Taylor County, TX Map & Demographics
Taylor County Overview
$31,492
PER CAPITA INCOME
$80,045
AVG FAMILY INCOME
$61,806
AVG HOUSEHOLD INCOME
24.2%
WAGE / INCOME GAP [ % ]
75.8¢/ $1
WAGE / INCOME GAP [ $ ]
$10,694
FAMILY INCOME DEFICIT
0.45
INEQUALITY / GINI INDEX
143,029
TOTAL POPULATION
70,009
MALE POPULATION
73,020
FEMALE POPULATION
95.88
MALES / 100 FEMALES
104.30
FEMALES / 100 MALES
32.9
MEDIAN AGE
3.1
AVG FAMILY SIZE
2.5
AVG HOUSEHOLD SIZE
72,763
LABOR FORCE [ PEOPLE ]
65.3%
PERCENT IN LABOR FORCE
2.4%
UNEMPLOYMENT RATE
Taylor County Area Codes
Income in Taylor County
Income Overview in Taylor County
Per Capita Income in Taylor County is $31,492, while median incomes of families and households are $80,045 and $61,806 respectively.
| Characteristic | Number | Measure |
| Per Capita Income | 143,029 | $31,492 |
| Median Family Income | 35,347 | $80,045 |
| Mean Family Income | 35,347 | $96,548 |
| Median Household Income | 53,888 | $61,806 |
| Mean Household Income | 53,888 | $82,300 |
| Income Deficit | 35,347 | $10,694 |
| Wage / Income Gap (%) | 143,029 | 24.21% |
| Wage / Income Gap ($) | 143,029 | 75.79¢ per $1 |
| Gini / Inequality Index | 143,029 | 0.45 |
Earnings by Sex in Taylor County
Average Earnings in Taylor County are $34,137, $38,849 for men and $29,444 for women, a difference of 24.2%.
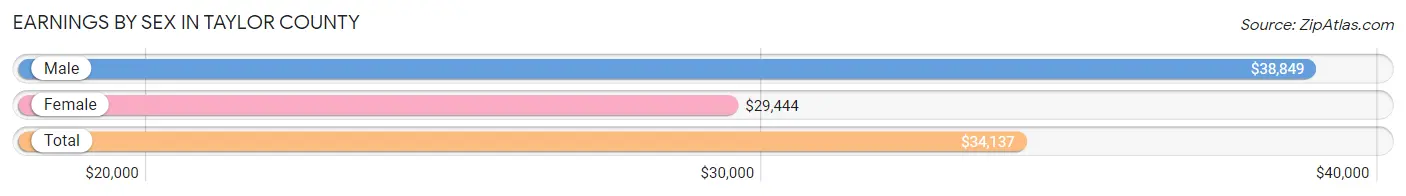
| Sex | Number | Average Earnings |
| Male | 40,309 (52.6%) | $38,849 |
| Female | 36,372 (47.4%) | $29,444 |
| Total | 76,681 (100.0%) | $34,137 |
Earnings by Sex by Income Bracket in Taylor County
The most common earnings brackets in Taylor County are $100,000+ for men (4,546 | 11.3%) and $25,000 to $29,999 for women (2,825 | 7.8%).
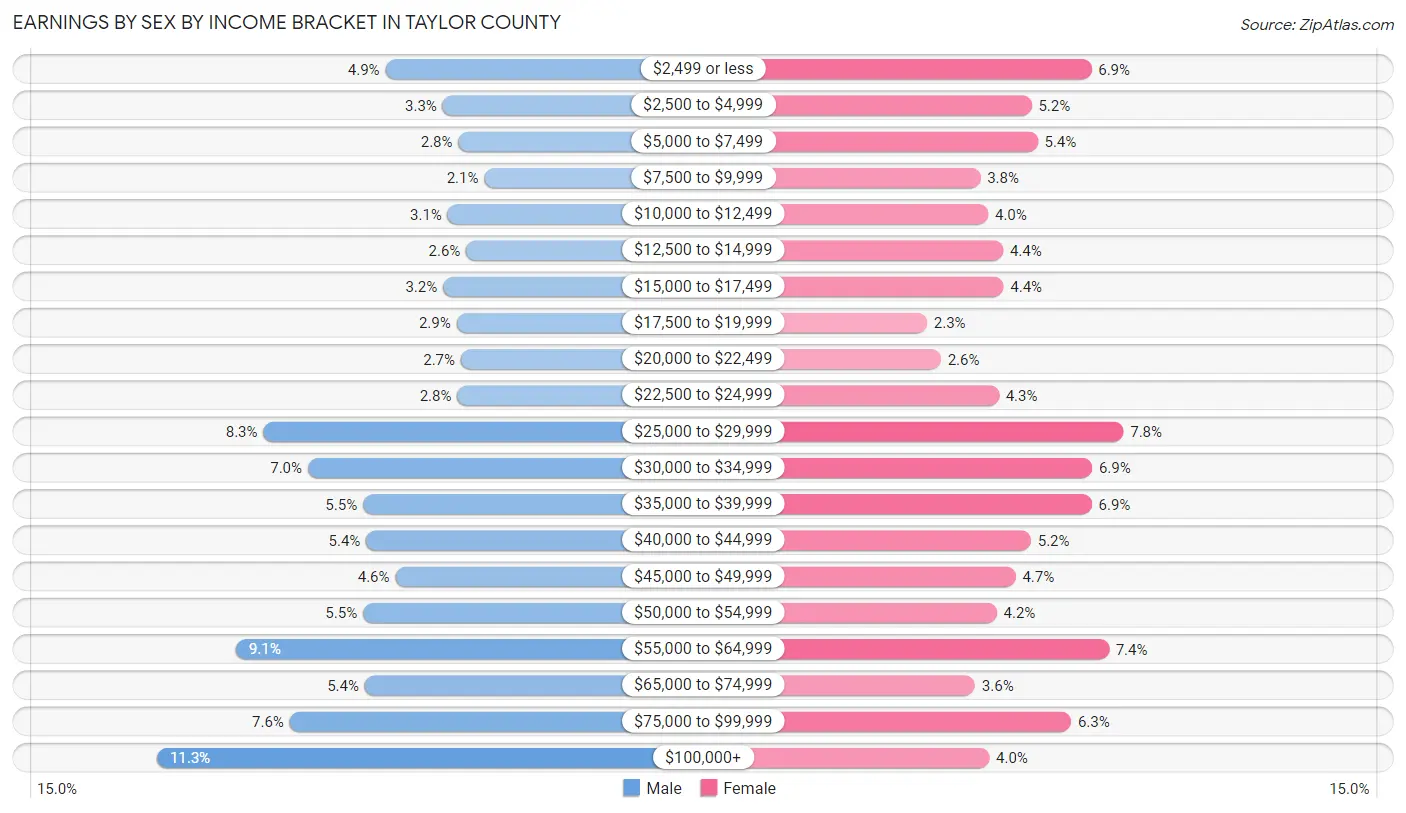
| Income | Male | Female |
| $2,499 or less | 1,960 (4.9%) | 2,498 (6.9%) |
| $2,500 to $4,999 | 1,312 (3.3%) | 1,886 (5.2%) |
| $5,000 to $7,499 | 1,133 (2.8%) | 1,949 (5.4%) |
| $7,500 to $9,999 | 838 (2.1%) | 1,364 (3.7%) |
| $10,000 to $12,499 | 1,253 (3.1%) | 1,443 (4.0%) |
| $12,500 to $14,999 | 1,043 (2.6%) | 1,596 (4.4%) |
| $15,000 to $17,499 | 1,306 (3.2%) | 1,599 (4.4%) |
| $17,500 to $19,999 | 1,154 (2.9%) | 820 (2.2%) |
| $20,000 to $22,499 | 1,105 (2.7%) | 959 (2.6%) |
| $22,500 to $24,999 | 1,145 (2.8%) | 1,552 (4.3%) |
| $25,000 to $29,999 | 3,343 (8.3%) | 2,825 (7.8%) |
| $30,000 to $34,999 | 2,839 (7.0%) | 2,506 (6.9%) |
| $35,000 to $39,999 | 2,213 (5.5%) | 2,504 (6.9%) |
| $40,000 to $44,999 | 2,176 (5.4%) | 1,882 (5.2%) |
| $45,000 to $49,999 | 1,847 (4.6%) | 1,723 (4.7%) |
| $50,000 to $54,999 | 2,212 (5.5%) | 1,533 (4.2%) |
| $55,000 to $64,999 | 3,650 (9.1%) | 2,678 (7.4%) |
| $65,000 to $74,999 | 2,191 (5.4%) | 1,308 (3.6%) |
| $75,000 to $99,999 | 3,043 (7.5%) | 2,291 (6.3%) |
| $100,000+ | 4,546 (11.3%) | 1,456 (4.0%) |
| Total | 40,309 (100.0%) | 36,372 (100.0%) |
Earnings by Sex by Educational Attainment in Taylor County
Average earnings in Taylor County are $47,622 for men and $35,908 for women, a difference of 24.6%. Men with an educational attainment of graduate degree enjoy the highest average annual earnings of $69,770, while those with less than high school education earn the least with $33,168. Women with an educational attainment of graduate degree earn the most with the average annual earnings of $60,829, while those with less than high school education have the smallest earnings of $20,677.
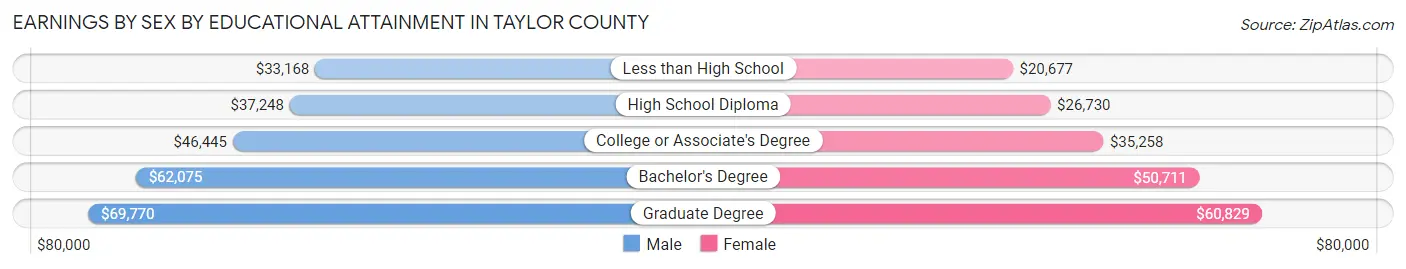
| Educational Attainment | Male Income | Female Income |
| Less than High School | $33,168 | $20,677 |
| High School Diploma | $37,248 | $26,730 |
| College or Associate's Degree | $46,445 | $35,258 |
| Bachelor's Degree | $62,075 | $50,711 |
| Graduate Degree | $69,770 | $60,829 |
| Total | $47,622 | $35,908 |
Family Income in Taylor County
Family Income Brackets in Taylor County
According to the Taylor County family income data, there are 6,999 families falling into the $100,000 to $149,999 income range, which is the most common income bracket and makes up 19.8% of all families. Conversely, the $10,000 to $14,999 income bracket is the least frequent group with only 848 families (2.4%) belonging to this category.
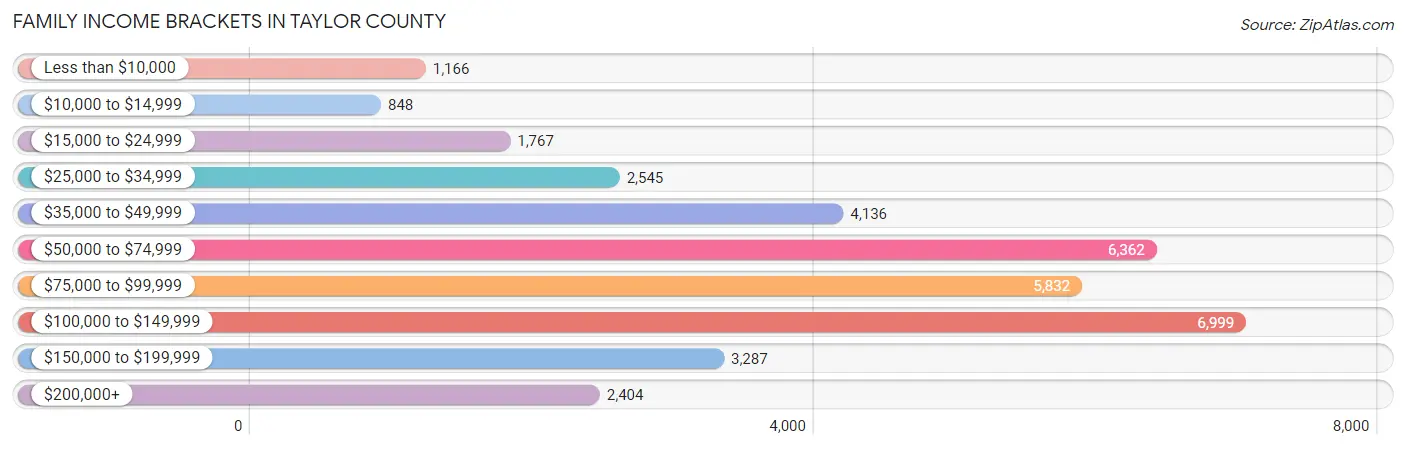
| Income Bracket | # Families | % Families |
| Less than $10,000 | 1,166 | 3.3% |
| $10,000 to $14,999 | 848 | 2.4% |
| $15,000 to $24,999 | 1,767 | 5.0% |
| $25,000 to $34,999 | 2,545 | 7.2% |
| $35,000 to $49,999 | 4,136 | 11.7% |
| $50,000 to $74,999 | 6,362 | 18.0% |
| $75,000 to $99,999 | 5,832 | 16.5% |
| $100,000 to $149,999 | 6,999 | 19.8% |
| $150,000 to $199,999 | 3,287 | 9.3% |
| $200,000+ | 2,404 | 6.8% |
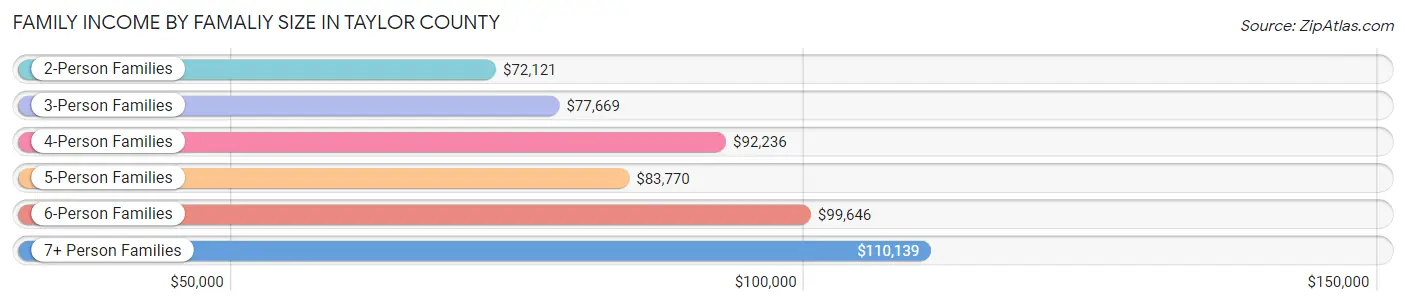
Family Income by Famaliy Size in Taylor County
7+ person families (510 | 1.4%) account for the highest median family income in Taylor County with $110,139 per family, while 2-person families (16,436 | 46.5%) have the highest median income of $36,060 per family member.
| Income Bracket | # Families | Median Income |
| 2-Person Families | 16,436 (46.5%) | $72,121 |
| 3-Person Families | 7,934 (22.5%) | $77,669 |
| 4-Person Families | 6,705 (19.0%) | $92,236 |
| 5-Person Families | 2,843 (8.0%) | $83,770 |
| 6-Person Families | 919 (2.6%) | $99,646 |
| 7+ Person Families | 510 (1.4%) | $110,139 |
| Total | 35,347 (100.0%) | $80,045 |
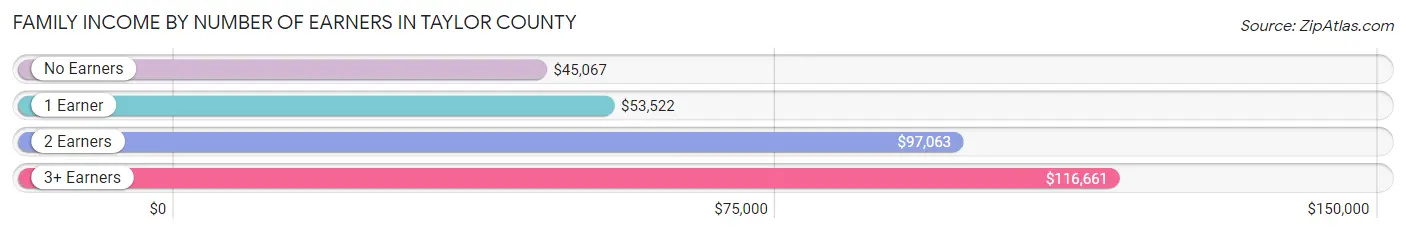
Family Income by Number of Earners in Taylor County
The median family income in Taylor County is $80,045, with families comprising 3+ earners (3,321) having the highest median family income of $116,661, while families with no earners (4,640) have the lowest median family income of $45,067, accounting for 9.4% and 13.1% of families, respectively.
| Number of Earners | # Families | Median Income |
| No Earners | 4,640 (13.1%) | $45,067 |
| 1 Earner | 11,904 (33.7%) | $53,522 |
| 2 Earners | 15,482 (43.8%) | $97,063 |
| 3+ Earners | 3,321 (9.4%) | $116,661 |
| Total | 35,347 (100.0%) | $80,045 |
Household Income in Taylor County
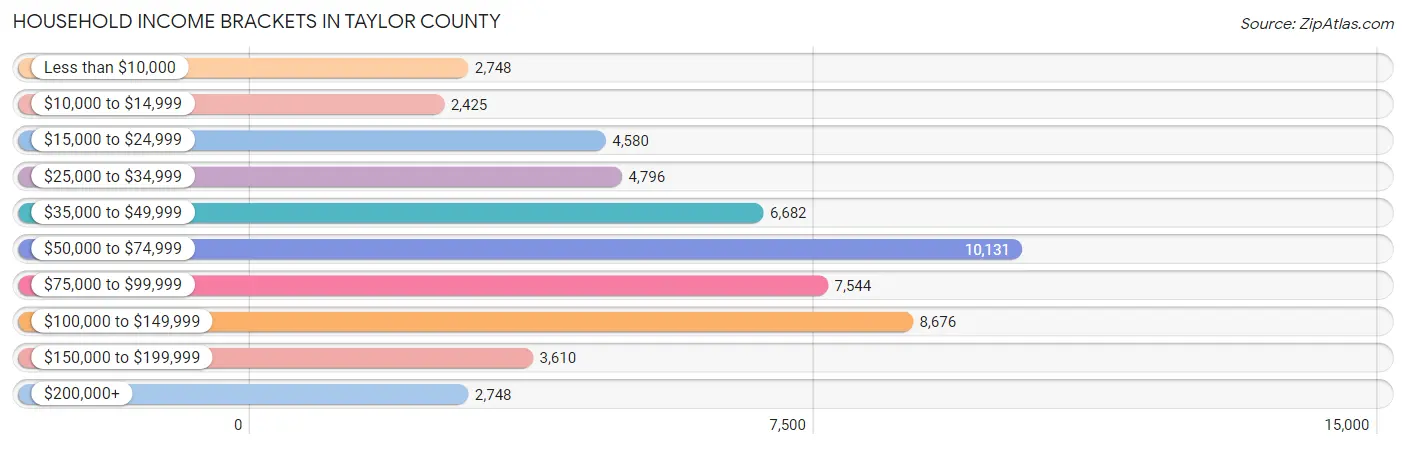
Household Income Brackets in Taylor County
With 10,131 households falling in the category, the $50,000 to $74,999 income range is the most frequent in Taylor County, accounting for 18.8% of all households. In contrast, only 2,425 households (4.5%) fall into the $10,000 to $14,999 income bracket, making it the least populous group.
| Income Bracket | # Households | % Households |
| Less than $10,000 | 2,748 | 5.1% |
| $10,000 to $14,999 | 2,425 | 4.5% |
| $15,000 to $24,999 | 4,580 | 8.5% |
| $25,000 to $34,999 | 4,796 | 8.9% |
| $35,000 to $49,999 | 6,682 | 12.4% |
| $50,000 to $74,999 | 10,131 | 18.8% |
| $75,000 to $99,999 | 7,544 | 14.0% |
| $100,000 to $149,999 | 8,676 | 16.1% |
| $150,000 to $199,999 | 3,610 | 6.7% |
| $200,000+ | 2,748 | 5.1% |
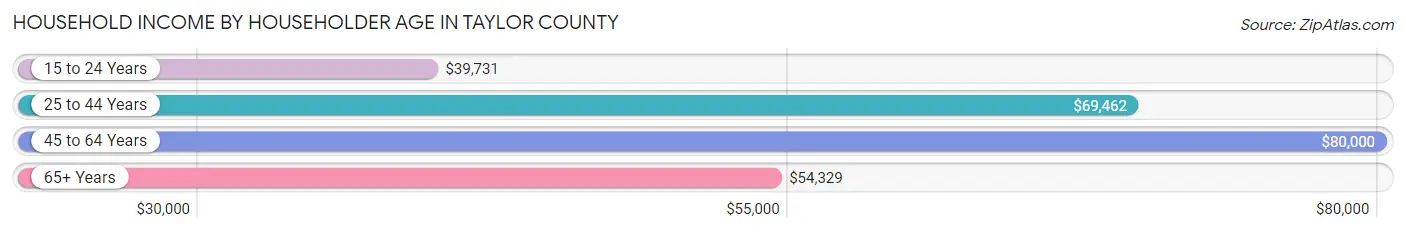
Household Income by Householder Age in Taylor County
The median household income in Taylor County is $61,806, with the highest median household income of $80,000 found in the 45 to 64 years age bracket for the primary householder. A total of 15,882 households (29.5%) fall into this category. Meanwhile, the 15 to 24 years age bracket for the primary householder has the lowest median household income of $39,731, with 5,834 households (10.8%) in this group.
| Income Bracket | # Households | Median Income |
| 15 to 24 Years | 5,834 (10.8%) | $39,731 |
| 25 to 44 Years | 19,341 (35.9%) | $69,462 |
| 45 to 64 Years | 15,882 (29.5%) | $80,000 |
| 65+ Years | 12,831 (23.8%) | $54,329 |
| Total | 53,888 (100.0%) | $61,806 |
Poverty in Taylor County
Income Below Poverty by Sex and Age in Taylor County
With 12.8% poverty level for males and 16.3% for females among the residents of Taylor County, under 5 year old males and 18 to 24 year old females are the most vulnerable to poverty, with 1,029 males (21.0%) and 2,404 females (28.5%) in their respective age groups living below the poverty level.
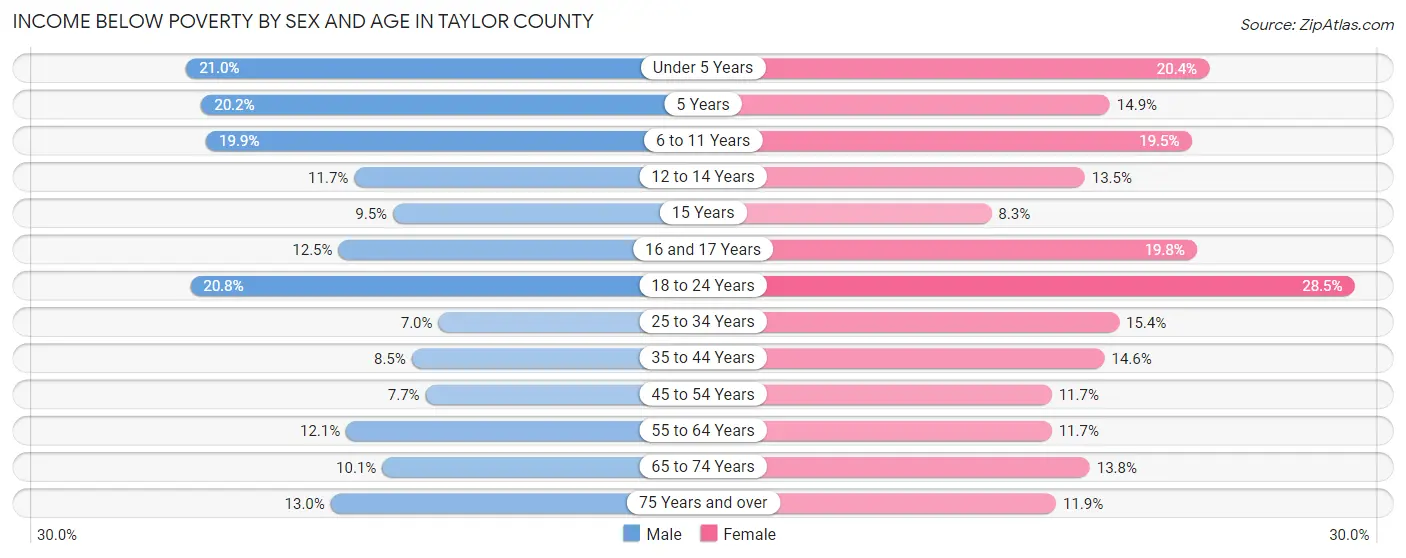
| Age Bracket | Male | Female |
| Under 5 Years | 1,029 (21.0%) | 993 (20.4%) |
| 5 Years | 156 (20.2%) | 132 (14.9%) |
| 6 to 11 Years | 1,197 (19.9%) | 996 (19.5%) |
| 12 to 14 Years | 335 (11.7%) | 463 (13.5%) |
| 15 Years | 92 (9.5%) | 91 (8.3%) |
| 16 and 17 Years | 213 (12.5%) | 341 (19.8%) |
| 18 to 24 Years | 1,747 (20.8%) | 2,404 (28.5%) |
| 25 to 34 Years | 695 (7.0%) | 1,542 (15.4%) |
| 35 to 44 Years | 729 (8.5%) | 1,272 (14.6%) |
| 45 to 54 Years | 498 (7.7%) | 787 (11.7%) |
| 55 to 64 Years | 866 (12.1%) | 913 (11.7%) |
| 65 to 74 Years | 537 (10.1%) | 854 (13.8%) |
| 75 Years and over | 450 (13.0%) | 615 (11.9%) |
| Total | 8,544 (12.8%) | 11,403 (16.3%) |
Income Above Poverty by Sex and Age in Taylor County
According to the poverty statistics in Taylor County, males aged 25 to 34 years and females aged 15 years are the age groups that are most secure financially, with 93.0% of males and 91.7% of females in these age groups living above the poverty line.
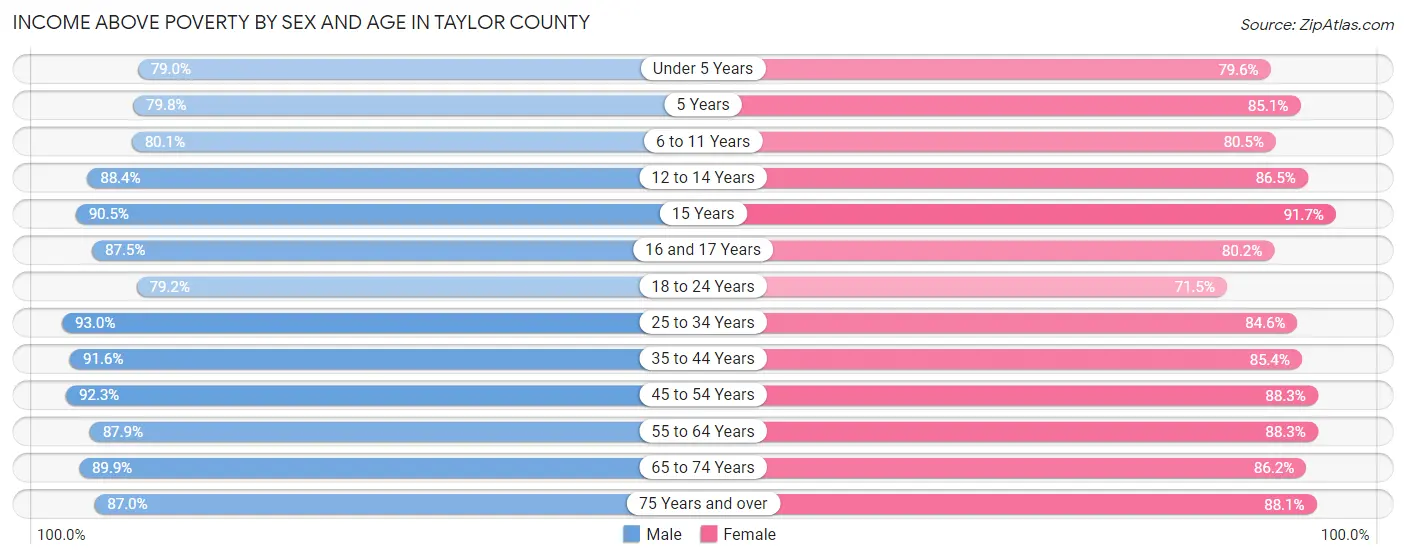
| Age Bracket | Male | Female |
| Under 5 Years | 3,871 (79.0%) | 3,866 (79.6%) |
| 5 Years | 618 (79.8%) | 752 (85.1%) |
| 6 to 11 Years | 4,820 (80.1%) | 4,123 (80.5%) |
| 12 to 14 Years | 2,541 (88.3%) | 2,960 (86.5%) |
| 15 Years | 877 (90.5%) | 1,002 (91.7%) |
| 16 and 17 Years | 1,487 (87.5%) | 1,385 (80.2%) |
| 18 to 24 Years | 6,664 (79.2%) | 6,018 (71.5%) |
| 25 to 34 Years | 9,295 (93.0%) | 8,447 (84.6%) |
| 35 to 44 Years | 7,897 (91.5%) | 7,422 (85.4%) |
| 45 to 54 Years | 5,984 (92.3%) | 5,947 (88.3%) |
| 55 to 64 Years | 6,291 (87.9%) | 6,900 (88.3%) |
| 65 to 74 Years | 4,785 (89.9%) | 5,329 (86.2%) |
| 75 Years and over | 3,022 (87.0%) | 4,540 (88.1%) |
| Total | 58,152 (87.2%) | 58,691 (83.7%) |
Income Below Poverty Among Married-Couple Families in Taylor County
The poverty statistics for married-couple families in Taylor County show that 4.5% or 1,180 of the total 26,024 families live below the poverty line. Families with 3 or 4 children have the highest poverty rate of 10.6%, comprising of 258 families. On the other hand, families with no children have the lowest poverty rate of 3.5%, which includes 509 families.
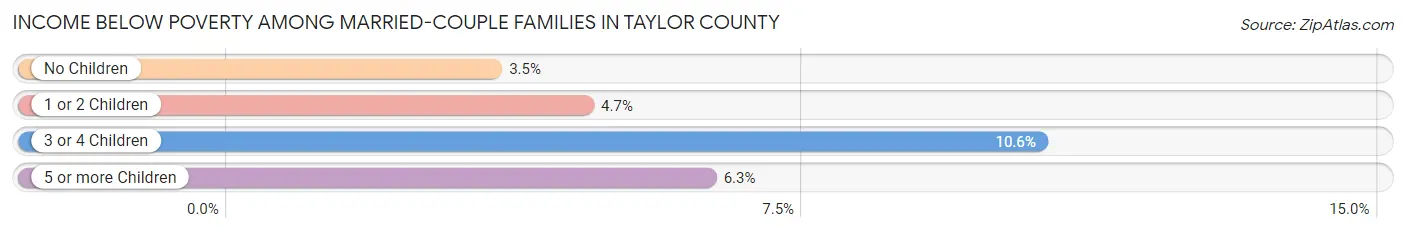
| Children | Above Poverty | Below Poverty |
| No Children | 14,251 (96.6%) | 509 (3.5%) |
| 1 or 2 Children | 8,246 (95.4%) | 402 (4.6%) |
| 3 or 4 Children | 2,182 (89.4%) | 258 (10.6%) |
| 5 or more Children | 165 (93.8%) | 11 (6.2%) |
| Total | 24,844 (95.5%) | 1,180 (4.5%) |
Income Below Poverty Among Single-Parent Households in Taylor County
According to the poverty data in Taylor County, 13.5% or 339 single-father households and 30.1% or 2,050 single-mother households are living below the poverty line. Among single-father households, those with 3 or 4 children have the highest poverty rate, with 87 households (37.2%) experiencing poverty. Likewise, among single-mother households, those with 5 or more children have the highest poverty rate, with 40 households (69.0%) falling below the poverty line.
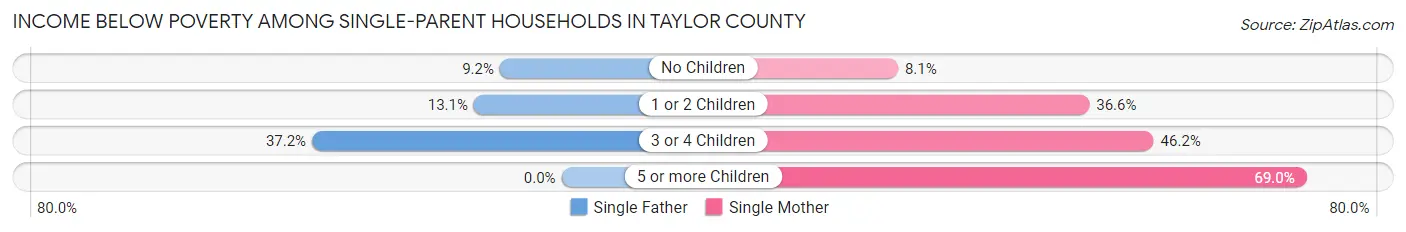
| Children | Single Father | Single Mother |
| No Children | 105 (9.2%) | 157 (8.1%) |
| 1 or 2 Children | 147 (13.1%) | 1,423 (36.6%) |
| 3 or 4 Children | 87 (37.2%) | 430 (46.2%) |
| 5 or more Children | 0 (0.0%) | 40 (69.0%) |
| Total | 339 (13.5%) | 2,050 (30.1%) |
Income Below Poverty Among Married-Couple vs Single-Parent Households in Taylor County
The poverty data for Taylor County shows that 1,180 of the married-couple family households (4.5%) and 2,389 of the single-parent households (25.6%) are living below the poverty level. Within the married-couple family households, those with 3 or 4 children have the highest poverty rate, with 258 households (10.6%) falling below the poverty line. Among the single-parent households, those with 5 or more children have the highest poverty rate, with 40 household (65.6%) living below poverty.
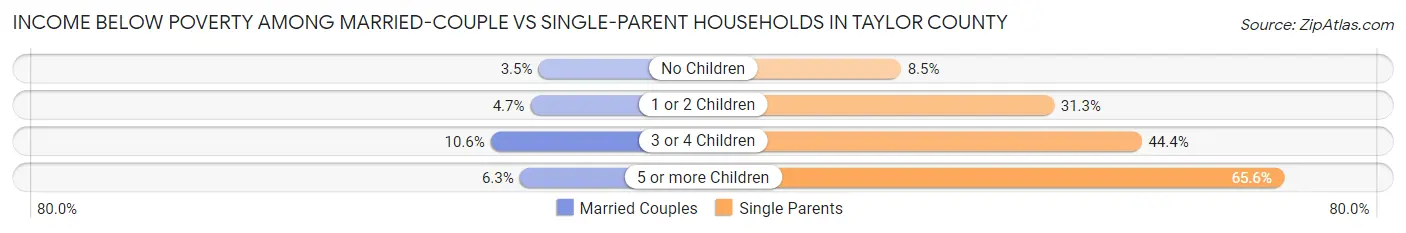
| Children | Married-Couple Families | Single-Parent Households |
| No Children | 509 (3.5%) | 262 (8.5%) |
| 1 or 2 Children | 402 (4.6%) | 1,570 (31.3%) |
| 3 or 4 Children | 258 (10.6%) | 517 (44.4%) |
| 5 or more Children | 11 (6.2%) | 40 (65.6%) |
| Total | 1,180 (4.5%) | 2,389 (25.6%) |
Race in Taylor County
The most populous races in Taylor County are White / Caucasian (102,445 | 71.6%), Hispanic or Latino (36,517 | 25.5%), and Two or more Races (16,182 | 11.3%).
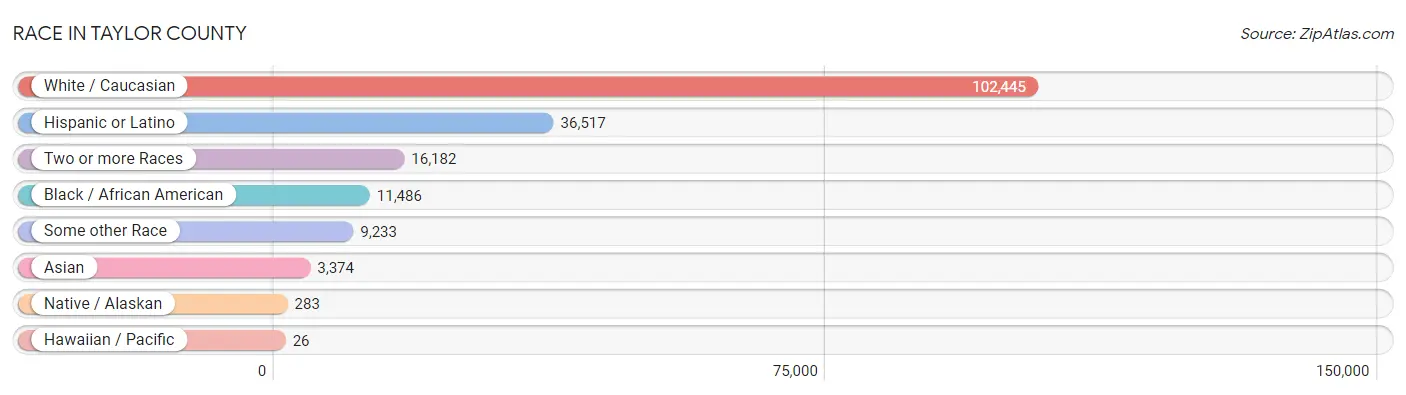
| Race | # Population | % Population |
| Asian | 3,374 | 2.4% |
| Black / African American | 11,486 | 8.0% |
| Hawaiian / Pacific | 26 | 0.0% |
| Hispanic or Latino | 36,517 | 25.5% |
| Native / Alaskan | 283 | 0.2% |
| White / Caucasian | 102,445 | 71.6% |
| Two or more Races | 16,182 | 11.3% |
| Some other Race | 9,233 | 6.5% |
| Total | 143,029 | 100.0% |
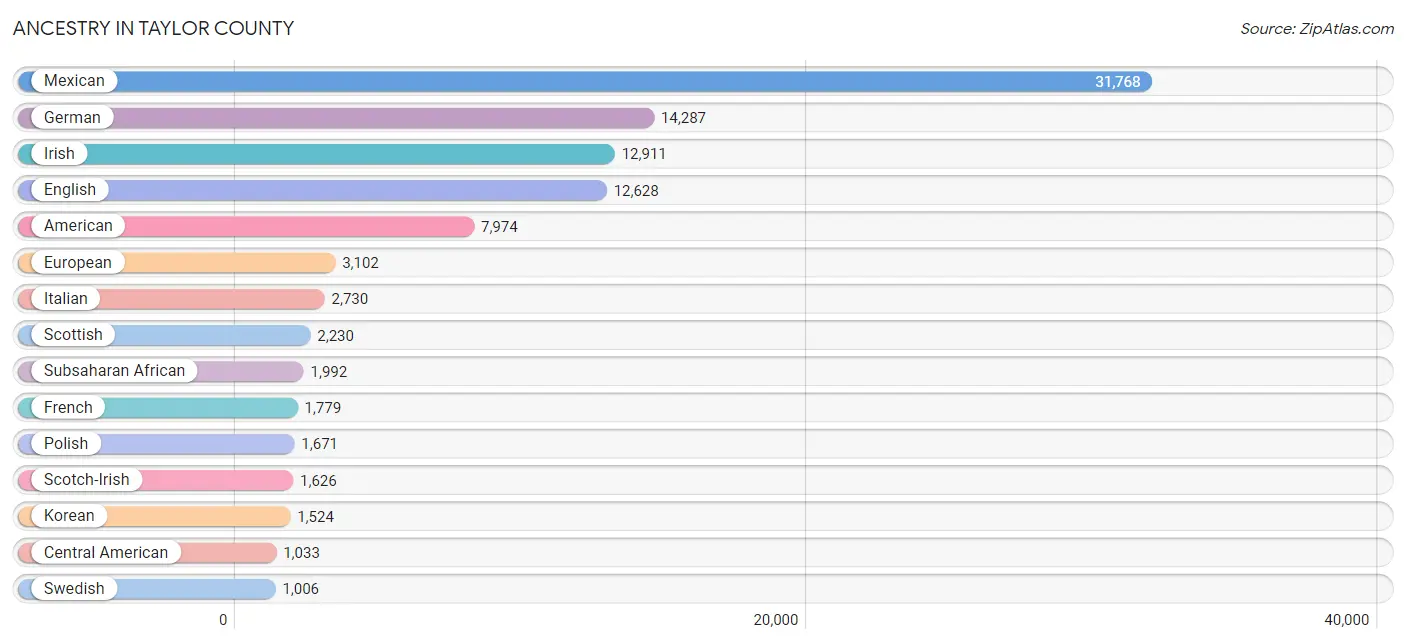
Ancestry in Taylor County
The most populous ancestries reported in Taylor County are Mexican (31,768 | 22.2%), German (14,287 | 10.0%), Irish (12,911 | 9.0%), English (12,628 | 8.8%), and American (7,974 | 5.6%), together accounting for 55.6% of all Taylor County residents.
| Ancestry | # Population | % Population |
| African | 261 | 0.2% |
| American | 7,974 | 5.6% |
| Apache | 44 | 0.0% |
| Arab | 132 | 0.1% |
| Armenian | 67 | 0.1% |
| Australian | 11 | 0.0% |
| Austrian | 41 | 0.0% |
| Belgian | 8 | 0.0% |
| Belizean | 18 | 0.0% |
| Bhutanese | 268 | 0.2% |
| Blackfeet | 27 | 0.0% |
| Brazilian | 7 | 0.0% |
| British | 795 | 0.6% |
| Burmese | 590 | 0.4% |
| Cajun | 96 | 0.1% |
| Canadian | 162 | 0.1% |
| Central American | 1,033 | 0.7% |
| Central American Indian | 134 | 0.1% |
| Cherokee | 441 | 0.3% |
| Chippewa | 64 | 0.0% |
| Choctaw | 122 | 0.1% |
| Colombian | 235 | 0.2% |
| Comanche | 61 | 0.0% |
| Costa Rican | 11 | 0.0% |
| Creek | 8 | 0.0% |
| Croatian | 20 | 0.0% |
| Crow | 34 | 0.0% |
| Cuban | 380 | 0.3% |
| Czech | 359 | 0.3% |
| Czechoslovakian | 72 | 0.1% |
| Danish | 323 | 0.2% |
| Dutch | 804 | 0.6% |
| Dutch West Indian | 34 | 0.0% |
| Eastern European | 104 | 0.1% |
| English | 12,628 | 8.8% |
| Estonian | 144 | 0.1% |
| Ethiopian | 115 | 0.1% |
| European | 3,102 | 2.2% |
| Filipino | 105 | 0.1% |
| Finnish | 99 | 0.1% |
| French | 1,779 | 1.2% |
| French Canadian | 499 | 0.4% |
| German | 14,287 | 10.0% |
| Ghanaian | 10 | 0.0% |
| Greek | 83 | 0.1% |
| Guamanian / Chamorro | 16 | 0.0% |
| Guatemalan | 151 | 0.1% |
| Honduran | 46 | 0.0% |
| Hopi | 38 | 0.0% |
| Hungarian | 116 | 0.1% |
| Icelander | 22 | 0.0% |
| Indian (Asian) | 219 | 0.2% |
| Indonesian | 43 | 0.0% |
| Iranian | 11 | 0.0% |
| Irish | 12,911 | 9.0% |
| Israeli | 14 | 0.0% |
| Italian | 2,730 | 1.9% |
| Jamaican | 691 | 0.5% |
| Japanese | 118 | 0.1% |
| Kenyan | 105 | 0.1% |
| Korean | 1,524 | 1.1% |
| Latvian | 67 | 0.1% |
| Lebanese | 95 | 0.1% |
| Lithuanian | 25 | 0.0% |
| Luxembourger | 1 | 0.0% |
| Malaysian | 8 | 0.0% |
| Menominee | 19 | 0.0% |
| Mexican | 31,768 | 22.2% |
| Mexican American Indian | 117 | 0.1% |
| Moroccan | 26 | 0.0% |
| Native Hawaiian | 10 | 0.0% |
| Navajo | 63 | 0.0% |
| New Zealander | 17 | 0.0% |
| Nicaraguan | 378 | 0.3% |
| Nigerian | 50 | 0.0% |
| Northern European | 123 | 0.1% |
| Norwegian | 933 | 0.6% |
| Osage | 19 | 0.0% |
| Pakistani | 52 | 0.0% |
| Panamanian | 32 | 0.0% |
| Pennsylvania German | 84 | 0.1% |
| Peruvian | 35 | 0.0% |
| Polish | 1,671 | 1.2% |
| Portuguese | 59 | 0.0% |
| Pueblo | 2 | 0.0% |
| Puerto Rican | 699 | 0.5% |
| Romanian | 12 | 0.0% |
| Russian | 148 | 0.1% |
| Salvadoran | 415 | 0.3% |
| Samoan | 8 | 0.0% |
| Scandinavian | 303 | 0.2% |
| Scotch-Irish | 1,626 | 1.1% |
| Scottish | 2,230 | 1.6% |
| Sioux | 12 | 0.0% |
| Slavic | 8 | 0.0% |
| Slovene | 37 | 0.0% |
| South American | 327 | 0.2% |
| Spaniard | 406 | 0.3% |
| Spanish | 484 | 0.3% |
| Sri Lankan | 643 | 0.4% |
| Subsaharan African | 1,992 | 1.4% |
| Sudanese | 20 | 0.0% |
| Swedish | 1,006 | 0.7% |
| Swiss | 89 | 0.1% |
| Thai | 230 | 0.2% |
| Trinidadian and Tobagonian | 15 | 0.0% |
| Turkish | 31 | 0.0% |
| Ukrainian | 41 | 0.0% |
| Uruguayan | 11 | 0.0% |
| Ute | 120 | 0.1% |
| Venezuelan | 46 | 0.0% |
| Welsh | 399 | 0.3% |
| West Indian | 74 | 0.1% |
| Yaqui | 28 | 0.0% |
| Yugoslavian | 48 | 0.0% | View All 115 Rows |
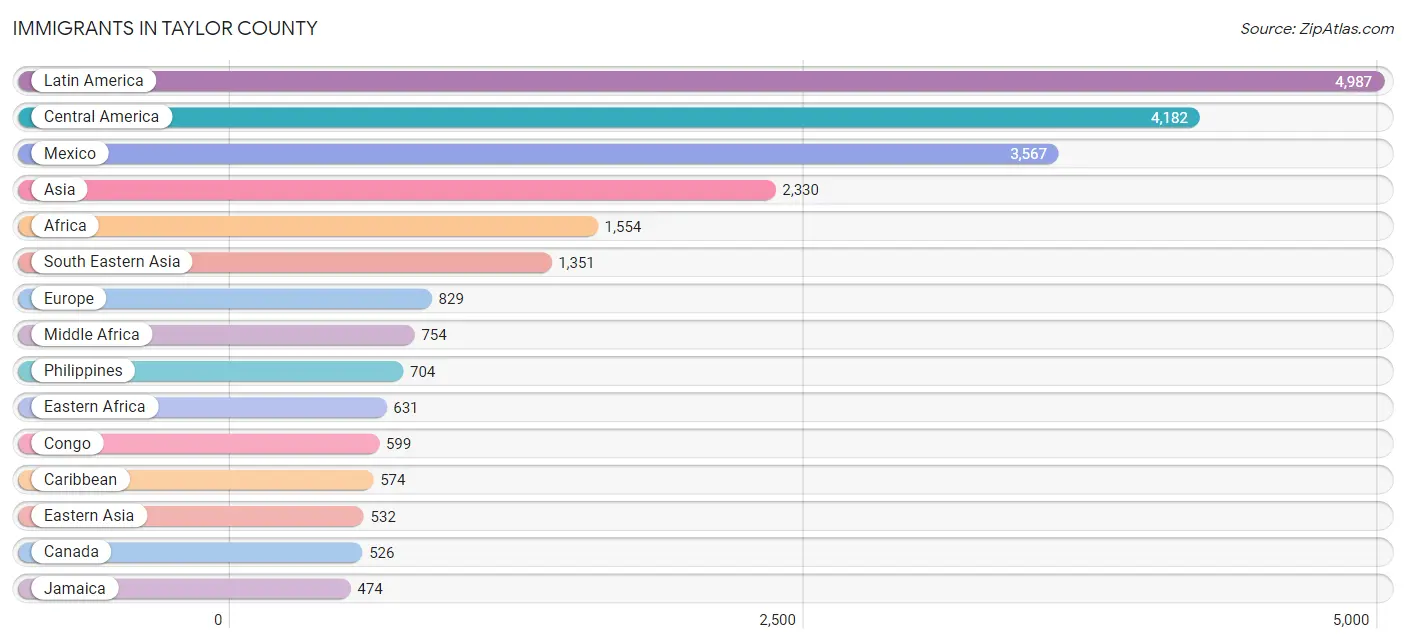
Immigrants in Taylor County
The most numerous immigrant groups reported in Taylor County came from Latin America (4,987 | 3.5%), Central America (4,182 | 2.9%), Mexico (3,567 | 2.5%), Asia (2,330 | 1.6%), and Africa (1,554 | 1.1%), together accounting for 11.6% of all Taylor County residents.
| Immigration Origin | # Population | % Population |
| Africa | 1,554 | 1.1% |
| Asia | 2,330 | 1.6% |
| Australia | 25 | 0.0% |
| Austria | 13 | 0.0% |
| Belize | 32 | 0.0% |
| Cambodia | 129 | 0.1% |
| Cameroon | 33 | 0.0% |
| Canada | 526 | 0.4% |
| Caribbean | 574 | 0.4% |
| Central America | 4,182 | 2.9% |
| China | 120 | 0.1% |
| Colombia | 139 | 0.1% |
| Congo | 599 | 0.4% |
| Costa Rica | 11 | 0.0% |
| Cuba | 100 | 0.1% |
| Denmark | 61 | 0.0% |
| Eastern Africa | 631 | 0.4% |
| Eastern Asia | 532 | 0.4% |
| Eastern Europe | 72 | 0.1% |
| El Salvador | 183 | 0.1% |
| England | 150 | 0.1% |
| Ethiopia | 57 | 0.0% |
| Europe | 829 | 0.6% |
| France | 31 | 0.0% |
| Germany | 205 | 0.1% |
| Ghana | 10 | 0.0% |
| Guatemala | 51 | 0.0% |
| Honduras | 112 | 0.1% |
| India | 109 | 0.1% |
| Iran | 11 | 0.0% |
| Ireland | 7 | 0.0% |
| Italy | 24 | 0.0% |
| Jamaica | 474 | 0.3% |
| Japan | 68 | 0.1% |
| Kenya | 223 | 0.2% |
| Korea | 344 | 0.2% |
| Latin America | 4,987 | 3.5% |
| Latvia | 49 | 0.0% |
| Mexico | 3,567 | 2.5% |
| Middle Africa | 754 | 0.5% |
| Morocco | 10 | 0.0% |
| Nepal | 235 | 0.2% |
| Netherlands | 5 | 0.0% |
| Nicaragua | 196 | 0.1% |
| Nigeria | 81 | 0.1% |
| Northern Africa | 12 | 0.0% |
| Northern Europe | 452 | 0.3% |
| Oceania | 41 | 0.0% |
| Panama | 30 | 0.0% |
| Peru | 35 | 0.0% |
| Philippines | 704 | 0.5% |
| Poland | 23 | 0.0% |
| South Africa | 27 | 0.0% |
| South America | 231 | 0.2% |
| South Central Asia | 416 | 0.3% |
| South Eastern Asia | 1,351 | 0.9% |
| Southern Europe | 51 | 0.0% |
| Spain | 16 | 0.0% |
| Taiwan | 1 | 0.0% |
| Thailand | 15 | 0.0% |
| Turkey | 31 | 0.0% |
| Uruguay | 11 | 0.0% |
| Venezuela | 46 | 0.0% |
| Vietnam | 433 | 0.3% |
| Western Africa | 115 | 0.1% |
| Western Asia | 31 | 0.0% |
| Western Europe | 254 | 0.2% |
| Zaire | 122 | 0.1% |
| Zimbabwe | 6 | 0.0% | View All 69 Rows |
Sex and Age in Taylor County
Sex and Age in Taylor County
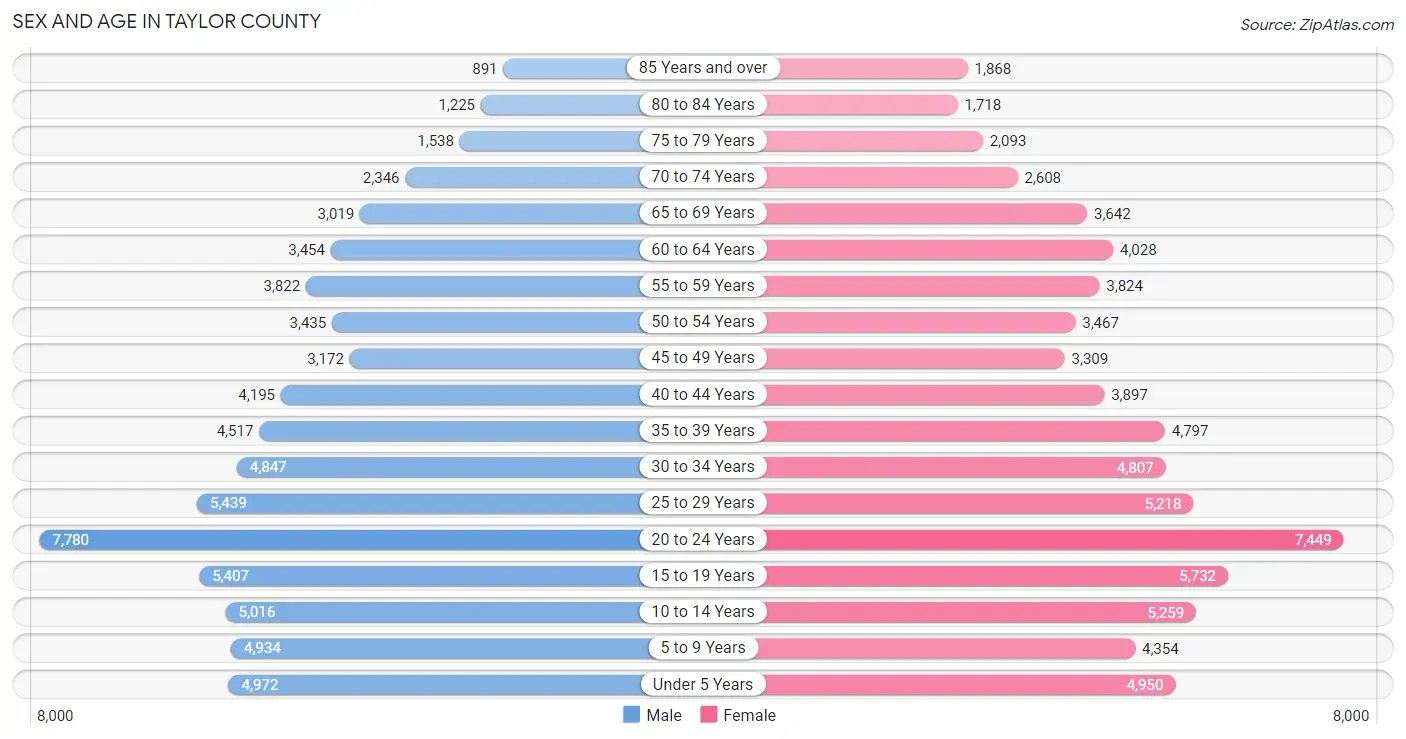
The most populous age groups in Taylor County are 20 to 24 Years (7,780 | 11.1%) for men and 20 to 24 Years (7,449 | 10.2%) for women.
| Age Bracket | Male | Female |
| Under 5 Years | 4,972 (7.1%) | 4,950 (6.8%) |
| 5 to 9 Years | 4,934 (7.0%) | 4,354 (6.0%) |
| 10 to 14 Years | 5,016 (7.2%) | 5,259 (7.2%) |
| 15 to 19 Years | 5,407 (7.7%) | 5,732 (7.9%) |
| 20 to 24 Years | 7,780 (11.1%) | 7,449 (10.2%) |
| 25 to 29 Years | 5,439 (7.8%) | 5,218 (7.1%) |
| 30 to 34 Years | 4,847 (6.9%) | 4,807 (6.6%) |
| 35 to 39 Years | 4,517 (6.5%) | 4,797 (6.6%) |
| 40 to 44 Years | 4,195 (6.0%) | 3,897 (5.3%) |
| 45 to 49 Years | 3,172 (4.5%) | 3,309 (4.5%) |
| 50 to 54 Years | 3,435 (4.9%) | 3,467 (4.8%) |
| 55 to 59 Years | 3,822 (5.5%) | 3,824 (5.2%) |
| 60 to 64 Years | 3,454 (4.9%) | 4,028 (5.5%) |
| 65 to 69 Years | 3,019 (4.3%) | 3,642 (5.0%) |
| 70 to 74 Years | 2,346 (3.4%) | 2,608 (3.6%) |
| 75 to 79 Years | 1,538 (2.2%) | 2,093 (2.9%) |
| 80 to 84 Years | 1,225 (1.8%) | 1,718 (2.4%) |
| 85 Years and over | 891 (1.3%) | 1,868 (2.6%) |
| Total | 70,009 (100.0%) | 73,020 (100.0%) |
Families and Households in Taylor County
Median Family Size in Taylor County
The median family size in Taylor County is 3.07 persons per family, with married-couple families (26,024 | 73.6%) accounting for the largest median family size of 3.11 persons per family. On the other hand, single male/father families (2,505 | 7.1%) represent the smallest median family size with 2.71 persons per family.

| Family Type | # Families | Family Size |
| Married-Couple | 26,024 (73.6%) | 3.11 |
| Single Male/Father | 2,505 (7.1%) | 2.71 |
| Single Female/Mother | 6,818 (19.3%) | 3.04 |
| Total Families | 35,347 (100.0%) | 3.07 |
Median Household Size in Taylor County
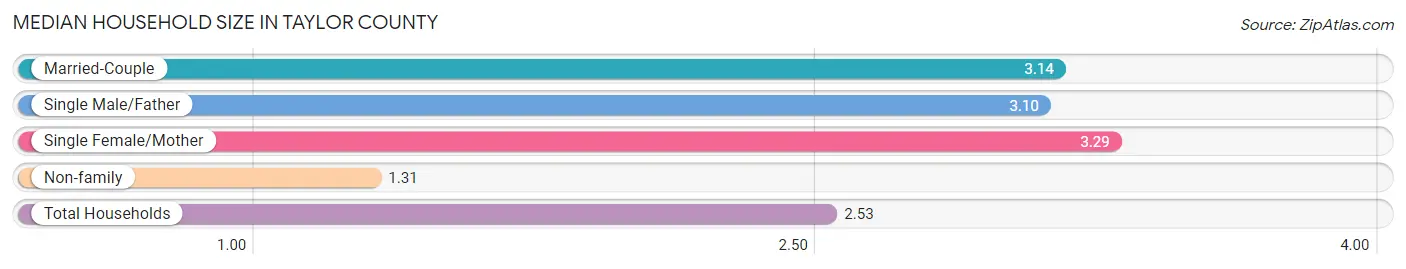
The median household size in Taylor County is 2.53 persons per household, with single female/mother households (6,818 | 12.7%) accounting for the largest median household size of 3.29 persons per household. non-family households (18,541 | 34.4%) represent the smallest median household size with 1.31 persons per household.
| Household Type | # Households | Household Size |
| Married-Couple | 26,024 (48.3%) | 3.14 |
| Single Male/Father | 2,505 (4.6%) | 3.10 |
| Single Female/Mother | 6,818 (12.7%) | 3.29 |
| Non-family | 18,541 (34.4%) | 1.31 |
| Total Households | 53,888 (100.0%) | 2.53 |
Household Size by Marriage Status in Taylor County
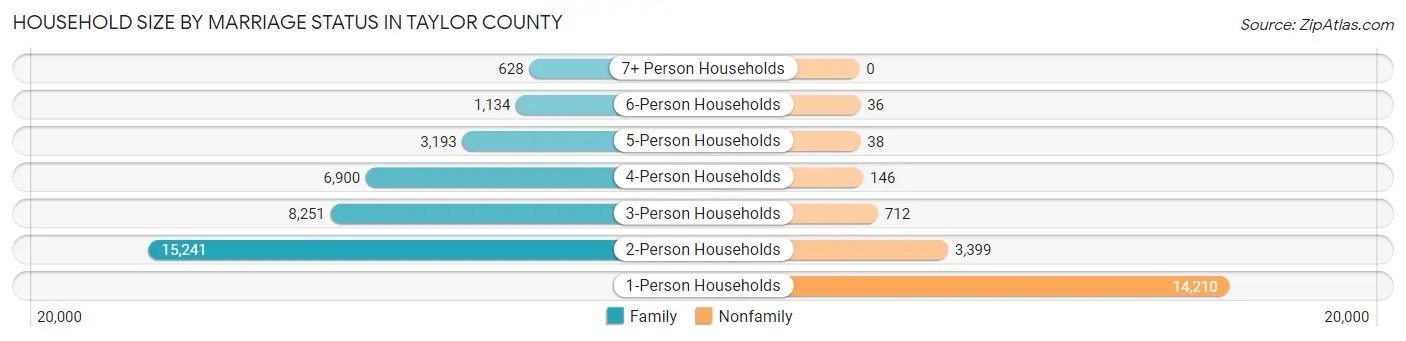
Out of a total of 53,888 households in Taylor County, 35,347 (65.6%) are family households, while 18,541 (34.4%) are nonfamily households. The most numerous type of family households are 2-person households, comprising 15,241, and the most common type of nonfamily households are 1-person households, comprising 14,210.
| Household Size | Family Households | Nonfamily Households |
| 1-Person Households | - | 14,210 (26.4%) |
| 2-Person Households | 15,241 (28.3%) | 3,399 (6.3%) |
| 3-Person Households | 8,251 (15.3%) | 712 (1.3%) |
| 4-Person Households | 6,900 (12.8%) | 146 (0.3%) |
| 5-Person Households | 3,193 (5.9%) | 38 (0.1%) |
| 6-Person Households | 1,134 (2.1%) | 36 (0.1%) |
| 7+ Person Households | 628 (1.2%) | 0 (0.0%) |
| Total | 35,347 (65.6%) | 18,541 (34.4%) |
Female Fertility in Taylor County
Fertility by Age in Taylor County
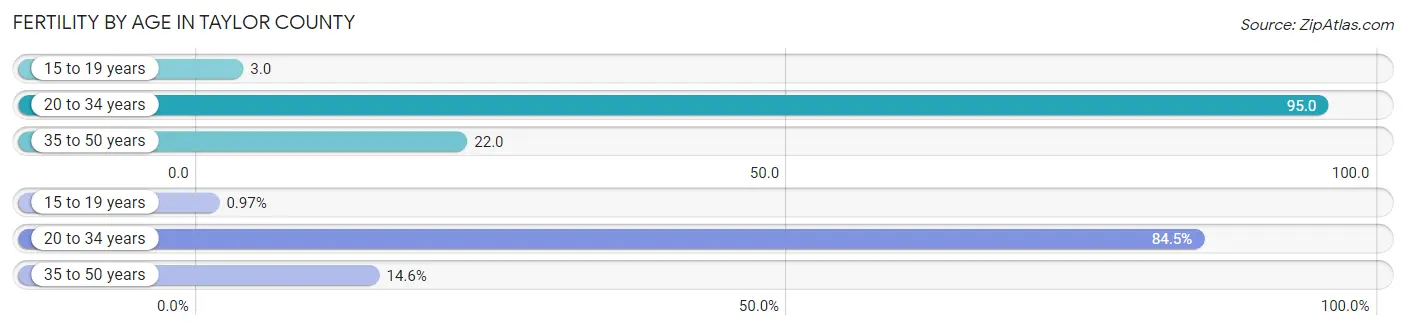
Average fertility rate in Taylor County is 54.0 births per 1,000 women. Women in the age bracket of 20 to 34 years have the highest fertility rate with 95.0 births per 1,000 women. Women in the age bracket of 20 to 34 years acount for 84.5% of all women with births.
| Age Bracket | Women with Births | Births / 1,000 Women |
| 15 to 19 years | 19 (1.0%) | 3.0 |
| 20 to 34 years | 1,655 (84.5%) | 95.0 |
| 35 to 50 years | 285 (14.5%) | 22.0 |
| Total | 1,959 (100.0%) | 54.0 |
Fertility by Age by Marriage Status in Taylor County
60.2% of women with births (1,959) in Taylor County are married. The highest percentage of unmarried women with births falls into 15 to 19 years age bracket with 100.0% of them unmarried at the time of birth, while the lowest percentage of unmarried women with births belong to 35 to 50 years age bracket with 10.2% of them unmarried.
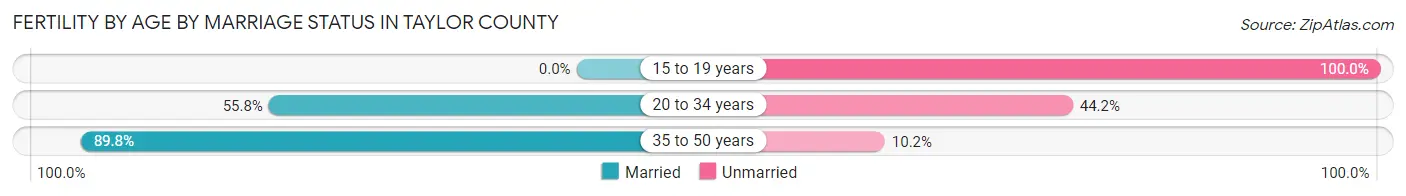
| Age Bracket | Married | Unmarried |
| 15 to 19 years | 0 (0.0%) | 19 (100.0%) |
| 20 to 34 years | 923 (55.8%) | 732 (44.2%) |
| 35 to 50 years | 256 (89.8%) | 29 (10.2%) |
| Total | 1,179 (60.2%) | 780 (39.8%) |
Fertility by Education in Taylor County
Average fertility rate in Taylor County is 54.0 births per 1,000 women. Women with the education attainment of graduate degree have the highest fertility rate of 66.0 births per 1,000 women, while women with the education attainment of less than high school have the lowest fertility at 21.0 births per 1,000 women. Women with the education attainment of college or associate's degree represent 39.2% of all women with births.
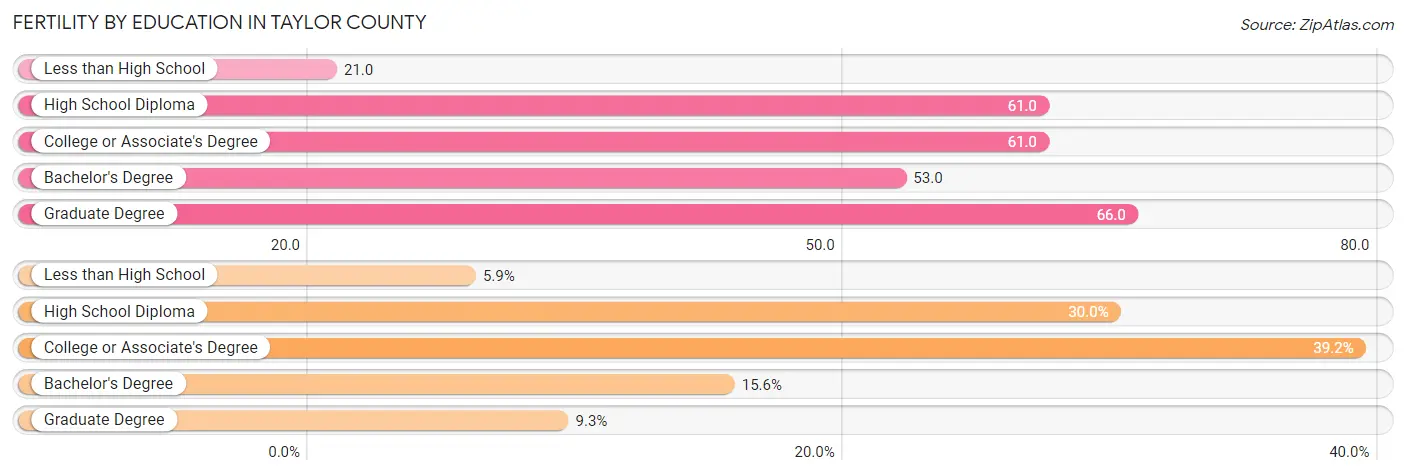
| Educational Attainment | Women with Births | Births / 1,000 Women |
| Less than High School | 115 (5.9%) | 21.0 |
| High School Diploma | 588 (30.0%) | 61.0 |
| College or Associate's Degree | 768 (39.2%) | 61.0 |
| Bachelor's Degree | 305 (15.6%) | 53.0 |
| Graduate Degree | 183 (9.3%) | 66.0 |
| Total | 1,959 (100.0%) | 54.0 |
Fertility by Education by Marriage Status in Taylor County
39.8% of women with births in Taylor County are unmarried. Women with the educational attainment of graduate degree are most likely to be married with 95.1% of them married at childbirth, while women with the educational attainment of high school diploma are least likely to be married with 63.3% of them unmarried at childbirth.
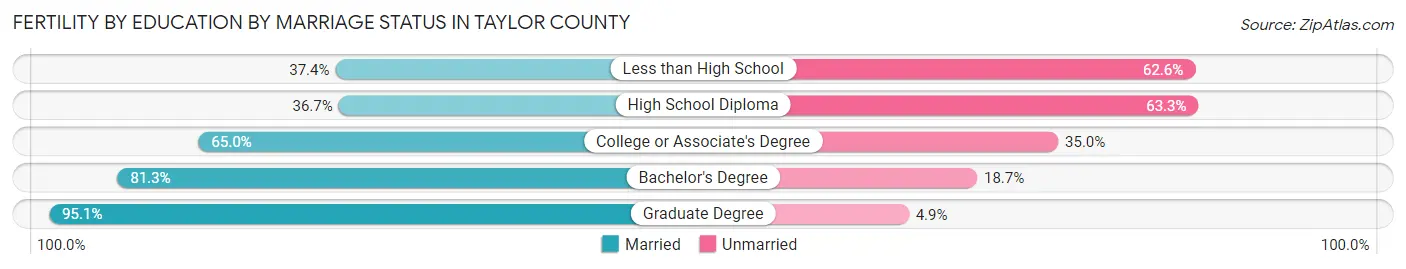
| Educational Attainment | Married | Unmarried |
| Less than High School | 43 (37.4%) | 72 (62.6%) |
| High School Diploma | 216 (36.7%) | 372 (63.3%) |
| College or Associate's Degree | 499 (65.0%) | 269 (35.0%) |
| Bachelor's Degree | 248 (81.3%) | 57 (18.7%) |
| Graduate Degree | 174 (95.1%) | 9 (4.9%) |
| Total | 1,179 (60.2%) | 780 (39.8%) |
Employment Characteristics in Taylor County
Employment by Class of Employer in Taylor County
Among the 70,258 employed individuals in Taylor County, private company employees (41,956 | 59.7%), not-for-profit organizations (7,841 | 11.2%), and federal government employees (6,685 | 9.5%) make up the most common classes of employment.
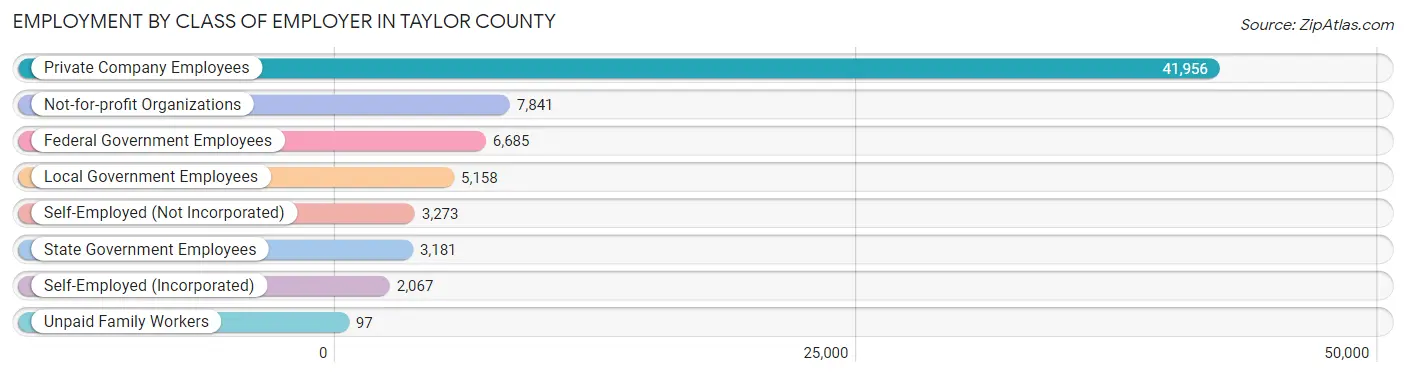
| Employer Class | # Employees | % Employees |
| Private Company Employees | 41,956 | 59.7% |
| Self-Employed (Incorporated) | 2,067 | 2.9% |
| Self-Employed (Not Incorporated) | 3,273 | 4.7% |
| Not-for-profit Organizations | 7,841 | 11.2% |
| Local Government Employees | 5,158 | 7.3% |
| State Government Employees | 3,181 | 4.5% |
| Federal Government Employees | 6,685 | 9.5% |
| Unpaid Family Workers | 97 | 0.1% |
| Total | 70,258 | 100.0% |
Employment Status by Age in Taylor County
According to the labor force statistics for Taylor County, out of the total population over 16 years of age (111,429), 65.3% or 72,763 individuals are in the labor force, with 2.4% or 1,746 of them unemployed. The age group with the highest labor force participation rate is 30 to 34 years, with 86.6% or 8,360 individuals in the labor force. Within the labor force, the 16 to 19 years age range has the highest percentage of unemployed individuals, with 9.3% or 365 of them being unemployed.
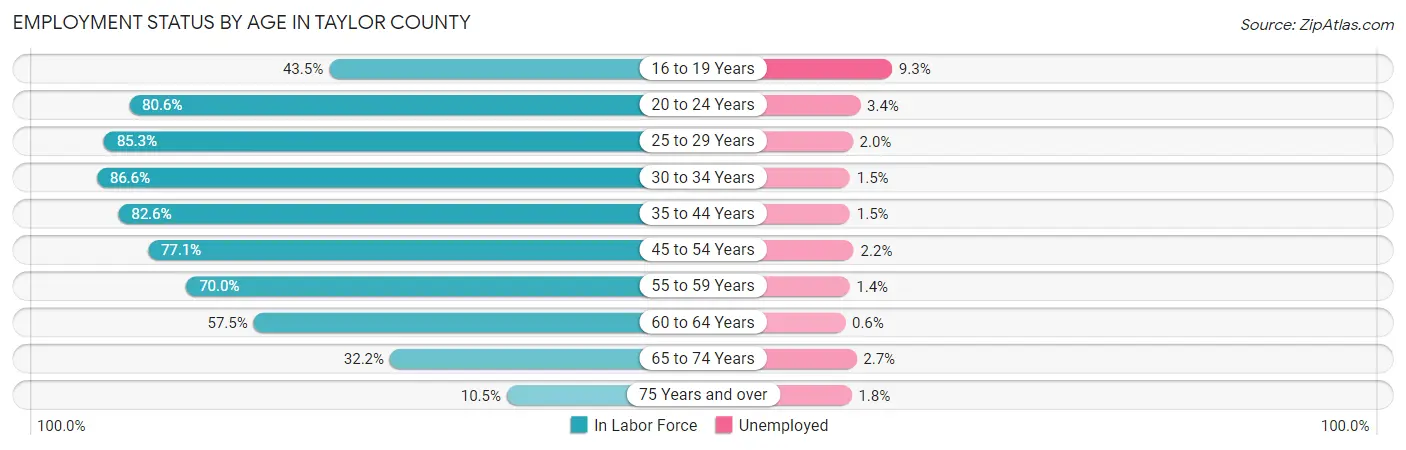
| Age Bracket | In Labor Force | Unemployed |
| 16 to 19 Years | 3,925 (43.5%) | 365 (9.3%) |
| 20 to 24 Years | 12,275 (80.6%) | 417 (3.4%) |
| 25 to 29 Years | 9,090 (85.3%) | 182 (2.0%) |
| 30 to 34 Years | 8,360 (86.6%) | 125 (1.5%) |
| 35 to 44 Years | 14,377 (82.6%) | 216 (1.5%) |
| 45 to 54 Years | 10,318 (77.1%) | 227 (2.2%) |
| 55 to 59 Years | 5,352 (70.0%) | 75 (1.4%) |
| 60 to 64 Years | 4,302 (57.5%) | 26 (0.6%) |
| 65 to 74 Years | 3,740 (32.2%) | 101 (2.7%) |
| 75 Years and over | 980 (10.5%) | 18 (1.8%) |
| Total | 72,763 (65.3%) | 1,746 (2.4%) |
Employment Status by Educational Attainment in Taylor County
According to labor force statistics for Taylor County, 78.2% of individuals (51,790) out of the total population between 25 and 64 years of age (66,228) are in the labor force, with 1.7% or 880 of them being unemployed. The group with the highest labor force participation rate are those with the educational attainment of bachelor's degree or higher, with 86.1% or 16,630 individuals in the labor force. Within the labor force, individuals with less than high school education have the highest percentage of unemployment, with 2.4% or 81 of them being unemployed.
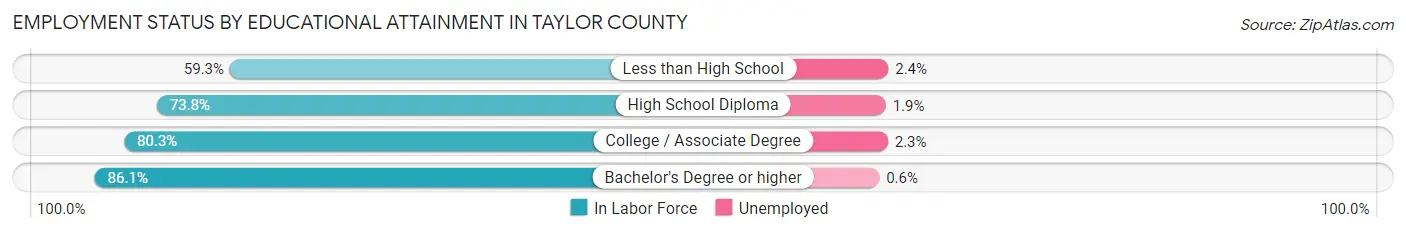
| Educational Attainment | In Labor Force | Unemployed |
| Less than High School | 3,391 (59.3%) | 137 (2.4%) |
| High School Diploma | 14,541 (73.8%) | 374 (1.9%) |
| College / Associate Degree | 17,257 (80.3%) | 494 (2.3%) |
| Bachelor's Degree or higher | 16,630 (86.1%) | 116 (0.6%) |
| Total | 51,790 (78.2%) | 1,126 (1.7%) |
Employment Occupations by Sex in Taylor County
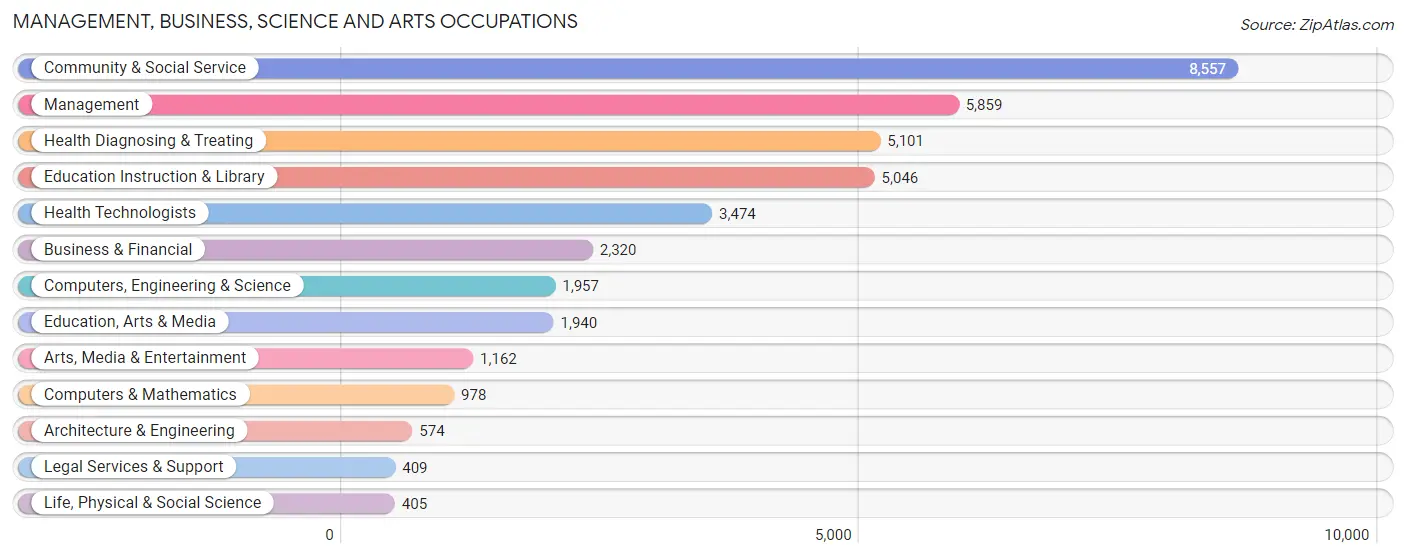
Management, Business, Science and Arts Occupations
The most common Management, Business, Science and Arts occupations in Taylor County are Community & Social Service (8,557 | 12.9%), Management (5,859 | 8.8%), Health Diagnosing & Treating (5,101 | 7.7%), Education Instruction & Library (5,046 | 7.6%), and Health Technologists (3,474 | 5.2%).
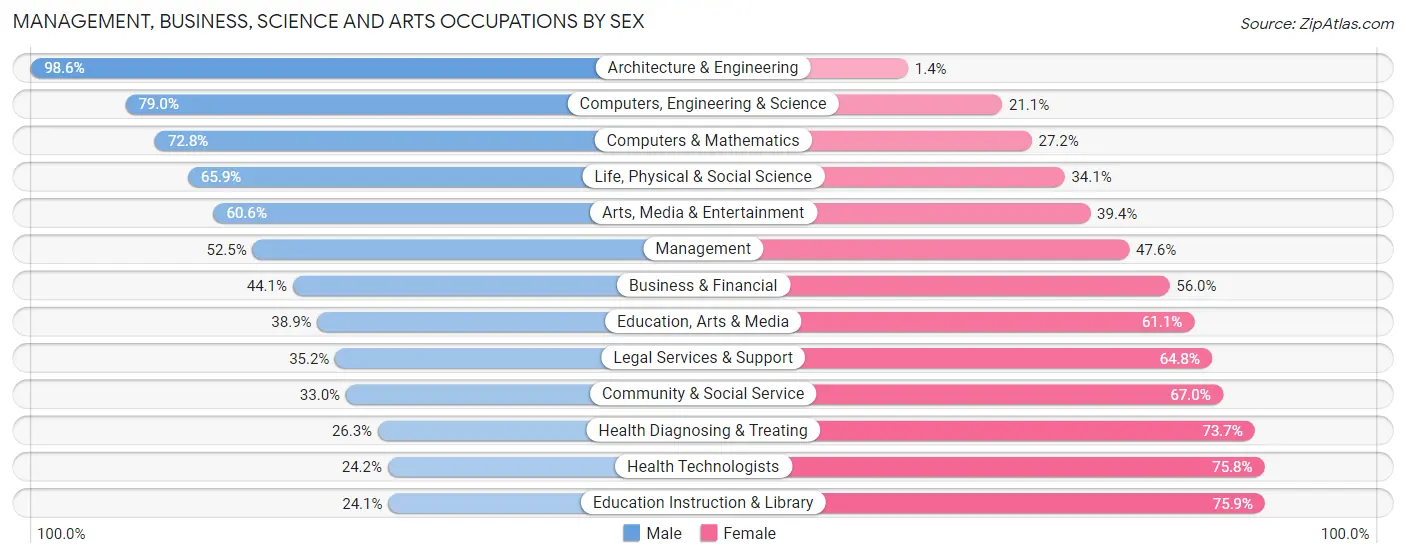
Management, Business, Science and Arts Occupations by Sex
Within the Management, Business, Science and Arts occupations in Taylor County, the most male-oriented occupations are Architecture & Engineering (98.6%), Computers, Engineering & Science (78.9%), and Computers & Mathematics (72.8%), while the most female-oriented occupations are Education Instruction & Library (75.9%), Health Technologists (75.8%), and Health Diagnosing & Treating (73.7%).
| Occupation | Male | Female |
| Management | 3,073 (52.4%) | 2,786 (47.5%) |
| Business & Financial | 1,022 (44.1%) | 1,298 (55.9%) |
| Computers, Engineering & Science | 1,545 (78.9%) | 412 (21.0%) |
| Computers & Mathematics | 712 (72.8%) | 266 (27.2%) |
| Architecture & Engineering | 566 (98.6%) | 8 (1.4%) |
| Life, Physical & Social Science | 267 (65.9%) | 138 (34.1%) |
| Community & Social Service | 2,821 (33.0%) | 5,736 (67.0%) |
| Education, Arts & Media | 755 (38.9%) | 1,185 (61.1%) |
| Legal Services & Support | 144 (35.2%) | 265 (64.8%) |
| Education Instruction & Library | 1,218 (24.1%) | 3,828 (75.9%) |
| Arts, Media & Entertainment | 704 (60.6%) | 458 (39.4%) |
| Health Diagnosing & Treating | 1,341 (26.3%) | 3,760 (73.7%) |
| Health Technologists | 842 (24.2%) | 2,632 (75.8%) |
| Total (Category) | 9,802 (41.2%) | 13,992 (58.8%) |
| Total (Overall) | 33,591 (50.8%) | 32,589 (49.2%) |
Services Occupations
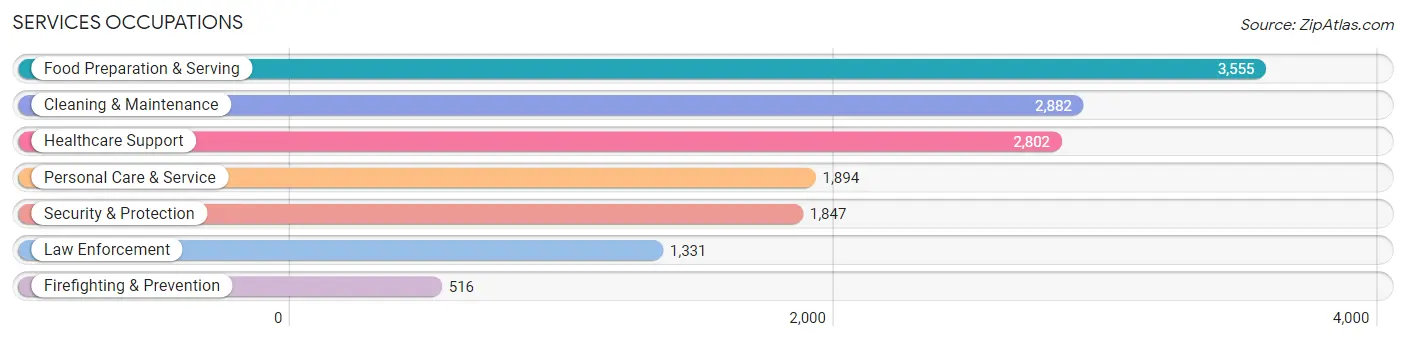
The most common Services occupations in Taylor County are Food Preparation & Serving (3,555 | 5.4%), Cleaning & Maintenance (2,882 | 4.3%), Healthcare Support (2,802 | 4.2%), Personal Care & Service (1,894 | 2.9%), and Security & Protection (1,847 | 2.8%).
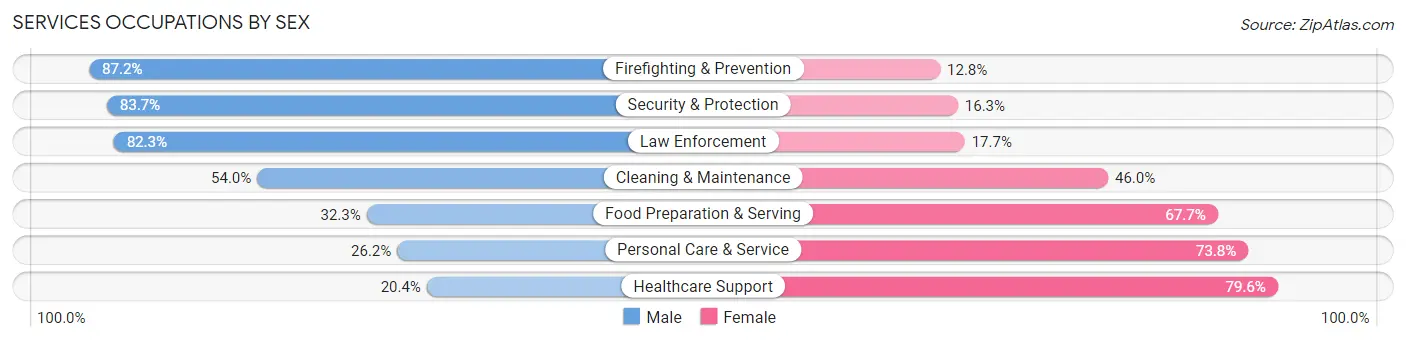
Services Occupations by Sex
Within the Services occupations in Taylor County, the most male-oriented occupations are Firefighting & Prevention (87.2%), Security & Protection (83.7%), and Law Enforcement (82.3%), while the most female-oriented occupations are Healthcare Support (79.6%), Personal Care & Service (73.8%), and Food Preparation & Serving (67.7%).
| Occupation | Male | Female |
| Healthcare Support | 571 (20.4%) | 2,231 (79.6%) |
| Security & Protection | 1,546 (83.7%) | 301 (16.3%) |
| Firefighting & Prevention | 450 (87.2%) | 66 (12.8%) |
| Law Enforcement | 1,096 (82.3%) | 235 (17.7%) |
| Food Preparation & Serving | 1,148 (32.3%) | 2,407 (67.7%) |
| Cleaning & Maintenance | 1,555 (54.0%) | 1,327 (46.0%) |
| Personal Care & Service | 497 (26.2%) | 1,397 (73.8%) |
| Total (Category) | 5,317 (41.0%) | 7,663 (59.0%) |
| Total (Overall) | 33,591 (50.8%) | 32,589 (49.2%) |
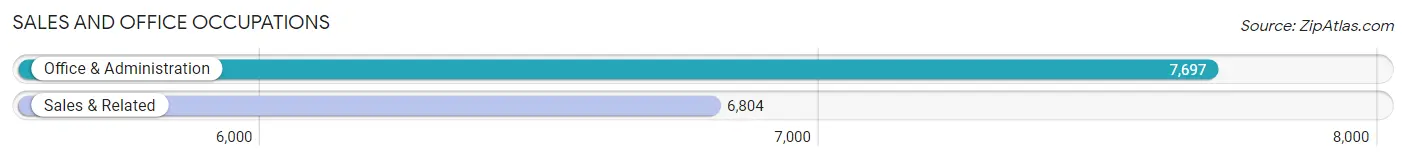
Sales and Office Occupations
The most common Sales and Office occupations in Taylor County are Office & Administration (7,697 | 11.6%), and Sales & Related (6,804 | 10.3%).
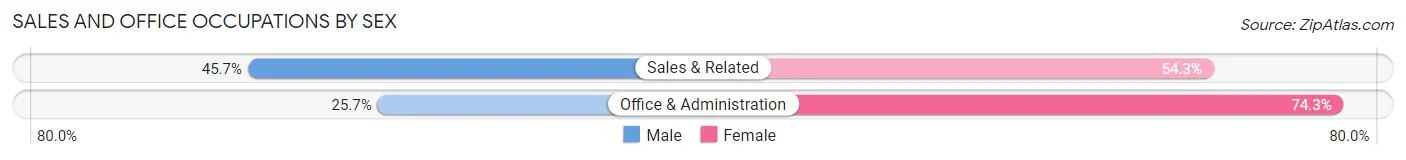
Sales and Office Occupations by Sex
| Occupation | Male | Female |
| Sales & Related | 3,107 (45.7%) | 3,697 (54.3%) |
| Office & Administration | 1,978 (25.7%) | 5,719 (74.3%) |
| Total (Category) | 5,085 (35.1%) | 9,416 (64.9%) |
| Total (Overall) | 33,591 (50.8%) | 32,589 (49.2%) |
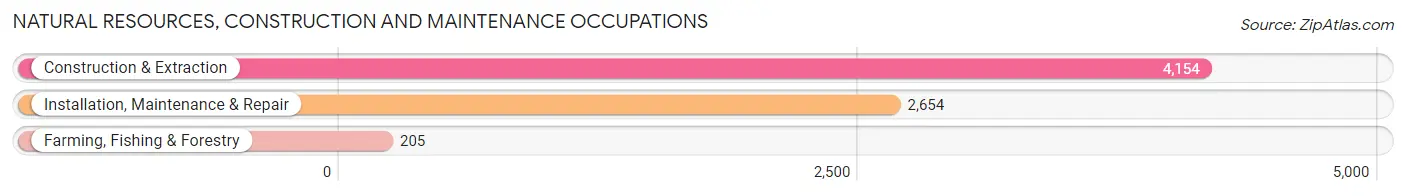
Natural Resources, Construction and Maintenance Occupations
The most common Natural Resources, Construction and Maintenance occupations in Taylor County are Construction & Extraction (4,154 | 6.3%), Installation, Maintenance & Repair (2,654 | 4.0%), and Farming, Fishing & Forestry (205 | 0.3%).
Natural Resources, Construction and Maintenance Occupations by Sex
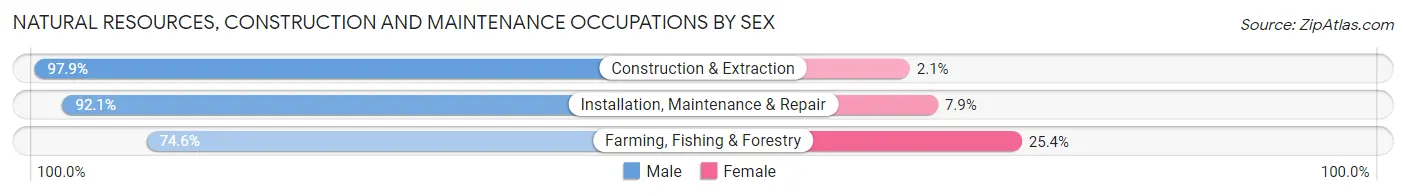
| Occupation | Male | Female |
| Farming, Fishing & Forestry | 153 (74.6%) | 52 (25.4%) |
| Construction & Extraction | 4,068 (97.9%) | 86 (2.1%) |
| Installation, Maintenance & Repair | 2,444 (92.1%) | 210 (7.9%) |
| Total (Category) | 6,665 (95.0%) | 348 (5.0%) |
| Total (Overall) | 33,591 (50.8%) | 32,589 (49.2%) |
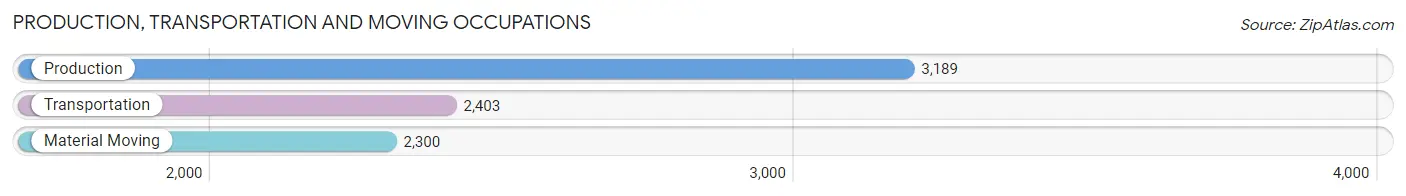
Production, Transportation and Moving Occupations
The most common Production, Transportation and Moving occupations in Taylor County are Production (3,189 | 4.8%), Transportation (2,403 | 3.6%), and Material Moving (2,300 | 3.5%).
Production, Transportation and Moving Occupations by Sex
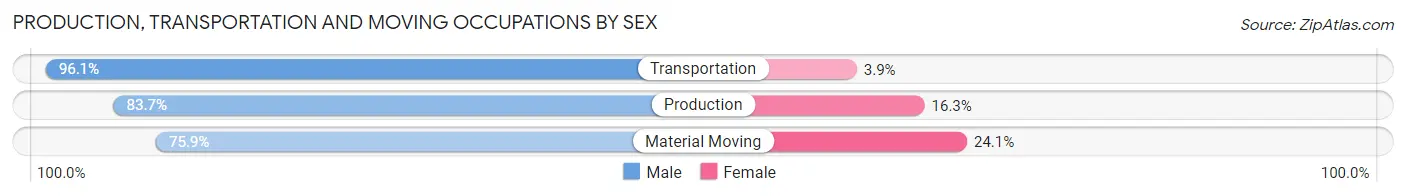
| Occupation | Male | Female |
| Production | 2,668 (83.7%) | 521 (16.3%) |
| Transportation | 2,309 (96.1%) | 94 (3.9%) |
| Material Moving | 1,745 (75.9%) | 555 (24.1%) |
| Total (Category) | 6,722 (85.2%) | 1,170 (14.8%) |
| Total (Overall) | 33,591 (50.8%) | 32,589 (49.2%) |
Employment Industries by Sex in Taylor County
Employment Industries in Taylor County
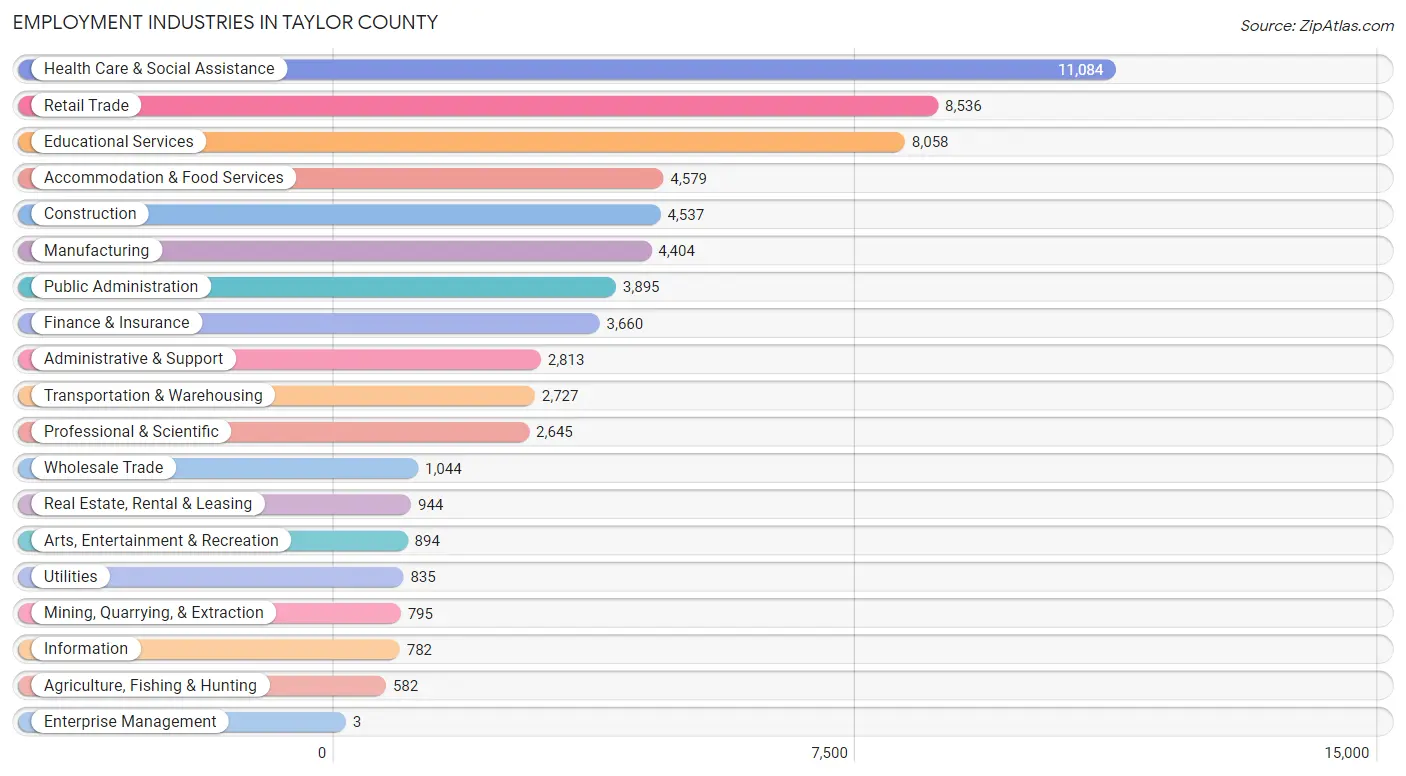
The major employment industries in Taylor County include Health Care & Social Assistance (11,084 | 16.8%), Retail Trade (8,536 | 12.9%), Educational Services (8,058 | 12.2%), Accommodation & Food Services (4,579 | 6.9%), and Construction (4,537 | 6.9%).
Employment Industries by Sex in Taylor County
The Taylor County industries that see more men than women are Enterprise Management (100.0%), Construction (95.3%), and Transportation & Warehousing (87.2%), whereas the industries that tend to have a higher number of women are Health Care & Social Assistance (76.8%), Educational Services (69.4%), and Finance & Insurance (69.2%).
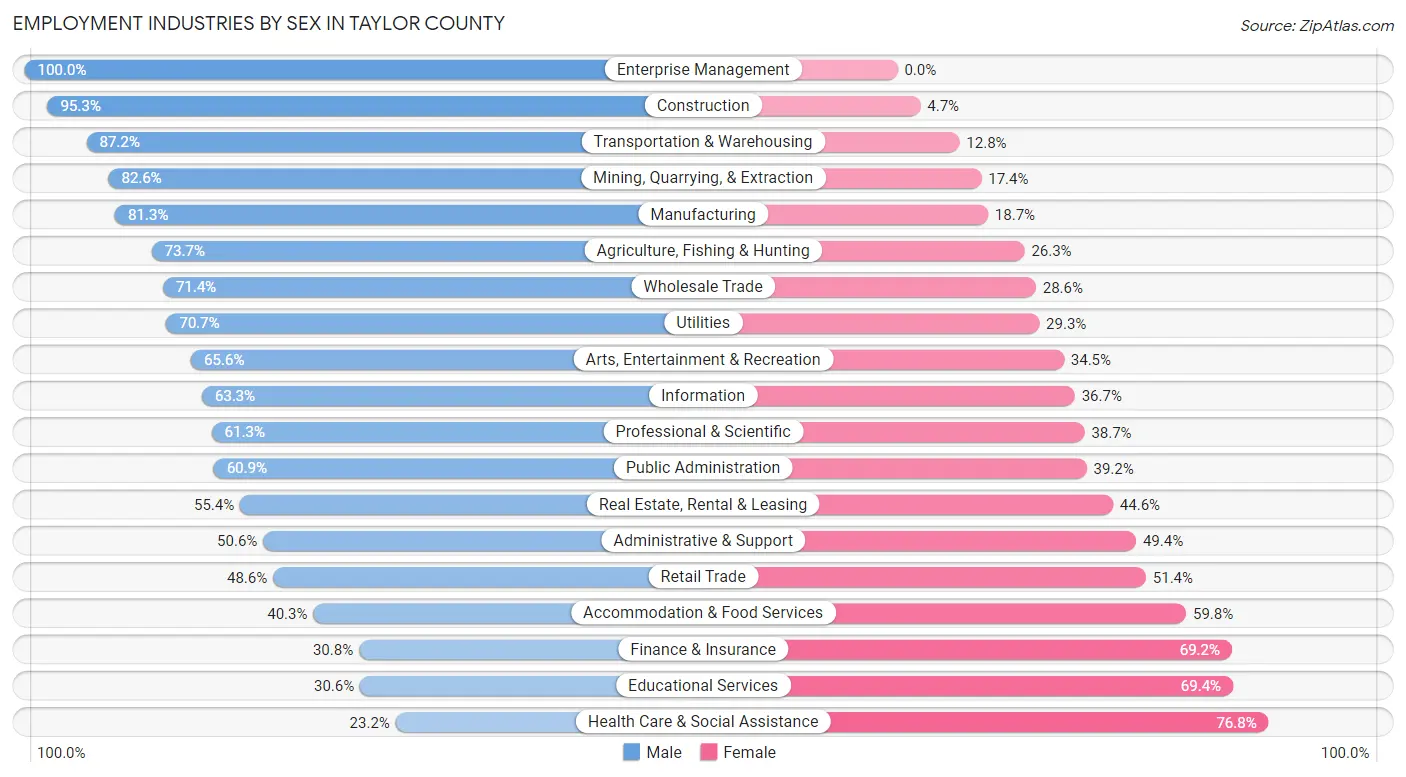
| Industry | Male | Female |
| Agriculture, Fishing & Hunting | 429 (73.7%) | 153 (26.3%) |
| Mining, Quarrying, & Extraction | 657 (82.6%) | 138 (17.4%) |
| Construction | 4,322 (95.3%) | 215 (4.7%) |
| Manufacturing | 3,579 (81.3%) | 825 (18.7%) |
| Wholesale Trade | 745 (71.4%) | 299 (28.6%) |
| Retail Trade | 4,147 (48.6%) | 4,389 (51.4%) |
| Transportation & Warehousing | 2,377 (87.2%) | 350 (12.8%) |
| Utilities | 590 (70.7%) | 245 (29.3%) |
| Information | 495 (63.3%) | 287 (36.7%) |
| Finance & Insurance | 1,127 (30.8%) | 2,533 (69.2%) |
| Real Estate, Rental & Leasing | 523 (55.4%) | 421 (44.6%) |
| Professional & Scientific | 1,621 (61.3%) | 1,024 (38.7%) |
| Enterprise Management | 3 (100.0%) | 0 (0.0%) |
| Administrative & Support | 1,424 (50.6%) | 1,389 (49.4%) |
| Educational Services | 2,463 (30.6%) | 5,595 (69.4%) |
| Health Care & Social Assistance | 2,572 (23.2%) | 8,512 (76.8%) |
| Arts, Entertainment & Recreation | 586 (65.5%) | 308 (34.4%) |
| Accommodation & Food Services | 1,843 (40.3%) | 2,736 (59.8%) |
| Public Administration | 2,370 (60.9%) | 1,525 (39.2%) |
| Total | 33,591 (50.8%) | 32,589 (49.2%) |
Education in Taylor County
School Enrollment in Taylor County
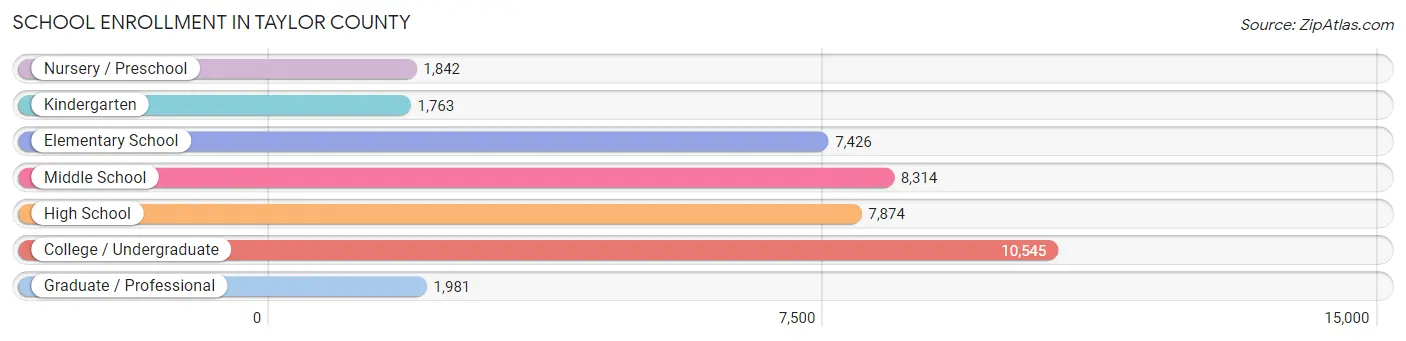
The most common levels of schooling among the 39,745 students in Taylor County are college / undergraduate (10,545 | 26.5%), middle school (8,314 | 20.9%), and high school (7,874 | 19.8%).
| School Level | # Students | % Students |
| Nursery / Preschool | 1,842 | 4.6% |
| Kindergarten | 1,763 | 4.4% |
| Elementary School | 7,426 | 18.7% |
| Middle School | 8,314 | 20.9% |
| High School | 7,874 | 19.8% |
| College / Undergraduate | 10,545 | 26.5% |
| Graduate / Professional | 1,981 | 5.0% |
| Total | 39,745 | 100.0% |
School Enrollment by Age by Funding Source in Taylor County
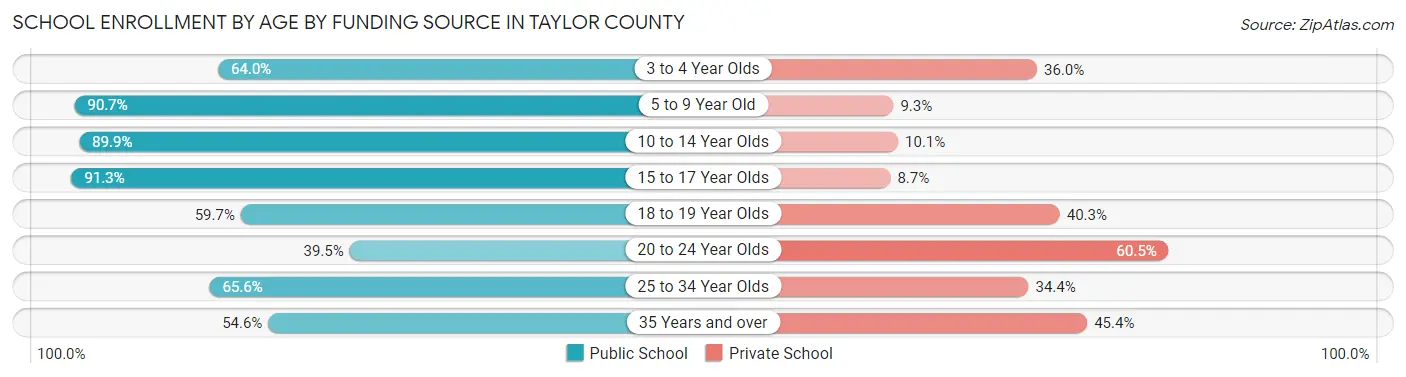
Out of a total of 39,745 students who are enrolled in schools in Taylor County, 9,817 (24.7%) attend a private institution, while the remaining 29,928 (75.3%) are enrolled in public schools. The age group of 20 to 24 year olds has the highest likelihood of being enrolled in private schools, with 3,914 (60.5% in the age bracket) enrolled. Conversely, the age group of 15 to 17 year olds has the lowest likelihood of being enrolled in a private school, with 4,938 (91.3% in the age bracket) attending a public institution.
| Age Bracket | Public School | Private School |
| 3 to 4 Year Olds | 904 (64.0%) | 509 (36.0%) |
| 5 to 9 Year Old | 7,886 (90.7%) | 806 (9.3%) |
| 10 to 14 Year Olds | 8,925 (89.9%) | 1,007 (10.1%) |
| 15 to 17 Year Olds | 4,938 (91.3%) | 472 (8.7%) |
| 18 to 19 Year Olds | 2,428 (59.7%) | 1,636 (40.3%) |
| 20 to 24 Year Olds | 2,552 (39.5%) | 3,914 (60.5%) |
| 25 to 34 Year Olds | 1,317 (65.6%) | 692 (34.4%) |
| 35 Years and over | 961 (54.6%) | 798 (45.4%) |
| Total | 29,928 (75.3%) | 9,817 (24.7%) |
Educational Attainment by Field of Study in Taylor County
Education (4,549 | 17.3%), business (4,448 | 16.9%), science & technology (4,056 | 15.4%), arts & humanities (2,232 | 8.5%), and bio, nature & agricultural (1,464 | 5.6%) are the most common fields of study among 26,322 individuals in Taylor County who have obtained a bachelor's degree or higher.
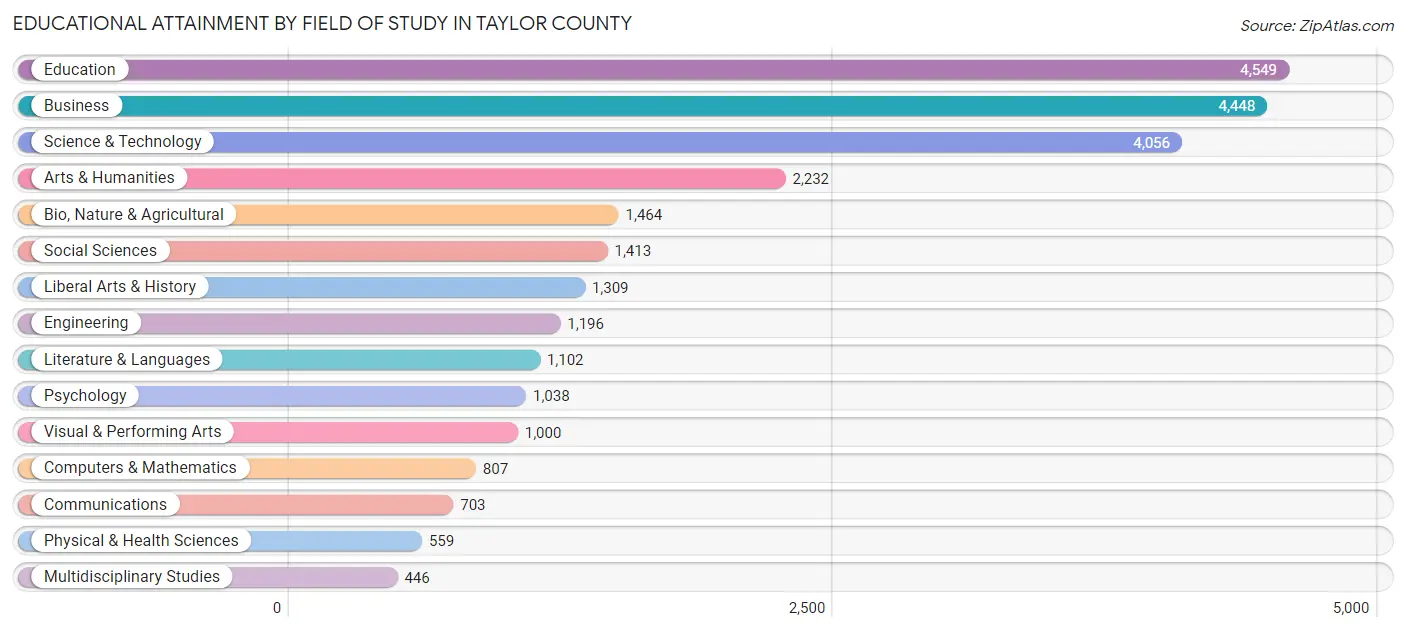
| Field of Study | # Graduates | % Graduates |
| Computers & Mathematics | 807 | 3.1% |
| Bio, Nature & Agricultural | 1,464 | 5.6% |
| Physical & Health Sciences | 559 | 2.1% |
| Psychology | 1,038 | 3.9% |
| Social Sciences | 1,413 | 5.4% |
| Engineering | 1,196 | 4.5% |
| Multidisciplinary Studies | 446 | 1.7% |
| Science & Technology | 4,056 | 15.4% |
| Business | 4,448 | 16.9% |
| Education | 4,549 | 17.3% |
| Literature & Languages | 1,102 | 4.2% |
| Liberal Arts & History | 1,309 | 5.0% |
| Visual & Performing Arts | 1,000 | 3.8% |
| Communications | 703 | 2.7% |
| Arts & Humanities | 2,232 | 8.5% |
| Total | 26,322 | 100.0% |
Transportation & Commute in Taylor County
Vehicle Availability by Sex in Taylor County
The most prevalent vehicle ownership categories in Taylor County are males with 2 vehicles (17,290, accounting for 47.9%) and females with 2 vehicles (14,932, making up 54.2%).
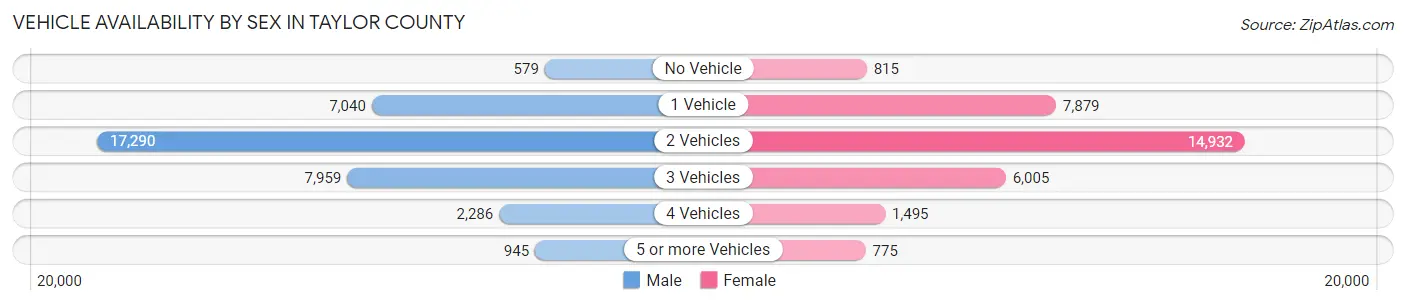
| Vehicles Available | Male | Female |
| No Vehicle | 579 (1.6%) | 815 (2.5%) |
| 1 Vehicle | 7,040 (19.5%) | 7,879 (24.7%) |
| 2 Vehicles | 17,290 (47.9%) | 14,932 (46.8%) |
| 3 Vehicles | 7,959 (22.1%) | 6,005 (18.8%) |
| 4 Vehicles | 2,286 (6.3%) | 1,495 (4.7%) |
| 5 or more Vehicles | 945 (2.6%) | 775 (2.4%) |
| Total | 36,099 (100.0%) | 31,901 (100.0%) |
Commute Time in Taylor County
The most frequently occuring commute durations in Taylor County are 10 to 14 minutes (16,406 commuters, 25.1%), 15 to 19 minutes (15,685 commuters, 24.0%), and 5 to 9 minutes (12,908 commuters, 19.7%).
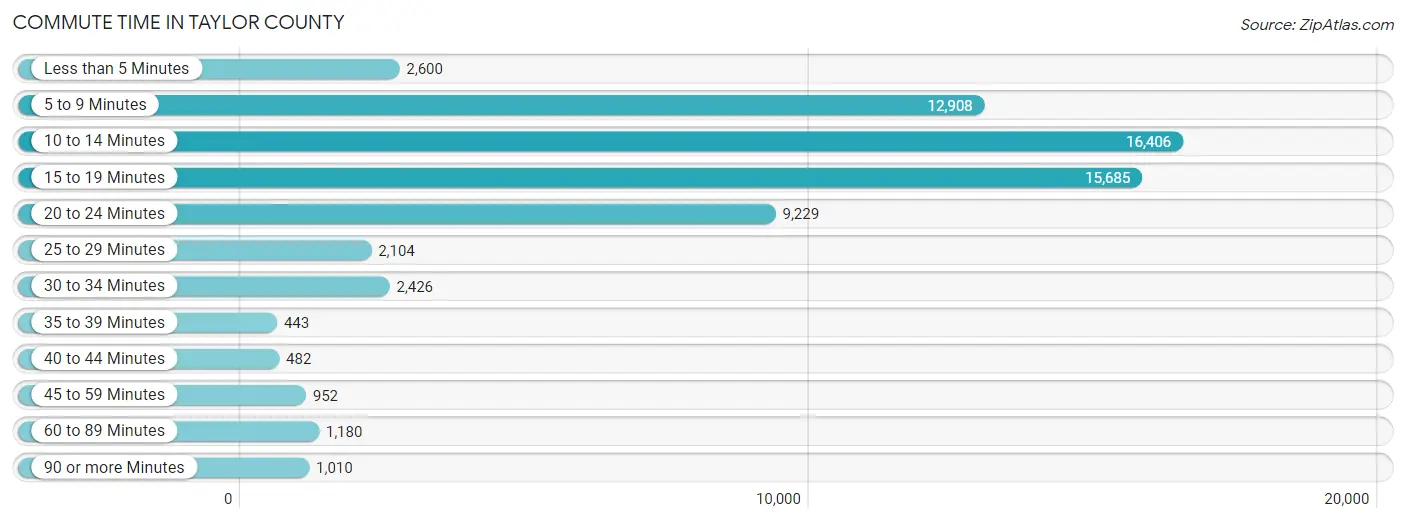
| Commute Time | # Commuters | % Commuters |
| Less than 5 Minutes | 2,600 | 4.0% |
| 5 to 9 Minutes | 12,908 | 19.7% |
| 10 to 14 Minutes | 16,406 | 25.1% |
| 15 to 19 Minutes | 15,685 | 24.0% |
| 20 to 24 Minutes | 9,229 | 14.1% |
| 25 to 29 Minutes | 2,104 | 3.2% |
| 30 to 34 Minutes | 2,426 | 3.7% |
| 35 to 39 Minutes | 443 | 0.7% |
| 40 to 44 Minutes | 482 | 0.7% |
| 45 to 59 Minutes | 952 | 1.5% |
| 60 to 89 Minutes | 1,180 | 1.8% |
| 90 or more Minutes | 1,010 | 1.5% |
Commute Time by Sex in Taylor County
The most common commute times in Taylor County are 15 to 19 minutes (8,340 commuters, 23.8%) for males and 10 to 14 minutes (8,071 commuters, 26.5%) for females.
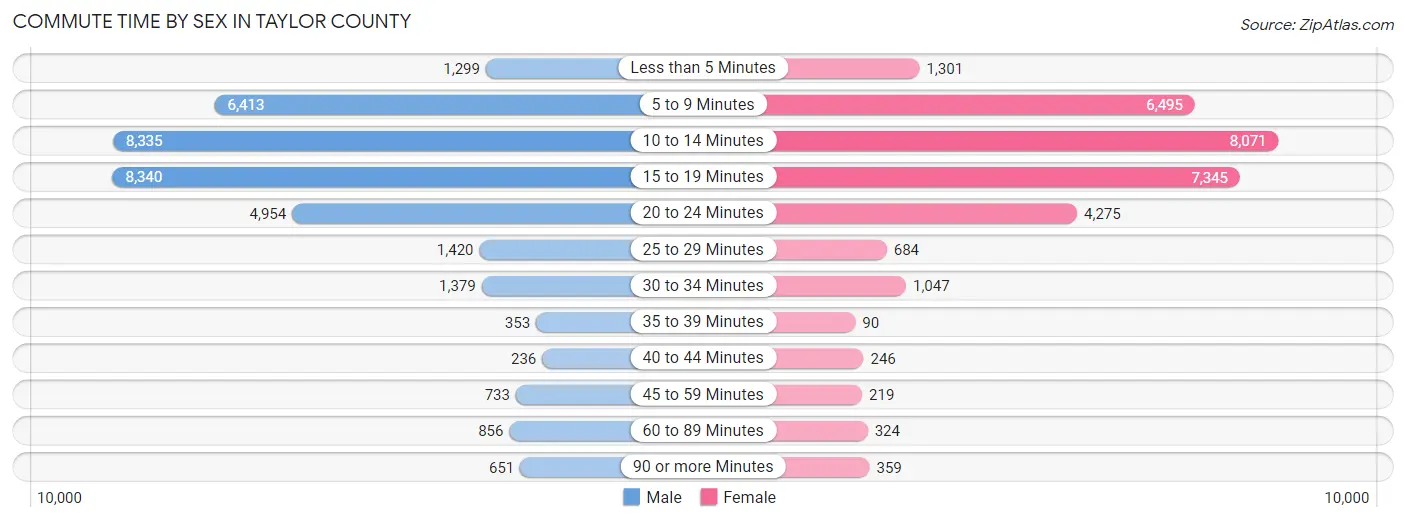
| Commute Time | Male | Female |
| Less than 5 Minutes | 1,299 (3.7%) | 1,301 (4.3%) |
| 5 to 9 Minutes | 6,413 (18.3%) | 6,495 (21.3%) |
| 10 to 14 Minutes | 8,335 (23.8%) | 8,071 (26.5%) |
| 15 to 19 Minutes | 8,340 (23.8%) | 7,345 (24.1%) |
| 20 to 24 Minutes | 4,954 (14.2%) | 4,275 (14.0%) |
| 25 to 29 Minutes | 1,420 (4.1%) | 684 (2.2%) |
| 30 to 34 Minutes | 1,379 (3.9%) | 1,047 (3.4%) |
| 35 to 39 Minutes | 353 (1.0%) | 90 (0.3%) |
| 40 to 44 Minutes | 236 (0.7%) | 246 (0.8%) |
| 45 to 59 Minutes | 733 (2.1%) | 219 (0.7%) |
| 60 to 89 Minutes | 856 (2.5%) | 324 (1.1%) |
| 90 or more Minutes | 651 (1.9%) | 359 (1.2%) |
Time of Departure to Work by Sex in Taylor County
The most frequent times of departure to work in Taylor County are 7:30 AM to 7:59 AM (5,986, 17.1%) for males and 7:30 AM to 7:59 AM (7,029, 23.1%) for females.
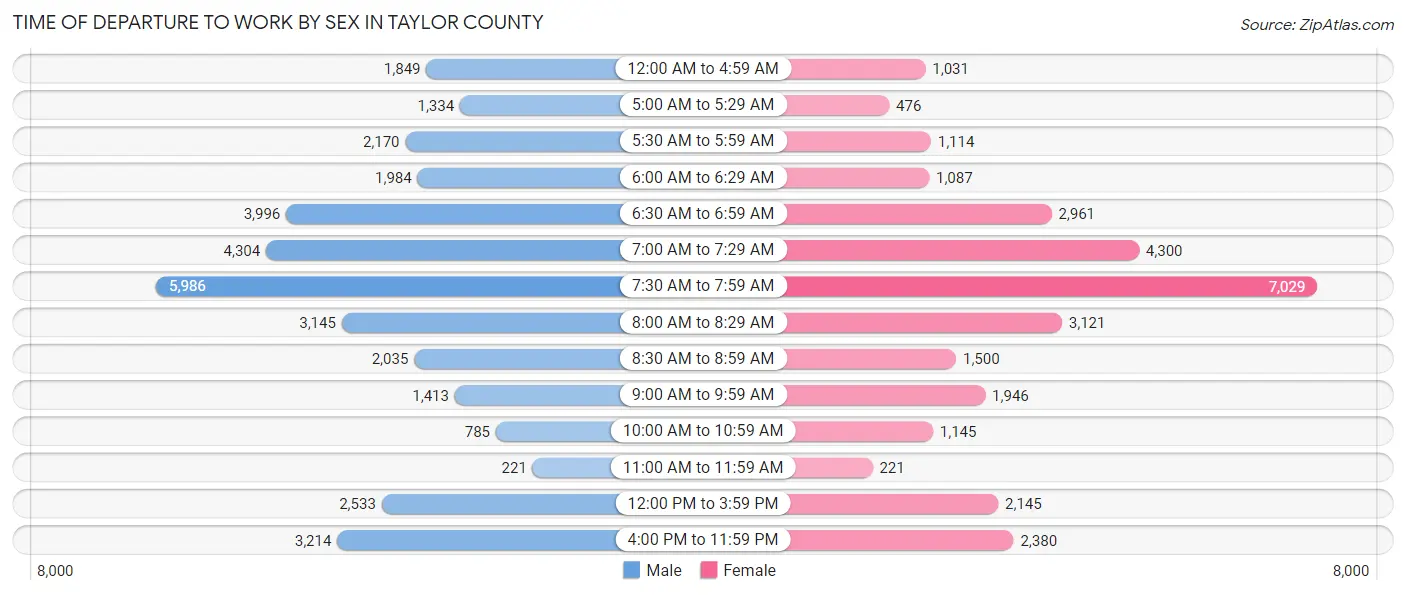
| Time of Departure | Male | Female |
| 12:00 AM to 4:59 AM | 1,849 (5.3%) | 1,031 (3.4%) |
| 5:00 AM to 5:29 AM | 1,334 (3.8%) | 476 (1.6%) |
| 5:30 AM to 5:59 AM | 2,170 (6.2%) | 1,114 (3.7%) |
| 6:00 AM to 6:29 AM | 1,984 (5.7%) | 1,087 (3.6%) |
| 6:30 AM to 6:59 AM | 3,996 (11.4%) | 2,961 (9.7%) |
| 7:00 AM to 7:29 AM | 4,304 (12.3%) | 4,300 (14.1%) |
| 7:30 AM to 7:59 AM | 5,986 (17.1%) | 7,029 (23.1%) |
| 8:00 AM to 8:29 AM | 3,145 (9.0%) | 3,121 (10.2%) |
| 8:30 AM to 8:59 AM | 2,035 (5.8%) | 1,500 (4.9%) |
| 9:00 AM to 9:59 AM | 1,413 (4.0%) | 1,946 (6.4%) |
| 10:00 AM to 10:59 AM | 785 (2.2%) | 1,145 (3.8%) |
| 11:00 AM to 11:59 AM | 221 (0.6%) | 221 (0.7%) |
| 12:00 PM to 3:59 PM | 2,533 (7.2%) | 2,145 (7.0%) |
| 4:00 PM to 11:59 PM | 3,214 (9.2%) | 2,380 (7.8%) |
| Total | 34,969 (100.0%) | 30,456 (100.0%) |
Housing Occupancy in Taylor County
Occupancy by Ownership in Taylor County
Of the total 53,888 dwellings in Taylor County, owner-occupied units account for 31,646 (58.7%), while renter-occupied units make up 22,242 (41.3%).
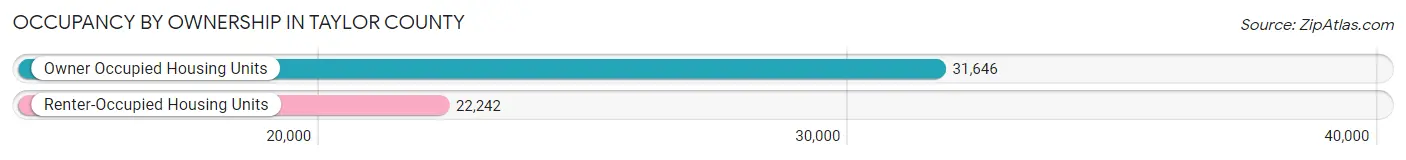
| Occupancy | # Housing Units | % Housing Units |
| Owner Occupied Housing Units | 31,646 | 58.7% |
| Renter-Occupied Housing Units | 22,242 | 41.3% |
| Total Occupied Housing Units | 53,888 | 100.0% |
Occupancy by Household Size in Taylor County
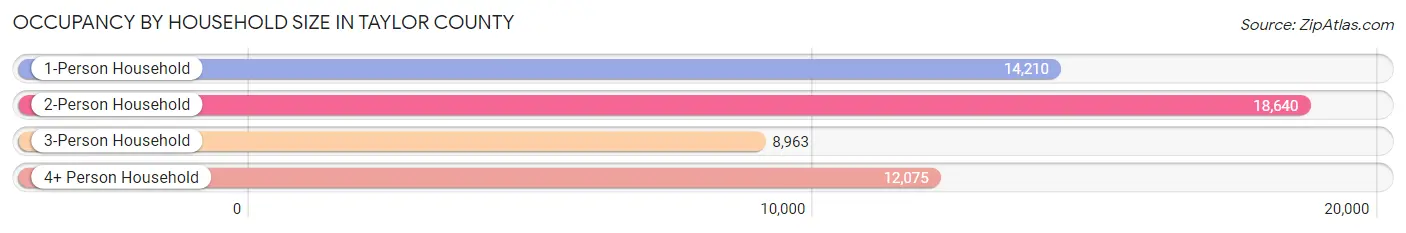
| Household Size | # Housing Units | % Housing Units |
| 1-Person Household | 14,210 | 26.4% |
| 2-Person Household | 18,640 | 34.6% |
| 3-Person Household | 8,963 | 16.6% |
| 4+ Person Household | 12,075 | 22.4% |
| Total Housing Units | 53,888 | 100.0% |
Occupancy by Ownership by Household Size in Taylor County
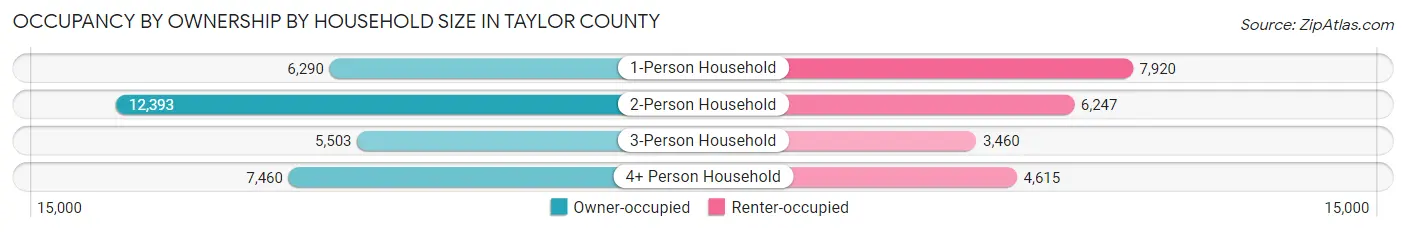
| Household Size | Owner-occupied | Renter-occupied |
| 1-Person Household | 6,290 (44.3%) | 7,920 (55.7%) |
| 2-Person Household | 12,393 (66.5%) | 6,247 (33.5%) |
| 3-Person Household | 5,503 (61.4%) | 3,460 (38.6%) |
| 4+ Person Household | 7,460 (61.8%) | 4,615 (38.2%) |
| Total Housing Units | 31,646 (58.7%) | 22,242 (41.3%) |
Occupancy by Educational Attainment in Taylor County
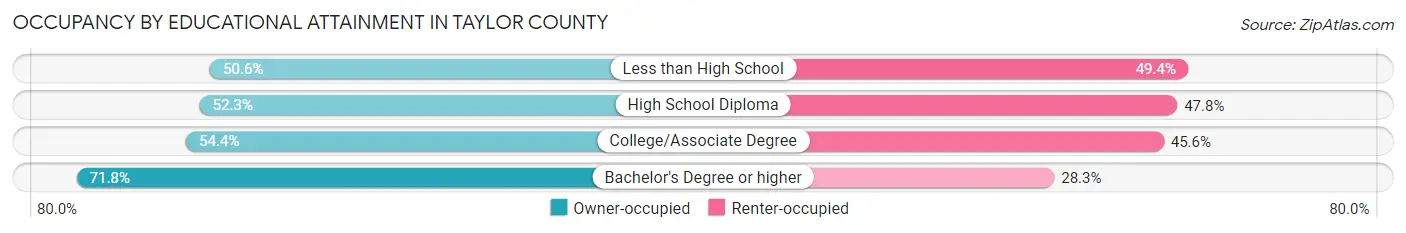
| Household Size | Owner-occupied | Renter-occupied |
| Less than High School | 2,220 (50.6%) | 2,168 (49.4%) |
| High School Diploma | 7,499 (52.2%) | 6,854 (47.7%) |
| College/Associate Degree | 10,303 (54.4%) | 8,644 (45.6%) |
| Bachelor's Degree or higher | 11,624 (71.8%) | 4,576 (28.2%) |
Occupancy by Age of Householder in Taylor County
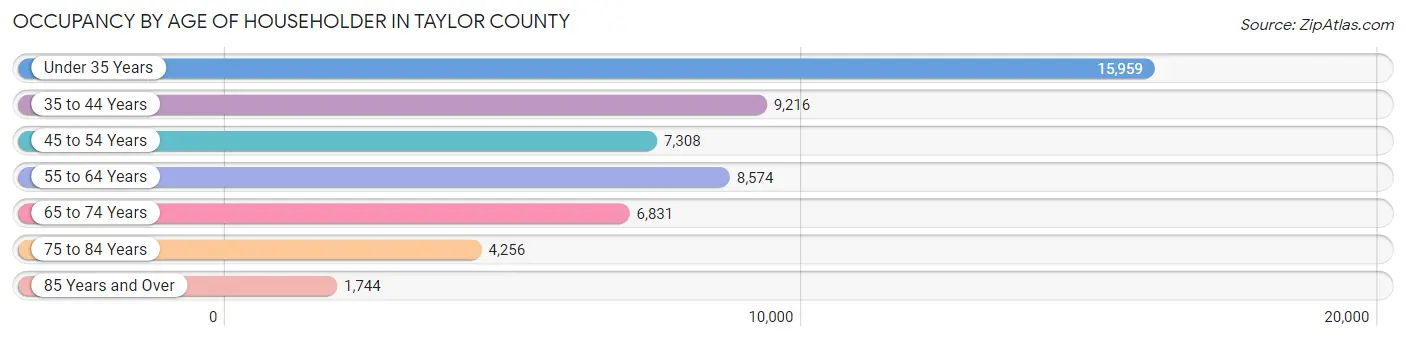
| Age Bracket | # Households | % Households |
| Under 35 Years | 15,959 | 29.6% |
| 35 to 44 Years | 9,216 | 17.1% |
| 45 to 54 Years | 7,308 | 13.6% |
| 55 to 64 Years | 8,574 | 15.9% |
| 65 to 74 Years | 6,831 | 12.7% |
| 75 to 84 Years | 4,256 | 7.9% |
| 85 Years and Over | 1,744 | 3.2% |
| Total | 53,888 | 100.0% |
Housing Finances in Taylor County
Median Income by Occupancy in Taylor County
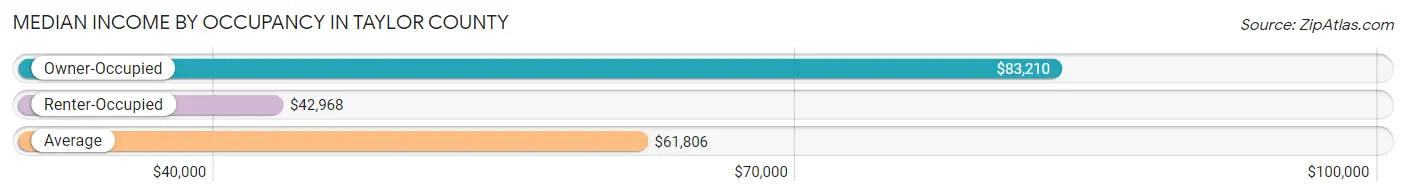
| Occupancy Type | # Households | Median Income |
| Owner-Occupied | 31,646 (58.7%) | $83,210 |
| Renter-Occupied | 22,242 (41.3%) | $42,968 |
| Average | 53,888 (100.0%) | $61,806 |
Occupancy by Householder Income Bracket in Taylor County
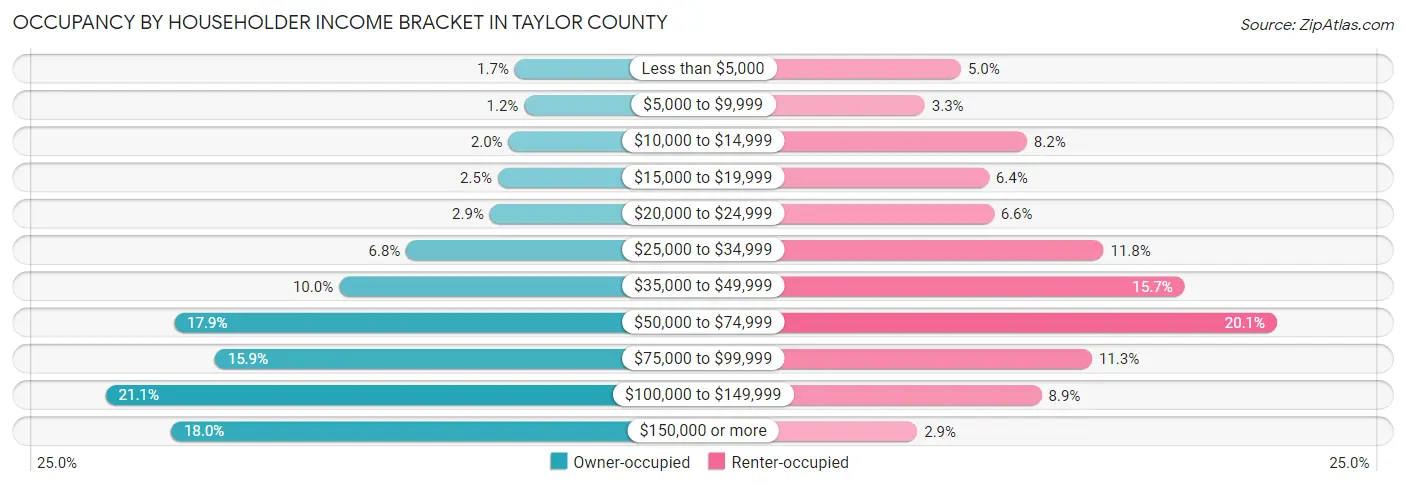
| Income Bracket | Owner-occupied | Renter-occupied |
| Less than $5,000 | 525 (1.7%) | 1,117 (5.0%) |
| $5,000 to $9,999 | 383 (1.2%) | 733 (3.3%) |
| $10,000 to $14,999 | 621 (2.0%) | 1,814 (8.2%) |
| $15,000 to $19,999 | 783 (2.5%) | 1,412 (6.4%) |
| $20,000 to $24,999 | 903 (2.9%) | 1,464 (6.6%) |
| $25,000 to $34,999 | 2,161 (6.8%) | 2,626 (11.8%) |
| $35,000 to $49,999 | 3,174 (10.0%) | 3,485 (15.7%) |
| $50,000 to $74,999 | 5,657 (17.9%) | 4,462 (20.1%) |
| $75,000 to $99,999 | 5,043 (15.9%) | 2,505 (11.3%) |
| $100,000 to $149,999 | 6,690 (21.1%) | 1,971 (8.9%) |
| $150,000 or more | 5,706 (18.0%) | 653 (2.9%) |
| Total | 31,646 (100.0%) | 22,242 (100.0%) |
Monthly Housing Cost Tiers in Taylor County
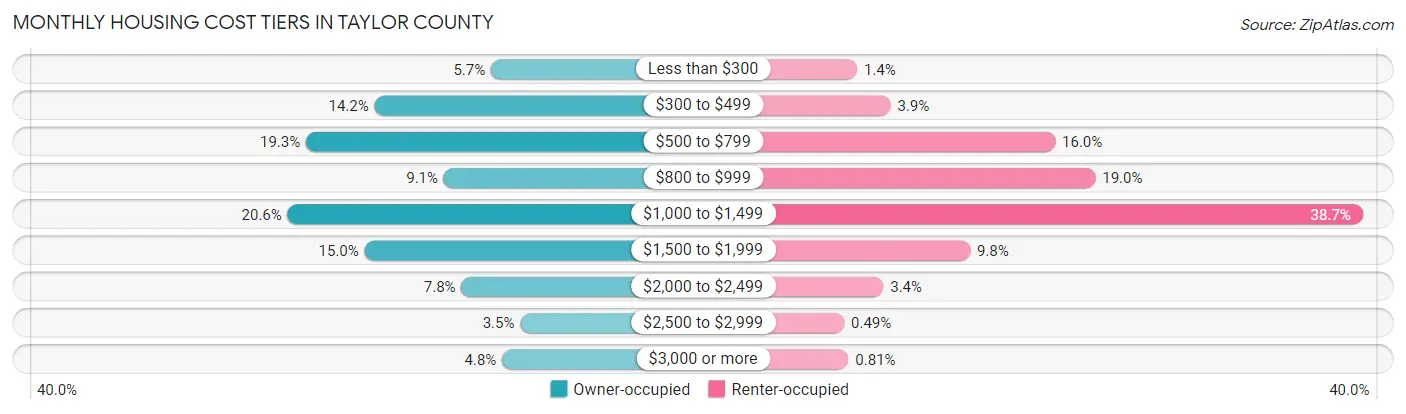
| Monthly Cost | Owner-occupied | Renter-occupied |
| Less than $300 | 1,787 (5.7%) | 321 (1.4%) |
| $300 to $499 | 4,502 (14.2%) | 869 (3.9%) |
| $500 to $799 | 6,098 (19.3%) | 3,566 (16.0%) |
| $800 to $999 | 2,886 (9.1%) | 4,223 (19.0%) |
| $1,000 to $1,499 | 6,529 (20.6%) | 8,603 (38.7%) |
| $1,500 to $1,999 | 4,733 (15.0%) | 2,171 (9.8%) |
| $2,000 to $2,499 | 2,479 (7.8%) | 752 (3.4%) |
| $2,500 to $2,999 | 1,105 (3.5%) | 110 (0.5%) |
| $3,000 or more | 1,527 (4.8%) | 180 (0.8%) |
| Total | 31,646 (100.0%) | 22,242 (100.0%) |
Physical Housing Characteristics in Taylor County
Housing Structures in Taylor County
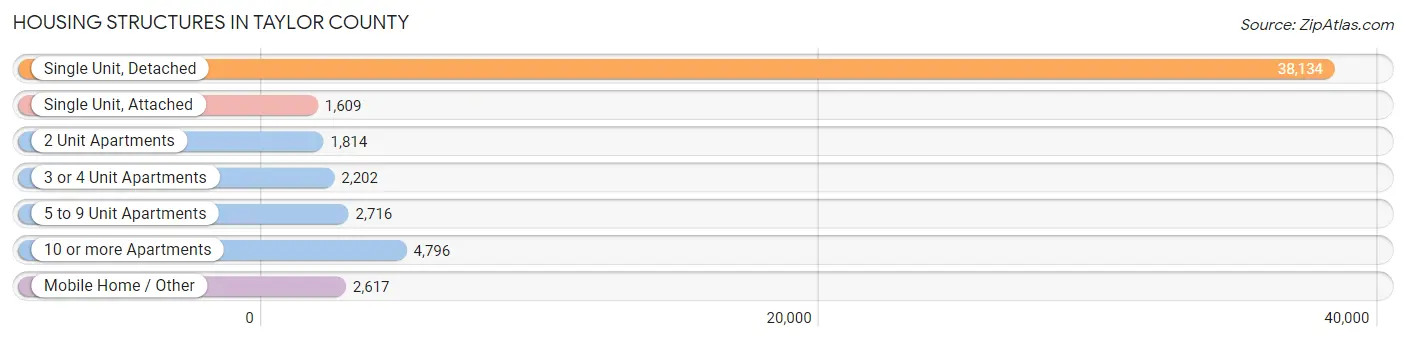
| Structure Type | # Housing Units | % Housing Units |
| Single Unit, Detached | 38,134 | 70.8% |
| Single Unit, Attached | 1,609 | 3.0% |
| 2 Unit Apartments | 1,814 | 3.4% |
| 3 or 4 Unit Apartments | 2,202 | 4.1% |
| 5 to 9 Unit Apartments | 2,716 | 5.0% |
| 10 or more Apartments | 4,796 | 8.9% |
| Mobile Home / Other | 2,617 | 4.9% |
| Total | 53,888 | 100.0% |
Housing Structures by Occupancy in Taylor County
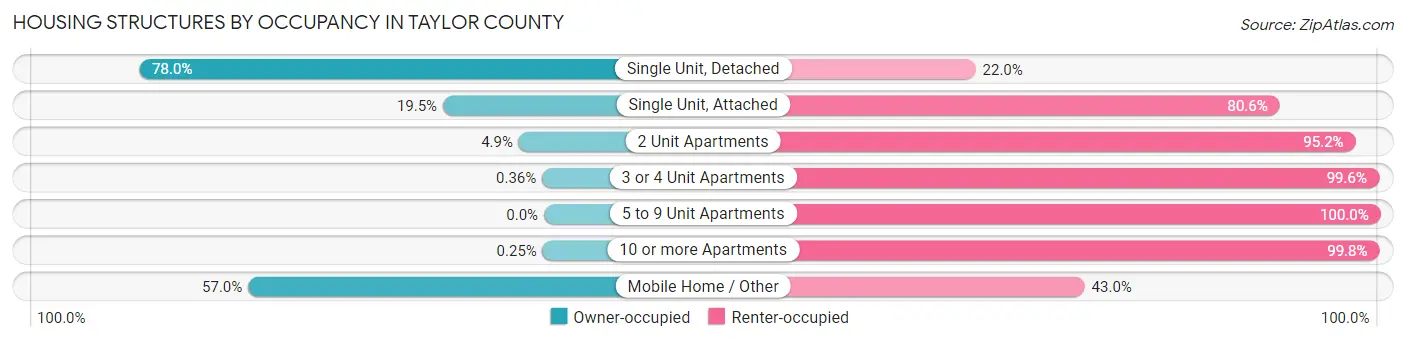
| Structure Type | Owner-occupied | Renter-occupied |
| Single Unit, Detached | 29,734 (78.0%) | 8,400 (22.0%) |
| Single Unit, Attached | 313 (19.5%) | 1,296 (80.5%) |
| 2 Unit Apartments | 88 (4.9%) | 1,726 (95.2%) |
| 3 or 4 Unit Apartments | 8 (0.4%) | 2,194 (99.6%) |
| 5 to 9 Unit Apartments | 0 (0.0%) | 2,716 (100.0%) |
| 10 or more Apartments | 12 (0.3%) | 4,784 (99.8%) |
| Mobile Home / Other | 1,491 (57.0%) | 1,126 (43.0%) |
| Total | 31,646 (58.7%) | 22,242 (41.3%) |
Housing Structures by Number of Rooms in Taylor County
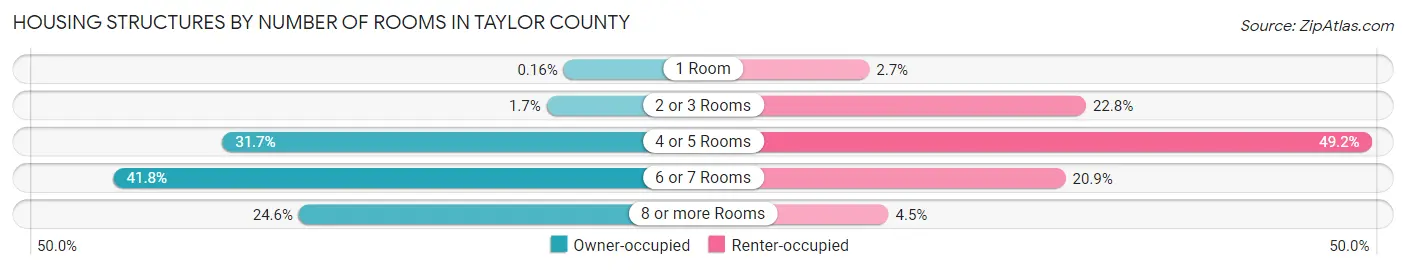
| Number of Rooms | Owner-occupied | Renter-occupied |
| 1 Room | 51 (0.2%) | 604 (2.7%) |
| 2 or 3 Rooms | 548 (1.7%) | 5,062 (22.8%) |
| 4 or 5 Rooms | 10,036 (31.7%) | 10,933 (49.1%) |
| 6 or 7 Rooms | 13,215 (41.8%) | 4,643 (20.9%) |
| 8 or more Rooms | 7,796 (24.6%) | 1,000 (4.5%) |
| Total | 31,646 (100.0%) | 22,242 (100.0%) |
Housing Structure by Heating Type in Taylor County
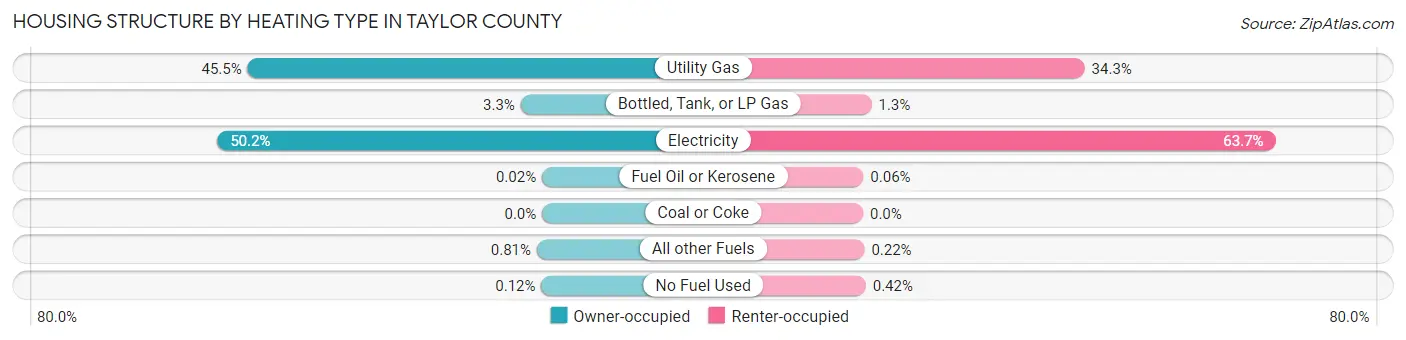
| Heating Type | Owner-occupied | Renter-occupied |
| Utility Gas | 14,408 (45.5%) | 7,619 (34.3%) |
| Bottled, Tank, or LP Gas | 1,047 (3.3%) | 291 (1.3%) |
| Electricity | 15,893 (50.2%) | 14,176 (63.7%) |
| Fuel Oil or Kerosene | 5 (0.0%) | 13 (0.1%) |
| Coal or Coke | 0 (0.0%) | 0 (0.0%) |
| All other Fuels | 256 (0.8%) | 49 (0.2%) |
| No Fuel Used | 37 (0.1%) | 94 (0.4%) |
| Total | 31,646 (100.0%) | 22,242 (100.0%) |
Household Vehicle Usage in Taylor County
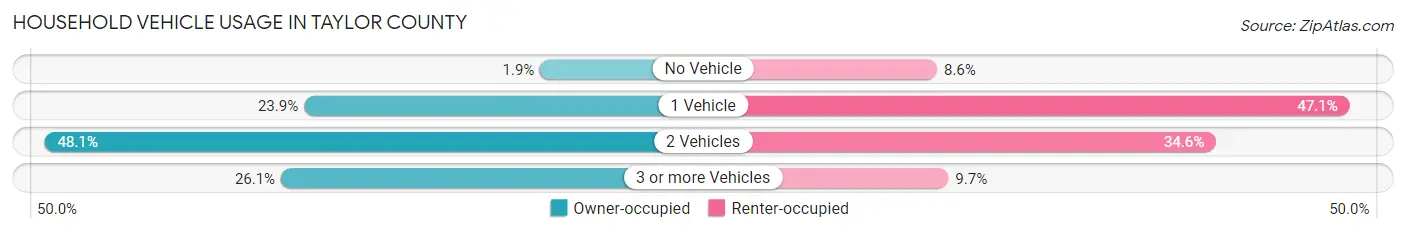
| Vehicles per Household | Owner-occupied | Renter-occupied |
| No Vehicle | 593 (1.9%) | 1,912 (8.6%) |
| 1 Vehicle | 7,570 (23.9%) | 10,477 (47.1%) |
| 2 Vehicles | 15,234 (48.1%) | 7,704 (34.6%) |
| 3 or more Vehicles | 8,249 (26.1%) | 2,149 (9.7%) |
| Total | 31,646 (100.0%) | 22,242 (100.0%) |
Real Estate & Mortgages in Taylor County
Real Estate and Mortgage Overview in Taylor County
| Characteristic | Without Mortgage | With Mortgage |
| Housing Units | 14,491 | 17,155 |
| Median Property Value | $132,600 | $197,400 |
| Median Household Income | $63,284 | $3,914 |
| Monthly Housing Costs | $548 | $1,447 |
| Real Estate Taxes | $1,601 | $816 |
Property Value by Mortgage Status in Taylor County
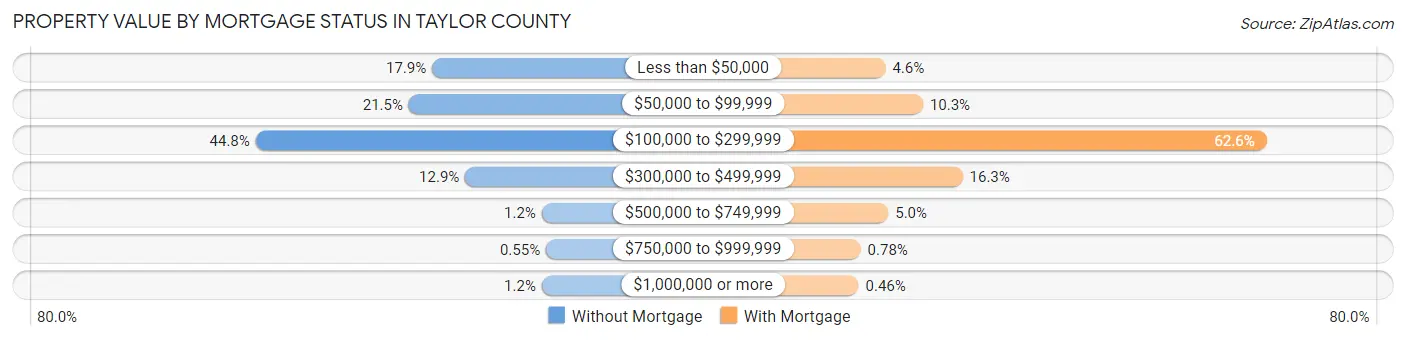
| Property Value | Without Mortgage | With Mortgage |
| Less than $50,000 | 2,595 (17.9%) | 783 (4.6%) |
| $50,000 to $99,999 | 3,110 (21.5%) | 1,761 (10.3%) |
| $100,000 to $299,999 | 6,492 (44.8%) | 10,745 (62.6%) |
| $300,000 to $499,999 | 1,865 (12.9%) | 2,798 (16.3%) |
| $500,000 to $749,999 | 176 (1.2%) | 856 (5.0%) |
| $750,000 to $999,999 | 79 (0.5%) | 133 (0.8%) |
| $1,000,000 or more | 174 (1.2%) | 79 (0.5%) |
| Total | 14,491 (100.0%) | 17,155 (100.0%) |
Household Income by Mortgage Status in Taylor County
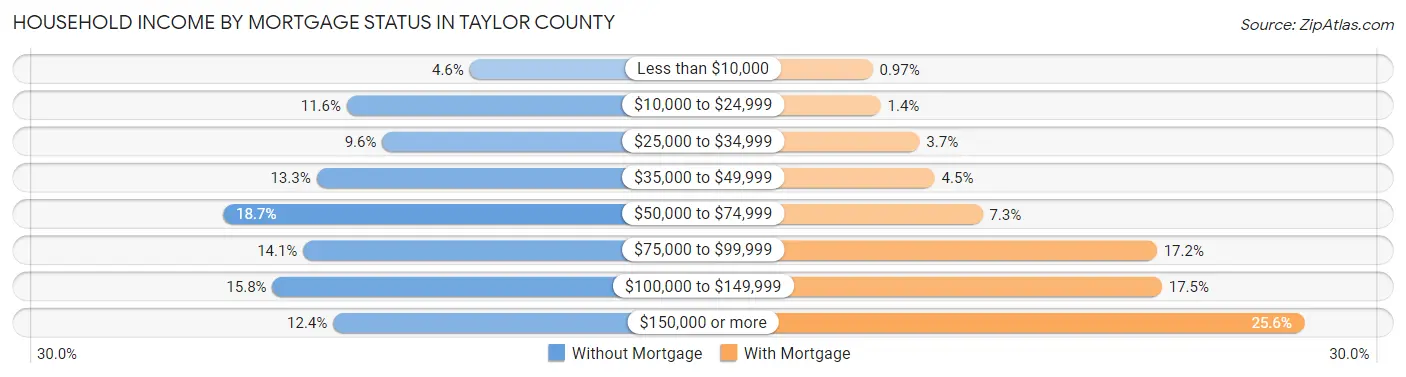
| Household Income | Without Mortgage | With Mortgage |
| Less than $10,000 | 662 (4.6%) | 167 (1.0%) |
| $10,000 to $24,999 | 1,680 (11.6%) | 246 (1.4%) |
| $25,000 to $34,999 | 1,386 (9.6%) | 627 (3.6%) |
| $35,000 to $49,999 | 1,930 (13.3%) | 775 (4.5%) |
| $50,000 to $74,999 | 2,704 (18.7%) | 1,244 (7.2%) |
| $75,000 to $99,999 | 2,041 (14.1%) | 2,953 (17.2%) |
| $100,000 to $149,999 | 2,296 (15.8%) | 3,002 (17.5%) |
| $150,000 or more | 1,792 (12.4%) | 4,394 (25.6%) |
| Total | 14,491 (100.0%) | 17,155 (100.0%) |
Property Value to Household Income Ratio in Taylor County
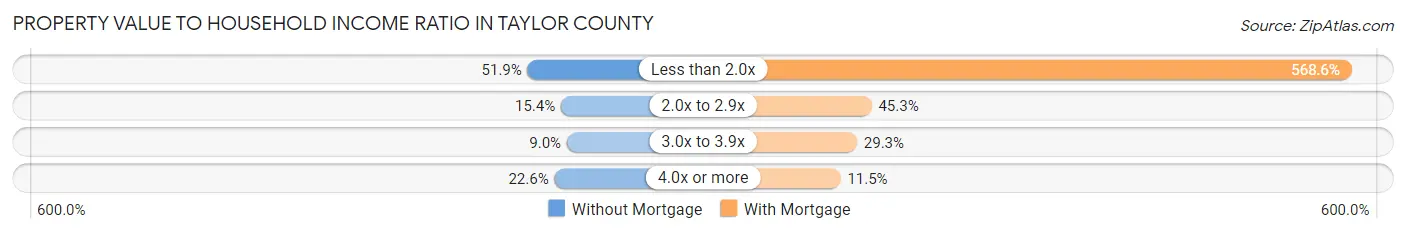
| Value-to-Income Ratio | Without Mortgage | With Mortgage |
| Less than 2.0x | 7,521 (51.9%) | 97,541 (568.6%) |
| 2.0x to 2.9x | 2,233 (15.4%) | 7,773 (45.3%) |
| 3.0x to 3.9x | 1,307 (9.0%) | 5,032 (29.3%) |
| 4.0x or more | 3,275 (22.6%) | 1,970 (11.5%) |
| Total | 14,491 (100.0%) | 17,155 (100.0%) |
Real Estate Taxes by Mortgage Status in Taylor County
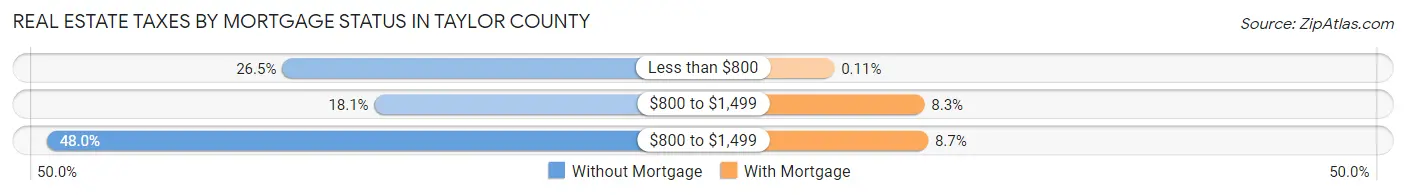
| Property Taxes | Without Mortgage | With Mortgage |
| Less than $800 | 3,836 (26.5%) | 19 (0.1%) |
| $800 to $1,499 | 2,616 (18.0%) | 1,431 (8.3%) |
| $800 to $1,499 | 6,953 (48.0%) | 1,487 (8.7%) |
| Total | 14,491 (100.0%) | 17,155 (100.0%) |
Health & Disability in Taylor County
Health Insurance Coverage by Age in Taylor County
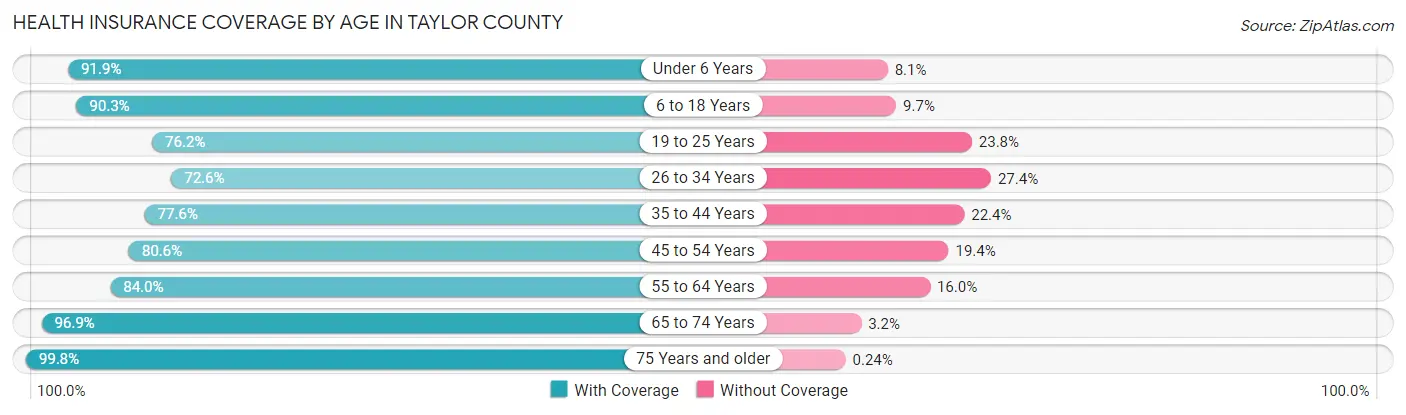
| Age Bracket | With Coverage | Without Coverage |
| Under 6 Years | 10,654 (91.9%) | 939 (8.1%) |
| 6 to 18 Years | 23,458 (90.3%) | 2,510 (9.7%) |
| 19 to 25 Years | 13,609 (76.2%) | 4,248 (23.8%) |
| 26 to 34 Years | 11,866 (72.6%) | 4,469 (27.4%) |
| 35 to 44 Years | 12,802 (77.6%) | 3,691 (22.4%) |
| 45 to 54 Years | 10,517 (80.6%) | 2,538 (19.4%) |
| 55 to 64 Years | 12,578 (84.0%) | 2,392 (16.0%) |
| 65 to 74 Years | 11,143 (96.9%) | 362 (3.2%) |
| 75 Years and older | 8,606 (99.8%) | 21 (0.2%) |
| Total | 115,233 (84.5%) | 21,170 (15.5%) |
Health Insurance Coverage by Citizenship Status in Taylor County
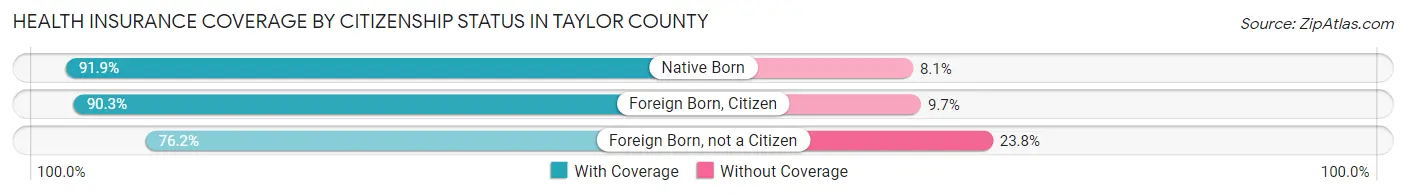
| Citizenship Status | With Coverage | Without Coverage |
| Native Born | 10,654 (91.9%) | 939 (8.1%) |
| Foreign Born, Citizen | 23,458 (90.3%) | 2,510 (9.7%) |
| Foreign Born, not a Citizen | 13,609 (76.2%) | 4,248 (23.8%) |
Health Insurance Coverage by Household Income in Taylor County
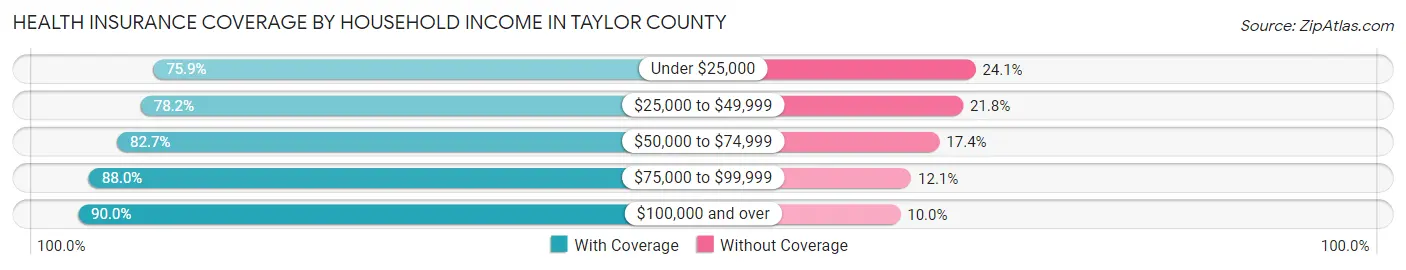
| Household Income | With Coverage | Without Coverage |
| Under $25,000 | 12,854 (75.9%) | 4,081 (24.1%) |
| $25,000 to $49,999 | 19,048 (78.2%) | 5,304 (21.8%) |
| $50,000 to $74,999 | 20,060 (82.7%) | 4,211 (17.3%) |
| $75,000 to $99,999 | 17,853 (87.9%) | 2,445 (12.0%) |
| $100,000 and over | 41,469 (90.0%) | 4,622 (10.0%) |
Public vs Private Health Insurance Coverage by Age in Taylor County
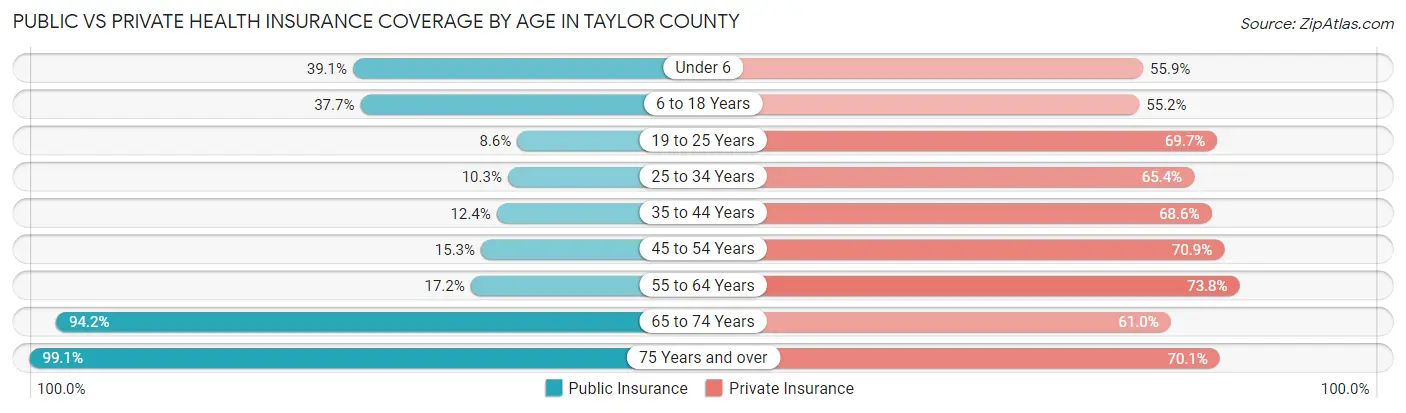
| Age Bracket | Public Insurance | Private Insurance |
| Under 6 | 4,531 (39.1%) | 6,485 (55.9%) |
| 6 to 18 Years | 9,790 (37.7%) | 14,341 (55.2%) |
| 19 to 25 Years | 1,533 (8.6%) | 12,441 (69.7%) |
| 25 to 34 Years | 1,685 (10.3%) | 10,675 (65.3%) |
| 35 to 44 Years | 2,047 (12.4%) | 11,309 (68.6%) |
| 45 to 54 Years | 1,999 (15.3%) | 9,261 (70.9%) |
| 55 to 64 Years | 2,579 (17.2%) | 11,045 (73.8%) |
| 65 to 74 Years | 10,832 (94.2%) | 7,022 (61.0%) |
| 75 Years and over | 8,547 (99.1%) | 6,050 (70.1%) |
| Total | 43,543 (31.9%) | 88,629 (65.0%) |
Disability Status by Sex by Age in Taylor County
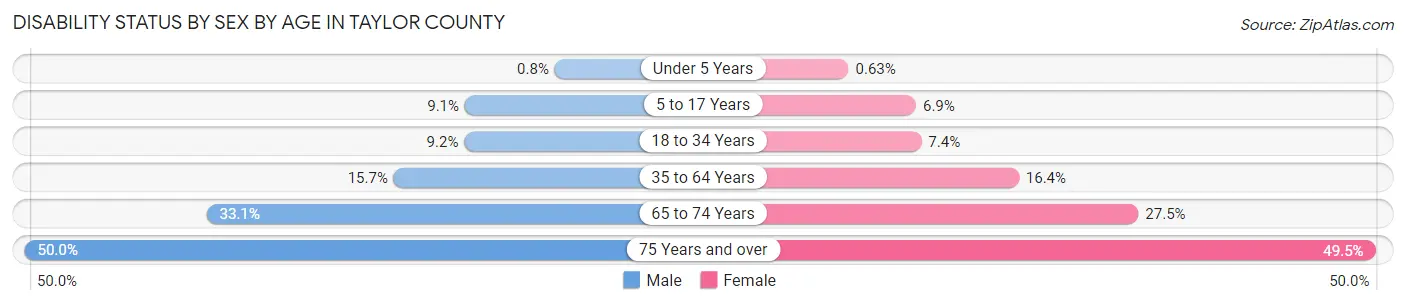
| Age Bracket | Male | Female |
| Under 5 Years | 40 (0.8%) | 31 (0.6%) |
| 5 to 17 Years | 1,155 (9.1%) | 857 (6.9%) |
| 18 to 34 Years | 1,570 (9.2%) | 1,455 (7.4%) |
| 35 to 64 Years | 3,372 (15.7%) | 3,793 (16.4%) |
| 65 to 74 Years | 1,762 (33.1%) | 1,702 (27.5%) |
| 75 Years and over | 1,736 (50.0%) | 2,553 (49.5%) |
Disability Class by Sex by Age in Taylor County
Disability Class: Hearing Difficulty
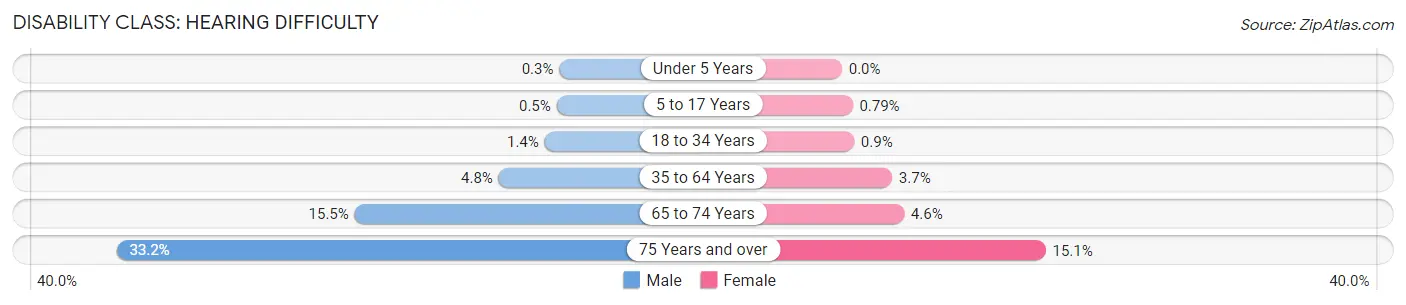
| Age Bracket | Male | Female |
| Under 5 Years | 15 (0.3%) | 0 (0.0%) |
| 5 to 17 Years | 63 (0.5%) | 98 (0.8%) |
| 18 to 34 Years | 238 (1.4%) | 178 (0.9%) |
| 35 to 64 Years | 1,028 (4.8%) | 859 (3.7%) |
| 65 to 74 Years | 825 (15.5%) | 285 (4.6%) |
| 75 Years and over | 1,152 (33.2%) | 780 (15.1%) |
Disability Class: Vision Difficulty
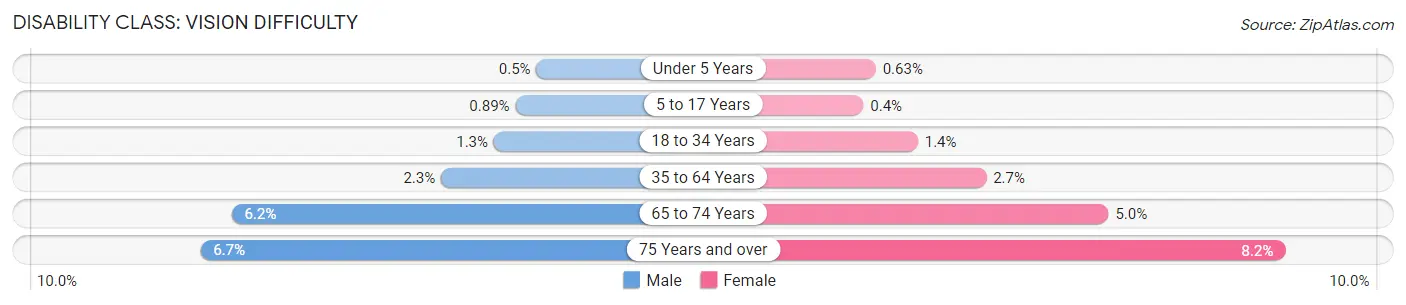
| Age Bracket | Male | Female |
| Under 5 Years | 25 (0.5%) | 31 (0.6%) |
| 5 to 17 Years | 112 (0.9%) | 50 (0.4%) |
| 18 to 34 Years | 220 (1.3%) | 278 (1.4%) |
| 35 to 64 Years | 487 (2.3%) | 619 (2.7%) |
| 65 to 74 Years | 328 (6.2%) | 306 (5.0%) |
| 75 Years and over | 234 (6.7%) | 424 (8.2%) |
Disability Class: Cognitive Difficulty
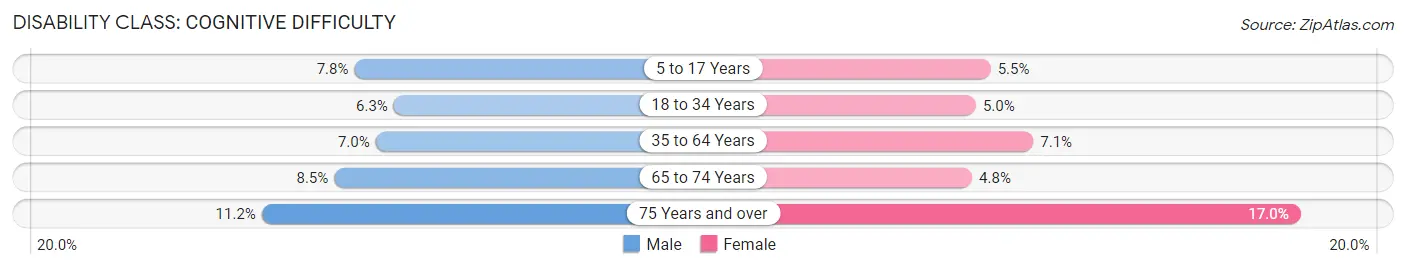
| Age Bracket | Male | Female |
| 5 to 17 Years | 981 (7.8%) | 688 (5.5%) |
| 18 to 34 Years | 1,075 (6.3%) | 981 (5.0%) |
| 35 to 64 Years | 1,493 (7.0%) | 1,641 (7.1%) |
| 65 to 74 Years | 453 (8.5%) | 299 (4.8%) |
| 75 Years and over | 389 (11.2%) | 878 (17.0%) |
Disability Class: Ambulatory Difficulty
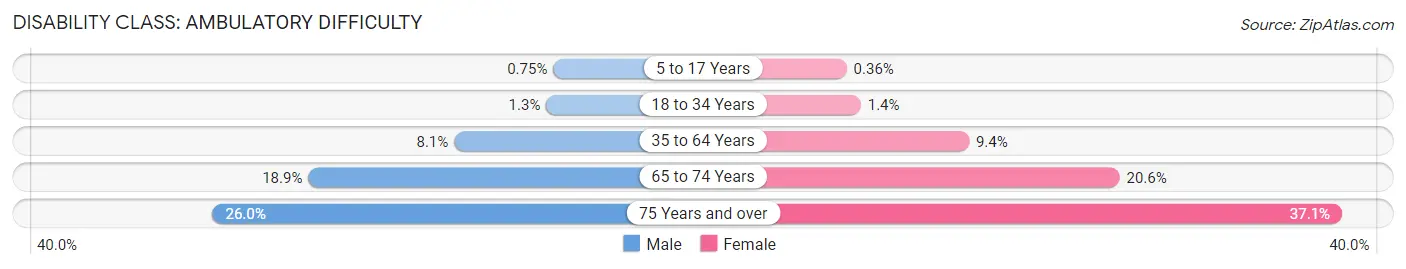
| Age Bracket | Male | Female |
| 5 to 17 Years | 95 (0.7%) | 45 (0.4%) |
| 18 to 34 Years | 217 (1.3%) | 278 (1.4%) |
| 35 to 64 Years | 1,737 (8.1%) | 2,181 (9.4%) |
| 65 to 74 Years | 1,008 (18.9%) | 1,275 (20.6%) |
| 75 Years and over | 904 (26.0%) | 1,914 (37.1%) |
Disability Class: Self-Care Difficulty
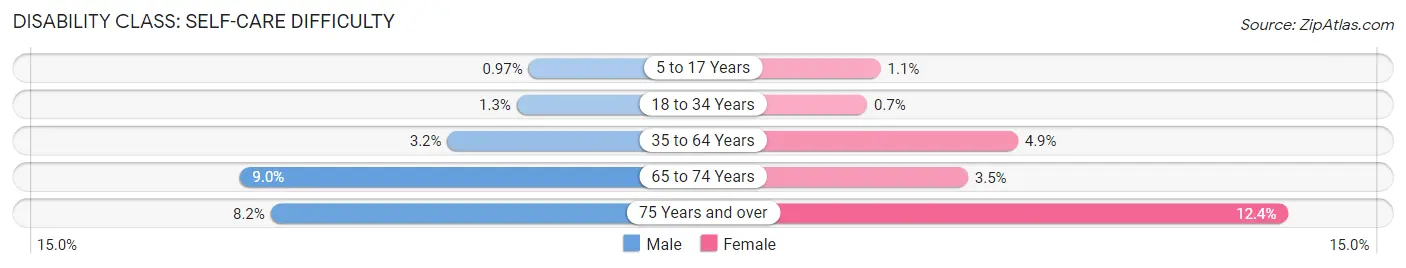
| Age Bracket | Male | Female |
| 5 to 17 Years | 122 (1.0%) | 134 (1.1%) |
| 18 to 34 Years | 222 (1.3%) | 138 (0.7%) |
| 35 to 64 Years | 691 (3.2%) | 1,132 (4.9%) |
| 65 to 74 Years | 480 (9.0%) | 217 (3.5%) |
| 75 Years and over | 283 (8.2%) | 641 (12.4%) |
Technology Access in Taylor County
Computing Device Access in Taylor County
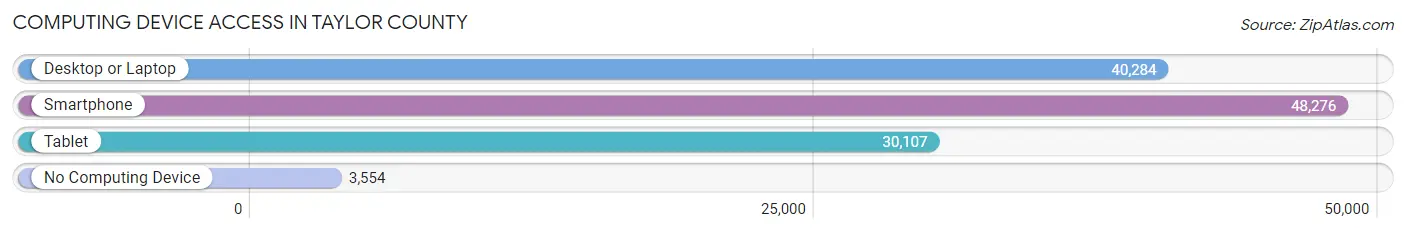
| Device Type | # Households | % Households |
| Desktop or Laptop | 40,284 | 74.8% |
| Smartphone | 48,276 | 89.6% |
| Tablet | 30,107 | 55.9% |
| No Computing Device | 3,554 | 6.6% |
| Total | 53,888 | 100.0% |
Internet Access in Taylor County
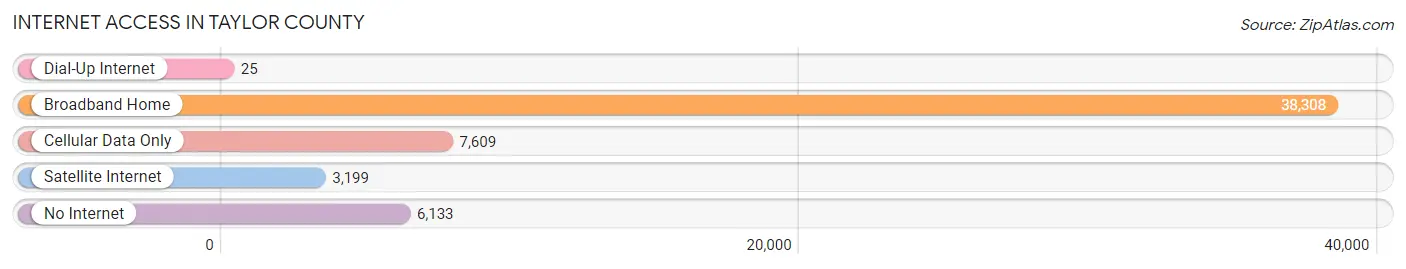
| Internet Type | # Households | % Households |
| Dial-Up Internet | 25 | 0.1% |
| Broadband Home | 38,308 | 71.1% |
| Cellular Data Only | 7,609 | 14.1% |
| Satellite Internet | 3,199 | 5.9% |
| No Internet | 6,133 | 11.4% |
| Total | 53,888 | 100.0% |
Taylor County Summary
Taylor County is located in the state of Texas, in the United States of America. It is part of the Abilene Metropolitan Statistical Area and is the county seat of Taylor County. The county was established in 1858 and named after Edward Taylor, a soldier in the Texas Revolution. As of the 2010 census, the population of Taylor County was 131,506.
Geography
Taylor County is located in the rolling hills of the Texas Hill Country, with an elevation of 1,000 feet above sea level. The county covers an area of 1,056 square miles, of which 1,053 square miles is land and 3 square miles is water. The county is bordered by Jones County to the north, Callahan County to the east, Coleman County to the south, and Runnels County to the west.
The county is home to several rivers and creeks, including the Clear Fork of the Brazos River, the Colorado River, and the South Fork of the Brazos River. The county also contains several lakes, including Lake Abilene, Lake Fort Phantom Hill, and Lake Kirby.
Climate
Taylor County has a humid subtropical climate, with hot summers and mild winters. The average annual temperature is 64°F, with an average high of 91°F in July and an average low of 37°F in January. The average annual precipitation is 28 inches, with the wettest month being May, when an average of 4.5 inches of rain falls.
Demographics
As of the 2010 census, the population of Taylor County was 131,506, with a population density of 124 people per square mile. The racial makeup of the county was 79.2% White, 11.3% African American, 0.7% Native American, 1.2% Asian, 0.1% Pacific Islander, 5.7% from other races, and 2.0% from two or more races. Hispanic or Latino of any race made up 17.2% of the population.
The median income for a household in Taylor County was $41,945, and the median income for a family was $50,945. The per capita income for the county was $21,845. About 13.2% of the population was below the poverty line.
Economy
Taylor County’s economy is largely based on agriculture, with the county’s main crops being cotton, corn, wheat, and sorghum. The county is also home to several oil and gas fields, as well as several manufacturing plants. The largest employers in the county are Dynegy, Abilene Regional Medical Center, and the Abilene Independent School District.
History
The area that is now Taylor County was first inhabited by Native American tribes, including the Comanche, Kiowa, and Apache. The first European settlers arrived in the area in the 1840s, and the county was officially established in 1858.
During the Civil War, Taylor County was a major site of conflict between Union and Confederate forces. In 1864, the Battle of Dove Creek was fought in the county, resulting in a Confederate victory.
In the late 19th century, the county’s economy began to shift from agriculture to ranching, and the area became known as the “Cowboy Capital of Texas.” The county’s population grew steadily throughout the 20th century, and in the 1950s, the city of Abilene was established as the county seat.
Today, Taylor County is a thriving community with a diverse economy and a rich cultural heritage. The county is home to several museums, historic sites, and outdoor recreation areas, making it a popular destination for tourists and residents alike.
Common Questions
What is Per Capita Income in Taylor County?
Per Capita income in Taylor County is $31,492.
What is the Median Family Income in Taylor County?
Median Family Income in Taylor County is $80,045.
What is the Median Household income in Taylor County?
Median Household Income in Taylor County is $61,806.
What is Income or Wage Gap in Taylor County?
Income or Wage Gap in Taylor County is 24.2%.
Women in Taylor County earn 75.8 cents for every dollar earned by a man.
What is Family Income Deficit in Taylor County?
Family Income Deficit in Taylor County is $10,694.
Families that are below poverty line in Taylor County earn $10,694 less on average than the poverty threshold level.
What is Inequality or Gini Index in Taylor County?
Inequality or Gini Index in Taylor County is 0.45.
What is the Total Population of Taylor County?
Total Population of Taylor County is 143,029.
What is the Total Male Population of Taylor County?
Total Male Population of Taylor County is 70,009.
What is the Total Female Population of Taylor County?
Total Female Population of Taylor County is 73,020.
What is the Ratio of Males per 100 Females in Taylor County?
There are 95.88 Males per 100 Females in Taylor County.
What is the Ratio of Females per 100 Males in Taylor County?
There are 104.30 Females per 100 Males in Taylor County.
What is the Median Population Age in Taylor County?
Median Population Age in Taylor County is 32.9 Years.
What is the Average Family Size in Taylor County
Average Family Size in Taylor County is 3.1 People.
What is the Average Household Size in Taylor County
Average Household Size in Taylor County is 2.5 People.
How Large is the Labor Force in Taylor County?
There are 72,763 People in the Labor Forcein in Taylor County.
What is the Percentage of People in the Labor Force in Taylor County?
65.3% of People are in the Labor Force in Taylor County.
What is the Unemployment Rate in Taylor County?
Unemployment Rate in Taylor County is 2.4%.