Swisher County, TX Map & Demographics
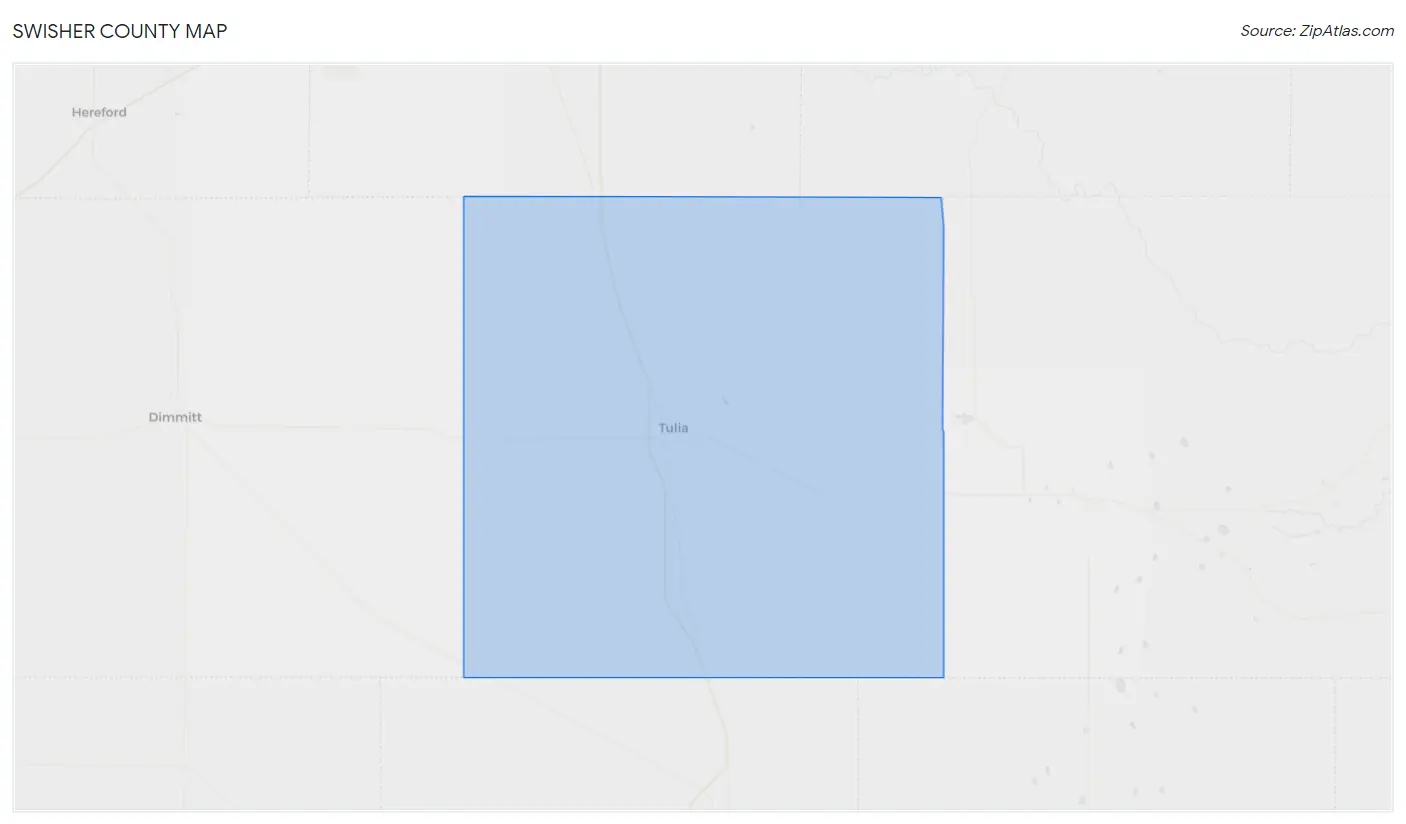
Swisher County Map
Swisher County Overview
$21,371
PER CAPITA INCOME
$53,895
AVG FAMILY INCOME
$40,290
AVG HOUSEHOLD INCOME
43.2%
WAGE / INCOME GAP [ % ]
56.8¢/ $1
WAGE / INCOME GAP [ $ ]
$9,896
FAMILY INCOME DEFICIT
0.48
INEQUALITY / GINI INDEX
6,989
TOTAL POPULATION
3,848
MALE POPULATION
3,141
FEMALE POPULATION
122.51
MALES / 100 FEMALES
81.63
FEMALES / 100 MALES
35.9
MEDIAN AGE
3.5
AVG FAMILY SIZE
2.6
AVG HOUSEHOLD SIZE
2,811
LABOR FORCE [ PEOPLE ]
51.9%
PERCENT IN LABOR FORCE
5.2%
UNEMPLOYMENT RATE
Swisher County Area Codes
Income in Swisher County
Income Overview in Swisher County
Per Capita Income in Swisher County is $21,371, while median incomes of families and households are $53,895 and $40,290 respectively.
| Characteristic | Number | Measure |
| Per Capita Income | 6,989 | $21,371 |
| Median Family Income | 1,390 | $53,895 |
| Mean Family Income | 1,390 | $70,932 |
| Median Household Income | 2,401 | $40,290 |
| Mean Household Income | 2,401 | $55,431 |
| Income Deficit | 1,390 | $9,896 |
| Wage / Income Gap (%) | 6,989 | 43.22% |
| Wage / Income Gap ($) | 6,989 | 56.78¢ per $1 |
| Gini / Inequality Index | 6,989 | 0.48 |
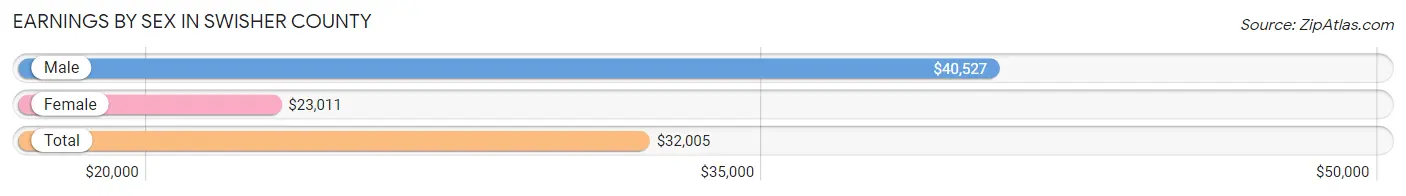
Earnings by Sex in Swisher County
Average Earnings in Swisher County are $32,005, $40,527 for men and $23,011 for women, a difference of 43.2%.
| Sex | Number | Average Earnings |
| Male | 1,642 (53.3%) | $40,527 |
| Female | 1,439 (46.7%) | $23,011 |
| Total | 3,081 (100.0%) | $32,005 |
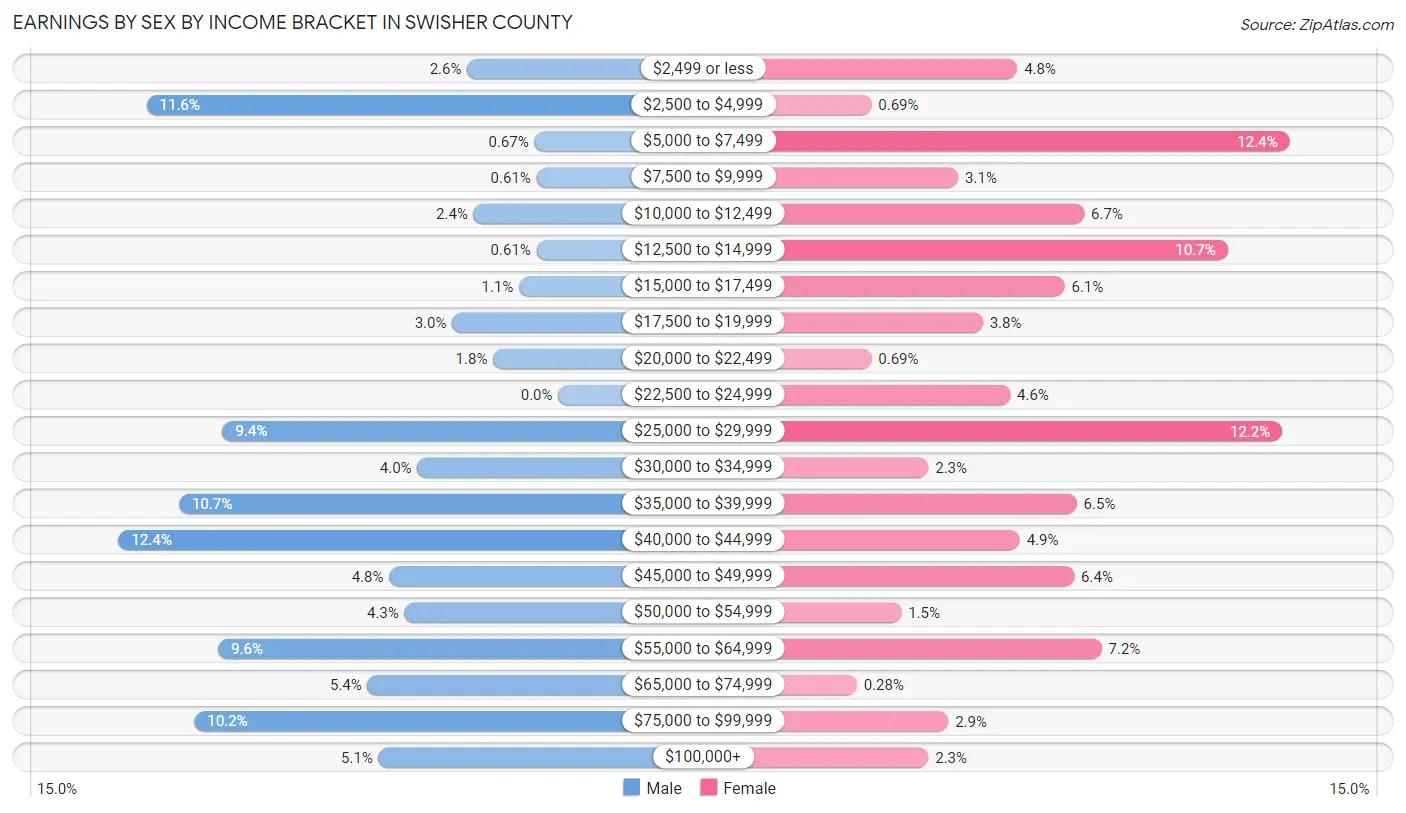
Earnings by Sex by Income Bracket in Swisher County
The most common earnings brackets in Swisher County are $40,000 to $44,999 for men (203 | 12.4%) and $5,000 to $7,499 for women (179 | 12.4%).
| Income | Male | Female |
| $2,499 or less | 42 (2.6%) | 69 (4.8%) |
| $2,500 to $4,999 | 190 (11.6%) | 10 (0.7%) |
| $5,000 to $7,499 | 11 (0.7%) | 179 (12.4%) |
| $7,500 to $9,999 | 10 (0.6%) | 45 (3.1%) |
| $10,000 to $12,499 | 39 (2.4%) | 96 (6.7%) |
| $12,500 to $14,999 | 10 (0.6%) | 154 (10.7%) |
| $15,000 to $17,499 | 18 (1.1%) | 88 (6.1%) |
| $17,500 to $19,999 | 49 (3.0%) | 55 (3.8%) |
| $20,000 to $22,499 | 30 (1.8%) | 10 (0.7%) |
| $22,500 to $24,999 | 0 (0.0%) | 66 (4.6%) |
| $25,000 to $29,999 | 155 (9.4%) | 176 (12.2%) |
| $30,000 to $34,999 | 65 (4.0%) | 33 (2.3%) |
| $35,000 to $39,999 | 175 (10.7%) | 93 (6.5%) |
| $40,000 to $44,999 | 203 (12.4%) | 70 (4.9%) |
| $45,000 to $49,999 | 78 (4.8%) | 92 (6.4%) |
| $50,000 to $54,999 | 71 (4.3%) | 22 (1.5%) |
| $55,000 to $64,999 | 157 (9.6%) | 103 (7.2%) |
| $65,000 to $74,999 | 88 (5.4%) | 4 (0.3%) |
| $75,000 to $99,999 | 168 (10.2%) | 41 (2.9%) |
| $100,000+ | 83 (5.1%) | 33 (2.3%) |
| Total | 1,642 (100.0%) | 1,439 (100.0%) |
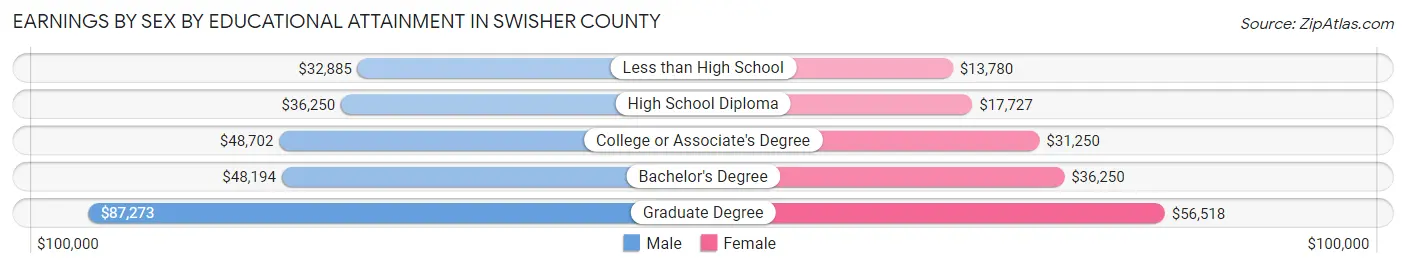
Earnings by Sex by Educational Attainment in Swisher County
Average earnings in Swisher County are $40,166 for men and $27,114 for women, a difference of 32.5%. Men with an educational attainment of graduate degree enjoy the highest average annual earnings of $87,273, while those with less than high school education earn the least with $32,885. Women with an educational attainment of graduate degree earn the most with the average annual earnings of $56,518, while those with less than high school education have the smallest earnings of $13,780.
| Educational Attainment | Male Income | Female Income |
| Less than High School | $32,885 | $13,780 |
| High School Diploma | $36,250 | $17,727 |
| College or Associate's Degree | $48,702 | $31,250 |
| Bachelor's Degree | $48,194 | $36,250 |
| Graduate Degree | $87,273 | $56,518 |
| Total | $40,166 | $27,114 |
Family Income in Swisher County
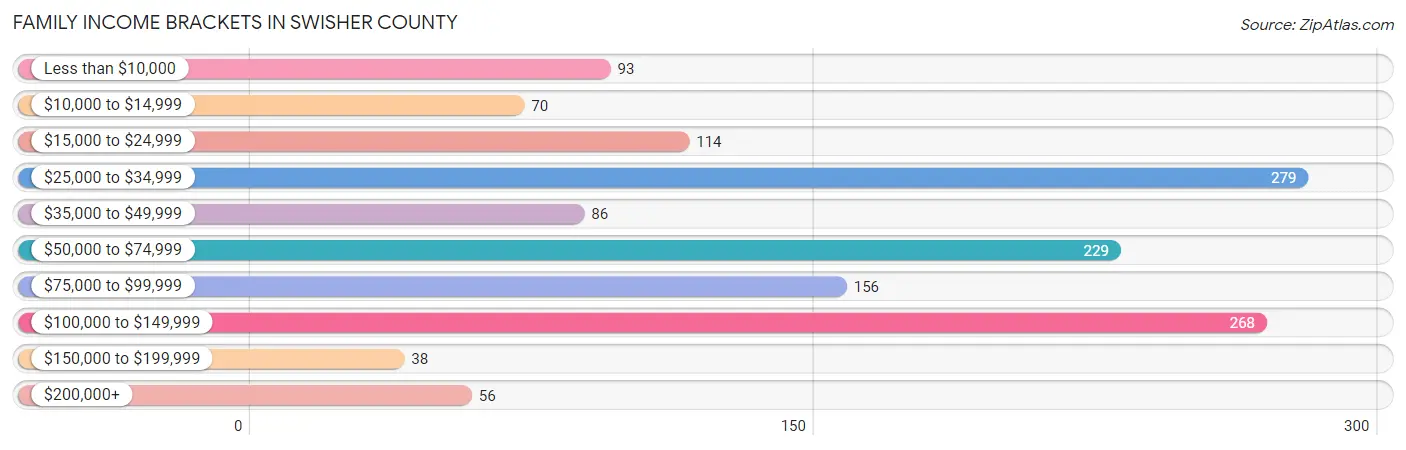
Family Income Brackets in Swisher County
According to the Swisher County family income data, there are 279 families falling into the $25,000 to $34,999 income range, which is the most common income bracket and makes up 20.1% of all families. Conversely, the $150,000 to $199,999 income bracket is the least frequent group with only 38 families (2.7%) belonging to this category.
| Income Bracket | # Families | % Families |
| Less than $10,000 | 93 | 6.7% |
| $10,000 to $14,999 | 70 | 5.0% |
| $15,000 to $24,999 | 114 | 8.2% |
| $25,000 to $34,999 | 279 | 20.1% |
| $35,000 to $49,999 | 86 | 6.2% |
| $50,000 to $74,999 | 229 | 16.5% |
| $75,000 to $99,999 | 156 | 11.2% |
| $100,000 to $149,999 | 268 | 19.3% |
| $150,000 to $199,999 | 38 | 2.7% |
| $200,000+ | 56 | 4.0% |
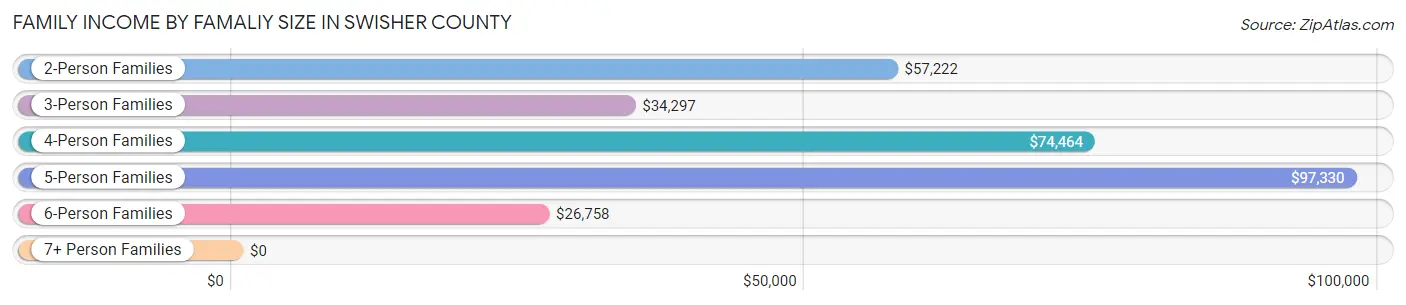
Family Income by Famaliy Size in Swisher County
5-person families (73 | 5.2%) account for the highest median family income in Swisher County with $97,330 per family, while 2-person families (656 | 47.2%) have the highest median income of $28,611 per family member.
| Income Bracket | # Families | Median Income |
| 2-Person Families | 656 (47.2%) | $57,222 |
| 3-Person Families | 238 (17.1%) | $34,297 |
| 4-Person Families | 331 (23.8%) | $74,464 |
| 5-Person Families | 73 (5.2%) | $97,330 |
| 6-Person Families | 83 (6.0%) | $26,758 |
| 7+ Person Families | 9 (0.6%) | $0 |
| Total | 1,390 (100.0%) | $53,895 |
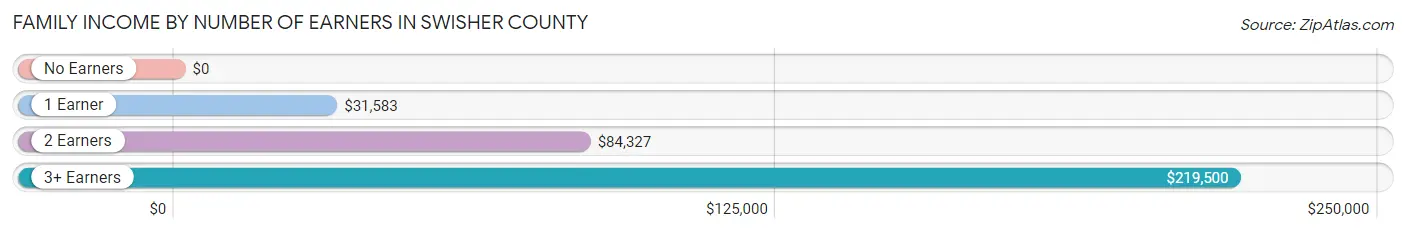
Family Income by Number of Earners in Swisher County
| Number of Earners | # Families | Median Income |
| No Earners | 251 (18.1%) | $0 |
| 1 Earner | 418 (30.1%) | $31,583 |
| 2 Earners | 677 (48.7%) | $84,327 |
| 3+ Earners | 44 (3.2%) | $219,500 |
| Total | 1,390 (100.0%) | $53,895 |
Household Income in Swisher County
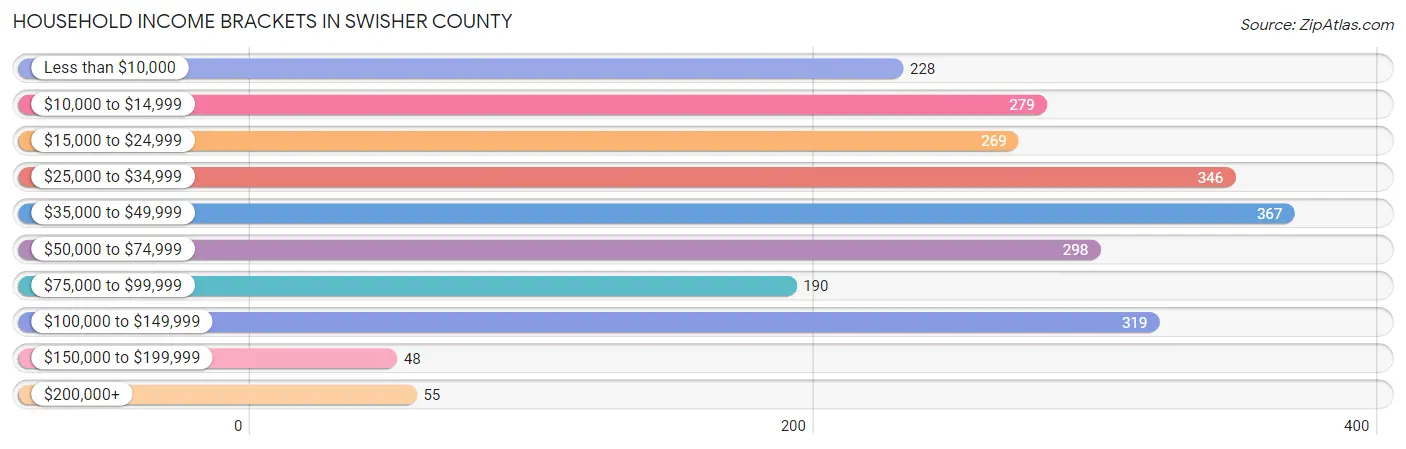
Household Income Brackets in Swisher County
With 367 households falling in the category, the $35,000 to $49,999 income range is the most frequent in Swisher County, accounting for 15.3% of all households. In contrast, only 48 households (2.0%) fall into the $150,000 to $199,999 income bracket, making it the least populous group.
| Income Bracket | # Households | % Households |
| Less than $10,000 | 228 | 9.5% |
| $10,000 to $14,999 | 279 | 11.6% |
| $15,000 to $24,999 | 269 | 11.2% |
| $25,000 to $34,999 | 346 | 14.4% |
| $35,000 to $49,999 | 367 | 15.3% |
| $50,000 to $74,999 | 298 | 12.4% |
| $75,000 to $99,999 | 190 | 7.9% |
| $100,000 to $149,999 | 319 | 13.3% |
| $150,000 to $199,999 | 48 | 2.0% |
| $200,000+ | 55 | 2.3% |
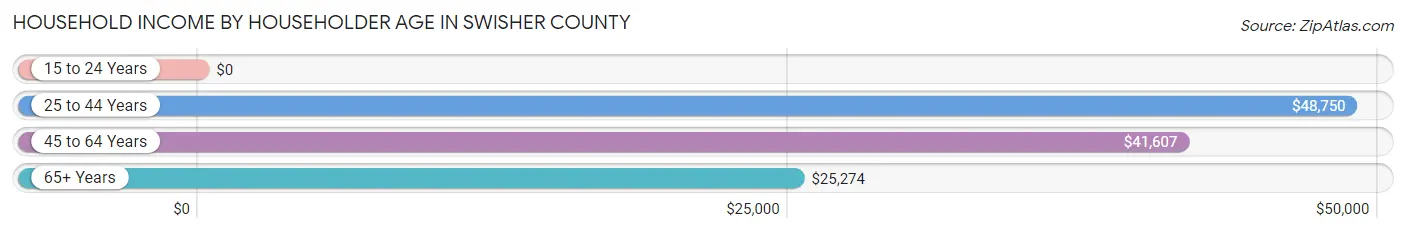
Household Income by Householder Age in Swisher County
The median household income in Swisher County is $40,290, with the highest median household income of $48,750 found in the 25 to 44 years age bracket for the primary householder. A total of 575 households (23.9%) fall into this category. Meanwhile, the 15 to 24 years age bracket for the primary householder has the lowest median household income of $0, with 172 households (7.2%) in this group.
| Income Bracket | # Households | Median Income |
| 15 to 24 Years | 172 (7.2%) | $0 |
| 25 to 44 Years | 575 (23.9%) | $48,750 |
| 45 to 64 Years | 814 (33.9%) | $41,607 |
| 65+ Years | 840 (35.0%) | $25,274 |
| Total | 2,401 (100.0%) | $40,290 |
Poverty in Swisher County
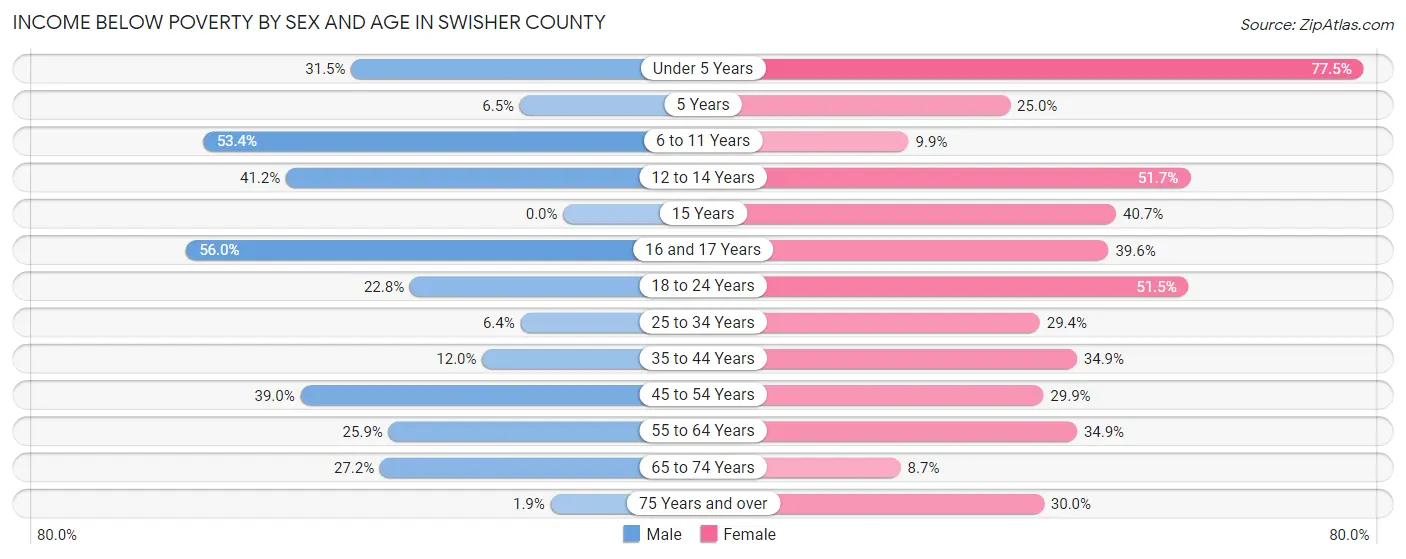
Income Below Poverty by Sex and Age in Swisher County
With 26.5% poverty level for males and 32.6% for females among the residents of Swisher County, 16 and 17 year old males and under 5 year old females are the most vulnerable to poverty, with 42 males (56.0%) and 110 females (77.5%) in their respective age groups living below the poverty level.
| Age Bracket | Male | Female |
| Under 5 Years | 85 (31.5%) | 110 (77.5%) |
| 5 Years | 4 (6.5%) | 3 (25.0%) |
| 6 to 11 Years | 157 (53.4%) | 28 (9.9%) |
| 12 to 14 Years | 98 (41.2%) | 106 (51.7%) |
| 15 Years | 0 (0.0%) | 22 (40.7%) |
| 16 and 17 Years | 42 (56.0%) | 40 (39.6%) |
| 18 to 24 Years | 87 (22.8%) | 139 (51.5%) |
| 25 to 34 Years | 26 (6.4%) | 117 (29.4%) |
| 35 to 44 Years | 32 (12.0%) | 118 (34.9%) |
| 45 to 54 Years | 128 (39.0%) | 94 (29.9%) |
| 55 to 64 Years | 104 (25.9%) | 125 (34.9%) |
| 65 to 74 Years | 95 (27.2%) | 32 (8.7%) |
| 75 Years and over | 3 (1.9%) | 84 (30.0%) |
| Total | 861 (26.5%) | 1,018 (32.6%) |
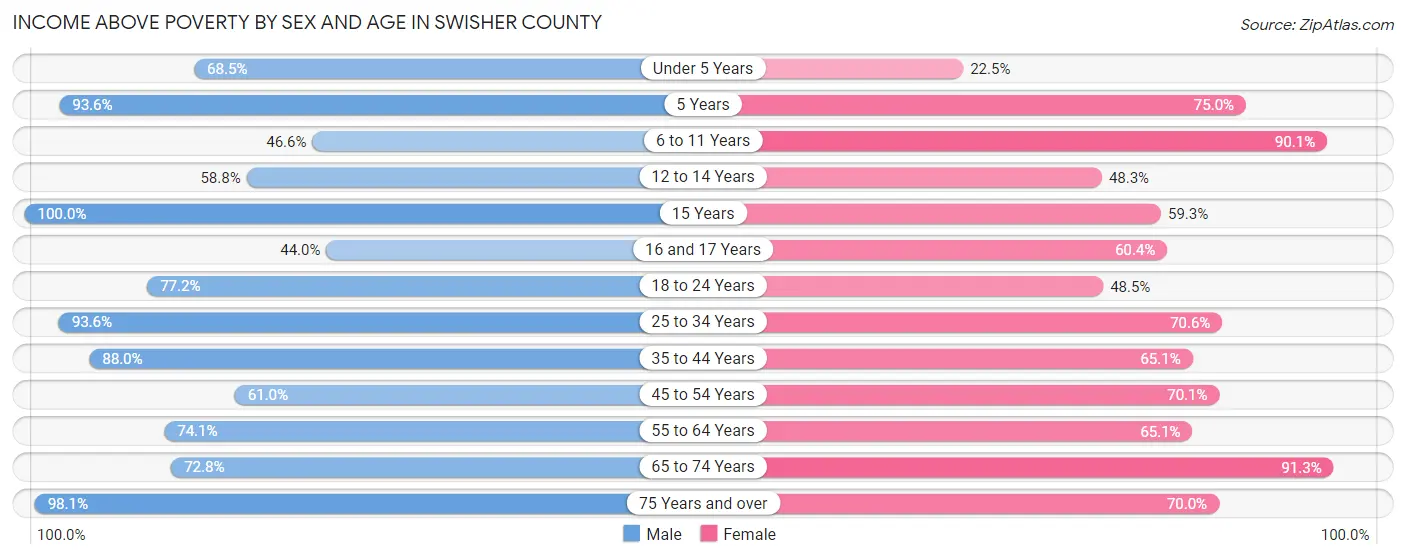
Income Above Poverty by Sex and Age in Swisher County
According to the poverty statistics in Swisher County, males aged 15 years and females aged 65 to 74 years are the age groups that are most secure financially, with 100.0% of males and 91.3% of females in these age groups living above the poverty line.
| Age Bracket | Male | Female |
| Under 5 Years | 185 (68.5%) | 32 (22.5%) |
| 5 Years | 58 (93.5%) | 9 (75.0%) |
| 6 to 11 Years | 137 (46.6%) | 254 (90.1%) |
| 12 to 14 Years | 140 (58.8%) | 99 (48.3%) |
| 15 Years | 13 (100.0%) | 32 (59.3%) |
| 16 and 17 Years | 33 (44.0%) | 61 (60.4%) |
| 18 to 24 Years | 295 (77.2%) | 131 (48.5%) |
| 25 to 34 Years | 383 (93.6%) | 281 (70.6%) |
| 35 to 44 Years | 234 (88.0%) | 220 (65.1%) |
| 45 to 54 Years | 200 (61.0%) | 220 (70.1%) |
| 55 to 64 Years | 297 (74.1%) | 233 (65.1%) |
| 65 to 74 Years | 254 (72.8%) | 334 (91.3%) |
| 75 Years and over | 156 (98.1%) | 196 (70.0%) |
| Total | 2,385 (73.5%) | 2,102 (67.4%) |
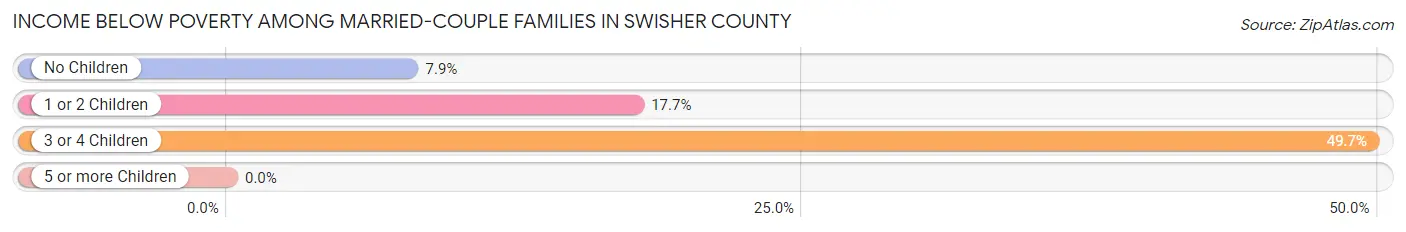
Income Below Poverty Among Married-Couple Families in Swisher County
The poverty statistics for married-couple families in Swisher County show that 16.8% or 182 of the total 1,082 families live below the poverty line. Families with 3 or 4 children have the highest poverty rate of 49.6%, comprising of 71 families. On the other hand, families with no children have the lowest poverty rate of 7.9%, which includes 44 families.
| Children | Above Poverty | Below Poverty |
| No Children | 516 (92.1%) | 44 (7.9%) |
| 1 or 2 Children | 312 (82.3%) | 67 (17.7%) |
| 3 or 4 Children | 72 (50.3%) | 71 (49.6%) |
| 5 or more Children | 0 (0.0%) | 0 (0.0%) |
| Total | 900 (83.2%) | 182 (16.8%) |
Income Below Poverty Among Single-Parent Households in Swisher County
According to the poverty data in Swisher County, 37.3% or 47 single-father households and 62.6% or 114 single-mother households are living below the poverty line. Among single-father households, those with 3 or 4 children have the highest poverty rate, with 29 households (100.0%) experiencing poverty. Likewise, among single-mother households, those with 3 or 4 children have the highest poverty rate, with 4 households (100.0%) falling below the poverty line.
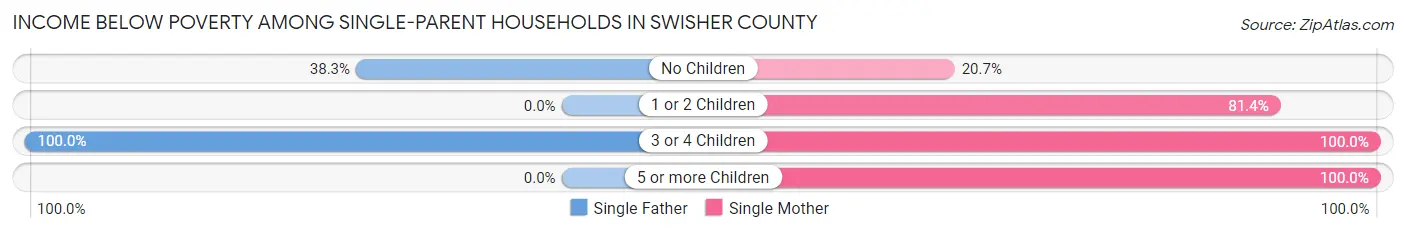
| Children | Single Father | Single Mother |
| No Children | 18 (38.3%) | 12 (20.7%) |
| 1 or 2 Children | 0 (0.0%) | 96 (81.4%) |
| 3 or 4 Children | 29 (100.0%) | 4 (100.0%) |
| 5 or more Children | 0 (0.0%) | 2 (100.0%) |
| Total | 47 (37.3%) | 114 (62.6%) |
Income Below Poverty Among Married-Couple vs Single-Parent Households in Swisher County
The poverty data for Swisher County shows that 182 of the married-couple family households (16.8%) and 161 of the single-parent households (52.3%) are living below the poverty level. Within the married-couple family households, those with 3 or 4 children have the highest poverty rate, with 71 households (49.6%) falling below the poverty line. Among the single-parent households, those with 3 or 4 children have the highest poverty rate, with 33 household (100.0%) living below poverty.
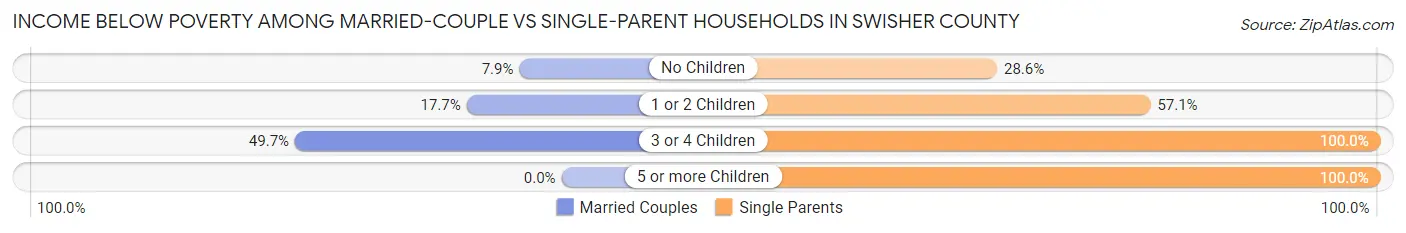
| Children | Married-Couple Families | Single-Parent Households |
| No Children | 44 (7.9%) | 30 (28.6%) |
| 1 or 2 Children | 67 (17.7%) | 96 (57.1%) |
| 3 or 4 Children | 71 (49.6%) | 33 (100.0%) |
| 5 or more Children | 0 (0.0%) | 2 (100.0%) |
| Total | 182 (16.8%) | 161 (52.3%) |
Race in Swisher County
The most populous races in Swisher County are White / Caucasian (5,145 | 73.6%), Hispanic or Latino (3,183 | 45.5%), and Two or more Races (902 | 12.9%).
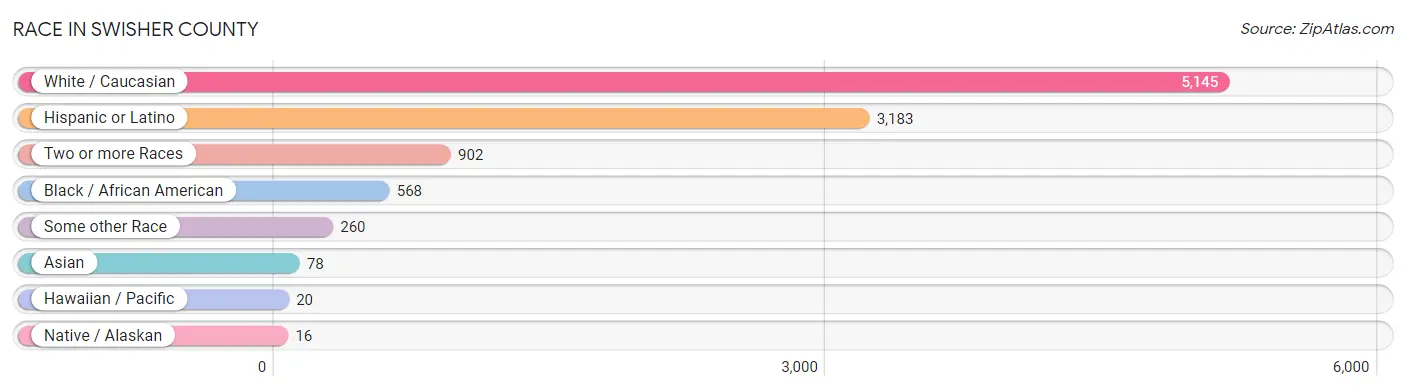
| Race | # Population | % Population |
| Asian | 78 | 1.1% |
| Black / African American | 568 | 8.1% |
| Hawaiian / Pacific | 20 | 0.3% |
| Hispanic or Latino | 3,183 | 45.5% |
| Native / Alaskan | 16 | 0.2% |
| White / Caucasian | 5,145 | 73.6% |
| Two or more Races | 902 | 12.9% |
| Some other Race | 260 | 3.7% |
| Total | 6,989 | 100.0% |
Ancestry in Swisher County
The most populous ancestries reported in Swisher County are Mexican (2,901 | 41.5%), German (470 | 6.7%), American (415 | 5.9%), English (322 | 4.6%), and Irish (269 | 3.8%), together accounting for 62.6% of all Swisher County residents.
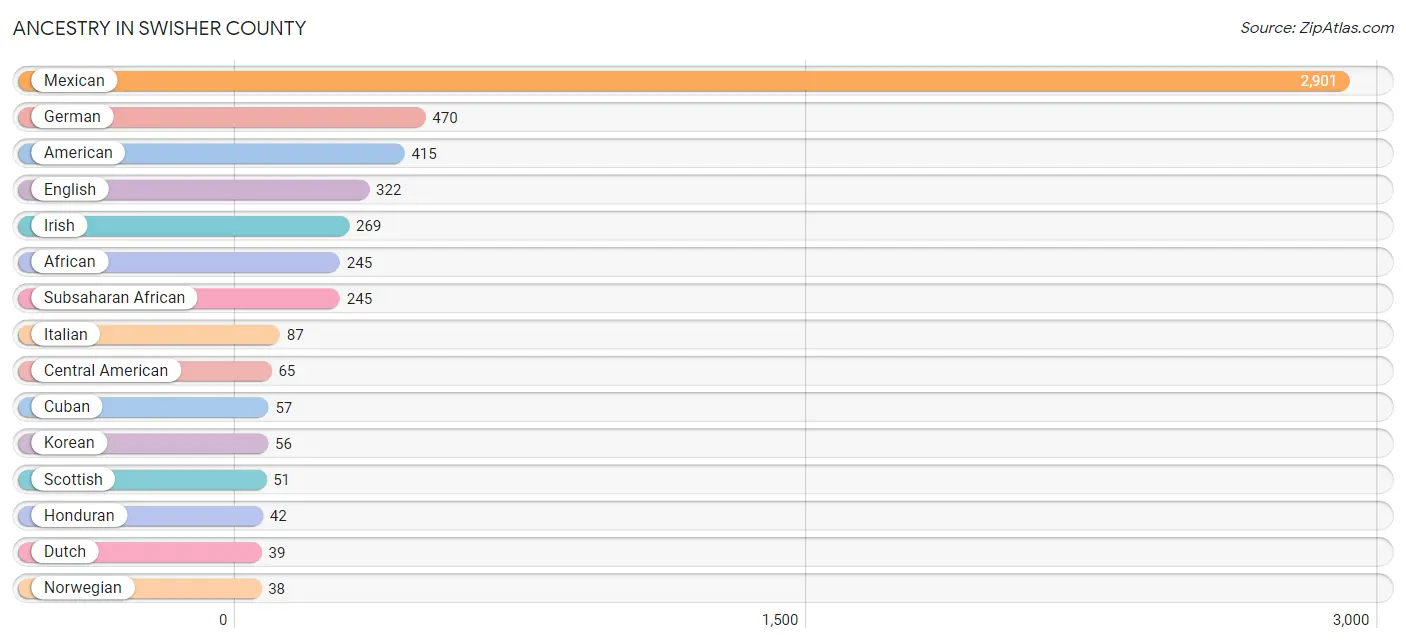
| Ancestry | # Population | % Population |
| African | 245 | 3.5% |
| American | 415 | 5.9% |
| Arab | 8 | 0.1% |
| Blackfeet | 7 | 0.1% |
| British | 32 | 0.5% |
| Canadian | 3 | 0.0% |
| Central American | 65 | 0.9% |
| Cherokee | 15 | 0.2% |
| Chickasaw | 1 | 0.0% |
| Cuban | 57 | 0.8% |
| Danish | 12 | 0.2% |
| Delaware | 11 | 0.2% |
| Dutch | 39 | 0.6% |
| Dutch West Indian | 8 | 0.1% |
| Eastern European | 8 | 0.1% |
| English | 322 | 4.6% |
| European | 11 | 0.2% |
| French | 26 | 0.4% |
| German | 470 | 6.7% |
| Greek | 7 | 0.1% |
| Guamanian / Chamorro | 20 | 0.3% |
| Guatemalan | 20 | 0.3% |
| Honduran | 42 | 0.6% |
| Indian (Asian) | 4 | 0.1% |
| Irish | 269 | 3.8% |
| Italian | 87 | 1.2% |
| Korean | 56 | 0.8% |
| Lebanese | 8 | 0.1% |
| Mexican | 2,901 | 41.5% |
| Navajo | 3 | 0.0% |
| Northern European | 30 | 0.4% |
| Norwegian | 38 | 0.5% |
| Pennsylvania German | 2 | 0.0% |
| Polish | 12 | 0.2% |
| Portuguese | 2 | 0.0% |
| Puerto Rican | 3 | 0.0% |
| Salvadoran | 3 | 0.0% |
| Scotch-Irish | 13 | 0.2% |
| Scottish | 51 | 0.7% |
| Spaniard | 17 | 0.2% |
| Spanish | 5 | 0.1% |
| Subsaharan African | 245 | 3.5% |
| Sudanese | 4 | 0.1% |
| Swedish | 28 | 0.4% |
| Swiss | 9 | 0.1% |
| Thai | 17 | 0.2% |
| Welsh | 13 | 0.2% | View All 47 Rows |
Immigrants in Swisher County
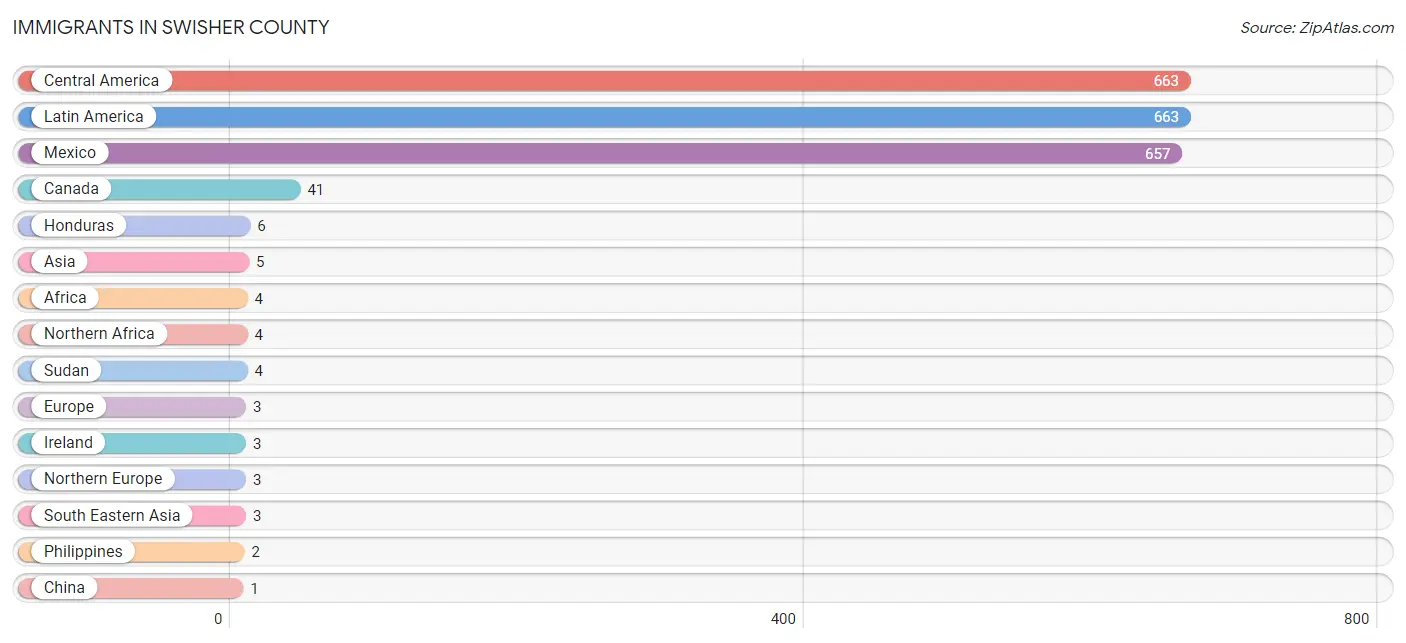
The most numerous immigrant groups reported in Swisher County came from Central America (663 | 9.5%), Latin America (663 | 9.5%), Mexico (657 | 9.4%), Canada (41 | 0.6%), and Honduras (6 | 0.1%), together accounting for 29.1% of all Swisher County residents.
| Immigration Origin | # Population | % Population |
| Africa | 4 | 0.1% |
| Asia | 5 | 0.1% |
| Canada | 41 | 0.6% |
| Central America | 663 | 9.5% |
| China | 1 | 0.0% |
| Eastern Asia | 1 | 0.0% |
| Europe | 3 | 0.0% |
| Honduras | 6 | 0.1% |
| Ireland | 3 | 0.0% |
| Latin America | 663 | 9.5% |
| Mexico | 657 | 9.4% |
| Northern Africa | 4 | 0.1% |
| Northern Europe | 3 | 0.0% |
| Pakistan | 1 | 0.0% |
| Philippines | 2 | 0.0% |
| South Central Asia | 1 | 0.0% |
| South Eastern Asia | 3 | 0.0% |
| Sudan | 4 | 0.1% |
| Vietnam | 1 | 0.0% | View All 19 Rows |
Sex and Age in Swisher County
Sex and Age in Swisher County
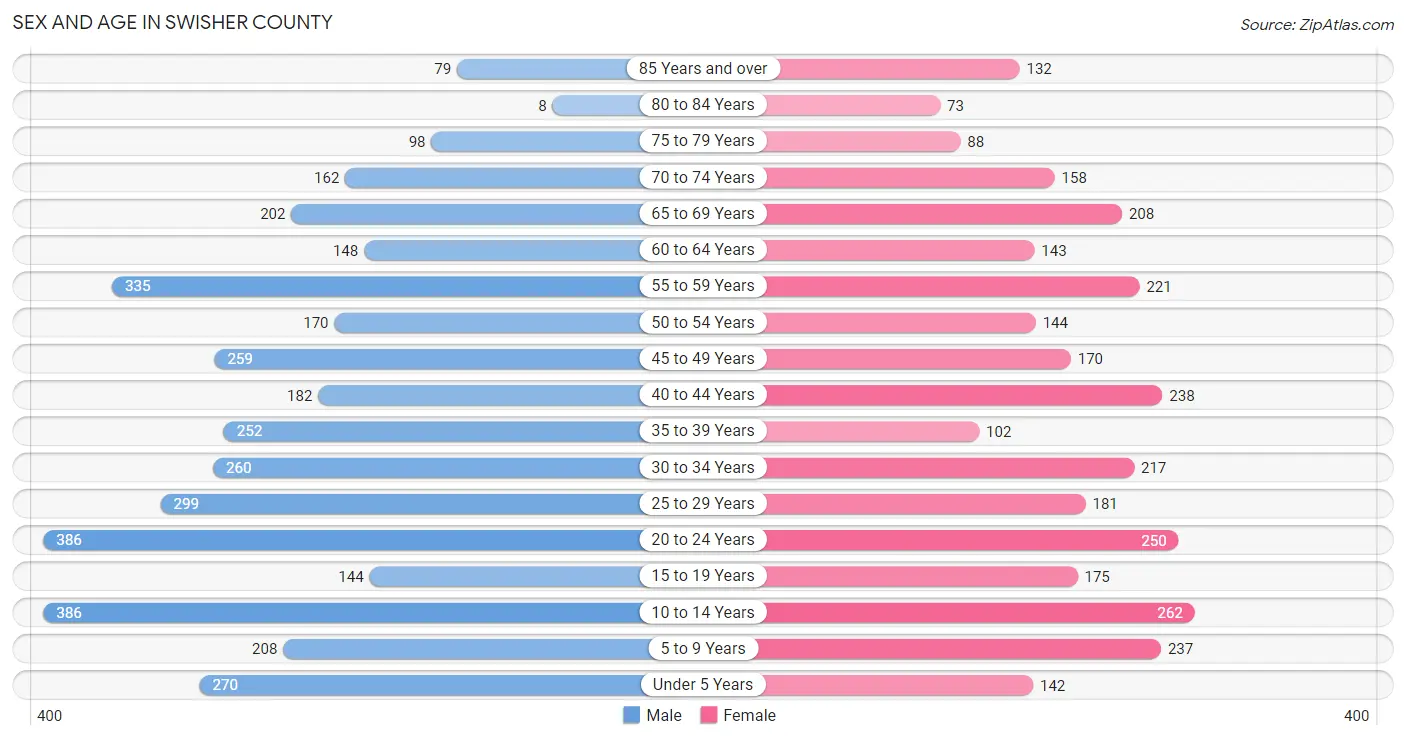
The most populous age groups in Swisher County are 10 to 14 Years (386 | 10.0%) for men and 10 to 14 Years (262 | 8.3%) for women.
| Age Bracket | Male | Female |
| Under 5 Years | 270 (7.0%) | 142 (4.5%) |
| 5 to 9 Years | 208 (5.4%) | 237 (7.5%) |
| 10 to 14 Years | 386 (10.0%) | 262 (8.3%) |
| 15 to 19 Years | 144 (3.7%) | 175 (5.6%) |
| 20 to 24 Years | 386 (10.0%) | 250 (8.0%) |
| 25 to 29 Years | 299 (7.8%) | 181 (5.8%) |
| 30 to 34 Years | 260 (6.8%) | 217 (6.9%) |
| 35 to 39 Years | 252 (6.6%) | 102 (3.3%) |
| 40 to 44 Years | 182 (4.7%) | 238 (7.6%) |
| 45 to 49 Years | 259 (6.7%) | 170 (5.4%) |
| 50 to 54 Years | 170 (4.4%) | 144 (4.6%) |
| 55 to 59 Years | 335 (8.7%) | 221 (7.0%) |
| 60 to 64 Years | 148 (3.8%) | 143 (4.5%) |
| 65 to 69 Years | 202 (5.2%) | 208 (6.6%) |
| 70 to 74 Years | 162 (4.2%) | 158 (5.0%) |
| 75 to 79 Years | 98 (2.5%) | 88 (2.8%) |
| 80 to 84 Years | 8 (0.2%) | 73 (2.3%) |
| 85 Years and over | 79 (2.1%) | 132 (4.2%) |
| Total | 3,848 (100.0%) | 3,141 (100.0%) |
Families and Households in Swisher County
Median Family Size in Swisher County
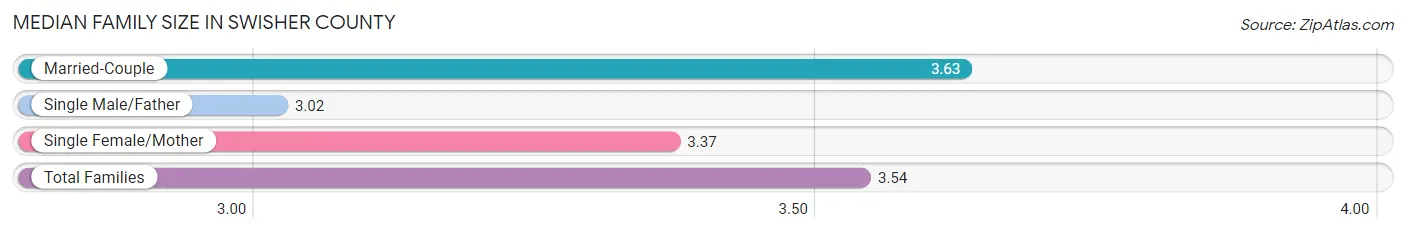
The median family size in Swisher County is 3.54 persons per family, with married-couple families (1,082 | 77.8%) accounting for the largest median family size of 3.63 persons per family. On the other hand, single male/father families (126 | 9.1%) represent the smallest median family size with 3.02 persons per family.
| Family Type | # Families | Family Size |
| Married-Couple | 1,082 (77.8%) | 3.63 |
| Single Male/Father | 126 (9.1%) | 3.02 |
| Single Female/Mother | 182 (13.1%) | 3.37 |
| Total Families | 1,390 (100.0%) | 3.54 |
Median Household Size in Swisher County
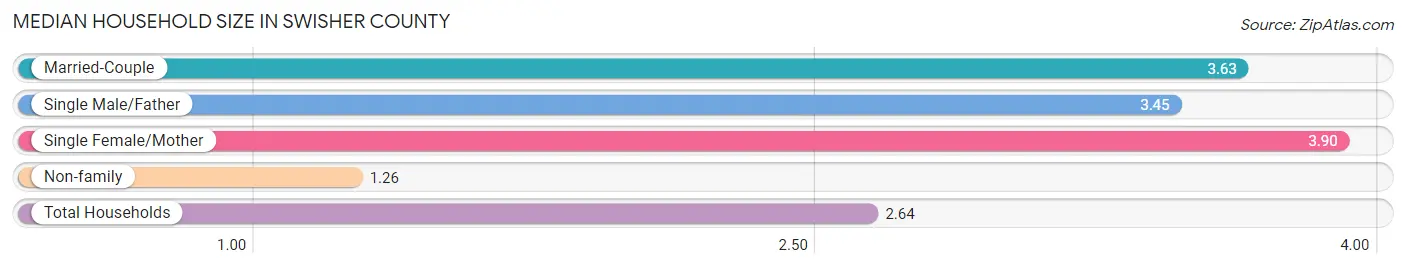
The median household size in Swisher County is 2.64 persons per household, with single female/mother households (182 | 7.6%) accounting for the largest median household size of 3.9 persons per household. non-family households (1,011 | 42.1%) represent the smallest median household size with 1.26 persons per household.
| Household Type | # Households | Household Size |
| Married-Couple | 1,082 (45.1%) | 3.63 |
| Single Male/Father | 126 (5.2%) | 3.45 |
| Single Female/Mother | 182 (7.6%) | 3.90 |
| Non-family | 1,011 (42.1%) | 1.26 |
| Total Households | 2,401 (100.0%) | 2.64 |
Household Size by Marriage Status in Swisher County
Out of a total of 2,401 households in Swisher County, 1,390 (57.9%) are family households, while 1,011 (42.1%) are nonfamily households. The most numerous type of family households are 2-person households, comprising 643, and the most common type of nonfamily households are 1-person households, comprising 884.
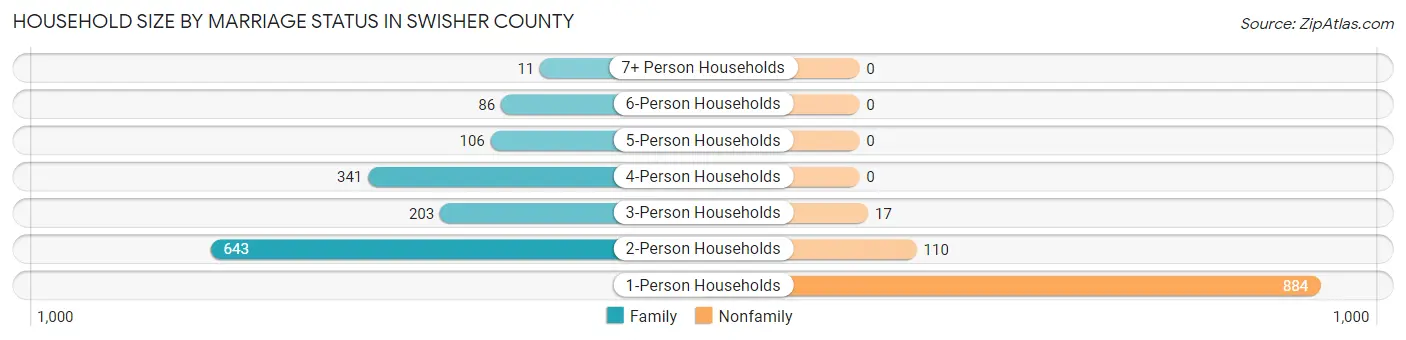
| Household Size | Family Households | Nonfamily Households |
| 1-Person Households | - | 884 (36.8%) |
| 2-Person Households | 643 (26.8%) | 110 (4.6%) |
| 3-Person Households | 203 (8.5%) | 17 (0.7%) |
| 4-Person Households | 341 (14.2%) | 0 (0.0%) |
| 5-Person Households | 106 (4.4%) | 0 (0.0%) |
| 6-Person Households | 86 (3.6%) | 0 (0.0%) |
| 7+ Person Households | 11 (0.5%) | 0 (0.0%) |
| Total | 1,390 (57.9%) | 1,011 (42.1%) |
Female Fertility in Swisher County
Fertility by Age in Swisher County
Average fertility rate in Swisher County is 40.0 births per 1,000 women. Women in the age bracket of 20 to 34 years have the highest fertility rate with 83.0 births per 1,000 women. Women in the age bracket of 20 to 34 years acount for 100.0% of all women with births.
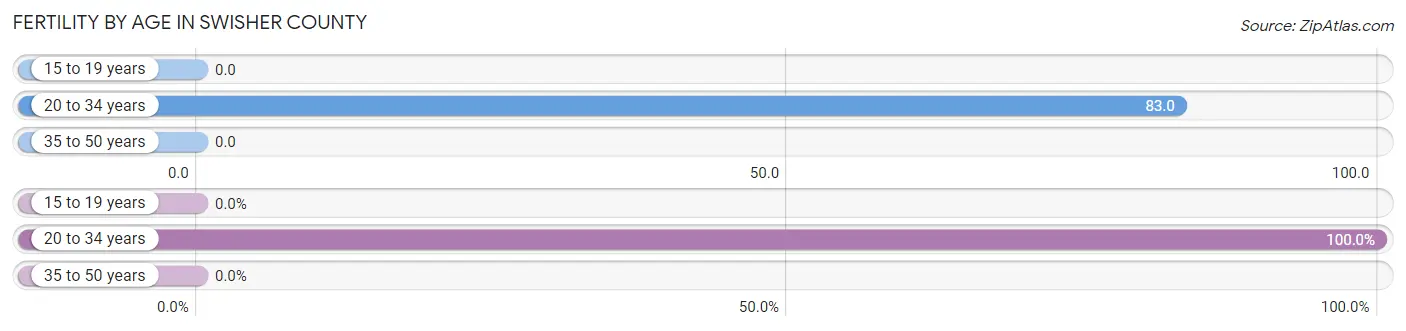
| Age Bracket | Women with Births | Births / 1,000 Women |
| 15 to 19 years | 0 (0.0%) | 0.0 |
| 20 to 34 years | 54 (100.0%) | 83.0 |
| 35 to 50 years | 0 (0.0%) | 0.0 |
| Total | 54 (100.0%) | 40.0 |
Fertility by Age by Marriage Status in Swisher County
81.5% of women with births (54) in Swisher County are married. The highest percentage of unmarried women with births falls into 20 to 34 years age bracket with 18.5% of them unmarried at the time of birth, while the lowest percentage of unmarried women with births belong to 20 to 34 years age bracket with 18.5% of them unmarried.
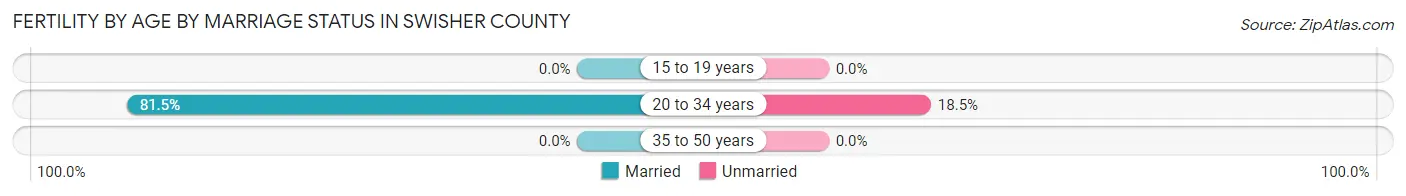
| Age Bracket | Married | Unmarried |
| 15 to 19 years | 0 (0.0%) | 0 (0.0%) |
| 20 to 34 years | 44 (81.5%) | 10 (18.5%) |
| 35 to 50 years | 0 (0.0%) | 0 (0.0%) |
| Total | 44 (81.5%) | 10 (18.5%) |
Fertility by Education in Swisher County
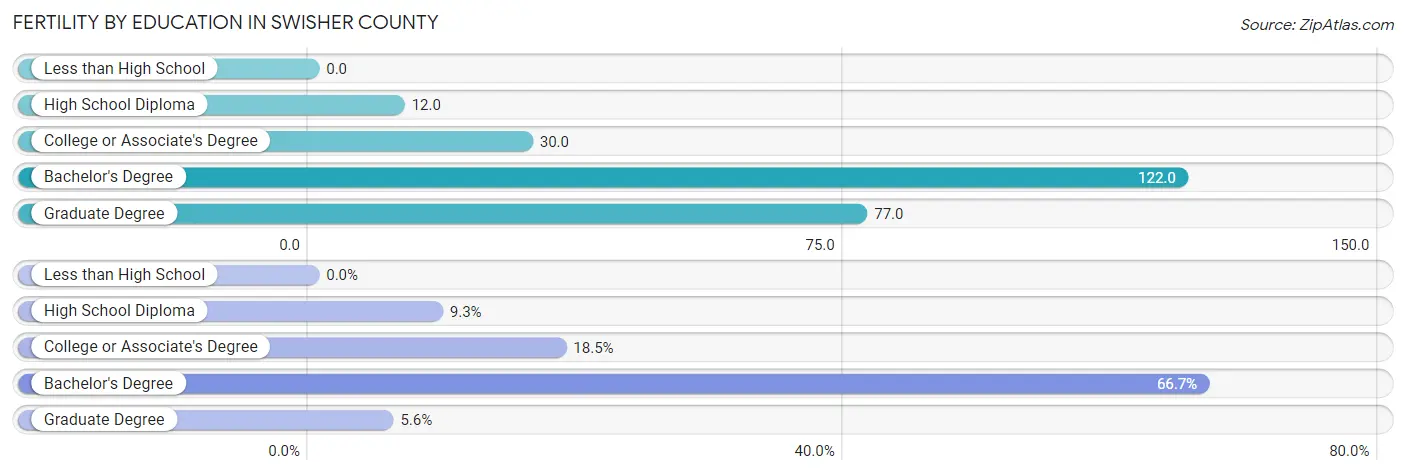
| Educational Attainment | Women with Births | Births / 1,000 Women |
| Less than High School | 0 (0.0%) | 0.0 |
| High School Diploma | 5 (9.3%) | 12.0 |
| College or Associate's Degree | 10 (18.5%) | 30.0 |
| Bachelor's Degree | 36 (66.7%) | 122.0 |
| Graduate Degree | 3 (5.6%) | 77.0 |
| Total | 54 (100.0%) | 40.0 |
Fertility by Education by Marriage Status in Swisher County
18.5% of women with births in Swisher County are unmarried. Women with the educational attainment of high school diploma are most likely to be married with 100.0% of them married at childbirth, while women with the educational attainment of college or associate's degree are least likely to be married with 100.0% of them unmarried at childbirth.
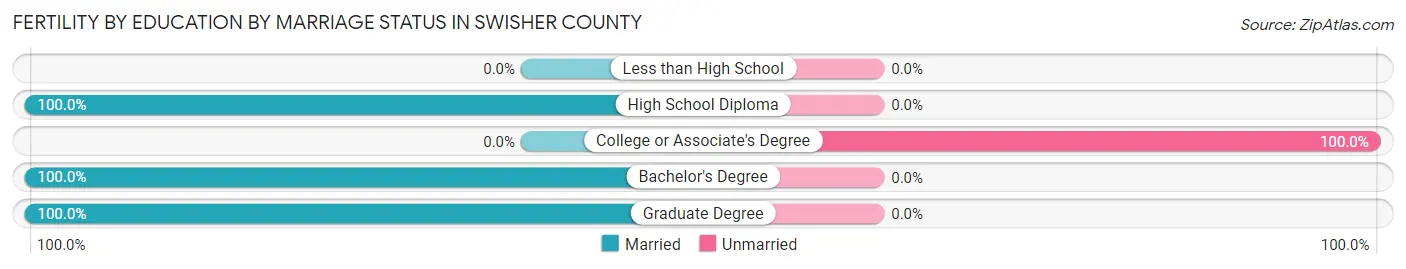
| Educational Attainment | Married | Unmarried |
| Less than High School | 0 (0.0%) | 0 (0.0%) |
| High School Diploma | 5 (100.0%) | 0 (0.0%) |
| College or Associate's Degree | 0 (0.0%) | 10 (100.0%) |
| Bachelor's Degree | 36 (100.0%) | 0 (0.0%) |
| Graduate Degree | 3 (100.0%) | 0 (0.0%) |
| Total | 44 (81.5%) | 10 (18.5%) |
Employment Characteristics in Swisher County
Employment by Class of Employer in Swisher County
Among the 2,610 employed individuals in Swisher County, private company employees (1,320 | 50.6%), local government employees (460 | 17.6%), and self-employed (not incorporated) (269 | 10.3%) make up the most common classes of employment.
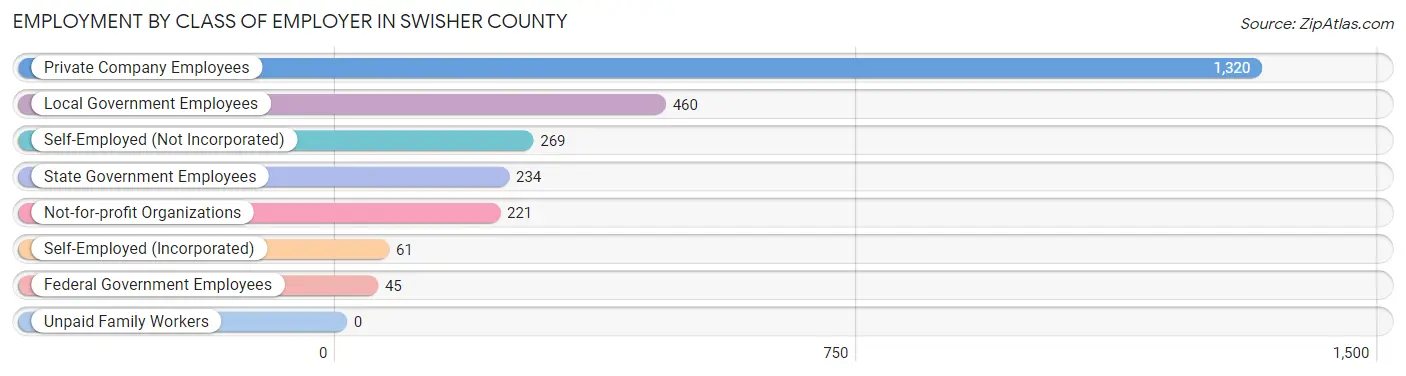
| Employer Class | # Employees | % Employees |
| Private Company Employees | 1,320 | 50.6% |
| Self-Employed (Incorporated) | 61 | 2.3% |
| Self-Employed (Not Incorporated) | 269 | 10.3% |
| Not-for-profit Organizations | 221 | 8.5% |
| Local Government Employees | 460 | 17.6% |
| State Government Employees | 234 | 9.0% |
| Federal Government Employees | 45 | 1.7% |
| Unpaid Family Workers | 0 | 0.0% |
| Total | 2,610 | 100.0% |
Employment Status by Age in Swisher County
According to the labor force statistics for Swisher County, out of the total population over 16 years of age (5,417), 51.9% or 2,811 individuals are in the labor force, with 5.2% or 146 of them unemployed. The age group with the highest labor force participation rate is 25 to 29 years, with 81.3% or 390 individuals in the labor force. Within the labor force, the 16 to 19 years age range has the highest percentage of unemployed individuals, with 29.6% or 16 of them being unemployed.
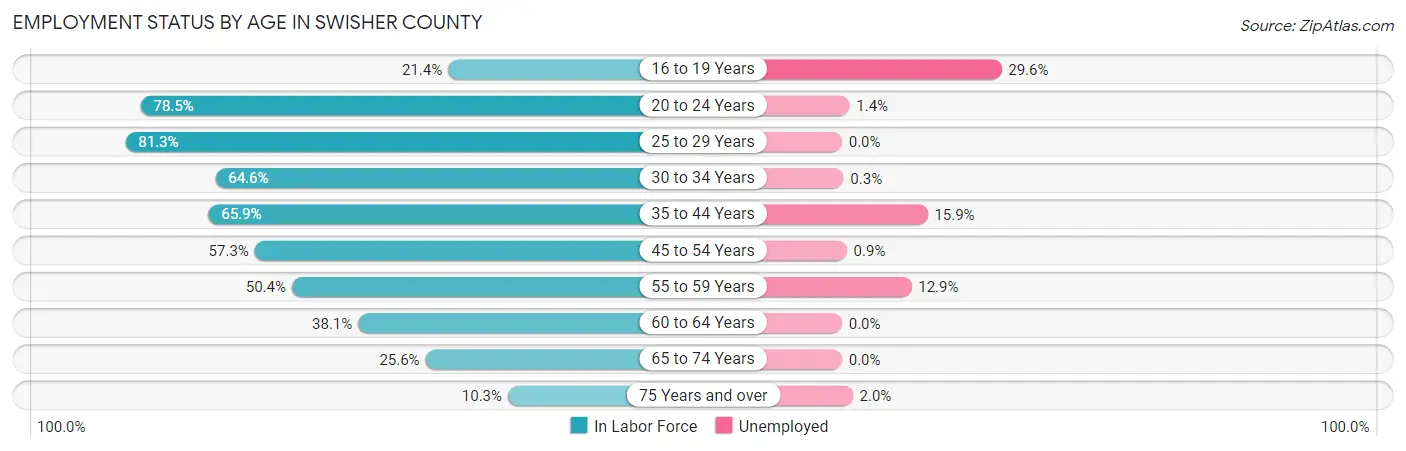
| Age Bracket | In Labor Force | Unemployed |
| 16 to 19 Years | 54 (21.4%) | 16 (29.6%) |
| 20 to 24 Years | 499 (78.5%) | 7 (1.4%) |
| 25 to 29 Years | 390 (81.3%) | 0 (0.0%) |
| 30 to 34 Years | 308 (64.6%) | 1 (0.3%) |
| 35 to 44 Years | 510 (65.9%) | 81 (15.9%) |
| 45 to 54 Years | 426 (57.3%) | 4 (0.9%) |
| 55 to 59 Years | 280 (50.4%) | 36 (12.9%) |
| 60 to 64 Years | 111 (38.1%) | 0 (0.0%) |
| 65 to 74 Years | 187 (25.6%) | 0 (0.0%) |
| 75 Years and over | 49 (10.3%) | 1 (2.0%) |
| Total | 2,811 (51.9%) | 146 (5.2%) |
Employment Status by Educational Attainment in Swisher County
According to labor force statistics for Swisher County, 61.0% of individuals (2,026) out of the total population between 25 and 64 years of age (3,321) are in the labor force, with 6.0% or 122 of them being unemployed. The group with the highest labor force participation rate are those with the educational attainment of bachelor's degree or higher, with 88.8% or 540 individuals in the labor force. Within the labor force, individuals with less than high school education have the highest percentage of unemployment, with 15.5% or 38 of them being unemployed.
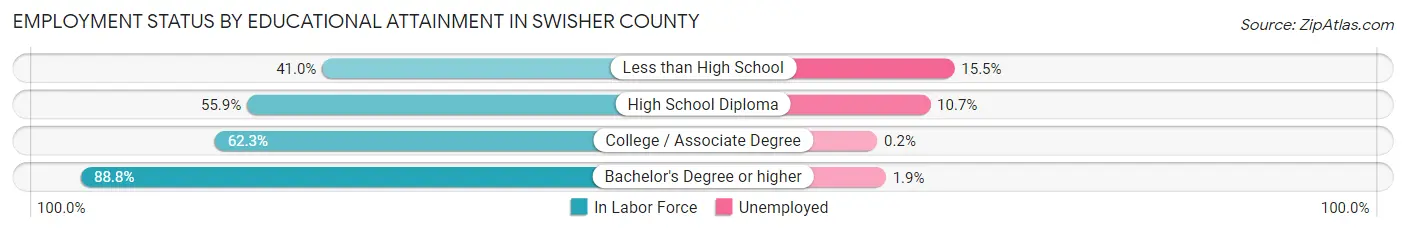
| Educational Attainment | In Labor Force | Unemployed |
| Less than High School | 245 (41.0%) | 93 (15.5%) |
| High School Diploma | 684 (55.9%) | 131 (10.7%) |
| College / Associate Degree | 556 (62.3%) | 2 (0.2%) |
| Bachelor's Degree or higher | 540 (88.8%) | 12 (1.9%) |
| Total | 2,026 (61.0%) | 199 (6.0%) |
Employment Occupations by Sex in Swisher County
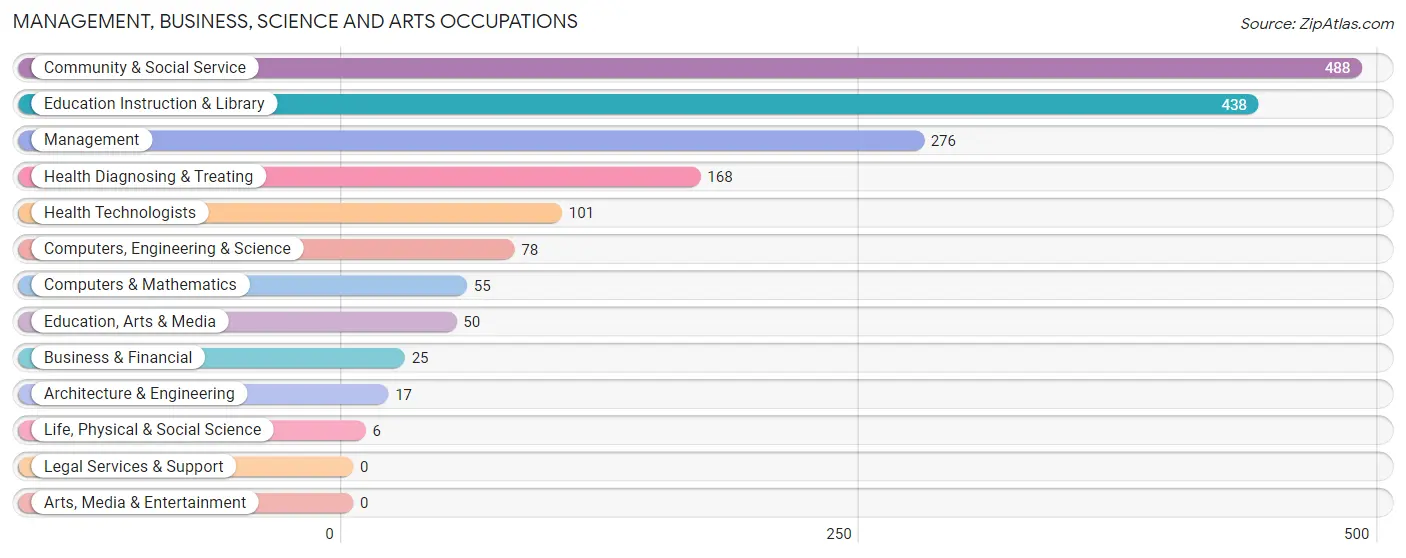
Management, Business, Science and Arts Occupations
The most common Management, Business, Science and Arts occupations in Swisher County are Community & Social Service (488 | 18.3%), Education Instruction & Library (438 | 16.4%), Management (276 | 10.3%), Health Diagnosing & Treating (168 | 6.3%), and Health Technologists (101 | 3.8%).
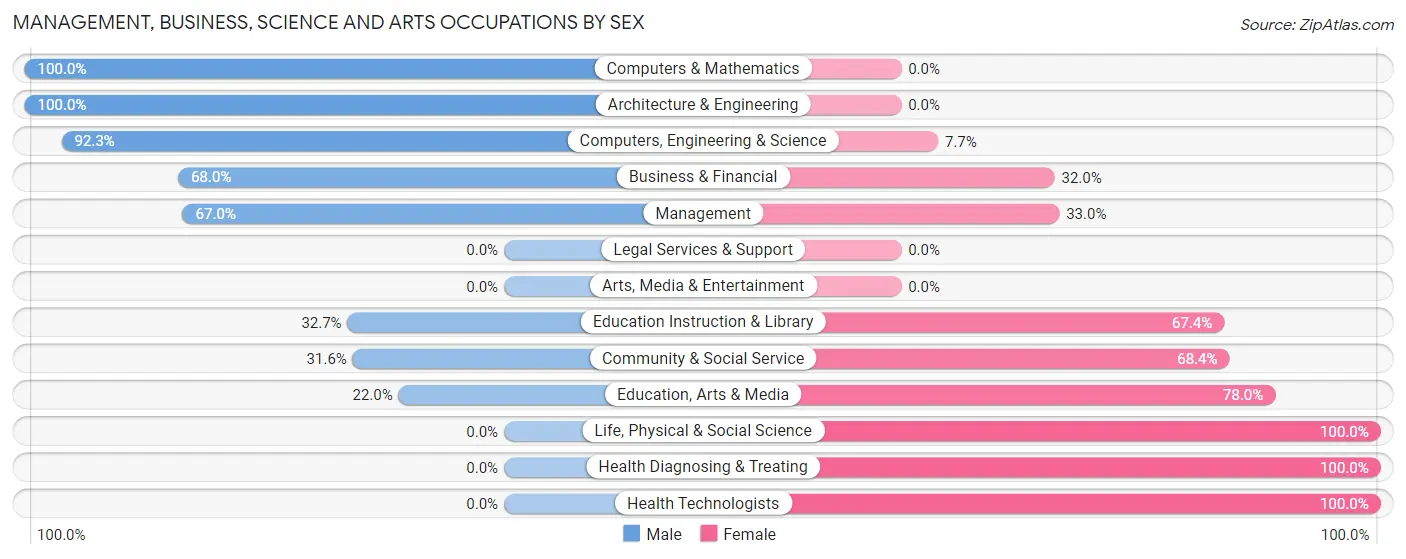
Management, Business, Science and Arts Occupations by Sex
Within the Management, Business, Science and Arts occupations in Swisher County, the most male-oriented occupations are Computers & Mathematics (100.0%), Architecture & Engineering (100.0%), and Computers, Engineering & Science (92.3%), while the most female-oriented occupations are Life, Physical & Social Science (100.0%), Health Diagnosing & Treating (100.0%), and Health Technologists (100.0%).
| Occupation | Male | Female |
| Management | 185 (67.0%) | 91 (33.0%) |
| Business & Financial | 17 (68.0%) | 8 (32.0%) |
| Computers, Engineering & Science | 72 (92.3%) | 6 (7.7%) |
| Computers & Mathematics | 55 (100.0%) | 0 (0.0%) |
| Architecture & Engineering | 17 (100.0%) | 0 (0.0%) |
| Life, Physical & Social Science | 0 (0.0%) | 6 (100.0%) |
| Community & Social Service | 154 (31.6%) | 334 (68.4%) |
| Education, Arts & Media | 11 (22.0%) | 39 (78.0%) |
| Legal Services & Support | 0 (0.0%) | 0 (0.0%) |
| Education Instruction & Library | 143 (32.7%) | 295 (67.3%) |
| Arts, Media & Entertainment | 0 (0.0%) | 0 (0.0%) |
| Health Diagnosing & Treating | 0 (0.0%) | 168 (100.0%) |
| Health Technologists | 0 (0.0%) | 101 (100.0%) |
| Total (Category) | 428 (41.3%) | 607 (58.7%) |
| Total (Overall) | 1,339 (50.2%) | 1,329 (49.8%) |
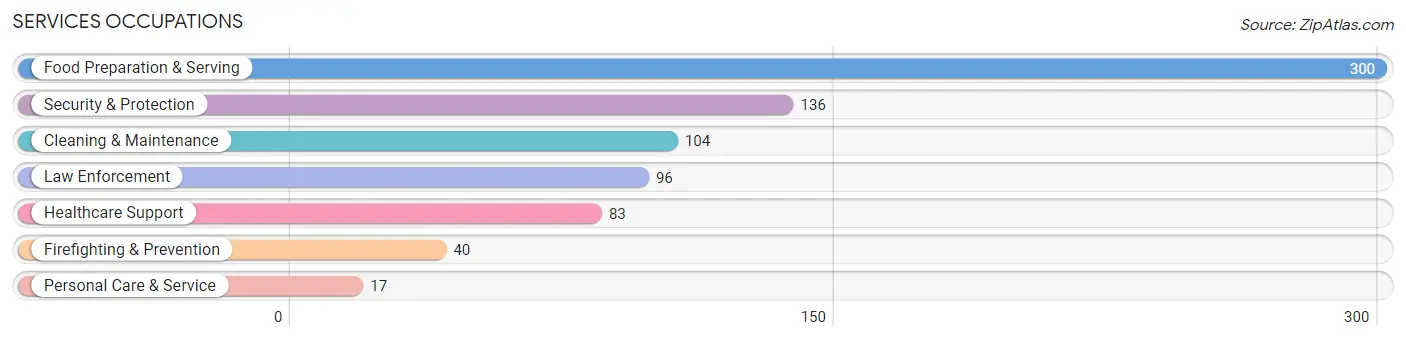
Services Occupations
The most common Services occupations in Swisher County are Food Preparation & Serving (300 | 11.2%), Security & Protection (136 | 5.1%), Cleaning & Maintenance (104 | 3.9%), Law Enforcement (96 | 3.6%), and Healthcare Support (83 | 3.1%).
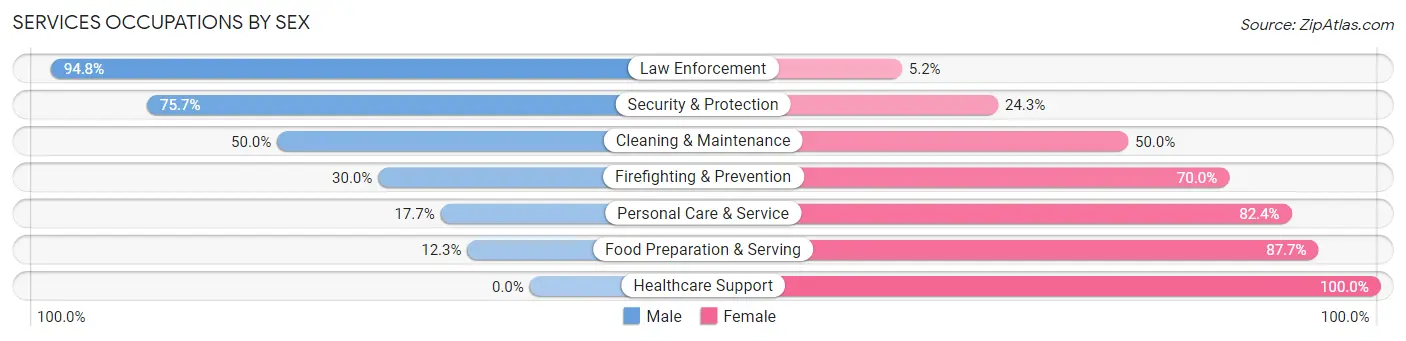
Services Occupations by Sex
Within the Services occupations in Swisher County, the most male-oriented occupations are Law Enforcement (94.8%), Security & Protection (75.7%), and Cleaning & Maintenance (50.0%), while the most female-oriented occupations are Healthcare Support (100.0%), Food Preparation & Serving (87.7%), and Personal Care & Service (82.4%).
| Occupation | Male | Female |
| Healthcare Support | 0 (0.0%) | 83 (100.0%) |
| Security & Protection | 103 (75.7%) | 33 (24.3%) |
| Firefighting & Prevention | 12 (30.0%) | 28 (70.0%) |
| Law Enforcement | 91 (94.8%) | 5 (5.2%) |
| Food Preparation & Serving | 37 (12.3%) | 263 (87.7%) |
| Cleaning & Maintenance | 52 (50.0%) | 52 (50.0%) |
| Personal Care & Service | 3 (17.6%) | 14 (82.4%) |
| Total (Category) | 195 (30.5%) | 445 (69.5%) |
| Total (Overall) | 1,339 (50.2%) | 1,329 (49.8%) |
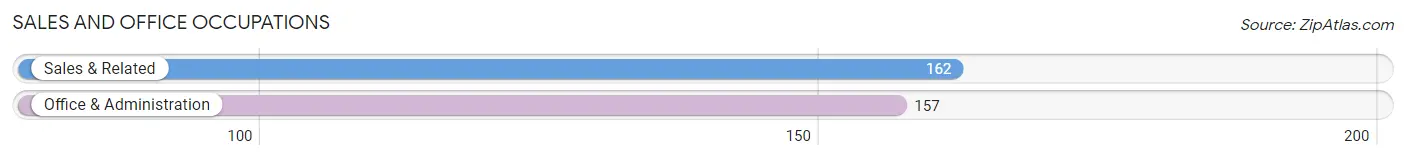
Sales and Office Occupations
The most common Sales and Office occupations in Swisher County are Sales & Related (162 | 6.1%), and Office & Administration (157 | 5.9%).
Sales and Office Occupations by Sex
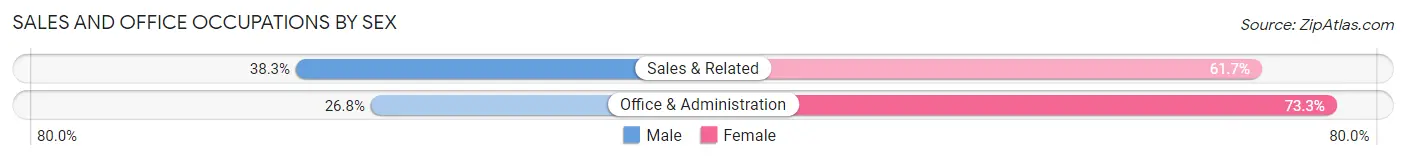
| Occupation | Male | Female |
| Sales & Related | 62 (38.3%) | 100 (61.7%) |
| Office & Administration | 42 (26.8%) | 115 (73.3%) |
| Total (Category) | 104 (32.6%) | 215 (67.4%) |
| Total (Overall) | 1,339 (50.2%) | 1,329 (49.8%) |
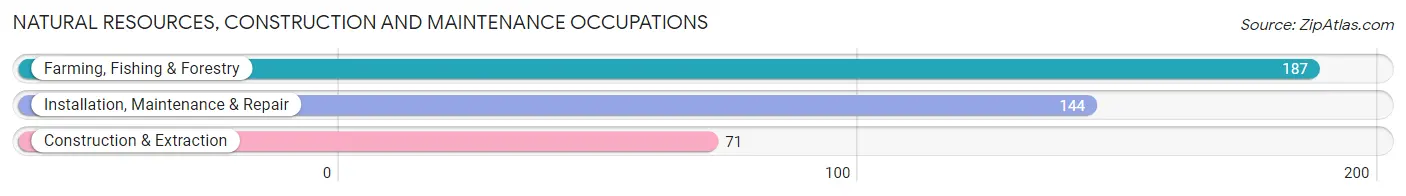
Natural Resources, Construction and Maintenance Occupations
The most common Natural Resources, Construction and Maintenance occupations in Swisher County are Farming, Fishing & Forestry (187 | 7.0%), Installation, Maintenance & Repair (144 | 5.4%), and Construction & Extraction (71 | 2.7%).
Natural Resources, Construction and Maintenance Occupations by Sex
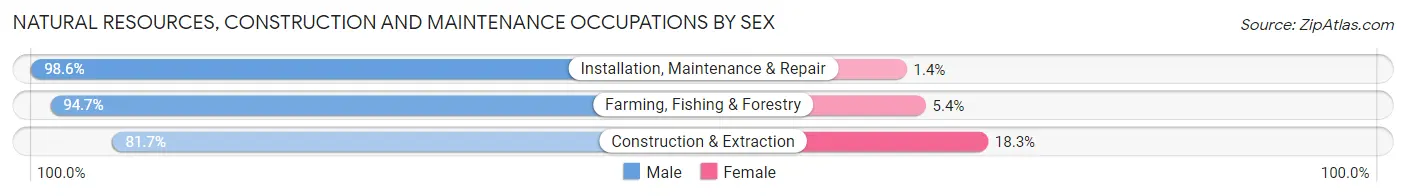
| Occupation | Male | Female |
| Farming, Fishing & Forestry | 177 (94.7%) | 10 (5.3%) |
| Construction & Extraction | 58 (81.7%) | 13 (18.3%) |
| Installation, Maintenance & Repair | 142 (98.6%) | 2 (1.4%) |
| Total (Category) | 377 (93.8%) | 25 (6.2%) |
| Total (Overall) | 1,339 (50.2%) | 1,329 (49.8%) |
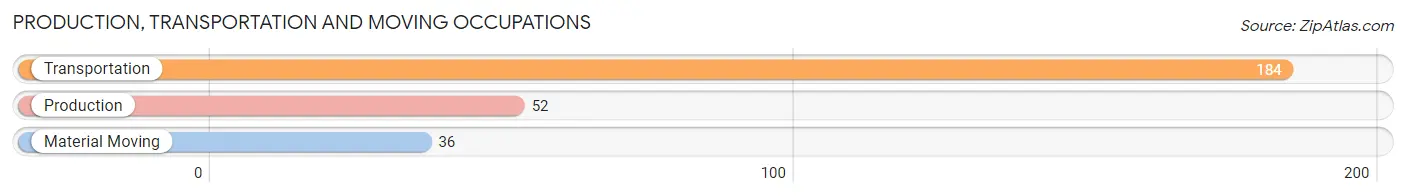
Production, Transportation and Moving Occupations
The most common Production, Transportation and Moving occupations in Swisher County are Transportation (184 | 6.9%), Production (52 | 1.9%), and Material Moving (36 | 1.3%).
Production, Transportation and Moving Occupations by Sex
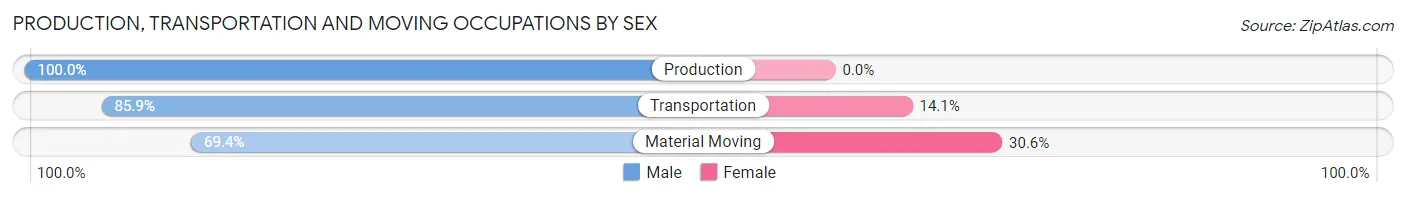
| Occupation | Male | Female |
| Production | 52 (100.0%) | 0 (0.0%) |
| Transportation | 158 (85.9%) | 26 (14.1%) |
| Material Moving | 25 (69.4%) | 11 (30.6%) |
| Total (Category) | 235 (86.4%) | 37 (13.6%) |
| Total (Overall) | 1,339 (50.2%) | 1,329 (49.8%) |
Employment Industries by Sex in Swisher County
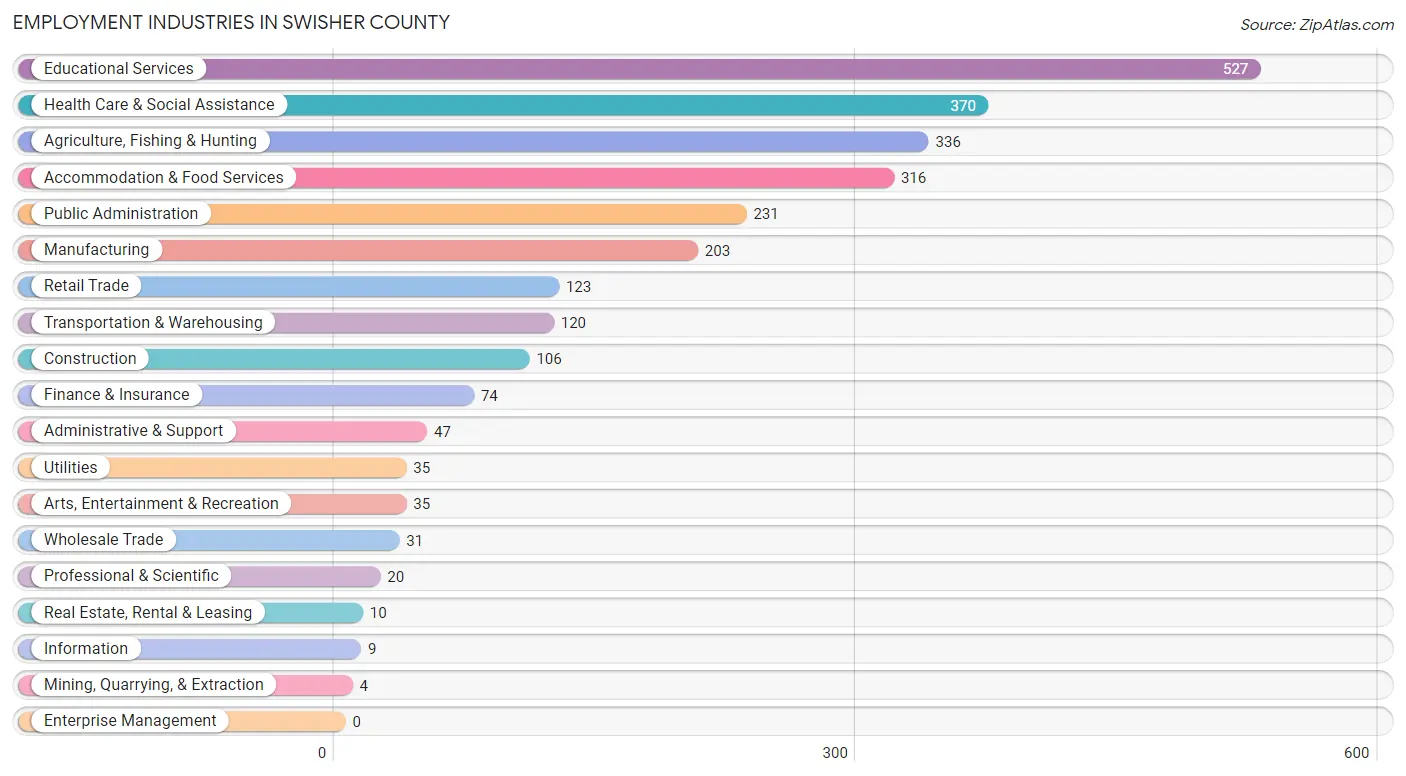
Employment Industries in Swisher County
The major employment industries in Swisher County include Educational Services (527 | 19.8%), Health Care & Social Assistance (370 | 13.9%), Agriculture, Fishing & Hunting (336 | 12.6%), Accommodation & Food Services (316 | 11.8%), and Public Administration (231 | 8.7%).
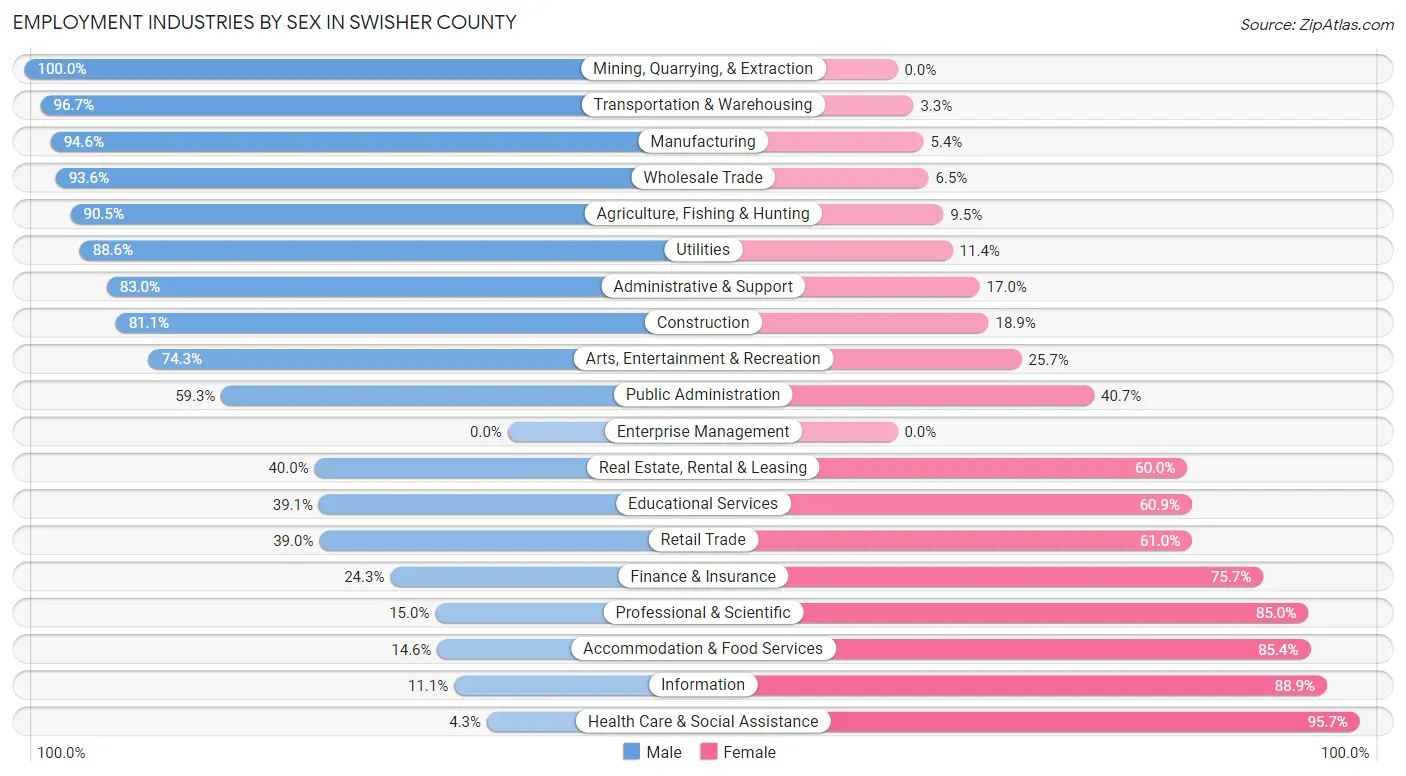
Employment Industries by Sex in Swisher County
The Swisher County industries that see more men than women are Mining, Quarrying, & Extraction (100.0%), Transportation & Warehousing (96.7%), and Manufacturing (94.6%), whereas the industries that tend to have a higher number of women are Health Care & Social Assistance (95.7%), Information (88.9%), and Accommodation & Food Services (85.4%).
| Industry | Male | Female |
| Agriculture, Fishing & Hunting | 304 (90.5%) | 32 (9.5%) |
| Mining, Quarrying, & Extraction | 4 (100.0%) | 0 (0.0%) |
| Construction | 86 (81.1%) | 20 (18.9%) |
| Manufacturing | 192 (94.6%) | 11 (5.4%) |
| Wholesale Trade | 29 (93.5%) | 2 (6.5%) |
| Retail Trade | 48 (39.0%) | 75 (61.0%) |
| Transportation & Warehousing | 116 (96.7%) | 4 (3.3%) |
| Utilities | 31 (88.6%) | 4 (11.4%) |
| Information | 1 (11.1%) | 8 (88.9%) |
| Finance & Insurance | 18 (24.3%) | 56 (75.7%) |
| Real Estate, Rental & Leasing | 4 (40.0%) | 6 (60.0%) |
| Professional & Scientific | 3 (15.0%) | 17 (85.0%) |
| Enterprise Management | 0 (0.0%) | 0 (0.0%) |
| Administrative & Support | 39 (83.0%) | 8 (17.0%) |
| Educational Services | 206 (39.1%) | 321 (60.9%) |
| Health Care & Social Assistance | 16 (4.3%) | 354 (95.7%) |
| Arts, Entertainment & Recreation | 26 (74.3%) | 9 (25.7%) |
| Accommodation & Food Services | 46 (14.6%) | 270 (85.4%) |
| Public Administration | 137 (59.3%) | 94 (40.7%) |
| Total | 1,339 (50.2%) | 1,329 (49.8%) |
Education in Swisher County
School Enrollment in Swisher County
The most common levels of schooling among the 1,972 students in Swisher County are middle school (505 | 25.6%), college / undergraduate (418 | 21.2%), and elementary school (370 | 18.8%).
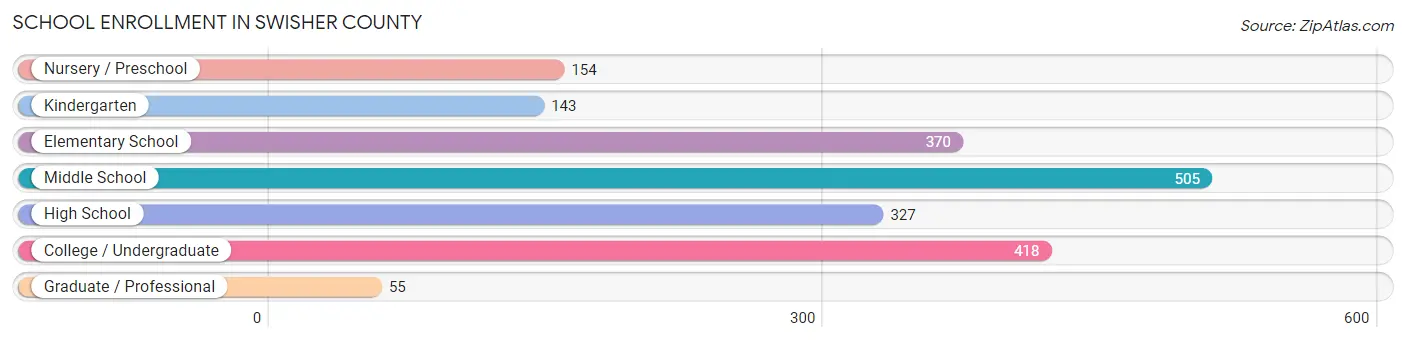
| School Level | # Students | % Students |
| Nursery / Preschool | 154 | 7.8% |
| Kindergarten | 143 | 7.2% |
| Elementary School | 370 | 18.8% |
| Middle School | 505 | 25.6% |
| High School | 327 | 16.6% |
| College / Undergraduate | 418 | 21.2% |
| Graduate / Professional | 55 | 2.8% |
| Total | 1,972 | 100.0% |
School Enrollment by Age by Funding Source in Swisher County
Out of a total of 1,972 students who are enrolled in schools in Swisher County, 110 (5.6%) attend a private institution, while the remaining 1,862 (94.4%) are enrolled in public schools. The age group of 3 to 4 year olds has the highest likelihood of being enrolled in private schools, with 31 (27.7% in the age bracket) enrolled. Conversely, the age group of 15 to 17 year olds has the lowest likelihood of being enrolled in a private school, with 238 (100.0% in the age bracket) attending a public institution.
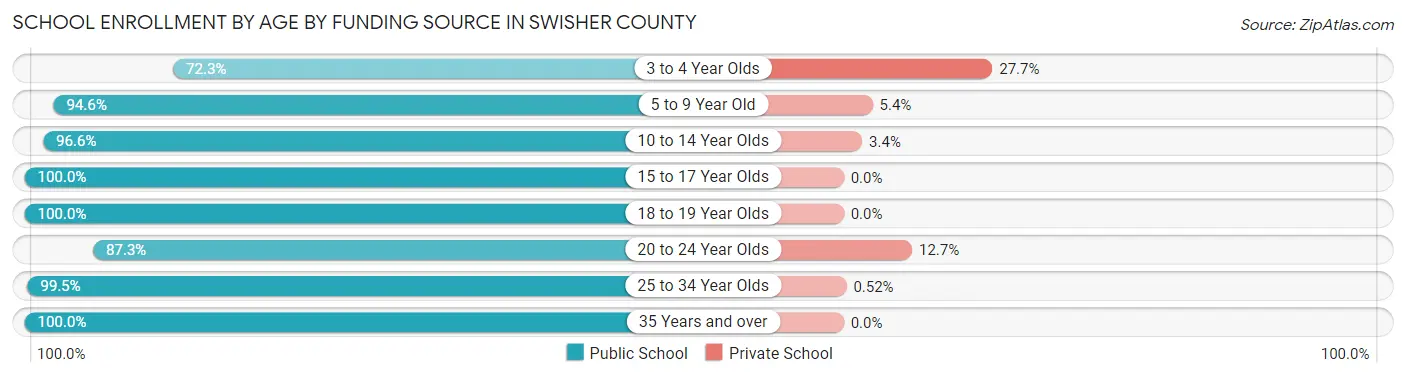
| Age Bracket | Public School | Private School |
| 3 to 4 Year Olds | 81 (72.3%) | 31 (27.7%) |
| 5 to 9 Year Old | 421 (94.6%) | 24 (5.4%) |
| 10 to 14 Year Olds | 618 (96.6%) | 22 (3.4%) |
| 15 to 17 Year Olds | 238 (100.0%) | 0 (0.0%) |
| 18 to 19 Year Olds | 25 (100.0%) | 0 (0.0%) |
| 20 to 24 Year Olds | 226 (87.3%) | 33 (12.7%) |
| 25 to 34 Year Olds | 190 (99.5%) | 1 (0.5%) |
| 35 Years and over | 62 (100.0%) | 0 (0.0%) |
| Total | 1,862 (94.4%) | 110 (5.6%) |
Educational Attainment by Field of Study in Swisher County
Education (248 | 28.2%), business (125 | 14.2%), science & technology (109 | 12.4%), bio, nature & agricultural (99 | 11.3%), and arts & humanities (61 | 7.0%) are the most common fields of study among 878 individuals in Swisher County who have obtained a bachelor's degree or higher.
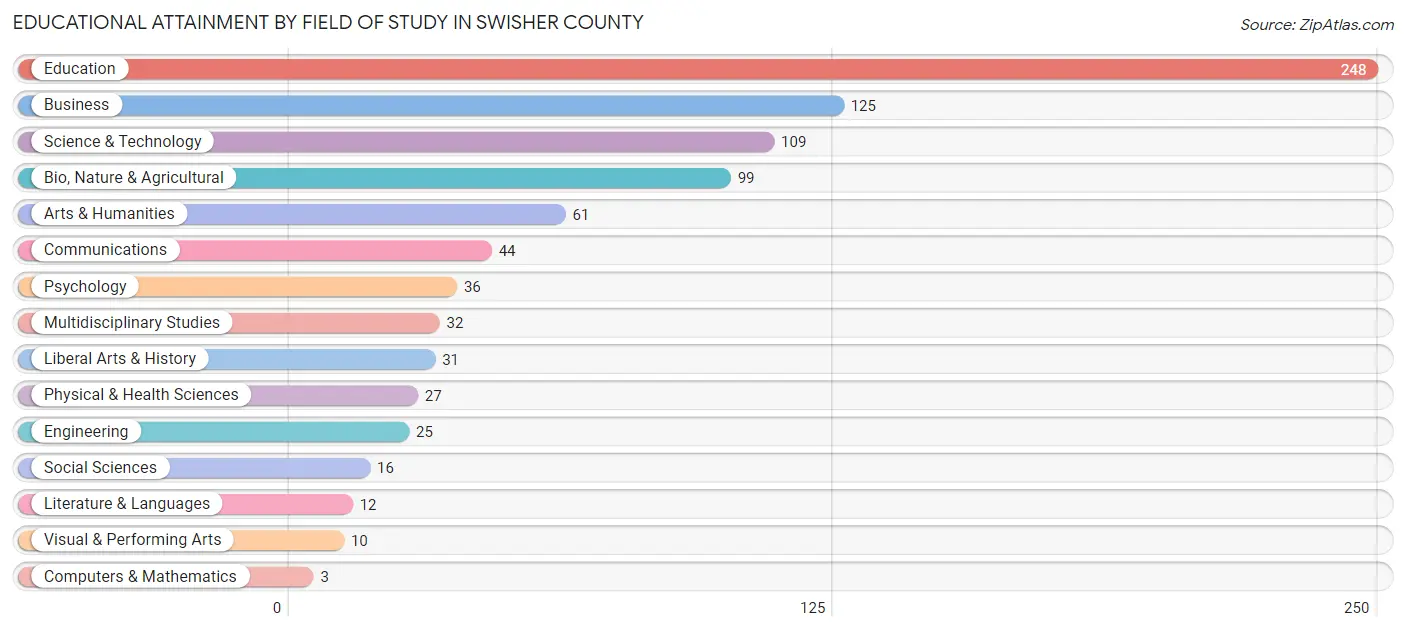
| Field of Study | # Graduates | % Graduates |
| Computers & Mathematics | 3 | 0.3% |
| Bio, Nature & Agricultural | 99 | 11.3% |
| Physical & Health Sciences | 27 | 3.1% |
| Psychology | 36 | 4.1% |
| Social Sciences | 16 | 1.8% |
| Engineering | 25 | 2.9% |
| Multidisciplinary Studies | 32 | 3.6% |
| Science & Technology | 109 | 12.4% |
| Business | 125 | 14.2% |
| Education | 248 | 28.2% |
| Literature & Languages | 12 | 1.4% |
| Liberal Arts & History | 31 | 3.5% |
| Visual & Performing Arts | 10 | 1.1% |
| Communications | 44 | 5.0% |
| Arts & Humanities | 61 | 7.0% |
| Total | 878 | 100.0% |
Transportation & Commute in Swisher County
Vehicle Availability by Sex in Swisher County
The most prevalent vehicle ownership categories in Swisher County are males with 2 vehicles (564, accounting for 43.7%) and females with 2 vehicles (556, making up 42.9%).
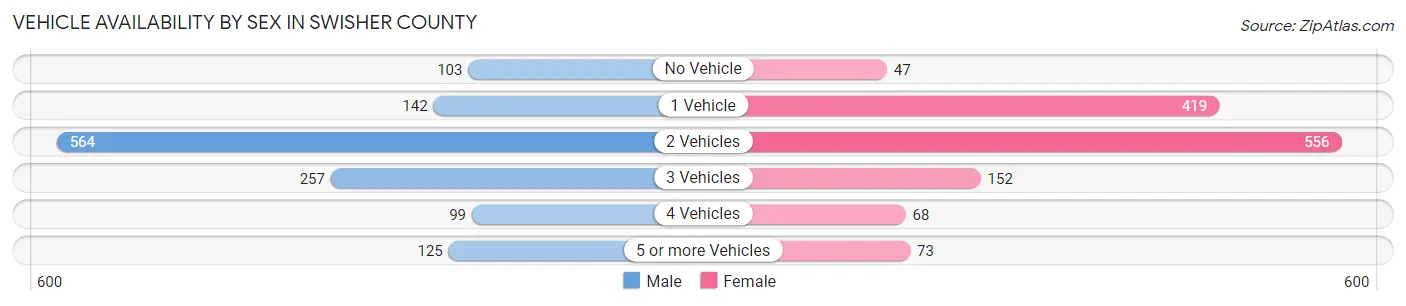
| Vehicles Available | Male | Female |
| No Vehicle | 103 (8.0%) | 47 (3.6%) |
| 1 Vehicle | 142 (11.0%) | 419 (31.9%) |
| 2 Vehicles | 564 (43.7%) | 556 (42.3%) |
| 3 Vehicles | 257 (19.9%) | 152 (11.6%) |
| 4 Vehicles | 99 (7.7%) | 68 (5.2%) |
| 5 or more Vehicles | 125 (9.7%) | 73 (5.6%) |
| Total | 1,290 (100.0%) | 1,315 (100.0%) |
Commute Time in Swisher County
The most frequently occuring commute durations in Swisher County are less than 5 minutes (514 commuters, 20.2%), 5 to 9 minutes (479 commuters, 18.8%), and 10 to 14 minutes (402 commuters, 15.8%).
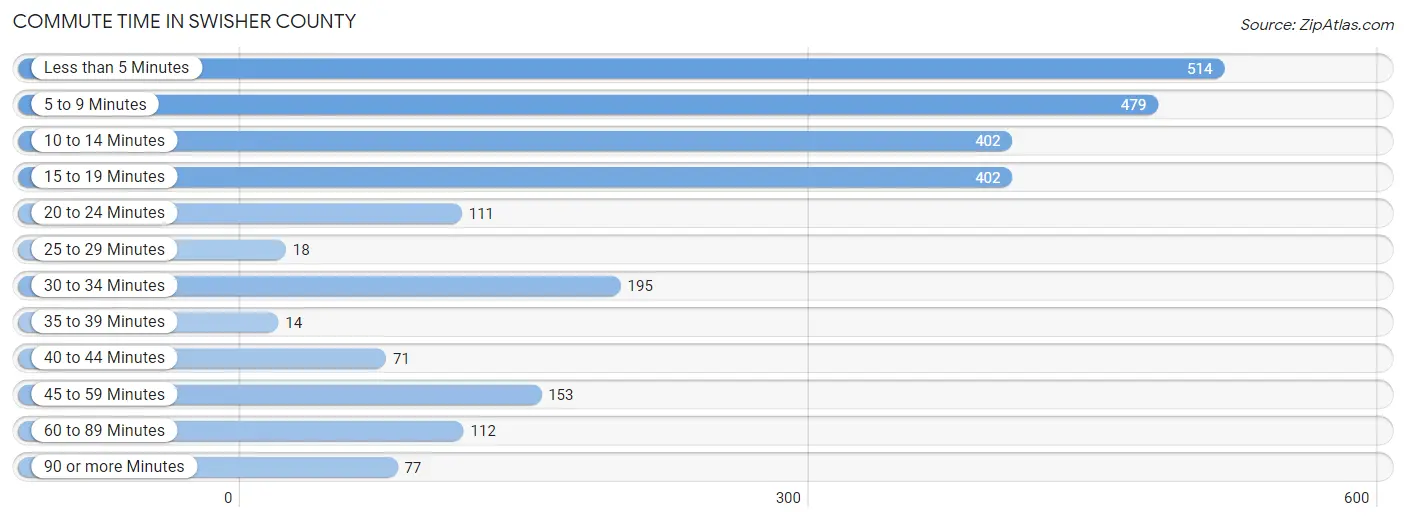
| Commute Time | # Commuters | % Commuters |
| Less than 5 Minutes | 514 | 20.2% |
| 5 to 9 Minutes | 479 | 18.8% |
| 10 to 14 Minutes | 402 | 15.8% |
| 15 to 19 Minutes | 402 | 15.8% |
| 20 to 24 Minutes | 111 | 4.4% |
| 25 to 29 Minutes | 18 | 0.7% |
| 30 to 34 Minutes | 195 | 7.6% |
| 35 to 39 Minutes | 14 | 0.5% |
| 40 to 44 Minutes | 71 | 2.8% |
| 45 to 59 Minutes | 153 | 6.0% |
| 60 to 89 Minutes | 112 | 4.4% |
| 90 or more Minutes | 77 | 3.0% |
Commute Time by Sex in Swisher County
The most common commute times in Swisher County are 15 to 19 minutes (258 commuters, 20.5%) for males and less than 5 minutes (328 commuters, 25.5%) for females.
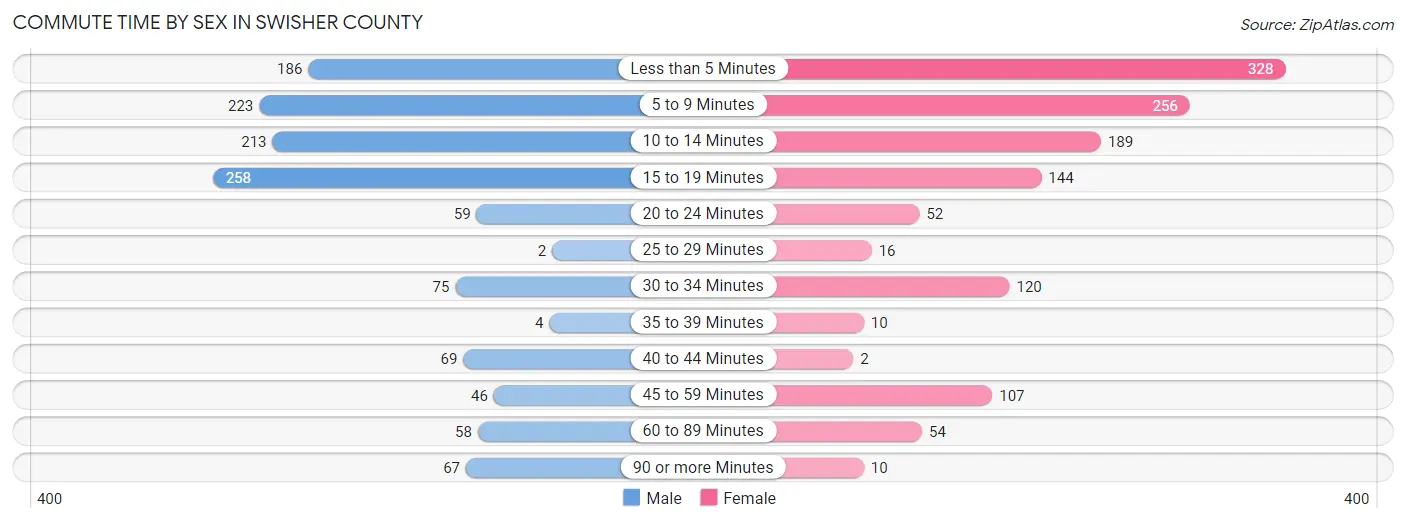
| Commute Time | Male | Female |
| Less than 5 Minutes | 186 (14.8%) | 328 (25.5%) |
| 5 to 9 Minutes | 223 (17.7%) | 256 (19.9%) |
| 10 to 14 Minutes | 213 (16.9%) | 189 (14.7%) |
| 15 to 19 Minutes | 258 (20.5%) | 144 (11.2%) |
| 20 to 24 Minutes | 59 (4.7%) | 52 (4.0%) |
| 25 to 29 Minutes | 2 (0.2%) | 16 (1.2%) |
| 30 to 34 Minutes | 75 (5.9%) | 120 (9.3%) |
| 35 to 39 Minutes | 4 (0.3%) | 10 (0.8%) |
| 40 to 44 Minutes | 69 (5.5%) | 2 (0.2%) |
| 45 to 59 Minutes | 46 (3.6%) | 107 (8.3%) |
| 60 to 89 Minutes | 58 (4.6%) | 54 (4.2%) |
| 90 or more Minutes | 67 (5.3%) | 10 (0.8%) |
Time of Departure to Work by Sex in Swisher County
The most frequent times of departure to work in Swisher County are 8:00 AM to 8:29 AM (251, 19.9%) for males and 7:30 AM to 7:59 AM (228, 17.7%) for females.
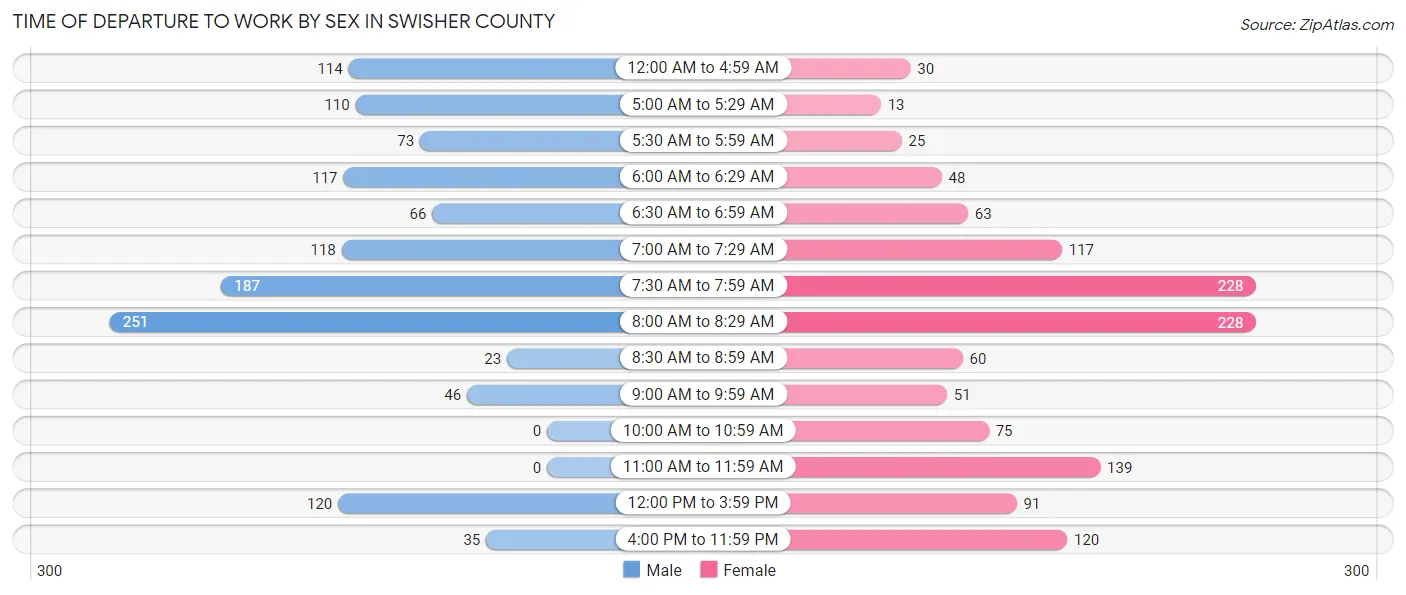
| Time of Departure | Male | Female |
| 12:00 AM to 4:59 AM | 114 (9.0%) | 30 (2.3%) |
| 5:00 AM to 5:29 AM | 110 (8.7%) | 13 (1.0%) |
| 5:30 AM to 5:59 AM | 73 (5.8%) | 25 (1.9%) |
| 6:00 AM to 6:29 AM | 117 (9.3%) | 48 (3.7%) |
| 6:30 AM to 6:59 AM | 66 (5.2%) | 63 (4.9%) |
| 7:00 AM to 7:29 AM | 118 (9.4%) | 117 (9.1%) |
| 7:30 AM to 7:59 AM | 187 (14.8%) | 228 (17.7%) |
| 8:00 AM to 8:29 AM | 251 (19.9%) | 228 (17.7%) |
| 8:30 AM to 8:59 AM | 23 (1.8%) | 60 (4.7%) |
| 9:00 AM to 9:59 AM | 46 (3.6%) | 51 (4.0%) |
| 10:00 AM to 10:59 AM | 0 (0.0%) | 75 (5.8%) |
| 11:00 AM to 11:59 AM | 0 (0.0%) | 139 (10.8%) |
| 12:00 PM to 3:59 PM | 120 (9.5%) | 91 (7.1%) |
| 4:00 PM to 11:59 PM | 35 (2.8%) | 120 (9.3%) |
| Total | 1,260 (100.0%) | 1,288 (100.0%) |
Housing Occupancy in Swisher County
Occupancy by Ownership in Swisher County
Of the total 2,401 dwellings in Swisher County, owner-occupied units account for 1,648 (68.6%), while renter-occupied units make up 753 (31.4%).
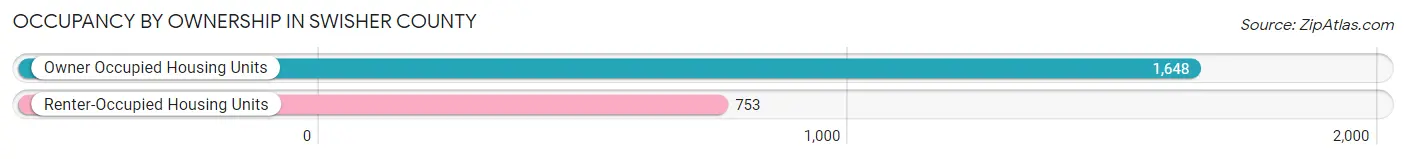
| Occupancy | # Housing Units | % Housing Units |
| Owner Occupied Housing Units | 1,648 | 68.6% |
| Renter-Occupied Housing Units | 753 | 31.4% |
| Total Occupied Housing Units | 2,401 | 100.0% |
Occupancy by Household Size in Swisher County
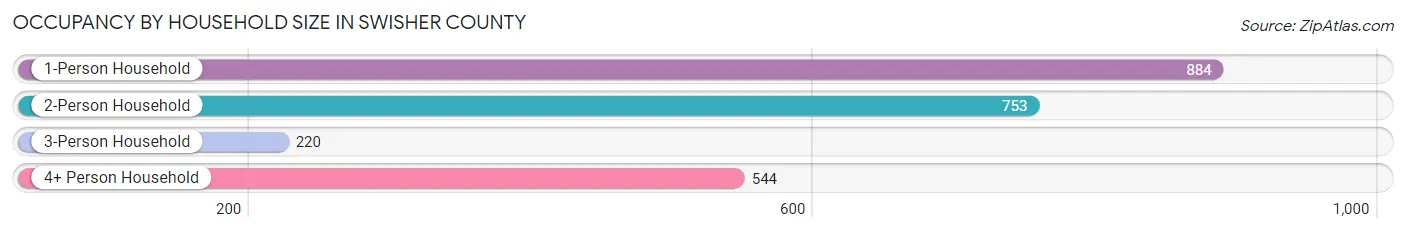
| Household Size | # Housing Units | % Housing Units |
| 1-Person Household | 884 | 36.8% |
| 2-Person Household | 753 | 31.4% |
| 3-Person Household | 220 | 9.2% |
| 4+ Person Household | 544 | 22.7% |
| Total Housing Units | 2,401 | 100.0% |
Occupancy by Ownership by Household Size in Swisher County
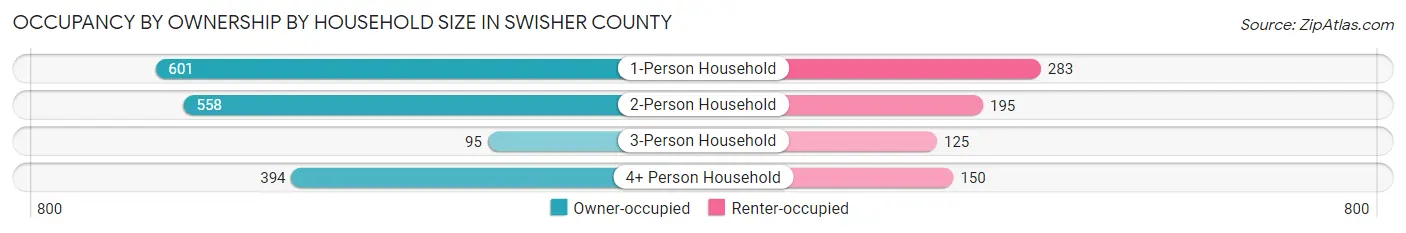
| Household Size | Owner-occupied | Renter-occupied |
| 1-Person Household | 601 (68.0%) | 283 (32.0%) |
| 2-Person Household | 558 (74.1%) | 195 (25.9%) |
| 3-Person Household | 95 (43.2%) | 125 (56.8%) |
| 4+ Person Household | 394 (72.4%) | 150 (27.6%) |
| Total Housing Units | 1,648 (68.6%) | 753 (31.4%) |
Occupancy by Educational Attainment in Swisher County
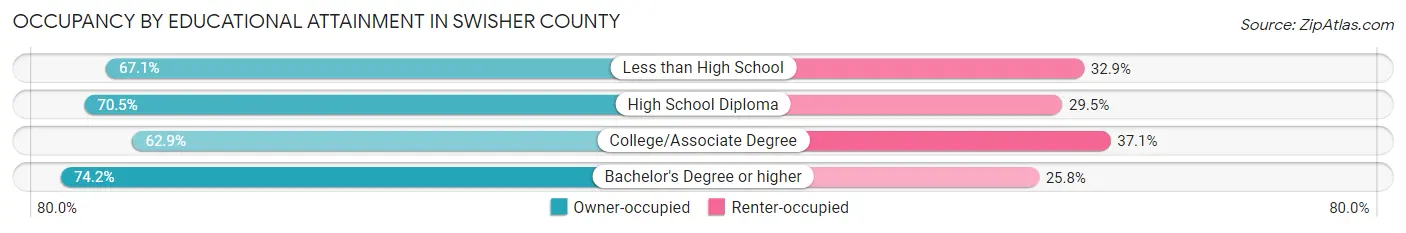
| Household Size | Owner-occupied | Renter-occupied |
| Less than High School | 340 (67.1%) | 167 (32.9%) |
| High School Diploma | 476 (70.5%) | 199 (29.5%) |
| College/Associate Degree | 403 (62.9%) | 238 (37.1%) |
| Bachelor's Degree or higher | 429 (74.2%) | 149 (25.8%) |
Occupancy by Age of Householder in Swisher County
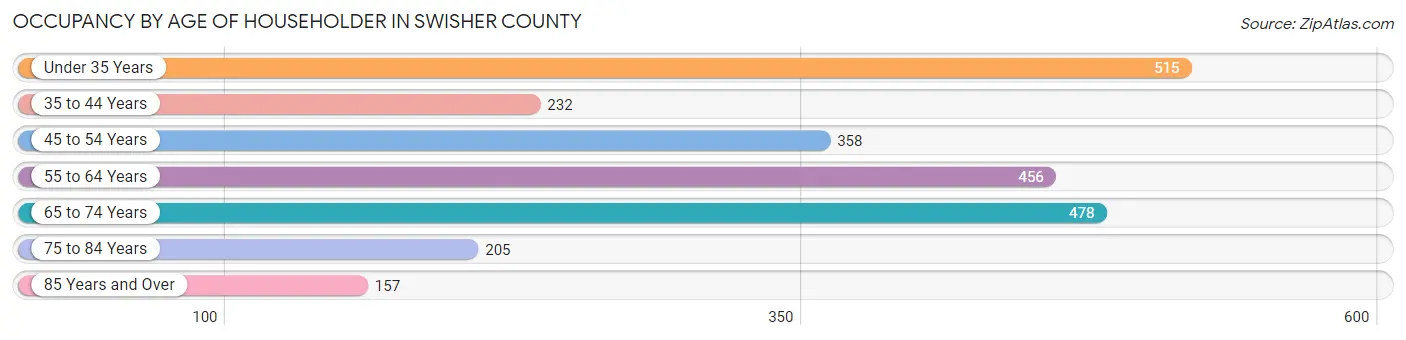
| Age Bracket | # Households | % Households |
| Under 35 Years | 515 | 21.4% |
| 35 to 44 Years | 232 | 9.7% |
| 45 to 54 Years | 358 | 14.9% |
| 55 to 64 Years | 456 | 19.0% |
| 65 to 74 Years | 478 | 19.9% |
| 75 to 84 Years | 205 | 8.5% |
| 85 Years and Over | 157 | 6.5% |
| Total | 2,401 | 100.0% |
Housing Finances in Swisher County
Median Income by Occupancy in Swisher County
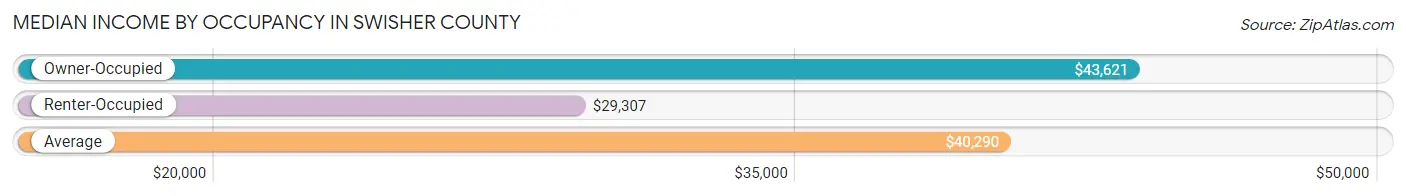
| Occupancy Type | # Households | Median Income |
| Owner-Occupied | 1,648 (68.6%) | $43,621 |
| Renter-Occupied | 753 (31.4%) | $29,307 |
| Average | 2,401 (100.0%) | $40,290 |
Occupancy by Householder Income Bracket in Swisher County
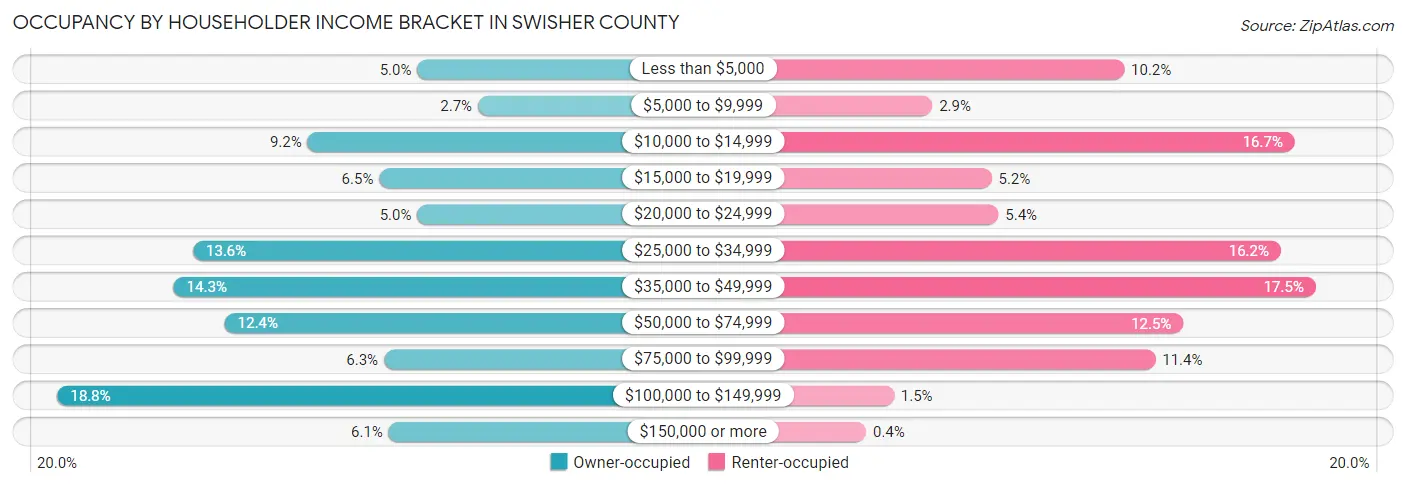
| Income Bracket | Owner-occupied | Renter-occupied |
| Less than $5,000 | 83 (5.0%) | 77 (10.2%) |
| $5,000 to $9,999 | 45 (2.7%) | 22 (2.9%) |
| $10,000 to $14,999 | 152 (9.2%) | 126 (16.7%) |
| $15,000 to $19,999 | 107 (6.5%) | 39 (5.2%) |
| $20,000 to $24,999 | 83 (5.0%) | 41 (5.4%) |
| $25,000 to $34,999 | 224 (13.6%) | 122 (16.2%) |
| $35,000 to $49,999 | 236 (14.3%) | 132 (17.5%) |
| $50,000 to $74,999 | 204 (12.4%) | 94 (12.5%) |
| $75,000 to $99,999 | 104 (6.3%) | 86 (11.4%) |
| $100,000 to $149,999 | 309 (18.8%) | 11 (1.5%) |
| $150,000 or more | 101 (6.1%) | 3 (0.4%) |
| Total | 1,648 (100.0%) | 753 (100.0%) |
Monthly Housing Cost Tiers in Swisher County
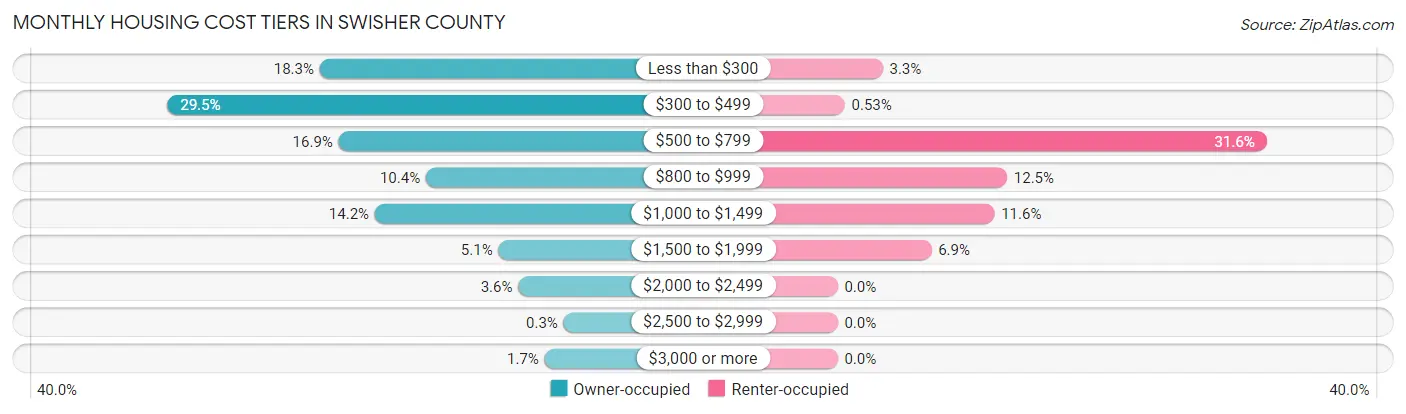
| Monthly Cost | Owner-occupied | Renter-occupied |
| Less than $300 | 301 (18.3%) | 25 (3.3%) |
| $300 to $499 | 486 (29.5%) | 4 (0.5%) |
| $500 to $799 | 278 (16.9%) | 238 (31.6%) |
| $800 to $999 | 172 (10.4%) | 94 (12.5%) |
| $1,000 to $1,499 | 234 (14.2%) | 87 (11.6%) |
| $1,500 to $1,999 | 84 (5.1%) | 52 (6.9%) |
| $2,000 to $2,499 | 60 (3.6%) | 0 (0.0%) |
| $2,500 to $2,999 | 5 (0.3%) | 0 (0.0%) |
| $3,000 or more | 28 (1.7%) | 0 (0.0%) |
| Total | 1,648 (100.0%) | 753 (100.0%) |
Physical Housing Characteristics in Swisher County
Housing Structures in Swisher County
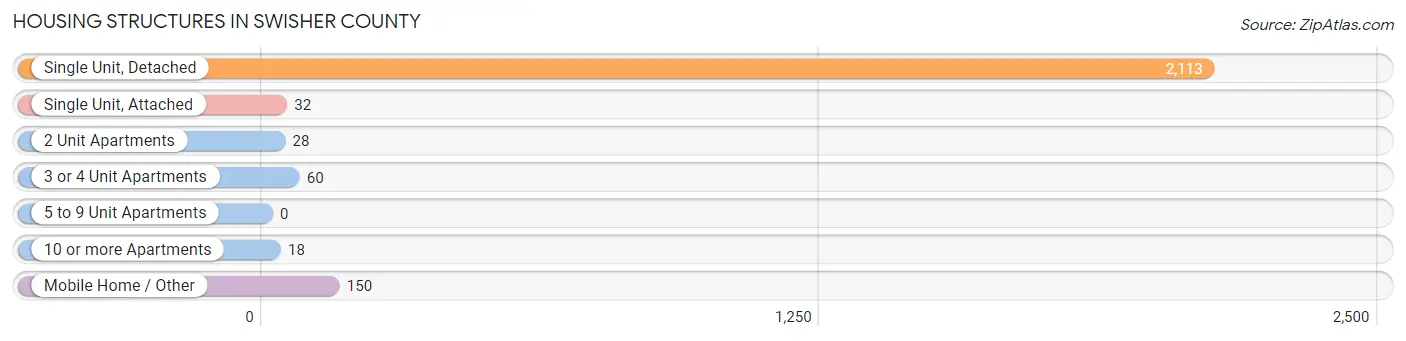
| Structure Type | # Housing Units | % Housing Units |
| Single Unit, Detached | 2,113 | 88.0% |
| Single Unit, Attached | 32 | 1.3% |
| 2 Unit Apartments | 28 | 1.2% |
| 3 or 4 Unit Apartments | 60 | 2.5% |
| 5 to 9 Unit Apartments | 0 | 0.0% |
| 10 or more Apartments | 18 | 0.7% |
| Mobile Home / Other | 150 | 6.2% |
| Total | 2,401 | 100.0% |
Housing Structures by Occupancy in Swisher County
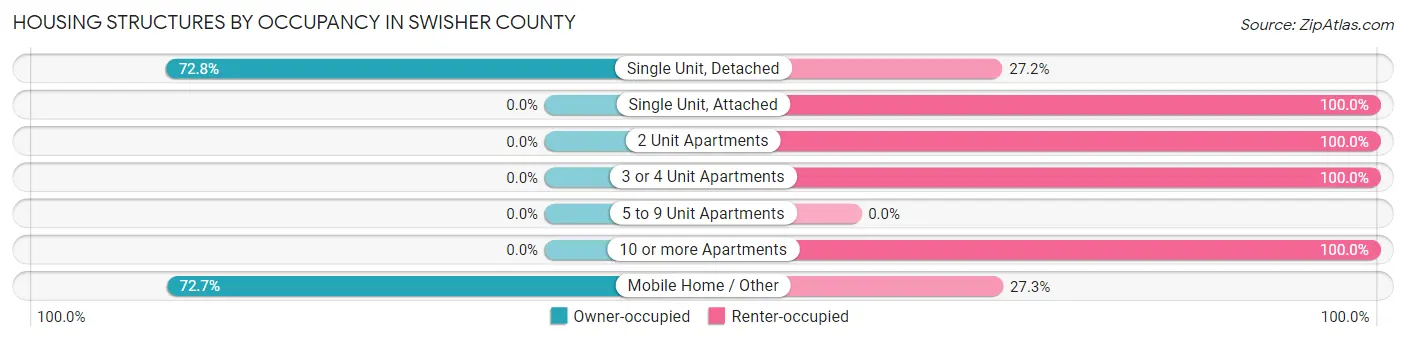
| Structure Type | Owner-occupied | Renter-occupied |
| Single Unit, Detached | 1,539 (72.8%) | 574 (27.2%) |
| Single Unit, Attached | 0 (0.0%) | 32 (100.0%) |
| 2 Unit Apartments | 0 (0.0%) | 28 (100.0%) |
| 3 or 4 Unit Apartments | 0 (0.0%) | 60 (100.0%) |
| 5 to 9 Unit Apartments | 0 (0.0%) | 0 (0.0%) |
| 10 or more Apartments | 0 (0.0%) | 18 (100.0%) |
| Mobile Home / Other | 109 (72.7%) | 41 (27.3%) |
| Total | 1,648 (68.6%) | 753 (31.4%) |
Housing Structures by Number of Rooms in Swisher County
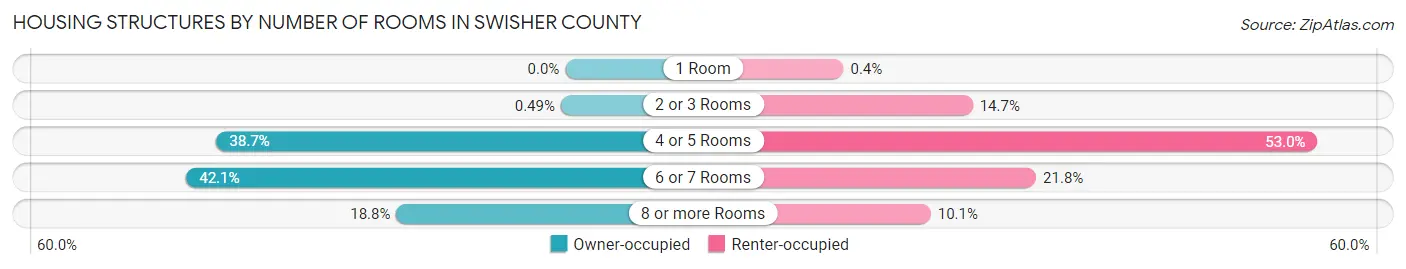
| Number of Rooms | Owner-occupied | Renter-occupied |
| 1 Room | 0 (0.0%) | 3 (0.4%) |
| 2 or 3 Rooms | 8 (0.5%) | 111 (14.7%) |
| 4 or 5 Rooms | 638 (38.7%) | 399 (53.0%) |
| 6 or 7 Rooms | 693 (42.0%) | 164 (21.8%) |
| 8 or more Rooms | 309 (18.8%) | 76 (10.1%) |
| Total | 1,648 (100.0%) | 753 (100.0%) |
Housing Structure by Heating Type in Swisher County
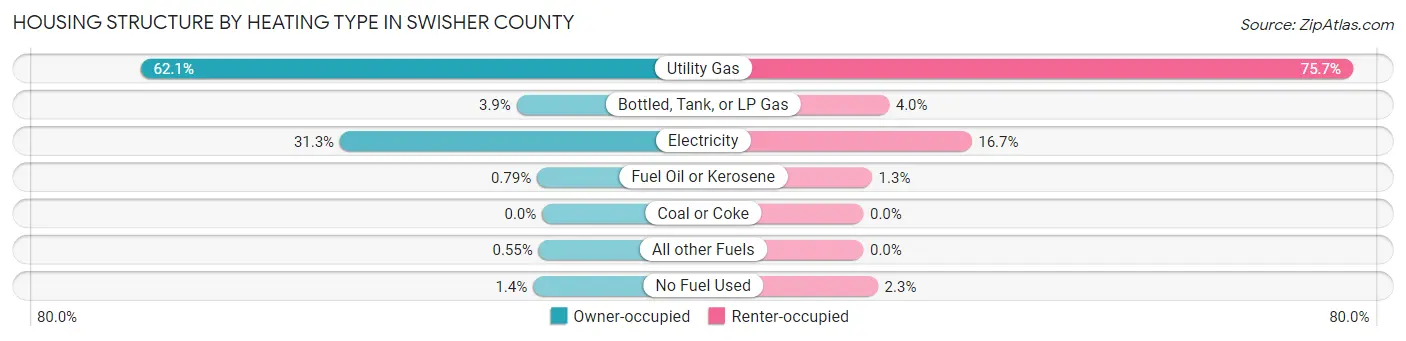
| Heating Type | Owner-occupied | Renter-occupied |
| Utility Gas | 1,023 (62.1%) | 570 (75.7%) |
| Bottled, Tank, or LP Gas | 65 (3.9%) | 30 (4.0%) |
| Electricity | 515 (31.2%) | 126 (16.7%) |
| Fuel Oil or Kerosene | 13 (0.8%) | 10 (1.3%) |
| Coal or Coke | 0 (0.0%) | 0 (0.0%) |
| All other Fuels | 9 (0.5%) | 0 (0.0%) |
| No Fuel Used | 23 (1.4%) | 17 (2.3%) |
| Total | 1,648 (100.0%) | 753 (100.0%) |
Household Vehicle Usage in Swisher County
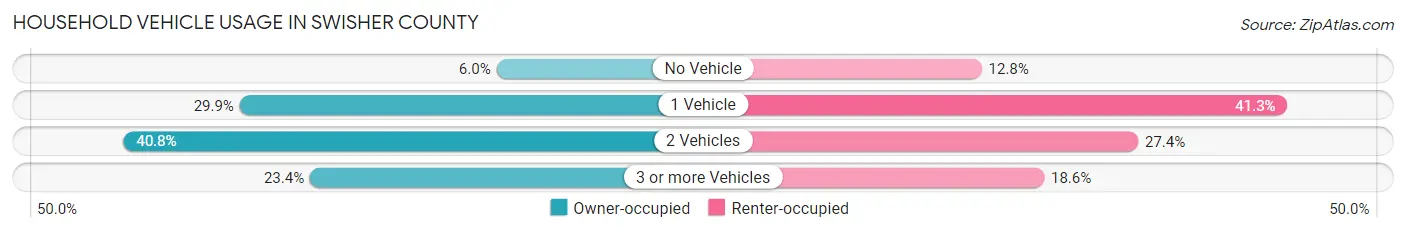
| Vehicles per Household | Owner-occupied | Renter-occupied |
| No Vehicle | 98 (5.9%) | 96 (12.8%) |
| 1 Vehicle | 493 (29.9%) | 311 (41.3%) |
| 2 Vehicles | 672 (40.8%) | 206 (27.4%) |
| 3 or more Vehicles | 385 (23.4%) | 140 (18.6%) |
| Total | 1,648 (100.0%) | 753 (100.0%) |
Real Estate & Mortgages in Swisher County
Real Estate and Mortgage Overview in Swisher County
| Characteristic | Without Mortgage | With Mortgage |
| Housing Units | 1,156 | 492 |
| Median Property Value | $67,400 | $123,700 |
| Median Household Income | $34,375 | $54 |
| Monthly Housing Costs | $396 | $28 |
| Real Estate Taxes | $1,000 | $13 |
Property Value by Mortgage Status in Swisher County
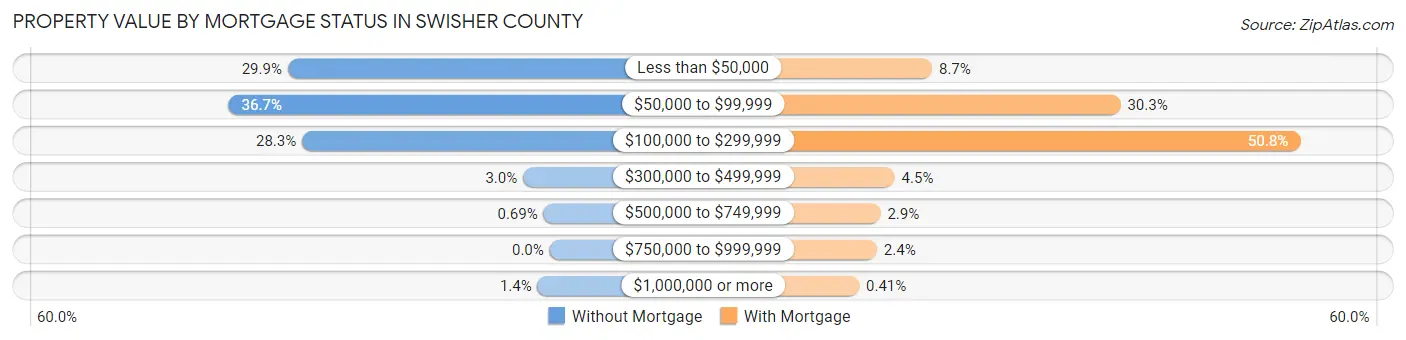
| Property Value | Without Mortgage | With Mortgage |
| Less than $50,000 | 346 (29.9%) | 43 (8.7%) |
| $50,000 to $99,999 | 424 (36.7%) | 149 (30.3%) |
| $100,000 to $299,999 | 327 (28.3%) | 250 (50.8%) |
| $300,000 to $499,999 | 35 (3.0%) | 22 (4.5%) |
| $500,000 to $749,999 | 8 (0.7%) | 14 (2.9%) |
| $750,000 to $999,999 | 0 (0.0%) | 12 (2.4%) |
| $1,000,000 or more | 16 (1.4%) | 2 (0.4%) |
| Total | 1,156 (100.0%) | 492 (100.0%) |
Household Income by Mortgage Status in Swisher County
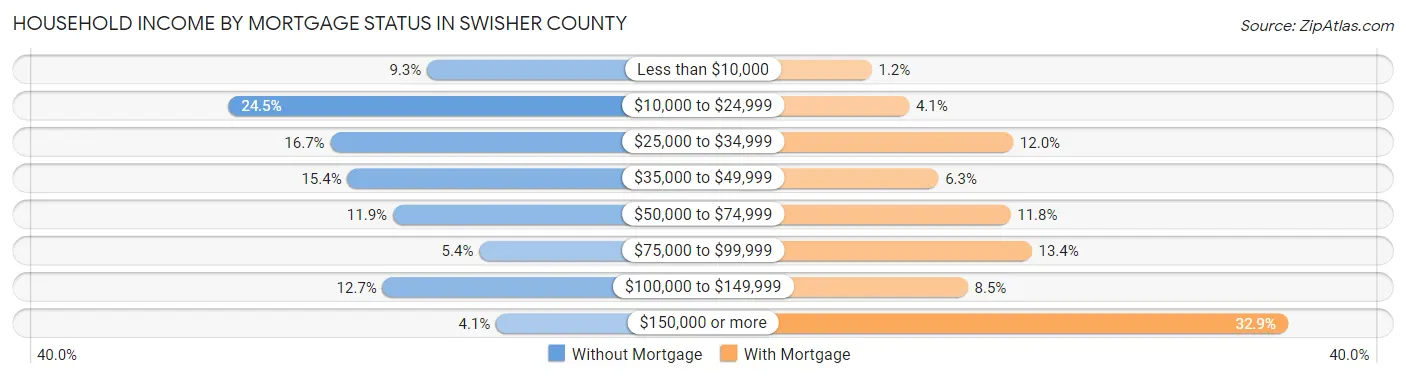
| Household Income | Without Mortgage | With Mortgage |
| Less than $10,000 | 108 (9.3%) | 6 (1.2%) |
| $10,000 to $24,999 | 283 (24.5%) | 20 (4.1%) |
| $25,000 to $34,999 | 193 (16.7%) | 59 (12.0%) |
| $35,000 to $49,999 | 178 (15.4%) | 31 (6.3%) |
| $50,000 to $74,999 | 138 (11.9%) | 58 (11.8%) |
| $75,000 to $99,999 | 62 (5.4%) | 66 (13.4%) |
| $100,000 to $149,999 | 147 (12.7%) | 42 (8.5%) |
| $150,000 or more | 47 (4.1%) | 162 (32.9%) |
| Total | 1,156 (100.0%) | 492 (100.0%) |
Property Value to Household Income Ratio in Swisher County
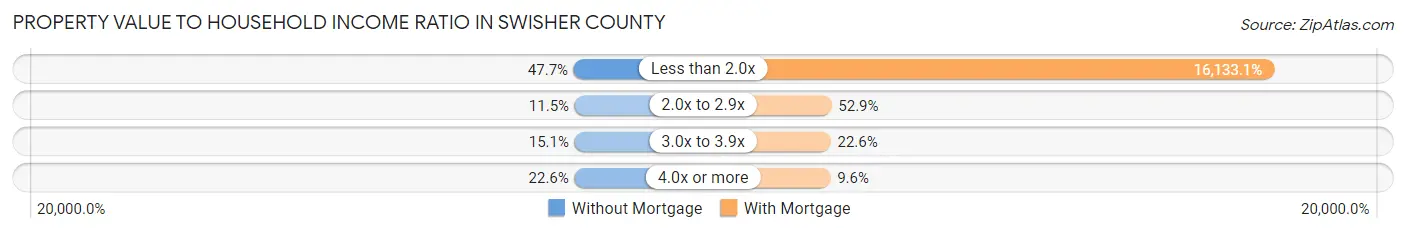
| Value-to-Income Ratio | Without Mortgage | With Mortgage |
| Less than 2.0x | 551 (47.7%) | 79,375 (16,133.1%) |
| 2.0x to 2.9x | 133 (11.5%) | 260 (52.8%) |
| 3.0x to 3.9x | 175 (15.1%) | 111 (22.6%) |
| 4.0x or more | 261 (22.6%) | 47 (9.6%) |
| Total | 1,156 (100.0%) | 492 (100.0%) |
Real Estate Taxes by Mortgage Status in Swisher County
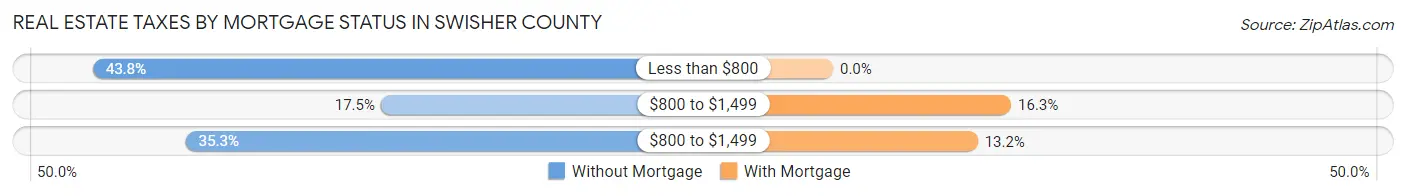
| Property Taxes | Without Mortgage | With Mortgage |
| Less than $800 | 506 (43.8%) | 0 (0.0%) |
| $800 to $1,499 | 202 (17.5%) | 80 (16.3%) |
| $800 to $1,499 | 408 (35.3%) | 65 (13.2%) |
| Total | 1,156 (100.0%) | 492 (100.0%) |
Health & Disability in Swisher County
Health Insurance Coverage by Age in Swisher County
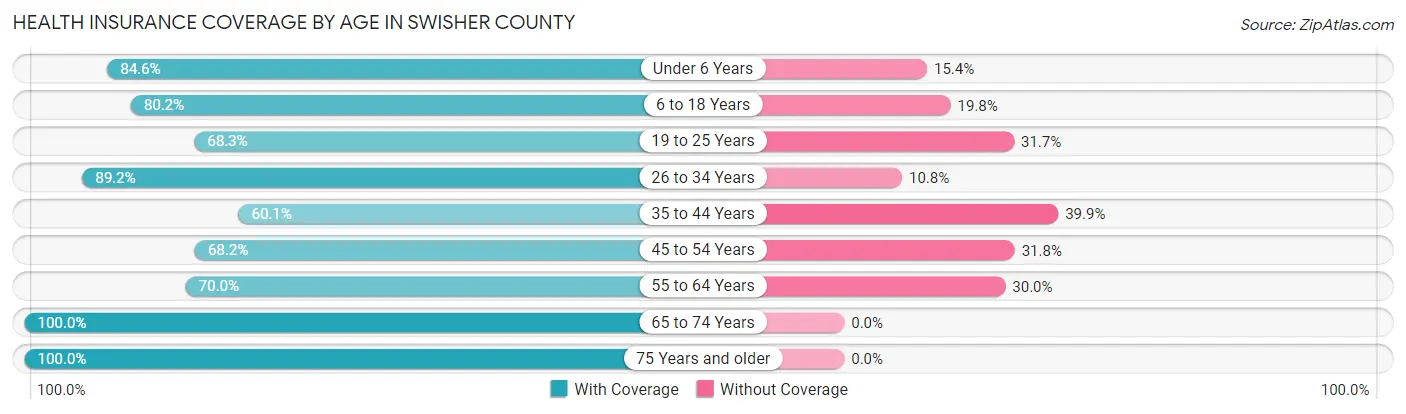
| Age Bracket | With Coverage | Without Coverage |
| Under 6 Years | 411 (84.6%) | 75 (15.4%) |
| 6 to 18 Years | 1,044 (80.2%) | 258 (19.8%) |
| 19 to 25 Years | 462 (68.3%) | 214 (31.7%) |
| 26 to 34 Years | 663 (89.2%) | 80 (10.8%) |
| 35 to 44 Years | 363 (60.1%) | 241 (39.9%) |
| 45 to 54 Years | 438 (68.2%) | 204 (31.8%) |
| 55 to 64 Years | 531 (70.0%) | 228 (30.0%) |
| 65 to 74 Years | 715 (100.0%) | 0 (0.0%) |
| 75 Years and older | 439 (100.0%) | 0 (0.0%) |
| Total | 5,066 (79.6%) | 1,300 (20.4%) |
Health Insurance Coverage by Citizenship Status in Swisher County
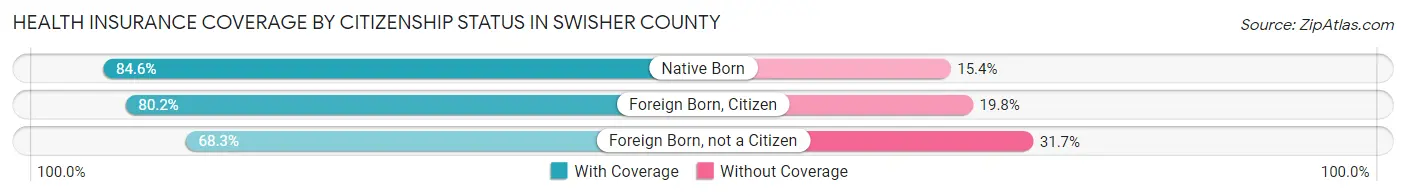
| Citizenship Status | With Coverage | Without Coverage |
| Native Born | 411 (84.6%) | 75 (15.4%) |
| Foreign Born, Citizen | 1,044 (80.2%) | 258 (19.8%) |
| Foreign Born, not a Citizen | 462 (68.3%) | 214 (31.7%) |
Health Insurance Coverage by Household Income in Swisher County
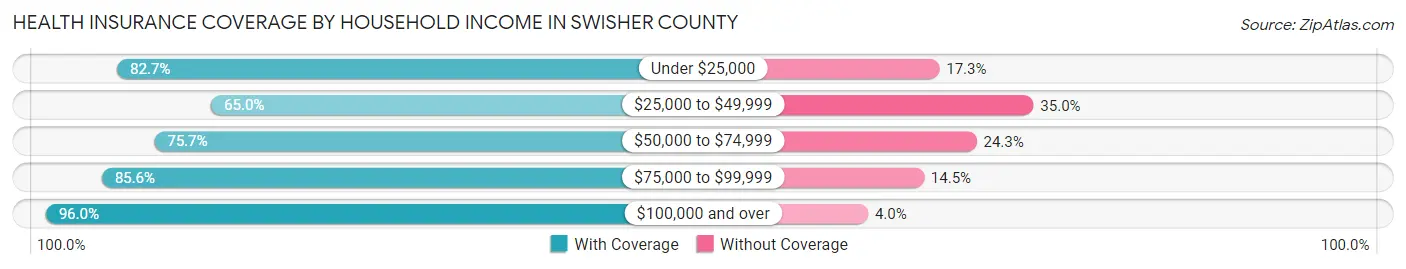
| Household Income | With Coverage | Without Coverage |
| Under $25,000 | 1,102 (82.7%) | 231 (17.3%) |
| $25,000 to $49,999 | 1,293 (65.0%) | 695 (35.0%) |
| $50,000 to $74,999 | 607 (75.7%) | 195 (24.3%) |
| $75,000 to $99,999 | 651 (85.6%) | 110 (14.4%) |
| $100,000 and over | 1,404 (96.0%) | 58 (4.0%) |
Public vs Private Health Insurance Coverage by Age in Swisher County
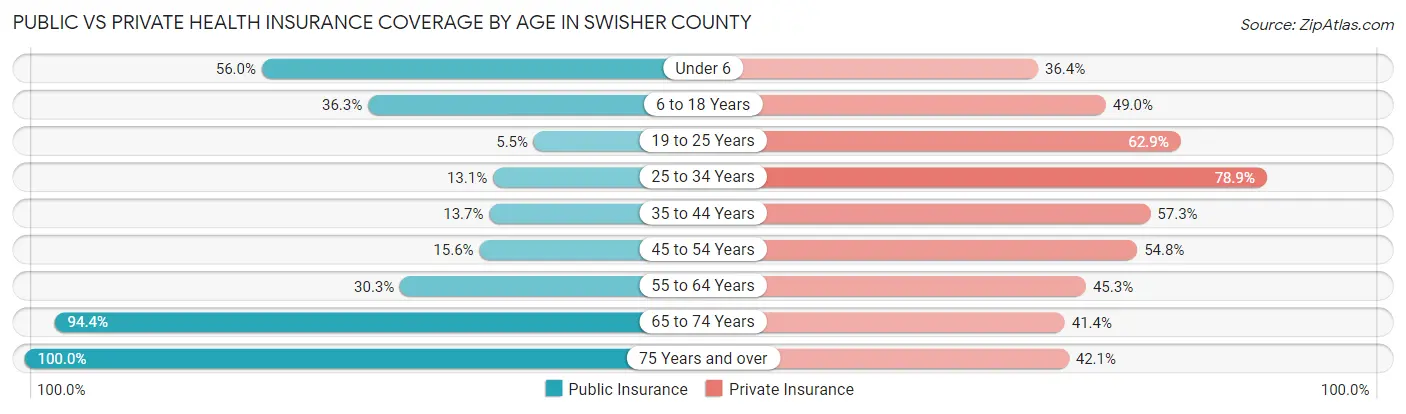
| Age Bracket | Public Insurance | Private Insurance |
| Under 6 | 272 (56.0%) | 177 (36.4%) |
| 6 to 18 Years | 472 (36.2%) | 638 (49.0%) |
| 19 to 25 Years | 37 (5.5%) | 425 (62.9%) |
| 25 to 34 Years | 97 (13.1%) | 586 (78.9%) |
| 35 to 44 Years | 83 (13.7%) | 346 (57.3%) |
| 45 to 54 Years | 100 (15.6%) | 352 (54.8%) |
| 55 to 64 Years | 230 (30.3%) | 344 (45.3%) |
| 65 to 74 Years | 675 (94.4%) | 296 (41.4%) |
| 75 Years and over | 439 (100.0%) | 185 (42.1%) |
| Total | 2,405 (37.8%) | 3,349 (52.6%) |
Disability Status by Sex by Age in Swisher County
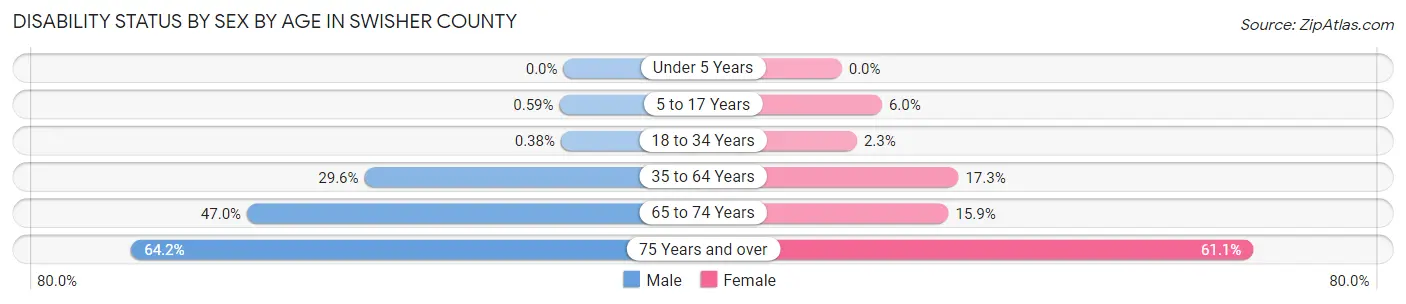
| Age Bracket | Male | Female |
| Under 5 Years | 0 (0.0%) | 0 (0.0%) |
| 5 to 17 Years | 4 (0.6%) | 39 (6.0%) |
| 18 to 34 Years | 3 (0.4%) | 15 (2.2%) |
| 35 to 64 Years | 294 (29.5%) | 175 (17.3%) |
| 65 to 74 Years | 164 (47.0%) | 58 (15.9%) |
| 75 Years and over | 102 (64.1%) | 171 (61.1%) |
Disability Class by Sex by Age in Swisher County
Disability Class: Hearing Difficulty
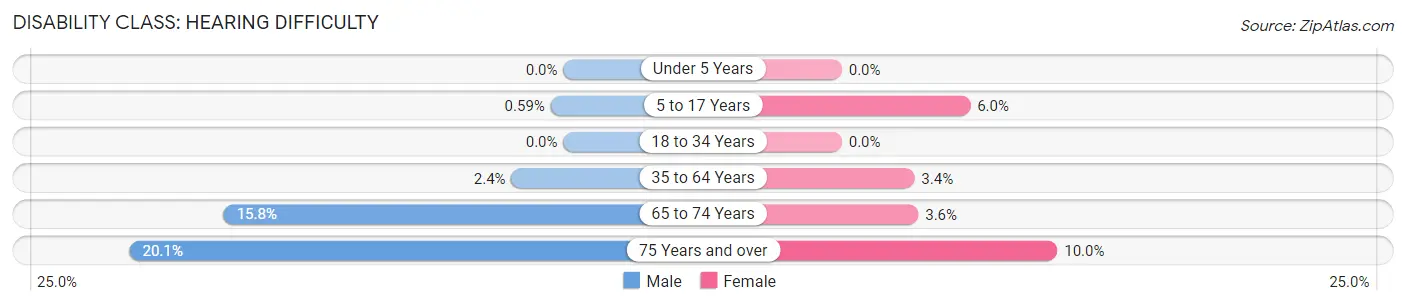
| Age Bracket | Male | Female |
| Under 5 Years | 0 (0.0%) | 0 (0.0%) |
| 5 to 17 Years | 4 (0.6%) | 39 (6.0%) |
| 18 to 34 Years | 0 (0.0%) | 0 (0.0%) |
| 35 to 64 Years | 24 (2.4%) | 34 (3.4%) |
| 65 to 74 Years | 55 (15.8%) | 13 (3.5%) |
| 75 Years and over | 32 (20.1%) | 28 (10.0%) |
Disability Class: Vision Difficulty
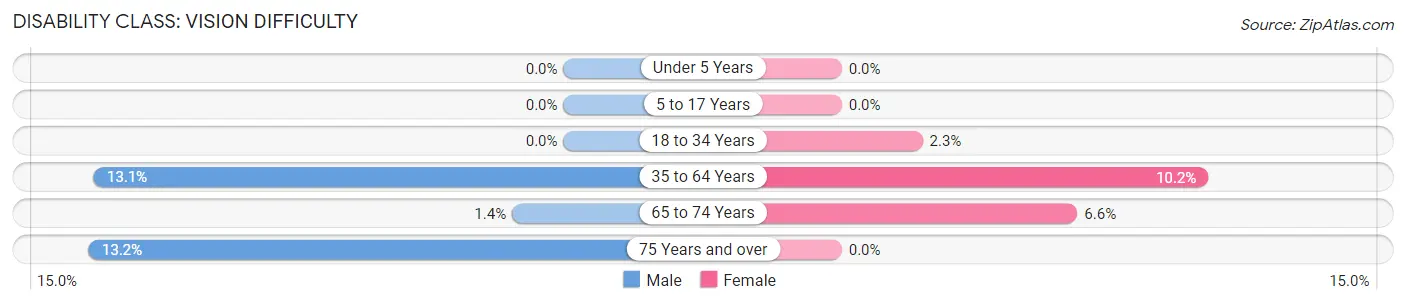
| Age Bracket | Male | Female |
| Under 5 Years | 0 (0.0%) | 0 (0.0%) |
| 5 to 17 Years | 0 (0.0%) | 0 (0.0%) |
| 18 to 34 Years | 0 (0.0%) | 15 (2.2%) |
| 35 to 64 Years | 130 (13.1%) | 103 (10.2%) |
| 65 to 74 Years | 5 (1.4%) | 24 (6.6%) |
| 75 Years and over | 21 (13.2%) | 0 (0.0%) |
Disability Class: Cognitive Difficulty
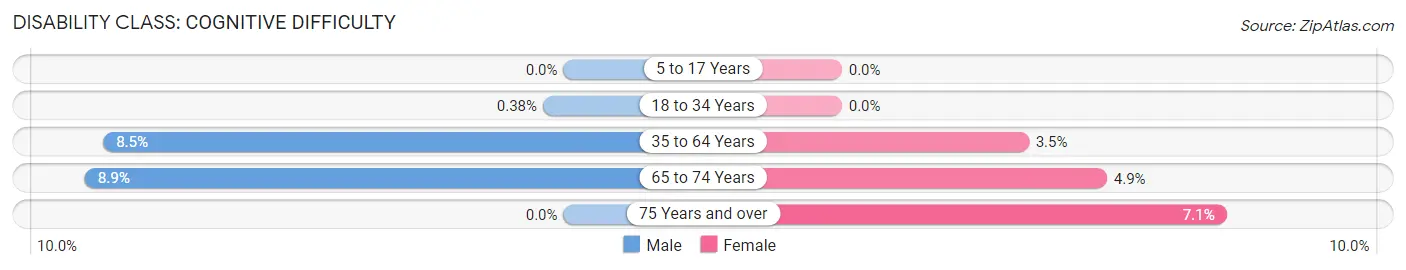
| Age Bracket | Male | Female |
| 5 to 17 Years | 0 (0.0%) | 0 (0.0%) |
| 18 to 34 Years | 3 (0.4%) | 0 (0.0%) |
| 35 to 64 Years | 85 (8.5%) | 35 (3.5%) |
| 65 to 74 Years | 31 (8.9%) | 18 (4.9%) |
| 75 Years and over | 0 (0.0%) | 20 (7.1%) |
Disability Class: Ambulatory Difficulty
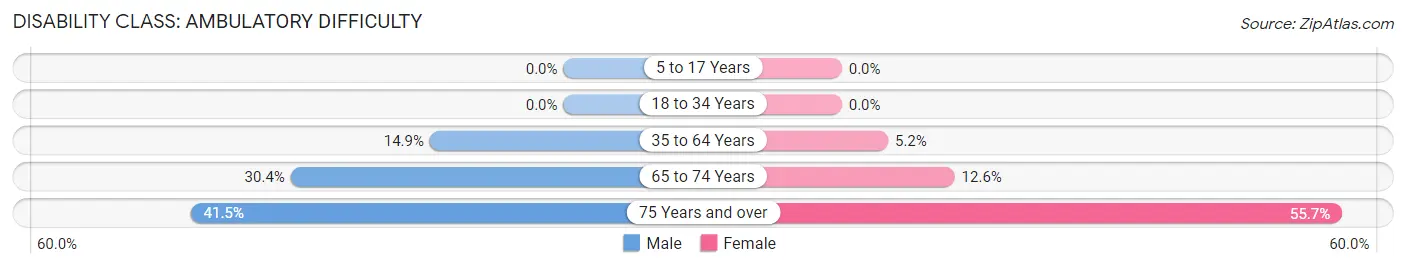
| Age Bracket | Male | Female |
| 5 to 17 Years | 0 (0.0%) | 0 (0.0%) |
| 18 to 34 Years | 0 (0.0%) | 0 (0.0%) |
| 35 to 64 Years | 148 (14.9%) | 52 (5.1%) |
| 65 to 74 Years | 106 (30.4%) | 46 (12.6%) |
| 75 Years and over | 66 (41.5%) | 156 (55.7%) |
Disability Class: Self-Care Difficulty
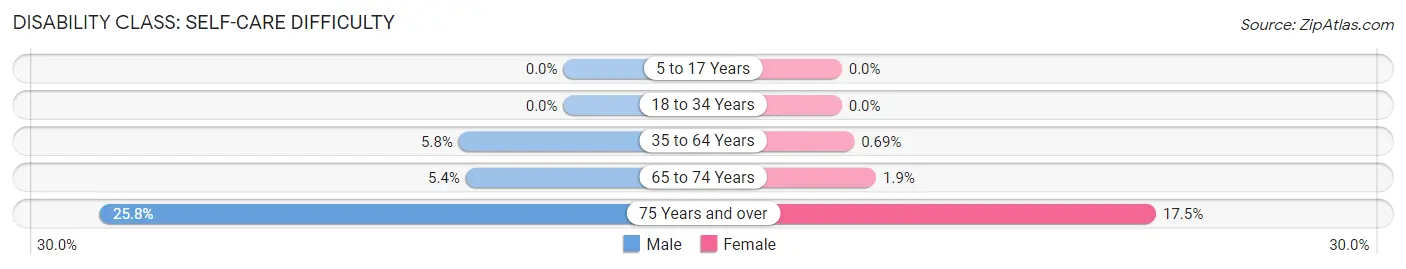
| Age Bracket | Male | Female |
| 5 to 17 Years | 0 (0.0%) | 0 (0.0%) |
| 18 to 34 Years | 0 (0.0%) | 0 (0.0%) |
| 35 to 64 Years | 58 (5.8%) | 7 (0.7%) |
| 65 to 74 Years | 19 (5.4%) | 7 (1.9%) |
| 75 Years and over | 41 (25.8%) | 49 (17.5%) |
Technology Access in Swisher County
Computing Device Access in Swisher County
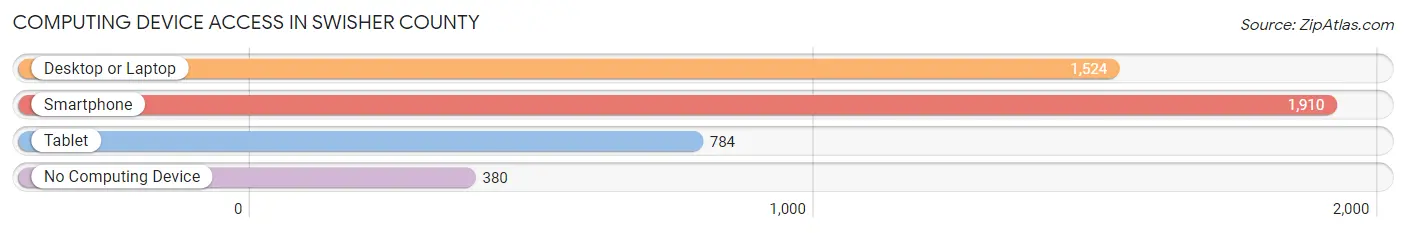
| Device Type | # Households | % Households |
| Desktop or Laptop | 1,524 | 63.5% |
| Smartphone | 1,910 | 79.5% |
| Tablet | 784 | 32.7% |
| No Computing Device | 380 | 15.8% |
| Total | 2,401 | 100.0% |
Internet Access in Swisher County
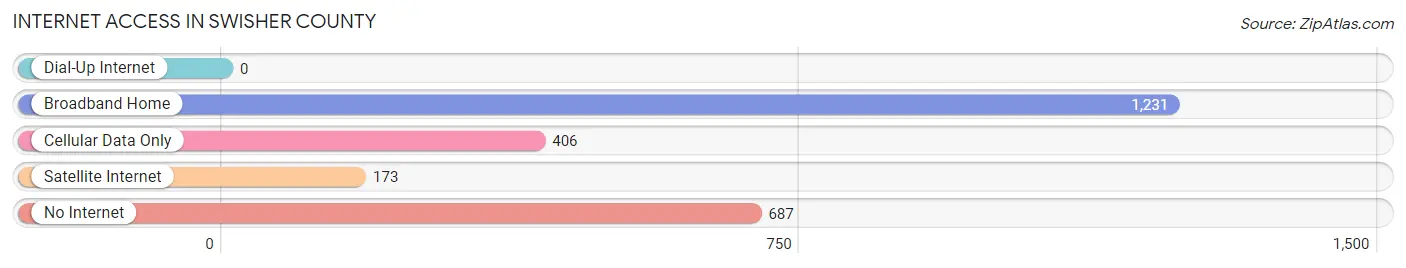
| Internet Type | # Households | % Households |
| Dial-Up Internet | 0 | 0.0% |
| Broadband Home | 1,231 | 51.3% |
| Cellular Data Only | 406 | 16.9% |
| Satellite Internet | 173 | 7.2% |
| No Internet | 687 | 28.6% |
| Total | 2,401 | 100.0% |
Swisher County Summary
Swisher County is located in the Texas Panhandle, in the northern part of the state. It is bordered by Deaf Smith County to the north, Randall County to the east, Castro County to the south, and Parmer County to the west. The county seat is Tulia, and the largest city is Happy. The county was named for James G. Swisher, a signer of the Texas Declaration of Independence.
History
Swisher County was established in 1876 from portions of Bexar County and Young County. The county was named for James G. Swisher, a signer of the Texas Declaration of Independence. The first settlers in the area were ranchers, who were attracted by the abundance of grass and water. The first town in the county was Tulia, which was founded in 1887.
In the early 1900s, the area experienced a boom in cotton production, and the population of the county grew rapidly. The Santa Fe Railroad was built through the county in 1908, and the town of Happy was founded in 1909. The county continued to grow throughout the 20th century, and by 2000, the population had reached 8,845.
Geography
Swisher County is located in the Texas Panhandle, in the northern part of the state. It is bordered by Deaf Smith County to the north, Randall County to the east, Castro County to the south, and Parmer County to the west. The county covers an area of 902 square miles, and is mostly flat, with some rolling hills. The county is drained by the Canadian River and its tributaries.
The climate of Swisher County is semi-arid, with hot summers and mild winters. The average annual temperature is 64°F, and the average annual precipitation is 19 inches.
Economy
Agriculture is the main economic activity in Swisher County. The county is a major producer of cotton, wheat, sorghum, and hay. Cattle and sheep are also raised in the area.
The county is also home to several oil and gas fields, and there are several oil and gas related businesses in the area. The county is served by the Santa Fe Railroad, and there are several trucking companies in the area.
Demographics
As of the 2010 census, there were 7,854 people, 2,845 households, and 2,039 families living in the county. The population density was 8.7 people per square mile. The racial makeup of the county was 79.2% White, 0.7% African American, 0.7% Native American, 0.2% Asian, 16.7% from other races, and 2.5% from two or more races. Hispanic or Latino of any race were 37.2% of the population.
The median income for a household in the county was $35,938, and the median income for a family was $41,944. The per capita income for the county was $17,845. About 17.2% of families and 21.2% of the population were below the poverty line, including 28.2% of those under age 18 and 14.2% of those age 65 or over.
Common Questions
What is Per Capita Income in Swisher County?
Per Capita income in Swisher County is $21,371.
What is the Median Family Income in Swisher County?
Median Family Income in Swisher County is $53,895.
What is the Median Household income in Swisher County?
Median Household Income in Swisher County is $40,290.
What is Income or Wage Gap in Swisher County?
Income or Wage Gap in Swisher County is 43.2%.
Women in Swisher County earn 56.8 cents for every dollar earned by a man.
What is Family Income Deficit in Swisher County?
Family Income Deficit in Swisher County is $9,896.
Families that are below poverty line in Swisher County earn $9,896 less on average than the poverty threshold level.
What is Inequality or Gini Index in Swisher County?
Inequality or Gini Index in Swisher County is 0.48.
What is the Total Population of Swisher County?
Total Population of Swisher County is 6,989.
What is the Total Male Population of Swisher County?
Total Male Population of Swisher County is 3,848.
What is the Total Female Population of Swisher County?
Total Female Population of Swisher County is 3,141.
What is the Ratio of Males per 100 Females in Swisher County?
There are 122.51 Males per 100 Females in Swisher County.
What is the Ratio of Females per 100 Males in Swisher County?
There are 81.63 Females per 100 Males in Swisher County.
What is the Median Population Age in Swisher County?
Median Population Age in Swisher County is 35.9 Years.
What is the Average Family Size in Swisher County
Average Family Size in Swisher County is 3.5 People.
What is the Average Household Size in Swisher County
Average Household Size in Swisher County is 2.6 People.
How Large is the Labor Force in Swisher County?
There are 2,811 People in the Labor Forcein in Swisher County.
What is the Percentage of People in the Labor Force in Swisher County?
51.9% of People are in the Labor Force in Swisher County.
What is the Unemployment Rate in Swisher County?
Unemployment Rate in Swisher County is 5.2%.