Sutton County, TX Map & Demographics
Sutton County Map
Sutton County Overview
$22,836
PER CAPITA INCOME
$57,113
AVG FAMILY INCOME
$56,778
AVG HOUSEHOLD INCOME
64.9%
WAGE / INCOME GAP [ % ]
35.1¢/ $1
WAGE / INCOME GAP [ $ ]
0.41
INEQUALITY / GINI INDEX
3,345
TOTAL POPULATION
1,651
MALE POPULATION
1,694
FEMALE POPULATION
97.46
MALES / 100 FEMALES
102.60
FEMALES / 100 MALES
31.3
MEDIAN AGE
3.6
AVG FAMILY SIZE
3.1
AVG HOUSEHOLD SIZE
1,501
LABOR FORCE [ PEOPLE ]
65.4%
PERCENT IN LABOR FORCE
4.7%
UNEMPLOYMENT RATE
Sutton County Area Codes
Income in Sutton County
Income Overview in Sutton County
Per Capita Income in Sutton County is $22,836, while median incomes of families and households are $57,113 and $56,778 respectively.
| Characteristic | Number | Measure |
| Per Capita Income | 3,345 | $22,836 |
| Median Family Income | 845 | $57,113 |
| Mean Family Income | 845 | $71,001 |
| Median Household Income | 1,068 | $56,778 |
| Mean Household Income | 1,068 | $69,544 |
| Income Deficit | 845 | $0 |
| Wage / Income Gap (%) | 3,345 | 64.92% |
| Wage / Income Gap ($) | 3,345 | 35.08¢ per $1 |
| Gini / Inequality Index | 3,345 | 0.41 |
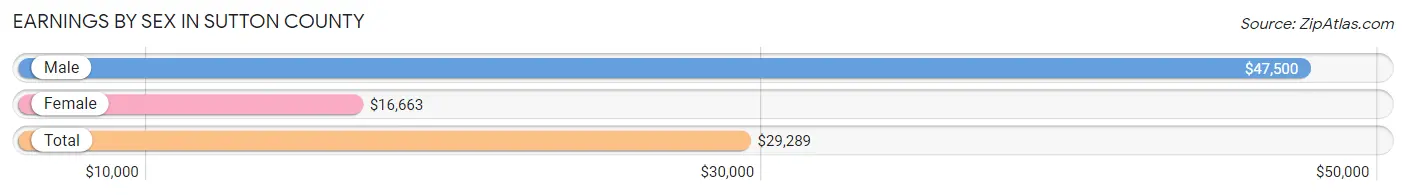
Earnings by Sex in Sutton County
Average Earnings in Sutton County are $29,289, $47,500 for men and $16,663 for women, a difference of 64.9%.
| Sex | Number | Average Earnings |
| Male | 730 (47.1%) | $47,500 |
| Female | 821 (52.9%) | $16,663 |
| Total | 1,551 (100.0%) | $29,289 |
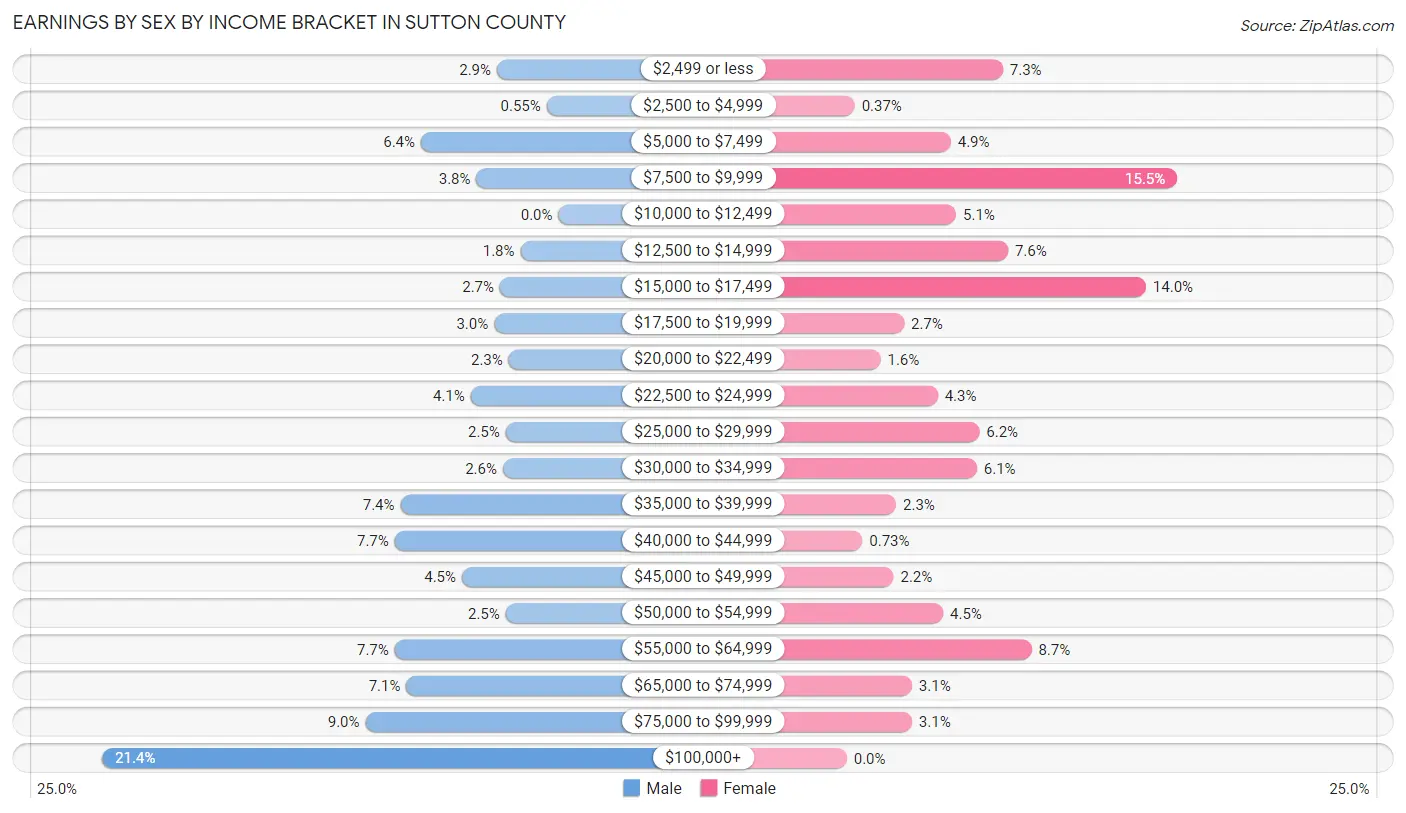
Earnings by Sex by Income Bracket in Sutton County
The most common earnings brackets in Sutton County are $100,000+ for men (156 | 21.4%) and $7,500 to $9,999 for women (127 | 15.5%).
| Income | Male | Female |
| $2,499 or less | 21 (2.9%) | 60 (7.3%) |
| $2,500 to $4,999 | 4 (0.5%) | 3 (0.4%) |
| $5,000 to $7,499 | 47 (6.4%) | 40 (4.9%) |
| $7,500 to $9,999 | 28 (3.8%) | 127 (15.5%) |
| $10,000 to $12,499 | 0 (0.0%) | 42 (5.1%) |
| $12,500 to $14,999 | 13 (1.8%) | 62 (7.5%) |
| $15,000 to $17,499 | 20 (2.7%) | 115 (14.0%) |
| $17,500 to $19,999 | 22 (3.0%) | 22 (2.7%) |
| $20,000 to $22,499 | 17 (2.3%) | 13 (1.6%) |
| $22,500 to $24,999 | 30 (4.1%) | 35 (4.3%) |
| $25,000 to $29,999 | 18 (2.5%) | 51 (6.2%) |
| $30,000 to $34,999 | 19 (2.6%) | 50 (6.1%) |
| $35,000 to $39,999 | 54 (7.4%) | 19 (2.3%) |
| $40,000 to $44,999 | 56 (7.7%) | 6 (0.7%) |
| $45,000 to $49,999 | 33 (4.5%) | 18 (2.2%) |
| $50,000 to $54,999 | 18 (2.5%) | 37 (4.5%) |
| $55,000 to $64,999 | 56 (7.7%) | 71 (8.6%) |
| $65,000 to $74,999 | 52 (7.1%) | 25 (3.0%) |
| $75,000 to $99,999 | 66 (9.0%) | 25 (3.0%) |
| $100,000+ | 156 (21.4%) | 0 (0.0%) |
| Total | 730 (100.0%) | 821 (100.0%) |
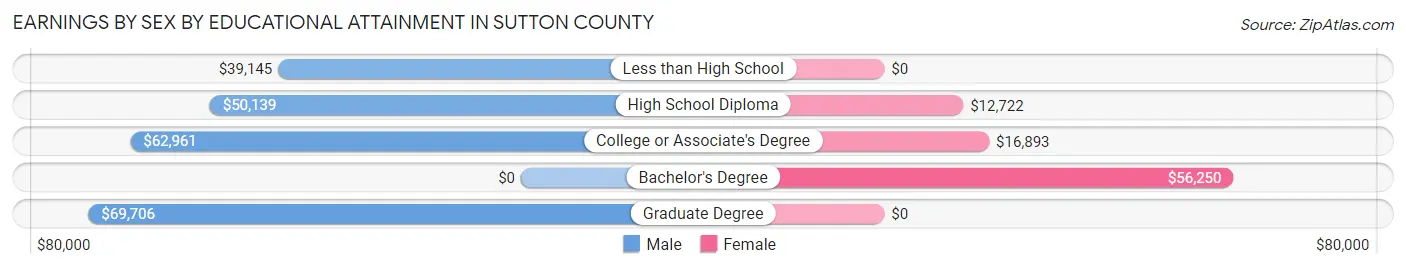
Earnings by Sex by Educational Attainment in Sutton County
Average earnings in Sutton County are $57,601 for men and $16,967 for women, a difference of 70.5%. Men with an educational attainment of graduate degree enjoy the highest average annual earnings of $69,706, while those with less than high school education earn the least with $39,145. Women with an educational attainment of bachelor's degree earn the most with the average annual earnings of $56,250, while those with high school diploma education have the smallest earnings of $12,722.
| Educational Attainment | Male Income | Female Income |
| Less than High School | $39,145 | $0 |
| High School Diploma | $50,139 | $12,722 |
| College or Associate's Degree | $62,961 | $16,893 |
| Bachelor's Degree | - | - |
| Graduate Degree | $69,706 | $0 |
| Total | $57,601 | $16,967 |
Family Income in Sutton County
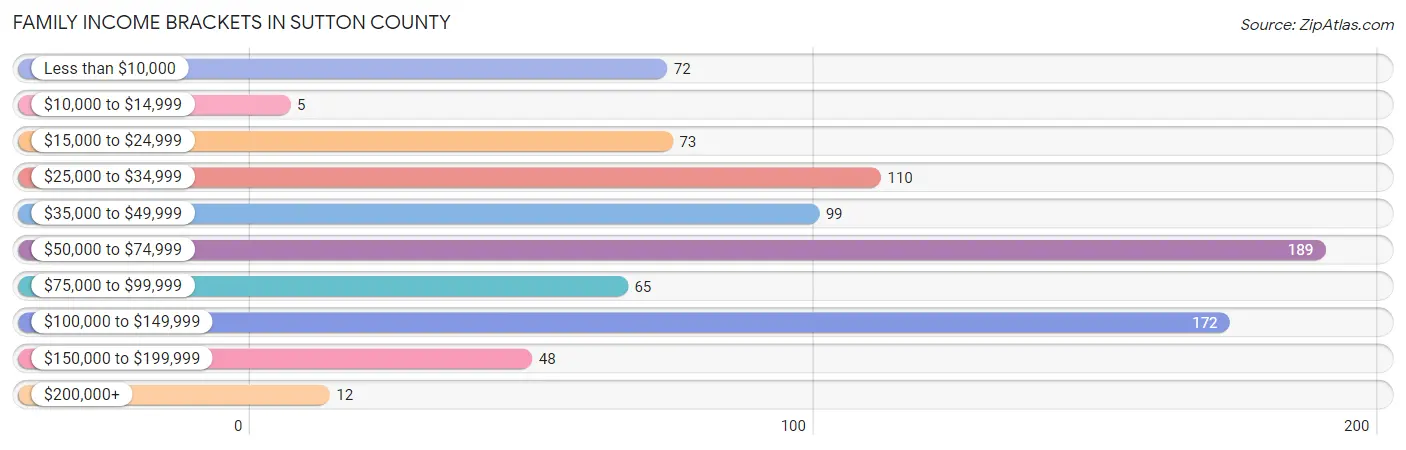
Family Income Brackets in Sutton County
According to the Sutton County family income data, there are 189 families falling into the $50,000 to $74,999 income range, which is the most common income bracket and makes up 22.4% of all families. Conversely, the $10,000 to $14,999 income bracket is the least frequent group with only 5 families (0.6%) belonging to this category.
| Income Bracket | # Families | % Families |
| Less than $10,000 | 72 | 8.5% |
| $10,000 to $14,999 | 5 | 0.6% |
| $15,000 to $24,999 | 73 | 8.6% |
| $25,000 to $34,999 | 110 | 13.0% |
| $35,000 to $49,999 | 99 | 11.7% |
| $50,000 to $74,999 | 189 | 22.4% |
| $75,000 to $99,999 | 65 | 7.7% |
| $100,000 to $149,999 | 172 | 20.4% |
| $150,000 to $199,999 | 48 | 5.7% |
| $200,000+ | 12 | 1.4% |
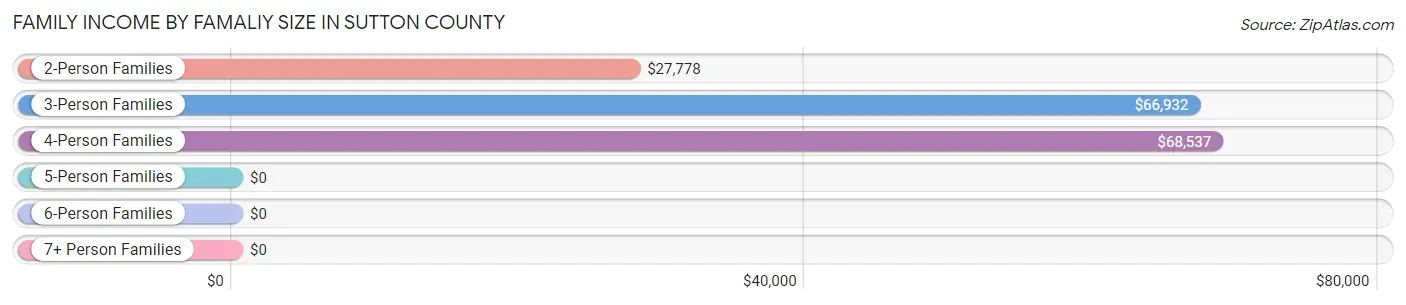
Family Income by Famaliy Size in Sutton County
4-person families (232 | 27.5%) account for the highest median family income in Sutton County with $68,537 per family, while 3-person families (153 | 18.1%) have the highest median income of $22,311 per family member.
| Income Bracket | # Families | Median Income |
| 2-Person Families | 308 (36.4%) | $27,778 |
| 3-Person Families | 153 (18.1%) | $66,932 |
| 4-Person Families | 232 (27.5%) | $68,537 |
| 5-Person Families | 152 (18.0%) | $0 |
| 6-Person Families | 0 (0.0%) | $0 |
| 7+ Person Families | 0 (0.0%) | $0 |
| Total | 845 (100.0%) | $57,113 |
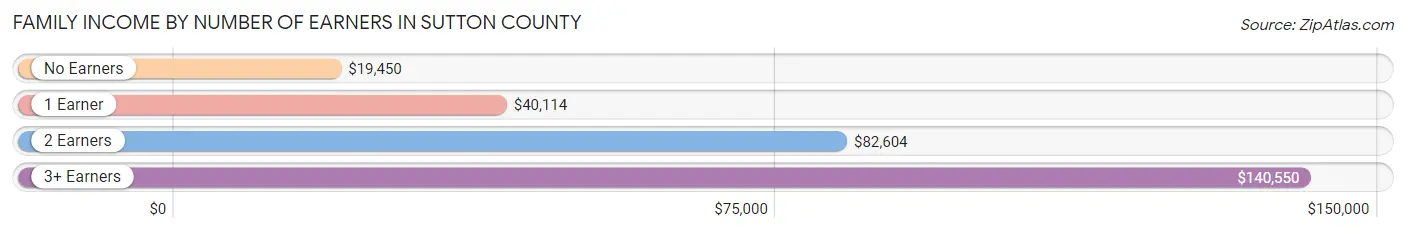
Family Income by Number of Earners in Sutton County
The median family income in Sutton County is $57,113, with families comprising 3+ earners (69) having the highest median family income of $140,550, while families with no earners (89) have the lowest median family income of $19,450, accounting for 8.2% and 10.5% of families, respectively.
| Number of Earners | # Families | Median Income |
| No Earners | 89 (10.5%) | $19,450 |
| 1 Earner | 352 (41.7%) | $40,114 |
| 2 Earners | 335 (39.6%) | $82,604 |
| 3+ Earners | 69 (8.2%) | $140,550 |
| Total | 845 (100.0%) | $57,113 |
Household Income in Sutton County
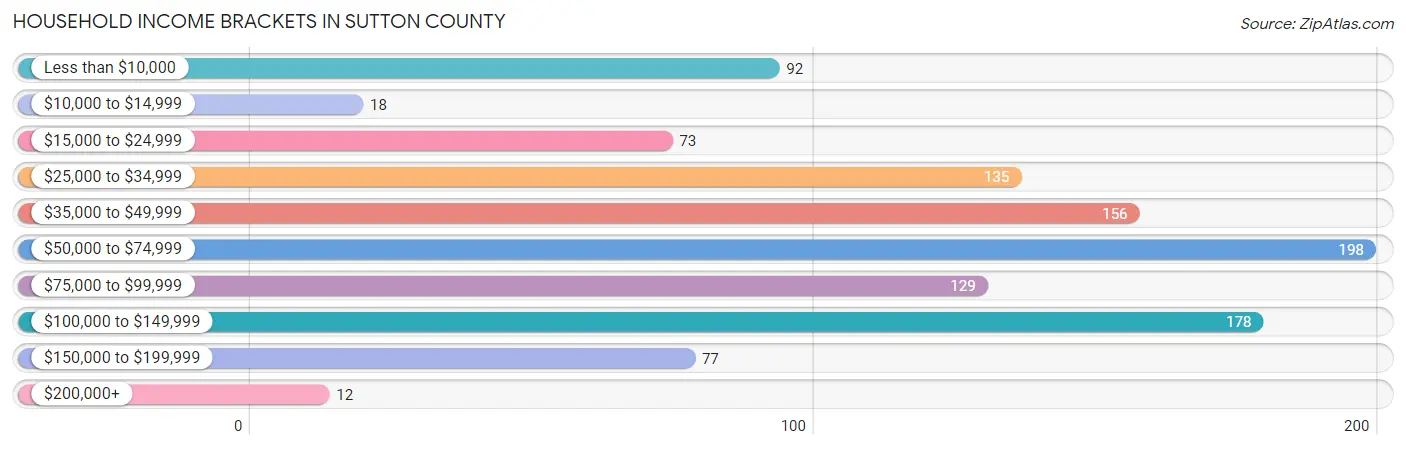
Household Income Brackets in Sutton County
With 198 households falling in the category, the $50,000 to $74,999 income range is the most frequent in Sutton County, accounting for 18.5% of all households. In contrast, only 12 households (1.1%) fall into the $200,000+ income bracket, making it the least populous group.
| Income Bracket | # Households | % Households |
| Less than $10,000 | 92 | 8.6% |
| $10,000 to $14,999 | 18 | 1.7% |
| $15,000 to $24,999 | 73 | 6.8% |
| $25,000 to $34,999 | 135 | 12.6% |
| $35,000 to $49,999 | 156 | 14.6% |
| $50,000 to $74,999 | 198 | 18.5% |
| $75,000 to $99,999 | 129 | 12.1% |
| $100,000 to $149,999 | 178 | 16.7% |
| $150,000 to $199,999 | 77 | 7.2% |
| $200,000+ | 12 | 1.1% |
Household Income by Householder Age in Sutton County
The median household income in Sutton County is $56,778, with the highest median household income of $74,300 found in the 45 to 64 years age bracket for the primary householder. A total of 336 households (31.5%) fall into this category. Meanwhile, the 15 to 24 years age bracket for the primary householder has the lowest median household income of $0, with 26 households (2.4%) in this group.
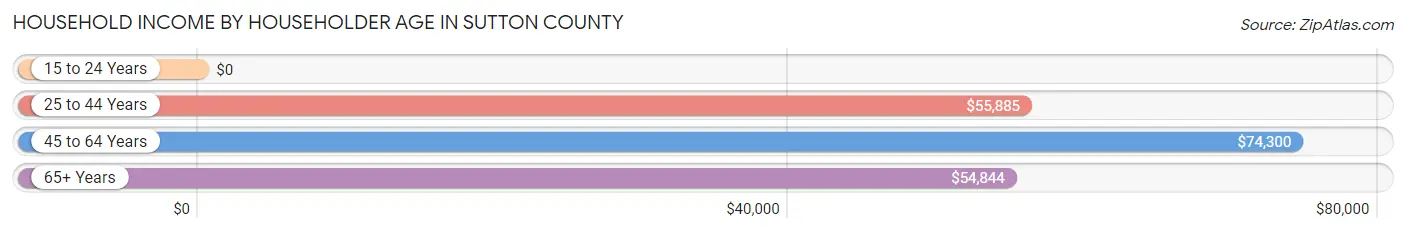
| Income Bracket | # Households | Median Income |
| 15 to 24 Years | 26 (2.4%) | $0 |
| 25 to 44 Years | 441 (41.3%) | $55,885 |
| 45 to 64 Years | 336 (31.5%) | $74,300 |
| 65+ Years | 265 (24.8%) | $54,844 |
| Total | 1,068 (100.0%) | $56,778 |
Poverty in Sutton County
Income Below Poverty by Sex and Age in Sutton County
With 14.0% poverty level for males and 19.1% for females among the residents of Sutton County, under 5 year old males and 5 year old females are the most vulnerable to poverty, with 49 males (46.7%) and 22 females (100.0%) in their respective age groups living below the poverty level.
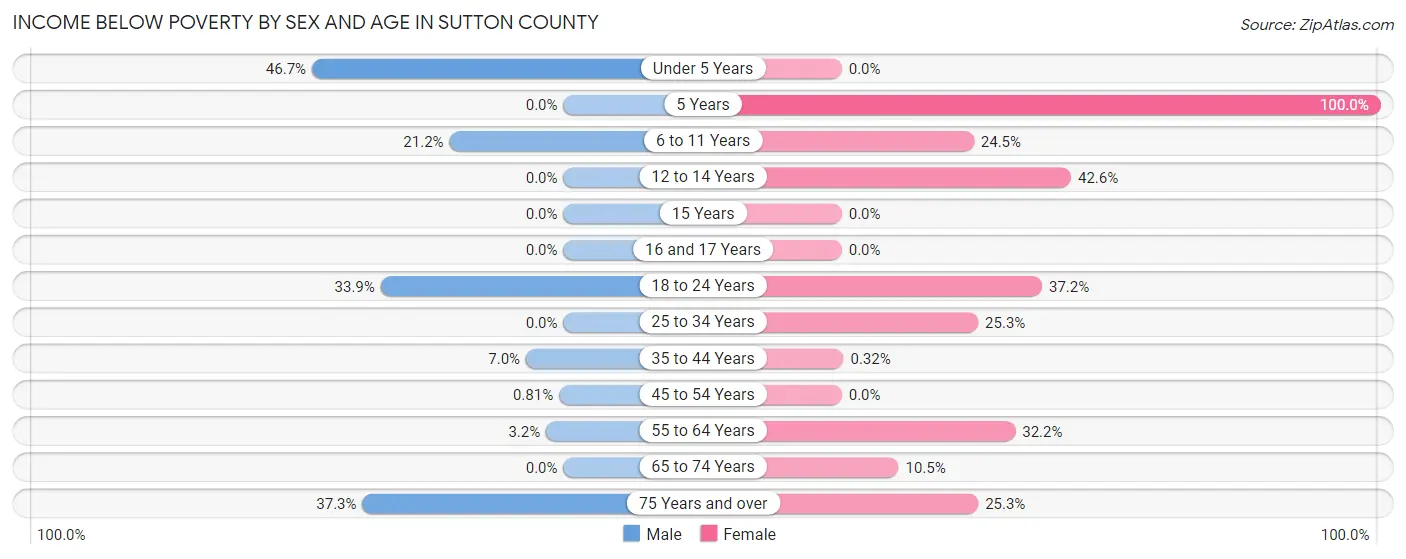
| Age Bracket | Male | Female |
| Under 5 Years | 49 (46.7%) | 0 (0.0%) |
| 5 Years | 0 (0.0%) | 22 (100.0%) |
| 6 to 11 Years | 77 (21.1%) | 62 (24.5%) |
| 12 to 14 Years | 0 (0.0%) | 40 (42.5%) |
| 15 Years | 0 (0.0%) | 0 (0.0%) |
| 16 and 17 Years | 0 (0.0%) | 0 (0.0%) |
| 18 to 24 Years | 58 (33.9%) | 42 (37.2%) |
| 25 to 34 Years | 0 (0.0%) | 82 (25.3%) |
| 35 to 44 Years | 13 (7.0%) | 1 (0.3%) |
| 45 to 54 Years | 1 (0.8%) | 0 (0.0%) |
| 55 to 64 Years | 5 (3.2%) | 38 (32.2%) |
| 65 to 74 Years | 0 (0.0%) | 16 (10.5%) |
| 75 Years and over | 25 (37.3%) | 20 (25.3%) |
| Total | 228 (14.0%) | 323 (19.1%) |
Income Above Poverty by Sex and Age in Sutton County
According to the poverty statistics in Sutton County, males aged 5 years and females aged under 5 years are the age groups that are most secure financially, with 100.0% of males and 100.0% of females in these age groups living above the poverty line.
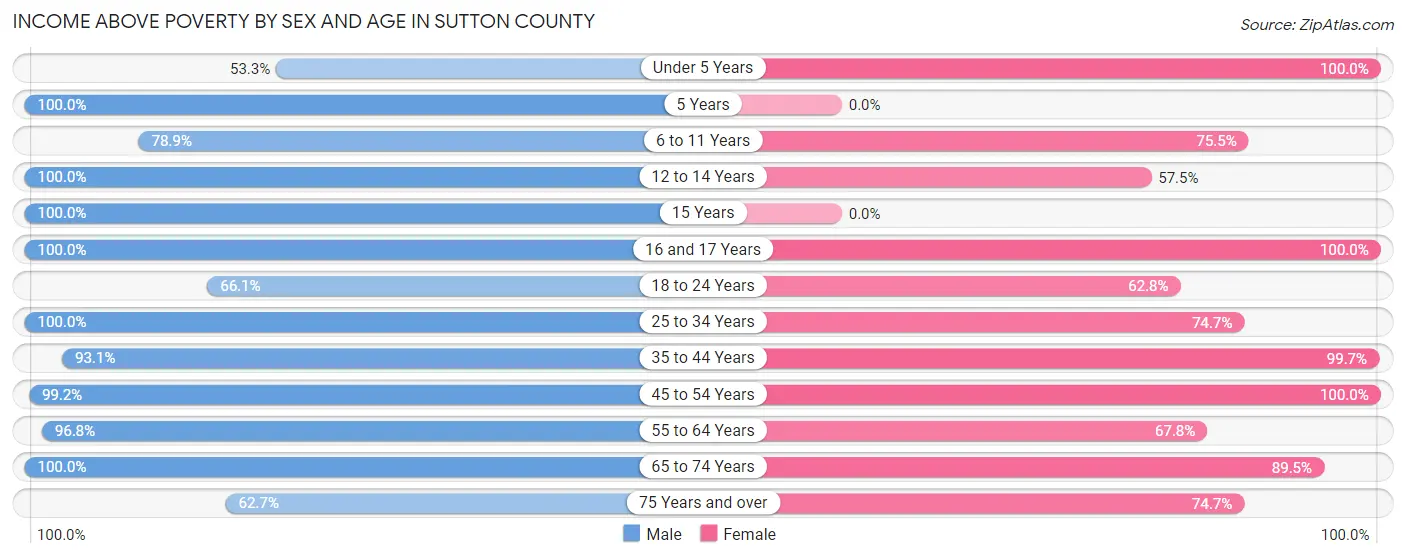
| Age Bracket | Male | Female |
| Under 5 Years | 56 (53.3%) | 78 (100.0%) |
| 5 Years | 51 (100.0%) | 0 (0.0%) |
| 6 to 11 Years | 287 (78.8%) | 191 (75.5%) |
| 12 to 14 Years | 67 (100.0%) | 54 (57.5%) |
| 15 Years | 16 (100.0%) | 0 (0.0%) |
| 16 and 17 Years | 18 (100.0%) | 16 (100.0%) |
| 18 to 24 Years | 113 (66.1%) | 71 (62.8%) |
| 25 to 34 Years | 163 (100.0%) | 242 (74.7%) |
| 35 to 44 Years | 174 (93.0%) | 307 (99.7%) |
| 45 to 54 Years | 123 (99.2%) | 136 (100.0%) |
| 55 to 64 Years | 151 (96.8%) | 80 (67.8%) |
| 65 to 74 Years | 144 (100.0%) | 136 (89.5%) |
| 75 Years and over | 42 (62.7%) | 59 (74.7%) |
| Total | 1,405 (86.0%) | 1,370 (80.9%) |
Income Below Poverty Among Married-Couple Families in Sutton County
The poverty statistics for married-couple families in Sutton County show that 0.8% or 5 of the total 592 families live below the poverty line. Families with no children have the highest poverty rate of 1.8%, comprising of 5 families. On the other hand, families with 1 or 2 children have the lowest poverty rate of 0.0%, which includes 0 families.
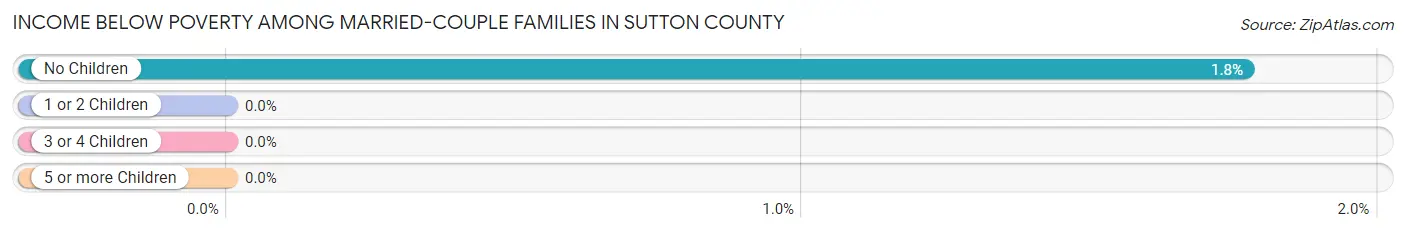
| Children | Above Poverty | Below Poverty |
| No Children | 277 (98.2%) | 5 (1.8%) |
| 1 or 2 Children | 259 (100.0%) | 0 (0.0%) |
| 3 or 4 Children | 51 (100.0%) | 0 (0.0%) |
| 5 or more Children | 0 (0.0%) | 0 (0.0%) |
| Total | 587 (99.2%) | 5 (0.8%) |
Income Below Poverty Among Single-Parent Households in Sutton County
According to the poverty data in Sutton County, 51.6% or 33 single-father households and 59.3% or 112 single-mother households are living below the poverty line. Among single-father households, those with no children have the highest poverty rate, with 33 households (100.0%) experiencing poverty. Likewise, among single-mother households, those with 3 or 4 children have the highest poverty rate, with 82 households (100.0%) falling below the poverty line.
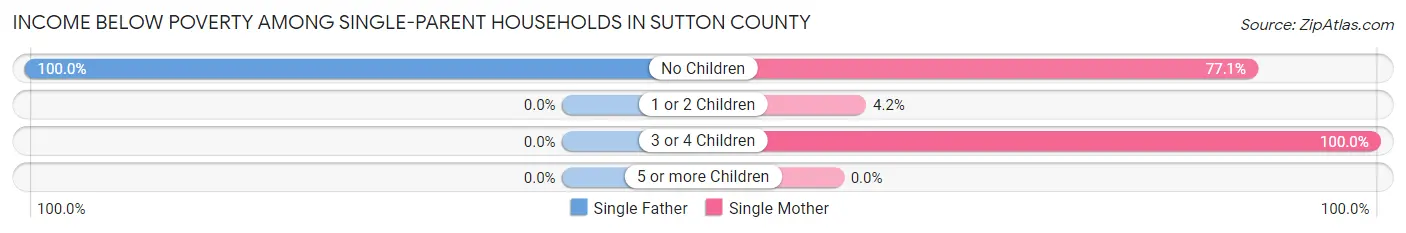
| Children | Single Father | Single Mother |
| No Children | 33 (100.0%) | 27 (77.1%) |
| 1 or 2 Children | 0 (0.0%) | 3 (4.2%) |
| 3 or 4 Children | 0 (0.0%) | 82 (100.0%) |
| 5 or more Children | 0 (0.0%) | 0 (0.0%) |
| Total | 33 (51.6%) | 112 (59.3%) |
Income Below Poverty Among Married-Couple vs Single-Parent Households in Sutton County
The poverty data for Sutton County shows that 5 of the married-couple family households (0.8%) and 145 of the single-parent households (57.3%) are living below the poverty level. Within the married-couple family households, those with no children have the highest poverty rate, with 5 households (1.8%) falling below the poverty line. Among the single-parent households, those with 3 or 4 children have the highest poverty rate, with 82 household (100.0%) living below poverty.
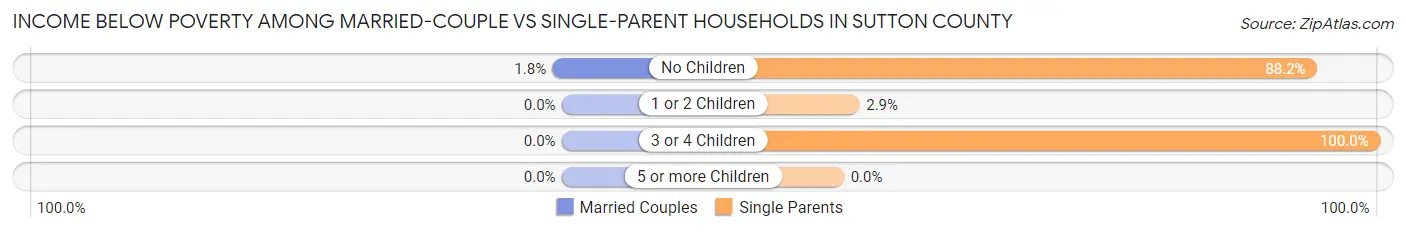
| Children | Married-Couple Families | Single-Parent Households |
| No Children | 5 (1.8%) | 60 (88.2%) |
| 1 or 2 Children | 0 (0.0%) | 3 (2.9%) |
| 3 or 4 Children | 0 (0.0%) | 82 (100.0%) |
| 5 or more Children | 0 (0.0%) | 0 (0.0%) |
| Total | 5 (0.8%) | 145 (57.3%) |
Race in Sutton County
The most populous races in Sutton County are Hispanic or Latino (2,496 | 74.6%), White / Caucasian (1,590 | 47.5%), and Some other Race (1,558 | 46.6%).
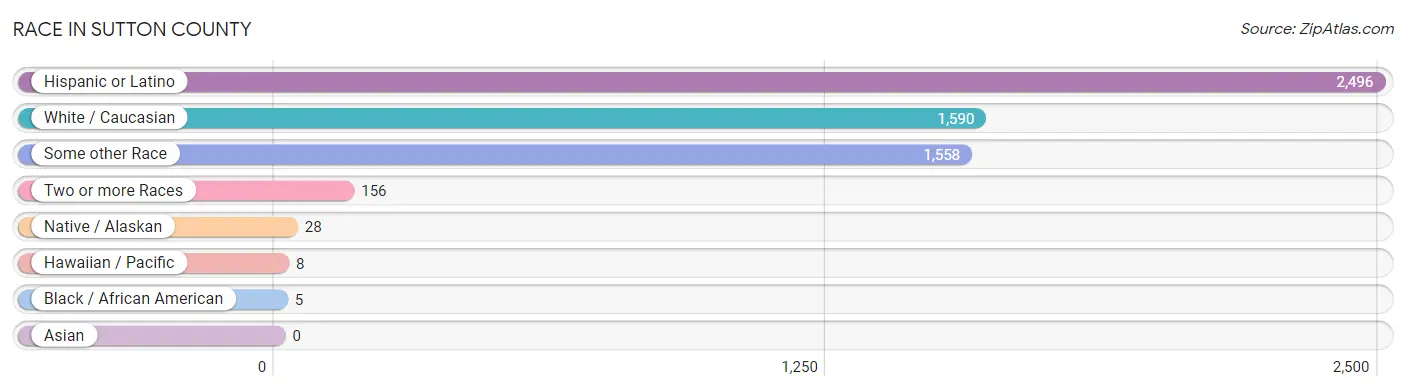
| Race | # Population | % Population |
| Asian | 0 | 0.0% |
| Black / African American | 5 | 0.2% |
| Hawaiian / Pacific | 8 | 0.2% |
| Hispanic or Latino | 2,496 | 74.6% |
| Native / Alaskan | 28 | 0.8% |
| White / Caucasian | 1,590 | 47.5% |
| Two or more Races | 156 | 4.7% |
| Some other Race | 1,558 | 46.6% |
| Total | 3,345 | 100.0% |
Ancestry in Sutton County
The most populous ancestries reported in Sutton County are Mexican (2,298 | 68.7%), Cuban (178 | 5.3%), Irish (107 | 3.2%), Italian (105 | 3.1%), and English (72 | 2.1%), together accounting for 82.5% of all Sutton County residents.
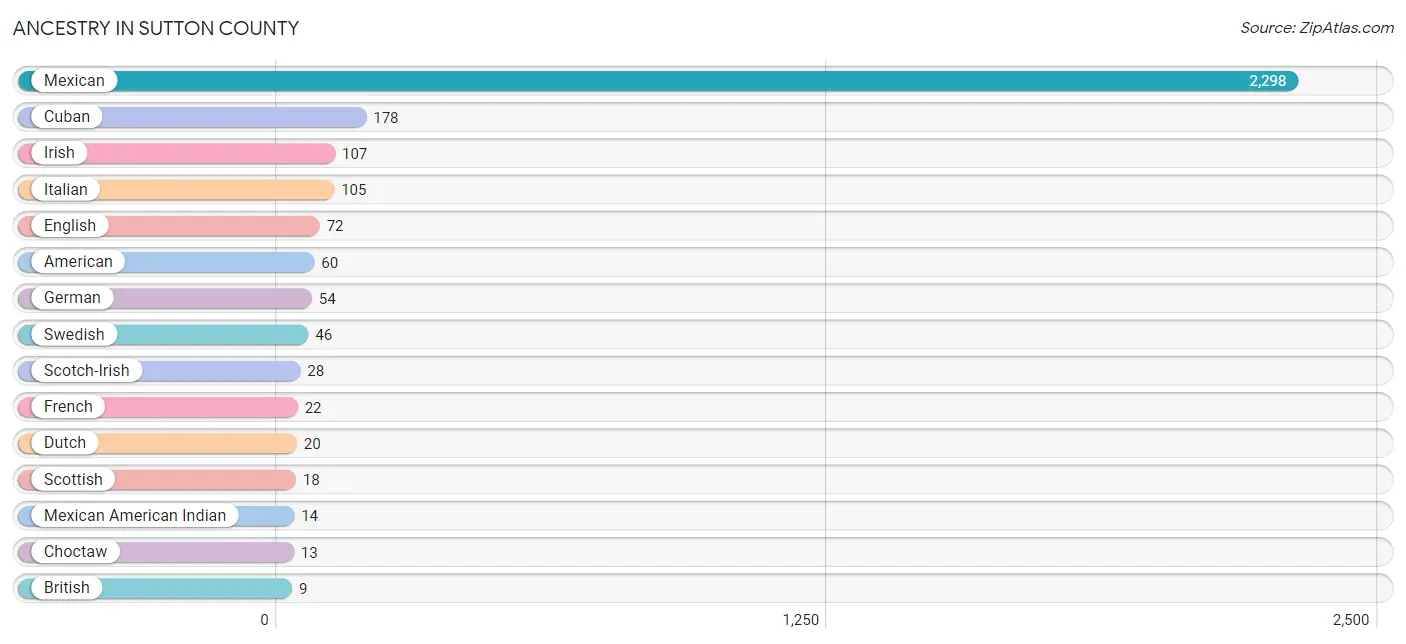
| Ancestry | # Population | % Population |
| African | 2 | 0.1% |
| American | 60 | 1.8% |
| Apache | 1 | 0.0% |
| British | 9 | 0.3% |
| Choctaw | 13 | 0.4% |
| Cuban | 178 | 5.3% |
| Dutch | 20 | 0.6% |
| English | 72 | 2.1% |
| French | 22 | 0.7% |
| French Canadian | 6 | 0.2% |
| German | 54 | 1.6% |
| Irish | 107 | 3.2% |
| Italian | 105 | 3.1% |
| Mexican | 2,298 | 68.7% |
| Mexican American Indian | 14 | 0.4% |
| Native Hawaiian | 8 | 0.2% |
| Portuguese | 8 | 0.2% |
| Scotch-Irish | 28 | 0.8% |
| Scottish | 18 | 0.5% |
| Subsaharan African | 2 | 0.1% |
| Swedish | 46 | 1.4% | View All 21 Rows |
Immigrants in Sutton County
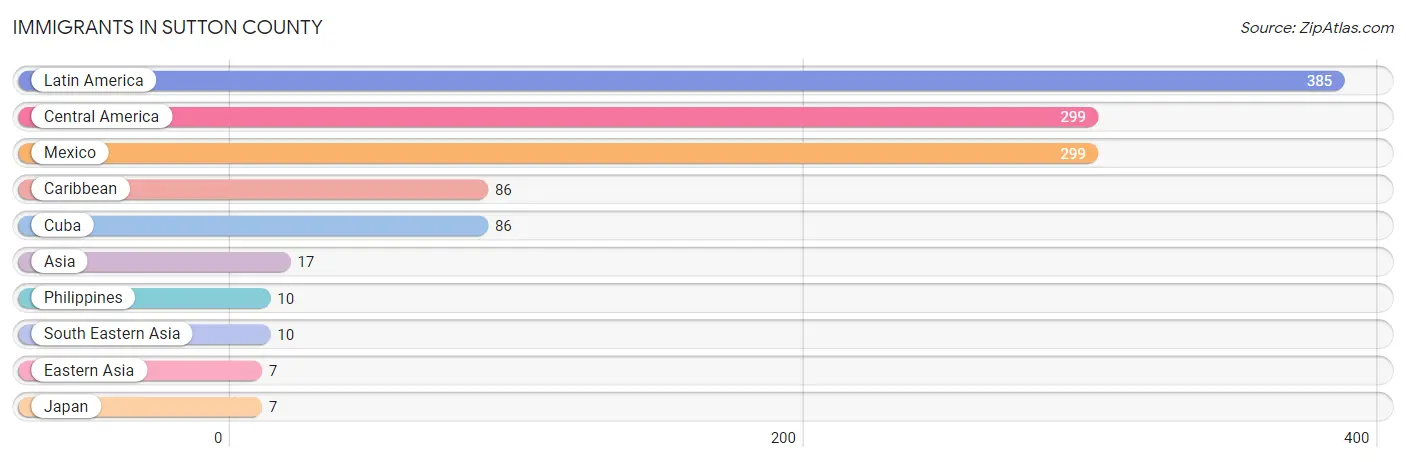
The most numerous immigrant groups reported in Sutton County came from Latin America (385 | 11.5%), Central America (299 | 8.9%), Mexico (299 | 8.9%), Caribbean (86 | 2.6%), and Cuba (86 | 2.6%), together accounting for 34.5% of all Sutton County residents.
| Immigration Origin | # Population | % Population |
| Asia | 17 | 0.5% |
| Caribbean | 86 | 2.6% |
| Central America | 299 | 8.9% |
| Cuba | 86 | 2.6% |
| Eastern Asia | 7 | 0.2% |
| Japan | 7 | 0.2% |
| Latin America | 385 | 11.5% |
| Mexico | 299 | 8.9% |
| Philippines | 10 | 0.3% |
| South Eastern Asia | 10 | 0.3% | View All 10 Rows |
Sex and Age in Sutton County
Sex and Age in Sutton County
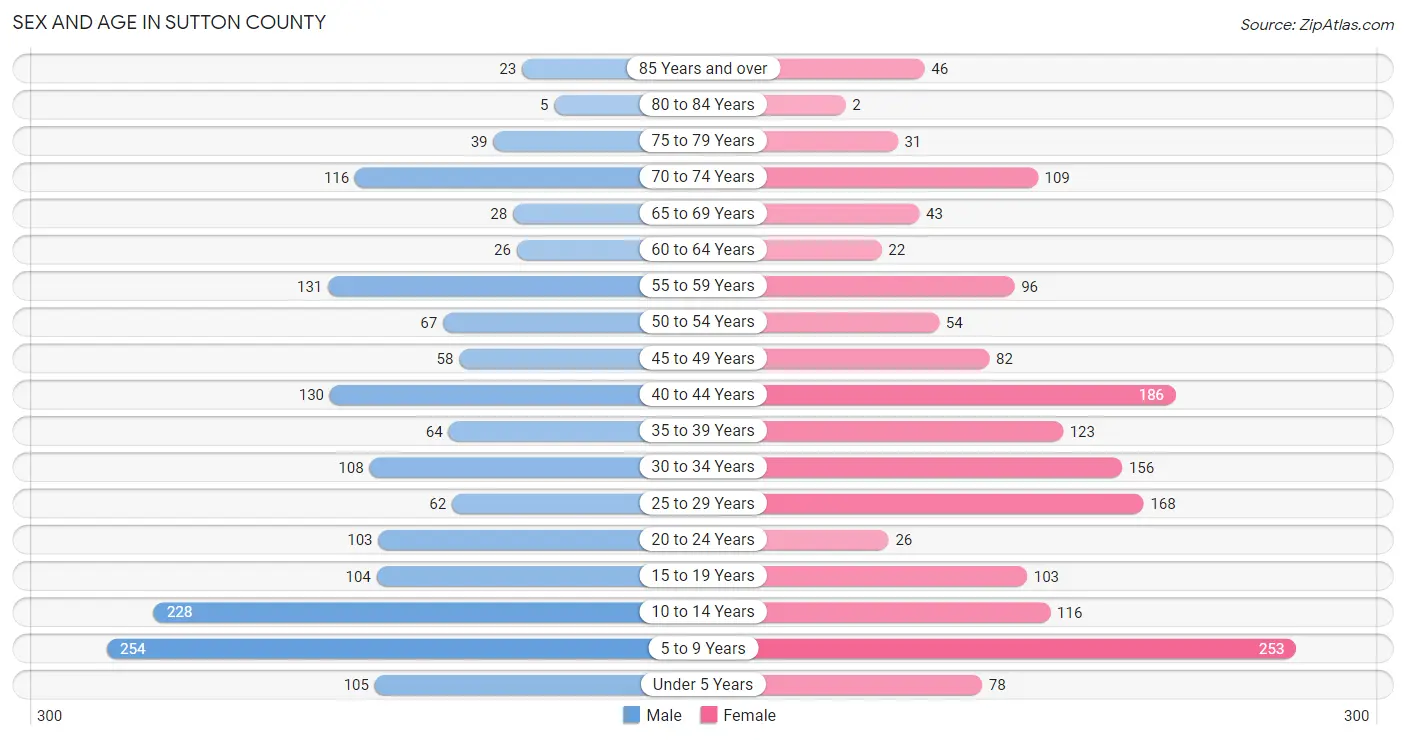
The most populous age groups in Sutton County are 5 to 9 Years (254 | 15.4%) for men and 5 to 9 Years (253 | 14.9%) for women.
| Age Bracket | Male | Female |
| Under 5 Years | 105 (6.4%) | 78 (4.6%) |
| 5 to 9 Years | 254 (15.4%) | 253 (14.9%) |
| 10 to 14 Years | 228 (13.8%) | 116 (6.9%) |
| 15 to 19 Years | 104 (6.3%) | 103 (6.1%) |
| 20 to 24 Years | 103 (6.2%) | 26 (1.5%) |
| 25 to 29 Years | 62 (3.8%) | 168 (9.9%) |
| 30 to 34 Years | 108 (6.5%) | 156 (9.2%) |
| 35 to 39 Years | 64 (3.9%) | 123 (7.3%) |
| 40 to 44 Years | 130 (7.9%) | 186 (11.0%) |
| 45 to 49 Years | 58 (3.5%) | 82 (4.8%) |
| 50 to 54 Years | 67 (4.1%) | 54 (3.2%) |
| 55 to 59 Years | 131 (7.9%) | 96 (5.7%) |
| 60 to 64 Years | 26 (1.6%) | 22 (1.3%) |
| 65 to 69 Years | 28 (1.7%) | 43 (2.5%) |
| 70 to 74 Years | 116 (7.0%) | 109 (6.4%) |
| 75 to 79 Years | 39 (2.4%) | 31 (1.8%) |
| 80 to 84 Years | 5 (0.3%) | 2 (0.1%) |
| 85 Years and over | 23 (1.4%) | 46 (2.7%) |
| Total | 1,651 (100.0%) | 1,694 (100.0%) |
Families and Households in Sutton County
Median Family Size in Sutton County
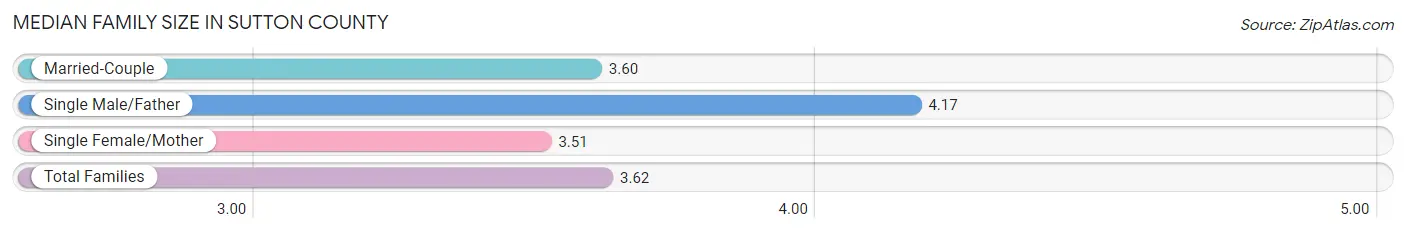
The median family size in Sutton County is 3.62 persons per family, with single male/father families (64 | 7.6%) accounting for the largest median family size of 4.17 persons per family. On the other hand, single female/mother families (189 | 22.4%) represent the smallest median family size with 3.51 persons per family.
| Family Type | # Families | Family Size |
| Married-Couple | 592 (70.1%) | 3.60 |
| Single Male/Father | 64 (7.6%) | 4.17 |
| Single Female/Mother | 189 (22.4%) | 3.51 |
| Total Families | 845 (100.0%) | 3.62 |
Median Household Size in Sutton County
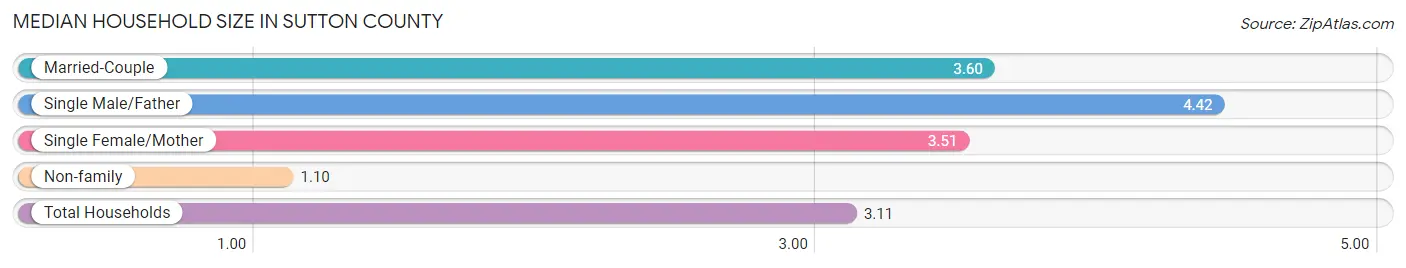
The median household size in Sutton County is 3.11 persons per household, with single male/father households (64 | 6.0%) accounting for the largest median household size of 4.42 persons per household. non-family households (223 | 20.9%) represent the smallest median household size with 1.10 persons per household.
| Household Type | # Households | Household Size |
| Married-Couple | 592 (55.4%) | 3.60 |
| Single Male/Father | 64 (6.0%) | 4.42 |
| Single Female/Mother | 189 (17.7%) | 3.51 |
| Non-family | 223 (20.9%) | 1.10 |
| Total Households | 1,068 (100.0%) | 3.11 |
Household Size by Marriage Status in Sutton County
Out of a total of 1,068 households in Sutton County, 845 (79.1%) are family households, while 223 (20.9%) are nonfamily households. The most numerous type of family households are 2-person households, comprising 295, and the most common type of nonfamily households are 1-person households, comprising 212.
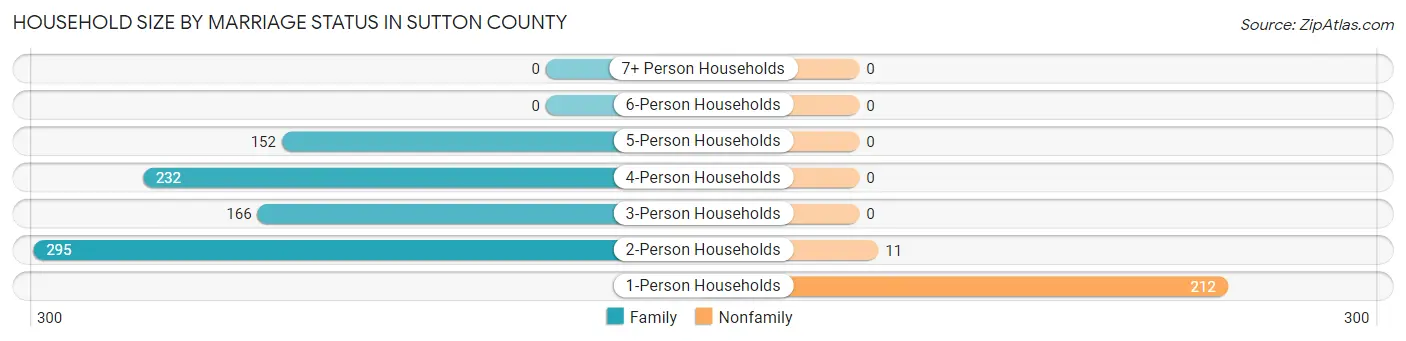
| Household Size | Family Households | Nonfamily Households |
| 1-Person Households | - | 212 (19.9%) |
| 2-Person Households | 295 (27.6%) | 11 (1.0%) |
| 3-Person Households | 166 (15.5%) | 0 (0.0%) |
| 4-Person Households | 232 (21.7%) | 0 (0.0%) |
| 5-Person Households | 152 (14.2%) | 0 (0.0%) |
| 6-Person Households | 0 (0.0%) | 0 (0.0%) |
| 7+ Person Households | 0 (0.0%) | 0 (0.0%) |
| Total | 845 (79.1%) | 223 (20.9%) |
Female Fertility in Sutton County
Fertility by Age in Sutton County
Average fertility rate in Sutton County is 78.0 births per 1,000 women. Women in the age bracket of 35 to 50 years have the highest fertility rate with 132.0 births per 1,000 women. Women in the age bracket of 35 to 50 years acount for 78.8% of all women with births.
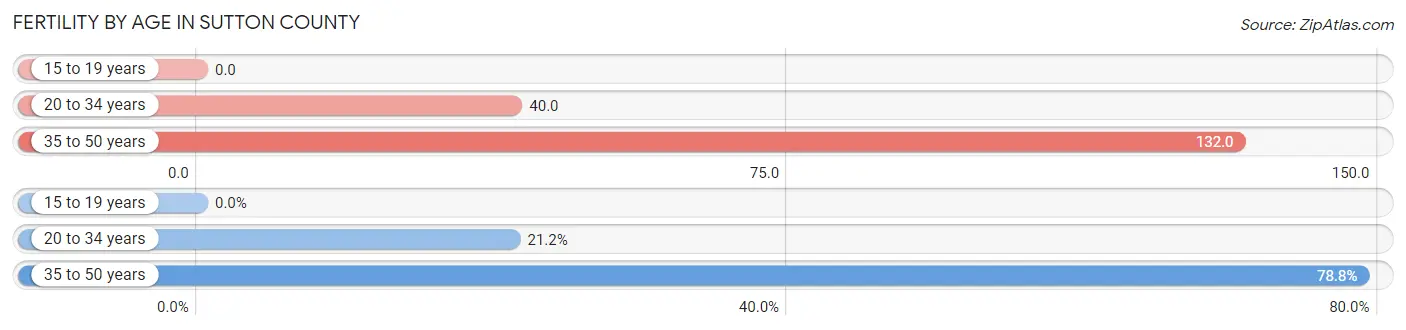
| Age Bracket | Women with Births | Births / 1,000 Women |
| 15 to 19 years | 0 (0.0%) | 0.0 |
| 20 to 34 years | 14 (21.2%) | 40.0 |
| 35 to 50 years | 52 (78.8%) | 132.0 |
| Total | 66 (100.0%) | 78.0 |
Fertility by Age by Marriage Status in Sutton County
95.5% of women with births (66) in Sutton County are married. The highest percentage of unmarried women with births falls into 20 to 34 years age bracket with 21.4% of them unmarried at the time of birth, while the lowest percentage of unmarried women with births belong to 35 to 50 years age bracket with 0.0% of them unmarried.
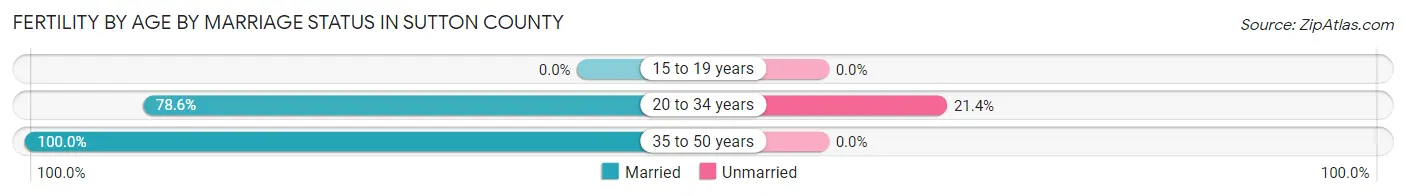
| Age Bracket | Married | Unmarried |
| 15 to 19 years | 0 (0.0%) | 0 (0.0%) |
| 20 to 34 years | 11 (78.6%) | 3 (21.4%) |
| 35 to 50 years | 52 (100.0%) | 0 (0.0%) |
| Total | 63 (95.5%) | 3 (4.5%) |
Fertility by Education in Sutton County
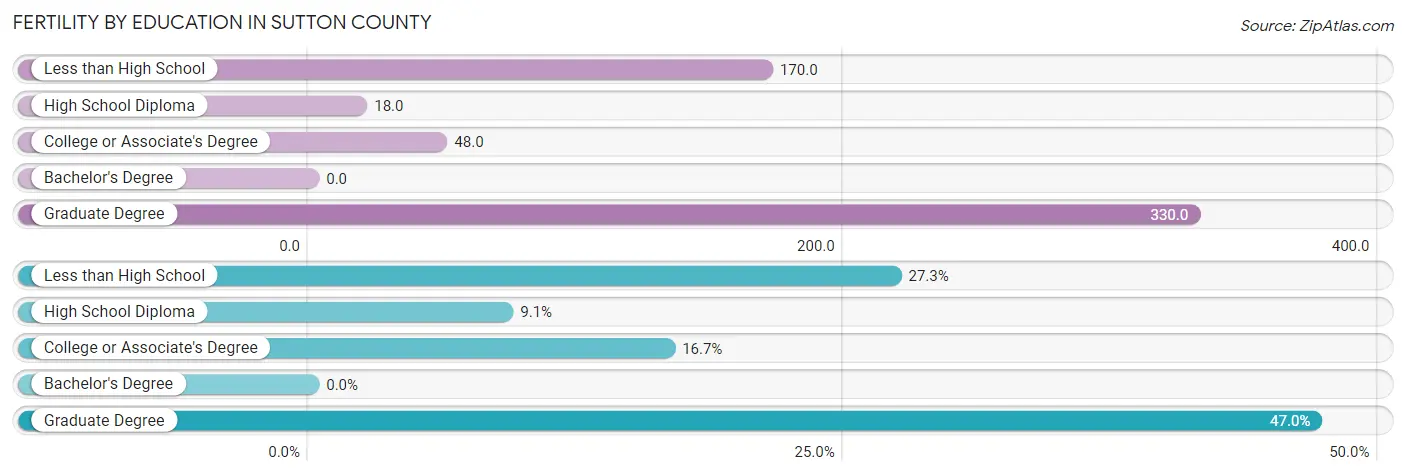
| Educational Attainment | Women with Births | Births / 1,000 Women |
| Less than High School | 18 (27.3%) | 170.0 |
| High School Diploma | 6 (9.1%) | 18.0 |
| College or Associate's Degree | 11 (16.7%) | 48.0 |
| Bachelor's Degree | 0 (0.0%) | 0.0 |
| Graduate Degree | 31 (47.0%) | 330.0 |
| Total | 66 (100.0%) | 78.0 |
Fertility by Education by Marriage Status in Sutton County
4.5% of women with births in Sutton County are unmarried. Women with the educational attainment of less than high school are most likely to be married with 100.0% of them married at childbirth, while women with the educational attainment of high school diploma are least likely to be married with 50.0% of them unmarried at childbirth.
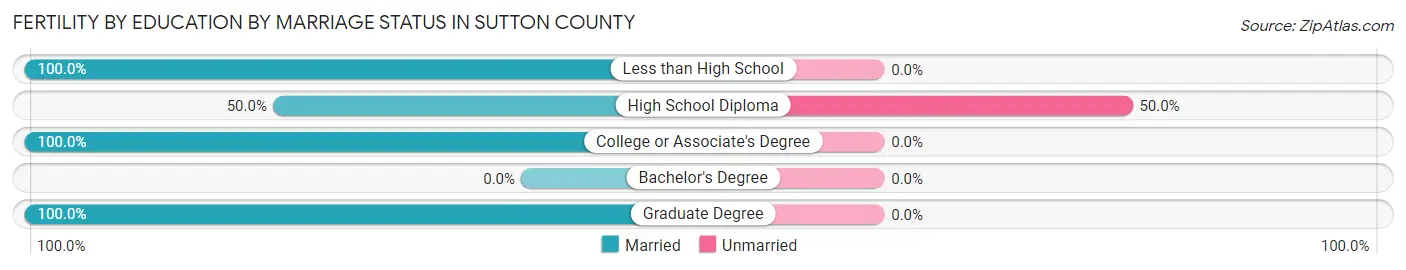
| Educational Attainment | Married | Unmarried |
| Less than High School | 18 (100.0%) | 0 (0.0%) |
| High School Diploma | 3 (50.0%) | 3 (50.0%) |
| College or Associate's Degree | 11 (100.0%) | 0 (0.0%) |
| Bachelor's Degree | 0 (0.0%) | 0 (0.0%) |
| Graduate Degree | 31 (100.0%) | 0 (0.0%) |
| Total | 63 (95.5%) | 3 (4.5%) |
Employment Characteristics in Sutton County
Employment by Class of Employer in Sutton County
Among the 1,421 employed individuals in Sutton County, private company employees (916 | 64.5%), local government employees (147 | 10.3%), and self-employed (not incorporated) (119 | 8.4%) make up the most common classes of employment.
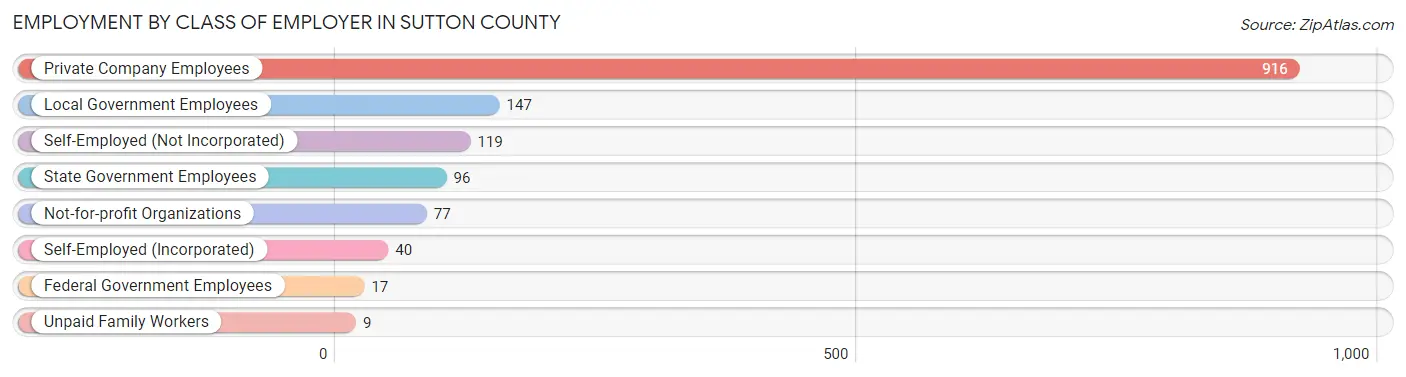
| Employer Class | # Employees | % Employees |
| Private Company Employees | 916 | 64.5% |
| Self-Employed (Incorporated) | 40 | 2.8% |
| Self-Employed (Not Incorporated) | 119 | 8.4% |
| Not-for-profit Organizations | 77 | 5.4% |
| Local Government Employees | 147 | 10.3% |
| State Government Employees | 96 | 6.8% |
| Federal Government Employees | 17 | 1.2% |
| Unpaid Family Workers | 9 | 0.6% |
| Total | 1,421 | 100.0% |
Employment Status by Age in Sutton County
According to the labor force statistics for Sutton County, out of the total population over 16 years of age (2,295), 65.4% or 1,501 individuals are in the labor force, with 4.7% or 71 of them unemployed. The age group with the highest labor force participation rate is 45 to 54 years, with 97.7% or 255 individuals in the labor force. Within the labor force, the 60 to 64 years age range has the highest percentage of unemployed individuals, with 55.3% or 21 of them being unemployed.
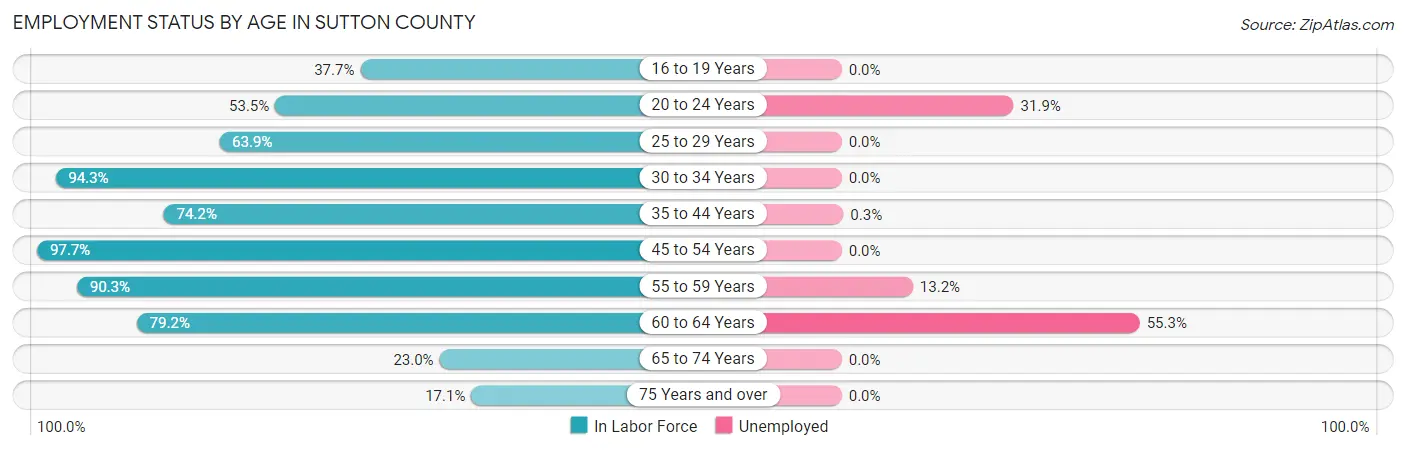
| Age Bracket | In Labor Force | Unemployed |
| 16 to 19 Years | 72 (37.7%) | 0 (0.0%) |
| 20 to 24 Years | 69 (53.5%) | 22 (31.9%) |
| 25 to 29 Years | 147 (63.9%) | 0 (0.0%) |
| 30 to 34 Years | 249 (94.3%) | 0 (0.0%) |
| 35 to 44 Years | 373 (74.2%) | 1 (0.3%) |
| 45 to 54 Years | 255 (97.7%) | 0 (0.0%) |
| 55 to 59 Years | 205 (90.3%) | 27 (13.2%) |
| 60 to 64 Years | 38 (79.2%) | 21 (55.3%) |
| 65 to 74 Years | 68 (23.0%) | 0 (0.0%) |
| 75 Years and over | 25 (17.1%) | 0 (0.0%) |
| Total | 1,501 (65.4%) | 71 (4.7%) |
Employment Status by Educational Attainment in Sutton County
According to labor force statistics for Sutton County, 82.6% of individuals (1,266) out of the total population between 25 and 64 years of age (1,533) are in the labor force, with 3.9% or 49 of them being unemployed. The group with the highest labor force participation rate are those with the educational attainment of high school diploma, with 87.9% or 550 individuals in the labor force. Within the labor force, individuals with high school diploma education have the highest percentage of unemployment, with 5.6% or 31 of them being unemployed.
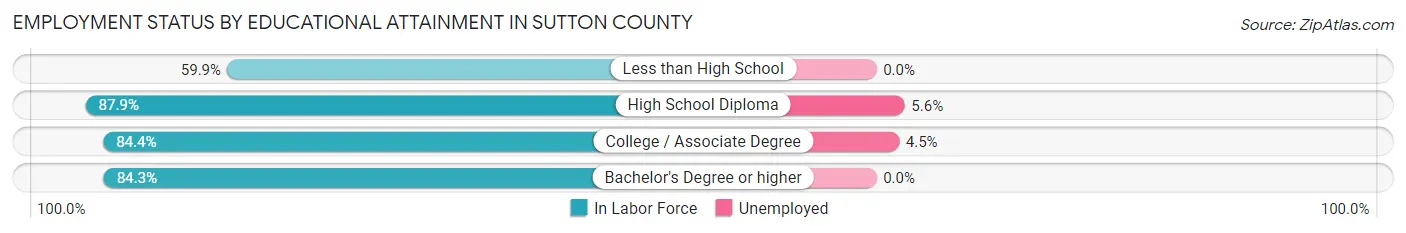
| Educational Attainment | In Labor Force | Unemployed |
| Less than High School | 118 (59.9%) | 0 (0.0%) |
| High School Diploma | 550 (87.9%) | 35 (5.6%) |
| College / Associate Degree | 401 (84.4%) | 21 (4.5%) |
| Bachelor's Degree or higher | 198 (84.3%) | 0 (0.0%) |
| Total | 1,266 (82.6%) | 60 (3.9%) |
Employment Occupations by Sex in Sutton County
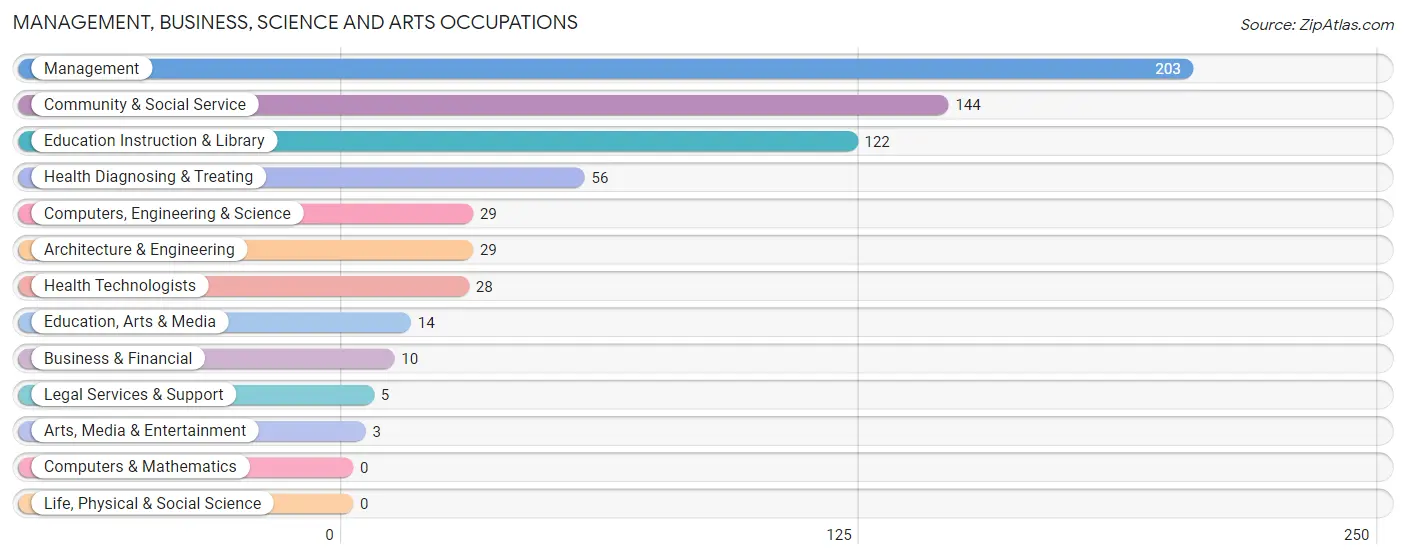
Management, Business, Science and Arts Occupations
The most common Management, Business, Science and Arts occupations in Sutton County are Management (203 | 14.2%), Community & Social Service (144 | 10.1%), Education Instruction & Library (122 | 8.5%), Health Diagnosing & Treating (56 | 3.9%), and Computers, Engineering & Science (29 | 2.0%).
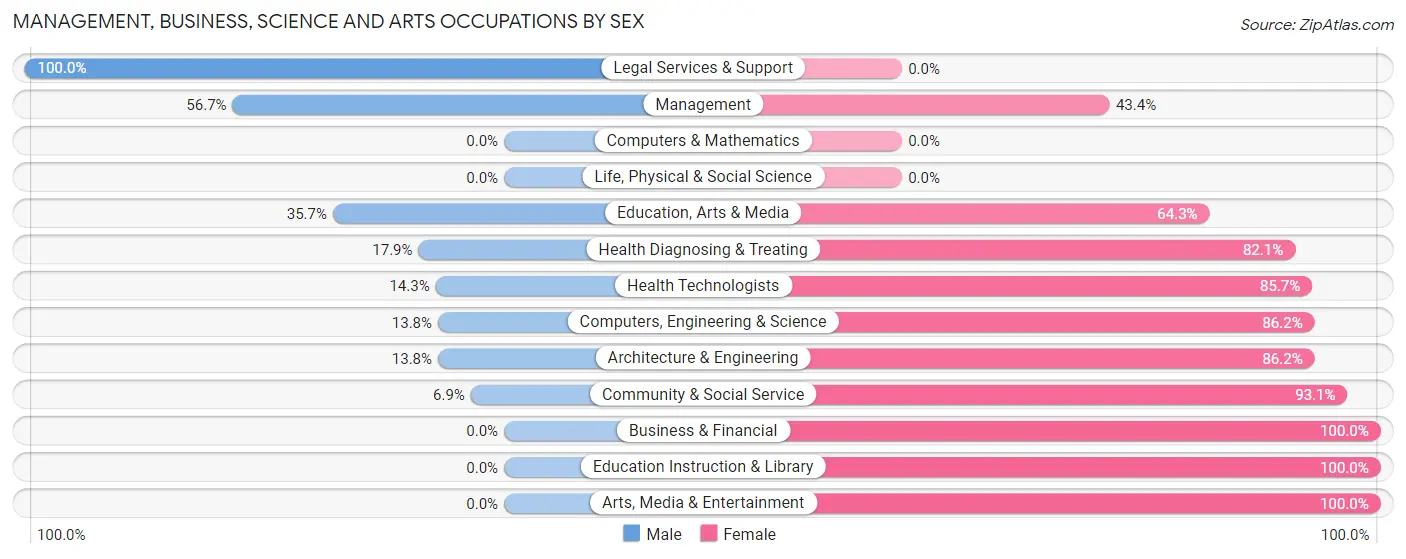
Management, Business, Science and Arts Occupations by Sex
Within the Management, Business, Science and Arts occupations in Sutton County, the most male-oriented occupations are Legal Services & Support (100.0%), Management (56.7%), and Education, Arts & Media (35.7%), while the most female-oriented occupations are Business & Financial (100.0%), Education Instruction & Library (100.0%), and Arts, Media & Entertainment (100.0%).
| Occupation | Male | Female |
| Management | 115 (56.7%) | 88 (43.3%) |
| Business & Financial | 0 (0.0%) | 10 (100.0%) |
| Computers, Engineering & Science | 4 (13.8%) | 25 (86.2%) |
| Computers & Mathematics | 0 (0.0%) | 0 (0.0%) |
| Architecture & Engineering | 4 (13.8%) | 25 (86.2%) |
| Life, Physical & Social Science | 0 (0.0%) | 0 (0.0%) |
| Community & Social Service | 10 (6.9%) | 134 (93.1%) |
| Education, Arts & Media | 5 (35.7%) | 9 (64.3%) |
| Legal Services & Support | 5 (100.0%) | 0 (0.0%) |
| Education Instruction & Library | 0 (0.0%) | 122 (100.0%) |
| Arts, Media & Entertainment | 0 (0.0%) | 3 (100.0%) |
| Health Diagnosing & Treating | 10 (17.9%) | 46 (82.1%) |
| Health Technologists | 4 (14.3%) | 24 (85.7%) |
| Total (Category) | 139 (31.5%) | 303 (68.5%) |
| Total (Overall) | 669 (46.8%) | 761 (53.2%) |
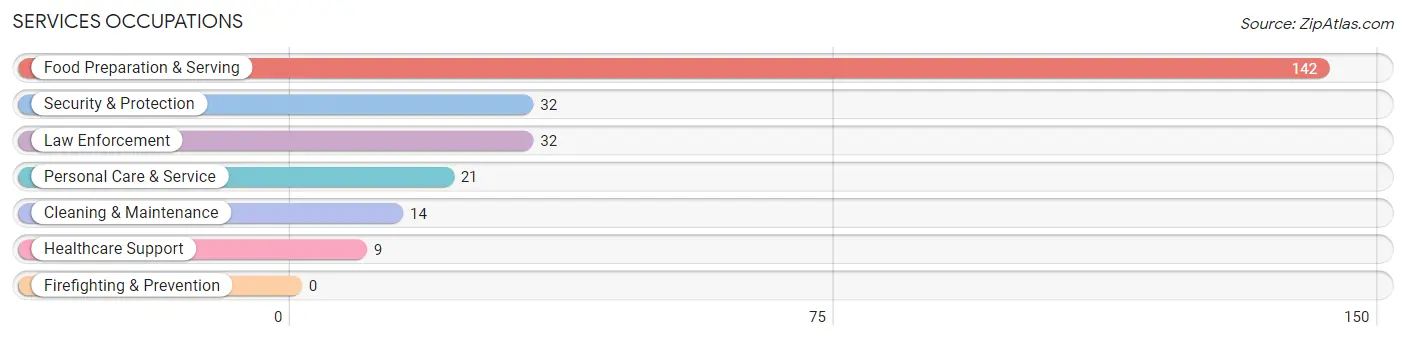
Services Occupations
The most common Services occupations in Sutton County are Food Preparation & Serving (142 | 9.9%), Security & Protection (32 | 2.2%), Law Enforcement (32 | 2.2%), Personal Care & Service (21 | 1.5%), and Cleaning & Maintenance (14 | 1.0%).
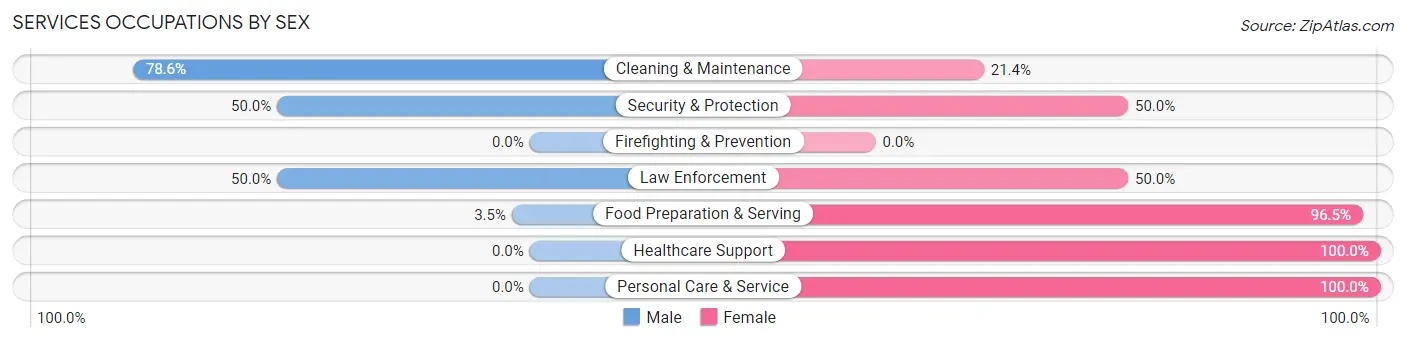
Services Occupations by Sex
Within the Services occupations in Sutton County, the most male-oriented occupations are Cleaning & Maintenance (78.6%), Security & Protection (50.0%), and Law Enforcement (50.0%), while the most female-oriented occupations are Healthcare Support (100.0%), Personal Care & Service (100.0%), and Food Preparation & Serving (96.5%).
| Occupation | Male | Female |
| Healthcare Support | 0 (0.0%) | 9 (100.0%) |
| Security & Protection | 16 (50.0%) | 16 (50.0%) |
| Firefighting & Prevention | 0 (0.0%) | 0 (0.0%) |
| Law Enforcement | 16 (50.0%) | 16 (50.0%) |
| Food Preparation & Serving | 5 (3.5%) | 137 (96.5%) |
| Cleaning & Maintenance | 11 (78.6%) | 3 (21.4%) |
| Personal Care & Service | 0 (0.0%) | 21 (100.0%) |
| Total (Category) | 32 (14.7%) | 186 (85.3%) |
| Total (Overall) | 669 (46.8%) | 761 (53.2%) |
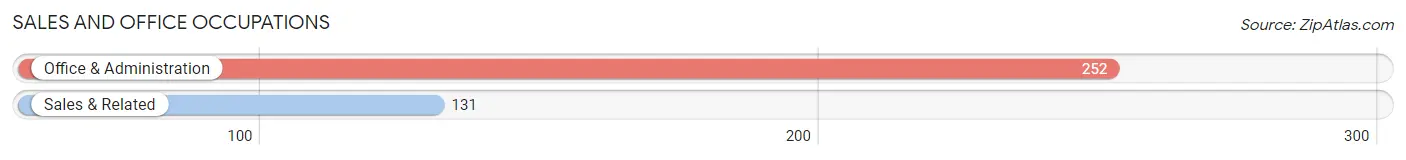
Sales and Office Occupations
The most common Sales and Office occupations in Sutton County are Office & Administration (252 | 17.6%), and Sales & Related (131 | 9.2%).
Sales and Office Occupations by Sex
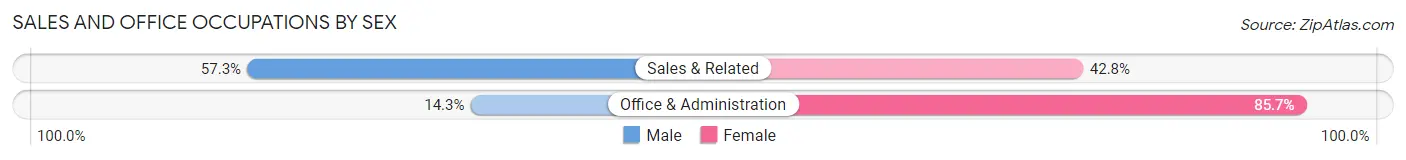
| Occupation | Male | Female |
| Sales & Related | 75 (57.3%) | 56 (42.7%) |
| Office & Administration | 36 (14.3%) | 216 (85.7%) |
| Total (Category) | 111 (29.0%) | 272 (71.0%) |
| Total (Overall) | 669 (46.8%) | 761 (53.2%) |
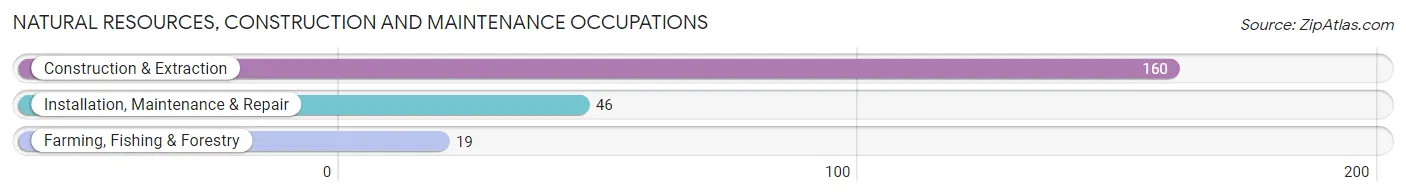
Natural Resources, Construction and Maintenance Occupations
The most common Natural Resources, Construction and Maintenance occupations in Sutton County are Construction & Extraction (160 | 11.2%), Installation, Maintenance & Repair (46 | 3.2%), and Farming, Fishing & Forestry (19 | 1.3%).
Natural Resources, Construction and Maintenance Occupations by Sex
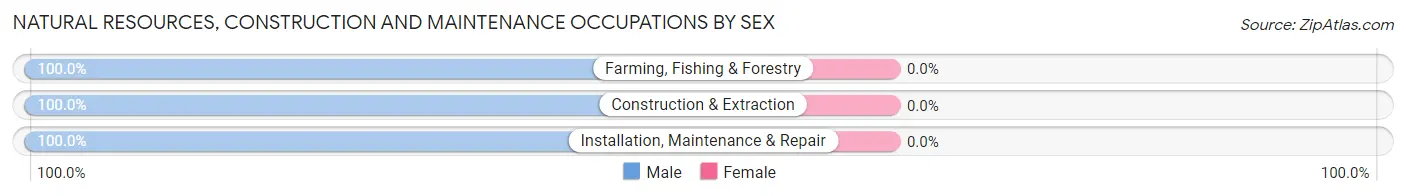
| Occupation | Male | Female |
| Farming, Fishing & Forestry | 19 (100.0%) | 0 (0.0%) |
| Construction & Extraction | 160 (100.0%) | 0 (0.0%) |
| Installation, Maintenance & Repair | 46 (100.0%) | 0 (0.0%) |
| Total (Category) | 225 (100.0%) | 0 (0.0%) |
| Total (Overall) | 669 (46.8%) | 761 (53.2%) |
Production, Transportation and Moving Occupations
The most common Production, Transportation and Moving occupations in Sutton County are Transportation (98 | 6.9%), and Production (64 | 4.5%).
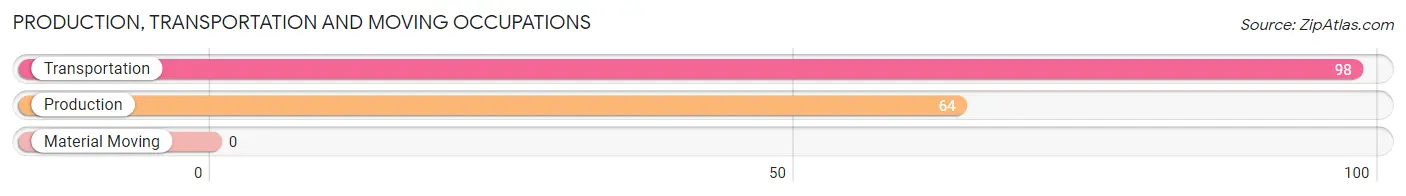
Production, Transportation and Moving Occupations by Sex
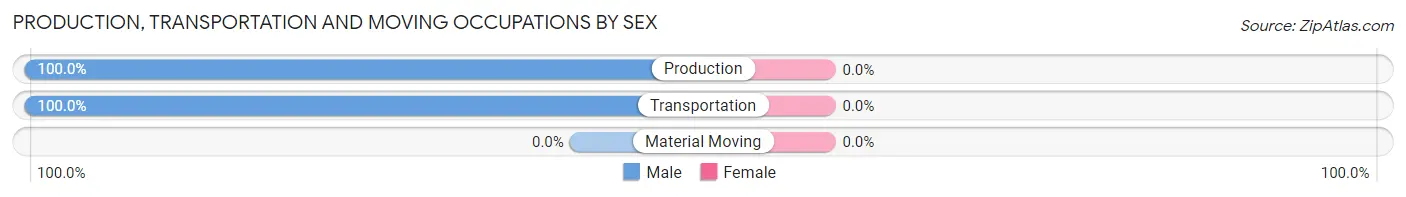
| Occupation | Male | Female |
| Production | 64 (100.0%) | 0 (0.0%) |
| Transportation | 98 (100.0%) | 0 (0.0%) |
| Material Moving | 0 (0.0%) | 0 (0.0%) |
| Total (Category) | 162 (100.0%) | 0 (0.0%) |
| Total (Overall) | 669 (46.8%) | 761 (53.2%) |
Employment Industries by Sex in Sutton County
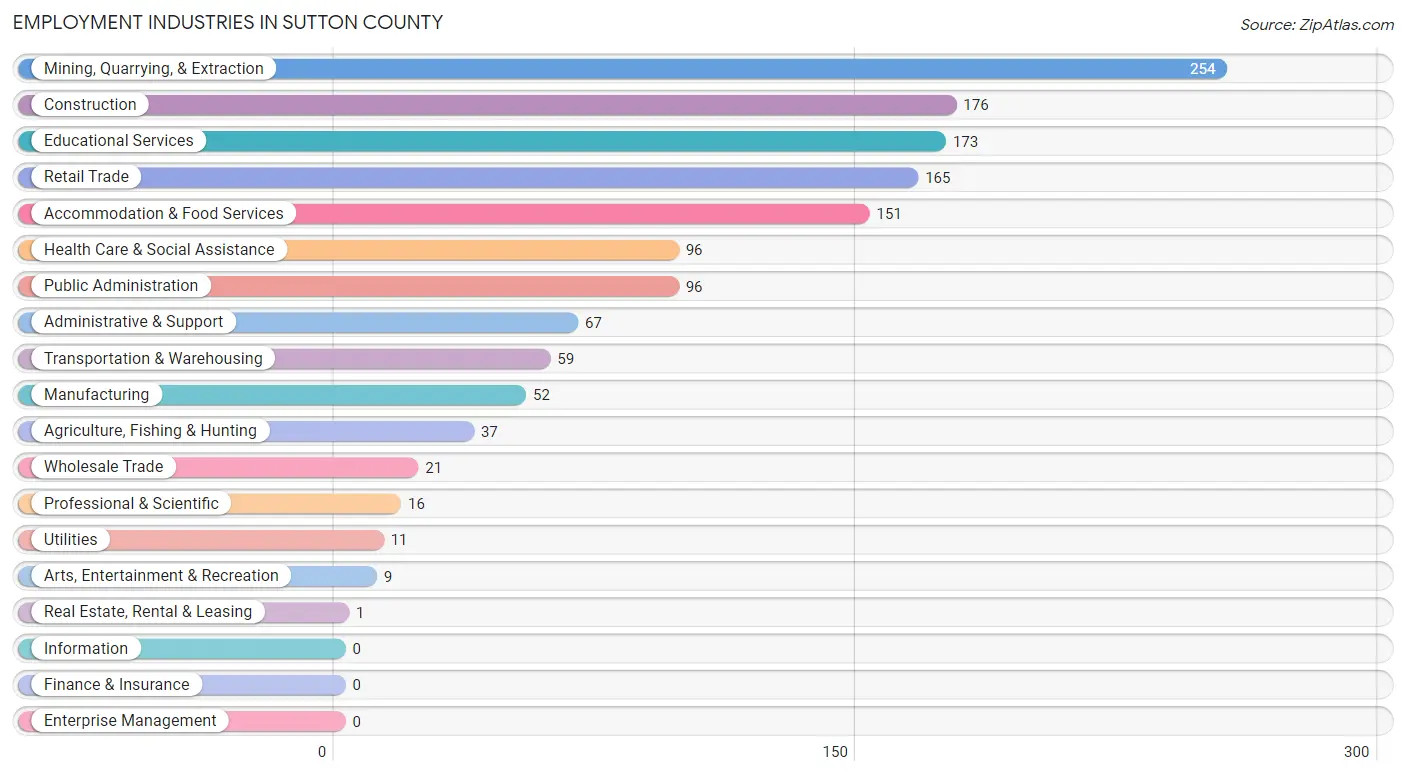
Employment Industries in Sutton County
The major employment industries in Sutton County include Mining, Quarrying, & Extraction (254 | 17.8%), Construction (176 | 12.3%), Educational Services (173 | 12.1%), Retail Trade (165 | 11.5%), and Accommodation & Food Services (151 | 10.6%).
Employment Industries by Sex in Sutton County
The Sutton County industries that see more men than women are Wholesale Trade (100.0%), Utilities (100.0%), and Real Estate, Rental & Leasing (100.0%), whereas the industries that tend to have a higher number of women are Administrative & Support (100.0%), Accommodation & Food Services (96.7%), and Educational Services (91.9%).
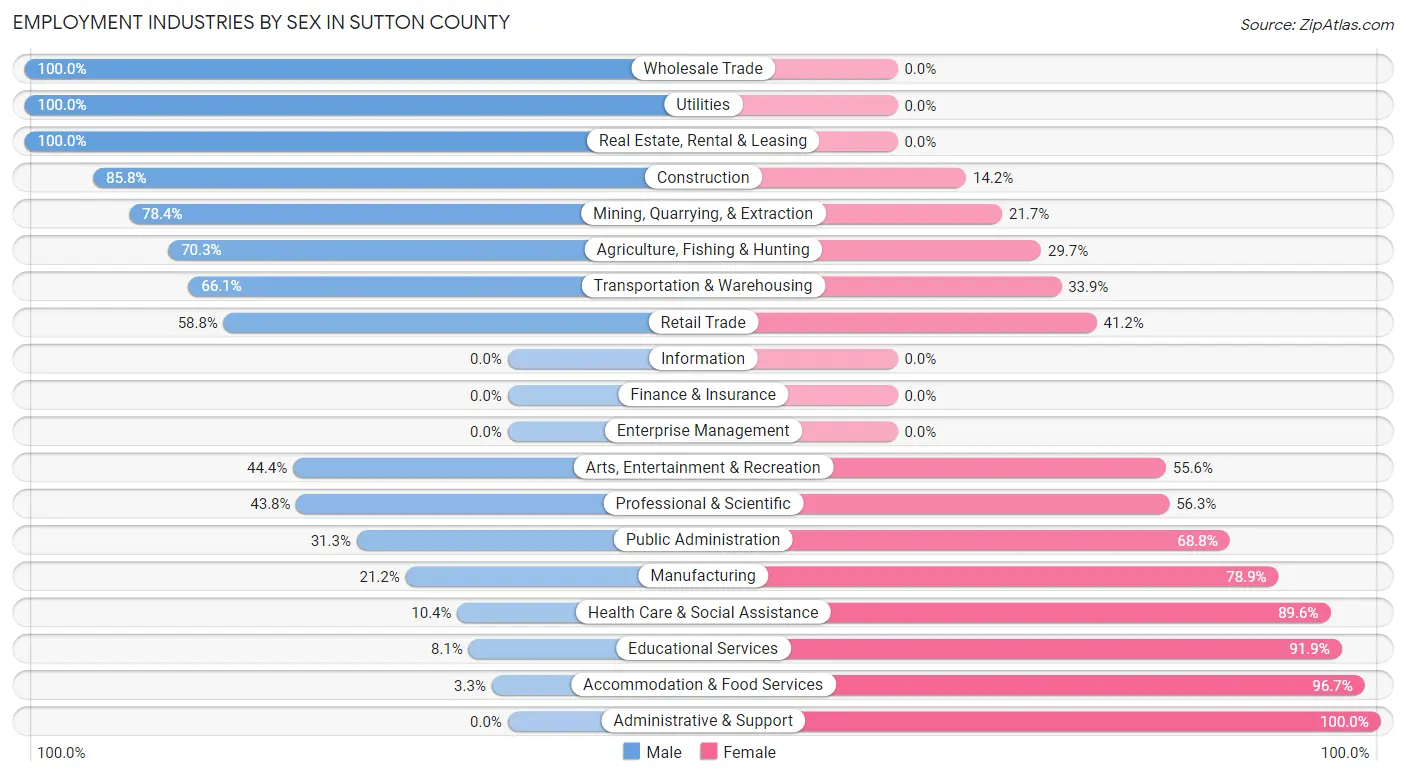
| Industry | Male | Female |
| Agriculture, Fishing & Hunting | 26 (70.3%) | 11 (29.7%) |
| Mining, Quarrying, & Extraction | 199 (78.3%) | 55 (21.6%) |
| Construction | 151 (85.8%) | 25 (14.2%) |
| Manufacturing | 11 (21.1%) | 41 (78.8%) |
| Wholesale Trade | 21 (100.0%) | 0 (0.0%) |
| Retail Trade | 97 (58.8%) | 68 (41.2%) |
| Transportation & Warehousing | 39 (66.1%) | 20 (33.9%) |
| Utilities | 11 (100.0%) | 0 (0.0%) |
| Information | 0 (0.0%) | 0 (0.0%) |
| Finance & Insurance | 0 (0.0%) | 0 (0.0%) |
| Real Estate, Rental & Leasing | 1 (100.0%) | 0 (0.0%) |
| Professional & Scientific | 7 (43.8%) | 9 (56.2%) |
| Enterprise Management | 0 (0.0%) | 0 (0.0%) |
| Administrative & Support | 0 (0.0%) | 67 (100.0%) |
| Educational Services | 14 (8.1%) | 159 (91.9%) |
| Health Care & Social Assistance | 10 (10.4%) | 86 (89.6%) |
| Arts, Entertainment & Recreation | 4 (44.4%) | 5 (55.6%) |
| Accommodation & Food Services | 5 (3.3%) | 146 (96.7%) |
| Public Administration | 30 (31.2%) | 66 (68.8%) |
| Total | 669 (46.8%) | 761 (53.2%) |
Education in Sutton County
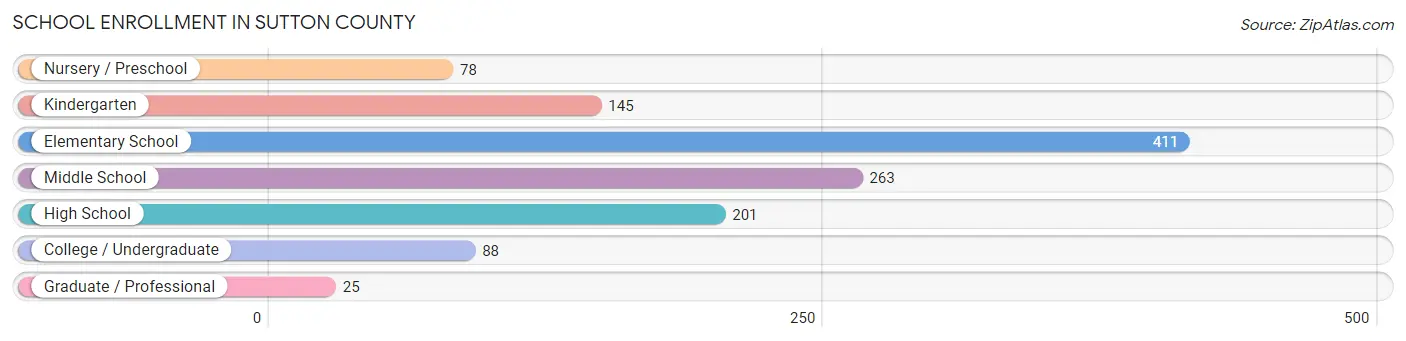
School Enrollment in Sutton County
The most common levels of schooling among the 1,211 students in Sutton County are elementary school (411 | 33.9%), middle school (263 | 21.7%), and high school (201 | 16.6%).
| School Level | # Students | % Students |
| Nursery / Preschool | 78 | 6.4% |
| Kindergarten | 145 | 12.0% |
| Elementary School | 411 | 33.9% |
| Middle School | 263 | 21.7% |
| High School | 201 | 16.6% |
| College / Undergraduate | 88 | 7.3% |
| Graduate / Professional | 25 | 2.1% |
| Total | 1,211 | 100.0% |
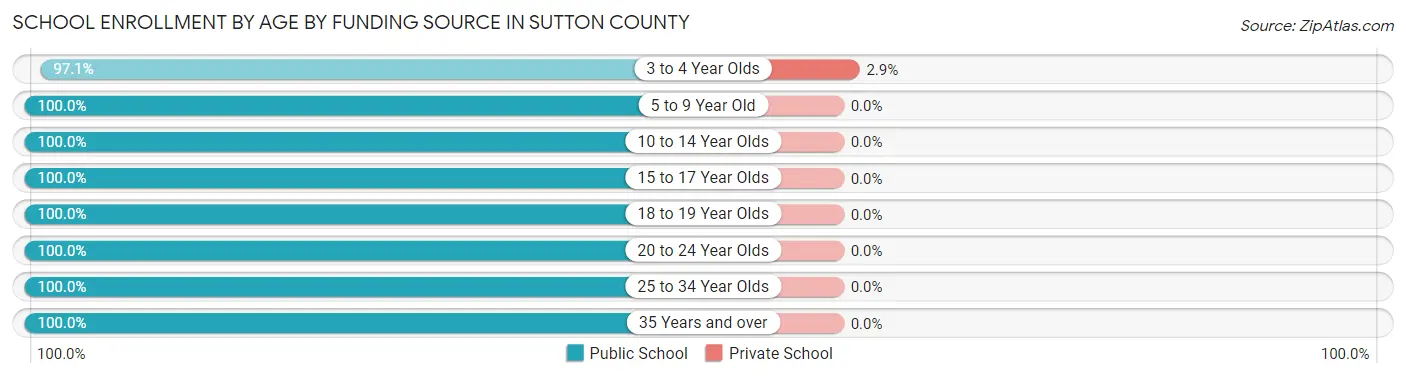
School Enrollment by Age by Funding Source in Sutton County
Out of a total of 1,211 students who are enrolled in schools in Sutton County, 2 (0.2%) attend a private institution, while the remaining 1,209 (99.8%) are enrolled in public schools. The age group of 3 to 4 year olds has the highest likelihood of being enrolled in private schools, with 2 (2.9% in the age bracket) enrolled. Conversely, the age group of 5 to 9 year old has the lowest likelihood of being enrolled in a private school, with 469 (100.0% in the age bracket) attending a public institution.
| Age Bracket | Public School | Private School |
| 3 to 4 Year Olds | 66 (97.1%) | 2 (2.9%) |
| 5 to 9 Year Old | 469 (100.0%) | 0 (0.0%) |
| 10 to 14 Year Olds | 344 (100.0%) | 0 (0.0%) |
| 15 to 17 Year Olds | 50 (100.0%) | 0 (0.0%) |
| 18 to 19 Year Olds | 157 (100.0%) | 0 (0.0%) |
| 20 to 24 Year Olds | 15 (100.0%) | 0 (0.0%) |
| 25 to 34 Year Olds | 51 (100.0%) | 0 (0.0%) |
| 35 Years and over | 57 (100.0%) | 0 (0.0%) |
| Total | 1,209 (99.8%) | 2 (0.2%) |
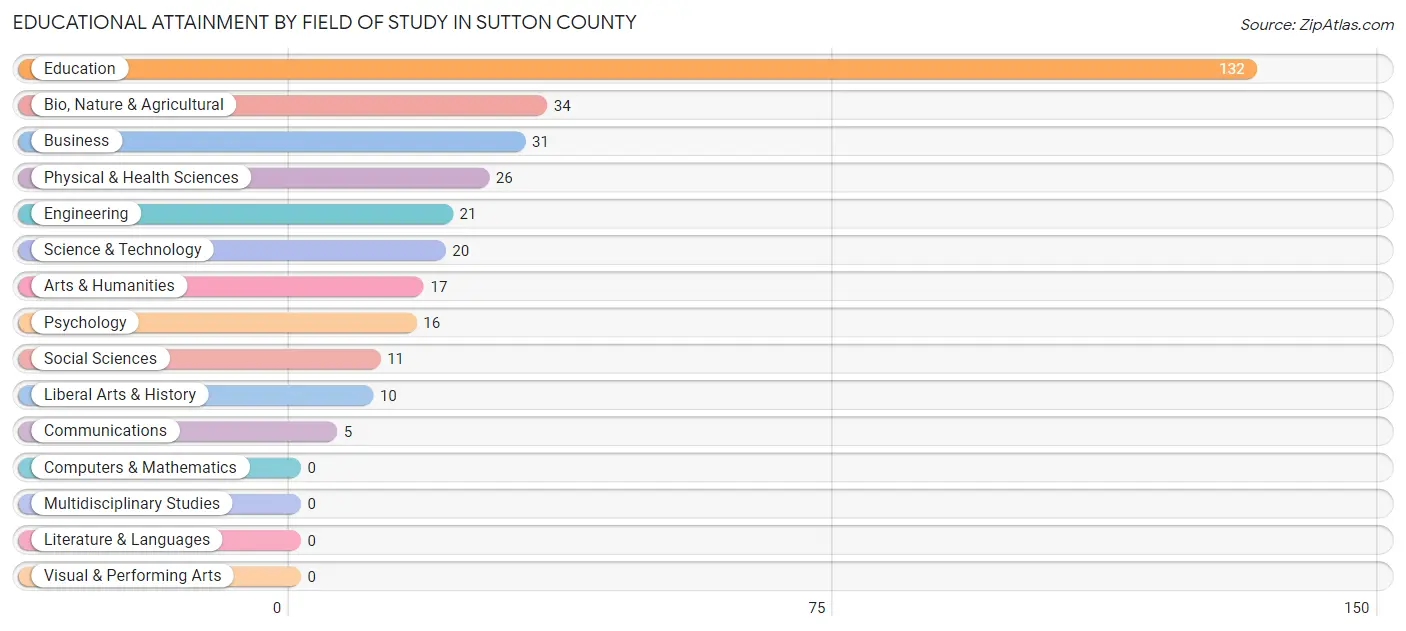
Educational Attainment by Field of Study in Sutton County
Education (132 | 40.9%), bio, nature & agricultural (34 | 10.5%), business (31 | 9.6%), physical & health sciences (26 | 8.1%), and engineering (21 | 6.5%) are the most common fields of study among 323 individuals in Sutton County who have obtained a bachelor's degree or higher.
| Field of Study | # Graduates | % Graduates |
| Computers & Mathematics | 0 | 0.0% |
| Bio, Nature & Agricultural | 34 | 10.5% |
| Physical & Health Sciences | 26 | 8.1% |
| Psychology | 16 | 5.0% |
| Social Sciences | 11 | 3.4% |
| Engineering | 21 | 6.5% |
| Multidisciplinary Studies | 0 | 0.0% |
| Science & Technology | 20 | 6.2% |
| Business | 31 | 9.6% |
| Education | 132 | 40.9% |
| Literature & Languages | 0 | 0.0% |
| Liberal Arts & History | 10 | 3.1% |
| Visual & Performing Arts | 0 | 0.0% |
| Communications | 5 | 1.5% |
| Arts & Humanities | 17 | 5.3% |
| Total | 323 | 100.0% |
Transportation & Commute in Sutton County
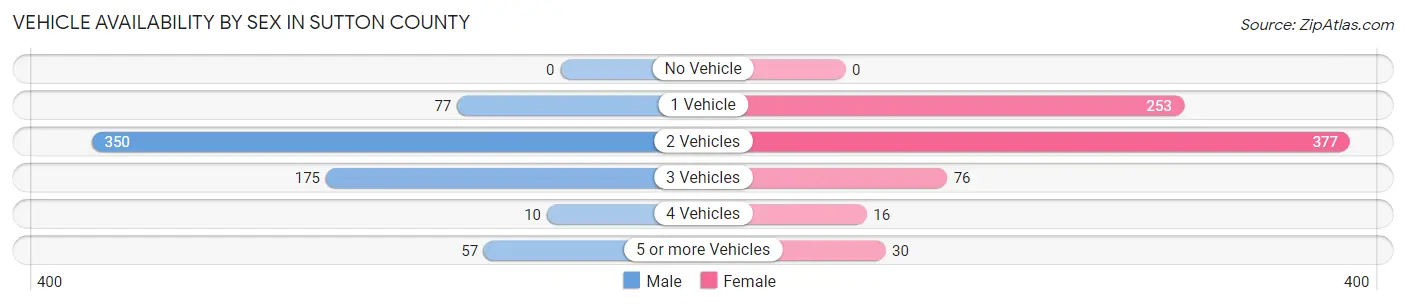
Vehicle Availability by Sex in Sutton County
The most prevalent vehicle ownership categories in Sutton County are males with 2 vehicles (350, accounting for 52.3%) and females with 2 vehicles (377, making up 46.5%).
| Vehicles Available | Male | Female |
| No Vehicle | 0 (0.0%) | 0 (0.0%) |
| 1 Vehicle | 77 (11.5%) | 253 (33.6%) |
| 2 Vehicles | 350 (52.3%) | 377 (50.1%) |
| 3 Vehicles | 175 (26.2%) | 76 (10.1%) |
| 4 Vehicles | 10 (1.5%) | 16 (2.1%) |
| 5 or more Vehicles | 57 (8.5%) | 30 (4.0%) |
| Total | 669 (100.0%) | 752 (100.0%) |
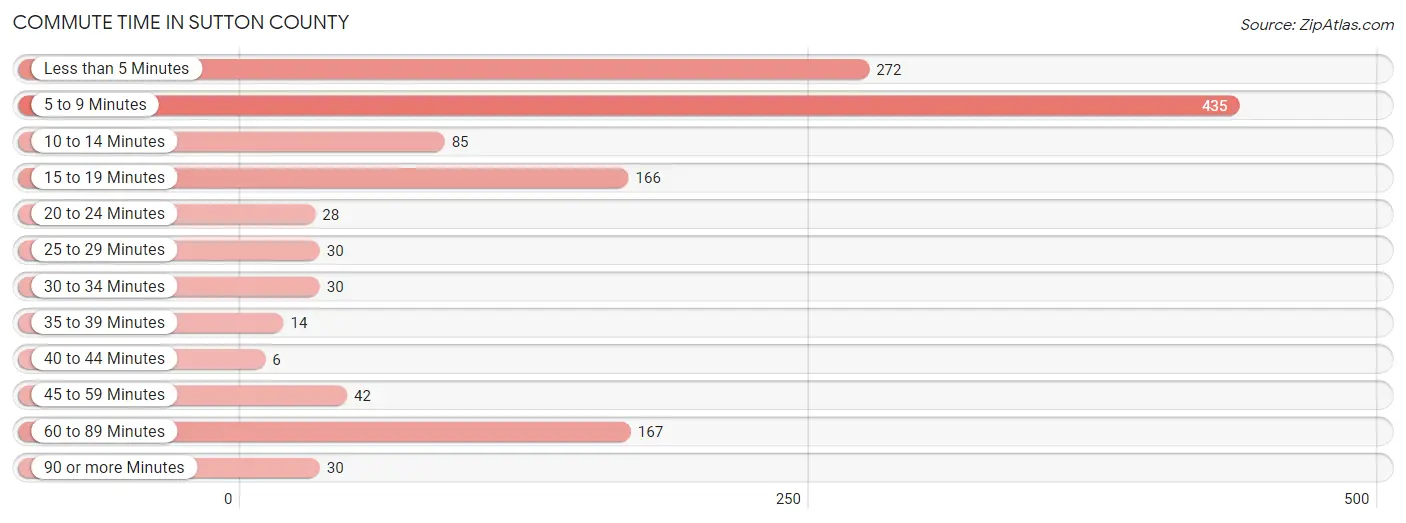
Commute Time in Sutton County
The most frequently occuring commute durations in Sutton County are 5 to 9 minutes (435 commuters, 33.3%), less than 5 minutes (272 commuters, 20.8%), and 60 to 89 minutes (167 commuters, 12.8%).
| Commute Time | # Commuters | % Commuters |
| Less than 5 Minutes | 272 | 20.8% |
| 5 to 9 Minutes | 435 | 33.3% |
| 10 to 14 Minutes | 85 | 6.5% |
| 15 to 19 Minutes | 166 | 12.7% |
| 20 to 24 Minutes | 28 | 2.1% |
| 25 to 29 Minutes | 30 | 2.3% |
| 30 to 34 Minutes | 30 | 2.3% |
| 35 to 39 Minutes | 14 | 1.1% |
| 40 to 44 Minutes | 6 | 0.5% |
| 45 to 59 Minutes | 42 | 3.2% |
| 60 to 89 Minutes | 167 | 12.8% |
| 90 or more Minutes | 30 | 2.3% |
Commute Time by Sex in Sutton County
The most common commute times in Sutton County are less than 5 minutes (137 commuters, 22.5%) for males and 5 to 9 minutes (298 commuters, 42.8%) for females.
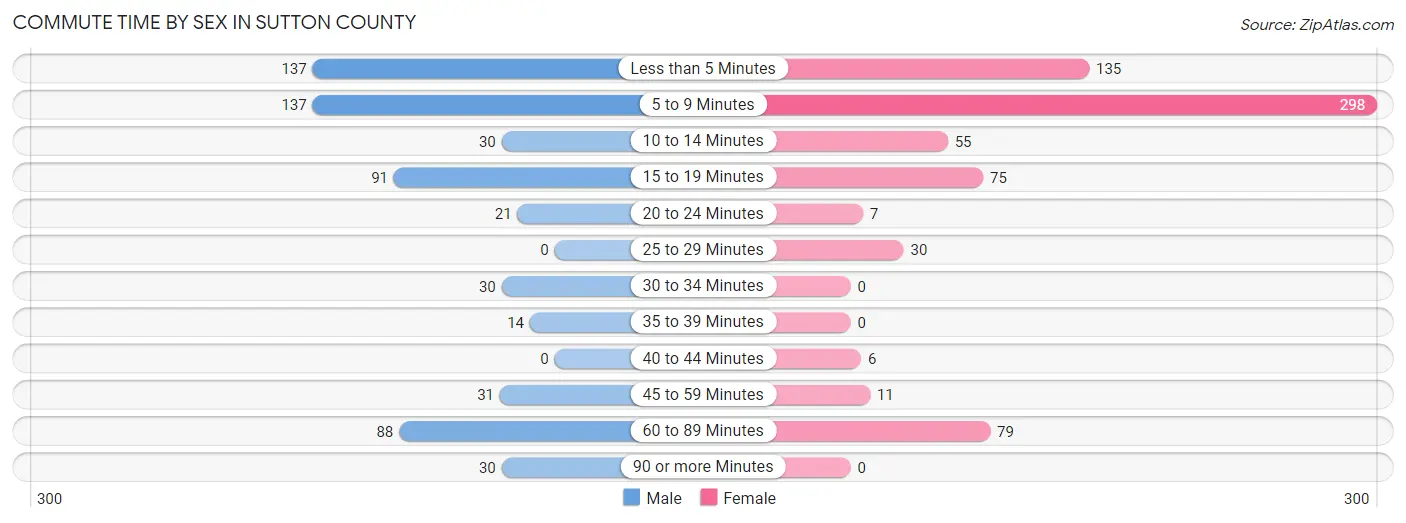
| Commute Time | Male | Female |
| Less than 5 Minutes | 137 (22.5%) | 135 (19.4%) |
| 5 to 9 Minutes | 137 (22.5%) | 298 (42.8%) |
| 10 to 14 Minutes | 30 (4.9%) | 55 (7.9%) |
| 15 to 19 Minutes | 91 (14.9%) | 75 (10.8%) |
| 20 to 24 Minutes | 21 (3.5%) | 7 (1.0%) |
| 25 to 29 Minutes | 0 (0.0%) | 30 (4.3%) |
| 30 to 34 Minutes | 30 (4.9%) | 0 (0.0%) |
| 35 to 39 Minutes | 14 (2.3%) | 0 (0.0%) |
| 40 to 44 Minutes | 0 (0.0%) | 6 (0.9%) |
| 45 to 59 Minutes | 31 (5.1%) | 11 (1.6%) |
| 60 to 89 Minutes | 88 (14.4%) | 79 (11.4%) |
| 90 or more Minutes | 30 (4.9%) | 0 (0.0%) |
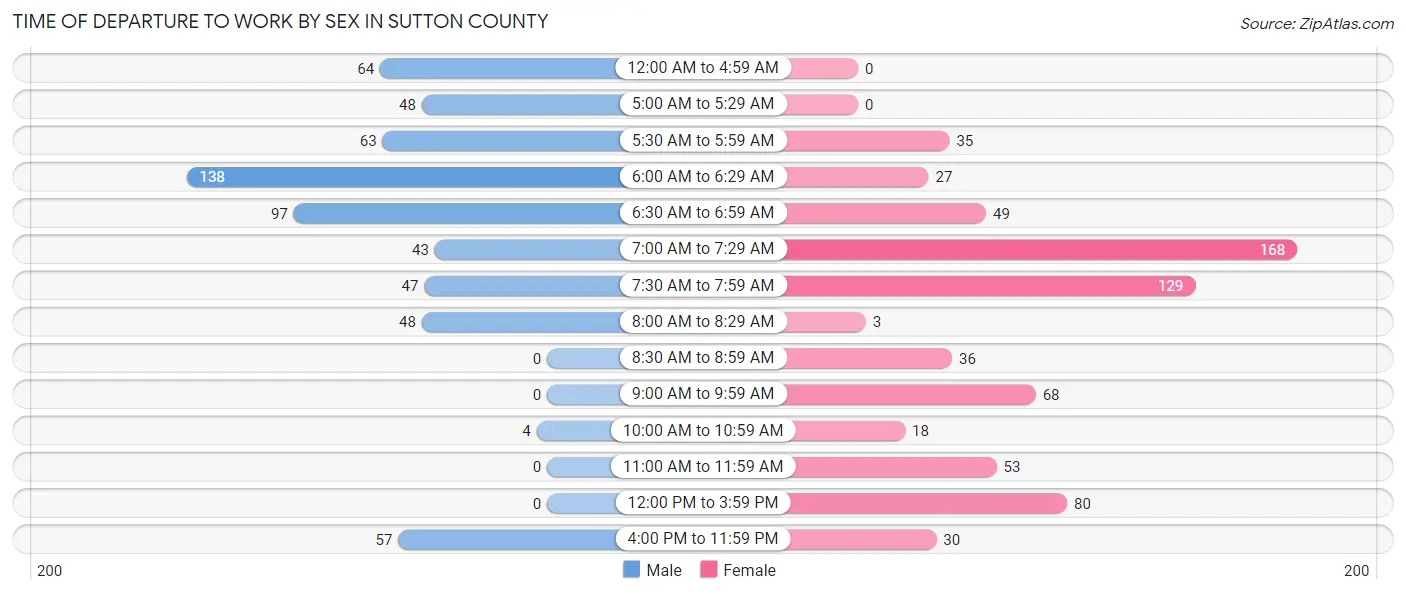
Time of Departure to Work by Sex in Sutton County
The most frequent times of departure to work in Sutton County are 6:00 AM to 6:29 AM (138, 22.7%) for males and 7:00 AM to 7:29 AM (168, 24.1%) for females.
| Time of Departure | Male | Female |
| 12:00 AM to 4:59 AM | 64 (10.5%) | 0 (0.0%) |
| 5:00 AM to 5:29 AM | 48 (7.9%) | 0 (0.0%) |
| 5:30 AM to 5:59 AM | 63 (10.3%) | 35 (5.0%) |
| 6:00 AM to 6:29 AM | 138 (22.7%) | 27 (3.9%) |
| 6:30 AM to 6:59 AM | 97 (15.9%) | 49 (7.0%) |
| 7:00 AM to 7:29 AM | 43 (7.1%) | 168 (24.1%) |
| 7:30 AM to 7:59 AM | 47 (7.7%) | 129 (18.5%) |
| 8:00 AM to 8:29 AM | 48 (7.9%) | 3 (0.4%) |
| 8:30 AM to 8:59 AM | 0 (0.0%) | 36 (5.2%) |
| 9:00 AM to 9:59 AM | 0 (0.0%) | 68 (9.8%) |
| 10:00 AM to 10:59 AM | 4 (0.7%) | 18 (2.6%) |
| 11:00 AM to 11:59 AM | 0 (0.0%) | 53 (7.6%) |
| 12:00 PM to 3:59 PM | 0 (0.0%) | 80 (11.5%) |
| 4:00 PM to 11:59 PM | 57 (9.4%) | 30 (4.3%) |
| Total | 609 (100.0%) | 696 (100.0%) |
Housing Occupancy in Sutton County
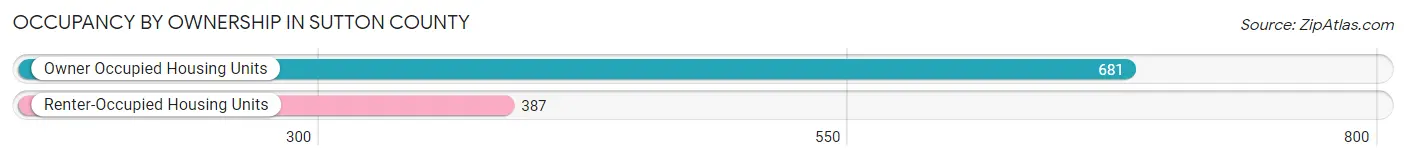
Occupancy by Ownership in Sutton County
Of the total 1,068 dwellings in Sutton County, owner-occupied units account for 681 (63.8%), while renter-occupied units make up 387 (36.2%).
| Occupancy | # Housing Units | % Housing Units |
| Owner Occupied Housing Units | 681 | 63.8% |
| Renter-Occupied Housing Units | 387 | 36.2% |
| Total Occupied Housing Units | 1,068 | 100.0% |
Occupancy by Household Size in Sutton County
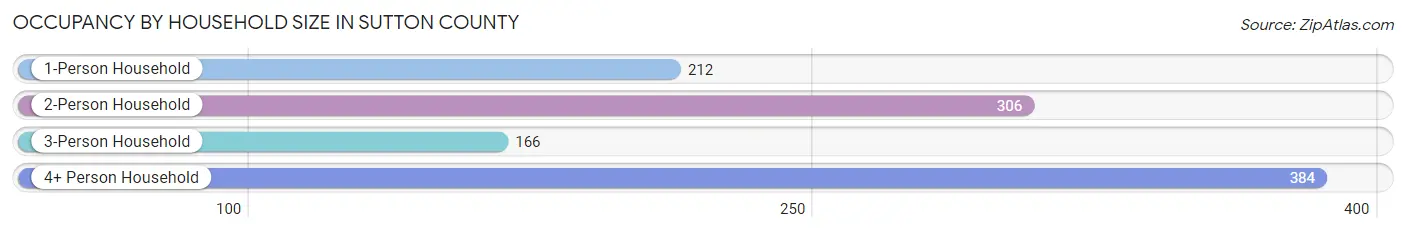
| Household Size | # Housing Units | % Housing Units |
| 1-Person Household | 212 | 19.9% |
| 2-Person Household | 306 | 28.6% |
| 3-Person Household | 166 | 15.5% |
| 4+ Person Household | 384 | 36.0% |
| Total Housing Units | 1,068 | 100.0% |
Occupancy by Ownership by Household Size in Sutton County
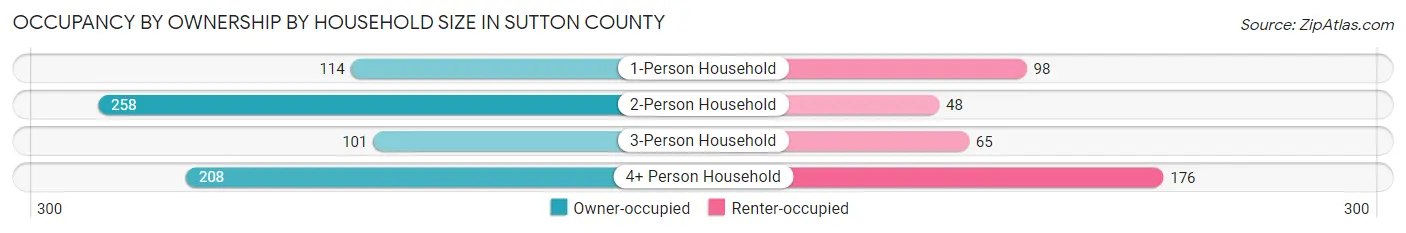
| Household Size | Owner-occupied | Renter-occupied |
| 1-Person Household | 114 (53.8%) | 98 (46.2%) |
| 2-Person Household | 258 (84.3%) | 48 (15.7%) |
| 3-Person Household | 101 (60.8%) | 65 (39.2%) |
| 4+ Person Household | 208 (54.2%) | 176 (45.8%) |
| Total Housing Units | 681 (63.8%) | 387 (36.2%) |
Occupancy by Educational Attainment in Sutton County
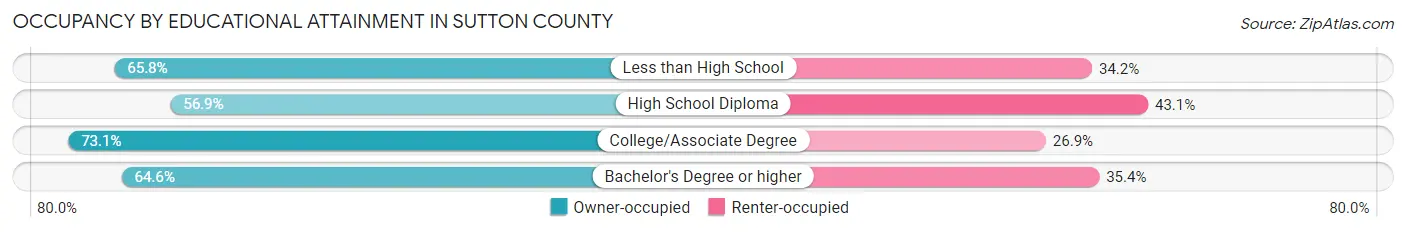
| Household Size | Owner-occupied | Renter-occupied |
| Less than High School | 121 (65.8%) | 63 (34.2%) |
| High School Diploma | 244 (56.9%) | 185 (43.1%) |
| College/Associate Degree | 190 (73.1%) | 70 (26.9%) |
| Bachelor's Degree or higher | 126 (64.6%) | 69 (35.4%) |
Occupancy by Age of Householder in Sutton County
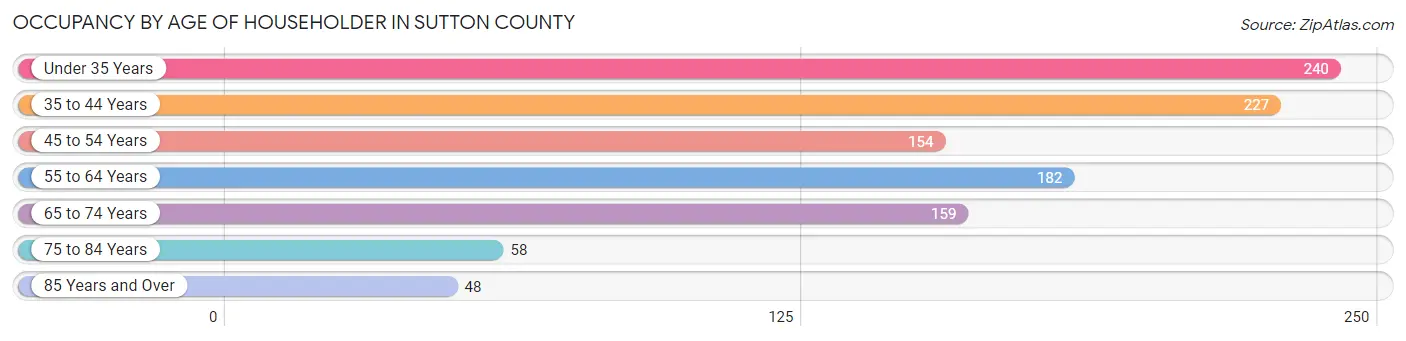
| Age Bracket | # Households | % Households |
| Under 35 Years | 240 | 22.5% |
| 35 to 44 Years | 227 | 21.2% |
| 45 to 54 Years | 154 | 14.4% |
| 55 to 64 Years | 182 | 17.0% |
| 65 to 74 Years | 159 | 14.9% |
| 75 to 84 Years | 58 | 5.4% |
| 85 Years and Over | 48 | 4.5% |
| Total | 1,068 | 100.0% |
Housing Finances in Sutton County
Median Income by Occupancy in Sutton County
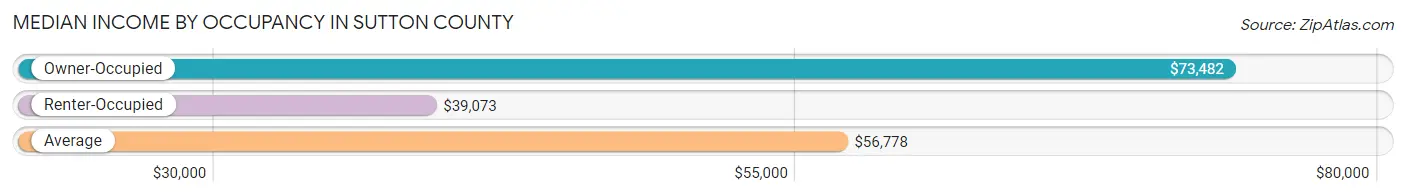
| Occupancy Type | # Households | Median Income |
| Owner-Occupied | 681 (63.8%) | $73,482 |
| Renter-Occupied | 387 (36.2%) | $39,073 |
| Average | 1,068 (100.0%) | $56,778 |
Occupancy by Householder Income Bracket in Sutton County
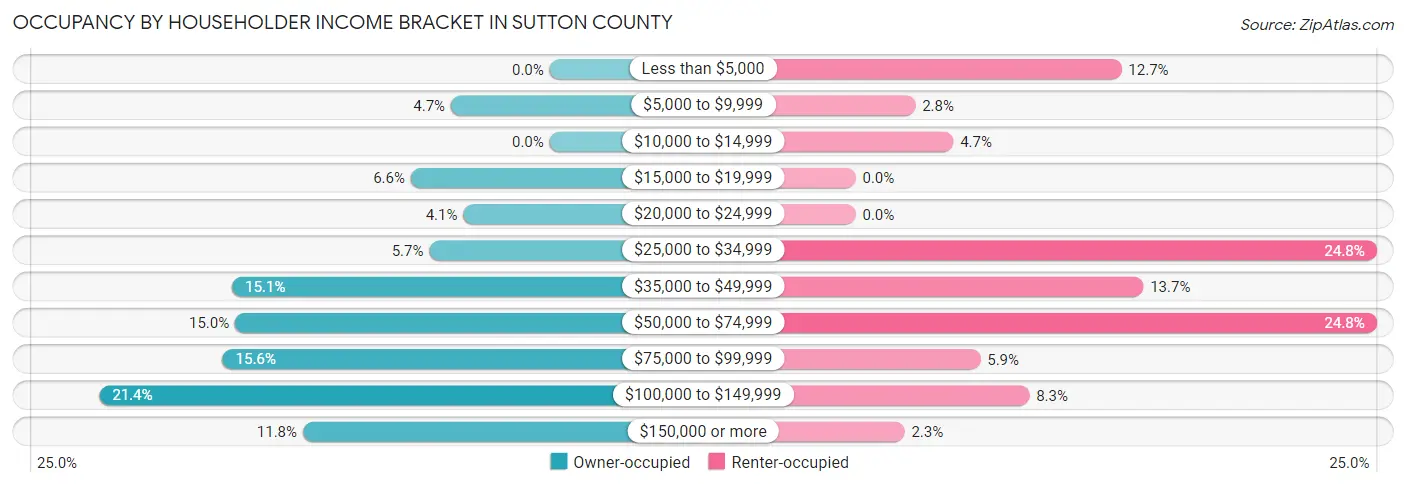
| Income Bracket | Owner-occupied | Renter-occupied |
| Less than $5,000 | 0 (0.0%) | 49 (12.7%) |
| $5,000 to $9,999 | 32 (4.7%) | 11 (2.8%) |
| $10,000 to $14,999 | 0 (0.0%) | 18 (4.6%) |
| $15,000 to $19,999 | 45 (6.6%) | 0 (0.0%) |
| $20,000 to $24,999 | 28 (4.1%) | 0 (0.0%) |
| $25,000 to $34,999 | 39 (5.7%) | 96 (24.8%) |
| $35,000 to $49,999 | 103 (15.1%) | 53 (13.7%) |
| $50,000 to $74,999 | 102 (15.0%) | 96 (24.8%) |
| $75,000 to $99,999 | 106 (15.6%) | 23 (5.9%) |
| $100,000 to $149,999 | 146 (21.4%) | 32 (8.3%) |
| $150,000 or more | 80 (11.7%) | 9 (2.3%) |
| Total | 681 (100.0%) | 387 (100.0%) |
Monthly Housing Cost Tiers in Sutton County
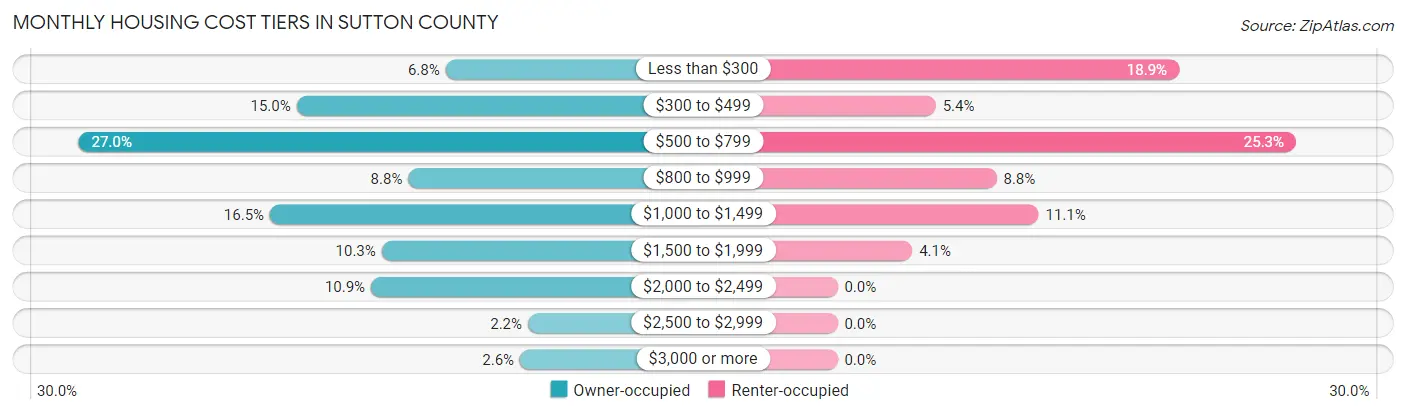
| Monthly Cost | Owner-occupied | Renter-occupied |
| Less than $300 | 46 (6.8%) | 73 (18.9%) |
| $300 to $499 | 102 (15.0%) | 21 (5.4%) |
| $500 to $799 | 184 (27.0%) | 98 (25.3%) |
| $800 to $999 | 60 (8.8%) | 34 (8.8%) |
| $1,000 to $1,499 | 112 (16.5%) | 43 (11.1%) |
| $1,500 to $1,999 | 70 (10.3%) | 16 (4.1%) |
| $2,000 to $2,499 | 74 (10.9%) | 0 (0.0%) |
| $2,500 to $2,999 | 15 (2.2%) | 0 (0.0%) |
| $3,000 or more | 18 (2.6%) | 0 (0.0%) |
| Total | 681 (100.0%) | 387 (100.0%) |
Physical Housing Characteristics in Sutton County
Housing Structures in Sutton County
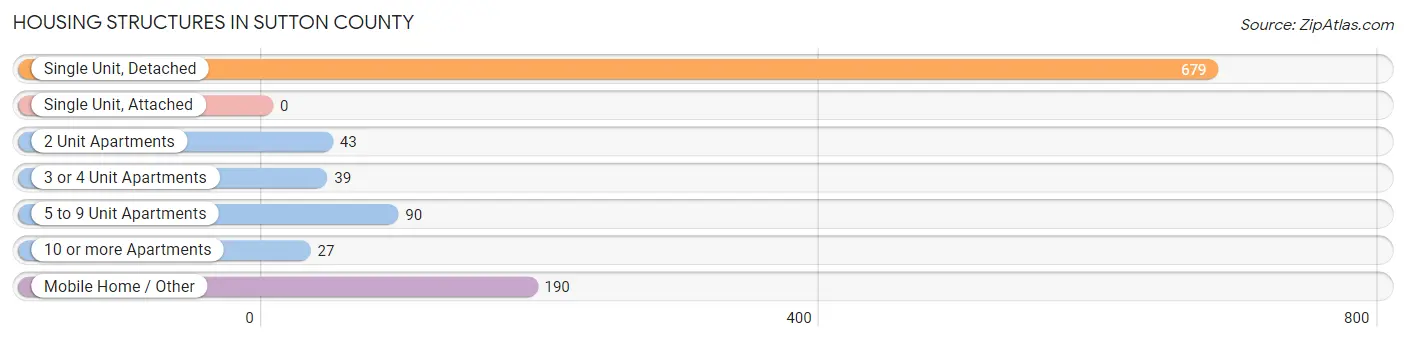
| Structure Type | # Housing Units | % Housing Units |
| Single Unit, Detached | 679 | 63.6% |
| Single Unit, Attached | 0 | 0.0% |
| 2 Unit Apartments | 43 | 4.0% |
| 3 or 4 Unit Apartments | 39 | 3.6% |
| 5 to 9 Unit Apartments | 90 | 8.4% |
| 10 or more Apartments | 27 | 2.5% |
| Mobile Home / Other | 190 | 17.8% |
| Total | 1,068 | 100.0% |
Housing Structures by Occupancy in Sutton County
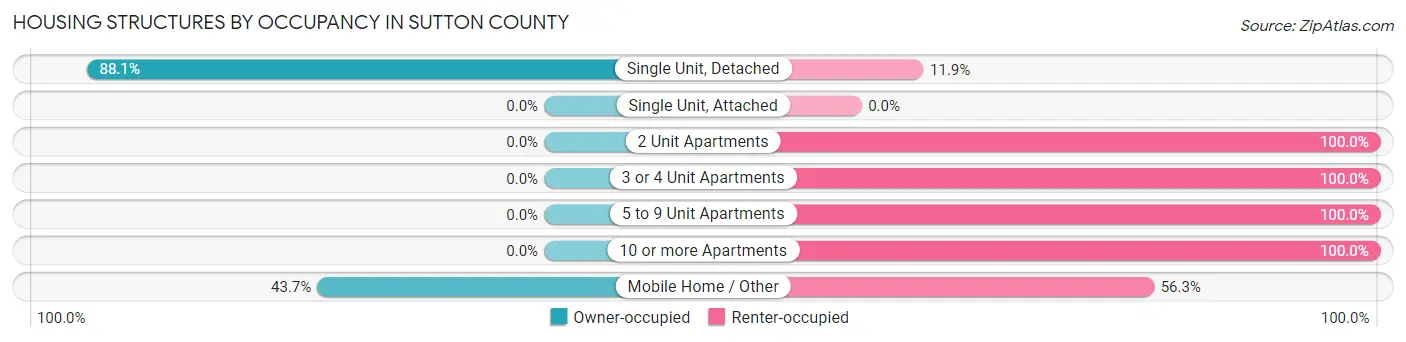
| Structure Type | Owner-occupied | Renter-occupied |
| Single Unit, Detached | 598 (88.1%) | 81 (11.9%) |
| Single Unit, Attached | 0 (0.0%) | 0 (0.0%) |
| 2 Unit Apartments | 0 (0.0%) | 43 (100.0%) |
| 3 or 4 Unit Apartments | 0 (0.0%) | 39 (100.0%) |
| 5 to 9 Unit Apartments | 0 (0.0%) | 90 (100.0%) |
| 10 or more Apartments | 0 (0.0%) | 27 (100.0%) |
| Mobile Home / Other | 83 (43.7%) | 107 (56.3%) |
| Total | 681 (63.8%) | 387 (36.2%) |
Housing Structures by Number of Rooms in Sutton County
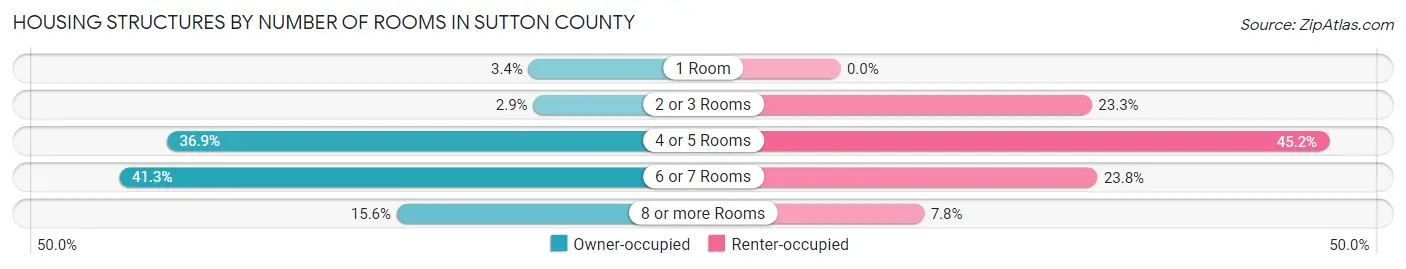
| Number of Rooms | Owner-occupied | Renter-occupied |
| 1 Room | 23 (3.4%) | 0 (0.0%) |
| 2 or 3 Rooms | 20 (2.9%) | 90 (23.3%) |
| 4 or 5 Rooms | 251 (36.9%) | 175 (45.2%) |
| 6 or 7 Rooms | 281 (41.3%) | 92 (23.8%) |
| 8 or more Rooms | 106 (15.6%) | 30 (7.7%) |
| Total | 681 (100.0%) | 387 (100.0%) |
Housing Structure by Heating Type in Sutton County
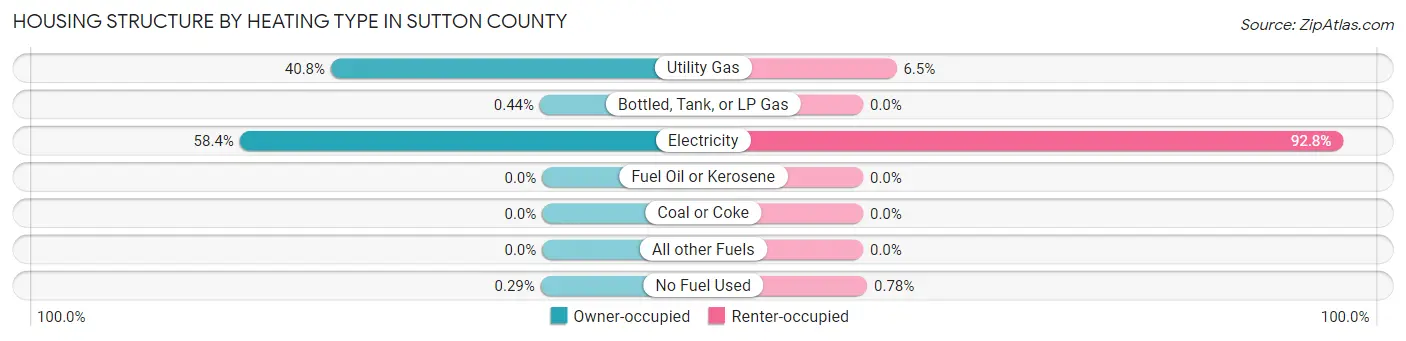
| Heating Type | Owner-occupied | Renter-occupied |
| Utility Gas | 278 (40.8%) | 25 (6.5%) |
| Bottled, Tank, or LP Gas | 3 (0.4%) | 0 (0.0%) |
| Electricity | 398 (58.4%) | 359 (92.8%) |
| Fuel Oil or Kerosene | 0 (0.0%) | 0 (0.0%) |
| Coal or Coke | 0 (0.0%) | 0 (0.0%) |
| All other Fuels | 0 (0.0%) | 0 (0.0%) |
| No Fuel Used | 2 (0.3%) | 3 (0.8%) |
| Total | 681 (100.0%) | 387 (100.0%) |
Household Vehicle Usage in Sutton County
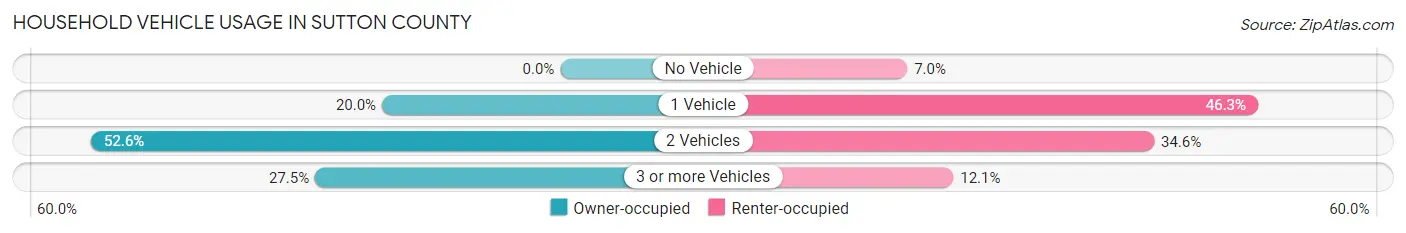
| Vehicles per Household | Owner-occupied | Renter-occupied |
| No Vehicle | 0 (0.0%) | 27 (7.0%) |
| 1 Vehicle | 136 (20.0%) | 179 (46.3%) |
| 2 Vehicles | 358 (52.6%) | 134 (34.6%) |
| 3 or more Vehicles | 187 (27.5%) | 47 (12.1%) |
| Total | 681 (100.0%) | 387 (100.0%) |
Real Estate & Mortgages in Sutton County
Real Estate and Mortgage Overview in Sutton County
| Characteristic | Without Mortgage | With Mortgage |
| Housing Units | 358 | 323 |
| Median Property Value | $94,100 | $181,900 |
| Median Household Income | $58,636 | $64 |
| Monthly Housing Costs | $541 | $18 |
| Real Estate Taxes | $1,335 | $0 |
Property Value by Mortgage Status in Sutton County
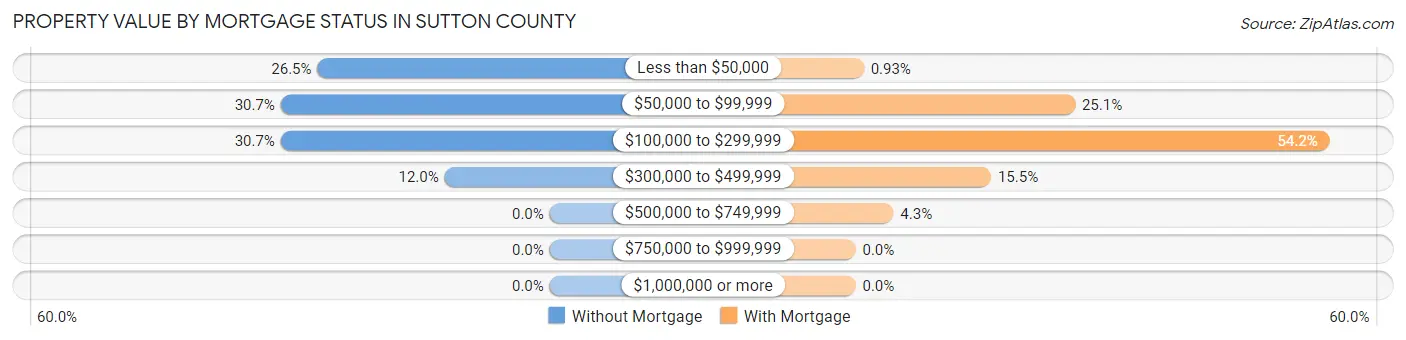
| Property Value | Without Mortgage | With Mortgage |
| Less than $50,000 | 95 (26.5%) | 3 (0.9%) |
| $50,000 to $99,999 | 110 (30.7%) | 81 (25.1%) |
| $100,000 to $299,999 | 110 (30.7%) | 175 (54.2%) |
| $300,000 to $499,999 | 43 (12.0%) | 50 (15.5%) |
| $500,000 to $749,999 | 0 (0.0%) | 14 (4.3%) |
| $750,000 to $999,999 | 0 (0.0%) | 0 (0.0%) |
| $1,000,000 or more | 0 (0.0%) | 0 (0.0%) |
| Total | 358 (100.0%) | 323 (100.0%) |
Household Income by Mortgage Status in Sutton County
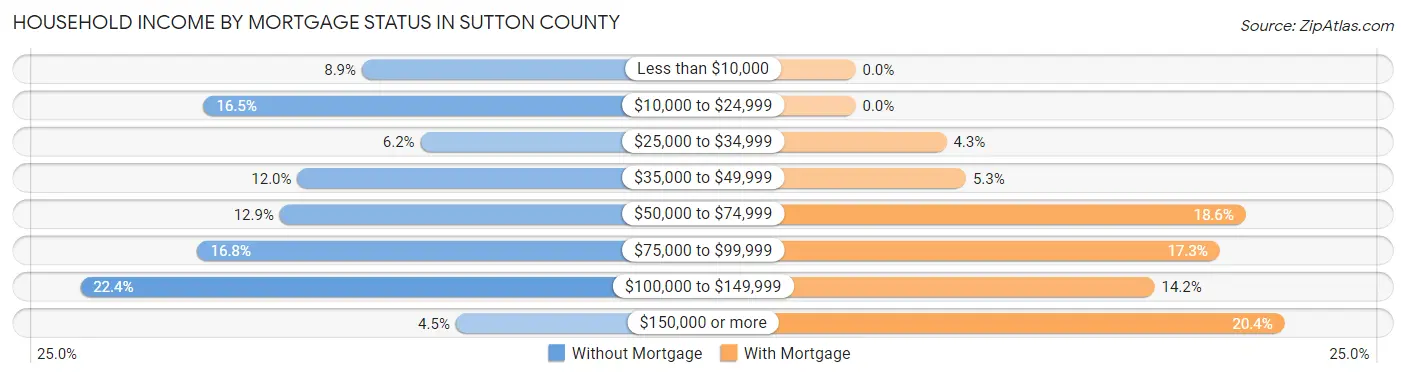
| Household Income | Without Mortgage | With Mortgage |
| Less than $10,000 | 32 (8.9%) | 0 (0.0%) |
| $10,000 to $24,999 | 59 (16.5%) | 0 (0.0%) |
| $25,000 to $34,999 | 22 (6.1%) | 14 (4.3%) |
| $35,000 to $49,999 | 43 (12.0%) | 17 (5.3%) |
| $50,000 to $74,999 | 46 (12.9%) | 60 (18.6%) |
| $75,000 to $99,999 | 60 (16.8%) | 56 (17.3%) |
| $100,000 to $149,999 | 80 (22.4%) | 46 (14.2%) |
| $150,000 or more | 16 (4.5%) | 66 (20.4%) |
| Total | 358 (100.0%) | 323 (100.0%) |
Property Value to Household Income Ratio in Sutton County
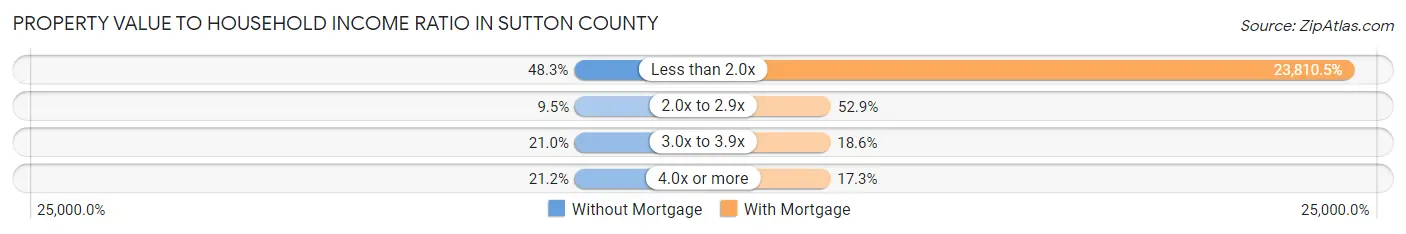
| Value-to-Income Ratio | Without Mortgage | With Mortgage |
| Less than 2.0x | 173 (48.3%) | 76,908 (23,810.5%) |
| 2.0x to 2.9x | 34 (9.5%) | 171 (52.9%) |
| 3.0x to 3.9x | 75 (20.9%) | 60 (18.6%) |
| 4.0x or more | 76 (21.2%) | 56 (17.3%) |
| Total | 358 (100.0%) | 323 (100.0%) |
Real Estate Taxes by Mortgage Status in Sutton County
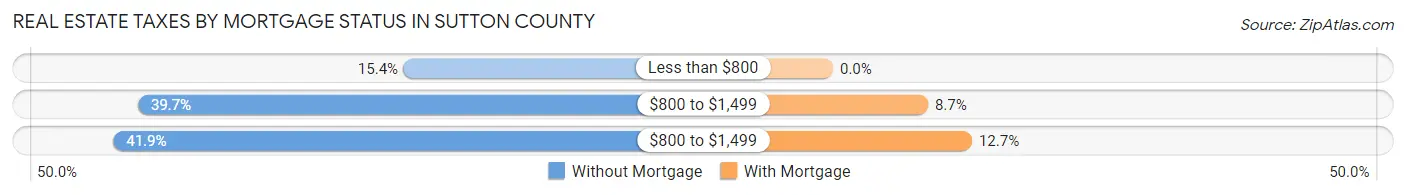
| Property Taxes | Without Mortgage | With Mortgage |
| Less than $800 | 55 (15.4%) | 0 (0.0%) |
| $800 to $1,499 | 142 (39.7%) | 28 (8.7%) |
| $800 to $1,499 | 150 (41.9%) | 41 (12.7%) |
| Total | 358 (100.0%) | 323 (100.0%) |
Health & Disability in Sutton County
Health Insurance Coverage by Age in Sutton County
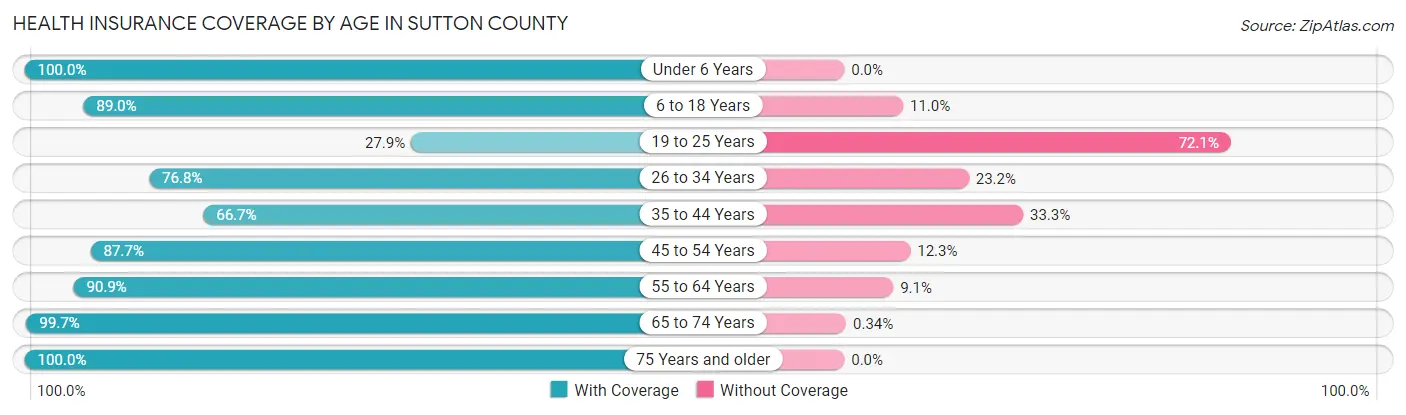
| Age Bracket | With Coverage | Without Coverage |
| Under 6 Years | 256 (100.0%) | 0 (0.0%) |
| 6 to 18 Years | 877 (89.0%) | 108 (11.0%) |
| 19 to 25 Years | 38 (27.9%) | 98 (72.1%) |
| 26 to 34 Years | 367 (76.8%) | 111 (23.2%) |
| 35 to 44 Years | 330 (66.7%) | 165 (33.3%) |
| 45 to 54 Years | 228 (87.7%) | 32 (12.3%) |
| 55 to 64 Years | 249 (90.9%) | 25 (9.1%) |
| 65 to 74 Years | 295 (99.7%) | 1 (0.3%) |
| 75 Years and older | 146 (100.0%) | 0 (0.0%) |
| Total | 2,786 (83.8%) | 540 (16.2%) |
Health Insurance Coverage by Citizenship Status in Sutton County
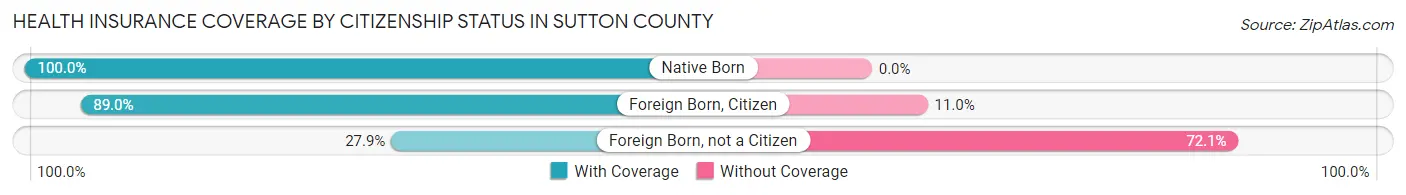
| Citizenship Status | With Coverage | Without Coverage |
| Native Born | 256 (100.0%) | 0 (0.0%) |
| Foreign Born, Citizen | 877 (89.0%) | 108 (11.0%) |
| Foreign Born, not a Citizen | 38 (27.9%) | 98 (72.1%) |
Health Insurance Coverage by Household Income in Sutton County
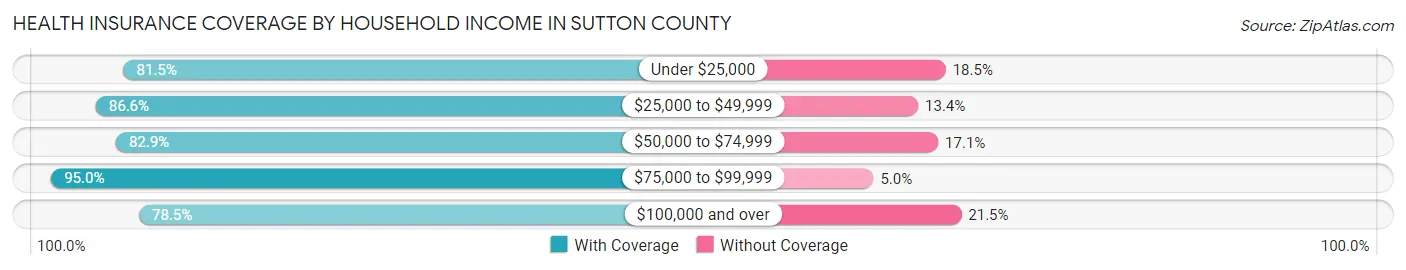
| Household Income | With Coverage | Without Coverage |
| Under $25,000 | 312 (81.5%) | 71 (18.5%) |
| $25,000 to $49,999 | 759 (86.6%) | 117 (13.4%) |
| $50,000 to $74,999 | 639 (82.9%) | 132 (17.1%) |
| $75,000 to $99,999 | 342 (95.0%) | 18 (5.0%) |
| $100,000 and over | 732 (78.5%) | 200 (21.5%) |
Public vs Private Health Insurance Coverage by Age in Sutton County
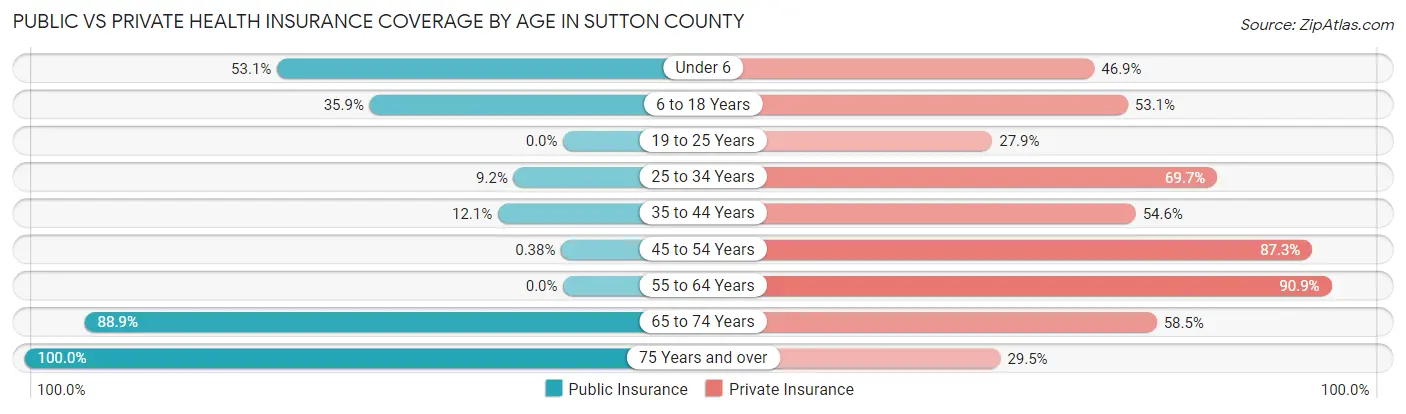
| Age Bracket | Public Insurance | Private Insurance |
| Under 6 | 136 (53.1%) | 120 (46.9%) |
| 6 to 18 Years | 354 (35.9%) | 523 (53.1%) |
| 19 to 25 Years | 0 (0.0%) | 38 (27.9%) |
| 25 to 34 Years | 44 (9.2%) | 333 (69.7%) |
| 35 to 44 Years | 60 (12.1%) | 270 (54.5%) |
| 45 to 54 Years | 1 (0.4%) | 227 (87.3%) |
| 55 to 64 Years | 0 (0.0%) | 249 (90.9%) |
| 65 to 74 Years | 263 (88.8%) | 173 (58.5%) |
| 75 Years and over | 146 (100.0%) | 43 (29.4%) |
| Total | 1,004 (30.2%) | 1,976 (59.4%) |
Disability Status by Sex by Age in Sutton County
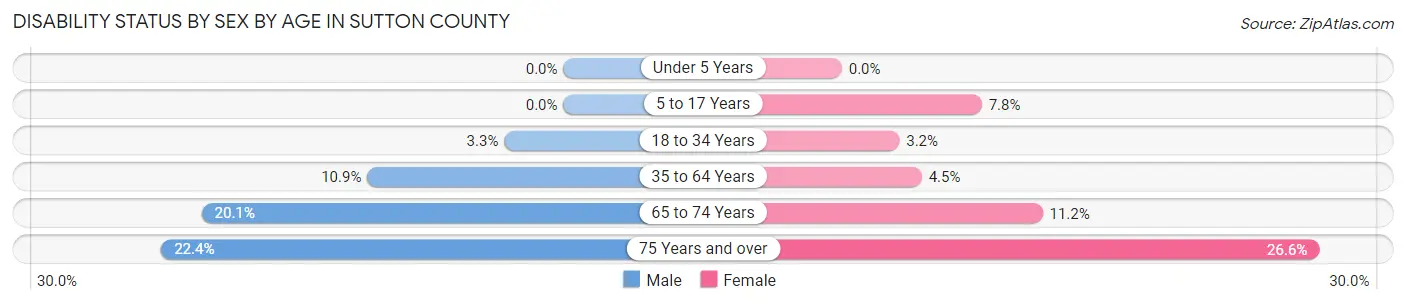
| Age Bracket | Male | Female |
| Under 5 Years | 0 (0.0%) | 0 (0.0%) |
| 5 to 17 Years | 0 (0.0%) | 30 (7.8%) |
| 18 to 34 Years | 11 (3.3%) | 14 (3.2%) |
| 35 to 64 Years | 51 (10.9%) | 25 (4.4%) |
| 65 to 74 Years | 29 (20.1%) | 17 (11.2%) |
| 75 Years and over | 15 (22.4%) | 21 (26.6%) |
Disability Class by Sex by Age in Sutton County
Disability Class: Hearing Difficulty
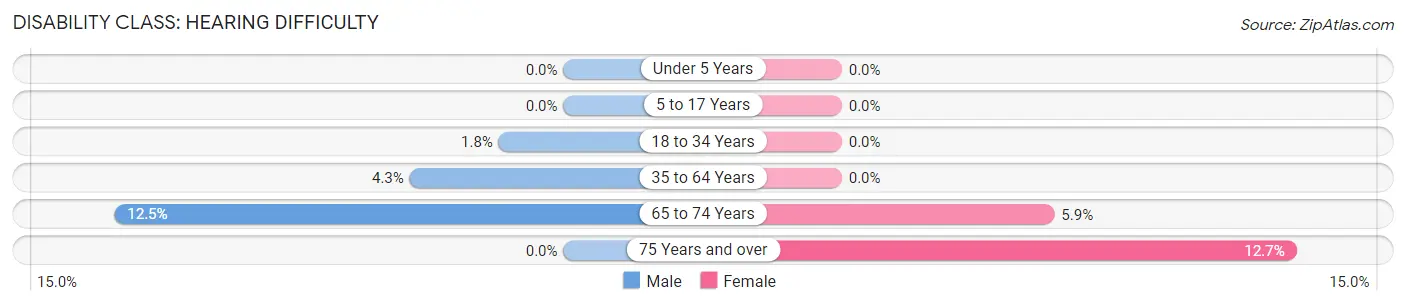
| Age Bracket | Male | Female |
| Under 5 Years | 0 (0.0%) | 0 (0.0%) |
| 5 to 17 Years | 0 (0.0%) | 0 (0.0%) |
| 18 to 34 Years | 6 (1.8%) | 0 (0.0%) |
| 35 to 64 Years | 20 (4.3%) | 0 (0.0%) |
| 65 to 74 Years | 18 (12.5%) | 9 (5.9%) |
| 75 Years and over | 0 (0.0%) | 10 (12.7%) |
Disability Class: Vision Difficulty
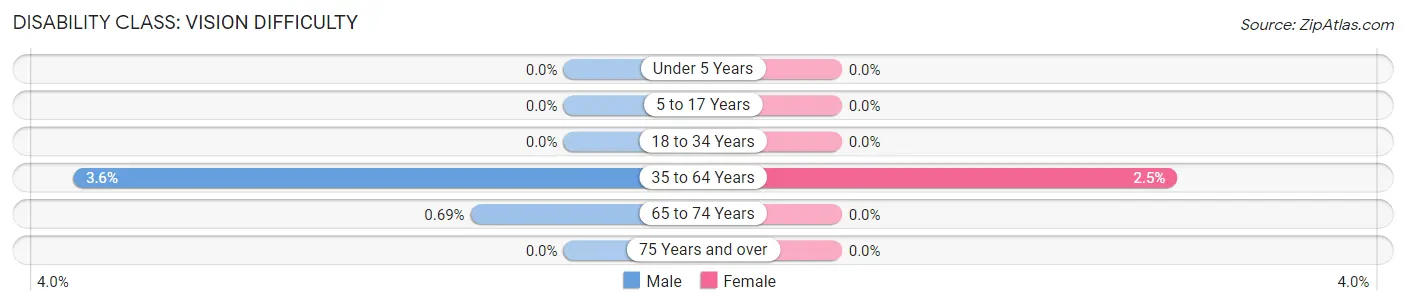
| Age Bracket | Male | Female |
| Under 5 Years | 0 (0.0%) | 0 (0.0%) |
| 5 to 17 Years | 0 (0.0%) | 0 (0.0%) |
| 18 to 34 Years | 0 (0.0%) | 0 (0.0%) |
| 35 to 64 Years | 17 (3.6%) | 14 (2.5%) |
| 65 to 74 Years | 1 (0.7%) | 0 (0.0%) |
| 75 Years and over | 0 (0.0%) | 0 (0.0%) |
Disability Class: Cognitive Difficulty
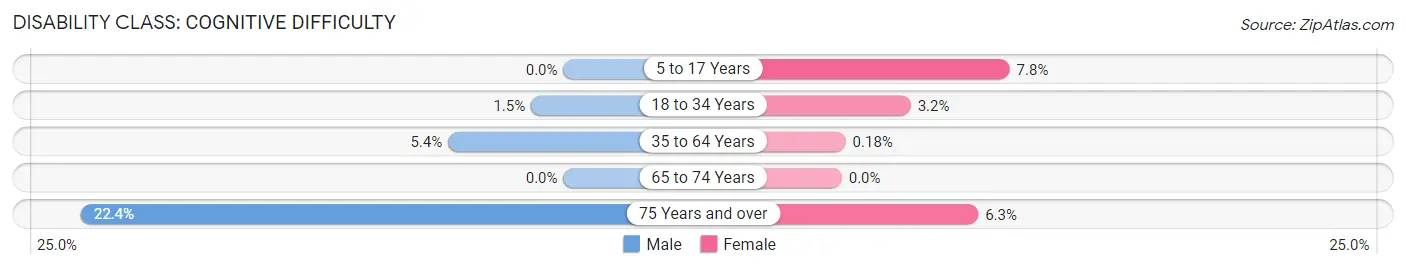
| Age Bracket | Male | Female |
| 5 to 17 Years | 0 (0.0%) | 30 (7.8%) |
| 18 to 34 Years | 5 (1.5%) | 14 (3.2%) |
| 35 to 64 Years | 25 (5.3%) | 1 (0.2%) |
| 65 to 74 Years | 0 (0.0%) | 0 (0.0%) |
| 75 Years and over | 15 (22.4%) | 5 (6.3%) |
Disability Class: Ambulatory Difficulty
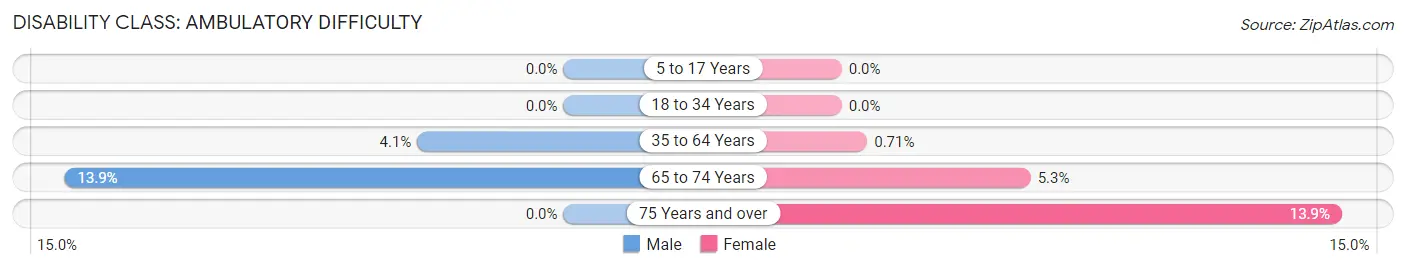
| Age Bracket | Male | Female |
| 5 to 17 Years | 0 (0.0%) | 0 (0.0%) |
| 18 to 34 Years | 0 (0.0%) | 0 (0.0%) |
| 35 to 64 Years | 19 (4.1%) | 4 (0.7%) |
| 65 to 74 Years | 20 (13.9%) | 8 (5.3%) |
| 75 Years and over | 0 (0.0%) | 11 (13.9%) |
Disability Class: Self-Care Difficulty
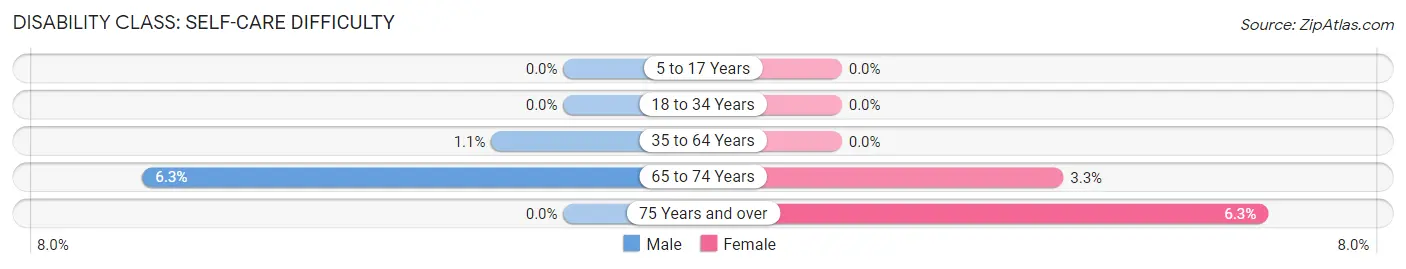
| Age Bracket | Male | Female |
| 5 to 17 Years | 0 (0.0%) | 0 (0.0%) |
| 18 to 34 Years | 0 (0.0%) | 0 (0.0%) |
| 35 to 64 Years | 5 (1.1%) | 0 (0.0%) |
| 65 to 74 Years | 9 (6.2%) | 5 (3.3%) |
| 75 Years and over | 0 (0.0%) | 5 (6.3%) |
Technology Access in Sutton County
Computing Device Access in Sutton County
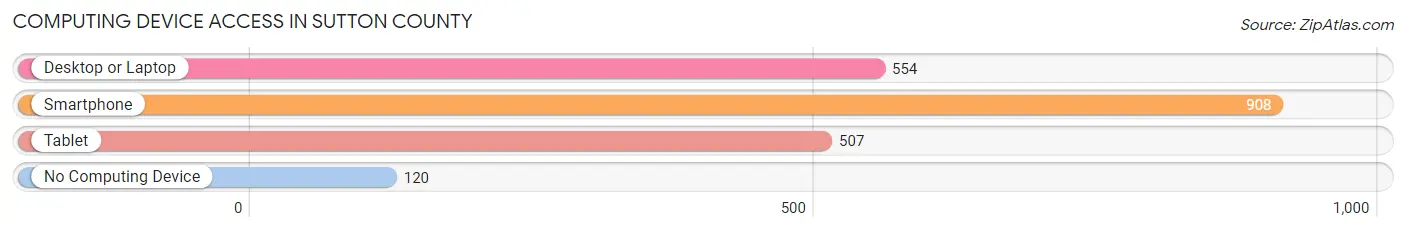
| Device Type | # Households | % Households |
| Desktop or Laptop | 554 | 51.9% |
| Smartphone | 908 | 85.0% |
| Tablet | 507 | 47.5% |
| No Computing Device | 120 | 11.2% |
| Total | 1,068 | 100.0% |
Internet Access in Sutton County
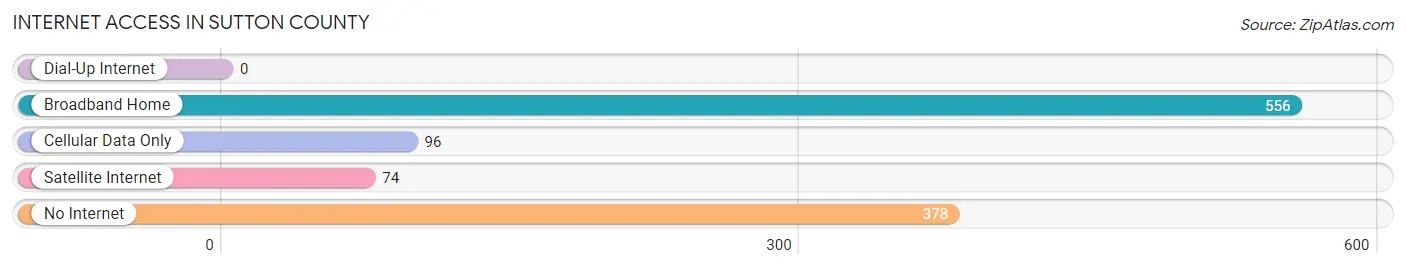
| Internet Type | # Households | % Households |
| Dial-Up Internet | 0 | 0.0% |
| Broadband Home | 556 | 52.1% |
| Cellular Data Only | 96 | 9.0% |
| Satellite Internet | 74 | 6.9% |
| No Internet | 378 | 35.4% |
| Total | 1,068 | 100.0% |
Sutton County Summary
Sutton County is located in the western part of the state of Texas, in the Edwards Plateau region. It is bordered by Crockett County to the north, Schleicher County to the east, Edwards County to the south, and Val Verde County to the west. The county seat is Sonora, and the largest city is Sonora. The county was named for John S. Sutton, a soldier in the Texas Revolution.
Geography
Sutton County covers an area of 1,072 square miles, making it the second-smallest county in Texas. The terrain is mostly flat, with some rolling hills in the western part of the county. The county is drained by the Nueces River and its tributaries. The climate is semi-arid, with hot summers and mild winters.
The county is home to several state parks, including Kickapoo Cavern State Park, which features a variety of caves and rock formations. Other attractions include the Sutton County Museum, which houses artifacts from the county’s history, and the Sonora Opera House, which hosts a variety of performances.
Economy
The economy of Sutton County is largely based on agriculture and ranching. The county is home to several large ranches, including the historic Pitchfork Ranch. The county is also home to several oil and gas fields, which provide jobs for many of the county’s residents.
The county’s largest employer is the Sonora Independent School District, which employs over 1,000 people. Other major employers include the Sutton County Hospital, the Sonora State Bank, and the Sonora Livestock Auction.
Demographics
As of the 2010 census, the population of Sutton County was 4,128. The population is largely white (83.3%), with a small Hispanic population (14.2%). The median household income is $37,941, and the median age is 38.7.
The county is home to several small towns, including Sonora, the county seat, and Eldorado, the largest town in the county. Other towns include Sonora, Eldorado, and Ozona.
Conclusion
Sutton County is a small county in the western part of Texas. It is home to several state parks, ranches, and oil and gas fields. The economy is largely based on agriculture and ranching, and the county’s largest employer is the Sonora Independent School District. The population is largely white, with a small Hispanic population. Sutton County is a great place to live and work, and it offers a variety of attractions and activities for residents and visitors alike.
Common Questions
What is Per Capita Income in Sutton County?
Per Capita income in Sutton County is $22,836.
What is the Median Family Income in Sutton County?
Median Family Income in Sutton County is $57,113.
What is the Median Household income in Sutton County?
Median Household Income in Sutton County is $56,778.
What is Income or Wage Gap in Sutton County?
Income or Wage Gap in Sutton County is 64.9%.
Women in Sutton County earn 35.1 cents for every dollar earned by a man.
What is Inequality or Gini Index in Sutton County?
Inequality or Gini Index in Sutton County is 0.41.
What is the Total Population of Sutton County?
Total Population of Sutton County is 3,345.
What is the Total Male Population of Sutton County?
Total Male Population of Sutton County is 1,651.
What is the Total Female Population of Sutton County?
Total Female Population of Sutton County is 1,694.
What is the Ratio of Males per 100 Females in Sutton County?
There are 97.46 Males per 100 Females in Sutton County.
What is the Ratio of Females per 100 Males in Sutton County?
There are 102.60 Females per 100 Males in Sutton County.
What is the Median Population Age in Sutton County?
Median Population Age in Sutton County is 31.3 Years.
What is the Average Family Size in Sutton County
Average Family Size in Sutton County is 3.6 People.
What is the Average Household Size in Sutton County
Average Household Size in Sutton County is 3.1 People.
How Large is the Labor Force in Sutton County?
There are 1,501 People in the Labor Forcein in Sutton County.
What is the Percentage of People in the Labor Force in Sutton County?
65.4% of People are in the Labor Force in Sutton County.
What is the Unemployment Rate in Sutton County?
Unemployment Rate in Sutton County is 4.7%.