Stonewall County, TX Map & Demographics
Stonewall County Map
Stonewall County Overview
$26,733
PER CAPITA INCOME
$82,176
AVG FAMILY INCOME
$66,591
AVG HOUSEHOLD INCOME
56.0%
WAGE / INCOME GAP [ % ]
44.0¢/ $1
WAGE / INCOME GAP [ $ ]
0.43
INEQUALITY / GINI INDEX
1,331
TOTAL POPULATION
681
MALE POPULATION
650
FEMALE POPULATION
104.77
MALES / 100 FEMALES
95.45
FEMALES / 100 MALES
33.5
MEDIAN AGE
3.5
AVG FAMILY SIZE
2.9
AVG HOUSEHOLD SIZE
679
LABOR FORCE [ PEOPLE ]
66.2%
PERCENT IN LABOR FORCE
1.8%
UNEMPLOYMENT RATE
Income in Stonewall County
Income Overview in Stonewall County
Per Capita Income in Stonewall County is $26,733, while median incomes of families and households are $82,176 and $66,591 respectively.
| Characteristic | Number | Measure |
| Per Capita Income | 1,331 | $26,733 |
| Median Family Income | 315 | $82,176 |
| Mean Family Income | 315 | $93,728 |
| Median Household Income | 450 | $66,591 |
| Mean Household Income | 450 | $75,657 |
| Income Deficit | 315 | $0 |
| Wage / Income Gap (%) | 1,331 | 55.96% |
| Wage / Income Gap ($) | 1,331 | 44.04¢ per $1 |
| Gini / Inequality Index | 1,331 | 0.43 |
Earnings by Sex in Stonewall County
Average Earnings in Stonewall County are $28,578, $47,022 for men and $20,707 for women, a difference of 56.0%.
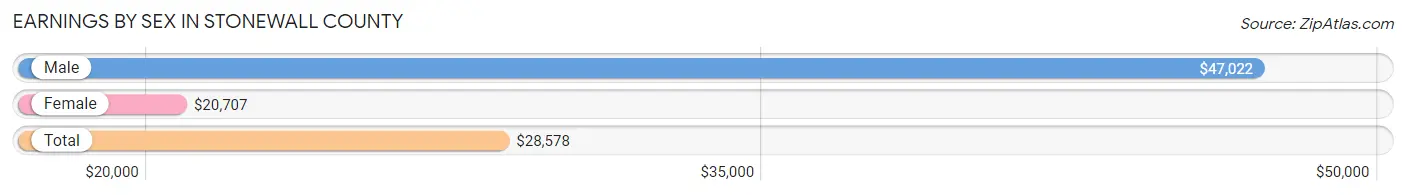
| Sex | Number | Average Earnings |
| Male | 369 (50.7%) | $47,022 |
| Female | 359 (49.3%) | $20,707 |
| Total | 728 (100.0%) | $28,578 |
Earnings by Sex by Income Bracket in Stonewall County
The most common earnings brackets in Stonewall County are $45,000 to $49,999 for men (52 | 14.1%) and $25,000 to $29,999 for women (68 | 18.9%).
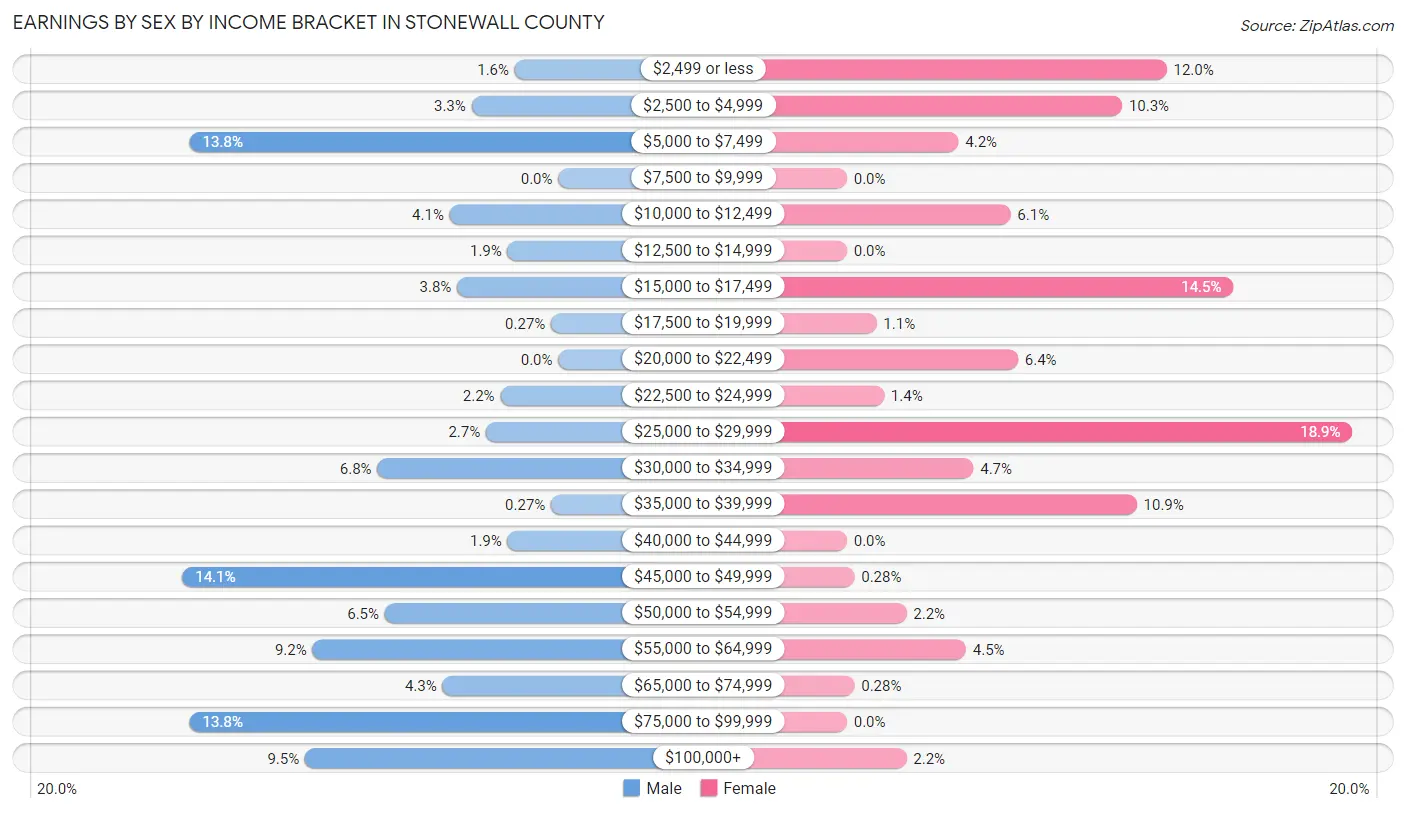
| Income | Male | Female |
| $2,499 or less | 6 (1.6%) | 43 (12.0%) |
| $2,500 to $4,999 | 12 (3.3%) | 37 (10.3%) |
| $5,000 to $7,499 | 51 (13.8%) | 15 (4.2%) |
| $7,500 to $9,999 | 0 (0.0%) | 0 (0.0%) |
| $10,000 to $12,499 | 15 (4.1%) | 22 (6.1%) |
| $12,500 to $14,999 | 7 (1.9%) | 0 (0.0%) |
| $15,000 to $17,499 | 14 (3.8%) | 52 (14.5%) |
| $17,500 to $19,999 | 1 (0.3%) | 4 (1.1%) |
| $20,000 to $22,499 | 0 (0.0%) | 23 (6.4%) |
| $22,500 to $24,999 | 8 (2.2%) | 5 (1.4%) |
| $25,000 to $29,999 | 10 (2.7%) | 68 (18.9%) |
| $30,000 to $34,999 | 25 (6.8%) | 17 (4.7%) |
| $35,000 to $39,999 | 1 (0.3%) | 39 (10.9%) |
| $40,000 to $44,999 | 7 (1.9%) | 0 (0.0%) |
| $45,000 to $49,999 | 52 (14.1%) | 1 (0.3%) |
| $50,000 to $54,999 | 24 (6.5%) | 8 (2.2%) |
| $55,000 to $64,999 | 34 (9.2%) | 16 (4.5%) |
| $65,000 to $74,999 | 16 (4.3%) | 1 (0.3%) |
| $75,000 to $99,999 | 51 (13.8%) | 0 (0.0%) |
| $100,000+ | 35 (9.5%) | 8 (2.2%) |
| Total | 369 (100.0%) | 359 (100.0%) |
Earnings by Sex by Educational Attainment in Stonewall County
Average earnings in Stonewall County are $48,819 for men and $28,556 for women, a difference of 41.5%. Men with an educational attainment of college or associate's degree enjoy the highest average annual earnings of $49,583, while those with less than high school education earn the least with $33,250. Women with an educational attainment of graduate degree earn the most with the average annual earnings of $123,125, while those with high school diploma education have the smallest earnings of $27,438.
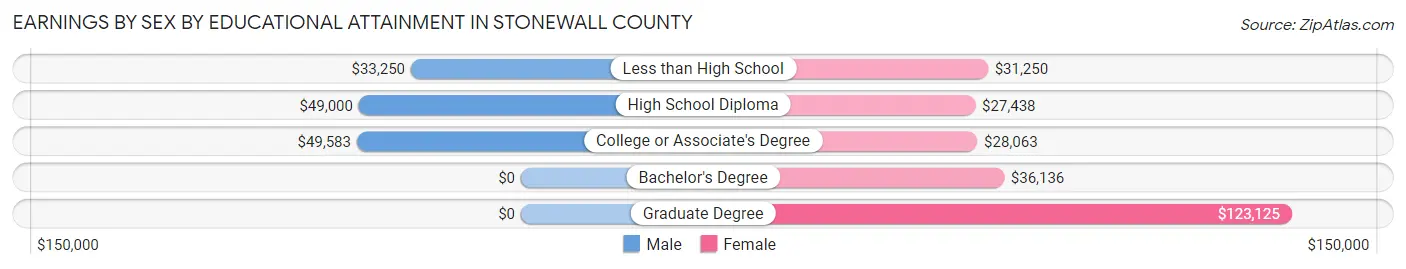
| Educational Attainment | Male Income | Female Income |
| Less than High School | $33,250 | $31,250 |
| High School Diploma | $49,000 | $27,438 |
| College or Associate's Degree | $49,583 | $28,063 |
| Bachelor's Degree | - | - |
| Graduate Degree | - | - |
| Total | $48,819 | $28,556 |
Family Income in Stonewall County
Family Income Brackets in Stonewall County
According to the Stonewall County family income data, there are 86 families falling into the $100,000 to $149,999 income range, which is the most common income bracket and makes up 27.3% of all families.
| Income Bracket | # Families | % Families |
| Less than $10,000 | 0 | 0.0% |
| $10,000 to $14,999 | 0 | 0.0% |
| $15,000 to $24,999 | 4 | 1.3% |
| $25,000 to $34,999 | 56 | 17.8% |
| $35,000 to $49,999 | 25 | 7.9% |
| $50,000 to $74,999 | 45 | 14.3% |
| $75,000 to $99,999 | 66 | 21.0% |
| $100,000 to $149,999 | 86 | 27.3% |
| $150,000 to $199,999 | 20 | 6.3% |
| $200,000+ | 13 | 4.1% |
Family Income by Famaliy Size in Stonewall County
2-person families (141 | 44.8%) account for the highest median family income in Stonewall County with $92,969 per family, while 2-person families (141 | 44.8%) have the highest median income of $46,484 per family member.
| Income Bracket | # Families | Median Income |
| 2-Person Families | 141 (44.8%) | $92,969 |
| 3-Person Families | 58 (18.4%) | $71,250 |
| 4-Person Families | 72 (22.9%) | $88,750 |
| 5-Person Families | 34 (10.8%) | $0 |
| 6-Person Families | 0 (0.0%) | $0 |
| 7+ Person Families | 10 (3.2%) | $0 |
| Total | 315 (100.0%) | $82,176 |
Family Income by Number of Earners in Stonewall County
The median family income in Stonewall County is $82,176, with families comprising 3+ earners (42) having the highest median family income of $103,194, while families with no earners (24) have the lowest median family income of $31,875, accounting for 13.3% and 7.6% of families, respectively.
| Number of Earners | # Families | Median Income |
| No Earners | 24 (7.6%) | $31,875 |
| 1 Earner | 74 (23.5%) | $41,667 |
| 2 Earners | 175 (55.6%) | $94,219 |
| 3+ Earners | 42 (13.3%) | $103,194 |
| Total | 315 (100.0%) | $82,176 |
Household Income in Stonewall County
Household Income Brackets in Stonewall County
With 91 households falling in the category, the $100,000 to $149,999 income range is the most frequent in Stonewall County, accounting for 20.2% of all households. In contrast, only 7 households (1.6%) fall into the $10,000 to $14,999 income bracket, making it the least populous group.
| Income Bracket | # Households | % Households |
| Less than $10,000 | 30 | 6.7% |
| $10,000 to $14,999 | 7 | 1.6% |
| $15,000 to $24,999 | 47 | 10.4% |
| $25,000 to $34,999 | 65 | 14.4% |
| $35,000 to $49,999 | 42 | 9.3% |
| $50,000 to $74,999 | 51 | 11.3% |
| $75,000 to $99,999 | 83 | 18.4% |
| $100,000 to $149,999 | 91 | 20.2% |
| $150,000 to $199,999 | 21 | 4.7% |
| $200,000+ | 13 | 2.9% |
Household Income by Householder Age in Stonewall County
The median household income in Stonewall County is $66,591, with the highest median household income of $86,250 found in the 45 to 64 years age bracket for the primary householder. A total of 184 households (40.9%) fall into this category. Meanwhile, the 65+ years age bracket for the primary householder has the lowest median household income of $31,875, with 158 households (35.1%) in this group.
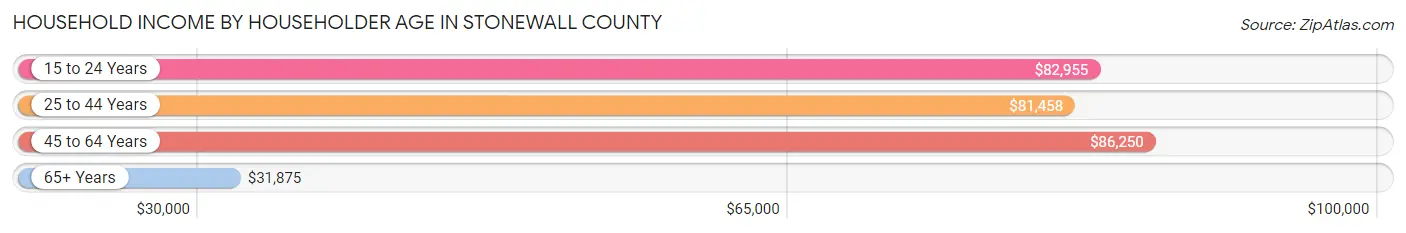
| Income Bracket | # Households | Median Income |
| 15 to 24 Years | 34 (7.6%) | $82,955 |
| 25 to 44 Years | 74 (16.4%) | $81,458 |
| 45 to 64 Years | 184 (40.9%) | $86,250 |
| 65+ Years | 158 (35.1%) | $31,875 |
| Total | 450 (100.0%) | $66,591 |
Poverty in Stonewall County
Income Below Poverty by Sex and Age in Stonewall County
With 6.5% poverty level for males and 7.6% for females among the residents of Stonewall County, 55 to 64 year old males and 5 year old females are the most vulnerable to poverty, with 19 males (25.7%) and 6 females (66.7%) in their respective age groups living below the poverty level.
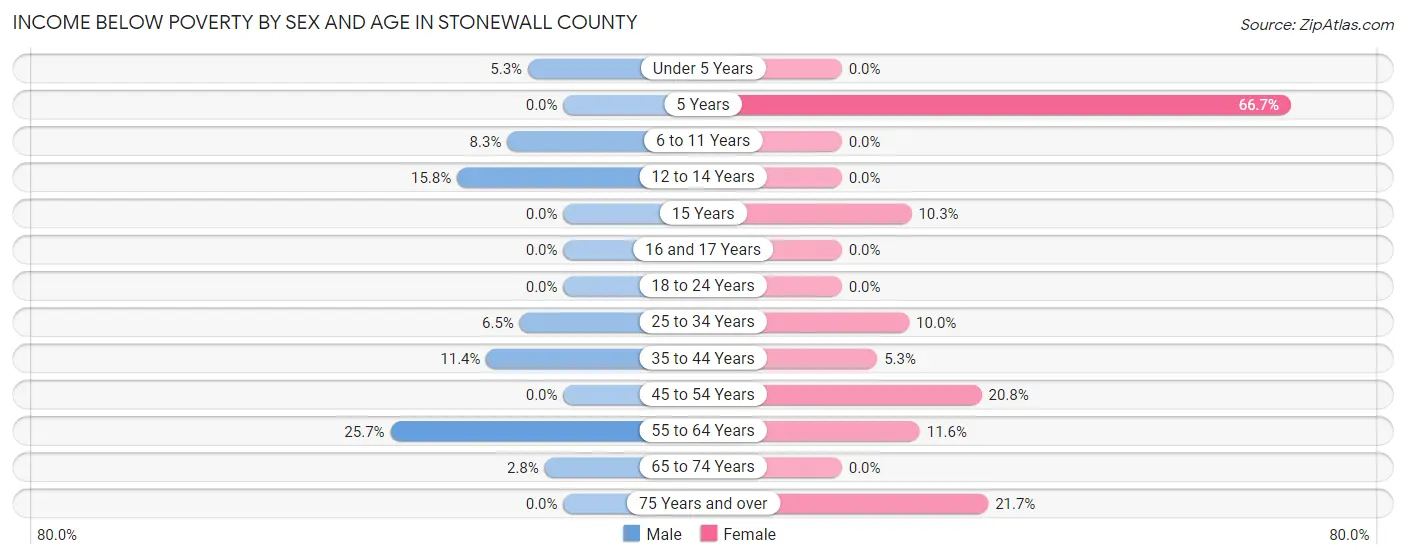
| Age Bracket | Male | Female |
| Under 5 Years | 4 (5.3%) | 0 (0.0%) |
| 5 Years | 0 (0.0%) | 6 (66.7%) |
| 6 to 11 Years | 3 (8.3%) | 0 (0.0%) |
| 12 to 14 Years | 6 (15.8%) | 0 (0.0%) |
| 15 Years | 0 (0.0%) | 3 (10.3%) |
| 16 and 17 Years | 0 (0.0%) | 0 (0.0%) |
| 18 to 24 Years | 0 (0.0%) | 0 (0.0%) |
| 25 to 34 Years | 5 (6.5%) | 4 (10.0%) |
| 35 to 44 Years | 4 (11.4%) | 3 (5.3%) |
| 45 to 54 Years | 0 (0.0%) | 11 (20.7%) |
| 55 to 64 Years | 19 (25.7%) | 11 (11.6%) |
| 65 to 74 Years | 2 (2.8%) | 0 (0.0%) |
| 75 Years and over | 0 (0.0%) | 10 (21.7%) |
| Total | 43 (6.5%) | 48 (7.6%) |
Income Above Poverty by Sex and Age in Stonewall County
According to the poverty statistics in Stonewall County, males aged 5 years and females aged under 5 years are the age groups that are most secure financially, with 100.0% of males and 100.0% of females in these age groups living above the poverty line.
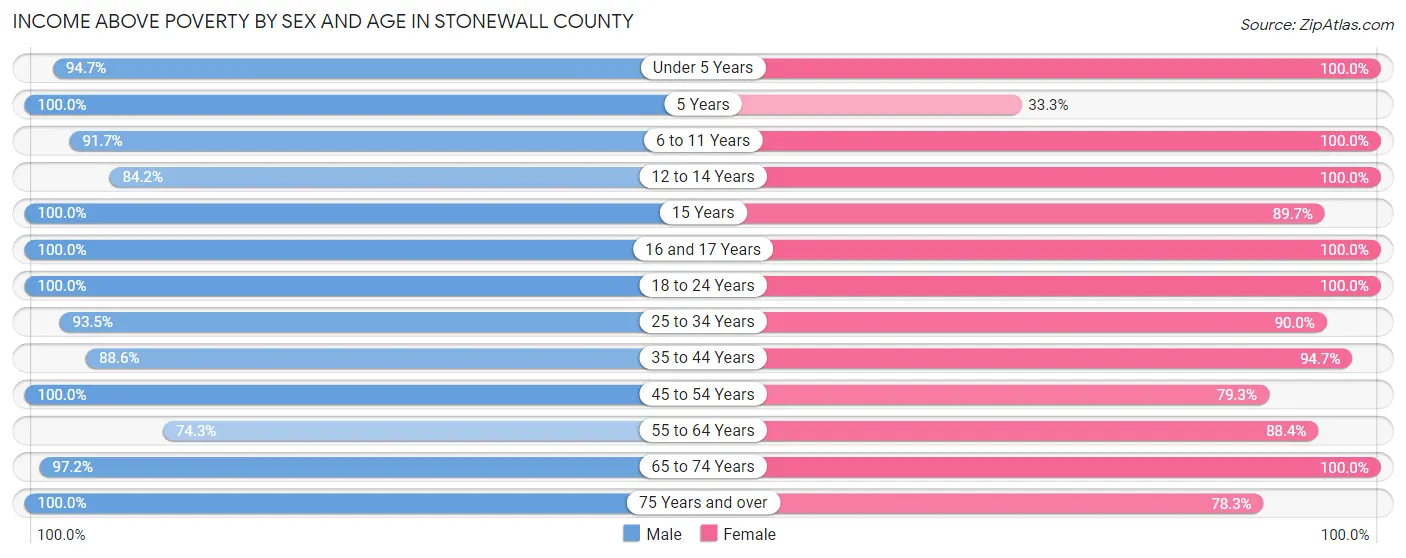
| Age Bracket | Male | Female |
| Under 5 Years | 72 (94.7%) | 65 (100.0%) |
| 5 Years | 13 (100.0%) | 3 (33.3%) |
| 6 to 11 Years | 33 (91.7%) | 7 (100.0%) |
| 12 to 14 Years | 32 (84.2%) | 26 (100.0%) |
| 15 Years | 6 (100.0%) | 26 (89.7%) |
| 16 and 17 Years | 28 (100.0%) | 36 (100.0%) |
| 18 to 24 Years | 89 (100.0%) | 102 (100.0%) |
| 25 to 34 Years | 72 (93.5%) | 36 (90.0%) |
| 35 to 44 Years | 31 (88.6%) | 54 (94.7%) |
| 45 to 54 Years | 59 (100.0%) | 42 (79.2%) |
| 55 to 64 Years | 55 (74.3%) | 84 (88.4%) |
| 65 to 74 Years | 70 (97.2%) | 64 (100.0%) |
| 75 Years and over | 57 (100.0%) | 36 (78.3%) |
| Total | 617 (93.5%) | 581 (92.4%) |
Income Below Poverty Among Married-Couple Families in Stonewall County
The poverty statistics for married-couple families in Stonewall County show that 3.2% or 8 of the total 252 families live below the poverty line. Families with 3 or 4 children have the highest poverty rate of 20.0%, comprising of 4 families. On the other hand, families with no children have the lowest poverty rate of 0.0%, which includes 0 families.
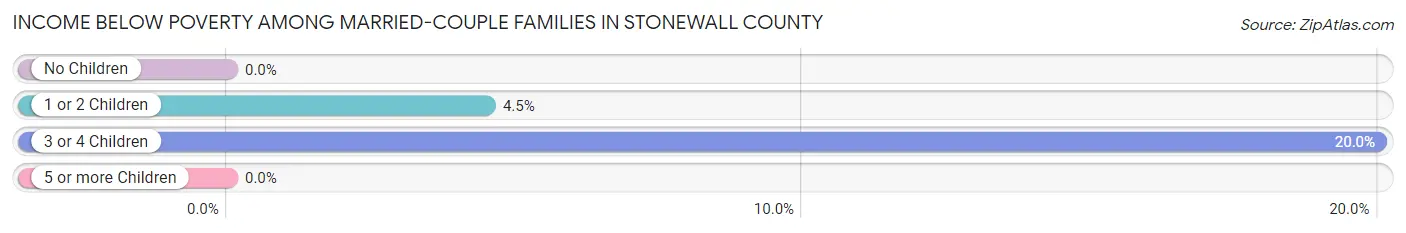
| Children | Above Poverty | Below Poverty |
| No Children | 133 (100.0%) | 0 (0.0%) |
| 1 or 2 Children | 85 (95.5%) | 4 (4.5%) |
| 3 or 4 Children | 16 (80.0%) | 4 (20.0%) |
| 5 or more Children | 10 (100.0%) | 0 (0.0%) |
| Total | 244 (96.8%) | 8 (3.2%) |
Income Below Poverty Among Single-Parent Households in Stonewall County
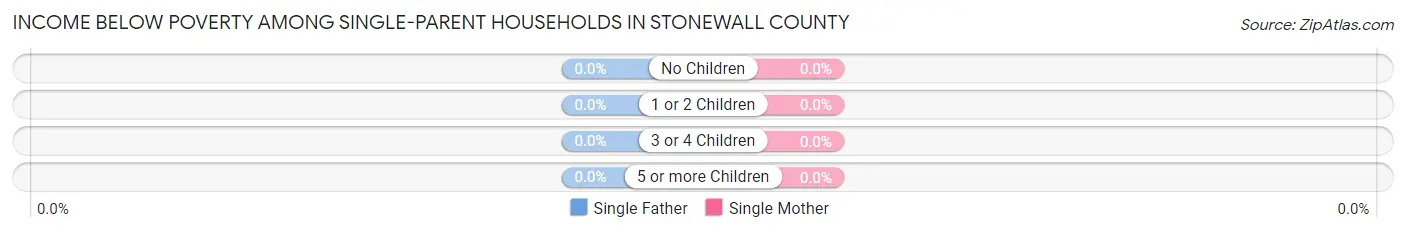
| Children | Single Father | Single Mother |
| No Children | 0 (0.0%) | 0 (0.0%) |
| 1 or 2 Children | 0 (0.0%) | 0 (0.0%) |
| 3 or 4 Children | 0 (0.0%) | 0 (0.0%) |
| 5 or more Children | 0 (0.0%) | 0 (0.0%) |
| Total | 0 (0.0%) | 0 (0.0%) |
Income Below Poverty Among Married-Couple vs Single-Parent Households in Stonewall County
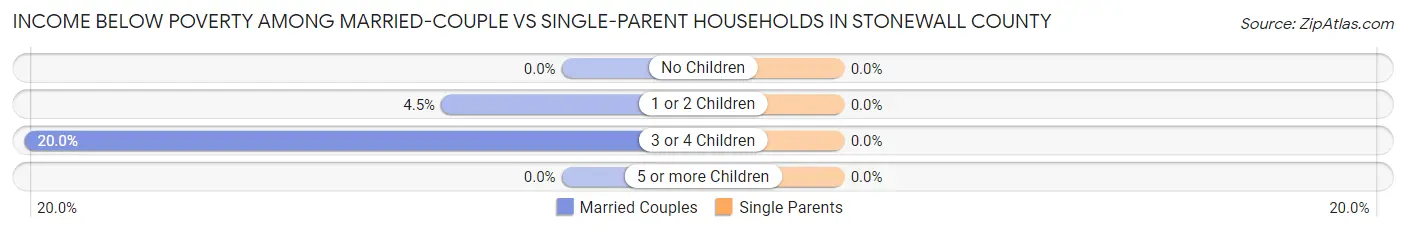
| Children | Married-Couple Families | Single-Parent Households |
| No Children | 0 (0.0%) | 0 (0.0%) |
| 1 or 2 Children | 4 (4.5%) | 0 (0.0%) |
| 3 or 4 Children | 4 (20.0%) | 0 (0.0%) |
| 5 or more Children | 0 (0.0%) | 0 (0.0%) |
| Total | 8 (3.2%) | 0 (0.0%) |
Race in Stonewall County
The most populous races in Stonewall County are White / Caucasian (1,175 | 88.3%), Hispanic or Latino (357 | 26.8%), and Some other Race (74 | 5.6%).
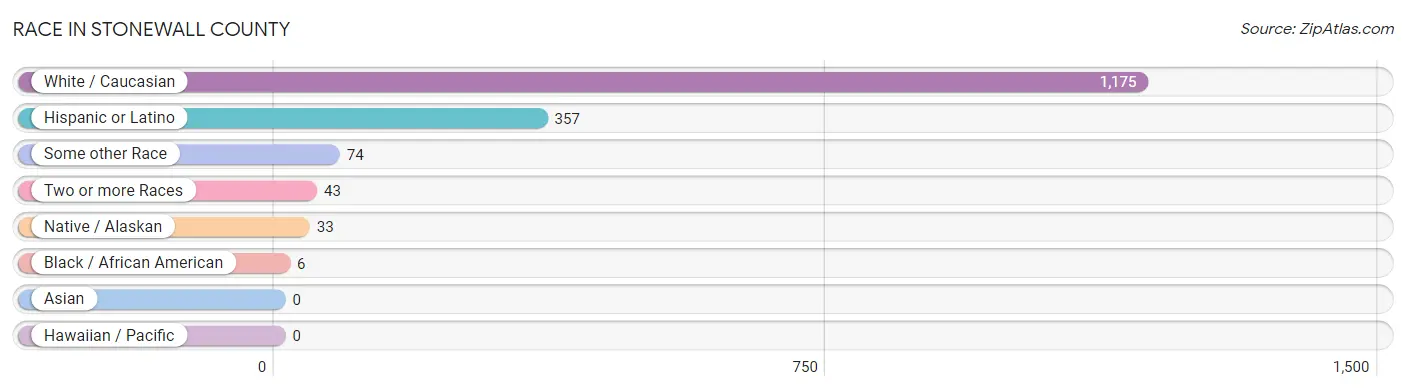
| Race | # Population | % Population |
| Asian | 0 | 0.0% |
| Black / African American | 6 | 0.4% |
| Hawaiian / Pacific | 0 | 0.0% |
| Hispanic or Latino | 357 | 26.8% |
| Native / Alaskan | 33 | 2.5% |
| White / Caucasian | 1,175 | 88.3% |
| Two or more Races | 43 | 3.2% |
| Some other Race | 74 | 5.6% |
| Total | 1,331 | 100.0% |
Ancestry in Stonewall County
The most populous ancestries reported in Stonewall County are Mexican (357 | 26.8%), Irish (137 | 10.3%), German (84 | 6.3%), American (80 | 6.0%), and English (71 | 5.3%), together accounting for 54.8% of all Stonewall County residents.
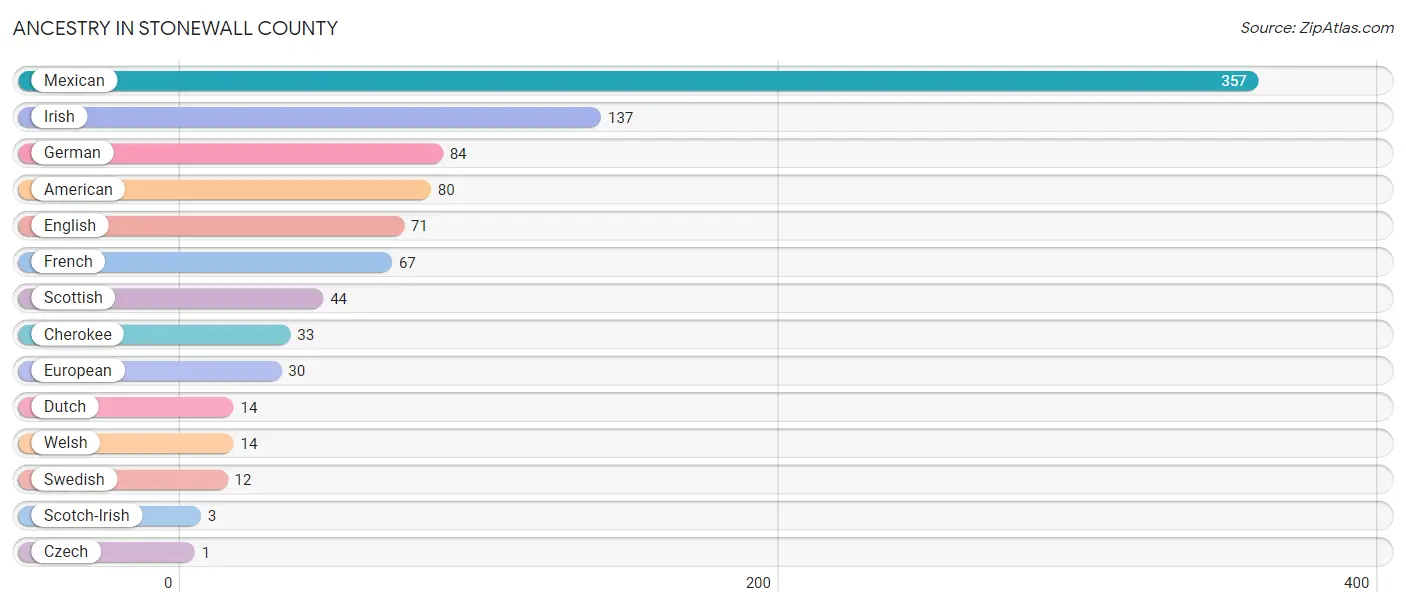
| Ancestry | # Population | % Population |
| American | 80 | 6.0% |
| Cherokee | 33 | 2.5% |
| Czech | 1 | 0.1% |
| Dutch | 14 | 1.1% |
| English | 71 | 5.3% |
| European | 30 | 2.2% |
| French | 67 | 5.0% |
| German | 84 | 6.3% |
| Irish | 137 | 10.3% |
| Mexican | 357 | 26.8% |
| Scotch-Irish | 3 | 0.2% |
| Scottish | 44 | 3.3% |
| Swedish | 12 | 0.9% |
| Welsh | 14 | 1.1% | View All 14 Rows |
Immigrants in Stonewall County
The most numerous immigrant groups reported in Stonewall County came from Central America (23 | 1.7%), Latin America (23 | 1.7%), and Mexico (23 | 1.7%), together accounting for 5.2% of all Stonewall County residents.
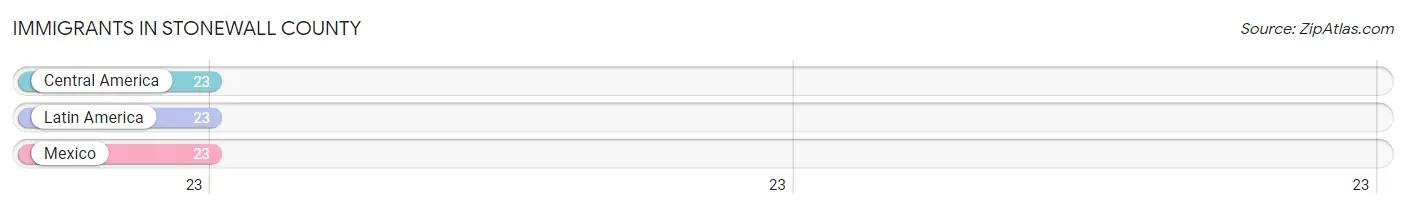
| Immigration Origin | # Population | % Population |
| Central America | 23 | 1.7% |
| Latin America | 23 | 1.7% |
| Mexico | 23 | 1.7% | View All 3 Rows |
Sex and Age in Stonewall County
Sex and Age in Stonewall County
The most populous age groups in Stonewall County are 15 to 19 Years (82 | 12.0%) for men and 20 to 24 Years (91 | 14.0%) for women.
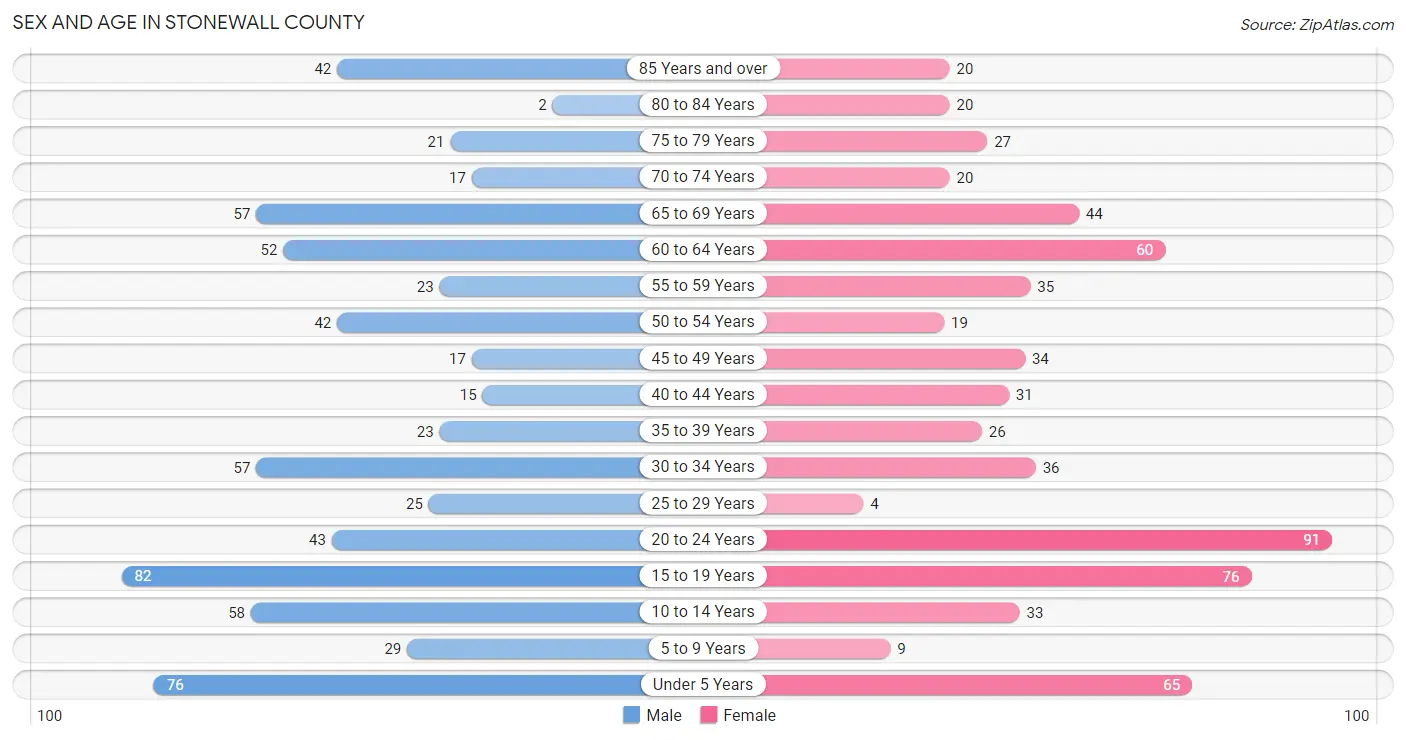
| Age Bracket | Male | Female |
| Under 5 Years | 76 (11.2%) | 65 (10.0%) |
| 5 to 9 Years | 29 (4.3%) | 9 (1.4%) |
| 10 to 14 Years | 58 (8.5%) | 33 (5.1%) |
| 15 to 19 Years | 82 (12.0%) | 76 (11.7%) |
| 20 to 24 Years | 43 (6.3%) | 91 (14.0%) |
| 25 to 29 Years | 25 (3.7%) | 4 (0.6%) |
| 30 to 34 Years | 57 (8.4%) | 36 (5.5%) |
| 35 to 39 Years | 23 (3.4%) | 26 (4.0%) |
| 40 to 44 Years | 15 (2.2%) | 31 (4.8%) |
| 45 to 49 Years | 17 (2.5%) | 34 (5.2%) |
| 50 to 54 Years | 42 (6.2%) | 19 (2.9%) |
| 55 to 59 Years | 23 (3.4%) | 35 (5.4%) |
| 60 to 64 Years | 52 (7.6%) | 60 (9.2%) |
| 65 to 69 Years | 57 (8.4%) | 44 (6.8%) |
| 70 to 74 Years | 17 (2.5%) | 20 (3.1%) |
| 75 to 79 Years | 21 (3.1%) | 27 (4.2%) |
| 80 to 84 Years | 2 (0.3%) | 20 (3.1%) |
| 85 Years and over | 42 (6.2%) | 20 (3.1%) |
| Total | 681 (100.0%) | 650 (100.0%) |
Families and Households in Stonewall County
Median Family Size in Stonewall County
The median family size in Stonewall County is 3.51 persons per family, with single female/mother families (48 | 15.2%) accounting for the largest median family size of 4.71 persons per family. On the other hand, single male/father families (15 | 4.8%) represent the smallest median family size with 2.20 persons per family.
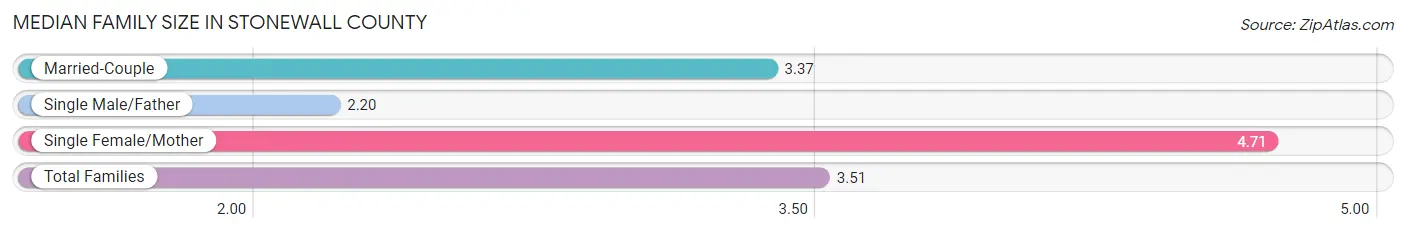
| Family Type | # Families | Family Size |
| Married-Couple | 252 (80.0%) | 3.37 |
| Single Male/Father | 15 (4.8%) | 2.20 |
| Single Female/Mother | 48 (15.2%) | 4.71 |
| Total Families | 315 (100.0%) | 3.51 |
Median Household Size in Stonewall County
The median household size in Stonewall County is 2.86 persons per household, with single female/mother households (48 | 10.7%) accounting for the largest median household size of 5.44 persons per household. non-family households (135 | 30.0%) represent the smallest median household size with 1.09 persons per household.
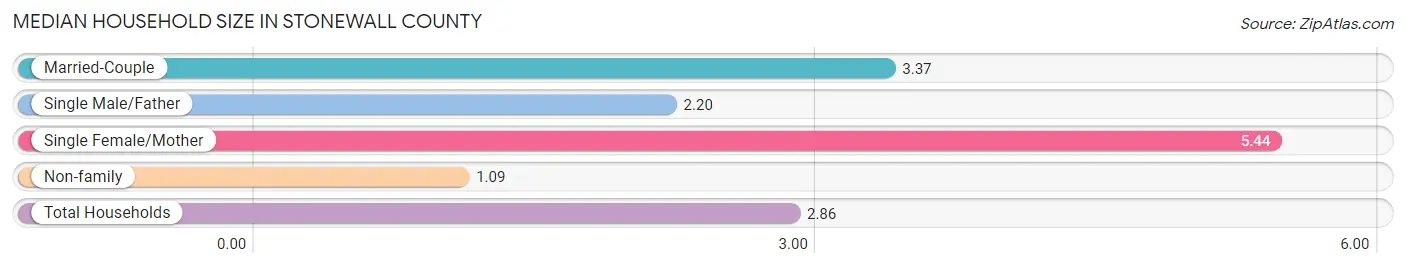
| Household Type | # Households | Household Size |
| Married-Couple | 252 (56.0%) | 3.37 |
| Single Male/Father | 15 (3.3%) | 2.20 |
| Single Female/Mother | 48 (10.7%) | 5.44 |
| Non-family | 135 (30.0%) | 1.09 |
| Total Households | 450 (100.0%) | 2.86 |
Household Size by Marriage Status in Stonewall County
Out of a total of 450 households in Stonewall County, 315 (70.0%) are family households, while 135 (30.0%) are nonfamily households. The most numerous type of family households are 2-person households, comprising 137, and the most common type of nonfamily households are 1-person households, comprising 122.
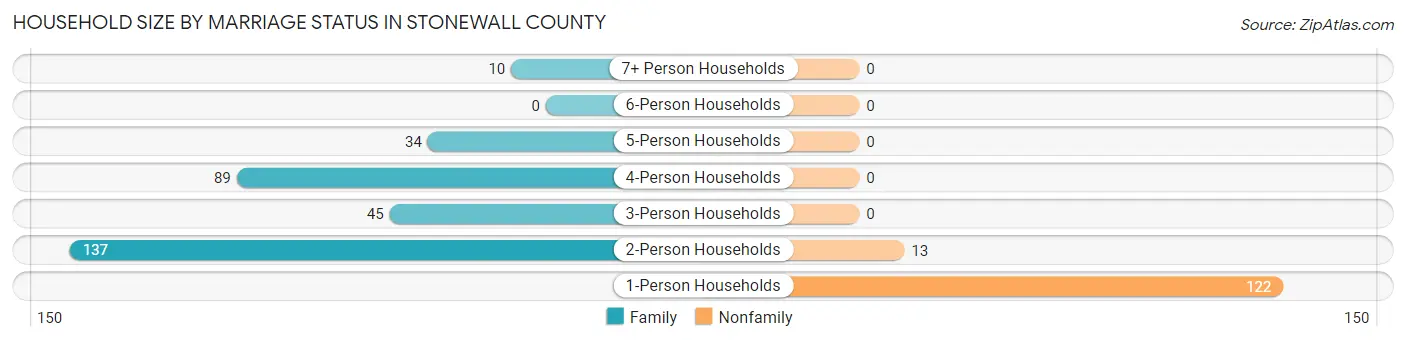
| Household Size | Family Households | Nonfamily Households |
| 1-Person Households | - | 122 (27.1%) |
| 2-Person Households | 137 (30.4%) | 13 (2.9%) |
| 3-Person Households | 45 (10.0%) | 0 (0.0%) |
| 4-Person Households | 89 (19.8%) | 0 (0.0%) |
| 5-Person Households | 34 (7.6%) | 0 (0.0%) |
| 6-Person Households | 0 (0.0%) | 0 (0.0%) |
| 7+ Person Households | 10 (2.2%) | 0 (0.0%) |
| Total | 315 (70.0%) | 135 (30.0%) |
Female Fertility in Stonewall County
Fertility by Age in Stonewall County
Average fertility rate in Stonewall County is 37.0 births per 1,000 women. Women in the age bracket of 15 to 19 years have the highest fertility rate with 145.0 births per 1,000 women. Women in the age bracket of 15 to 19 years acount for 100.0% of all women with births.
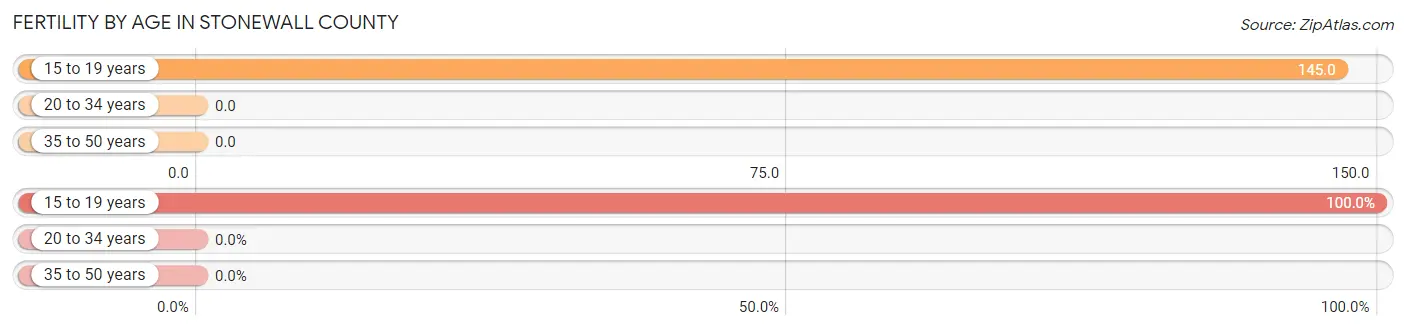
| Age Bracket | Women with Births | Births / 1,000 Women |
| 15 to 19 years | 11 (100.0%) | 145.0 |
| 20 to 34 years | 0 (0.0%) | 0.0 |
| 35 to 50 years | 0 (0.0%) | 0.0 |
| Total | 11 (100.0%) | 37.0 |
Fertility by Age by Marriage Status in Stonewall County
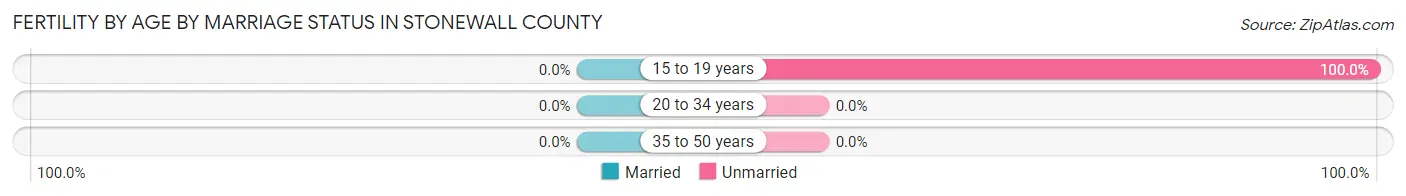
| Age Bracket | Married | Unmarried |
| 15 to 19 years | 0 (0.0%) | 11 (100.0%) |
| 20 to 34 years | 0 (0.0%) | 0 (0.0%) |
| 35 to 50 years | 0 (0.0%) | 0 (0.0%) |
| Total | 0 (0.0%) | 11 (100.0%) |
Fertility by Education in Stonewall County
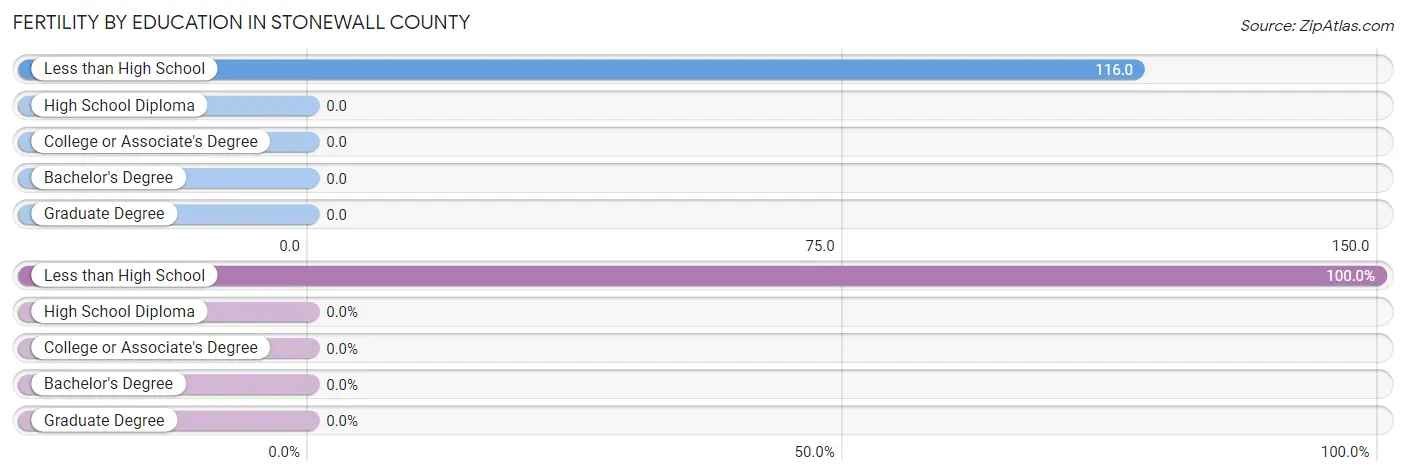
| Educational Attainment | Women with Births | Births / 1,000 Women |
| Less than High School | 11 (100.0%) | 116.0 |
| High School Diploma | 0 (0.0%) | 0.0 |
| College or Associate's Degree | 0 (0.0%) | 0.0 |
| Bachelor's Degree | 0 (0.0%) | 0.0 |
| Graduate Degree | 0 (0.0%) | 0.0 |
| Total | 11 (100.0%) | 37.0 |
Fertility by Education by Marriage Status in Stonewall County
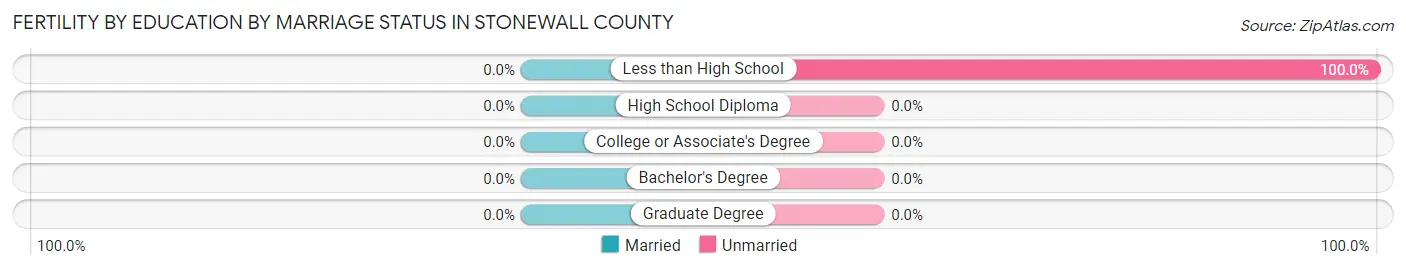
| Educational Attainment | Married | Unmarried |
| Less than High School | 0 (0.0%) | 11 (100.0%) |
| High School Diploma | 0 (0.0%) | 0 (0.0%) |
| College or Associate's Degree | 0 (0.0%) | 0 (0.0%) |
| Bachelor's Degree | 0 (0.0%) | 0 (0.0%) |
| Graduate Degree | 0 (0.0%) | 0 (0.0%) |
| Total | 0 (0.0%) | 11 (100.0%) |
Employment Characteristics in Stonewall County
Employment by Class of Employer in Stonewall County
Among the 664 employed individuals in Stonewall County, private company employees (433 | 65.2%), not-for-profit organizations (79 | 11.9%), and self-employed (incorporated) (51 | 7.7%) make up the most common classes of employment.
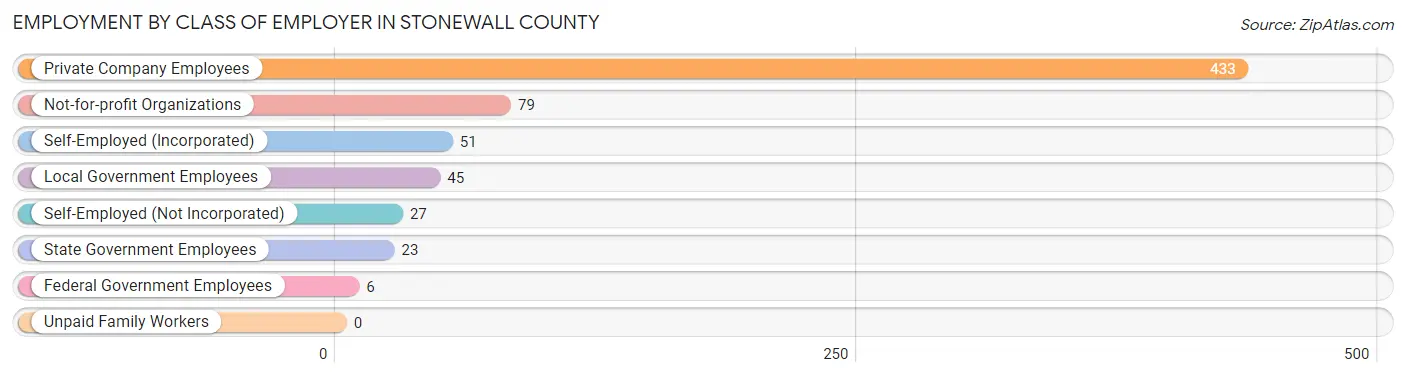
| Employer Class | # Employees | % Employees |
| Private Company Employees | 433 | 65.2% |
| Self-Employed (Incorporated) | 51 | 7.7% |
| Self-Employed (Not Incorporated) | 27 | 4.1% |
| Not-for-profit Organizations | 79 | 11.9% |
| Local Government Employees | 45 | 6.8% |
| State Government Employees | 23 | 3.5% |
| Federal Government Employees | 6 | 0.9% |
| Unpaid Family Workers | 0 | 0.0% |
| Total | 664 | 100.0% |
Employment Status by Age in Stonewall County
According to the labor force statistics for Stonewall County, out of the total population over 16 years of age (1,026), 66.2% or 679 individuals are in the labor force, with 1.8% or 12 of them unemployed. The age group with the highest labor force participation rate is 45 to 54 years, with 88.4% or 99 individuals in the labor force. Within the labor force, the 45 to 54 years age range has the highest percentage of unemployed individuals, with 11.1% or 11 of them being unemployed.
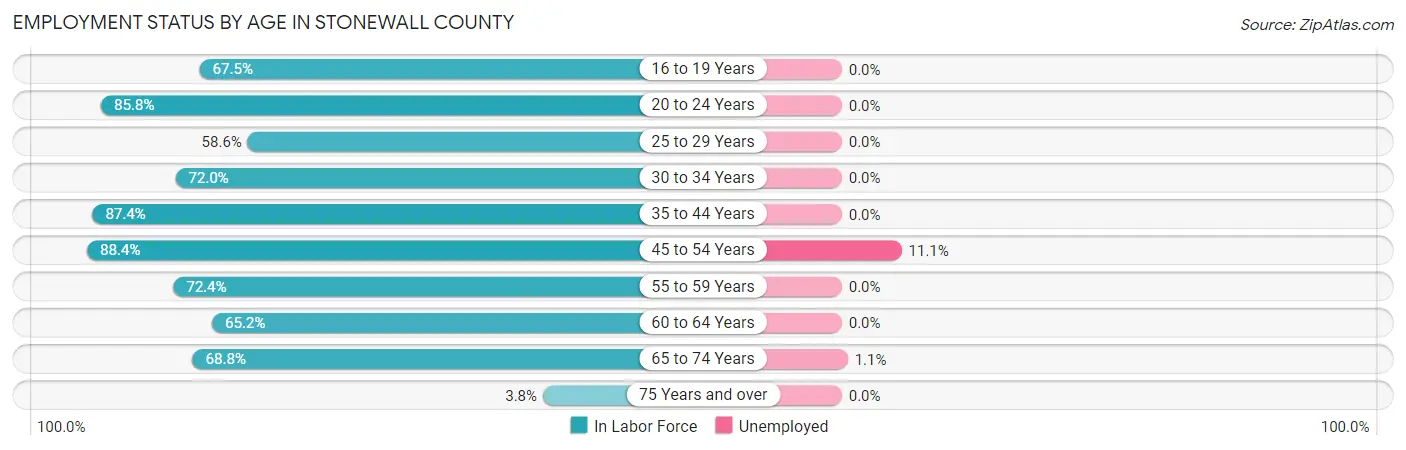
| Age Bracket | In Labor Force | Unemployed |
| 16 to 19 Years | 83 (67.5%) | 0 (0.0%) |
| 20 to 24 Years | 115 (85.8%) | 0 (0.0%) |
| 25 to 29 Years | 17 (58.6%) | 0 (0.0%) |
| 30 to 34 Years | 67 (72.0%) | 0 (0.0%) |
| 35 to 44 Years | 83 (87.4%) | 0 (0.0%) |
| 45 to 54 Years | 99 (88.4%) | 11 (11.1%) |
| 55 to 59 Years | 42 (72.4%) | 0 (0.0%) |
| 60 to 64 Years | 73 (65.2%) | 0 (0.0%) |
| 65 to 74 Years | 95 (68.8%) | 1 (1.1%) |
| 75 Years and over | 5 (3.8%) | 0 (0.0%) |
| Total | 679 (66.2%) | 12 (1.8%) |
Employment Status by Educational Attainment in Stonewall County
According to labor force statistics for Stonewall County, 76.4% of individuals (381) out of the total population between 25 and 64 years of age (499) are in the labor force, with 2.9% or 11 of them being unemployed. The group with the highest labor force participation rate are those with the educational attainment of bachelor's degree or higher, with 81.6% or 62 individuals in the labor force. Within the labor force, individuals with college / associate degree education have the highest percentage of unemployment, with 15.3% or 11 of them being unemployed.
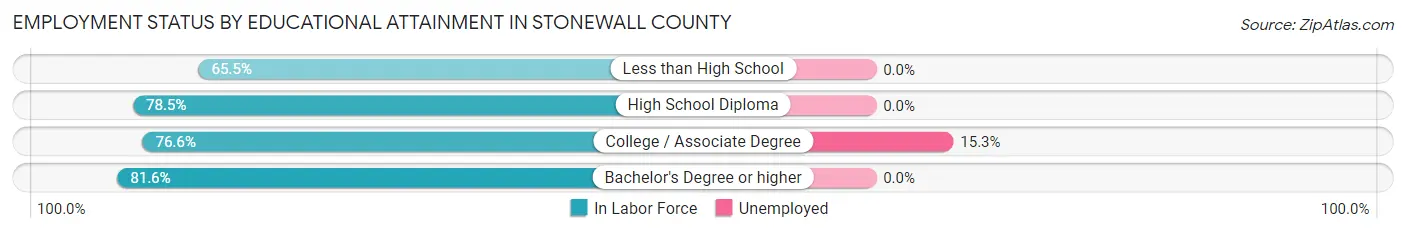
| Educational Attainment | In Labor Force | Unemployed |
| Less than High School | 57 (65.5%) | 0 (0.0%) |
| High School Diploma | 190 (78.5%) | 0 (0.0%) |
| College / Associate Degree | 72 (76.6%) | 14 (15.3%) |
| Bachelor's Degree or higher | 62 (81.6%) | 0 (0.0%) |
| Total | 381 (76.4%) | 14 (2.9%) |
Employment Occupations by Sex in Stonewall County
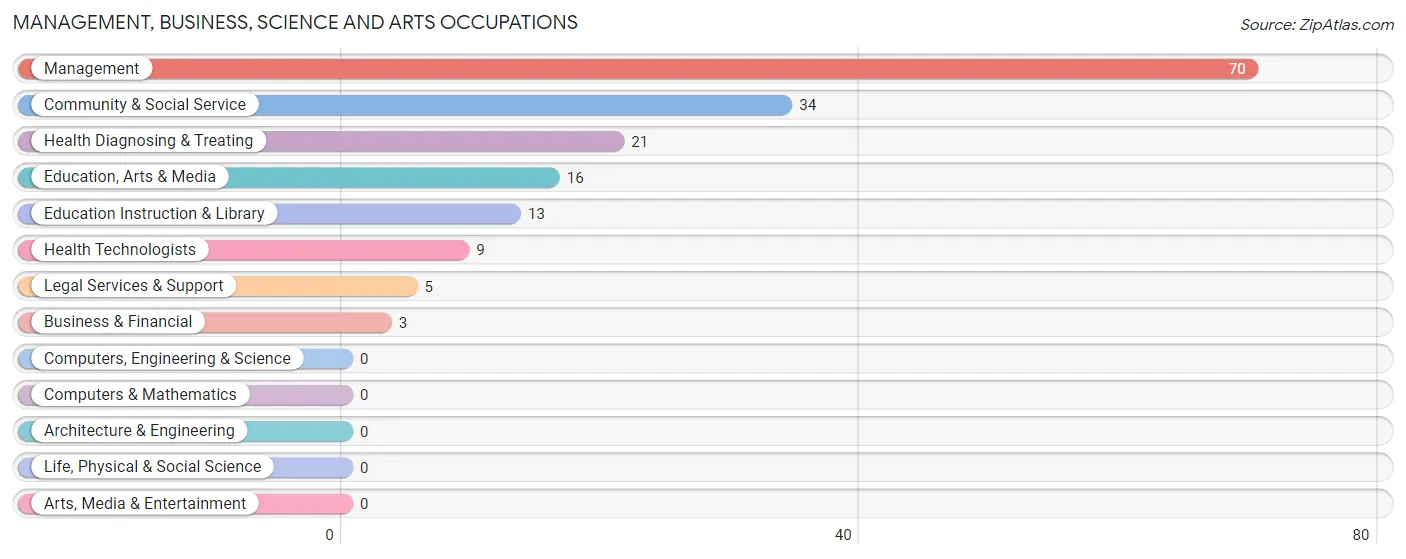
Management, Business, Science and Arts Occupations
The most common Management, Business, Science and Arts occupations in Stonewall County are Management (70 | 10.5%), Community & Social Service (34 | 5.1%), Health Diagnosing & Treating (21 | 3.2%), Education, Arts & Media (16 | 2.4%), and Education Instruction & Library (13 | 1.9%).
Management, Business, Science and Arts Occupations by Sex
Within the Management, Business, Science and Arts occupations in Stonewall County, the most male-oriented occupations are Management (62.9%), Education Instruction & Library (46.2%), and Community & Social Service (17.6%), while the most female-oriented occupations are Business & Financial (100.0%), Education, Arts & Media (100.0%), and Legal Services & Support (100.0%).
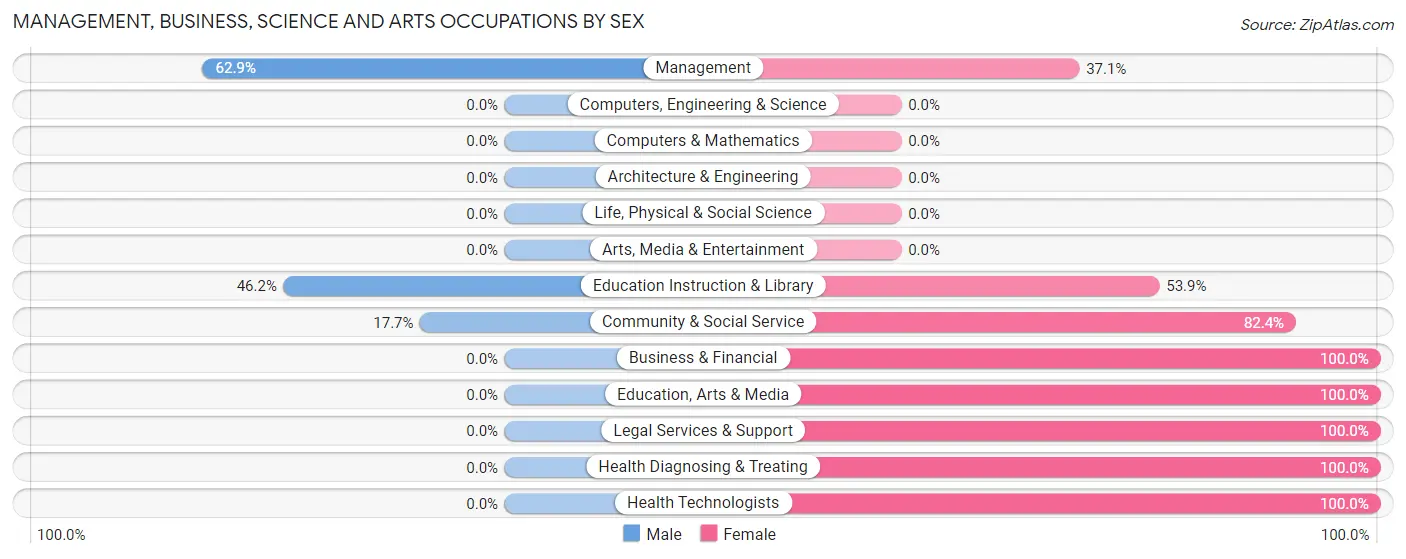
| Occupation | Male | Female |
| Management | 44 (62.9%) | 26 (37.1%) |
| Business & Financial | 0 (0.0%) | 3 (100.0%) |
| Computers, Engineering & Science | 0 (0.0%) | 0 (0.0%) |
| Computers & Mathematics | 0 (0.0%) | 0 (0.0%) |
| Architecture & Engineering | 0 (0.0%) | 0 (0.0%) |
| Life, Physical & Social Science | 0 (0.0%) | 0 (0.0%) |
| Community & Social Service | 6 (17.6%) | 28 (82.4%) |
| Education, Arts & Media | 0 (0.0%) | 16 (100.0%) |
| Legal Services & Support | 0 (0.0%) | 5 (100.0%) |
| Education Instruction & Library | 6 (46.2%) | 7 (53.8%) |
| Arts, Media & Entertainment | 0 (0.0%) | 0 (0.0%) |
| Health Diagnosing & Treating | 0 (0.0%) | 21 (100.0%) |
| Health Technologists | 0 (0.0%) | 9 (100.0%) |
| Total (Category) | 50 (39.1%) | 78 (60.9%) |
| Total (Overall) | 363 (54.4%) | 304 (45.6%) |
Services Occupations
The most common Services occupations in Stonewall County are Personal Care & Service (52 | 7.8%), Food Preparation & Serving (47 | 7.0%), Cleaning & Maintenance (16 | 2.4%), Healthcare Support (6 | 0.9%), and Security & Protection (5 | 0.7%).
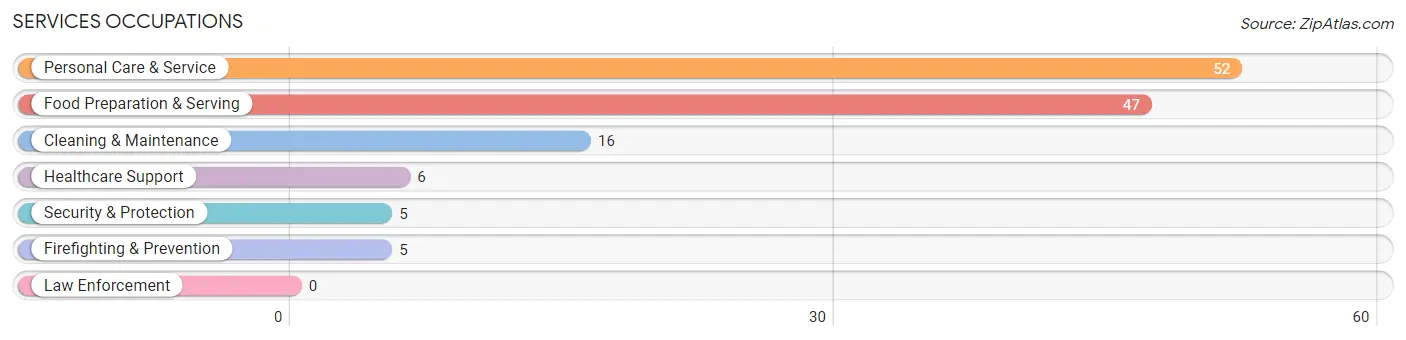
Services Occupations by Sex
Within the Services occupations in Stonewall County, the most male-oriented occupations are Security & Protection (100.0%), Firefighting & Prevention (100.0%), and Healthcare Support (83.3%), while the most female-oriented occupations are Food Preparation & Serving (100.0%), Cleaning & Maintenance (100.0%), and Personal Care & Service (100.0%).
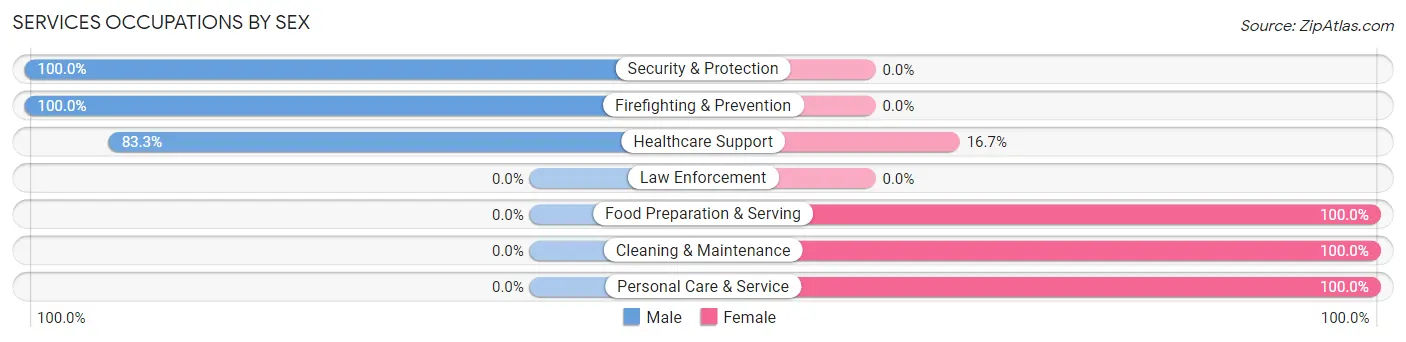
| Occupation | Male | Female |
| Healthcare Support | 5 (83.3%) | 1 (16.7%) |
| Security & Protection | 5 (100.0%) | 0 (0.0%) |
| Firefighting & Prevention | 5 (100.0%) | 0 (0.0%) |
| Law Enforcement | 0 (0.0%) | 0 (0.0%) |
| Food Preparation & Serving | 0 (0.0%) | 47 (100.0%) |
| Cleaning & Maintenance | 0 (0.0%) | 16 (100.0%) |
| Personal Care & Service | 0 (0.0%) | 52 (100.0%) |
| Total (Category) | 10 (7.9%) | 116 (92.1%) |
| Total (Overall) | 363 (54.4%) | 304 (45.6%) |
Sales and Office Occupations
The most common Sales and Office occupations in Stonewall County are Sales & Related (96 | 14.4%), and Office & Administration (53 | 8.0%).
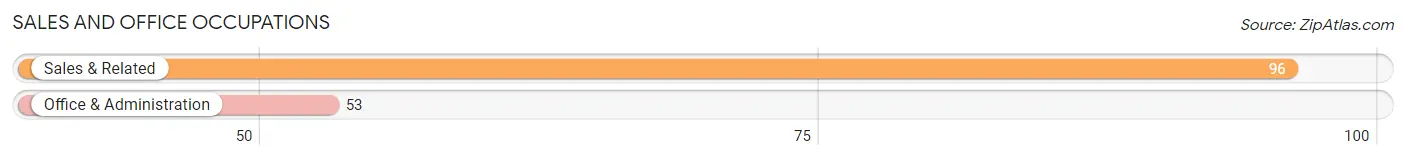
Sales and Office Occupations by Sex

| Occupation | Male | Female |
| Sales & Related | 88 (91.7%) | 8 (8.3%) |
| Office & Administration | 5 (9.4%) | 48 (90.6%) |
| Total (Category) | 93 (62.4%) | 56 (37.6%) |
| Total (Overall) | 363 (54.4%) | 304 (45.6%) |
Natural Resources, Construction and Maintenance Occupations
The most common Natural Resources, Construction and Maintenance occupations in Stonewall County are Construction & Extraction (55 | 8.3%), Installation, Maintenance & Repair (25 | 3.7%), and Farming, Fishing & Forestry (14 | 2.1%).
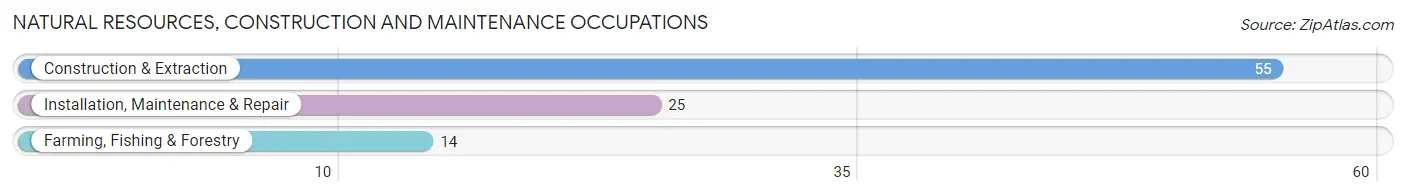
Natural Resources, Construction and Maintenance Occupations by Sex
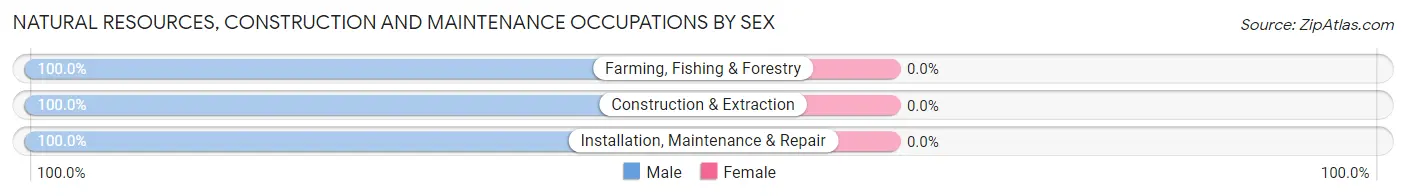
| Occupation | Male | Female |
| Farming, Fishing & Forestry | 14 (100.0%) | 0 (0.0%) |
| Construction & Extraction | 55 (100.0%) | 0 (0.0%) |
| Installation, Maintenance & Repair | 25 (100.0%) | 0 (0.0%) |
| Total (Category) | 94 (100.0%) | 0 (0.0%) |
| Total (Overall) | 363 (54.4%) | 304 (45.6%) |
Production, Transportation and Moving Occupations
The most common Production, Transportation and Moving occupations in Stonewall County are Material Moving (73 | 10.9%), Transportation (61 | 9.1%), and Production (36 | 5.4%).
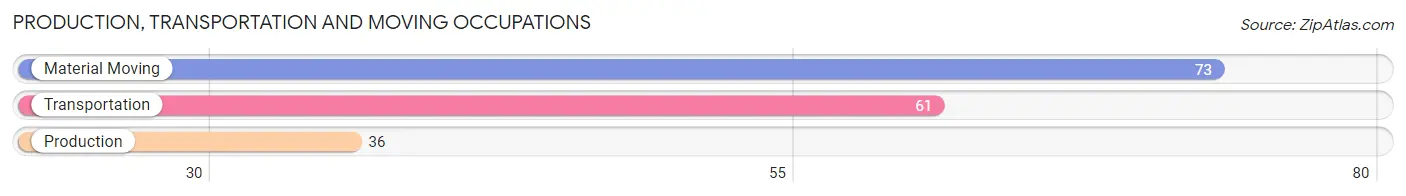
Production, Transportation and Moving Occupations by Sex
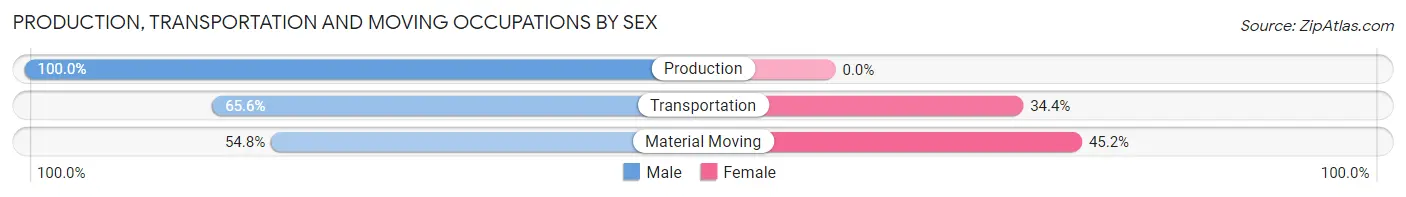
| Occupation | Male | Female |
| Production | 36 (100.0%) | 0 (0.0%) |
| Transportation | 40 (65.6%) | 21 (34.4%) |
| Material Moving | 40 (54.8%) | 33 (45.2%) |
| Total (Category) | 116 (68.2%) | 54 (31.8%) |
| Total (Overall) | 363 (54.4%) | 304 (45.6%) |
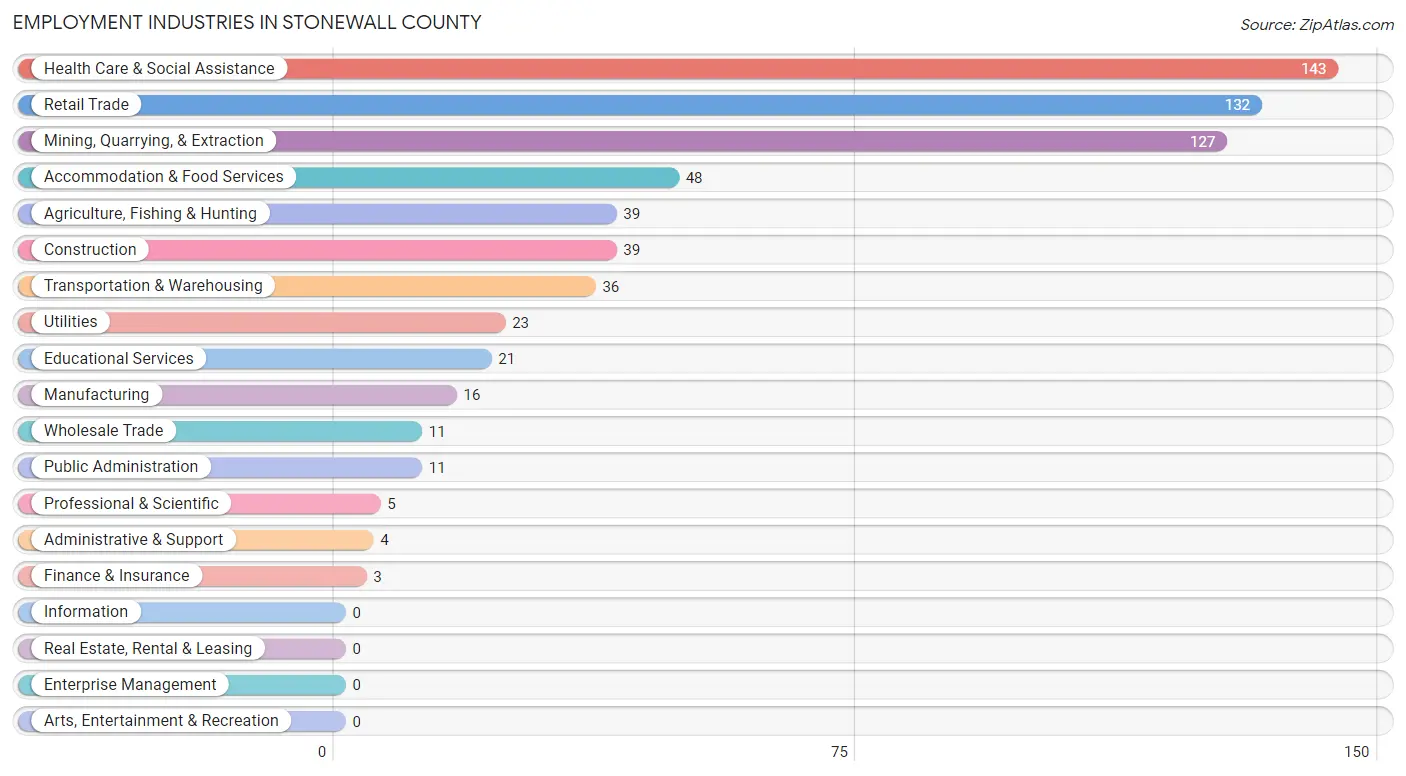
Employment Industries by Sex in Stonewall County
Employment Industries in Stonewall County
The major employment industries in Stonewall County include Health Care & Social Assistance (143 | 21.4%), Retail Trade (132 | 19.8%), Mining, Quarrying, & Extraction (127 | 19.0%), Accommodation & Food Services (48 | 7.2%), and Agriculture, Fishing & Hunting (39 | 5.9%).
Employment Industries by Sex in Stonewall County
The Stonewall County industries that see more men than women are Wholesale Trade (100.0%), Utilities (100.0%), and Administrative & Support (100.0%), whereas the industries that tend to have a higher number of women are Finance & Insurance (100.0%), Professional & Scientific (100.0%), and Health Care & Social Assistance (91.6%).
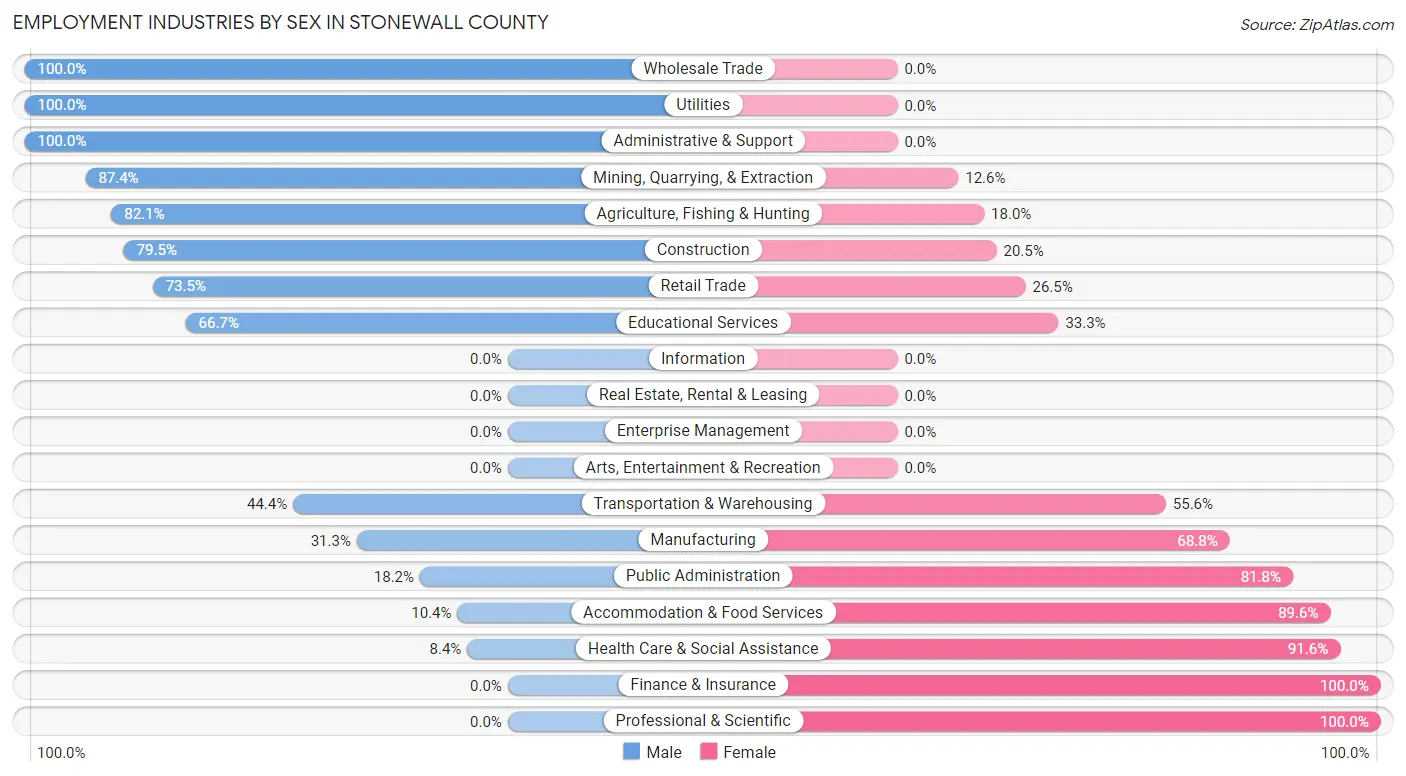
| Industry | Male | Female |
| Agriculture, Fishing & Hunting | 32 (82.1%) | 7 (17.9%) |
| Mining, Quarrying, & Extraction | 111 (87.4%) | 16 (12.6%) |
| Construction | 31 (79.5%) | 8 (20.5%) |
| Manufacturing | 5 (31.2%) | 11 (68.8%) |
| Wholesale Trade | 11 (100.0%) | 0 (0.0%) |
| Retail Trade | 97 (73.5%) | 35 (26.5%) |
| Transportation & Warehousing | 16 (44.4%) | 20 (55.6%) |
| Utilities | 23 (100.0%) | 0 (0.0%) |
| Information | 0 (0.0%) | 0 (0.0%) |
| Finance & Insurance | 0 (0.0%) | 3 (100.0%) |
| Real Estate, Rental & Leasing | 0 (0.0%) | 0 (0.0%) |
| Professional & Scientific | 0 (0.0%) | 5 (100.0%) |
| Enterprise Management | 0 (0.0%) | 0 (0.0%) |
| Administrative & Support | 4 (100.0%) | 0 (0.0%) |
| Educational Services | 14 (66.7%) | 7 (33.3%) |
| Health Care & Social Assistance | 12 (8.4%) | 131 (91.6%) |
| Arts, Entertainment & Recreation | 0 (0.0%) | 0 (0.0%) |
| Accommodation & Food Services | 5 (10.4%) | 43 (89.6%) |
| Public Administration | 2 (18.2%) | 9 (81.8%) |
| Total | 363 (54.4%) | 304 (45.6%) |
Education in Stonewall County
School Enrollment in Stonewall County
The most common levels of schooling among the 390 students in Stonewall County are high school (153 | 39.2%), college / undergraduate (74 | 19.0%), and middle school (70 | 17.9%).
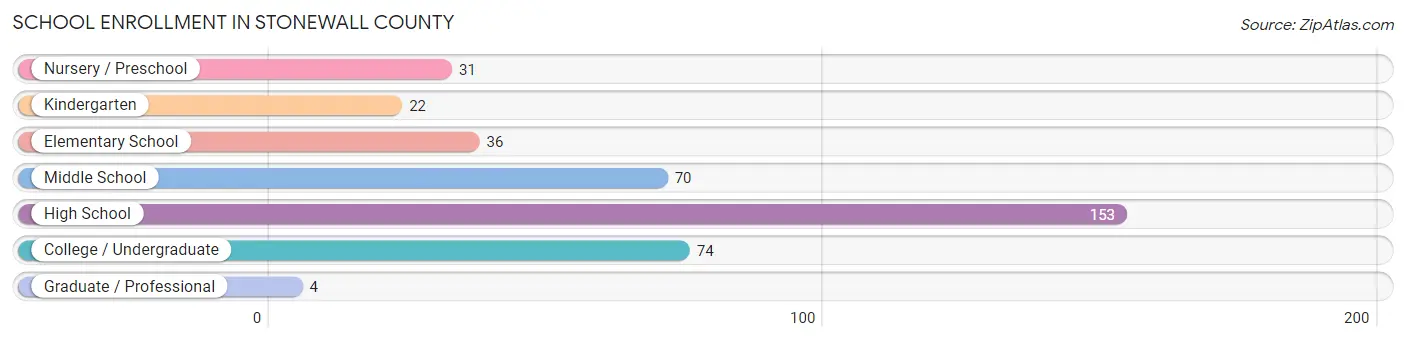
| School Level | # Students | % Students |
| Nursery / Preschool | 31 | 8.0% |
| Kindergarten | 22 | 5.6% |
| Elementary School | 36 | 9.2% |
| Middle School | 70 | 17.9% |
| High School | 153 | 39.2% |
| College / Undergraduate | 74 | 19.0% |
| Graduate / Professional | 4 | 1.0% |
| Total | 390 | 100.0% |
School Enrollment by Age by Funding Source in Stonewall County
Out of a total of 390 students who are enrolled in schools in Stonewall County, 12 (3.1%) attend a private institution, while the remaining 378 (96.9%) are enrolled in public schools. The age group of 35 years and over has the highest likelihood of being enrolled in private schools, with 12 (52.2% in the age bracket) enrolled. Conversely, the age group of 3 to 4 year olds has the lowest likelihood of being enrolled in a private school, with 31 (100.0% in the age bracket) attending a public institution.
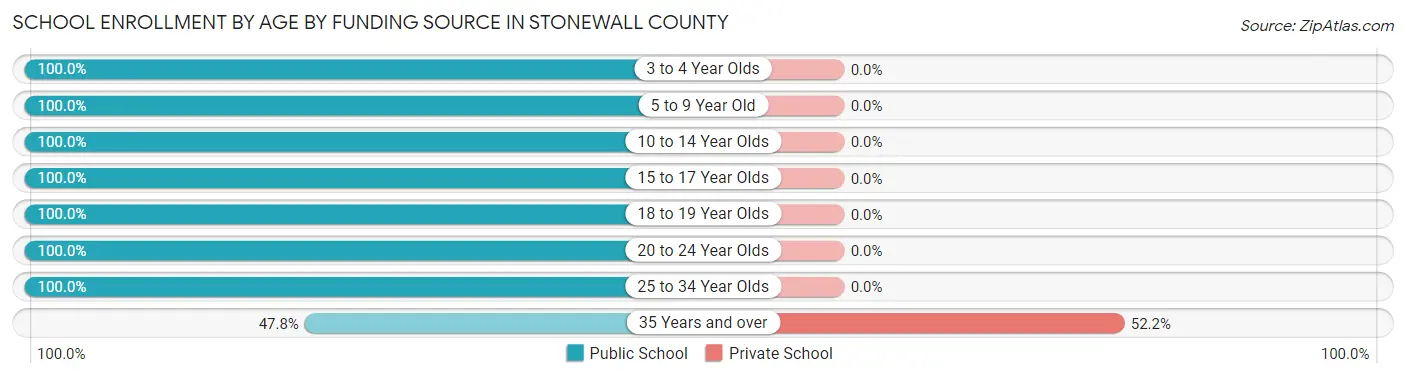
| Age Bracket | Public School | Private School |
| 3 to 4 Year Olds | 31 (100.0%) | 0 (0.0%) |
| 5 to 9 Year Old | 38 (100.0%) | 0 (0.0%) |
| 10 to 14 Year Olds | 91 (100.0%) | 0 (0.0%) |
| 15 to 17 Year Olds | 97 (100.0%) | 0 (0.0%) |
| 18 to 19 Year Olds | 48 (100.0%) | 0 (0.0%) |
| 20 to 24 Year Olds | 39 (100.0%) | 0 (0.0%) |
| 25 to 34 Year Olds | 23 (100.0%) | 0 (0.0%) |
| 35 Years and over | 11 (47.8%) | 12 (52.2%) |
| Total | 378 (96.9%) | 12 (3.1%) |
Educational Attainment by Field of Study in Stonewall County
Education (22 | 17.1%), bio, nature & agricultural (20 | 15.5%), science & technology (20 | 15.5%), engineering (12 | 9.3%), and arts & humanities (11 | 8.5%) are the most common fields of study among 129 individuals in Stonewall County who have obtained a bachelor's degree or higher.
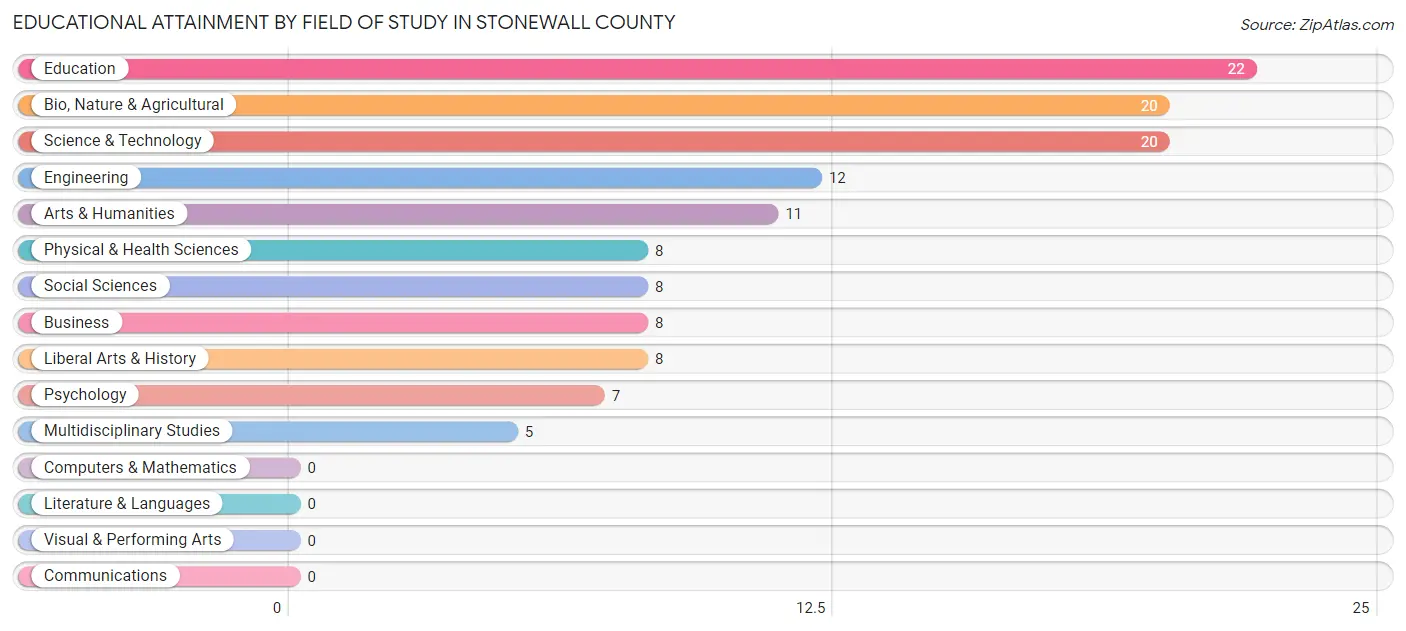
| Field of Study | # Graduates | % Graduates |
| Computers & Mathematics | 0 | 0.0% |
| Bio, Nature & Agricultural | 20 | 15.5% |
| Physical & Health Sciences | 8 | 6.2% |
| Psychology | 7 | 5.4% |
| Social Sciences | 8 | 6.2% |
| Engineering | 12 | 9.3% |
| Multidisciplinary Studies | 5 | 3.9% |
| Science & Technology | 20 | 15.5% |
| Business | 8 | 6.2% |
| Education | 22 | 17.1% |
| Literature & Languages | 0 | 0.0% |
| Liberal Arts & History | 8 | 6.2% |
| Visual & Performing Arts | 0 | 0.0% |
| Communications | 0 | 0.0% |
| Arts & Humanities | 11 | 8.5% |
| Total | 129 | 100.0% |
Transportation & Commute in Stonewall County
Vehicle Availability by Sex in Stonewall County
The most prevalent vehicle ownership categories in Stonewall County are males with 4 vehicles (145, accounting for 39.9%) and females with 4 vehicles (95, making up 48.2%).
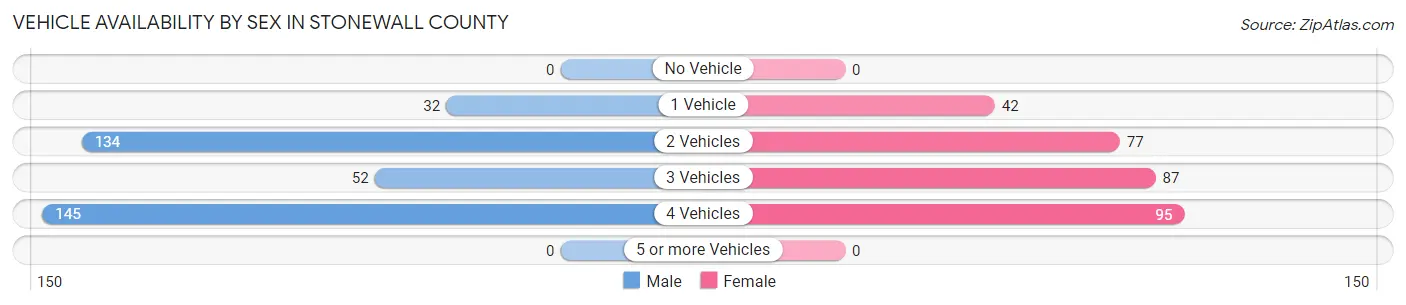
| Vehicles Available | Male | Female |
| No Vehicle | 0 (0.0%) | 0 (0.0%) |
| 1 Vehicle | 32 (8.8%) | 42 (14.0%) |
| 2 Vehicles | 134 (36.9%) | 77 (25.6%) |
| 3 Vehicles | 52 (14.3%) | 87 (28.9%) |
| 4 Vehicles | 145 (39.9%) | 95 (31.6%) |
| 5 or more Vehicles | 0 (0.0%) | 0 (0.0%) |
| Total | 363 (100.0%) | 301 (100.0%) |
Commute Time in Stonewall County
The most frequently occuring commute durations in Stonewall County are less than 5 minutes (210 commuters, 31.8%), 5 to 9 minutes (189 commuters, 28.6%), and 30 to 34 minutes (86 commuters, 13.0%).
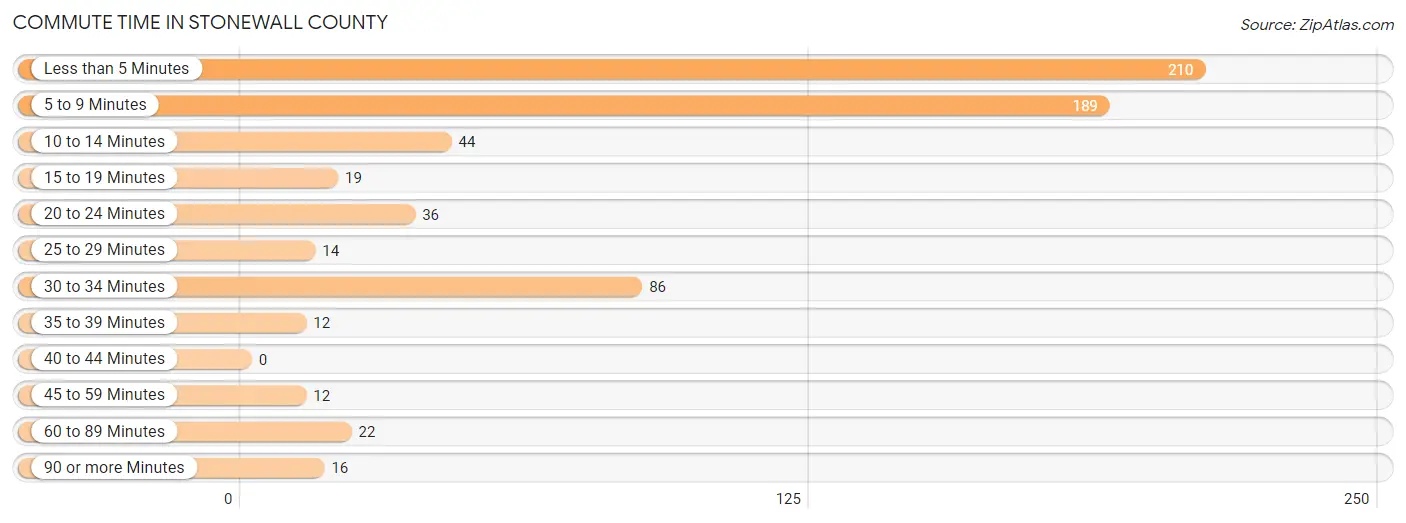
| Commute Time | # Commuters | % Commuters |
| Less than 5 Minutes | 210 | 31.8% |
| 5 to 9 Minutes | 189 | 28.6% |
| 10 to 14 Minutes | 44 | 6.7% |
| 15 to 19 Minutes | 19 | 2.9% |
| 20 to 24 Minutes | 36 | 5.4% |
| 25 to 29 Minutes | 14 | 2.1% |
| 30 to 34 Minutes | 86 | 13.0% |
| 35 to 39 Minutes | 12 | 1.8% |
| 40 to 44 Minutes | 0 | 0.0% |
| 45 to 59 Minutes | 12 | 1.8% |
| 60 to 89 Minutes | 22 | 3.3% |
| 90 or more Minutes | 16 | 2.4% |
Commute Time by Sex in Stonewall County
The most common commute times in Stonewall County are 5 to 9 minutes (122 commuters, 33.6%) for males and less than 5 minutes (175 commuters, 58.9%) for females.
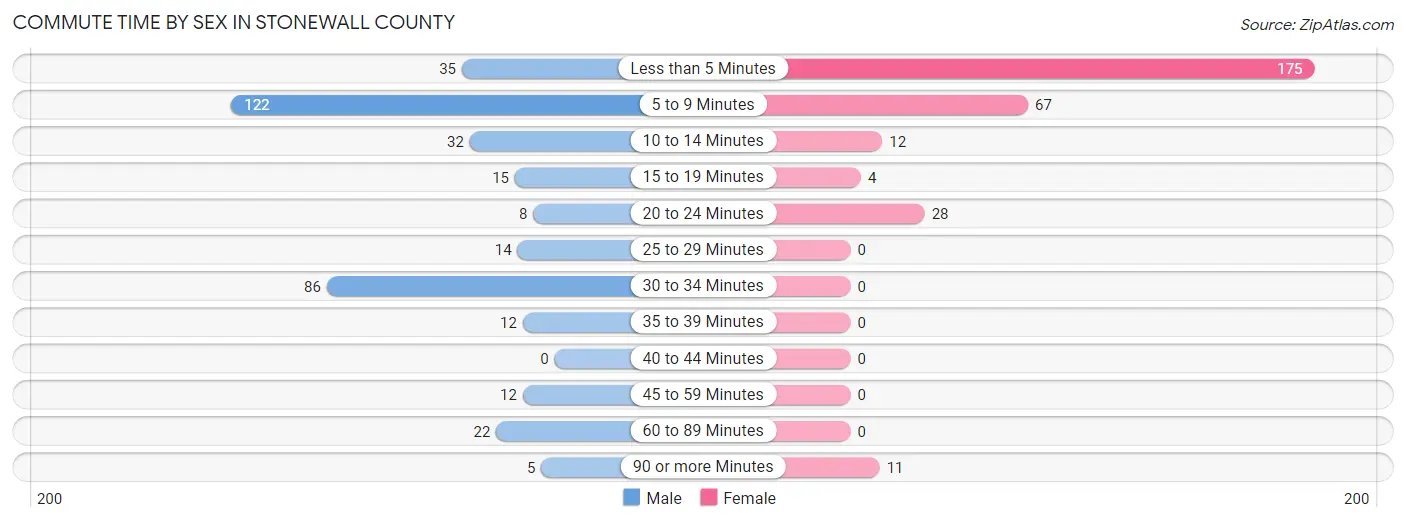
| Commute Time | Male | Female |
| Less than 5 Minutes | 35 (9.6%) | 175 (58.9%) |
| 5 to 9 Minutes | 122 (33.6%) | 67 (22.6%) |
| 10 to 14 Minutes | 32 (8.8%) | 12 (4.0%) |
| 15 to 19 Minutes | 15 (4.1%) | 4 (1.3%) |
| 20 to 24 Minutes | 8 (2.2%) | 28 (9.4%) |
| 25 to 29 Minutes | 14 (3.9%) | 0 (0.0%) |
| 30 to 34 Minutes | 86 (23.7%) | 0 (0.0%) |
| 35 to 39 Minutes | 12 (3.3%) | 0 (0.0%) |
| 40 to 44 Minutes | 0 (0.0%) | 0 (0.0%) |
| 45 to 59 Minutes | 12 (3.3%) | 0 (0.0%) |
| 60 to 89 Minutes | 22 (6.1%) | 0 (0.0%) |
| 90 or more Minutes | 5 (1.4%) | 11 (3.7%) |
Time of Departure to Work by Sex in Stonewall County
The most frequent times of departure to work in Stonewall County are 7:30 AM to 7:59 AM (89, 24.5%) for males and 7:30 AM to 7:59 AM (145, 48.8%) for females.
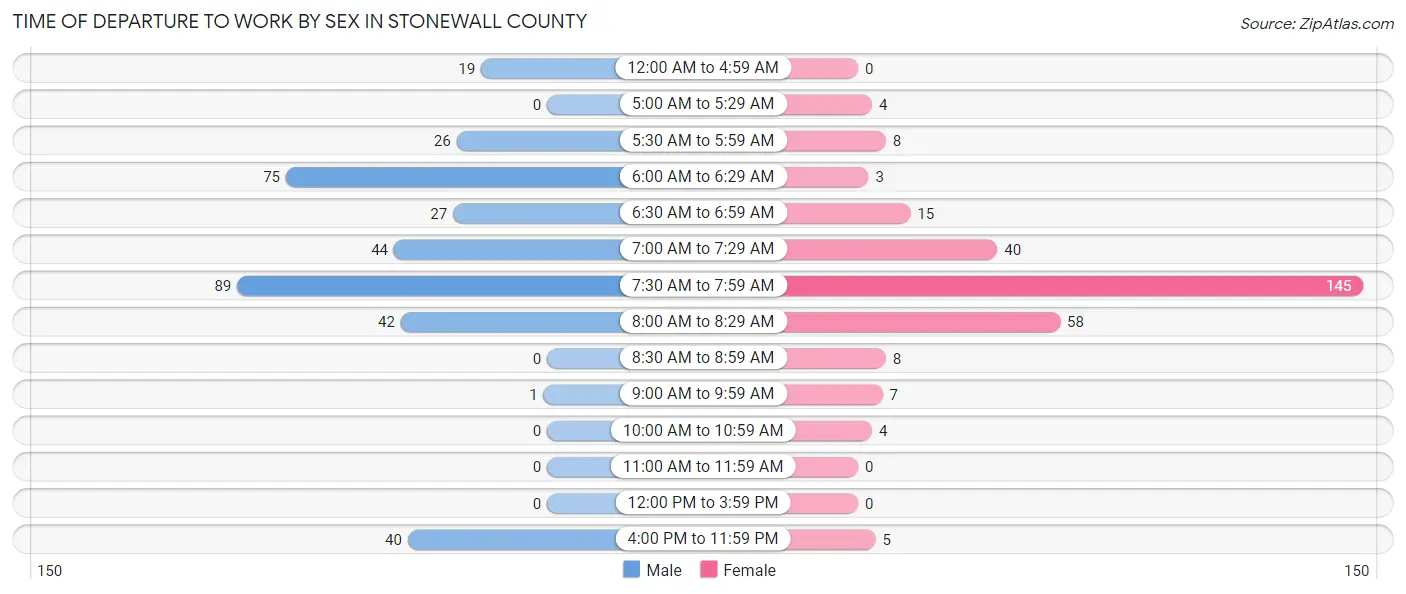
| Time of Departure | Male | Female |
| 12:00 AM to 4:59 AM | 19 (5.2%) | 0 (0.0%) |
| 5:00 AM to 5:29 AM | 0 (0.0%) | 4 (1.3%) |
| 5:30 AM to 5:59 AM | 26 (7.2%) | 8 (2.7%) |
| 6:00 AM to 6:29 AM | 75 (20.7%) | 3 (1.0%) |
| 6:30 AM to 6:59 AM | 27 (7.4%) | 15 (5.1%) |
| 7:00 AM to 7:29 AM | 44 (12.1%) | 40 (13.5%) |
| 7:30 AM to 7:59 AM | 89 (24.5%) | 145 (48.8%) |
| 8:00 AM to 8:29 AM | 42 (11.6%) | 58 (19.5%) |
| 8:30 AM to 8:59 AM | 0 (0.0%) | 8 (2.7%) |
| 9:00 AM to 9:59 AM | 1 (0.3%) | 7 (2.4%) |
| 10:00 AM to 10:59 AM | 0 (0.0%) | 4 (1.3%) |
| 11:00 AM to 11:59 AM | 0 (0.0%) | 0 (0.0%) |
| 12:00 PM to 3:59 PM | 0 (0.0%) | 0 (0.0%) |
| 4:00 PM to 11:59 PM | 40 (11.0%) | 5 (1.7%) |
| Total | 363 (100.0%) | 297 (100.0%) |
Housing Occupancy in Stonewall County
Occupancy by Ownership in Stonewall County
Of the total 450 dwellings in Stonewall County, owner-occupied units account for 374 (83.1%), while renter-occupied units make up 76 (16.9%).
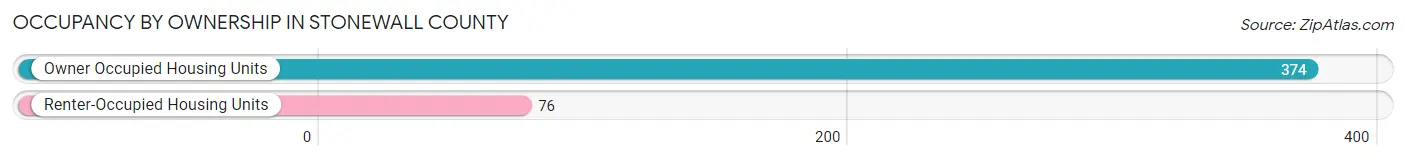
| Occupancy | # Housing Units | % Housing Units |
| Owner Occupied Housing Units | 374 | 83.1% |
| Renter-Occupied Housing Units | 76 | 16.9% |
| Total Occupied Housing Units | 450 | 100.0% |
Occupancy by Household Size in Stonewall County
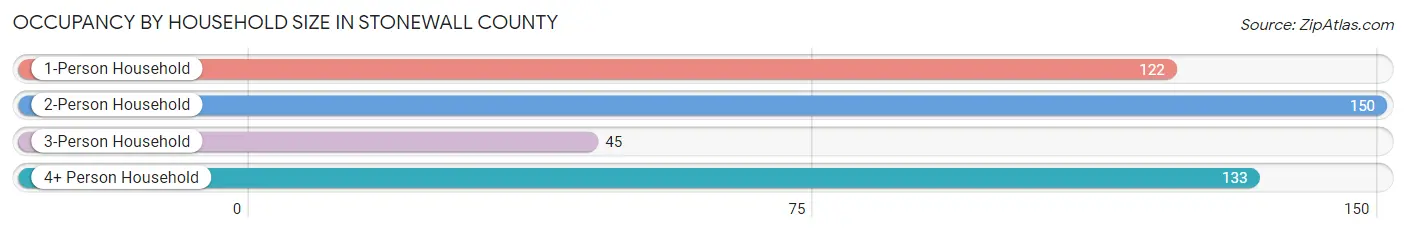
| Household Size | # Housing Units | % Housing Units |
| 1-Person Household | 122 | 27.1% |
| 2-Person Household | 150 | 33.3% |
| 3-Person Household | 45 | 10.0% |
| 4+ Person Household | 133 | 29.6% |
| Total Housing Units | 450 | 100.0% |
Occupancy by Ownership by Household Size in Stonewall County
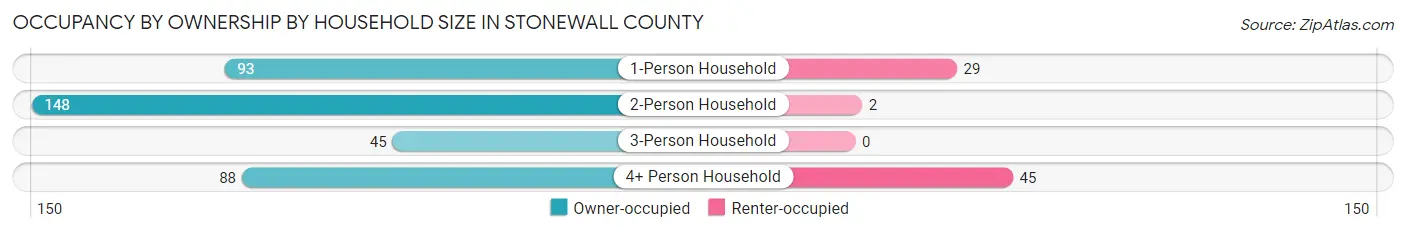
| Household Size | Owner-occupied | Renter-occupied |
| 1-Person Household | 93 (76.2%) | 29 (23.8%) |
| 2-Person Household | 148 (98.7%) | 2 (1.3%) |
| 3-Person Household | 45 (100.0%) | 0 (0.0%) |
| 4+ Person Household | 88 (66.2%) | 45 (33.8%) |
| Total Housing Units | 374 (83.1%) | 76 (16.9%) |
Occupancy by Educational Attainment in Stonewall County
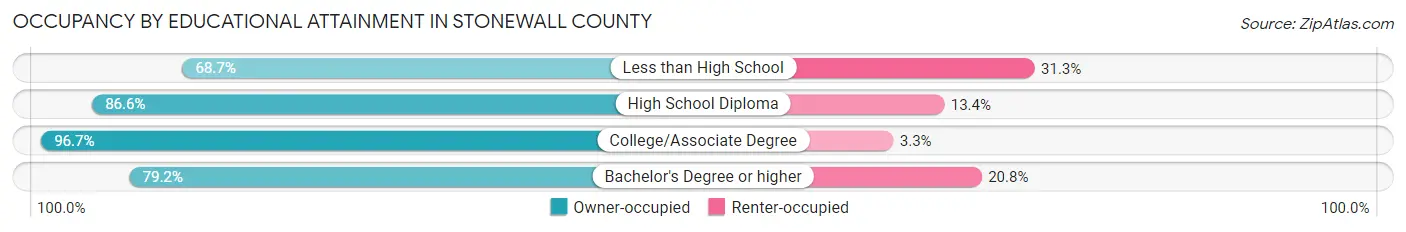
| Household Size | Owner-occupied | Renter-occupied |
| Less than High School | 68 (68.7%) | 31 (31.3%) |
| High School Diploma | 142 (86.6%) | 22 (13.4%) |
| College/Associate Degree | 88 (96.7%) | 3 (3.3%) |
| Bachelor's Degree or higher | 76 (79.2%) | 20 (20.8%) |
Occupancy by Age of Householder in Stonewall County
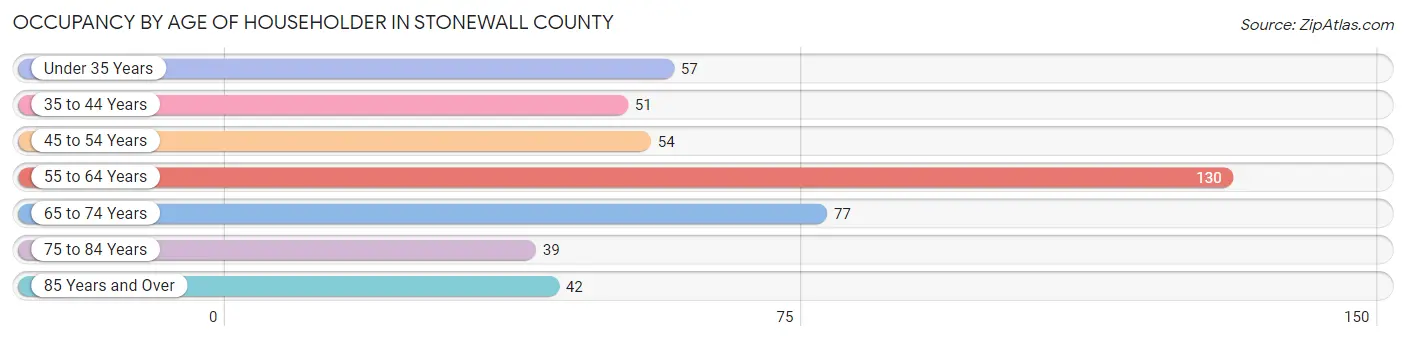
| Age Bracket | # Households | % Households |
| Under 35 Years | 57 | 12.7% |
| 35 to 44 Years | 51 | 11.3% |
| 45 to 54 Years | 54 | 12.0% |
| 55 to 64 Years | 130 | 28.9% |
| 65 to 74 Years | 77 | 17.1% |
| 75 to 84 Years | 39 | 8.7% |
| 85 Years and Over | 42 | 9.3% |
| Total | 450 | 100.0% |
Housing Finances in Stonewall County
Median Income by Occupancy in Stonewall County
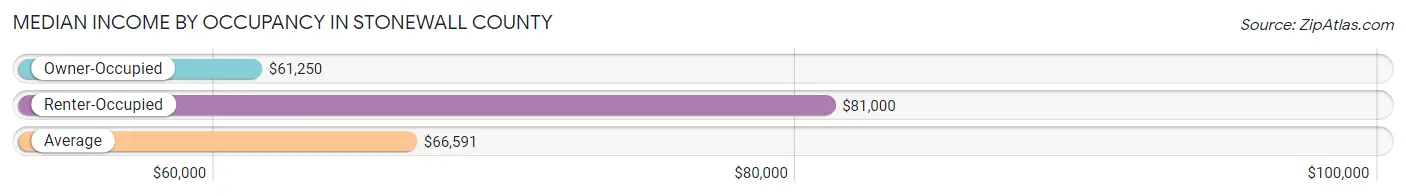
| Occupancy Type | # Households | Median Income |
| Owner-Occupied | 374 (83.1%) | $61,250 |
| Renter-Occupied | 76 (16.9%) | $81,000 |
| Average | 450 (100.0%) | $66,591 |
Occupancy by Householder Income Bracket in Stonewall County
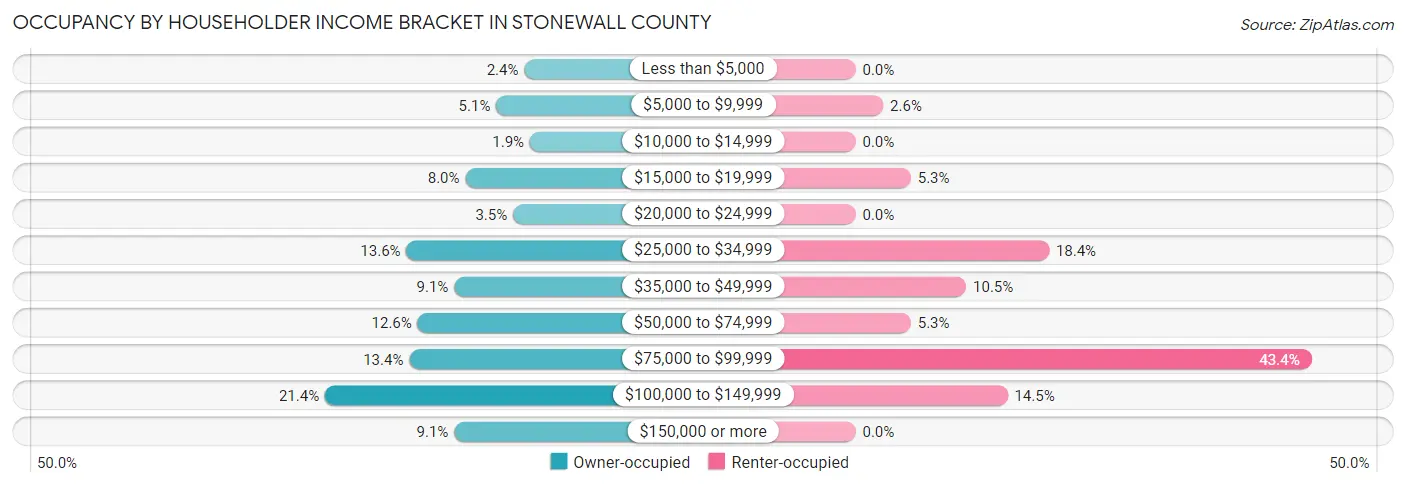
| Income Bracket | Owner-occupied | Renter-occupied |
| Less than $5,000 | 9 (2.4%) | 0 (0.0%) |
| $5,000 to $9,999 | 19 (5.1%) | 2 (2.6%) |
| $10,000 to $14,999 | 7 (1.9%) | 0 (0.0%) |
| $15,000 to $19,999 | 30 (8.0%) | 4 (5.3%) |
| $20,000 to $24,999 | 13 (3.5%) | 0 (0.0%) |
| $25,000 to $34,999 | 51 (13.6%) | 14 (18.4%) |
| $35,000 to $49,999 | 34 (9.1%) | 8 (10.5%) |
| $50,000 to $74,999 | 47 (12.6%) | 4 (5.3%) |
| $75,000 to $99,999 | 50 (13.4%) | 33 (43.4%) |
| $100,000 to $149,999 | 80 (21.4%) | 11 (14.5%) |
| $150,000 or more | 34 (9.1%) | 0 (0.0%) |
| Total | 374 (100.0%) | 76 (100.0%) |
Monthly Housing Cost Tiers in Stonewall County
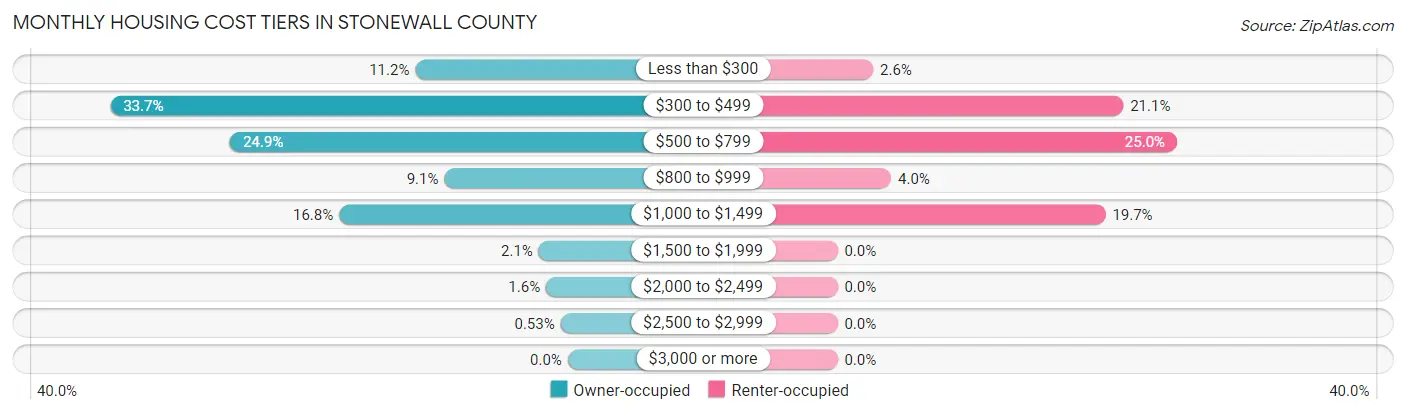
| Monthly Cost | Owner-occupied | Renter-occupied |
| Less than $300 | 42 (11.2%) | 2 (2.6%) |
| $300 to $499 | 126 (33.7%) | 16 (21.0%) |
| $500 to $799 | 93 (24.9%) | 19 (25.0%) |
| $800 to $999 | 34 (9.1%) | 3 (4.0%) |
| $1,000 to $1,499 | 63 (16.8%) | 15 (19.7%) |
| $1,500 to $1,999 | 8 (2.1%) | 0 (0.0%) |
| $2,000 to $2,499 | 6 (1.6%) | 0 (0.0%) |
| $2,500 to $2,999 | 2 (0.5%) | 0 (0.0%) |
| $3,000 or more | 0 (0.0%) | 0 (0.0%) |
| Total | 374 (100.0%) | 76 (100.0%) |
Physical Housing Characteristics in Stonewall County
Housing Structures in Stonewall County
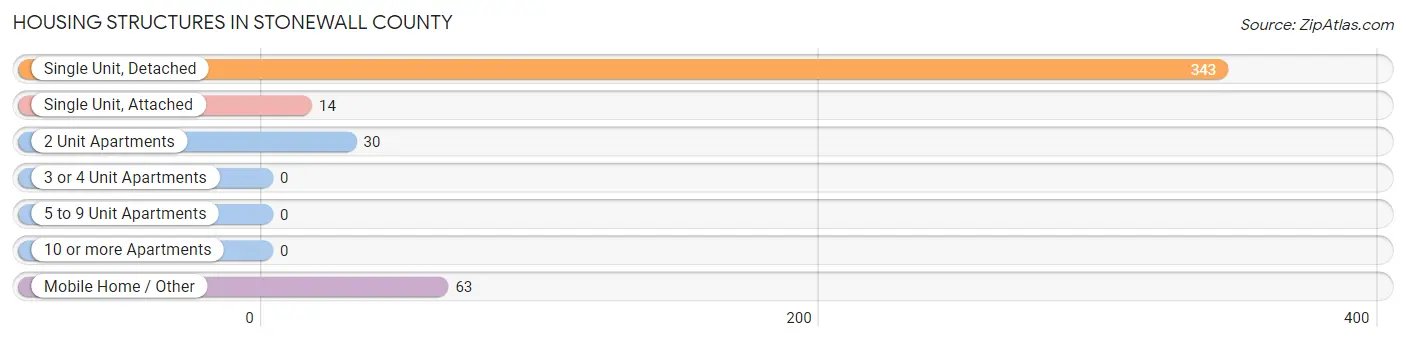
| Structure Type | # Housing Units | % Housing Units |
| Single Unit, Detached | 343 | 76.2% |
| Single Unit, Attached | 14 | 3.1% |
| 2 Unit Apartments | 30 | 6.7% |
| 3 or 4 Unit Apartments | 0 | 0.0% |
| 5 to 9 Unit Apartments | 0 | 0.0% |
| 10 or more Apartments | 0 | 0.0% |
| Mobile Home / Other | 63 | 14.0% |
| Total | 450 | 100.0% |
Housing Structures by Occupancy in Stonewall County
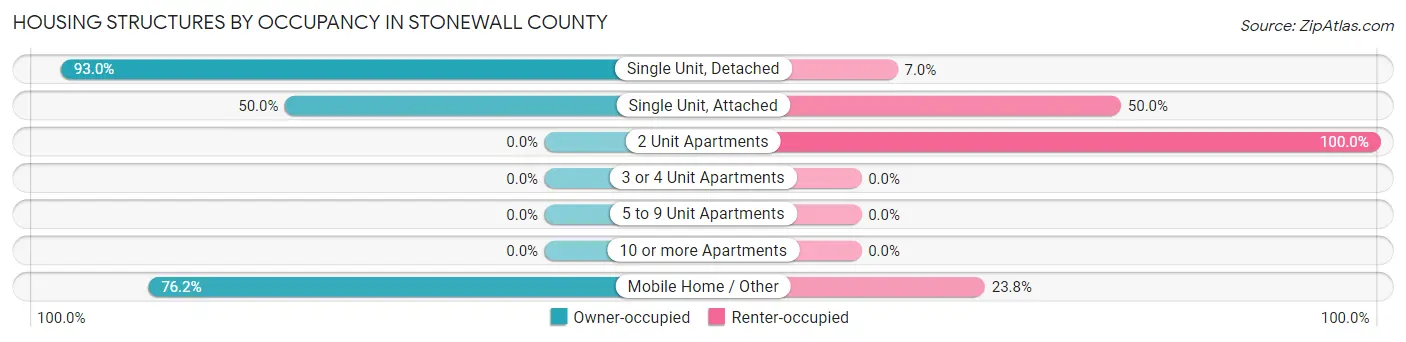
| Structure Type | Owner-occupied | Renter-occupied |
| Single Unit, Detached | 319 (93.0%) | 24 (7.0%) |
| Single Unit, Attached | 7 (50.0%) | 7 (50.0%) |
| 2 Unit Apartments | 0 (0.0%) | 30 (100.0%) |
| 3 or 4 Unit Apartments | 0 (0.0%) | 0 (0.0%) |
| 5 to 9 Unit Apartments | 0 (0.0%) | 0 (0.0%) |
| 10 or more Apartments | 0 (0.0%) | 0 (0.0%) |
| Mobile Home / Other | 48 (76.2%) | 15 (23.8%) |
| Total | 374 (83.1%) | 76 (16.9%) |
Housing Structures by Number of Rooms in Stonewall County
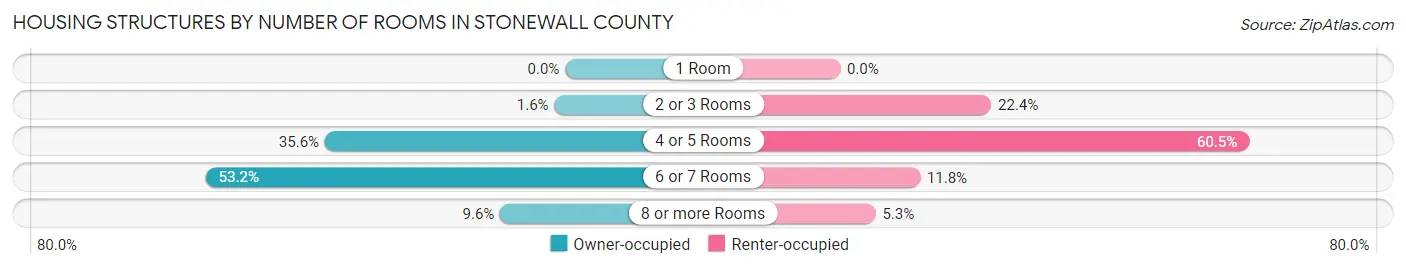
| Number of Rooms | Owner-occupied | Renter-occupied |
| 1 Room | 0 (0.0%) | 0 (0.0%) |
| 2 or 3 Rooms | 6 (1.6%) | 17 (22.4%) |
| 4 or 5 Rooms | 133 (35.6%) | 46 (60.5%) |
| 6 or 7 Rooms | 199 (53.2%) | 9 (11.8%) |
| 8 or more Rooms | 36 (9.6%) | 4 (5.3%) |
| Total | 374 (100.0%) | 76 (100.0%) |
Housing Structure by Heating Type in Stonewall County
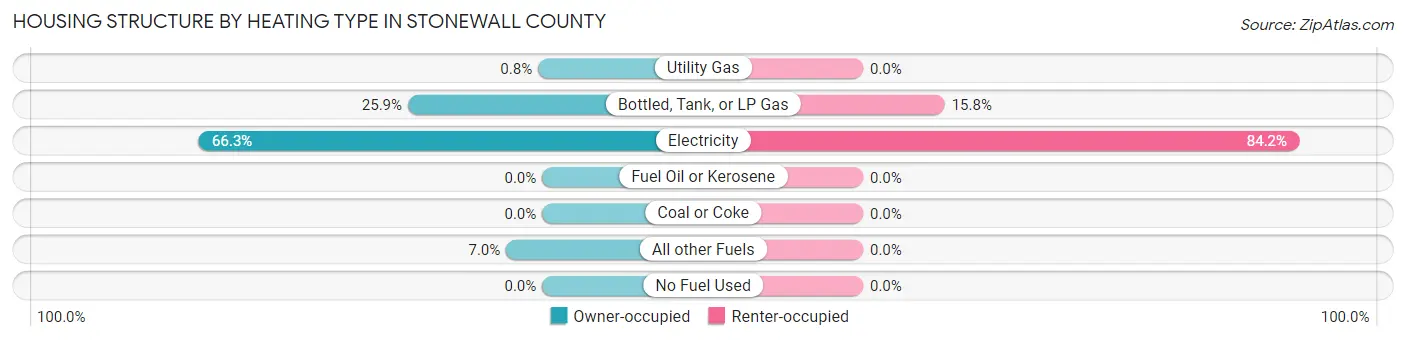
| Heating Type | Owner-occupied | Renter-occupied |
| Utility Gas | 3 (0.8%) | 0 (0.0%) |
| Bottled, Tank, or LP Gas | 97 (25.9%) | 12 (15.8%) |
| Electricity | 248 (66.3%) | 64 (84.2%) |
| Fuel Oil or Kerosene | 0 (0.0%) | 0 (0.0%) |
| Coal or Coke | 0 (0.0%) | 0 (0.0%) |
| All other Fuels | 26 (7.0%) | 0 (0.0%) |
| No Fuel Used | 0 (0.0%) | 0 (0.0%) |
| Total | 374 (100.0%) | 76 (100.0%) |
Household Vehicle Usage in Stonewall County
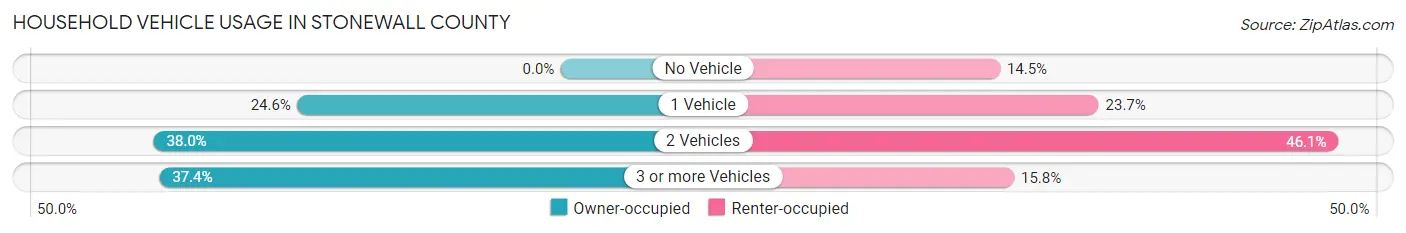
| Vehicles per Household | Owner-occupied | Renter-occupied |
| No Vehicle | 0 (0.0%) | 11 (14.5%) |
| 1 Vehicle | 92 (24.6%) | 18 (23.7%) |
| 2 Vehicles | 142 (38.0%) | 35 (46.1%) |
| 3 or more Vehicles | 140 (37.4%) | 12 (15.8%) |
| Total | 374 (100.0%) | 76 (100.0%) |
Real Estate & Mortgages in Stonewall County
Real Estate and Mortgage Overview in Stonewall County
| Characteristic | Without Mortgage | With Mortgage |
| Housing Units | 278 | 96 |
| Median Property Value | $52,200 | $66,700 |
| Median Household Income | $41,000 | $17 |
| Monthly Housing Costs | $445 | $0 |
| Real Estate Taxes | $672 | $0 |
Property Value by Mortgage Status in Stonewall County
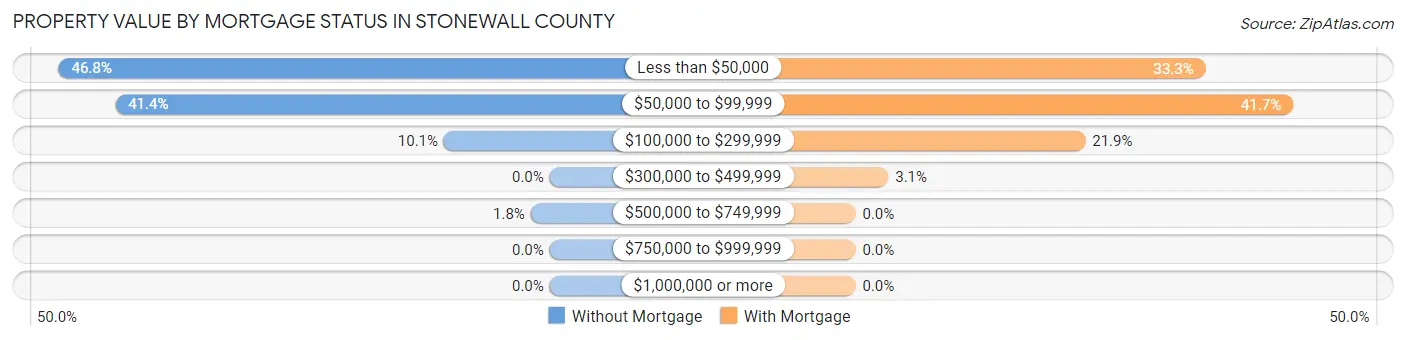
| Property Value | Without Mortgage | With Mortgage |
| Less than $50,000 | 130 (46.8%) | 32 (33.3%) |
| $50,000 to $99,999 | 115 (41.4%) | 40 (41.7%) |
| $100,000 to $299,999 | 28 (10.1%) | 21 (21.9%) |
| $300,000 to $499,999 | 0 (0.0%) | 3 (3.1%) |
| $500,000 to $749,999 | 5 (1.8%) | 0 (0.0%) |
| $750,000 to $999,999 | 0 (0.0%) | 0 (0.0%) |
| $1,000,000 or more | 0 (0.0%) | 0 (0.0%) |
| Total | 278 (100.0%) | 96 (100.0%) |
Household Income by Mortgage Status in Stonewall County
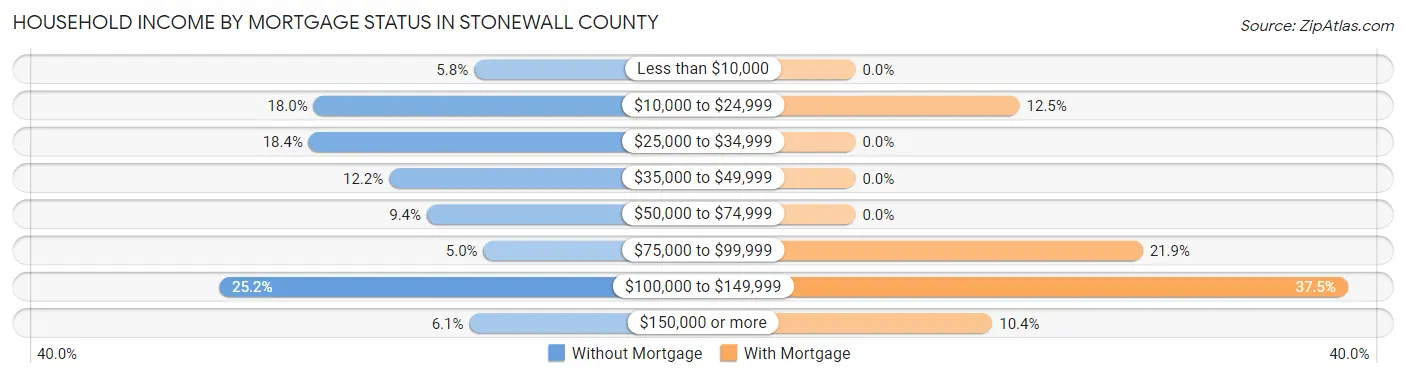
| Household Income | Without Mortgage | With Mortgage |
| Less than $10,000 | 16 (5.8%) | 0 (0.0%) |
| $10,000 to $24,999 | 50 (18.0%) | 12 (12.5%) |
| $25,000 to $34,999 | 51 (18.3%) | 0 (0.0%) |
| $35,000 to $49,999 | 34 (12.2%) | 0 (0.0%) |
| $50,000 to $74,999 | 26 (9.3%) | 0 (0.0%) |
| $75,000 to $99,999 | 14 (5.0%) | 21 (21.9%) |
| $100,000 to $149,999 | 70 (25.2%) | 36 (37.5%) |
| $150,000 or more | 17 (6.1%) | 10 (10.4%) |
| Total | 278 (100.0%) | 96 (100.0%) |
Property Value to Household Income Ratio in Stonewall County
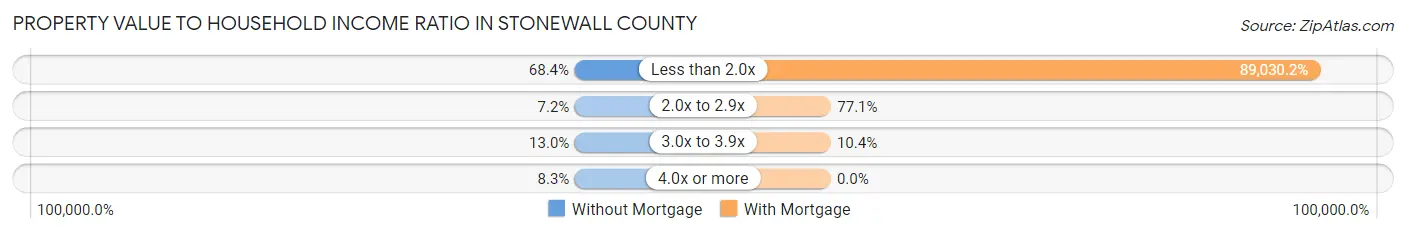
| Value-to-Income Ratio | Without Mortgage | With Mortgage |
| Less than 2.0x | 190 (68.3%) | 85,469 (89,030.2%) |
| 2.0x to 2.9x | 20 (7.2%) | 74 (77.1%) |
| 3.0x to 3.9x | 36 (13.0%) | 10 (10.4%) |
| 4.0x or more | 23 (8.3%) | 0 (0.0%) |
| Total | 278 (100.0%) | 96 (100.0%) |
Real Estate Taxes by Mortgage Status in Stonewall County
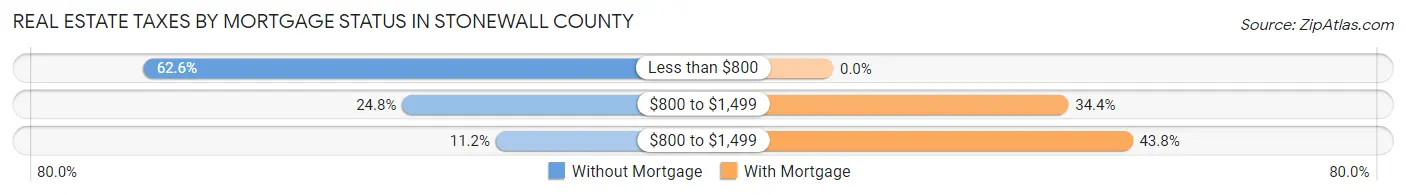
| Property Taxes | Without Mortgage | With Mortgage |
| Less than $800 | 174 (62.6%) | 0 (0.0%) |
| $800 to $1,499 | 69 (24.8%) | 33 (34.4%) |
| $800 to $1,499 | 31 (11.2%) | 42 (43.8%) |
| Total | 278 (100.0%) | 96 (100.0%) |
Health & Disability in Stonewall County
Health Insurance Coverage by Age in Stonewall County
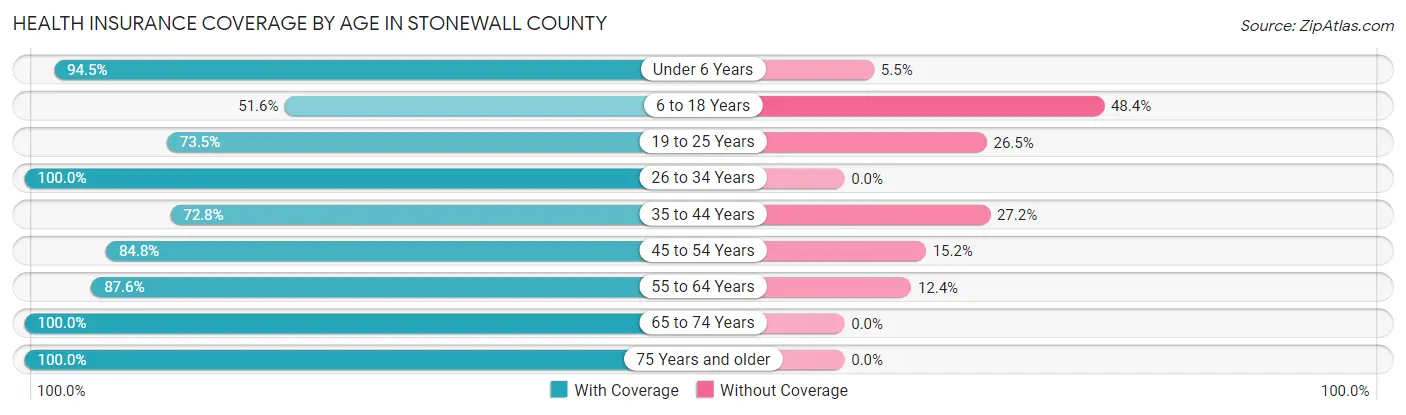
| Age Bracket | With Coverage | Without Coverage |
| Under 6 Years | 154 (94.5%) | 9 (5.5%) |
| 6 to 18 Years | 131 (51.6%) | 123 (48.4%) |
| 19 to 25 Years | 108 (73.5%) | 39 (26.5%) |
| 26 to 34 Years | 113 (100.0%) | 0 (0.0%) |
| 35 to 44 Years | 67 (72.8%) | 25 (27.2%) |
| 45 to 54 Years | 95 (84.8%) | 17 (15.2%) |
| 55 to 64 Years | 148 (87.6%) | 21 (12.4%) |
| 65 to 74 Years | 136 (100.0%) | 0 (0.0%) |
| 75 Years and older | 103 (100.0%) | 0 (0.0%) |
| Total | 1,055 (81.9%) | 234 (18.1%) |
Health Insurance Coverage by Citizenship Status in Stonewall County
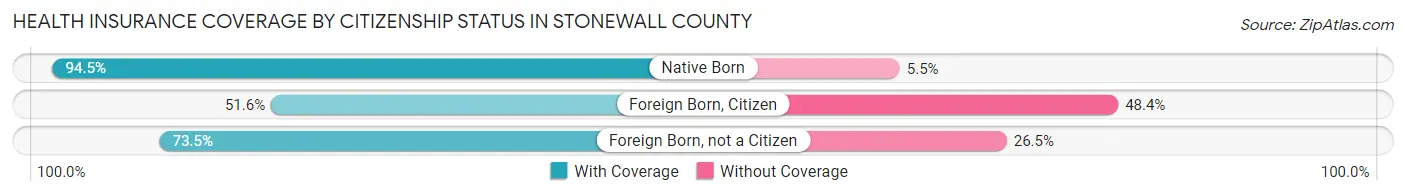
| Citizenship Status | With Coverage | Without Coverage |
| Native Born | 154 (94.5%) | 9 (5.5%) |
| Foreign Born, Citizen | 131 (51.6%) | 123 (48.4%) |
| Foreign Born, not a Citizen | 108 (73.5%) | 39 (26.5%) |
Health Insurance Coverage by Household Income in Stonewall County
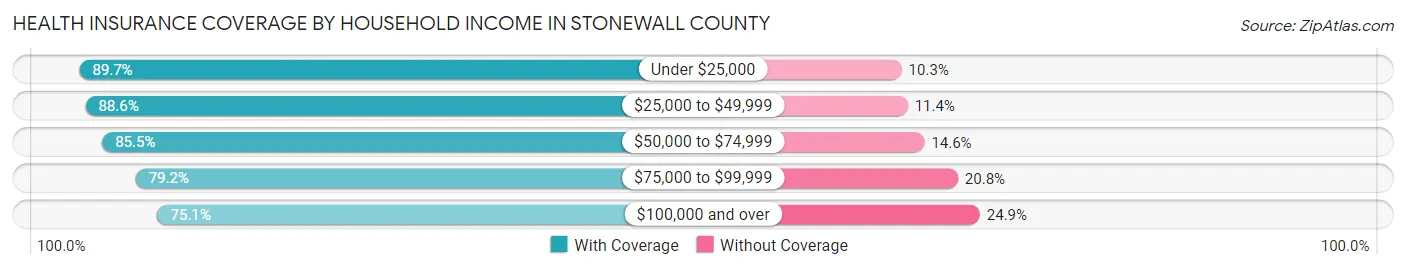
| Household Income | With Coverage | Without Coverage |
| Under $25,000 | 96 (89.7%) | 11 (10.3%) |
| $25,000 to $49,999 | 233 (88.6%) | 30 (11.4%) |
| $50,000 to $74,999 | 182 (85.5%) | 31 (14.5%) |
| $75,000 to $99,999 | 270 (79.2%) | 71 (20.8%) |
| $100,000 and over | 274 (75.1%) | 91 (24.9%) |
Public vs Private Health Insurance Coverage by Age in Stonewall County
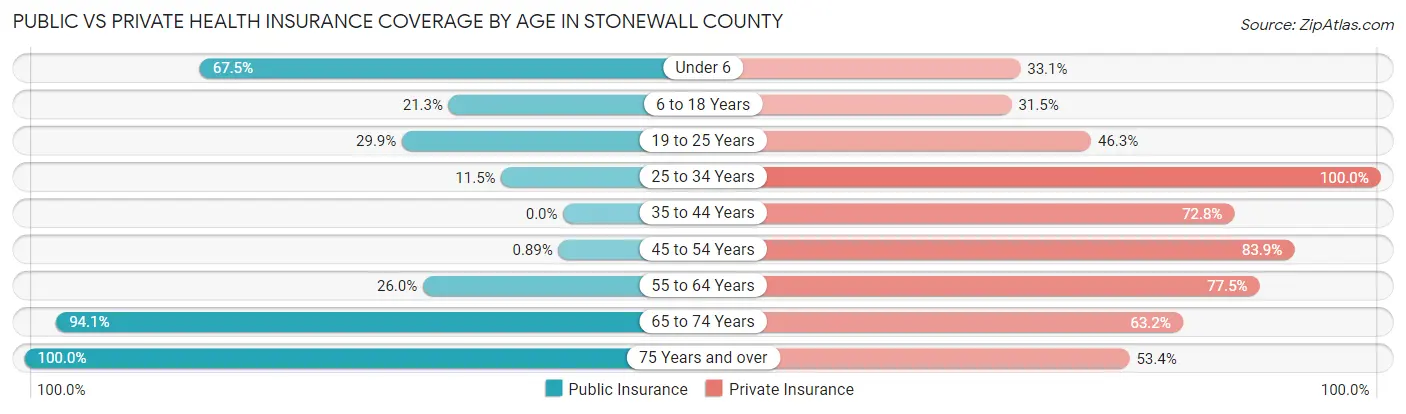
| Age Bracket | Public Insurance | Private Insurance |
| Under 6 | 110 (67.5%) | 54 (33.1%) |
| 6 to 18 Years | 54 (21.3%) | 80 (31.5%) |
| 19 to 25 Years | 44 (29.9%) | 68 (46.3%) |
| 25 to 34 Years | 13 (11.5%) | 113 (100.0%) |
| 35 to 44 Years | 0 (0.0%) | 67 (72.8%) |
| 45 to 54 Years | 1 (0.9%) | 94 (83.9%) |
| 55 to 64 Years | 44 (26.0%) | 131 (77.5%) |
| 65 to 74 Years | 128 (94.1%) | 86 (63.2%) |
| 75 Years and over | 103 (100.0%) | 55 (53.4%) |
| Total | 497 (38.6%) | 748 (58.0%) |
Disability Status by Sex by Age in Stonewall County
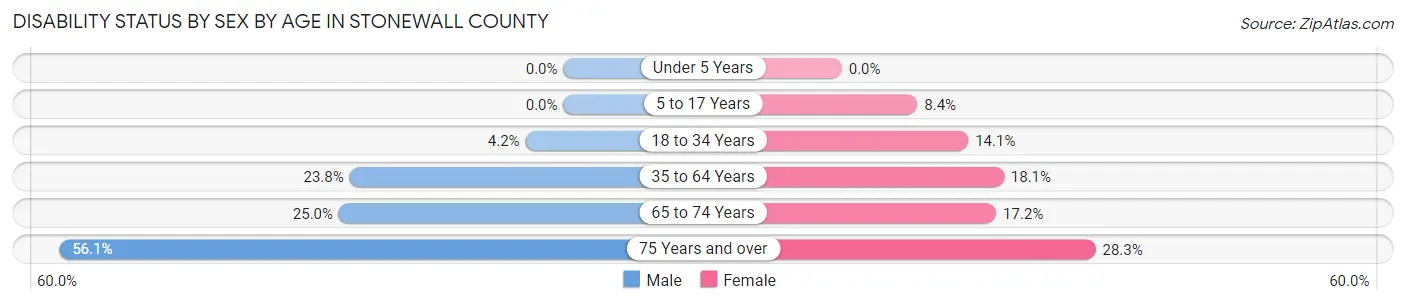
| Age Bracket | Male | Female |
| Under 5 Years | 0 (0.0%) | 0 (0.0%) |
| 5 to 17 Years | 0 (0.0%) | 9 (8.4%) |
| 18 to 34 Years | 7 (4.2%) | 20 (14.1%) |
| 35 to 64 Years | 40 (23.8%) | 37 (18.0%) |
| 65 to 74 Years | 18 (25.0%) | 11 (17.2%) |
| 75 Years and over | 32 (56.1%) | 13 (28.3%) |
Disability Class by Sex by Age in Stonewall County
Disability Class: Hearing Difficulty
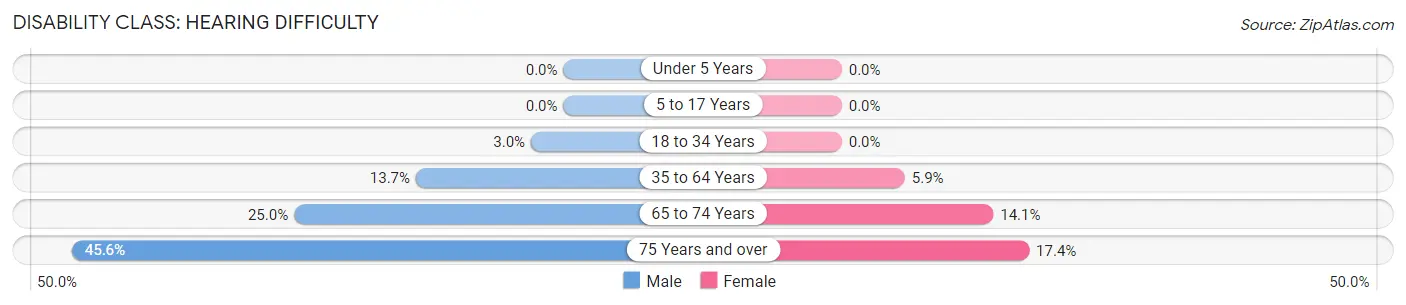
| Age Bracket | Male | Female |
| Under 5 Years | 0 (0.0%) | 0 (0.0%) |
| 5 to 17 Years | 0 (0.0%) | 0 (0.0%) |
| 18 to 34 Years | 5 (3.0%) | 0 (0.0%) |
| 35 to 64 Years | 23 (13.7%) | 12 (5.9%) |
| 65 to 74 Years | 18 (25.0%) | 9 (14.1%) |
| 75 Years and over | 26 (45.6%) | 8 (17.4%) |
Disability Class: Vision Difficulty
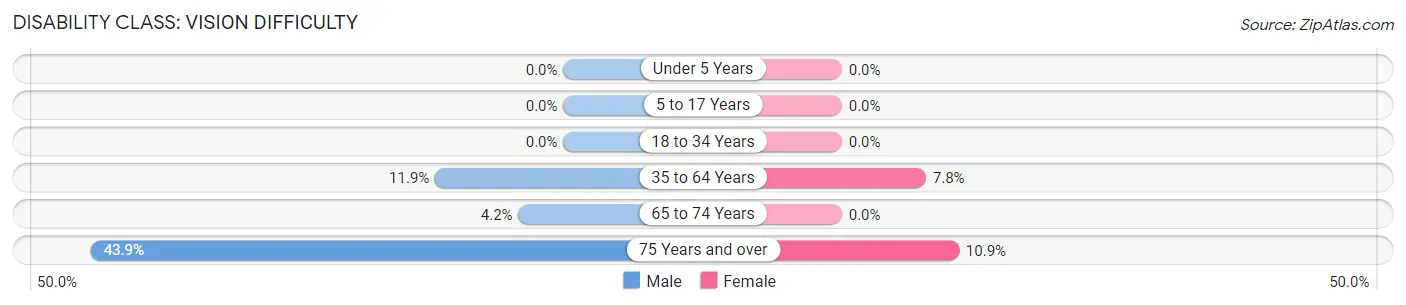
| Age Bracket | Male | Female |
| Under 5 Years | 0 (0.0%) | 0 (0.0%) |
| 5 to 17 Years | 0 (0.0%) | 0 (0.0%) |
| 18 to 34 Years | 0 (0.0%) | 0 (0.0%) |
| 35 to 64 Years | 20 (11.9%) | 16 (7.8%) |
| 65 to 74 Years | 3 (4.2%) | 0 (0.0%) |
| 75 Years and over | 25 (43.9%) | 5 (10.9%) |
Disability Class: Cognitive Difficulty
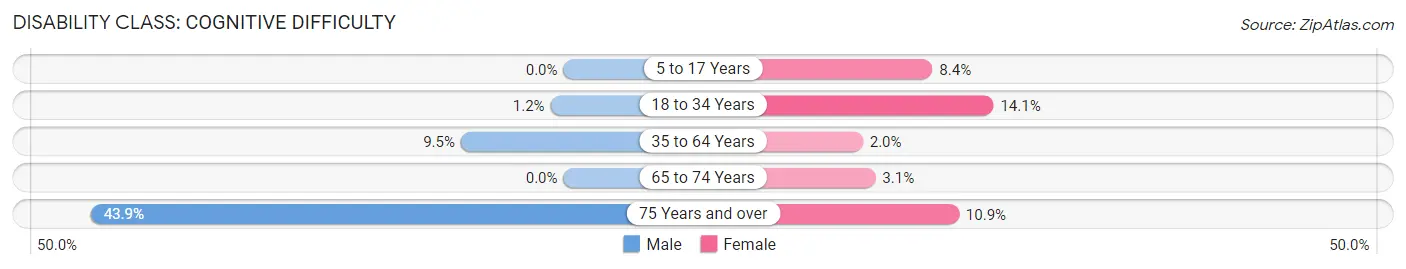
| Age Bracket | Male | Female |
| 5 to 17 Years | 0 (0.0%) | 9 (8.4%) |
| 18 to 34 Years | 2 (1.2%) | 20 (14.1%) |
| 35 to 64 Years | 16 (9.5%) | 4 (1.9%) |
| 65 to 74 Years | 0 (0.0%) | 2 (3.1%) |
| 75 Years and over | 25 (43.9%) | 5 (10.9%) |
Disability Class: Ambulatory Difficulty
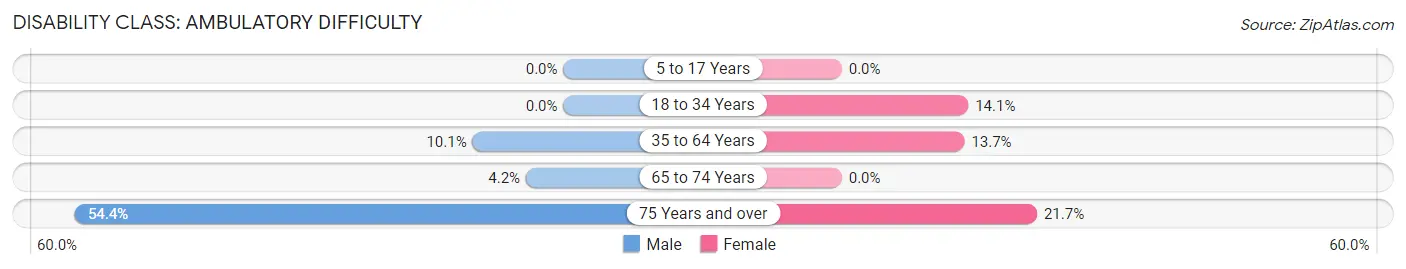
| Age Bracket | Male | Female |
| 5 to 17 Years | 0 (0.0%) | 0 (0.0%) |
| 18 to 34 Years | 0 (0.0%) | 20 (14.1%) |
| 35 to 64 Years | 17 (10.1%) | 28 (13.7%) |
| 65 to 74 Years | 3 (4.2%) | 0 (0.0%) |
| 75 Years and over | 31 (54.4%) | 10 (21.7%) |
Disability Class: Self-Care Difficulty
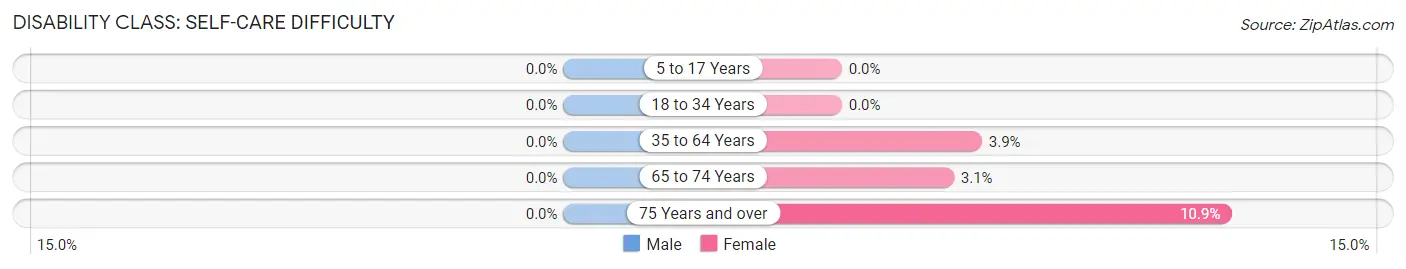
| Age Bracket | Male | Female |
| 5 to 17 Years | 0 (0.0%) | 0 (0.0%) |
| 18 to 34 Years | 0 (0.0%) | 0 (0.0%) |
| 35 to 64 Years | 0 (0.0%) | 8 (3.9%) |
| 65 to 74 Years | 0 (0.0%) | 2 (3.1%) |
| 75 Years and over | 0 (0.0%) | 5 (10.9%) |
Technology Access in Stonewall County
Computing Device Access in Stonewall County
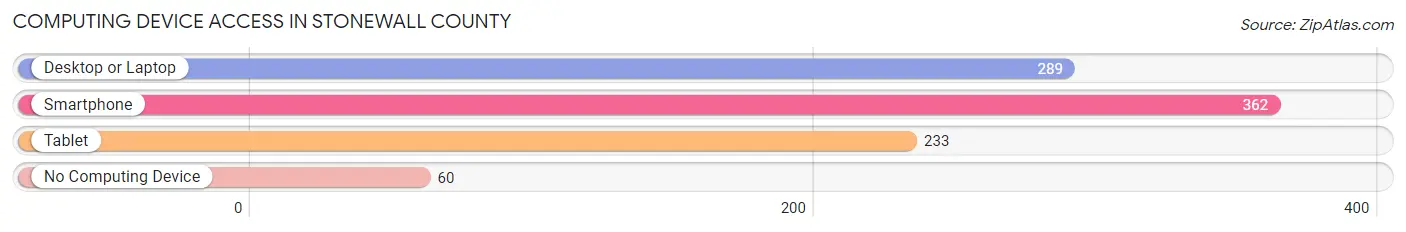
| Device Type | # Households | % Households |
| Desktop or Laptop | 289 | 64.2% |
| Smartphone | 362 | 80.4% |
| Tablet | 233 | 51.8% |
| No Computing Device | 60 | 13.3% |
| Total | 450 | 100.0% |
Internet Access in Stonewall County
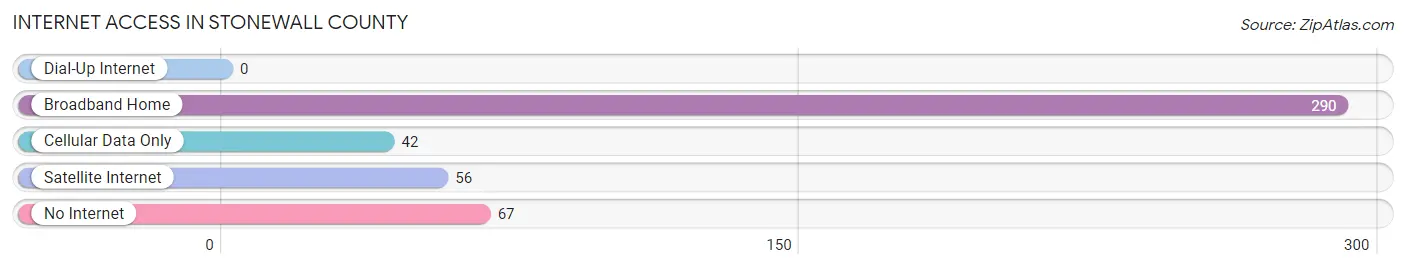
| Internet Type | # Households | % Households |
| Dial-Up Internet | 0 | 0.0% |
| Broadband Home | 290 | 64.4% |
| Cellular Data Only | 42 | 9.3% |
| Satellite Internet | 56 | 12.4% |
| No Internet | 67 | 14.9% |
| Total | 450 | 100.0% |
Stonewall County Summary
Stonewall County is located in the Texas Panhandle, in the northwestern corner of the state. It is bordered by King County to the north, Kent County to the east, Fisher County to the south, and Floyd County to the west. The county seat is Aspermont, and the largest city is Aspermont. The county was named for Thomas J. Stonewall, a hero of the Battle of San Jacinto.
Geography
Stonewall County covers an area of 902 square miles, making it the second-smallest county in Texas. The terrain is mostly flat, with some rolling hills in the eastern part of the county. The county is drained by the Salt Fork of the Brazos River, which flows through the center of the county. The county is part of the High Plains region of Texas, and is mostly covered in grasslands.
Demographics
As of the 2010 census, the population of Stonewall County was 1,490, a decrease of 8.3% from the 2000 census. The population density was 1.7 people per square mile. The racial makeup of the county was 94.3% White, 0.2% African American, 0.2% Native American, 0.2% Asian, 0.1% Pacific Islander, 4.2% from other races, and 0.9% from two or more races. Hispanic or Latino of any race were 8.3% of the population.
The median income for a household in the county was $30,938, and the median income for a family was $35,625. The per capita income for the county was $15,845. About 16.2% of families and 19.2% of the population were below the poverty line, including 25.2% of those under age 18 and 14.2% of those age 65 or over.
Economy
Agriculture is the main economic activity in Stonewall County. The county is home to a variety of crops, including wheat, corn, sorghum, cotton, and hay. Cattle and sheep are also raised in the county.
Oil and gas production is also an important part of the economy. The county is home to several oil and gas fields, including the Aspermont Field, the Stonewall Field, and the Salt Fork Field.
The county is also home to several manufacturing companies, including a plastics plant, a metal fabrication plant, and a food processing plant.
History
Stonewall County was created in 1876 from parts of Bexar and Young counties. The county was named for Thomas J. Stonewall, a hero of the Battle of San Jacinto.
The first settlers in the county were ranchers, who began arriving in the late 1870s. The first town in the county was Aspermont, which was founded in 1881. The town was named for the Aspermont family, who were early settlers in the area.
The county experienced a population boom in the early 1900s, as farmers began to move to the area. The population peaked in 1930, at 8,845.
The county has experienced a population decline since then, as many people have moved away in search of better economic opportunities. The population was 1,490 in 2010, a decrease of 8.3% from the 2000 census.
Conclusion
Stonewall County is located in the Texas Panhandle, in the northwestern corner of the state. It is bordered by King County to the north, Kent County to the east, Fisher County to the south, and Floyd County to the west. The county was named for Thomas J. Stonewall, a hero of the Battle of San Jacinto. The county covers an area of 902 square miles, and has a population of 1,490, as of the 2010 census. The economy of the county is based on agriculture, oil and gas production, and manufacturing. The county has experienced a population decline since the 1930s, as many people have moved away in search of better economic opportunities.
Common Questions
What is Per Capita Income in Stonewall County?
Per Capita income in Stonewall County is $26,733.
What is the Median Family Income in Stonewall County?
Median Family Income in Stonewall County is $82,176.
What is the Median Household income in Stonewall County?
Median Household Income in Stonewall County is $66,591.
What is Income or Wage Gap in Stonewall County?
Income or Wage Gap in Stonewall County is 56.0%.
Women in Stonewall County earn 44.0 cents for every dollar earned by a man.
What is Inequality or Gini Index in Stonewall County?
Inequality or Gini Index in Stonewall County is 0.43.
What is the Total Population of Stonewall County?
Total Population of Stonewall County is 1,331.
What is the Total Male Population of Stonewall County?
Total Male Population of Stonewall County is 681.
What is the Total Female Population of Stonewall County?
Total Female Population of Stonewall County is 650.
What is the Ratio of Males per 100 Females in Stonewall County?
There are 104.77 Males per 100 Females in Stonewall County.
What is the Ratio of Females per 100 Males in Stonewall County?
There are 95.45 Females per 100 Males in Stonewall County.
What is the Median Population Age in Stonewall County?
Median Population Age in Stonewall County is 33.5 Years.
What is the Average Family Size in Stonewall County
Average Family Size in Stonewall County is 3.5 People.
What is the Average Household Size in Stonewall County
Average Household Size in Stonewall County is 2.9 People.
How Large is the Labor Force in Stonewall County?
There are 679 People in the Labor Forcein in Stonewall County.
What is the Percentage of People in the Labor Force in Stonewall County?
66.2% of People are in the Labor Force in Stonewall County.
What is the Unemployment Rate in Stonewall County?
Unemployment Rate in Stonewall County is 1.8%.