Sterling County, TX Map & Demographics
Sterling County Map
Sterling County Overview
$31,039
PER CAPITA INCOME
$69,375
AVG FAMILY INCOME
$63,558
AVG HOUSEHOLD INCOME
59.7%
WAGE / INCOME GAP [ % ]
40.3¢/ $1
WAGE / INCOME GAP [ $ ]
0.37
INEQUALITY / GINI INDEX
1,392
TOTAL POPULATION
737
MALE POPULATION
655
FEMALE POPULATION
112.52
MALES / 100 FEMALES
88.87
FEMALES / 100 MALES
32.1
MEDIAN AGE
3.8
AVG FAMILY SIZE
3.5
AVG HOUSEHOLD SIZE
575
LABOR FORCE [ PEOPLE ]
62.3%
PERCENT IN LABOR FORCE
Sterling County Area Codes
Income in Sterling County
Income Overview in Sterling County
Per Capita Income in Sterling County is $31,039, while median incomes of families and households are $69,375 and $63,558 respectively.
| Characteristic | Number | Measure |
| Per Capita Income | 1,392 | $31,039 |
| Median Family Income | 344 | $69,375 |
| Mean Family Income | 344 | $105,919 |
| Median Household Income | 392 | $63,558 |
| Mean Household Income | 392 | $98,668 |
| Income Deficit | 344 | $0 |
| Wage / Income Gap (%) | 1,392 | 59.74% |
| Wage / Income Gap ($) | 1,392 | 40.26¢ per $1 |
| Gini / Inequality Index | 1,392 | 0.37 |
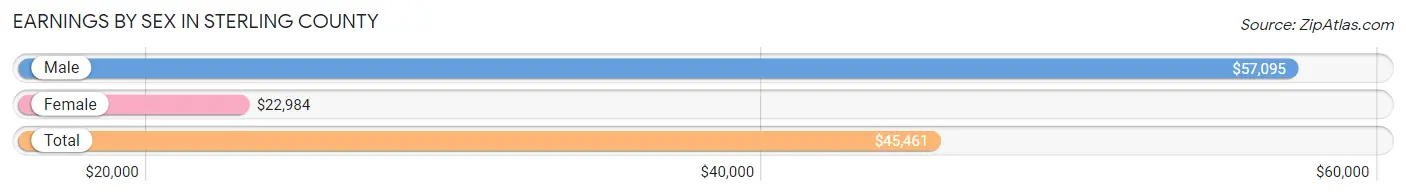
Earnings by Sex in Sterling County
Average Earnings in Sterling County are $45,461, $57,095 for men and $22,984 for women, a difference of 59.7%.
| Sex | Number | Average Earnings |
| Male | 328 (56.0%) | $57,095 |
| Female | 258 (44.0%) | $22,984 |
| Total | 586 (100.0%) | $45,461 |
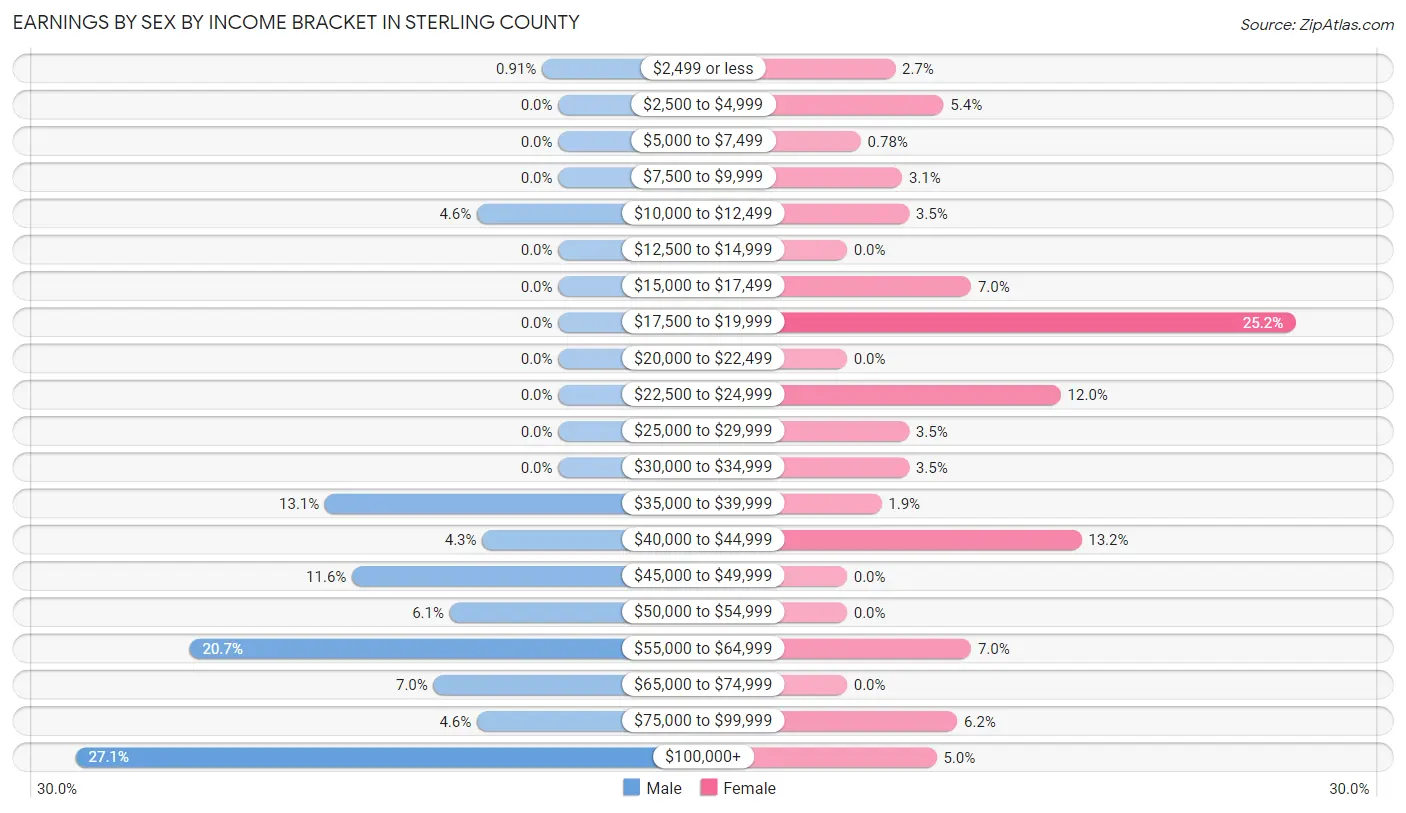
Earnings by Sex by Income Bracket in Sterling County
The most common earnings brackets in Sterling County are $100,000+ for men (89 | 27.1%) and $17,500 to $19,999 for women (65 | 25.2%).
| Income | Male | Female |
| $2,499 or less | 3 (0.9%) | 7 (2.7%) |
| $2,500 to $4,999 | 0 (0.0%) | 14 (5.4%) |
| $5,000 to $7,499 | 0 (0.0%) | 2 (0.8%) |
| $7,500 to $9,999 | 0 (0.0%) | 8 (3.1%) |
| $10,000 to $12,499 | 15 (4.6%) | 9 (3.5%) |
| $12,500 to $14,999 | 0 (0.0%) | 0 (0.0%) |
| $15,000 to $17,499 | 0 (0.0%) | 18 (7.0%) |
| $17,500 to $19,999 | 0 (0.0%) | 65 (25.2%) |
| $20,000 to $22,499 | 0 (0.0%) | 0 (0.0%) |
| $22,500 to $24,999 | 0 (0.0%) | 31 (12.0%) |
| $25,000 to $29,999 | 0 (0.0%) | 9 (3.5%) |
| $30,000 to $34,999 | 0 (0.0%) | 9 (3.5%) |
| $35,000 to $39,999 | 43 (13.1%) | 5 (1.9%) |
| $40,000 to $44,999 | 14 (4.3%) | 34 (13.2%) |
| $45,000 to $49,999 | 38 (11.6%) | 0 (0.0%) |
| $50,000 to $54,999 | 20 (6.1%) | 0 (0.0%) |
| $55,000 to $64,999 | 68 (20.7%) | 18 (7.0%) |
| $65,000 to $74,999 | 23 (7.0%) | 0 (0.0%) |
| $75,000 to $99,999 | 15 (4.6%) | 16 (6.2%) |
| $100,000+ | 89 (27.1%) | 13 (5.0%) |
| Total | 328 (100.0%) | 258 (100.0%) |
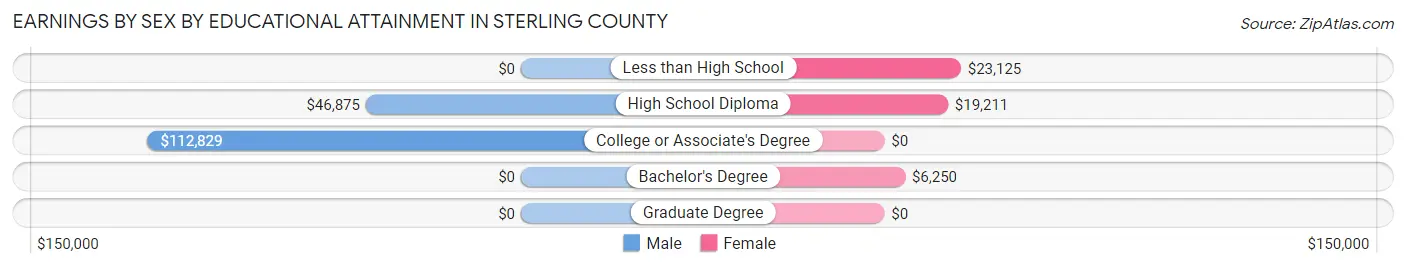
Earnings by Sex by Educational Attainment in Sterling County
Average earnings in Sterling County are $57,196 for men and $24,395 for women, a difference of 57.4%. Men with an educational attainment of college or associate's degree enjoy the highest average annual earnings of $112,829, while those with high school diploma education earn the least with $46,875. Women with an educational attainment of less than high school earn the most with the average annual earnings of $23,125, while those with bachelor's degree education have the smallest earnings of $6,250.
| Educational Attainment | Male Income | Female Income |
| Less than High School | - | - |
| High School Diploma | $46,875 | $19,211 |
| College or Associate's Degree | $112,829 | $0 |
| Bachelor's Degree | - | - |
| Graduate Degree | - | - |
| Total | $57,196 | $24,395 |
Family Income in Sterling County
Family Income Brackets in Sterling County
According to the Sterling County family income data, there are 141 families falling into the $50,000 to $74,999 income range, which is the most common income bracket and makes up 41.0% of all families.
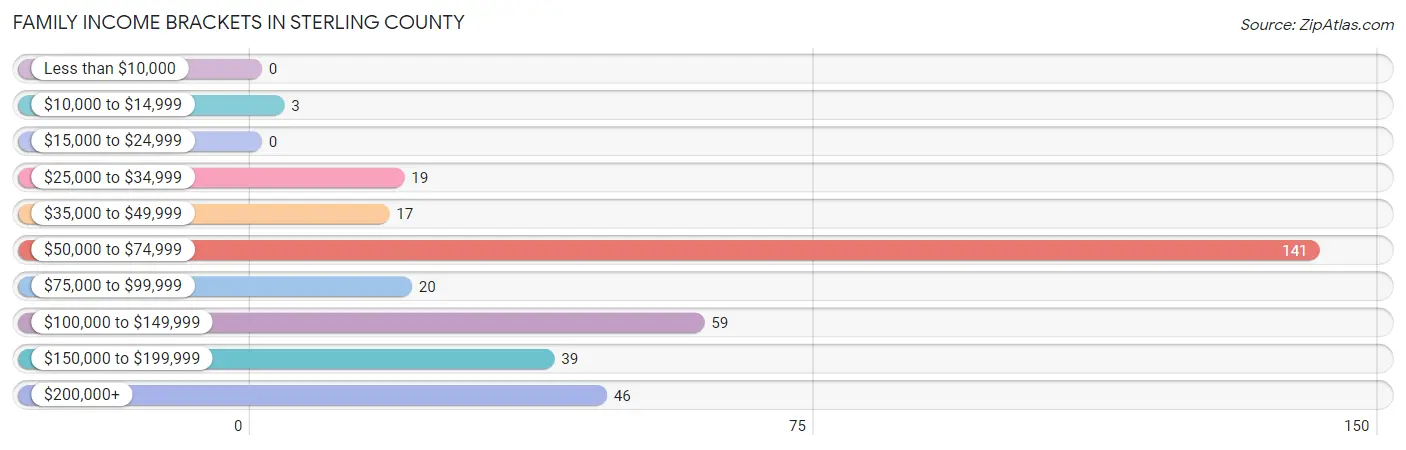
| Income Bracket | # Families | % Families |
| Less than $10,000 | 0 | 0.0% |
| $10,000 to $14,999 | 3 | 0.9% |
| $15,000 to $24,999 | 0 | 0.0% |
| $25,000 to $34,999 | 19 | 5.5% |
| $35,000 to $49,999 | 17 | 4.9% |
| $50,000 to $74,999 | 141 | 41.0% |
| $75,000 to $99,999 | 20 | 5.8% |
| $100,000 to $149,999 | 59 | 17.2% |
| $150,000 to $199,999 | 39 | 11.3% |
| $200,000+ | 46 | 13.4% |
Family Income by Famaliy Size in Sterling County
5-person families (44 | 12.8%) account for the highest median family income in Sterling County with $208,452 per family, while 5-person families (44 | 12.8%) have the highest median income of $41,690 per family member.
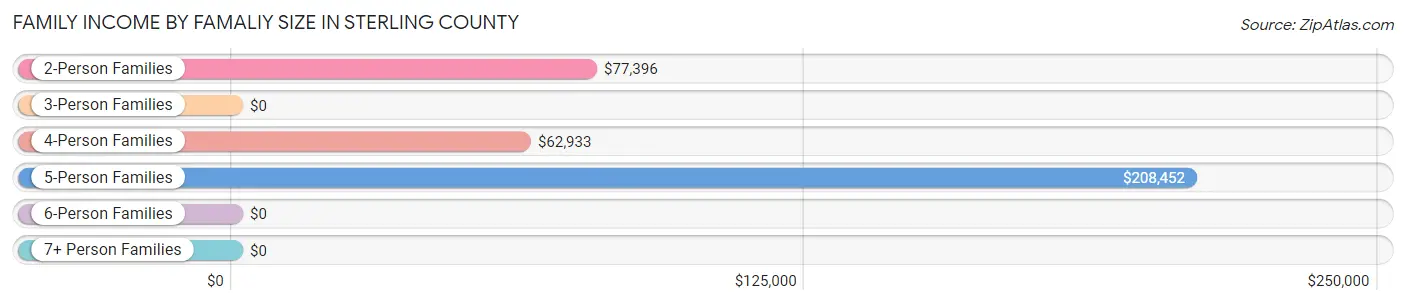
| Income Bracket | # Families | Median Income |
| 2-Person Families | 131 (38.1%) | $77,396 |
| 3-Person Families | 40 (11.6%) | $0 |
| 4-Person Families | 115 (33.4%) | $62,933 |
| 5-Person Families | 44 (12.8%) | $208,452 |
| 6-Person Families | 0 (0.0%) | $0 |
| 7+ Person Families | 14 (4.1%) | $0 |
| Total | 344 (100.0%) | $69,375 |
Family Income by Number of Earners in Sterling County
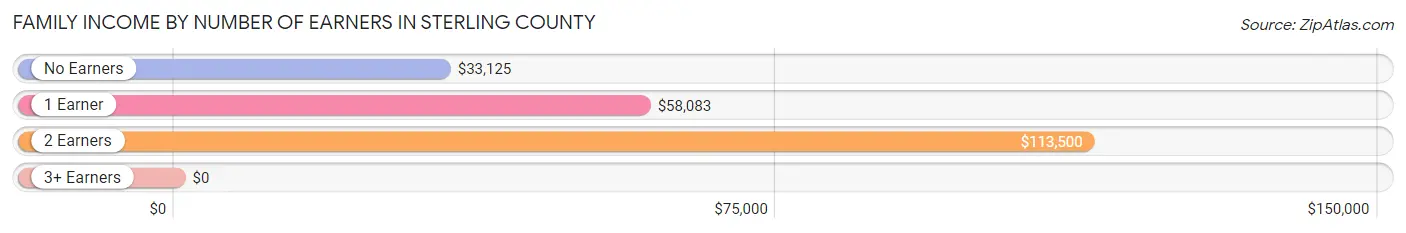
| Number of Earners | # Families | Median Income |
| No Earners | 32 (9.3%) | $33,125 |
| 1 Earner | 142 (41.3%) | $58,083 |
| 2 Earners | 166 (48.3%) | $113,500 |
| 3+ Earners | 4 (1.2%) | $0 |
| Total | 344 (100.0%) | $69,375 |
Household Income in Sterling County
Household Income Brackets in Sterling County
With 159 households falling in the category, the $50,000 to $74,999 income range is the most frequent in Sterling County, accounting for 40.6% of all households.
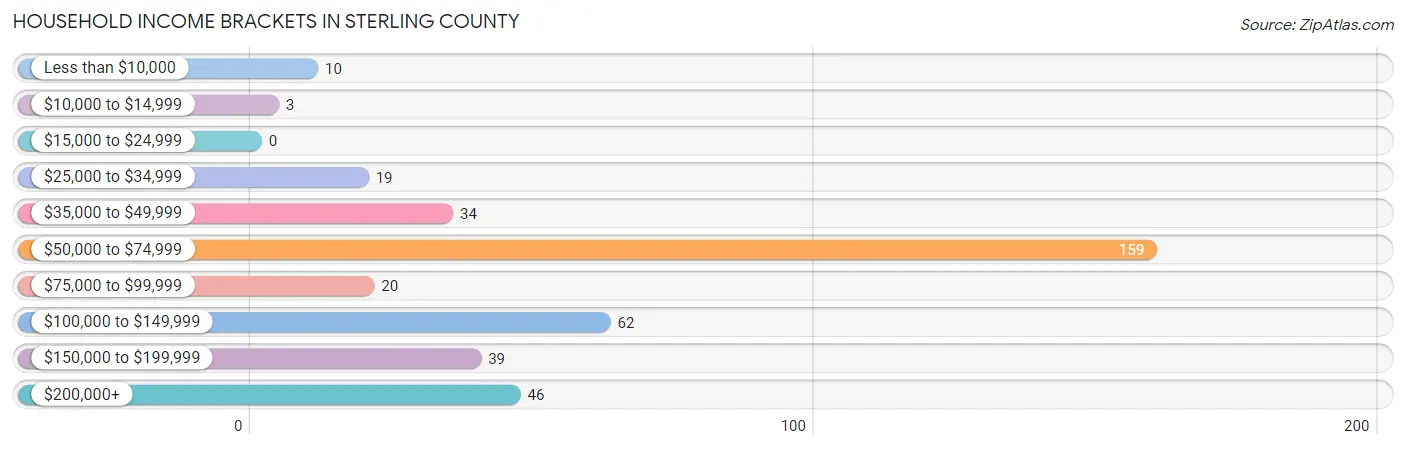
| Income Bracket | # Households | % Households |
| Less than $10,000 | 10 | 2.6% |
| $10,000 to $14,999 | 3 | 0.8% |
| $15,000 to $24,999 | 0 | 0.0% |
| $25,000 to $34,999 | 19 | 4.8% |
| $35,000 to $49,999 | 34 | 8.7% |
| $50,000 to $74,999 | 159 | 40.6% |
| $75,000 to $99,999 | 20 | 5.1% |
| $100,000 to $149,999 | 62 | 15.8% |
| $150,000 to $199,999 | 39 | 9.9% |
| $200,000+ | 46 | 11.7% |
Household Income by Householder Age in Sterling County
The median household income in Sterling County is $63,558, with the highest median household income of $67,969 found in the 25 to 44 years age bracket for the primary householder. A total of 137 households (34.9%) fall into this category.
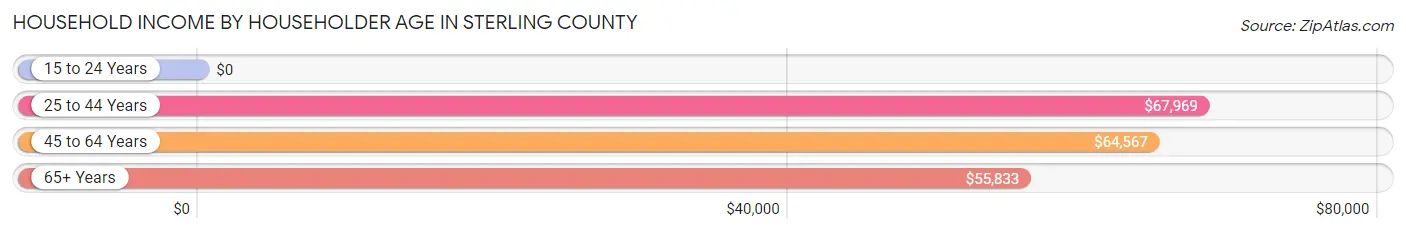
| Income Bracket | # Households | Median Income |
| 15 to 24 Years | 0 (0.0%) | $0 |
| 25 to 44 Years | 137 (34.9%) | $67,969 |
| 45 to 64 Years | 159 (40.6%) | $64,567 |
| 65+ Years | 96 (24.5%) | $55,833 |
| Total | 392 (100.0%) | $63,558 |
Poverty in Sterling County
Income Below Poverty by Sex and Age in Sterling County
With 2.0% poverty level for males and 1.6% for females among the residents of Sterling County, 75 year old and over males and 55 to 64 year old females are the most vulnerable to poverty, with 3 males (25.0%) and 7 females (8.1%) in their respective age groups living below the poverty level.
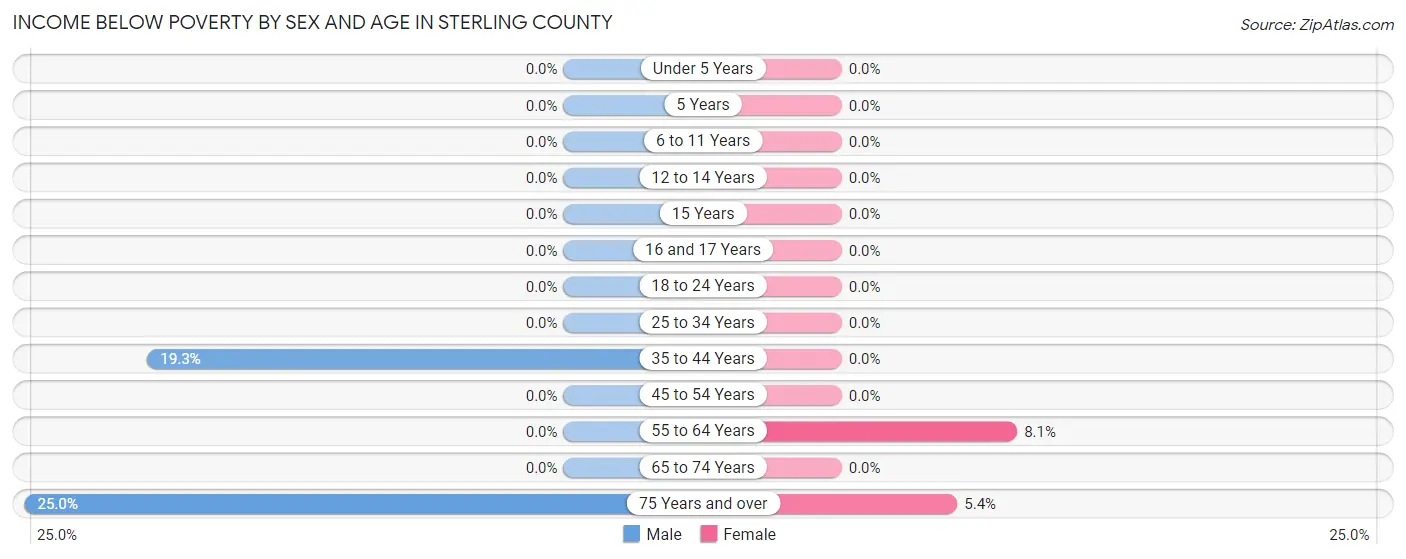
| Age Bracket | Male | Female |
| Under 5 Years | 0 (0.0%) | 0 (0.0%) |
| 5 Years | 0 (0.0%) | 0 (0.0%) |
| 6 to 11 Years | 0 (0.0%) | 0 (0.0%) |
| 12 to 14 Years | 0 (0.0%) | 0 (0.0%) |
| 15 Years | 0 (0.0%) | 0 (0.0%) |
| 16 and 17 Years | 0 (0.0%) | 0 (0.0%) |
| 18 to 24 Years | 0 (0.0%) | 0 (0.0%) |
| 25 to 34 Years | 0 (0.0%) | 0 (0.0%) |
| 35 to 44 Years | 11 (19.3%) | 0 (0.0%) |
| 45 to 54 Years | 0 (0.0%) | 0 (0.0%) |
| 55 to 64 Years | 0 (0.0%) | 7 (8.1%) |
| 65 to 74 Years | 0 (0.0%) | 0 (0.0%) |
| 75 Years and over | 3 (25.0%) | 3 (5.4%) |
| Total | 14 (2.0%) | 10 (1.6%) |
Income Above Poverty by Sex and Age in Sterling County
According to the poverty statistics in Sterling County, males aged under 5 years and females aged under 5 years are the age groups that are most secure financially, with 100.0% of males and 100.0% of females in these age groups living above the poverty line.
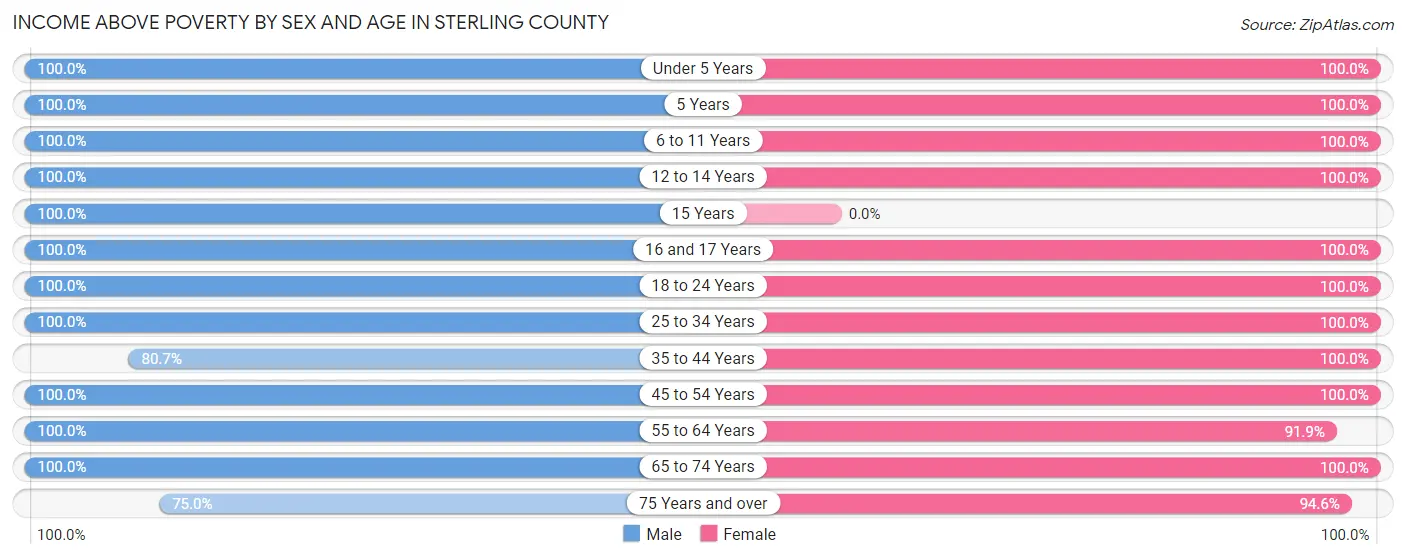
| Age Bracket | Male | Female |
| Under 5 Years | 79 (100.0%) | 47 (100.0%) |
| 5 Years | 22 (100.0%) | 33 (100.0%) |
| 6 to 11 Years | 95 (100.0%) | 106 (100.0%) |
| 12 to 14 Years | 73 (100.0%) | 7 (100.0%) |
| 15 Years | 7 (100.0%) | 0 (0.0%) |
| 16 and 17 Years | 10 (100.0%) | 3 (100.0%) |
| 18 to 24 Years | 55 (100.0%) | 35 (100.0%) |
| 25 to 34 Years | 91 (100.0%) | 131 (100.0%) |
| 35 to 44 Years | 46 (80.7%) | 37 (100.0%) |
| 45 to 54 Years | 85 (100.0%) | 49 (100.0%) |
| 55 to 64 Years | 92 (100.0%) | 79 (91.9%) |
| 65 to 74 Years | 37 (100.0%) | 51 (100.0%) |
| 75 Years and over | 9 (75.0%) | 53 (94.6%) |
| Total | 701 (98.0%) | 631 (98.4%) |
Income Below Poverty Among Married-Couple Families in Sterling County
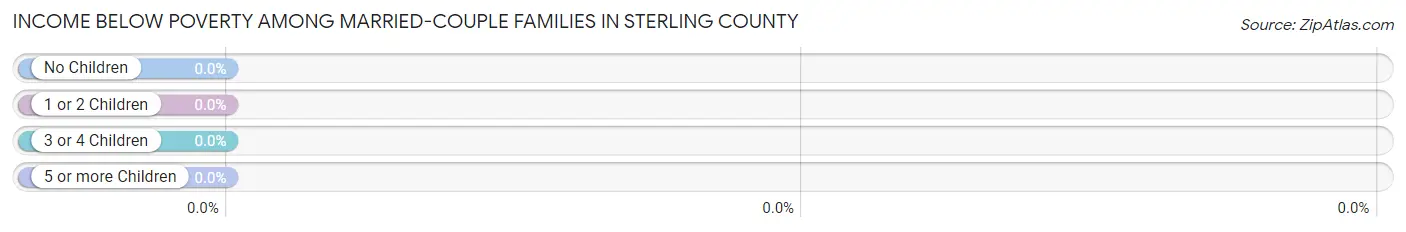
| Children | Above Poverty | Below Poverty |
| No Children | 129 (100.0%) | 0 (0.0%) |
| 1 or 2 Children | 127 (100.0%) | 0 (0.0%) |
| 3 or 4 Children | 44 (100.0%) | 0 (0.0%) |
| 5 or more Children | 0 (0.0%) | 0 (0.0%) |
| Total | 300 (100.0%) | 0 (0.0%) |
Income Below Poverty Among Single-Parent Households in Sterling County
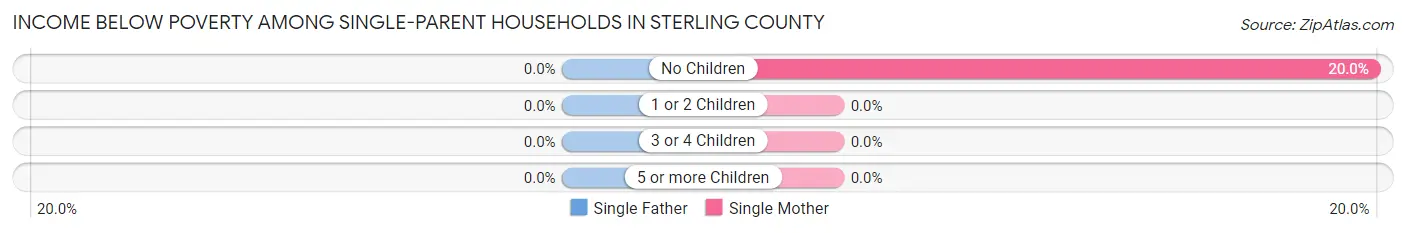
| Children | Single Father | Single Mother |
| No Children | 0 (0.0%) | 3 (20.0%) |
| 1 or 2 Children | 0 (0.0%) | 0 (0.0%) |
| 3 or 4 Children | 0 (0.0%) | 0 (0.0%) |
| 5 or more Children | 0 (0.0%) | 0 (0.0%) |
| Total | 0 (0.0%) | 3 (7.5%) |
Income Below Poverty Among Married-Couple vs Single-Parent Households in Sterling County
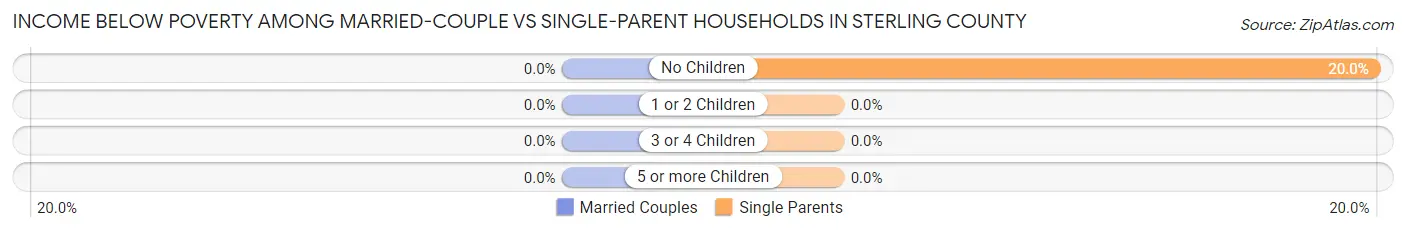
| Children | Married-Couple Families | Single-Parent Households |
| No Children | 0 (0.0%) | 3 (20.0%) |
| 1 or 2 Children | 0 (0.0%) | 0 (0.0%) |
| 3 or 4 Children | 0 (0.0%) | 0 (0.0%) |
| 5 or more Children | 0 (0.0%) | 0 (0.0%) |
| Total | 0 (0.0%) | 3 (6.8%) |
Race in Sterling County
The most populous races in Sterling County are White / Caucasian (1,049 | 75.4%), Hispanic or Latino (466 | 33.5%), and Some other Race (169 | 12.1%).
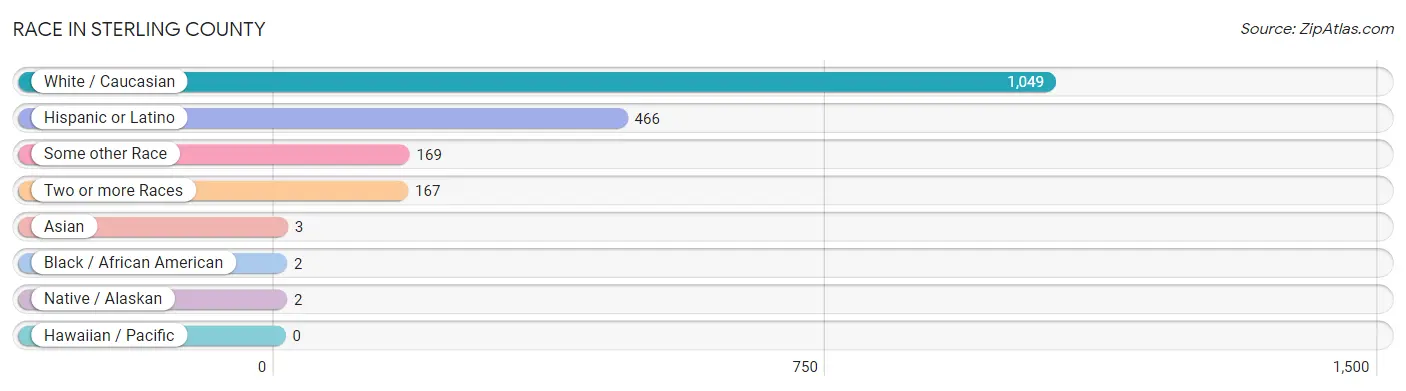
| Race | # Population | % Population |
| Asian | 3 | 0.2% |
| Black / African American | 2 | 0.1% |
| Hawaiian / Pacific | 0 | 0.0% |
| Hispanic or Latino | 466 | 33.5% |
| Native / Alaskan | 2 | 0.1% |
| White / Caucasian | 1,049 | 75.4% |
| Two or more Races | 167 | 12.0% |
| Some other Race | 169 | 12.1% |
| Total | 1,392 | 100.0% |
Ancestry in Sterling County
The most populous ancestries reported in Sterling County are Mexican (461 | 33.1%), Irish (224 | 16.1%), English (180 | 12.9%), German (98 | 7.0%), and Scotch-Irish (17 | 1.2%), together accounting for 70.4% of all Sterling County residents.
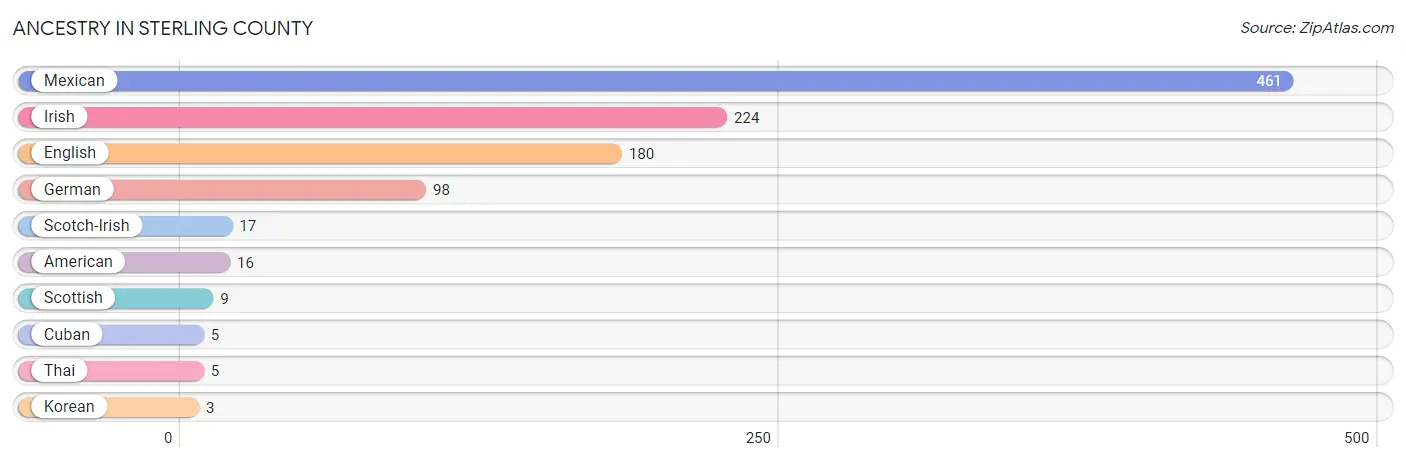
| Ancestry | # Population | % Population |
| American | 16 | 1.1% |
| Cuban | 5 | 0.4% |
| English | 180 | 12.9% |
| German | 98 | 7.0% |
| Irish | 224 | 16.1% |
| Korean | 3 | 0.2% |
| Mexican | 461 | 33.1% |
| Scotch-Irish | 17 | 1.2% |
| Scottish | 9 | 0.6% |
| Thai | 5 | 0.4% | View All 10 Rows |
Immigrants in Sterling County
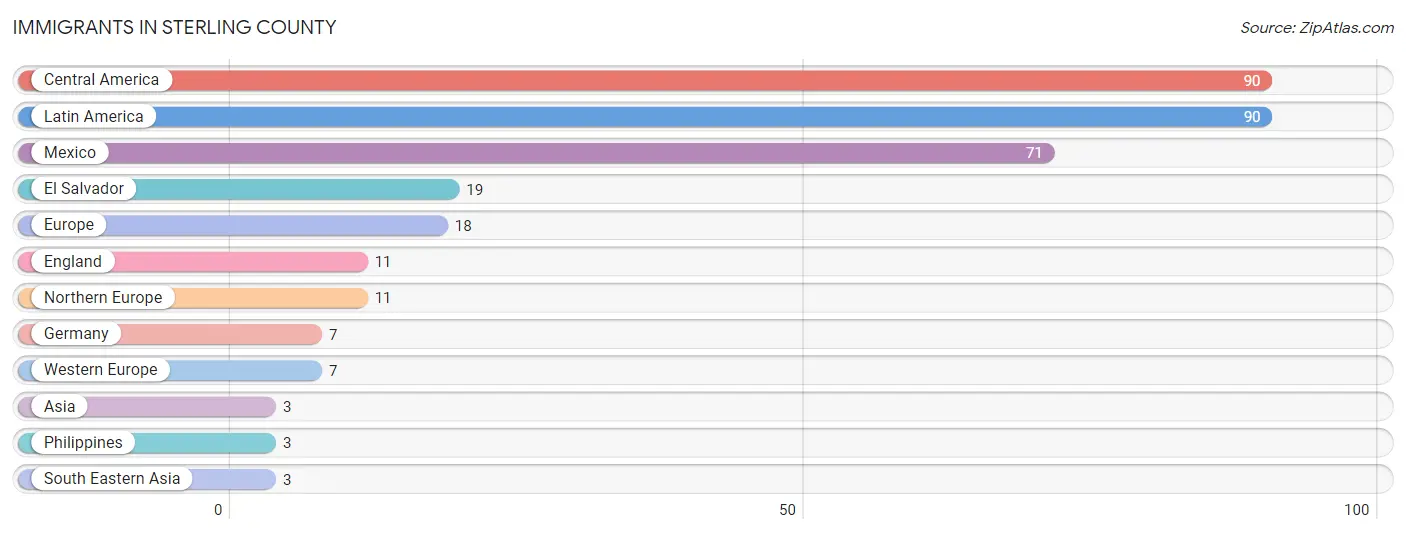
The most numerous immigrant groups reported in Sterling County came from Central America (90 | 6.5%), Latin America (90 | 6.5%), Mexico (71 | 5.1%), El Salvador (19 | 1.4%), and Europe (18 | 1.3%), together accounting for 20.7% of all Sterling County residents.
| Immigration Origin | # Population | % Population |
| Asia | 3 | 0.2% |
| Central America | 90 | 6.5% |
| El Salvador | 19 | 1.4% |
| England | 11 | 0.8% |
| Europe | 18 | 1.3% |
| Germany | 7 | 0.5% |
| Latin America | 90 | 6.5% |
| Mexico | 71 | 5.1% |
| Northern Europe | 11 | 0.8% |
| Philippines | 3 | 0.2% |
| South Eastern Asia | 3 | 0.2% |
| Western Europe | 7 | 0.5% | View All 12 Rows |
Sex and Age in Sterling County
Sex and Age in Sterling County
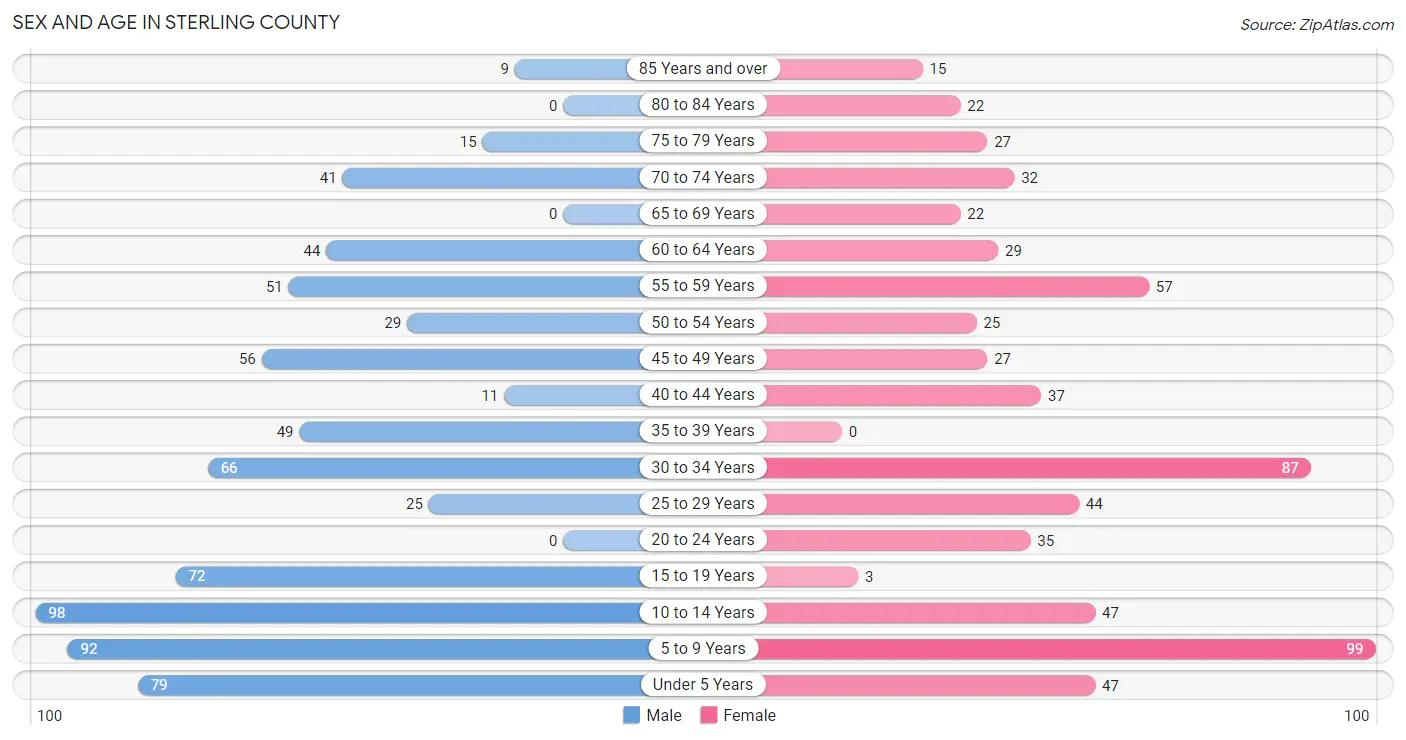
The most populous age groups in Sterling County are 10 to 14 Years (98 | 13.3%) for men and 5 to 9 Years (99 | 15.1%) for women.
| Age Bracket | Male | Female |
| Under 5 Years | 79 (10.7%) | 47 (7.2%) |
| 5 to 9 Years | 92 (12.5%) | 99 (15.1%) |
| 10 to 14 Years | 98 (13.3%) | 47 (7.2%) |
| 15 to 19 Years | 72 (9.8%) | 3 (0.5%) |
| 20 to 24 Years | 0 (0.0%) | 35 (5.3%) |
| 25 to 29 Years | 25 (3.4%) | 44 (6.7%) |
| 30 to 34 Years | 66 (9.0%) | 87 (13.3%) |
| 35 to 39 Years | 49 (6.7%) | 0 (0.0%) |
| 40 to 44 Years | 11 (1.5%) | 37 (5.7%) |
| 45 to 49 Years | 56 (7.6%) | 27 (4.1%) |
| 50 to 54 Years | 29 (3.9%) | 25 (3.8%) |
| 55 to 59 Years | 51 (6.9%) | 57 (8.7%) |
| 60 to 64 Years | 44 (6.0%) | 29 (4.4%) |
| 65 to 69 Years | 0 (0.0%) | 22 (3.4%) |
| 70 to 74 Years | 41 (5.6%) | 32 (4.9%) |
| 75 to 79 Years | 15 (2.0%) | 27 (4.1%) |
| 80 to 84 Years | 0 (0.0%) | 22 (3.4%) |
| 85 Years and over | 9 (1.2%) | 15 (2.3%) |
| Total | 737 (100.0%) | 655 (100.0%) |
Families and Households in Sterling County
Median Family Size in Sterling County
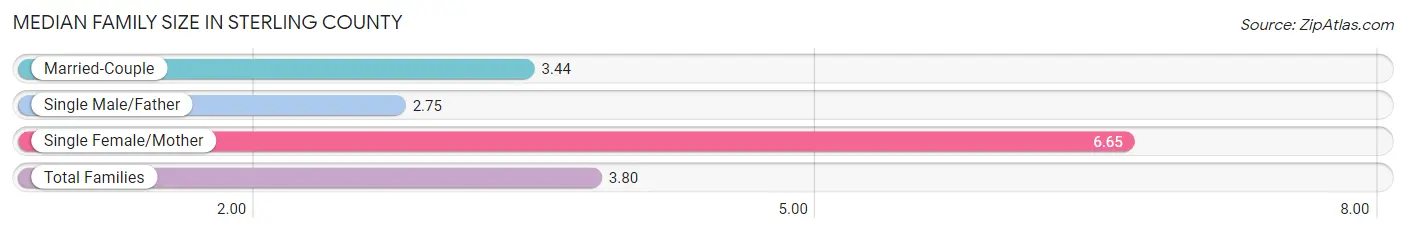
The median family size in Sterling County is 3.80 persons per family, with single female/mother families (40 | 11.6%) accounting for the largest median family size of 6.65 persons per family. On the other hand, single male/father families (4 | 1.2%) represent the smallest median family size with 2.75 persons per family.
| Family Type | # Families | Family Size |
| Married-Couple | 300 (87.2%) | 3.44 |
| Single Male/Father | 4 (1.2%) | 2.75 |
| Single Female/Mother | 40 (11.6%) | 6.65 |
| Total Families | 344 (100.0%) | 3.80 |
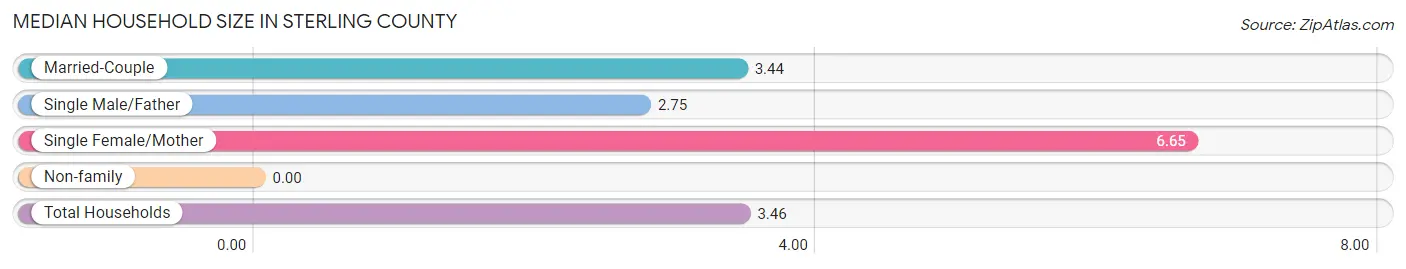
Median Household Size in Sterling County
| Household Type | # Households | Household Size |
| Married-Couple | 300 (76.5%) | 3.44 |
| Single Male/Father | 4 (1.0%) | 2.75 |
| Single Female/Mother | 40 (10.2%) | 6.65 |
| Non-family | 48 (12.2%) | - |
| Total Households | 392 (100.0%) | 3.46 |
Household Size by Marriage Status in Sterling County
Out of a total of 392 households in Sterling County, 344 (87.8%) are family households, while 48 (12.2%) are nonfamily households. The most numerous type of family households are 2-person households, comprising 131, and the most common type of nonfamily households are 1-person households, comprising 48.
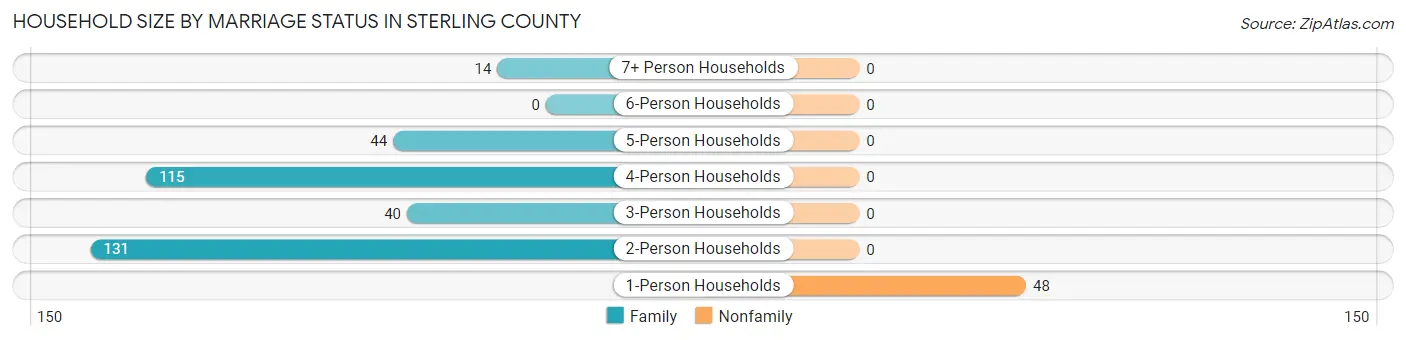
| Household Size | Family Households | Nonfamily Households |
| 1-Person Households | - | 48 (12.2%) |
| 2-Person Households | 131 (33.4%) | 0 (0.0%) |
| 3-Person Households | 40 (10.2%) | 0 (0.0%) |
| 4-Person Households | 115 (29.3%) | 0 (0.0%) |
| 5-Person Households | 44 (11.2%) | 0 (0.0%) |
| 6-Person Households | 0 (0.0%) | 0 (0.0%) |
| 7+ Person Households | 14 (3.6%) | 0 (0.0%) |
| Total | 344 (87.8%) | 48 (12.2%) |
Female Fertility in Sterling County
Fertility by Age in Sterling County
Average fertility rate in Sterling County is 39.0 births per 1,000 women. Women in the age bracket of 20 to 34 years have the highest fertility rate with 54.0 births per 1,000 women. Women in the age bracket of 20 to 34 years acount for 100.0% of all women with births.
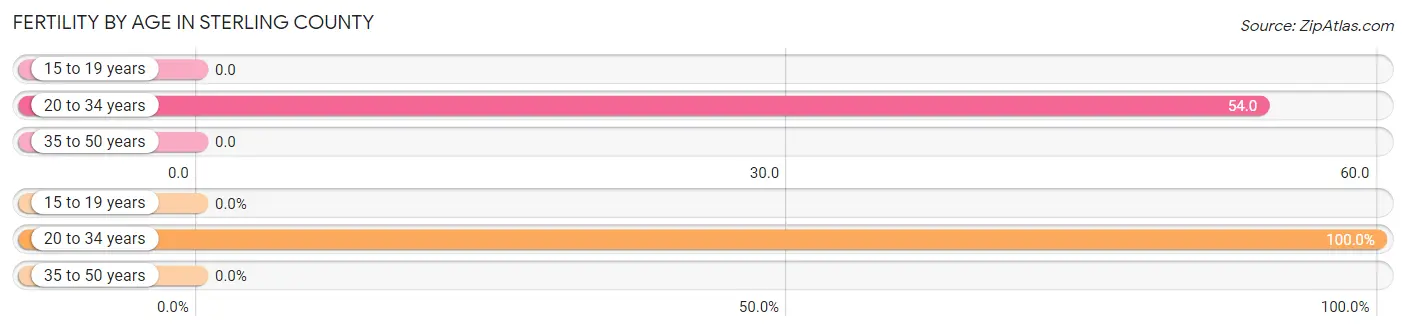
| Age Bracket | Women with Births | Births / 1,000 Women |
| 15 to 19 years | 0 (0.0%) | 0.0 |
| 20 to 34 years | 9 (100.0%) | 54.0 |
| 35 to 50 years | 0 (0.0%) | 0.0 |
| Total | 9 (100.0%) | 39.0 |
Fertility by Age by Marriage Status in Sterling County
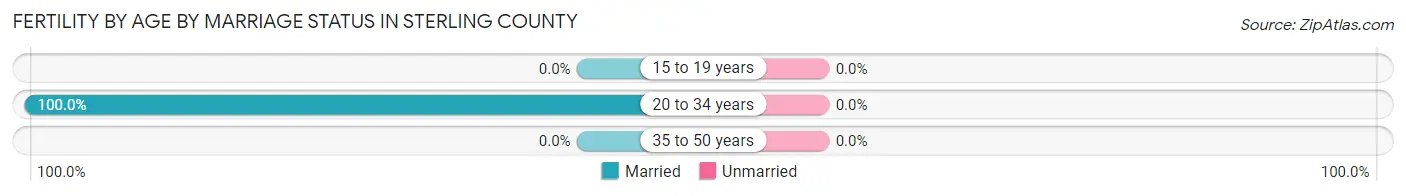
| Age Bracket | Married | Unmarried |
| 15 to 19 years | 0 (0.0%) | 0 (0.0%) |
| 20 to 34 years | 9 (100.0%) | 0 (0.0%) |
| 35 to 50 years | 0 (0.0%) | 0 (0.0%) |
| Total | 9 (100.0%) | 0 (0.0%) |
Fertility by Education in Sterling County
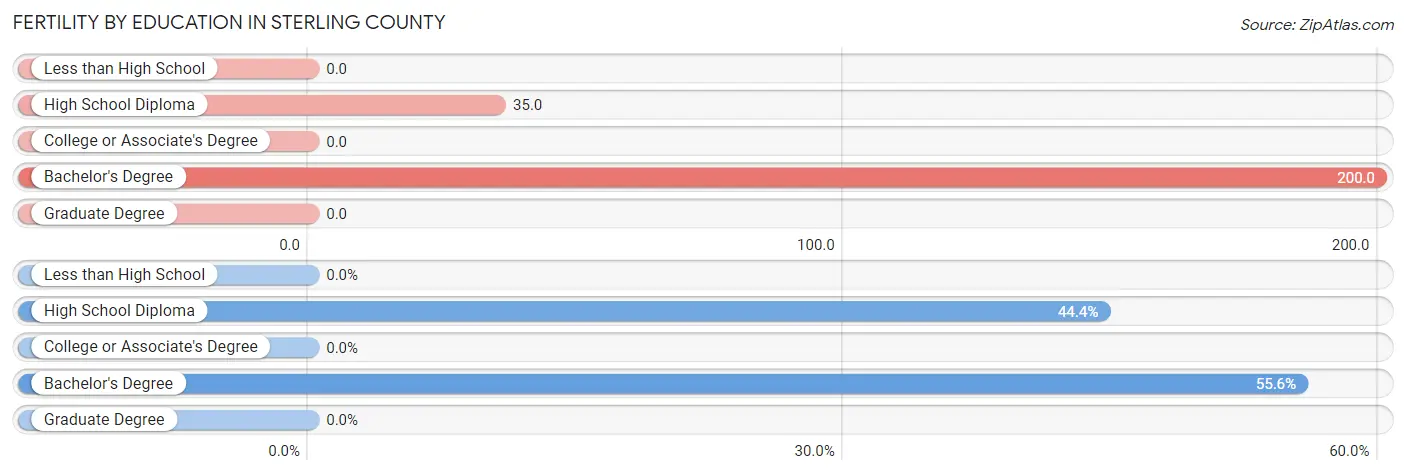
| Educational Attainment | Women with Births | Births / 1,000 Women |
| Less than High School | 0 (0.0%) | 0.0 |
| High School Diploma | 4 (44.4%) | 35.0 |
| College or Associate's Degree | 0 (0.0%) | 0.0 |
| Bachelor's Degree | 5 (55.6%) | 200.0 |
| Graduate Degree | 0 (0.0%) | 0.0 |
| Total | 9 (100.0%) | 39.0 |
Fertility by Education by Marriage Status in Sterling County
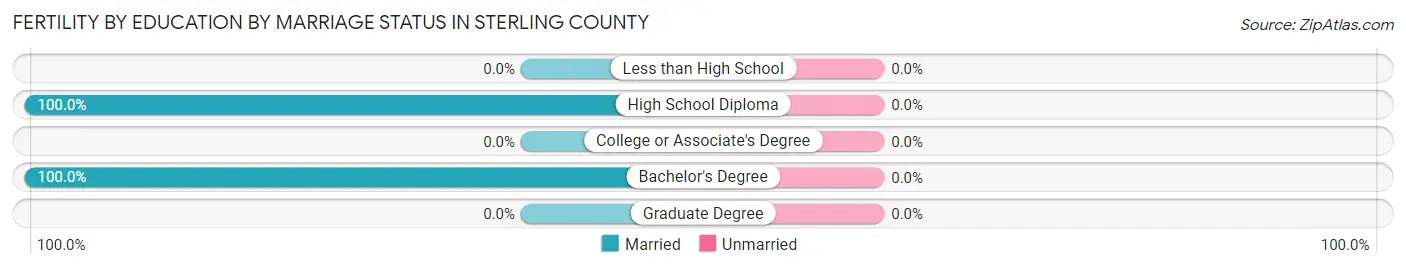
| Educational Attainment | Married | Unmarried |
| Less than High School | 0 (0.0%) | 0 (0.0%) |
| High School Diploma | 4 (100.0%) | 0 (0.0%) |
| College or Associate's Degree | 0 (0.0%) | 0 (0.0%) |
| Bachelor's Degree | 5 (100.0%) | 0 (0.0%) |
| Graduate Degree | 0 (0.0%) | 0 (0.0%) |
| Total | 9 (100.0%) | 0 (0.0%) |
Employment Characteristics in Sterling County
Employment by Class of Employer in Sterling County
Among the 575 employed individuals in Sterling County, private company employees (335 | 58.3%), self-employed (not incorporated) (110 | 19.1%), and local government employees (87 | 15.1%) make up the most common classes of employment.
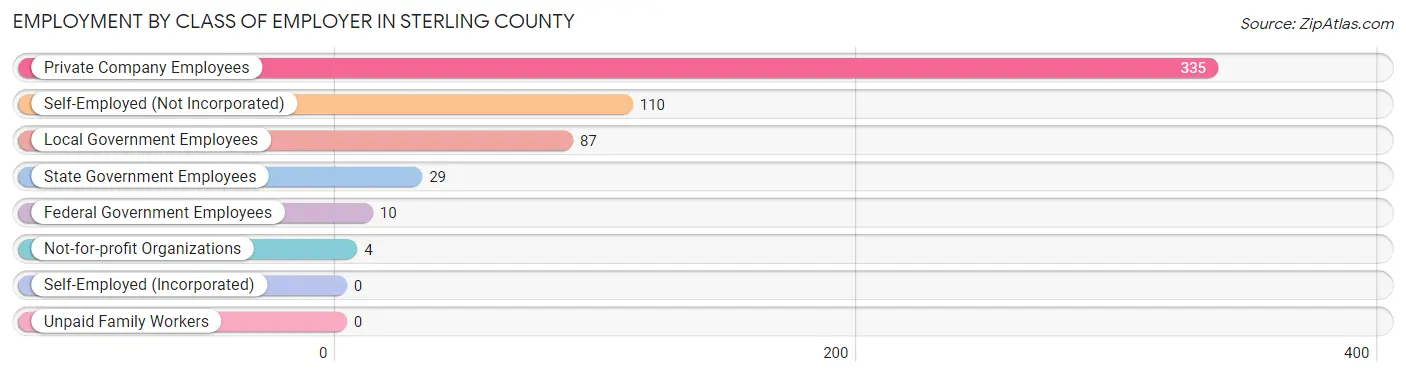
| Employer Class | # Employees | % Employees |
| Private Company Employees | 335 | 58.3% |
| Self-Employed (Incorporated) | 0 | 0.0% |
| Self-Employed (Not Incorporated) | 110 | 19.1% |
| Not-for-profit Organizations | 4 | 0.7% |
| Local Government Employees | 87 | 15.1% |
| State Government Employees | 29 | 5.0% |
| Federal Government Employees | 10 | 1.7% |
| Unpaid Family Workers | 0 | 0.0% |
| Total | 575 | 100.0% |
Employment Status by Age in Sterling County
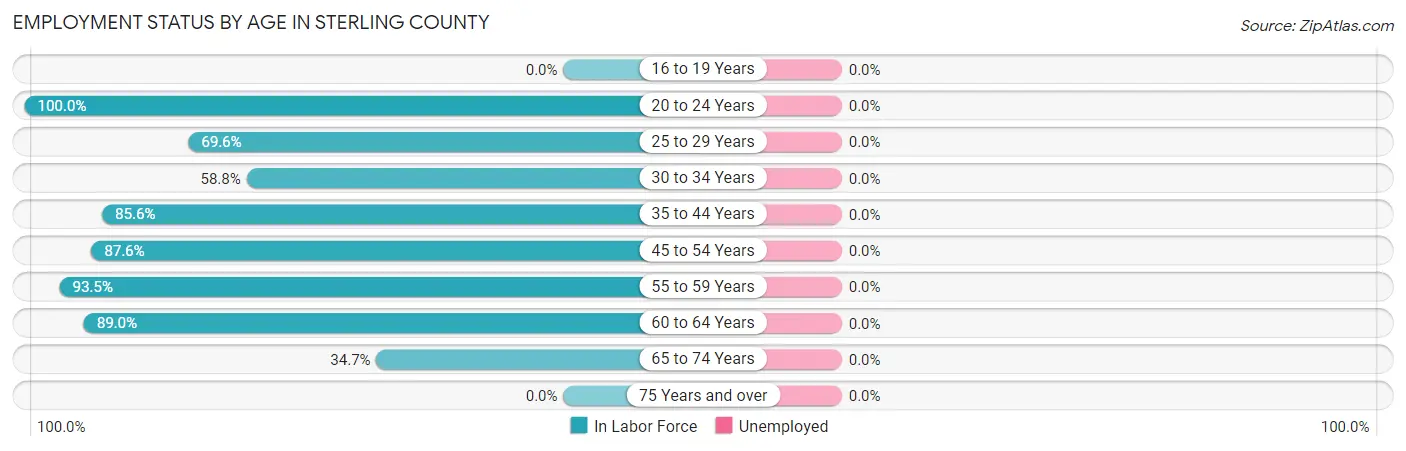
| Age Bracket | In Labor Force | Unemployed |
| 16 to 19 Years | 0 (0.0%) | 0 (0.0%) |
| 20 to 24 Years | 35 (100.0%) | 0 (0.0%) |
| 25 to 29 Years | 48 (69.6%) | 0 (0.0%) |
| 30 to 34 Years | 90 (58.8%) | 0 (0.0%) |
| 35 to 44 Years | 83 (85.6%) | 0 (0.0%) |
| 45 to 54 Years | 120 (87.6%) | 0 (0.0%) |
| 55 to 59 Years | 101 (93.5%) | 0 (0.0%) |
| 60 to 64 Years | 65 (89.0%) | 0 (0.0%) |
| 65 to 74 Years | 33 (34.7%) | 0 (0.0%) |
| 75 Years and over | 0 (0.0%) | 0 (0.0%) |
| Total | 575 (62.3%) | 0 (0.0%) |
Employment Status by Educational Attainment in Sterling County
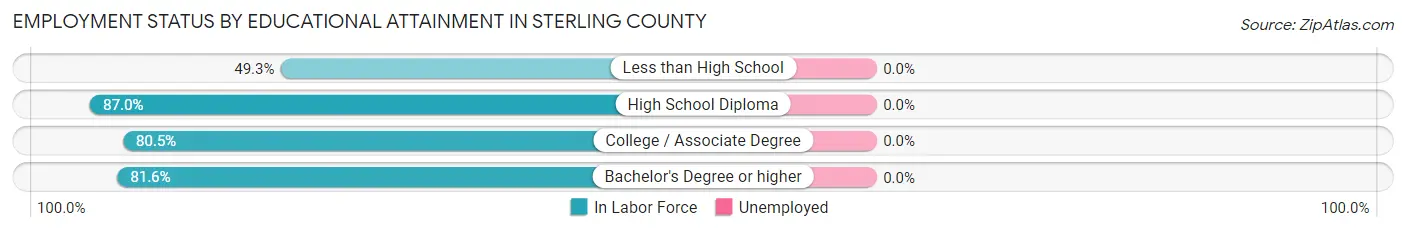
| Educational Attainment | In Labor Force | Unemployed |
| Less than High School | 37 (49.3%) | 0 (0.0%) |
| High School Diploma | 208 (87.0%) | 0 (0.0%) |
| College / Associate Degree | 120 (80.5%) | 0 (0.0%) |
| Bachelor's Degree or higher | 142 (81.6%) | 0 (0.0%) |
| Total | 507 (79.6%) | 0 (0.0%) |
Employment Occupations by Sex in Sterling County
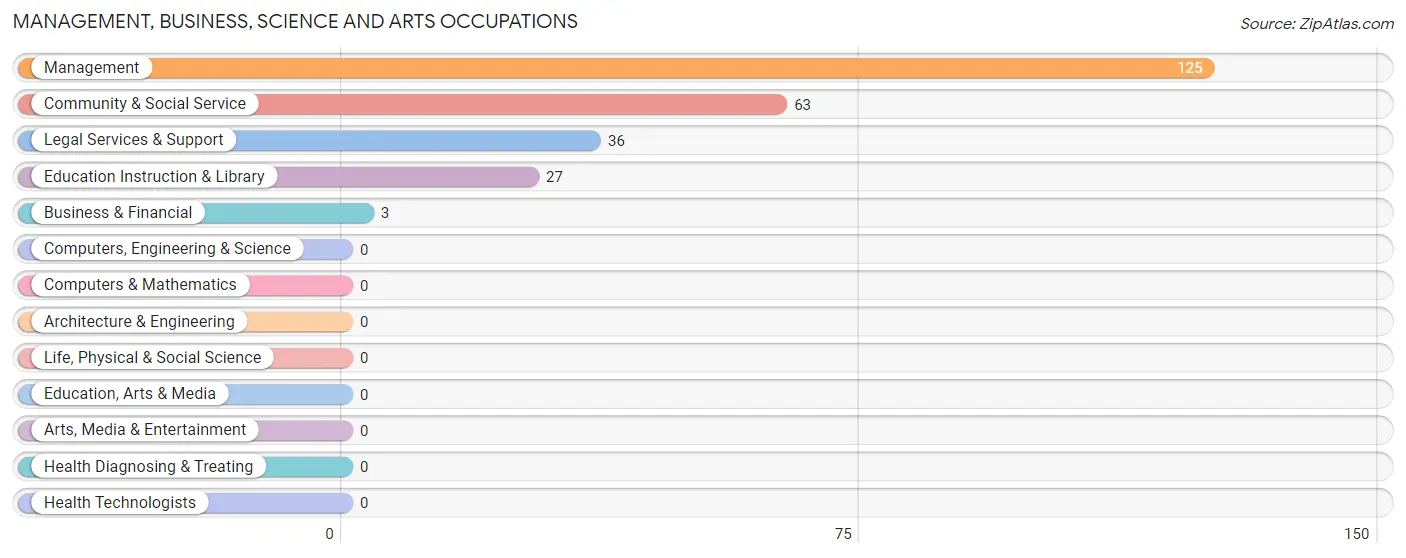
Management, Business, Science and Arts Occupations
The most common Management, Business, Science and Arts occupations in Sterling County are Management (125 | 21.7%), Community & Social Service (63 | 11.0%), Legal Services & Support (36 | 6.3%), Education Instruction & Library (27 | 4.7%), and Business & Financial (3 | 0.5%).
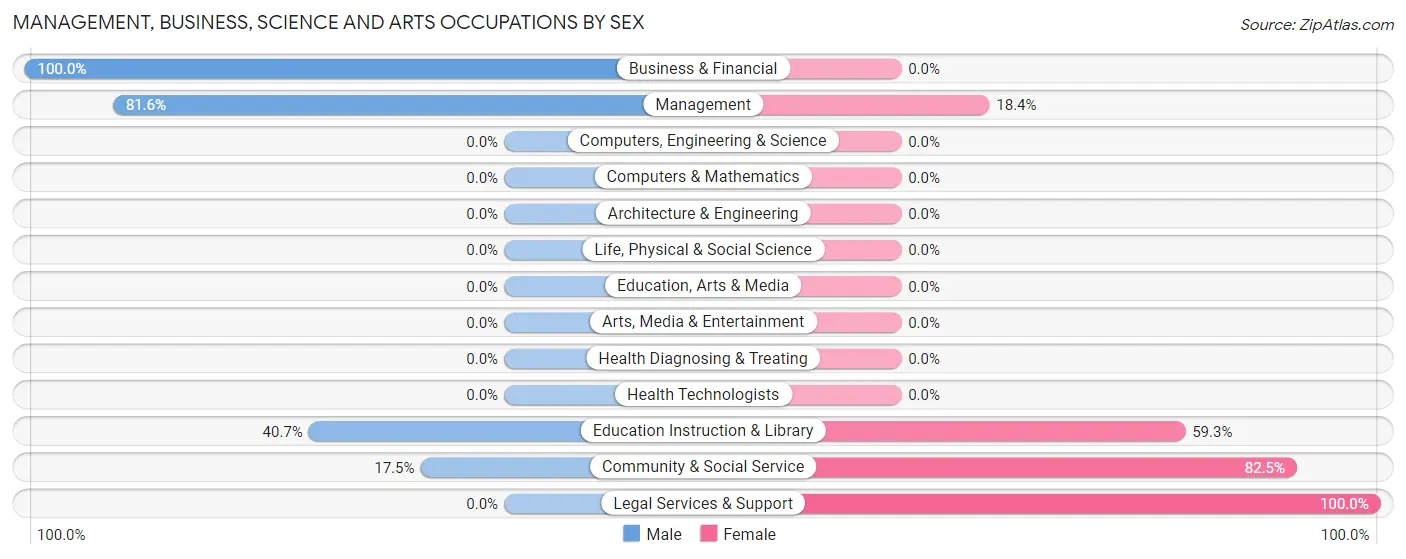
Management, Business, Science and Arts Occupations by Sex
Within the Management, Business, Science and Arts occupations in Sterling County, the most male-oriented occupations are Business & Financial (100.0%), Management (81.6%), and Education Instruction & Library (40.7%), while the most female-oriented occupations are Legal Services & Support (100.0%), Community & Social Service (82.5%), and Education Instruction & Library (59.3%).
| Occupation | Male | Female |
| Management | 102 (81.6%) | 23 (18.4%) |
| Business & Financial | 3 (100.0%) | 0 (0.0%) |
| Computers, Engineering & Science | 0 (0.0%) | 0 (0.0%) |
| Computers & Mathematics | 0 (0.0%) | 0 (0.0%) |
| Architecture & Engineering | 0 (0.0%) | 0 (0.0%) |
| Life, Physical & Social Science | 0 (0.0%) | 0 (0.0%) |
| Community & Social Service | 11 (17.5%) | 52 (82.5%) |
| Education, Arts & Media | 0 (0.0%) | 0 (0.0%) |
| Legal Services & Support | 0 (0.0%) | 36 (100.0%) |
| Education Instruction & Library | 11 (40.7%) | 16 (59.3%) |
| Arts, Media & Entertainment | 0 (0.0%) | 0 (0.0%) |
| Health Diagnosing & Treating | 0 (0.0%) | 0 (0.0%) |
| Health Technologists | 0 (0.0%) | 0 (0.0%) |
| Total (Category) | 116 (60.7%) | 75 (39.3%) |
| Total (Overall) | 320 (55.6%) | 255 (44.4%) |
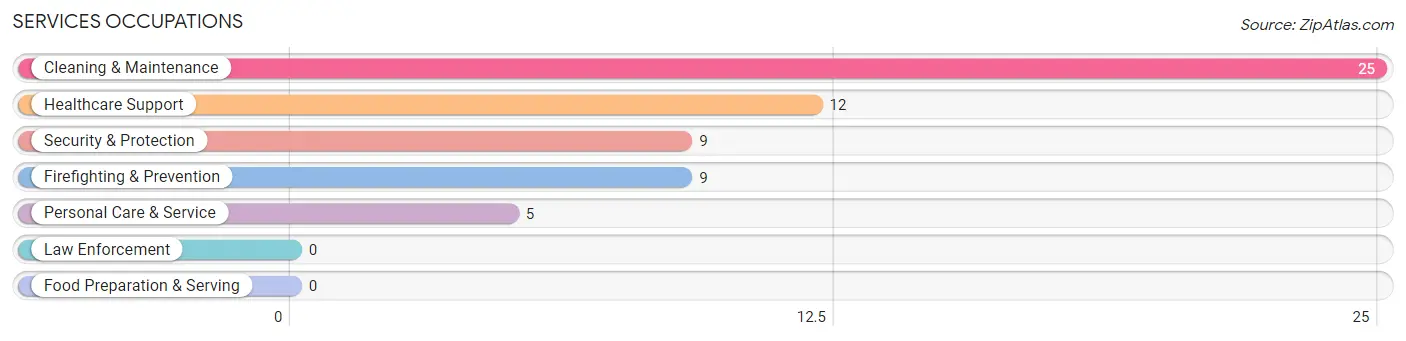
Services Occupations
The most common Services occupations in Sterling County are Cleaning & Maintenance (25 | 4.3%), Healthcare Support (12 | 2.1%), Security & Protection (9 | 1.6%), Firefighting & Prevention (9 | 1.6%), and Personal Care & Service (5 | 0.9%).
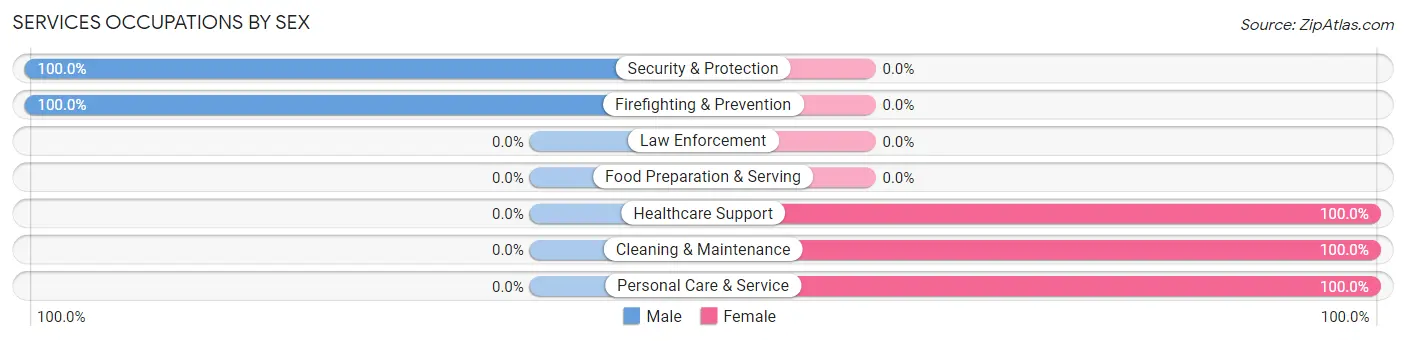
Services Occupations by Sex
Within the Services occupations in Sterling County, the most male-oriented occupations are Security & Protection (100.0%), and Firefighting & Prevention (100.0%), while the most female-oriented occupations are Healthcare Support (100.0%), Cleaning & Maintenance (100.0%), and Personal Care & Service (100.0%).
| Occupation | Male | Female |
| Healthcare Support | 0 (0.0%) | 12 (100.0%) |
| Security & Protection | 9 (100.0%) | 0 (0.0%) |
| Firefighting & Prevention | 9 (100.0%) | 0 (0.0%) |
| Law Enforcement | 0 (0.0%) | 0 (0.0%) |
| Food Preparation & Serving | 0 (0.0%) | 0 (0.0%) |
| Cleaning & Maintenance | 0 (0.0%) | 25 (100.0%) |
| Personal Care & Service | 0 (0.0%) | 5 (100.0%) |
| Total (Category) | 9 (17.6%) | 42 (82.4%) |
| Total (Overall) | 320 (55.6%) | 255 (44.4%) |
Sales and Office Occupations
The most common Sales and Office occupations in Sterling County are Sales & Related (84 | 14.6%), and Office & Administration (77 | 13.4%).
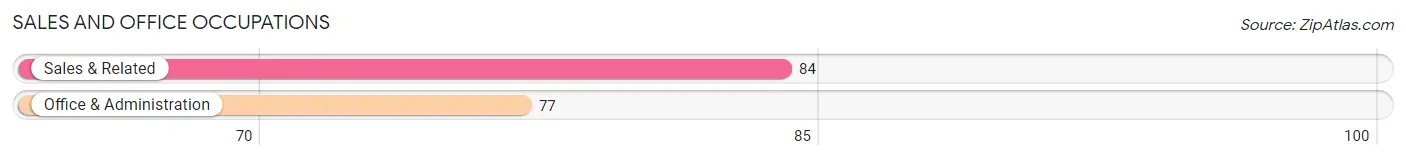
Sales and Office Occupations by Sex

| Occupation | Male | Female |
| Sales & Related | 23 (27.4%) | 61 (72.6%) |
| Office & Administration | 0 (0.0%) | 77 (100.0%) |
| Total (Category) | 23 (14.3%) | 138 (85.7%) |
| Total (Overall) | 320 (55.6%) | 255 (44.4%) |
Natural Resources, Construction and Maintenance Occupations
The most common Natural Resources, Construction and Maintenance occupations in Sterling County are Construction & Extraction (45 | 7.8%), Farming, Fishing & Forestry (16 | 2.8%), and Installation, Maintenance & Repair (4 | 0.7%).
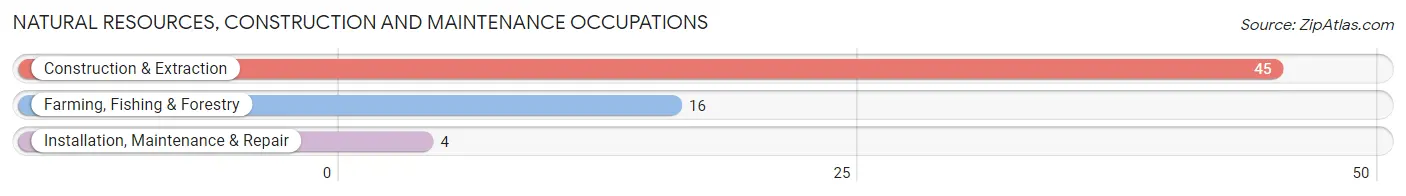
Natural Resources, Construction and Maintenance Occupations by Sex
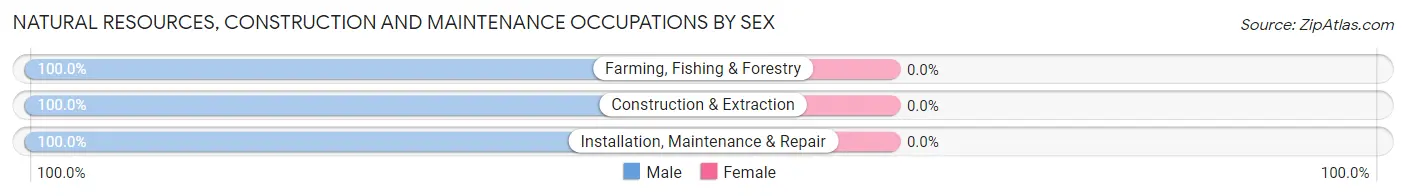
| Occupation | Male | Female |
| Farming, Fishing & Forestry | 16 (100.0%) | 0 (0.0%) |
| Construction & Extraction | 45 (100.0%) | 0 (0.0%) |
| Installation, Maintenance & Repair | 4 (100.0%) | 0 (0.0%) |
| Total (Category) | 65 (100.0%) | 0 (0.0%) |
| Total (Overall) | 320 (55.6%) | 255 (44.4%) |
Production, Transportation and Moving Occupations
The most common Production, Transportation and Moving occupations in Sterling County are Production (59 | 10.3%), Transportation (45 | 7.8%), and Material Moving (3 | 0.5%).
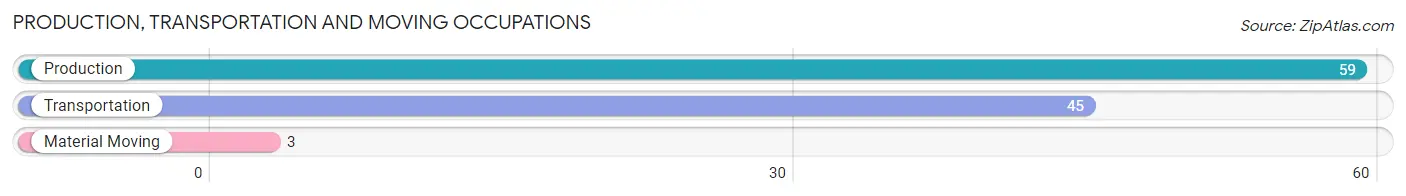
Production, Transportation and Moving Occupations by Sex
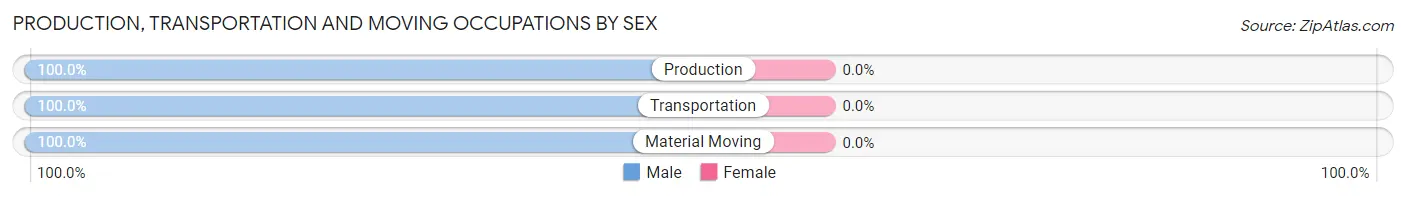
| Occupation | Male | Female |
| Production | 59 (100.0%) | 0 (0.0%) |
| Transportation | 45 (100.0%) | 0 (0.0%) |
| Material Moving | 3 (100.0%) | 0 (0.0%) |
| Total (Category) | 107 (100.0%) | 0 (0.0%) |
| Total (Overall) | 320 (55.6%) | 255 (44.4%) |
Employment Industries by Sex in Sterling County
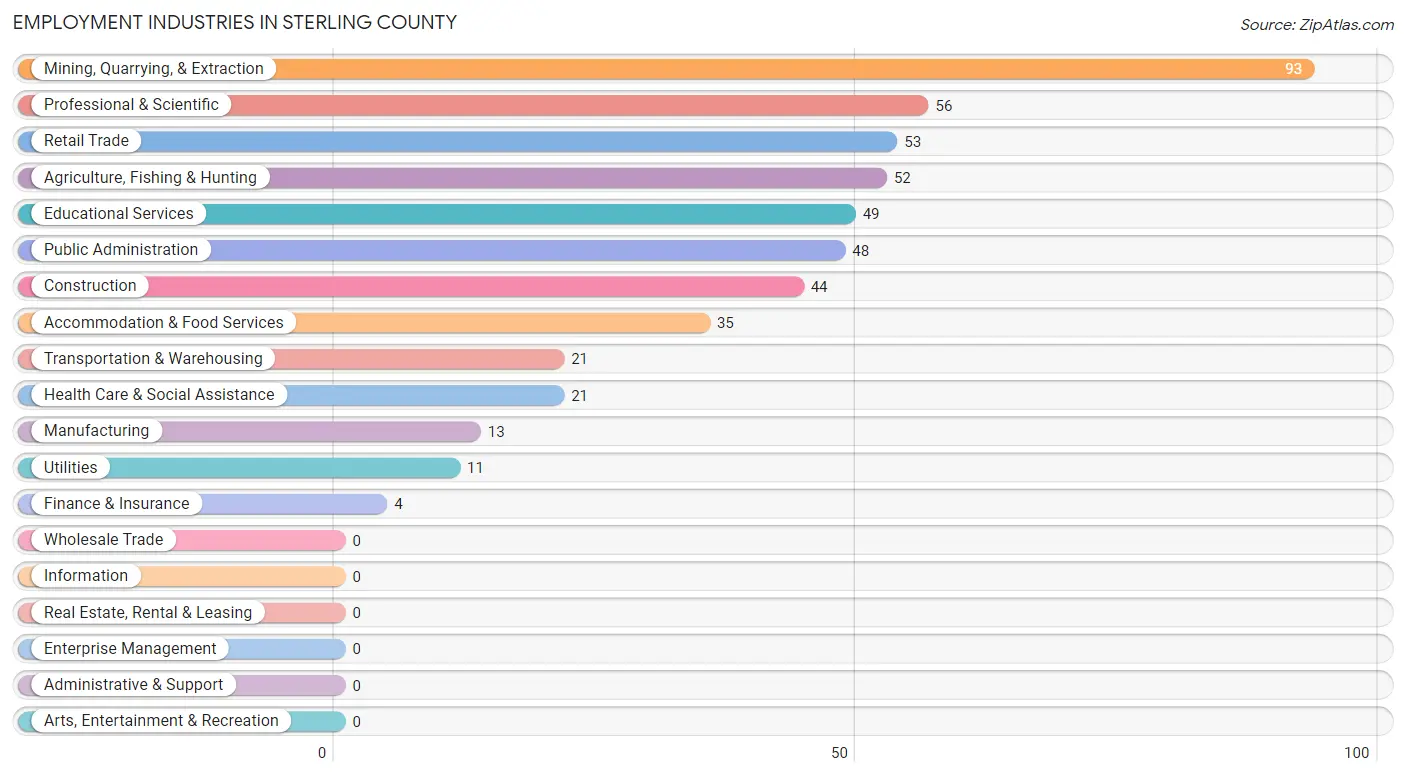
Employment Industries in Sterling County
The major employment industries in Sterling County include Mining, Quarrying, & Extraction (93 | 16.2%), Professional & Scientific (56 | 9.7%), Retail Trade (53 | 9.2%), Agriculture, Fishing & Hunting (52 | 9.0%), and Educational Services (49 | 8.5%).
Employment Industries by Sex in Sterling County
The Sterling County industries that see more men than women are Manufacturing (100.0%), Utilities (100.0%), and Finance & Insurance (100.0%), whereas the industries that tend to have a higher number of women are Health Care & Social Assistance (100.0%), Accommodation & Food Services (100.0%), and Public Administration (100.0%).
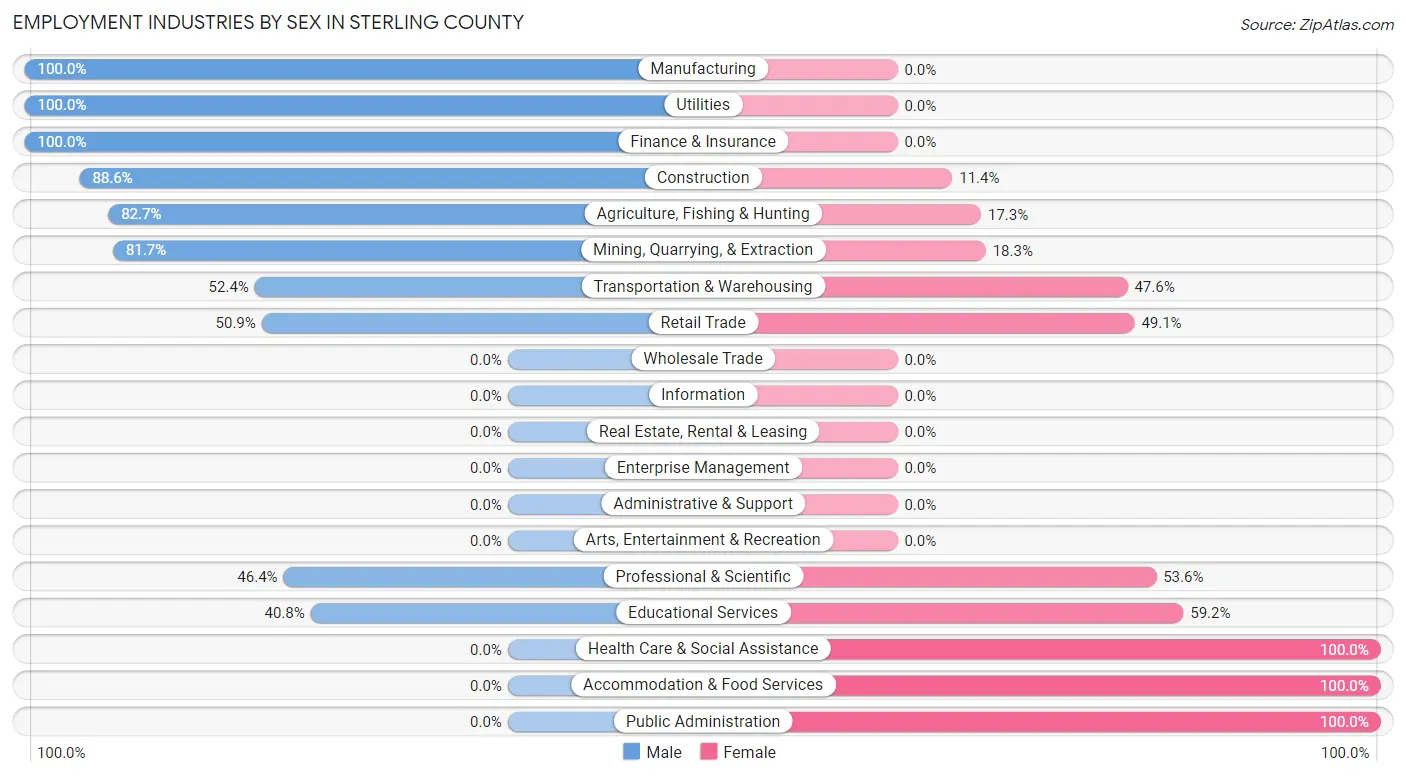
| Industry | Male | Female |
| Agriculture, Fishing & Hunting | 43 (82.7%) | 9 (17.3%) |
| Mining, Quarrying, & Extraction | 76 (81.7%) | 17 (18.3%) |
| Construction | 39 (88.6%) | 5 (11.4%) |
| Manufacturing | 13 (100.0%) | 0 (0.0%) |
| Wholesale Trade | 0 (0.0%) | 0 (0.0%) |
| Retail Trade | 27 (50.9%) | 26 (49.1%) |
| Transportation & Warehousing | 11 (52.4%) | 10 (47.6%) |
| Utilities | 11 (100.0%) | 0 (0.0%) |
| Information | 0 (0.0%) | 0 (0.0%) |
| Finance & Insurance | 4 (100.0%) | 0 (0.0%) |
| Real Estate, Rental & Leasing | 0 (0.0%) | 0 (0.0%) |
| Professional & Scientific | 26 (46.4%) | 30 (53.6%) |
| Enterprise Management | 0 (0.0%) | 0 (0.0%) |
| Administrative & Support | 0 (0.0%) | 0 (0.0%) |
| Educational Services | 20 (40.8%) | 29 (59.2%) |
| Health Care & Social Assistance | 0 (0.0%) | 21 (100.0%) |
| Arts, Entertainment & Recreation | 0 (0.0%) | 0 (0.0%) |
| Accommodation & Food Services | 0 (0.0%) | 35 (100.0%) |
| Public Administration | 0 (0.0%) | 48 (100.0%) |
| Total | 320 (55.6%) | 255 (44.4%) |
Education in Sterling County
School Enrollment in Sterling County
The most common levels of schooling among the 373 students in Sterling County are elementary school (131 | 35.1%), middle school (78 | 20.9%), and high school (78 | 20.9%).
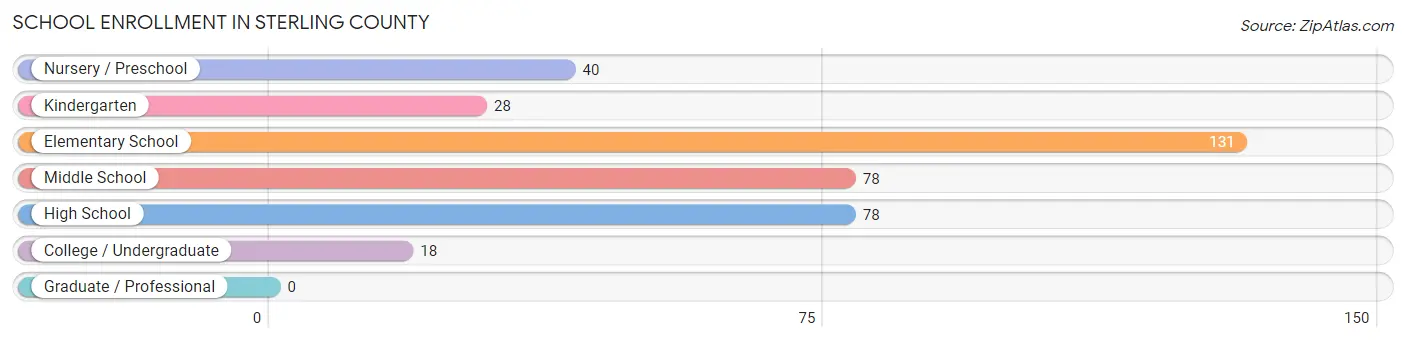
| School Level | # Students | % Students |
| Nursery / Preschool | 40 | 10.7% |
| Kindergarten | 28 | 7.5% |
| Elementary School | 131 | 35.1% |
| Middle School | 78 | 20.9% |
| High School | 78 | 20.9% |
| College / Undergraduate | 18 | 4.8% |
| Graduate / Professional | 0 | 0.0% |
| Total | 373 | 100.0% |
School Enrollment by Age by Funding Source in Sterling County
Out of a total of 373 students who are enrolled in schools in Sterling County, 50 (13.4%) attend a private institution, while the remaining 323 (86.6%) are enrolled in public schools. The age group of 5 to 9 year old has the highest likelihood of being enrolled in private schools, with 50 (28.7% in the age bracket) enrolled. Conversely, the age group of 3 to 4 year olds has the lowest likelihood of being enrolled in a private school, with 18 (100.0% in the age bracket) attending a public institution.
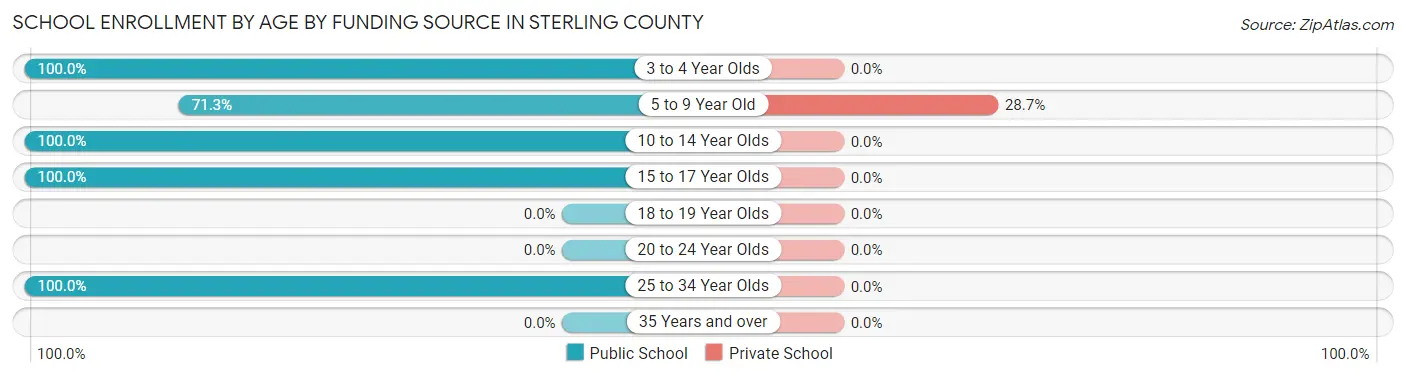
| Age Bracket | Public School | Private School |
| 3 to 4 Year Olds | 18 (100.0%) | 0 (0.0%) |
| 5 to 9 Year Old | 124 (71.3%) | 50 (28.7%) |
| 10 to 14 Year Olds | 143 (100.0%) | 0 (0.0%) |
| 15 to 17 Year Olds | 20 (100.0%) | 0 (0.0%) |
| 18 to 19 Year Olds | 0 (0.0%) | 0 (0.0%) |
| 20 to 24 Year Olds | 0 (0.0%) | 0 (0.0%) |
| 25 to 34 Year Olds | 18 (100.0%) | 0 (0.0%) |
| 35 Years and over | 0 (0.0%) | 0 (0.0%) |
| Total | 323 (86.6%) | 50 (13.4%) |
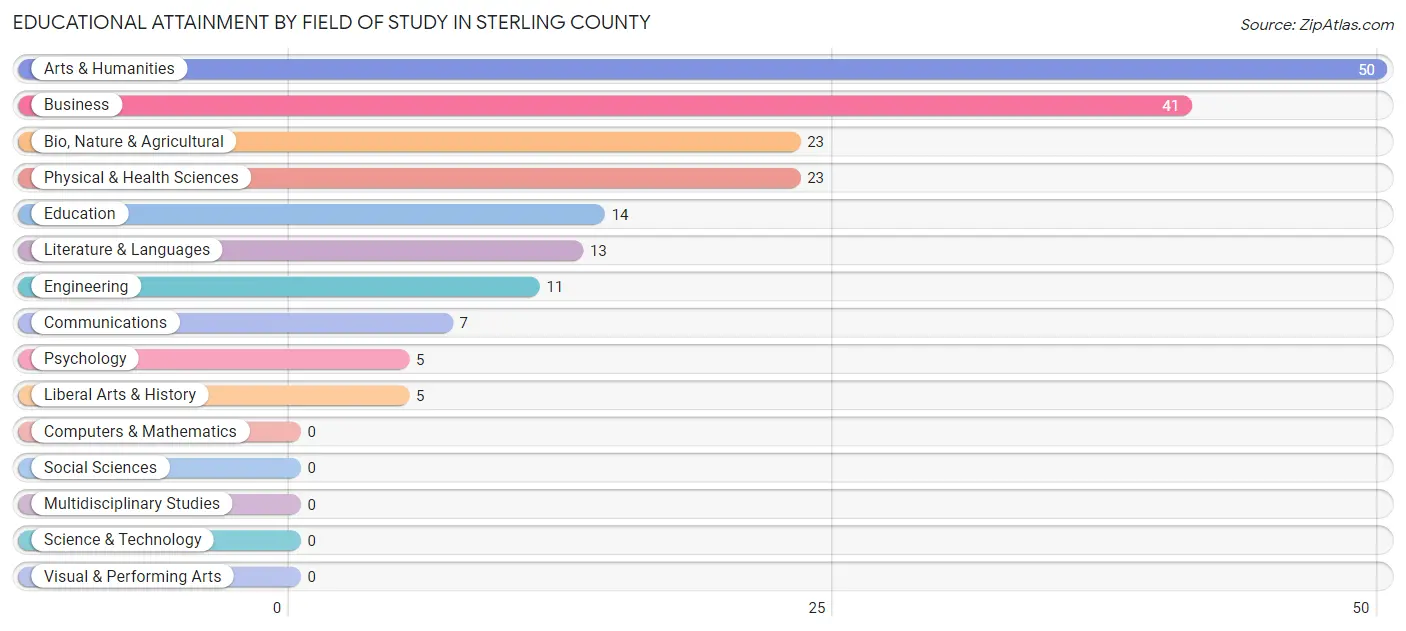
Educational Attainment by Field of Study in Sterling County
Arts & humanities (50 | 26.0%), business (41 | 21.3%), bio, nature & agricultural (23 | 12.0%), physical & health sciences (23 | 12.0%), and education (14 | 7.3%) are the most common fields of study among 192 individuals in Sterling County who have obtained a bachelor's degree or higher.
| Field of Study | # Graduates | % Graduates |
| Computers & Mathematics | 0 | 0.0% |
| Bio, Nature & Agricultural | 23 | 12.0% |
| Physical & Health Sciences | 23 | 12.0% |
| Psychology | 5 | 2.6% |
| Social Sciences | 0 | 0.0% |
| Engineering | 11 | 5.7% |
| Multidisciplinary Studies | 0 | 0.0% |
| Science & Technology | 0 | 0.0% |
| Business | 41 | 21.3% |
| Education | 14 | 7.3% |
| Literature & Languages | 13 | 6.8% |
| Liberal Arts & History | 5 | 2.6% |
| Visual & Performing Arts | 0 | 0.0% |
| Communications | 7 | 3.6% |
| Arts & Humanities | 50 | 26.0% |
| Total | 192 | 100.0% |
Transportation & Commute in Sterling County
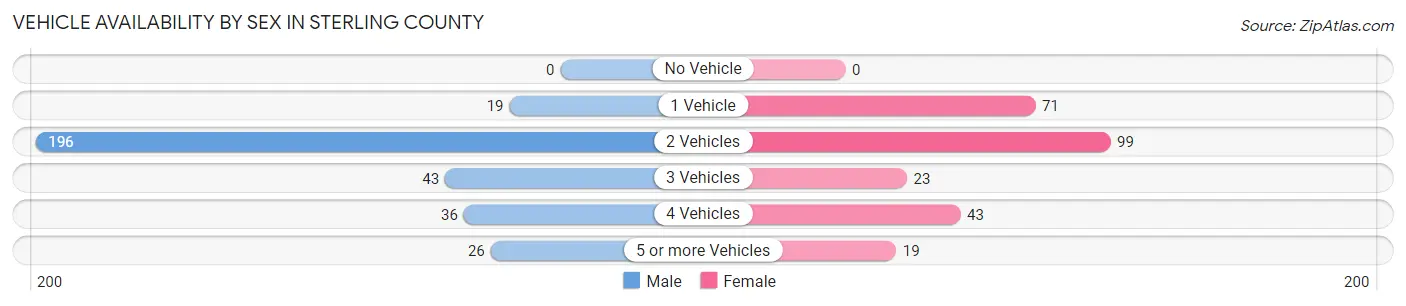
Vehicle Availability by Sex in Sterling County
The most prevalent vehicle ownership categories in Sterling County are males with 2 vehicles (196, accounting for 61.3%) and females with 2 vehicles (99, making up 76.9%).
| Vehicles Available | Male | Female |
| No Vehicle | 0 (0.0%) | 0 (0.0%) |
| 1 Vehicle | 19 (5.9%) | 71 (27.8%) |
| 2 Vehicles | 196 (61.3%) | 99 (38.8%) |
| 3 Vehicles | 43 (13.4%) | 23 (9.0%) |
| 4 Vehicles | 36 (11.3%) | 43 (16.9%) |
| 5 or more Vehicles | 26 (8.1%) | 19 (7.4%) |
| Total | 320 (100.0%) | 255 (100.0%) |
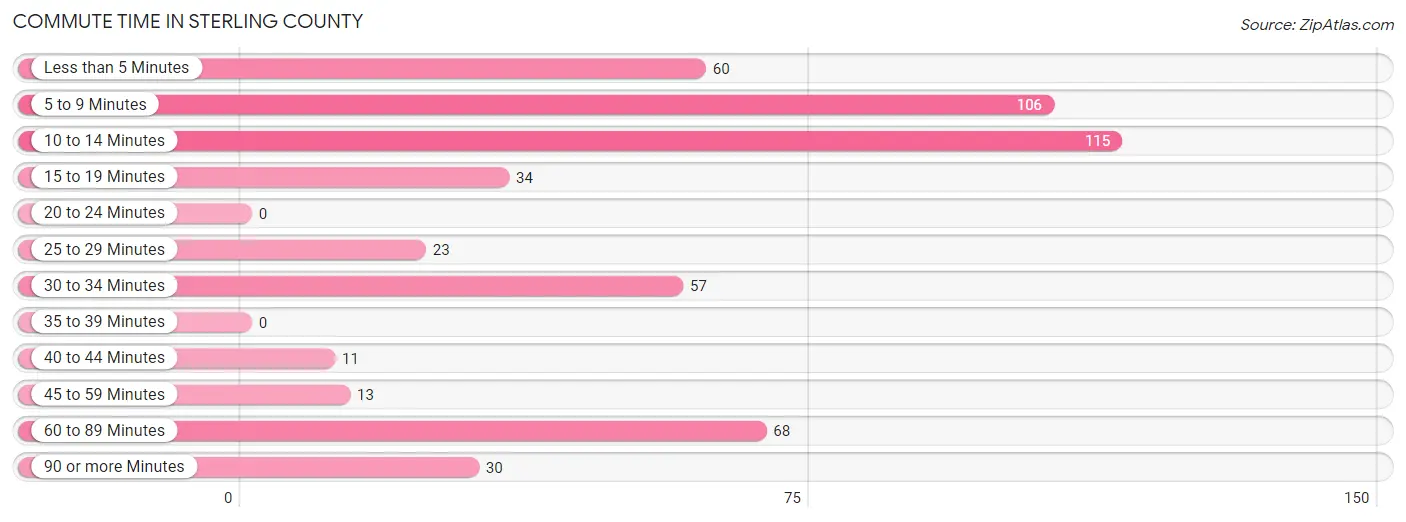
Commute Time in Sterling County
The most frequently occuring commute durations in Sterling County are 10 to 14 minutes (115 commuters, 22.2%), 5 to 9 minutes (106 commuters, 20.5%), and 60 to 89 minutes (68 commuters, 13.2%).
| Commute Time | # Commuters | % Commuters |
| Less than 5 Minutes | 60 | 11.6% |
| 5 to 9 Minutes | 106 | 20.5% |
| 10 to 14 Minutes | 115 | 22.2% |
| 15 to 19 Minutes | 34 | 6.6% |
| 20 to 24 Minutes | 0 | 0.0% |
| 25 to 29 Minutes | 23 | 4.4% |
| 30 to 34 Minutes | 57 | 11.0% |
| 35 to 39 Minutes | 0 | 0.0% |
| 40 to 44 Minutes | 11 | 2.1% |
| 45 to 59 Minutes | 13 | 2.5% |
| 60 to 89 Minutes | 68 | 13.2% |
| 90 or more Minutes | 30 | 5.8% |
Commute Time by Sex in Sterling County
The most common commute times in Sterling County are 5 to 9 minutes (76 commuters, 28.5%) for males and 10 to 14 minutes (91 commuters, 36.4%) for females.
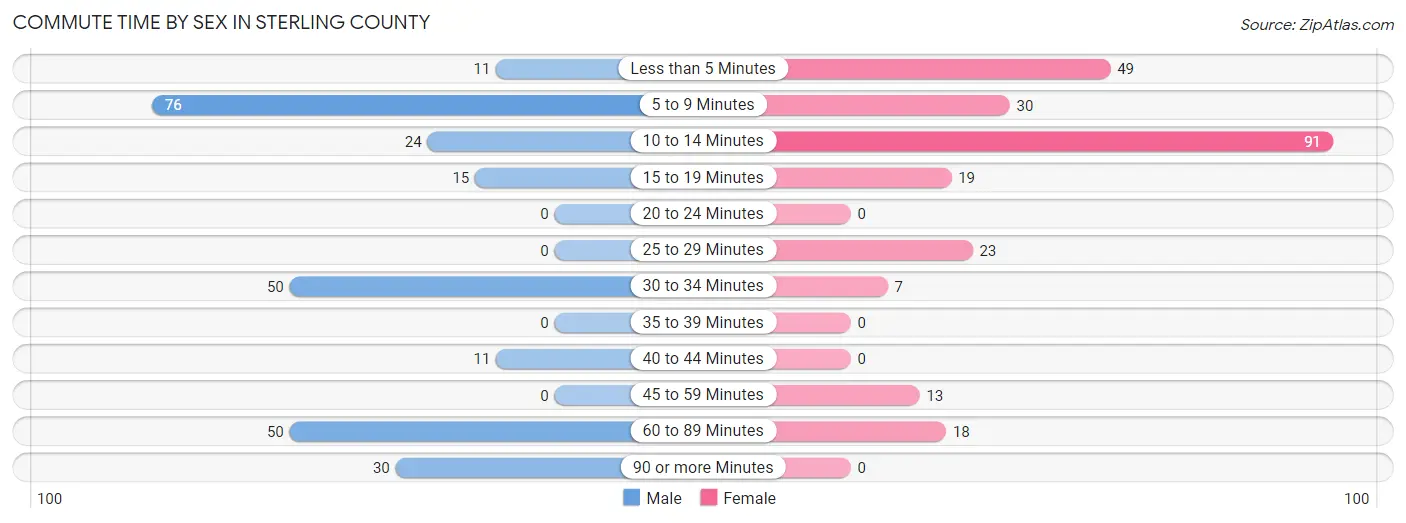
| Commute Time | Male | Female |
| Less than 5 Minutes | 11 (4.1%) | 49 (19.6%) |
| 5 to 9 Minutes | 76 (28.5%) | 30 (12.0%) |
| 10 to 14 Minutes | 24 (9.0%) | 91 (36.4%) |
| 15 to 19 Minutes | 15 (5.6%) | 19 (7.6%) |
| 20 to 24 Minutes | 0 (0.0%) | 0 (0.0%) |
| 25 to 29 Minutes | 0 (0.0%) | 23 (9.2%) |
| 30 to 34 Minutes | 50 (18.7%) | 7 (2.8%) |
| 35 to 39 Minutes | 0 (0.0%) | 0 (0.0%) |
| 40 to 44 Minutes | 11 (4.1%) | 0 (0.0%) |
| 45 to 59 Minutes | 0 (0.0%) | 13 (5.2%) |
| 60 to 89 Minutes | 50 (18.7%) | 18 (7.2%) |
| 90 or more Minutes | 30 (11.2%) | 0 (0.0%) |
Time of Departure to Work by Sex in Sterling County
The most frequent times of departure to work in Sterling County are 12:00 AM to 4:59 AM (61, 22.9%) for males and 8:00 AM to 8:29 AM (62, 24.8%) for females.
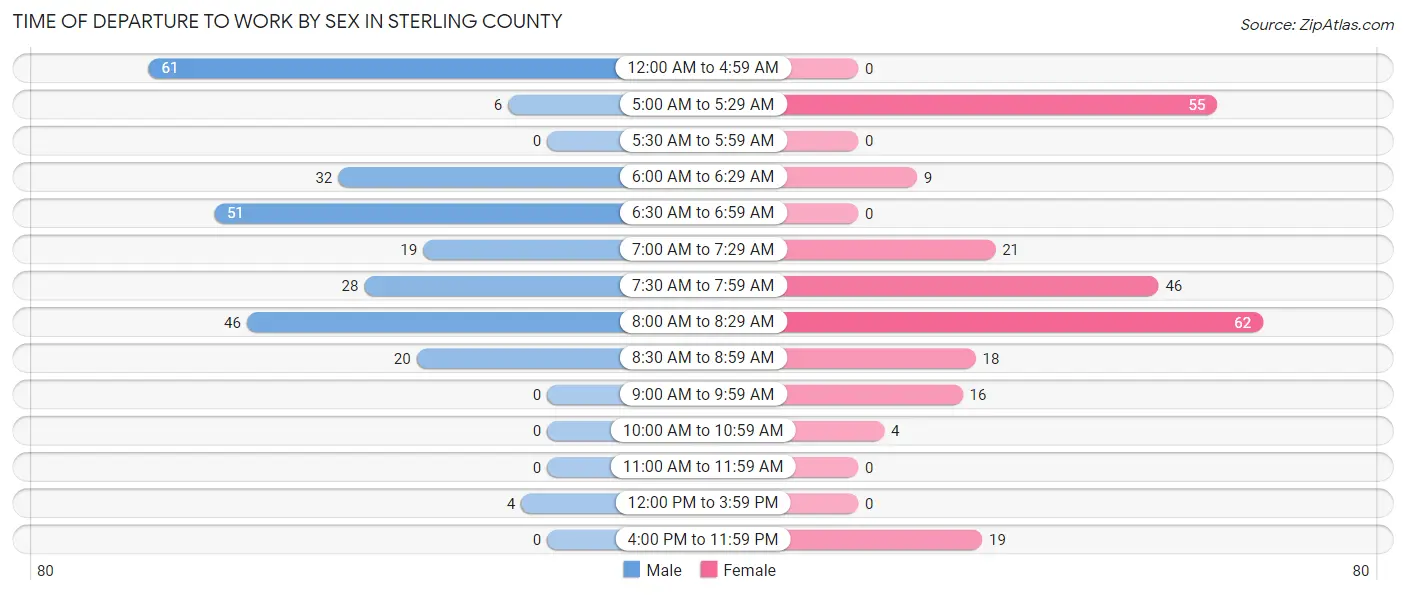
| Time of Departure | Male | Female |
| 12:00 AM to 4:59 AM | 61 (22.9%) | 0 (0.0%) |
| 5:00 AM to 5:29 AM | 6 (2.2%) | 55 (22.0%) |
| 5:30 AM to 5:59 AM | 0 (0.0%) | 0 (0.0%) |
| 6:00 AM to 6:29 AM | 32 (12.0%) | 9 (3.6%) |
| 6:30 AM to 6:59 AM | 51 (19.1%) | 0 (0.0%) |
| 7:00 AM to 7:29 AM | 19 (7.1%) | 21 (8.4%) |
| 7:30 AM to 7:59 AM | 28 (10.5%) | 46 (18.4%) |
| 8:00 AM to 8:29 AM | 46 (17.2%) | 62 (24.8%) |
| 8:30 AM to 8:59 AM | 20 (7.5%) | 18 (7.2%) |
| 9:00 AM to 9:59 AM | 0 (0.0%) | 16 (6.4%) |
| 10:00 AM to 10:59 AM | 0 (0.0%) | 4 (1.6%) |
| 11:00 AM to 11:59 AM | 0 (0.0%) | 0 (0.0%) |
| 12:00 PM to 3:59 PM | 4 (1.5%) | 0 (0.0%) |
| 4:00 PM to 11:59 PM | 0 (0.0%) | 19 (7.6%) |
| Total | 267 (100.0%) | 250 (100.0%) |
Housing Occupancy in Sterling County
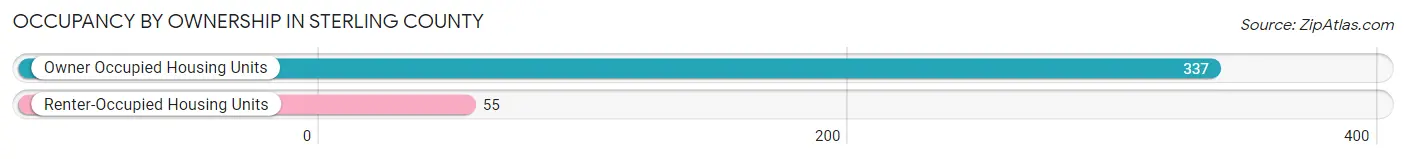
Occupancy by Ownership in Sterling County
Of the total 392 dwellings in Sterling County, owner-occupied units account for 337 (86.0%), while renter-occupied units make up 55 (14.0%).
| Occupancy | # Housing Units | % Housing Units |
| Owner Occupied Housing Units | 337 | 86.0% |
| Renter-Occupied Housing Units | 55 | 14.0% |
| Total Occupied Housing Units | 392 | 100.0% |
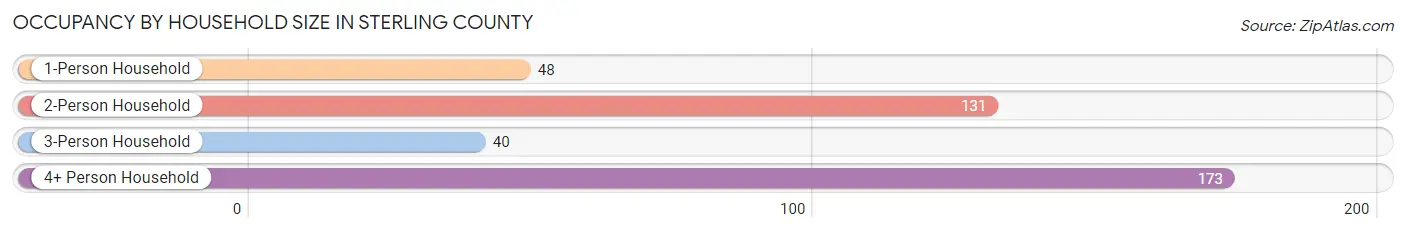
Occupancy by Household Size in Sterling County
| Household Size | # Housing Units | % Housing Units |
| 1-Person Household | 48 | 12.2% |
| 2-Person Household | 131 | 33.4% |
| 3-Person Household | 40 | 10.2% |
| 4+ Person Household | 173 | 44.1% |
| Total Housing Units | 392 | 100.0% |
Occupancy by Ownership by Household Size in Sterling County
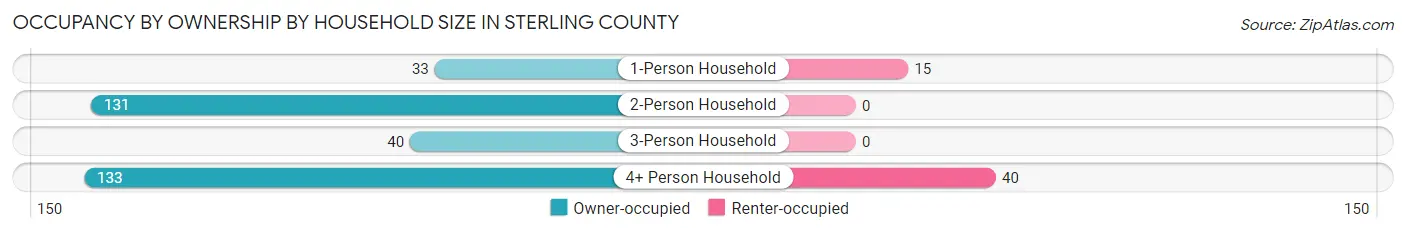
| Household Size | Owner-occupied | Renter-occupied |
| 1-Person Household | 33 (68.8%) | 15 (31.2%) |
| 2-Person Household | 131 (100.0%) | 0 (0.0%) |
| 3-Person Household | 40 (100.0%) | 0 (0.0%) |
| 4+ Person Household | 133 (76.9%) | 40 (23.1%) |
| Total Housing Units | 337 (86.0%) | 55 (14.0%) |
Occupancy by Educational Attainment in Sterling County
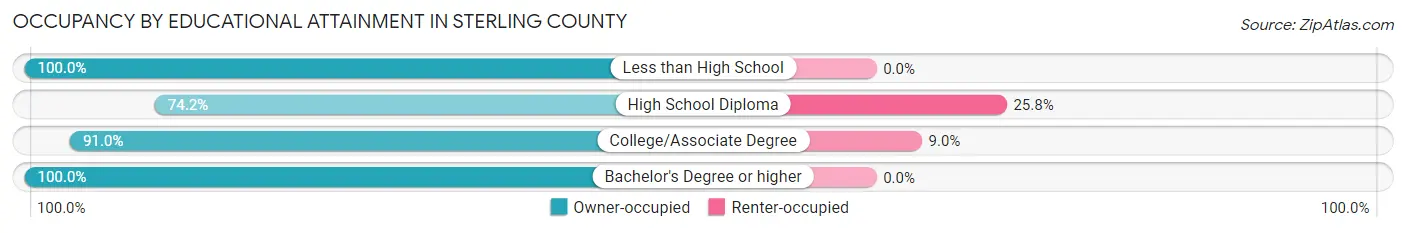
| Household Size | Owner-occupied | Renter-occupied |
| Less than High School | 37 (100.0%) | 0 (0.0%) |
| High School Diploma | 132 (74.2%) | 46 (25.8%) |
| College/Associate Degree | 91 (91.0%) | 9 (9.0%) |
| Bachelor's Degree or higher | 77 (100.0%) | 0 (0.0%) |
Occupancy by Age of Householder in Sterling County
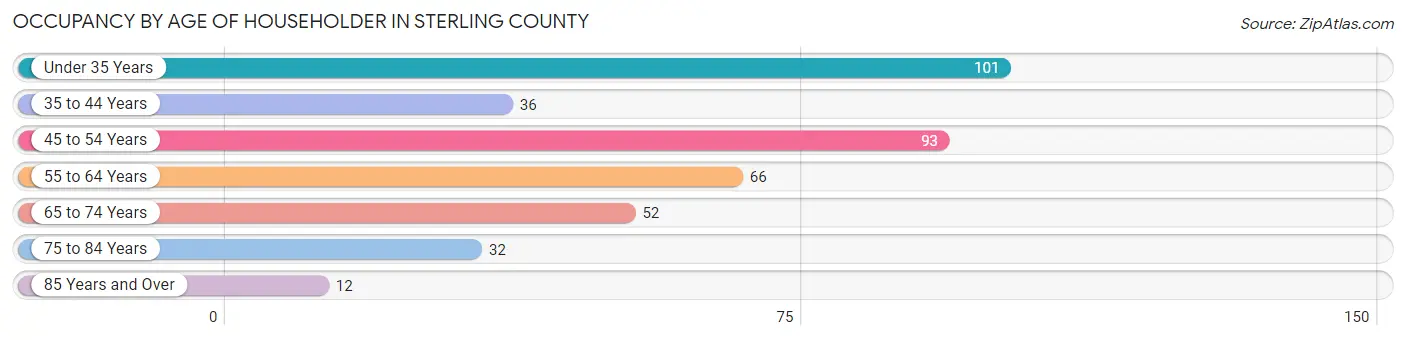
| Age Bracket | # Households | % Households |
| Under 35 Years | 101 | 25.8% |
| 35 to 44 Years | 36 | 9.2% |
| 45 to 54 Years | 93 | 23.7% |
| 55 to 64 Years | 66 | 16.8% |
| 65 to 74 Years | 52 | 13.3% |
| 75 to 84 Years | 32 | 8.2% |
| 85 Years and Over | 12 | 3.1% |
| Total | 392 | 100.0% |
Housing Finances in Sterling County
Median Income by Occupancy in Sterling County
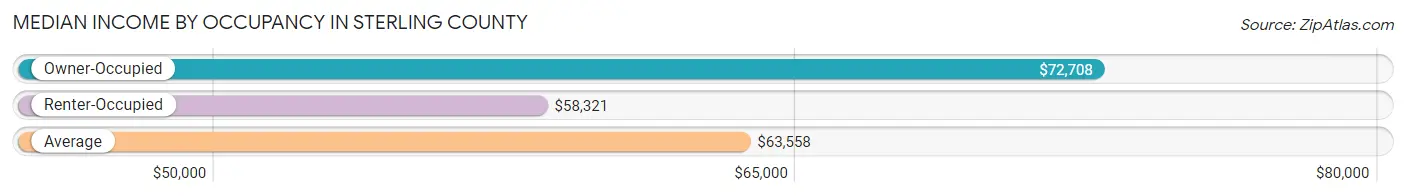
| Occupancy Type | # Households | Median Income |
| Owner-Occupied | 337 (86.0%) | $72,708 |
| Renter-Occupied | 55 (14.0%) | $58,321 |
| Average | 392 (100.0%) | $63,558 |
Occupancy by Householder Income Bracket in Sterling County
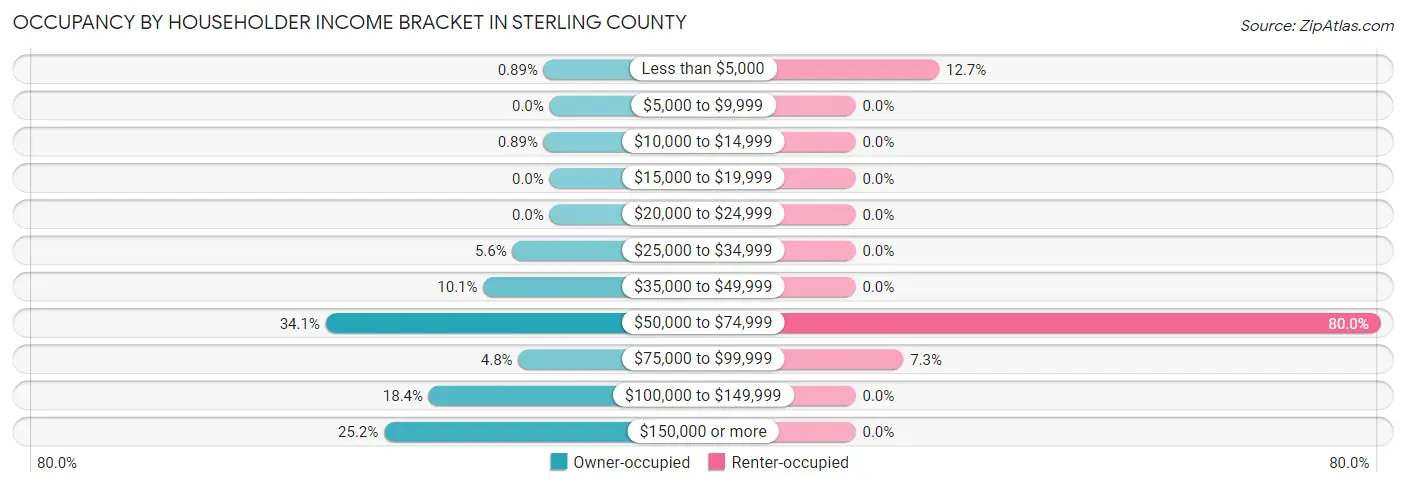
| Income Bracket | Owner-occupied | Renter-occupied |
| Less than $5,000 | 3 (0.9%) | 7 (12.7%) |
| $5,000 to $9,999 | 0 (0.0%) | 0 (0.0%) |
| $10,000 to $14,999 | 3 (0.9%) | 0 (0.0%) |
| $15,000 to $19,999 | 0 (0.0%) | 0 (0.0%) |
| $20,000 to $24,999 | 0 (0.0%) | 0 (0.0%) |
| $25,000 to $34,999 | 19 (5.6%) | 0 (0.0%) |
| $35,000 to $49,999 | 34 (10.1%) | 0 (0.0%) |
| $50,000 to $74,999 | 115 (34.1%) | 44 (80.0%) |
| $75,000 to $99,999 | 16 (4.8%) | 4 (7.3%) |
| $100,000 to $149,999 | 62 (18.4%) | 0 (0.0%) |
| $150,000 or more | 85 (25.2%) | 0 (0.0%) |
| Total | 337 (100.0%) | 55 (100.0%) |
Monthly Housing Cost Tiers in Sterling County
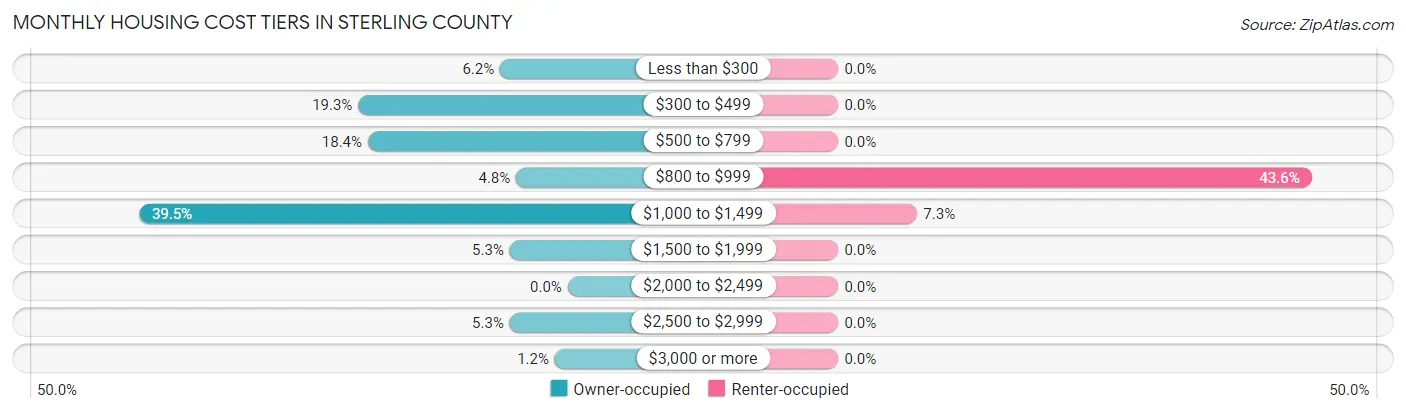
| Monthly Cost | Owner-occupied | Renter-occupied |
| Less than $300 | 21 (6.2%) | 0 (0.0%) |
| $300 to $499 | 65 (19.3%) | 0 (0.0%) |
| $500 to $799 | 62 (18.4%) | 0 (0.0%) |
| $800 to $999 | 16 (4.8%) | 24 (43.6%) |
| $1,000 to $1,499 | 133 (39.5%) | 4 (7.3%) |
| $1,500 to $1,999 | 18 (5.3%) | 0 (0.0%) |
| $2,000 to $2,499 | 0 (0.0%) | 0 (0.0%) |
| $2,500 to $2,999 | 18 (5.3%) | 0 (0.0%) |
| $3,000 or more | 4 (1.2%) | 0 (0.0%) |
| Total | 337 (100.0%) | 55 (100.0%) |
Physical Housing Characteristics in Sterling County
Housing Structures in Sterling County
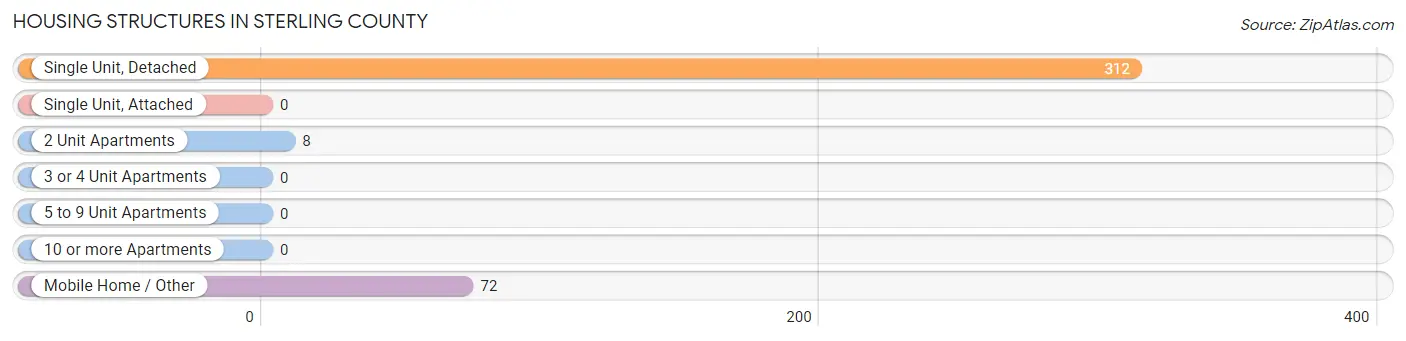
| Structure Type | # Housing Units | % Housing Units |
| Single Unit, Detached | 312 | 79.6% |
| Single Unit, Attached | 0 | 0.0% |
| 2 Unit Apartments | 8 | 2.0% |
| 3 or 4 Unit Apartments | 0 | 0.0% |
| 5 to 9 Unit Apartments | 0 | 0.0% |
| 10 or more Apartments | 0 | 0.0% |
| Mobile Home / Other | 72 | 18.4% |
| Total | 392 | 100.0% |
Housing Structures by Occupancy in Sterling County
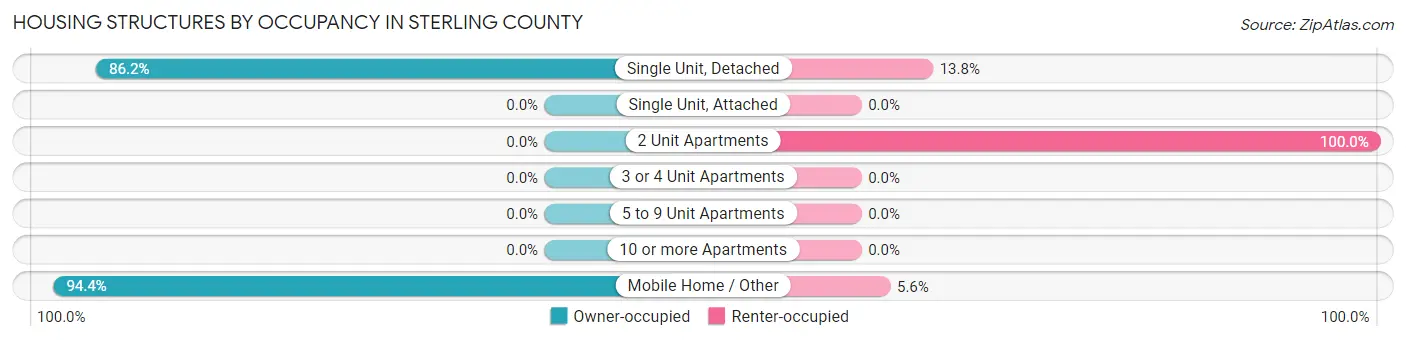
| Structure Type | Owner-occupied | Renter-occupied |
| Single Unit, Detached | 269 (86.2%) | 43 (13.8%) |
| Single Unit, Attached | 0 (0.0%) | 0 (0.0%) |
| 2 Unit Apartments | 0 (0.0%) | 8 (100.0%) |
| 3 or 4 Unit Apartments | 0 (0.0%) | 0 (0.0%) |
| 5 to 9 Unit Apartments | 0 (0.0%) | 0 (0.0%) |
| 10 or more Apartments | 0 (0.0%) | 0 (0.0%) |
| Mobile Home / Other | 68 (94.4%) | 4 (5.6%) |
| Total | 337 (86.0%) | 55 (14.0%) |
Housing Structures by Number of Rooms in Sterling County
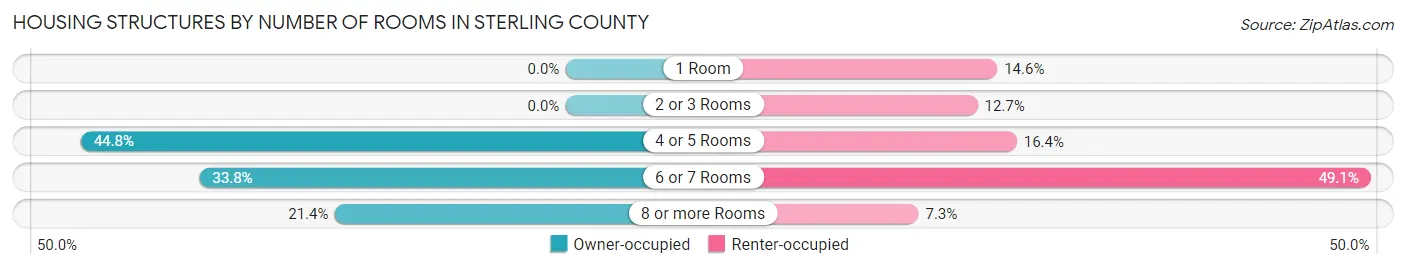
| Number of Rooms | Owner-occupied | Renter-occupied |
| 1 Room | 0 (0.0%) | 8 (14.5%) |
| 2 or 3 Rooms | 0 (0.0%) | 7 (12.7%) |
| 4 or 5 Rooms | 151 (44.8%) | 9 (16.4%) |
| 6 or 7 Rooms | 114 (33.8%) | 27 (49.1%) |
| 8 or more Rooms | 72 (21.4%) | 4 (7.3%) |
| Total | 337 (100.0%) | 55 (100.0%) |
Housing Structure by Heating Type in Sterling County
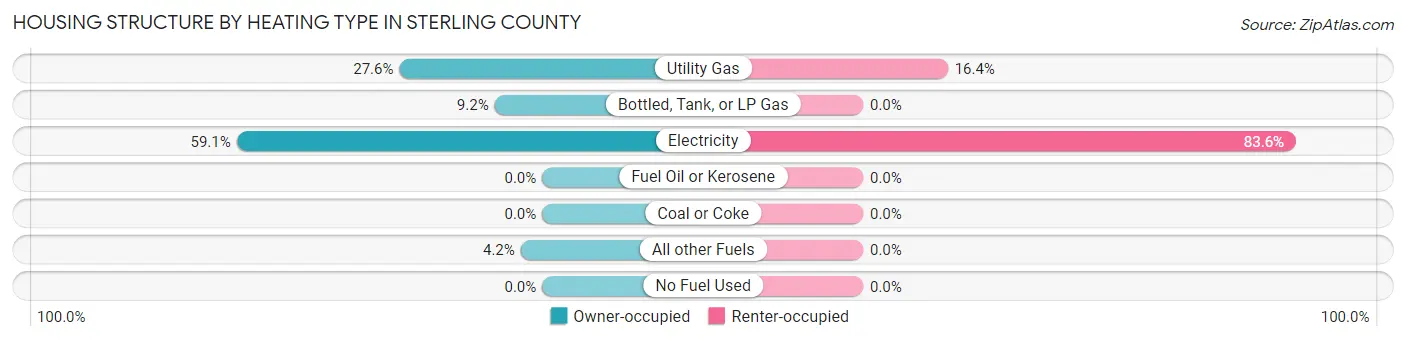
| Heating Type | Owner-occupied | Renter-occupied |
| Utility Gas | 93 (27.6%) | 9 (16.4%) |
| Bottled, Tank, or LP Gas | 31 (9.2%) | 0 (0.0%) |
| Electricity | 199 (59.1%) | 46 (83.6%) |
| Fuel Oil or Kerosene | 0 (0.0%) | 0 (0.0%) |
| Coal or Coke | 0 (0.0%) | 0 (0.0%) |
| All other Fuels | 14 (4.2%) | 0 (0.0%) |
| No Fuel Used | 0 (0.0%) | 0 (0.0%) |
| Total | 337 (100.0%) | 55 (100.0%) |
Household Vehicle Usage in Sterling County
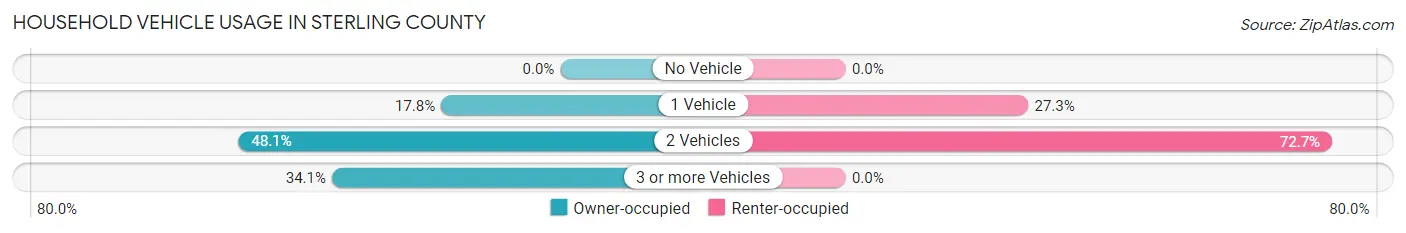
| Vehicles per Household | Owner-occupied | Renter-occupied |
| No Vehicle | 0 (0.0%) | 0 (0.0%) |
| 1 Vehicle | 60 (17.8%) | 15 (27.3%) |
| 2 Vehicles | 162 (48.1%) | 40 (72.7%) |
| 3 or more Vehicles | 115 (34.1%) | 0 (0.0%) |
| Total | 337 (100.0%) | 55 (100.0%) |
Real Estate & Mortgages in Sterling County
Real Estate and Mortgage Overview in Sterling County
| Characteristic | Without Mortgage | With Mortgage |
| Housing Units | 164 | 173 |
| Median Property Value | - | - |
| Median Household Income | $81,250 | $30 |
| Monthly Housing Costs | $488 | $4 |
| Real Estate Taxes | $1,314 | $14 |
Property Value by Mortgage Status in Sterling County
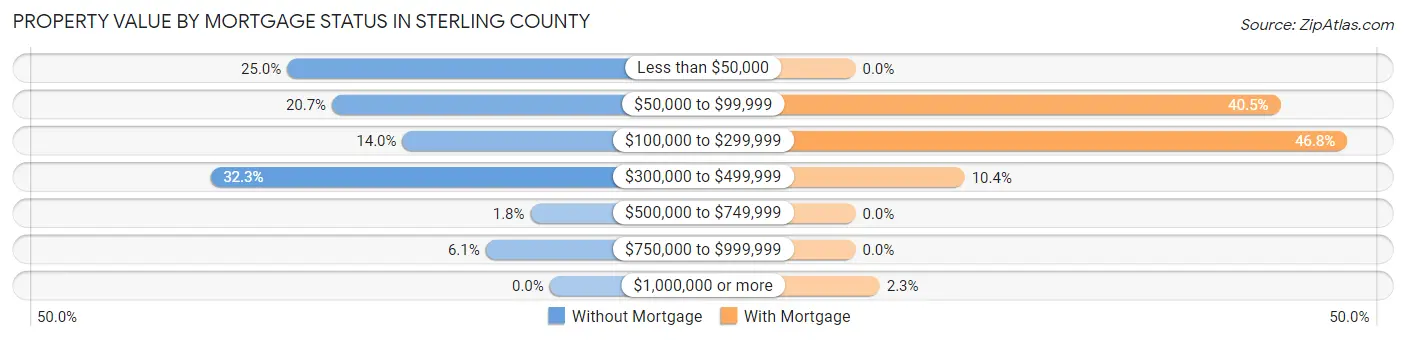
| Property Value | Without Mortgage | With Mortgage |
| Less than $50,000 | 41 (25.0%) | 0 (0.0%) |
| $50,000 to $99,999 | 34 (20.7%) | 70 (40.5%) |
| $100,000 to $299,999 | 23 (14.0%) | 81 (46.8%) |
| $300,000 to $499,999 | 53 (32.3%) | 18 (10.4%) |
| $500,000 to $749,999 | 3 (1.8%) | 0 (0.0%) |
| $750,000 to $999,999 | 10 (6.1%) | 0 (0.0%) |
| $1,000,000 or more | 0 (0.0%) | 4 (2.3%) |
| Total | 164 (100.0%) | 173 (100.0%) |
Household Income by Mortgage Status in Sterling County
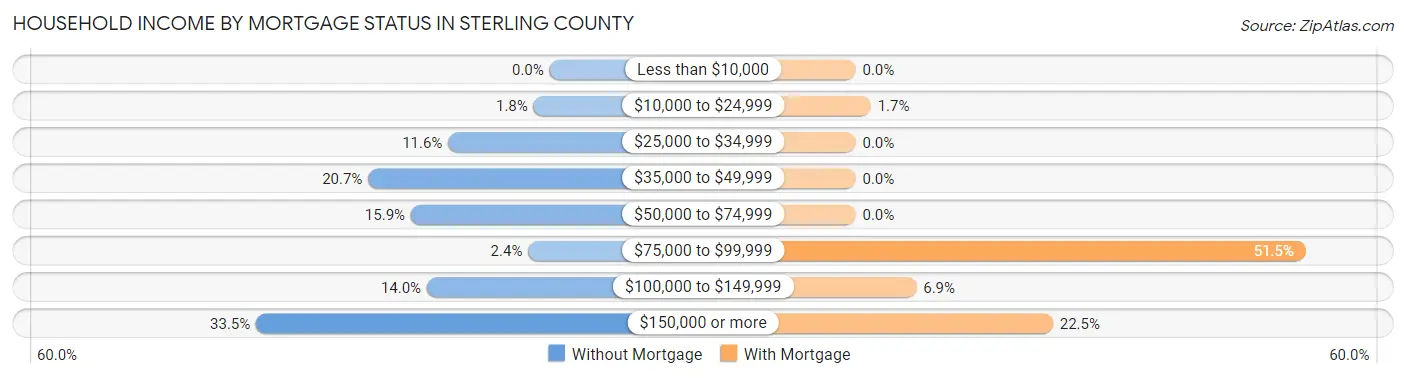
| Household Income | Without Mortgage | With Mortgage |
| Less than $10,000 | 0 (0.0%) | 0 (0.0%) |
| $10,000 to $24,999 | 3 (1.8%) | 3 (1.7%) |
| $25,000 to $34,999 | 19 (11.6%) | 0 (0.0%) |
| $35,000 to $49,999 | 34 (20.7%) | 0 (0.0%) |
| $50,000 to $74,999 | 26 (15.9%) | 0 (0.0%) |
| $75,000 to $99,999 | 4 (2.4%) | 89 (51.4%) |
| $100,000 to $149,999 | 23 (14.0%) | 12 (6.9%) |
| $150,000 or more | 55 (33.5%) | 39 (22.5%) |
| Total | 164 (100.0%) | 173 (100.0%) |
Property Value to Household Income Ratio in Sterling County
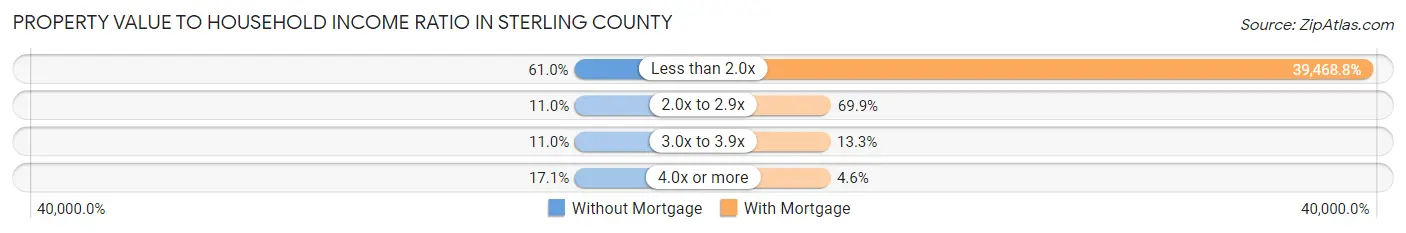
| Value-to-Income Ratio | Without Mortgage | With Mortgage |
| Less than 2.0x | 100 (61.0%) | 68,281 (39,468.8%) |
| 2.0x to 2.9x | 18 (11.0%) | 121 (69.9%) |
| 3.0x to 3.9x | 18 (11.0%) | 23 (13.3%) |
| 4.0x or more | 28 (17.1%) | 8 (4.6%) |
| Total | 164 (100.0%) | 173 (100.0%) |
Real Estate Taxes by Mortgage Status in Sterling County
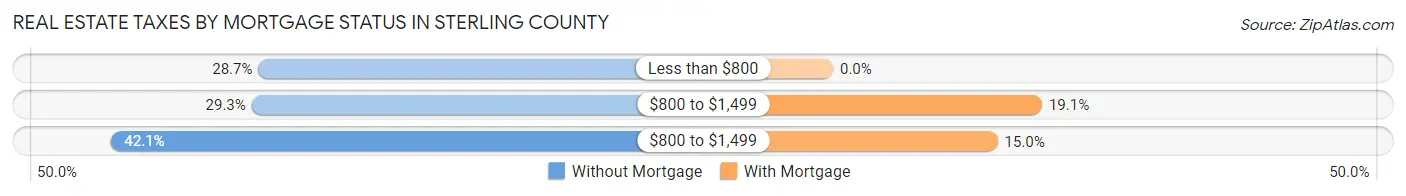
| Property Taxes | Without Mortgage | With Mortgage |
| Less than $800 | 47 (28.7%) | 0 (0.0%) |
| $800 to $1,499 | 48 (29.3%) | 33 (19.1%) |
| $800 to $1,499 | 69 (42.1%) | 26 (15.0%) |
| Total | 164 (100.0%) | 173 (100.0%) |
Health & Disability in Sterling County
Health Insurance Coverage by Age in Sterling County
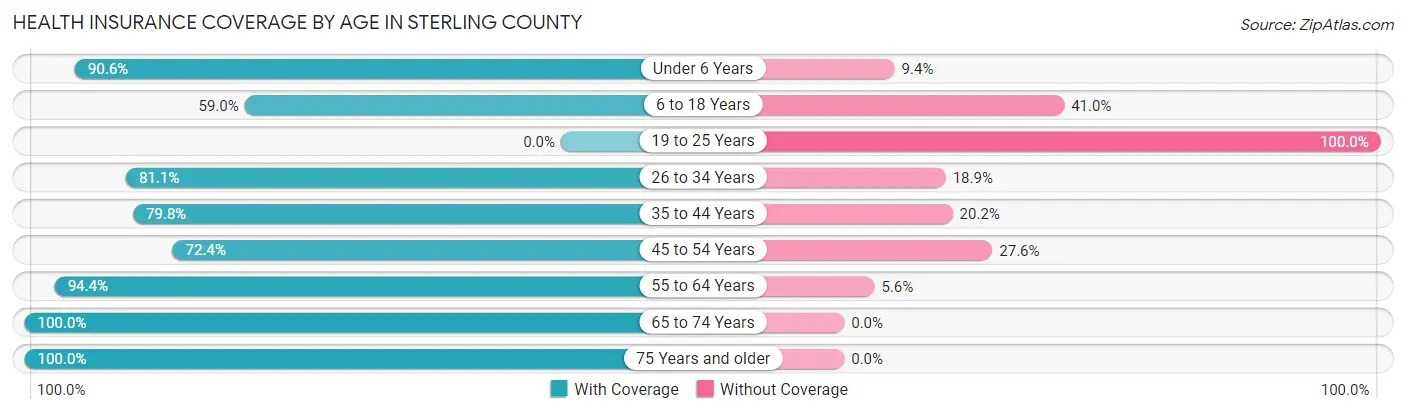
| Age Bracket | With Coverage | Without Coverage |
| Under 6 Years | 164 (90.6%) | 17 (9.4%) |
| 6 to 18 Years | 210 (59.0%) | 146 (41.0%) |
| 19 to 25 Years | 0 (0.0%) | 35 (100.0%) |
| 26 to 34 Years | 180 (81.1%) | 42 (18.9%) |
| 35 to 44 Years | 75 (79.8%) | 19 (20.2%) |
| 45 to 54 Years | 97 (72.4%) | 37 (27.6%) |
| 55 to 64 Years | 168 (94.4%) | 10 (5.6%) |
| 65 to 74 Years | 88 (100.0%) | 0 (0.0%) |
| 75 Years and older | 68 (100.0%) | 0 (0.0%) |
| Total | 1,050 (77.4%) | 306 (22.6%) |
Health Insurance Coverage by Citizenship Status in Sterling County
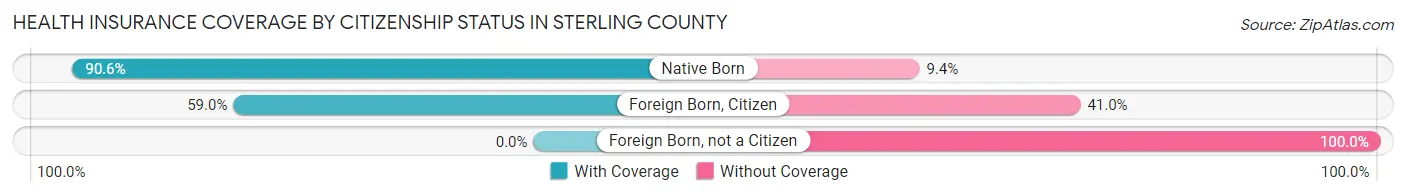
| Citizenship Status | With Coverage | Without Coverage |
| Native Born | 164 (90.6%) | 17 (9.4%) |
| Foreign Born, Citizen | 210 (59.0%) | 146 (41.0%) |
| Foreign Born, not a Citizen | 0 (0.0%) | 35 (100.0%) |
Health Insurance Coverage by Household Income in Sterling County
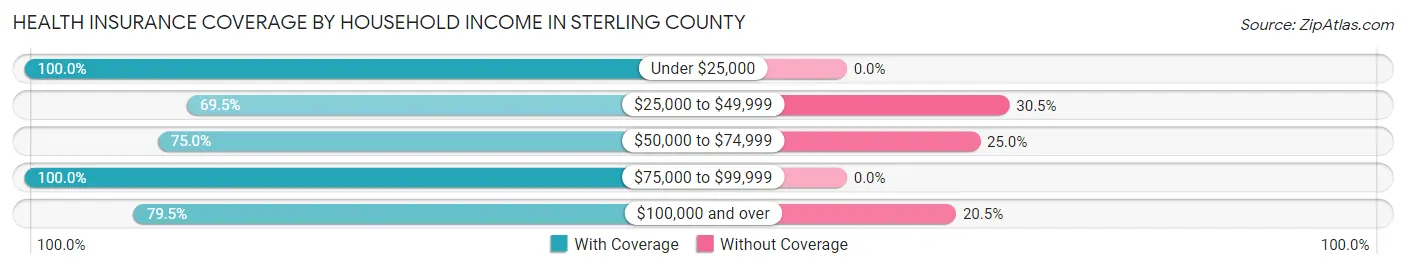
| Household Income | With Coverage | Without Coverage |
| Under $25,000 | 24 (100.0%) | 0 (0.0%) |
| $25,000 to $49,999 | 105 (69.5%) | 46 (30.5%) |
| $50,000 to $74,999 | 490 (75.0%) | 163 (25.0%) |
| $75,000 to $99,999 | 54 (100.0%) | 0 (0.0%) |
| $100,000 and over | 377 (79.5%) | 97 (20.5%) |
Public vs Private Health Insurance Coverage by Age in Sterling County
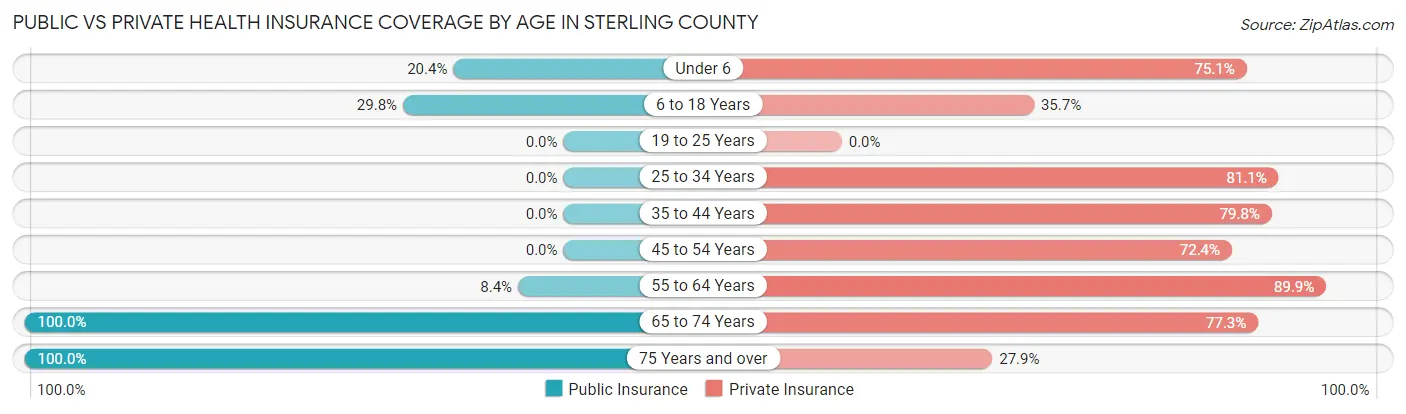
| Age Bracket | Public Insurance | Private Insurance |
| Under 6 | 37 (20.4%) | 136 (75.1%) |
| 6 to 18 Years | 106 (29.8%) | 127 (35.7%) |
| 19 to 25 Years | 0 (0.0%) | 0 (0.0%) |
| 25 to 34 Years | 0 (0.0%) | 180 (81.1%) |
| 35 to 44 Years | 0 (0.0%) | 75 (79.8%) |
| 45 to 54 Years | 0 (0.0%) | 97 (72.4%) |
| 55 to 64 Years | 15 (8.4%) | 160 (89.9%) |
| 65 to 74 Years | 88 (100.0%) | 68 (77.3%) |
| 75 Years and over | 68 (100.0%) | 19 (27.9%) |
| Total | 314 (23.2%) | 862 (63.6%) |
Disability Status by Sex by Age in Sterling County
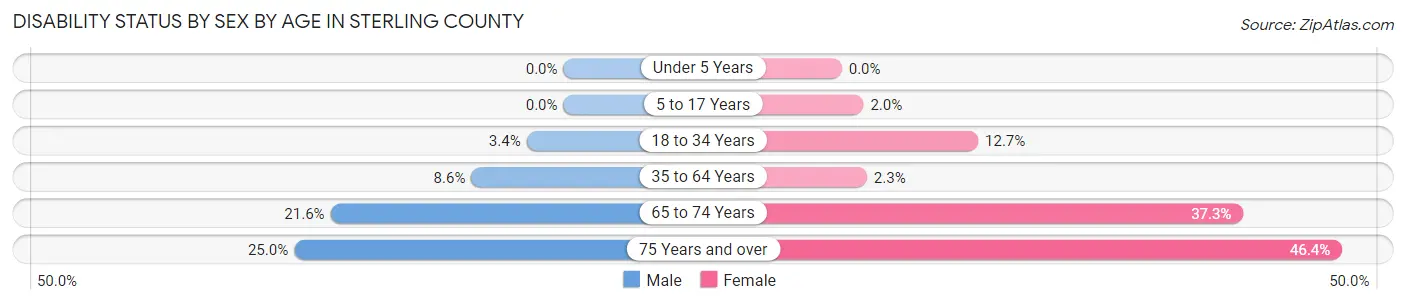
| Age Bracket | Male | Female |
| Under 5 Years | 0 (0.0%) | 0 (0.0%) |
| 5 to 17 Years | 0 (0.0%) | 3 (2.0%) |
| 18 to 34 Years | 5 (3.4%) | 21 (12.7%) |
| 35 to 64 Years | 20 (8.6%) | 4 (2.3%) |
| 65 to 74 Years | 8 (21.6%) | 19 (37.2%) |
| 75 Years and over | 3 (25.0%) | 26 (46.4%) |
Disability Class by Sex by Age in Sterling County
Disability Class: Hearing Difficulty
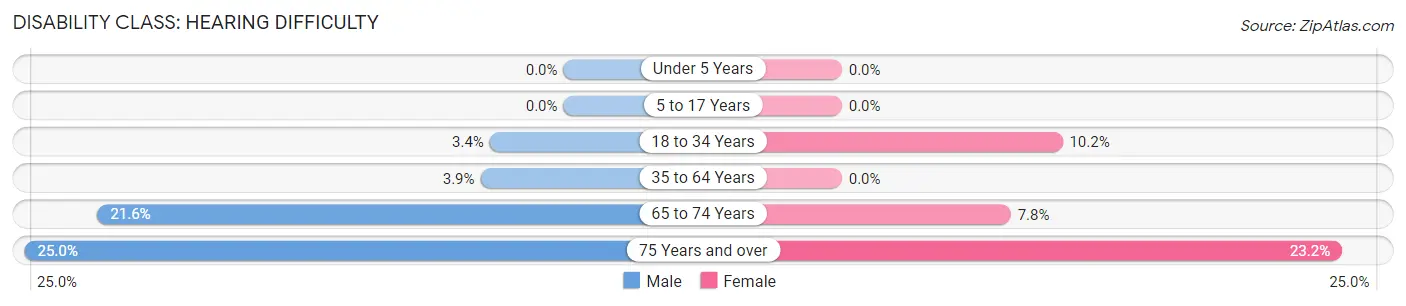
| Age Bracket | Male | Female |
| Under 5 Years | 0 (0.0%) | 0 (0.0%) |
| 5 to 17 Years | 0 (0.0%) | 0 (0.0%) |
| 18 to 34 Years | 5 (3.4%) | 17 (10.2%) |
| 35 to 64 Years | 9 (3.8%) | 0 (0.0%) |
| 65 to 74 Years | 8 (21.6%) | 4 (7.8%) |
| 75 Years and over | 3 (25.0%) | 13 (23.2%) |
Disability Class: Vision Difficulty
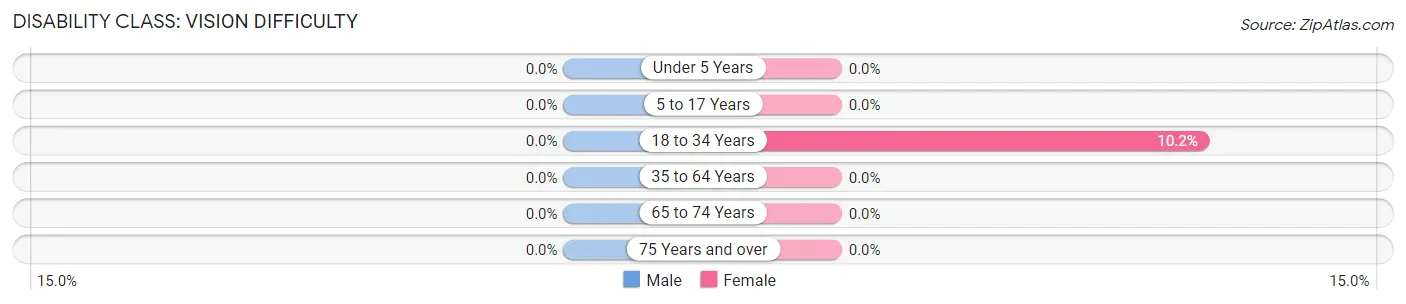
| Age Bracket | Male | Female |
| Under 5 Years | 0 (0.0%) | 0 (0.0%) |
| 5 to 17 Years | 0 (0.0%) | 0 (0.0%) |
| 18 to 34 Years | 0 (0.0%) | 17 (10.2%) |
| 35 to 64 Years | 0 (0.0%) | 0 (0.0%) |
| 65 to 74 Years | 0 (0.0%) | 0 (0.0%) |
| 75 Years and over | 0 (0.0%) | 0 (0.0%) |
Disability Class: Cognitive Difficulty
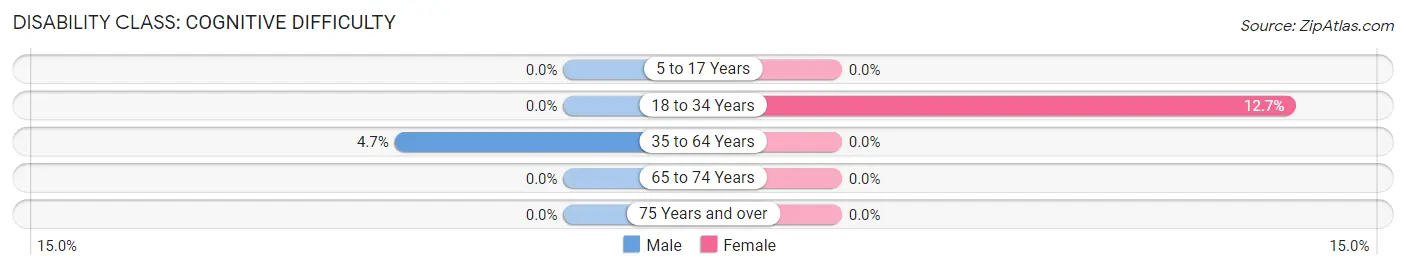
| Age Bracket | Male | Female |
| 5 to 17 Years | 0 (0.0%) | 0 (0.0%) |
| 18 to 34 Years | 0 (0.0%) | 21 (12.7%) |
| 35 to 64 Years | 11 (4.7%) | 0 (0.0%) |
| 65 to 74 Years | 0 (0.0%) | 0 (0.0%) |
| 75 Years and over | 0 (0.0%) | 0 (0.0%) |
Disability Class: Ambulatory Difficulty
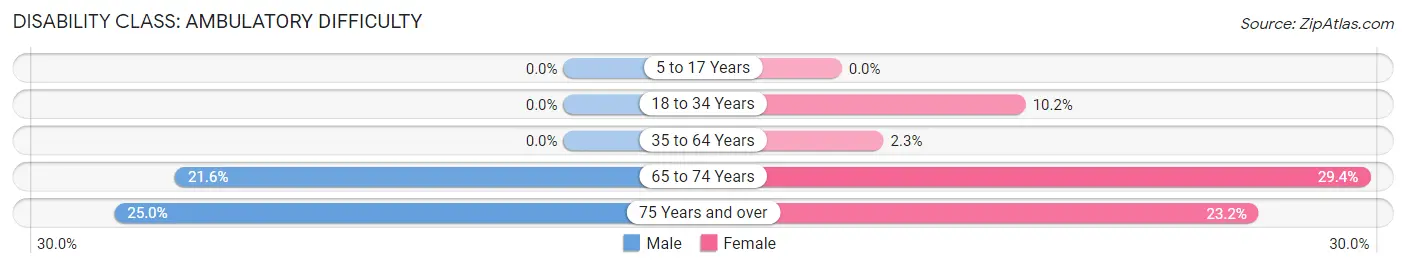
| Age Bracket | Male | Female |
| 5 to 17 Years | 0 (0.0%) | 0 (0.0%) |
| 18 to 34 Years | 0 (0.0%) | 17 (10.2%) |
| 35 to 64 Years | 0 (0.0%) | 4 (2.3%) |
| 65 to 74 Years | 8 (21.6%) | 15 (29.4%) |
| 75 Years and over | 3 (25.0%) | 13 (23.2%) |
Disability Class: Self-Care Difficulty
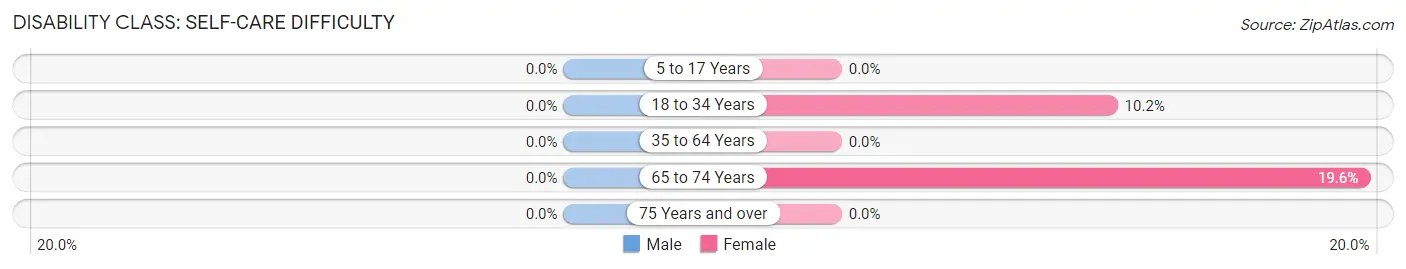
| Age Bracket | Male | Female |
| 5 to 17 Years | 0 (0.0%) | 0 (0.0%) |
| 18 to 34 Years | 0 (0.0%) | 17 (10.2%) |
| 35 to 64 Years | 0 (0.0%) | 0 (0.0%) |
| 65 to 74 Years | 0 (0.0%) | 10 (19.6%) |
| 75 Years and over | 0 (0.0%) | 0 (0.0%) |
Technology Access in Sterling County
Computing Device Access in Sterling County
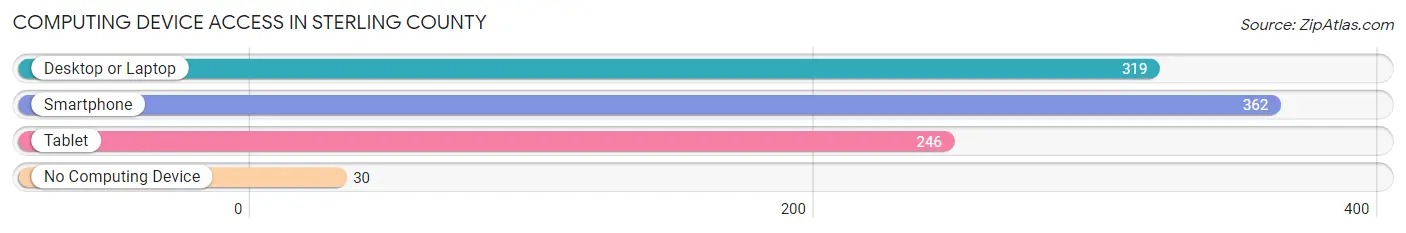
| Device Type | # Households | % Households |
| Desktop or Laptop | 319 | 81.4% |
| Smartphone | 362 | 92.3% |
| Tablet | 246 | 62.8% |
| No Computing Device | 30 | 7.6% |
| Total | 392 | 100.0% |
Internet Access in Sterling County
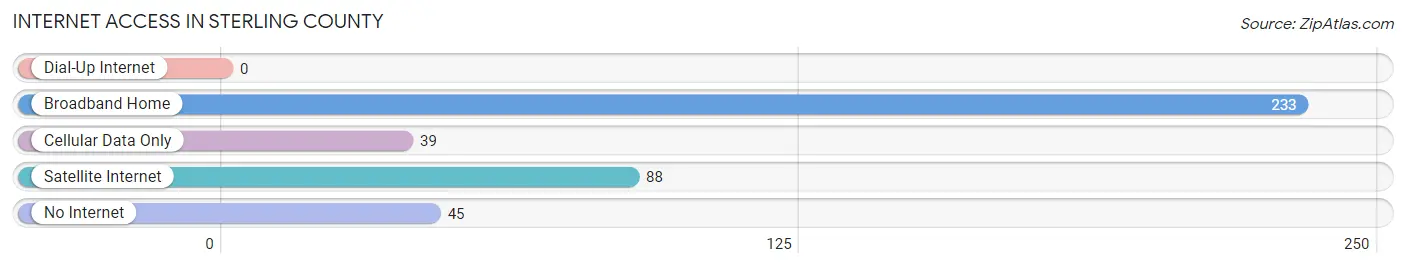
| Internet Type | # Households | % Households |
| Dial-Up Internet | 0 | 0.0% |
| Broadband Home | 233 | 59.4% |
| Cellular Data Only | 39 | 10.0% |
| Satellite Internet | 88 | 22.5% |
| No Internet | 45 | 11.5% |
| Total | 392 | 100.0% |
Sterling County Summary
Sterling County is a county located in the state of Texas, United States. As of the 2010 census, the population was 1,143, making it the second-least populous county in Texas. The county seat is Sterling City. The county was created in 1891 and named for William A. Sterling, a Confederate soldier and Texas state legislator.
History
Sterling County was established in 1891 from parts of Tom Green and Irion counties. It was named for William A. Sterling, a Confederate soldier and Texas state legislator. The county was originally part of the Edwards Plateau, but was later divided into two parts by the Colorado River. The western part of the county is part of the Concho River watershed, while the eastern part is part of the Colorado River watershed.
The first settlers in the area were ranchers, who established large cattle ranches in the area. The first town in the county was Sterling City, which was established in 1891. The town was named for William A. Sterling.
Geography
Sterling County is located in the western part of Texas, in the Edwards Plateau region. It is bordered by Tom Green County to the north, Irion County to the east, Coke County to the south, and Runnels County to the west. The county has a total area of 845 square miles, of which 844 square miles is land and 1.2 square miles (0.1%) is water.
The terrain of Sterling County is mostly flat, with some rolling hills in the western part of the county. The county is part of the Concho River watershed, with the Colorado River forming the eastern boundary of the county. The county is home to several creeks, including the North Concho River, South Concho River, and the Colorado River.
Economy
The economy of Sterling County is largely based on agriculture and ranching. The county is home to several large ranches, including the Sterling Ranch, which is one of the largest ranches in the state. The county is also home to several oil and gas wells, which provide jobs and revenue for the county.
The county is home to several small businesses, including a few restaurants, convenience stores, and a few small retail stores. The county is also home to a few small manufacturing companies, which produce a variety of products, including furniture, clothing, and food products.
Demographics
As of the 2010 census, there were 1,143 people, 441 households, and 315 families residing in the county. The population density was 1.3 people per square mile. There were 517 housing units at an average density of 0.6 per square mile. The racial makeup of the county was 94.2% White, 0.2% African American, 0.2% Native American, 0.2% Asian, 0.1% Pacific Islander, 4.2% from other races, and 0.9% from two or more races. Hispanic or Latino of any race were 8.3% of the population.
There were 441 households, out of which 28.2% had children under the age of 18 living with them, 57.2% were married couples living together, 8.6% had a female householder with no husband present, and 29.7% were non-families. 25.9% of all households were made up of individuals, and 13.2% had someone living alone who was 65 years of age or older. The average household size was 2.58 and the average family size was 3.09.
In the county, the population was spread out, with 25.2% under the age of 18, 6.7% from 18 to 24, 24.2% from 25 to 44, 27.2% from 45 to 64, and 16.7% who were 65 years of age or older. The median age was 40 years. For every 100 females, there were 103.2 males. For every 100 females age 18 and over, there were 103.2 males.
The median income for a household in the county was $31,250, and the median income for a family was $36,250. Males had a median income of $27,500 versus $20,000 for females. The per capita income for the county was $14,945. About 11.2% of families and 14.2% of the population were below the poverty line, including 17.2% of those under age 18 and 11.2% of those age 65 or over.
Common Questions
What is Per Capita Income in Sterling County?
Per Capita income in Sterling County is $31,039.
What is the Median Family Income in Sterling County?
Median Family Income in Sterling County is $69,375.
What is the Median Household income in Sterling County?
Median Household Income in Sterling County is $63,558.
What is Income or Wage Gap in Sterling County?
Income or Wage Gap in Sterling County is 59.7%.
Women in Sterling County earn 40.3 cents for every dollar earned by a man.
What is Inequality or Gini Index in Sterling County?
Inequality or Gini Index in Sterling County is 0.37.
What is the Total Population of Sterling County?
Total Population of Sterling County is 1,392.
What is the Total Male Population of Sterling County?
Total Male Population of Sterling County is 737.
What is the Total Female Population of Sterling County?
Total Female Population of Sterling County is 655.
What is the Ratio of Males per 100 Females in Sterling County?
There are 112.52 Males per 100 Females in Sterling County.
What is the Ratio of Females per 100 Males in Sterling County?
There are 88.87 Females per 100 Males in Sterling County.
What is the Median Population Age in Sterling County?
Median Population Age in Sterling County is 32.1 Years.
What is the Average Family Size in Sterling County
Average Family Size in Sterling County is 3.8 People.
What is the Average Household Size in Sterling County
Average Household Size in Sterling County is 3.5 People.
How Large is the Labor Force in Sterling County?
There are 575 People in the Labor Forcein in Sterling County.
What is the Percentage of People in the Labor Force in Sterling County?
62.3% of People are in the Labor Force in Sterling County.