Stephens County, TX Map & Demographics
Stephens County Map
Stephens County Overview
$28,231
PER CAPITA INCOME
$61,879
AVG FAMILY INCOME
$44,712
AVG HOUSEHOLD INCOME
24.9%
WAGE / INCOME GAP [ % ]
75.1¢/ $1
WAGE / INCOME GAP [ $ ]
0.50
INEQUALITY / GINI INDEX
9,260
TOTAL POPULATION
4,997
MALE POPULATION
4,263
FEMALE POPULATION
117.22
MALES / 100 FEMALES
85.31
FEMALES / 100 MALES
40.9
MEDIAN AGE
3.2
AVG FAMILY SIZE
2.6
AVG HOUSEHOLD SIZE
4,221
LABOR FORCE [ PEOPLE ]
56.7%
PERCENT IN LABOR FORCE
8.6%
UNEMPLOYMENT RATE
Stephens County Area Codes
Income in Stephens County
Income Overview in Stephens County
Per Capita Income in Stephens County is $28,231, while median incomes of families and households are $61,879 and $44,712 respectively.
| Characteristic | Number | Measure |
| Per Capita Income | 9,260 | $28,231 |
| Median Family Income | 2,256 | $61,879 |
| Mean Family Income | 2,256 | $79,242 |
| Median Household Income | 3,405 | $44,712 |
| Mean Household Income | 3,405 | $68,486 |
| Income Deficit | 2,256 | $0 |
| Wage / Income Gap (%) | 9,260 | 24.94% |
| Wage / Income Gap ($) | 9,260 | 75.06¢ per $1 |
| Gini / Inequality Index | 9,260 | 0.50 |
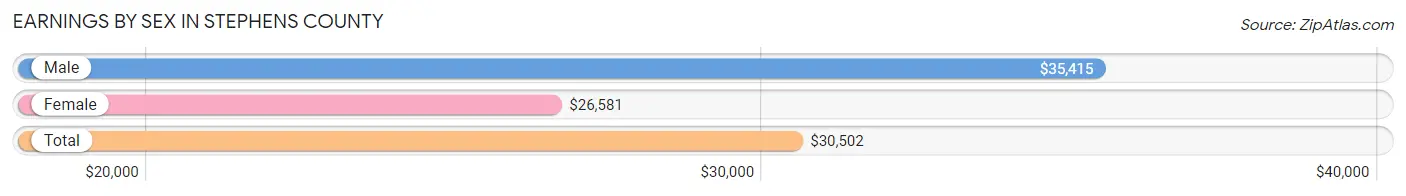
Earnings by Sex in Stephens County
Average Earnings in Stephens County are $30,502, $35,415 for men and $26,581 for women, a difference of 24.9%.
| Sex | Number | Average Earnings |
| Male | 2,679 (58.5%) | $35,415 |
| Female | 1,901 (41.5%) | $26,581 |
| Total | 4,580 (100.0%) | $30,502 |
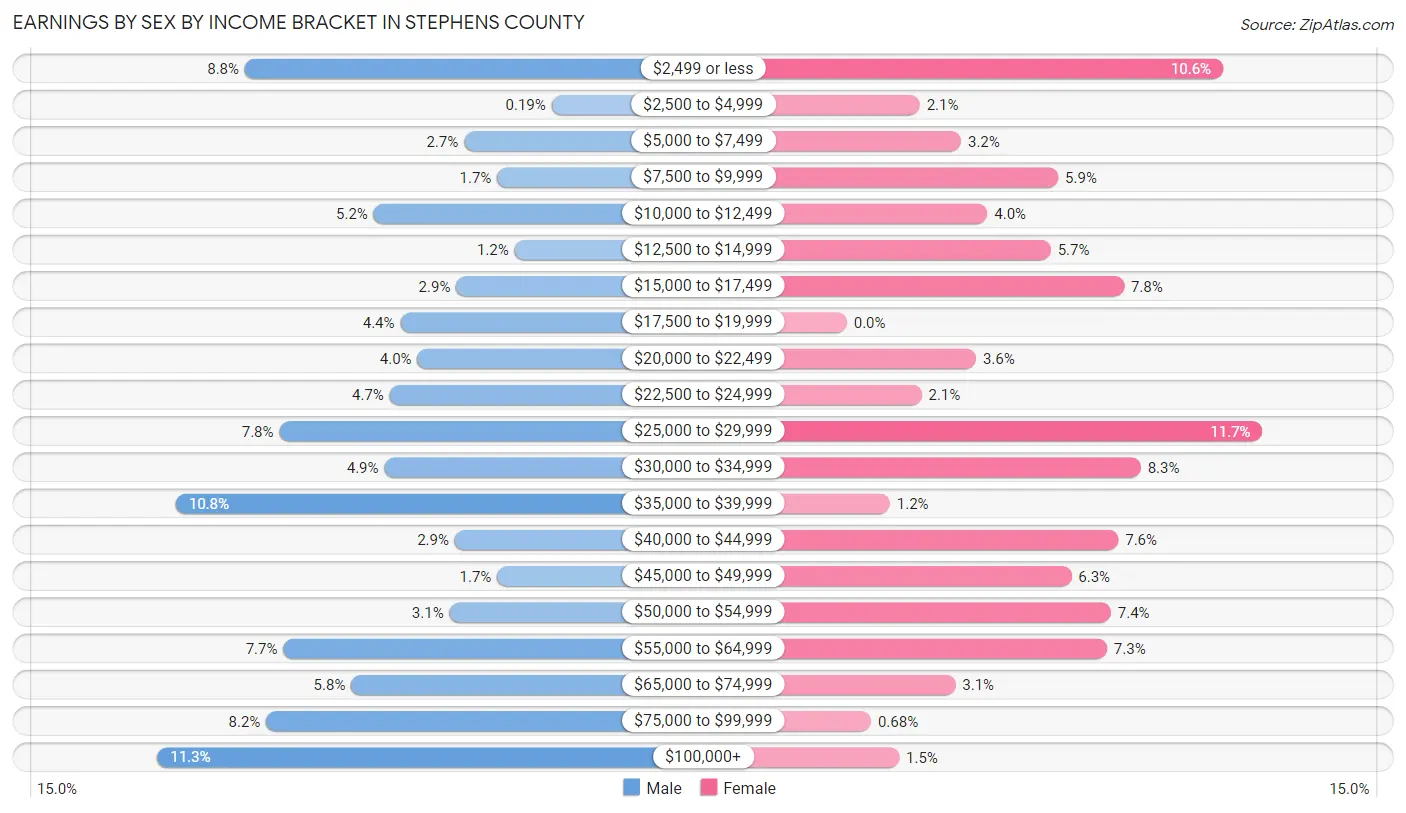
Earnings by Sex by Income Bracket in Stephens County
The most common earnings brackets in Stephens County are $100,000+ for men (302 | 11.3%) and $25,000 to $29,999 for women (222 | 11.7%).
| Income | Male | Female |
| $2,499 or less | 236 (8.8%) | 201 (10.6%) |
| $2,500 to $4,999 | 5 (0.2%) | 39 (2.1%) |
| $5,000 to $7,499 | 71 (2.6%) | 61 (3.2%) |
| $7,500 to $9,999 | 46 (1.7%) | 113 (5.9%) |
| $10,000 to $12,499 | 139 (5.2%) | 75 (4.0%) |
| $12,500 to $14,999 | 33 (1.2%) | 109 (5.7%) |
| $15,000 to $17,499 | 77 (2.9%) | 148 (7.8%) |
| $17,500 to $19,999 | 119 (4.4%) | 0 (0.0%) |
| $20,000 to $22,499 | 106 (4.0%) | 69 (3.6%) |
| $22,500 to $24,999 | 127 (4.7%) | 40 (2.1%) |
| $25,000 to $29,999 | 210 (7.8%) | 222 (11.7%) |
| $30,000 to $34,999 | 131 (4.9%) | 157 (8.3%) |
| $35,000 to $39,999 | 288 (10.7%) | 23 (1.2%) |
| $40,000 to $44,999 | 78 (2.9%) | 145 (7.6%) |
| $45,000 to $49,999 | 46 (1.7%) | 120 (6.3%) |
| $50,000 to $54,999 | 82 (3.1%) | 141 (7.4%) |
| $55,000 to $64,999 | 207 (7.7%) | 139 (7.3%) |
| $65,000 to $74,999 | 156 (5.8%) | 58 (3.0%) |
| $75,000 to $99,999 | 220 (8.2%) | 13 (0.7%) |
| $100,000+ | 302 (11.3%) | 28 (1.5%) |
| Total | 2,679 (100.0%) | 1,901 (100.0%) |
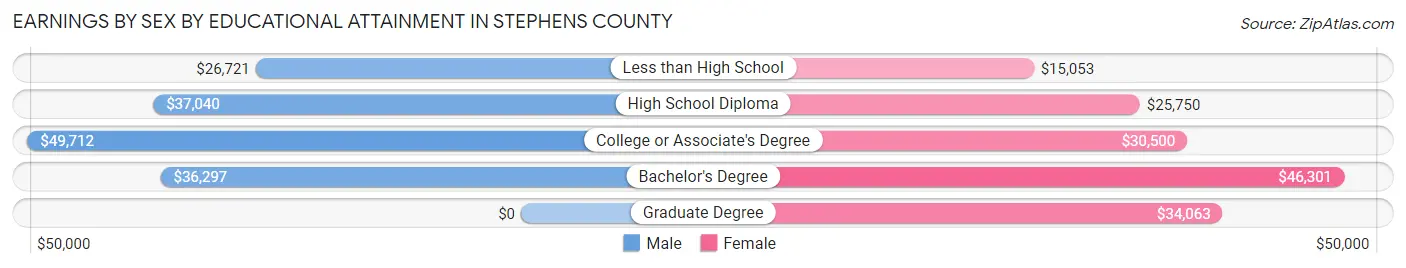
Earnings by Sex by Educational Attainment in Stephens County
Average earnings in Stephens County are $36,896 for men and $27,073 for women, a difference of 26.6%. Men with an educational attainment of college or associate's degree enjoy the highest average annual earnings of $49,712, while those with less than high school education earn the least with $26,721. Women with an educational attainment of bachelor's degree earn the most with the average annual earnings of $46,301, while those with less than high school education have the smallest earnings of $15,053.
| Educational Attainment | Male Income | Female Income |
| Less than High School | $26,721 | $15,053 |
| High School Diploma | $37,040 | $25,750 |
| College or Associate's Degree | $49,712 | $30,500 |
| Bachelor's Degree | $36,297 | $46,301 |
| Graduate Degree | - | - |
| Total | $36,896 | $27,073 |
Family Income in Stephens County
Family Income Brackets in Stephens County
According to the Stephens County family income data, there are 496 families falling into the $50,000 to $74,999 income range, which is the most common income bracket and makes up 22.0% of all families. Conversely, the $10,000 to $14,999 income bracket is the least frequent group with only 59 families (2.6%) belonging to this category.
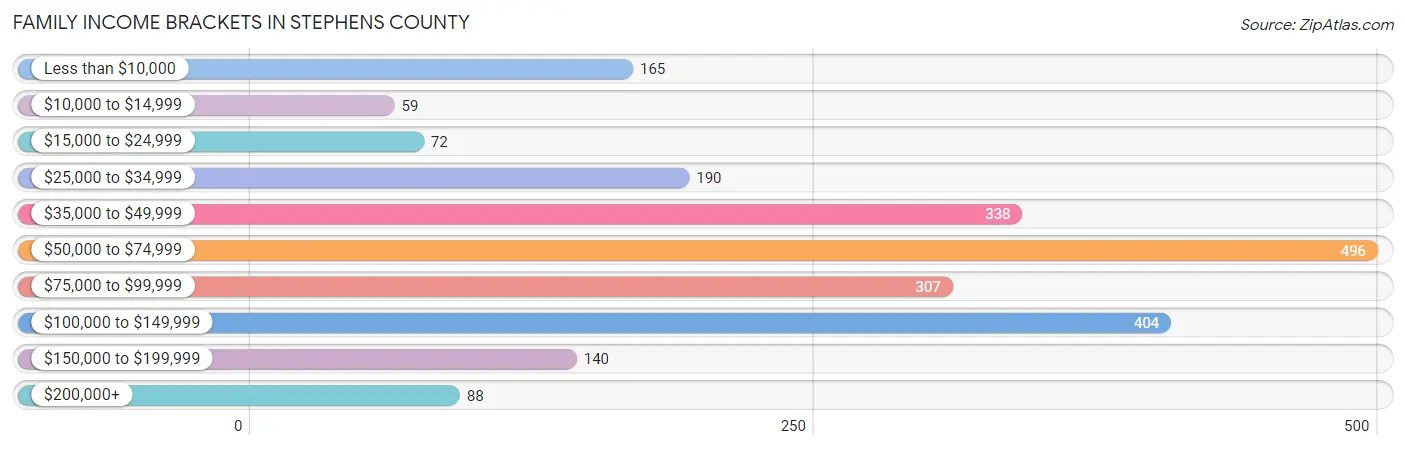
| Income Bracket | # Families | % Families |
| Less than $10,000 | 165 | 7.3% |
| $10,000 to $14,999 | 59 | 2.6% |
| $15,000 to $24,999 | 72 | 3.2% |
| $25,000 to $34,999 | 190 | 8.4% |
| $35,000 to $49,999 | 338 | 15.0% |
| $50,000 to $74,999 | 496 | 22.0% |
| $75,000 to $99,999 | 307 | 13.6% |
| $100,000 to $149,999 | 404 | 17.9% |
| $150,000 to $199,999 | 140 | 6.2% |
| $200,000+ | 88 | 3.9% |
Family Income by Famaliy Size in Stephens County
6-person families (35 | 1.5%) account for the highest median family income in Stephens County with $73,958 per family, while 2-person families (1,237 | 54.8%) have the highest median income of $30,670 per family member.
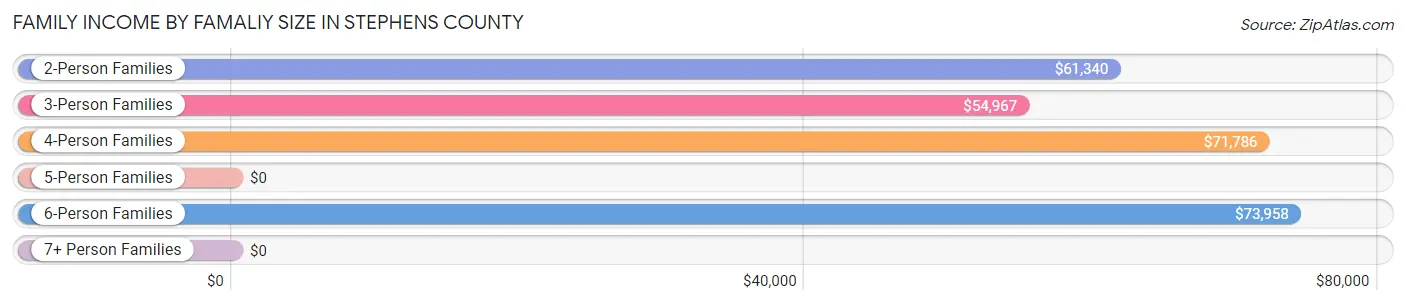
| Income Bracket | # Families | Median Income |
| 2-Person Families | 1,237 (54.8%) | $61,340 |
| 3-Person Families | 494 (21.9%) | $54,967 |
| 4-Person Families | 384 (17.0%) | $71,786 |
| 5-Person Families | 78 (3.5%) | $0 |
| 6-Person Families | 35 (1.5%) | $73,958 |
| 7+ Person Families | 28 (1.2%) | $0 |
| Total | 2,256 (100.0%) | $61,879 |
Family Income by Number of Earners in Stephens County
The median family income in Stephens County is $61,879, with families comprising 3+ earners (157) having the highest median family income of $140,893, while families with no earners (347) have the lowest median family income of $39,297, accounting for 7.0% and 15.4% of families, respectively.
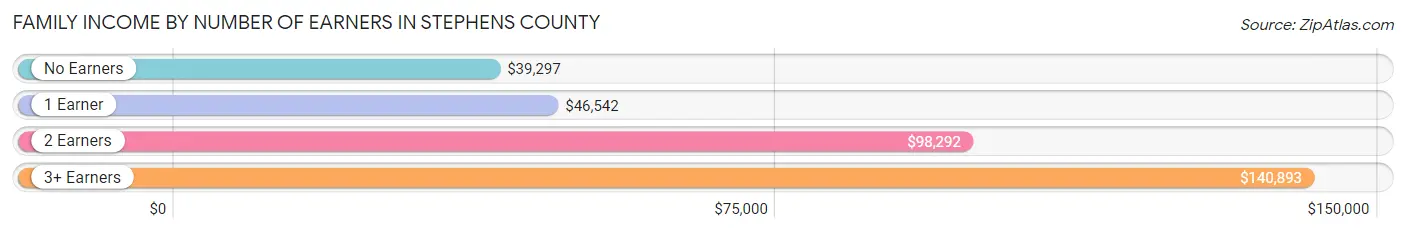
| Number of Earners | # Families | Median Income |
| No Earners | 347 (15.4%) | $39,297 |
| 1 Earner | 1,019 (45.2%) | $46,542 |
| 2 Earners | 733 (32.5%) | $98,292 |
| 3+ Earners | 157 (7.0%) | $140,893 |
| Total | 2,256 (100.0%) | $61,879 |
Household Income in Stephens County
Household Income Brackets in Stephens County
With 463 households falling in the category, the $35,000 to $49,999 income range is the most frequent in Stephens County, accounting for 13.6% of all households. In contrast, only 112 households (3.3%) fall into the $200,000+ income bracket, making it the least populous group.
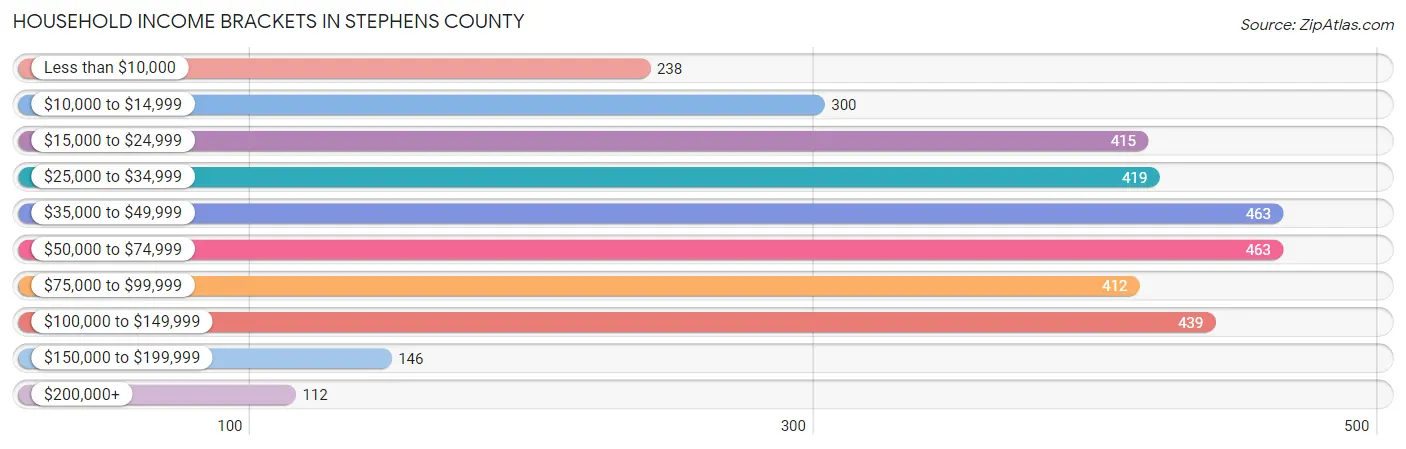
| Income Bracket | # Households | % Households |
| Less than $10,000 | 238 | 7.0% |
| $10,000 to $14,999 | 300 | 8.8% |
| $15,000 to $24,999 | 415 | 12.2% |
| $25,000 to $34,999 | 419 | 12.3% |
| $35,000 to $49,999 | 463 | 13.6% |
| $50,000 to $74,999 | 463 | 13.6% |
| $75,000 to $99,999 | 412 | 12.1% |
| $100,000 to $149,999 | 439 | 12.9% |
| $150,000 to $199,999 | 146 | 4.3% |
| $200,000+ | 112 | 3.3% |
Household Income by Householder Age in Stephens County
The median household income in Stephens County is $44,712, with the highest median household income of $81,786 found in the 45 to 64 years age bracket for the primary householder. A total of 910 households (26.7%) fall into this category. Meanwhile, the 15 to 24 years age bracket for the primary householder has the lowest median household income of $0, with 199 households (5.8%) in this group.
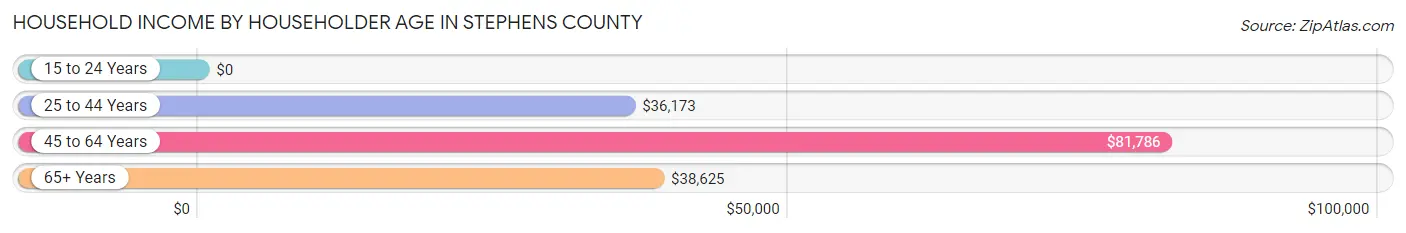
| Income Bracket | # Households | Median Income |
| 15 to 24 Years | 199 (5.8%) | $0 |
| 25 to 44 Years | 1,110 (32.6%) | $36,173 |
| 45 to 64 Years | 910 (26.7%) | $81,786 |
| 65+ Years | 1,186 (34.8%) | $38,625 |
| Total | 3,405 (100.0%) | $44,712 |
Poverty in Stephens County
Income Below Poverty by Sex and Age in Stephens County
With 11.4% poverty level for males and 22.4% for females among the residents of Stephens County, 16 and 17 year old males and 12 to 14 year old females are the most vulnerable to poverty, with 45 males (41.3%) and 99 females (76.1%) in their respective age groups living below the poverty level.
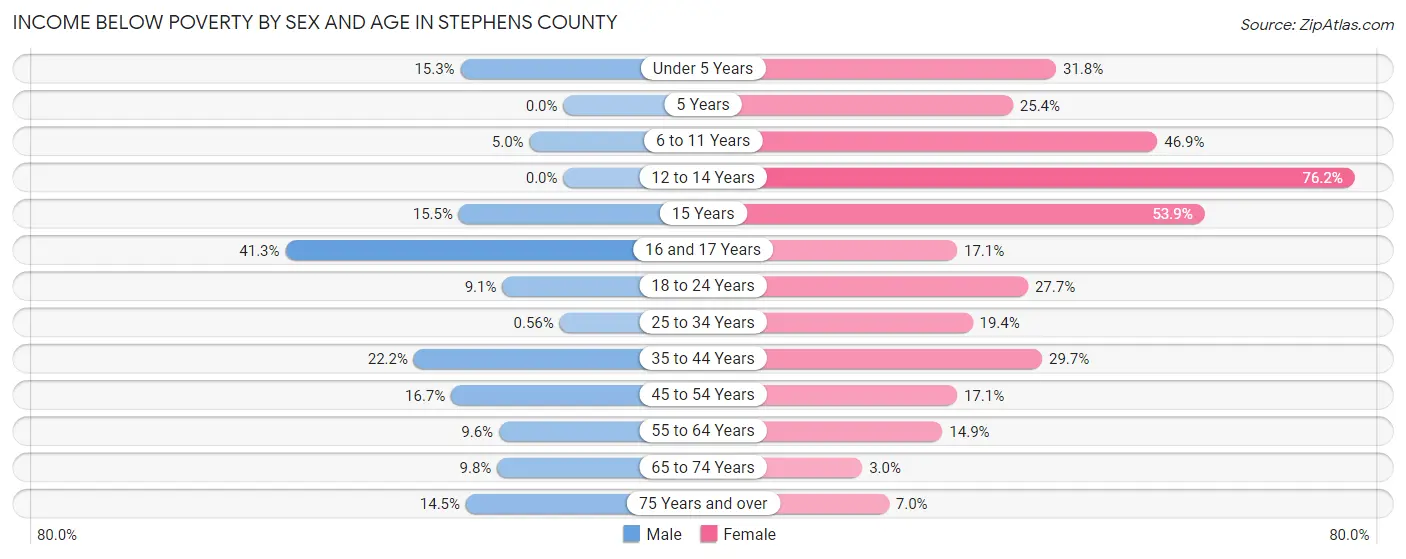
| Age Bracket | Male | Female |
| Under 5 Years | 44 (15.3%) | 77 (31.8%) |
| 5 Years | 0 (0.0%) | 16 (25.4%) |
| 6 to 11 Years | 14 (5.0%) | 171 (46.9%) |
| 12 to 14 Years | 0 (0.0%) | 99 (76.1%) |
| 15 Years | 16 (15.5%) | 7 (53.8%) |
| 16 and 17 Years | 45 (41.3%) | 19 (17.1%) |
| 18 to 24 Years | 48 (9.1%) | 86 (27.7%) |
| 25 to 34 Years | 3 (0.6%) | 85 (19.4%) |
| 35 to 44 Years | 145 (22.2%) | 174 (29.7%) |
| 45 to 54 Years | 58 (16.7%) | 69 (17.1%) |
| 55 to 64 Years | 57 (9.6%) | 94 (14.9%) |
| 65 to 74 Years | 52 (9.8%) | 15 (3.0%) |
| 75 Years and over | 43 (14.5%) | 30 (7.0%) |
| Total | 525 (11.4%) | 942 (22.4%) |
Income Above Poverty by Sex and Age in Stephens County
According to the poverty statistics in Stephens County, males aged 5 years and females aged 65 to 74 years are the age groups that are most secure financially, with 100.0% of males and 97.0% of females in these age groups living above the poverty line.
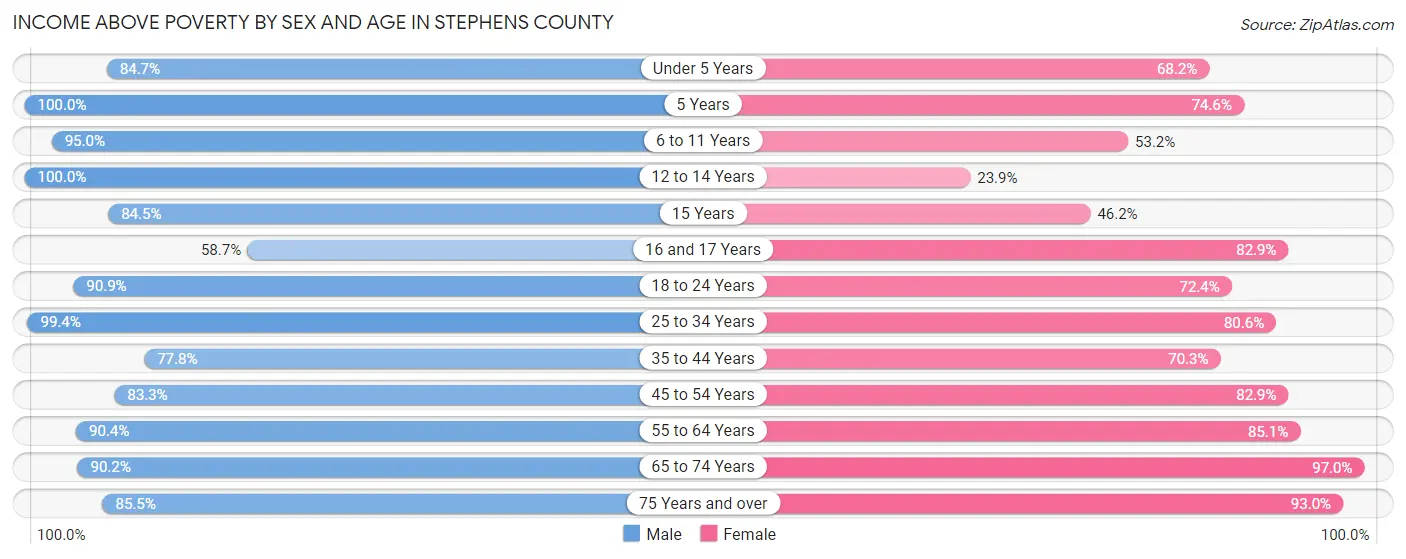
| Age Bracket | Male | Female |
| Under 5 Years | 244 (84.7%) | 165 (68.2%) |
| 5 Years | 143 (100.0%) | 47 (74.6%) |
| 6 to 11 Years | 264 (95.0%) | 194 (53.1%) |
| 12 to 14 Years | 183 (100.0%) | 31 (23.8%) |
| 15 Years | 87 (84.5%) | 6 (46.2%) |
| 16 and 17 Years | 64 (58.7%) | 92 (82.9%) |
| 18 to 24 Years | 481 (90.9%) | 225 (72.4%) |
| 25 to 34 Years | 533 (99.4%) | 353 (80.6%) |
| 35 to 44 Years | 508 (77.8%) | 411 (70.3%) |
| 45 to 54 Years | 290 (83.3%) | 334 (82.9%) |
| 55 to 64 Years | 539 (90.4%) | 535 (85.1%) |
| 65 to 74 Years | 477 (90.2%) | 480 (97.0%) |
| 75 Years and over | 254 (85.5%) | 399 (93.0%) |
| Total | 4,067 (88.6%) | 3,272 (77.6%) |
Income Below Poverty Among Married-Couple Families in Stephens County
The poverty statistics for married-couple families in Stephens County show that 3.6% or 60 of the total 1,664 families live below the poverty line. Families with 1 or 2 children have the highest poverty rate of 4.2%, comprising of 21 families. On the other hand, families with 3 or 4 children have the lowest poverty rate of 0.0%, which includes 0 families.
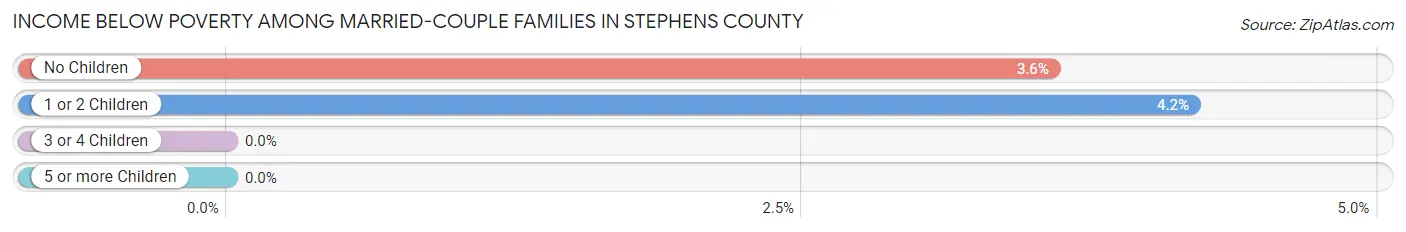
| Children | Above Poverty | Below Poverty |
| No Children | 1,050 (96.4%) | 39 (3.6%) |
| 1 or 2 Children | 480 (95.8%) | 21 (4.2%) |
| 3 or 4 Children | 74 (100.0%) | 0 (0.0%) |
| 5 or more Children | 0 (0.0%) | 0 (0.0%) |
| Total | 1,604 (96.4%) | 60 (3.6%) |
Income Below Poverty Among Single-Parent Households in Stephens County
According to the poverty data in Stephens County, 4.4% or 6 single-father households and 43.2% or 197 single-mother households are living below the poverty line. Among single-father households, those with no children have the highest poverty rate, with 6 households (7.1%) experiencing poverty. Likewise, among single-mother households, those with 3 or 4 children have the highest poverty rate, with 63 households (100.0%) falling below the poverty line.
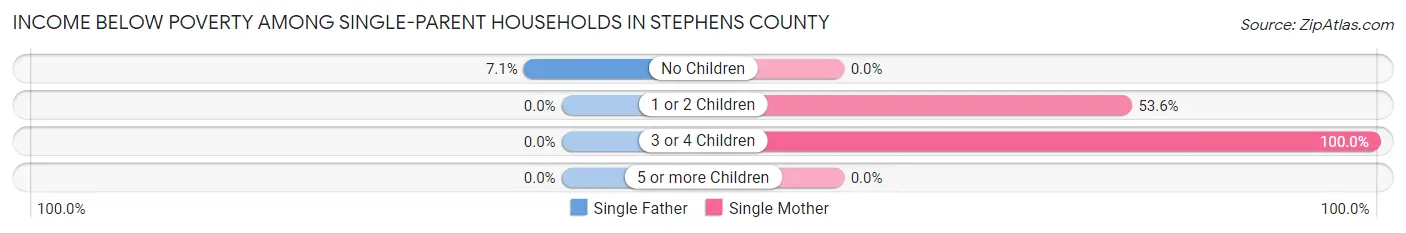
| Children | Single Father | Single Mother |
| No Children | 6 (7.1%) | 0 (0.0%) |
| 1 or 2 Children | 0 (0.0%) | 134 (53.6%) |
| 3 or 4 Children | 0 (0.0%) | 63 (100.0%) |
| 5 or more Children | 0 (0.0%) | 0 (0.0%) |
| Total | 6 (4.4%) | 197 (43.2%) |
Income Below Poverty Among Married-Couple vs Single-Parent Households in Stephens County
The poverty data for Stephens County shows that 60 of the married-couple family households (3.6%) and 203 of the single-parent households (34.3%) are living below the poverty level. Within the married-couple family households, those with 1 or 2 children have the highest poverty rate, with 21 households (4.2%) falling below the poverty line. Among the single-parent households, those with 3 or 4 children have the highest poverty rate, with 63 household (100.0%) living below poverty.
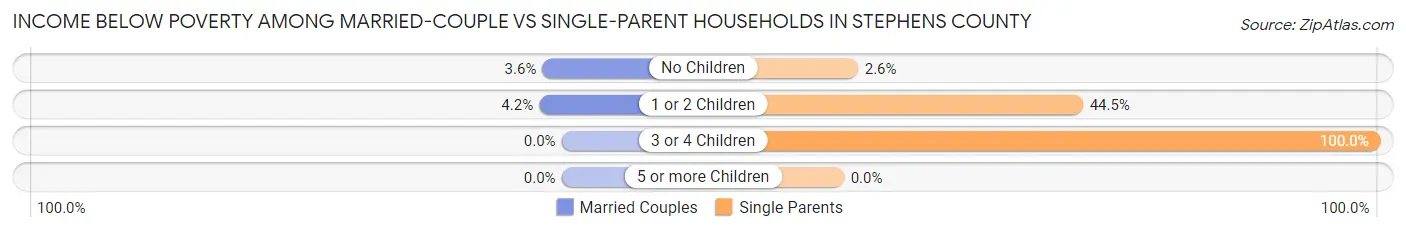
| Children | Married-Couple Families | Single-Parent Households |
| No Children | 39 (3.6%) | 6 (2.6%) |
| 1 or 2 Children | 21 (4.2%) | 134 (44.5%) |
| 3 or 4 Children | 0 (0.0%) | 63 (100.0%) |
| 5 or more Children | 0 (0.0%) | 0 (0.0%) |
| Total | 60 (3.6%) | 203 (34.3%) |
Race in Stephens County
The most populous races in Stephens County are White / Caucasian (7,656 | 82.7%), Hispanic or Latino (2,325 | 25.1%), and Two or more Races (821 | 8.9%).
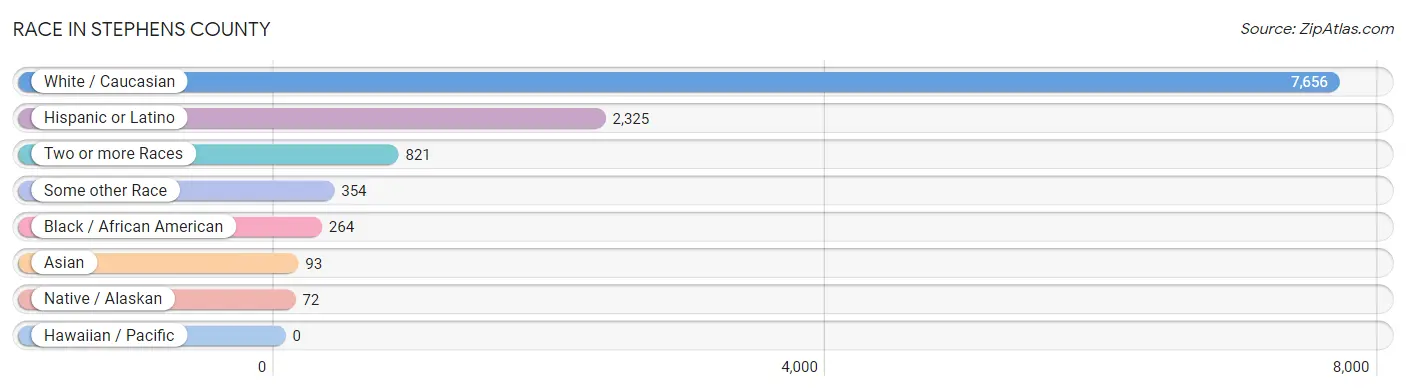
| Race | # Population | % Population |
| Asian | 93 | 1.0% |
| Black / African American | 264 | 2.9% |
| Hawaiian / Pacific | 0 | 0.0% |
| Hispanic or Latino | 2,325 | 25.1% |
| Native / Alaskan | 72 | 0.8% |
| White / Caucasian | 7,656 | 82.7% |
| Two or more Races | 821 | 8.9% |
| Some other Race | 354 | 3.8% |
| Total | 9,260 | 100.0% |
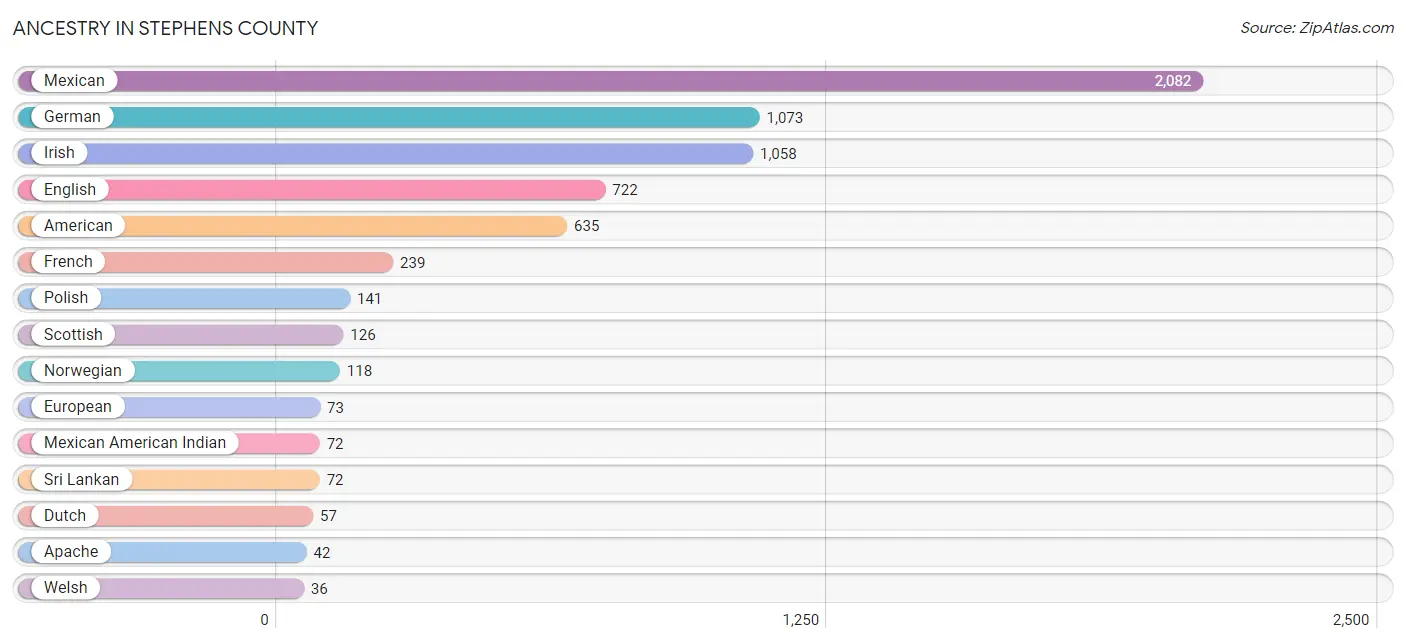
Ancestry in Stephens County
The most populous ancestries reported in Stephens County are Mexican (2,082 | 22.5%), German (1,073 | 11.6%), Irish (1,058 | 11.4%), English (722 | 7.8%), and American (635 | 6.9%), together accounting for 60.2% of all Stephens County residents.
| Ancestry | # Population | % Population |
| Albanian | 8 | 0.1% |
| American | 635 | 6.9% |
| Apache | 42 | 0.4% |
| Austrian | 11 | 0.1% |
| Blackfeet | 6 | 0.1% |
| Brazilian | 14 | 0.2% |
| British | 14 | 0.2% |
| Central American | 8 | 0.1% |
| Costa Rican | 7 | 0.1% |
| Czech | 12 | 0.1% |
| Czechoslovakian | 1 | 0.0% |
| Dutch | 57 | 0.6% |
| English | 722 | 7.8% |
| European | 73 | 0.8% |
| French | 239 | 2.6% |
| French Canadian | 9 | 0.1% |
| German | 1,073 | 11.6% |
| Guatemalan | 1 | 0.0% |
| Hungarian | 18 | 0.2% |
| Icelander | 24 | 0.3% |
| Irish | 1,058 | 11.4% |
| Italian | 20 | 0.2% |
| Japanese | 12 | 0.1% |
| Mexican | 2,082 | 22.5% |
| Mexican American Indian | 72 | 0.8% |
| Northern European | 9 | 0.1% |
| Norwegian | 118 | 1.3% |
| Polish | 141 | 1.5% |
| Portuguese | 6 | 0.1% |
| Scandinavian | 18 | 0.2% |
| Scotch-Irish | 11 | 0.1% |
| Scottish | 126 | 1.4% |
| Spaniard | 15 | 0.2% |
| Sri Lankan | 72 | 0.8% |
| Subsaharan African | 7 | 0.1% |
| Swedish | 17 | 0.2% |
| Thai | 9 | 0.1% |
| Welsh | 36 | 0.4% |
| Yugoslavian | 7 | 0.1% | View All 39 Rows |
Immigrants in Stephens County
The most numerous immigrant groups reported in Stephens County came from Latin America (705 | 7.6%), Central America (691 | 7.5%), Mexico (684 | 7.4%), Europe (57 | 0.6%), and Northern Europe (44 | 0.5%), together accounting for 23.6% of all Stephens County residents.
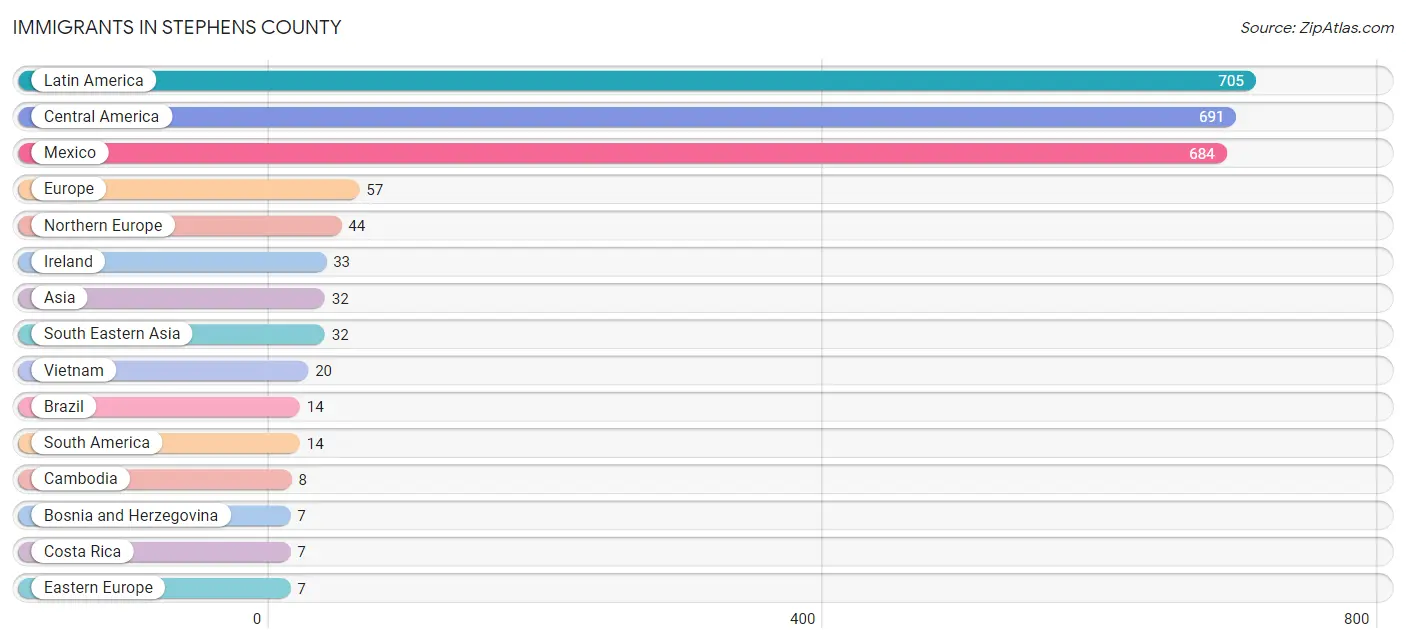
| Immigration Origin | # Population | % Population |
| Asia | 32 | 0.4% |
| Bosnia and Herzegovina | 7 | 0.1% |
| Brazil | 14 | 0.2% |
| Cambodia | 8 | 0.1% |
| Central America | 691 | 7.5% |
| Costa Rica | 7 | 0.1% |
| Eastern Europe | 7 | 0.1% |
| Europe | 57 | 0.6% |
| Ireland | 33 | 0.4% |
| Latin America | 705 | 7.6% |
| Mexico | 684 | 7.4% |
| Northern Europe | 44 | 0.5% |
| Philippines | 4 | 0.0% |
| Portugal | 6 | 0.1% |
| South America | 14 | 0.2% |
| South Eastern Asia | 32 | 0.4% |
| Southern Europe | 6 | 0.1% |
| Vietnam | 20 | 0.2% | View All 18 Rows |
Sex and Age in Stephens County
Sex and Age in Stephens County
The most populous age groups in Stephens County are 40 to 44 Years (480 | 9.6%) for men and 60 to 64 Years (385 | 9.0%) for women.
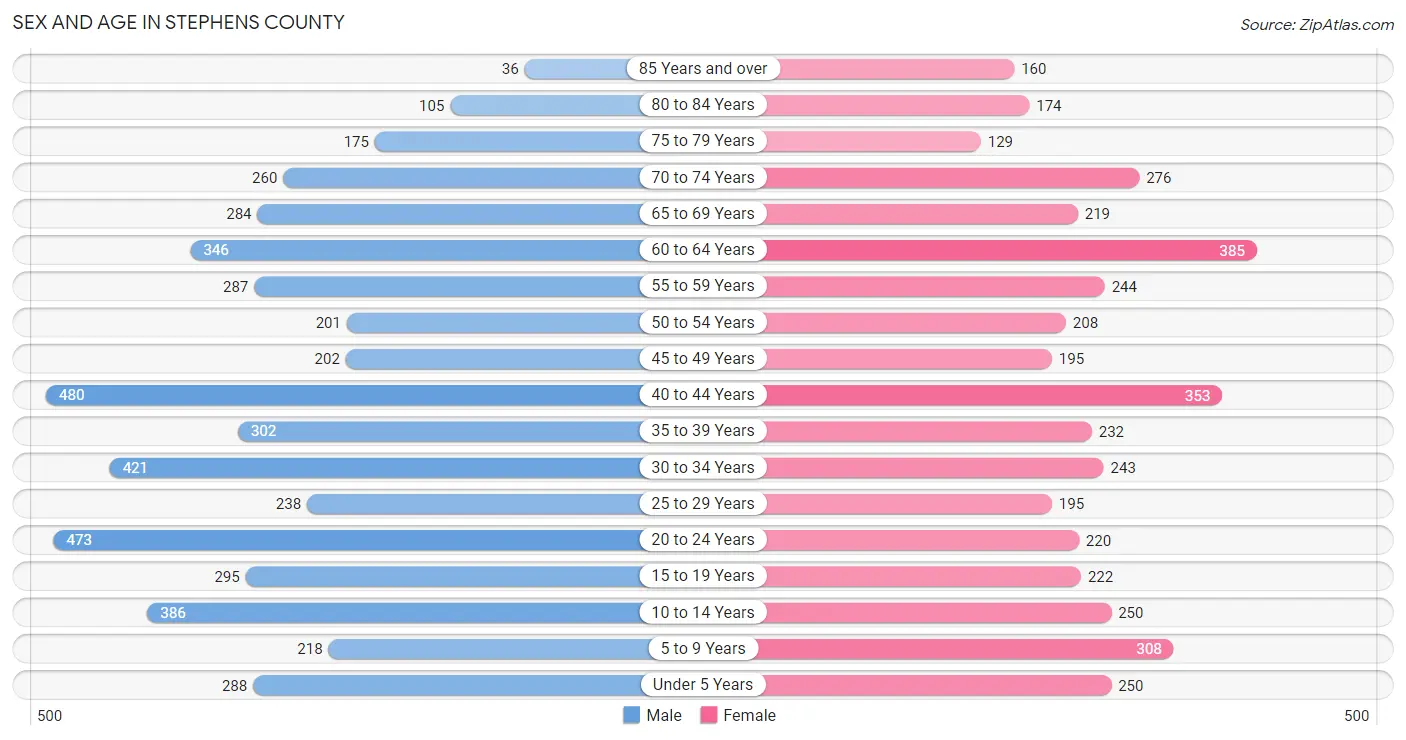
| Age Bracket | Male | Female |
| Under 5 Years | 288 (5.8%) | 250 (5.9%) |
| 5 to 9 Years | 218 (4.4%) | 308 (7.2%) |
| 10 to 14 Years | 386 (7.7%) | 250 (5.9%) |
| 15 to 19 Years | 295 (5.9%) | 222 (5.2%) |
| 20 to 24 Years | 473 (9.5%) | 220 (5.2%) |
| 25 to 29 Years | 238 (4.8%) | 195 (4.6%) |
| 30 to 34 Years | 421 (8.4%) | 243 (5.7%) |
| 35 to 39 Years | 302 (6.0%) | 232 (5.4%) |
| 40 to 44 Years | 480 (9.6%) | 353 (8.3%) |
| 45 to 49 Years | 202 (4.0%) | 195 (4.6%) |
| 50 to 54 Years | 201 (4.0%) | 208 (4.9%) |
| 55 to 59 Years | 287 (5.7%) | 244 (5.7%) |
| 60 to 64 Years | 346 (6.9%) | 385 (9.0%) |
| 65 to 69 Years | 284 (5.7%) | 219 (5.1%) |
| 70 to 74 Years | 260 (5.2%) | 276 (6.5%) |
| 75 to 79 Years | 175 (3.5%) | 129 (3.0%) |
| 80 to 84 Years | 105 (2.1%) | 174 (4.1%) |
| 85 Years and over | 36 (0.7%) | 160 (3.7%) |
| Total | 4,997 (100.0%) | 4,263 (100.0%) |
Families and Households in Stephens County
Median Family Size in Stephens County
The median family size in Stephens County is 3.19 persons per family, with single male/father families (136 | 6.0%) accounting for the largest median family size of 3.51 persons per family. On the other hand, married-couple families (1,664 | 73.8%) represent the smallest median family size with 3.08 persons per family.
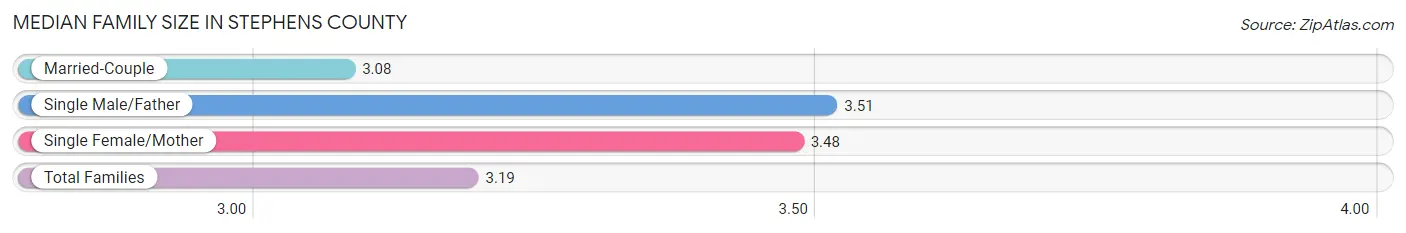
| Family Type | # Families | Family Size |
| Married-Couple | 1,664 (73.8%) | 3.08 |
| Single Male/Father | 136 (6.0%) | 3.51 |
| Single Female/Mother | 456 (20.2%) | 3.48 |
| Total Families | 2,256 (100.0%) | 3.19 |
Median Household Size in Stephens County
The median household size in Stephens County is 2.59 persons per household, with single female/mother households (456 | 13.4%) accounting for the largest median household size of 4.04 persons per household. non-family households (1,149 | 33.7%) represent the smallest median household size with 1.16 persons per household.
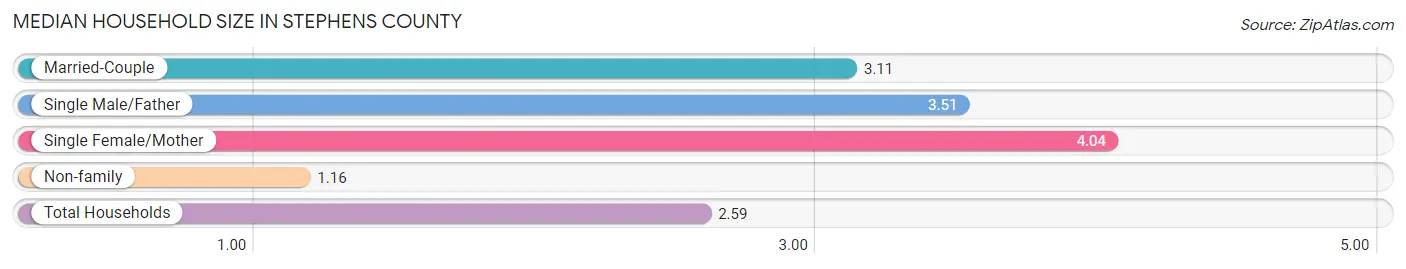
| Household Type | # Households | Household Size |
| Married-Couple | 1,664 (48.9%) | 3.11 |
| Single Male/Father | 136 (4.0%) | 3.51 |
| Single Female/Mother | 456 (13.4%) | 4.04 |
| Non-family | 1,149 (33.7%) | 1.16 |
| Total Households | 3,405 (100.0%) | 2.59 |
Household Size by Marriage Status in Stephens County
Out of a total of 3,405 households in Stephens County, 2,256 (66.3%) are family households, while 1,149 (33.7%) are nonfamily households. The most numerous type of family households are 2-person households, comprising 1,161, and the most common type of nonfamily households are 1-person households, comprising 1,044.
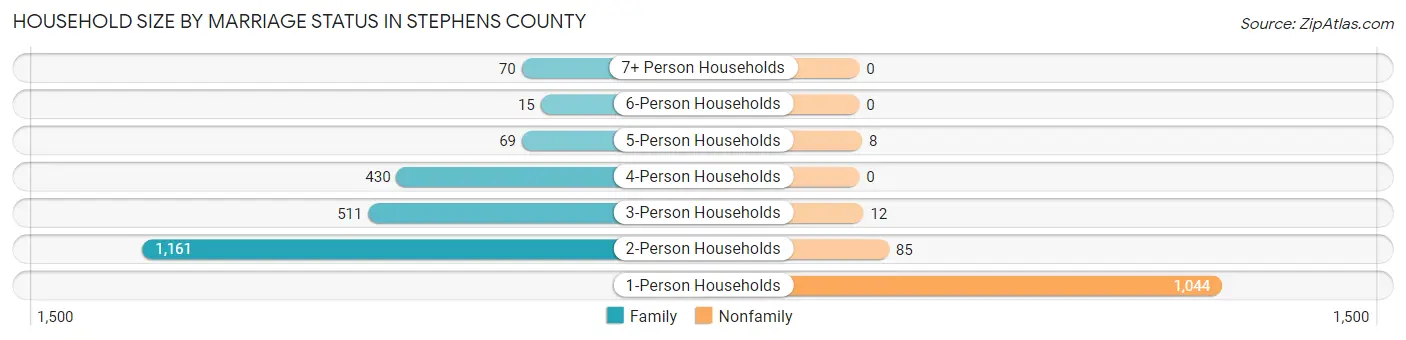
| Household Size | Family Households | Nonfamily Households |
| 1-Person Households | - | 1,044 (30.7%) |
| 2-Person Households | 1,161 (34.1%) | 85 (2.5%) |
| 3-Person Households | 511 (15.0%) | 12 (0.4%) |
| 4-Person Households | 430 (12.6%) | 0 (0.0%) |
| 5-Person Households | 69 (2.0%) | 8 (0.2%) |
| 6-Person Households | 15 (0.4%) | 0 (0.0%) |
| 7+ Person Households | 70 (2.1%) | 0 (0.0%) |
| Total | 2,256 (66.3%) | 1,149 (33.7%) |
Female Fertility in Stephens County
Fertility by Age in Stephens County
Average fertility rate in Stephens County is 46.0 births per 1,000 women. Women in the age bracket of 35 to 50 years have the highest fertility rate with 56.0 births per 1,000 women. Women in the age bracket of 35 to 50 years acount for 58.4% of all women with births.
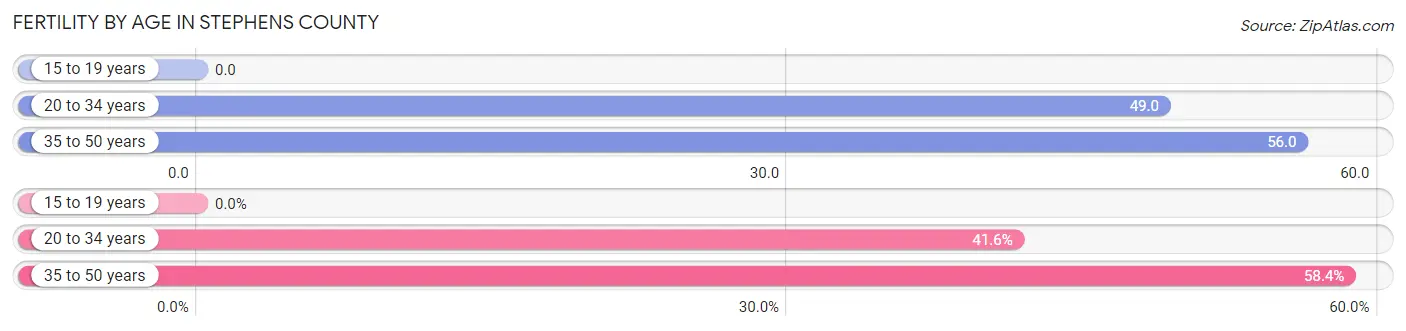
| Age Bracket | Women with Births | Births / 1,000 Women |
| 15 to 19 years | 0 (0.0%) | 0.0 |
| 20 to 34 years | 32 (41.6%) | 49.0 |
| 35 to 50 years | 45 (58.4%) | 56.0 |
| Total | 77 (100.0%) | 46.0 |
Fertility by Age by Marriage Status in Stephens County
72.7% of women with births (77) in Stephens County are married. The highest percentage of unmarried women with births falls into 35 to 50 years age bracket with 46.7% of them unmarried at the time of birth, while the lowest percentage of unmarried women with births belong to 20 to 34 years age bracket with 0.0% of them unmarried.
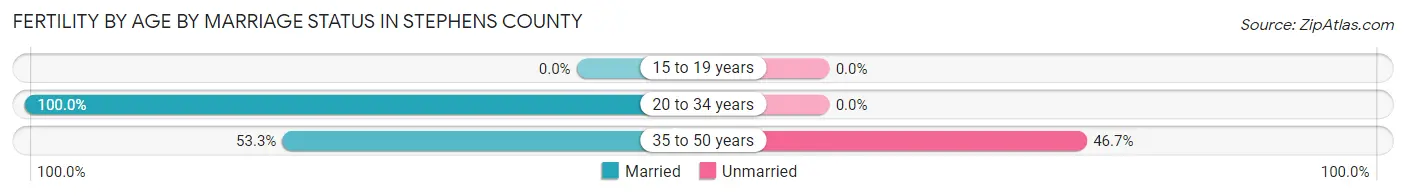
| Age Bracket | Married | Unmarried |
| 15 to 19 years | 0 (0.0%) | 0 (0.0%) |
| 20 to 34 years | 32 (100.0%) | 0 (0.0%) |
| 35 to 50 years | 24 (53.3%) | 21 (46.7%) |
| Total | 56 (72.7%) | 21 (27.3%) |
Fertility by Education in Stephens County
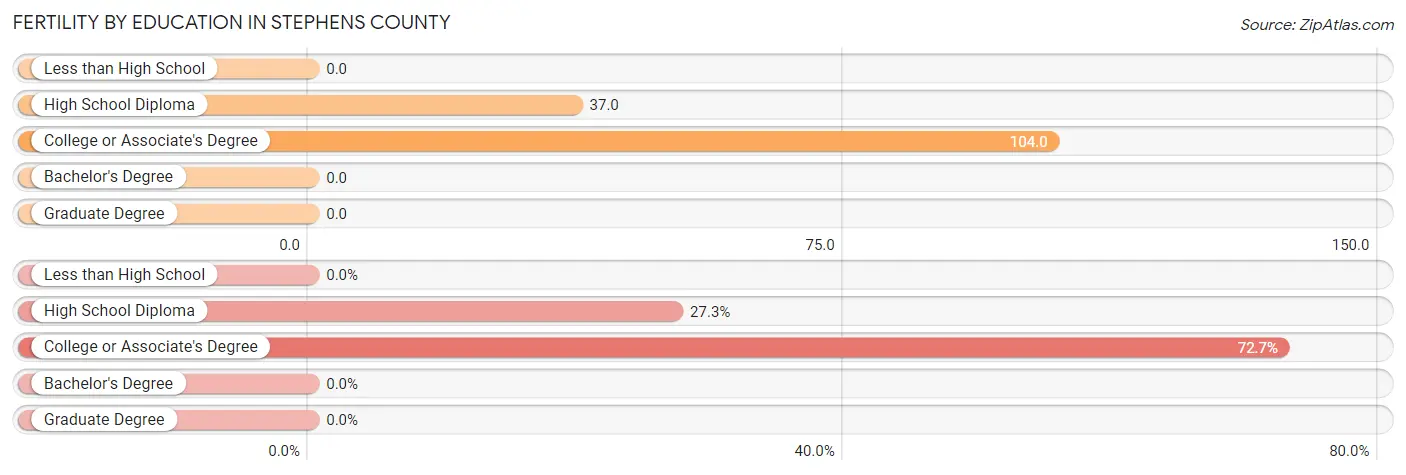
| Educational Attainment | Women with Births | Births / 1,000 Women |
| Less than High School | 0 (0.0%) | 0.0 |
| High School Diploma | 21 (27.3%) | 37.0 |
| College or Associate's Degree | 56 (72.7%) | 104.0 |
| Bachelor's Degree | 0 (0.0%) | 0.0 |
| Graduate Degree | 0 (0.0%) | 0.0 |
| Total | 77 (100.0%) | 46.0 |
Fertility by Education by Marriage Status in Stephens County
27.3% of women with births in Stephens County are unmarried. Women with the educational attainment of college or associate's degree are most likely to be married with 100.0% of them married at childbirth, while women with the educational attainment of high school diploma are least likely to be married with 100.0% of them unmarried at childbirth.
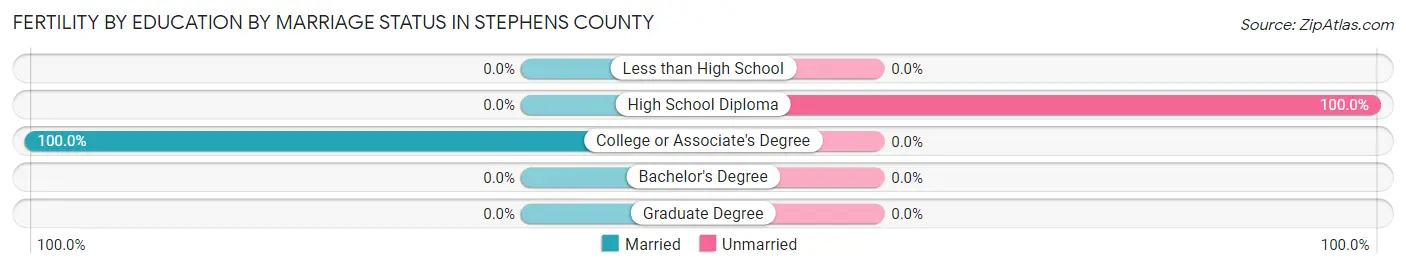
| Educational Attainment | Married | Unmarried |
| Less than High School | 0 (0.0%) | 0 (0.0%) |
| High School Diploma | 0 (0.0%) | 21 (100.0%) |
| College or Associate's Degree | 56 (100.0%) | 0 (0.0%) |
| Bachelor's Degree | 0 (0.0%) | 0 (0.0%) |
| Graduate Degree | 0 (0.0%) | 0 (0.0%) |
| Total | 56 (72.7%) | 21 (27.3%) |
Employment Characteristics in Stephens County
Employment by Class of Employer in Stephens County
Among the 3,815 employed individuals in Stephens County, private company employees (2,285 | 59.9%), self-employed (not incorporated) (529 | 13.9%), and local government employees (382 | 10.0%) make up the most common classes of employment.
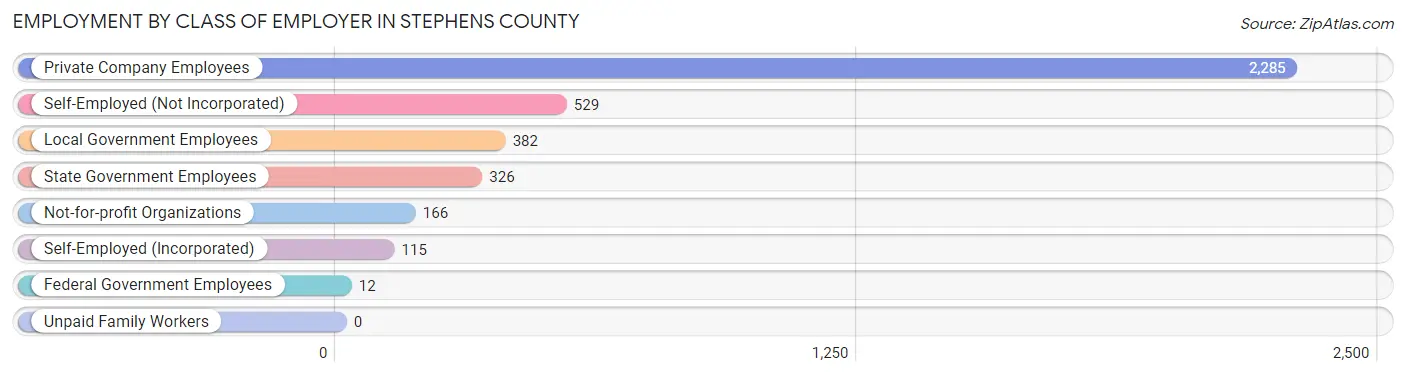
| Employer Class | # Employees | % Employees |
| Private Company Employees | 2,285 | 59.9% |
| Self-Employed (Incorporated) | 115 | 3.0% |
| Self-Employed (Not Incorporated) | 529 | 13.9% |
| Not-for-profit Organizations | 166 | 4.3% |
| Local Government Employees | 382 | 10.0% |
| State Government Employees | 326 | 8.6% |
| Federal Government Employees | 12 | 0.3% |
| Unpaid Family Workers | 0 | 0.0% |
| Total | 3,815 | 100.0% |
Employment Status by Age in Stephens County
According to the labor force statistics for Stephens County, out of the total population over 16 years of age (7,444), 56.7% or 4,221 individuals are in the labor force, with 8.6% or 363 of them unemployed. The age group with the highest labor force participation rate is 25 to 29 years, with 78.1% or 338 individuals in the labor force. Within the labor force, the 16 to 19 years age range has the highest percentage of unemployed individuals, with 27.1% or 29 of them being unemployed.
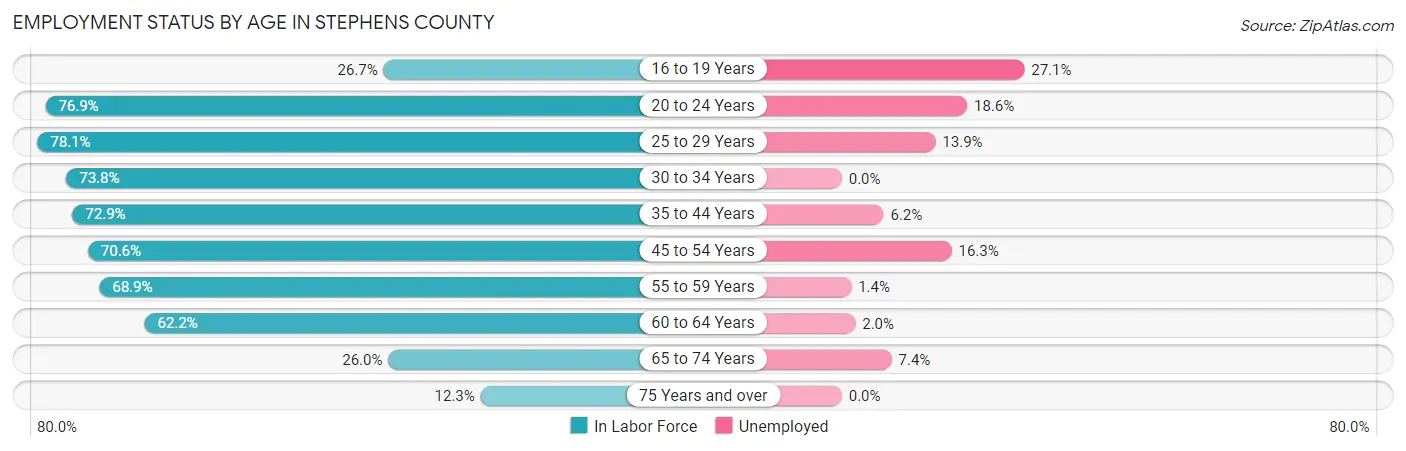
| Age Bracket | In Labor Force | Unemployed |
| 16 to 19 Years | 107 (26.7%) | 29 (27.1%) |
| 20 to 24 Years | 533 (76.9%) | 99 (18.6%) |
| 25 to 29 Years | 338 (78.1%) | 47 (13.9%) |
| 30 to 34 Years | 490 (73.8%) | 0 (0.0%) |
| 35 to 44 Years | 997 (72.9%) | 62 (6.2%) |
| 45 to 54 Years | 569 (70.6%) | 93 (16.3%) |
| 55 to 59 Years | 366 (68.9%) | 5 (1.4%) |
| 60 to 64 Years | 455 (62.2%) | 9 (2.0%) |
| 65 to 74 Years | 270 (26.0%) | 20 (7.4%) |
| 75 Years and over | 96 (12.3%) | 0 (0.0%) |
| Total | 4,221 (56.7%) | 363 (8.6%) |
Employment Status by Educational Attainment in Stephens County
According to labor force statistics for Stephens County, 70.9% of individuals (3,213) out of the total population between 25 and 64 years of age (4,532) are in the labor force, with 6.7% or 215 of them being unemployed. The group with the highest labor force participation rate are those with the educational attainment of bachelor's degree or higher, with 87.1% or 725 individuals in the labor force. Within the labor force, individuals with bachelor's degree or higher education have the highest percentage of unemployment, with 13.2% or 96 of them being unemployed.
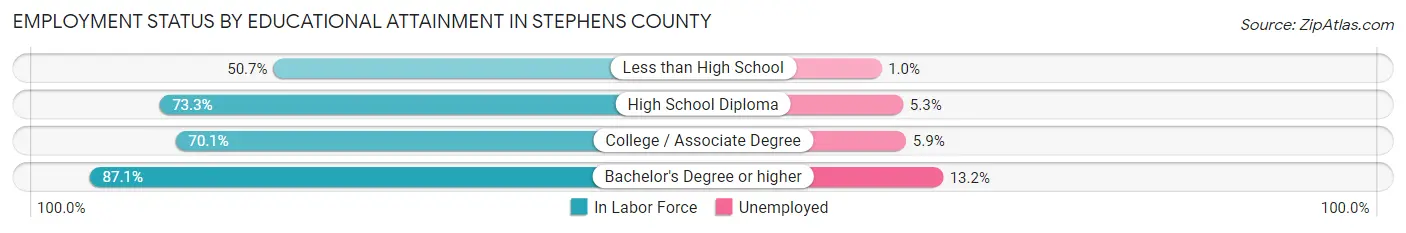
| Educational Attainment | In Labor Force | Unemployed |
| Less than High School | 402 (50.7%) | 8 (1.0%) |
| High School Diploma | 1,168 (73.3%) | 84 (5.3%) |
| College / Associate Degree | 920 (70.1%) | 77 (5.9%) |
| Bachelor's Degree or higher | 725 (87.1%) | 110 (13.2%) |
| Total | 3,213 (70.9%) | 304 (6.7%) |
Employment Occupations by Sex in Stephens County
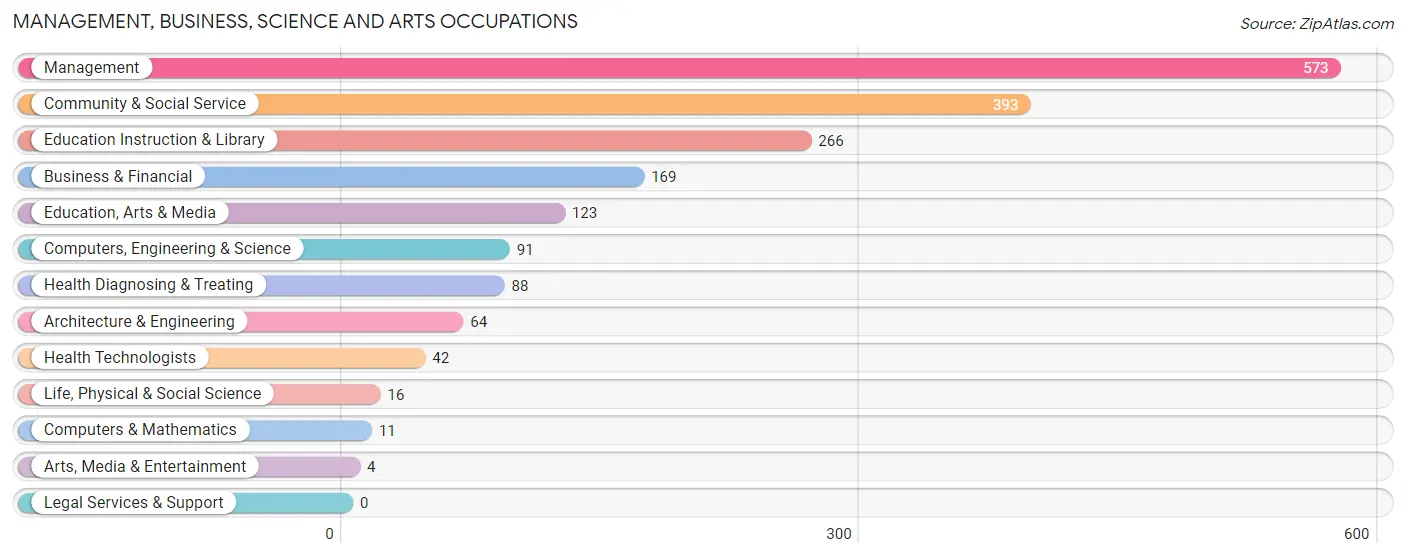
Management, Business, Science and Arts Occupations
The most common Management, Business, Science and Arts occupations in Stephens County are Management (573 | 14.9%), Community & Social Service (393 | 10.2%), Education Instruction & Library (266 | 6.9%), Business & Financial (169 | 4.4%), and Education, Arts & Media (123 | 3.2%).
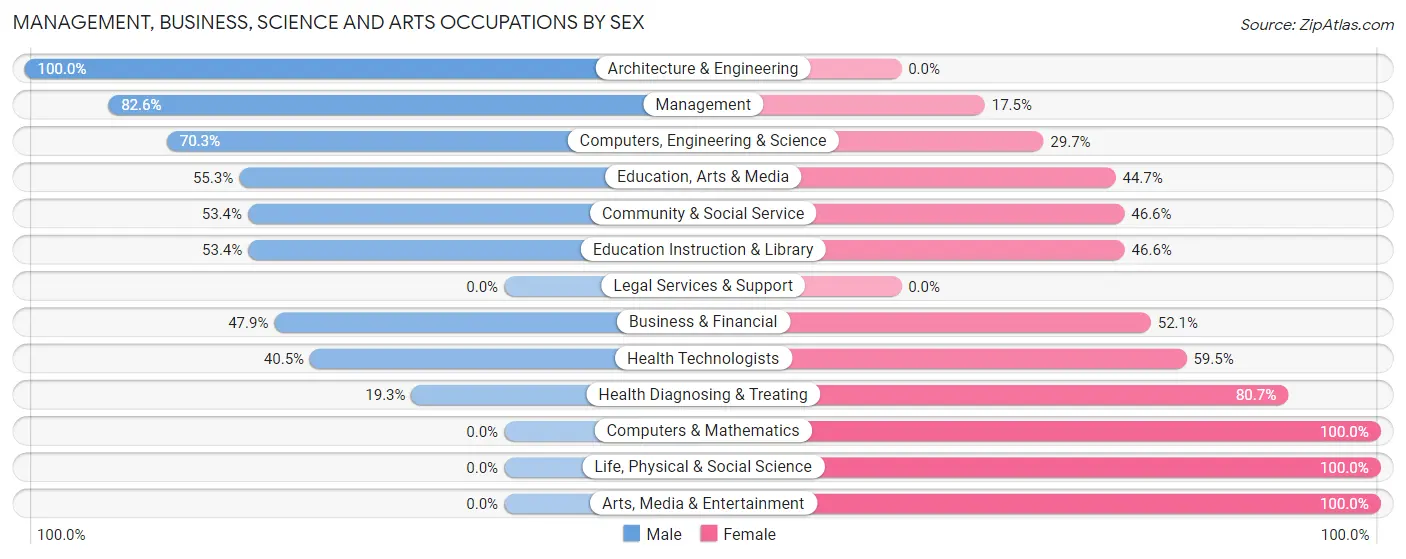
Management, Business, Science and Arts Occupations by Sex
Within the Management, Business, Science and Arts occupations in Stephens County, the most male-oriented occupations are Architecture & Engineering (100.0%), Management (82.6%), and Computers, Engineering & Science (70.3%), while the most female-oriented occupations are Computers & Mathematics (100.0%), Life, Physical & Social Science (100.0%), and Arts, Media & Entertainment (100.0%).
| Occupation | Male | Female |
| Management | 473 (82.6%) | 100 (17.4%) |
| Business & Financial | 81 (47.9%) | 88 (52.1%) |
| Computers, Engineering & Science | 64 (70.3%) | 27 (29.7%) |
| Computers & Mathematics | 0 (0.0%) | 11 (100.0%) |
| Architecture & Engineering | 64 (100.0%) | 0 (0.0%) |
| Life, Physical & Social Science | 0 (0.0%) | 16 (100.0%) |
| Community & Social Service | 210 (53.4%) | 183 (46.6%) |
| Education, Arts & Media | 68 (55.3%) | 55 (44.7%) |
| Legal Services & Support | 0 (0.0%) | 0 (0.0%) |
| Education Instruction & Library | 142 (53.4%) | 124 (46.6%) |
| Arts, Media & Entertainment | 0 (0.0%) | 4 (100.0%) |
| Health Diagnosing & Treating | 17 (19.3%) | 71 (80.7%) |
| Health Technologists | 17 (40.5%) | 25 (59.5%) |
| Total (Category) | 845 (64.3%) | 469 (35.7%) |
| Total (Overall) | 2,234 (57.9%) | 1,623 (42.1%) |
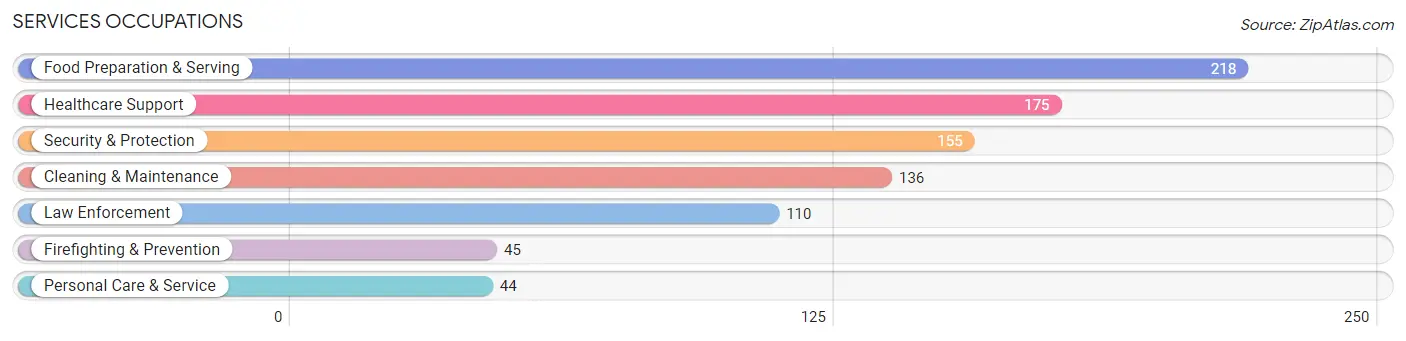
Services Occupations
The most common Services occupations in Stephens County are Food Preparation & Serving (218 | 5.7%), Healthcare Support (175 | 4.5%), Security & Protection (155 | 4.0%), Cleaning & Maintenance (136 | 3.5%), and Law Enforcement (110 | 2.9%).
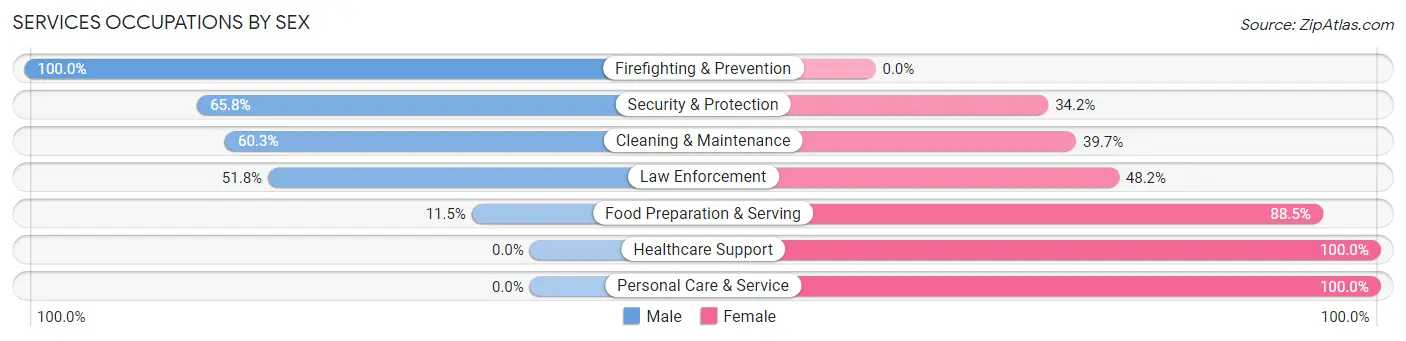
Services Occupations by Sex
Within the Services occupations in Stephens County, the most male-oriented occupations are Firefighting & Prevention (100.0%), Security & Protection (65.8%), and Cleaning & Maintenance (60.3%), while the most female-oriented occupations are Healthcare Support (100.0%), Personal Care & Service (100.0%), and Food Preparation & Serving (88.5%).
| Occupation | Male | Female |
| Healthcare Support | 0 (0.0%) | 175 (100.0%) |
| Security & Protection | 102 (65.8%) | 53 (34.2%) |
| Firefighting & Prevention | 45 (100.0%) | 0 (0.0%) |
| Law Enforcement | 57 (51.8%) | 53 (48.2%) |
| Food Preparation & Serving | 25 (11.5%) | 193 (88.5%) |
| Cleaning & Maintenance | 82 (60.3%) | 54 (39.7%) |
| Personal Care & Service | 0 (0.0%) | 44 (100.0%) |
| Total (Category) | 209 (28.7%) | 519 (71.3%) |
| Total (Overall) | 2,234 (57.9%) | 1,623 (42.1%) |
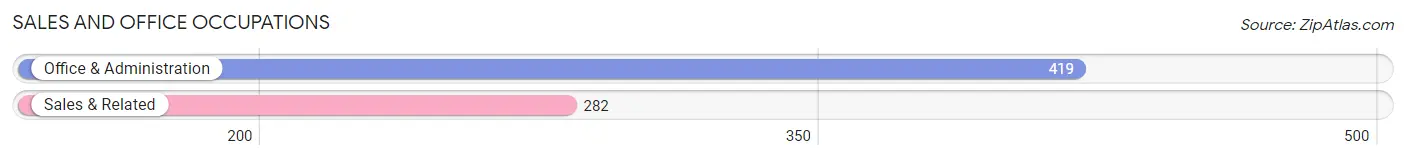
Sales and Office Occupations
The most common Sales and Office occupations in Stephens County are Office & Administration (419 | 10.9%), and Sales & Related (282 | 7.3%).
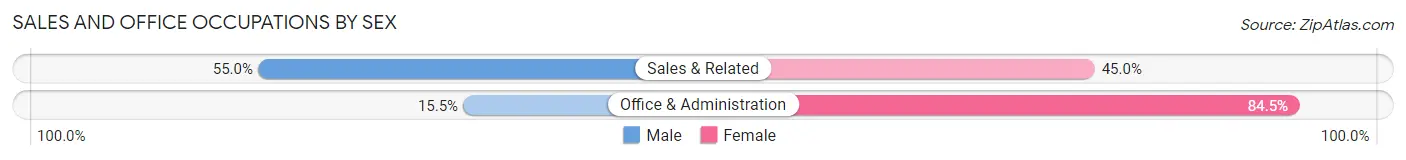
Sales and Office Occupations by Sex
| Occupation | Male | Female |
| Sales & Related | 155 (55.0%) | 127 (45.0%) |
| Office & Administration | 65 (15.5%) | 354 (84.5%) |
| Total (Category) | 220 (31.4%) | 481 (68.6%) |
| Total (Overall) | 2,234 (57.9%) | 1,623 (42.1%) |
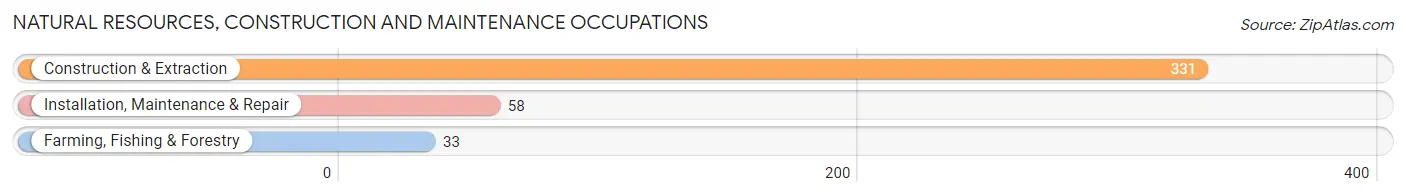
Natural Resources, Construction and Maintenance Occupations
The most common Natural Resources, Construction and Maintenance occupations in Stephens County are Construction & Extraction (331 | 8.6%), Installation, Maintenance & Repair (58 | 1.5%), and Farming, Fishing & Forestry (33 | 0.9%).
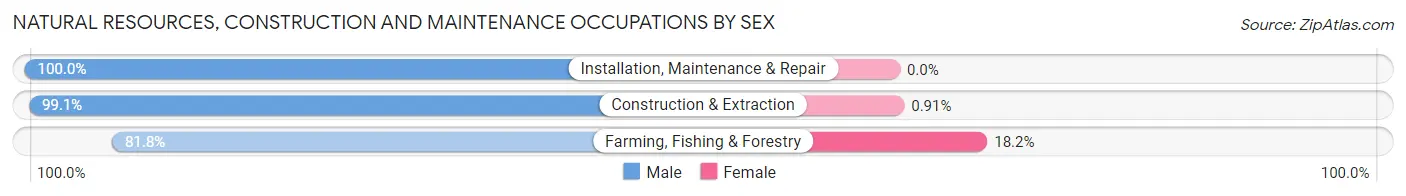
Natural Resources, Construction and Maintenance Occupations by Sex
| Occupation | Male | Female |
| Farming, Fishing & Forestry | 27 (81.8%) | 6 (18.2%) |
| Construction & Extraction | 328 (99.1%) | 3 (0.9%) |
| Installation, Maintenance & Repair | 58 (100.0%) | 0 (0.0%) |
| Total (Category) | 413 (97.9%) | 9 (2.1%) |
| Total (Overall) | 2,234 (57.9%) | 1,623 (42.1%) |
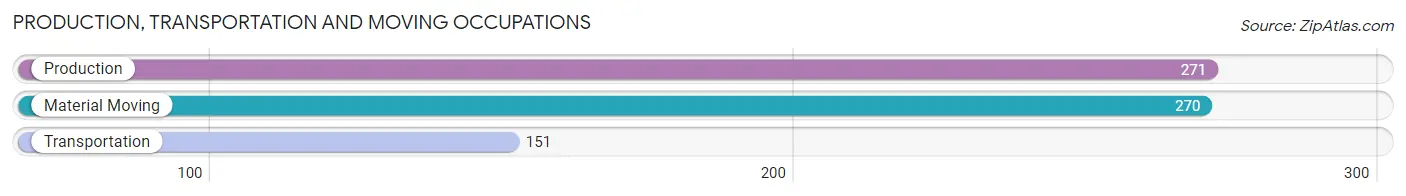
Production, Transportation and Moving Occupations
The most common Production, Transportation and Moving occupations in Stephens County are Production (271 | 7.0%), Material Moving (270 | 7.0%), and Transportation (151 | 3.9%).
Production, Transportation and Moving Occupations by Sex
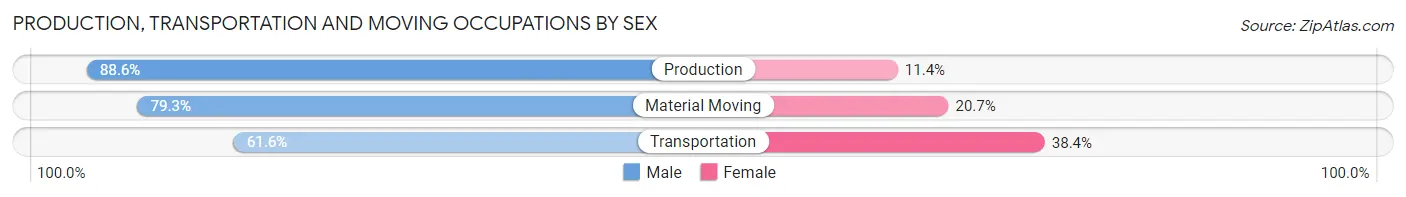
| Occupation | Male | Female |
| Production | 240 (88.6%) | 31 (11.4%) |
| Transportation | 93 (61.6%) | 58 (38.4%) |
| Material Moving | 214 (79.3%) | 56 (20.7%) |
| Total (Category) | 547 (79.0%) | 145 (20.9%) |
| Total (Overall) | 2,234 (57.9%) | 1,623 (42.1%) |
Employment Industries by Sex in Stephens County
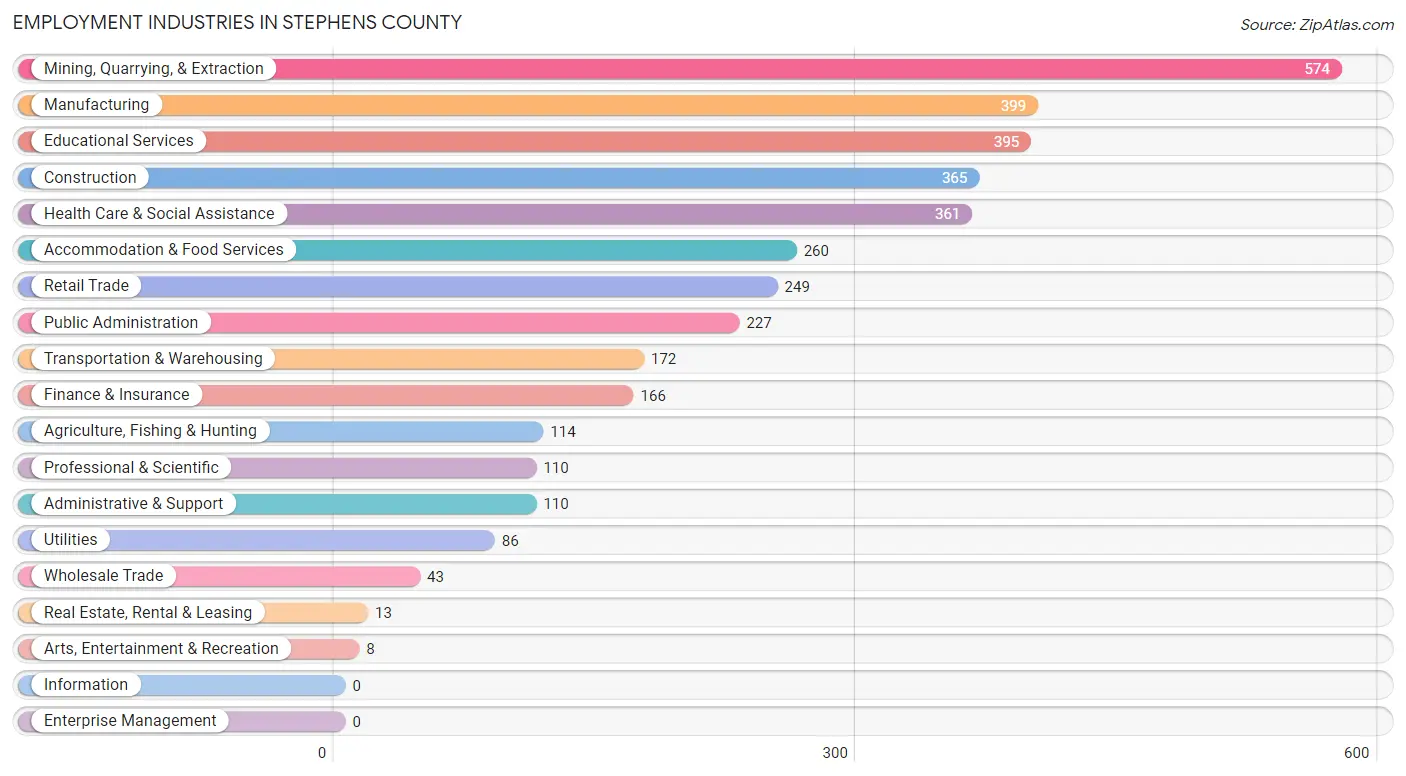
Employment Industries in Stephens County
The major employment industries in Stephens County include Mining, Quarrying, & Extraction (574 | 14.9%), Manufacturing (399 | 10.3%), Educational Services (395 | 10.2%), Construction (365 | 9.5%), and Health Care & Social Assistance (361 | 9.4%).
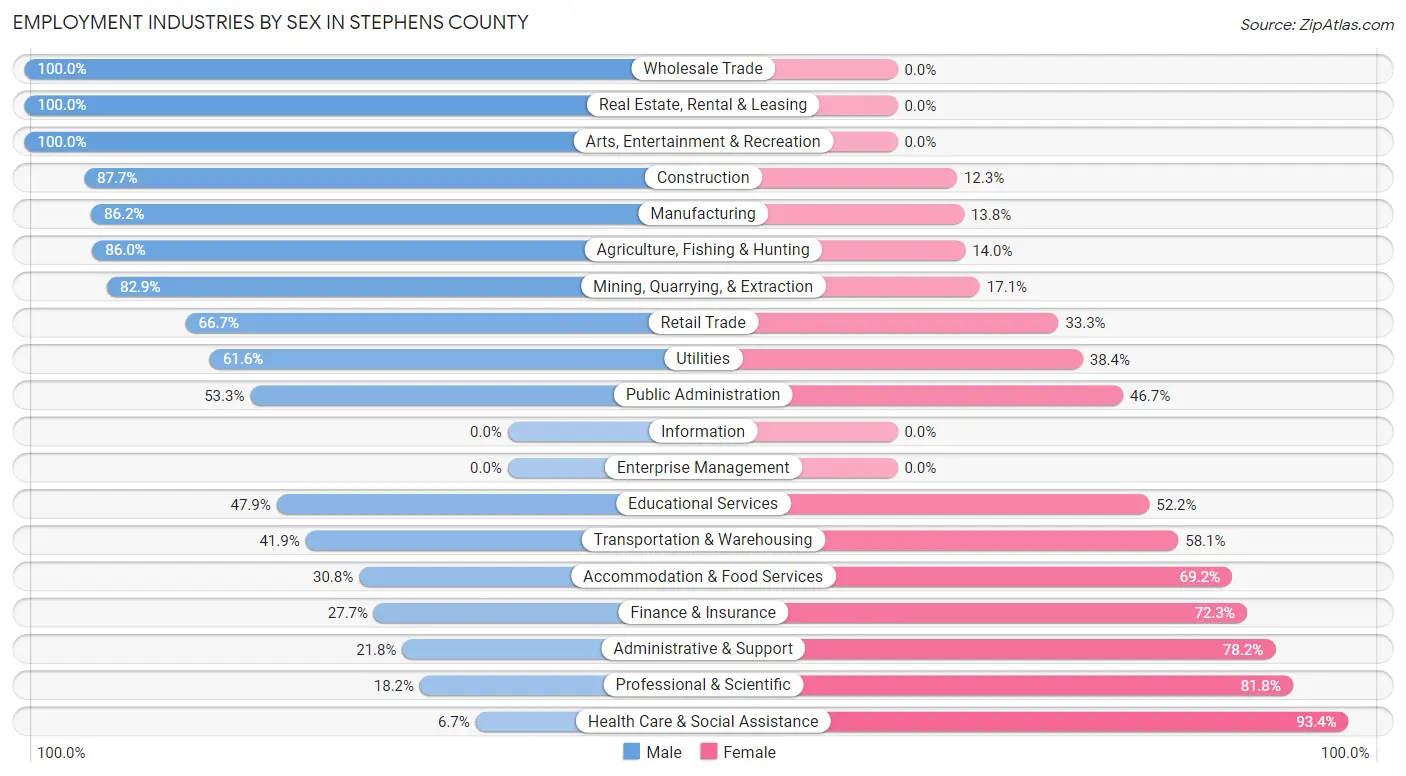
Employment Industries by Sex in Stephens County
The Stephens County industries that see more men than women are Wholesale Trade (100.0%), Real Estate, Rental & Leasing (100.0%), and Arts, Entertainment & Recreation (100.0%), whereas the industries that tend to have a higher number of women are Health Care & Social Assistance (93.3%), Professional & Scientific (81.8%), and Administrative & Support (78.2%).
| Industry | Male | Female |
| Agriculture, Fishing & Hunting | 98 (86.0%) | 16 (14.0%) |
| Mining, Quarrying, & Extraction | 476 (82.9%) | 98 (17.1%) |
| Construction | 320 (87.7%) | 45 (12.3%) |
| Manufacturing | 344 (86.2%) | 55 (13.8%) |
| Wholesale Trade | 43 (100.0%) | 0 (0.0%) |
| Retail Trade | 166 (66.7%) | 83 (33.3%) |
| Transportation & Warehousing | 72 (41.9%) | 100 (58.1%) |
| Utilities | 53 (61.6%) | 33 (38.4%) |
| Information | 0 (0.0%) | 0 (0.0%) |
| Finance & Insurance | 46 (27.7%) | 120 (72.3%) |
| Real Estate, Rental & Leasing | 13 (100.0%) | 0 (0.0%) |
| Professional & Scientific | 20 (18.2%) | 90 (81.8%) |
| Enterprise Management | 0 (0.0%) | 0 (0.0%) |
| Administrative & Support | 24 (21.8%) | 86 (78.2%) |
| Educational Services | 189 (47.8%) | 206 (52.1%) |
| Health Care & Social Assistance | 24 (6.7%) | 337 (93.3%) |
| Arts, Entertainment & Recreation | 8 (100.0%) | 0 (0.0%) |
| Accommodation & Food Services | 80 (30.8%) | 180 (69.2%) |
| Public Administration | 121 (53.3%) | 106 (46.7%) |
| Total | 2,234 (57.9%) | 1,623 (42.1%) |
Education in Stephens County
School Enrollment in Stephens County
The most common levels of schooling among the 1,879 students in Stephens County are middle school (539 | 28.7%), high school (405 | 21.5%), and elementary school (364 | 19.4%).
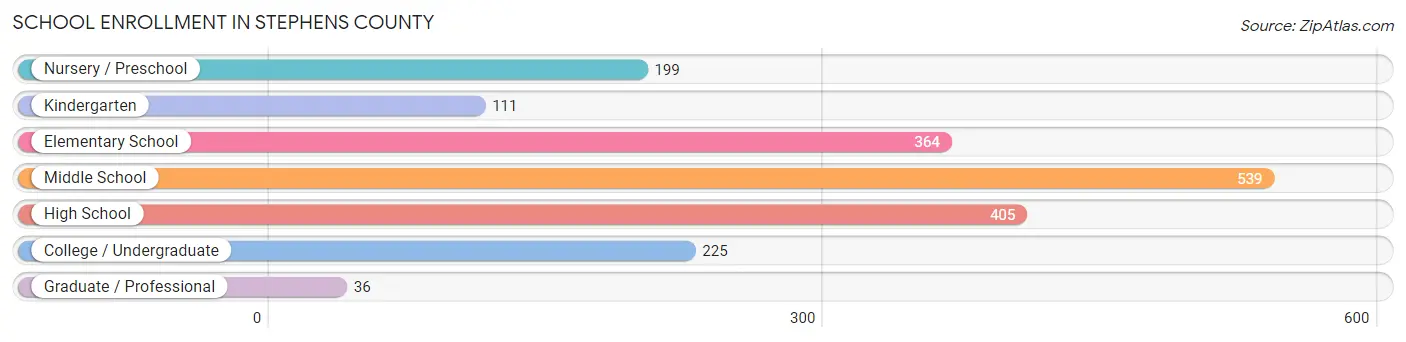
| School Level | # Students | % Students |
| Nursery / Preschool | 199 | 10.6% |
| Kindergarten | 111 | 5.9% |
| Elementary School | 364 | 19.4% |
| Middle School | 539 | 28.7% |
| High School | 405 | 21.5% |
| College / Undergraduate | 225 | 12.0% |
| Graduate / Professional | 36 | 1.9% |
| Total | 1,879 | 100.0% |
School Enrollment by Age by Funding Source in Stephens County
Out of a total of 1,879 students who are enrolled in schools in Stephens County, 252 (13.4%) attend a private institution, while the remaining 1,627 (86.6%) are enrolled in public schools. The age group of 15 to 17 year olds has the highest likelihood of being enrolled in private schools, with 80 (24.3% in the age bracket) enrolled. Conversely, the age group of 20 to 24 year olds has the lowest likelihood of being enrolled in a private school, with 118 (100.0% in the age bracket) attending a public institution.
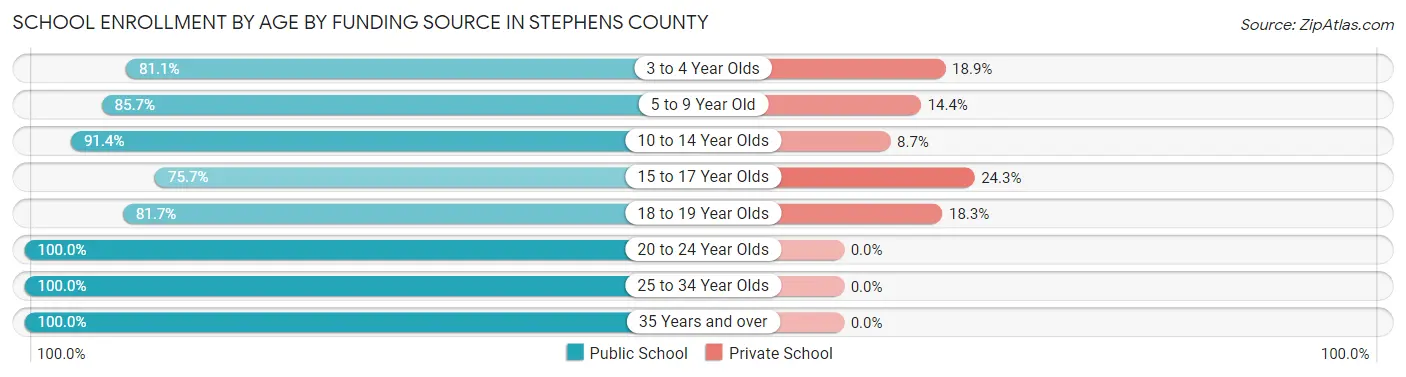
| Age Bracket | Public School | Private School |
| 3 to 4 Year Olds | 103 (81.1%) | 24 (18.9%) |
| 5 to 9 Year Old | 406 (85.7%) | 68 (14.3%) |
| 10 to 14 Year Olds | 581 (91.3%) | 55 (8.6%) |
| 15 to 17 Year Olds | 249 (75.7%) | 80 (24.3%) |
| 18 to 19 Year Olds | 107 (81.7%) | 24 (18.3%) |
| 20 to 24 Year Olds | 118 (100.0%) | 0 (0.0%) |
| 25 to 34 Year Olds | 12 (100.0%) | 0 (0.0%) |
| 35 Years and over | 52 (100.0%) | 0 (0.0%) |
| Total | 1,627 (86.6%) | 252 (13.4%) |
Educational Attainment by Field of Study in Stephens County
Business (273 | 22.1%), education (211 | 17.1%), bio, nature & agricultural (100 | 8.1%), visual & performing arts (88 | 7.1%), and arts & humanities (87 | 7.0%) are the most common fields of study among 1,235 individuals in Stephens County who have obtained a bachelor's degree or higher.
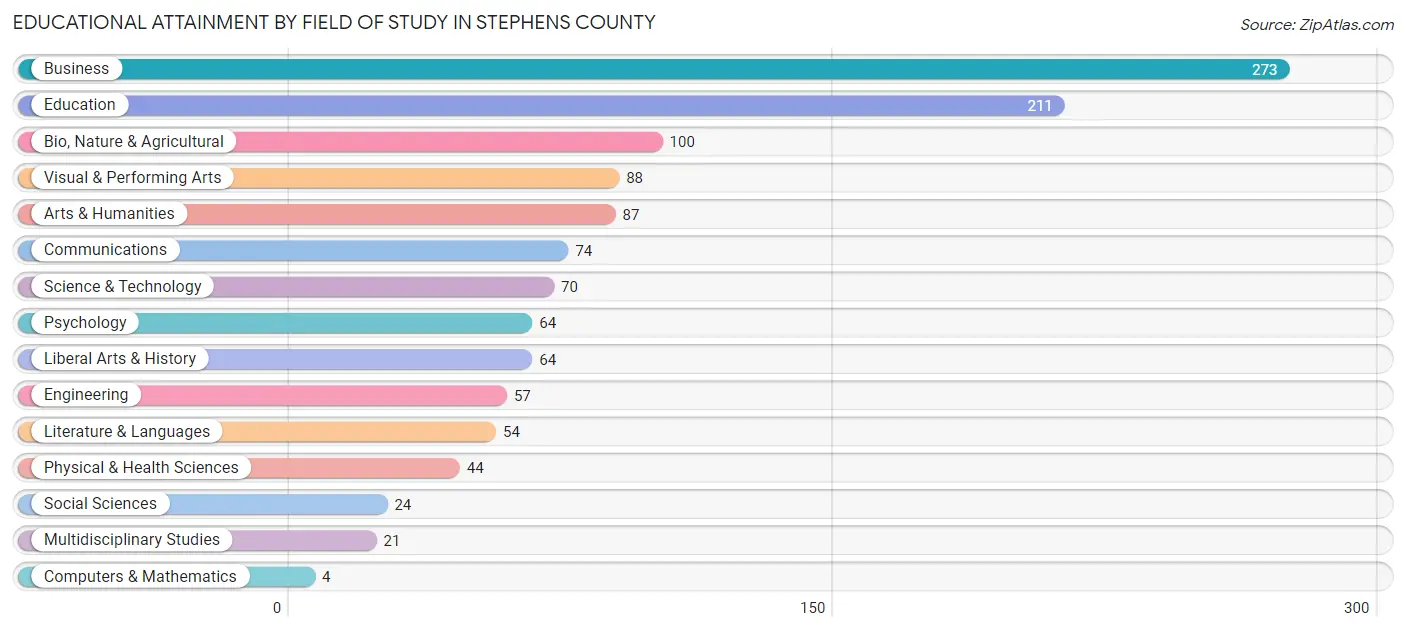
| Field of Study | # Graduates | % Graduates |
| Computers & Mathematics | 4 | 0.3% |
| Bio, Nature & Agricultural | 100 | 8.1% |
| Physical & Health Sciences | 44 | 3.6% |
| Psychology | 64 | 5.2% |
| Social Sciences | 24 | 1.9% |
| Engineering | 57 | 4.6% |
| Multidisciplinary Studies | 21 | 1.7% |
| Science & Technology | 70 | 5.7% |
| Business | 273 | 22.1% |
| Education | 211 | 17.1% |
| Literature & Languages | 54 | 4.4% |
| Liberal Arts & History | 64 | 5.2% |
| Visual & Performing Arts | 88 | 7.1% |
| Communications | 74 | 6.0% |
| Arts & Humanities | 87 | 7.0% |
| Total | 1,235 | 100.0% |
Transportation & Commute in Stephens County
Vehicle Availability by Sex in Stephens County
The most prevalent vehicle ownership categories in Stephens County are males with 2 vehicles (762, accounting for 34.8%) and females with 2 vehicles (622, making up 46.9%).
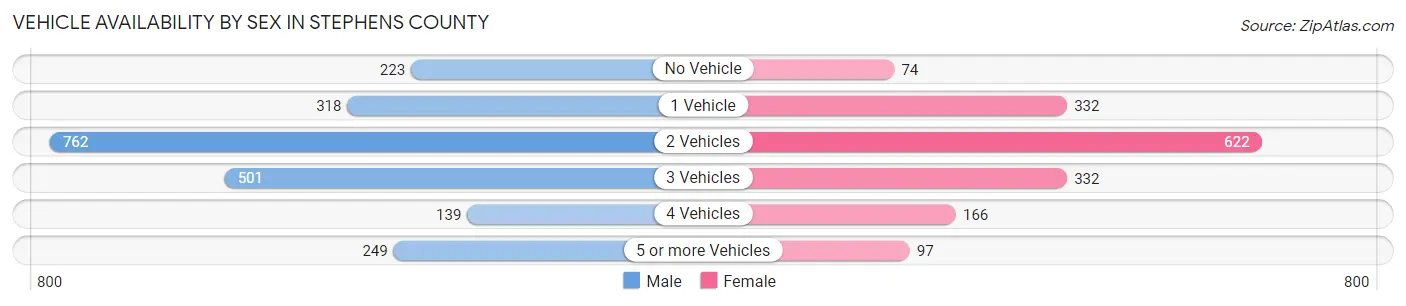
| Vehicles Available | Male | Female |
| No Vehicle | 223 (10.2%) | 74 (4.6%) |
| 1 Vehicle | 318 (14.5%) | 332 (20.5%) |
| 2 Vehicles | 762 (34.8%) | 622 (38.3%) |
| 3 Vehicles | 501 (22.9%) | 332 (20.5%) |
| 4 Vehicles | 139 (6.3%) | 166 (10.2%) |
| 5 or more Vehicles | 249 (11.4%) | 97 (6.0%) |
| Total | 2,192 (100.0%) | 1,623 (100.0%) |
Commute Time in Stephens County
The most frequently occuring commute durations in Stephens County are 5 to 9 minutes (856 commuters, 23.3%), 10 to 14 minutes (785 commuters, 21.4%), and 15 to 19 minutes (436 commuters, 11.9%).
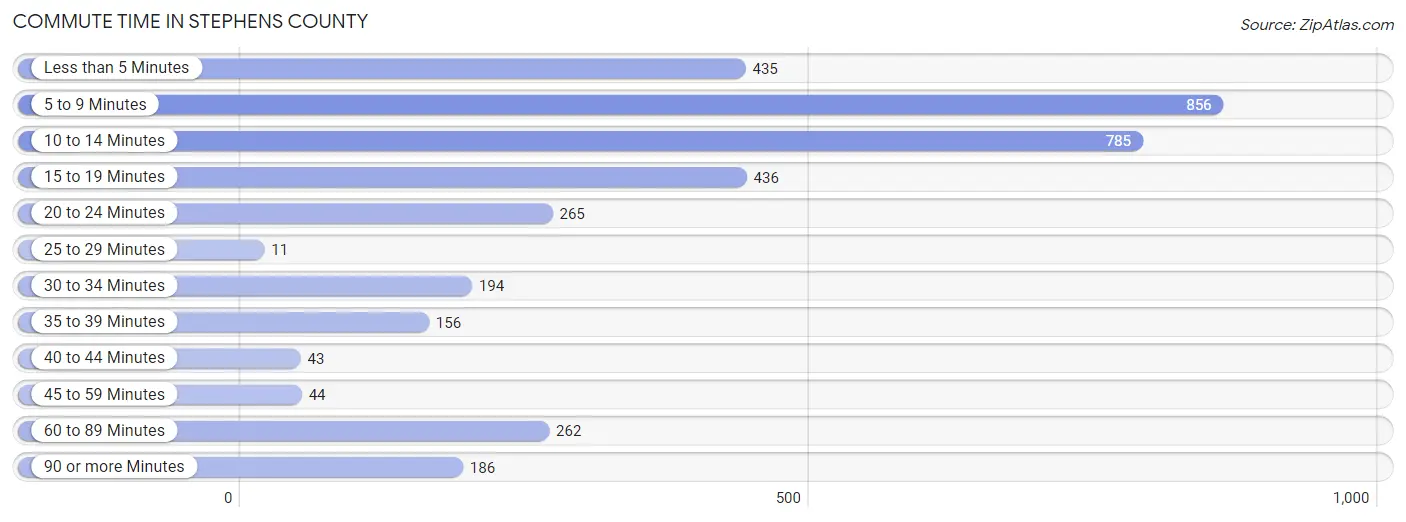
| Commute Time | # Commuters | % Commuters |
| Less than 5 Minutes | 435 | 11.8% |
| 5 to 9 Minutes | 856 | 23.3% |
| 10 to 14 Minutes | 785 | 21.4% |
| 15 to 19 Minutes | 436 | 11.9% |
| 20 to 24 Minutes | 265 | 7.2% |
| 25 to 29 Minutes | 11 | 0.3% |
| 30 to 34 Minutes | 194 | 5.3% |
| 35 to 39 Minutes | 156 | 4.3% |
| 40 to 44 Minutes | 43 | 1.2% |
| 45 to 59 Minutes | 44 | 1.2% |
| 60 to 89 Minutes | 262 | 7.1% |
| 90 or more Minutes | 186 | 5.1% |
Commute Time by Sex in Stephens County
The most common commute times in Stephens County are 10 to 14 minutes (472 commuters, 21.9%) for males and 5 to 9 minutes (458 commuters, 30.1%) for females.
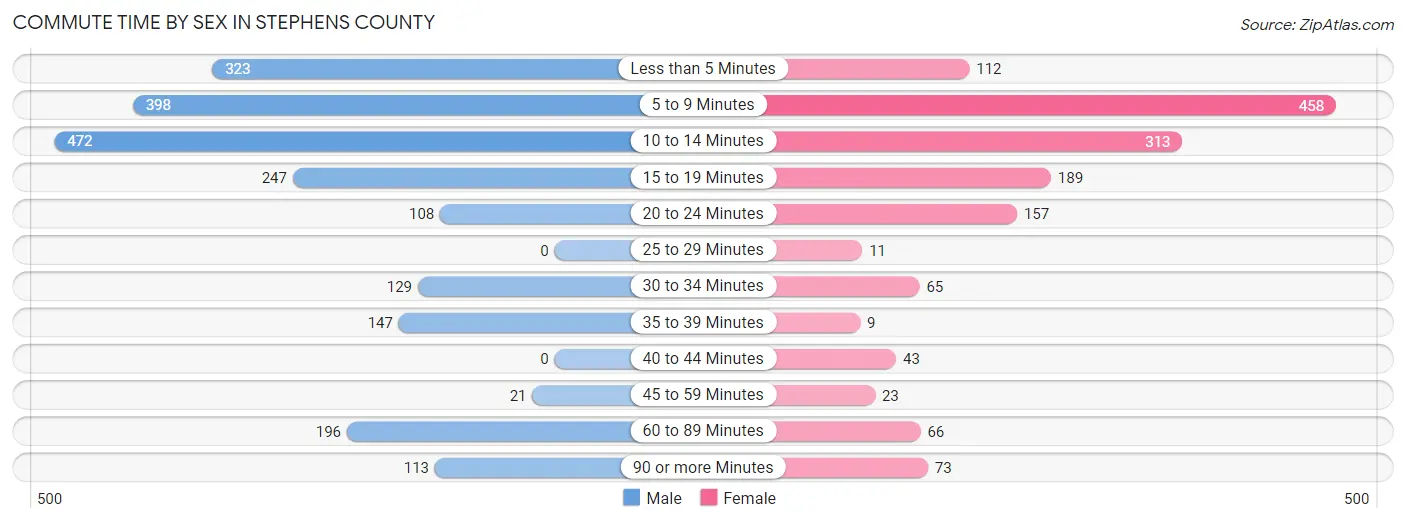
| Commute Time | Male | Female |
| Less than 5 Minutes | 323 (15.0%) | 112 (7.4%) |
| 5 to 9 Minutes | 398 (18.5%) | 458 (30.1%) |
| 10 to 14 Minutes | 472 (21.9%) | 313 (20.6%) |
| 15 to 19 Minutes | 247 (11.5%) | 189 (12.4%) |
| 20 to 24 Minutes | 108 (5.0%) | 157 (10.3%) |
| 25 to 29 Minutes | 0 (0.0%) | 11 (0.7%) |
| 30 to 34 Minutes | 129 (6.0%) | 65 (4.3%) |
| 35 to 39 Minutes | 147 (6.8%) | 9 (0.6%) |
| 40 to 44 Minutes | 0 (0.0%) | 43 (2.8%) |
| 45 to 59 Minutes | 21 (1.0%) | 23 (1.5%) |
| 60 to 89 Minutes | 196 (9.1%) | 66 (4.3%) |
| 90 or more Minutes | 113 (5.2%) | 73 (4.8%) |
Time of Departure to Work by Sex in Stephens County
The most frequent times of departure to work in Stephens County are 7:30 AM to 7:59 AM (433, 20.1%) for males and 7:30 AM to 7:59 AM (496, 32.7%) for females.
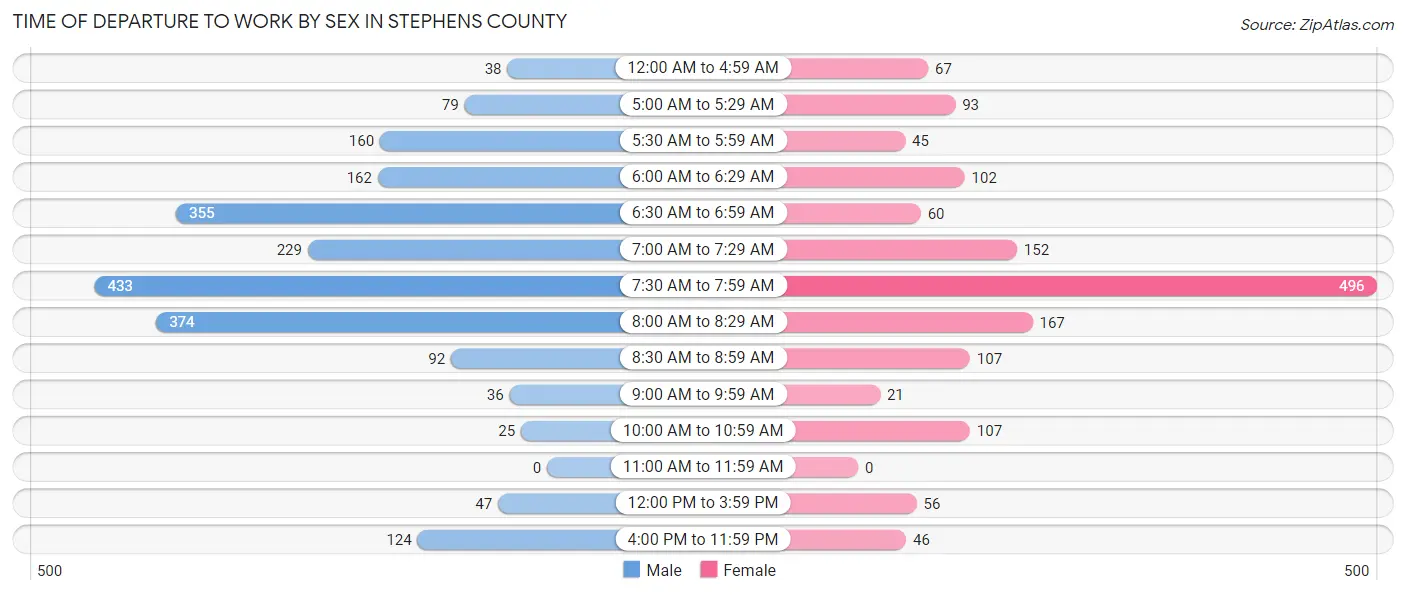
| Time of Departure | Male | Female |
| 12:00 AM to 4:59 AM | 38 (1.8%) | 67 (4.4%) |
| 5:00 AM to 5:29 AM | 79 (3.7%) | 93 (6.1%) |
| 5:30 AM to 5:59 AM | 160 (7.4%) | 45 (3.0%) |
| 6:00 AM to 6:29 AM | 162 (7.5%) | 102 (6.7%) |
| 6:30 AM to 6:59 AM | 355 (16.5%) | 60 (4.0%) |
| 7:00 AM to 7:29 AM | 229 (10.6%) | 152 (10.0%) |
| 7:30 AM to 7:59 AM | 433 (20.1%) | 496 (32.7%) |
| 8:00 AM to 8:29 AM | 374 (17.4%) | 167 (11.0%) |
| 8:30 AM to 8:59 AM | 92 (4.3%) | 107 (7.0%) |
| 9:00 AM to 9:59 AM | 36 (1.7%) | 21 (1.4%) |
| 10:00 AM to 10:59 AM | 25 (1.2%) | 107 (7.0%) |
| 11:00 AM to 11:59 AM | 0 (0.0%) | 0 (0.0%) |
| 12:00 PM to 3:59 PM | 47 (2.2%) | 56 (3.7%) |
| 4:00 PM to 11:59 PM | 124 (5.8%) | 46 (3.0%) |
| Total | 2,154 (100.0%) | 1,519 (100.0%) |
Housing Occupancy in Stephens County
Occupancy by Ownership in Stephens County
Of the total 3,405 dwellings in Stephens County, owner-occupied units account for 2,677 (78.6%), while renter-occupied units make up 728 (21.4%).
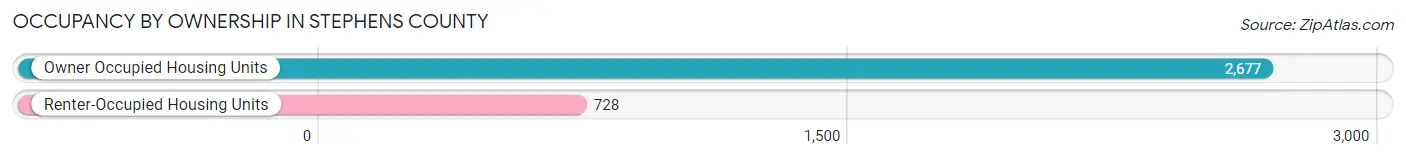
| Occupancy | # Housing Units | % Housing Units |
| Owner Occupied Housing Units | 2,677 | 78.6% |
| Renter-Occupied Housing Units | 728 | 21.4% |
| Total Occupied Housing Units | 3,405 | 100.0% |
Occupancy by Household Size in Stephens County
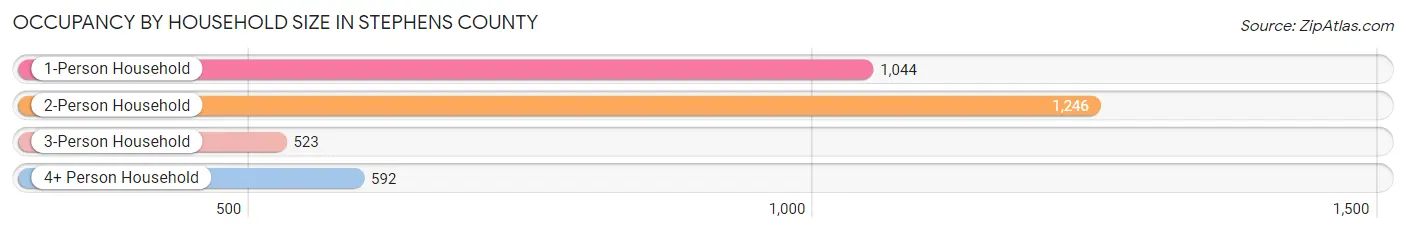
| Household Size | # Housing Units | % Housing Units |
| 1-Person Household | 1,044 | 30.7% |
| 2-Person Household | 1,246 | 36.6% |
| 3-Person Household | 523 | 15.4% |
| 4+ Person Household | 592 | 17.4% |
| Total Housing Units | 3,405 | 100.0% |
Occupancy by Ownership by Household Size in Stephens County
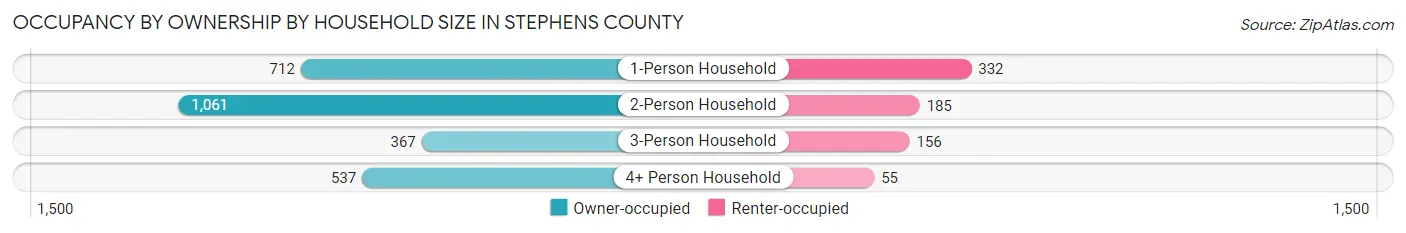
| Household Size | Owner-occupied | Renter-occupied |
| 1-Person Household | 712 (68.2%) | 332 (31.8%) |
| 2-Person Household | 1,061 (85.2%) | 185 (14.8%) |
| 3-Person Household | 367 (70.2%) | 156 (29.8%) |
| 4+ Person Household | 537 (90.7%) | 55 (9.3%) |
| Total Housing Units | 2,677 (78.6%) | 728 (21.4%) |
Occupancy by Educational Attainment in Stephens County
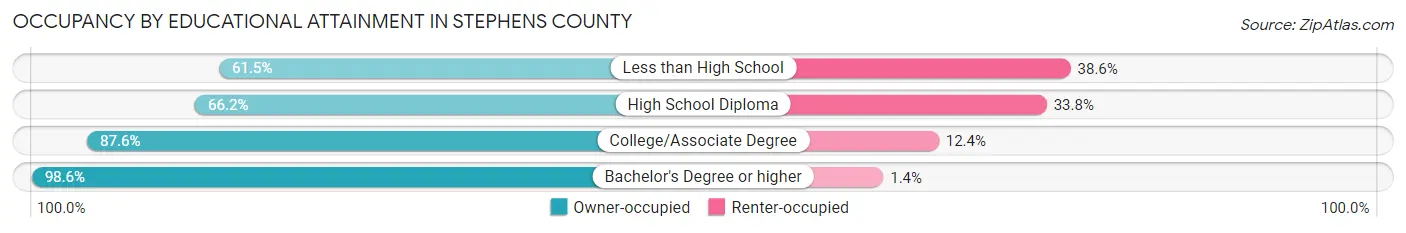
| Household Size | Owner-occupied | Renter-occupied |
| Less than High School | 279 (61.5%) | 175 (38.6%) |
| High School Diploma | 771 (66.2%) | 394 (33.8%) |
| College/Associate Degree | 1,066 (87.6%) | 151 (12.4%) |
| Bachelor's Degree or higher | 561 (98.6%) | 8 (1.4%) |
Occupancy by Age of Householder in Stephens County
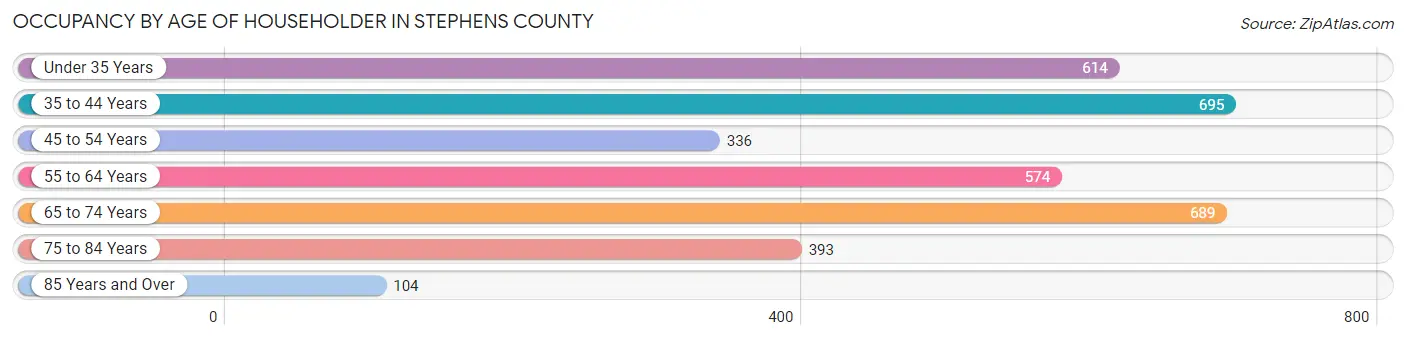
| Age Bracket | # Households | % Households |
| Under 35 Years | 614 | 18.0% |
| 35 to 44 Years | 695 | 20.4% |
| 45 to 54 Years | 336 | 9.9% |
| 55 to 64 Years | 574 | 16.9% |
| 65 to 74 Years | 689 | 20.2% |
| 75 to 84 Years | 393 | 11.5% |
| 85 Years and Over | 104 | 3.0% |
| Total | 3,405 | 100.0% |
Housing Finances in Stephens County
Median Income by Occupancy in Stephens County
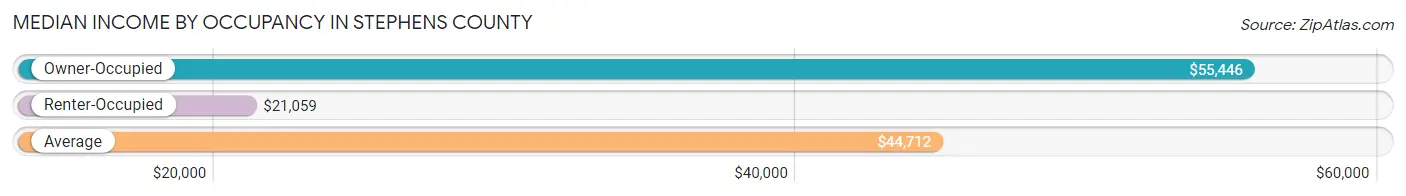
| Occupancy Type | # Households | Median Income |
| Owner-Occupied | 2,677 (78.6%) | $55,446 |
| Renter-Occupied | 728 (21.4%) | $21,059 |
| Average | 3,405 (100.0%) | $44,712 |
Occupancy by Householder Income Bracket in Stephens County
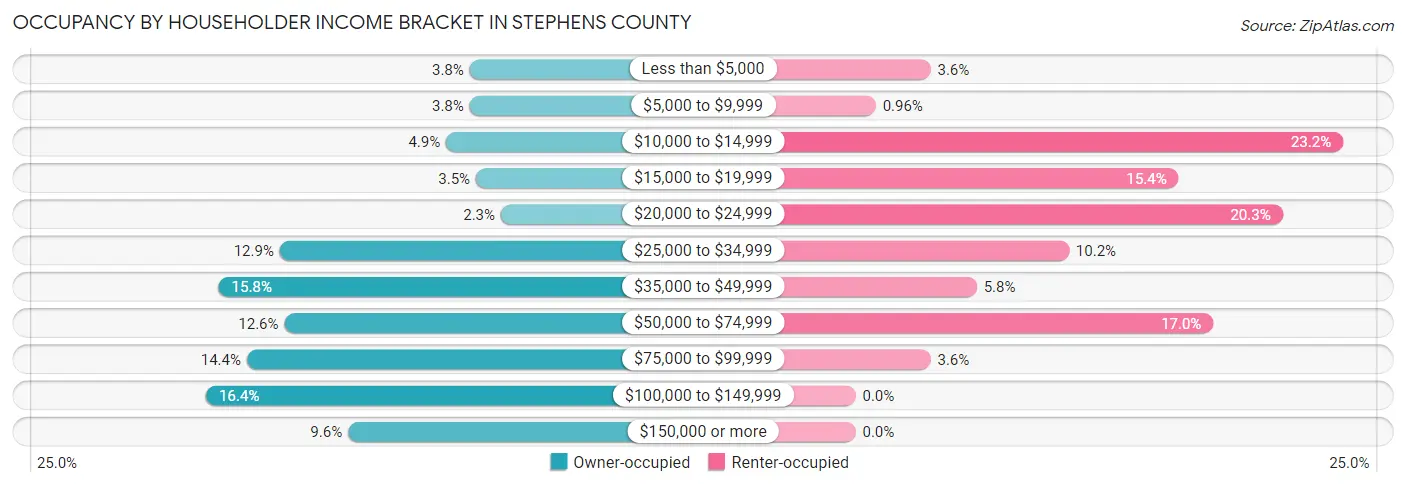
| Income Bracket | Owner-occupied | Renter-occupied |
| Less than $5,000 | 102 (3.8%) | 26 (3.6%) |
| $5,000 to $9,999 | 102 (3.8%) | 7 (1.0%) |
| $10,000 to $14,999 | 132 (4.9%) | 169 (23.2%) |
| $15,000 to $19,999 | 94 (3.5%) | 112 (15.4%) |
| $20,000 to $24,999 | 62 (2.3%) | 148 (20.3%) |
| $25,000 to $34,999 | 344 (12.9%) | 74 (10.2%) |
| $35,000 to $49,999 | 422 (15.8%) | 42 (5.8%) |
| $50,000 to $74,999 | 338 (12.6%) | 124 (17.0%) |
| $75,000 to $99,999 | 386 (14.4%) | 26 (3.6%) |
| $100,000 to $149,999 | 438 (16.4%) | 0 (0.0%) |
| $150,000 or more | 257 (9.6%) | 0 (0.0%) |
| Total | 2,677 (100.0%) | 728 (100.0%) |
Monthly Housing Cost Tiers in Stephens County
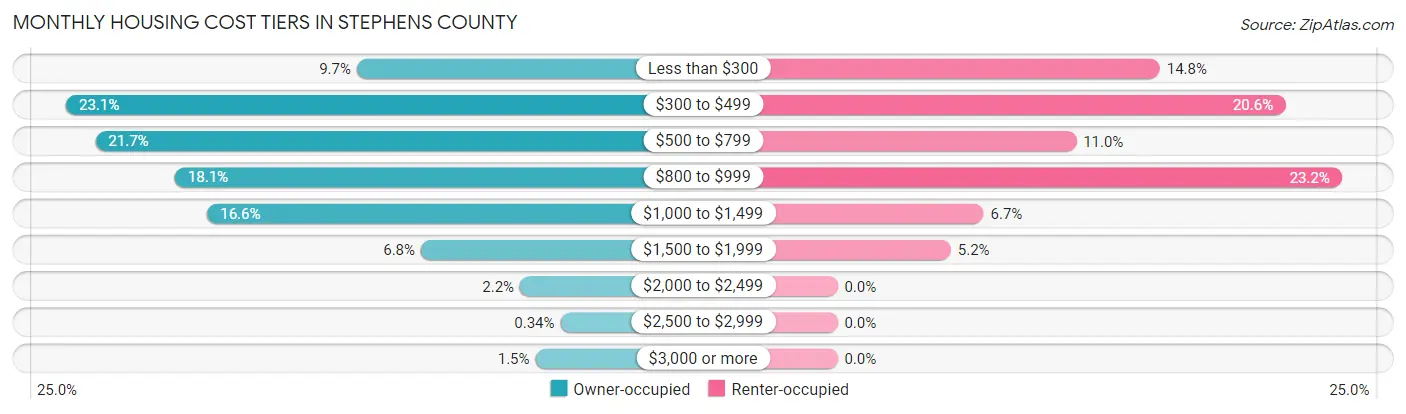
| Monthly Cost | Owner-occupied | Renter-occupied |
| Less than $300 | 260 (9.7%) | 108 (14.8%) |
| $300 to $499 | 618 (23.1%) | 150 (20.6%) |
| $500 to $799 | 582 (21.7%) | 80 (11.0%) |
| $800 to $999 | 484 (18.1%) | 169 (23.2%) |
| $1,000 to $1,499 | 444 (16.6%) | 49 (6.7%) |
| $1,500 to $1,999 | 181 (6.8%) | 38 (5.2%) |
| $2,000 to $2,499 | 59 (2.2%) | 0 (0.0%) |
| $2,500 to $2,999 | 9 (0.3%) | 0 (0.0%) |
| $3,000 or more | 40 (1.5%) | 0 (0.0%) |
| Total | 2,677 (100.0%) | 728 (100.0%) |
Physical Housing Characteristics in Stephens County
Housing Structures in Stephens County
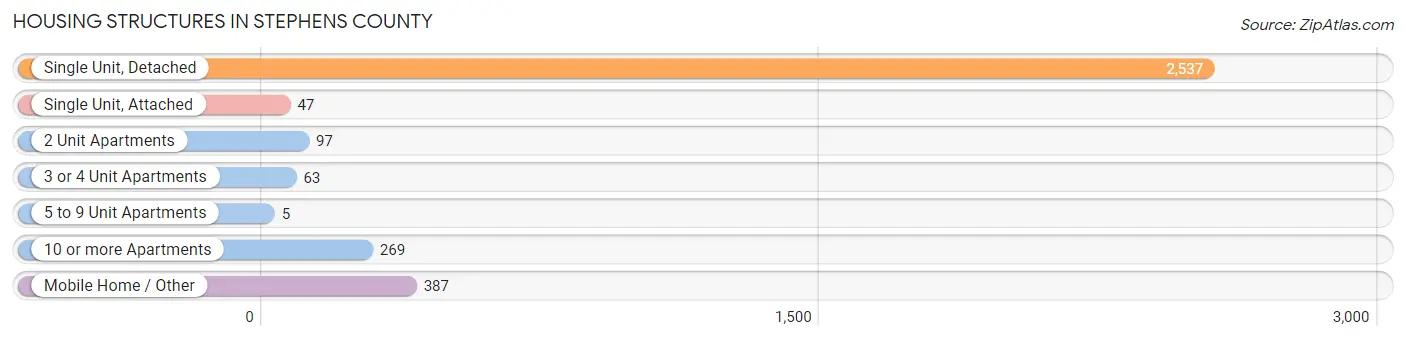
| Structure Type | # Housing Units | % Housing Units |
| Single Unit, Detached | 2,537 | 74.5% |
| Single Unit, Attached | 47 | 1.4% |
| 2 Unit Apartments | 97 | 2.9% |
| 3 or 4 Unit Apartments | 63 | 1.8% |
| 5 to 9 Unit Apartments | 5 | 0.2% |
| 10 or more Apartments | 269 | 7.9% |
| Mobile Home / Other | 387 | 11.4% |
| Total | 3,405 | 100.0% |
Housing Structures by Occupancy in Stephens County
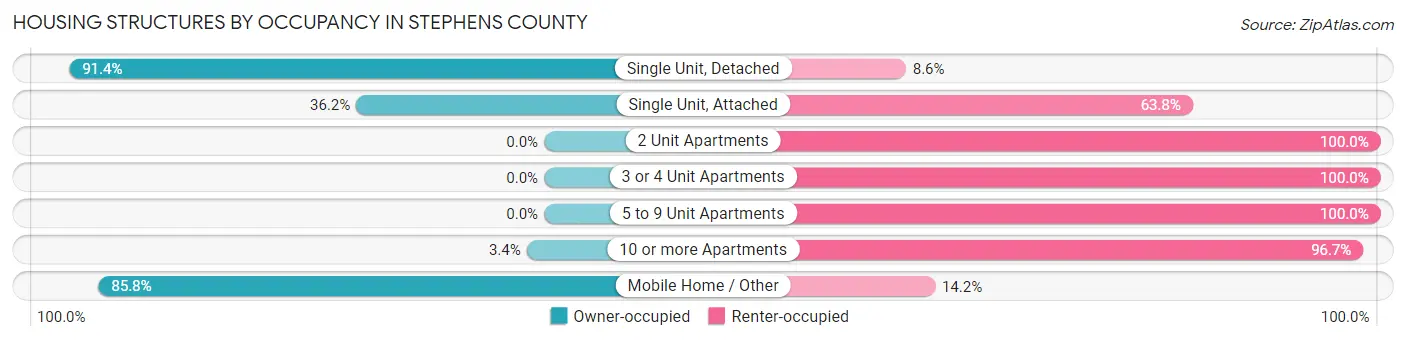
| Structure Type | Owner-occupied | Renter-occupied |
| Single Unit, Detached | 2,319 (91.4%) | 218 (8.6%) |
| Single Unit, Attached | 17 (36.2%) | 30 (63.8%) |
| 2 Unit Apartments | 0 (0.0%) | 97 (100.0%) |
| 3 or 4 Unit Apartments | 0 (0.0%) | 63 (100.0%) |
| 5 to 9 Unit Apartments | 0 (0.0%) | 5 (100.0%) |
| 10 or more Apartments | 9 (3.4%) | 260 (96.7%) |
| Mobile Home / Other | 332 (85.8%) | 55 (14.2%) |
| Total | 2,677 (78.6%) | 728 (21.4%) |
Housing Structures by Number of Rooms in Stephens County
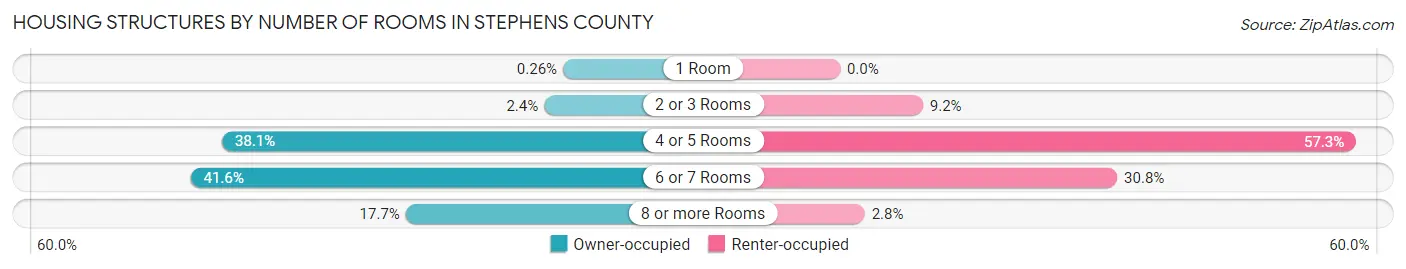
| Number of Rooms | Owner-occupied | Renter-occupied |
| 1 Room | 7 (0.3%) | 0 (0.0%) |
| 2 or 3 Rooms | 63 (2.4%) | 67 (9.2%) |
| 4 or 5 Rooms | 1,020 (38.1%) | 417 (57.3%) |
| 6 or 7 Rooms | 1,113 (41.6%) | 224 (30.8%) |
| 8 or more Rooms | 474 (17.7%) | 20 (2.8%) |
| Total | 2,677 (100.0%) | 728 (100.0%) |
Housing Structure by Heating Type in Stephens County
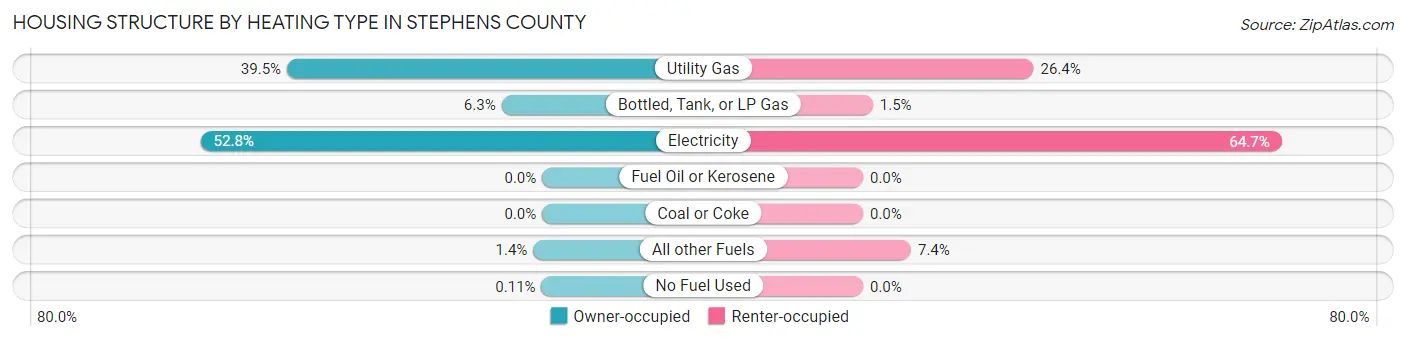
| Heating Type | Owner-occupied | Renter-occupied |
| Utility Gas | 1,056 (39.5%) | 192 (26.4%) |
| Bottled, Tank, or LP Gas | 168 (6.3%) | 11 (1.5%) |
| Electricity | 1,413 (52.8%) | 471 (64.7%) |
| Fuel Oil or Kerosene | 0 (0.0%) | 0 (0.0%) |
| Coal or Coke | 0 (0.0%) | 0 (0.0%) |
| All other Fuels | 37 (1.4%) | 54 (7.4%) |
| No Fuel Used | 3 (0.1%) | 0 (0.0%) |
| Total | 2,677 (100.0%) | 728 (100.0%) |
Household Vehicle Usage in Stephens County
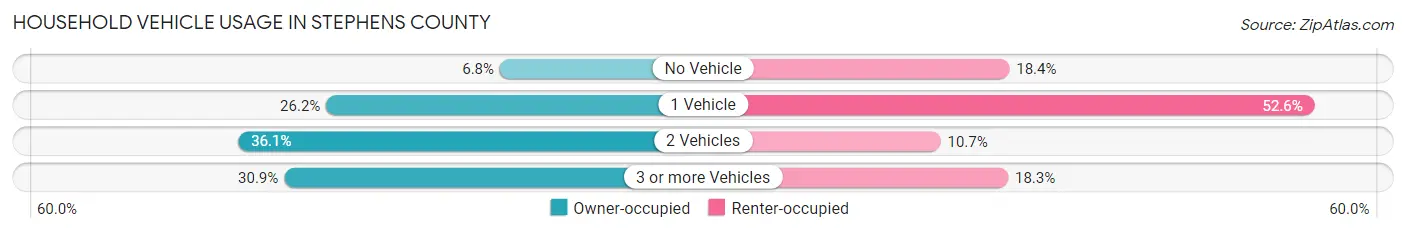
| Vehicles per Household | Owner-occupied | Renter-occupied |
| No Vehicle | 181 (6.8%) | 134 (18.4%) |
| 1 Vehicle | 702 (26.2%) | 383 (52.6%) |
| 2 Vehicles | 966 (36.1%) | 78 (10.7%) |
| 3 or more Vehicles | 828 (30.9%) | 133 (18.3%) |
| Total | 2,677 (100.0%) | 728 (100.0%) |
Real Estate & Mortgages in Stephens County
Real Estate and Mortgage Overview in Stephens County
| Characteristic | Without Mortgage | With Mortgage |
| Housing Units | 1,736 | 941 |
| Median Property Value | $106,000 | $87,800 |
| Median Household Income | $54,000 | $110 |
| Monthly Housing Costs | $497 | $40 |
| Real Estate Taxes | $1,494 | $0 |
Property Value by Mortgage Status in Stephens County
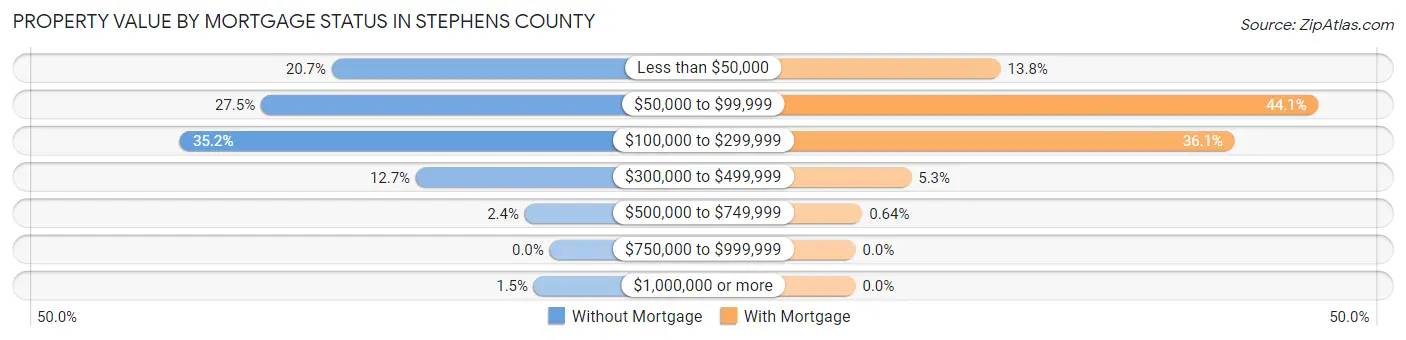
| Property Value | Without Mortgage | With Mortgage |
| Less than $50,000 | 360 (20.7%) | 130 (13.8%) |
| $50,000 to $99,999 | 477 (27.5%) | 415 (44.1%) |
| $100,000 to $299,999 | 611 (35.2%) | 340 (36.1%) |
| $300,000 to $499,999 | 221 (12.7%) | 50 (5.3%) |
| $500,000 to $749,999 | 41 (2.4%) | 6 (0.6%) |
| $750,000 to $999,999 | 0 (0.0%) | 0 (0.0%) |
| $1,000,000 or more | 26 (1.5%) | 0 (0.0%) |
| Total | 1,736 (100.0%) | 941 (100.0%) |
Household Income by Mortgage Status in Stephens County
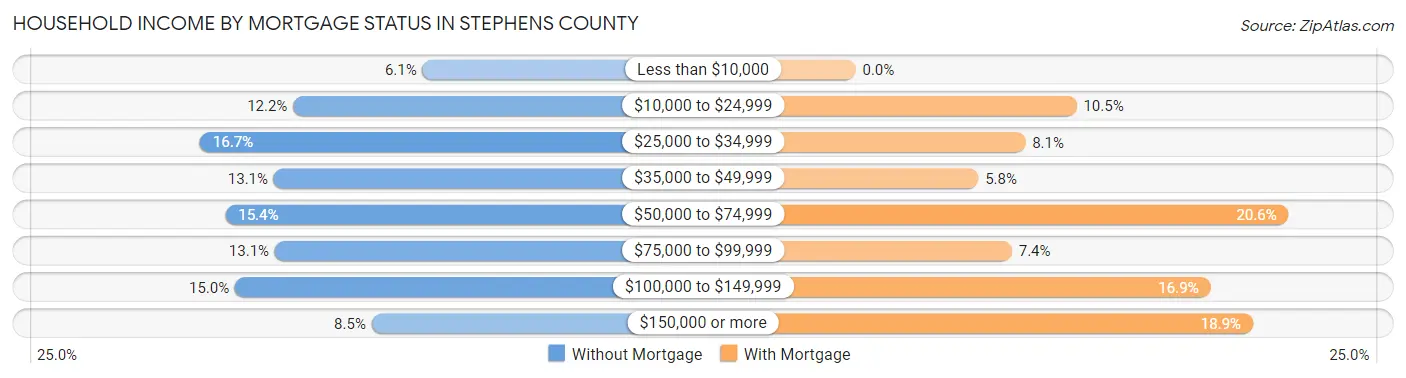
| Household Income | Without Mortgage | With Mortgage |
| Less than $10,000 | 105 (6.0%) | 0 (0.0%) |
| $10,000 to $24,999 | 212 (12.2%) | 99 (10.5%) |
| $25,000 to $34,999 | 289 (16.7%) | 76 (8.1%) |
| $35,000 to $49,999 | 228 (13.1%) | 55 (5.8%) |
| $50,000 to $74,999 | 268 (15.4%) | 194 (20.6%) |
| $75,000 to $99,999 | 227 (13.1%) | 70 (7.4%) |
| $100,000 to $149,999 | 260 (15.0%) | 159 (16.9%) |
| $150,000 or more | 147 (8.5%) | 178 (18.9%) |
| Total | 1,736 (100.0%) | 941 (100.0%) |
Property Value to Household Income Ratio in Stephens County
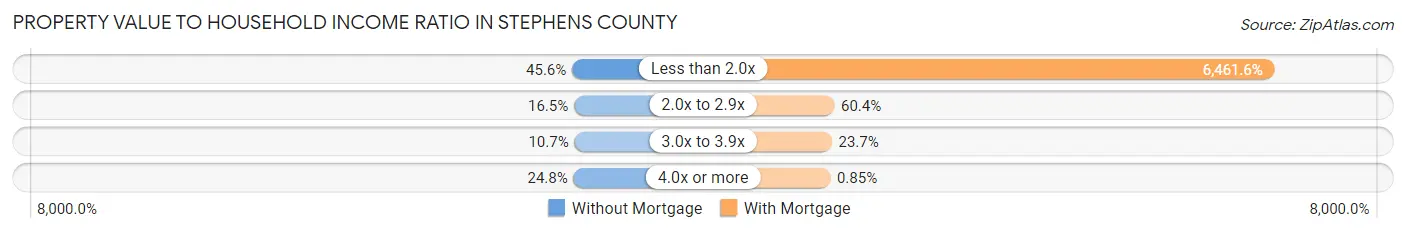
| Value-to-Income Ratio | Without Mortgage | With Mortgage |
| Less than 2.0x | 792 (45.6%) | 60,804 (6,461.6%) |
| 2.0x to 2.9x | 287 (16.5%) | 568 (60.4%) |
| 3.0x to 3.9x | 185 (10.7%) | 223 (23.7%) |
| 4.0x or more | 430 (24.8%) | 8 (0.9%) |
| Total | 1,736 (100.0%) | 941 (100.0%) |
Real Estate Taxes by Mortgage Status in Stephens County
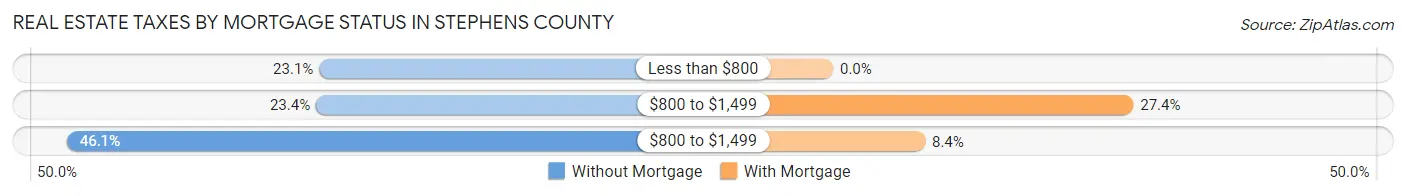
| Property Taxes | Without Mortgage | With Mortgage |
| Less than $800 | 401 (23.1%) | 0 (0.0%) |
| $800 to $1,499 | 406 (23.4%) | 258 (27.4%) |
| $800 to $1,499 | 801 (46.1%) | 79 (8.4%) |
| Total | 1,736 (100.0%) | 941 (100.0%) |
Health & Disability in Stephens County
Health Insurance Coverage by Age in Stephens County
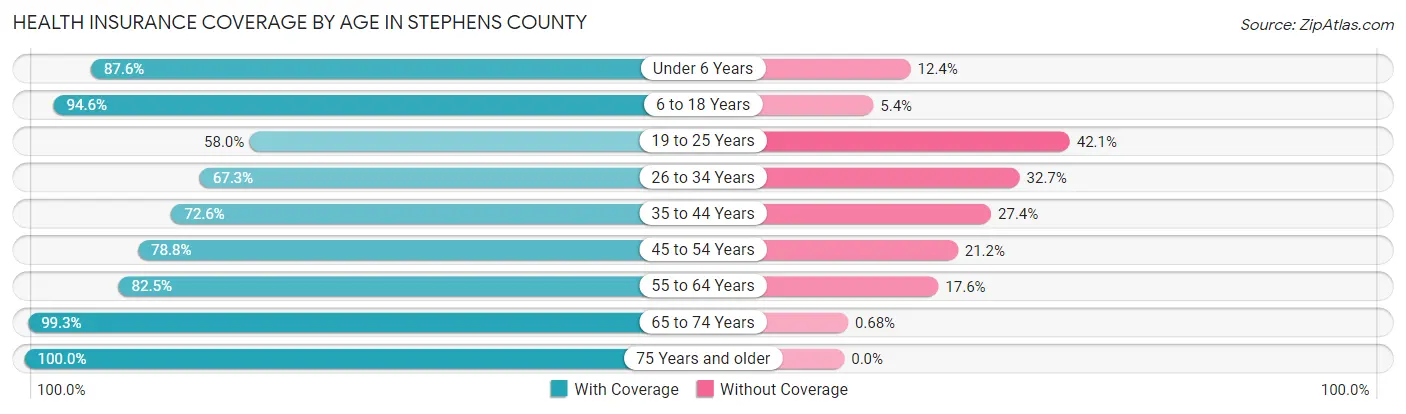
| Age Bracket | With Coverage | Without Coverage |
| Under 6 Years | 652 (87.6%) | 92 (12.4%) |
| 6 to 18 Years | 1,291 (94.6%) | 74 (5.4%) |
| 19 to 25 Years | 532 (58.0%) | 386 (42.0%) |
| 26 to 34 Years | 554 (67.3%) | 269 (32.7%) |
| 35 to 44 Years | 899 (72.6%) | 339 (27.4%) |
| 45 to 54 Years | 592 (78.8%) | 159 (21.2%) |
| 55 to 64 Years | 1,010 (82.5%) | 215 (17.5%) |
| 65 to 74 Years | 1,017 (99.3%) | 7 (0.7%) |
| 75 Years and older | 726 (100.0%) | 0 (0.0%) |
| Total | 7,273 (82.5%) | 1,541 (17.5%) |
Health Insurance Coverage by Citizenship Status in Stephens County
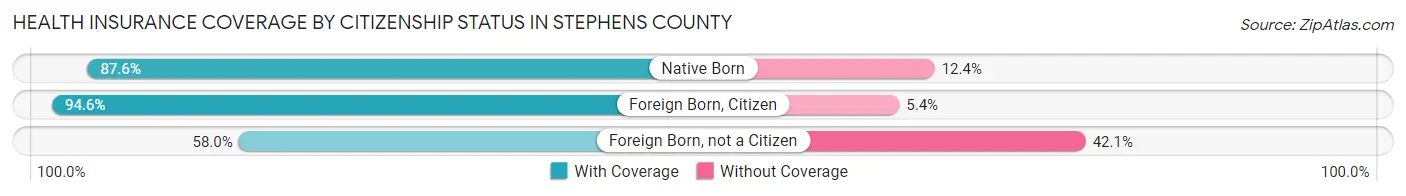
| Citizenship Status | With Coverage | Without Coverage |
| Native Born | 652 (87.6%) | 92 (12.4%) |
| Foreign Born, Citizen | 1,291 (94.6%) | 74 (5.4%) |
| Foreign Born, not a Citizen | 532 (58.0%) | 386 (42.0%) |
Health Insurance Coverage by Household Income in Stephens County
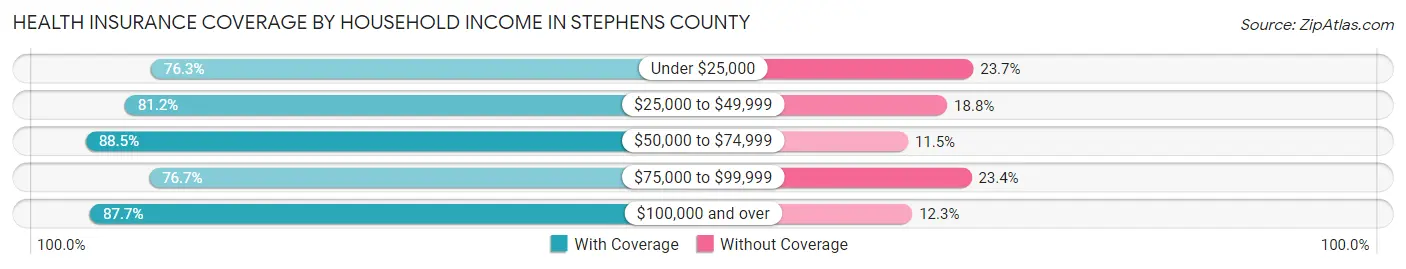
| Household Income | With Coverage | Without Coverage |
| Under $25,000 | 1,346 (76.3%) | 418 (23.7%) |
| $25,000 to $49,999 | 1,568 (81.2%) | 363 (18.8%) |
| $50,000 to $74,999 | 1,012 (88.5%) | 131 (11.5%) |
| $75,000 to $99,999 | 978 (76.6%) | 298 (23.4%) |
| $100,000 and over | 2,369 (87.7%) | 331 (12.3%) |
Public vs Private Health Insurance Coverage by Age in Stephens County
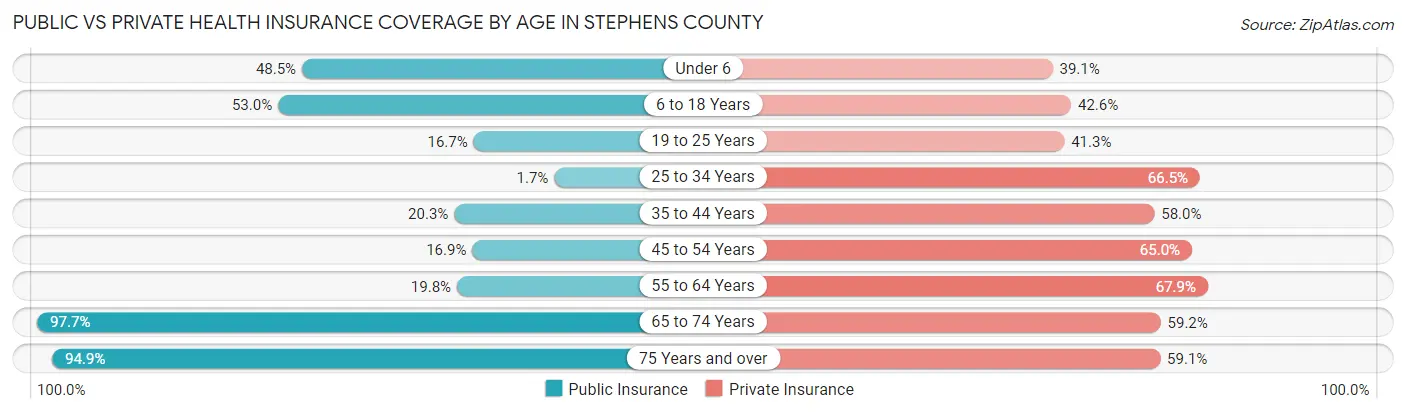
| Age Bracket | Public Insurance | Private Insurance |
| Under 6 | 361 (48.5%) | 291 (39.1%) |
| 6 to 18 Years | 723 (53.0%) | 581 (42.6%) |
| 19 to 25 Years | 153 (16.7%) | 379 (41.3%) |
| 25 to 34 Years | 14 (1.7%) | 547 (66.5%) |
| 35 to 44 Years | 251 (20.3%) | 718 (58.0%) |
| 45 to 54 Years | 127 (16.9%) | 488 (65.0%) |
| 55 to 64 Years | 242 (19.8%) | 832 (67.9%) |
| 65 to 74 Years | 1,000 (97.7%) | 606 (59.2%) |
| 75 Years and over | 689 (94.9%) | 429 (59.1%) |
| Total | 3,560 (40.4%) | 4,871 (55.3%) |
Disability Status by Sex by Age in Stephens County
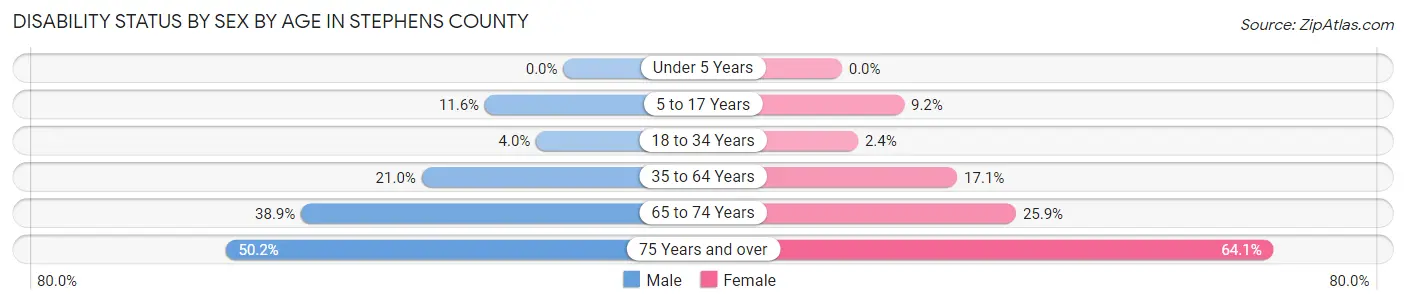
| Age Bracket | Male | Female |
| Under 5 Years | 0 (0.0%) | 0 (0.0%) |
| 5 to 17 Years | 95 (11.6%) | 63 (9.2%) |
| 18 to 34 Years | 43 (4.0%) | 18 (2.4%) |
| 35 to 64 Years | 336 (21.0%) | 277 (17.1%) |
| 65 to 74 Years | 206 (38.9%) | 128 (25.9%) |
| 75 Years and over | 149 (50.2%) | 275 (64.1%) |
Disability Class by Sex by Age in Stephens County
Disability Class: Hearing Difficulty
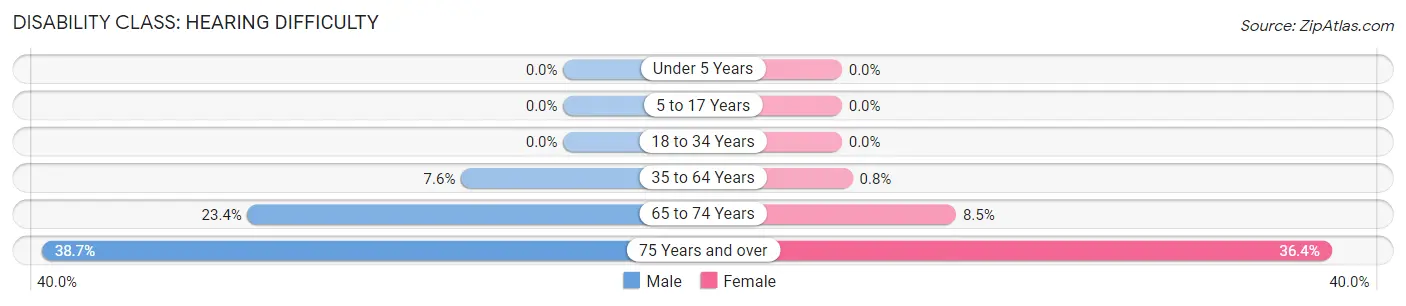
| Age Bracket | Male | Female |
| Under 5 Years | 0 (0.0%) | 0 (0.0%) |
| 5 to 17 Years | 0 (0.0%) | 0 (0.0%) |
| 18 to 34 Years | 0 (0.0%) | 0 (0.0%) |
| 35 to 64 Years | 121 (7.6%) | 13 (0.8%) |
| 65 to 74 Years | 124 (23.4%) | 42 (8.5%) |
| 75 Years and over | 115 (38.7%) | 156 (36.4%) |
Disability Class: Vision Difficulty
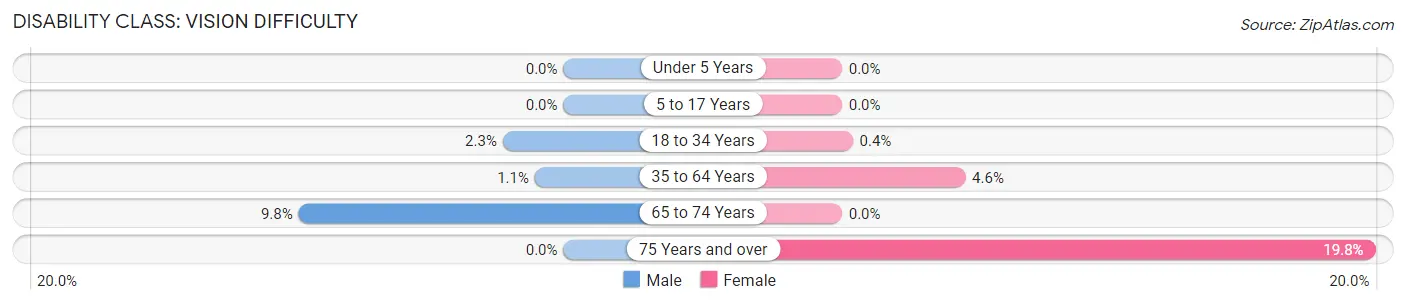
| Age Bracket | Male | Female |
| Under 5 Years | 0 (0.0%) | 0 (0.0%) |
| 5 to 17 Years | 0 (0.0%) | 0 (0.0%) |
| 18 to 34 Years | 24 (2.2%) | 3 (0.4%) |
| 35 to 64 Years | 17 (1.1%) | 74 (4.6%) |
| 65 to 74 Years | 52 (9.8%) | 0 (0.0%) |
| 75 Years and over | 0 (0.0%) | 85 (19.8%) |
Disability Class: Cognitive Difficulty
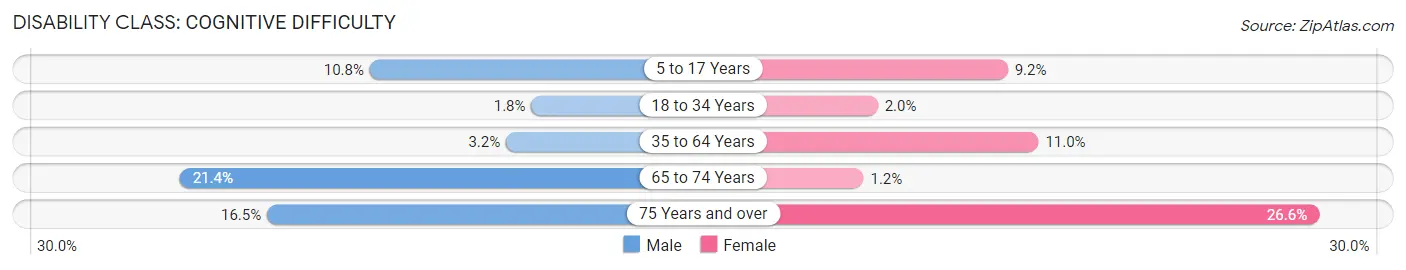
| Age Bracket | Male | Female |
| 5 to 17 Years | 88 (10.8%) | 63 (9.2%) |
| 18 to 34 Years | 19 (1.8%) | 15 (2.0%) |
| 35 to 64 Years | 51 (3.2%) | 177 (11.0%) |
| 65 to 74 Years | 113 (21.4%) | 6 (1.2%) |
| 75 Years and over | 49 (16.5%) | 114 (26.6%) |
Disability Class: Ambulatory Difficulty
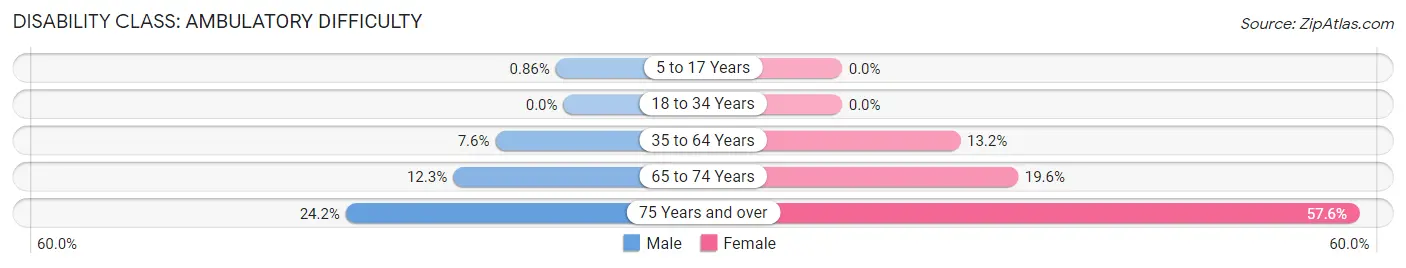
| Age Bracket | Male | Female |
| 5 to 17 Years | 7 (0.9%) | 0 (0.0%) |
| 18 to 34 Years | 0 (0.0%) | 0 (0.0%) |
| 35 to 64 Years | 121 (7.6%) | 213 (13.2%) |
| 65 to 74 Years | 65 (12.3%) | 97 (19.6%) |
| 75 Years and over | 72 (24.2%) | 247 (57.6%) |
Disability Class: Self-Care Difficulty
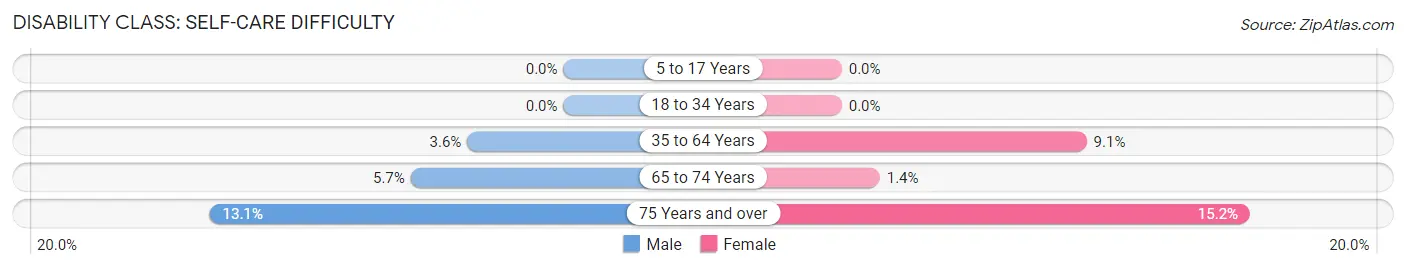
| Age Bracket | Male | Female |
| 5 to 17 Years | 0 (0.0%) | 0 (0.0%) |
| 18 to 34 Years | 0 (0.0%) | 0 (0.0%) |
| 35 to 64 Years | 57 (3.6%) | 147 (9.1%) |
| 65 to 74 Years | 30 (5.7%) | 7 (1.4%) |
| 75 Years and over | 39 (13.1%) | 65 (15.1%) |
Technology Access in Stephens County
Computing Device Access in Stephens County
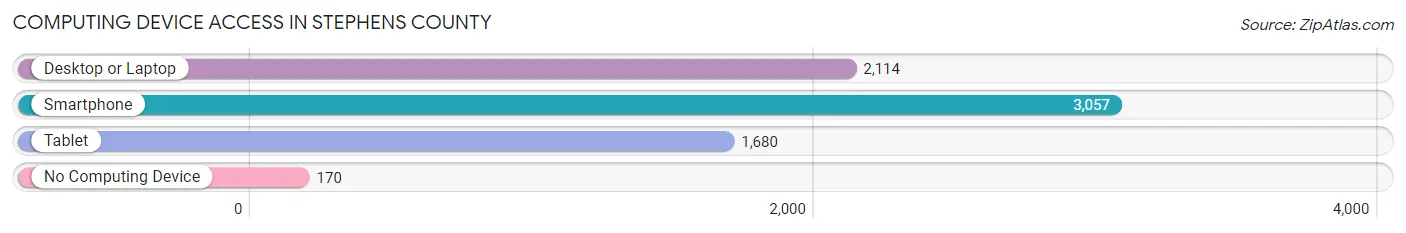
| Device Type | # Households | % Households |
| Desktop or Laptop | 2,114 | 62.1% |
| Smartphone | 3,057 | 89.8% |
| Tablet | 1,680 | 49.3% |
| No Computing Device | 170 | 5.0% |
| Total | 3,405 | 100.0% |
Internet Access in Stephens County
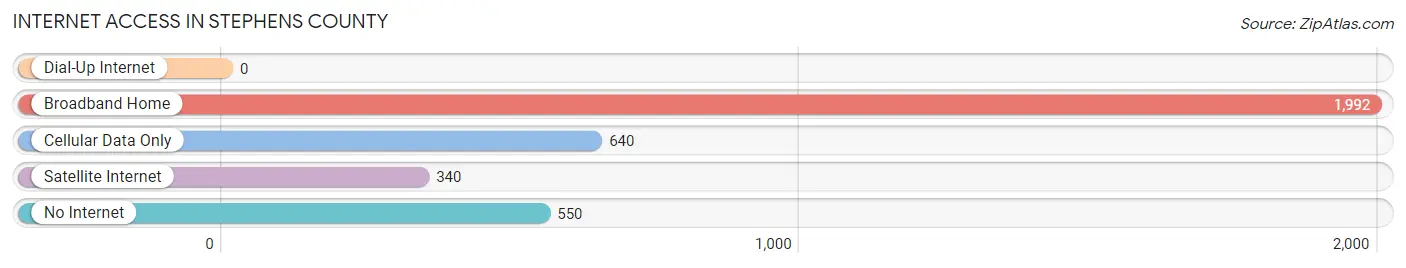
| Internet Type | # Households | % Households |
| Dial-Up Internet | 0 | 0.0% |
| Broadband Home | 1,992 | 58.5% |
| Cellular Data Only | 640 | 18.8% |
| Satellite Internet | 340 | 10.0% |
| No Internet | 550 | 16.2% |
| Total | 3,405 | 100.0% |
Stephens County Summary
Stephens County is located in the north-central region of Texas, and is part of the Big Country region. It is bordered by Eastland County to the north, Palo Pinto County to the east, Erath County to the south, and Shackelford County to the west. The county seat is Breckenridge, and the largest city is also Breckenridge. As of the 2010 census, the population of Stephens County was 9,630.
Geography
Stephens County is located in the rolling hills of the Edwards Plateau, and is part of the Cross Timbers region. The county is mostly covered in grasslands, with some areas of woodlands. The county is drained by the Brazos River, which flows through the western part of the county. The county is also home to several small lakes, including Lake Breckenridge, Lake Cisco, and Lake Ranger.
The terrain of Stephens County is mostly flat to gently rolling, with elevations ranging from 800 to 1,200 feet above sea level. The county has a total area of 902 square miles, of which 899 square miles is land and 3 square miles is water.
History
Stephens County was established in 1876 from parts of Bosque and Eastland counties. It was named for Alexander H. Stephens, the Vice President of the Confederate States of America. The county was originally populated by Native American tribes, including the Comanche, Kiowa, and Apache.
The first settlers in the county were ranchers, who began arriving in the late 1870s. The first town in the county was Breckenridge, which was established in 1878. The town was named after John Breckenridge, the Vice President of the United States under James Buchanan.
In the early 1880s, the Texas and Pacific Railway was built through the county, connecting Breckenridge to other towns in the region. This allowed for the development of the county’s economy, and the population began to grow.
Economy
The economy of Stephens County is largely based on agriculture and oil and gas production. The county is home to several large ranches, and the main crops grown in the county are cotton, wheat, and hay.
The oil and gas industry is also an important part of the county’s economy. Stephens County is home to several large oil and gas fields, and the county produces more than 1 million barrels of oil per year.
Demographics
As of the 2010 census, the population of Stephens County was 9,630. The racial makeup of the county was 81.3% White, 11.7% Hispanic or Latino, 5.2% African American, 0.7% Native American, 0.3% Asian, and 0.2% Pacific Islander.
The median household income in Stephens County was $37,945, and the median family income was $45,938. The per capita income was $19,945. About 16.2% of the population was below the poverty line.
Conclusion
Stephens County is located in the north-central region of Texas, and is part of the Big Country region. It is bordered by Eastland County to the north, Palo Pinto County to the east, Erath County to the south, and Shackelford County to the west. The county was established in 1876, and is named for Alexander H. Stephens, the Vice President of the Confederate States of America. The economy of Stephens County is largely based on agriculture and oil and gas production. As of the 2010 census, the population of Stephens County was 9,630.
Common Questions
What is Per Capita Income in Stephens County?
Per Capita income in Stephens County is $28,231.
What is the Median Family Income in Stephens County?
Median Family Income in Stephens County is $61,879.
What is the Median Household income in Stephens County?
Median Household Income in Stephens County is $44,712.
What is Income or Wage Gap in Stephens County?
Income or Wage Gap in Stephens County is 24.9%.
Women in Stephens County earn 75.1 cents for every dollar earned by a man.
What is Inequality or Gini Index in Stephens County?
Inequality or Gini Index in Stephens County is 0.50.
What is the Total Population of Stephens County?
Total Population of Stephens County is 9,260.
What is the Total Male Population of Stephens County?
Total Male Population of Stephens County is 4,997.
What is the Total Female Population of Stephens County?
Total Female Population of Stephens County is 4,263.
What is the Ratio of Males per 100 Females in Stephens County?
There are 117.22 Males per 100 Females in Stephens County.
What is the Ratio of Females per 100 Males in Stephens County?
There are 85.31 Females per 100 Males in Stephens County.
What is the Median Population Age in Stephens County?
Median Population Age in Stephens County is 40.9 Years.
What is the Average Family Size in Stephens County
Average Family Size in Stephens County is 3.2 People.
What is the Average Household Size in Stephens County
Average Household Size in Stephens County is 2.6 People.
How Large is the Labor Force in Stephens County?
There are 4,221 People in the Labor Forcein in Stephens County.
What is the Percentage of People in the Labor Force in Stephens County?
56.7% of People are in the Labor Force in Stephens County.
What is the Unemployment Rate in Stephens County?
Unemployment Rate in Stephens County is 8.6%.