Starr County, TX Map & Demographics
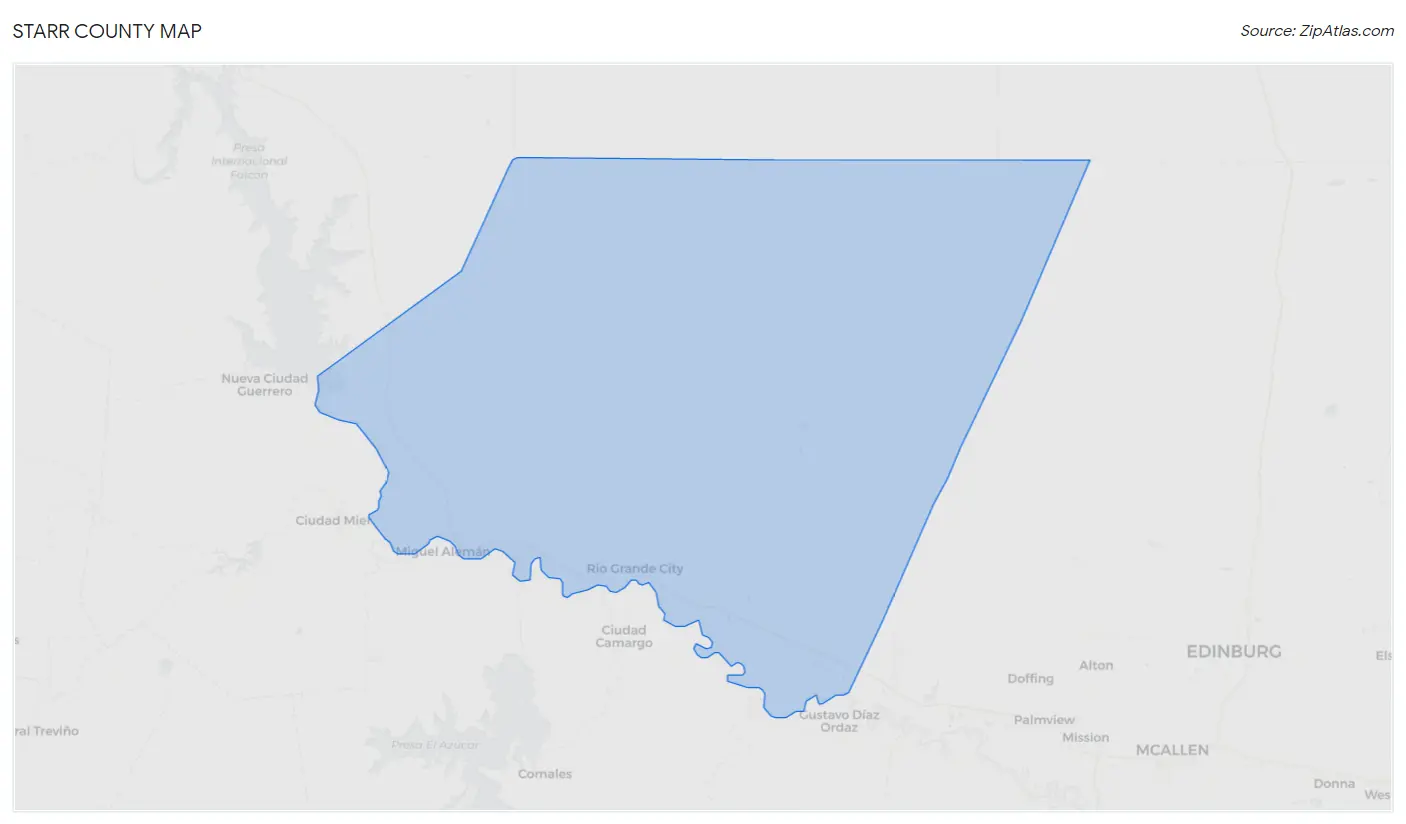
Starr County Map
Starr County Overview
$16,934
PER CAPITA INCOME
$42,033
AVG FAMILY INCOME
$35,979
AVG HOUSEHOLD INCOME
30.3%
WAGE / INCOME GAP [ % ]
69.7¢/ $1
WAGE / INCOME GAP [ $ ]
$10,748
FAMILY INCOME DEFICIT
0.51
INEQUALITY / GINI INDEX
65,716
TOTAL POPULATION
32,196
MALE POPULATION
33,520
FEMALE POPULATION
96.05
MALES / 100 FEMALES
104.11
FEMALES / 100 MALES
28.6
MEDIAN AGE
4.1
AVG FAMILY SIZE
3.5
AVG HOUSEHOLD SIZE
27,229
LABOR FORCE [ PEOPLE ]
58.2%
PERCENT IN LABOR FORCE
11.5%
UNEMPLOYMENT RATE
Starr County Area Codes
Income in Starr County
Income Overview in Starr County
Per Capita Income in Starr County is $16,934, while median incomes of families and households are $42,033 and $35,979 respectively.
| Characteristic | Number | Measure |
| Per Capita Income | 65,716 | $16,934 |
| Median Family Income | 14,539 | $42,033 |
| Mean Family Income | 14,539 | $61,583 |
| Median Household Income | 18,634 | $35,979 |
| Mean Household Income | 18,634 | $53,913 |
| Income Deficit | 14,539 | $10,748 |
| Wage / Income Gap (%) | 65,716 | 30.32% |
| Wage / Income Gap ($) | 65,716 | 69.68¢ per $1 |
| Gini / Inequality Index | 65,716 | 0.51 |
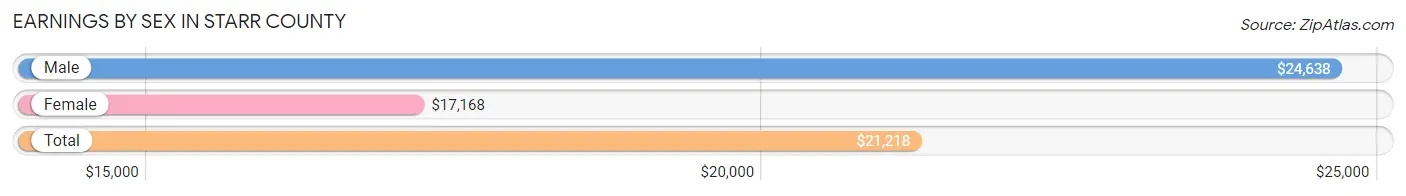
Earnings by Sex in Starr County
Average Earnings in Starr County are $21,218, $24,638 for men and $17,168 for women, a difference of 30.3%.
| Sex | Number | Average Earnings |
| Male | 14,611 (52.5%) | $24,638 |
| Female | 13,235 (47.5%) | $17,168 |
| Total | 27,846 (100.0%) | $21,218 |
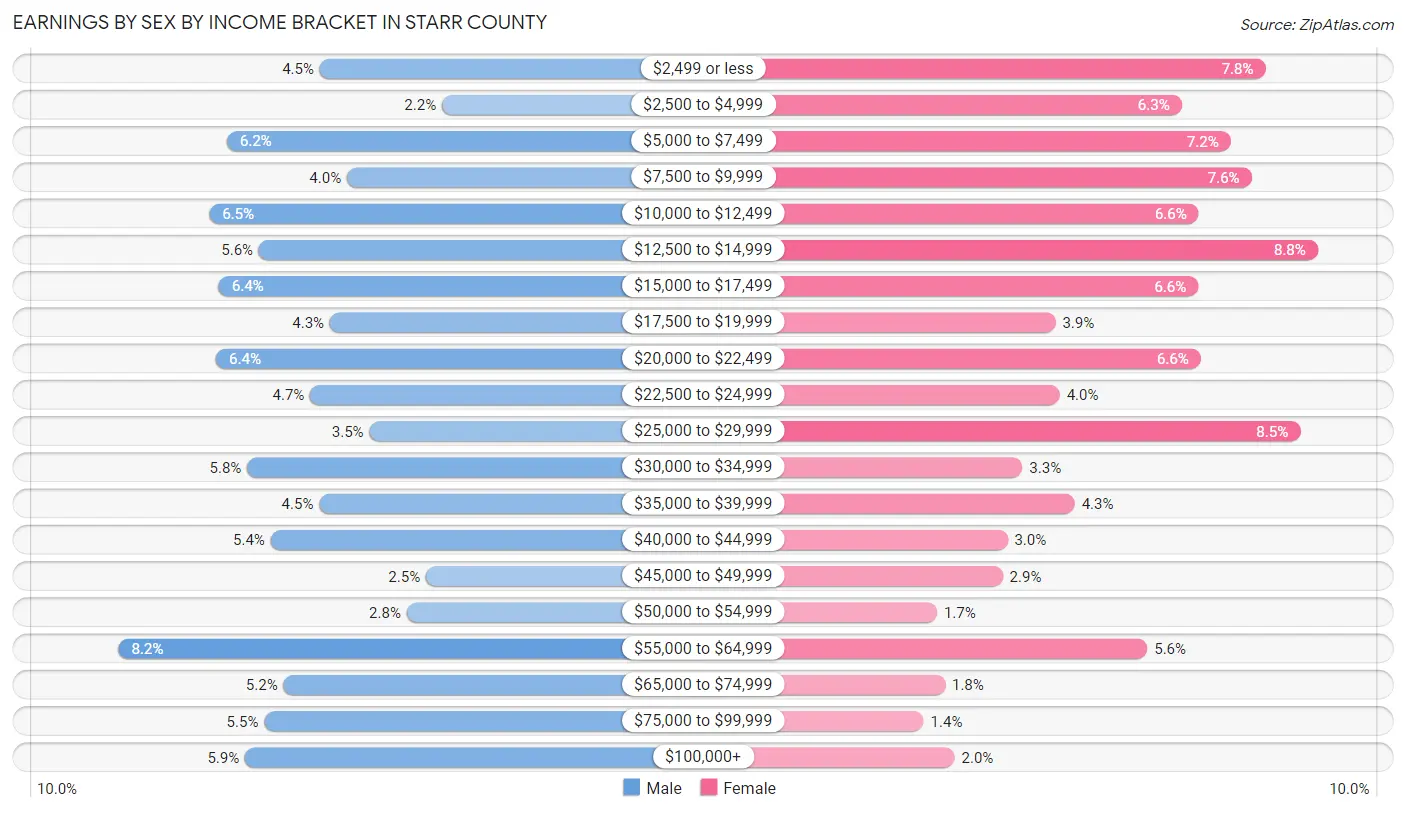
Earnings by Sex by Income Bracket in Starr County
The most common earnings brackets in Starr County are $55,000 to $64,999 for men (1,204 | 8.2%) and $12,500 to $14,999 for women (1,167 | 8.8%).
| Income | Male | Female |
| $2,499 or less | 653 (4.5%) | 1,038 (7.8%) |
| $2,500 to $4,999 | 319 (2.2%) | 830 (6.3%) |
| $5,000 to $7,499 | 908 (6.2%) | 952 (7.2%) |
| $7,500 to $9,999 | 579 (4.0%) | 1,003 (7.6%) |
| $10,000 to $12,499 | 955 (6.5%) | 872 (6.6%) |
| $12,500 to $14,999 | 820 (5.6%) | 1,167 (8.8%) |
| $15,000 to $17,499 | 929 (6.4%) | 871 (6.6%) |
| $17,500 to $19,999 | 625 (4.3%) | 518 (3.9%) |
| $20,000 to $22,499 | 936 (6.4%) | 878 (6.6%) |
| $22,500 to $24,999 | 680 (4.6%) | 528 (4.0%) |
| $25,000 to $29,999 | 517 (3.5%) | 1,123 (8.5%) |
| $30,000 to $34,999 | 852 (5.8%) | 435 (3.3%) |
| $35,000 to $39,999 | 654 (4.5%) | 565 (4.3%) |
| $40,000 to $44,999 | 787 (5.4%) | 398 (3.0%) |
| $45,000 to $49,999 | 363 (2.5%) | 387 (2.9%) |
| $50,000 to $54,999 | 415 (2.8%) | 224 (1.7%) |
| $55,000 to $64,999 | 1,204 (8.2%) | 745 (5.6%) |
| $65,000 to $74,999 | 753 (5.1%) | 244 (1.8%) |
| $75,000 to $99,999 | 805 (5.5%) | 190 (1.4%) |
| $100,000+ | 857 (5.9%) | 267 (2.0%) |
| Total | 14,611 (100.0%) | 13,235 (100.0%) |
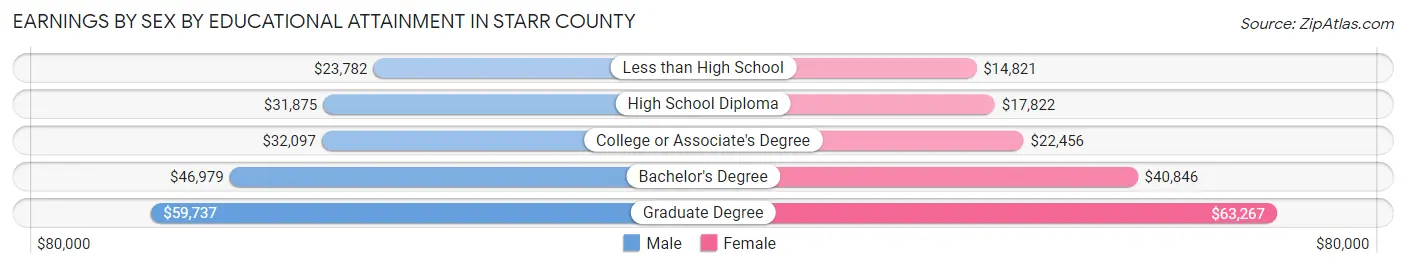
Earnings by Sex by Educational Attainment in Starr County
Average earnings in Starr County are $30,689 for men and $20,808 for women, a difference of 32.2%. Men with an educational attainment of graduate degree enjoy the highest average annual earnings of $59,737, while those with less than high school education earn the least with $23,782. Women with an educational attainment of graduate degree earn the most with the average annual earnings of $63,267, while those with less than high school education have the smallest earnings of $14,821.
| Educational Attainment | Male Income | Female Income |
| Less than High School | $23,782 | $14,821 |
| High School Diploma | $31,875 | $17,822 |
| College or Associate's Degree | $32,097 | $22,456 |
| Bachelor's Degree | $46,979 | $40,846 |
| Graduate Degree | $59,737 | $63,267 |
| Total | $30,689 | $20,808 |
Family Income in Starr County
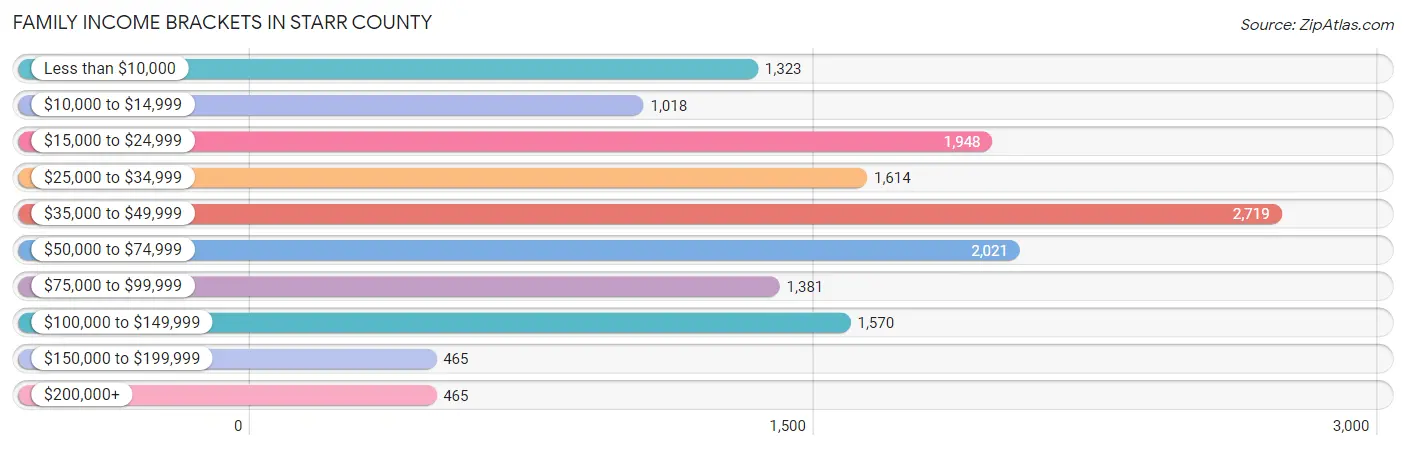
Family Income Brackets in Starr County
According to the Starr County family income data, there are 2,719 families falling into the $35,000 to $49,999 income range, which is the most common income bracket and makes up 18.7% of all families. Conversely, the $150,000 to $199,999 income bracket is the least frequent group with only 465 families (3.2%) belonging to this category.
| Income Bracket | # Families | % Families |
| Less than $10,000 | 1,323 | 9.1% |
| $10,000 to $14,999 | 1,018 | 7.0% |
| $15,000 to $24,999 | 1,948 | 13.4% |
| $25,000 to $34,999 | 1,614 | 11.1% |
| $35,000 to $49,999 | 2,719 | 18.7% |
| $50,000 to $74,999 | 2,021 | 13.9% |
| $75,000 to $99,999 | 1,381 | 9.5% |
| $100,000 to $149,999 | 1,570 | 10.8% |
| $150,000 to $199,999 | 465 | 3.2% |
| $200,000+ | 465 | 3.2% |
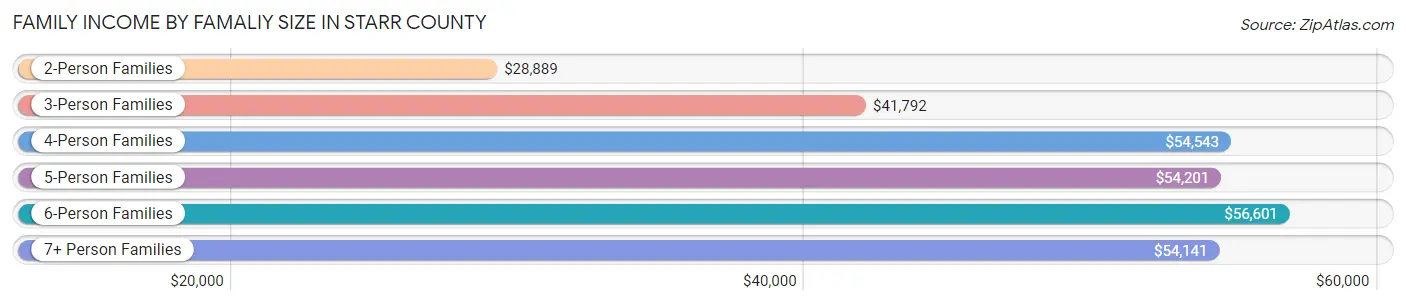
Family Income by Famaliy Size in Starr County
6-person families (603 | 4.2%) account for the highest median family income in Starr County with $56,601 per family, while 2-person families (4,624 | 31.8%) have the highest median income of $14,444 per family member.
| Income Bracket | # Families | Median Income |
| 2-Person Families | 4,624 (31.8%) | $28,889 |
| 3-Person Families | 3,715 (25.6%) | $41,792 |
| 4-Person Families | 3,195 (22.0%) | $54,543 |
| 5-Person Families | 1,932 (13.3%) | $54,201 |
| 6-Person Families | 603 (4.2%) | $56,601 |
| 7+ Person Families | 470 (3.2%) | $54,141 |
| Total | 14,539 (100.0%) | $42,033 |
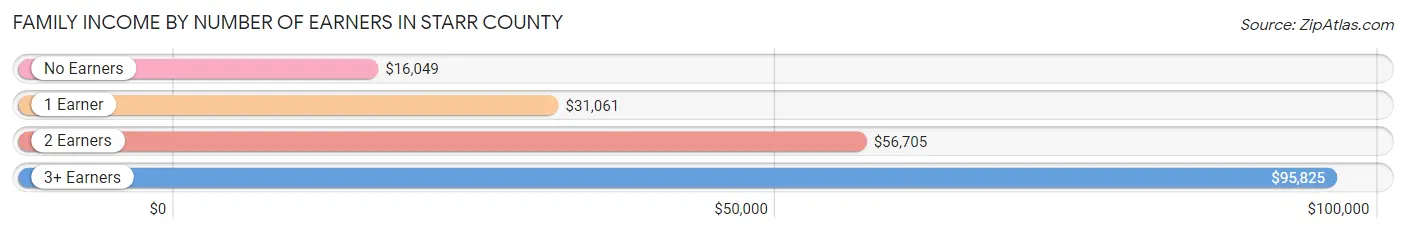
Family Income by Number of Earners in Starr County
The median family income in Starr County is $42,033, with families comprising 3+ earners (1,853) having the highest median family income of $95,825, while families with no earners (1,751) have the lowest median family income of $16,049, accounting for 12.8% and 12.0% of families, respectively.
| Number of Earners | # Families | Median Income |
| No Earners | 1,751 (12.0%) | $16,049 |
| 1 Earner | 5,990 (41.2%) | $31,061 |
| 2 Earners | 4,945 (34.0%) | $56,705 |
| 3+ Earners | 1,853 (12.8%) | $95,825 |
| Total | 14,539 (100.0%) | $42,033 |
Household Income in Starr County
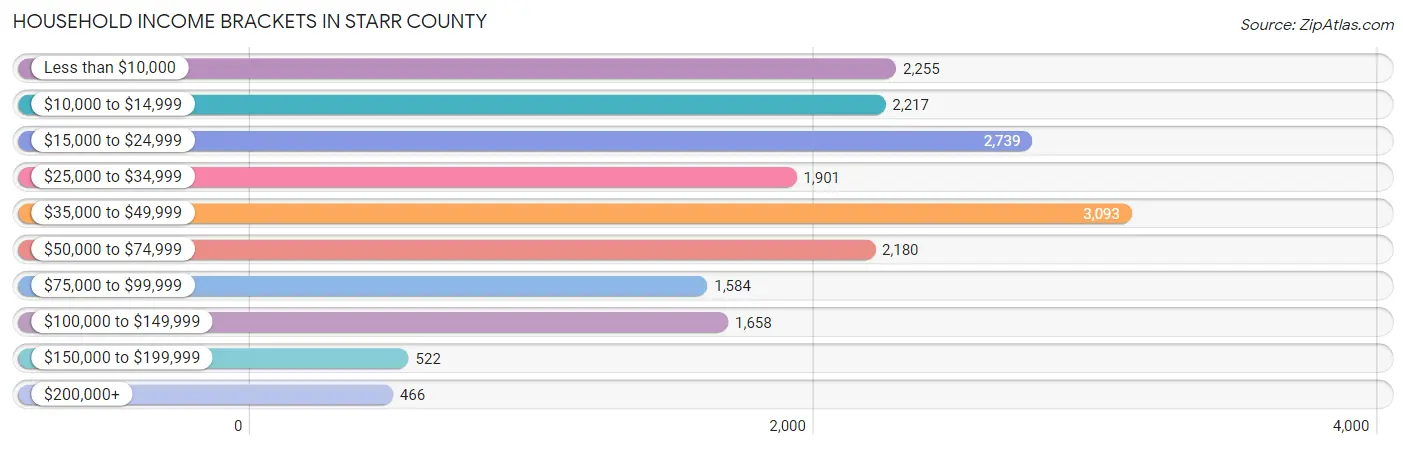
Household Income Brackets in Starr County
With 3,093 households falling in the category, the $35,000 to $49,999 income range is the most frequent in Starr County, accounting for 16.6% of all households. In contrast, only 466 households (2.5%) fall into the $200,000+ income bracket, making it the least populous group.
| Income Bracket | # Households | % Households |
| Less than $10,000 | 2,255 | 12.1% |
| $10,000 to $14,999 | 2,217 | 11.9% |
| $15,000 to $24,999 | 2,739 | 14.7% |
| $25,000 to $34,999 | 1,901 | 10.2% |
| $35,000 to $49,999 | 3,093 | 16.6% |
| $50,000 to $74,999 | 2,180 | 11.7% |
| $75,000 to $99,999 | 1,584 | 8.5% |
| $100,000 to $149,999 | 1,658 | 8.9% |
| $150,000 to $199,999 | 522 | 2.8% |
| $200,000+ | 466 | 2.5% |
Household Income by Householder Age in Starr County
The median household income in Starr County is $35,979, with the highest median household income of $48,970 found in the 25 to 44 years age bracket for the primary householder. A total of 6,119 households (32.8%) fall into this category. Meanwhile, the 15 to 24 years age bracket for the primary householder has the lowest median household income of $0, with 873 households (4.7%) in this group.
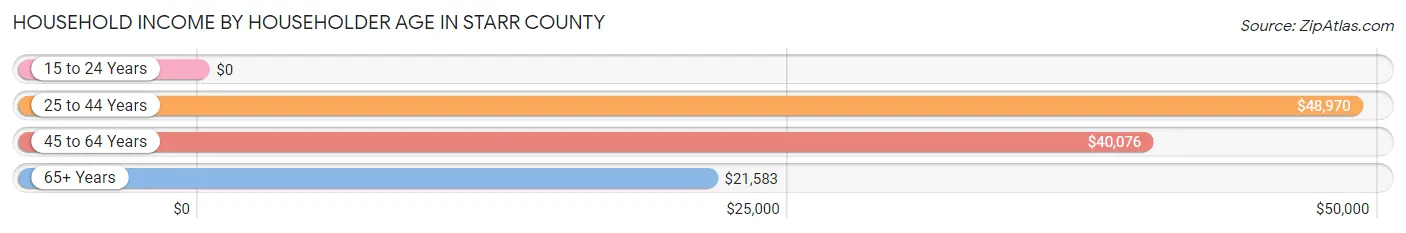
| Income Bracket | # Households | Median Income |
| 15 to 24 Years | 873 (4.7%) | $0 |
| 25 to 44 Years | 6,119 (32.8%) | $48,970 |
| 45 to 64 Years | 6,842 (36.7%) | $40,076 |
| 65+ Years | 4,800 (25.8%) | $21,583 |
| Total | 18,634 (100.0%) | $35,979 |
Poverty in Starr County
Income Below Poverty by Sex and Age in Starr County
With 29.2% poverty level for males and 37.5% for females among the residents of Starr County, under 5 year old males and 15 year old females are the most vulnerable to poverty, with 1,574 males (50.0%) and 286 females (58.3%) in their respective age groups living below the poverty level.
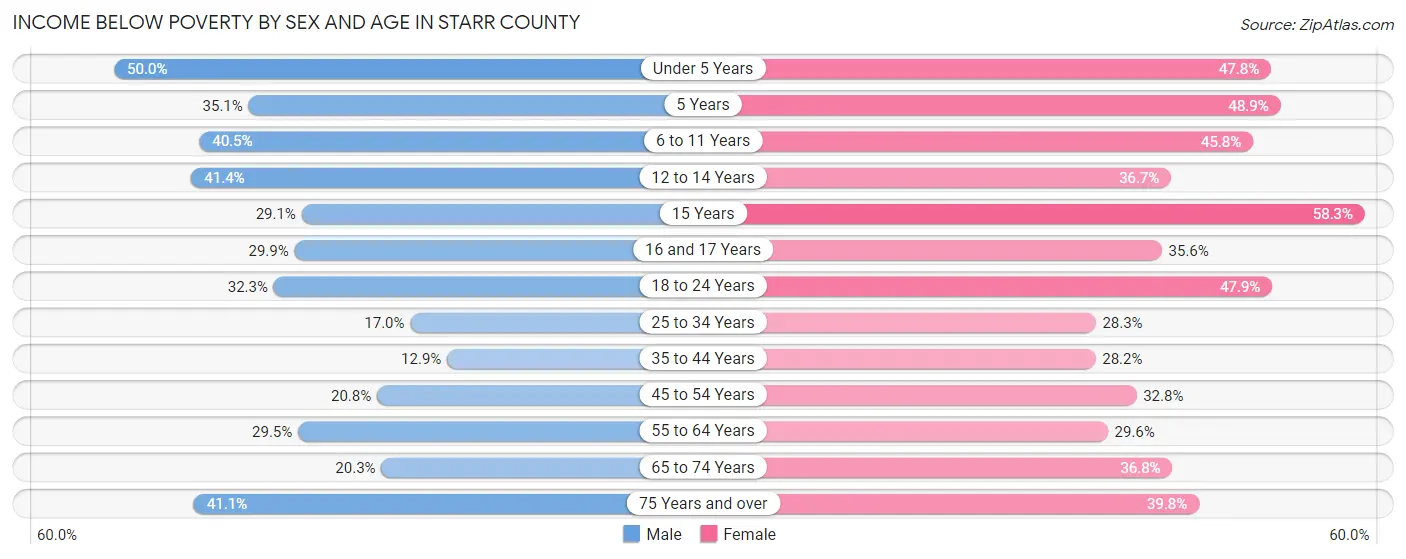
| Age Bracket | Male | Female |
| Under 5 Years | 1,574 (50.0%) | 1,404 (47.8%) |
| 5 Years | 307 (35.0%) | 279 (48.9%) |
| 6 to 11 Years | 1,343 (40.5%) | 1,572 (45.8%) |
| 12 to 14 Years | 756 (41.4%) | 691 (36.7%) |
| 15 Years | 118 (29.1%) | 286 (58.3%) |
| 16 and 17 Years | 382 (29.9%) | 437 (35.6%) |
| 18 to 24 Years | 1,221 (32.3%) | 1,888 (47.9%) |
| 25 to 34 Years | 744 (17.0%) | 1,208 (28.2%) |
| 35 to 44 Years | 470 (12.9%) | 1,062 (28.2%) |
| 45 to 54 Years | 704 (20.7%) | 1,216 (32.8%) |
| 55 to 64 Years | 732 (29.5%) | 873 (29.6%) |
| 65 to 74 Years | 404 (20.3%) | 862 (36.8%) |
| 75 Years and over | 499 (41.1%) | 764 (39.8%) |
| Total | 9,254 (29.2%) | 12,542 (37.5%) |
Income Above Poverty by Sex and Age in Starr County
According to the poverty statistics in Starr County, males aged 35 to 44 years and females aged 35 to 44 years are the age groups that are most secure financially, with 87.1% of males and 71.8% of females in these age groups living above the poverty line.
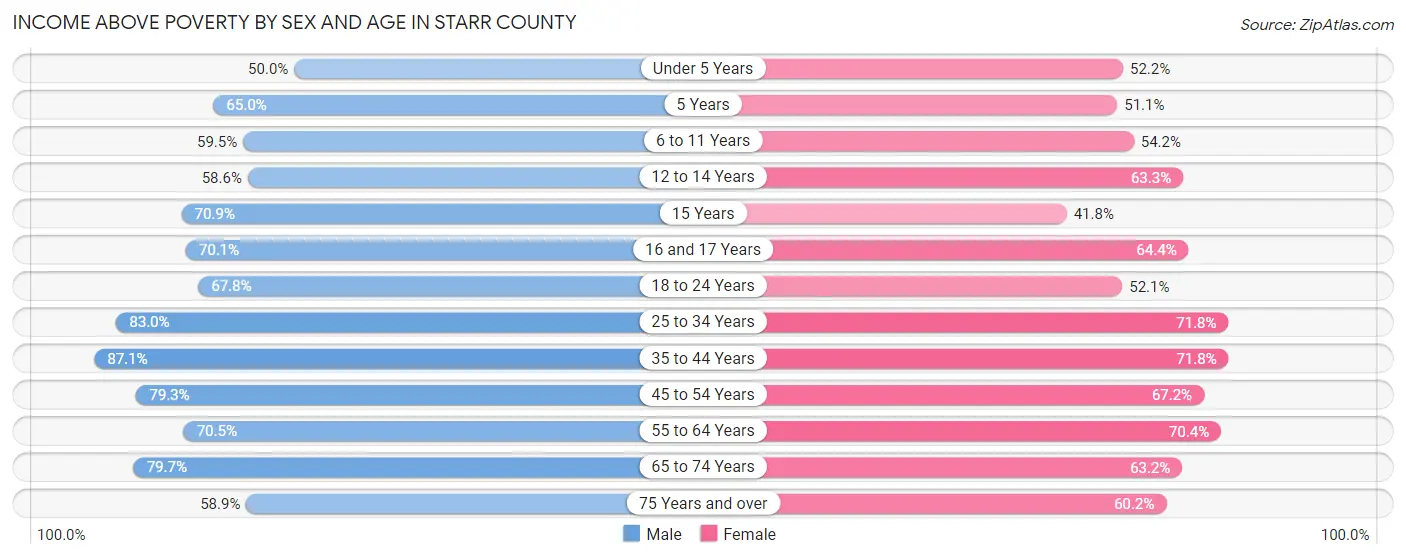
| Age Bracket | Male | Female |
| Under 5 Years | 1,572 (50.0%) | 1,533 (52.2%) |
| 5 Years | 569 (64.9%) | 292 (51.1%) |
| 6 to 11 Years | 1,970 (59.5%) | 1,860 (54.2%) |
| 12 to 14 Years | 1,069 (58.6%) | 1,193 (63.3%) |
| 15 Years | 287 (70.9%) | 205 (41.7%) |
| 16 and 17 Years | 894 (70.1%) | 790 (64.4%) |
| 18 to 24 Years | 2,565 (67.7%) | 2,051 (52.1%) |
| 25 to 34 Years | 3,622 (83.0%) | 3,068 (71.8%) |
| 35 to 44 Years | 3,162 (87.1%) | 2,700 (71.8%) |
| 45 to 54 Years | 2,688 (79.2%) | 2,493 (67.2%) |
| 55 to 64 Years | 1,746 (70.5%) | 2,076 (70.4%) |
| 65 to 74 Years | 1,590 (79.7%) | 1,479 (63.2%) |
| 75 Years and over | 714 (58.9%) | 1,156 (60.2%) |
| Total | 22,448 (70.8%) | 20,896 (62.5%) |
Income Below Poverty Among Married-Couple Families in Starr County
The poverty statistics for married-couple families in Starr County show that 19.8% or 1,683 of the total 8,496 families live below the poverty line. Families with 5 or more children have the highest poverty rate of 78.1%, comprising of 89 families. On the other hand, families with no children have the lowest poverty rate of 16.3%, which includes 608 families.
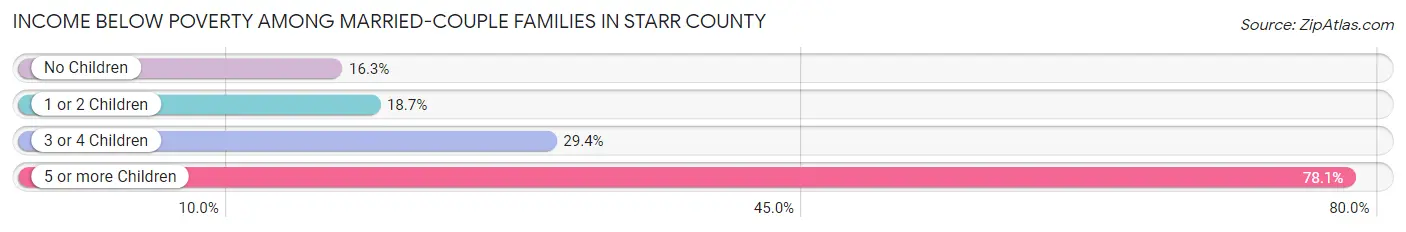
| Children | Above Poverty | Below Poverty |
| No Children | 3,113 (83.7%) | 608 (16.3%) |
| 1 or 2 Children | 2,909 (81.4%) | 667 (18.6%) |
| 3 or 4 Children | 766 (70.6%) | 319 (29.4%) |
| 5 or more Children | 25 (21.9%) | 89 (78.1%) |
| Total | 6,813 (80.2%) | 1,683 (19.8%) |
Income Below Poverty Among Single-Parent Households in Starr County
According to the poverty data in Starr County, 30.9% or 280 single-father households and 47.1% or 2,419 single-mother households are living below the poverty line. Among single-father households, those with 3 or 4 children have the highest poverty rate, with 95 households (52.5%) experiencing poverty. Likewise, among single-mother households, those with 5 or more children have the highest poverty rate, with 46 households (100.0%) falling below the poverty line.
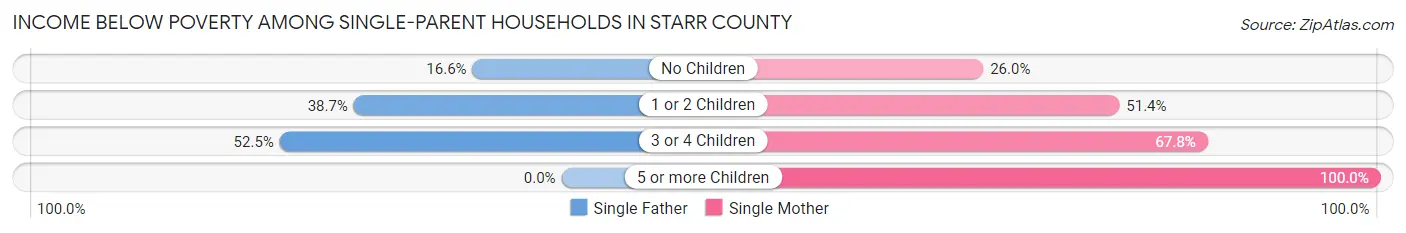
| Children | Single Father | Single Mother |
| No Children | 72 (16.6%) | 402 (26.0%) |
| 1 or 2 Children | 113 (38.7%) | 1,348 (51.3%) |
| 3 or 4 Children | 95 (52.5%) | 623 (67.8%) |
| 5 or more Children | 0 (0.0%) | 46 (100.0%) |
| Total | 280 (30.9%) | 2,419 (47.1%) |
Income Below Poverty Among Married-Couple vs Single-Parent Households in Starr County
The poverty data for Starr County shows that 1,683 of the married-couple family households (19.8%) and 2,699 of the single-parent households (44.7%) are living below the poverty level. Within the married-couple family households, those with 5 or more children have the highest poverty rate, with 89 households (78.1%) falling below the poverty line. Among the single-parent households, those with 5 or more children have the highest poverty rate, with 46 household (100.0%) living below poverty.
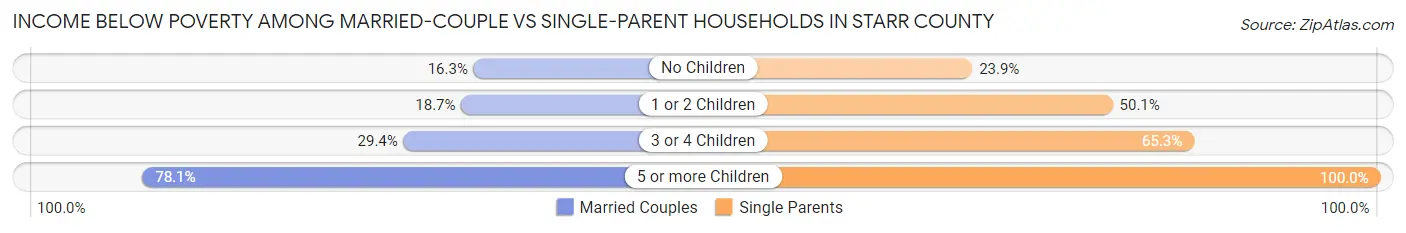
| Children | Married-Couple Families | Single-Parent Households |
| No Children | 608 (16.3%) | 474 (23.9%) |
| 1 or 2 Children | 667 (18.6%) | 1,461 (50.1%) |
| 3 or 4 Children | 319 (29.4%) | 718 (65.3%) |
| 5 or more Children | 89 (78.1%) | 46 (100.0%) |
| Total | 1,683 (19.8%) | 2,699 (44.7%) |
Race in Starr County
The most populous races in Starr County are Hispanic or Latino (63,245 | 96.2%), White / Caucasian (37,809 | 57.5%), and Two or more Races (22,905 | 34.8%).
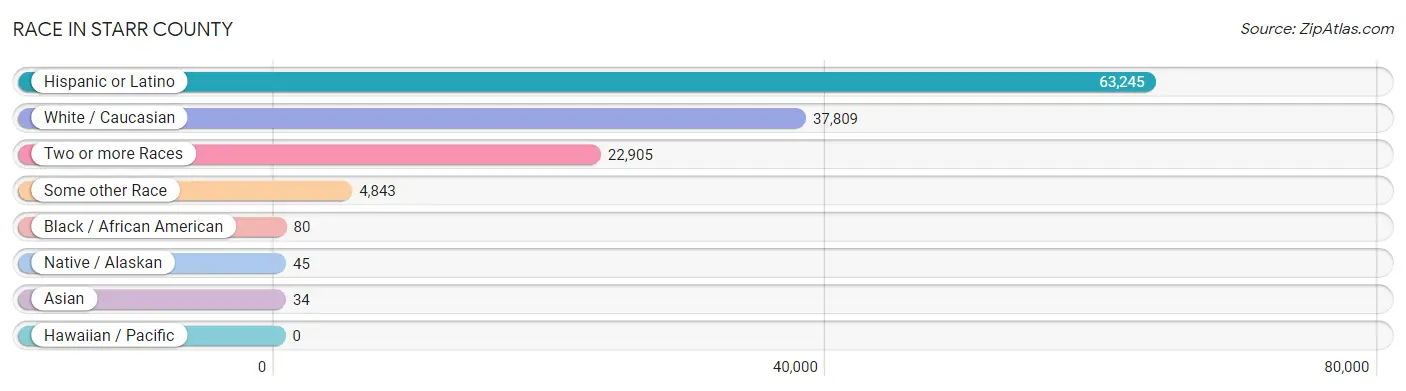
| Race | # Population | % Population |
| Asian | 34 | 0.1% |
| Black / African American | 80 | 0.1% |
| Hawaiian / Pacific | 0 | 0.0% |
| Hispanic or Latino | 63,245 | 96.2% |
| Native / Alaskan | 45 | 0.1% |
| White / Caucasian | 37,809 | 57.5% |
| Two or more Races | 22,905 | 34.8% |
| Some other Race | 4,843 | 7.4% |
| Total | 65,716 | 100.0% |
Ancestry in Starr County
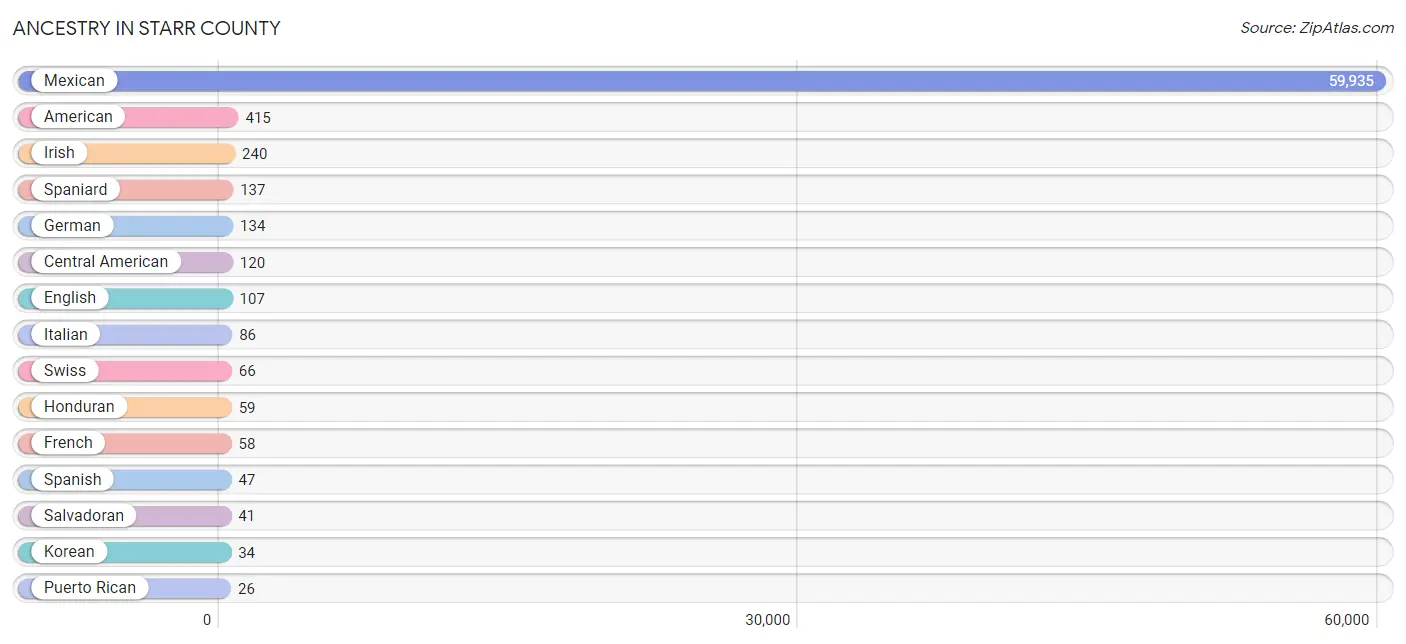
The most populous ancestries reported in Starr County are Mexican (59,935 | 91.2%), American (415 | 0.6%), Irish (240 | 0.4%), Spaniard (137 | 0.2%), and German (134 | 0.2%), together accounting for 92.6% of all Starr County residents.
| Ancestry | # Population | % Population |
| African | 8 | 0.0% |
| American | 415 | 0.6% |
| Apache | 17 | 0.0% |
| Arab | 1 | 0.0% |
| Basque | 18 | 0.0% |
| British | 20 | 0.0% |
| Central American | 120 | 0.2% |
| Choctaw | 6 | 0.0% |
| Czech | 19 | 0.0% |
| Danish | 2 | 0.0% |
| Egyptian | 1 | 0.0% |
| English | 107 | 0.2% |
| French | 58 | 0.1% |
| German | 134 | 0.2% |
| Greek | 16 | 0.0% |
| Guatemalan | 13 | 0.0% |
| Honduran | 59 | 0.1% |
| Irish | 240 | 0.4% |
| Italian | 86 | 0.1% |
| Korean | 34 | 0.1% |
| Mexican | 59,935 | 91.2% |
| Nicaraguan | 5 | 0.0% |
| Norwegian | 9 | 0.0% |
| Panamanian | 2 | 0.0% |
| Polish | 2 | 0.0% |
| Puerto Rican | 26 | 0.0% |
| Salvadoran | 41 | 0.1% |
| Scotch-Irish | 15 | 0.0% |
| Scottish | 23 | 0.0% |
| Spaniard | 137 | 0.2% |
| Spanish | 47 | 0.1% |
| Subsaharan African | 8 | 0.0% |
| Swiss | 66 | 0.1% |
| Welsh | 26 | 0.0% | View All 34 Rows |
Immigrants in Starr County
The most numerous immigrant groups reported in Starr County came from Central America (17,274 | 26.3%), Latin America (17,274 | 26.3%), Mexico (17,158 | 26.1%), Guatemala (36 | 0.1%), and Honduras (36 | 0.1%), together accounting for 78.8% of all Starr County residents.
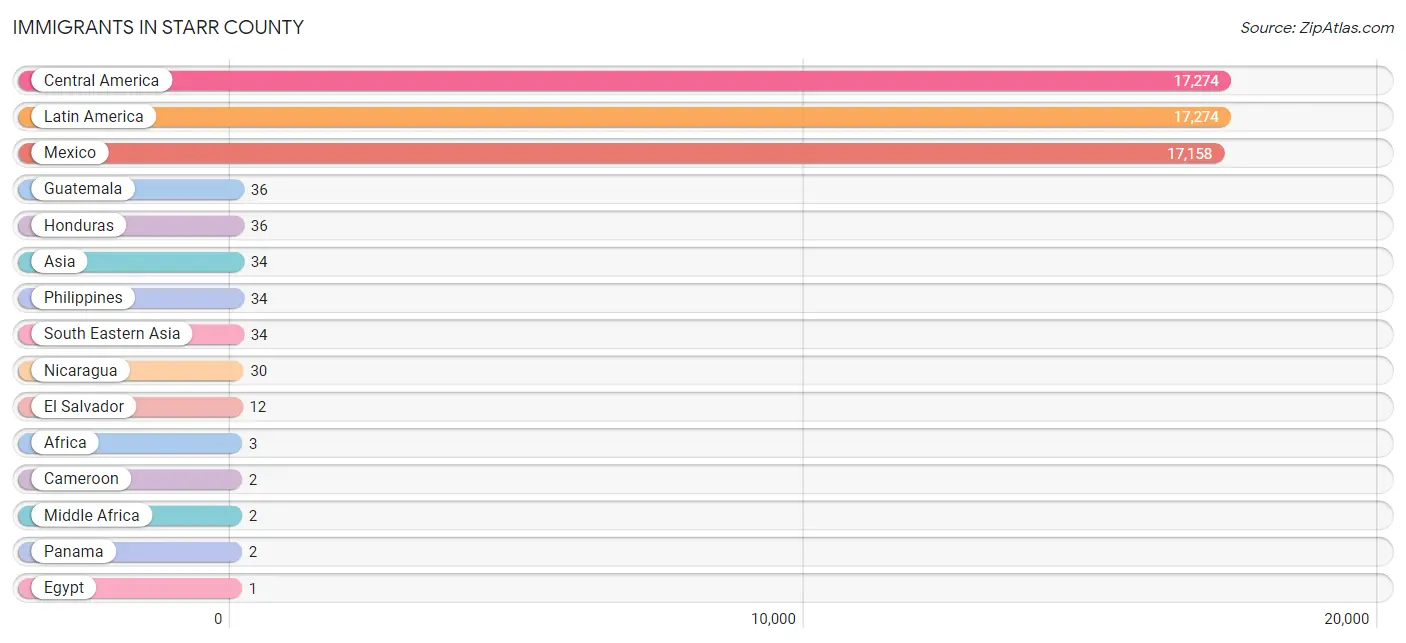
| Immigration Origin | # Population | % Population |
| Africa | 3 | 0.0% |
| Asia | 34 | 0.1% |
| Cameroon | 2 | 0.0% |
| Central America | 17,274 | 26.3% |
| Egypt | 1 | 0.0% |
| El Salvador | 12 | 0.0% |
| Guatemala | 36 | 0.1% |
| Honduras | 36 | 0.1% |
| Latin America | 17,274 | 26.3% |
| Mexico | 17,158 | 26.1% |
| Middle Africa | 2 | 0.0% |
| Nicaragua | 30 | 0.1% |
| Northern Africa | 1 | 0.0% |
| Panama | 2 | 0.0% |
| Philippines | 34 | 0.1% |
| South Eastern Asia | 34 | 0.1% | View All 16 Rows |
Sex and Age in Starr County
Sex and Age in Starr County
The most populous age groups in Starr County are 5 to 9 Years (3,189 | 9.9%) for men and 10 to 14 Years (3,330 | 9.9%) for women.
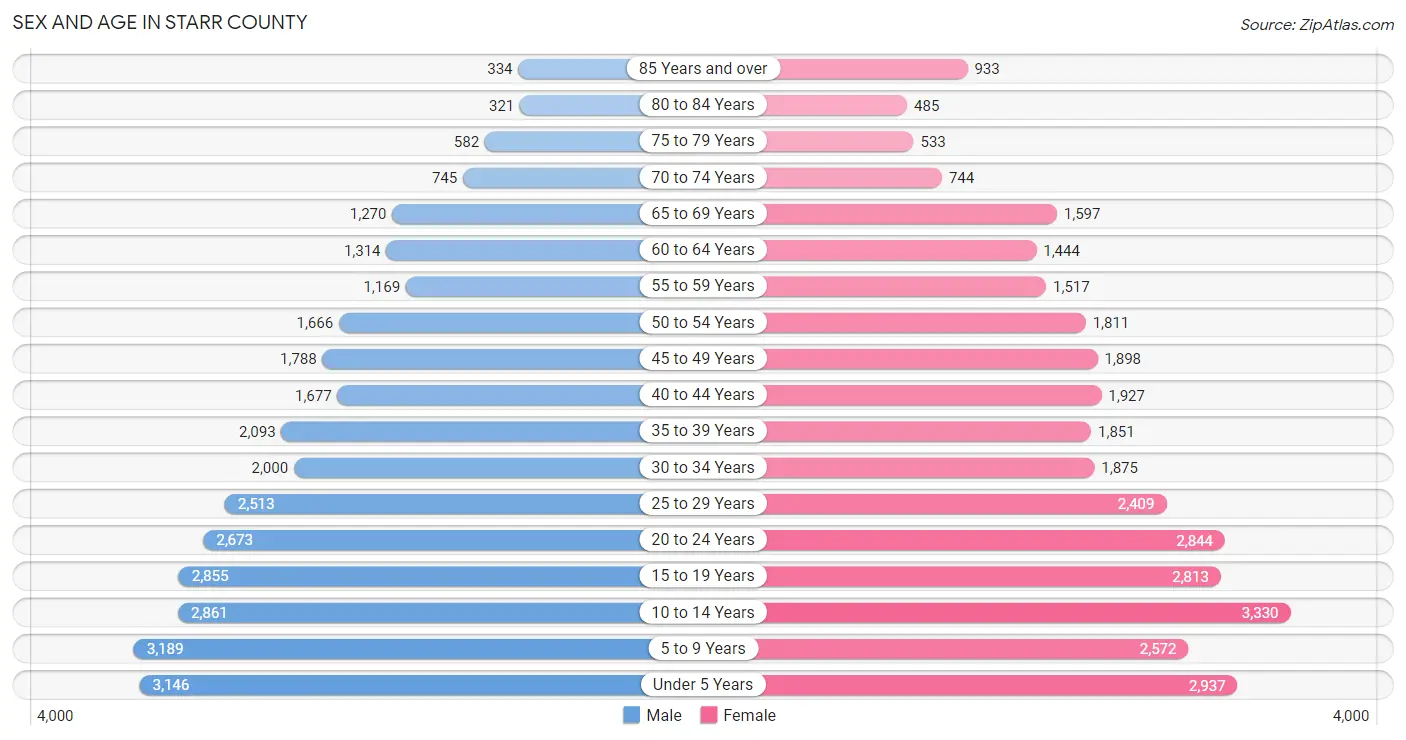
| Age Bracket | Male | Female |
| Under 5 Years | 3,146 (9.8%) | 2,937 (8.8%) |
| 5 to 9 Years | 3,189 (9.9%) | 2,572 (7.7%) |
| 10 to 14 Years | 2,861 (8.9%) | 3,330 (9.9%) |
| 15 to 19 Years | 2,855 (8.9%) | 2,813 (8.4%) |
| 20 to 24 Years | 2,673 (8.3%) | 2,844 (8.5%) |
| 25 to 29 Years | 2,513 (7.8%) | 2,409 (7.2%) |
| 30 to 34 Years | 2,000 (6.2%) | 1,875 (5.6%) |
| 35 to 39 Years | 2,093 (6.5%) | 1,851 (5.5%) |
| 40 to 44 Years | 1,677 (5.2%) | 1,927 (5.8%) |
| 45 to 49 Years | 1,788 (5.6%) | 1,898 (5.7%) |
| 50 to 54 Years | 1,666 (5.2%) | 1,811 (5.4%) |
| 55 to 59 Years | 1,169 (3.6%) | 1,517 (4.5%) |
| 60 to 64 Years | 1,314 (4.1%) | 1,444 (4.3%) |
| 65 to 69 Years | 1,270 (3.9%) | 1,597 (4.8%) |
| 70 to 74 Years | 745 (2.3%) | 744 (2.2%) |
| 75 to 79 Years | 582 (1.8%) | 533 (1.6%) |
| 80 to 84 Years | 321 (1.0%) | 485 (1.5%) |
| 85 Years and over | 334 (1.0%) | 933 (2.8%) |
| Total | 32,196 (100.0%) | 33,520 (100.0%) |
Families and Households in Starr County
Median Family Size in Starr County
The median family size in Starr County is 4.10 persons per family, with married-couple families (8,496 | 58.4%) accounting for the largest median family size of 4.18 persons per family. On the other hand, single male/father families (907 | 6.2%) represent the smallest median family size with 3.61 persons per family.
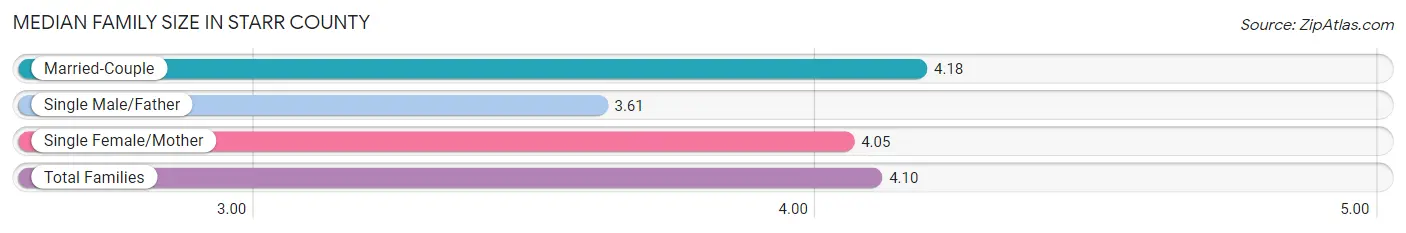
| Family Type | # Families | Family Size |
| Married-Couple | 8,496 (58.4%) | 4.18 |
| Single Male/Father | 907 (6.2%) | 3.61 |
| Single Female/Mother | 5,136 (35.3%) | 4.05 |
| Total Families | 14,539 (100.0%) | 4.10 |
Median Household Size in Starr County
The median household size in Starr County is 3.50 persons per household, with married-couple households (8,496 | 45.6%) accounting for the largest median household size of 4.22 persons per household. non-family households (4,095 | 22.0%) represent the smallest median household size with 1.07 persons per household.
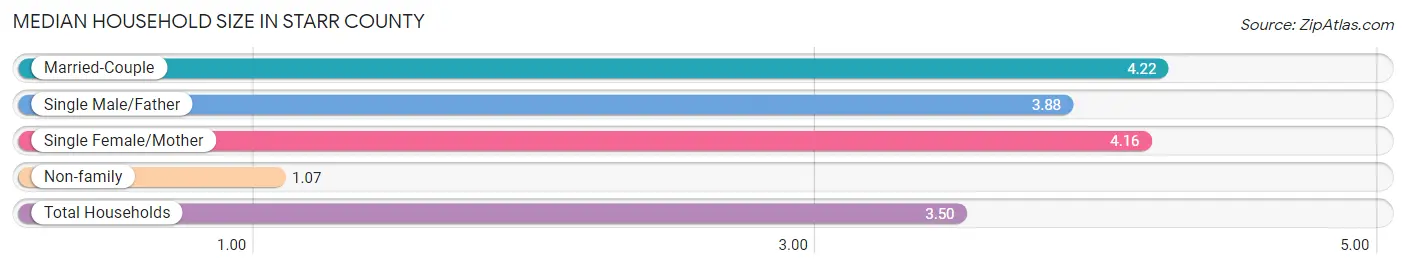
| Household Type | # Households | Household Size |
| Married-Couple | 8,496 (45.6%) | 4.22 |
| Single Male/Father | 907 (4.9%) | 3.88 |
| Single Female/Mother | 5,136 (27.6%) | 4.16 |
| Non-family | 4,095 (22.0%) | 1.07 |
| Total Households | 18,634 (100.0%) | 3.50 |
Household Size by Marriage Status in Starr County
Out of a total of 18,634 households in Starr County, 14,539 (78.0%) are family households, while 4,095 (22.0%) are nonfamily households. The most numerous type of family households are 2-person households, comprising 4,396, and the most common type of nonfamily households are 1-person households, comprising 3,807.
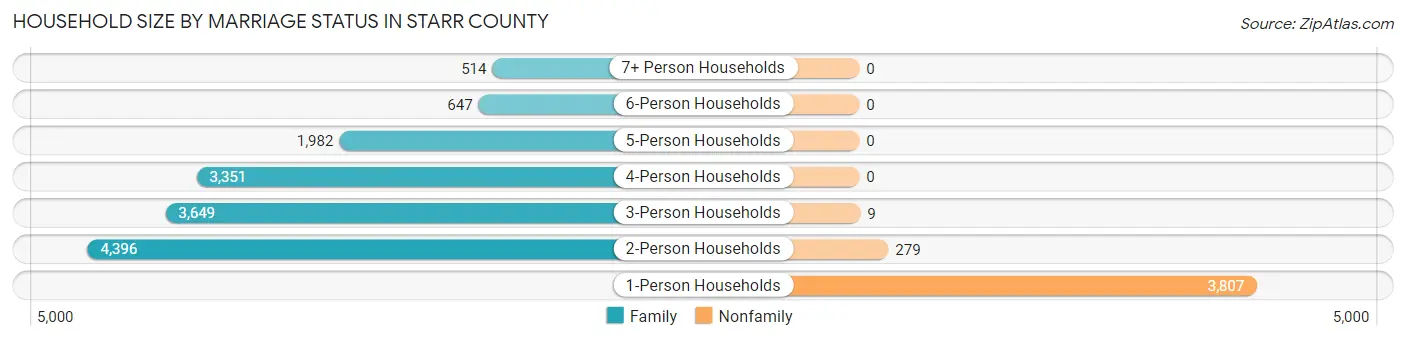
| Household Size | Family Households | Nonfamily Households |
| 1-Person Households | - | 3,807 (20.4%) |
| 2-Person Households | 4,396 (23.6%) | 279 (1.5%) |
| 3-Person Households | 3,649 (19.6%) | 9 (0.1%) |
| 4-Person Households | 3,351 (18.0%) | 0 (0.0%) |
| 5-Person Households | 1,982 (10.6%) | 0 (0.0%) |
| 6-Person Households | 647 (3.5%) | 0 (0.0%) |
| 7+ Person Households | 514 (2.8%) | 0 (0.0%) |
| Total | 14,539 (78.0%) | 4,095 (22.0%) |
Female Fertility in Starr County
Fertility by Age in Starr County
Average fertility rate in Starr County is 58.0 births per 1,000 women. Women in the age bracket of 20 to 34 years have the highest fertility rate with 113.0 births per 1,000 women. Women in the age bracket of 20 to 34 years acount for 87.4% of all women with births.
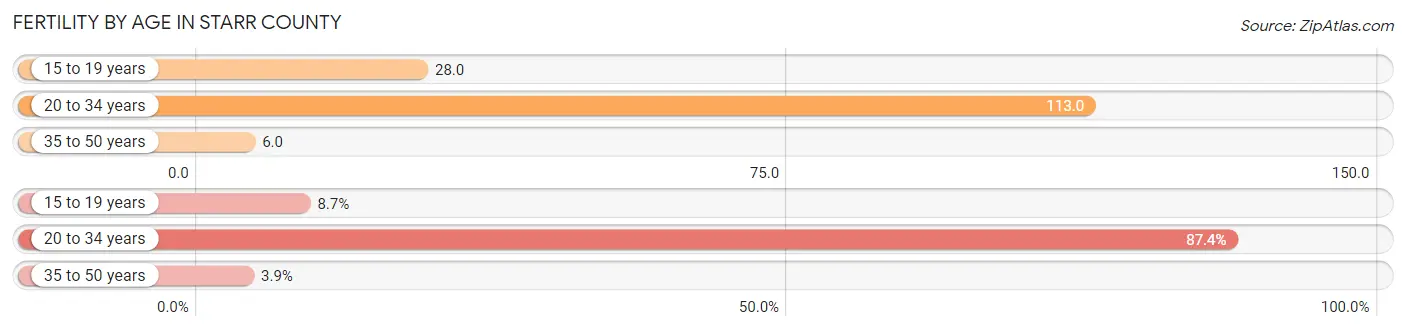
| Age Bracket | Women with Births | Births / 1,000 Women |
| 15 to 19 years | 80 (8.7%) | 28.0 |
| 20 to 34 years | 805 (87.4%) | 113.0 |
| 35 to 50 years | 36 (3.9%) | 6.0 |
| Total | 921 (100.0%) | 58.0 |
Fertility by Age by Marriage Status in Starr County
66.0% of women with births (921) in Starr County are married. The highest percentage of unmarried women with births falls into 20 to 34 years age bracket with 35.6% of them unmarried at the time of birth, while the lowest percentage of unmarried women with births belong to 35 to 50 years age bracket with 0.0% of them unmarried.
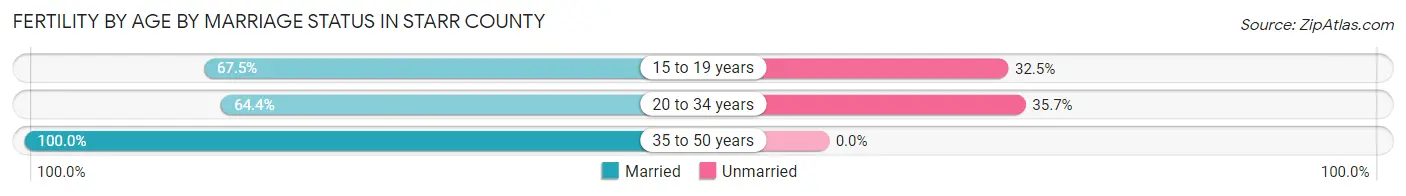
| Age Bracket | Married | Unmarried |
| 15 to 19 years | 54 (67.5%) | 26 (32.5%) |
| 20 to 34 years | 518 (64.3%) | 287 (35.6%) |
| 35 to 50 years | 36 (100.0%) | 0 (0.0%) |
| Total | 608 (66.0%) | 313 (34.0%) |
Fertility by Education in Starr County
Average fertility rate in Starr County is 58.0 births per 1,000 women. Women with the education attainment of graduate degree have the highest fertility rate of 123.0 births per 1,000 women, while women with the education attainment of less than high school have the lowest fertility at 18.0 births per 1,000 women. Women with the education attainment of high school diploma represent 36.8% of all women with births.
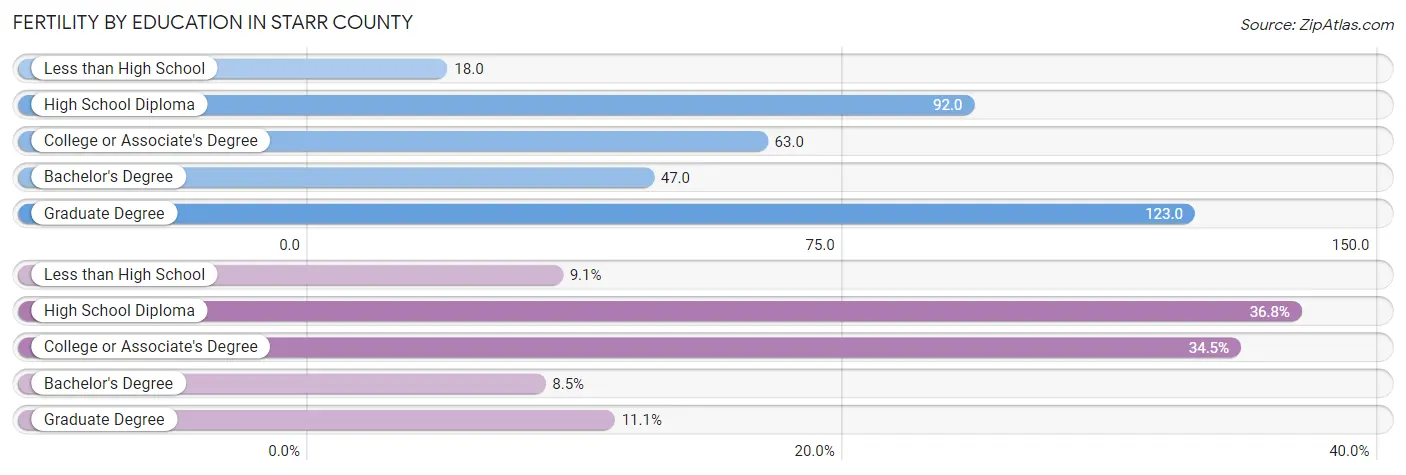
| Educational Attainment | Women with Births | Births / 1,000 Women |
| Less than High School | 84 (9.1%) | 18.0 |
| High School Diploma | 339 (36.8%) | 92.0 |
| College or Associate's Degree | 318 (34.5%) | 63.0 |
| Bachelor's Degree | 78 (8.5%) | 47.0 |
| Graduate Degree | 102 (11.1%) | 123.0 |
| Total | 921 (100.0%) | 58.0 |
Fertility by Education by Marriage Status in Starr County
34.0% of women with births in Starr County are unmarried. Women with the educational attainment of graduate degree are most likely to be married with 100.0% of them married at childbirth, while women with the educational attainment of bachelor's degree are least likely to be married with 55.1% of them unmarried at childbirth.
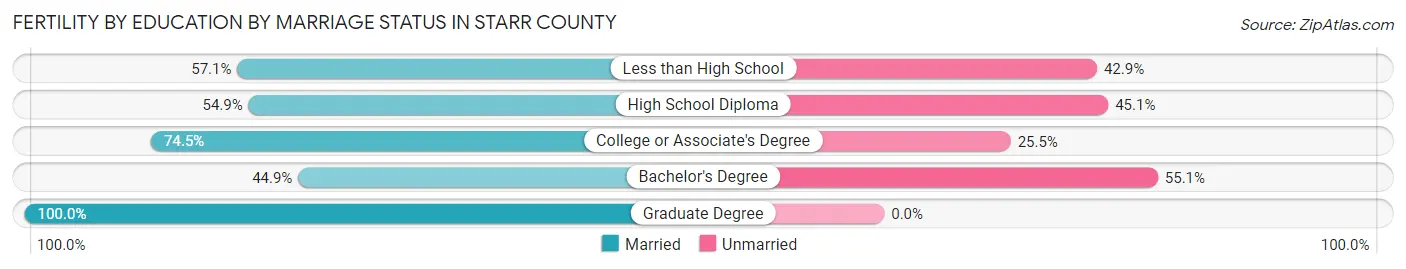
| Educational Attainment | Married | Unmarried |
| Less than High School | 48 (57.1%) | 36 (42.9%) |
| High School Diploma | 186 (54.9%) | 153 (45.1%) |
| College or Associate's Degree | 237 (74.5%) | 81 (25.5%) |
| Bachelor's Degree | 35 (44.9%) | 43 (55.1%) |
| Graduate Degree | 102 (100.0%) | 0 (0.0%) |
| Total | 608 (66.0%) | 313 (34.0%) |
Employment Characteristics in Starr County
Employment by Class of Employer in Starr County
Among the 23,333 employed individuals in Starr County, private company employees (13,718 | 58.8%), local government employees (2,808 | 12.0%), and state government employees (2,486 | 10.6%) make up the most common classes of employment.
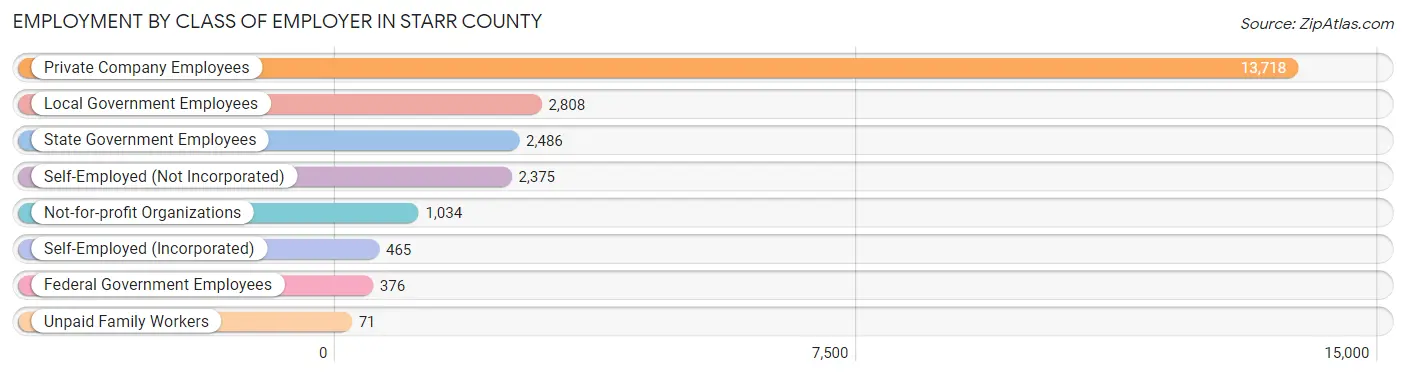
| Employer Class | # Employees | % Employees |
| Private Company Employees | 13,718 | 58.8% |
| Self-Employed (Incorporated) | 465 | 2.0% |
| Self-Employed (Not Incorporated) | 2,375 | 10.2% |
| Not-for-profit Organizations | 1,034 | 4.4% |
| Local Government Employees | 2,808 | 12.0% |
| State Government Employees | 2,486 | 10.6% |
| Federal Government Employees | 376 | 1.6% |
| Unpaid Family Workers | 71 | 0.3% |
| Total | 23,333 | 100.0% |
Employment Status by Age in Starr County
According to the labor force statistics for Starr County, out of the total population over 16 years of age (46,785), 58.2% or 27,229 individuals are in the labor force, with 11.5% or 3,131 of them unemployed. The age group with the highest labor force participation rate is 35 to 44 years, with 82.8% or 6,250 individuals in the labor force. Within the labor force, the 16 to 19 years age range has the highest percentage of unemployed individuals, with 25.2% or 295 of them being unemployed.
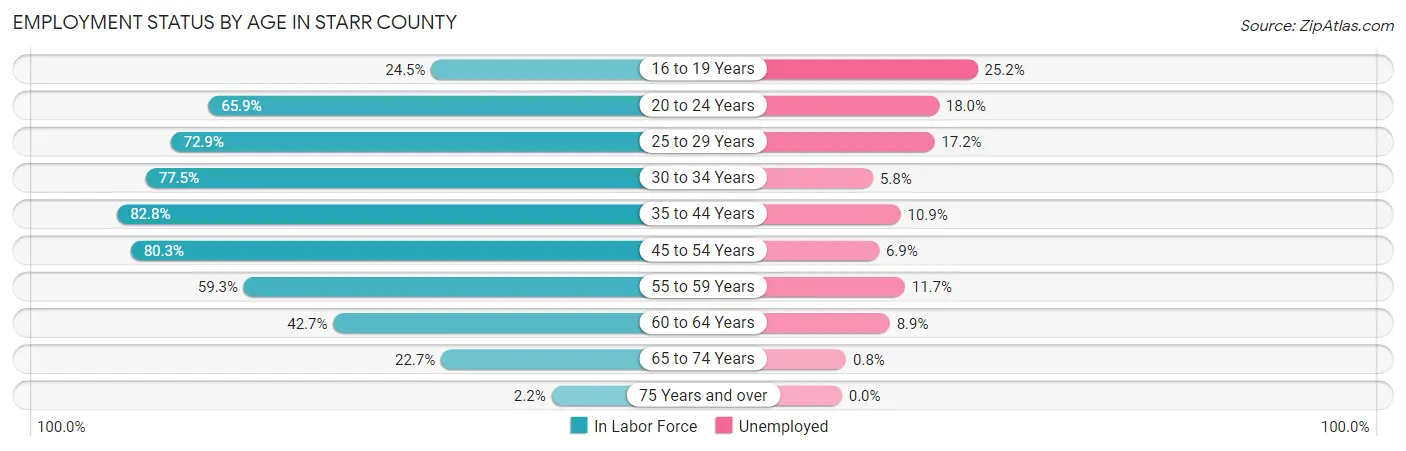
| Age Bracket | In Labor Force | Unemployed |
| 16 to 19 Years | 1,169 (24.5%) | 295 (25.2%) |
| 20 to 24 Years | 3,636 (65.9%) | 654 (18.0%) |
| 25 to 29 Years | 3,588 (72.9%) | 617 (17.2%) |
| 30 to 34 Years | 3,003 (77.5%) | 174 (5.8%) |
| 35 to 44 Years | 6,250 (82.8%) | 681 (10.9%) |
| 45 to 54 Years | 5,752 (80.3%) | 397 (6.9%) |
| 55 to 59 Years | 1,593 (59.3%) | 186 (11.7%) |
| 60 to 64 Years | 1,178 (42.7%) | 105 (8.9%) |
| 65 to 74 Years | 989 (22.7%) | 8 (0.8%) |
| 75 Years and over | 70 (2.2%) | 0 (0.0%) |
| Total | 27,229 (58.2%) | 3,131 (11.5%) |
Employment Status by Educational Attainment in Starr County
According to labor force statistics for Starr County, 73.8% of individuals (21,367) out of the total population between 25 and 64 years of age (28,952) are in the labor force, with 10.1% or 2,158 of them being unemployed. The group with the highest labor force participation rate are those with the educational attainment of bachelor's degree or higher, with 89.3% or 3,645 individuals in the labor force. Within the labor force, individuals with high school diploma education have the highest percentage of unemployment, with 16.1% or 1,019 of them being unemployed.
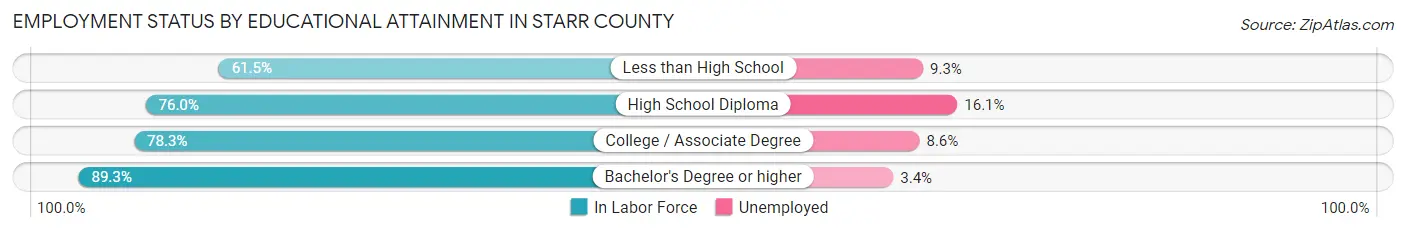
| Educational Attainment | In Labor Force | Unemployed |
| Less than High School | 5,731 (61.5%) | 867 (9.3%) |
| High School Diploma | 6,332 (76.0%) | 1,341 (16.1%) |
| College / Associate Degree | 5,652 (78.3%) | 621 (8.6%) |
| Bachelor's Degree or higher | 3,645 (89.3%) | 139 (3.4%) |
| Total | 21,367 (73.8%) | 2,924 (10.1%) |
Employment Occupations by Sex in Starr County
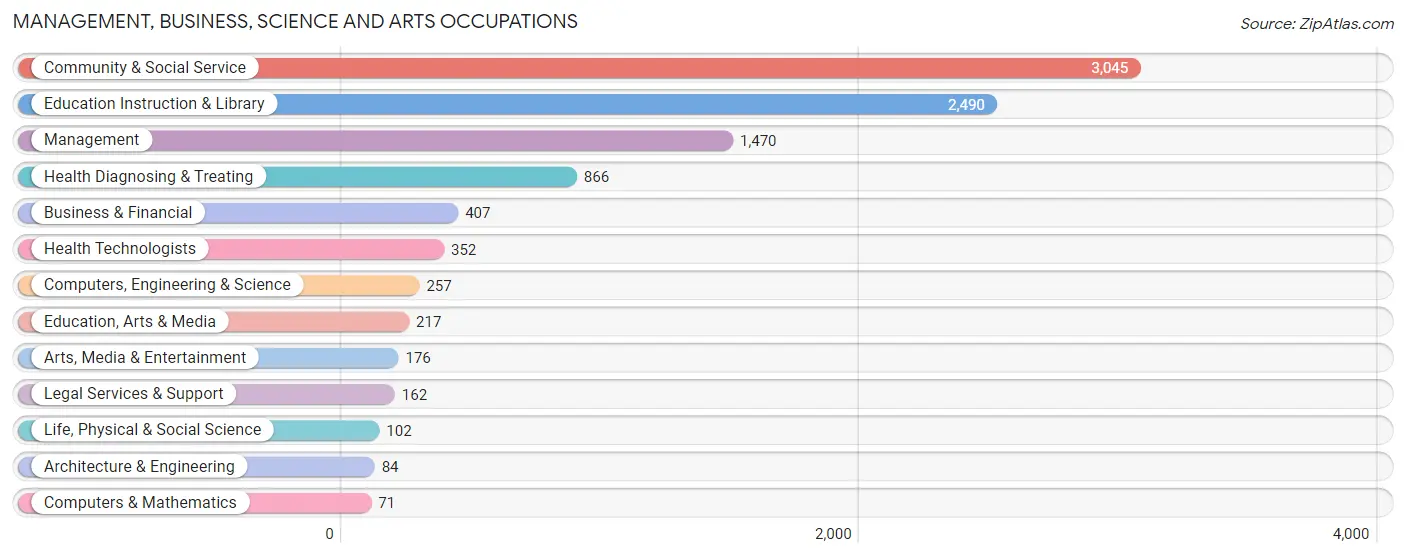
Management, Business, Science and Arts Occupations
The most common Management, Business, Science and Arts occupations in Starr County are Community & Social Service (3,045 | 12.6%), Education Instruction & Library (2,490 | 10.3%), Management (1,470 | 6.1%), Health Diagnosing & Treating (866 | 3.6%), and Business & Financial (407 | 1.7%).
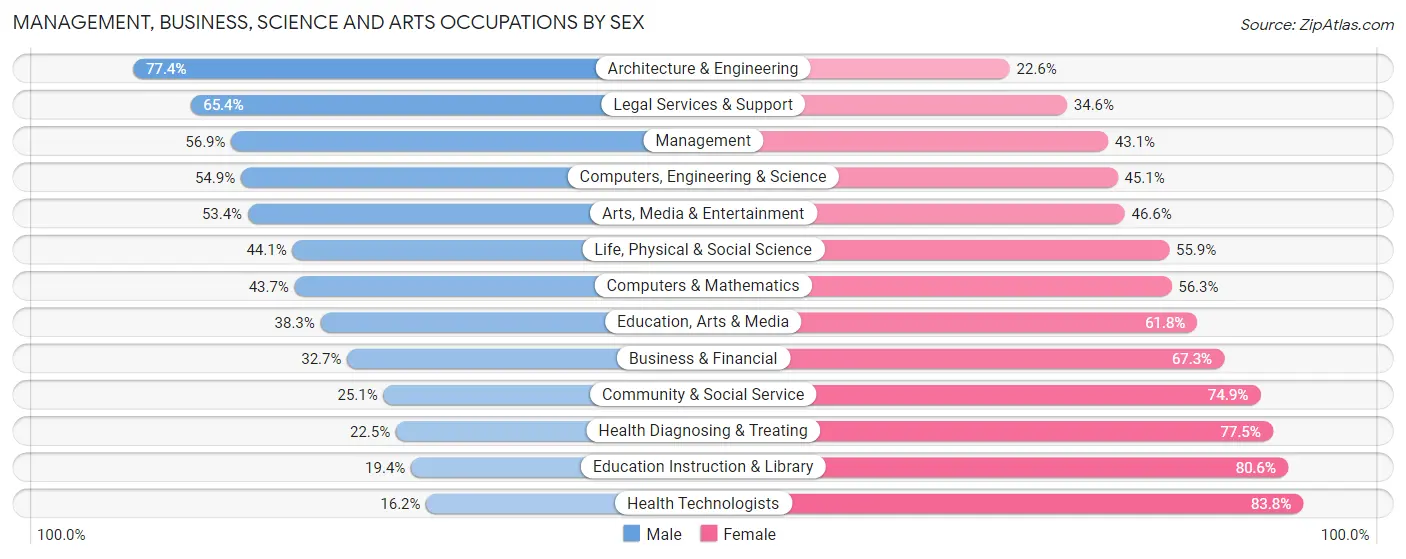
Management, Business, Science and Arts Occupations by Sex
Within the Management, Business, Science and Arts occupations in Starr County, the most male-oriented occupations are Architecture & Engineering (77.4%), Legal Services & Support (65.4%), and Management (56.9%), while the most female-oriented occupations are Health Technologists (83.8%), Education Instruction & Library (80.6%), and Health Diagnosing & Treating (77.5%).
| Occupation | Male | Female |
| Management | 836 (56.9%) | 634 (43.1%) |
| Business & Financial | 133 (32.7%) | 274 (67.3%) |
| Computers, Engineering & Science | 141 (54.9%) | 116 (45.1%) |
| Computers & Mathematics | 31 (43.7%) | 40 (56.3%) |
| Architecture & Engineering | 65 (77.4%) | 19 (22.6%) |
| Life, Physical & Social Science | 45 (44.1%) | 57 (55.9%) |
| Community & Social Service | 765 (25.1%) | 2,280 (74.9%) |
| Education, Arts & Media | 83 (38.3%) | 134 (61.8%) |
| Legal Services & Support | 106 (65.4%) | 56 (34.6%) |
| Education Instruction & Library | 482 (19.4%) | 2,008 (80.6%) |
| Arts, Media & Entertainment | 94 (53.4%) | 82 (46.6%) |
| Health Diagnosing & Treating | 195 (22.5%) | 671 (77.5%) |
| Health Technologists | 57 (16.2%) | 295 (83.8%) |
| Total (Category) | 2,070 (34.2%) | 3,975 (65.8%) |
| Total (Overall) | 12,713 (52.7%) | 11,396 (47.3%) |
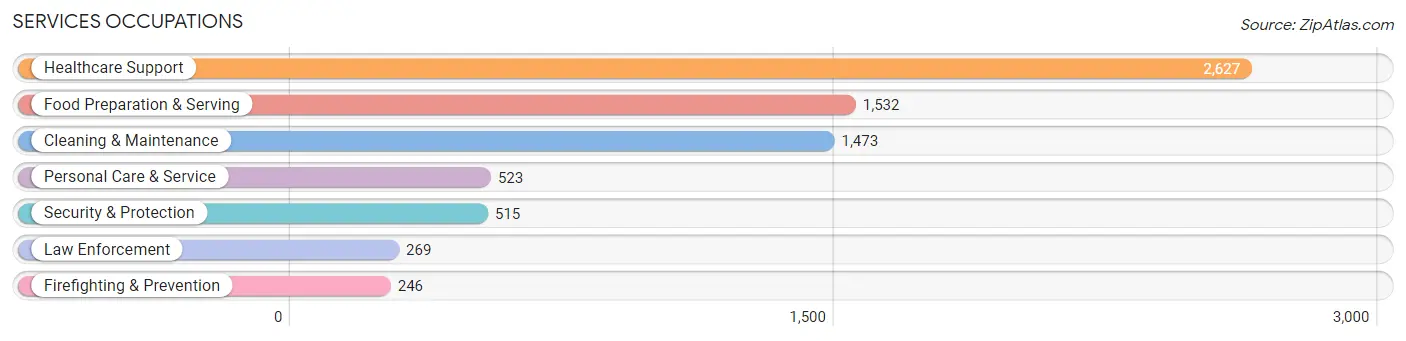
Services Occupations
The most common Services occupations in Starr County are Healthcare Support (2,627 | 10.9%), Food Preparation & Serving (1,532 | 6.4%), Cleaning & Maintenance (1,473 | 6.1%), Personal Care & Service (523 | 2.2%), and Security & Protection (515 | 2.1%).
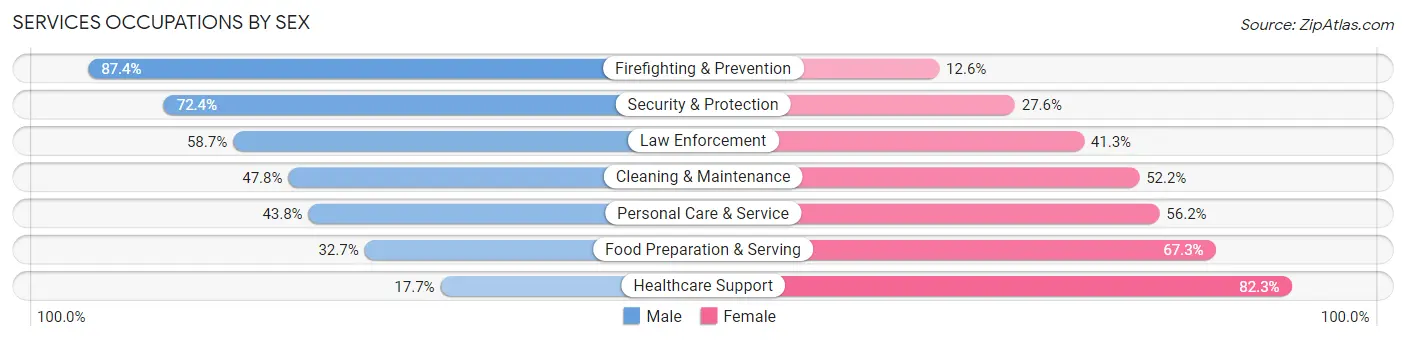
Services Occupations by Sex
Within the Services occupations in Starr County, the most male-oriented occupations are Firefighting & Prevention (87.4%), Security & Protection (72.4%), and Law Enforcement (58.7%), while the most female-oriented occupations are Healthcare Support (82.3%), Food Preparation & Serving (67.3%), and Personal Care & Service (56.2%).
| Occupation | Male | Female |
| Healthcare Support | 464 (17.7%) | 2,163 (82.3%) |
| Security & Protection | 373 (72.4%) | 142 (27.6%) |
| Firefighting & Prevention | 215 (87.4%) | 31 (12.6%) |
| Law Enforcement | 158 (58.7%) | 111 (41.3%) |
| Food Preparation & Serving | 501 (32.7%) | 1,031 (67.3%) |
| Cleaning & Maintenance | 704 (47.8%) | 769 (52.2%) |
| Personal Care & Service | 229 (43.8%) | 294 (56.2%) |
| Total (Category) | 2,271 (34.1%) | 4,399 (65.9%) |
| Total (Overall) | 12,713 (52.7%) | 11,396 (47.3%) |
Sales and Office Occupations
The most common Sales and Office occupations in Starr County are Sales & Related (2,210 | 9.2%), and Office & Administration (1,508 | 6.2%).
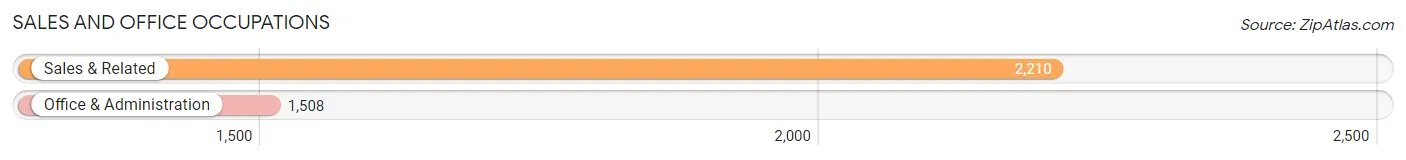
Sales and Office Occupations by Sex
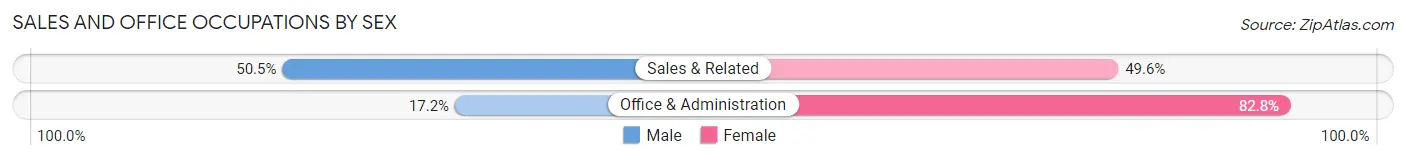
| Occupation | Male | Female |
| Sales & Related | 1,115 (50.4%) | 1,095 (49.5%) |
| Office & Administration | 260 (17.2%) | 1,248 (82.8%) |
| Total (Category) | 1,375 (37.0%) | 2,343 (63.0%) |
| Total (Overall) | 12,713 (52.7%) | 11,396 (47.3%) |
Natural Resources, Construction and Maintenance Occupations
The most common Natural Resources, Construction and Maintenance occupations in Starr County are Construction & Extraction (2,900 | 12.0%), Installation, Maintenance & Repair (720 | 3.0%), and Farming, Fishing & Forestry (203 | 0.8%).
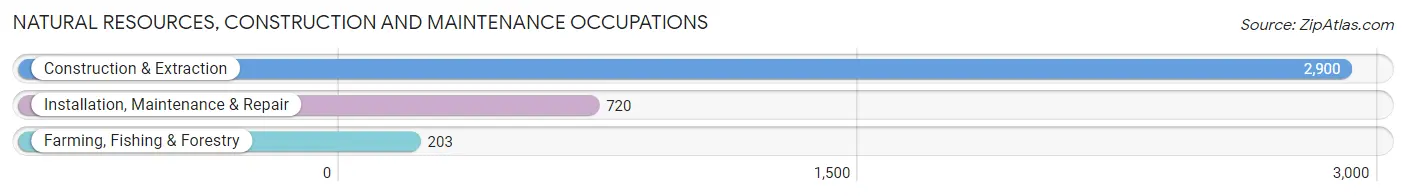
Natural Resources, Construction and Maintenance Occupations by Sex
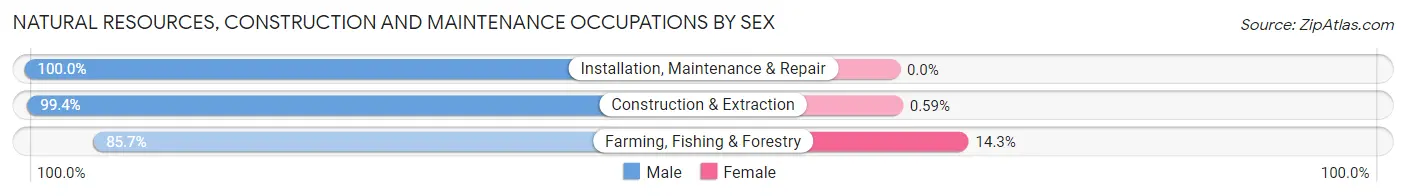
| Occupation | Male | Female |
| Farming, Fishing & Forestry | 174 (85.7%) | 29 (14.3%) |
| Construction & Extraction | 2,883 (99.4%) | 17 (0.6%) |
| Installation, Maintenance & Repair | 720 (100.0%) | 0 (0.0%) |
| Total (Category) | 3,777 (98.8%) | 46 (1.2%) |
| Total (Overall) | 12,713 (52.7%) | 11,396 (47.3%) |
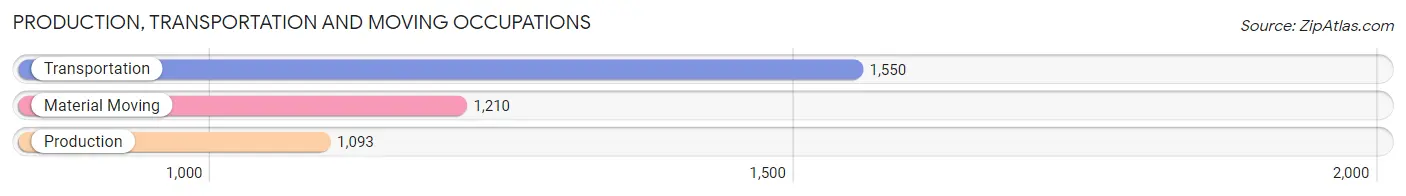
Production, Transportation and Moving Occupations
The most common Production, Transportation and Moving occupations in Starr County are Transportation (1,550 | 6.4%), Material Moving (1,210 | 5.0%), and Production (1,093 | 4.5%).
Production, Transportation and Moving Occupations by Sex
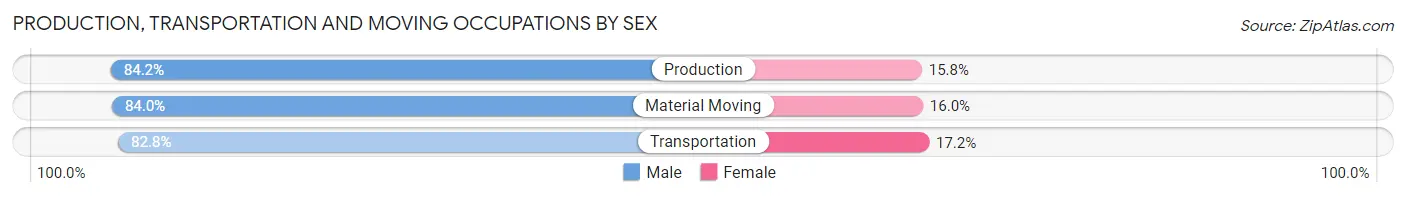
| Occupation | Male | Female |
| Production | 920 (84.2%) | 173 (15.8%) |
| Transportation | 1,284 (82.8%) | 266 (17.2%) |
| Material Moving | 1,016 (84.0%) | 194 (16.0%) |
| Total (Category) | 3,220 (83.6%) | 633 (16.4%) |
| Total (Overall) | 12,713 (52.7%) | 11,396 (47.3%) |
Employment Industries by Sex in Starr County
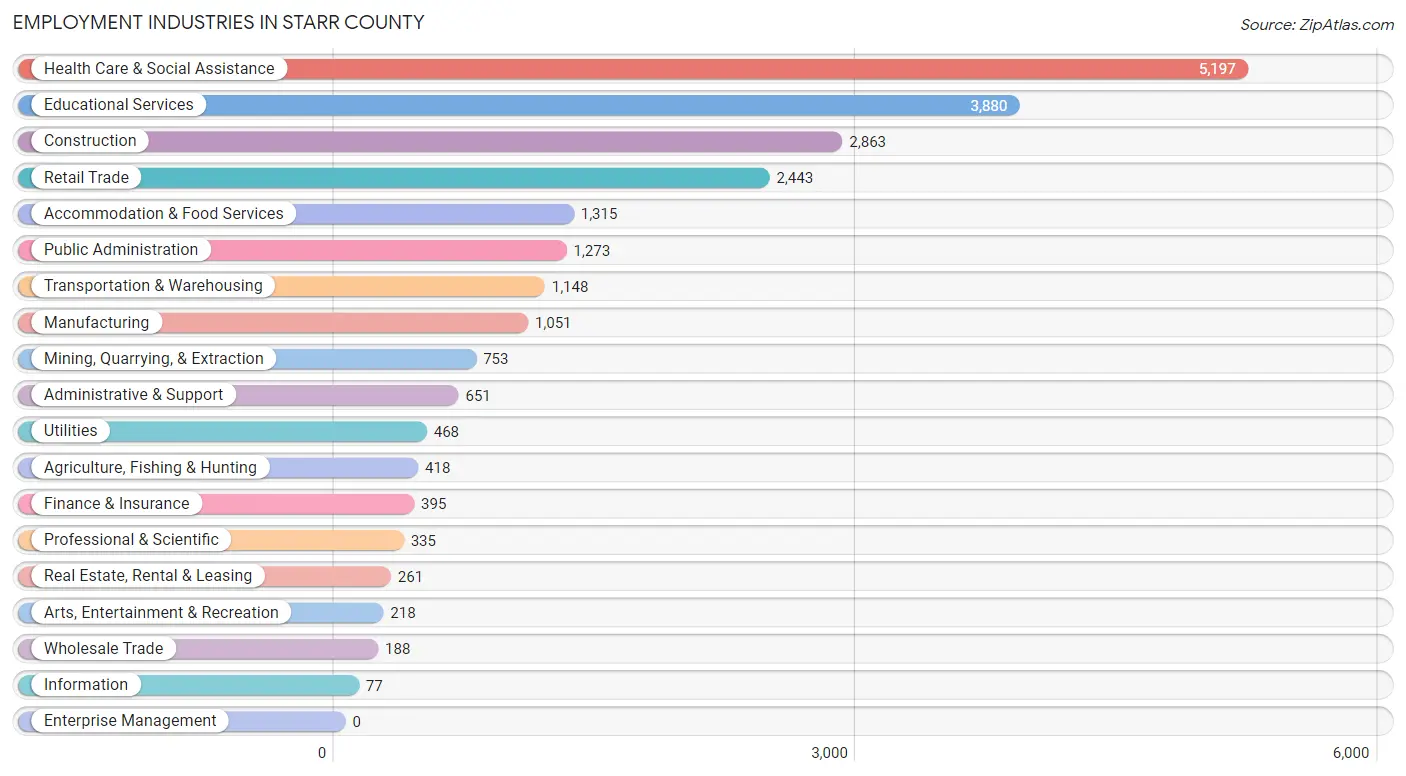
Employment Industries in Starr County
The major employment industries in Starr County include Health Care & Social Assistance (5,197 | 21.6%), Educational Services (3,880 | 16.1%), Construction (2,863 | 11.9%), Retail Trade (2,443 | 10.1%), and Accommodation & Food Services (1,315 | 5.4%).
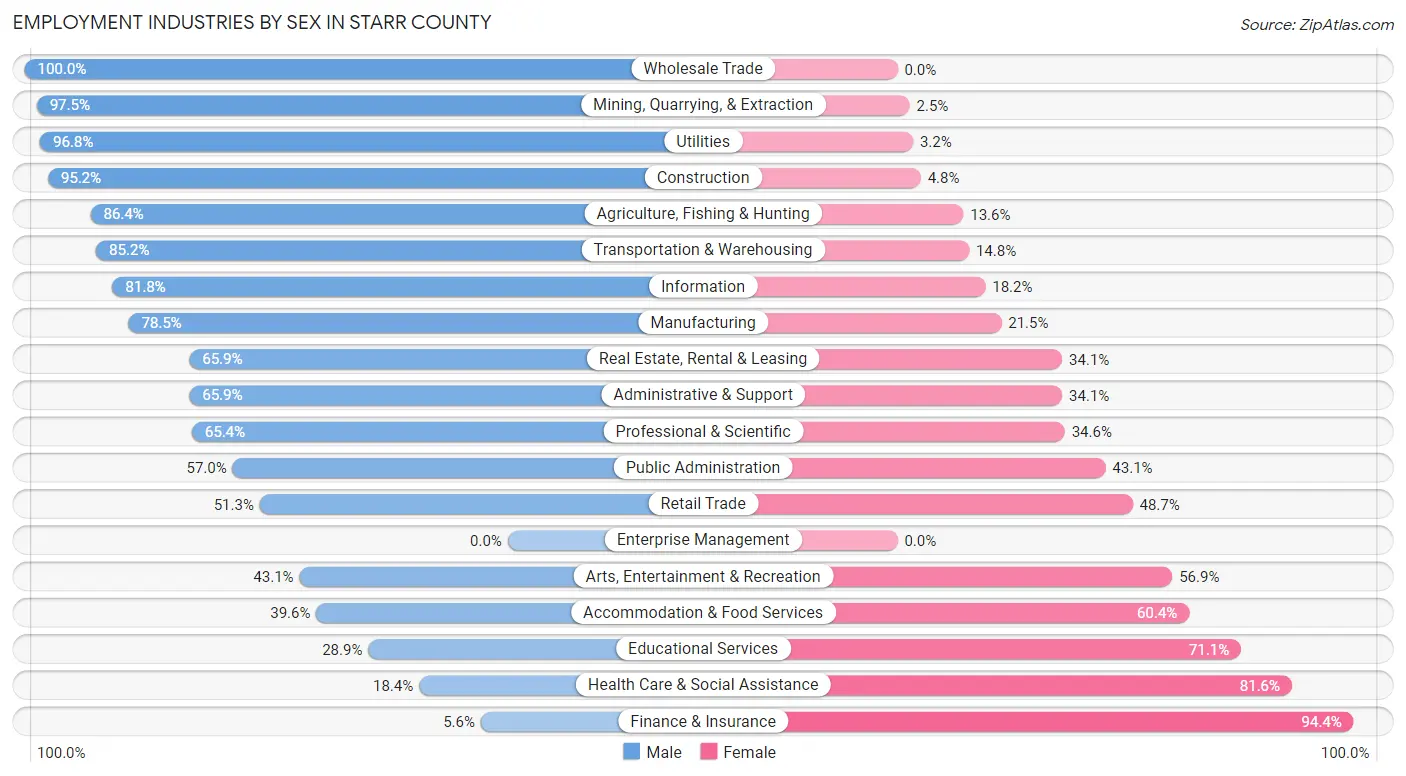
Employment Industries by Sex in Starr County
The Starr County industries that see more men than women are Wholesale Trade (100.0%), Mining, Quarrying, & Extraction (97.5%), and Utilities (96.8%), whereas the industries that tend to have a higher number of women are Finance & Insurance (94.4%), Health Care & Social Assistance (81.6%), and Educational Services (71.1%).
| Industry | Male | Female |
| Agriculture, Fishing & Hunting | 361 (86.4%) | 57 (13.6%) |
| Mining, Quarrying, & Extraction | 734 (97.5%) | 19 (2.5%) |
| Construction | 2,725 (95.2%) | 138 (4.8%) |
| Manufacturing | 825 (78.5%) | 226 (21.5%) |
| Wholesale Trade | 188 (100.0%) | 0 (0.0%) |
| Retail Trade | 1,254 (51.3%) | 1,189 (48.7%) |
| Transportation & Warehousing | 978 (85.2%) | 170 (14.8%) |
| Utilities | 453 (96.8%) | 15 (3.2%) |
| Information | 63 (81.8%) | 14 (18.2%) |
| Finance & Insurance | 22 (5.6%) | 373 (94.4%) |
| Real Estate, Rental & Leasing | 172 (65.9%) | 89 (34.1%) |
| Professional & Scientific | 219 (65.4%) | 116 (34.6%) |
| Enterprise Management | 0 (0.0%) | 0 (0.0%) |
| Administrative & Support | 429 (65.9%) | 222 (34.1%) |
| Educational Services | 1,120 (28.9%) | 2,760 (71.1%) |
| Health Care & Social Assistance | 954 (18.4%) | 4,243 (81.6%) |
| Arts, Entertainment & Recreation | 94 (43.1%) | 124 (56.9%) |
| Accommodation & Food Services | 521 (39.6%) | 794 (60.4%) |
| Public Administration | 725 (57.0%) | 548 (43.0%) |
| Total | 12,713 (52.7%) | 11,396 (47.3%) |
Education in Starr County
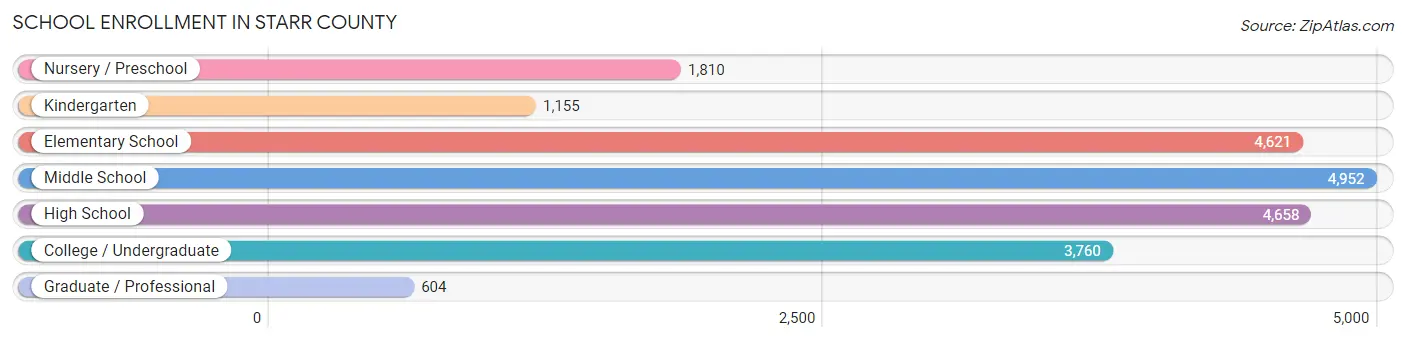
School Enrollment in Starr County
The most common levels of schooling among the 21,560 students in Starr County are middle school (4,952 | 23.0%), high school (4,658 | 21.6%), and elementary school (4,621 | 21.4%).
| School Level | # Students | % Students |
| Nursery / Preschool | 1,810 | 8.4% |
| Kindergarten | 1,155 | 5.4% |
| Elementary School | 4,621 | 21.4% |
| Middle School | 4,952 | 23.0% |
| High School | 4,658 | 21.6% |
| College / Undergraduate | 3,760 | 17.4% |
| Graduate / Professional | 604 | 2.8% |
| Total | 21,560 | 100.0% |
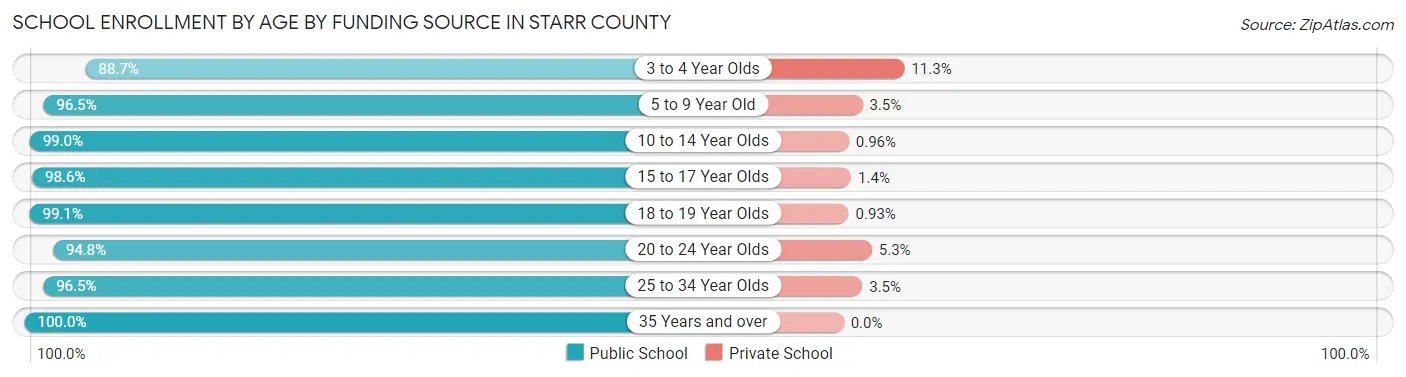
School Enrollment by Age by Funding Source in Starr County
Out of a total of 21,560 students who are enrolled in schools in Starr County, 625 (2.9%) attend a private institution, while the remaining 20,935 (97.1%) are enrolled in public schools. The age group of 3 to 4 year olds has the highest likelihood of being enrolled in private schools, with 152 (11.3% in the age bracket) enrolled. Conversely, the age group of 35 years and over has the lowest likelihood of being enrolled in a private school, with 367 (100.0% in the age bracket) attending a public institution.
| Age Bracket | Public School | Private School |
| 3 to 4 Year Olds | 1,190 (88.7%) | 152 (11.3%) |
| 5 to 9 Year Old | 5,325 (96.5%) | 193 (3.5%) |
| 10 to 14 Year Olds | 6,092 (99.0%) | 59 (1.0%) |
| 15 to 17 Year Olds | 3,257 (98.6%) | 46 (1.4%) |
| 18 to 19 Year Olds | 1,487 (99.1%) | 14 (0.9%) |
| 20 to 24 Year Olds | 2,382 (94.8%) | 132 (5.2%) |
| 25 to 34 Year Olds | 834 (96.5%) | 30 (3.5%) |
| 35 Years and over | 367 (100.0%) | 0 (0.0%) |
| Total | 20,935 (97.1%) | 625 (2.9%) |
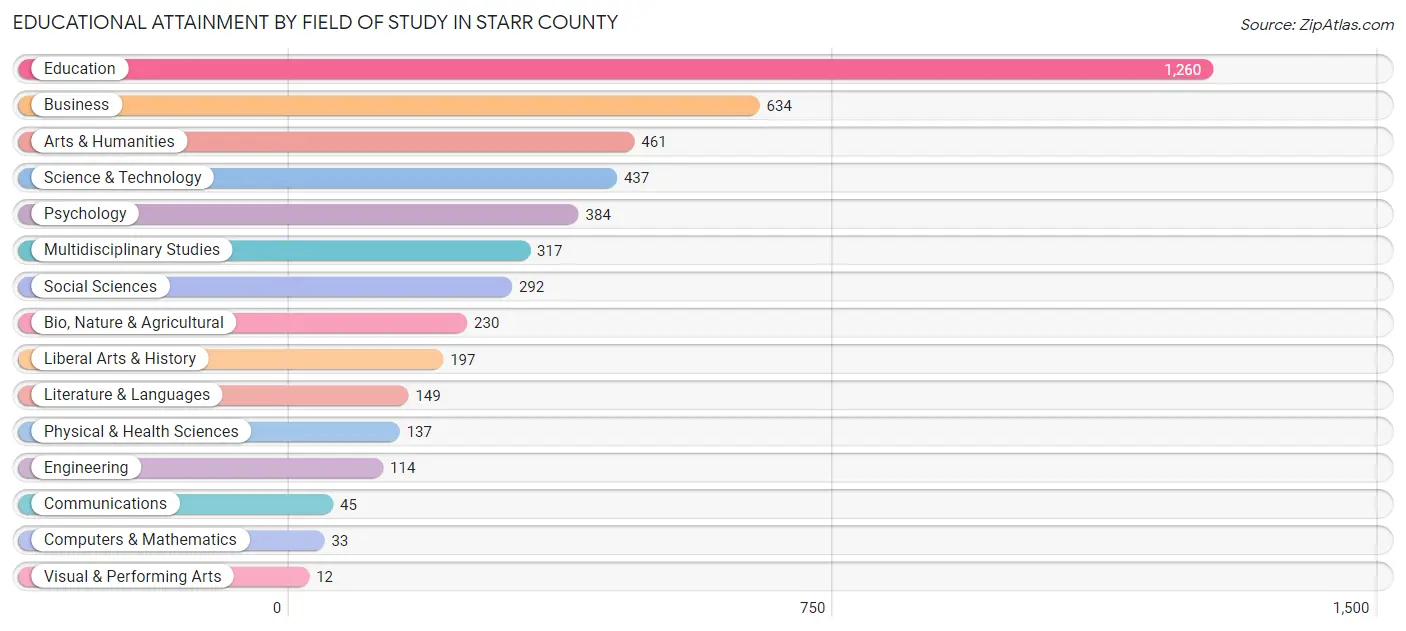
Educational Attainment by Field of Study in Starr County
Education (1,260 | 26.8%), business (634 | 13.5%), arts & humanities (461 | 9.8%), science & technology (437 | 9.3%), and psychology (384 | 8.2%) are the most common fields of study among 4,702 individuals in Starr County who have obtained a bachelor's degree or higher.
| Field of Study | # Graduates | % Graduates |
| Computers & Mathematics | 33 | 0.7% |
| Bio, Nature & Agricultural | 230 | 4.9% |
| Physical & Health Sciences | 137 | 2.9% |
| Psychology | 384 | 8.2% |
| Social Sciences | 292 | 6.2% |
| Engineering | 114 | 2.4% |
| Multidisciplinary Studies | 317 | 6.7% |
| Science & Technology | 437 | 9.3% |
| Business | 634 | 13.5% |
| Education | 1,260 | 26.8% |
| Literature & Languages | 149 | 3.2% |
| Liberal Arts & History | 197 | 4.2% |
| Visual & Performing Arts | 12 | 0.3% |
| Communications | 45 | 1.0% |
| Arts & Humanities | 461 | 9.8% |
| Total | 4,702 | 100.0% |
Transportation & Commute in Starr County
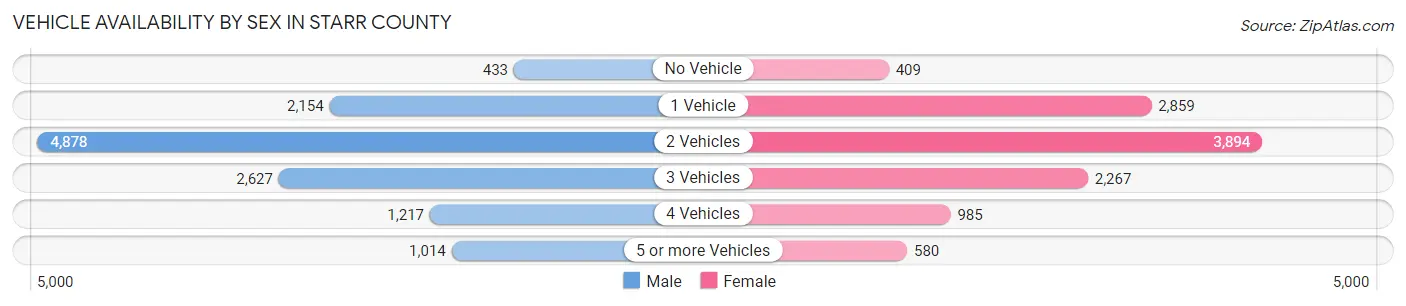
Vehicle Availability by Sex in Starr County
The most prevalent vehicle ownership categories in Starr County are males with 2 vehicles (4,878, accounting for 39.6%) and females with 2 vehicles (3,894, making up 44.4%).
| Vehicles Available | Male | Female |
| No Vehicle | 433 (3.5%) | 409 (3.7%) |
| 1 Vehicle | 2,154 (17.5%) | 2,859 (26.0%) |
| 2 Vehicles | 4,878 (39.6%) | 3,894 (35.4%) |
| 3 Vehicles | 2,627 (21.3%) | 2,267 (20.6%) |
| 4 Vehicles | 1,217 (9.9%) | 985 (9.0%) |
| 5 or more Vehicles | 1,014 (8.2%) | 580 (5.3%) |
| Total | 12,323 (100.0%) | 10,994 (100.0%) |
Commute Time in Starr County
The most frequently occuring commute durations in Starr County are 10 to 14 minutes (4,489 commuters, 21.0%), 15 to 19 minutes (3,530 commuters, 16.6%), and 5 to 9 minutes (3,149 commuters, 14.8%).
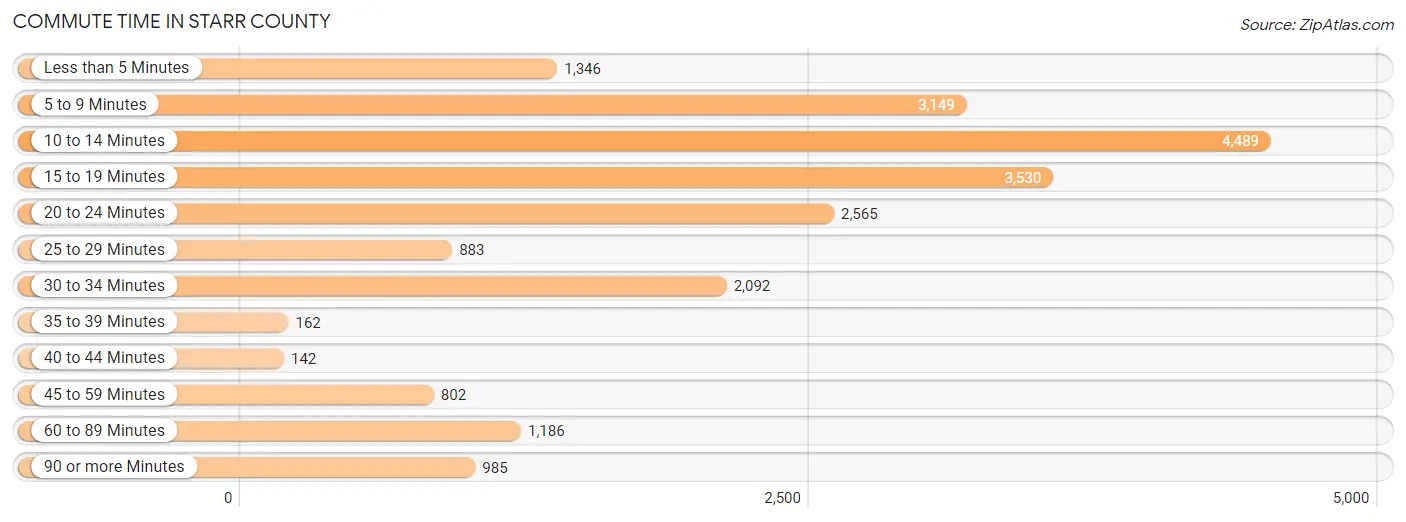
| Commute Time | # Commuters | % Commuters |
| Less than 5 Minutes | 1,346 | 6.3% |
| 5 to 9 Minutes | 3,149 | 14.8% |
| 10 to 14 Minutes | 4,489 | 21.0% |
| 15 to 19 Minutes | 3,530 | 16.6% |
| 20 to 24 Minutes | 2,565 | 12.0% |
| 25 to 29 Minutes | 883 | 4.1% |
| 30 to 34 Minutes | 2,092 | 9.8% |
| 35 to 39 Minutes | 162 | 0.8% |
| 40 to 44 Minutes | 142 | 0.7% |
| 45 to 59 Minutes | 802 | 3.8% |
| 60 to 89 Minutes | 1,186 | 5.6% |
| 90 or more Minutes | 985 | 4.6% |
Commute Time by Sex in Starr County
The most common commute times in Starr County are 10 to 14 minutes (1,924 commuters, 16.8%) for males and 10 to 14 minutes (2,565 commuters, 25.9%) for females.
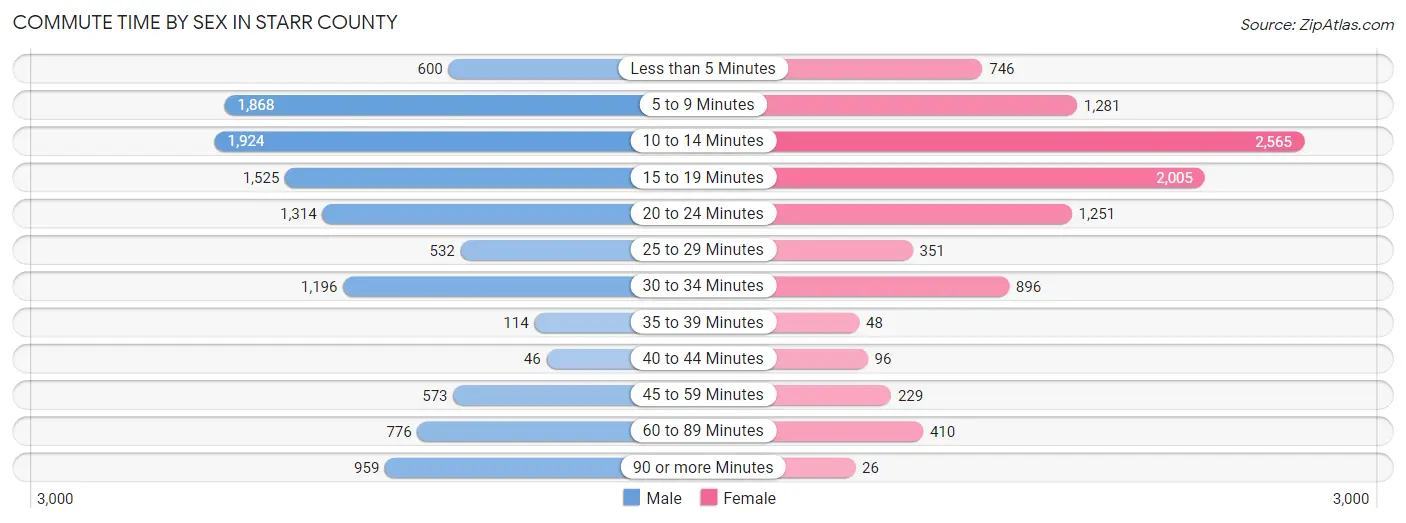
| Commute Time | Male | Female |
| Less than 5 Minutes | 600 (5.2%) | 746 (7.5%) |
| 5 to 9 Minutes | 1,868 (16.4%) | 1,281 (12.9%) |
| 10 to 14 Minutes | 1,924 (16.8%) | 2,565 (25.9%) |
| 15 to 19 Minutes | 1,525 (13.4%) | 2,005 (20.2%) |
| 20 to 24 Minutes | 1,314 (11.5%) | 1,251 (12.6%) |
| 25 to 29 Minutes | 532 (4.7%) | 351 (3.5%) |
| 30 to 34 Minutes | 1,196 (10.5%) | 896 (9.0%) |
| 35 to 39 Minutes | 114 (1.0%) | 48 (0.5%) |
| 40 to 44 Minutes | 46 (0.4%) | 96 (1.0%) |
| 45 to 59 Minutes | 573 (5.0%) | 229 (2.3%) |
| 60 to 89 Minutes | 776 (6.8%) | 410 (4.1%) |
| 90 or more Minutes | 959 (8.4%) | 26 (0.3%) |
Time of Departure to Work by Sex in Starr County
The most frequent times of departure to work in Starr County are 8:00 AM to 8:29 AM (1,814, 15.9%) for males and 7:00 AM to 7:29 AM (2,171, 21.9%) for females.
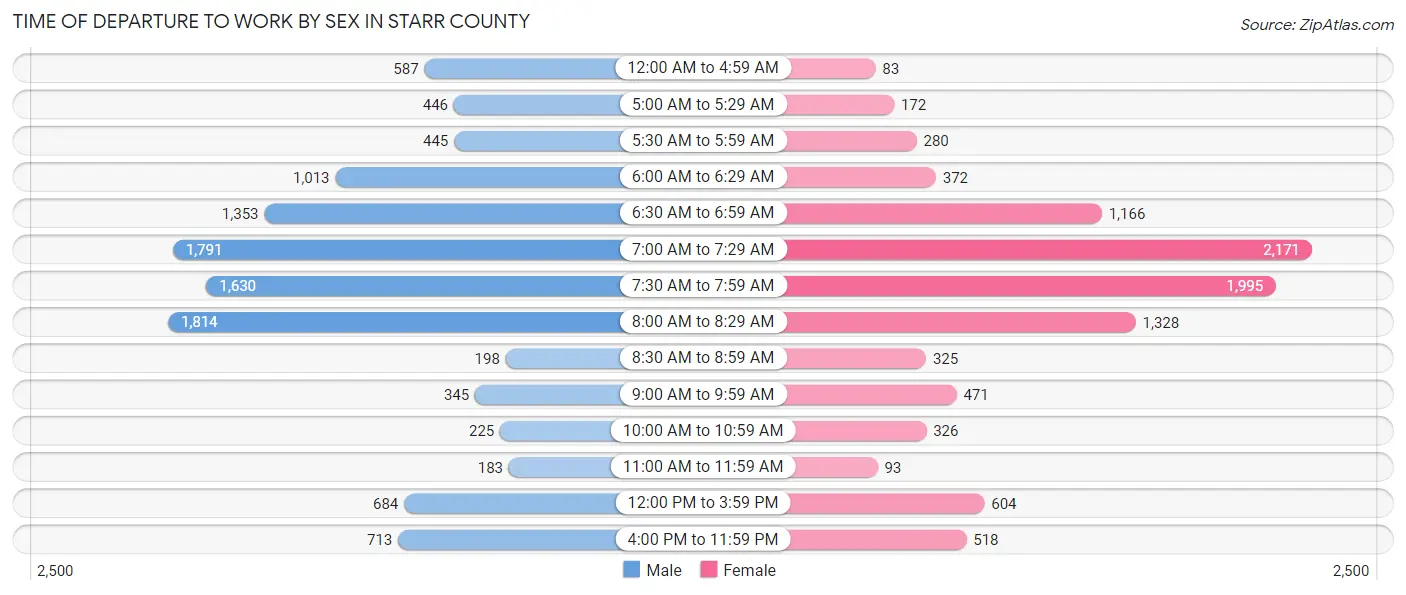
| Time of Departure | Male | Female |
| 12:00 AM to 4:59 AM | 587 (5.1%) | 83 (0.8%) |
| 5:00 AM to 5:29 AM | 446 (3.9%) | 172 (1.7%) |
| 5:30 AM to 5:59 AM | 445 (3.9%) | 280 (2.8%) |
| 6:00 AM to 6:29 AM | 1,013 (8.9%) | 372 (3.8%) |
| 6:30 AM to 6:59 AM | 1,353 (11.8%) | 1,166 (11.8%) |
| 7:00 AM to 7:29 AM | 1,791 (15.7%) | 2,171 (21.9%) |
| 7:30 AM to 7:59 AM | 1,630 (14.3%) | 1,995 (20.1%) |
| 8:00 AM to 8:29 AM | 1,814 (15.9%) | 1,328 (13.4%) |
| 8:30 AM to 8:59 AM | 198 (1.7%) | 325 (3.3%) |
| 9:00 AM to 9:59 AM | 345 (3.0%) | 471 (4.8%) |
| 10:00 AM to 10:59 AM | 225 (2.0%) | 326 (3.3%) |
| 11:00 AM to 11:59 AM | 183 (1.6%) | 93 (0.9%) |
| 12:00 PM to 3:59 PM | 684 (6.0%) | 604 (6.1%) |
| 4:00 PM to 11:59 PM | 713 (6.2%) | 518 (5.2%) |
| Total | 11,427 (100.0%) | 9,904 (100.0%) |
Housing Occupancy in Starr County
Occupancy by Ownership in Starr County
Of the total 18,634 dwellings in Starr County, owner-occupied units account for 13,528 (72.6%), while renter-occupied units make up 5,106 (27.4%).
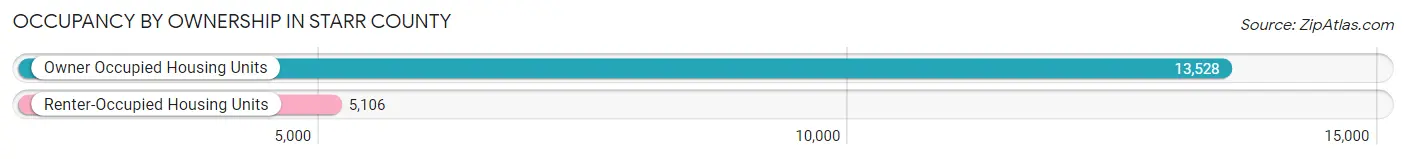
| Occupancy | # Housing Units | % Housing Units |
| Owner Occupied Housing Units | 13,528 | 72.6% |
| Renter-Occupied Housing Units | 5,106 | 27.4% |
| Total Occupied Housing Units | 18,634 | 100.0% |
Occupancy by Household Size in Starr County
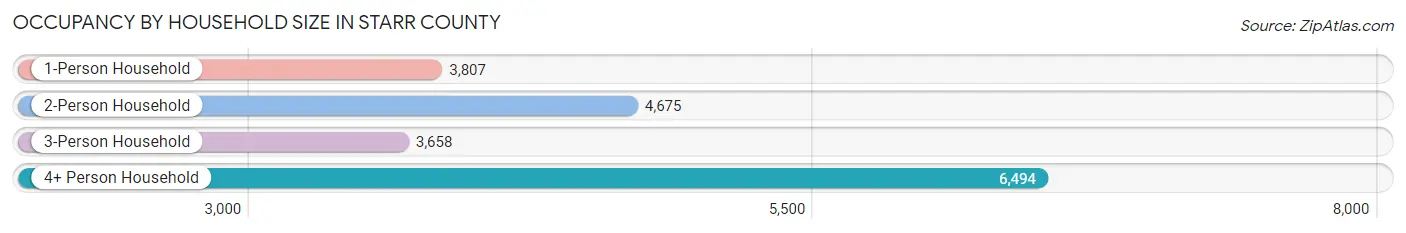
| Household Size | # Housing Units | % Housing Units |
| 1-Person Household | 3,807 | 20.4% |
| 2-Person Household | 4,675 | 25.1% |
| 3-Person Household | 3,658 | 19.6% |
| 4+ Person Household | 6,494 | 34.8% |
| Total Housing Units | 18,634 | 100.0% |
Occupancy by Ownership by Household Size in Starr County
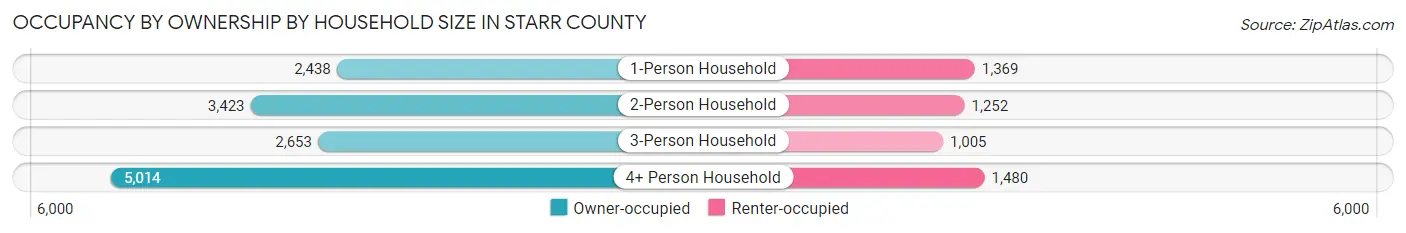
| Household Size | Owner-occupied | Renter-occupied |
| 1-Person Household | 2,438 (64.0%) | 1,369 (36.0%) |
| 2-Person Household | 3,423 (73.2%) | 1,252 (26.8%) |
| 3-Person Household | 2,653 (72.5%) | 1,005 (27.5%) |
| 4+ Person Household | 5,014 (77.2%) | 1,480 (22.8%) |
| Total Housing Units | 13,528 (72.6%) | 5,106 (27.4%) |
Occupancy by Educational Attainment in Starr County
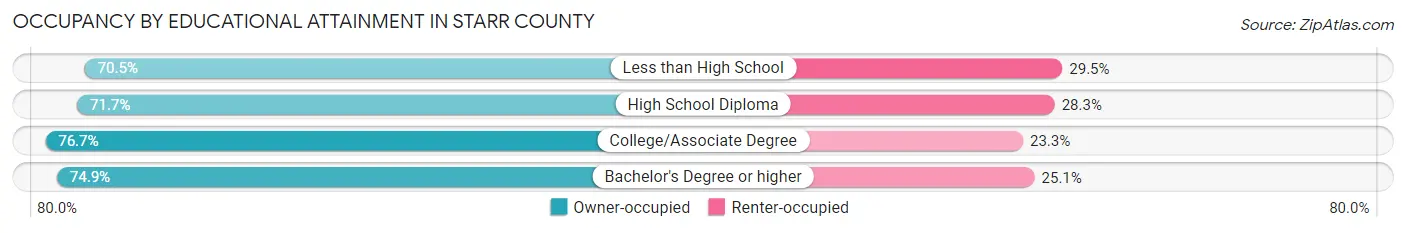
| Household Size | Owner-occupied | Renter-occupied |
| Less than High School | 5,361 (70.5%) | 2,247 (29.5%) |
| High School Diploma | 3,462 (71.7%) | 1,368 (28.3%) |
| College/Associate Degree | 2,760 (76.7%) | 838 (23.3%) |
| Bachelor's Degree or higher | 1,945 (74.9%) | 653 (25.1%) |
Occupancy by Age of Householder in Starr County
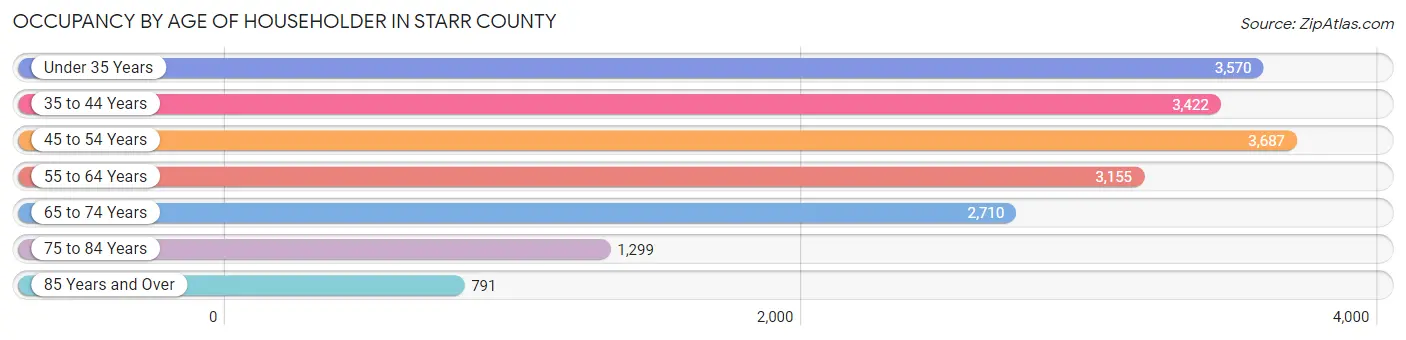
| Age Bracket | # Households | % Households |
| Under 35 Years | 3,570 | 19.2% |
| 35 to 44 Years | 3,422 | 18.4% |
| 45 to 54 Years | 3,687 | 19.8% |
| 55 to 64 Years | 3,155 | 16.9% |
| 65 to 74 Years | 2,710 | 14.5% |
| 75 to 84 Years | 1,299 | 7.0% |
| 85 Years and Over | 791 | 4.2% |
| Total | 18,634 | 100.0% |
Housing Finances in Starr County
Median Income by Occupancy in Starr County
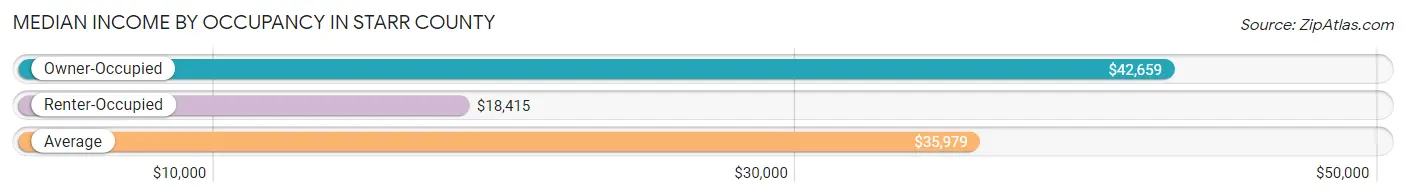
| Occupancy Type | # Households | Median Income |
| Owner-Occupied | 13,528 (72.6%) | $42,659 |
| Renter-Occupied | 5,106 (27.4%) | $18,415 |
| Average | 18,634 (100.0%) | $35,979 |
Occupancy by Householder Income Bracket in Starr County
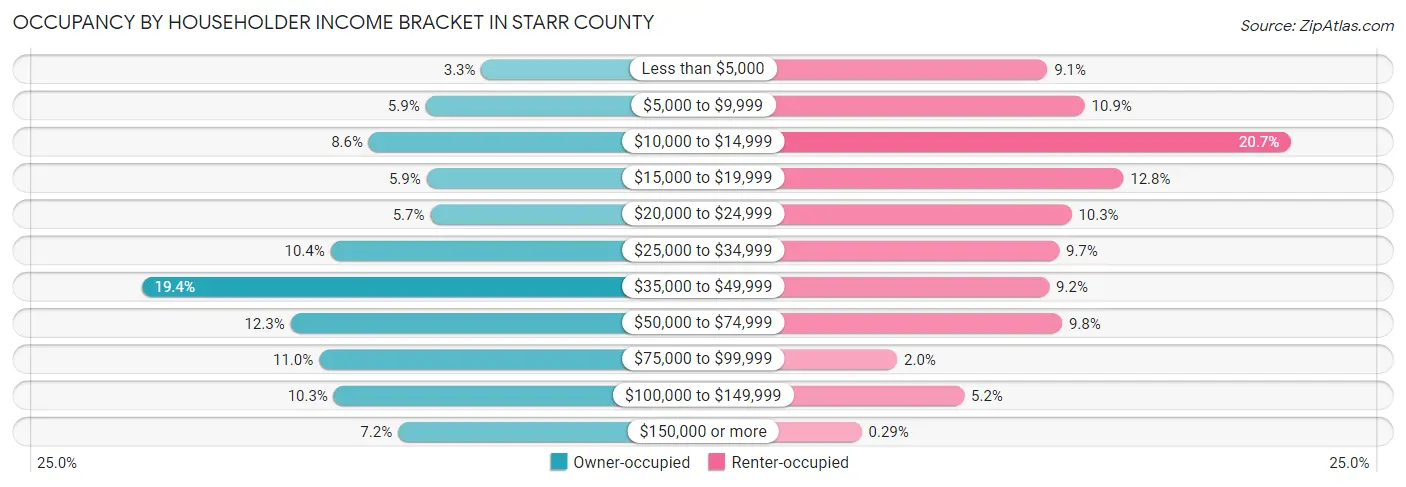
| Income Bracket | Owner-occupied | Renter-occupied |
| Less than $5,000 | 439 (3.3%) | 466 (9.1%) |
| $5,000 to $9,999 | 799 (5.9%) | 557 (10.9%) |
| $10,000 to $14,999 | 1,165 (8.6%) | 1,059 (20.7%) |
| $15,000 to $19,999 | 793 (5.9%) | 651 (12.8%) |
| $20,000 to $24,999 | 769 (5.7%) | 525 (10.3%) |
| $25,000 to $34,999 | 1,411 (10.4%) | 495 (9.7%) |
| $35,000 to $49,999 | 2,628 (19.4%) | 471 (9.2%) |
| $50,000 to $74,999 | 1,670 (12.3%) | 502 (9.8%) |
| $75,000 to $99,999 | 1,486 (11.0%) | 101 (2.0%) |
| $100,000 to $149,999 | 1,391 (10.3%) | 264 (5.2%) |
| $150,000 or more | 977 (7.2%) | 15 (0.3%) |
| Total | 13,528 (100.0%) | 5,106 (100.0%) |
Monthly Housing Cost Tiers in Starr County
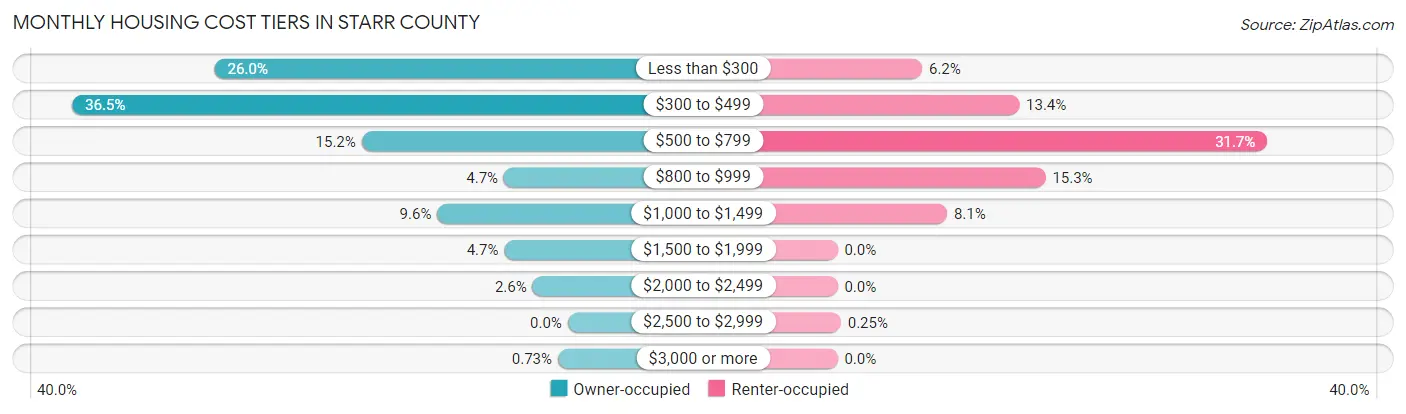
| Monthly Cost | Owner-occupied | Renter-occupied |
| Less than $300 | 3,519 (26.0%) | 318 (6.2%) |
| $300 to $499 | 4,938 (36.5%) | 683 (13.4%) |
| $500 to $799 | 2,053 (15.2%) | 1,616 (31.7%) |
| $800 to $999 | 636 (4.7%) | 782 (15.3%) |
| $1,000 to $1,499 | 1,300 (9.6%) | 412 (8.1%) |
| $1,500 to $1,999 | 632 (4.7%) | 0 (0.0%) |
| $2,000 to $2,499 | 351 (2.6%) | 0 (0.0%) |
| $2,500 to $2,999 | 0 (0.0%) | 13 (0.3%) |
| $3,000 or more | 99 (0.7%) | 0 (0.0%) |
| Total | 13,528 (100.0%) | 5,106 (100.0%) |
Physical Housing Characteristics in Starr County
Housing Structures in Starr County
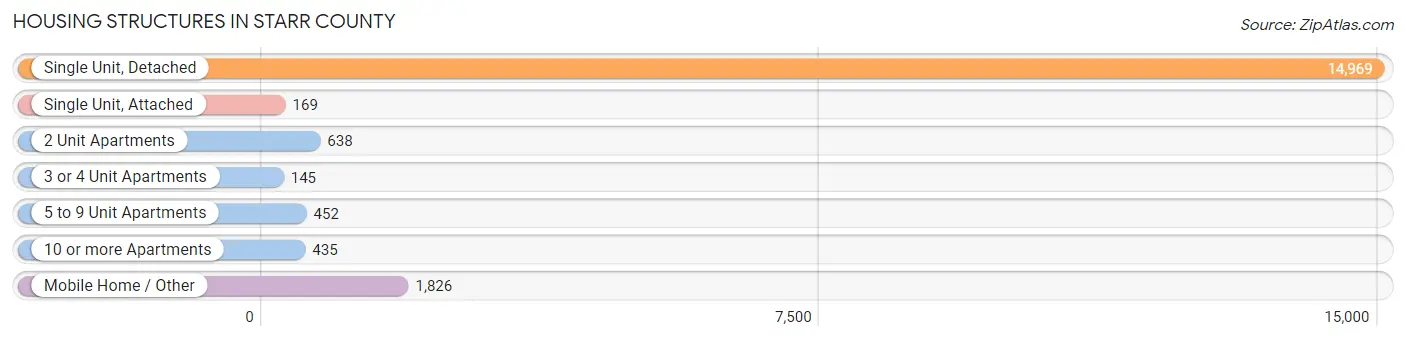
| Structure Type | # Housing Units | % Housing Units |
| Single Unit, Detached | 14,969 | 80.3% |
| Single Unit, Attached | 169 | 0.9% |
| 2 Unit Apartments | 638 | 3.4% |
| 3 or 4 Unit Apartments | 145 | 0.8% |
| 5 to 9 Unit Apartments | 452 | 2.4% |
| 10 or more Apartments | 435 | 2.3% |
| Mobile Home / Other | 1,826 | 9.8% |
| Total | 18,634 | 100.0% |
Housing Structures by Occupancy in Starr County
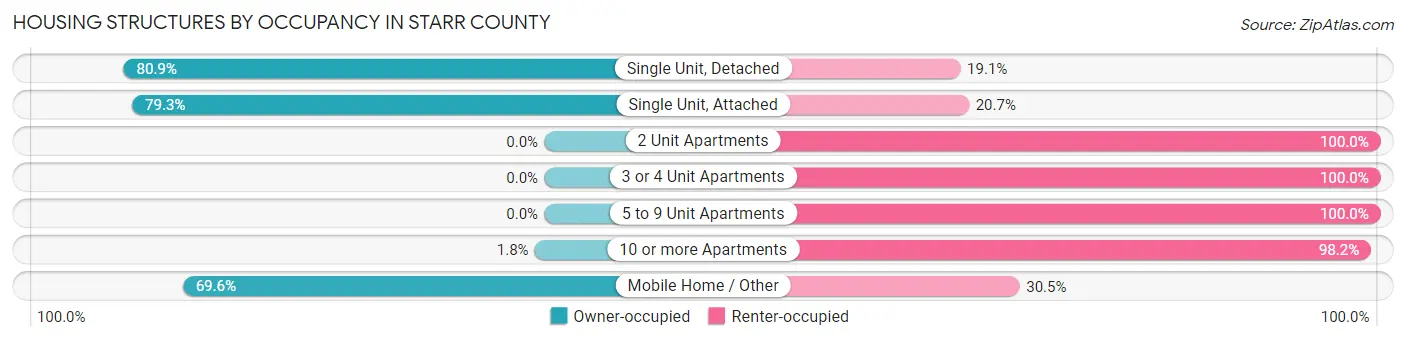
| Structure Type | Owner-occupied | Renter-occupied |
| Single Unit, Detached | 12,116 (80.9%) | 2,853 (19.1%) |
| Single Unit, Attached | 134 (79.3%) | 35 (20.7%) |
| 2 Unit Apartments | 0 (0.0%) | 638 (100.0%) |
| 3 or 4 Unit Apartments | 0 (0.0%) | 145 (100.0%) |
| 5 to 9 Unit Apartments | 0 (0.0%) | 452 (100.0%) |
| 10 or more Apartments | 8 (1.8%) | 427 (98.2%) |
| Mobile Home / Other | 1,270 (69.6%) | 556 (30.4%) |
| Total | 13,528 (72.6%) | 5,106 (27.4%) |
Housing Structures by Number of Rooms in Starr County
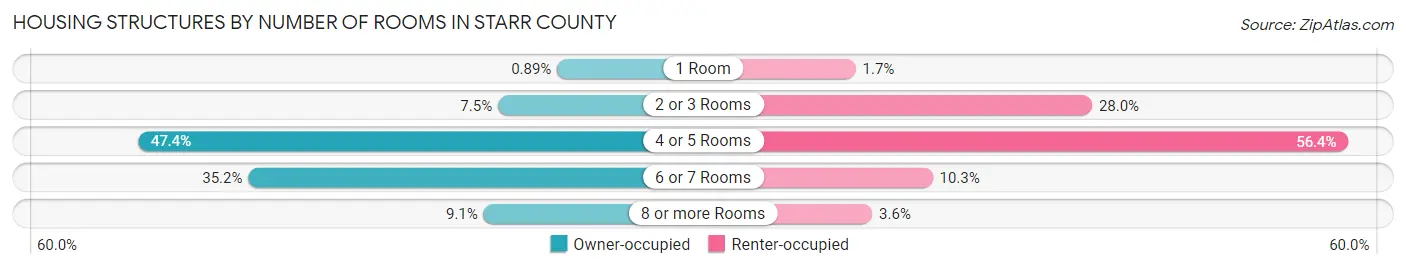
| Number of Rooms | Owner-occupied | Renter-occupied |
| 1 Room | 120 (0.9%) | 89 (1.7%) |
| 2 or 3 Rooms | 1,009 (7.5%) | 1,428 (28.0%) |
| 4 or 5 Rooms | 6,416 (47.4%) | 2,881 (56.4%) |
| 6 or 7 Rooms | 4,758 (35.2%) | 525 (10.3%) |
| 8 or more Rooms | 1,225 (9.1%) | 183 (3.6%) |
| Total | 13,528 (100.0%) | 5,106 (100.0%) |
Housing Structure by Heating Type in Starr County
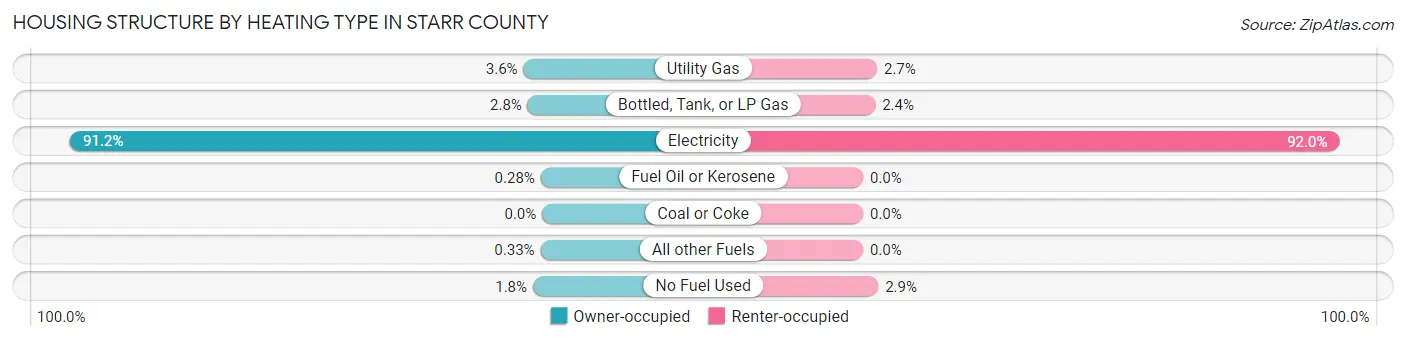
| Heating Type | Owner-occupied | Renter-occupied |
| Utility Gas | 489 (3.6%) | 138 (2.7%) |
| Bottled, Tank, or LP Gas | 378 (2.8%) | 120 (2.4%) |
| Electricity | 12,337 (91.2%) | 4,698 (92.0%) |
| Fuel Oil or Kerosene | 38 (0.3%) | 0 (0.0%) |
| Coal or Coke | 0 (0.0%) | 0 (0.0%) |
| All other Fuels | 45 (0.3%) | 0 (0.0%) |
| No Fuel Used | 241 (1.8%) | 150 (2.9%) |
| Total | 13,528 (100.0%) | 5,106 (100.0%) |
Household Vehicle Usage in Starr County
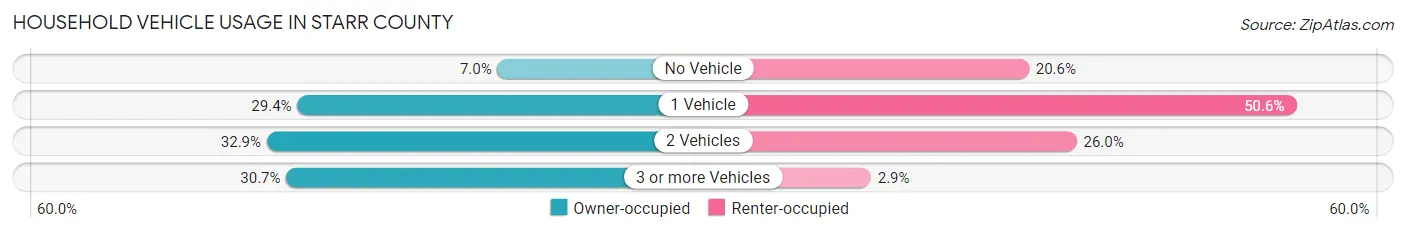
| Vehicles per Household | Owner-occupied | Renter-occupied |
| No Vehicle | 950 (7.0%) | 1,052 (20.6%) |
| 1 Vehicle | 3,982 (29.4%) | 2,581 (50.5%) |
| 2 Vehicles | 4,445 (32.9%) | 1,325 (26.0%) |
| 3 or more Vehicles | 4,151 (30.7%) | 148 (2.9%) |
| Total | 13,528 (100.0%) | 5,106 (100.0%) |
Real Estate & Mortgages in Starr County
Real Estate and Mortgage Overview in Starr County
| Characteristic | Without Mortgage | With Mortgage |
| Housing Units | 10,917 | 2,611 |
| Median Property Value | $78,100 | $130,600 |
| Median Household Income | $38,803 | $233 |
| Monthly Housing Costs | $367 | $99 |
| Real Estate Taxes | $866 | $86 |
Property Value by Mortgage Status in Starr County
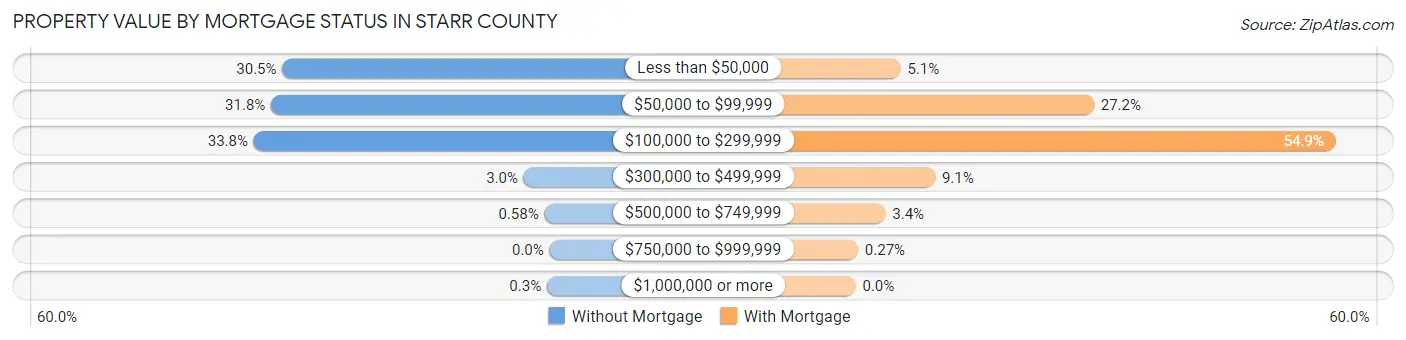
| Property Value | Without Mortgage | With Mortgage |
| Less than $50,000 | 3,334 (30.5%) | 134 (5.1%) |
| $50,000 to $99,999 | 3,474 (31.8%) | 711 (27.2%) |
| $100,000 to $299,999 | 3,691 (33.8%) | 1,433 (54.9%) |
| $300,000 to $499,999 | 322 (2.9%) | 237 (9.1%) |
| $500,000 to $749,999 | 63 (0.6%) | 89 (3.4%) |
| $750,000 to $999,999 | 0 (0.0%) | 7 (0.3%) |
| $1,000,000 or more | 33 (0.3%) | 0 (0.0%) |
| Total | 10,917 (100.0%) | 2,611 (100.0%) |
Household Income by Mortgage Status in Starr County
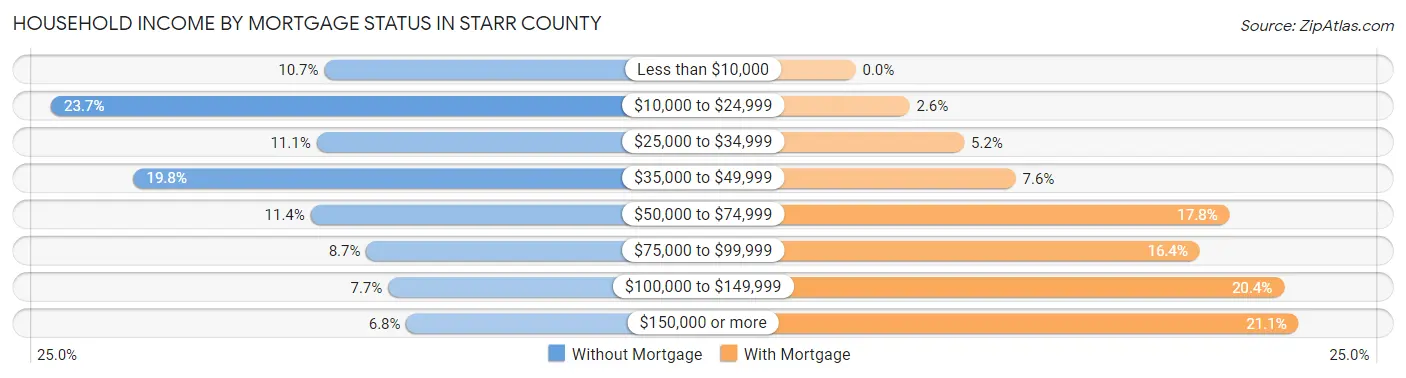
| Household Income | Without Mortgage | With Mortgage |
| Less than $10,000 | 1,171 (10.7%) | 0 (0.0%) |
| $10,000 to $24,999 | 2,592 (23.7%) | 67 (2.6%) |
| $25,000 to $34,999 | 1,212 (11.1%) | 135 (5.2%) |
| $35,000 to $49,999 | 2,163 (19.8%) | 199 (7.6%) |
| $50,000 to $74,999 | 1,242 (11.4%) | 465 (17.8%) |
| $75,000 to $99,999 | 953 (8.7%) | 428 (16.4%) |
| $100,000 to $149,999 | 840 (7.7%) | 533 (20.4%) |
| $150,000 or more | 744 (6.8%) | 551 (21.1%) |
| Total | 10,917 (100.0%) | 2,611 (100.0%) |
Property Value to Household Income Ratio in Starr County
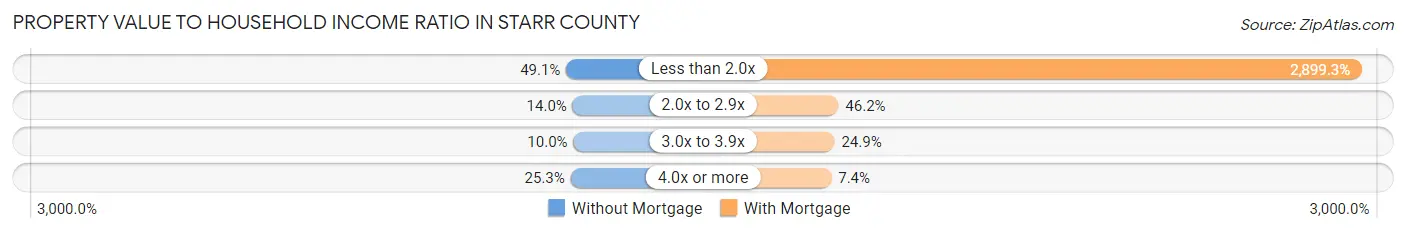
| Value-to-Income Ratio | Without Mortgage | With Mortgage |
| Less than 2.0x | 5,363 (49.1%) | 75,701 (2,899.3%) |
| 2.0x to 2.9x | 1,526 (14.0%) | 1,206 (46.2%) |
| 3.0x to 3.9x | 1,089 (10.0%) | 649 (24.9%) |
| 4.0x or more | 2,757 (25.3%) | 194 (7.4%) |
| Total | 10,917 (100.0%) | 2,611 (100.0%) |
Real Estate Taxes by Mortgage Status in Starr County
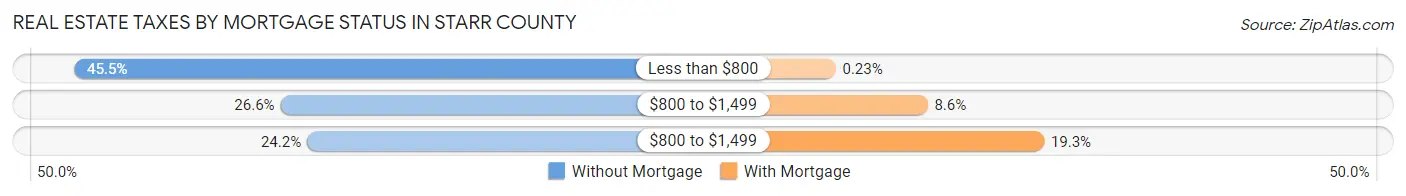
| Property Taxes | Without Mortgage | With Mortgage |
| Less than $800 | 4,965 (45.5%) | 6 (0.2%) |
| $800 to $1,499 | 2,908 (26.6%) | 225 (8.6%) |
| $800 to $1,499 | 2,643 (24.2%) | 503 (19.3%) |
| Total | 10,917 (100.0%) | 2,611 (100.0%) |
Health & Disability in Starr County
Health Insurance Coverage by Age in Starr County
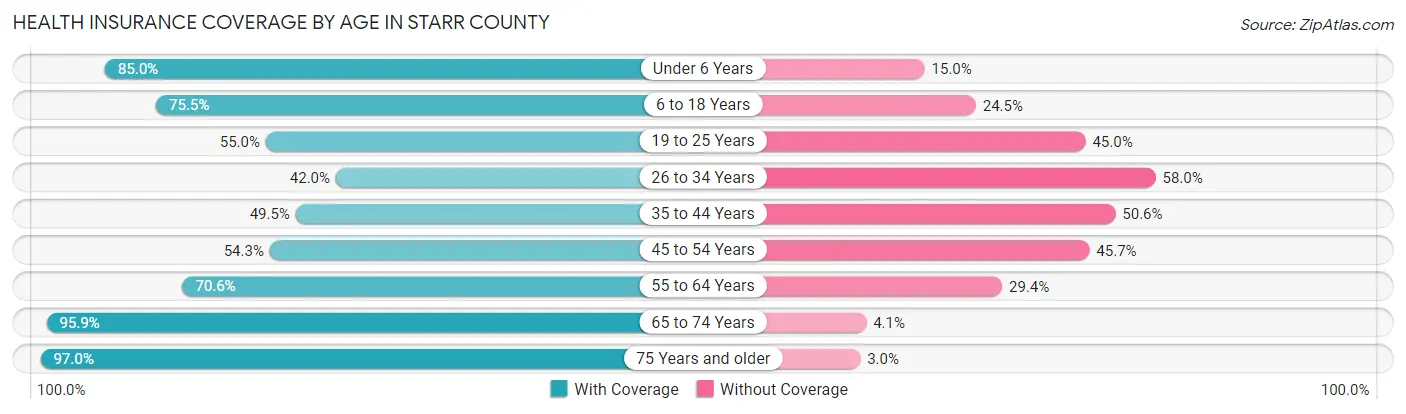
| Age Bracket | With Coverage | Without Coverage |
| Under 6 Years | 6,402 (85.0%) | 1,128 (15.0%) |
| 6 to 18 Years | 11,121 (75.5%) | 3,614 (24.5%) |
| 19 to 25 Years | 4,436 (55.0%) | 3,627 (45.0%) |
| 26 to 34 Years | 3,136 (42.0%) | 4,337 (58.0%) |
| 35 to 44 Years | 3,656 (49.4%) | 3,738 (50.5%) |
| 45 to 54 Years | 3,855 (54.3%) | 3,246 (45.7%) |
| 55 to 64 Years | 3,830 (70.6%) | 1,597 (29.4%) |
| 65 to 74 Years | 4,158 (95.9%) | 177 (4.1%) |
| 75 Years and older | 3,040 (97.0%) | 93 (3.0%) |
| Total | 43,634 (66.9%) | 21,557 (33.1%) |
Health Insurance Coverage by Citizenship Status in Starr County
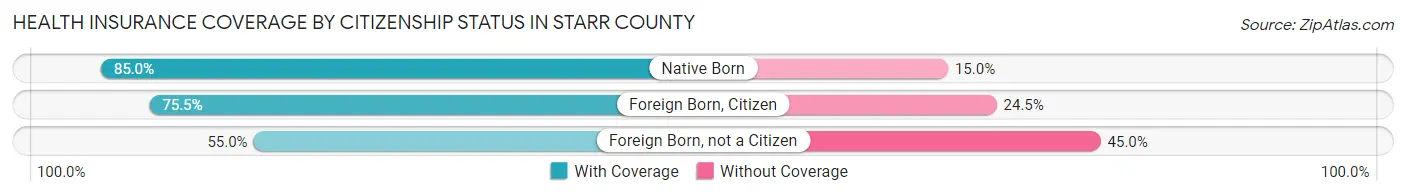
| Citizenship Status | With Coverage | Without Coverage |
| Native Born | 6,402 (85.0%) | 1,128 (15.0%) |
| Foreign Born, Citizen | 11,121 (75.5%) | 3,614 (24.5%) |
| Foreign Born, not a Citizen | 4,436 (55.0%) | 3,627 (45.0%) |
Health Insurance Coverage by Household Income in Starr County
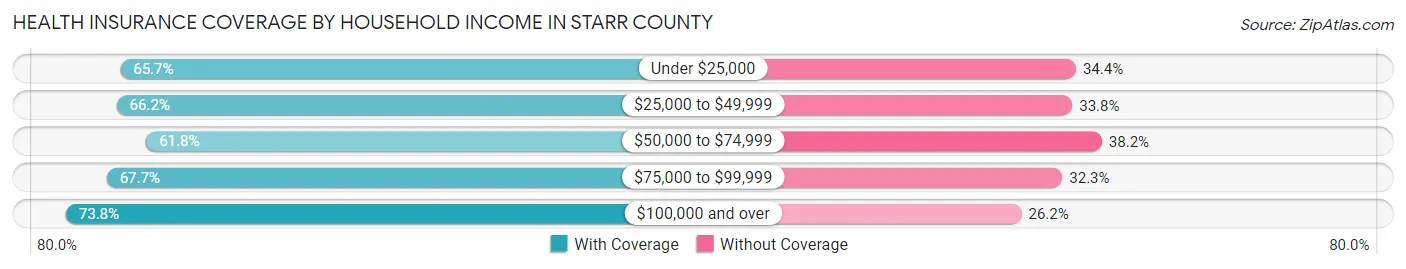
| Household Income | With Coverage | Without Coverage |
| Under $25,000 | 11,509 (65.6%) | 6,023 (34.4%) |
| $25,000 to $49,999 | 13,005 (66.2%) | 6,641 (33.8%) |
| $50,000 to $74,999 | 5,817 (61.8%) | 3,601 (38.2%) |
| $75,000 to $99,999 | 4,716 (67.7%) | 2,251 (32.3%) |
| $100,000 and over | 8,535 (73.8%) | 3,029 (26.2%) |
Public vs Private Health Insurance Coverage by Age in Starr County
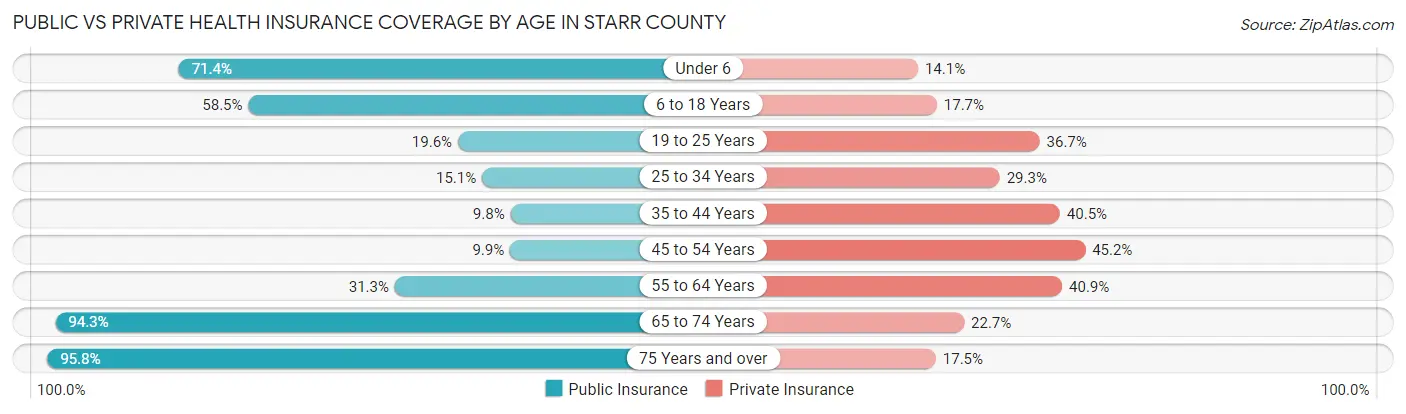
| Age Bracket | Public Insurance | Private Insurance |
| Under 6 | 5,376 (71.4%) | 1,065 (14.1%) |
| 6 to 18 Years | 8,615 (58.5%) | 2,600 (17.6%) |
| 19 to 25 Years | 1,578 (19.6%) | 2,961 (36.7%) |
| 25 to 34 Years | 1,128 (15.1%) | 2,191 (29.3%) |
| 35 to 44 Years | 725 (9.8%) | 2,993 (40.5%) |
| 45 to 54 Years | 703 (9.9%) | 3,208 (45.2%) |
| 55 to 64 Years | 1,698 (31.3%) | 2,219 (40.9%) |
| 65 to 74 Years | 4,087 (94.3%) | 984 (22.7%) |
| 75 Years and over | 3,001 (95.8%) | 547 (17.5%) |
| Total | 26,911 (41.3%) | 18,768 (28.8%) |
Disability Status by Sex by Age in Starr County
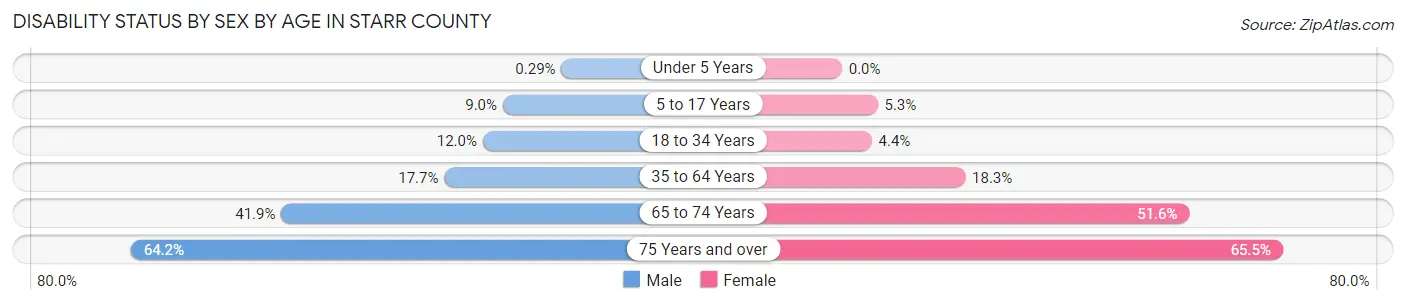
| Age Bracket | Male | Female |
| Under 5 Years | 9 (0.3%) | 0 (0.0%) |
| 5 to 17 Years | 694 (9.0%) | 405 (5.3%) |
| 18 to 34 Years | 975 (12.0%) | 363 (4.4%) |
| 35 to 64 Years | 1,680 (17.7%) | 1,908 (18.3%) |
| 65 to 74 Years | 835 (41.9%) | 1,208 (51.6%) |
| 75 Years and over | 779 (64.2%) | 1,257 (65.5%) |
Disability Class by Sex by Age in Starr County
Disability Class: Hearing Difficulty
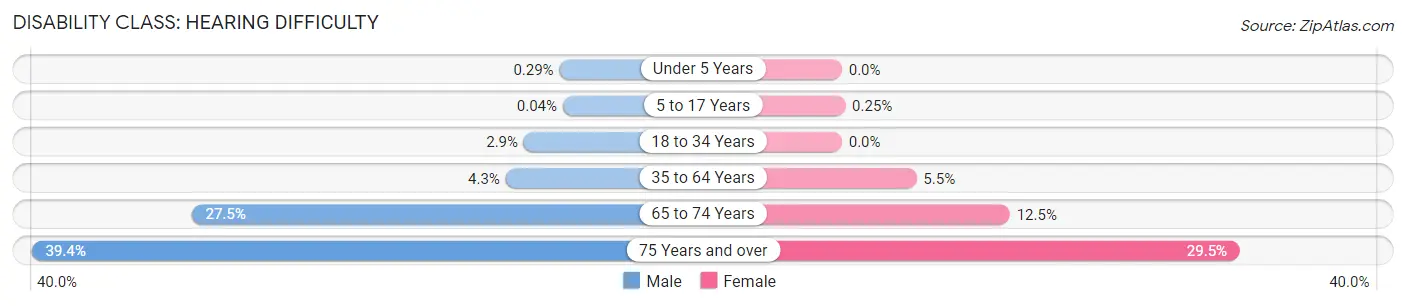
| Age Bracket | Male | Female |
| Under 5 Years | 9 (0.3%) | 0 (0.0%) |
| 5 to 17 Years | 3 (0.0%) | 19 (0.3%) |
| 18 to 34 Years | 239 (2.9%) | 0 (0.0%) |
| 35 to 64 Years | 407 (4.3%) | 577 (5.5%) |
| 65 to 74 Years | 549 (27.5%) | 292 (12.5%) |
| 75 Years and over | 478 (39.4%) | 566 (29.5%) |
Disability Class: Vision Difficulty
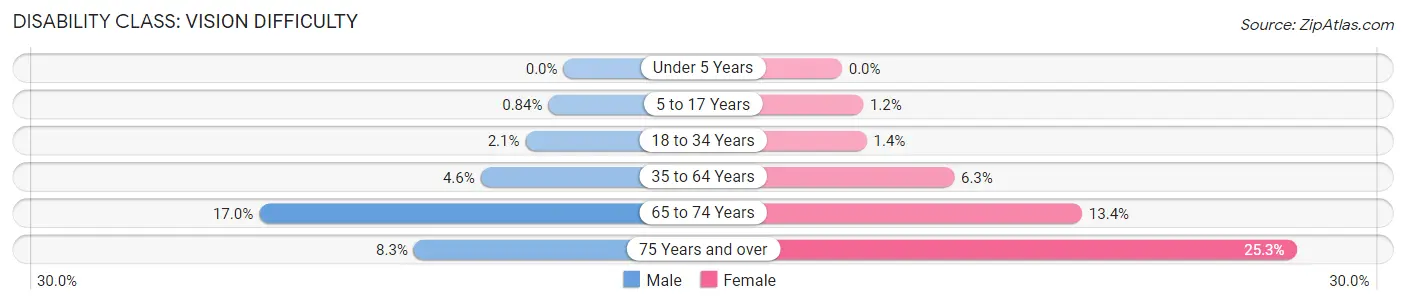
| Age Bracket | Male | Female |
| Under 5 Years | 0 (0.0%) | 0 (0.0%) |
| 5 to 17 Years | 65 (0.8%) | 90 (1.2%) |
| 18 to 34 Years | 173 (2.1%) | 113 (1.4%) |
| 35 to 64 Years | 438 (4.6%) | 651 (6.2%) |
| 65 to 74 Years | 338 (17.0%) | 313 (13.4%) |
| 75 Years and over | 101 (8.3%) | 486 (25.3%) |
Disability Class: Cognitive Difficulty
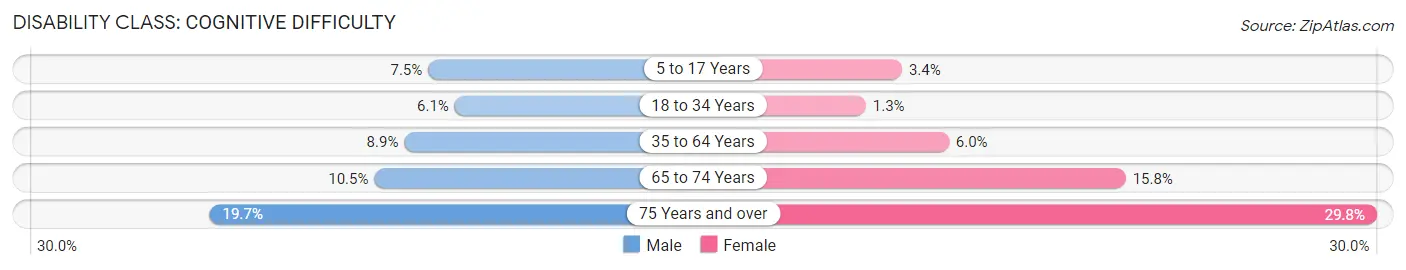
| Age Bracket | Male | Female |
| 5 to 17 Years | 582 (7.5%) | 255 (3.4%) |
| 18 to 34 Years | 493 (6.0%) | 110 (1.3%) |
| 35 to 64 Years | 842 (8.9%) | 621 (6.0%) |
| 65 to 74 Years | 210 (10.5%) | 370 (15.8%) |
| 75 Years and over | 239 (19.7%) | 572 (29.8%) |
Disability Class: Ambulatory Difficulty
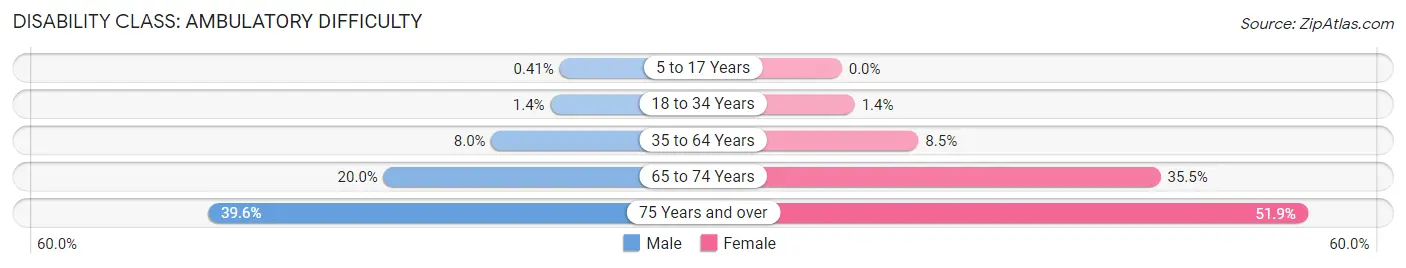
| Age Bracket | Male | Female |
| 5 to 17 Years | 32 (0.4%) | 0 (0.0%) |
| 18 to 34 Years | 117 (1.4%) | 118 (1.4%) |
| 35 to 64 Years | 761 (8.0%) | 889 (8.5%) |
| 65 to 74 Years | 399 (20.0%) | 831 (35.5%) |
| 75 Years and over | 480 (39.6%) | 996 (51.9%) |
Disability Class: Self-Care Difficulty
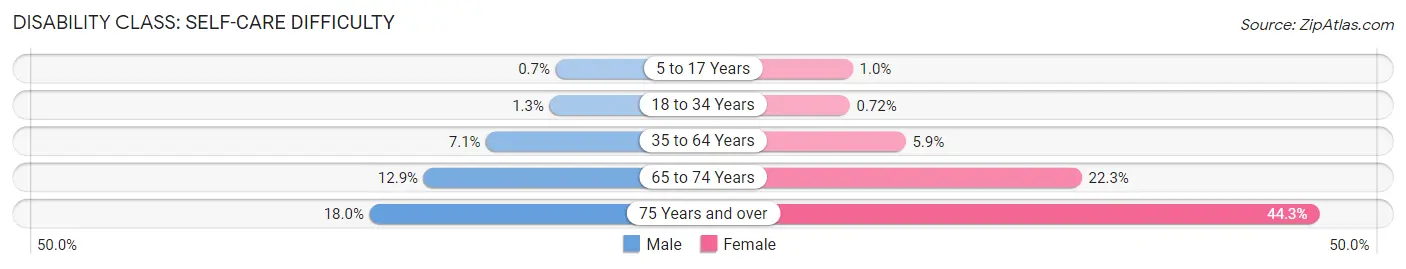
| Age Bracket | Male | Female |
| 5 to 17 Years | 54 (0.7%) | 76 (1.0%) |
| 18 to 34 Years | 103 (1.3%) | 59 (0.7%) |
| 35 to 64 Years | 678 (7.1%) | 616 (5.9%) |
| 65 to 74 Years | 258 (12.9%) | 521 (22.3%) |
| 75 Years and over | 218 (18.0%) | 851 (44.3%) |
Technology Access in Starr County
Computing Device Access in Starr County
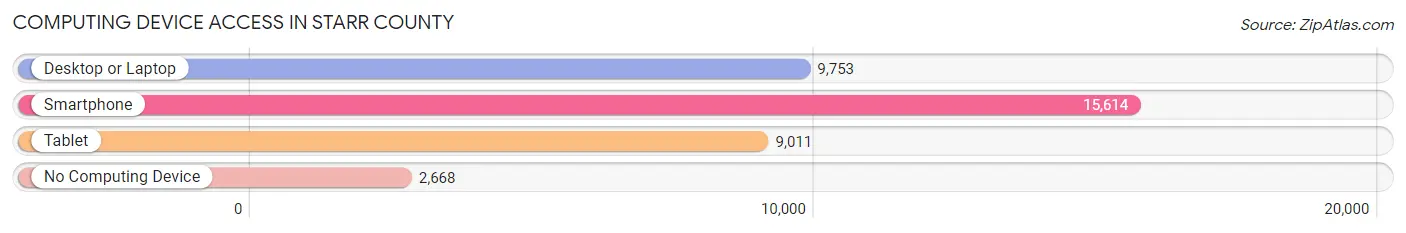
| Device Type | # Households | % Households |
| Desktop or Laptop | 9,753 | 52.3% |
| Smartphone | 15,614 | 83.8% |
| Tablet | 9,011 | 48.4% |
| No Computing Device | 2,668 | 14.3% |
| Total | 18,634 | 100.0% |
Internet Access in Starr County
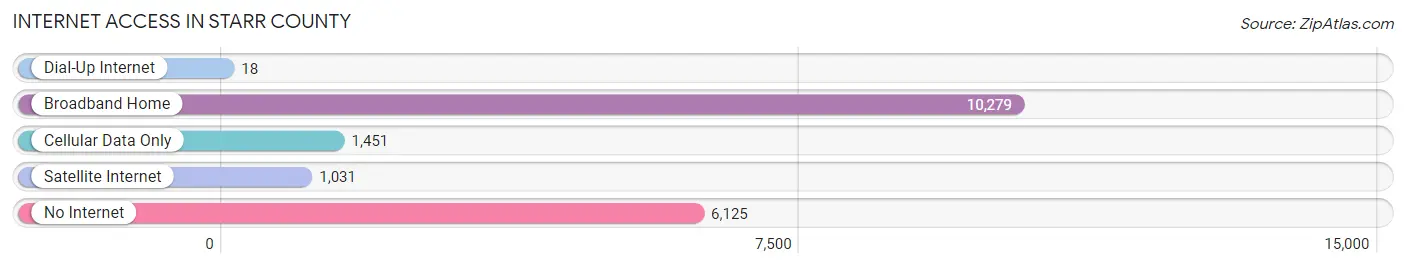
| Internet Type | # Households | % Households |
| Dial-Up Internet | 18 | 0.1% |
| Broadband Home | 10,279 | 55.2% |
| Cellular Data Only | 1,451 | 7.8% |
| Satellite Internet | 1,031 | 5.5% |
| No Internet | 6,125 | 32.9% |
| Total | 18,634 | 100.0% |
Starr County Summary
Starr County is located in the Rio Grande Valley of South Texas, along the U.S.-Mexico border. It is bordered by Hidalgo County to the east, Cameron County to the south, and Webb County to the west. The county seat is Rio Grande City. As of the 2010 census, the population was 60,968.
History
Starr County was established in 1848 and named for James Harper Starr, a soldier in the Texas Revolution. The county was originally part of Hidalgo County, but was split off in 1848. The county was originally populated by Native Americans, including the Coahuiltecan, Karankawa, and Tonkawa tribes.
In the late 19th century, Starr County was home to a large number of German and Czech immigrants, who were attracted to the area by the fertile land and mild climate. The county was also home to a large number of Mexican immigrants, who were drawn to the area by the promise of work in the agricultural and ranching industries.
Geography
Starr County covers an area of 1,229 square miles, making it the second-largest county in Texas. The terrain is mostly flat, with some rolling hills in the northern part of the county. The Rio Grande forms the county’s eastern border.
The climate is subtropical, with hot summers and mild winters. The average annual temperature is 73°F, and the average annual precipitation is 22 inches.
Economy
Starr County’s economy is largely based on agriculture and ranching. The county is one of the leading producers of citrus fruits in the state, and is also a major producer of vegetables, cotton, and grain.
The county is also home to a number of manufacturing and service industries, including food processing, electronics, and tourism. The county is also home to a number of oil and gas fields, which provide jobs and revenue for the county.
Demographics
As of the 2010 census, the population of Starr County was 60,968. The racial makeup of the county was 79.3% Hispanic or Latino, 17.2% White, 0.7% African American, 0.3% Native American, 0.1% Asian, and 2.4% from other races.
The median household income in the county was $25,945, and the median family income was $30,945. The per capita income was $12,845. About 28.3% of the population was below the poverty line.
Starr County is one of the poorest counties in the state, with a poverty rate of 28.3%. The county has a high rate of unemployment, with an unemployment rate of 8.2%. The county also has a high rate of uninsured residents, with an uninsured rate of 33.3%.
Common Questions
What is Per Capita Income in Starr County?
Per Capita income in Starr County is $16,934.
What is the Median Family Income in Starr County?
Median Family Income in Starr County is $42,033.
What is the Median Household income in Starr County?
Median Household Income in Starr County is $35,979.
What is Income or Wage Gap in Starr County?
Income or Wage Gap in Starr County is 30.3%.
Women in Starr County earn 69.7 cents for every dollar earned by a man.
What is Family Income Deficit in Starr County?
Family Income Deficit in Starr County is $10,748.
Families that are below poverty line in Starr County earn $10,748 less on average than the poverty threshold level.
What is Inequality or Gini Index in Starr County?
Inequality or Gini Index in Starr County is 0.51.
What is the Total Population of Starr County?
Total Population of Starr County is 65,716.
What is the Total Male Population of Starr County?
Total Male Population of Starr County is 32,196.
What is the Total Female Population of Starr County?
Total Female Population of Starr County is 33,520.
What is the Ratio of Males per 100 Females in Starr County?
There are 96.05 Males per 100 Females in Starr County.
What is the Ratio of Females per 100 Males in Starr County?
There are 104.11 Females per 100 Males in Starr County.
What is the Median Population Age in Starr County?
Median Population Age in Starr County is 28.6 Years.
What is the Average Family Size in Starr County
Average Family Size in Starr County is 4.1 People.
What is the Average Household Size in Starr County
Average Household Size in Starr County is 3.5 People.
How Large is the Labor Force in Starr County?
There are 27,229 People in the Labor Forcein in Starr County.
What is the Percentage of People in the Labor Force in Starr County?
58.2% of People are in the Labor Force in Starr County.
What is the Unemployment Rate in Starr County?
Unemployment Rate in Starr County is 11.5%.