Somervell County, TX Map & Demographics
Somervell County Map
Somervell County Overview
$39,037
PER CAPITA INCOME
$96,386
AVG FAMILY INCOME
$87,899
AVG HOUSEHOLD INCOME
45.7%
WAGE / INCOME GAP [ % ]
54.3¢/ $1
WAGE / INCOME GAP [ $ ]
0.41
INEQUALITY / GINI INDEX
9,337
TOTAL POPULATION
4,573
MALE POPULATION
4,764
FEMALE POPULATION
95.99
MALES / 100 FEMALES
104.18
FEMALES / 100 MALES
43.1
MEDIAN AGE
3.0
AVG FAMILY SIZE
2.7
AVG HOUSEHOLD SIZE
4,752
LABOR FORCE [ PEOPLE ]
62.6%
PERCENT IN LABOR FORCE
3.9%
UNEMPLOYMENT RATE
Somervell County Area Codes
Income in Somervell County
Income Overview in Somervell County
Per Capita Income in Somervell County is $39,037, while median incomes of families and households are $96,386 and $87,899 respectively.
| Characteristic | Number | Measure |
| Per Capita Income | 9,337 | $39,037 |
| Median Family Income | 2,647 | $96,386 |
| Mean Family Income | 2,647 | $109,837 |
| Median Household Income | 3,345 | $87,899 |
| Mean Household Income | 3,345 | $97,659 |
| Income Deficit | 2,647 | $0 |
| Wage / Income Gap (%) | 9,337 | 45.75% |
| Wage / Income Gap ($) | 9,337 | 54.25¢ per $1 |
| Gini / Inequality Index | 9,337 | 0.41 |
Earnings by Sex in Somervell County
Average Earnings in Somervell County are $41,024, $54,226 for men and $29,419 for women, a difference of 45.8%.
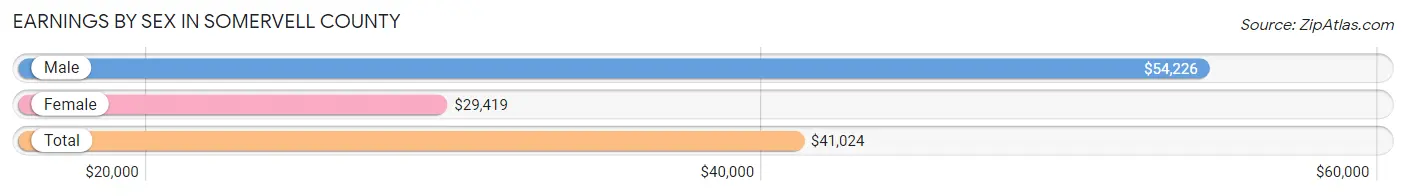
| Sex | Number | Average Earnings |
| Male | 2,798 (55.6%) | $54,226 |
| Female | 2,237 (44.4%) | $29,419 |
| Total | 5,035 (100.0%) | $41,024 |
Earnings by Sex by Income Bracket in Somervell County
The most common earnings brackets in Somervell County are $100,000+ for men (594 | 21.2%) and $100,000+ for women (260 | 11.6%).
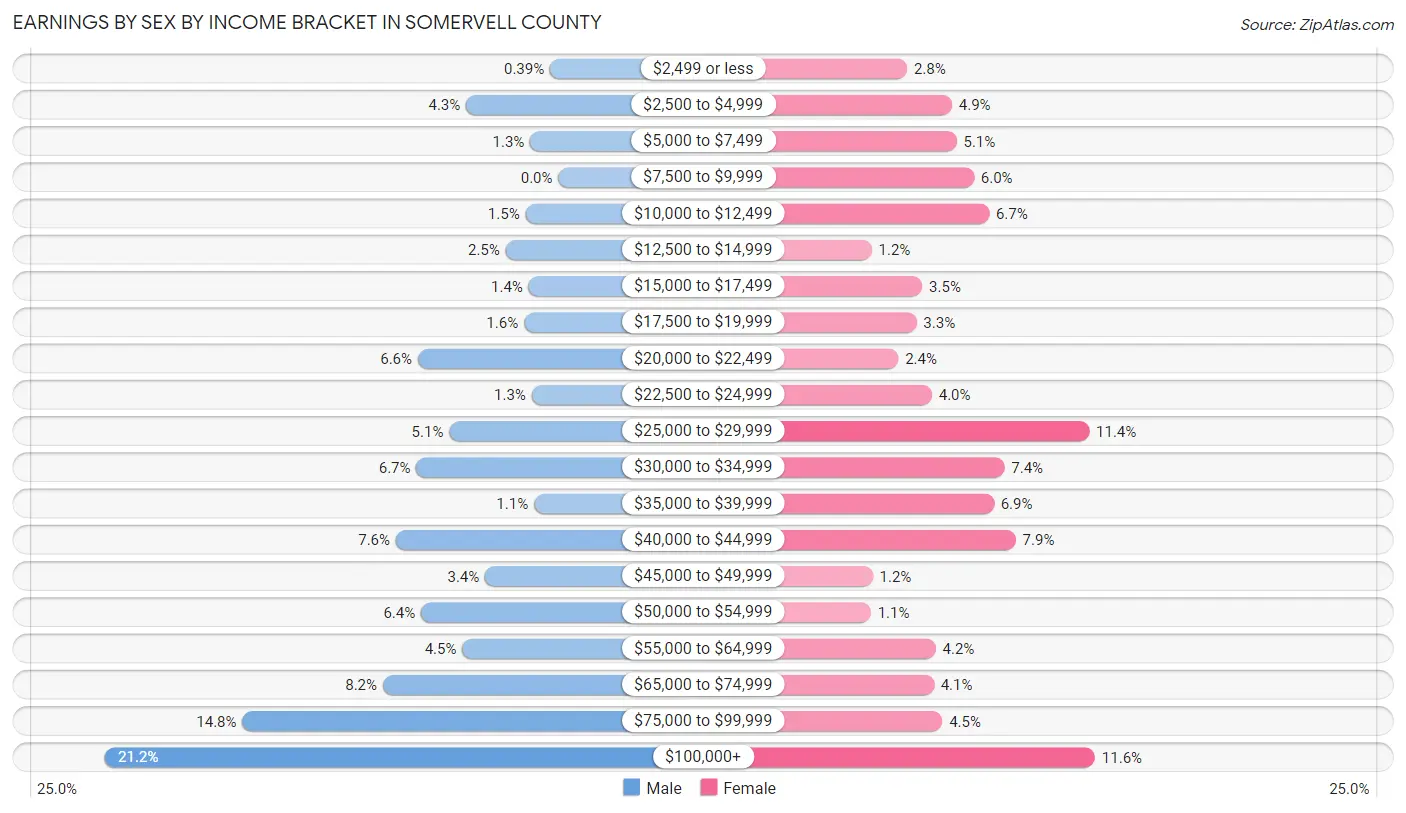
| Income | Male | Female |
| $2,499 or less | 11 (0.4%) | 63 (2.8%) |
| $2,500 to $4,999 | 121 (4.3%) | 110 (4.9%) |
| $5,000 to $7,499 | 37 (1.3%) | 115 (5.1%) |
| $7,500 to $9,999 | 0 (0.0%) | 133 (5.9%) |
| $10,000 to $12,499 | 43 (1.5%) | 149 (6.7%) |
| $12,500 to $14,999 | 69 (2.5%) | 26 (1.2%) |
| $15,000 to $17,499 | 39 (1.4%) | 79 (3.5%) |
| $17,500 to $19,999 | 45 (1.6%) | 73 (3.3%) |
| $20,000 to $22,499 | 184 (6.6%) | 54 (2.4%) |
| $22,500 to $24,999 | 35 (1.3%) | 89 (4.0%) |
| $25,000 to $29,999 | 143 (5.1%) | 254 (11.4%) |
| $30,000 to $34,999 | 186 (6.7%) | 165 (7.4%) |
| $35,000 to $39,999 | 32 (1.1%) | 154 (6.9%) |
| $40,000 to $44,999 | 213 (7.6%) | 177 (7.9%) |
| $45,000 to $49,999 | 96 (3.4%) | 27 (1.2%) |
| $50,000 to $54,999 | 180 (6.4%) | 25 (1.1%) |
| $55,000 to $64,999 | 126 (4.5%) | 93 (4.2%) |
| $65,000 to $74,999 | 230 (8.2%) | 91 (4.1%) |
| $75,000 to $99,999 | 414 (14.8%) | 100 (4.5%) |
| $100,000+ | 594 (21.2%) | 260 (11.6%) |
| Total | 2,798 (100.0%) | 2,237 (100.0%) |
Earnings by Sex by Educational Attainment in Somervell County
Average earnings in Somervell County are $60,781 for men and $33,705 for women, a difference of 44.6%. Men with an educational attainment of bachelor's degree enjoy the highest average annual earnings of $76,806, while those with less than high school education earn the least with $40,918. Women with an educational attainment of college or associate's degree earn the most with the average annual earnings of $36,406, while those with less than high school education have the smallest earnings of $18,636.
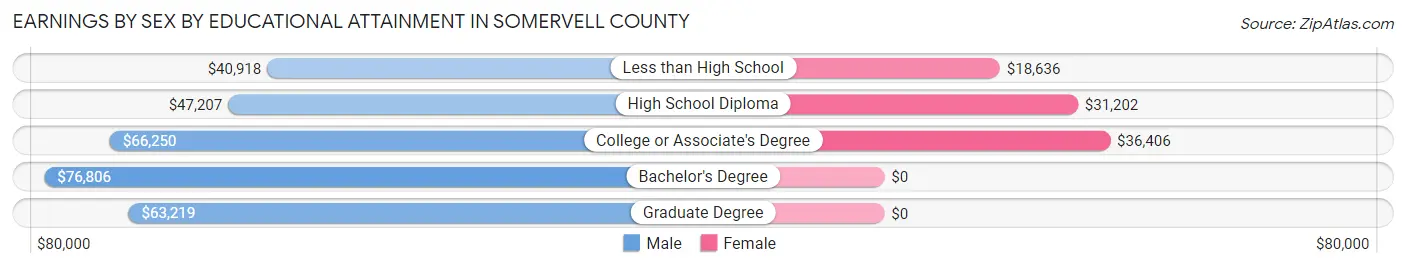
| Educational Attainment | Male Income | Female Income |
| Less than High School | $40,918 | $18,636 |
| High School Diploma | $47,207 | $31,202 |
| College or Associate's Degree | $66,250 | $36,406 |
| Bachelor's Degree | $76,806 | $0 |
| Graduate Degree | $63,219 | $0 |
| Total | $60,781 | $33,705 |
Family Income in Somervell County
Family Income Brackets in Somervell County
According to the Somervell County family income data, there are 752 families falling into the $100,000 to $149,999 income range, which is the most common income bracket and makes up 28.4% of all families. Conversely, the $10,000 to $14,999 income bracket is the least frequent group with only 11 families (0.4%) belonging to this category.
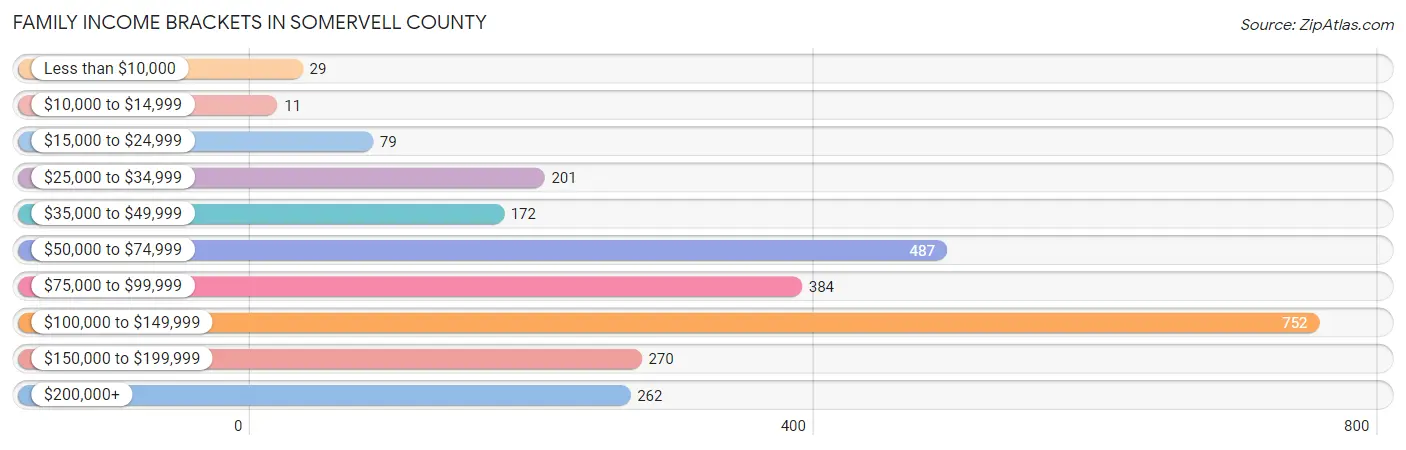
| Income Bracket | # Families | % Families |
| Less than $10,000 | 29 | 1.1% |
| $10,000 to $14,999 | 11 | 0.4% |
| $15,000 to $24,999 | 79 | 3.0% |
| $25,000 to $34,999 | 201 | 7.6% |
| $35,000 to $49,999 | 172 | 6.5% |
| $50,000 to $74,999 | 487 | 18.4% |
| $75,000 to $99,999 | 384 | 14.5% |
| $100,000 to $149,999 | 752 | 28.4% |
| $150,000 to $199,999 | 270 | 10.2% |
| $200,000+ | 262 | 9.9% |
Family Income by Famaliy Size in Somervell County
7+ person families (76 | 2.9%) account for the highest median family income in Somervell County with $179,605 per family, while 2-person families (1,440 | 54.4%) have the highest median income of $37,320 per family member.
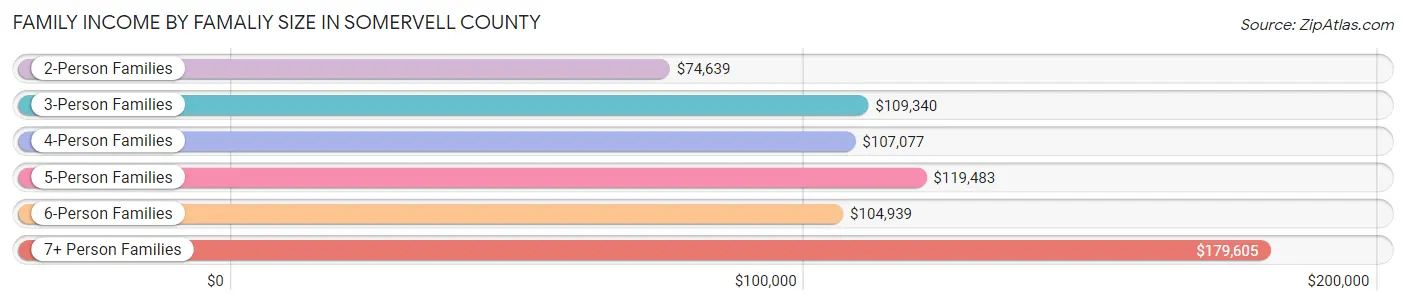
| Income Bracket | # Families | Median Income |
| 2-Person Families | 1,440 (54.4%) | $74,639 |
| 3-Person Families | 475 (17.9%) | $109,340 |
| 4-Person Families | 388 (14.7%) | $107,077 |
| 5-Person Families | 188 (7.1%) | $119,483 |
| 6-Person Families | 80 (3.0%) | $104,939 |
| 7+ Person Families | 76 (2.9%) | $179,605 |
| Total | 2,647 (100.0%) | $96,386 |
Family Income by Number of Earners in Somervell County
The median family income in Somervell County is $96,386, with families comprising 3+ earners (341) having the highest median family income of $126,094, while families with no earners (413) have the lowest median family income of $62,961, accounting for 12.9% and 15.6% of families, respectively.
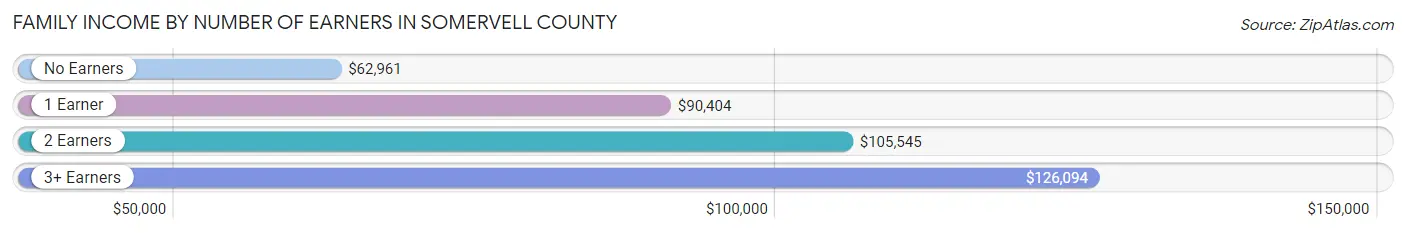
| Number of Earners | # Families | Median Income |
| No Earners | 413 (15.6%) | $62,961 |
| 1 Earner | 669 (25.3%) | $90,404 |
| 2 Earners | 1,224 (46.2%) | $105,545 |
| 3+ Earners | 341 (12.9%) | $126,094 |
| Total | 2,647 (100.0%) | $96,386 |
Household Income in Somervell County
Household Income Brackets in Somervell County
With 937 households falling in the category, the $100,000 to $149,999 income range is the most frequent in Somervell County, accounting for 28.0% of all households. In contrast, only 84 households (2.5%) fall into the less than $10,000 income bracket, making it the least populous group.
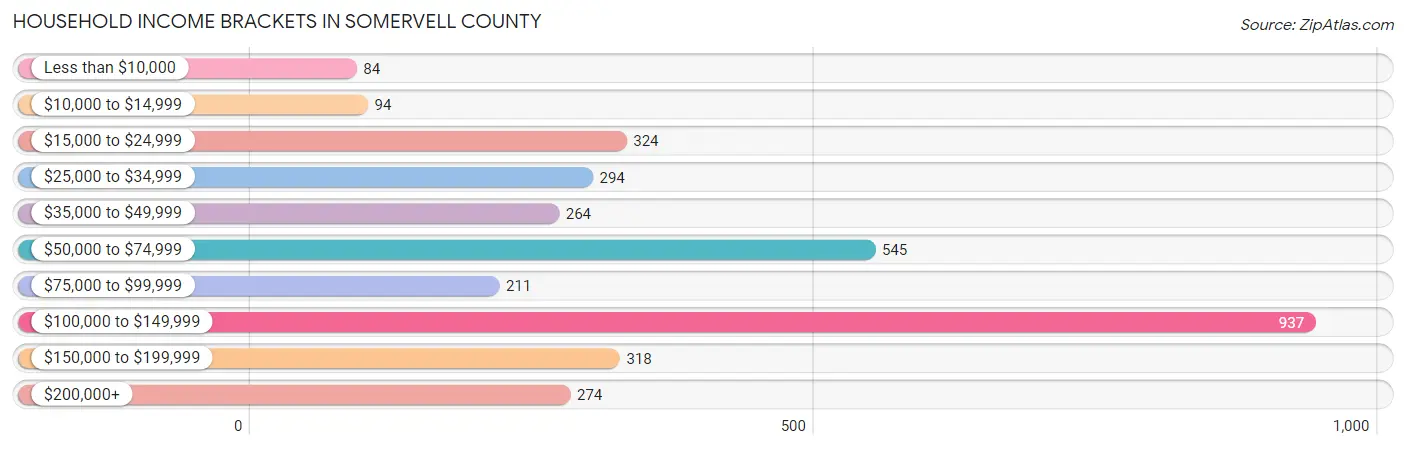
| Income Bracket | # Households | % Households |
| Less than $10,000 | 84 | 2.5% |
| $10,000 to $14,999 | 94 | 2.8% |
| $15,000 to $24,999 | 324 | 9.7% |
| $25,000 to $34,999 | 294 | 8.8% |
| $35,000 to $49,999 | 264 | 7.9% |
| $50,000 to $74,999 | 545 | 16.3% |
| $75,000 to $99,999 | 211 | 6.3% |
| $100,000 to $149,999 | 937 | 28.0% |
| $150,000 to $199,999 | 318 | 9.5% |
| $200,000+ | 274 | 8.2% |
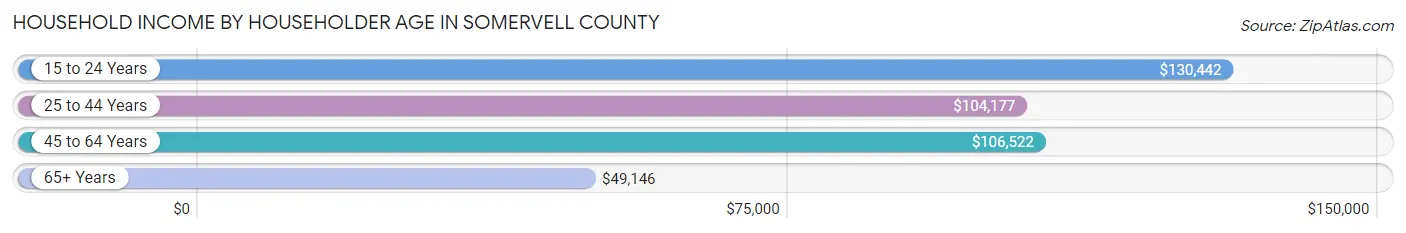
Household Income by Householder Age in Somervell County
The median household income in Somervell County is $87,899, with the highest median household income of $130,442 found in the 15 to 24 years age bracket for the primary householder. A total of 219 households (6.6%) fall into this category. Meanwhile, the 65+ years age bracket for the primary householder has the lowest median household income of $49,146, with 1,024 households (30.6%) in this group.
| Income Bracket | # Households | Median Income |
| 15 to 24 Years | 219 (6.6%) | $130,442 |
| 25 to 44 Years | 729 (21.8%) | $104,177 |
| 45 to 64 Years | 1,373 (41.0%) | $106,522 |
| 65+ Years | 1,024 (30.6%) | $49,146 |
| Total | 3,345 (100.0%) | $87,899 |
Poverty in Somervell County
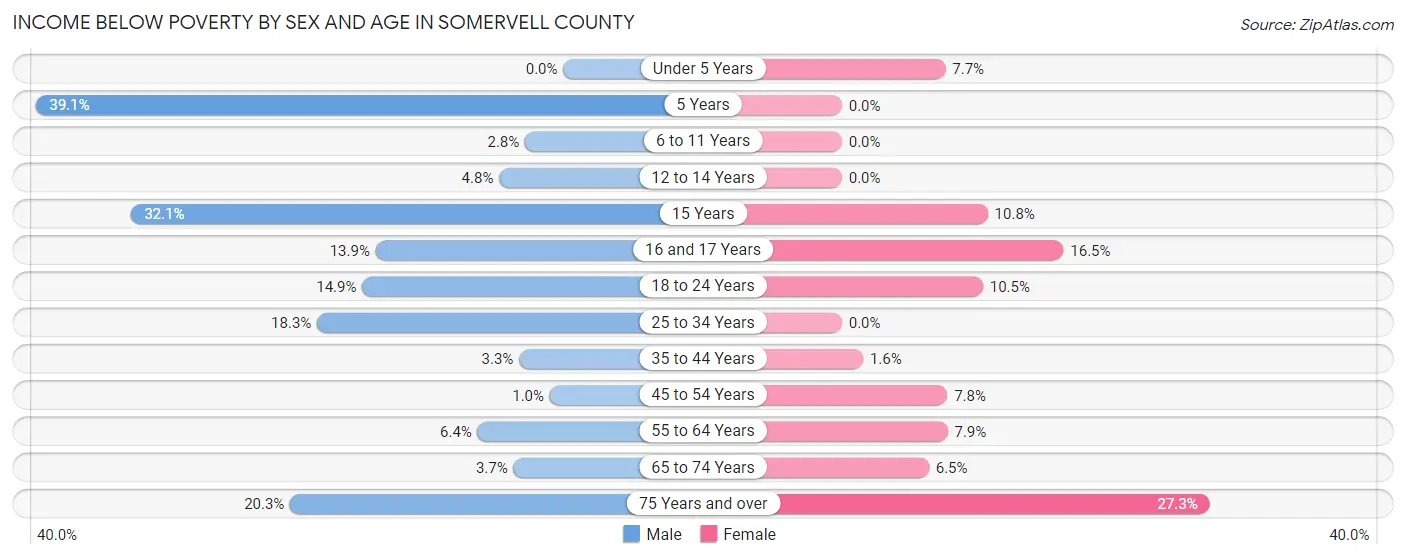
Income Below Poverty by Sex and Age in Somervell County
With 7.7% poverty level for males and 6.9% for females among the residents of Somervell County, 5 year old males and 75 year old and over females are the most vulnerable to poverty, with 9 males (39.1%) and 92 females (27.3%) in their respective age groups living below the poverty level.
| Age Bracket | Male | Female |
| Under 5 Years | 0 (0.0%) | 7 (7.7%) |
| 5 Years | 9 (39.1%) | 0 (0.0%) |
| 6 to 11 Years | 8 (2.8%) | 0 (0.0%) |
| 12 to 14 Years | 8 (4.8%) | 0 (0.0%) |
| 15 Years | 34 (32.1%) | 17 (10.8%) |
| 16 and 17 Years | 17 (13.9%) | 25 (16.5%) |
| 18 to 24 Years | 56 (14.9%) | 40 (10.5%) |
| 25 to 34 Years | 68 (18.3%) | 0 (0.0%) |
| 35 to 44 Years | 21 (3.3%) | 12 (1.6%) |
| 45 to 54 Years | 7 (1.0%) | 40 (7.8%) |
| 55 to 64 Years | 43 (6.4%) | 55 (7.9%) |
| 65 to 74 Years | 18 (3.7%) | 32 (6.5%) |
| 75 Years and over | 58 (20.3%) | 92 (27.3%) |
| Total | 347 (7.7%) | 320 (6.9%) |
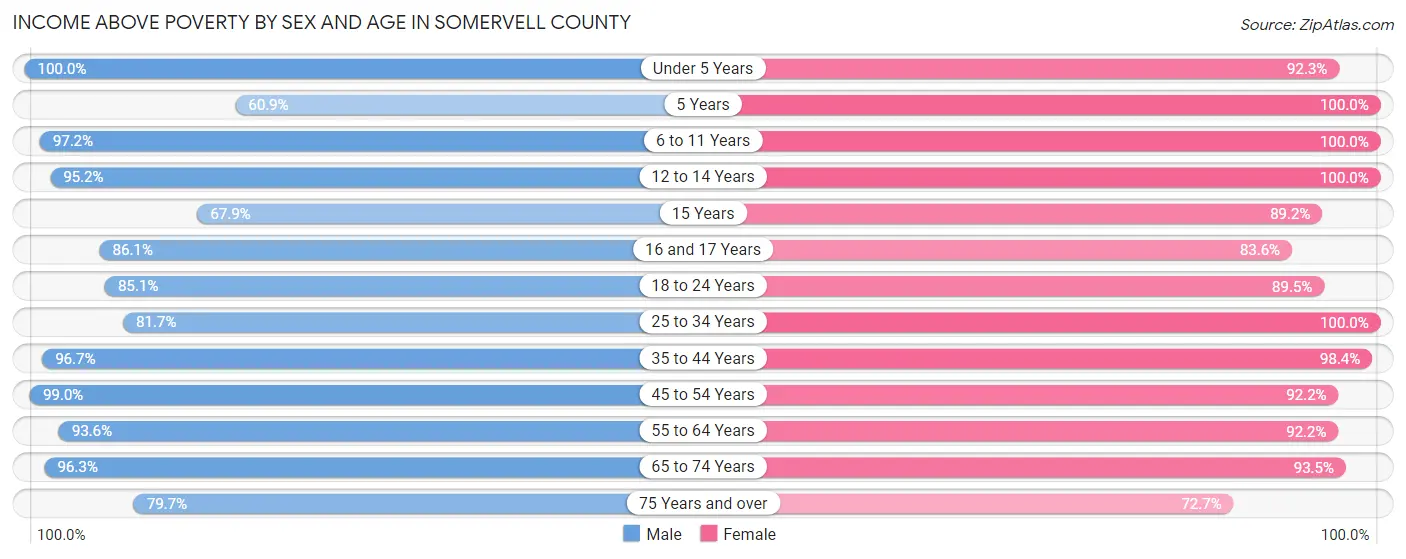
Income Above Poverty by Sex and Age in Somervell County
According to the poverty statistics in Somervell County, males aged under 5 years and females aged 5 years are the age groups that are most secure financially, with 100.0% of males and 100.0% of females in these age groups living above the poverty line.
| Age Bracket | Male | Female |
| Under 5 Years | 272 (100.0%) | 84 (92.3%) |
| 5 Years | 14 (60.9%) | 7 (100.0%) |
| 6 to 11 Years | 274 (97.2%) | 186 (100.0%) |
| 12 to 14 Years | 160 (95.2%) | 442 (100.0%) |
| 15 Years | 72 (67.9%) | 140 (89.2%) |
| 16 and 17 Years | 105 (86.1%) | 127 (83.6%) |
| 18 to 24 Years | 319 (85.1%) | 342 (89.5%) |
| 25 to 34 Years | 304 (81.7%) | 426 (100.0%) |
| 35 to 44 Years | 619 (96.7%) | 751 (98.4%) |
| 45 to 54 Years | 695 (99.0%) | 471 (92.2%) |
| 55 to 64 Years | 633 (93.6%) | 646 (92.1%) |
| 65 to 74 Years | 468 (96.3%) | 463 (93.5%) |
| 75 Years and over | 228 (79.7%) | 245 (72.7%) |
| Total | 4,163 (92.3%) | 4,330 (93.1%) |
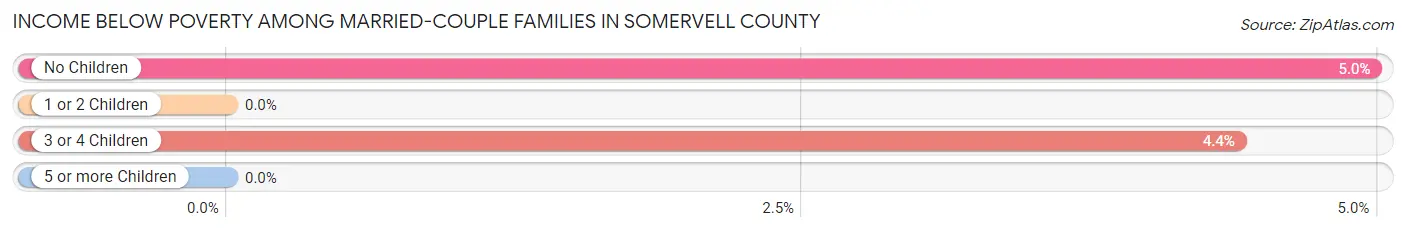
Income Below Poverty Among Married-Couple Families in Somervell County
The poverty statistics for married-couple families in Somervell County show that 3.5% or 75 of the total 2,159 families live below the poverty line. Families with no children have the highest poverty rate of 5.0%, comprising of 66 families. On the other hand, families with 1 or 2 children have the lowest poverty rate of 0.0%, which includes 0 families.
| Children | Above Poverty | Below Poverty |
| No Children | 1,258 (95.0%) | 66 (5.0%) |
| 1 or 2 Children | 630 (100.0%) | 0 (0.0%) |
| 3 or 4 Children | 196 (95.6%) | 9 (4.4%) |
| 5 or more Children | 0 (0.0%) | 0 (0.0%) |
| Total | 2,084 (96.5%) | 75 (3.5%) |
Income Below Poverty Among Single-Parent Households in Somervell County
According to the poverty data in Somervell County, 6.7% or 22 single-father households and 7.4% or 12 single-mother households are living below the poverty line. Among single-father households, those with no children have the highest poverty rate, with 10 households (23.8%) experiencing poverty. Likewise, among single-mother households, those with 1 or 2 children have the highest poverty rate, with 12 households (10.3%) falling below the poverty line.
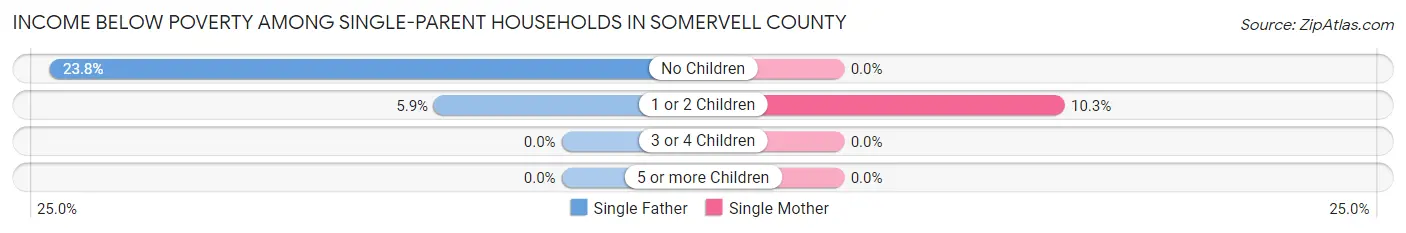
| Children | Single Father | Single Mother |
| No Children | 10 (23.8%) | 0 (0.0%) |
| 1 or 2 Children | 12 (5.9%) | 12 (10.3%) |
| 3 or 4 Children | 0 (0.0%) | 0 (0.0%) |
| 5 or more Children | 0 (0.0%) | 0 (0.0%) |
| Total | 22 (6.7%) | 12 (7.4%) |
Income Below Poverty Among Married-Couple vs Single-Parent Households in Somervell County
The poverty data for Somervell County shows that 75 of the married-couple family households (3.5%) and 34 of the single-parent households (7.0%) are living below the poverty level. Within the married-couple family households, those with no children have the highest poverty rate, with 66 households (5.0%) falling below the poverty line. Among the single-parent households, those with no children have the highest poverty rate, with 10 household (12.8%) living below poverty.
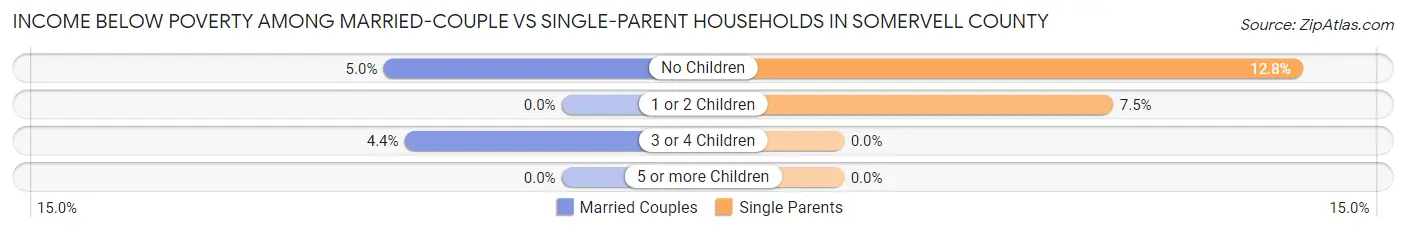
| Children | Married-Couple Families | Single-Parent Households |
| No Children | 66 (5.0%) | 10 (12.8%) |
| 1 or 2 Children | 0 (0.0%) | 24 (7.5%) |
| 3 or 4 Children | 9 (4.4%) | 0 (0.0%) |
| 5 or more Children | 0 (0.0%) | 0 (0.0%) |
| Total | 75 (3.5%) | 34 (7.0%) |
Race in Somervell County
The most populous races in Somervell County are White / Caucasian (7,622 | 81.6%), Hispanic or Latino (1,682 | 18.0%), and Two or more Races (1,009 | 10.8%).
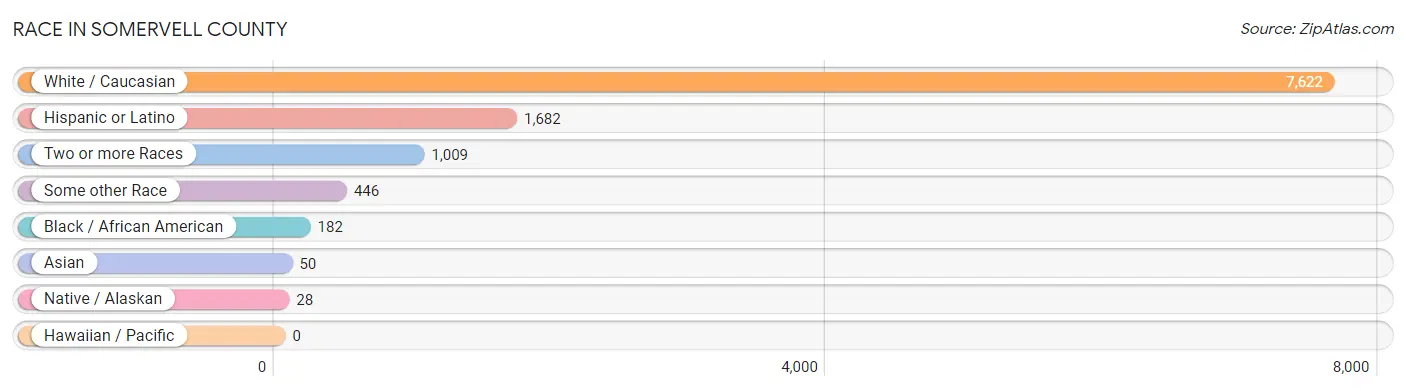
| Race | # Population | % Population |
| Asian | 50 | 0.5% |
| Black / African American | 182 | 1.9% |
| Hawaiian / Pacific | 0 | 0.0% |
| Hispanic or Latino | 1,682 | 18.0% |
| Native / Alaskan | 28 | 0.3% |
| White / Caucasian | 7,622 | 81.6% |
| Two or more Races | 1,009 | 10.8% |
| Some other Race | 446 | 4.8% |
| Total | 9,337 | 100.0% |
Ancestry in Somervell County
The most populous ancestries reported in Somervell County are Mexican (1,594 | 17.1%), American (1,540 | 16.5%), English (1,340 | 14.3%), German (846 | 9.1%), and Irish (600 | 6.4%), together accounting for 63.4% of all Somervell County residents.
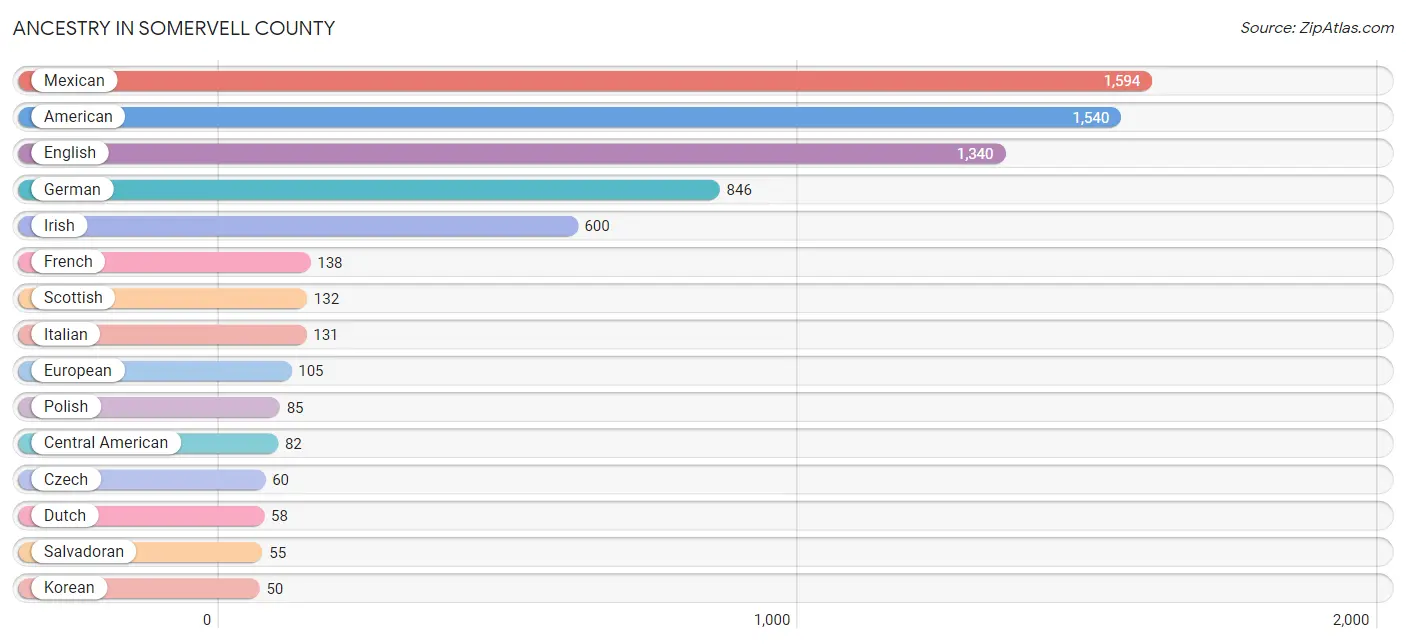
| Ancestry | # Population | % Population |
| African | 48 | 0.5% |
| American | 1,540 | 16.5% |
| British | 32 | 0.3% |
| Central American | 82 | 0.9% |
| Cherokee | 41 | 0.4% |
| Choctaw | 21 | 0.2% |
| Czech | 60 | 0.6% |
| Czechoslovakian | 35 | 0.4% |
| Danish | 5 | 0.1% |
| Dutch | 58 | 0.6% |
| English | 1,340 | 14.3% |
| European | 105 | 1.1% |
| French | 138 | 1.5% |
| French Canadian | 26 | 0.3% |
| German | 846 | 9.1% |
| Greek | 12 | 0.1% |
| Guatemalan | 16 | 0.2% |
| Irish | 600 | 6.4% |
| Italian | 131 | 1.4% |
| Korean | 50 | 0.5% |
| Mexican | 1,594 | 17.1% |
| Norwegian | 43 | 0.5% |
| Panamanian | 11 | 0.1% |
| Polish | 85 | 0.9% |
| Puerto Rican | 6 | 0.1% |
| Russian | 21 | 0.2% |
| Salvadoran | 55 | 0.6% |
| Scandinavian | 22 | 0.2% |
| Scotch-Irish | 49 | 0.5% |
| Scottish | 132 | 1.4% |
| Serbian | 17 | 0.2% |
| Subsaharan African | 48 | 0.5% |
| Swedish | 22 | 0.2% |
| Swiss | 2 | 0.0% |
| Ukrainian | 17 | 0.2% |
| Welsh | 37 | 0.4% | View All 36 Rows |
Immigrants in Somervell County
The most numerous immigrant groups reported in Somervell County came from Central America (551 | 5.9%), Latin America (551 | 5.9%), Mexico (438 | 4.7%), Europe (126 | 1.3%), and El Salvador (97 | 1.0%), together accounting for 18.9% of all Somervell County residents.
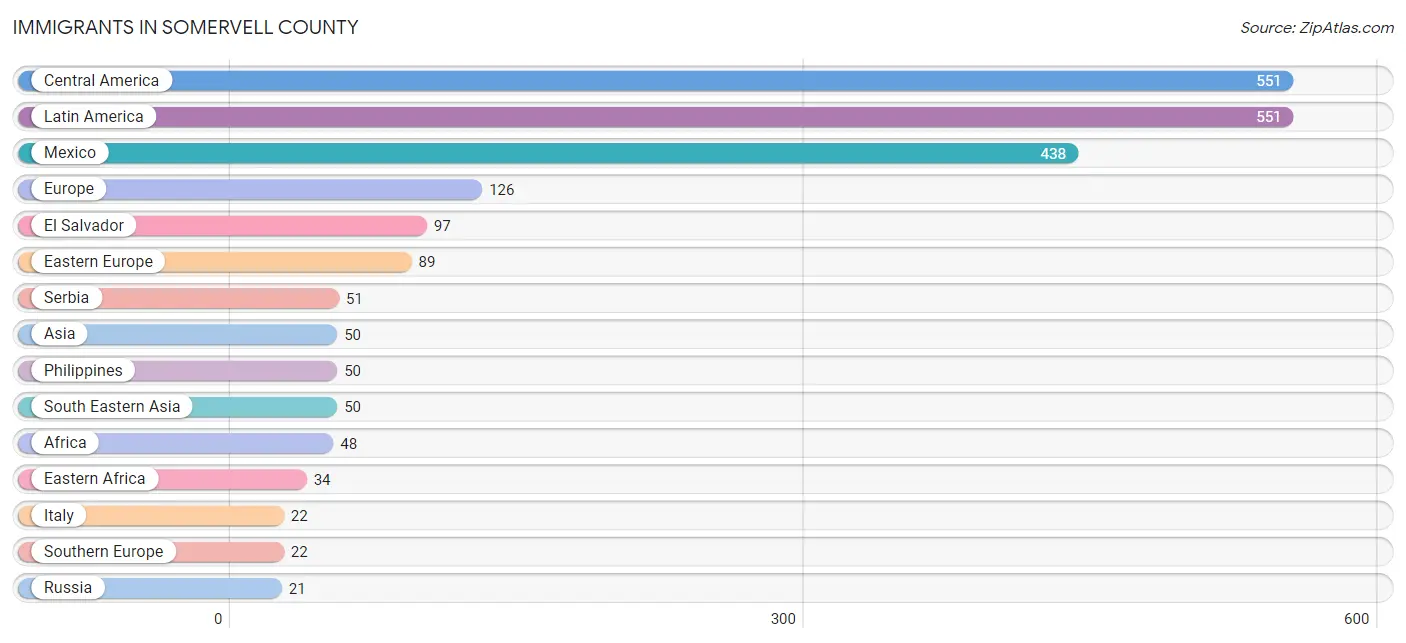
| Immigration Origin | # Population | % Population |
| Africa | 48 | 0.5% |
| Asia | 50 | 0.5% |
| Central America | 551 | 5.9% |
| Eastern Africa | 34 | 0.4% |
| Eastern Europe | 89 | 0.9% |
| El Salvador | 97 | 1.0% |
| England | 5 | 0.1% |
| Europe | 126 | 1.3% |
| France | 10 | 0.1% |
| Guatemala | 16 | 0.2% |
| Italy | 22 | 0.2% |
| Latin America | 551 | 5.9% |
| Mexico | 438 | 4.7% |
| Nigeria | 14 | 0.2% |
| Northern Europe | 5 | 0.1% |
| Philippines | 50 | 0.5% |
| Russia | 21 | 0.2% |
| Serbia | 51 | 0.5% |
| South Eastern Asia | 50 | 0.5% |
| Southern Europe | 22 | 0.2% |
| Ukraine | 17 | 0.2% |
| Western Africa | 14 | 0.2% |
| Western Europe | 10 | 0.1% | View All 23 Rows |
Sex and Age in Somervell County
Sex and Age in Somervell County
The most populous age groups in Somervell County are 50 to 54 Years (458 | 10.0%) for men and 10 to 14 Years (555 | 11.7%) for women.
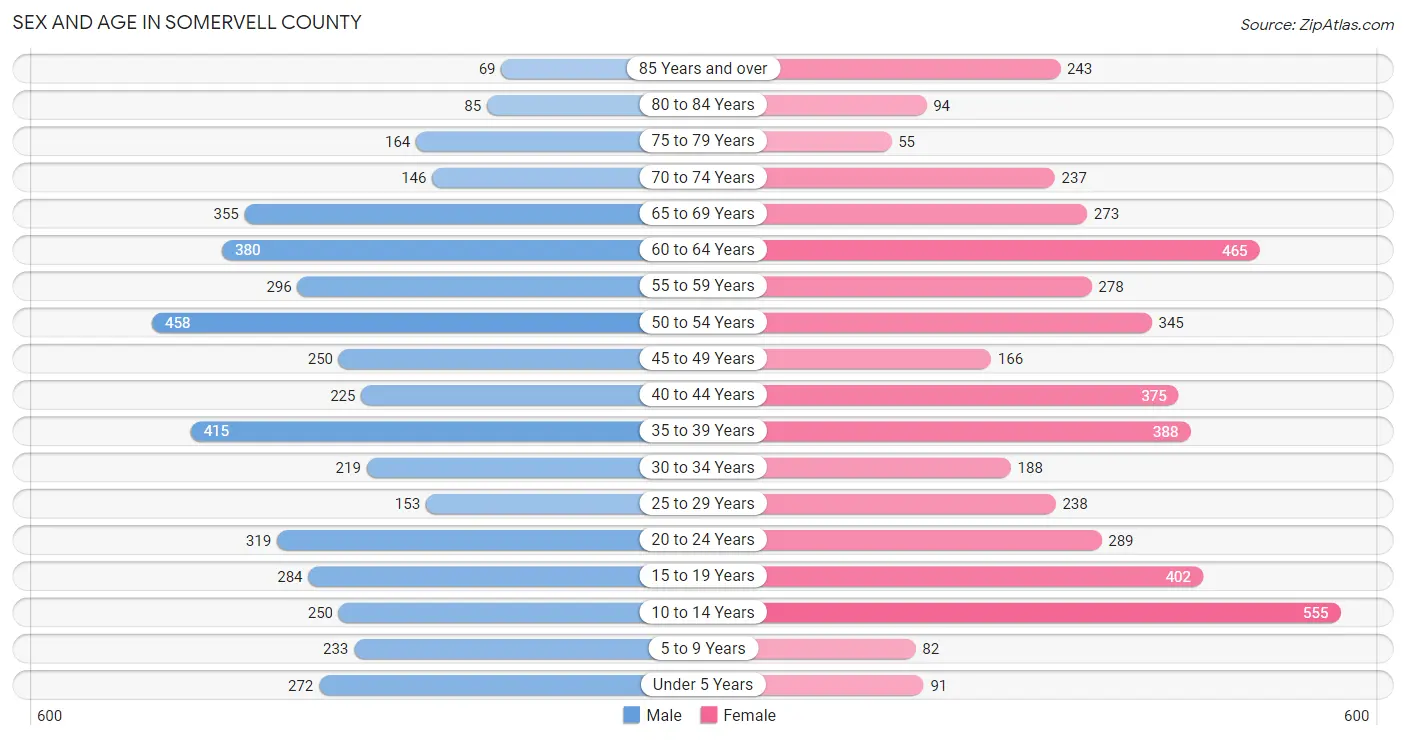
| Age Bracket | Male | Female |
| Under 5 Years | 272 (5.9%) | 91 (1.9%) |
| 5 to 9 Years | 233 (5.1%) | 82 (1.7%) |
| 10 to 14 Years | 250 (5.5%) | 555 (11.7%) |
| 15 to 19 Years | 284 (6.2%) | 402 (8.4%) |
| 20 to 24 Years | 319 (7.0%) | 289 (6.1%) |
| 25 to 29 Years | 153 (3.4%) | 238 (5.0%) |
| 30 to 34 Years | 219 (4.8%) | 188 (4.0%) |
| 35 to 39 Years | 415 (9.1%) | 388 (8.1%) |
| 40 to 44 Years | 225 (4.9%) | 375 (7.9%) |
| 45 to 49 Years | 250 (5.5%) | 166 (3.5%) |
| 50 to 54 Years | 458 (10.0%) | 345 (7.2%) |
| 55 to 59 Years | 296 (6.5%) | 278 (5.8%) |
| 60 to 64 Years | 380 (8.3%) | 465 (9.8%) |
| 65 to 69 Years | 355 (7.8%) | 273 (5.7%) |
| 70 to 74 Years | 146 (3.2%) | 237 (5.0%) |
| 75 to 79 Years | 164 (3.6%) | 55 (1.1%) |
| 80 to 84 Years | 85 (1.9%) | 94 (2.0%) |
| 85 Years and over | 69 (1.5%) | 243 (5.1%) |
| Total | 4,573 (100.0%) | 4,764 (100.0%) |
Families and Households in Somervell County
Median Family Size in Somervell County
The median family size in Somervell County is 2.99 persons per family, with married-couple families (2,159 | 81.6%) accounting for the largest median family size of 3.07 persons per family. On the other hand, single male/father families (327 | 12.3%) represent the smallest median family size with 2.58 persons per family.
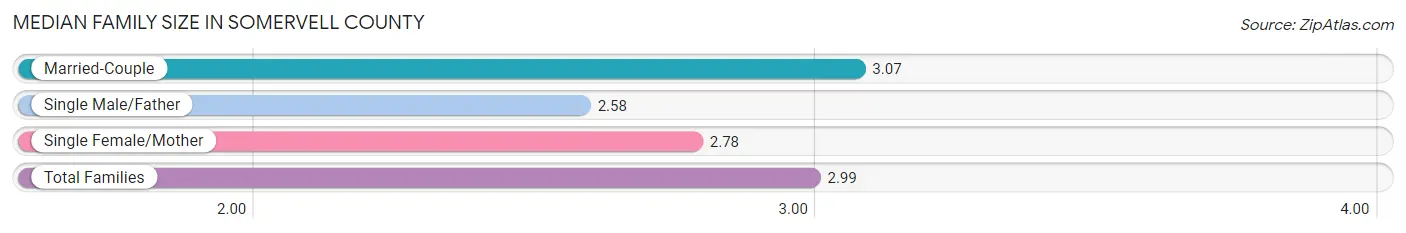
| Family Type | # Families | Family Size |
| Married-Couple | 2,159 (81.6%) | 3.07 |
| Single Male/Father | 327 (12.3%) | 2.58 |
| Single Female/Mother | 161 (6.1%) | 2.78 |
| Total Families | 2,647 (100.0%) | 2.99 |
Median Household Size in Somervell County
The median household size in Somervell County is 2.67 persons per household, with single male/father households (327 | 9.8%) accounting for the largest median household size of 3.24 persons per household. non-family households (698 | 20.9%) represent the smallest median household size with 1.07 persons per household.
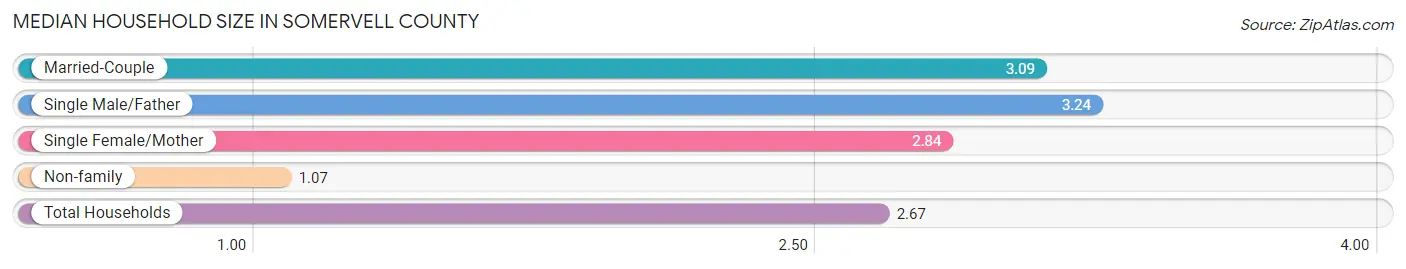
| Household Type | # Households | Household Size |
| Married-Couple | 2,159 (64.5%) | 3.09 |
| Single Male/Father | 327 (9.8%) | 3.24 |
| Single Female/Mother | 161 (4.8%) | 2.84 |
| Non-family | 698 (20.9%) | 1.07 |
| Total Households | 3,345 (100.0%) | 2.67 |
Household Size by Marriage Status in Somervell County
Out of a total of 3,345 households in Somervell County, 2,647 (79.1%) are family households, while 698 (20.9%) are nonfamily households. The most numerous type of family households are 2-person households, comprising 1,295, and the most common type of nonfamily households are 1-person households, comprising 638.
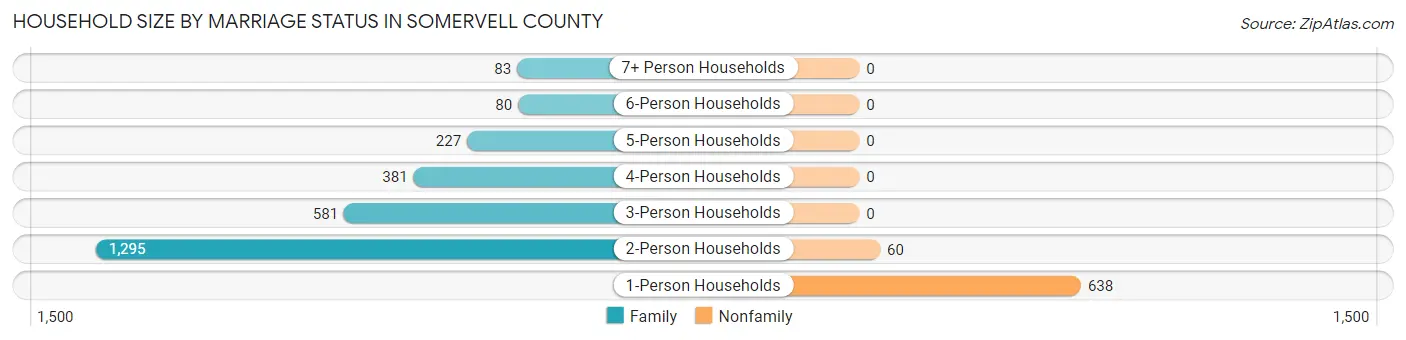
| Household Size | Family Households | Nonfamily Households |
| 1-Person Households | - | 638 (19.1%) |
| 2-Person Households | 1,295 (38.7%) | 60 (1.8%) |
| 3-Person Households | 581 (17.4%) | 0 (0.0%) |
| 4-Person Households | 381 (11.4%) | 0 (0.0%) |
| 5-Person Households | 227 (6.8%) | 0 (0.0%) |
| 6-Person Households | 80 (2.4%) | 0 (0.0%) |
| 7+ Person Households | 83 (2.5%) | 0 (0.0%) |
| Total | 2,647 (79.1%) | 698 (20.9%) |
Female Fertility in Somervell County
Fertility by Age in Somervell County
Average fertility rate in Somervell County is 15.0 births per 1,000 women. Women in the age bracket of 35 to 50 years have the highest fertility rate with 20.0 births per 1,000 women. Women in the age bracket of 35 to 50 years acount for 61.3% of all women with births.
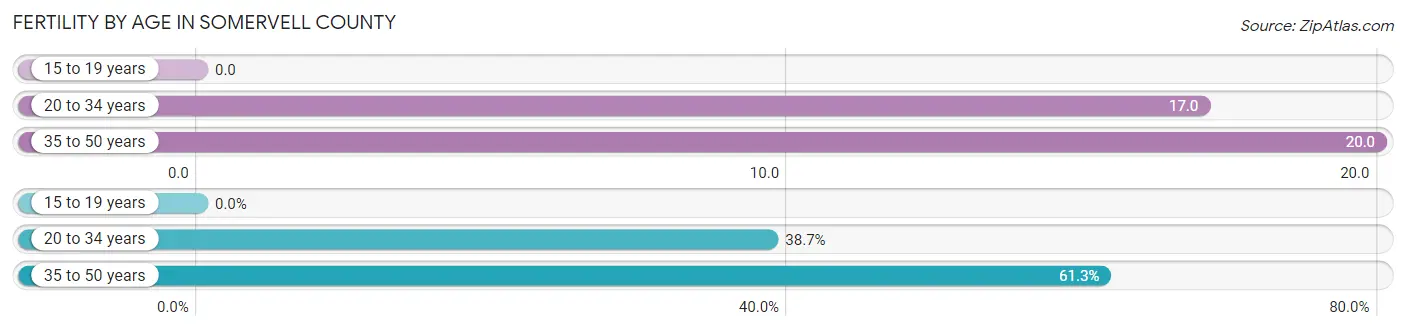
| Age Bracket | Women with Births | Births / 1,000 Women |
| 15 to 19 years | 0 (0.0%) | 0.0 |
| 20 to 34 years | 12 (38.7%) | 17.0 |
| 35 to 50 years | 19 (61.3%) | 20.0 |
| Total | 31 (100.0%) | 15.0 |
Fertility by Age by Marriage Status in Somervell County
61.3% of women with births (31) in Somervell County are married. The highest percentage of unmarried women with births falls into 20 to 34 years age bracket with 100.0% of them unmarried at the time of birth, while the lowest percentage of unmarried women with births belong to 35 to 50 years age bracket with 0.0% of them unmarried.
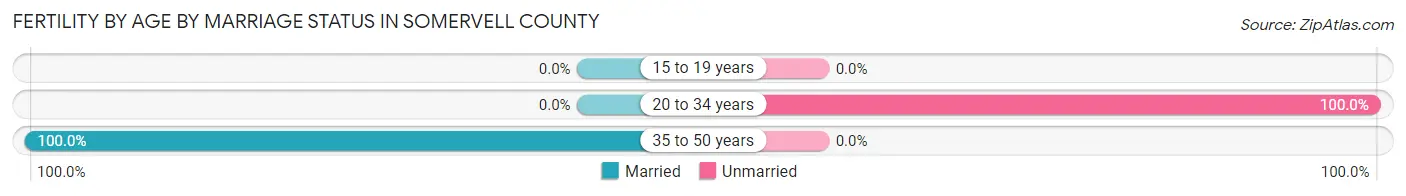
| Age Bracket | Married | Unmarried |
| 15 to 19 years | 0 (0.0%) | 0 (0.0%) |
| 20 to 34 years | 0 (0.0%) | 12 (100.0%) |
| 35 to 50 years | 19 (100.0%) | 0 (0.0%) |
| Total | 19 (61.3%) | 12 (38.7%) |
Fertility by Education in Somervell County
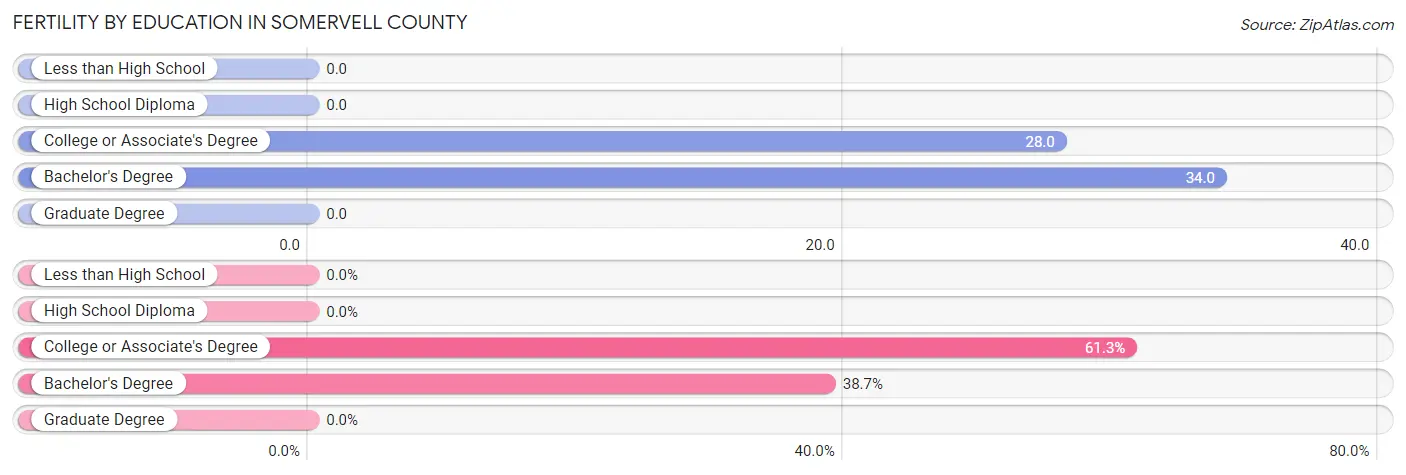
| Educational Attainment | Women with Births | Births / 1,000 Women |
| Less than High School | 0 (0.0%) | 0.0 |
| High School Diploma | 0 (0.0%) | 0.0 |
| College or Associate's Degree | 19 (61.3%) | 28.0 |
| Bachelor's Degree | 12 (38.7%) | 34.0 |
| Graduate Degree | 0 (0.0%) | 0.0 |
| Total | 31 (100.0%) | 15.0 |
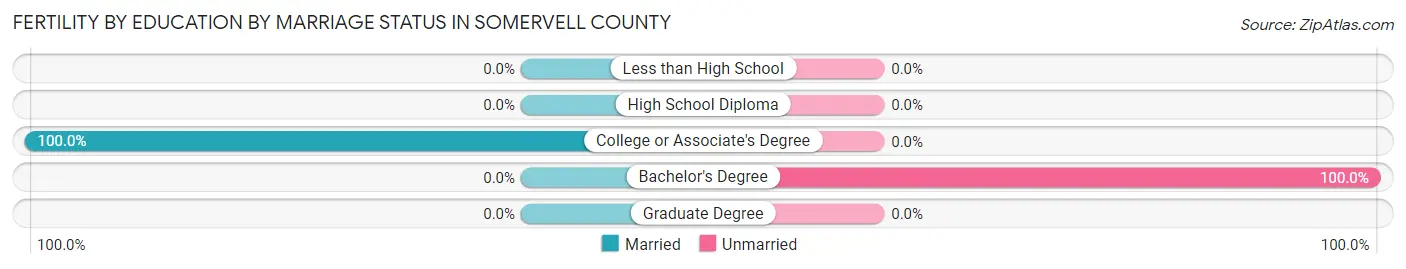
Fertility by Education by Marriage Status in Somervell County
38.7% of women with births in Somervell County are unmarried. Women with the educational attainment of college or associate's degree are most likely to be married with 100.0% of them married at childbirth, while women with the educational attainment of bachelor's degree are least likely to be married with 100.0% of them unmarried at childbirth.
| Educational Attainment | Married | Unmarried |
| Less than High School | 0 (0.0%) | 0 (0.0%) |
| High School Diploma | 0 (0.0%) | 0 (0.0%) |
| College or Associate's Degree | 19 (100.0%) | 0 (0.0%) |
| Bachelor's Degree | 0 (0.0%) | 12 (100.0%) |
| Graduate Degree | 0 (0.0%) | 0 (0.0%) |
| Total | 19 (61.3%) | 12 (38.7%) |
Employment Characteristics in Somervell County
Employment by Class of Employer in Somervell County
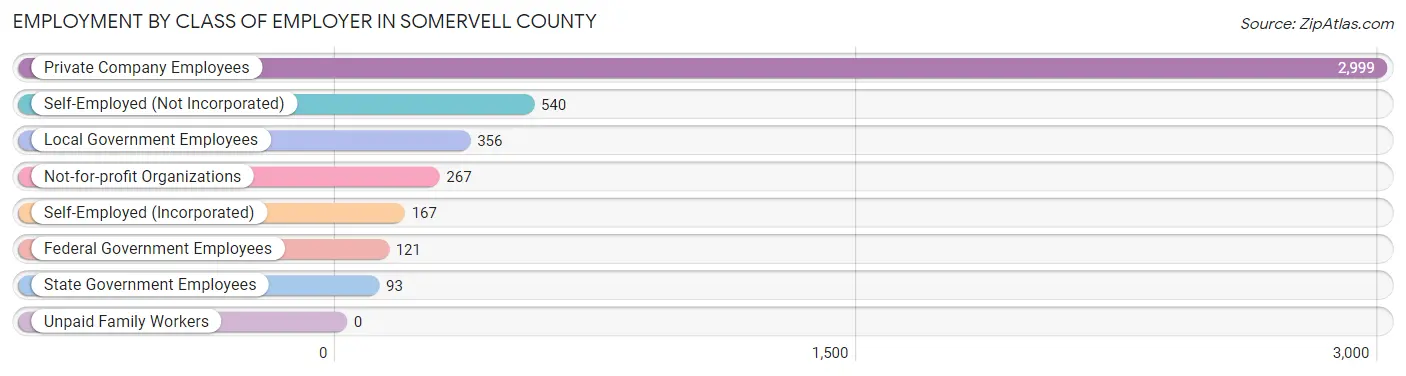
Among the 4,543 employed individuals in Somervell County, private company employees (2,999 | 66.0%), self-employed (not incorporated) (540 | 11.9%), and local government employees (356 | 7.8%) make up the most common classes of employment.
| Employer Class | # Employees | % Employees |
| Private Company Employees | 2,999 | 66.0% |
| Self-Employed (Incorporated) | 167 | 3.7% |
| Self-Employed (Not Incorporated) | 540 | 11.9% |
| Not-for-profit Organizations | 267 | 5.9% |
| Local Government Employees | 356 | 7.8% |
| State Government Employees | 93 | 2.1% |
| Federal Government Employees | 121 | 2.7% |
| Unpaid Family Workers | 0 | 0.0% |
| Total | 4,543 | 100.0% |
Employment Status by Age in Somervell County
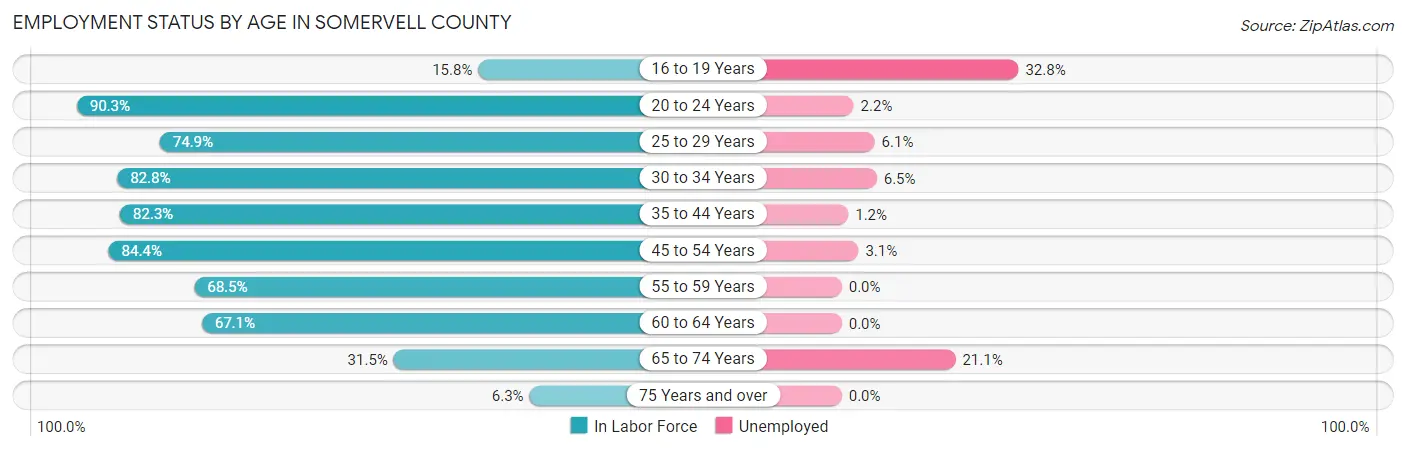
According to the labor force statistics for Somervell County, out of the total population over 16 years of age (7,591), 62.6% or 4,752 individuals are in the labor force, with 3.9% or 185 of them unemployed. The age group with the highest labor force participation rate is 20 to 24 years, with 90.3% or 549 individuals in the labor force. Within the labor force, the 16 to 19 years age range has the highest percentage of unemployed individuals, with 32.8% or 22 of them being unemployed.
| Age Bracket | In Labor Force | Unemployed |
| 16 to 19 Years | 67 (15.8%) | 22 (32.8%) |
| 20 to 24 Years | 549 (90.3%) | 12 (2.2%) |
| 25 to 29 Years | 293 (74.9%) | 18 (6.1%) |
| 30 to 34 Years | 337 (82.8%) | 22 (6.5%) |
| 35 to 44 Years | 1,155 (82.3%) | 14 (1.2%) |
| 45 to 54 Years | 1,029 (84.4%) | 32 (3.1%) |
| 55 to 59 Years | 393 (68.5%) | 0 (0.0%) |
| 60 to 64 Years | 567 (67.1%) | 0 (0.0%) |
| 65 to 74 Years | 318 (31.5%) | 67 (21.1%) |
| 75 Years and over | 45 (6.3%) | 0 (0.0%) |
| Total | 4,752 (62.6%) | 185 (3.9%) |
Employment Status by Educational Attainment in Somervell County
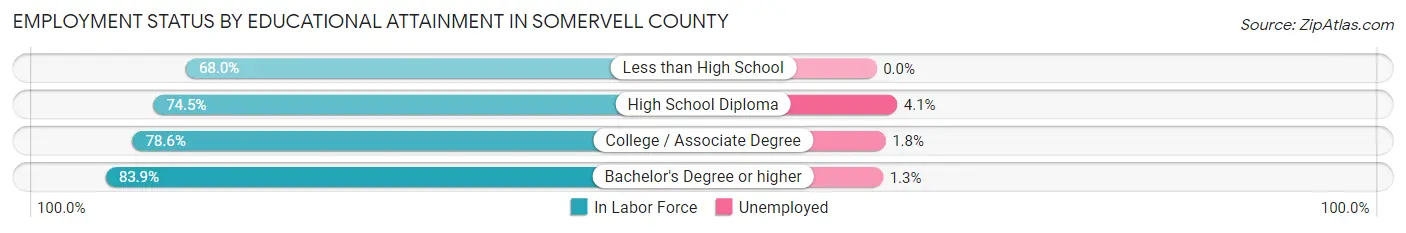
According to labor force statistics for Somervell County, 78.0% of individuals (3,774) out of the total population between 25 and 64 years of age (4,839) are in the labor force, with 2.3% or 87 of them being unemployed. The group with the highest labor force participation rate are those with the educational attainment of bachelor's degree or higher, with 83.9% or 1,097 individuals in the labor force. Within the labor force, individuals with high school diploma education have the highest percentage of unemployment, with 4.1% or 50 of them being unemployed.
| Educational Attainment | In Labor Force | Unemployed |
| Less than High School | 202 (68.0%) | 0 (0.0%) |
| High School Diploma | 1,226 (74.5%) | 67 (4.1%) |
| College / Associate Degree | 1,250 (78.6%) | 29 (1.8%) |
| Bachelor's Degree or higher | 1,097 (83.9%) | 17 (1.3%) |
| Total | 3,774 (78.0%) | 111 (2.3%) |
Employment Occupations by Sex in Somervell County
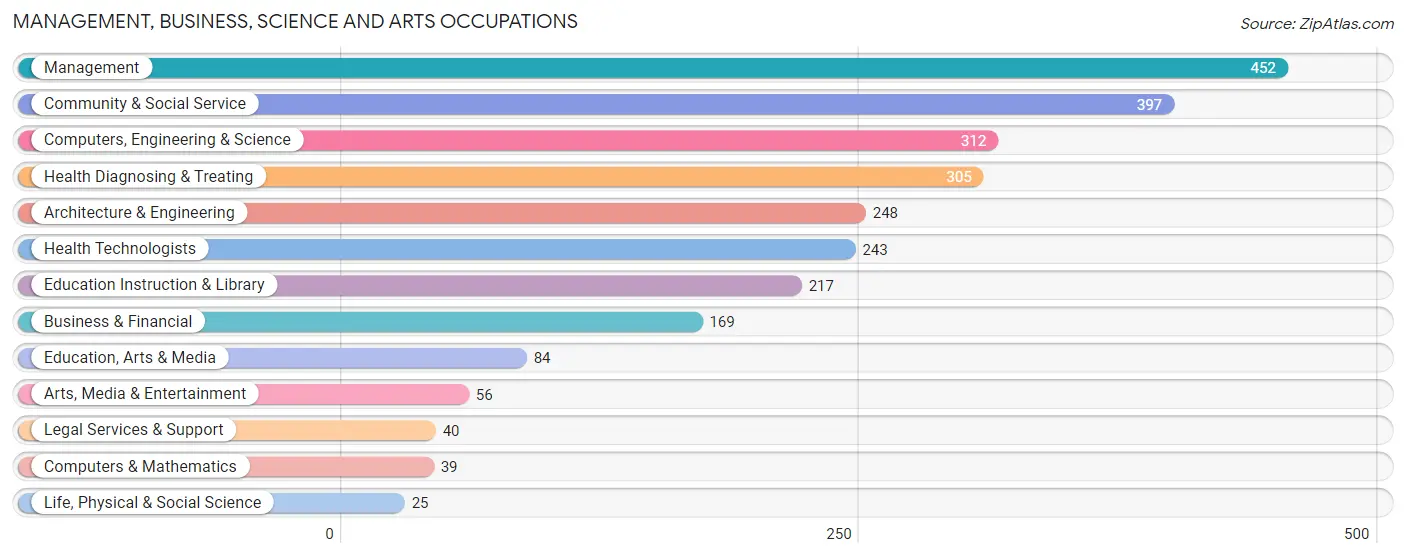
Management, Business, Science and Arts Occupations
The most common Management, Business, Science and Arts occupations in Somervell County are Management (452 | 9.9%), Community & Social Service (397 | 8.7%), Computers, Engineering & Science (312 | 6.8%), Health Diagnosing & Treating (305 | 6.7%), and Architecture & Engineering (248 | 5.4%).
Management, Business, Science and Arts Occupations by Sex
Within the Management, Business, Science and Arts occupations in Somervell County, the most male-oriented occupations are Computers, Engineering & Science (100.0%), Computers & Mathematics (100.0%), and Architecture & Engineering (100.0%), while the most female-oriented occupations are Legal Services & Support (100.0%), Health Diagnosing & Treating (90.2%), and Health Technologists (87.6%).
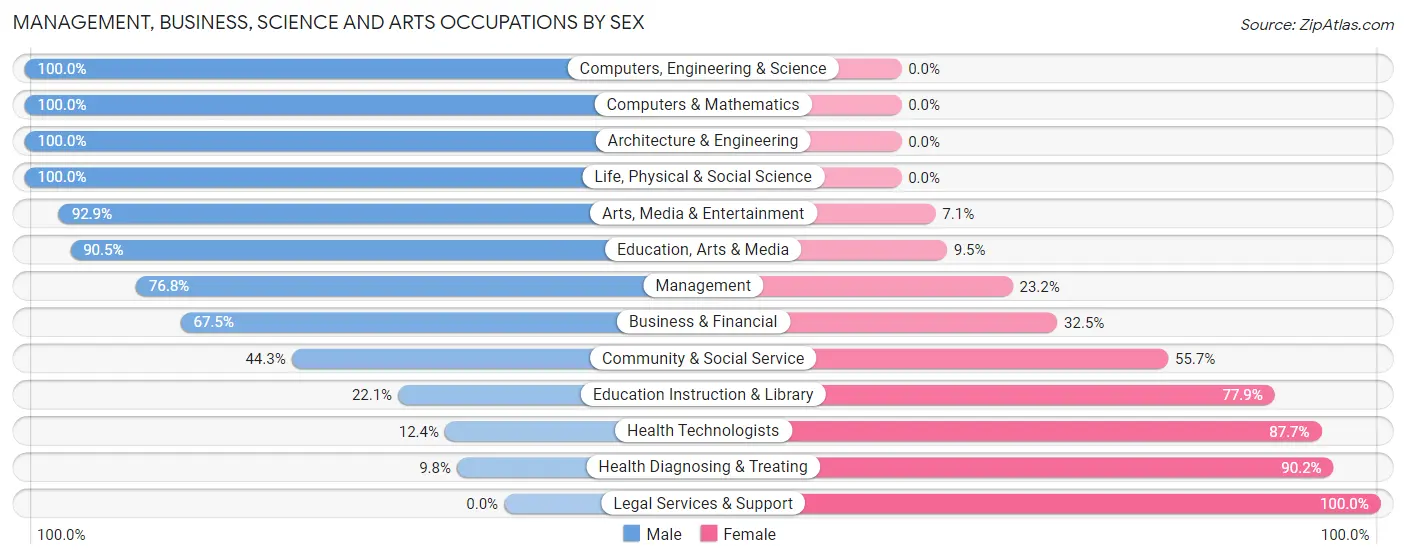
| Occupation | Male | Female |
| Management | 347 (76.8%) | 105 (23.2%) |
| Business & Financial | 114 (67.5%) | 55 (32.5%) |
| Computers, Engineering & Science | 312 (100.0%) | 0 (0.0%) |
| Computers & Mathematics | 39 (100.0%) | 0 (0.0%) |
| Architecture & Engineering | 248 (100.0%) | 0 (0.0%) |
| Life, Physical & Social Science | 25 (100.0%) | 0 (0.0%) |
| Community & Social Service | 176 (44.3%) | 221 (55.7%) |
| Education, Arts & Media | 76 (90.5%) | 8 (9.5%) |
| Legal Services & Support | 0 (0.0%) | 40 (100.0%) |
| Education Instruction & Library | 48 (22.1%) | 169 (77.9%) |
| Arts, Media & Entertainment | 52 (92.9%) | 4 (7.1%) |
| Health Diagnosing & Treating | 30 (9.8%) | 275 (90.2%) |
| Health Technologists | 30 (12.3%) | 213 (87.6%) |
| Total (Category) | 979 (59.9%) | 656 (40.1%) |
| Total (Overall) | 2,632 (57.7%) | 1,933 (42.3%) |
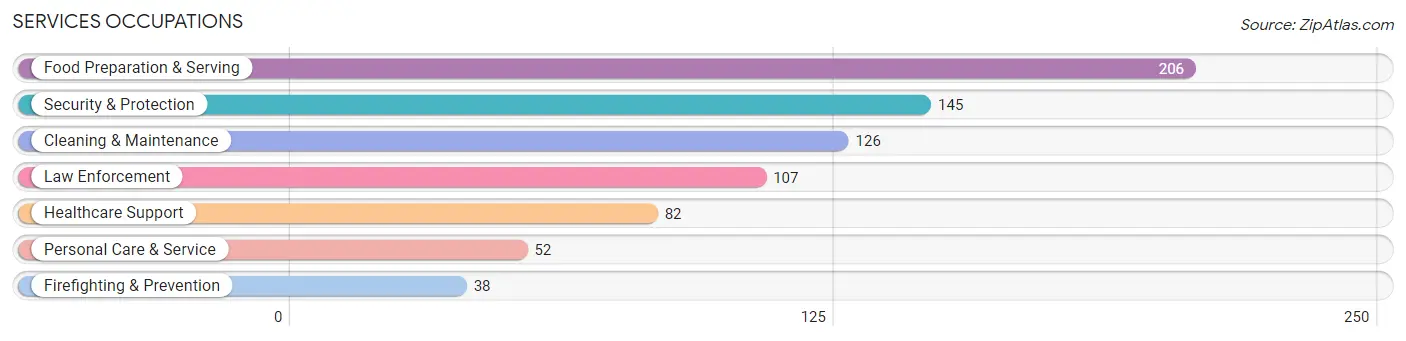
Services Occupations
The most common Services occupations in Somervell County are Food Preparation & Serving (206 | 4.5%), Security & Protection (145 | 3.2%), Cleaning & Maintenance (126 | 2.8%), Law Enforcement (107 | 2.3%), and Healthcare Support (82 | 1.8%).
Services Occupations by Sex
Within the Services occupations in Somervell County, the most male-oriented occupations are Security & Protection (100.0%), Firefighting & Prevention (100.0%), and Law Enforcement (100.0%), while the most female-oriented occupations are Healthcare Support (100.0%), Personal Care & Service (100.0%), and Food Preparation & Serving (67.5%).
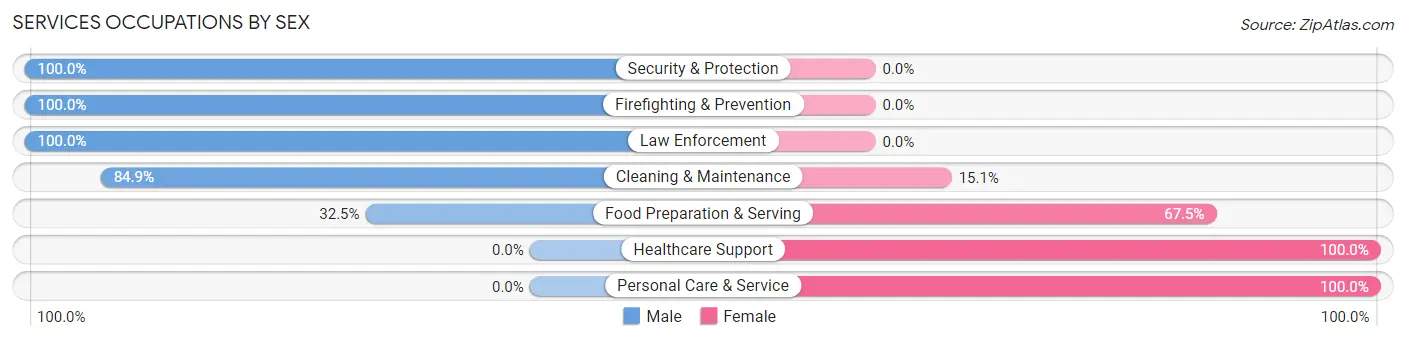
| Occupation | Male | Female |
| Healthcare Support | 0 (0.0%) | 82 (100.0%) |
| Security & Protection | 145 (100.0%) | 0 (0.0%) |
| Firefighting & Prevention | 38 (100.0%) | 0 (0.0%) |
| Law Enforcement | 107 (100.0%) | 0 (0.0%) |
| Food Preparation & Serving | 67 (32.5%) | 139 (67.5%) |
| Cleaning & Maintenance | 107 (84.9%) | 19 (15.1%) |
| Personal Care & Service | 0 (0.0%) | 52 (100.0%) |
| Total (Category) | 319 (52.2%) | 292 (47.8%) |
| Total (Overall) | 2,632 (57.7%) | 1,933 (42.3%) |
Sales and Office Occupations
The most common Sales and Office occupations in Somervell County are Office & Administration (627 | 13.7%), and Sales & Related (372 | 8.2%).
Sales and Office Occupations by Sex
| Occupation | Male | Female |
| Sales & Related | 236 (63.4%) | 136 (36.6%) |
| Office & Administration | 52 (8.3%) | 575 (91.7%) |
| Total (Category) | 288 (28.8%) | 711 (71.2%) |
| Total (Overall) | 2,632 (57.7%) | 1,933 (42.3%) |
Natural Resources, Construction and Maintenance Occupations
The most common Natural Resources, Construction and Maintenance occupations in Somervell County are Construction & Extraction (494 | 10.8%), Installation, Maintenance & Repair (139 | 3.0%), and Farming, Fishing & Forestry (66 | 1.5%).
Natural Resources, Construction and Maintenance Occupations by Sex
| Occupation | Male | Female |
| Farming, Fishing & Forestry | 66 (100.0%) | 0 (0.0%) |
| Construction & Extraction | 458 (92.7%) | 36 (7.3%) |
| Installation, Maintenance & Repair | 98 (70.5%) | 41 (29.5%) |
| Total (Category) | 622 (89.0%) | 77 (11.0%) |
| Total (Overall) | 2,632 (57.7%) | 1,933 (42.3%) |
Production, Transportation and Moving Occupations
The most common Production, Transportation and Moving occupations in Somervell County are Transportation (306 | 6.7%), Production (226 | 5.0%), and Material Moving (89 | 1.9%).
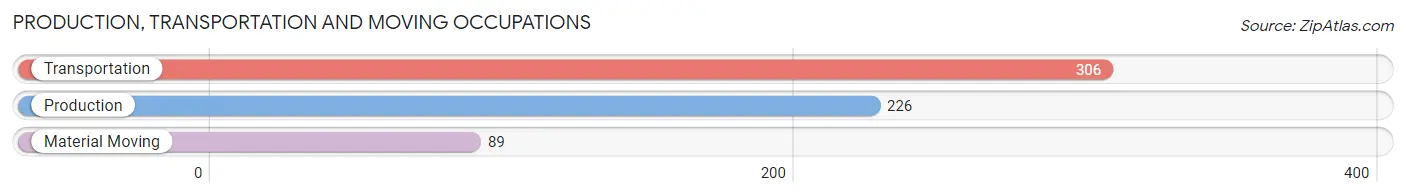
Production, Transportation and Moving Occupations by Sex
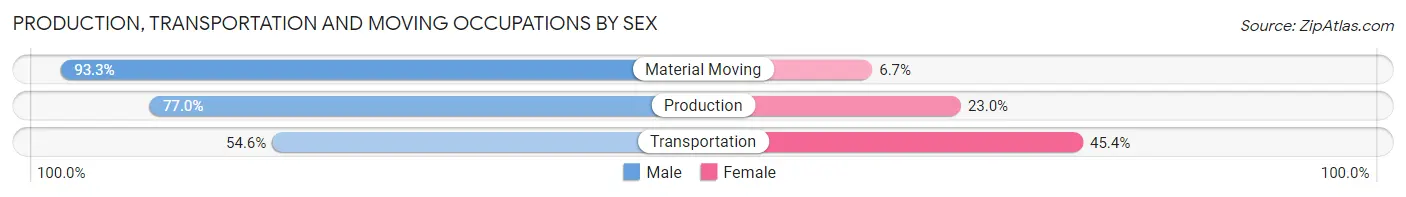
| Occupation | Male | Female |
| Production | 174 (77.0%) | 52 (23.0%) |
| Transportation | 167 (54.6%) | 139 (45.4%) |
| Material Moving | 83 (93.3%) | 6 (6.7%) |
| Total (Category) | 424 (68.3%) | 197 (31.7%) |
| Total (Overall) | 2,632 (57.7%) | 1,933 (42.3%) |
Employment Industries by Sex in Somervell County
Employment Industries in Somervell County
The major employment industries in Somervell County include Construction (565 | 12.4%), Health Care & Social Assistance (510 | 11.2%), Manufacturing (439 | 9.6%), Educational Services (380 | 8.3%), and Finance & Insurance (374 | 8.2%).
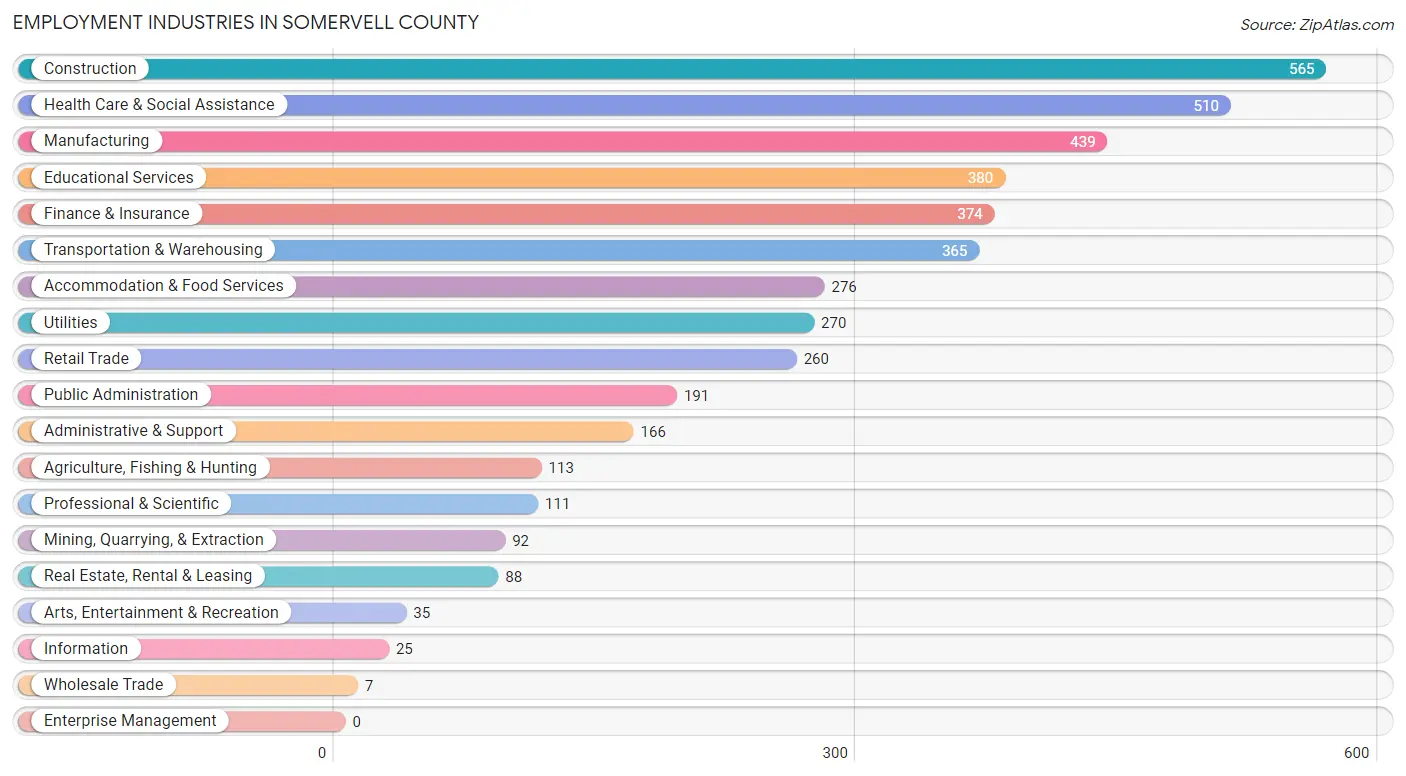
Employment Industries by Sex in Somervell County
The Somervell County industries that see more men than women are Wholesale Trade (100.0%), Information (100.0%), and Public Administration (94.8%), whereas the industries that tend to have a higher number of women are Finance & Insurance (94.7%), Health Care & Social Assistance (90.0%), and Educational Services (73.7%).
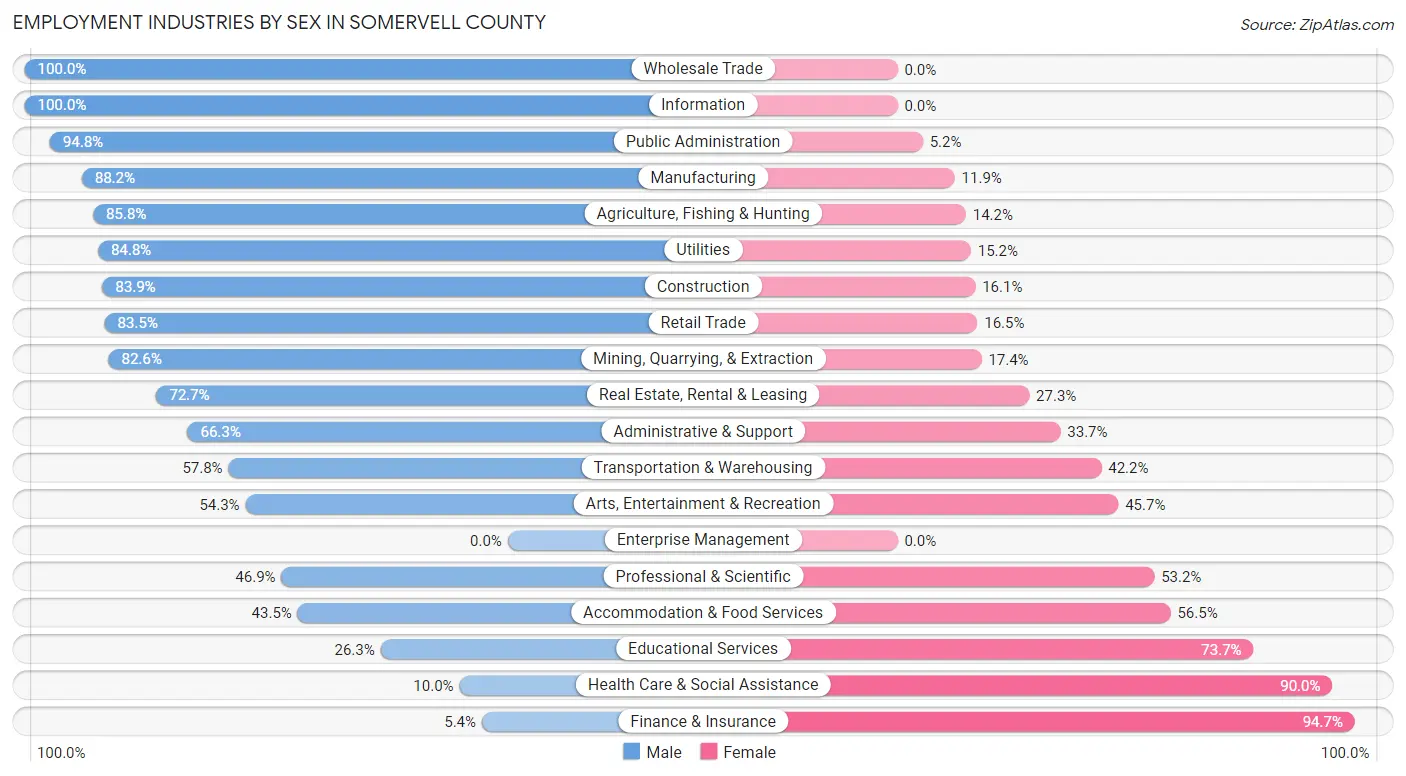
| Industry | Male | Female |
| Agriculture, Fishing & Hunting | 97 (85.8%) | 16 (14.2%) |
| Mining, Quarrying, & Extraction | 76 (82.6%) | 16 (17.4%) |
| Construction | 474 (83.9%) | 91 (16.1%) |
| Manufacturing | 387 (88.1%) | 52 (11.8%) |
| Wholesale Trade | 7 (100.0%) | 0 (0.0%) |
| Retail Trade | 217 (83.5%) | 43 (16.5%) |
| Transportation & Warehousing | 211 (57.8%) | 154 (42.2%) |
| Utilities | 229 (84.8%) | 41 (15.2%) |
| Information | 25 (100.0%) | 0 (0.0%) |
| Finance & Insurance | 20 (5.3%) | 354 (94.7%) |
| Real Estate, Rental & Leasing | 64 (72.7%) | 24 (27.3%) |
| Professional & Scientific | 52 (46.9%) | 59 (53.1%) |
| Enterprise Management | 0 (0.0%) | 0 (0.0%) |
| Administrative & Support | 110 (66.3%) | 56 (33.7%) |
| Educational Services | 100 (26.3%) | 280 (73.7%) |
| Health Care & Social Assistance | 51 (10.0%) | 459 (90.0%) |
| Arts, Entertainment & Recreation | 19 (54.3%) | 16 (45.7%) |
| Accommodation & Food Services | 120 (43.5%) | 156 (56.5%) |
| Public Administration | 181 (94.8%) | 10 (5.2%) |
| Total | 2,632 (57.7%) | 1,933 (42.3%) |
Education in Somervell County
School Enrollment in Somervell County
The most common levels of schooling among the 2,286 students in Somervell County are high school (695 | 30.4%), middle school (617 | 27.0%), and college / undergraduate (412 | 18.0%).
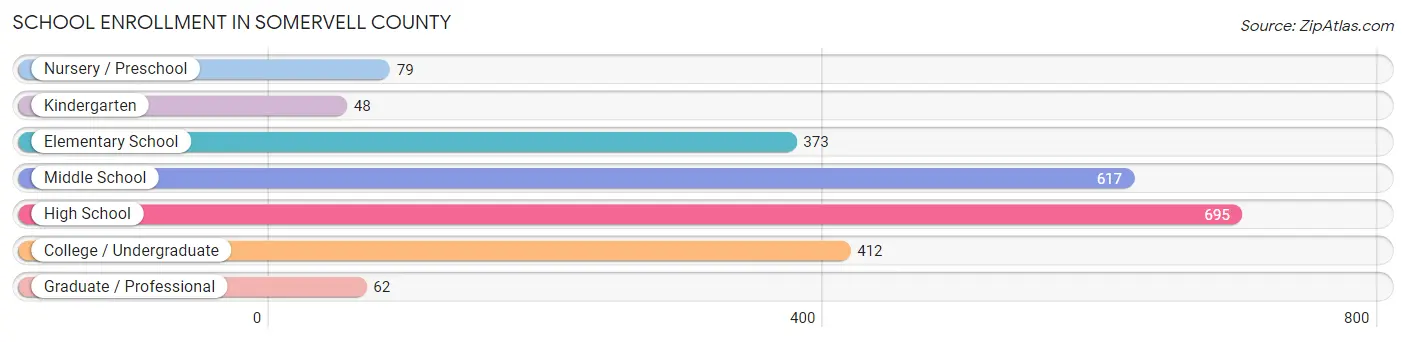
| School Level | # Students | % Students |
| Nursery / Preschool | 79 | 3.5% |
| Kindergarten | 48 | 2.1% |
| Elementary School | 373 | 16.3% |
| Middle School | 617 | 27.0% |
| High School | 695 | 30.4% |
| College / Undergraduate | 412 | 18.0% |
| Graduate / Professional | 62 | 2.7% |
| Total | 2,286 | 100.0% |
School Enrollment by Age by Funding Source in Somervell County
Out of a total of 2,286 students who are enrolled in schools in Somervell County, 519 (22.7%) attend a private institution, while the remaining 1,767 (77.3%) are enrolled in public schools. The age group of 3 to 4 year olds has the highest likelihood of being enrolled in private schools, with 60 (83.3% in the age bracket) enrolled. Conversely, the age group of 20 to 24 year olds has the lowest likelihood of being enrolled in a private school, with 92 (100.0% in the age bracket) attending a public institution.
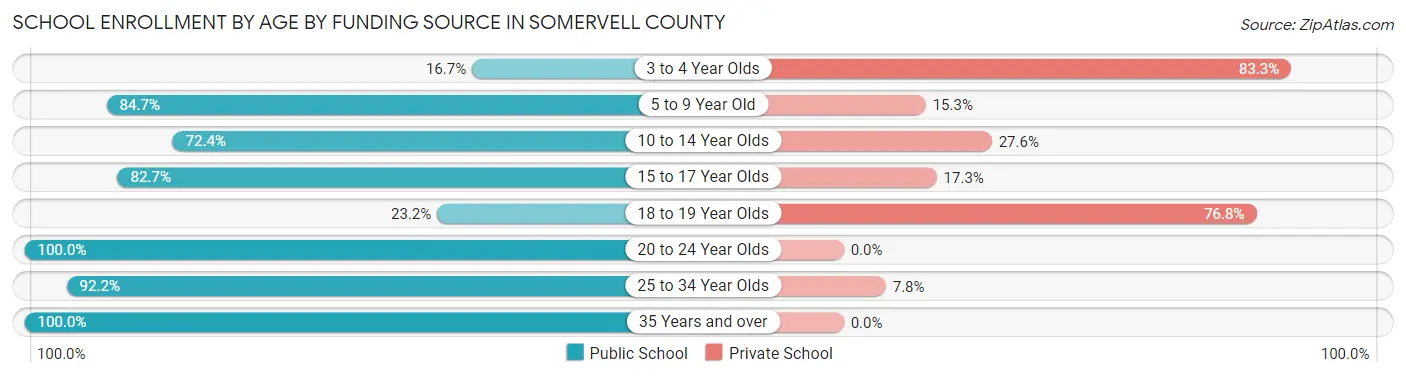
| Age Bracket | Public School | Private School |
| 3 to 4 Year Olds | 12 (16.7%) | 60 (83.3%) |
| 5 to 9 Year Old | 266 (84.7%) | 48 (15.3%) |
| 10 to 14 Year Olds | 583 (72.4%) | 222 (27.6%) |
| 15 to 17 Year Olds | 444 (82.7%) | 93 (17.3%) |
| 18 to 19 Year Olds | 22 (23.2%) | 73 (76.8%) |
| 20 to 24 Year Olds | 92 (100.0%) | 0 (0.0%) |
| 25 to 34 Year Olds | 282 (92.2%) | 24 (7.8%) |
| 35 Years and over | 65 (100.0%) | 0 (0.0%) |
| Total | 1,767 (77.3%) | 519 (22.7%) |
Educational Attainment by Field of Study in Somervell County
Business (331 | 17.5%), science & technology (282 | 14.9%), arts & humanities (264 | 13.9%), education (185 | 9.8%), and engineering (163 | 8.6%) are the most common fields of study among 1,894 individuals in Somervell County who have obtained a bachelor's degree or higher.
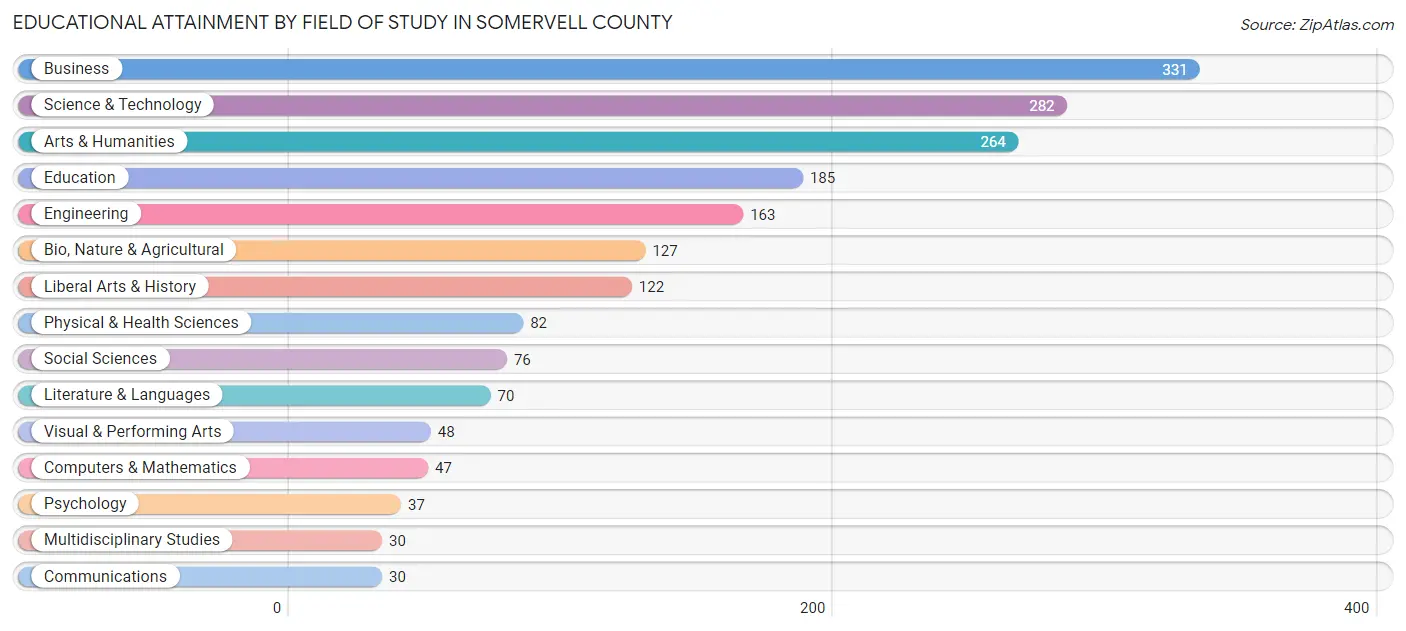
| Field of Study | # Graduates | % Graduates |
| Computers & Mathematics | 47 | 2.5% |
| Bio, Nature & Agricultural | 127 | 6.7% |
| Physical & Health Sciences | 82 | 4.3% |
| Psychology | 37 | 1.9% |
| Social Sciences | 76 | 4.0% |
| Engineering | 163 | 8.6% |
| Multidisciplinary Studies | 30 | 1.6% |
| Science & Technology | 282 | 14.9% |
| Business | 331 | 17.5% |
| Education | 185 | 9.8% |
| Literature & Languages | 70 | 3.7% |
| Liberal Arts & History | 122 | 6.4% |
| Visual & Performing Arts | 48 | 2.5% |
| Communications | 30 | 1.6% |
| Arts & Humanities | 264 | 13.9% |
| Total | 1,894 | 100.0% |
Transportation & Commute in Somervell County
Vehicle Availability by Sex in Somervell County
The most prevalent vehicle ownership categories in Somervell County are males with 2 vehicles (1,068, accounting for 40.8%) and females with 2 vehicles (812, making up 55.9%).
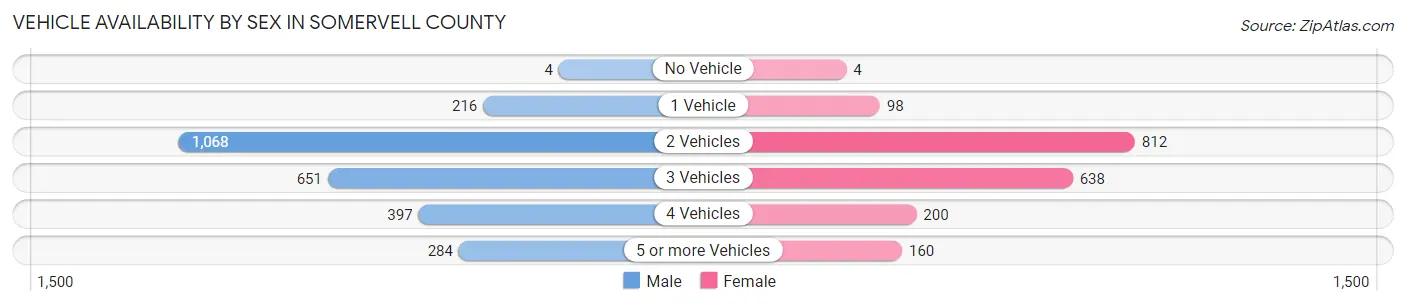
| Vehicles Available | Male | Female |
| No Vehicle | 4 (0.2%) | 4 (0.2%) |
| 1 Vehicle | 216 (8.2%) | 98 (5.1%) |
| 2 Vehicles | 1,068 (40.8%) | 812 (42.5%) |
| 3 Vehicles | 651 (24.8%) | 638 (33.4%) |
| 4 Vehicles | 397 (15.1%) | 200 (10.5%) |
| 5 or more Vehicles | 284 (10.8%) | 160 (8.4%) |
| Total | 2,620 (100.0%) | 1,912 (100.0%) |
Commute Time in Somervell County
The most frequently occuring commute durations in Somervell County are 10 to 14 minutes (785 commuters, 19.1%), 15 to 19 minutes (676 commuters, 16.5%), and 5 to 9 minutes (648 commuters, 15.8%).
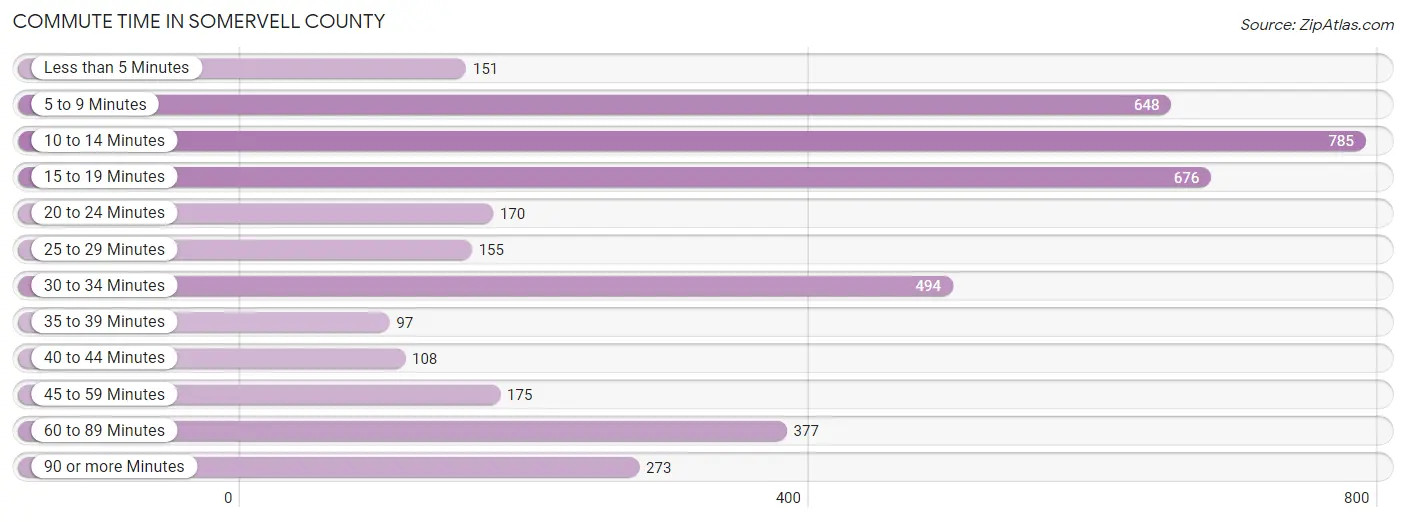
| Commute Time | # Commuters | % Commuters |
| Less than 5 Minutes | 151 | 3.7% |
| 5 to 9 Minutes | 648 | 15.8% |
| 10 to 14 Minutes | 785 | 19.1% |
| 15 to 19 Minutes | 676 | 16.5% |
| 20 to 24 Minutes | 170 | 4.1% |
| 25 to 29 Minutes | 155 | 3.8% |
| 30 to 34 Minutes | 494 | 12.0% |
| 35 to 39 Minutes | 97 | 2.4% |
| 40 to 44 Minutes | 108 | 2.6% |
| 45 to 59 Minutes | 175 | 4.3% |
| 60 to 89 Minutes | 377 | 9.2% |
| 90 or more Minutes | 273 | 6.6% |
Commute Time by Sex in Somervell County
The most common commute times in Somervell County are 15 to 19 minutes (393 commuters, 16.6%) for males and 10 to 14 minutes (429 commuters, 24.6%) for females.
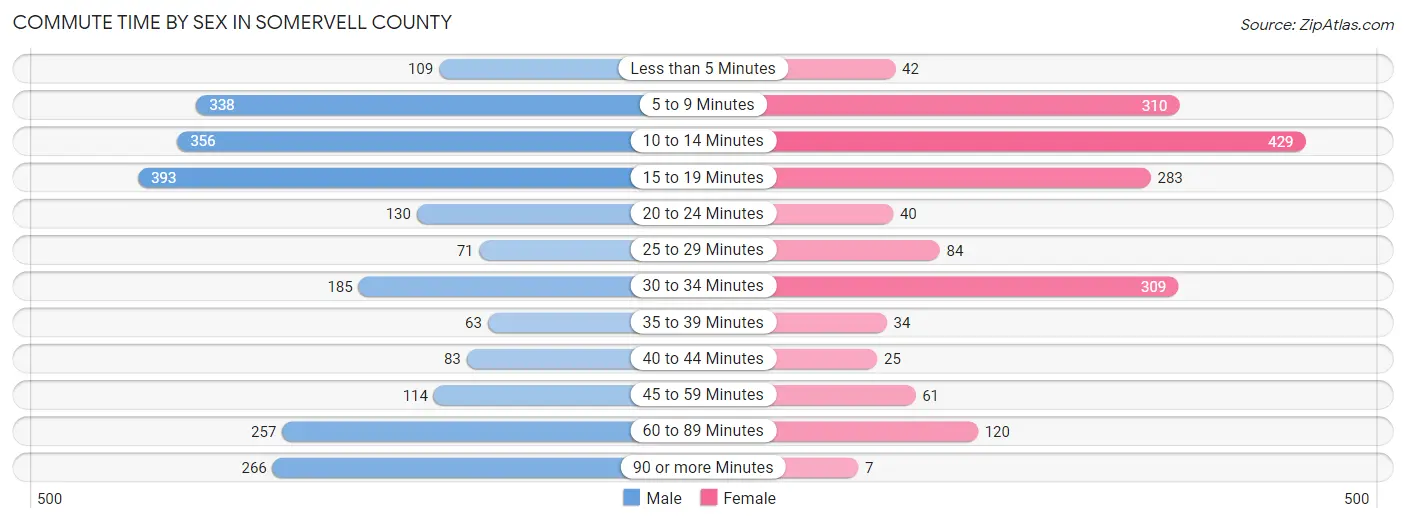
| Commute Time | Male | Female |
| Less than 5 Minutes | 109 (4.6%) | 42 (2.4%) |
| 5 to 9 Minutes | 338 (14.3%) | 310 (17.8%) |
| 10 to 14 Minutes | 356 (15.0%) | 429 (24.6%) |
| 15 to 19 Minutes | 393 (16.6%) | 283 (16.2%) |
| 20 to 24 Minutes | 130 (5.5%) | 40 (2.3%) |
| 25 to 29 Minutes | 71 (3.0%) | 84 (4.8%) |
| 30 to 34 Minutes | 185 (7.8%) | 309 (17.7%) |
| 35 to 39 Minutes | 63 (2.7%) | 34 (1.9%) |
| 40 to 44 Minutes | 83 (3.5%) | 25 (1.4%) |
| 45 to 59 Minutes | 114 (4.8%) | 61 (3.5%) |
| 60 to 89 Minutes | 257 (10.9%) | 120 (6.9%) |
| 90 or more Minutes | 266 (11.3%) | 7 (0.4%) |
Time of Departure to Work by Sex in Somervell County
The most frequent times of departure to work in Somervell County are 8:00 AM to 8:29 AM (459, 19.4%) for males and 7:00 AM to 7:29 AM (429, 24.6%) for females.
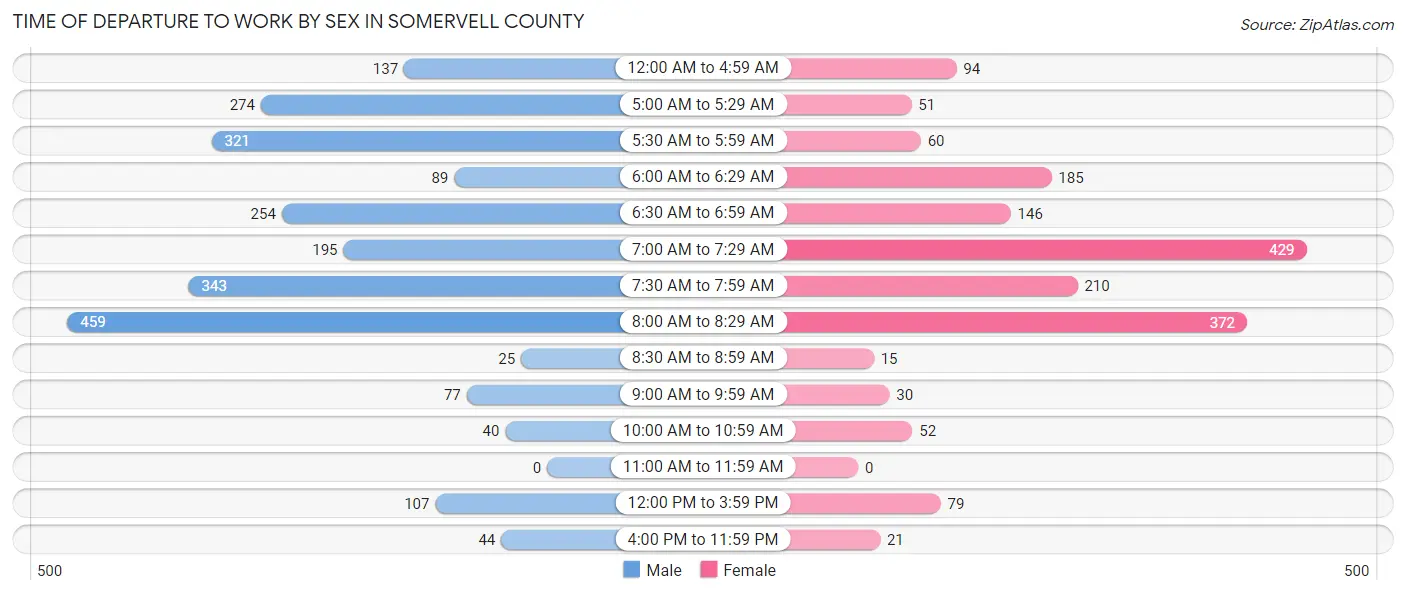
| Time of Departure | Male | Female |
| 12:00 AM to 4:59 AM | 137 (5.8%) | 94 (5.4%) |
| 5:00 AM to 5:29 AM | 274 (11.6%) | 51 (2.9%) |
| 5:30 AM to 5:59 AM | 321 (13.6%) | 60 (3.4%) |
| 6:00 AM to 6:29 AM | 89 (3.8%) | 185 (10.6%) |
| 6:30 AM to 6:59 AM | 254 (10.7%) | 146 (8.4%) |
| 7:00 AM to 7:29 AM | 195 (8.3%) | 429 (24.6%) |
| 7:30 AM to 7:59 AM | 343 (14.5%) | 210 (12.0%) |
| 8:00 AM to 8:29 AM | 459 (19.4%) | 372 (21.3%) |
| 8:30 AM to 8:59 AM | 25 (1.1%) | 15 (0.9%) |
| 9:00 AM to 9:59 AM | 77 (3.3%) | 30 (1.7%) |
| 10:00 AM to 10:59 AM | 40 (1.7%) | 52 (3.0%) |
| 11:00 AM to 11:59 AM | 0 (0.0%) | 0 (0.0%) |
| 12:00 PM to 3:59 PM | 107 (4.5%) | 79 (4.5%) |
| 4:00 PM to 11:59 PM | 44 (1.9%) | 21 (1.2%) |
| Total | 2,365 (100.0%) | 1,744 (100.0%) |
Housing Occupancy in Somervell County
Occupancy by Ownership in Somervell County
Of the total 3,345 dwellings in Somervell County, owner-occupied units account for 2,749 (82.2%), while renter-occupied units make up 596 (17.8%).
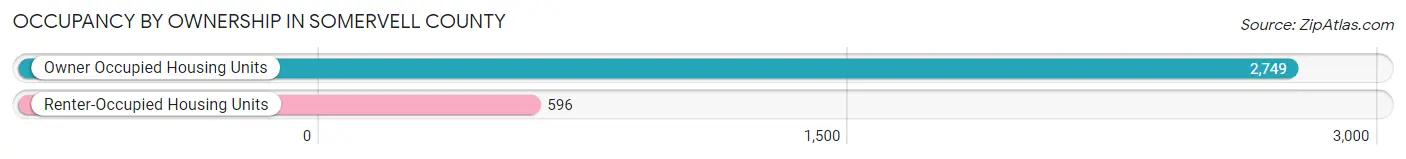
| Occupancy | # Housing Units | % Housing Units |
| Owner Occupied Housing Units | 2,749 | 82.2% |
| Renter-Occupied Housing Units | 596 | 17.8% |
| Total Occupied Housing Units | 3,345 | 100.0% |
Occupancy by Household Size in Somervell County
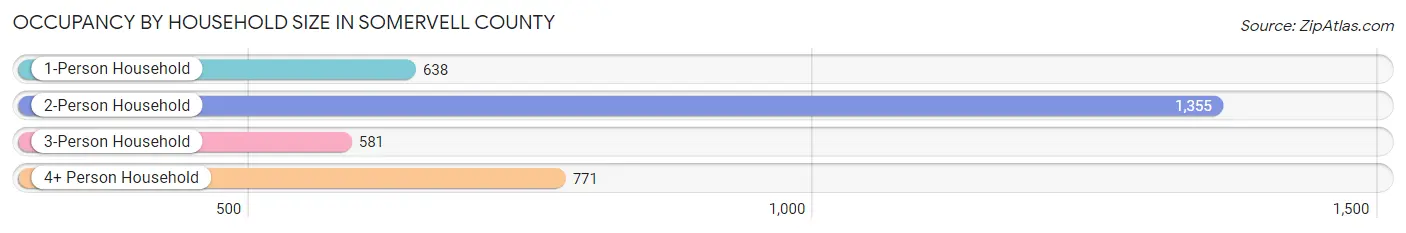
| Household Size | # Housing Units | % Housing Units |
| 1-Person Household | 638 | 19.1% |
| 2-Person Household | 1,355 | 40.5% |
| 3-Person Household | 581 | 17.4% |
| 4+ Person Household | 771 | 23.1% |
| Total Housing Units | 3,345 | 100.0% |
Occupancy by Ownership by Household Size in Somervell County
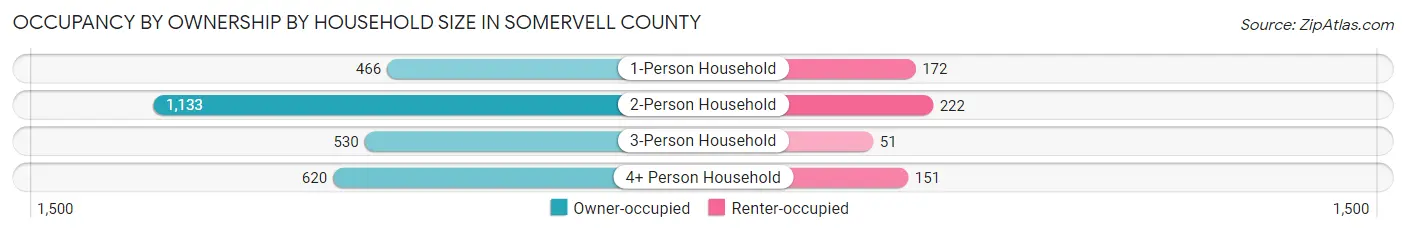
| Household Size | Owner-occupied | Renter-occupied |
| 1-Person Household | 466 (73.0%) | 172 (27.0%) |
| 2-Person Household | 1,133 (83.6%) | 222 (16.4%) |
| 3-Person Household | 530 (91.2%) | 51 (8.8%) |
| 4+ Person Household | 620 (80.4%) | 151 (19.6%) |
| Total Housing Units | 2,749 (82.2%) | 596 (17.8%) |
Occupancy by Educational Attainment in Somervell County
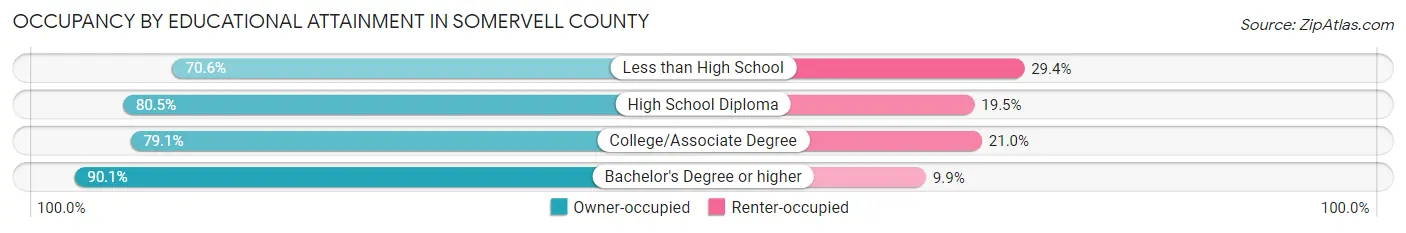
| Household Size | Owner-occupied | Renter-occupied |
| Less than High School | 154 (70.6%) | 64 (29.4%) |
| High School Diploma | 761 (80.5%) | 184 (19.5%) |
| College/Associate Degree | 947 (79.0%) | 251 (20.9%) |
| Bachelor's Degree or higher | 887 (90.1%) | 97 (9.9%) |
Occupancy by Age of Householder in Somervell County
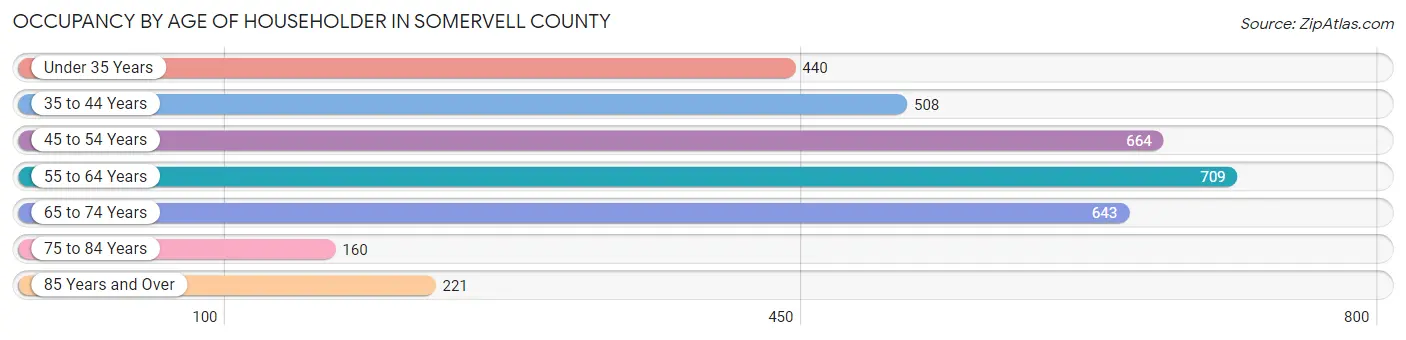
| Age Bracket | # Households | % Households |
| Under 35 Years | 440 | 13.2% |
| 35 to 44 Years | 508 | 15.2% |
| 45 to 54 Years | 664 | 19.9% |
| 55 to 64 Years | 709 | 21.2% |
| 65 to 74 Years | 643 | 19.2% |
| 75 to 84 Years | 160 | 4.8% |
| 85 Years and Over | 221 | 6.6% |
| Total | 3,345 | 100.0% |
Housing Finances in Somervell County
Median Income by Occupancy in Somervell County
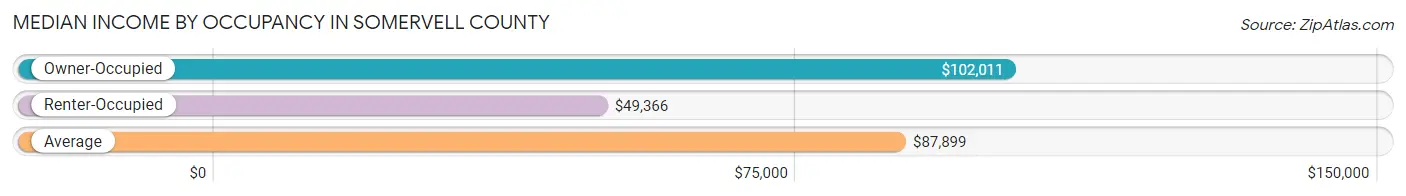
| Occupancy Type | # Households | Median Income |
| Owner-Occupied | 2,749 (82.2%) | $102,011 |
| Renter-Occupied | 596 (17.8%) | $49,366 |
| Average | 3,345 (100.0%) | $87,899 |
Occupancy by Householder Income Bracket in Somervell County
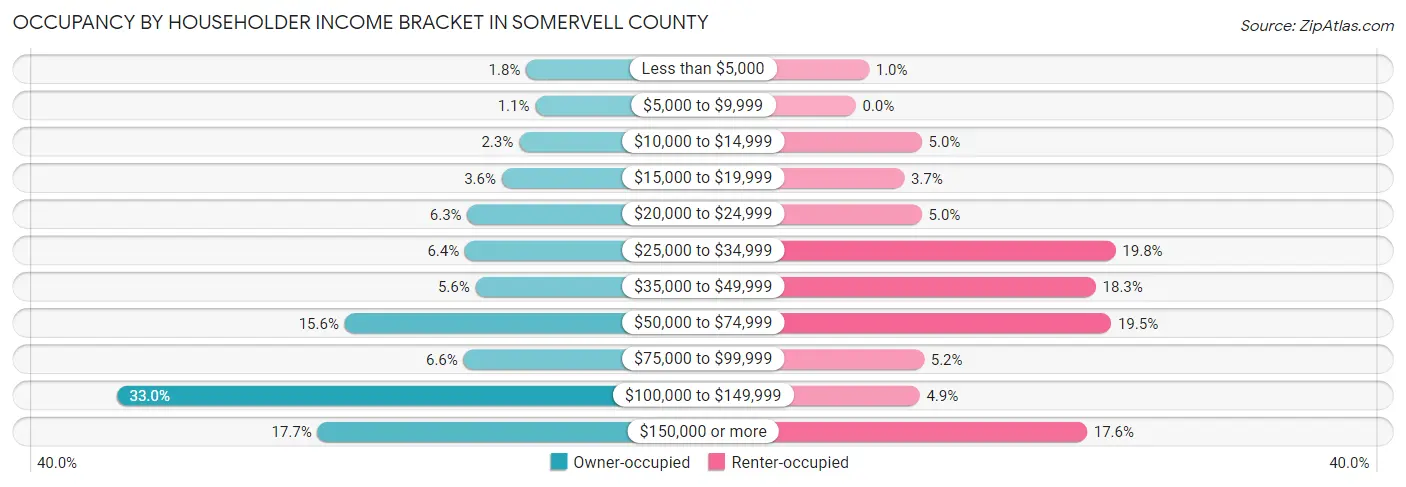
| Income Bracket | Owner-occupied | Renter-occupied |
| Less than $5,000 | 49 (1.8%) | 6 (1.0%) |
| $5,000 to $9,999 | 30 (1.1%) | 0 (0.0%) |
| $10,000 to $14,999 | 64 (2.3%) | 30 (5.0%) |
| $15,000 to $19,999 | 100 (3.6%) | 22 (3.7%) |
| $20,000 to $24,999 | 172 (6.3%) | 30 (5.0%) |
| $25,000 to $34,999 | 177 (6.4%) | 118 (19.8%) |
| $35,000 to $49,999 | 155 (5.6%) | 109 (18.3%) |
| $50,000 to $74,999 | 429 (15.6%) | 116 (19.5%) |
| $75,000 to $99,999 | 180 (6.6%) | 31 (5.2%) |
| $100,000 to $149,999 | 907 (33.0%) | 29 (4.9%) |
| $150,000 or more | 486 (17.7%) | 105 (17.6%) |
| Total | 2,749 (100.0%) | 596 (100.0%) |
Monthly Housing Cost Tiers in Somervell County
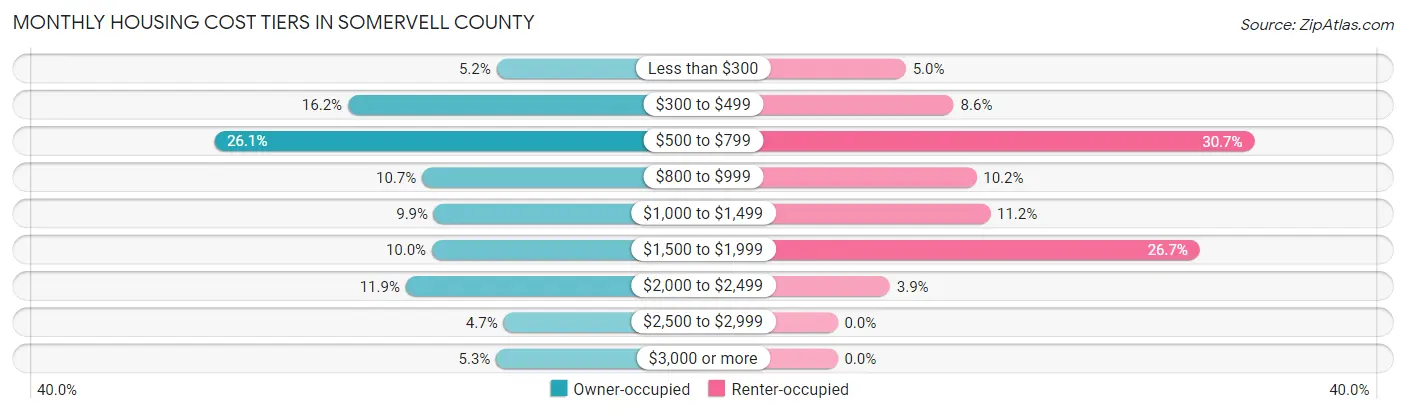
| Monthly Cost | Owner-occupied | Renter-occupied |
| Less than $300 | 144 (5.2%) | 30 (5.0%) |
| $300 to $499 | 445 (16.2%) | 51 (8.6%) |
| $500 to $799 | 716 (26.1%) | 183 (30.7%) |
| $800 to $999 | 295 (10.7%) | 61 (10.2%) |
| $1,000 to $1,499 | 271 (9.9%) | 67 (11.2%) |
| $1,500 to $1,999 | 275 (10.0%) | 159 (26.7%) |
| $2,000 to $2,499 | 328 (11.9%) | 23 (3.9%) |
| $2,500 to $2,999 | 130 (4.7%) | 0 (0.0%) |
| $3,000 or more | 145 (5.3%) | 0 (0.0%) |
| Total | 2,749 (100.0%) | 596 (100.0%) |
Physical Housing Characteristics in Somervell County
Housing Structures in Somervell County
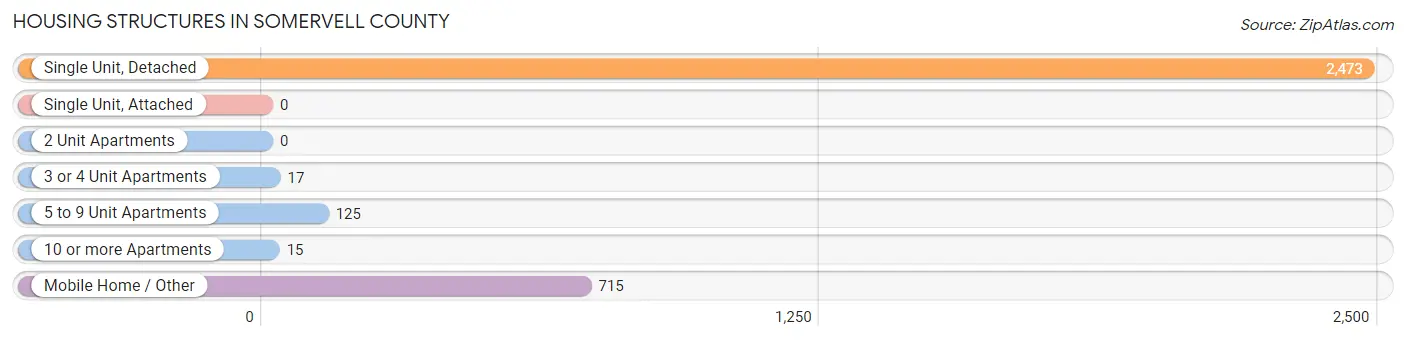
| Structure Type | # Housing Units | % Housing Units |
| Single Unit, Detached | 2,473 | 73.9% |
| Single Unit, Attached | 0 | 0.0% |
| 2 Unit Apartments | 0 | 0.0% |
| 3 or 4 Unit Apartments | 17 | 0.5% |
| 5 to 9 Unit Apartments | 125 | 3.7% |
| 10 or more Apartments | 15 | 0.4% |
| Mobile Home / Other | 715 | 21.4% |
| Total | 3,345 | 100.0% |
Housing Structures by Occupancy in Somervell County
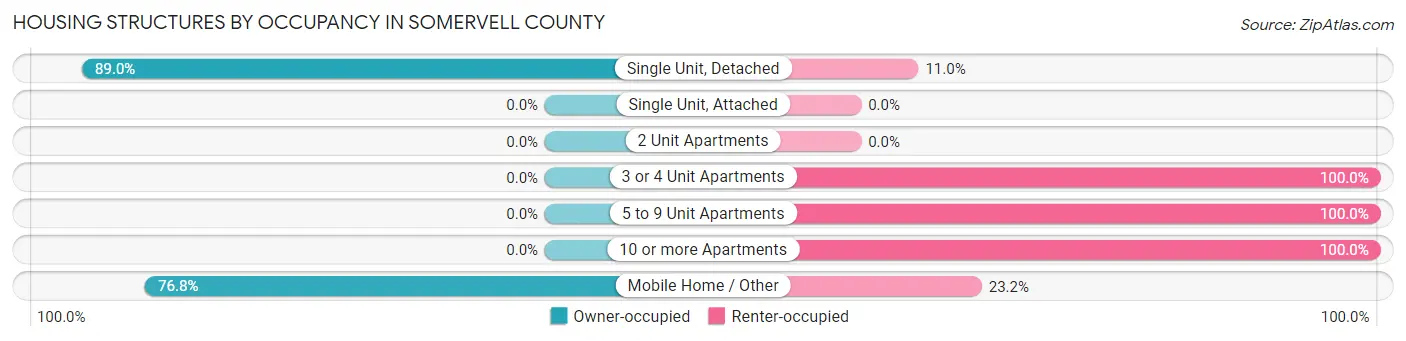
| Structure Type | Owner-occupied | Renter-occupied |
| Single Unit, Detached | 2,200 (89.0%) | 273 (11.0%) |
| Single Unit, Attached | 0 (0.0%) | 0 (0.0%) |
| 2 Unit Apartments | 0 (0.0%) | 0 (0.0%) |
| 3 or 4 Unit Apartments | 0 (0.0%) | 17 (100.0%) |
| 5 to 9 Unit Apartments | 0 (0.0%) | 125 (100.0%) |
| 10 or more Apartments | 0 (0.0%) | 15 (100.0%) |
| Mobile Home / Other | 549 (76.8%) | 166 (23.2%) |
| Total | 2,749 (82.2%) | 596 (17.8%) |
Housing Structures by Number of Rooms in Somervell County
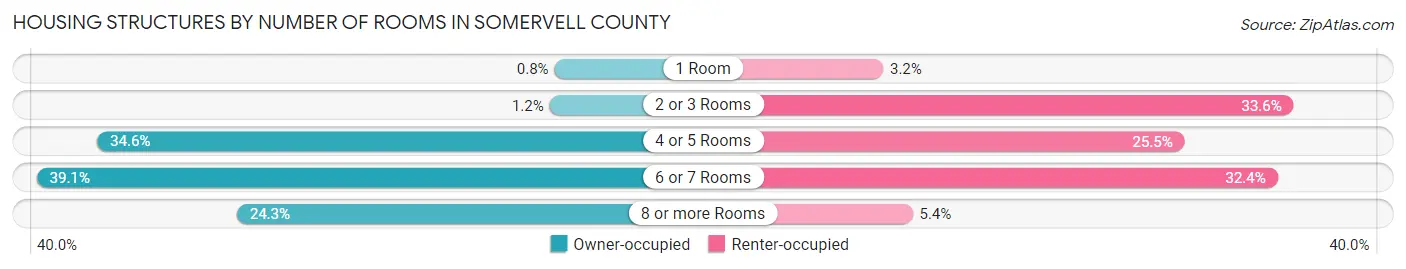
| Number of Rooms | Owner-occupied | Renter-occupied |
| 1 Room | 22 (0.8%) | 19 (3.2%) |
| 2 or 3 Rooms | 32 (1.2%) | 200 (33.6%) |
| 4 or 5 Rooms | 952 (34.6%) | 152 (25.5%) |
| 6 or 7 Rooms | 1,075 (39.1%) | 193 (32.4%) |
| 8 or more Rooms | 668 (24.3%) | 32 (5.4%) |
| Total | 2,749 (100.0%) | 596 (100.0%) |
Housing Structure by Heating Type in Somervell County
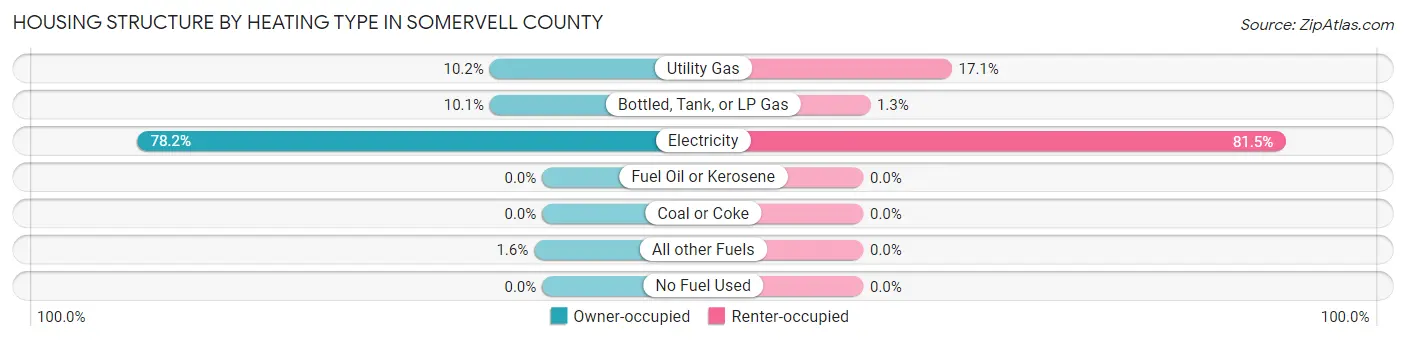
| Heating Type | Owner-occupied | Renter-occupied |
| Utility Gas | 279 (10.2%) | 102 (17.1%) |
| Bottled, Tank, or LP Gas | 278 (10.1%) | 8 (1.3%) |
| Electricity | 2,149 (78.2%) | 486 (81.5%) |
| Fuel Oil or Kerosene | 0 (0.0%) | 0 (0.0%) |
| Coal or Coke | 0 (0.0%) | 0 (0.0%) |
| All other Fuels | 43 (1.6%) | 0 (0.0%) |
| No Fuel Used | 0 (0.0%) | 0 (0.0%) |
| Total | 2,749 (100.0%) | 596 (100.0%) |
Household Vehicle Usage in Somervell County
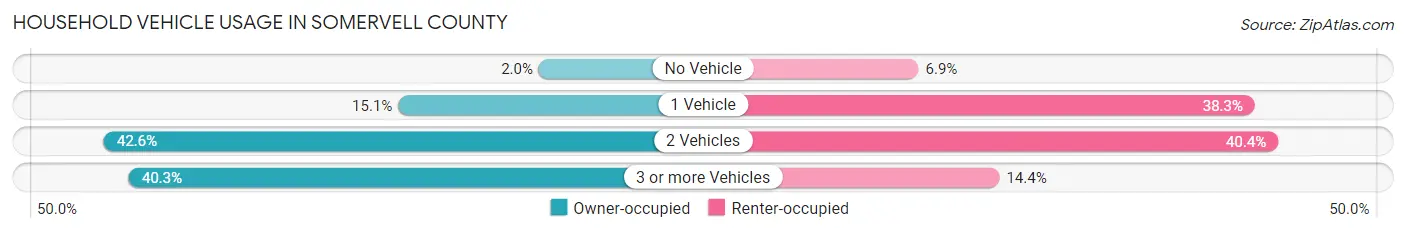
| Vehicles per Household | Owner-occupied | Renter-occupied |
| No Vehicle | 55 (2.0%) | 41 (6.9%) |
| 1 Vehicle | 416 (15.1%) | 228 (38.3%) |
| 2 Vehicles | 1,171 (42.6%) | 241 (40.4%) |
| 3 or more Vehicles | 1,107 (40.3%) | 86 (14.4%) |
| Total | 2,749 (100.0%) | 596 (100.0%) |
Real Estate & Mortgages in Somervell County
Real Estate and Mortgage Overview in Somervell County
| Characteristic | Without Mortgage | With Mortgage |
| Housing Units | 1,363 | 1,386 |
| Median Property Value | $220,100 | $268,400 |
| Median Household Income | $73,494 | $210 |
| Monthly Housing Costs | $537 | $145 |
| Real Estate Taxes | $2,080 | $0 |
Property Value by Mortgage Status in Somervell County
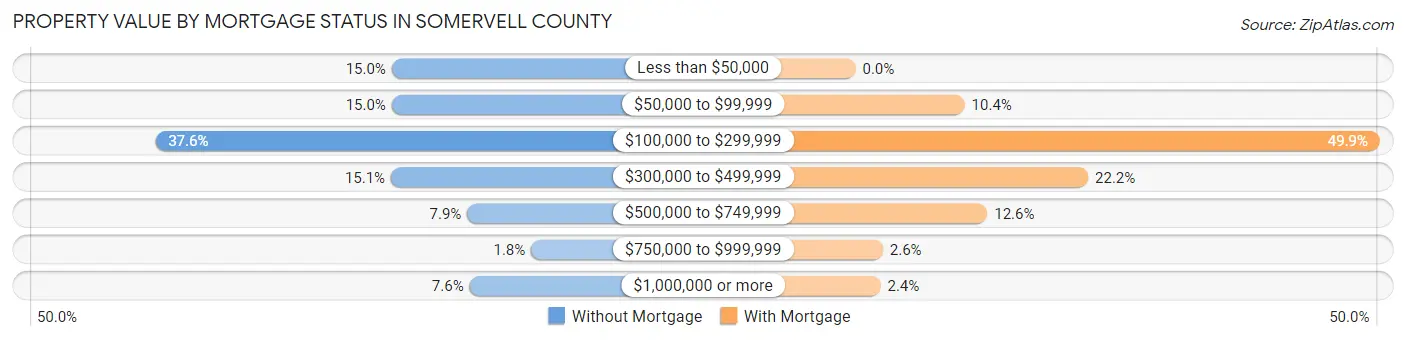
| Property Value | Without Mortgage | With Mortgage |
| Less than $50,000 | 205 (15.0%) | 0 (0.0%) |
| $50,000 to $99,999 | 205 (15.0%) | 144 (10.4%) |
| $100,000 to $299,999 | 512 (37.6%) | 692 (49.9%) |
| $300,000 to $499,999 | 206 (15.1%) | 307 (22.2%) |
| $500,000 to $749,999 | 107 (7.9%) | 174 (12.6%) |
| $750,000 to $999,999 | 24 (1.8%) | 36 (2.6%) |
| $1,000,000 or more | 104 (7.6%) | 33 (2.4%) |
| Total | 1,363 (100.0%) | 1,386 (100.0%) |
Household Income by Mortgage Status in Somervell County
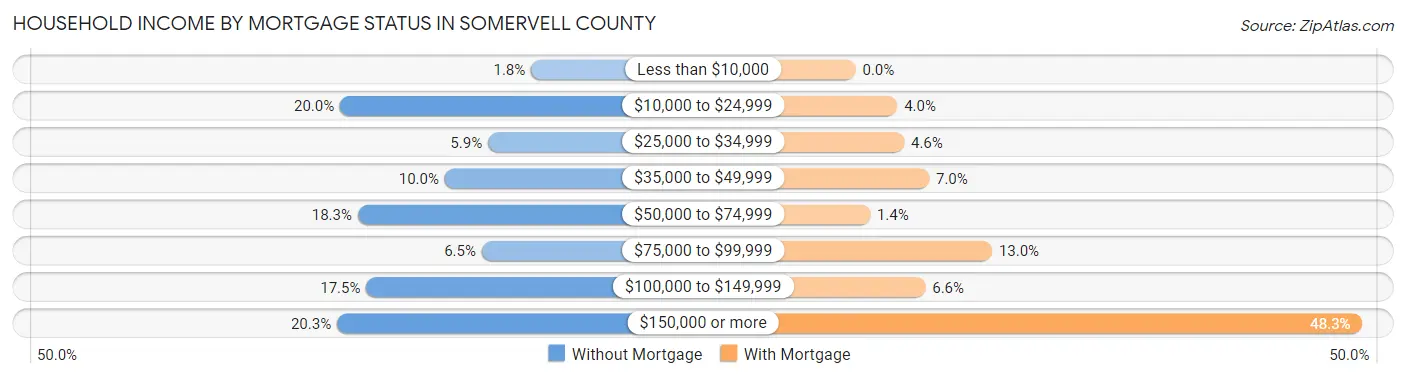
| Household Income | Without Mortgage | With Mortgage |
| Less than $10,000 | 24 (1.8%) | 0 (0.0%) |
| $10,000 to $24,999 | 272 (20.0%) | 55 (4.0%) |
| $25,000 to $34,999 | 80 (5.9%) | 64 (4.6%) |
| $35,000 to $49,999 | 136 (10.0%) | 97 (7.0%) |
| $50,000 to $74,999 | 249 (18.3%) | 19 (1.4%) |
| $75,000 to $99,999 | 88 (6.5%) | 180 (13.0%) |
| $100,000 to $149,999 | 238 (17.5%) | 92 (6.6%) |
| $150,000 or more | 276 (20.3%) | 669 (48.3%) |
| Total | 1,363 (100.0%) | 1,386 (100.0%) |
Property Value to Household Income Ratio in Somervell County
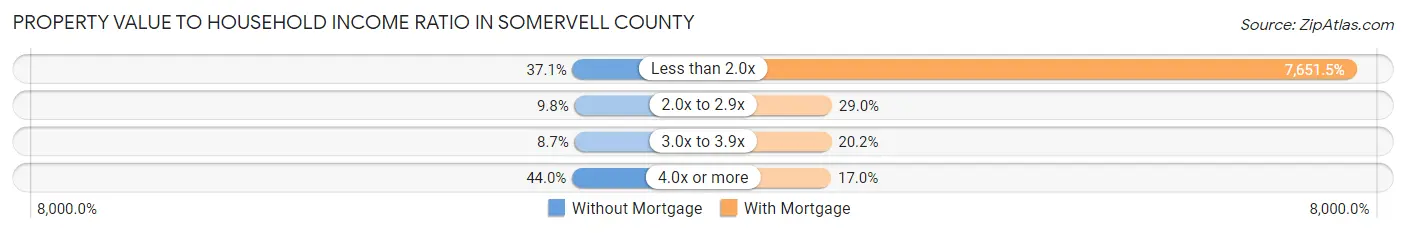
| Value-to-Income Ratio | Without Mortgage | With Mortgage |
| Less than 2.0x | 505 (37.0%) | 106,050 (7,651.5%) |
| 2.0x to 2.9x | 134 (9.8%) | 402 (29.0%) |
| 3.0x to 3.9x | 119 (8.7%) | 280 (20.2%) |
| 4.0x or more | 599 (44.0%) | 235 (17.0%) |
| Total | 1,363 (100.0%) | 1,386 (100.0%) |
Real Estate Taxes by Mortgage Status in Somervell County
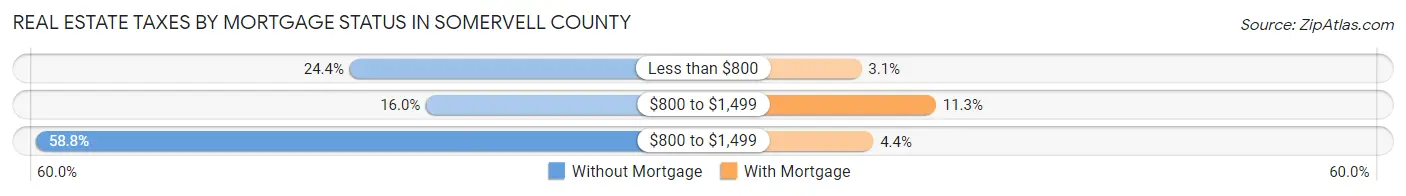
| Property Taxes | Without Mortgage | With Mortgage |
| Less than $800 | 332 (24.4%) | 43 (3.1%) |
| $800 to $1,499 | 218 (16.0%) | 156 (11.3%) |
| $800 to $1,499 | 801 (58.8%) | 61 (4.4%) |
| Total | 1,363 (100.0%) | 1,386 (100.0%) |
Health & Disability in Somervell County
Health Insurance Coverage by Age in Somervell County
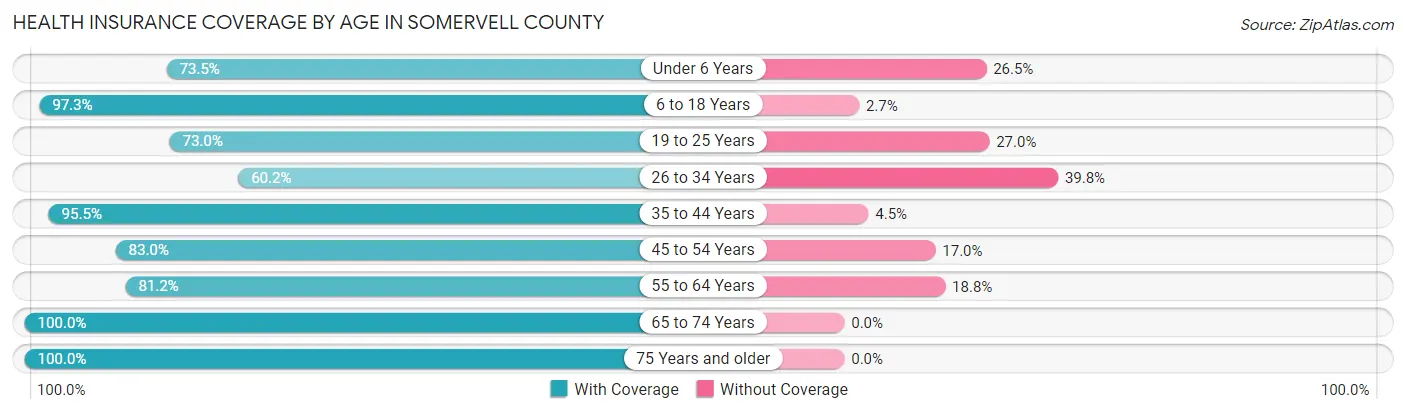
| Age Bracket | With Coverage | Without Coverage |
| Under 6 Years | 289 (73.5%) | 104 (26.5%) |
| 6 to 18 Years | 1,631 (97.3%) | 46 (2.7%) |
| 19 to 25 Years | 637 (73.0%) | 236 (27.0%) |
| 26 to 34 Years | 373 (60.2%) | 247 (39.8%) |
| 35 to 44 Years | 1,340 (95.5%) | 63 (4.5%) |
| 45 to 54 Years | 1,007 (83.0%) | 206 (17.0%) |
| 55 to 64 Years | 1,118 (81.2%) | 259 (18.8%) |
| 65 to 74 Years | 981 (100.0%) | 0 (0.0%) |
| 75 Years and older | 623 (100.0%) | 0 (0.0%) |
| Total | 7,999 (87.3%) | 1,161 (12.7%) |
Health Insurance Coverage by Citizenship Status in Somervell County
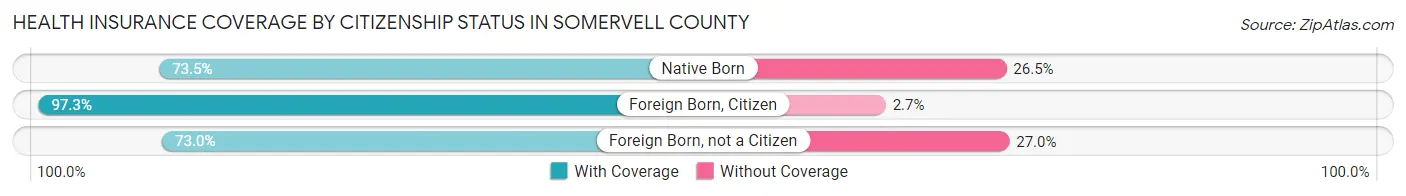
| Citizenship Status | With Coverage | Without Coverage |
| Native Born | 289 (73.5%) | 104 (26.5%) |
| Foreign Born, Citizen | 1,631 (97.3%) | 46 (2.7%) |
| Foreign Born, not a Citizen | 637 (73.0%) | 236 (27.0%) |
Health Insurance Coverage by Household Income in Somervell County
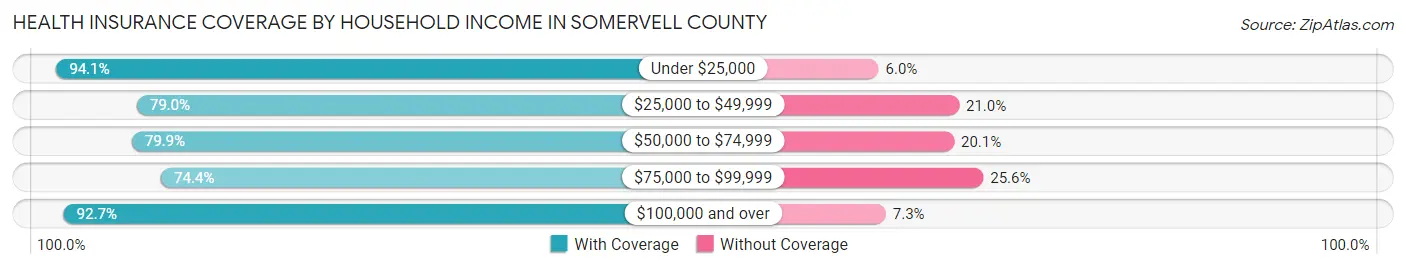
| Household Income | With Coverage | Without Coverage |
| Under $25,000 | 585 (94.1%) | 37 (5.9%) |
| $25,000 to $49,999 | 875 (79.0%) | 233 (21.0%) |
| $50,000 to $74,999 | 1,181 (79.9%) | 297 (20.1%) |
| $75,000 to $99,999 | 489 (74.4%) | 168 (25.6%) |
| $100,000 and over | 4,708 (92.7%) | 372 (7.3%) |
Public vs Private Health Insurance Coverage by Age in Somervell County
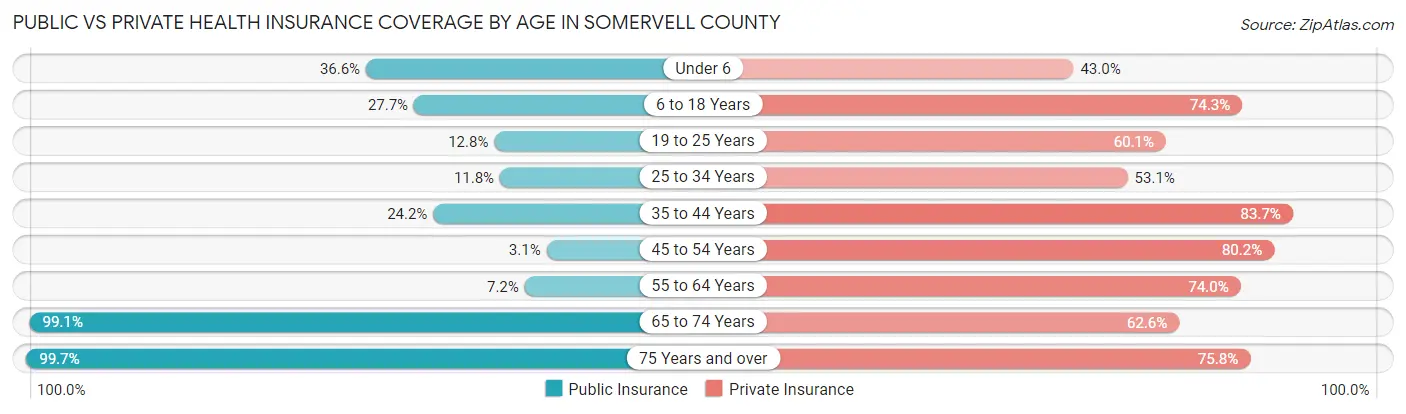
| Age Bracket | Public Insurance | Private Insurance |
| Under 6 | 144 (36.6%) | 169 (43.0%) |
| 6 to 18 Years | 465 (27.7%) | 1,246 (74.3%) |
| 19 to 25 Years | 112 (12.8%) | 525 (60.1%) |
| 25 to 34 Years | 73 (11.8%) | 329 (53.1%) |
| 35 to 44 Years | 339 (24.2%) | 1,174 (83.7%) |
| 45 to 54 Years | 38 (3.1%) | 973 (80.2%) |
| 55 to 64 Years | 99 (7.2%) | 1,019 (74.0%) |
| 65 to 74 Years | 972 (99.1%) | 614 (62.6%) |
| 75 Years and over | 621 (99.7%) | 472 (75.8%) |
| Total | 2,863 (31.3%) | 6,521 (71.2%) |
Disability Status by Sex by Age in Somervell County
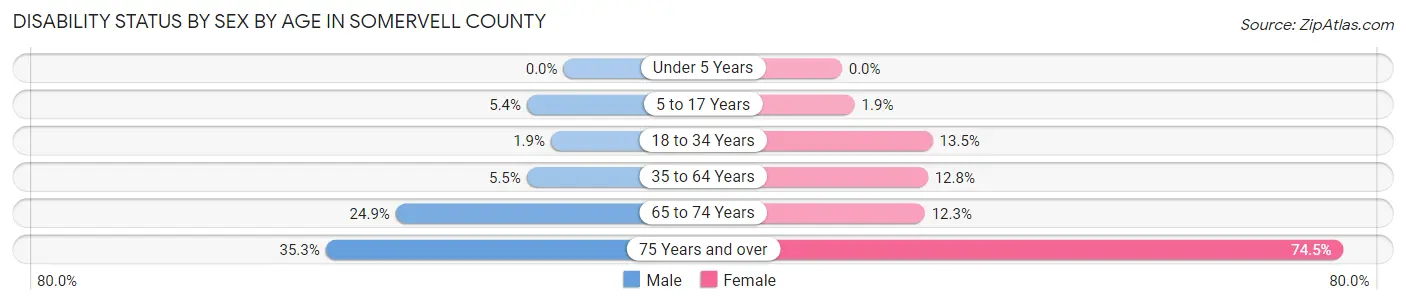
| Age Bracket | Male | Female |
| Under 5 Years | 0 (0.0%) | 0 (0.0%) |
| 5 to 17 Years | 38 (5.4%) | 18 (1.9%) |
| 18 to 34 Years | 14 (1.9%) | 109 (13.5%) |
| 35 to 64 Years | 110 (5.4%) | 252 (12.8%) |
| 65 to 74 Years | 121 (24.9%) | 61 (12.3%) |
| 75 Years and over | 101 (35.3%) | 251 (74.5%) |
Disability Class by Sex by Age in Somervell County
Disability Class: Hearing Difficulty
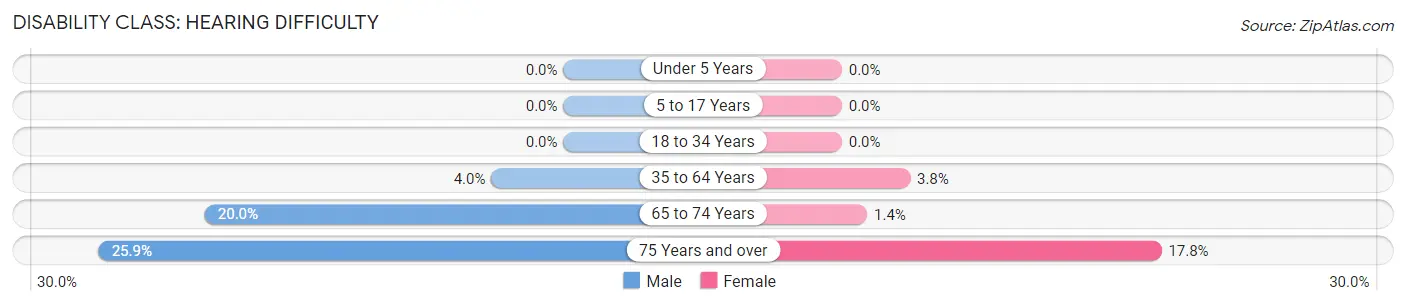
| Age Bracket | Male | Female |
| Under 5 Years | 0 (0.0%) | 0 (0.0%) |
| 5 to 17 Years | 0 (0.0%) | 0 (0.0%) |
| 18 to 34 Years | 0 (0.0%) | 0 (0.0%) |
| 35 to 64 Years | 81 (4.0%) | 75 (3.8%) |
| 65 to 74 Years | 97 (20.0%) | 7 (1.4%) |
| 75 Years and over | 74 (25.9%) | 60 (17.8%) |
Disability Class: Vision Difficulty
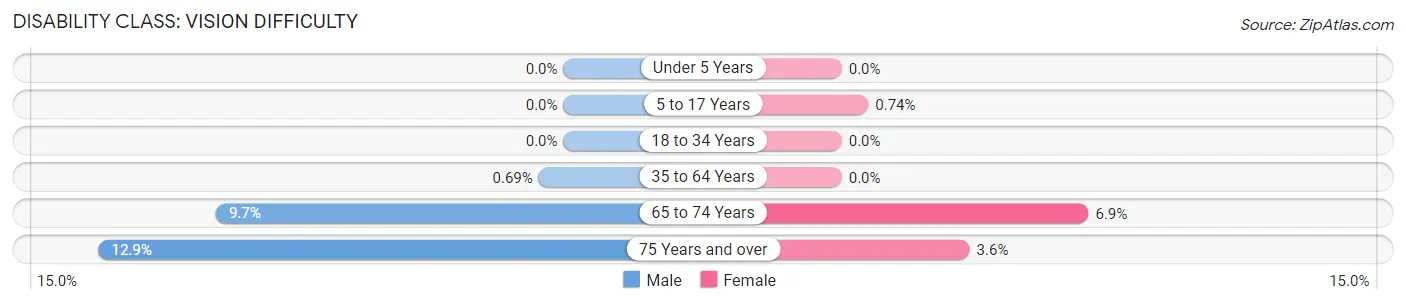
| Age Bracket | Male | Female |
| Under 5 Years | 0 (0.0%) | 0 (0.0%) |
| 5 to 17 Years | 0 (0.0%) | 7 (0.7%) |
| 18 to 34 Years | 0 (0.0%) | 0 (0.0%) |
| 35 to 64 Years | 14 (0.7%) | 0 (0.0%) |
| 65 to 74 Years | 47 (9.7%) | 34 (6.9%) |
| 75 Years and over | 37 (12.9%) | 12 (3.6%) |
Disability Class: Cognitive Difficulty
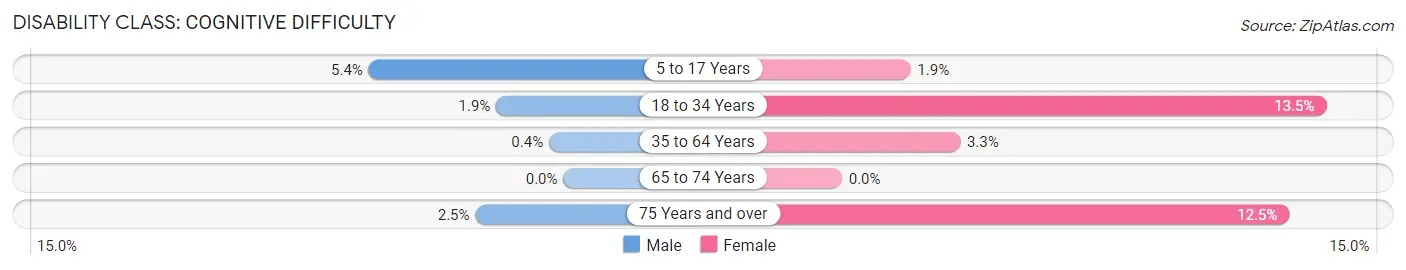
| Age Bracket | Male | Female |
| 5 to 17 Years | 38 (5.4%) | 18 (1.9%) |
| 18 to 34 Years | 14 (1.9%) | 109 (13.5%) |
| 35 to 64 Years | 8 (0.4%) | 65 (3.3%) |
| 65 to 74 Years | 0 (0.0%) | 0 (0.0%) |
| 75 Years and over | 7 (2.5%) | 42 (12.5%) |
Disability Class: Ambulatory Difficulty
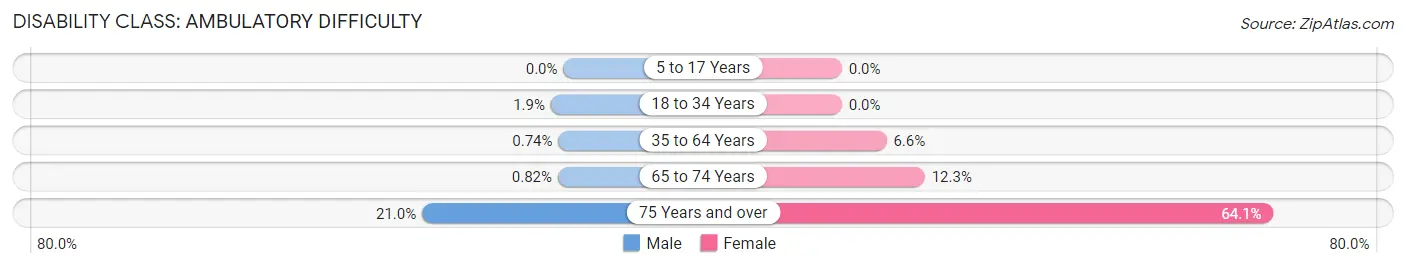
| Age Bracket | Male | Female |
| 5 to 17 Years | 0 (0.0%) | 0 (0.0%) |
| 18 to 34 Years | 14 (1.9%) | 0 (0.0%) |
| 35 to 64 Years | 15 (0.7%) | 131 (6.6%) |
| 65 to 74 Years | 4 (0.8%) | 61 (12.3%) |
| 75 Years and over | 60 (21.0%) | 216 (64.1%) |
Disability Class: Self-Care Difficulty
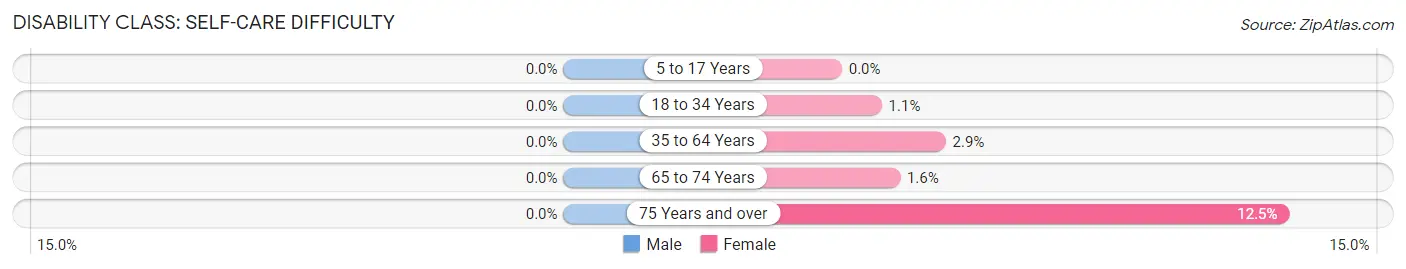
| Age Bracket | Male | Female |
| 5 to 17 Years | 0 (0.0%) | 0 (0.0%) |
| 18 to 34 Years | 0 (0.0%) | 9 (1.1%) |
| 35 to 64 Years | 0 (0.0%) | 57 (2.9%) |
| 65 to 74 Years | 0 (0.0%) | 8 (1.6%) |
| 75 Years and over | 0 (0.0%) | 42 (12.5%) |
Technology Access in Somervell County
Computing Device Access in Somervell County
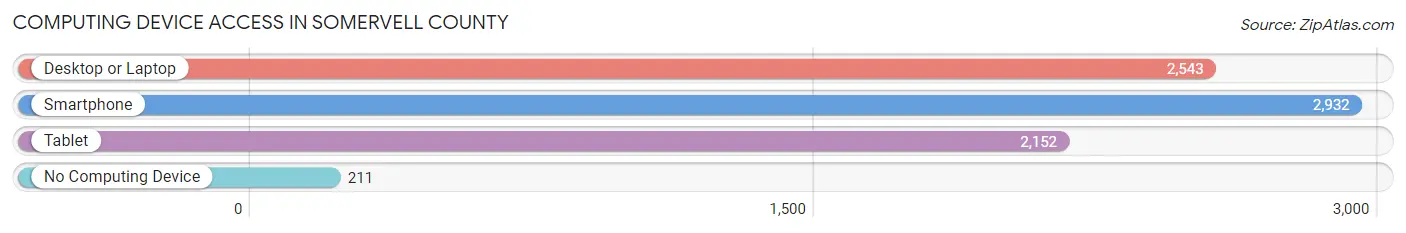
| Device Type | # Households | % Households |
| Desktop or Laptop | 2,543 | 76.0% |
| Smartphone | 2,932 | 87.6% |
| Tablet | 2,152 | 64.3% |
| No Computing Device | 211 | 6.3% |
| Total | 3,345 | 100.0% |
Internet Access in Somervell County
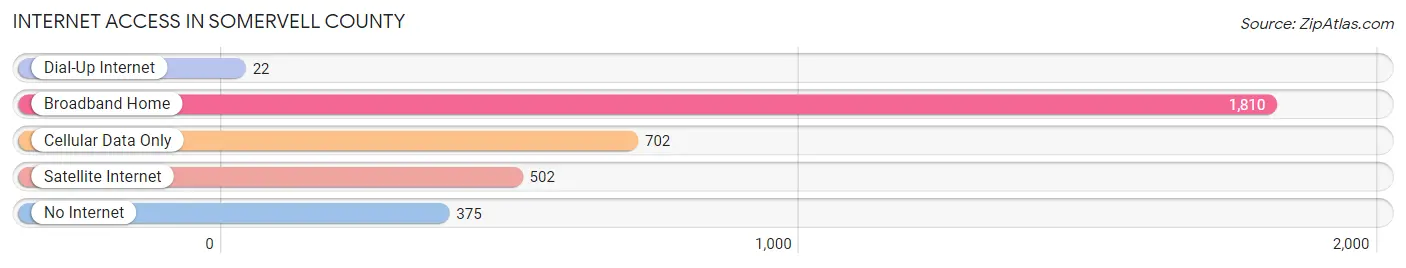
| Internet Type | # Households | % Households |
| Dial-Up Internet | 22 | 0.7% |
| Broadband Home | 1,810 | 54.1% |
| Cellular Data Only | 702 | 21.0% |
| Satellite Internet | 502 | 15.0% |
| No Internet | 375 | 11.2% |
| Total | 3,345 | 100.0% |
Somervell County Summary
Somervell County is a county located in the U.S. state of Texas. As of the 2010 census, the population was 8,490. Its county seat is Glen Rose. The county was created in 1875 and is named for Alexander Somervell, a secretary of war for the Republic of Texas.
Geography
Somervell County is located in the southwestern part of Texas, about 70 miles southwest of Fort Worth. It is bordered by Hood County to the north, Johnson County to the east, Erath County to the south, and Bosque County to the west. The county covers an area of 545 square miles, of which 543 square miles is land and 2 square miles is water. The county is mostly hilly, with elevations ranging from 500 to 1,000 feet above sea level. The county is drained by the Paluxy River and its tributaries.
Demographics
As of the 2010 census, there were 8,490 people, 3,093 households, and 2,269 families residing in the county. The population density was 15.6 people per square mile. The racial makeup of the county was 92.2% White, 0.5% Black or African American, 0.7% Native American, 0.2% Asian, 0.1% Pacific Islander, 5.2% from other races, and 1.1% from two or more races. 11.7% of the population were Hispanic or Latino of any race.
The median income for a household in the county was $41,945, and the median income for a family was $48,945. The per capita income for the county was $20,845. About 11.2% of families and 14.2% of the population were below the poverty line, including 18.2% of those under age 18 and 11.2% of those age 65 or over.
Economy
The economy of Somervell County is largely based on agriculture and tourism. The county is home to several wineries, and the nearby Dinosaur Valley State Park is a popular tourist destination. The county is also home to several manufacturing companies, including a large concrete plant and a metal fabrication plant.
The county is served by two school districts, the Glen Rose Independent School District and the Somervell County Independent School District. The county is also home to several higher education institutions, including Tarleton State University, Texas A&M University-Central Texas, and Hill College.
History
Somervell County was created in 1875 from parts of Hood and Johnson counties. It was named for Alexander Somervell, a secretary of war for the Republic of Texas. The county seat was originally located in the town of Somervell, but it was moved to Glen Rose in 1882.
The county was largely rural until the 1950s, when the construction of Lake Granbury brought an influx of new residents. The lake also brought new businesses and industries to the area, and the population of the county has grown steadily since then.
In recent years, Somervell County has become a popular tourist destination, thanks to its proximity to Dinosaur Valley State Park and the nearby wineries. The county has also become a popular retirement destination, with many retirees moving to the area to take advantage of the low cost of living and the scenic beauty of the area.
Common Questions
What is Per Capita Income in Somervell County?
Per Capita income in Somervell County is $39,037.
What is the Median Family Income in Somervell County?
Median Family Income in Somervell County is $96,386.
What is the Median Household income in Somervell County?
Median Household Income in Somervell County is $87,899.
What is Income or Wage Gap in Somervell County?
Income or Wage Gap in Somervell County is 45.7%.
Women in Somervell County earn 54.3 cents for every dollar earned by a man.
What is Inequality or Gini Index in Somervell County?
Inequality or Gini Index in Somervell County is 0.41.
What is the Total Population of Somervell County?
Total Population of Somervell County is 9,337.
What is the Total Male Population of Somervell County?
Total Male Population of Somervell County is 4,573.
What is the Total Female Population of Somervell County?
Total Female Population of Somervell County is 4,764.
What is the Ratio of Males per 100 Females in Somervell County?
There are 95.99 Males per 100 Females in Somervell County.
What is the Ratio of Females per 100 Males in Somervell County?
There are 104.18 Females per 100 Males in Somervell County.
What is the Median Population Age in Somervell County?
Median Population Age in Somervell County is 43.1 Years.
What is the Average Family Size in Somervell County
Average Family Size in Somervell County is 3.0 People.
What is the Average Household Size in Somervell County
Average Household Size in Somervell County is 2.7 People.
How Large is the Labor Force in Somervell County?
There are 4,752 People in the Labor Forcein in Somervell County.
What is the Percentage of People in the Labor Force in Somervell County?
62.6% of People are in the Labor Force in Somervell County.
What is the Unemployment Rate in Somervell County?
Unemployment Rate in Somervell County is 3.9%.