Sherman County, TX Map & Demographics
Sherman County Map
Sherman County Overview
$43,340
PER CAPITA INCOME
$83,158
AVG FAMILY INCOME
$66,169
AVG HOUSEHOLD INCOME
21.0%
WAGE / INCOME GAP [ % ]
79.0¢/ $1
WAGE / INCOME GAP [ $ ]
$13,056
FAMILY INCOME DEFICIT
0.56
INEQUALITY / GINI INDEX
2,414
TOTAL POPULATION
1,188
MALE POPULATION
1,226
FEMALE POPULATION
96.90
MALES / 100 FEMALES
103.20
FEMALES / 100 MALES
38.4
MEDIAN AGE
3.6
AVG FAMILY SIZE
3.0
AVG HOUSEHOLD SIZE
1,179
LABOR FORCE [ PEOPLE ]
61.2%
PERCENT IN LABOR FORCE
1.5%
UNEMPLOYMENT RATE
Sherman County Area Codes
Income in Sherman County
Income Overview in Sherman County
Per Capita Income in Sherman County is $43,340, while median incomes of families and households are $83,158 and $66,169 respectively.
| Characteristic | Number | Measure |
| Per Capita Income | 2,414 | $43,340 |
| Median Family Income | 602 | $83,158 |
| Mean Family Income | 602 | $137,432 |
| Median Household Income | 803 | $66,169 |
| Mean Household Income | 803 | $116,652 |
| Income Deficit | 602 | $13,056 |
| Wage / Income Gap (%) | 2,414 | 21.03% |
| Wage / Income Gap ($) | 2,414 | 78.97¢ per $1 |
| Gini / Inequality Index | 2,414 | 0.56 |
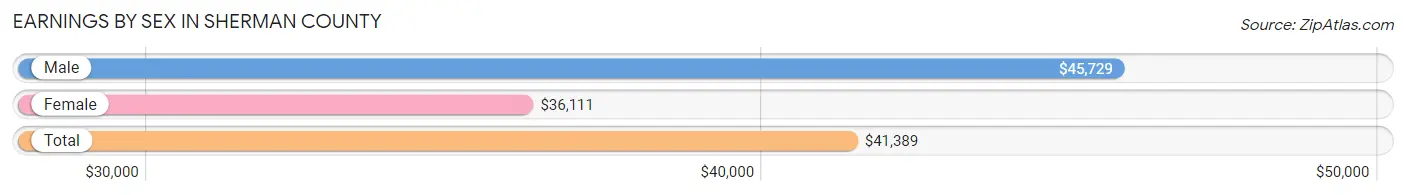
Earnings by Sex in Sherman County
Average Earnings in Sherman County are $41,389, $45,729 for men and $36,111 for women, a difference of 21.0%.
| Sex | Number | Average Earnings |
| Male | 716 (59.3%) | $45,729 |
| Female | 492 (40.7%) | $36,111 |
| Total | 1,208 (100.0%) | $41,389 |
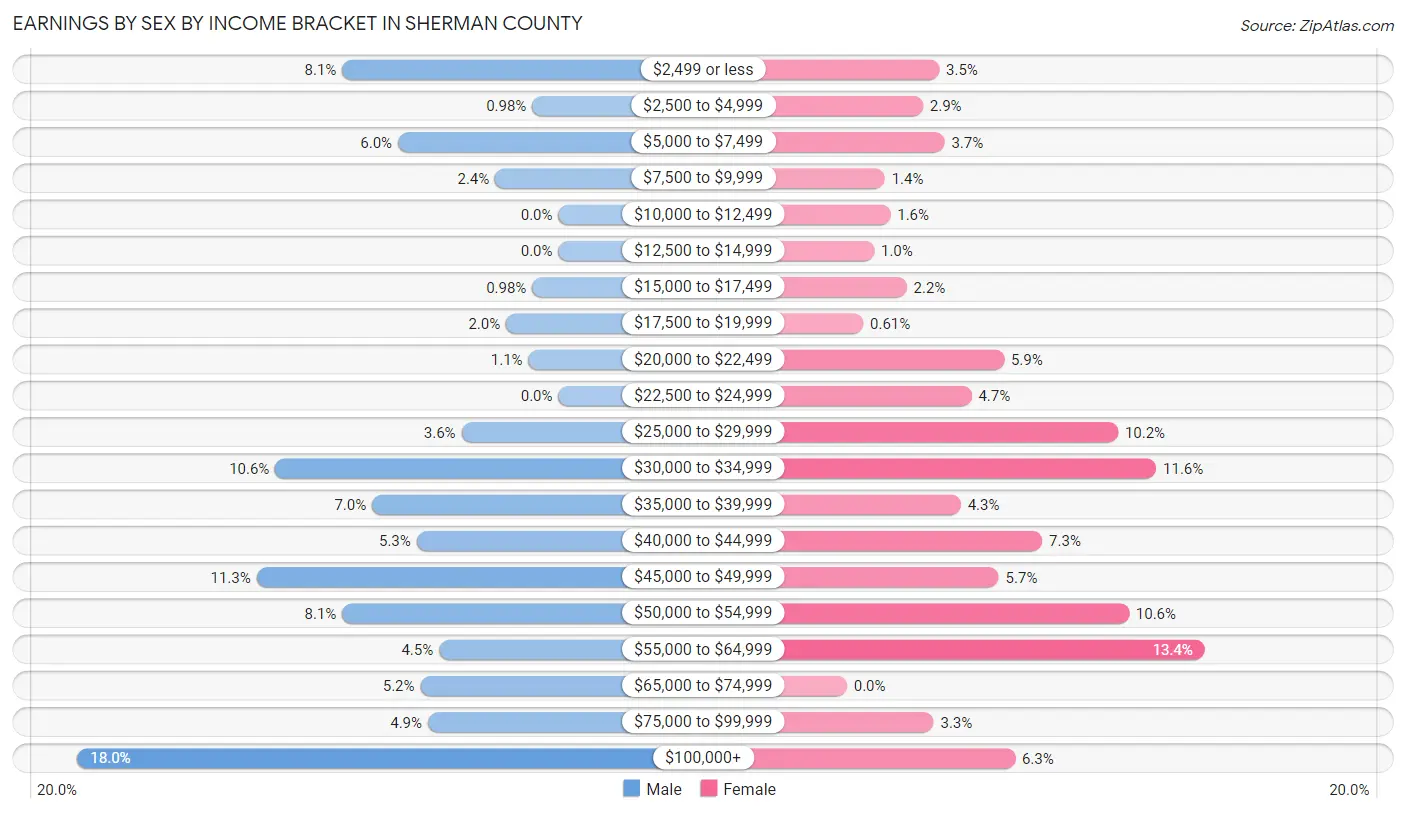
Earnings by Sex by Income Bracket in Sherman County
The most common earnings brackets in Sherman County are $100,000+ for men (129 | 18.0%) and $55,000 to $64,999 for women (66 | 13.4%).
| Income | Male | Female |
| $2,499 or less | 58 (8.1%) | 17 (3.5%) |
| $2,500 to $4,999 | 7 (1.0%) | 14 (2.9%) |
| $5,000 to $7,499 | 43 (6.0%) | 18 (3.7%) |
| $7,500 to $9,999 | 17 (2.4%) | 7 (1.4%) |
| $10,000 to $12,499 | 0 (0.0%) | 8 (1.6%) |
| $12,500 to $14,999 | 0 (0.0%) | 5 (1.0%) |
| $15,000 to $17,499 | 7 (1.0%) | 11 (2.2%) |
| $17,500 to $19,999 | 14 (2.0%) | 3 (0.6%) |
| $20,000 to $22,499 | 8 (1.1%) | 29 (5.9%) |
| $22,500 to $24,999 | 0 (0.0%) | 23 (4.7%) |
| $25,000 to $29,999 | 26 (3.6%) | 50 (10.2%) |
| $30,000 to $34,999 | 76 (10.6%) | 57 (11.6%) |
| $35,000 to $39,999 | 50 (7.0%) | 21 (4.3%) |
| $40,000 to $44,999 | 38 (5.3%) | 36 (7.3%) |
| $45,000 to $49,999 | 81 (11.3%) | 28 (5.7%) |
| $50,000 to $54,999 | 58 (8.1%) | 52 (10.6%) |
| $55,000 to $64,999 | 32 (4.5%) | 66 (13.4%) |
| $65,000 to $74,999 | 37 (5.2%) | 0 (0.0%) |
| $75,000 to $99,999 | 35 (4.9%) | 16 (3.3%) |
| $100,000+ | 129 (18.0%) | 31 (6.3%) |
| Total | 716 (100.0%) | 492 (100.0%) |
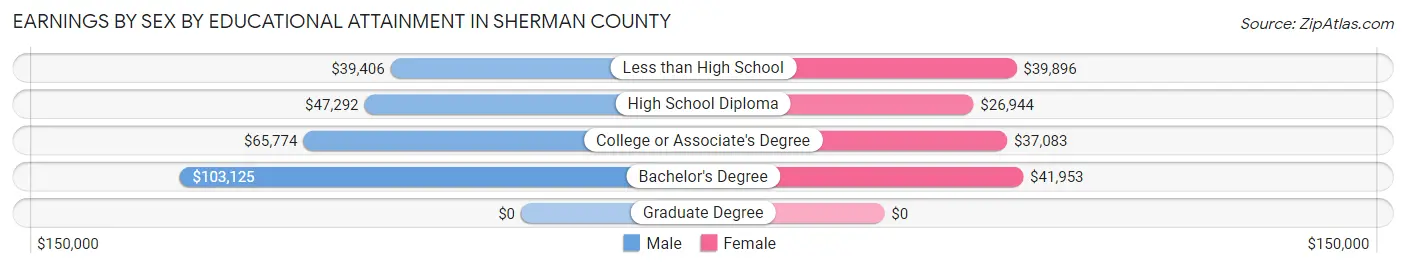
Earnings by Sex by Educational Attainment in Sherman County
Average earnings in Sherman County are $50,056 for men and $41,076 for women, a difference of 17.9%. Men with an educational attainment of bachelor's degree enjoy the highest average annual earnings of $103,125, while those with less than high school education earn the least with $39,406. Women with an educational attainment of bachelor's degree earn the most with the average annual earnings of $41,953, while those with high school diploma education have the smallest earnings of $26,944.
| Educational Attainment | Male Income | Female Income |
| Less than High School | $39,406 | $39,896 |
| High School Diploma | $47,292 | $26,944 |
| College or Associate's Degree | $65,774 | $37,083 |
| Bachelor's Degree | $103,125 | $41,953 |
| Graduate Degree | - | - |
| Total | $50,056 | $41,076 |
Family Income in Sherman County
Family Income Brackets in Sherman County
According to the Sherman County family income data, there are 121 families falling into the $75,000 to $99,999 income range, which is the most common income bracket and makes up 20.1% of all families.
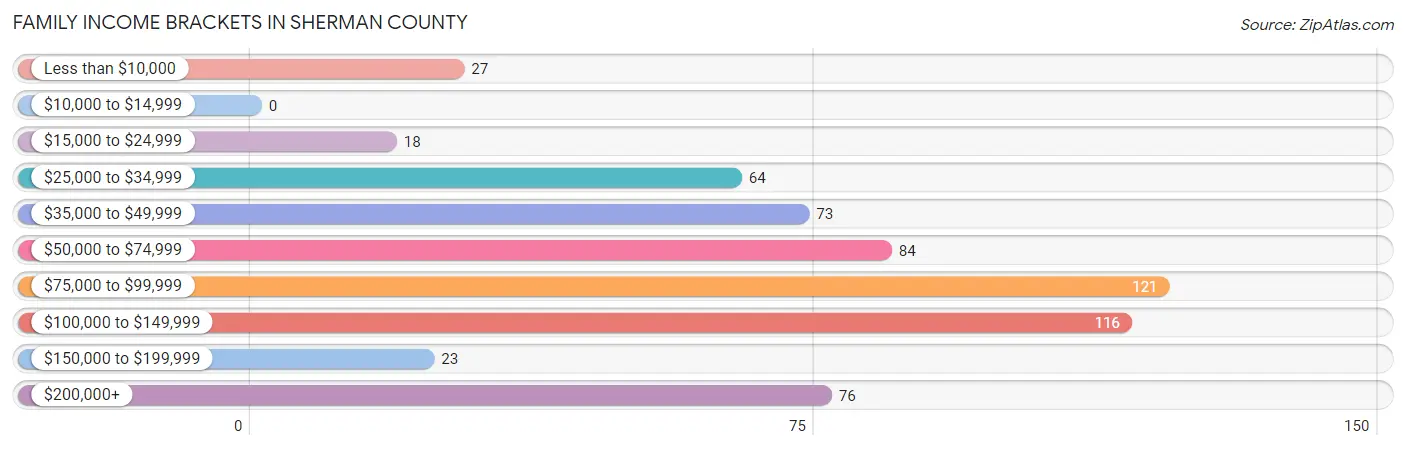
| Income Bracket | # Families | % Families |
| Less than $10,000 | 27 | 4.5% |
| $10,000 to $14,999 | 0 | 0.0% |
| $15,000 to $24,999 | 18 | 3.0% |
| $25,000 to $34,999 | 64 | 10.6% |
| $35,000 to $49,999 | 73 | 12.1% |
| $50,000 to $74,999 | 84 | 14.0% |
| $75,000 to $99,999 | 121 | 20.1% |
| $100,000 to $149,999 | 116 | 19.3% |
| $150,000 to $199,999 | 23 | 3.8% |
| $200,000+ | 76 | 12.6% |
Family Income by Famaliy Size in Sherman County
5-person families (57 | 9.5%) account for the highest median family income in Sherman County with $102,548 per family, while 2-person families (246 | 40.9%) have the highest median income of $37,500 per family member.
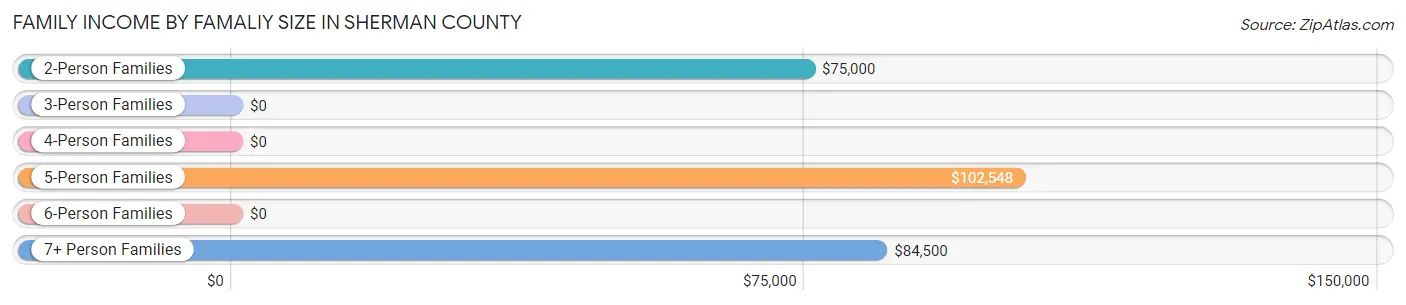
| Income Bracket | # Families | Median Income |
| 2-Person Families | 246 (40.9%) | $75,000 |
| 3-Person Families | 127 (21.1%) | $0 |
| 4-Person Families | 120 (19.9%) | $0 |
| 5-Person Families | 57 (9.5%) | $102,548 |
| 6-Person Families | 0 (0.0%) | $0 |
| 7+ Person Families | 52 (8.6%) | $84,500 |
| Total | 602 (100.0%) | $83,158 |
Family Income by Number of Earners in Sherman County
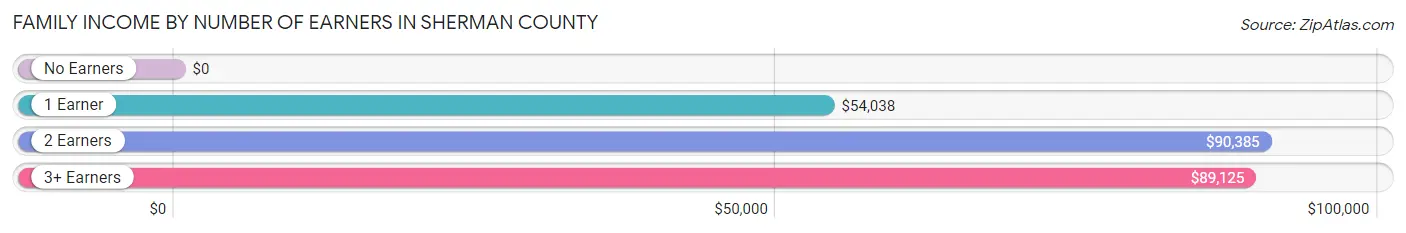
| Number of Earners | # Families | Median Income |
| No Earners | 66 (11.0%) | $0 |
| 1 Earner | 182 (30.2%) | $54,038 |
| 2 Earners | 298 (49.5%) | $90,385 |
| 3+ Earners | 56 (9.3%) | $89,125 |
| Total | 602 (100.0%) | $83,158 |
Household Income in Sherman County
Household Income Brackets in Sherman County
With 145 households falling in the category, the $100,000 to $149,999 income range is the most frequent in Sherman County, accounting for 18.1% of all households. In contrast, only 9 households (1.1%) fall into the $10,000 to $14,999 income bracket, making it the least populous group.
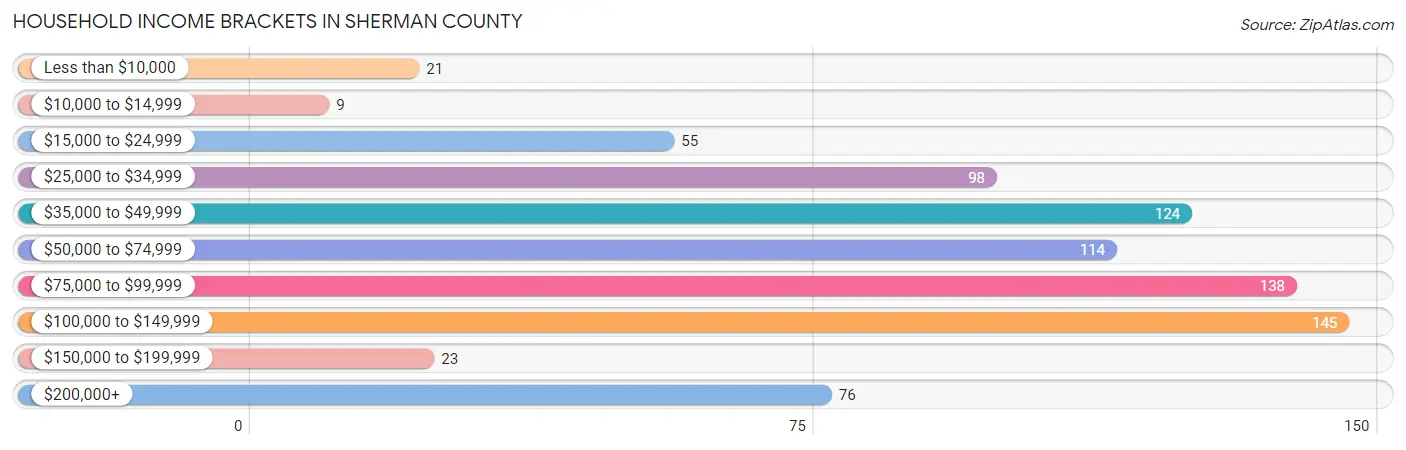
| Income Bracket | # Households | % Households |
| Less than $10,000 | 21 | 2.6% |
| $10,000 to $14,999 | 9 | 1.1% |
| $15,000 to $24,999 | 55 | 6.8% |
| $25,000 to $34,999 | 98 | 12.2% |
| $35,000 to $49,999 | 124 | 15.4% |
| $50,000 to $74,999 | 114 | 14.2% |
| $75,000 to $99,999 | 138 | 17.2% |
| $100,000 to $149,999 | 145 | 18.1% |
| $150,000 to $199,999 | 23 | 2.9% |
| $200,000+ | 76 | 9.5% |
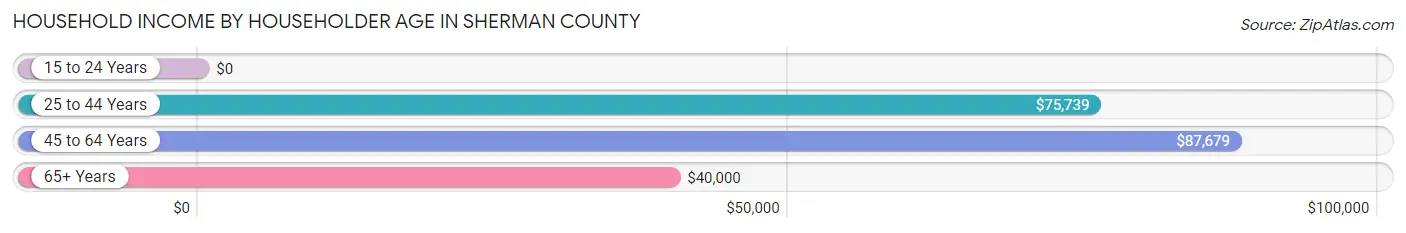
Household Income by Householder Age in Sherman County
The median household income in Sherman County is $66,169, with the highest median household income of $87,679 found in the 45 to 64 years age bracket for the primary householder. A total of 326 households (40.6%) fall into this category. Meanwhile, the 15 to 24 years age bracket for the primary householder has the lowest median household income of $0, with 2 households (0.3%) in this group.
| Income Bracket | # Households | Median Income |
| 15 to 24 Years | 2 (0.3%) | $0 |
| 25 to 44 Years | 269 (33.5%) | $75,739 |
| 45 to 64 Years | 326 (40.6%) | $87,679 |
| 65+ Years | 206 (25.7%) | $40,000 |
| Total | 803 (100.0%) | $66,169 |
Poverty in Sherman County
Income Below Poverty by Sex and Age in Sherman County
With 7.6% poverty level for males and 9.0% for females among the residents of Sherman County, 6 to 11 year old males and under 5 year old females are the most vulnerable to poverty, with 27 males (24.8%) and 28 females (23.1%) in their respective age groups living below the poverty level.
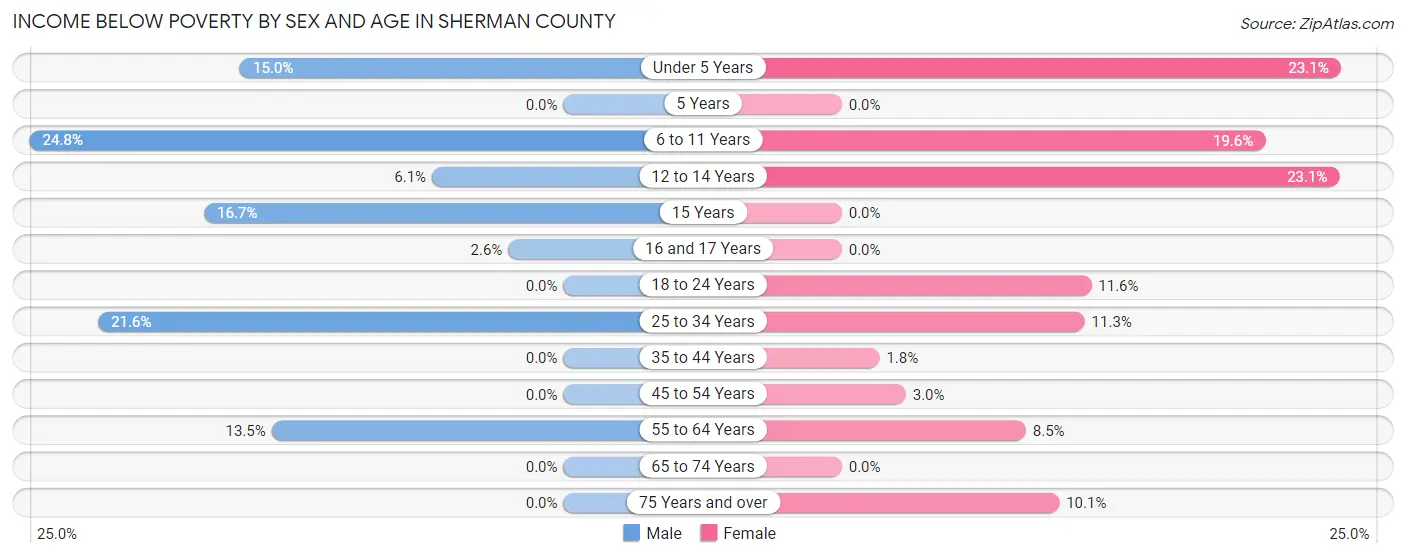
| Age Bracket | Male | Female |
| Under 5 Years | 3 (15.0%) | 28 (23.1%) |
| 5 Years | 0 (0.0%) | 0 (0.0%) |
| 6 to 11 Years | 27 (24.8%) | 11 (19.6%) |
| 12 to 14 Years | 5 (6.1%) | 9 (23.1%) |
| 15 Years | 3 (16.7%) | 0 (0.0%) |
| 16 and 17 Years | 1 (2.6%) | 0 (0.0%) |
| 18 to 24 Years | 0 (0.0%) | 11 (11.6%) |
| 25 to 34 Years | 19 (21.6%) | 16 (11.3%) |
| 35 to 44 Years | 0 (0.0%) | 3 (1.8%) |
| 45 to 54 Years | 0 (0.0%) | 3 (3.0%) |
| 55 to 64 Years | 31 (13.5%) | 17 (8.5%) |
| 65 to 74 Years | 0 (0.0%) | 0 (0.0%) |
| 75 Years and over | 0 (0.0%) | 11 (10.1%) |
| Total | 89 (7.6%) | 109 (9.0%) |
Income Above Poverty by Sex and Age in Sherman County
According to the poverty statistics in Sherman County, males aged 18 to 24 years and females aged 5 years are the age groups that are most secure financially, with 100.0% of males and 100.0% of females in these age groups living above the poverty line.
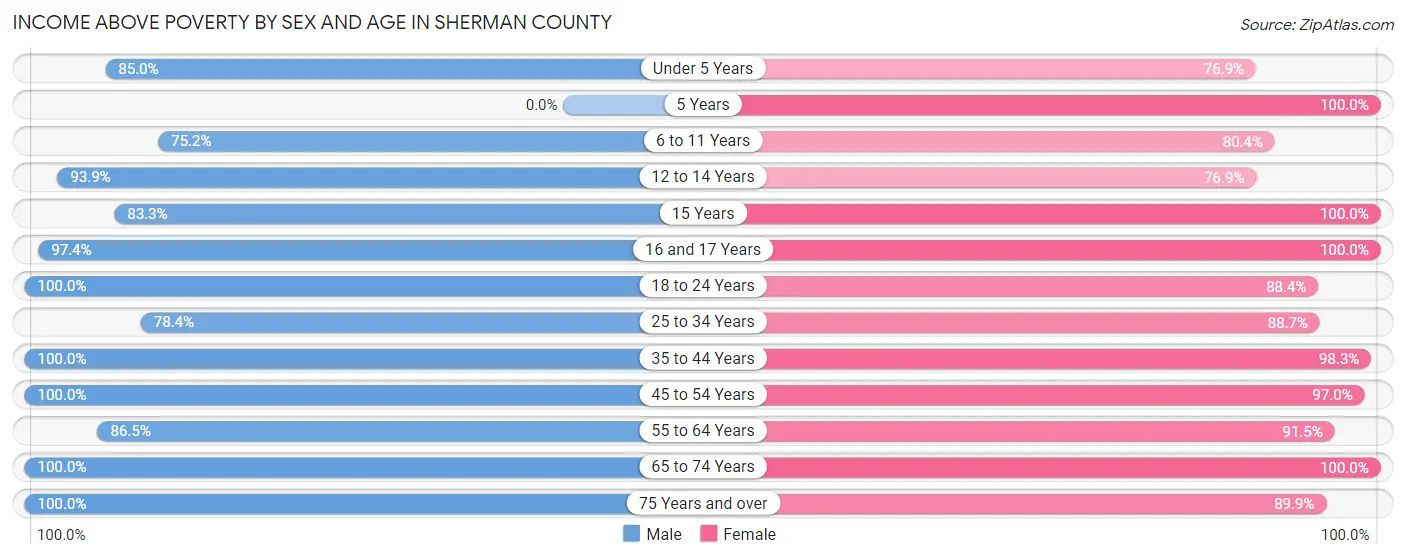
| Age Bracket | Male | Female |
| Under 5 Years | 17 (85.0%) | 93 (76.9%) |
| 5 Years | 0 (0.0%) | 13 (100.0%) |
| 6 to 11 Years | 82 (75.2%) | 45 (80.4%) |
| 12 to 14 Years | 77 (93.9%) | 30 (76.9%) |
| 15 Years | 15 (83.3%) | 30 (100.0%) |
| 16 and 17 Years | 38 (97.4%) | 35 (100.0%) |
| 18 to 24 Years | 177 (100.0%) | 84 (88.4%) |
| 25 to 34 Years | 69 (78.4%) | 126 (88.7%) |
| 35 to 44 Years | 121 (100.0%) | 168 (98.3%) |
| 45 to 54 Years | 123 (100.0%) | 98 (97.0%) |
| 55 to 64 Years | 198 (86.5%) | 182 (91.5%) |
| 65 to 74 Years | 99 (100.0%) | 100 (100.0%) |
| 75 Years and over | 64 (100.0%) | 98 (89.9%) |
| Total | 1,080 (92.4%) | 1,102 (91.0%) |
Income Below Poverty Among Married-Couple Families in Sherman County
The poverty statistics for married-couple families in Sherman County show that 3.7% or 19 of the total 508 families live below the poverty line. Families with 5 or more children have the highest poverty rate of 100.0%, comprising of 2 families. On the other hand, families with 1 or 2 children have the lowest poverty rate of 0.0%, which includes 0 families.
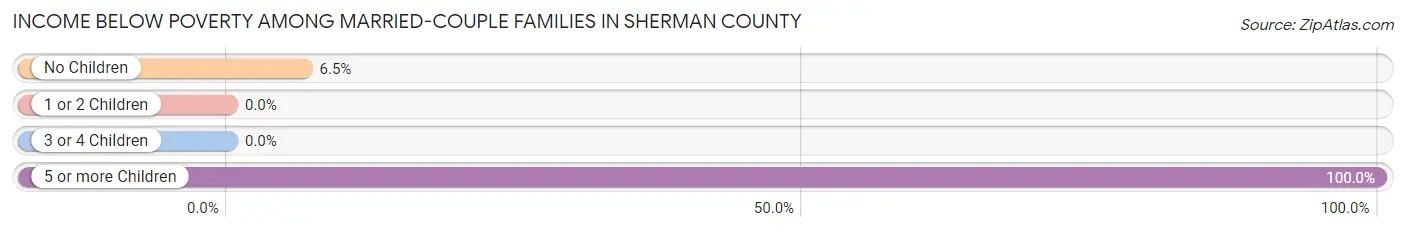
| Children | Above Poverty | Below Poverty |
| No Children | 245 (93.5%) | 17 (6.5%) |
| 1 or 2 Children | 166 (100.0%) | 0 (0.0%) |
| 3 or 4 Children | 78 (100.0%) | 0 (0.0%) |
| 5 or more Children | 0 (0.0%) | 2 (100.0%) |
| Total | 489 (96.3%) | 19 (3.7%) |
Income Below Poverty Among Single-Parent Households in Sherman County
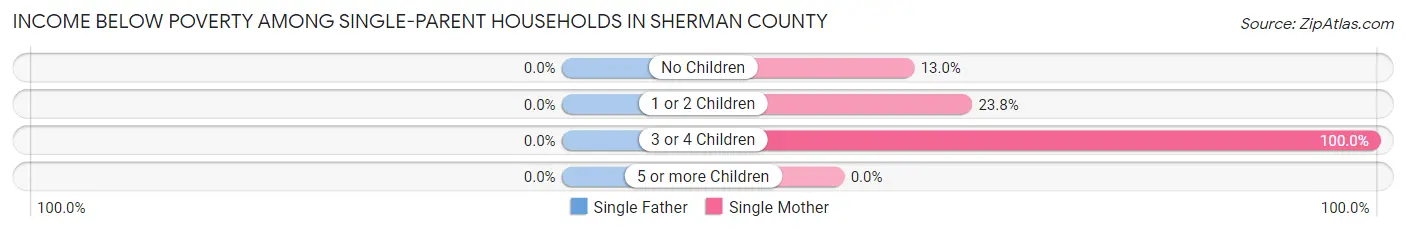
| Children | Single Father | Single Mother |
| No Children | 0 (0.0%) | 3 (13.0%) |
| 1 or 2 Children | 0 (0.0%) | 10 (23.8%) |
| 3 or 4 Children | 0 (0.0%) | 7 (100.0%) |
| 5 or more Children | 0 (0.0%) | 0 (0.0%) |
| Total | 0 (0.0%) | 20 (27.8%) |
Income Below Poverty Among Married-Couple vs Single-Parent Households in Sherman County
The poverty data for Sherman County shows that 19 of the married-couple family households (3.7%) and 20 of the single-parent households (21.3%) are living below the poverty level. Within the married-couple family households, those with 5 or more children have the highest poverty rate, with 2 households (100.0%) falling below the poverty line. Among the single-parent households, those with 3 or 4 children have the highest poverty rate, with 7 household (100.0%) living below poverty.
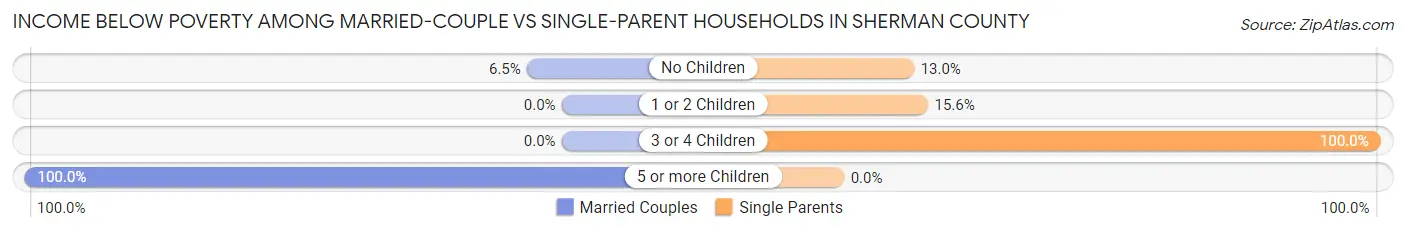
| Children | Married-Couple Families | Single-Parent Households |
| No Children | 17 (6.5%) | 3 (13.0%) |
| 1 or 2 Children | 0 (0.0%) | 10 (15.6%) |
| 3 or 4 Children | 0 (0.0%) | 7 (100.0%) |
| 5 or more Children | 2 (100.0%) | 0 (0.0%) |
| Total | 19 (3.7%) | 20 (21.3%) |
Race in Sherman County
The most populous races in Sherman County are White / Caucasian (1,858 | 77.0%), Hispanic or Latino (1,034 | 42.8%), and Two or more Races (342 | 14.2%).
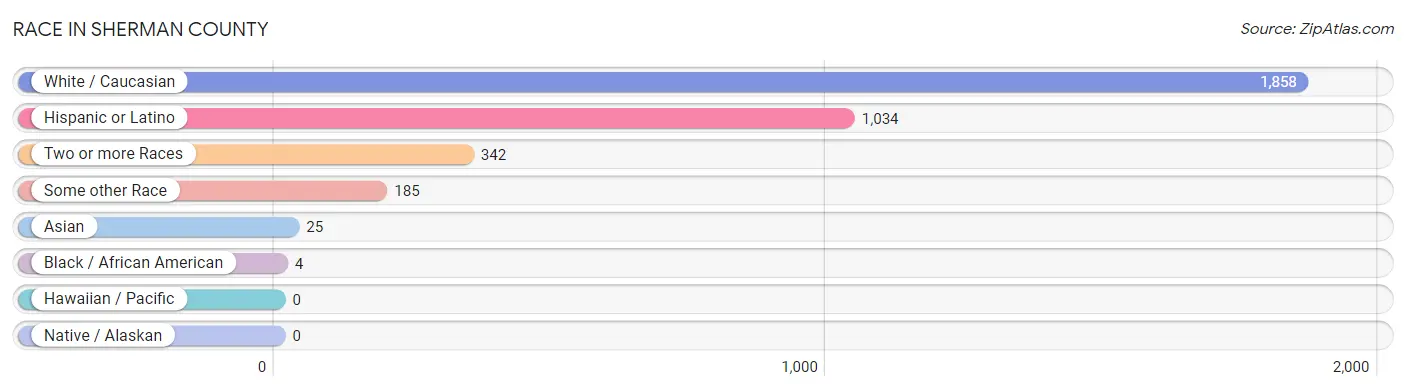
| Race | # Population | % Population |
| Asian | 25 | 1.0% |
| Black / African American | 4 | 0.2% |
| Hawaiian / Pacific | 0 | 0.0% |
| Hispanic or Latino | 1,034 | 42.8% |
| Native / Alaskan | 0 | 0.0% |
| White / Caucasian | 1,858 | 77.0% |
| Two or more Races | 342 | 14.2% |
| Some other Race | 185 | 7.7% |
| Total | 2,414 | 100.0% |
Ancestry in Sherman County
The most populous ancestries reported in Sherman County are Mexican (958 | 39.7%), German (366 | 15.2%), Irish (235 | 9.7%), American (169 | 7.0%), and English (144 | 6.0%), together accounting for 77.5% of all Sherman County residents.
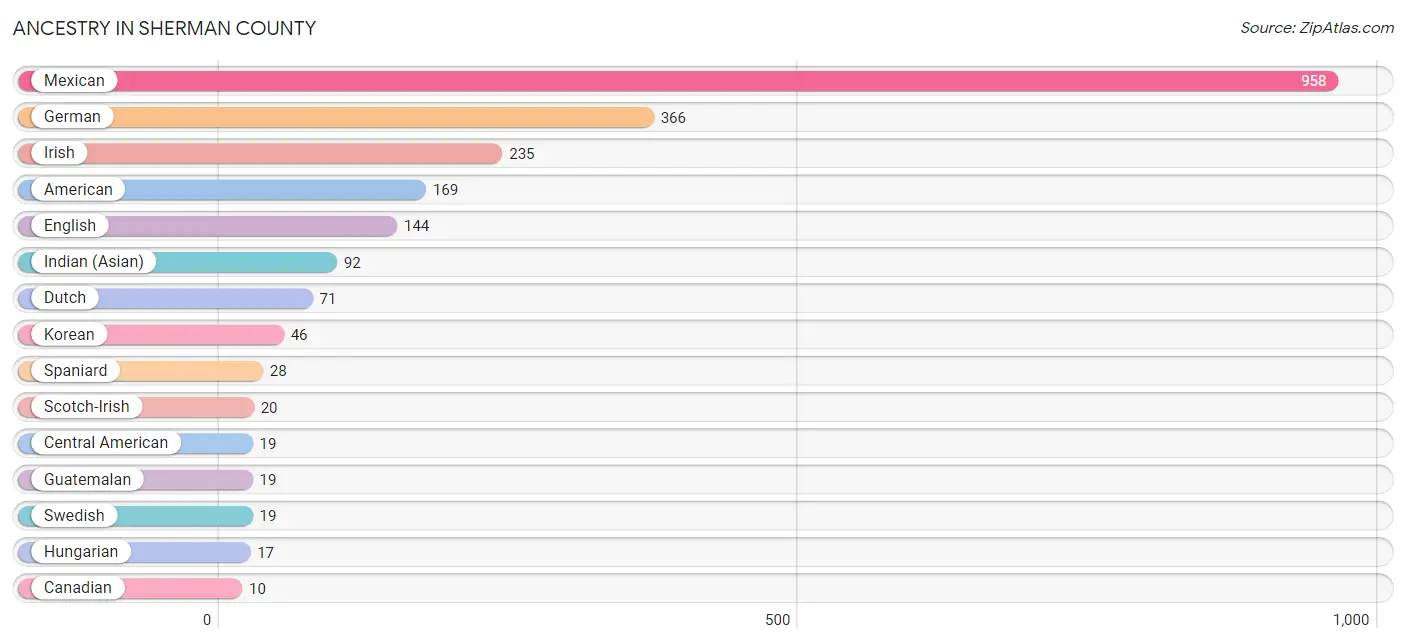
| Ancestry | # Population | % Population |
| American | 169 | 7.0% |
| Austrian | 8 | 0.3% |
| Belizean | 2 | 0.1% |
| British | 3 | 0.1% |
| Canadian | 10 | 0.4% |
| Central American | 19 | 0.8% |
| Dutch | 71 | 2.9% |
| English | 144 | 6.0% |
| European | 8 | 0.3% |
| German | 366 | 15.2% |
| Guatemalan | 19 | 0.8% |
| Hungarian | 17 | 0.7% |
| Indian (Asian) | 92 | 3.8% |
| Irish | 235 | 9.7% |
| Italian | 5 | 0.2% |
| Korean | 46 | 1.9% |
| Mexican | 958 | 39.7% |
| Polish | 3 | 0.1% |
| Russian | 4 | 0.2% |
| Scotch-Irish | 20 | 0.8% |
| Scottish | 4 | 0.2% |
| Serbian | 4 | 0.2% |
| South American | 8 | 0.3% |
| Spaniard | 28 | 1.2% |
| Swedish | 19 | 0.8% |
| Swiss | 3 | 0.1% |
| Venezuelan | 8 | 0.3% | View All 27 Rows |
Immigrants in Sherman County
The most numerous immigrant groups reported in Sherman County came from Latin America (404 | 16.7%), Central America (396 | 16.4%), Mexico (388 | 16.1%), Asia (25 | 1.0%), and Philippines (25 | 1.0%), together accounting for 51.3% of all Sherman County residents.
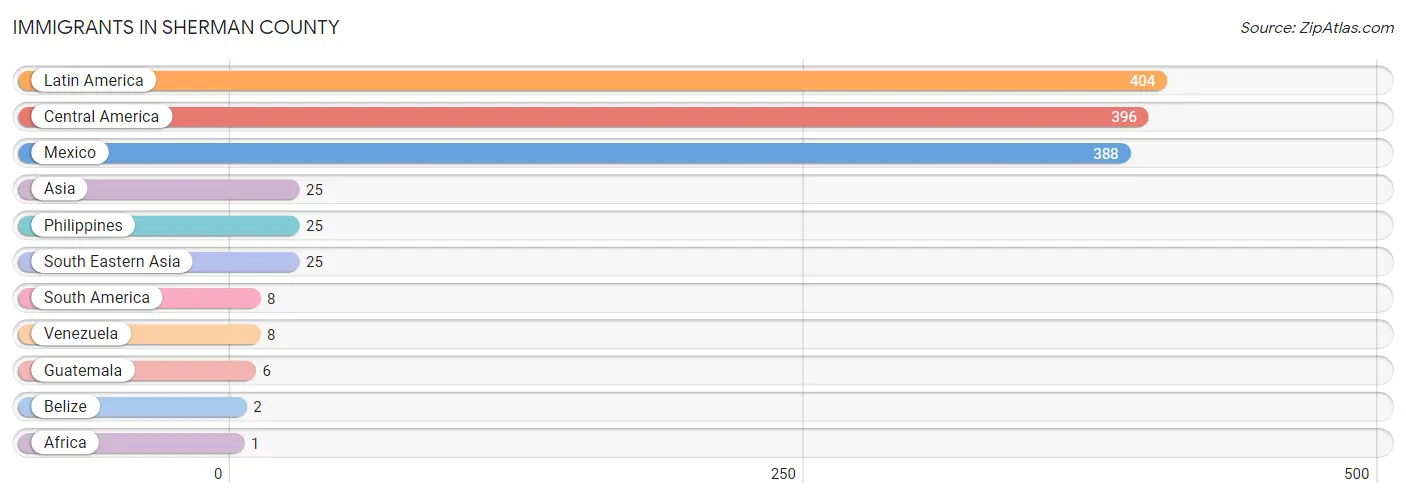
| Immigration Origin | # Population | % Population |
| Africa | 1 | 0.0% |
| Asia | 25 | 1.0% |
| Belize | 2 | 0.1% |
| Central America | 396 | 16.4% |
| Guatemala | 6 | 0.3% |
| Latin America | 404 | 16.7% |
| Mexico | 388 | 16.1% |
| Philippines | 25 | 1.0% |
| South America | 8 | 0.3% |
| South Eastern Asia | 25 | 1.0% |
| Venezuela | 8 | 0.3% | View All 11 Rows |
Sex and Age in Sherman County
Sex and Age in Sherman County
The most populous age groups in Sherman County are 15 to 19 Years (139 | 11.7%) for men and 35 to 39 Years (145 | 11.8%) for women.
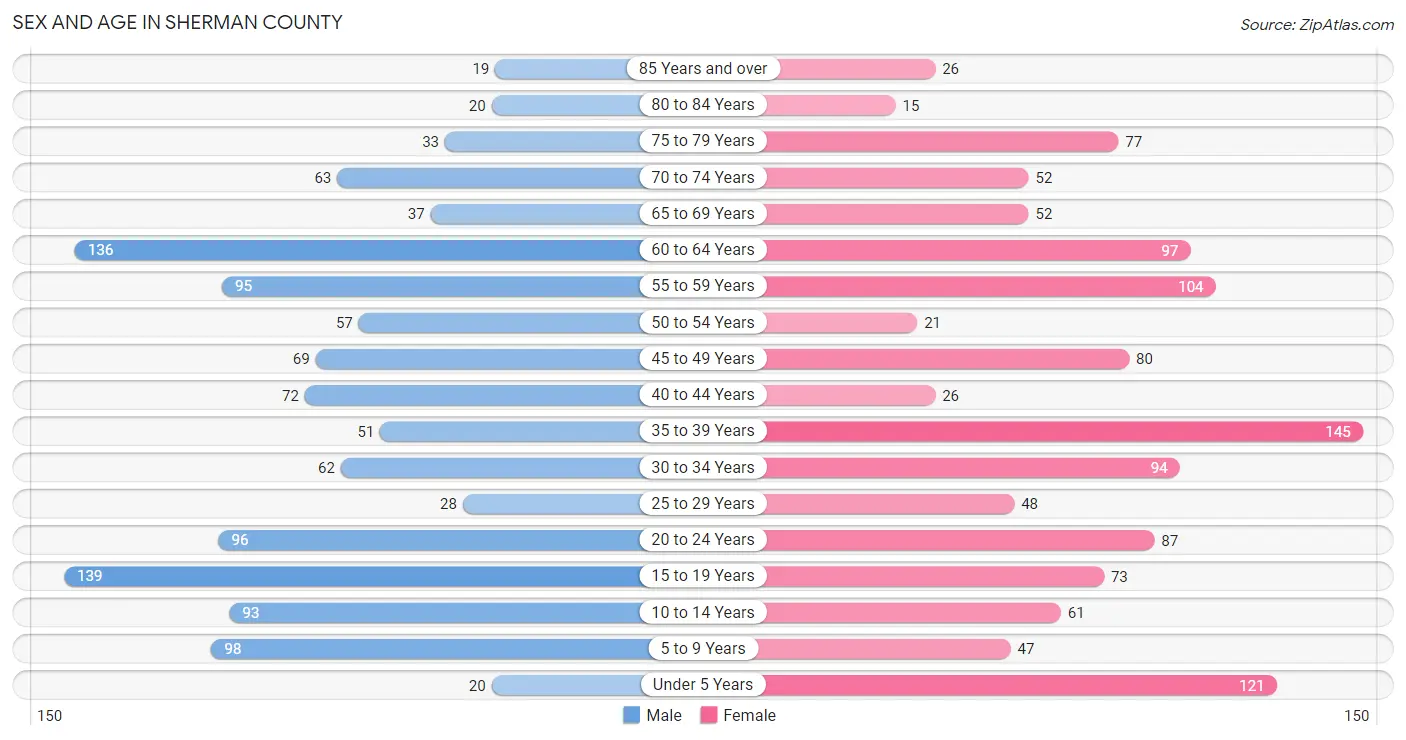
| Age Bracket | Male | Female |
| Under 5 Years | 20 (1.7%) | 121 (9.9%) |
| 5 to 9 Years | 98 (8.3%) | 47 (3.8%) |
| 10 to 14 Years | 93 (7.8%) | 61 (5.0%) |
| 15 to 19 Years | 139 (11.7%) | 73 (5.9%) |
| 20 to 24 Years | 96 (8.1%) | 87 (7.1%) |
| 25 to 29 Years | 28 (2.4%) | 48 (3.9%) |
| 30 to 34 Years | 62 (5.2%) | 94 (7.7%) |
| 35 to 39 Years | 51 (4.3%) | 145 (11.8%) |
| 40 to 44 Years | 72 (6.1%) | 26 (2.1%) |
| 45 to 49 Years | 69 (5.8%) | 80 (6.5%) |
| 50 to 54 Years | 57 (4.8%) | 21 (1.7%) |
| 55 to 59 Years | 95 (8.0%) | 104 (8.5%) |
| 60 to 64 Years | 136 (11.5%) | 97 (7.9%) |
| 65 to 69 Years | 37 (3.1%) | 52 (4.2%) |
| 70 to 74 Years | 63 (5.3%) | 52 (4.2%) |
| 75 to 79 Years | 33 (2.8%) | 77 (6.3%) |
| 80 to 84 Years | 20 (1.7%) | 15 (1.2%) |
| 85 Years and over | 19 (1.6%) | 26 (2.1%) |
| Total | 1,188 (100.0%) | 1,226 (100.0%) |
Families and Households in Sherman County
Median Family Size in Sherman County
The median family size in Sherman County is 3.58 persons per family, with single female/mother families (72 | 12.0%) accounting for the largest median family size of 3.93 persons per family. On the other hand, single male/father families (22 | 3.6%) represent the smallest median family size with 2.77 persons per family.
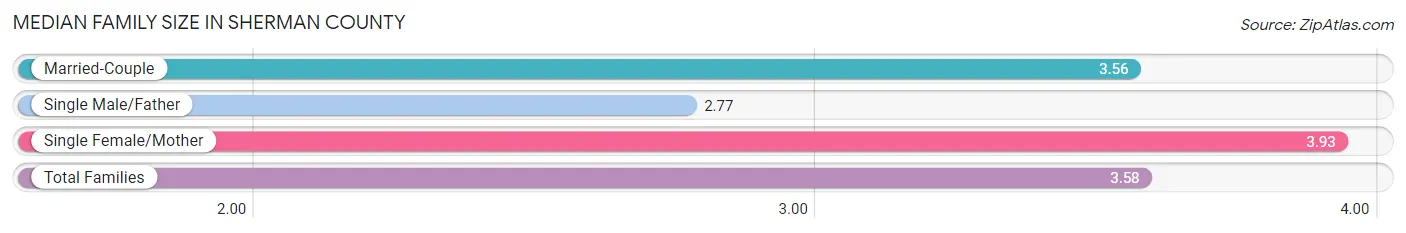
| Family Type | # Families | Family Size |
| Married-Couple | 508 (84.4%) | 3.56 |
| Single Male/Father | 22 (3.6%) | 2.77 |
| Single Female/Mother | 72 (12.0%) | 3.93 |
| Total Families | 602 (100.0%) | 3.58 |
Median Household Size in Sherman County
The median household size in Sherman County is 2.96 persons per household, with single female/mother households (72 | 9.0%) accounting for the largest median household size of 4.07 persons per household. non-family households (201 | 25.0%) represent the smallest median household size with 1.08 persons per household.
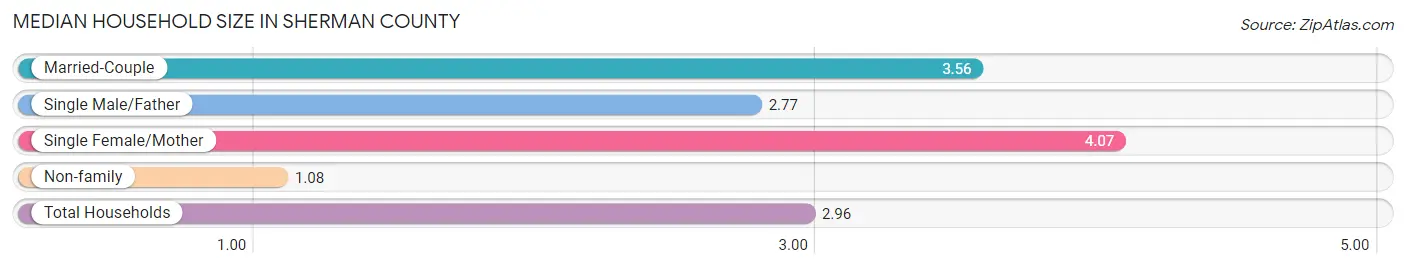
| Household Type | # Households | Household Size |
| Married-Couple | 508 (63.3%) | 3.56 |
| Single Male/Father | 22 (2.7%) | 2.77 |
| Single Female/Mother | 72 (9.0%) | 4.07 |
| Non-family | 201 (25.0%) | 1.08 |
| Total Households | 803 (100.0%) | 2.96 |
Household Size by Marriage Status in Sherman County
Out of a total of 803 households in Sherman County, 602 (75.0%) are family households, while 201 (25.0%) are nonfamily households. The most numerous type of family households are 2-person households, comprising 239, and the most common type of nonfamily households are 1-person households, comprising 172.
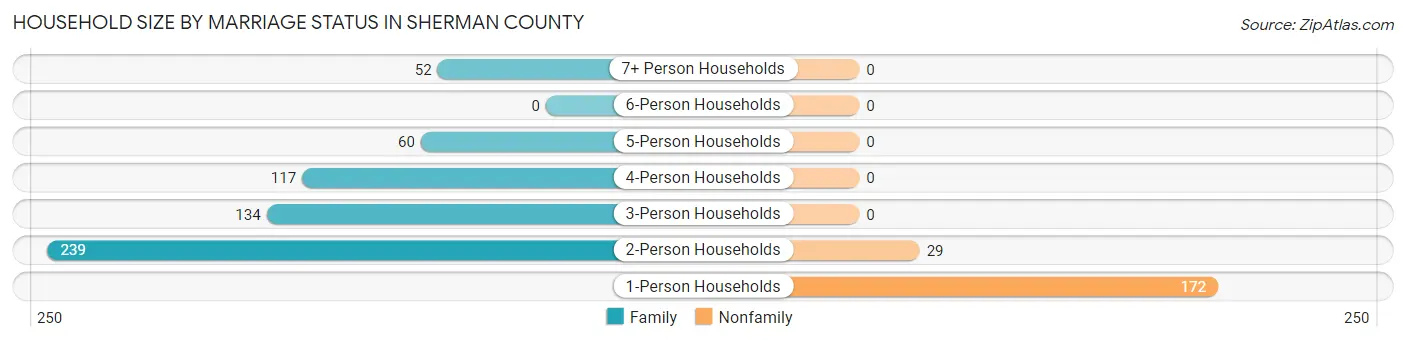
| Household Size | Family Households | Nonfamily Households |
| 1-Person Households | - | 172 (21.4%) |
| 2-Person Households | 239 (29.8%) | 29 (3.6%) |
| 3-Person Households | 134 (16.7%) | 0 (0.0%) |
| 4-Person Households | 117 (14.6%) | 0 (0.0%) |
| 5-Person Households | 60 (7.5%) | 0 (0.0%) |
| 6-Person Households | 0 (0.0%) | 0 (0.0%) |
| 7+ Person Households | 52 (6.5%) | 0 (0.0%) |
| Total | 602 (75.0%) | 201 (25.0%) |
Female Fertility in Sherman County
Fertility by Age in Sherman County
Average fertility rate in Sherman County is 80.0 births per 1,000 women. Women in the age bracket of 20 to 34 years have the highest fertility rate with 192.0 births per 1,000 women. Women in the age bracket of 20 to 34 years acount for 100.0% of all women with births.
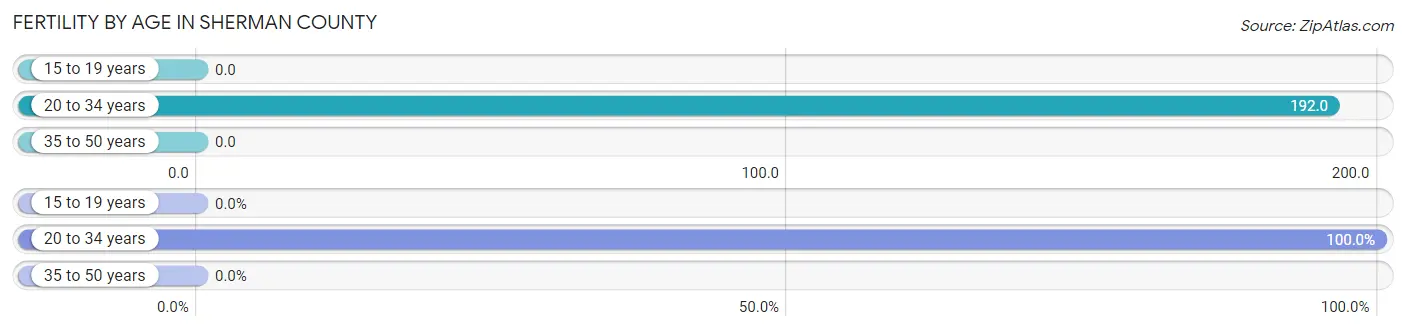
| Age Bracket | Women with Births | Births / 1,000 Women |
| 15 to 19 years | 0 (0.0%) | 0.0 |
| 20 to 34 years | 44 (100.0%) | 192.0 |
| 35 to 50 years | 0 (0.0%) | 0.0 |
| Total | 44 (100.0%) | 80.0 |
Fertility by Age by Marriage Status in Sherman County
29.5% of women with births (44) in Sherman County are married. The highest percentage of unmarried women with births falls into 20 to 34 years age bracket with 70.5% of them unmarried at the time of birth, while the lowest percentage of unmarried women with births belong to 20 to 34 years age bracket with 70.5% of them unmarried.
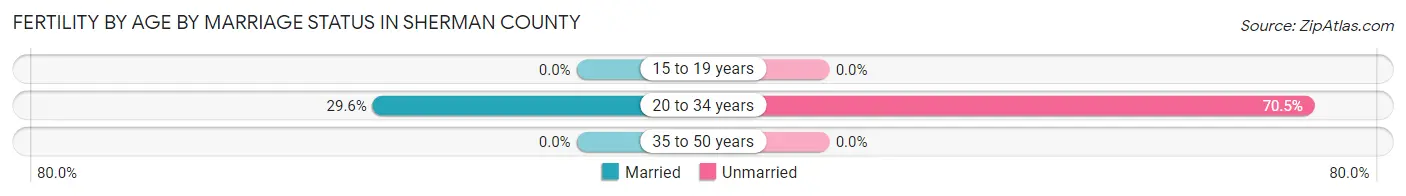
| Age Bracket | Married | Unmarried |
| 15 to 19 years | 0 (0.0%) | 0 (0.0%) |
| 20 to 34 years | 13 (29.5%) | 31 (70.5%) |
| 35 to 50 years | 0 (0.0%) | 0 (0.0%) |
| Total | 13 (29.5%) | 31 (70.5%) |
Fertility by Education in Sherman County
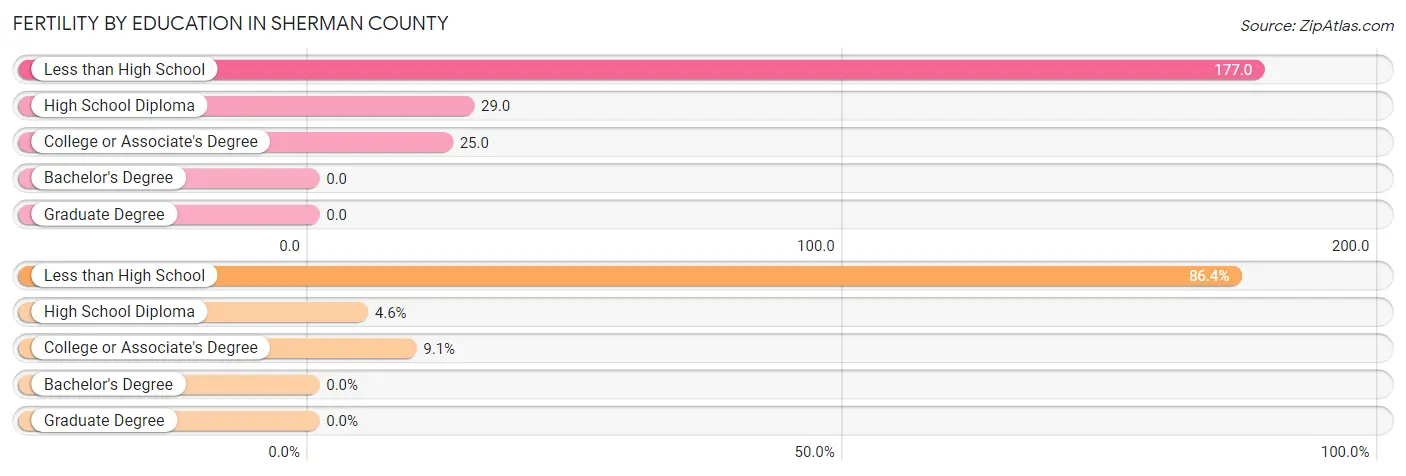
| Educational Attainment | Women with Births | Births / 1,000 Women |
| Less than High School | 38 (86.4%) | 177.0 |
| High School Diploma | 2 (4.5%) | 29.0 |
| College or Associate's Degree | 4 (9.1%) | 25.0 |
| Bachelor's Degree | 0 (0.0%) | 0.0 |
| Graduate Degree | 0 (0.0%) | 0.0 |
| Total | 44 (100.0%) | 80.0 |
Fertility by Education by Marriage Status in Sherman County
70.5% of women with births in Sherman County are unmarried. Women with the educational attainment of high school diploma are most likely to be married with 100.0% of them married at childbirth, while women with the educational attainment of less than high school are least likely to be married with 81.6% of them unmarried at childbirth.
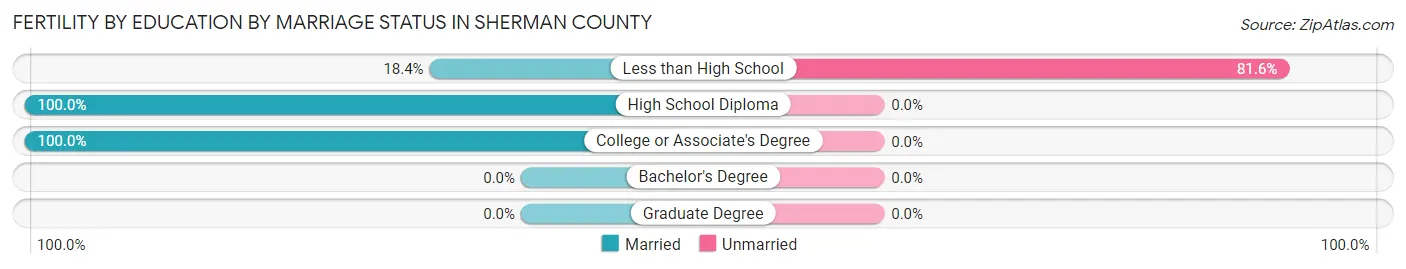
| Educational Attainment | Married | Unmarried |
| Less than High School | 7 (18.4%) | 31 (81.6%) |
| High School Diploma | 2 (100.0%) | 0 (0.0%) |
| College or Associate's Degree | 4 (100.0%) | 0 (0.0%) |
| Bachelor's Degree | 0 (0.0%) | 0 (0.0%) |
| Graduate Degree | 0 (0.0%) | 0 (0.0%) |
| Total | 13 (29.5%) | 31 (70.5%) |
Employment Characteristics in Sherman County
Employment by Class of Employer in Sherman County
Among the 1,116 employed individuals in Sherman County, private company employees (597 | 53.5%), self-employed (not incorporated) (267 | 23.9%), and local government employees (156 | 14.0%) make up the most common classes of employment.
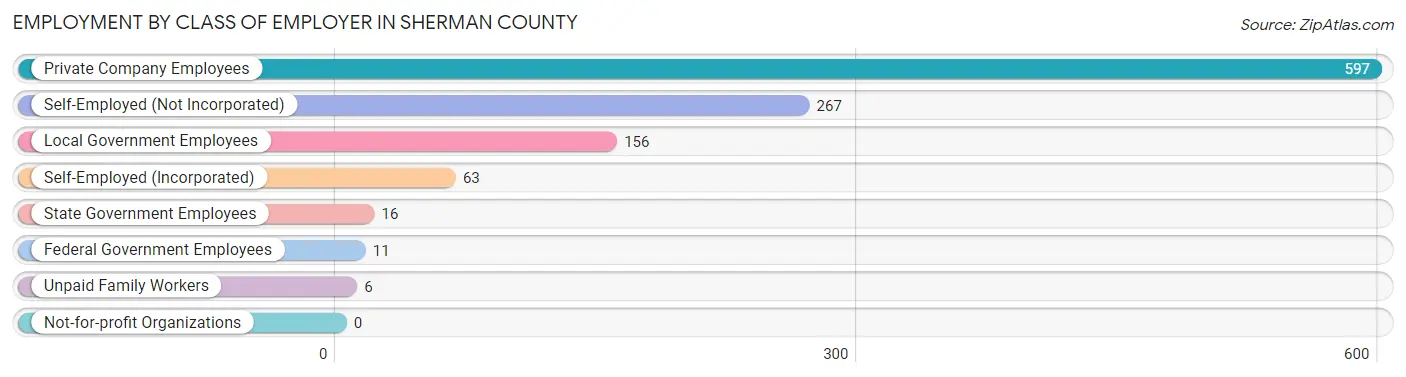
| Employer Class | # Employees | % Employees |
| Private Company Employees | 597 | 53.5% |
| Self-Employed (Incorporated) | 63 | 5.7% |
| Self-Employed (Not Incorporated) | 267 | 23.9% |
| Not-for-profit Organizations | 0 | 0.0% |
| Local Government Employees | 156 | 14.0% |
| State Government Employees | 16 | 1.4% |
| Federal Government Employees | 11 | 1.0% |
| Unpaid Family Workers | 6 | 0.5% |
| Total | 1,116 | 100.0% |
Employment Status by Age in Sherman County
According to the labor force statistics for Sherman County, out of the total population over 16 years of age (1,926), 61.2% or 1,179 individuals are in the labor force, with 1.5% or 18 of them unemployed. The age group with the highest labor force participation rate is 30 to 34 years, with 85.3% or 133 individuals in the labor force. Within the labor force, the 16 to 19 years age range has the highest percentage of unemployed individuals, with 20.5% or 18 of them being unemployed.
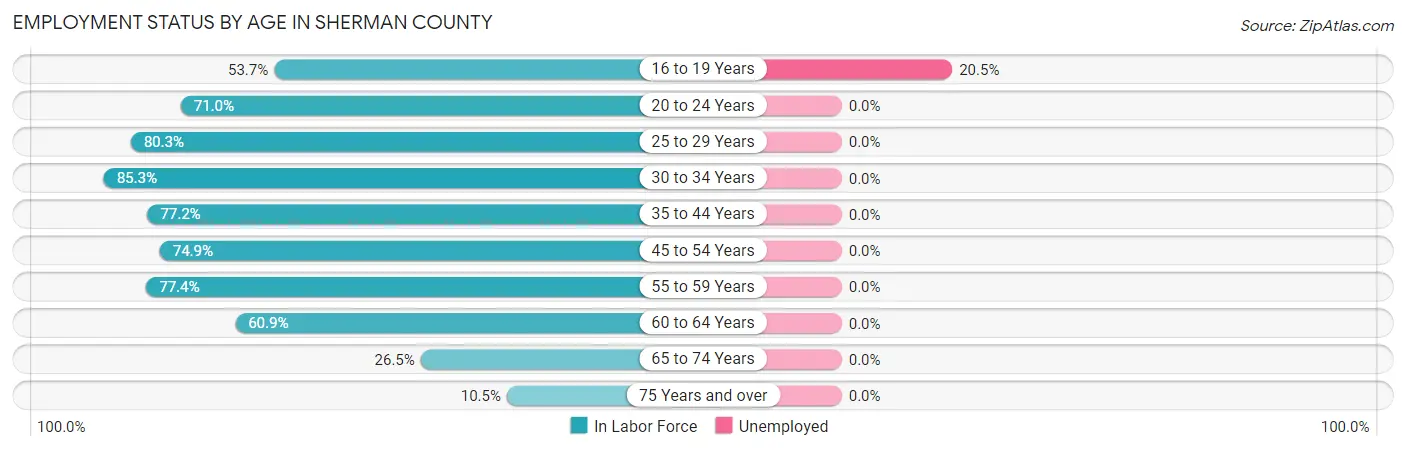
| Age Bracket | In Labor Force | Unemployed |
| 16 to 19 Years | 88 (53.7%) | 18 (20.5%) |
| 20 to 24 Years | 130 (71.0%) | 0 (0.0%) |
| 25 to 29 Years | 61 (80.3%) | 0 (0.0%) |
| 30 to 34 Years | 133 (85.3%) | 0 (0.0%) |
| 35 to 44 Years | 227 (77.2%) | 0 (0.0%) |
| 45 to 54 Years | 170 (74.9%) | 0 (0.0%) |
| 55 to 59 Years | 154 (77.4%) | 0 (0.0%) |
| 60 to 64 Years | 142 (60.9%) | 0 (0.0%) |
| 65 to 74 Years | 54 (26.5%) | 0 (0.0%) |
| 75 Years and over | 20 (10.5%) | 0 (0.0%) |
| Total | 1,179 (61.2%) | 18 (1.5%) |
Employment Status by Educational Attainment in Sherman County
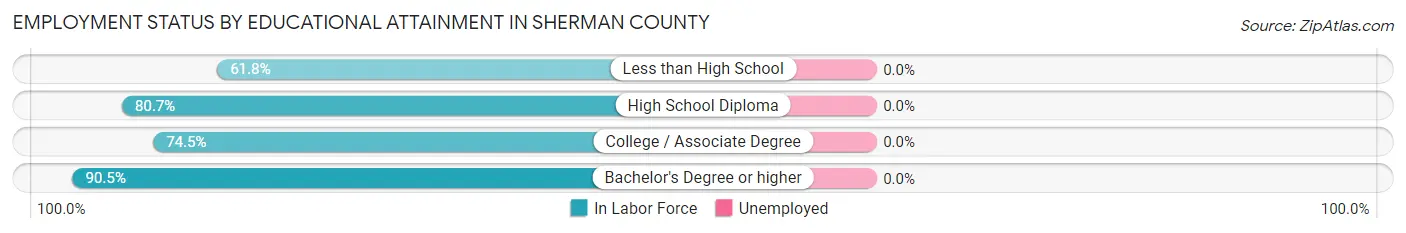
| Educational Attainment | In Labor Force | Unemployed |
| Less than High School | 243 (61.8%) | 0 (0.0%) |
| High School Diploma | 197 (80.7%) | 0 (0.0%) |
| College / Associate Degree | 228 (74.5%) | 0 (0.0%) |
| Bachelor's Degree or higher | 219 (90.5%) | 0 (0.0%) |
| Total | 888 (74.9%) | 0 (0.0%) |
Employment Occupations by Sex in Sherman County
Management, Business, Science and Arts Occupations
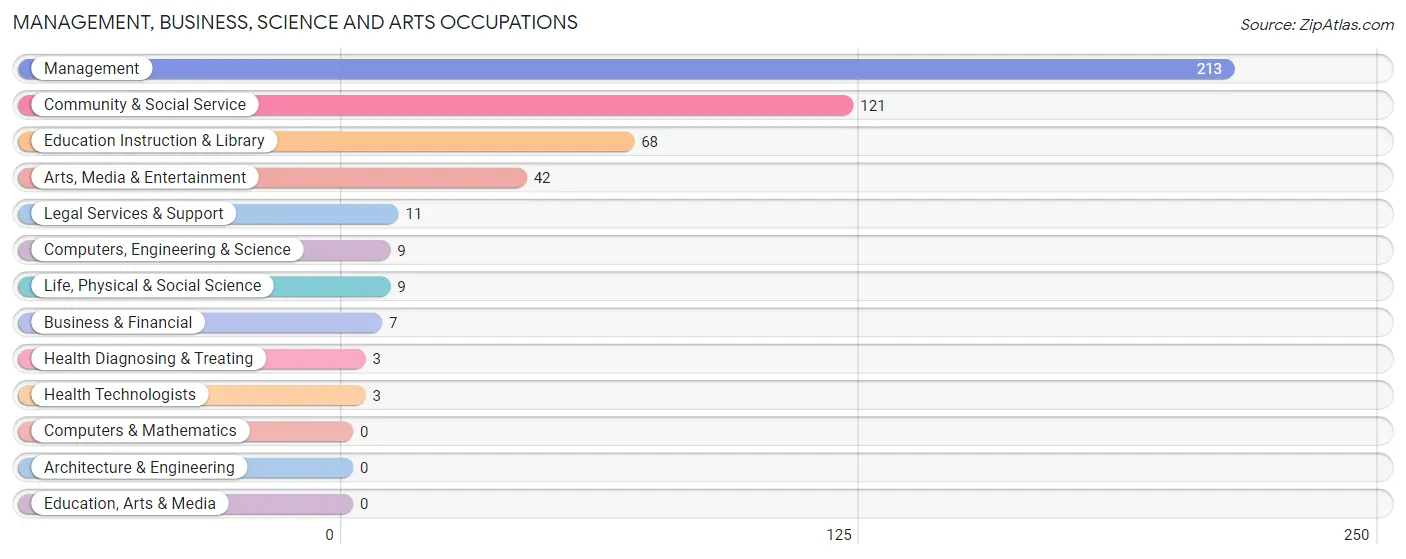
The most common Management, Business, Science and Arts occupations in Sherman County are Management (213 | 18.3%), Community & Social Service (121 | 10.4%), Education Instruction & Library (68 | 5.9%), Arts, Media & Entertainment (42 | 3.6%), and Legal Services & Support (11 | 0.9%).
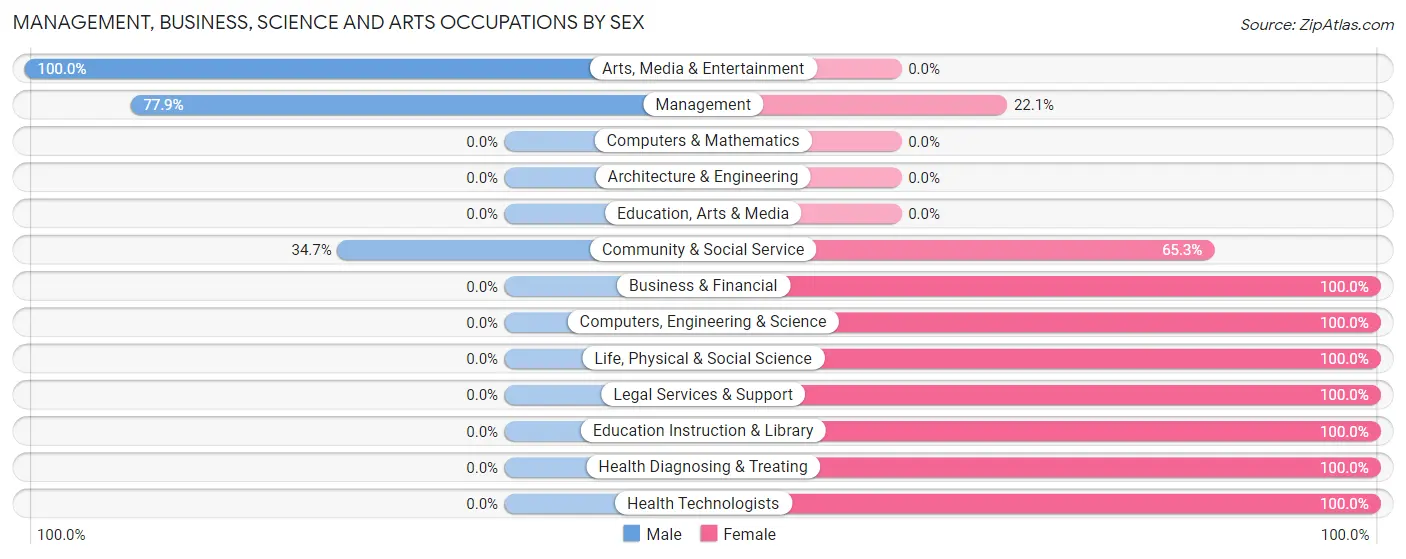
Management, Business, Science and Arts Occupations by Sex
Within the Management, Business, Science and Arts occupations in Sherman County, the most male-oriented occupations are Arts, Media & Entertainment (100.0%), Management (77.9%), and Community & Social Service (34.7%), while the most female-oriented occupations are Business & Financial (100.0%), Computers, Engineering & Science (100.0%), and Life, Physical & Social Science (100.0%).
| Occupation | Male | Female |
| Management | 166 (77.9%) | 47 (22.1%) |
| Business & Financial | 0 (0.0%) | 7 (100.0%) |
| Computers, Engineering & Science | 0 (0.0%) | 9 (100.0%) |
| Computers & Mathematics | 0 (0.0%) | 0 (0.0%) |
| Architecture & Engineering | 0 (0.0%) | 0 (0.0%) |
| Life, Physical & Social Science | 0 (0.0%) | 9 (100.0%) |
| Community & Social Service | 42 (34.7%) | 79 (65.3%) |
| Education, Arts & Media | 0 (0.0%) | 0 (0.0%) |
| Legal Services & Support | 0 (0.0%) | 11 (100.0%) |
| Education Instruction & Library | 0 (0.0%) | 68 (100.0%) |
| Arts, Media & Entertainment | 42 (100.0%) | 0 (0.0%) |
| Health Diagnosing & Treating | 0 (0.0%) | 3 (100.0%) |
| Health Technologists | 0 (0.0%) | 3 (100.0%) |
| Total (Category) | 208 (58.9%) | 145 (41.1%) |
| Total (Overall) | 706 (60.8%) | 455 (39.2%) |
Services Occupations
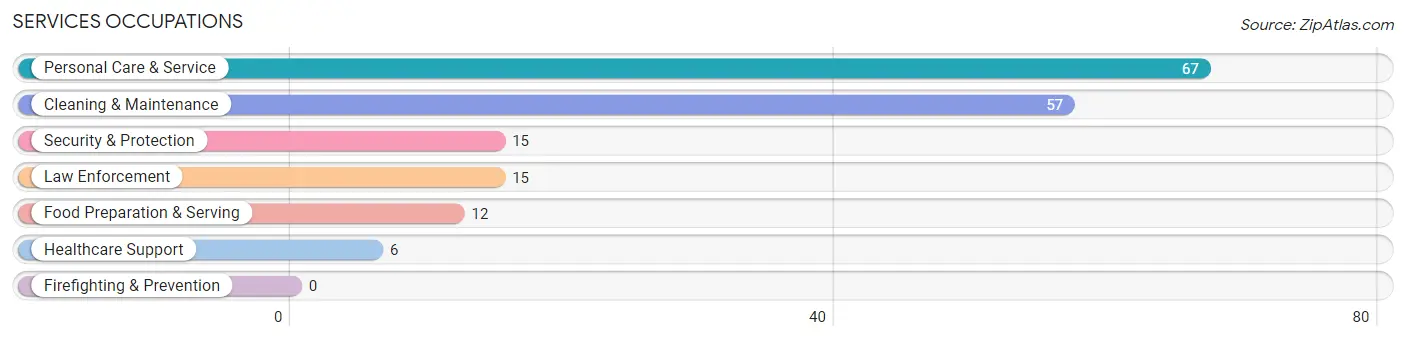
The most common Services occupations in Sherman County are Personal Care & Service (67 | 5.8%), Cleaning & Maintenance (57 | 4.9%), Security & Protection (15 | 1.3%), Law Enforcement (15 | 1.3%), and Food Preparation & Serving (12 | 1.0%).
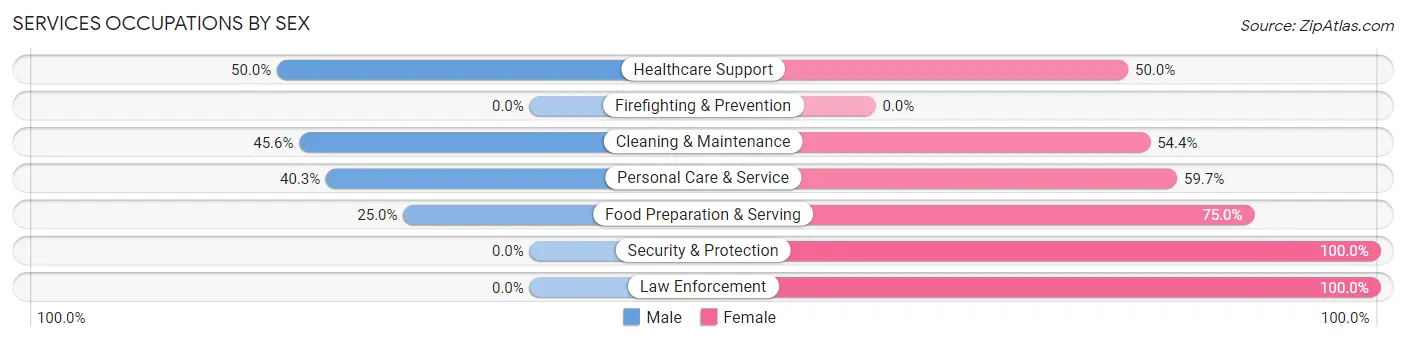
Services Occupations by Sex
Within the Services occupations in Sherman County, the most male-oriented occupations are Healthcare Support (50.0%), Cleaning & Maintenance (45.6%), and Personal Care & Service (40.3%), while the most female-oriented occupations are Security & Protection (100.0%), Law Enforcement (100.0%), and Food Preparation & Serving (75.0%).
| Occupation | Male | Female |
| Healthcare Support | 3 (50.0%) | 3 (50.0%) |
| Security & Protection | 0 (0.0%) | 15 (100.0%) |
| Firefighting & Prevention | 0 (0.0%) | 0 (0.0%) |
| Law Enforcement | 0 (0.0%) | 15 (100.0%) |
| Food Preparation & Serving | 3 (25.0%) | 9 (75.0%) |
| Cleaning & Maintenance | 26 (45.6%) | 31 (54.4%) |
| Personal Care & Service | 27 (40.3%) | 40 (59.7%) |
| Total (Category) | 59 (37.6%) | 98 (62.4%) |
| Total (Overall) | 706 (60.8%) | 455 (39.2%) |
Sales and Office Occupations
The most common Sales and Office occupations in Sherman County are Sales & Related (107 | 9.2%), and Office & Administration (104 | 9.0%).

Sales and Office Occupations by Sex

| Occupation | Male | Female |
| Sales & Related | 71 (66.4%) | 36 (33.6%) |
| Office & Administration | 0 (0.0%) | 104 (100.0%) |
| Total (Category) | 71 (33.7%) | 140 (66.3%) |
| Total (Overall) | 706 (60.8%) | 455 (39.2%) |
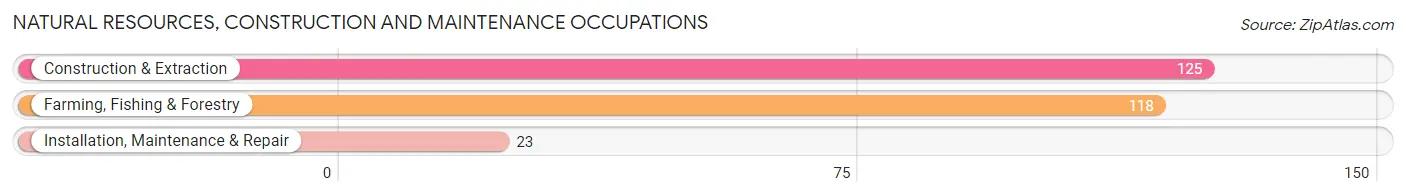
Natural Resources, Construction and Maintenance Occupations
The most common Natural Resources, Construction and Maintenance occupations in Sherman County are Construction & Extraction (125 | 10.8%), Farming, Fishing & Forestry (118 | 10.2%), and Installation, Maintenance & Repair (23 | 2.0%).
Natural Resources, Construction and Maintenance Occupations by Sex
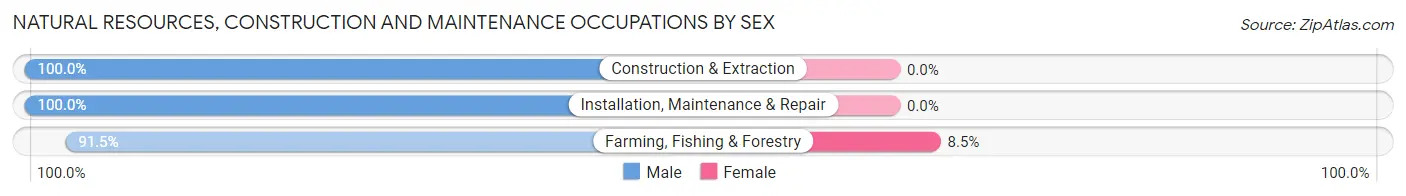
| Occupation | Male | Female |
| Farming, Fishing & Forestry | 108 (91.5%) | 10 (8.5%) |
| Construction & Extraction | 125 (100.0%) | 0 (0.0%) |
| Installation, Maintenance & Repair | 23 (100.0%) | 0 (0.0%) |
| Total (Category) | 256 (96.2%) | 10 (3.8%) |
| Total (Overall) | 706 (60.8%) | 455 (39.2%) |
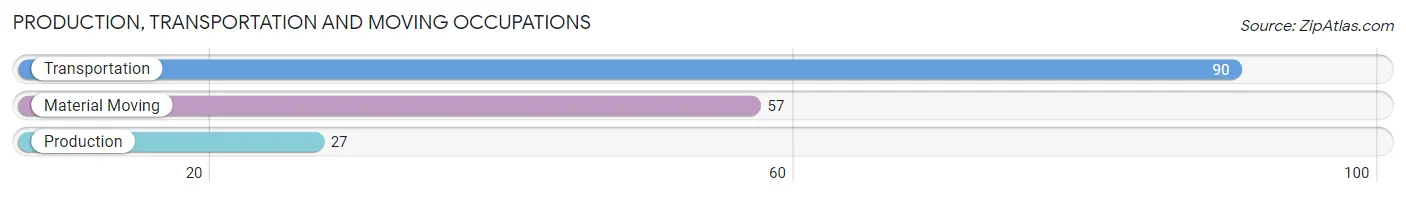
Production, Transportation and Moving Occupations
The most common Production, Transportation and Moving occupations in Sherman County are Transportation (90 | 7.7%), Material Moving (57 | 4.9%), and Production (27 | 2.3%).
Production, Transportation and Moving Occupations by Sex
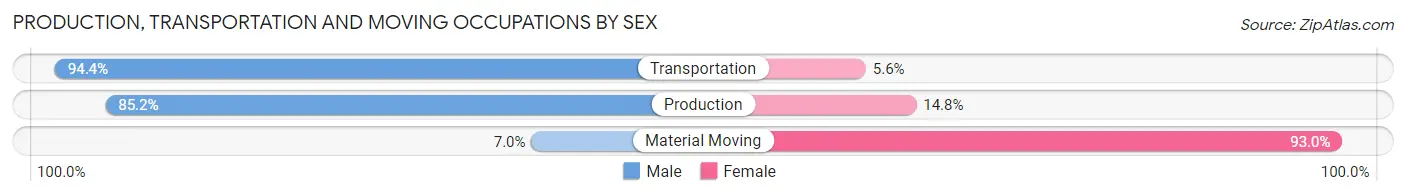
| Occupation | Male | Female |
| Production | 23 (85.2%) | 4 (14.8%) |
| Transportation | 85 (94.4%) | 5 (5.6%) |
| Material Moving | 4 (7.0%) | 53 (93.0%) |
| Total (Category) | 112 (64.4%) | 62 (35.6%) |
| Total (Overall) | 706 (60.8%) | 455 (39.2%) |
Employment Industries by Sex in Sherman County
Employment Industries in Sherman County
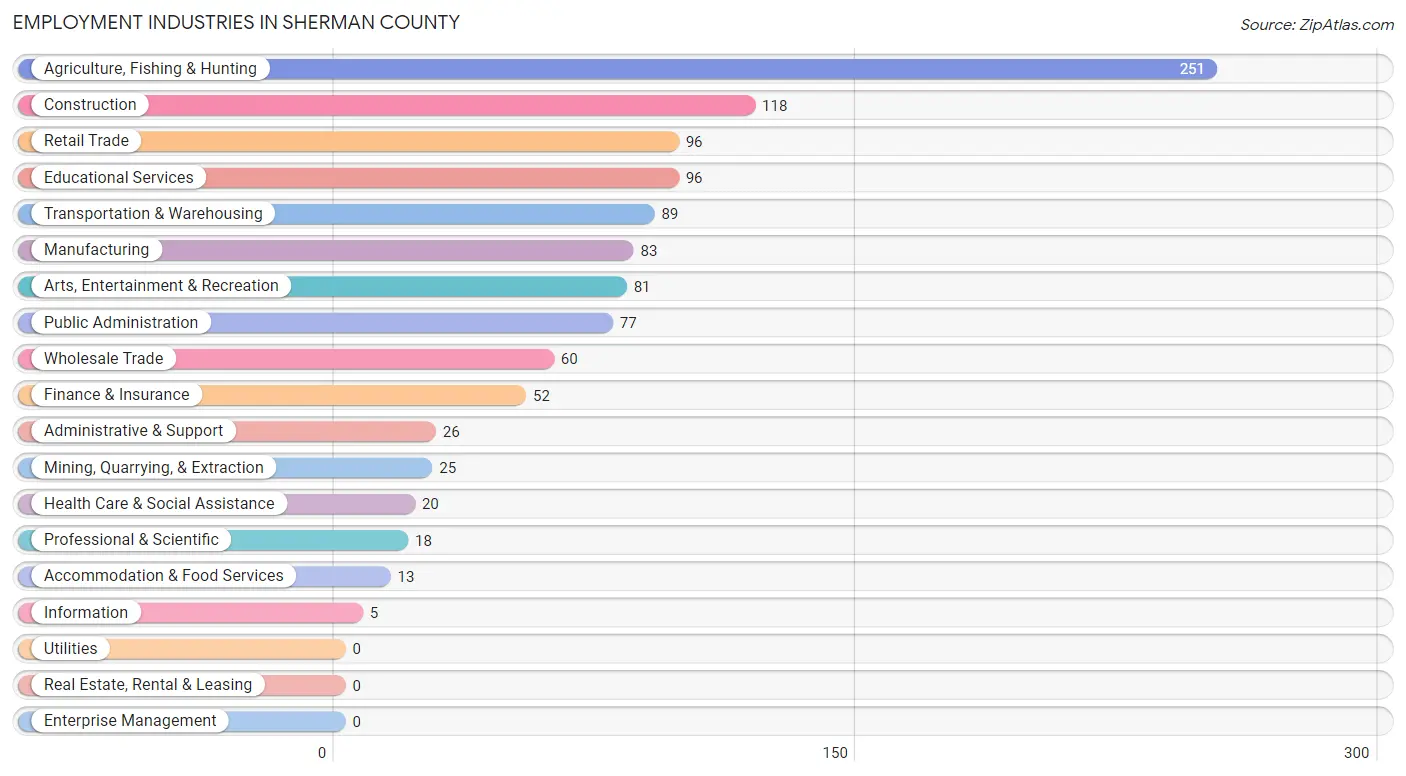
The major employment industries in Sherman County include Agriculture, Fishing & Hunting (251 | 21.6%), Construction (118 | 10.2%), Retail Trade (96 | 8.3%), Educational Services (96 | 8.3%), and Transportation & Warehousing (89 | 7.7%).
Employment Industries by Sex in Sherman County
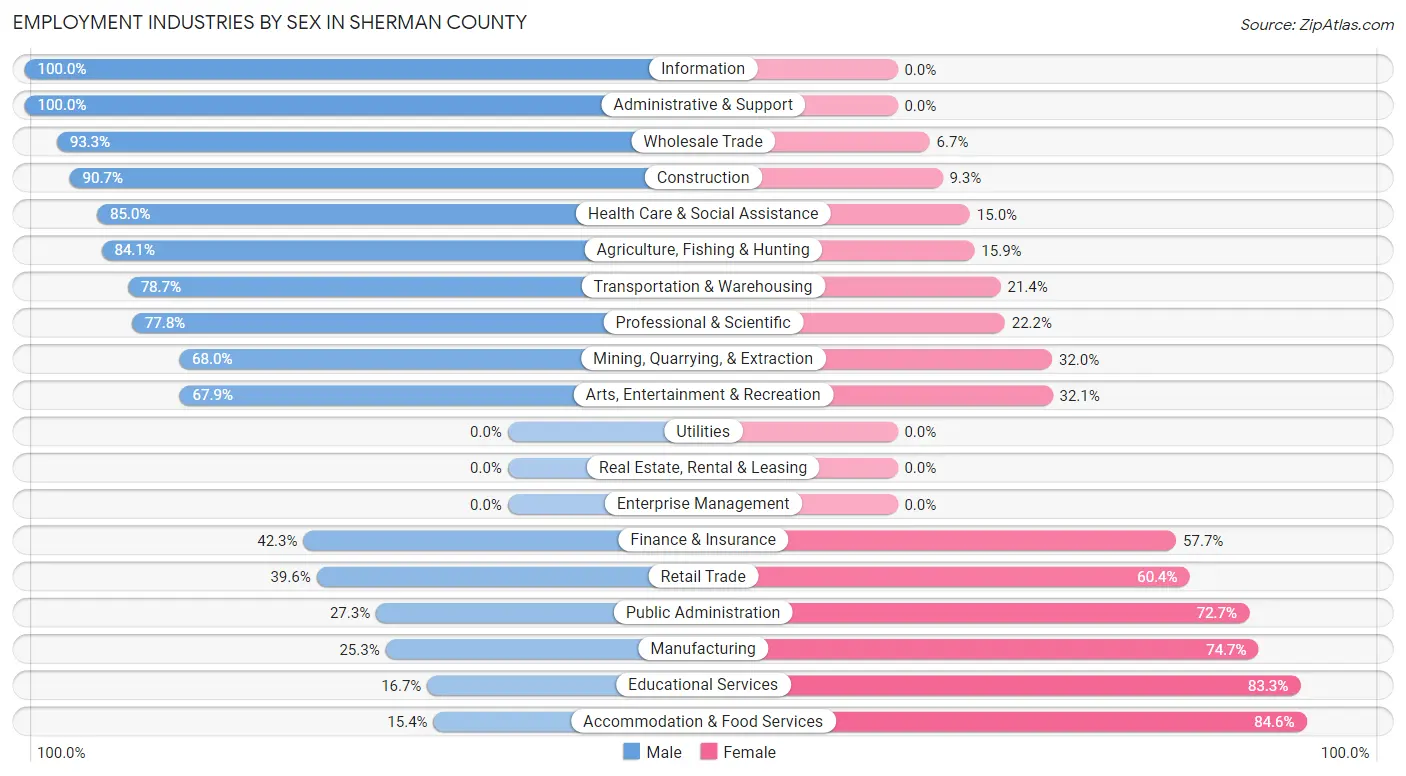
The Sherman County industries that see more men than women are Information (100.0%), Administrative & Support (100.0%), and Wholesale Trade (93.3%), whereas the industries that tend to have a higher number of women are Accommodation & Food Services (84.6%), Educational Services (83.3%), and Manufacturing (74.7%).
| Industry | Male | Female |
| Agriculture, Fishing & Hunting | 211 (84.1%) | 40 (15.9%) |
| Mining, Quarrying, & Extraction | 17 (68.0%) | 8 (32.0%) |
| Construction | 107 (90.7%) | 11 (9.3%) |
| Manufacturing | 21 (25.3%) | 62 (74.7%) |
| Wholesale Trade | 56 (93.3%) | 4 (6.7%) |
| Retail Trade | 38 (39.6%) | 58 (60.4%) |
| Transportation & Warehousing | 70 (78.6%) | 19 (21.3%) |
| Utilities | 0 (0.0%) | 0 (0.0%) |
| Information | 5 (100.0%) | 0 (0.0%) |
| Finance & Insurance | 22 (42.3%) | 30 (57.7%) |
| Real Estate, Rental & Leasing | 0 (0.0%) | 0 (0.0%) |
| Professional & Scientific | 14 (77.8%) | 4 (22.2%) |
| Enterprise Management | 0 (0.0%) | 0 (0.0%) |
| Administrative & Support | 26 (100.0%) | 0 (0.0%) |
| Educational Services | 16 (16.7%) | 80 (83.3%) |
| Health Care & Social Assistance | 17 (85.0%) | 3 (15.0%) |
| Arts, Entertainment & Recreation | 55 (67.9%) | 26 (32.1%) |
| Accommodation & Food Services | 2 (15.4%) | 11 (84.6%) |
| Public Administration | 21 (27.3%) | 56 (72.7%) |
| Total | 706 (60.8%) | 455 (39.2%) |
Education in Sherman County
School Enrollment in Sherman County
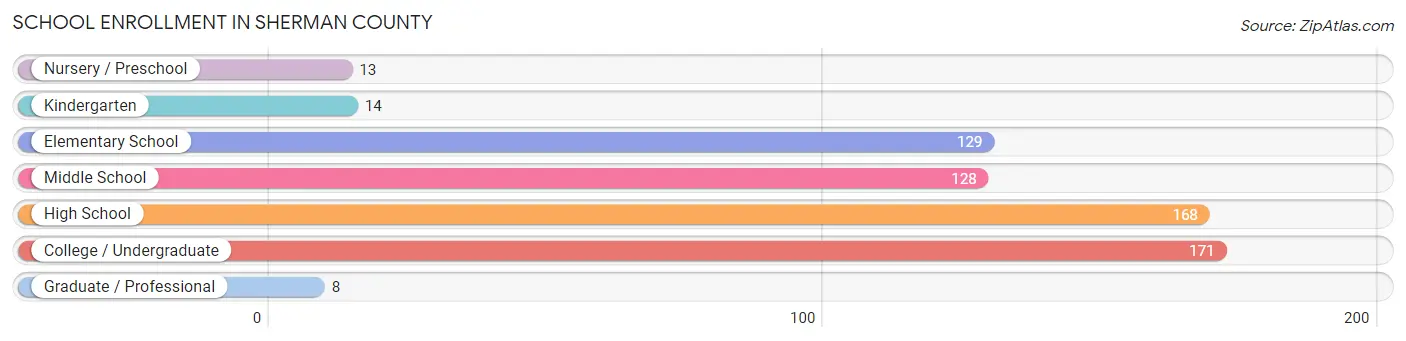
The most common levels of schooling among the 631 students in Sherman County are college / undergraduate (171 | 27.1%), high school (168 | 26.6%), and elementary school (129 | 20.4%).
| School Level | # Students | % Students |
| Nursery / Preschool | 13 | 2.1% |
| Kindergarten | 14 | 2.2% |
| Elementary School | 129 | 20.4% |
| Middle School | 128 | 20.3% |
| High School | 168 | 26.6% |
| College / Undergraduate | 171 | 27.1% |
| Graduate / Professional | 8 | 1.3% |
| Total | 631 | 100.0% |
School Enrollment by Age by Funding Source in Sherman County
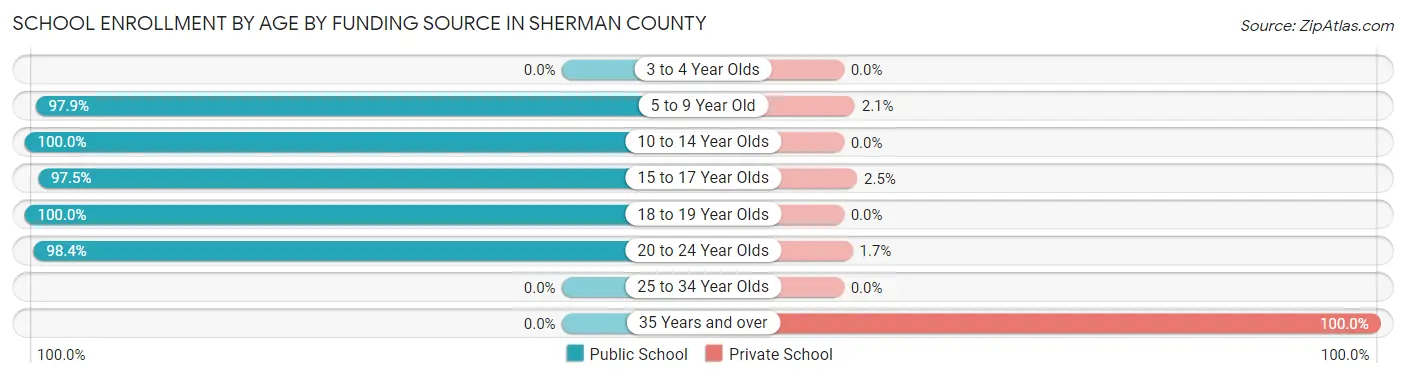
Out of a total of 631 students who are enrolled in schools in Sherman County, 19 (3.0%) attend a private institution, while the remaining 612 (97.0%) are enrolled in public schools. The age group of 35 years and over has the highest likelihood of being enrolled in private schools, with 11 (100.0% in the age bracket) enrolled. Conversely, the age group of 10 to 14 year olds has the lowest likelihood of being enrolled in a private school, with 154 (100.0% in the age bracket) attending a public institution.
| Age Bracket | Public School | Private School |
| 3 to 4 Year Olds | 0 (0.0%) | 0 (0.0%) |
| 5 to 9 Year Old | 142 (97.9%) | 3 (2.1%) |
| 10 to 14 Year Olds | 154 (100.0%) | 0 (0.0%) |
| 15 to 17 Year Olds | 117 (97.5%) | 3 (2.5%) |
| 18 to 19 Year Olds | 80 (100.0%) | 0 (0.0%) |
| 20 to 24 Year Olds | 119 (98.4%) | 2 (1.7%) |
| 25 to 34 Year Olds | 0 (0.0%) | 0 (0.0%) |
| 35 Years and over | 0 (0.0%) | 11 (100.0%) |
| Total | 612 (97.0%) | 19 (3.0%) |
Educational Attainment by Field of Study in Sherman County
Business (109 | 28.9%), education (104 | 27.6%), bio, nature & agricultural (55 | 14.6%), liberal arts & history (45 | 11.9%), and science & technology (25 | 6.6%) are the most common fields of study among 377 individuals in Sherman County who have obtained a bachelor's degree or higher.
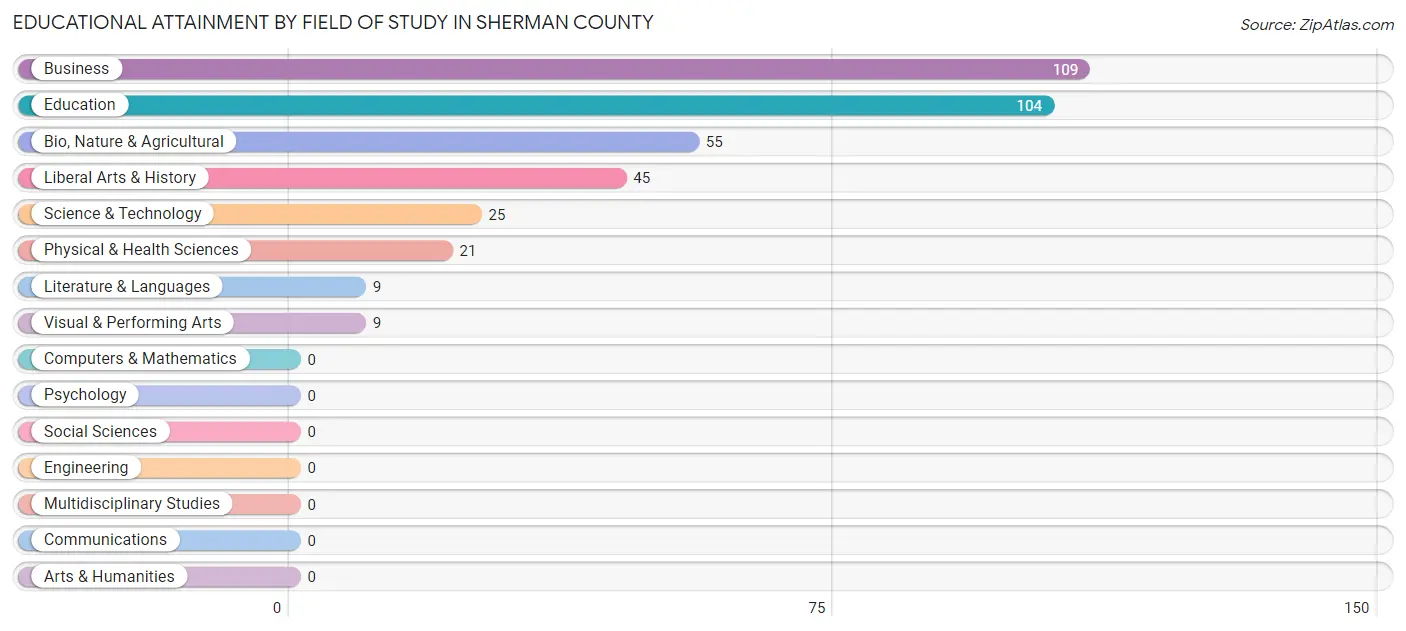
| Field of Study | # Graduates | % Graduates |
| Computers & Mathematics | 0 | 0.0% |
| Bio, Nature & Agricultural | 55 | 14.6% |
| Physical & Health Sciences | 21 | 5.6% |
| Psychology | 0 | 0.0% |
| Social Sciences | 0 | 0.0% |
| Engineering | 0 | 0.0% |
| Multidisciplinary Studies | 0 | 0.0% |
| Science & Technology | 25 | 6.6% |
| Business | 109 | 28.9% |
| Education | 104 | 27.6% |
| Literature & Languages | 9 | 2.4% |
| Liberal Arts & History | 45 | 11.9% |
| Visual & Performing Arts | 9 | 2.4% |
| Communications | 0 | 0.0% |
| Arts & Humanities | 0 | 0.0% |
| Total | 377 | 100.0% |
Transportation & Commute in Sherman County
Vehicle Availability by Sex in Sherman County
The most prevalent vehicle ownership categories in Sherman County are males with 2 vehicles (302, accounting for 42.8%) and females with 2 vehicles (232, making up 73.7%).
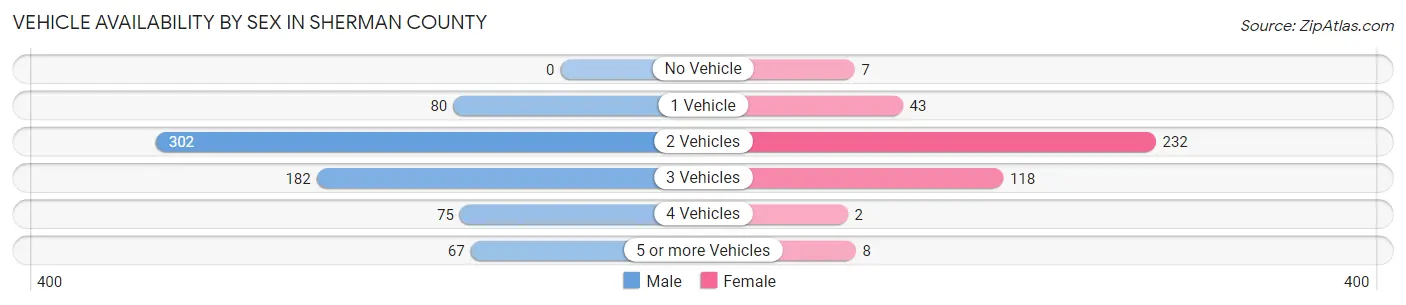
| Vehicles Available | Male | Female |
| No Vehicle | 0 (0.0%) | 7 (1.7%) |
| 1 Vehicle | 80 (11.3%) | 43 (10.5%) |
| 2 Vehicles | 302 (42.8%) | 232 (56.6%) |
| 3 Vehicles | 182 (25.8%) | 118 (28.8%) |
| 4 Vehicles | 75 (10.6%) | 2 (0.5%) |
| 5 or more Vehicles | 67 (9.5%) | 8 (1.9%) |
| Total | 706 (100.0%) | 410 (100.0%) |
Commute Time in Sherman County
The most frequently occuring commute durations in Sherman County are less than 5 minutes (307 commuters, 28.0%), 5 to 9 minutes (263 commuters, 24.0%), and 10 to 14 minutes (135 commuters, 12.3%).
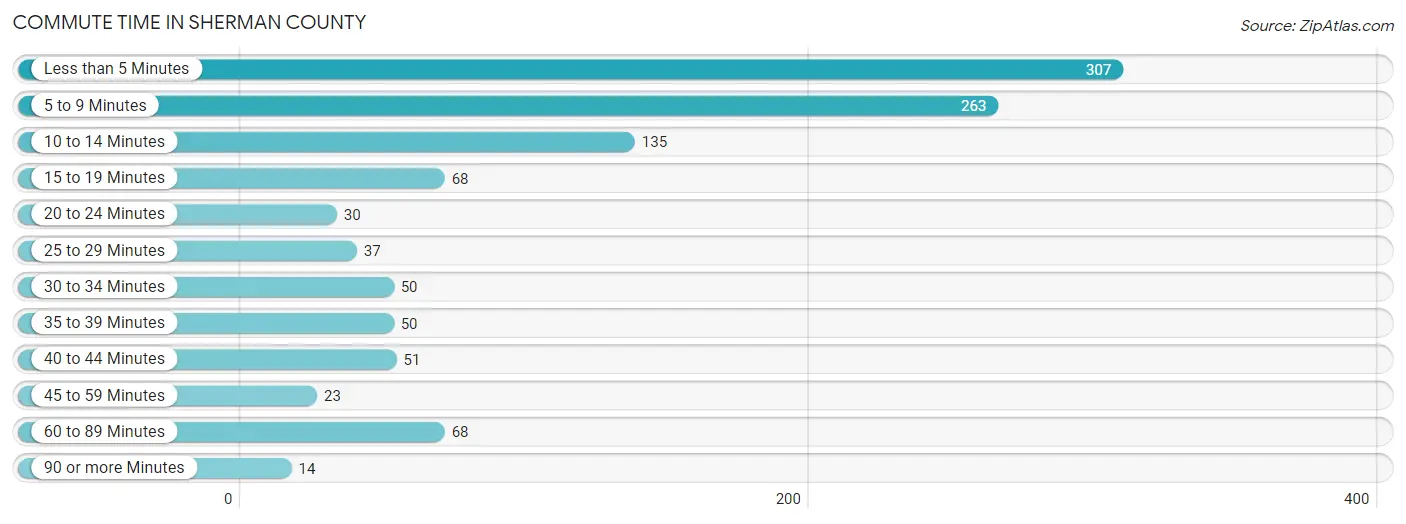
| Commute Time | # Commuters | % Commuters |
| Less than 5 Minutes | 307 | 28.0% |
| 5 to 9 Minutes | 263 | 24.0% |
| 10 to 14 Minutes | 135 | 12.3% |
| 15 to 19 Minutes | 68 | 6.2% |
| 20 to 24 Minutes | 30 | 2.7% |
| 25 to 29 Minutes | 37 | 3.4% |
| 30 to 34 Minutes | 50 | 4.6% |
| 35 to 39 Minutes | 50 | 4.6% |
| 40 to 44 Minutes | 51 | 4.6% |
| 45 to 59 Minutes | 23 | 2.1% |
| 60 to 89 Minutes | 68 | 6.2% |
| 90 or more Minutes | 14 | 1.3% |
Commute Time by Sex in Sherman County
The most common commute times in Sherman County are less than 5 minutes (245 commuters, 34.9%) for males and 5 to 9 minutes (109 commuters, 27.7%) for females.
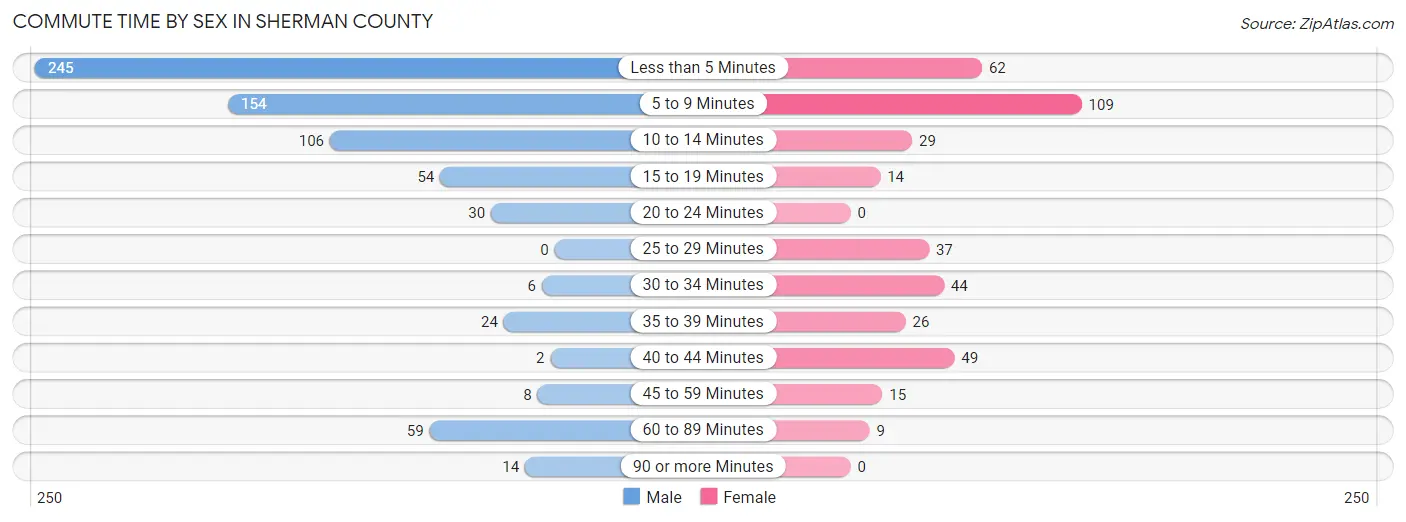
| Commute Time | Male | Female |
| Less than 5 Minutes | 245 (34.9%) | 62 (15.7%) |
| 5 to 9 Minutes | 154 (21.9%) | 109 (27.7%) |
| 10 to 14 Minutes | 106 (15.1%) | 29 (7.4%) |
| 15 to 19 Minutes | 54 (7.7%) | 14 (3.5%) |
| 20 to 24 Minutes | 30 (4.3%) | 0 (0.0%) |
| 25 to 29 Minutes | 0 (0.0%) | 37 (9.4%) |
| 30 to 34 Minutes | 6 (0.9%) | 44 (11.2%) |
| 35 to 39 Minutes | 24 (3.4%) | 26 (6.6%) |
| 40 to 44 Minutes | 2 (0.3%) | 49 (12.4%) |
| 45 to 59 Minutes | 8 (1.1%) | 15 (3.8%) |
| 60 to 89 Minutes | 59 (8.4%) | 9 (2.3%) |
| 90 or more Minutes | 14 (2.0%) | 0 (0.0%) |
Time of Departure to Work by Sex in Sherman County
The most frequent times of departure to work in Sherman County are 6:30 AM to 6:59 AM (167, 23.8%) for males and 8:00 AM to 8:29 AM (75, 19.0%) for females.
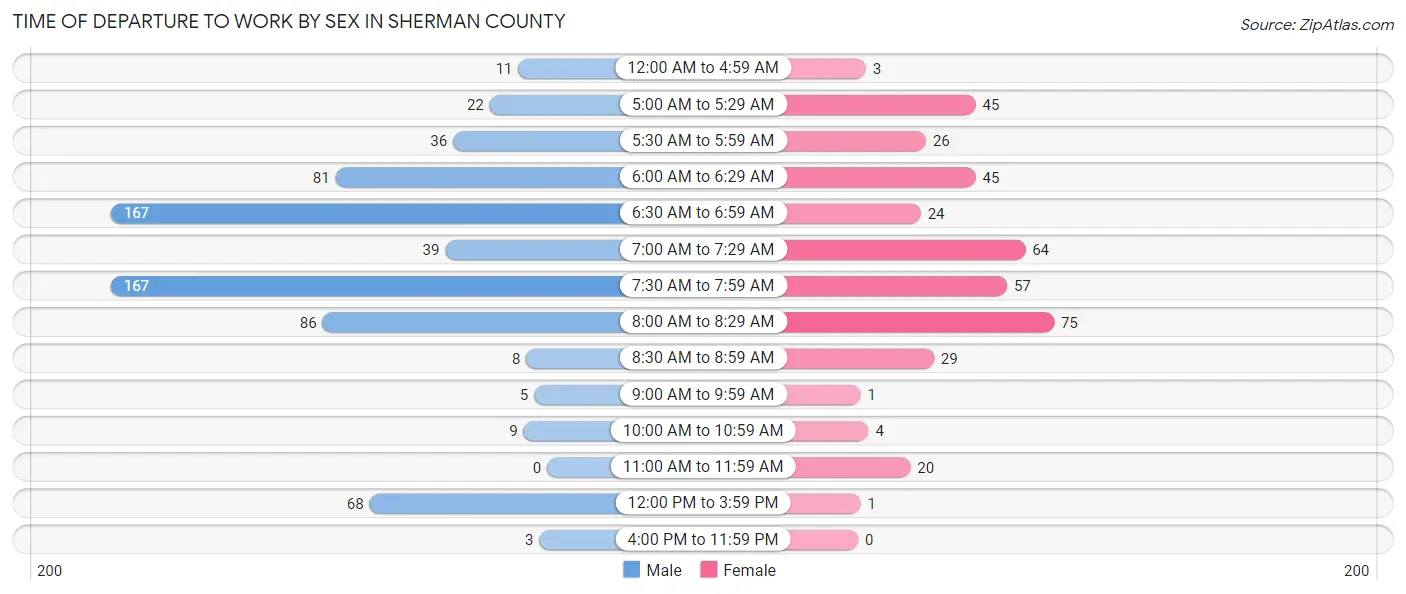
| Time of Departure | Male | Female |
| 12:00 AM to 4:59 AM | 11 (1.6%) | 3 (0.8%) |
| 5:00 AM to 5:29 AM | 22 (3.1%) | 45 (11.4%) |
| 5:30 AM to 5:59 AM | 36 (5.1%) | 26 (6.6%) |
| 6:00 AM to 6:29 AM | 81 (11.5%) | 45 (11.4%) |
| 6:30 AM to 6:59 AM | 167 (23.8%) | 24 (6.1%) |
| 7:00 AM to 7:29 AM | 39 (5.6%) | 64 (16.2%) |
| 7:30 AM to 7:59 AM | 167 (23.8%) | 57 (14.5%) |
| 8:00 AM to 8:29 AM | 86 (12.2%) | 75 (19.0%) |
| 8:30 AM to 8:59 AM | 8 (1.1%) | 29 (7.4%) |
| 9:00 AM to 9:59 AM | 5 (0.7%) | 1 (0.3%) |
| 10:00 AM to 10:59 AM | 9 (1.3%) | 4 (1.0%) |
| 11:00 AM to 11:59 AM | 0 (0.0%) | 20 (5.1%) |
| 12:00 PM to 3:59 PM | 68 (9.7%) | 1 (0.3%) |
| 4:00 PM to 11:59 PM | 3 (0.4%) | 0 (0.0%) |
| Total | 702 (100.0%) | 394 (100.0%) |
Housing Occupancy in Sherman County
Occupancy by Ownership in Sherman County
Of the total 803 dwellings in Sherman County, owner-occupied units account for 614 (76.5%), while renter-occupied units make up 189 (23.5%).
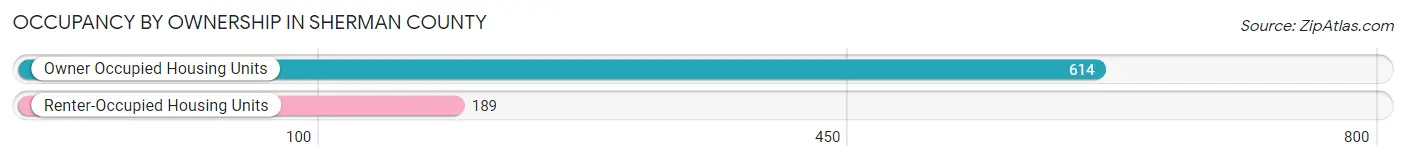
| Occupancy | # Housing Units | % Housing Units |
| Owner Occupied Housing Units | 614 | 76.5% |
| Renter-Occupied Housing Units | 189 | 23.5% |
| Total Occupied Housing Units | 803 | 100.0% |
Occupancy by Household Size in Sherman County
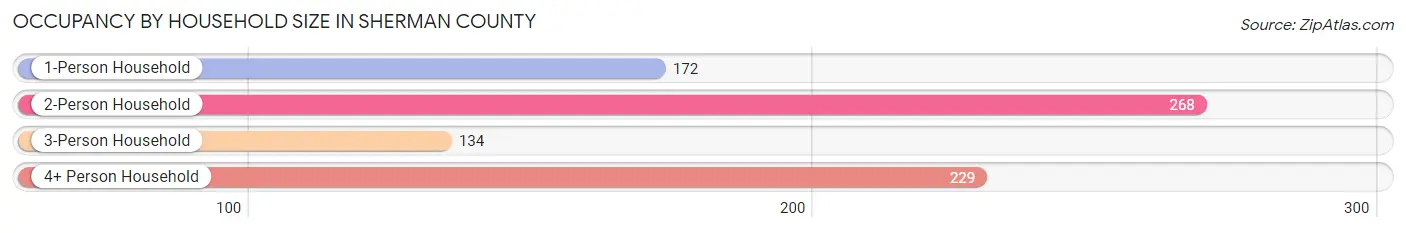
| Household Size | # Housing Units | % Housing Units |
| 1-Person Household | 172 | 21.4% |
| 2-Person Household | 268 | 33.4% |
| 3-Person Household | 134 | 16.7% |
| 4+ Person Household | 229 | 28.5% |
| Total Housing Units | 803 | 100.0% |
Occupancy by Ownership by Household Size in Sherman County
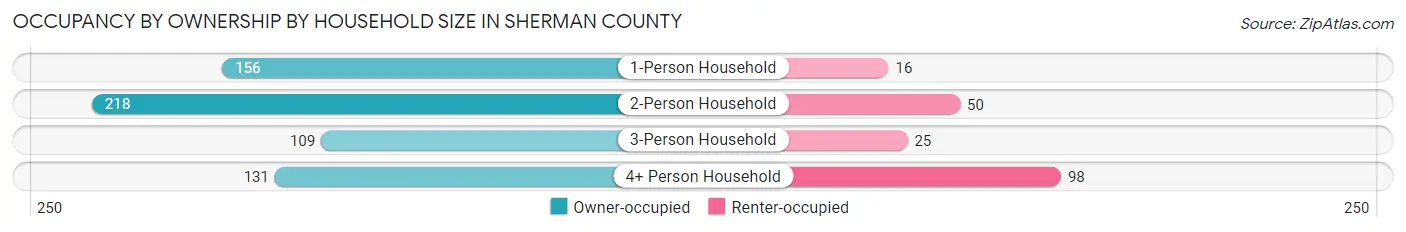
| Household Size | Owner-occupied | Renter-occupied |
| 1-Person Household | 156 (90.7%) | 16 (9.3%) |
| 2-Person Household | 218 (81.3%) | 50 (18.7%) |
| 3-Person Household | 109 (81.3%) | 25 (18.7%) |
| 4+ Person Household | 131 (57.2%) | 98 (42.8%) |
| Total Housing Units | 614 (76.5%) | 189 (23.5%) |
Occupancy by Educational Attainment in Sherman County
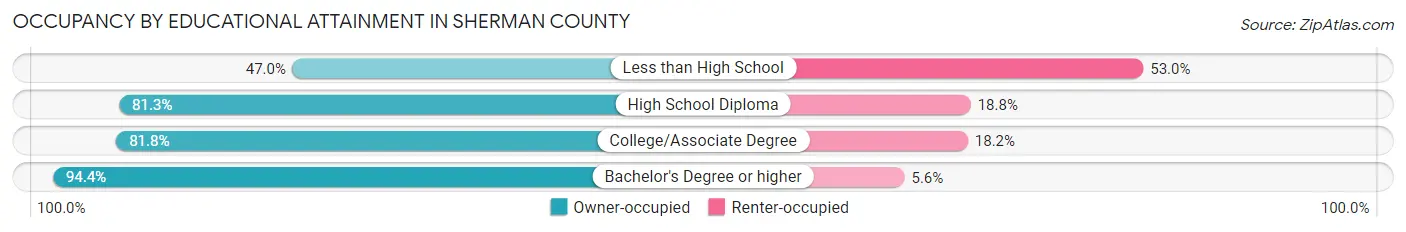
| Household Size | Owner-occupied | Renter-occupied |
| Less than High School | 87 (47.0%) | 98 (53.0%) |
| High School Diploma | 143 (81.2%) | 33 (18.8%) |
| College/Associate Degree | 216 (81.8%) | 48 (18.2%) |
| Bachelor's Degree or higher | 168 (94.4%) | 10 (5.6%) |
Occupancy by Age of Householder in Sherman County
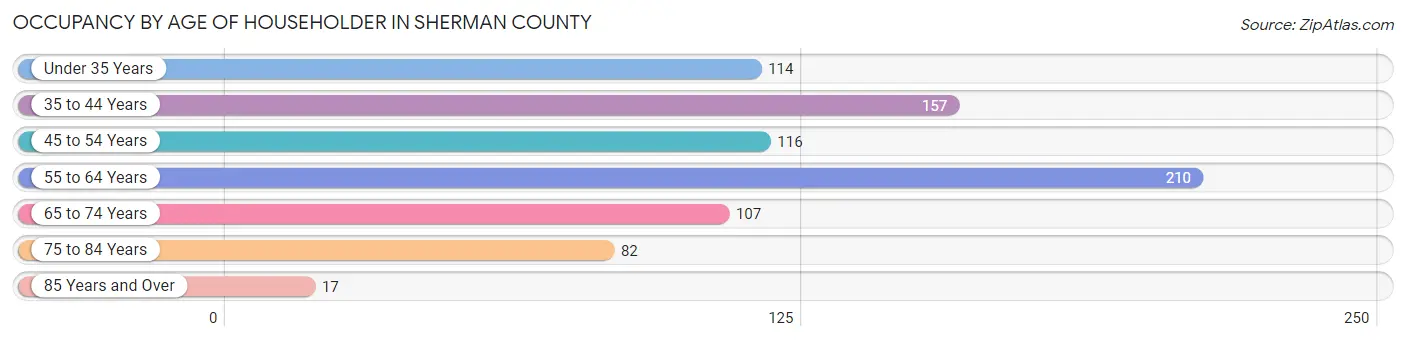
| Age Bracket | # Households | % Households |
| Under 35 Years | 114 | 14.2% |
| 35 to 44 Years | 157 | 19.6% |
| 45 to 54 Years | 116 | 14.4% |
| 55 to 64 Years | 210 | 26.2% |
| 65 to 74 Years | 107 | 13.3% |
| 75 to 84 Years | 82 | 10.2% |
| 85 Years and Over | 17 | 2.1% |
| Total | 803 | 100.0% |
Housing Finances in Sherman County
Median Income by Occupancy in Sherman County
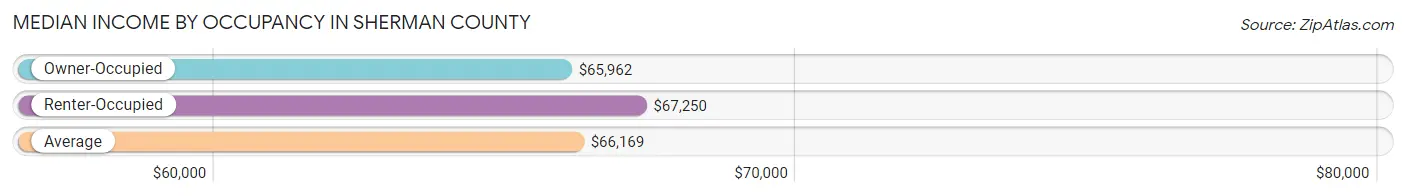
| Occupancy Type | # Households | Median Income |
| Owner-Occupied | 614 (76.5%) | $65,962 |
| Renter-Occupied | 189 (23.5%) | $67,250 |
| Average | 803 (100.0%) | $66,169 |
Occupancy by Householder Income Bracket in Sherman County
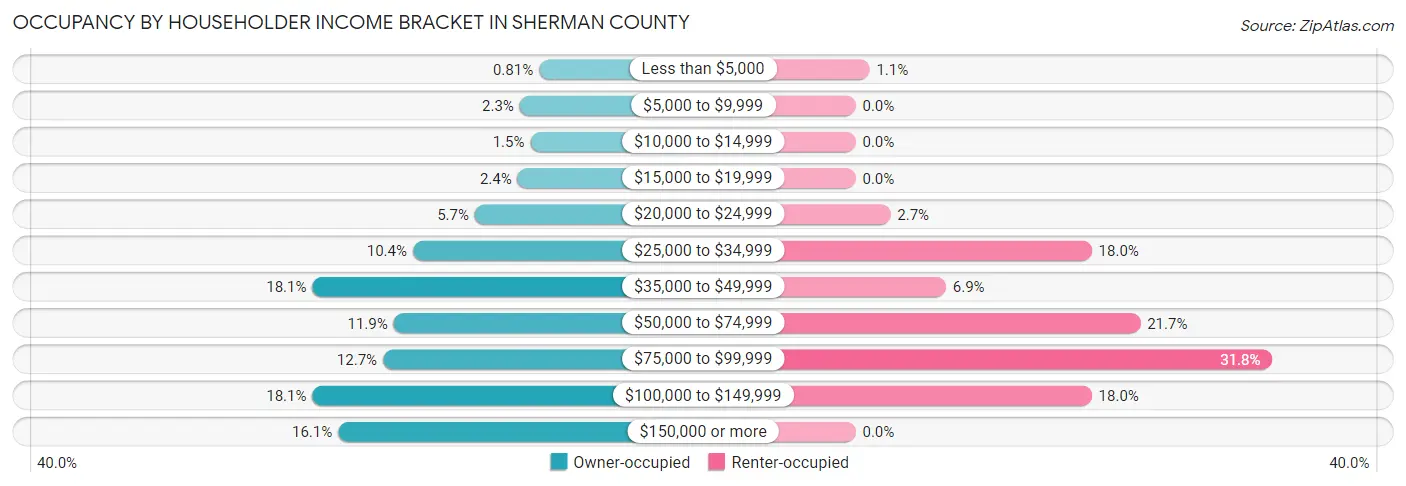
| Income Bracket | Owner-occupied | Renter-occupied |
| Less than $5,000 | 5 (0.8%) | 2 (1.1%) |
| $5,000 to $9,999 | 14 (2.3%) | 0 (0.0%) |
| $10,000 to $14,999 | 9 (1.5%) | 0 (0.0%) |
| $15,000 to $19,999 | 15 (2.4%) | 0 (0.0%) |
| $20,000 to $24,999 | 35 (5.7%) | 5 (2.6%) |
| $25,000 to $34,999 | 64 (10.4%) | 34 (18.0%) |
| $35,000 to $49,999 | 111 (18.1%) | 13 (6.9%) |
| $50,000 to $74,999 | 73 (11.9%) | 41 (21.7%) |
| $75,000 to $99,999 | 78 (12.7%) | 60 (31.8%) |
| $100,000 to $149,999 | 111 (18.1%) | 34 (18.0%) |
| $150,000 or more | 99 (16.1%) | 0 (0.0%) |
| Total | 614 (100.0%) | 189 (100.0%) |
Monthly Housing Cost Tiers in Sherman County
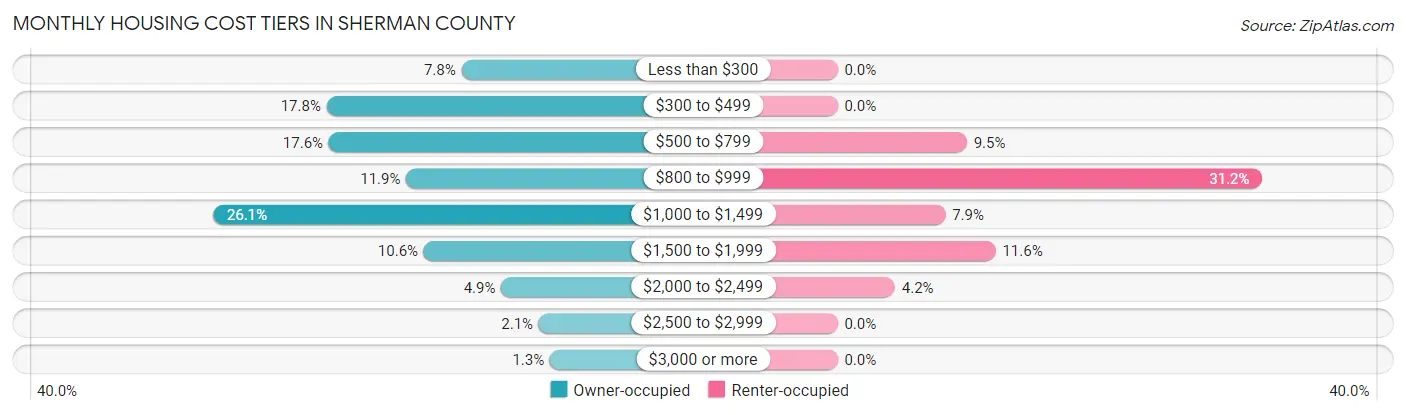
| Monthly Cost | Owner-occupied | Renter-occupied |
| Less than $300 | 48 (7.8%) | 0 (0.0%) |
| $300 to $499 | 109 (17.7%) | 0 (0.0%) |
| $500 to $799 | 108 (17.6%) | 18 (9.5%) |
| $800 to $999 | 73 (11.9%) | 59 (31.2%) |
| $1,000 to $1,499 | 160 (26.1%) | 15 (7.9%) |
| $1,500 to $1,999 | 65 (10.6%) | 22 (11.6%) |
| $2,000 to $2,499 | 30 (4.9%) | 8 (4.2%) |
| $2,500 to $2,999 | 13 (2.1%) | 0 (0.0%) |
| $3,000 or more | 8 (1.3%) | 0 (0.0%) |
| Total | 614 (100.0%) | 189 (100.0%) |
Physical Housing Characteristics in Sherman County
Housing Structures in Sherman County
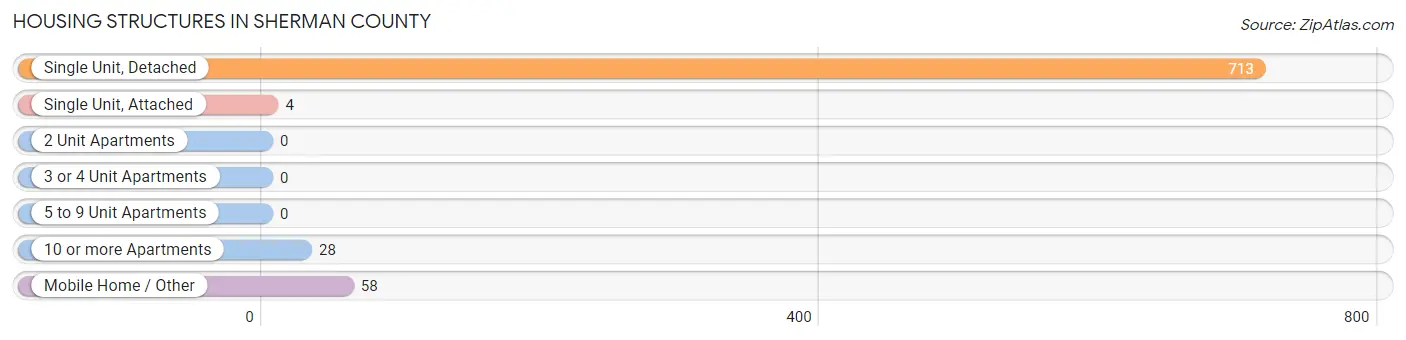
| Structure Type | # Housing Units | % Housing Units |
| Single Unit, Detached | 713 | 88.8% |
| Single Unit, Attached | 4 | 0.5% |
| 2 Unit Apartments | 0 | 0.0% |
| 3 or 4 Unit Apartments | 0 | 0.0% |
| 5 to 9 Unit Apartments | 0 | 0.0% |
| 10 or more Apartments | 28 | 3.5% |
| Mobile Home / Other | 58 | 7.2% |
| Total | 803 | 100.0% |
Housing Structures by Occupancy in Sherman County
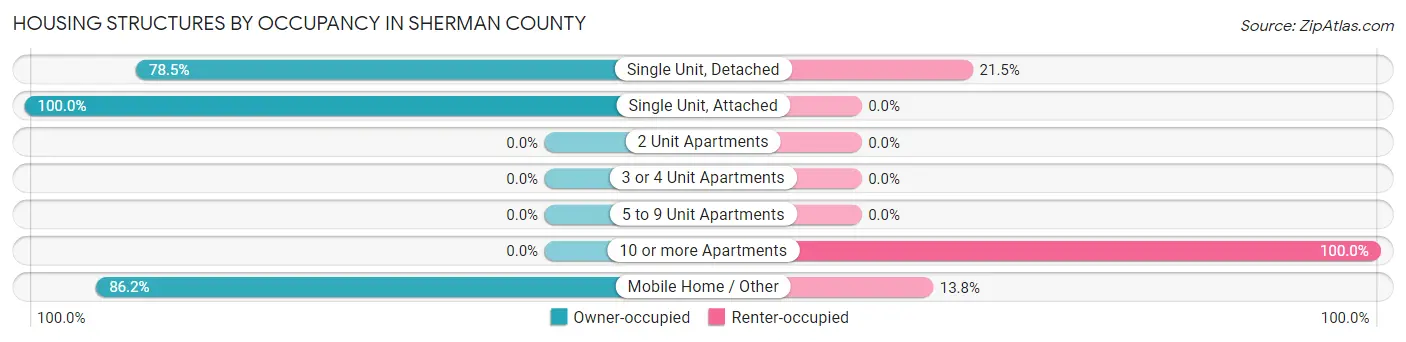
| Structure Type | Owner-occupied | Renter-occupied |
| Single Unit, Detached | 560 (78.5%) | 153 (21.5%) |
| Single Unit, Attached | 4 (100.0%) | 0 (0.0%) |
| 2 Unit Apartments | 0 (0.0%) | 0 (0.0%) |
| 3 or 4 Unit Apartments | 0 (0.0%) | 0 (0.0%) |
| 5 to 9 Unit Apartments | 0 (0.0%) | 0 (0.0%) |
| 10 or more Apartments | 0 (0.0%) | 28 (100.0%) |
| Mobile Home / Other | 50 (86.2%) | 8 (13.8%) |
| Total | 614 (76.5%) | 189 (23.5%) |
Housing Structures by Number of Rooms in Sherman County
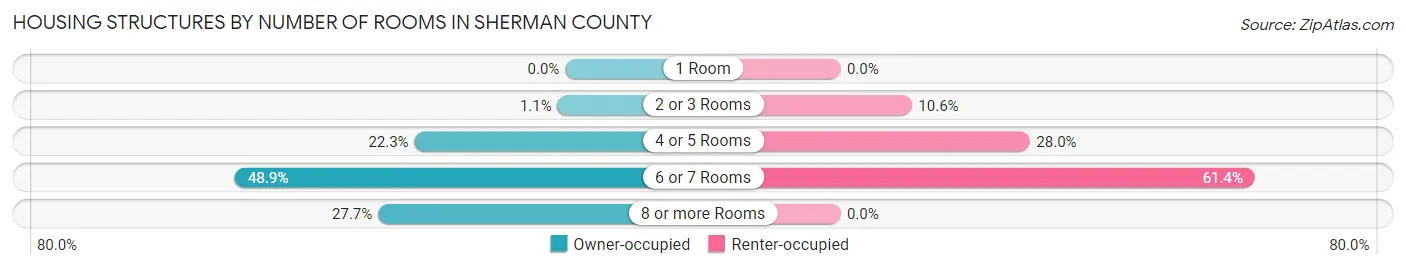
| Number of Rooms | Owner-occupied | Renter-occupied |
| 1 Room | 0 (0.0%) | 0 (0.0%) |
| 2 or 3 Rooms | 7 (1.1%) | 20 (10.6%) |
| 4 or 5 Rooms | 137 (22.3%) | 53 (28.0%) |
| 6 or 7 Rooms | 300 (48.9%) | 116 (61.4%) |
| 8 or more Rooms | 170 (27.7%) | 0 (0.0%) |
| Total | 614 (100.0%) | 189 (100.0%) |
Housing Structure by Heating Type in Sherman County
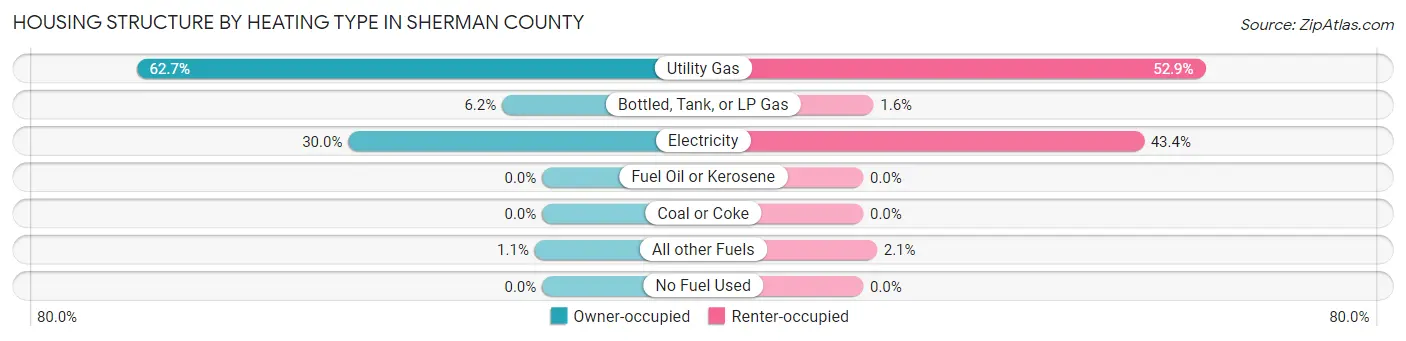
| Heating Type | Owner-occupied | Renter-occupied |
| Utility Gas | 385 (62.7%) | 100 (52.9%) |
| Bottled, Tank, or LP Gas | 38 (6.2%) | 3 (1.6%) |
| Electricity | 184 (30.0%) | 82 (43.4%) |
| Fuel Oil or Kerosene | 0 (0.0%) | 0 (0.0%) |
| Coal or Coke | 0 (0.0%) | 0 (0.0%) |
| All other Fuels | 7 (1.1%) | 4 (2.1%) |
| No Fuel Used | 0 (0.0%) | 0 (0.0%) |
| Total | 614 (100.0%) | 189 (100.0%) |
Household Vehicle Usage in Sherman County
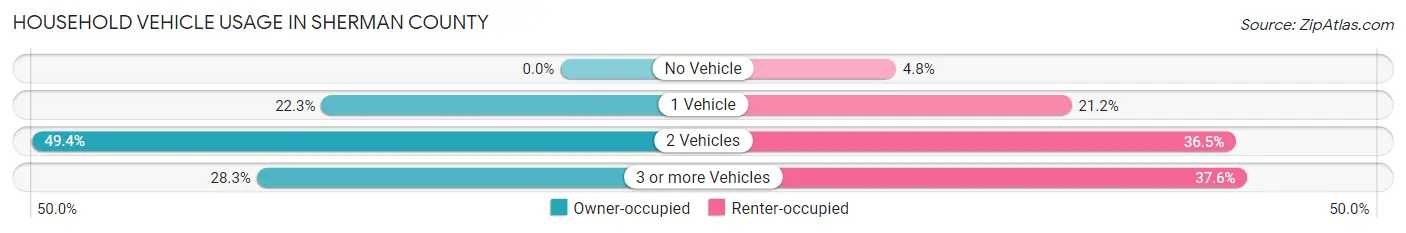
| Vehicles per Household | Owner-occupied | Renter-occupied |
| No Vehicle | 0 (0.0%) | 9 (4.8%) |
| 1 Vehicle | 137 (22.3%) | 40 (21.2%) |
| 2 Vehicles | 303 (49.3%) | 69 (36.5%) |
| 3 or more Vehicles | 174 (28.3%) | 71 (37.6%) |
| Total | 614 (100.0%) | 189 (100.0%) |
Real Estate & Mortgages in Sherman County
Real Estate and Mortgage Overview in Sherman County
| Characteristic | Without Mortgage | With Mortgage |
| Housing Units | 325 | 289 |
| Median Property Value | $103,300 | $116,800 |
| Median Household Income | $65,284 | $65 |
| Monthly Housing Costs | $566 | $8 |
| Real Estate Taxes | $1,398 | $0 |
Property Value by Mortgage Status in Sherman County
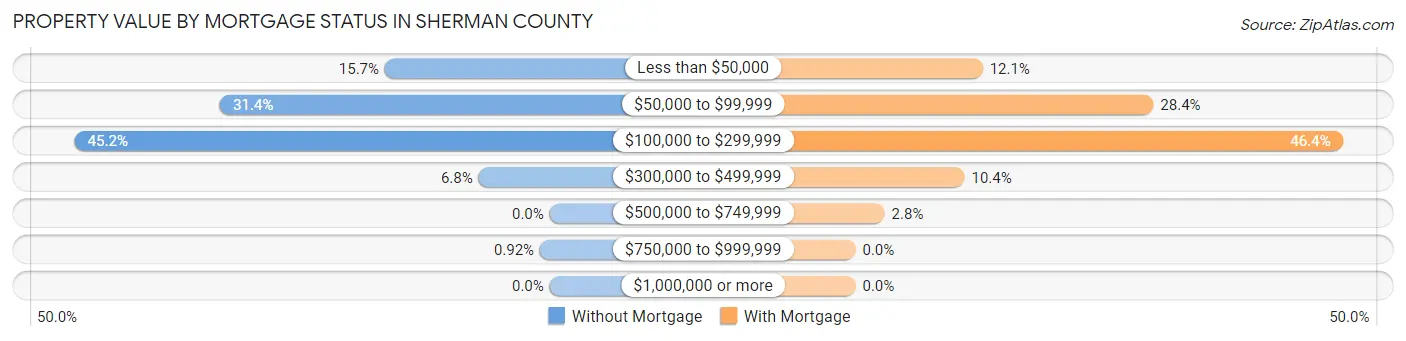
| Property Value | Without Mortgage | With Mortgage |
| Less than $50,000 | 51 (15.7%) | 35 (12.1%) |
| $50,000 to $99,999 | 102 (31.4%) | 82 (28.4%) |
| $100,000 to $299,999 | 147 (45.2%) | 134 (46.4%) |
| $300,000 to $499,999 | 22 (6.8%) | 30 (10.4%) |
| $500,000 to $749,999 | 0 (0.0%) | 8 (2.8%) |
| $750,000 to $999,999 | 3 (0.9%) | 0 (0.0%) |
| $1,000,000 or more | 0 (0.0%) | 0 (0.0%) |
| Total | 325 (100.0%) | 289 (100.0%) |
Household Income by Mortgage Status in Sherman County
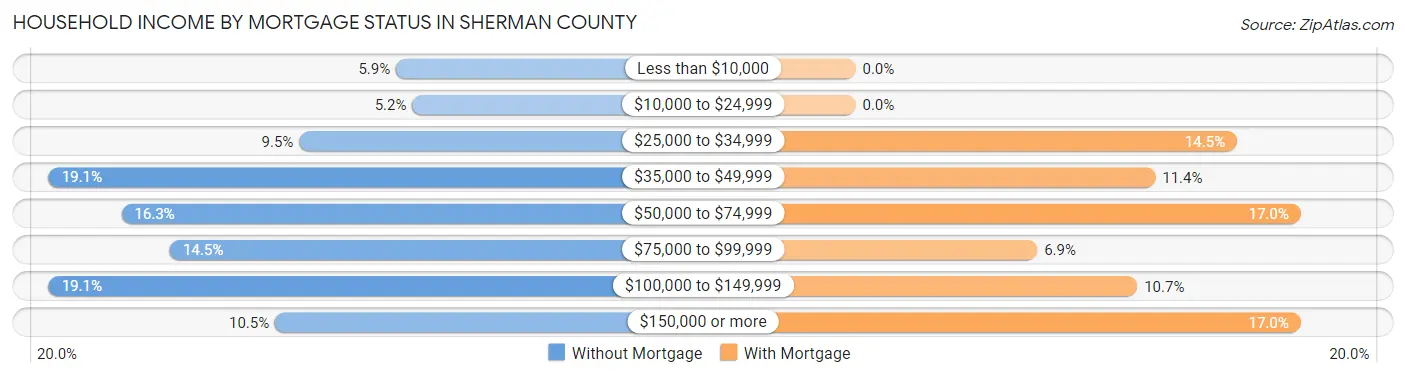
| Household Income | Without Mortgage | With Mortgage |
| Less than $10,000 | 19 (5.9%) | 0 (0.0%) |
| $10,000 to $24,999 | 17 (5.2%) | 0 (0.0%) |
| $25,000 to $34,999 | 31 (9.5%) | 42 (14.5%) |
| $35,000 to $49,999 | 62 (19.1%) | 33 (11.4%) |
| $50,000 to $74,999 | 53 (16.3%) | 49 (17.0%) |
| $75,000 to $99,999 | 47 (14.5%) | 20 (6.9%) |
| $100,000 to $149,999 | 62 (19.1%) | 31 (10.7%) |
| $150,000 or more | 34 (10.5%) | 49 (17.0%) |
| Total | 325 (100.0%) | 289 (100.0%) |
Property Value to Household Income Ratio in Sherman County
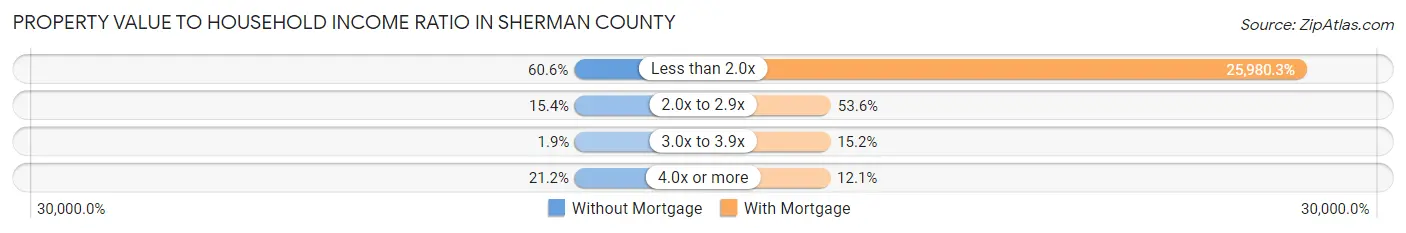
| Value-to-Income Ratio | Without Mortgage | With Mortgage |
| Less than 2.0x | 197 (60.6%) | 75,083 (25,980.3%) |
| 2.0x to 2.9x | 50 (15.4%) | 155 (53.6%) |
| 3.0x to 3.9x | 6 (1.8%) | 44 (15.2%) |
| 4.0x or more | 69 (21.2%) | 35 (12.1%) |
| Total | 325 (100.0%) | 289 (100.0%) |
Real Estate Taxes by Mortgage Status in Sherman County
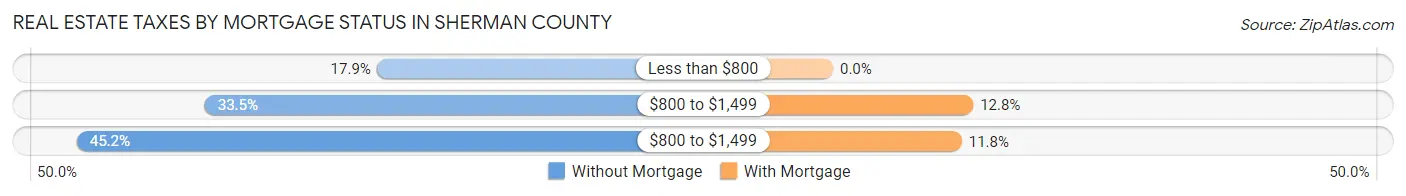
| Property Taxes | Without Mortgage | With Mortgage |
| Less than $800 | 58 (17.8%) | 0 (0.0%) |
| $800 to $1,499 | 109 (33.5%) | 37 (12.8%) |
| $800 to $1,499 | 147 (45.2%) | 34 (11.8%) |
| Total | 325 (100.0%) | 289 (100.0%) |
Health & Disability in Sherman County
Health Insurance Coverage by Age in Sherman County
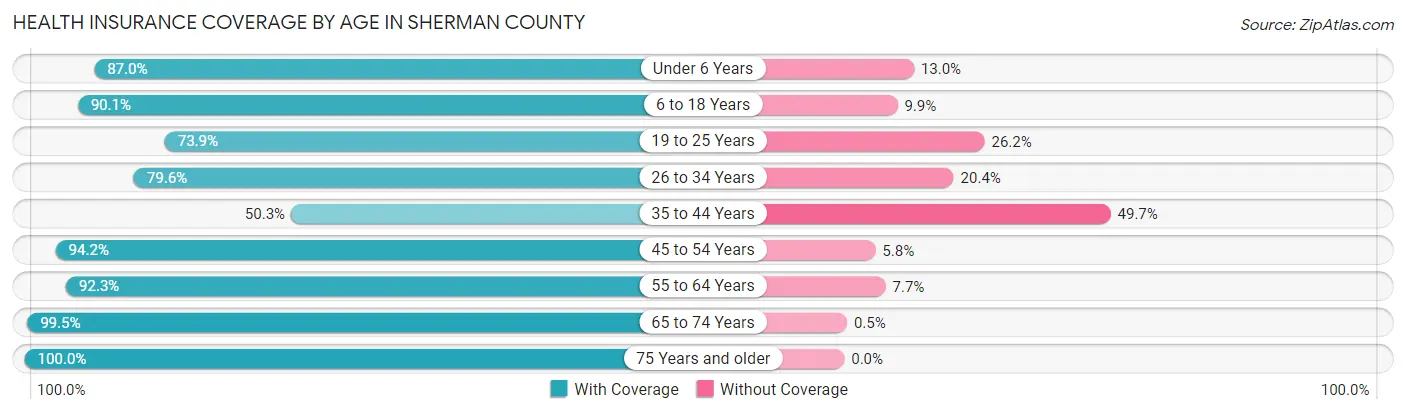
| Age Bracket | With Coverage | Without Coverage |
| Under 6 Years | 134 (87.0%) | 20 (13.0%) |
| 6 to 18 Years | 400 (90.1%) | 44 (9.9%) |
| 19 to 25 Years | 192 (73.9%) | 68 (26.2%) |
| 26 to 34 Years | 164 (79.6%) | 42 (20.4%) |
| 35 to 44 Years | 147 (50.3%) | 145 (49.7%) |
| 45 to 54 Years | 211 (94.2%) | 13 (5.8%) |
| 55 to 64 Years | 395 (92.3%) | 33 (7.7%) |
| 65 to 74 Years | 198 (99.5%) | 1 (0.5%) |
| 75 Years and older | 173 (100.0%) | 0 (0.0%) |
| Total | 2,014 (84.6%) | 366 (15.4%) |
Health Insurance Coverage by Citizenship Status in Sherman County
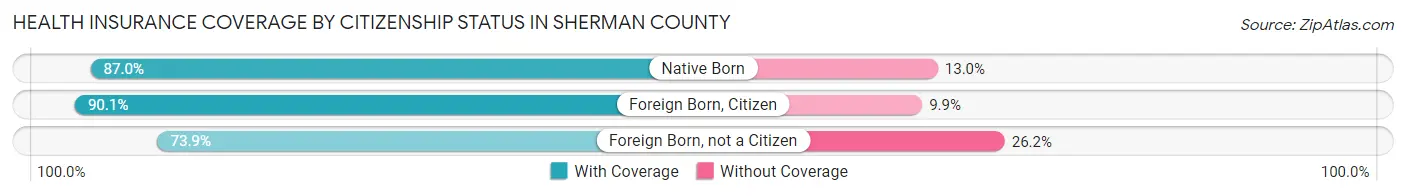
| Citizenship Status | With Coverage | Without Coverage |
| Native Born | 134 (87.0%) | 20 (13.0%) |
| Foreign Born, Citizen | 400 (90.1%) | 44 (9.9%) |
| Foreign Born, not a Citizen | 192 (73.9%) | 68 (26.2%) |
Health Insurance Coverage by Household Income in Sherman County
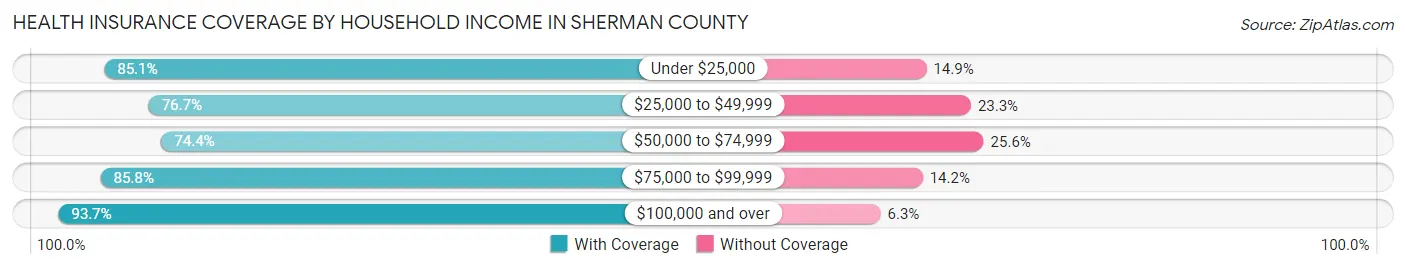
| Household Income | With Coverage | Without Coverage |
| Under $25,000 | 114 (85.1%) | 20 (14.9%) |
| $25,000 to $49,999 | 452 (76.7%) | 137 (23.3%) |
| $50,000 to $74,999 | 232 (74.4%) | 80 (25.6%) |
| $75,000 to $99,999 | 476 (85.8%) | 79 (14.2%) |
| $100,000 and over | 740 (93.7%) | 50 (6.3%) |
Public vs Private Health Insurance Coverage by Age in Sherman County
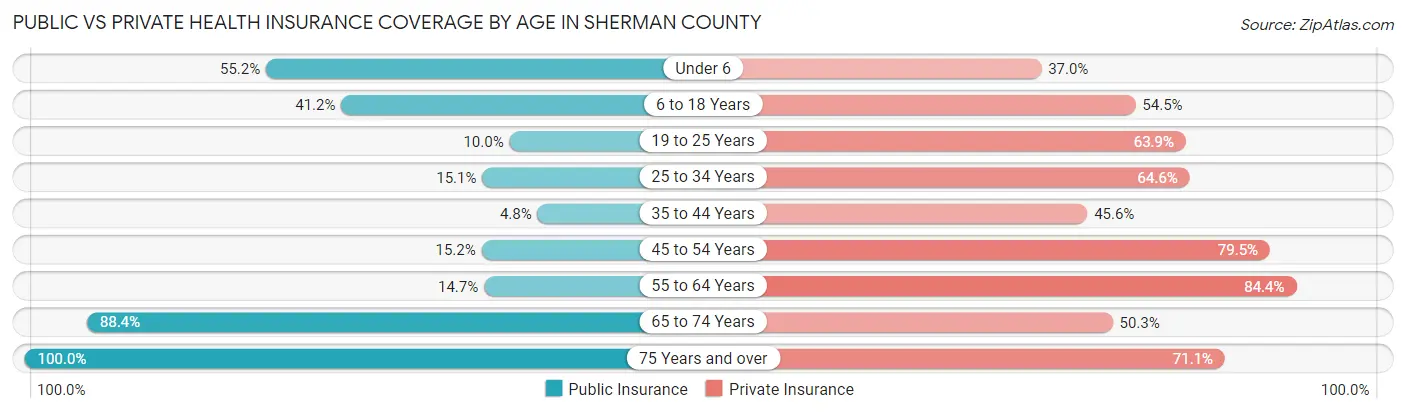
| Age Bracket | Public Insurance | Private Insurance |
| Under 6 | 85 (55.2%) | 57 (37.0%) |
| 6 to 18 Years | 183 (41.2%) | 242 (54.5%) |
| 19 to 25 Years | 26 (10.0%) | 166 (63.8%) |
| 25 to 34 Years | 31 (15.0%) | 133 (64.6%) |
| 35 to 44 Years | 14 (4.8%) | 133 (45.6%) |
| 45 to 54 Years | 34 (15.2%) | 178 (79.5%) |
| 55 to 64 Years | 63 (14.7%) | 361 (84.4%) |
| 65 to 74 Years | 176 (88.4%) | 100 (50.2%) |
| 75 Years and over | 173 (100.0%) | 123 (71.1%) |
| Total | 785 (33.0%) | 1,493 (62.7%) |
Disability Status by Sex by Age in Sherman County
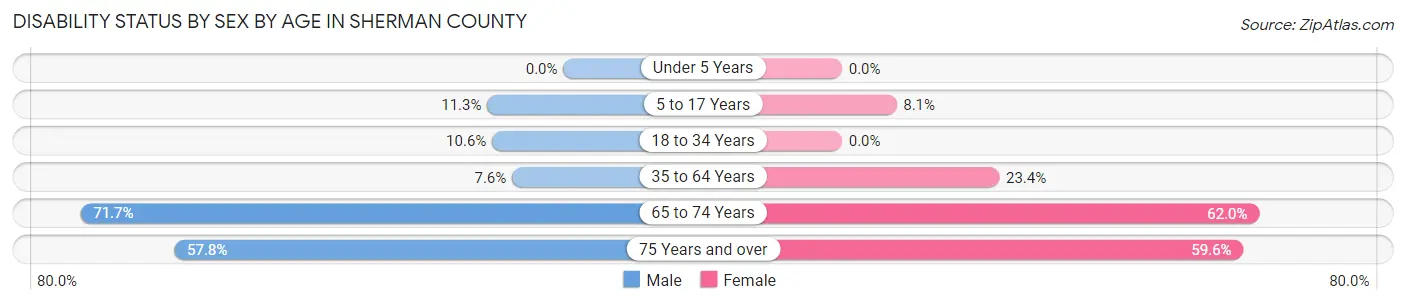
| Age Bracket | Male | Female |
| Under 5 Years | 0 (0.0%) | 0 (0.0%) |
| 5 to 17 Years | 28 (11.3%) | 14 (8.1%) |
| 18 to 34 Years | 28 (10.6%) | 0 (0.0%) |
| 35 to 64 Years | 36 (7.6%) | 110 (23.4%) |
| 65 to 74 Years | 71 (71.7%) | 62 (62.0%) |
| 75 Years and over | 37 (57.8%) | 65 (59.6%) |
Disability Class by Sex by Age in Sherman County
Disability Class: Hearing Difficulty
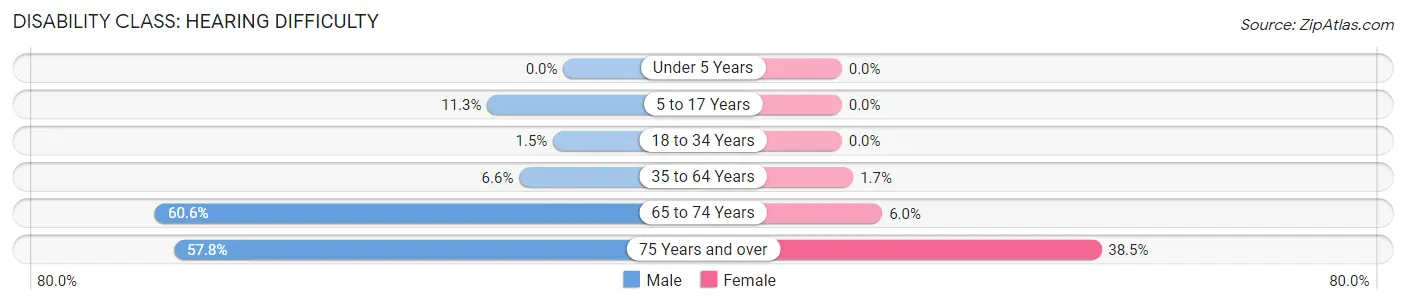
| Age Bracket | Male | Female |
| Under 5 Years | 0 (0.0%) | 0 (0.0%) |
| 5 to 17 Years | 28 (11.3%) | 0 (0.0%) |
| 18 to 34 Years | 4 (1.5%) | 0 (0.0%) |
| 35 to 64 Years | 31 (6.6%) | 8 (1.7%) |
| 65 to 74 Years | 60 (60.6%) | 6 (6.0%) |
| 75 Years and over | 37 (57.8%) | 42 (38.5%) |
Disability Class: Vision Difficulty
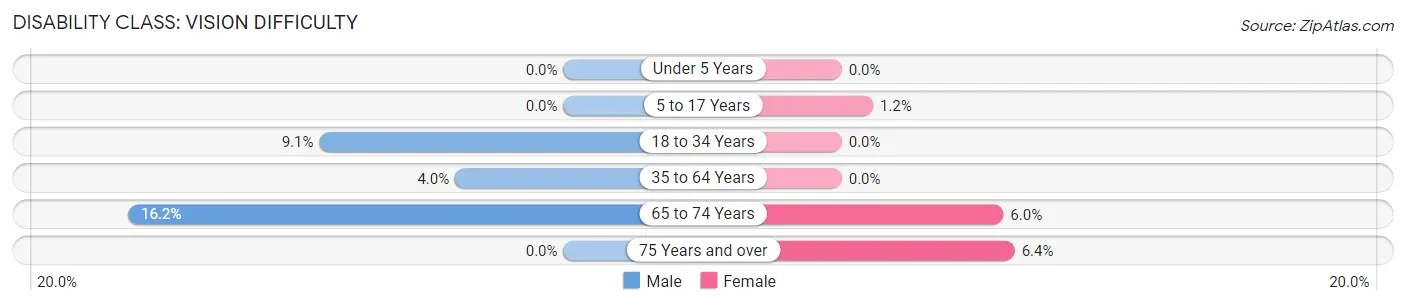
| Age Bracket | Male | Female |
| Under 5 Years | 0 (0.0%) | 0 (0.0%) |
| 5 to 17 Years | 0 (0.0%) | 2 (1.2%) |
| 18 to 34 Years | 24 (9.1%) | 0 (0.0%) |
| 35 to 64 Years | 19 (4.0%) | 0 (0.0%) |
| 65 to 74 Years | 16 (16.2%) | 6 (6.0%) |
| 75 Years and over | 0 (0.0%) | 7 (6.4%) |
Disability Class: Cognitive Difficulty
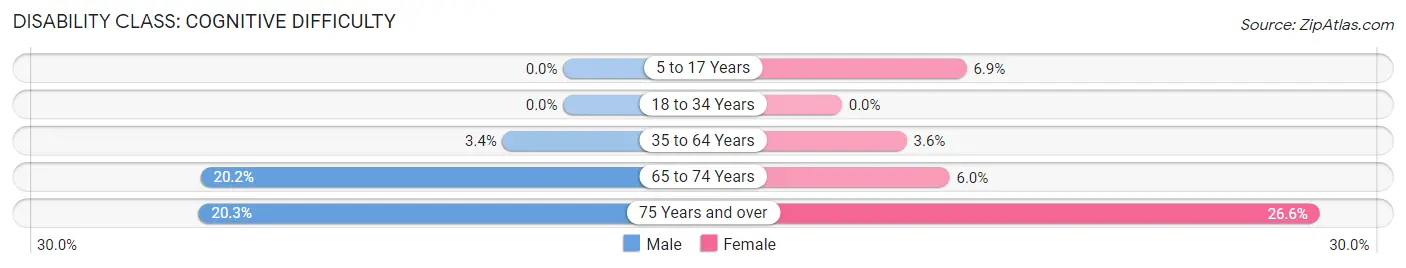
| Age Bracket | Male | Female |
| 5 to 17 Years | 0 (0.0%) | 12 (6.9%) |
| 18 to 34 Years | 0 (0.0%) | 0 (0.0%) |
| 35 to 64 Years | 16 (3.4%) | 17 (3.6%) |
| 65 to 74 Years | 20 (20.2%) | 6 (6.0%) |
| 75 Years and over | 13 (20.3%) | 29 (26.6%) |
Disability Class: Ambulatory Difficulty
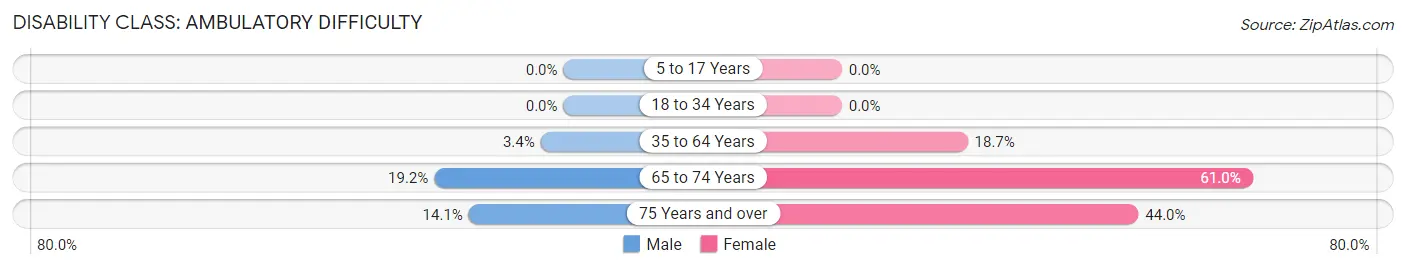
| Age Bracket | Male | Female |
| 5 to 17 Years | 0 (0.0%) | 0 (0.0%) |
| 18 to 34 Years | 0 (0.0%) | 0 (0.0%) |
| 35 to 64 Years | 16 (3.4%) | 88 (18.7%) |
| 65 to 74 Years | 19 (19.2%) | 61 (61.0%) |
| 75 Years and over | 9 (14.1%) | 48 (44.0%) |
Disability Class: Self-Care Difficulty
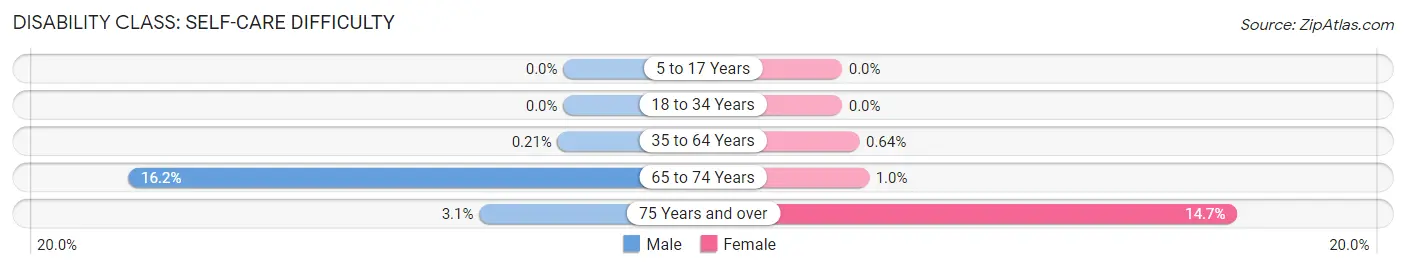
| Age Bracket | Male | Female |
| 5 to 17 Years | 0 (0.0%) | 0 (0.0%) |
| 18 to 34 Years | 0 (0.0%) | 0 (0.0%) |
| 35 to 64 Years | 1 (0.2%) | 3 (0.6%) |
| 65 to 74 Years | 16 (16.2%) | 1 (1.0%) |
| 75 Years and over | 2 (3.1%) | 16 (14.7%) |
Technology Access in Sherman County
Computing Device Access in Sherman County
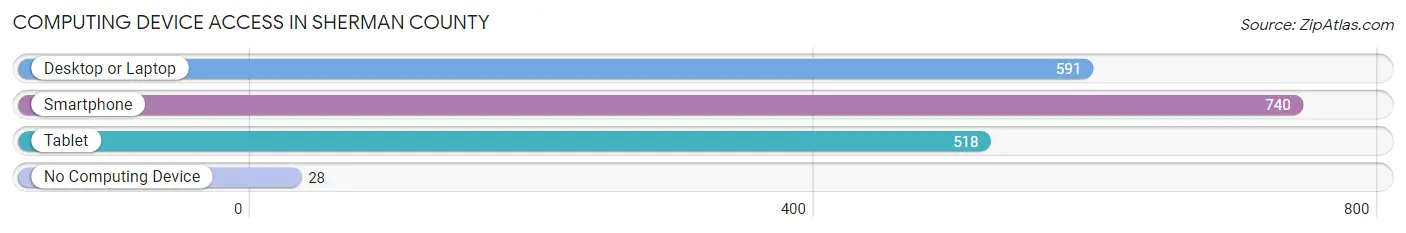
| Device Type | # Households | % Households |
| Desktop or Laptop | 591 | 73.6% |
| Smartphone | 740 | 92.1% |
| Tablet | 518 | 64.5% |
| No Computing Device | 28 | 3.5% |
| Total | 803 | 100.0% |
Internet Access in Sherman County
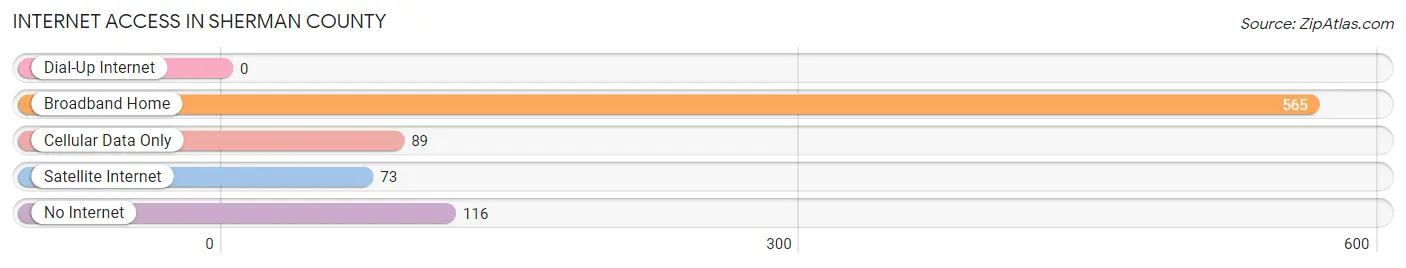
| Internet Type | # Households | % Households |
| Dial-Up Internet | 0 | 0.0% |
| Broadband Home | 565 | 70.4% |
| Cellular Data Only | 89 | 11.1% |
| Satellite Internet | 73 | 9.1% |
| No Internet | 116 | 14.4% |
| Total | 803 | 100.0% |
Sherman County Summary
Sherman County is located in the Texas Panhandle, in the northwestern corner of the state. It is bordered by Oklahoma to the north, Hansford County to the east, Moore County to the south, and Dallam County to the west. The county seat is Stratford, and the largest city is Stratford. The county has a total area of 902 square miles, of which 899 square miles is land and 3 square miles is water.
History
Sherman County was established in 1876 and named for Sidney Sherman, a hero of the Texas Revolution. The county was originally part of Bexar County, but was later divided into several smaller counties. The first settlers in the area were ranchers, who were attracted by the abundance of grass and water. The first town in the county was Stratford, which was founded in 1887.
Geography
Sherman County is located in the Texas Panhandle, in the northwestern corner of the state. It is bordered by Oklahoma to the north, Hansford County to the east, Moore County to the south, and Dallam County to the west. The county has a total area of 902 square miles, of which 899 square miles is land and 3 square miles is water. The terrain is mostly flat, with some rolling hills in the western part of the county. The county is drained by the Canadian River and its tributaries.
Economy
Agriculture is the main economic activity in Sherman County. The county is home to a variety of crops, including wheat, corn, sorghum, cotton, and hay. Cattle and sheep are also raised in the area. Oil and gas production is also an important part of the economy.
Demographics
As of the 2010 census, there were 3,621 people, 1,521 households, and 1,039 families living in the county. The population density was 4 people per square mile. The racial makeup of the county was 88.3% White, 0.3% African American, 0.7% Native American, 0.2% Asian, 0.1% Pacific Islander, 8.7% from other races, and 1.9% from two or more races. Hispanic or Latino of any race were 16.3% of the population.
The median income for a household in the county was $35,938, and the median income for a family was $41,944. The per capita income for the county was $17,845. About 14.2% of families and 17.7% of the population were below the poverty line, including 22.2% of those under age 18 and 14.2% of those age 65 or over.
Common Questions
What is Per Capita Income in Sherman County?
Per Capita income in Sherman County is $43,340.
What is the Median Family Income in Sherman County?
Median Family Income in Sherman County is $83,158.
What is the Median Household income in Sherman County?
Median Household Income in Sherman County is $66,169.
What is Income or Wage Gap in Sherman County?
Income or Wage Gap in Sherman County is 21.0%.
Women in Sherman County earn 79.0 cents for every dollar earned by a man.
What is Family Income Deficit in Sherman County?
Family Income Deficit in Sherman County is $13,056.
Families that are below poverty line in Sherman County earn $13,056 less on average than the poverty threshold level.
What is Inequality or Gini Index in Sherman County?
Inequality or Gini Index in Sherman County is 0.56.
What is the Total Population of Sherman County?
Total Population of Sherman County is 2,414.
What is the Total Male Population of Sherman County?
Total Male Population of Sherman County is 1,188.
What is the Total Female Population of Sherman County?
Total Female Population of Sherman County is 1,226.
What is the Ratio of Males per 100 Females in Sherman County?
There are 96.90 Males per 100 Females in Sherman County.
What is the Ratio of Females per 100 Males in Sherman County?
There are 103.20 Females per 100 Males in Sherman County.
What is the Median Population Age in Sherman County?
Median Population Age in Sherman County is 38.4 Years.
What is the Average Family Size in Sherman County
Average Family Size in Sherman County is 3.6 People.
What is the Average Household Size in Sherman County
Average Household Size in Sherman County is 3.0 People.
How Large is the Labor Force in Sherman County?
There are 1,179 People in the Labor Forcein in Sherman County.
What is the Percentage of People in the Labor Force in Sherman County?
61.2% of People are in the Labor Force in Sherman County.
What is the Unemployment Rate in Sherman County?
Unemployment Rate in Sherman County is 1.5%.