Shackelford County, TX Map & Demographics
Shackelford County Map
Shackelford County Overview
$32,245
PER CAPITA INCOME
$83,083
AVG FAMILY INCOME
$60,924
AVG HOUSEHOLD INCOME
28.6%
WAGE / INCOME GAP [ % ]
71.4¢/ $1
WAGE / INCOME GAP [ $ ]
0.44
INEQUALITY / GINI INDEX
3,134
TOTAL POPULATION
1,583
MALE POPULATION
1,551
FEMALE POPULATION
102.06
MALES / 100 FEMALES
97.98
FEMALES / 100 MALES
42.9
MEDIAN AGE
2.9
AVG FAMILY SIZE
2.3
AVG HOUSEHOLD SIZE
1,619
LABOR FORCE [ PEOPLE ]
65.2%
PERCENT IN LABOR FORCE
7.2%
UNEMPLOYMENT RATE
Shackelford County Area Codes
Income in Shackelford County
Income Overview in Shackelford County
Per Capita Income in Shackelford County is $32,245, while median incomes of families and households are $83,083 and $60,924 respectively.
| Characteristic | Number | Measure |
| Per Capita Income | 3,134 | $32,245 |
| Median Family Income | 872 | $83,083 |
| Mean Family Income | 872 | $96,395 |
| Median Household Income | 1,324 | $60,924 |
| Mean Household Income | 1,324 | $76,415 |
| Income Deficit | 872 | $0 |
| Wage / Income Gap (%) | 3,134 | 28.63% |
| Wage / Income Gap ($) | 3,134 | 71.37¢ per $1 |
| Gini / Inequality Index | 3,134 | 0.44 |
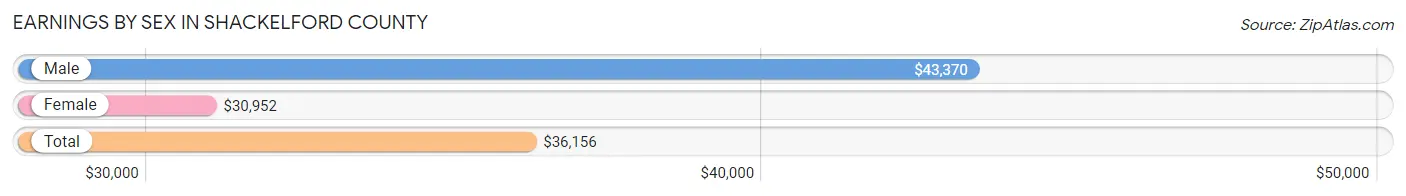
Earnings by Sex in Shackelford County
Average Earnings in Shackelford County are $36,156, $43,370 for men and $30,952 for women, a difference of 28.6%.
| Sex | Number | Average Earnings |
| Male | 886 (51.1%) | $43,370 |
| Female | 848 (48.9%) | $30,952 |
| Total | 1,734 (100.0%) | $36,156 |
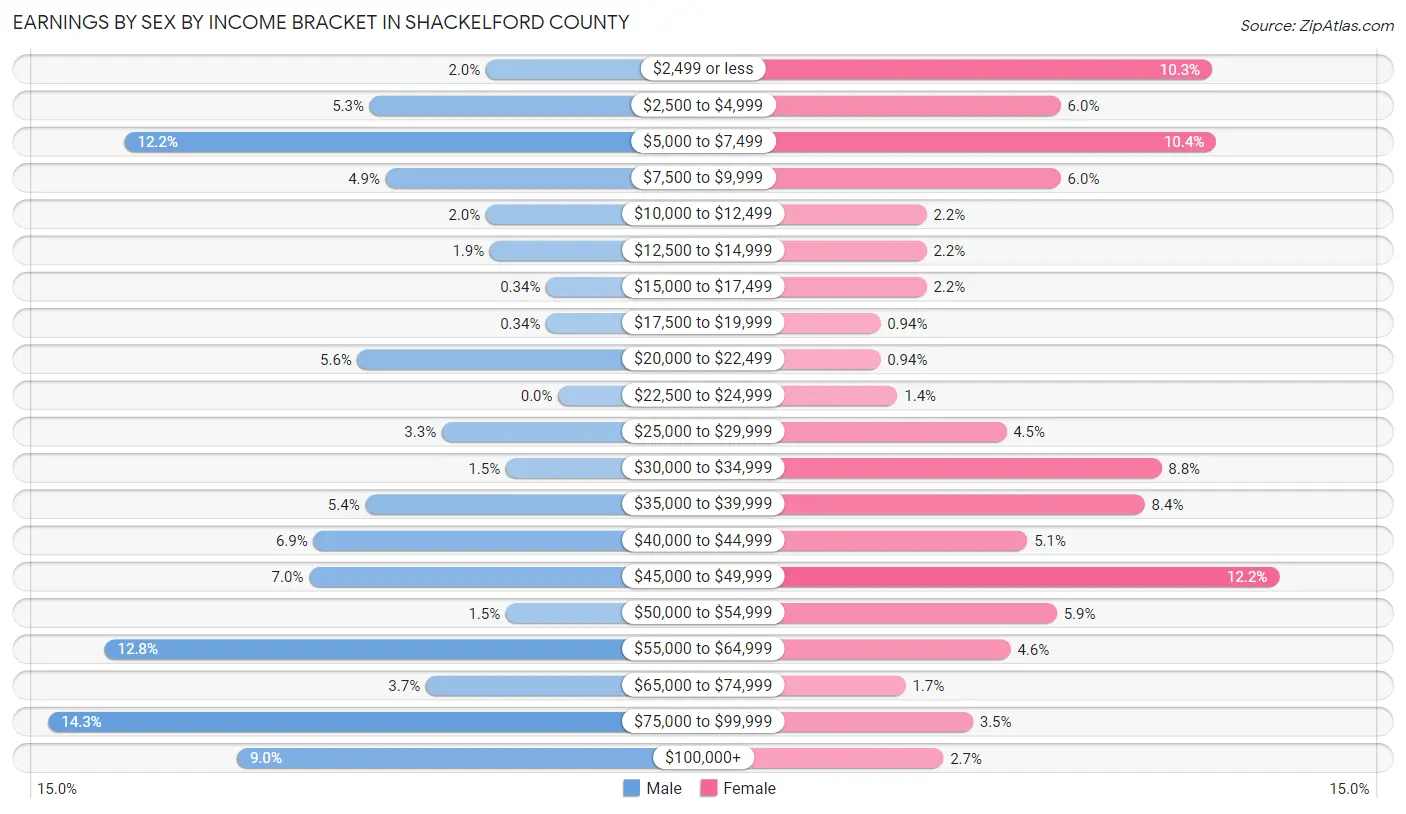
Earnings by Sex by Income Bracket in Shackelford County
The most common earnings brackets in Shackelford County are $75,000 to $99,999 for men (127 | 14.3%) and $45,000 to $49,999 for women (103 | 12.1%).
| Income | Male | Female |
| $2,499 or less | 18 (2.0%) | 87 (10.3%) |
| $2,500 to $4,999 | 47 (5.3%) | 51 (6.0%) |
| $5,000 to $7,499 | 108 (12.2%) | 88 (10.4%) |
| $7,500 to $9,999 | 43 (4.9%) | 51 (6.0%) |
| $10,000 to $12,499 | 18 (2.0%) | 19 (2.2%) |
| $12,500 to $14,999 | 17 (1.9%) | 19 (2.2%) |
| $15,000 to $17,499 | 3 (0.3%) | 19 (2.2%) |
| $17,500 to $19,999 | 3 (0.3%) | 8 (0.9%) |
| $20,000 to $22,499 | 50 (5.6%) | 8 (0.9%) |
| $22,500 to $24,999 | 0 (0.0%) | 12 (1.4%) |
| $25,000 to $29,999 | 29 (3.3%) | 38 (4.5%) |
| $30,000 to $34,999 | 13 (1.5%) | 75 (8.8%) |
| $35,000 to $39,999 | 48 (5.4%) | 71 (8.4%) |
| $40,000 to $44,999 | 61 (6.9%) | 43 (5.1%) |
| $45,000 to $49,999 | 62 (7.0%) | 103 (12.1%) |
| $50,000 to $54,999 | 13 (1.5%) | 50 (5.9%) |
| $55,000 to $64,999 | 113 (12.8%) | 39 (4.6%) |
| $65,000 to $74,999 | 33 (3.7%) | 14 (1.7%) |
| $75,000 to $99,999 | 127 (14.3%) | 30 (3.5%) |
| $100,000+ | 80 (9.0%) | 23 (2.7%) |
| Total | 886 (100.0%) | 848 (100.0%) |
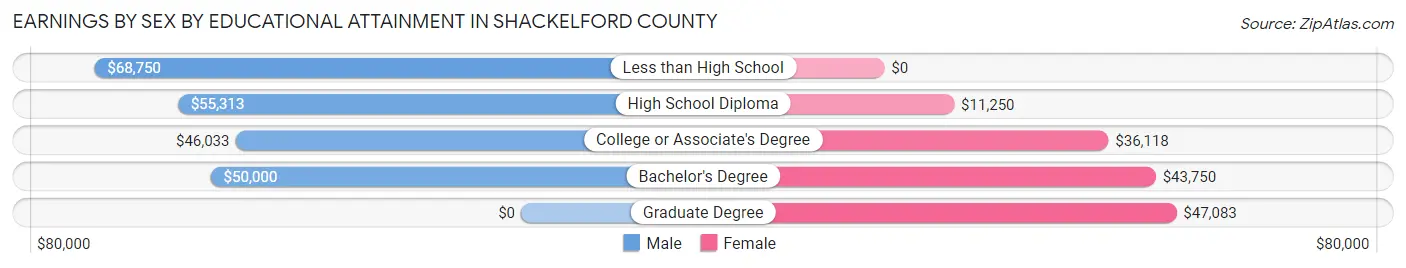
Earnings by Sex by Educational Attainment in Shackelford County
Average earnings in Shackelford County are $53,000 for men and $32,381 for women, a difference of 38.9%. Men with an educational attainment of less than high school enjoy the highest average annual earnings of $68,750, while those with college or associate's degree education earn the least with $46,033. Women with an educational attainment of graduate degree earn the most with the average annual earnings of $47,083, while those with high school diploma education have the smallest earnings of $11,250.
| Educational Attainment | Male Income | Female Income |
| Less than High School | $68,750 | $0 |
| High School Diploma | $55,313 | $11,250 |
| College or Associate's Degree | $46,033 | $36,118 |
| Bachelor's Degree | $50,000 | $43,750 |
| Graduate Degree | - | - |
| Total | $53,000 | $32,381 |
Family Income in Shackelford County
Family Income Brackets in Shackelford County
According to the Shackelford County family income data, there are 190 families falling into the $100,000 to $149,999 income range, which is the most common income bracket and makes up 21.8% of all families. Conversely, the $10,000 to $14,999 income bracket is the least frequent group with only 9 families (1.0%) belonging to this category.
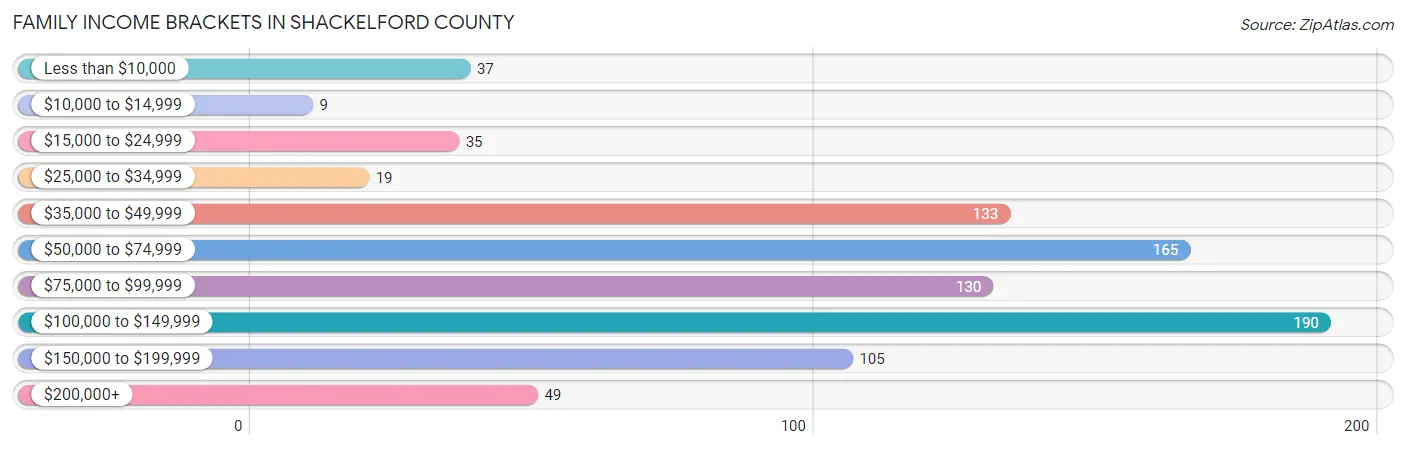
| Income Bracket | # Families | % Families |
| Less than $10,000 | 37 | 4.2% |
| $10,000 to $14,999 | 9 | 1.0% |
| $15,000 to $24,999 | 35 | 4.0% |
| $25,000 to $34,999 | 19 | 2.2% |
| $35,000 to $49,999 | 133 | 15.3% |
| $50,000 to $74,999 | 165 | 18.9% |
| $75,000 to $99,999 | 130 | 14.9% |
| $100,000 to $149,999 | 190 | 21.8% |
| $150,000 to $199,999 | 105 | 12.0% |
| $200,000+ | 49 | 5.6% |
Family Income by Famaliy Size in Shackelford County
3-person families (90 | 10.3%) account for the highest median family income in Shackelford County with $185,119 per family, while 3-person families (90 | 10.3%) have the highest median income of $61,706 per family member.
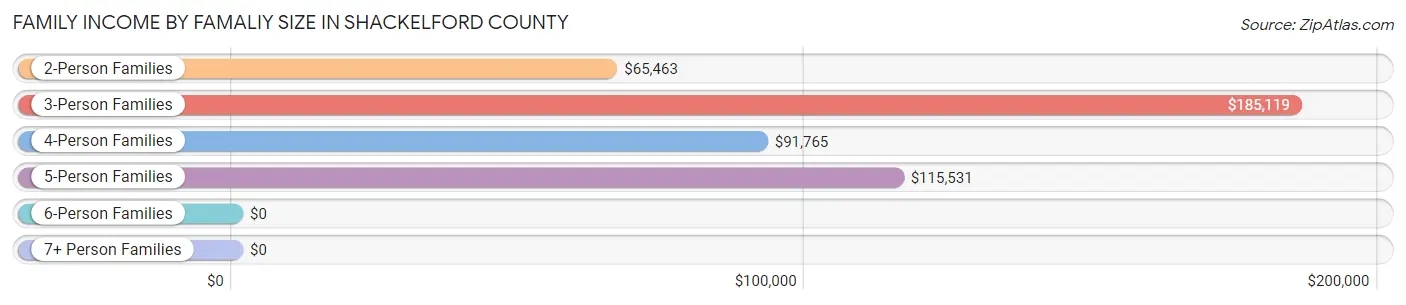
| Income Bracket | # Families | Median Income |
| 2-Person Families | 522 (59.9%) | $65,463 |
| 3-Person Families | 90 (10.3%) | $185,119 |
| 4-Person Families | 102 (11.7%) | $91,765 |
| 5-Person Families | 127 (14.6%) | $115,531 |
| 6-Person Families | 29 (3.3%) | $0 |
| 7+ Person Families | 2 (0.2%) | $0 |
| Total | 872 (100.0%) | $83,083 |
Family Income by Number of Earners in Shackelford County
The median family income in Shackelford County is $83,083, with families comprising 3+ earners (132) having the highest median family income of $115,500, while families with no earners (159) have the lowest median family income of $47,829, accounting for 15.1% and 18.2% of families, respectively.
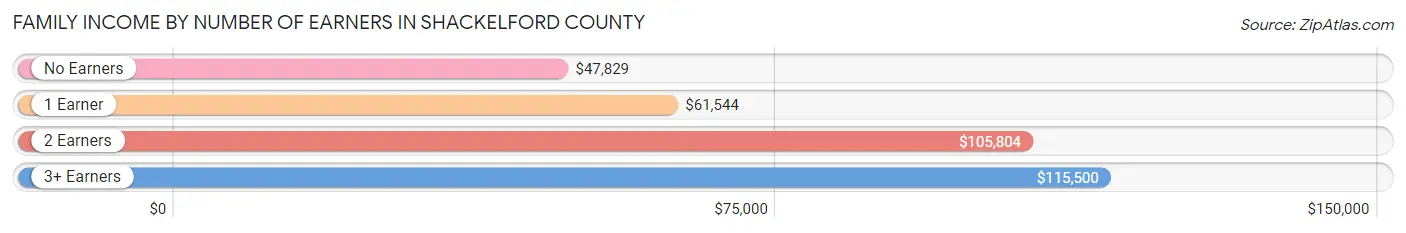
| Number of Earners | # Families | Median Income |
| No Earners | 159 (18.2%) | $47,829 |
| 1 Earner | 219 (25.1%) | $61,544 |
| 2 Earners | 362 (41.5%) | $105,804 |
| 3+ Earners | 132 (15.1%) | $115,500 |
| Total | 872 (100.0%) | $83,083 |
Household Income in Shackelford County
Household Income Brackets in Shackelford County
With 237 households falling in the category, the $35,000 to $49,999 income range is the most frequent in Shackelford County, accounting for 17.9% of all households. In contrast, only 34 households (2.6%) fall into the $25,000 to $34,999 income bracket, making it the least populous group.
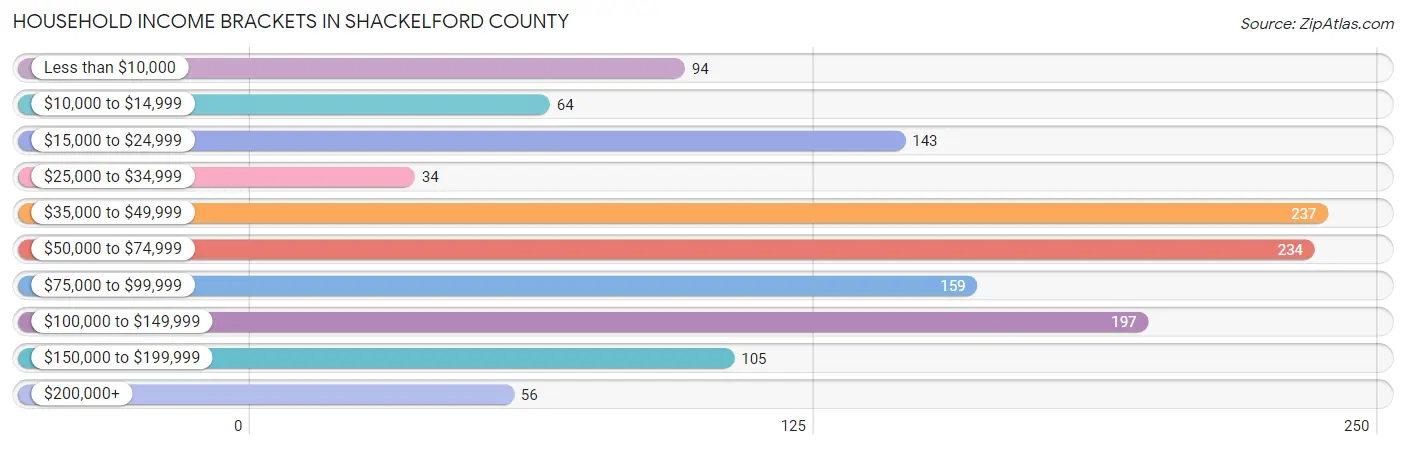
| Income Bracket | # Households | % Households |
| Less than $10,000 | 94 | 7.1% |
| $10,000 to $14,999 | 64 | 4.8% |
| $15,000 to $24,999 | 143 | 10.8% |
| $25,000 to $34,999 | 34 | 2.6% |
| $35,000 to $49,999 | 237 | 17.9% |
| $50,000 to $74,999 | 234 | 17.7% |
| $75,000 to $99,999 | 159 | 12.0% |
| $100,000 to $149,999 | 197 | 14.9% |
| $150,000 to $199,999 | 105 | 7.9% |
| $200,000+ | 56 | 4.2% |
Household Income by Householder Age in Shackelford County
The median household income in Shackelford County is $60,924, with the highest median household income of $81,771 found in the 25 to 44 years age bracket for the primary householder. A total of 384 households (29.0%) fall into this category. Meanwhile, the 15 to 24 years age bracket for the primary householder has the lowest median household income of $0, with 69 households (5.2%) in this group.
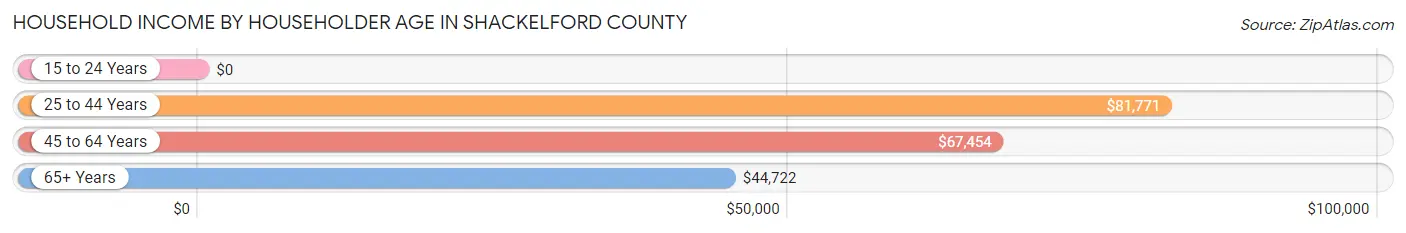
| Income Bracket | # Households | Median Income |
| 15 to 24 Years | 69 (5.2%) | $0 |
| 25 to 44 Years | 384 (29.0%) | $81,771 |
| 45 to 64 Years | 477 (36.0%) | $67,454 |
| 65+ Years | 394 (29.8%) | $44,722 |
| Total | 1,324 (100.0%) | $60,924 |
Poverty in Shackelford County
Income Below Poverty by Sex and Age in Shackelford County
With 8.6% poverty level for males and 14.0% for females among the residents of Shackelford County, 16 and 17 year old males and 18 to 24 year old females are the most vulnerable to poverty, with 48 males (78.7%) and 67 females (55.4%) in their respective age groups living below the poverty level.
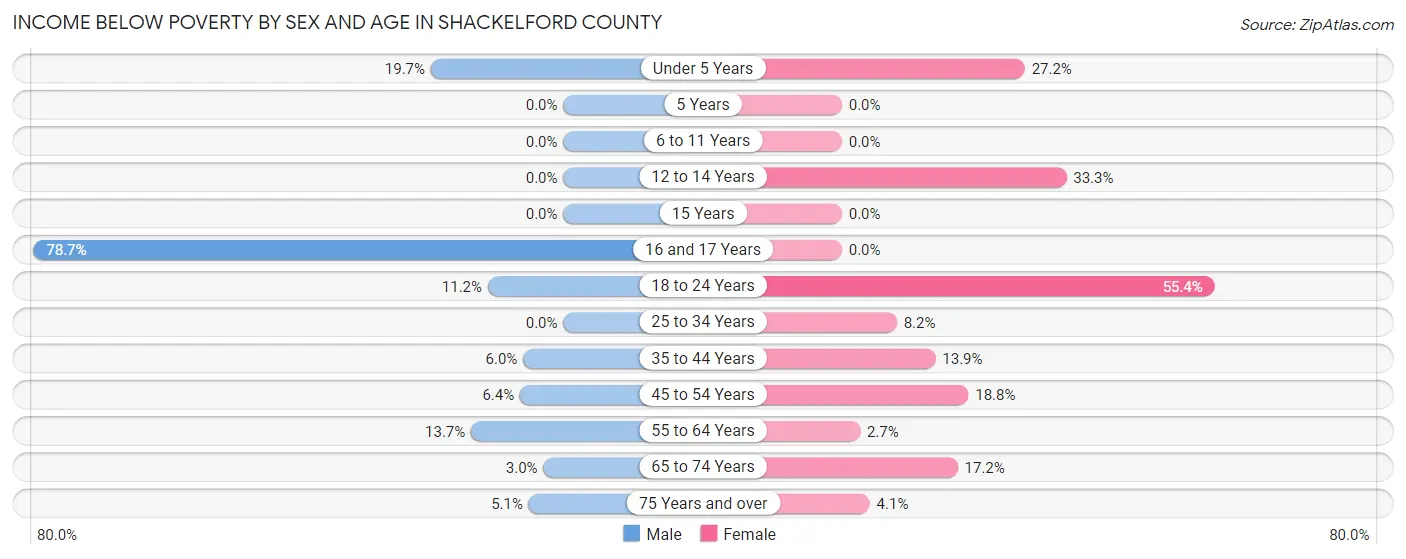
| Age Bracket | Male | Female |
| Under 5 Years | 12 (19.7%) | 22 (27.2%) |
| 5 Years | 0 (0.0%) | 0 (0.0%) |
| 6 to 11 Years | 0 (0.0%) | 0 (0.0%) |
| 12 to 14 Years | 0 (0.0%) | 11 (33.3%) |
| 15 Years | 0 (0.0%) | 0 (0.0%) |
| 16 and 17 Years | 48 (78.7%) | 0 (0.0%) |
| 18 to 24 Years | 13 (11.2%) | 67 (55.4%) |
| 25 to 34 Years | 0 (0.0%) | 12 (8.2%) |
| 35 to 44 Years | 8 (6.0%) | 25 (13.9%) |
| 45 to 54 Years | 11 (6.4%) | 34 (18.8%) |
| 55 to 64 Years | 30 (13.7%) | 8 (2.7%) |
| 65 to 74 Years | 5 (3.0%) | 32 (17.2%) |
| 75 Years and over | 6 (5.1%) | 6 (4.1%) |
| Total | 133 (8.6%) | 217 (14.0%) |
Income Above Poverty by Sex and Age in Shackelford County
According to the poverty statistics in Shackelford County, males aged 5 years and females aged 5 years are the age groups that are most secure financially, with 100.0% of males and 100.0% of females in these age groups living above the poverty line.
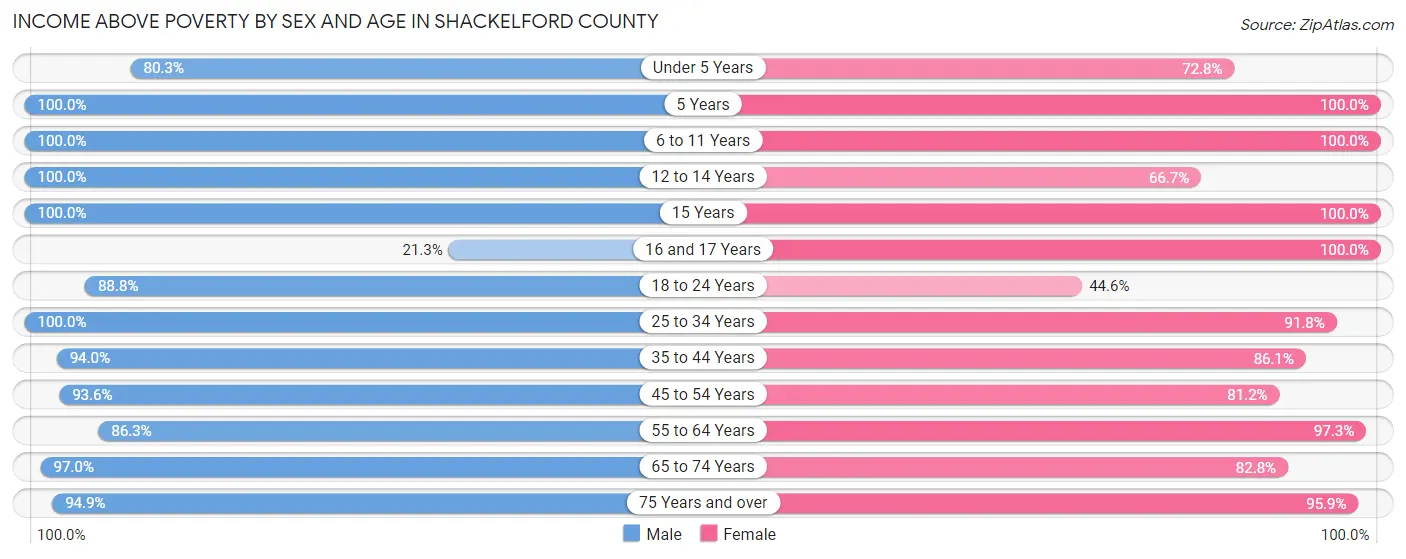
| Age Bracket | Male | Female |
| Under 5 Years | 49 (80.3%) | 59 (72.8%) |
| 5 Years | 36 (100.0%) | 29 (100.0%) |
| 6 to 11 Years | 80 (100.0%) | 106 (100.0%) |
| 12 to 14 Years | 134 (100.0%) | 22 (66.7%) |
| 15 Years | 66 (100.0%) | 17 (100.0%) |
| 16 and 17 Years | 13 (21.3%) | 29 (100.0%) |
| 18 to 24 Years | 103 (88.8%) | 54 (44.6%) |
| 25 to 34 Years | 182 (100.0%) | 135 (91.8%) |
| 35 to 44 Years | 126 (94.0%) | 155 (86.1%) |
| 45 to 54 Years | 160 (93.6%) | 147 (81.2%) |
| 55 to 64 Years | 189 (86.3%) | 288 (97.3%) |
| 65 to 74 Years | 164 (97.0%) | 154 (82.8%) |
| 75 Years and over | 111 (94.9%) | 139 (95.9%) |
| Total | 1,413 (91.4%) | 1,334 (86.0%) |
Income Below Poverty Among Married-Couple Families in Shackelford County
The poverty statistics for married-couple families in Shackelford County show that 1.9% or 14 of the total 735 families live below the poverty line. Families with 1 or 2 children have the highest poverty rate of 3.6%, comprising of 8 families. On the other hand, families with 3 or 4 children have the lowest poverty rate of 0.0%, which includes 0 families.
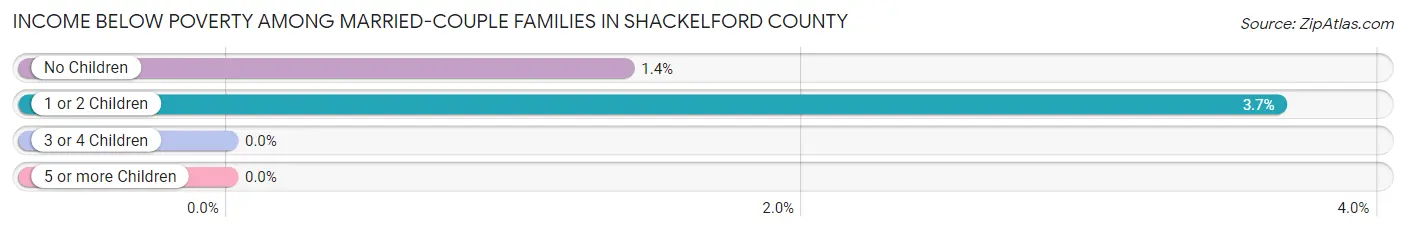
| Children | Above Poverty | Below Poverty |
| No Children | 430 (98.6%) | 6 (1.4%) |
| 1 or 2 Children | 211 (96.4%) | 8 (3.6%) |
| 3 or 4 Children | 80 (100.0%) | 0 (0.0%) |
| 5 or more Children | 0 (0.0%) | 0 (0.0%) |
| Total | 721 (98.1%) | 14 (1.9%) |
Income Below Poverty Among Single-Parent Households in Shackelford County
According to the poverty data in Shackelford County, 7.8% or 4 single-father households and 45.4% or 39 single-mother households are living below the poverty line. Among single-father households, those with no children have the highest poverty rate, with 4 households (23.5%) experiencing poverty. Likewise, among single-mother households, those with 1 or 2 children have the highest poverty rate, with 37 households (78.7%) falling below the poverty line.
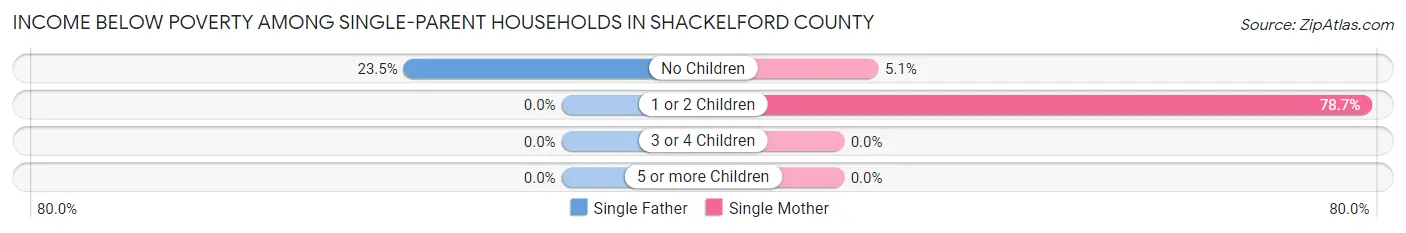
| Children | Single Father | Single Mother |
| No Children | 4 (23.5%) | 2 (5.1%) |
| 1 or 2 Children | 0 (0.0%) | 37 (78.7%) |
| 3 or 4 Children | 0 (0.0%) | 0 (0.0%) |
| 5 or more Children | 0 (0.0%) | 0 (0.0%) |
| Total | 4 (7.8%) | 39 (45.4%) |
Income Below Poverty Among Married-Couple vs Single-Parent Households in Shackelford County
The poverty data for Shackelford County shows that 14 of the married-couple family households (1.9%) and 43 of the single-parent households (31.4%) are living below the poverty level. Within the married-couple family households, those with 1 or 2 children have the highest poverty rate, with 8 households (3.6%) falling below the poverty line. Among the single-parent households, those with 1 or 2 children have the highest poverty rate, with 37 household (45.7%) living below poverty.
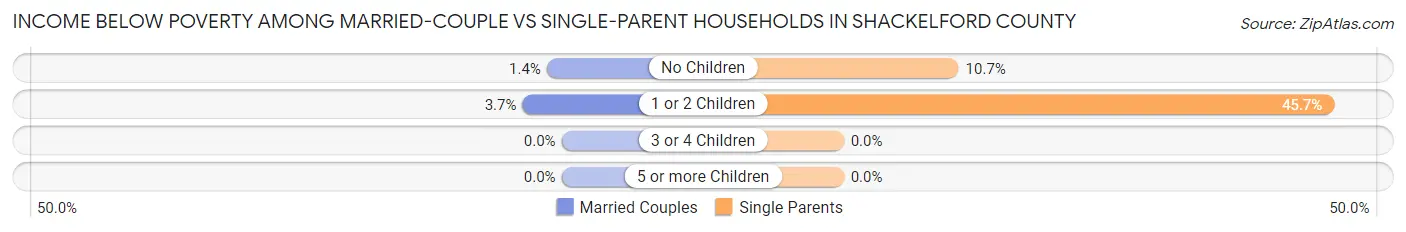
| Children | Married-Couple Families | Single-Parent Households |
| No Children | 6 (1.4%) | 6 (10.7%) |
| 1 or 2 Children | 8 (3.6%) | 37 (45.7%) |
| 3 or 4 Children | 0 (0.0%) | 0 (0.0%) |
| 5 or more Children | 0 (0.0%) | 0 (0.0%) |
| Total | 14 (1.9%) | 43 (31.4%) |
Race in Shackelford County
The most populous races in Shackelford County are White / Caucasian (2,847 | 90.8%), Hispanic or Latino (394 | 12.6%), and Two or more Races (153 | 4.9%).
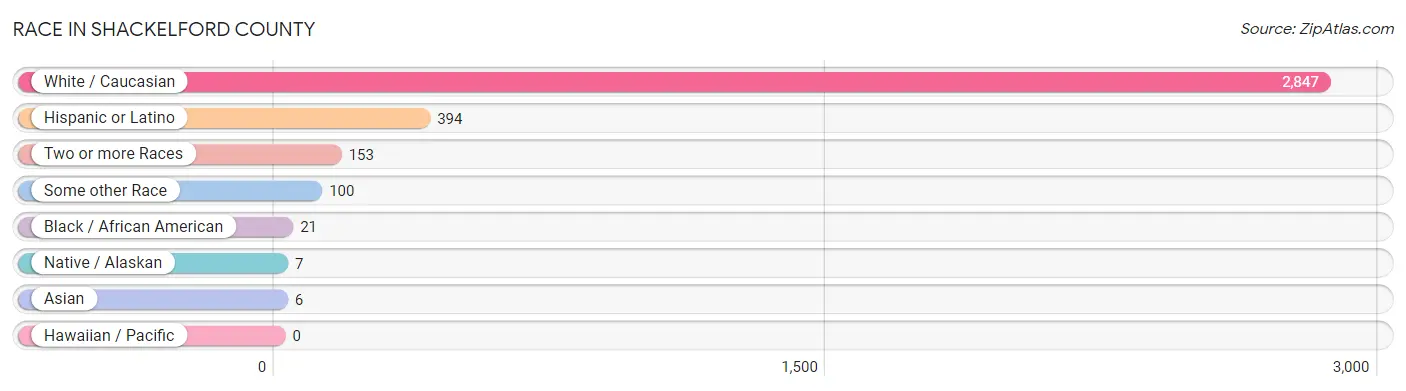
| Race | # Population | % Population |
| Asian | 6 | 0.2% |
| Black / African American | 21 | 0.7% |
| Hawaiian / Pacific | 0 | 0.0% |
| Hispanic or Latino | 394 | 12.6% |
| Native / Alaskan | 7 | 0.2% |
| White / Caucasian | 2,847 | 90.8% |
| Two or more Races | 153 | 4.9% |
| Some other Race | 100 | 3.2% |
| Total | 3,134 | 100.0% |
Ancestry in Shackelford County
The most populous ancestries reported in Shackelford County are Mexican (383 | 12.2%), Irish (347 | 11.1%), German (323 | 10.3%), American (322 | 10.3%), and English (309 | 9.9%), together accounting for 53.7% of all Shackelford County residents.
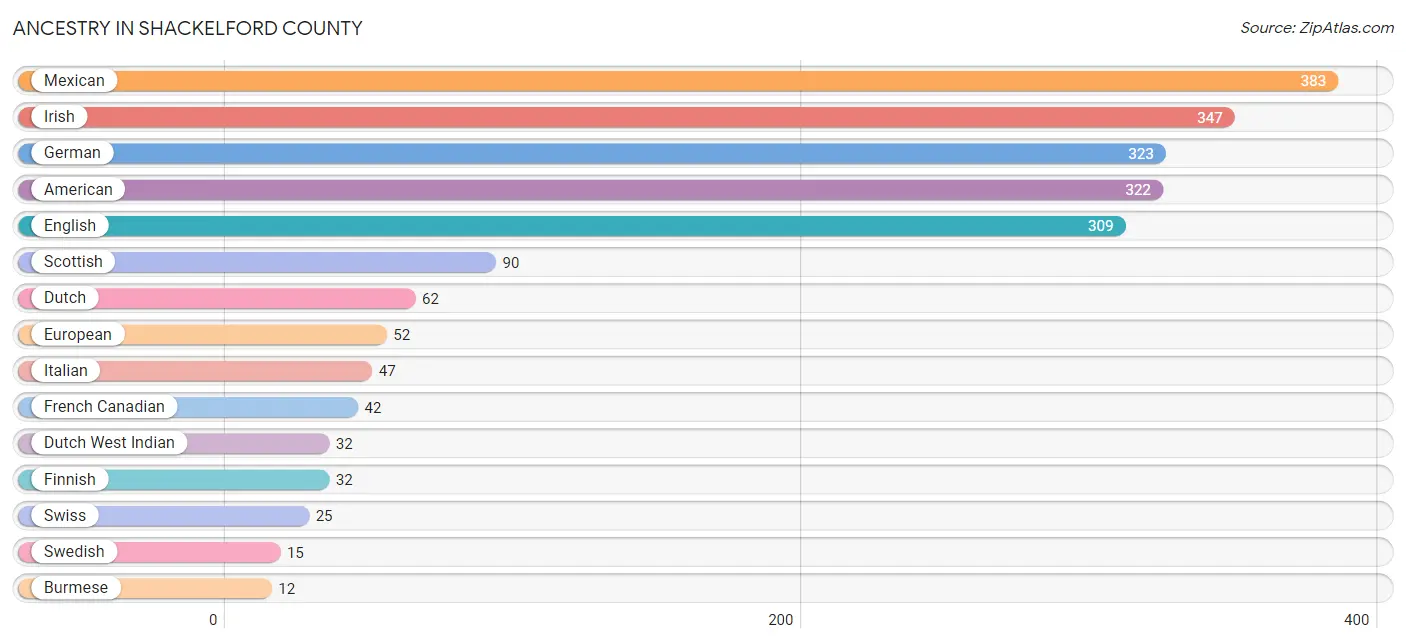
| Ancestry | # Population | % Population |
| African | 1 | 0.0% |
| American | 322 | 10.3% |
| Blackfeet | 1 | 0.0% |
| British | 8 | 0.3% |
| Burmese | 12 | 0.4% |
| Comanche | 4 | 0.1% |
| Dutch | 62 | 2.0% |
| Dutch West Indian | 32 | 1.0% |
| English | 309 | 9.9% |
| European | 52 | 1.7% |
| Finnish | 32 | 1.0% |
| French | 9 | 0.3% |
| French Canadian | 42 | 1.3% |
| German | 323 | 10.3% |
| Irish | 347 | 11.1% |
| Italian | 47 | 1.5% |
| Mexican | 383 | 12.2% |
| Norwegian | 5 | 0.2% |
| Polish | 6 | 0.2% |
| Scotch-Irish | 8 | 0.3% |
| Scottish | 90 | 2.9% |
| Slovene | 7 | 0.2% |
| Sri Lankan | 1 | 0.0% |
| Subsaharan African | 1 | 0.0% |
| Swedish | 15 | 0.5% |
| Swiss | 25 | 0.8% | View All 26 Rows |
Immigrants in Shackelford County
The most numerous immigrant groups reported in Shackelford County came from Central America (36 | 1.1%), Latin America (36 | 1.1%), Mexico (36 | 1.1%), Asia (5 | 0.2%), and Eastern Asia (5 | 0.2%), together accounting for 3.8% of all Shackelford County residents.
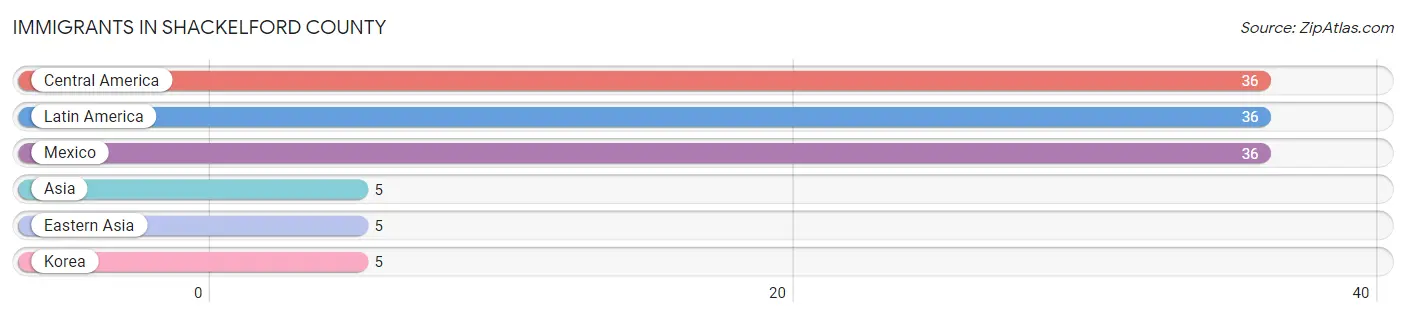
| Immigration Origin | # Population | % Population |
| Asia | 5 | 0.2% |
| Central America | 36 | 1.1% |
| Eastern Asia | 5 | 0.2% |
| Korea | 5 | 0.2% |
| Latin America | 36 | 1.1% |
| Mexico | 36 | 1.1% | View All 6 Rows |
Sex and Age in Shackelford County
Sex and Age in Shackelford County
The most populous age groups in Shackelford County are 15 to 19 Years (183 | 11.6%) for men and 55 to 59 Years (176 | 11.4%) for women.
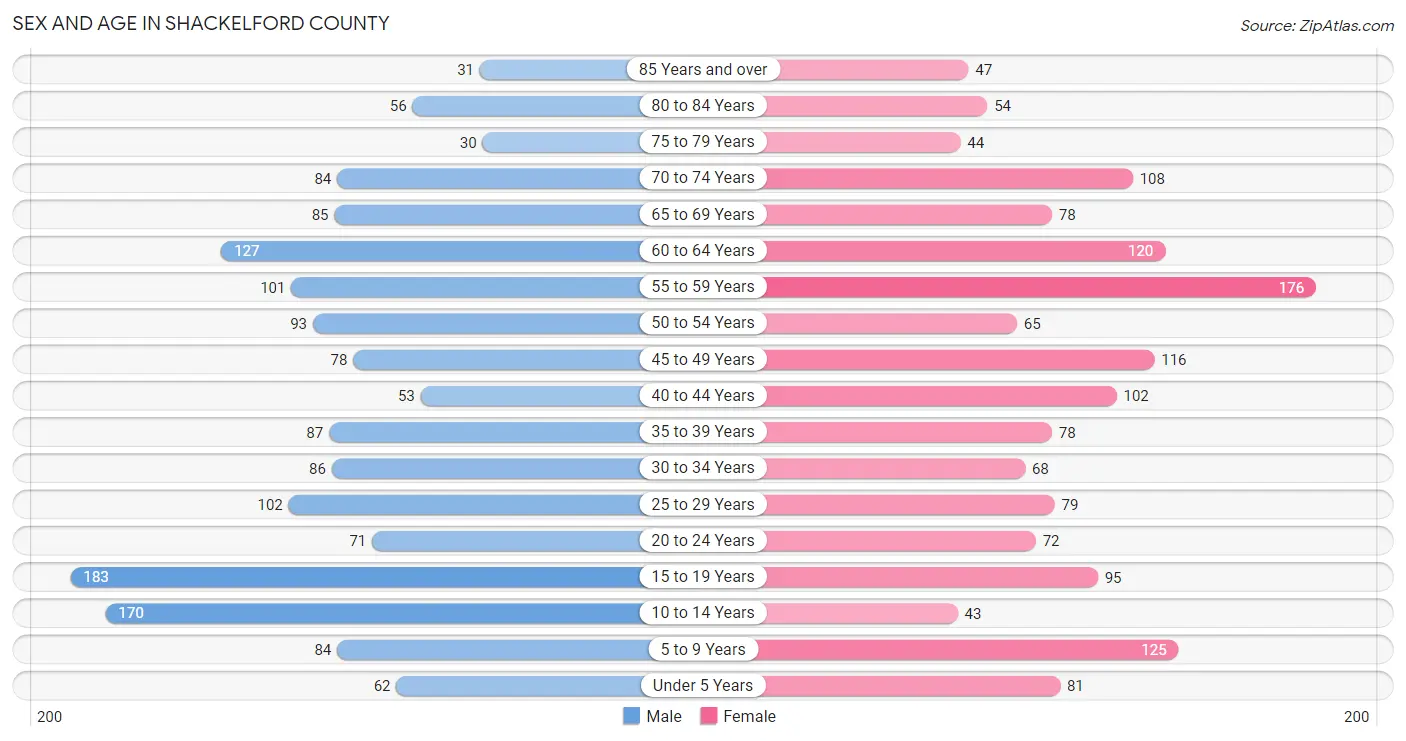
| Age Bracket | Male | Female |
| Under 5 Years | 62 (3.9%) | 81 (5.2%) |
| 5 to 9 Years | 84 (5.3%) | 125 (8.1%) |
| 10 to 14 Years | 170 (10.7%) | 43 (2.8%) |
| 15 to 19 Years | 183 (11.6%) | 95 (6.1%) |
| 20 to 24 Years | 71 (4.5%) | 72 (4.6%) |
| 25 to 29 Years | 102 (6.4%) | 79 (5.1%) |
| 30 to 34 Years | 86 (5.4%) | 68 (4.4%) |
| 35 to 39 Years | 87 (5.5%) | 78 (5.0%) |
| 40 to 44 Years | 53 (3.4%) | 102 (6.6%) |
| 45 to 49 Years | 78 (4.9%) | 116 (7.5%) |
| 50 to 54 Years | 93 (5.9%) | 65 (4.2%) |
| 55 to 59 Years | 101 (6.4%) | 176 (11.4%) |
| 60 to 64 Years | 127 (8.0%) | 120 (7.7%) |
| 65 to 69 Years | 85 (5.4%) | 78 (5.0%) |
| 70 to 74 Years | 84 (5.3%) | 108 (7.0%) |
| 75 to 79 Years | 30 (1.9%) | 44 (2.8%) |
| 80 to 84 Years | 56 (3.5%) | 54 (3.5%) |
| 85 Years and over | 31 (2.0%) | 47 (3.0%) |
| Total | 1,583 (100.0%) | 1,551 (100.0%) |
Families and Households in Shackelford County
Median Family Size in Shackelford County
The median family size in Shackelford County is 2.89 persons per family, with married-couple families (735 | 84.3%) accounting for the largest median family size of 3.04 persons per family. On the other hand, single male/father families (51 | 5.9%) represent the smallest median family size with 1.90 persons per family.

| Family Type | # Families | Family Size |
| Married-Couple | 735 (84.3%) | 3.04 |
| Single Male/Father | 51 (5.9%) | 1.90 |
| Single Female/Mother | 86 (9.9%) | 2.14 |
| Total Families | 872 (100.0%) | 2.89 |
Median Household Size in Shackelford County
The median household size in Shackelford County is 2.33 persons per household, with married-couple households (735 | 55.5%) accounting for the largest median household size of 3.07 persons per household. non-family households (452 | 34.1%) represent the smallest median household size with 1.10 persons per household.

| Household Type | # Households | Household Size |
| Married-Couple | 735 (55.5%) | 3.07 |
| Single Male/Father | 51 (3.8%) | 2.02 |
| Single Female/Mother | 86 (6.5%) | 2.71 |
| Non-family | 452 (34.1%) | 1.10 |
| Total Households | 1,324 (100.0%) | 2.33 |
Household Size by Marriage Status in Shackelford County
Out of a total of 1,324 households in Shackelford County, 872 (65.9%) are family households, while 452 (34.1%) are nonfamily households. The most numerous type of family households are 2-person households, comprising 478, and the most common type of nonfamily households are 1-person households, comprising 401.
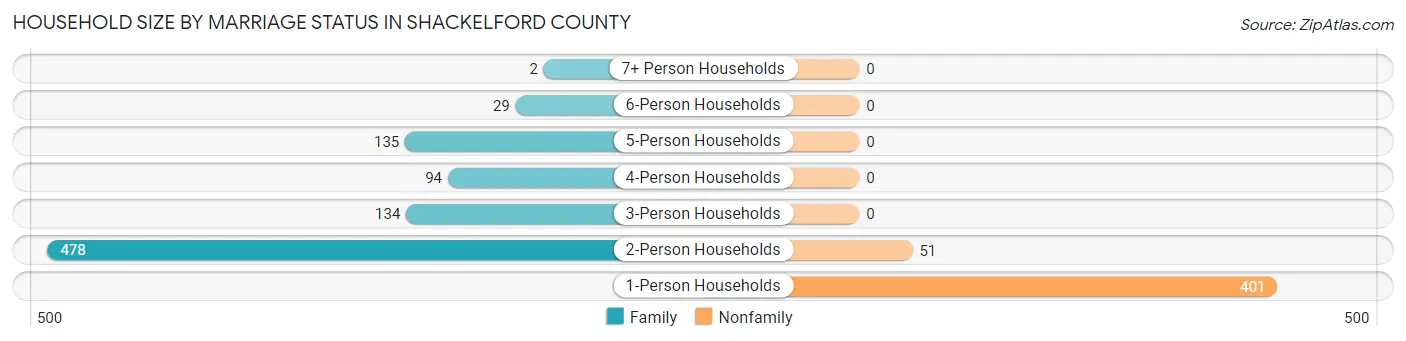
| Household Size | Family Households | Nonfamily Households |
| 1-Person Households | - | 401 (30.3%) |
| 2-Person Households | 478 (36.1%) | 51 (3.8%) |
| 3-Person Households | 134 (10.1%) | 0 (0.0%) |
| 4-Person Households | 94 (7.1%) | 0 (0.0%) |
| 5-Person Households | 135 (10.2%) | 0 (0.0%) |
| 6-Person Households | 29 (2.2%) | 0 (0.0%) |
| 7+ Person Households | 2 (0.2%) | 0 (0.0%) |
| Total | 872 (65.9%) | 452 (34.1%) |
Female Fertility in Shackelford County
Fertility by Age in Shackelford County
Average fertility rate in Shackelford County is 124.0 births per 1,000 women. Women in the age bracket of 15 to 19 years have the highest fertility rate with 368.0 births per 1,000 women. Women in the age bracket of 20 to 34 years acount for 53.9% of all women with births.
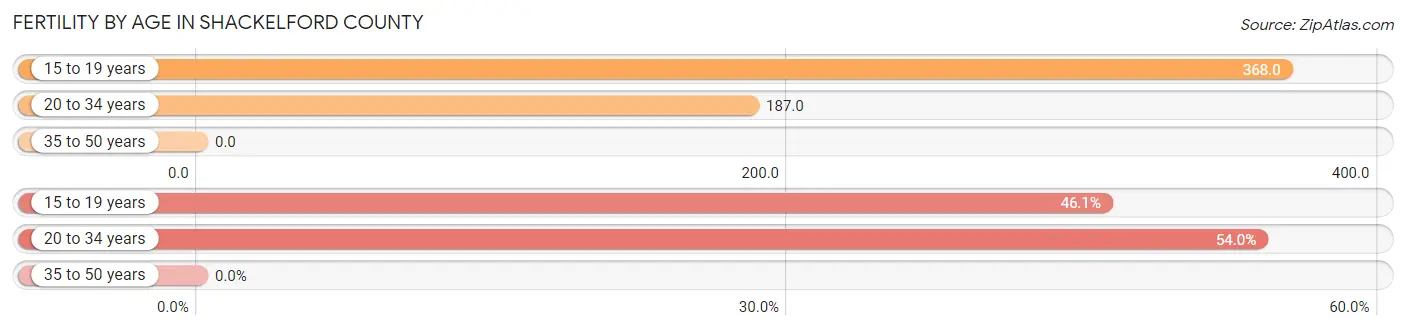
| Age Bracket | Women with Births | Births / 1,000 Women |
| 15 to 19 years | 35 (46.1%) | 368.0 |
| 20 to 34 years | 41 (53.9%) | 187.0 |
| 35 to 50 years | 0 (0.0%) | 0.0 |
| Total | 76 (100.0%) | 124.0 |
Fertility by Age by Marriage Status in Shackelford County
53.9% of women with births (76) in Shackelford County are married. The highest percentage of unmarried women with births falls into 15 to 19 years age bracket with 100.0% of them unmarried at the time of birth, while the lowest percentage of unmarried women with births belong to 20 to 34 years age bracket with 0.0% of them unmarried.
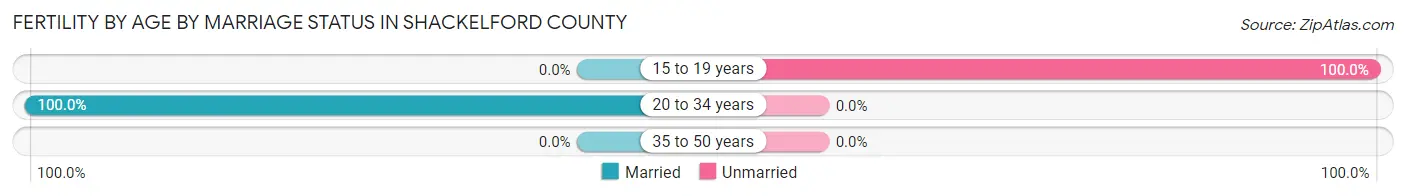
| Age Bracket | Married | Unmarried |
| 15 to 19 years | 0 (0.0%) | 35 (100.0%) |
| 20 to 34 years | 41 (100.0%) | 0 (0.0%) |
| 35 to 50 years | 0 (0.0%) | 0 (0.0%) |
| Total | 41 (53.9%) | 35 (46.1%) |
Fertility by Education in Shackelford County
Average fertility rate in Shackelford County is 124.0 births per 1,000 women. Women with the education attainment of less than high school have the highest fertility rate of 304.0 births per 1,000 women, while women with the education attainment of bachelor's degree have the lowest fertility at 10.0 births per 1,000 women. Women with the education attainment of less than high school represent 46.1% of all women with births.
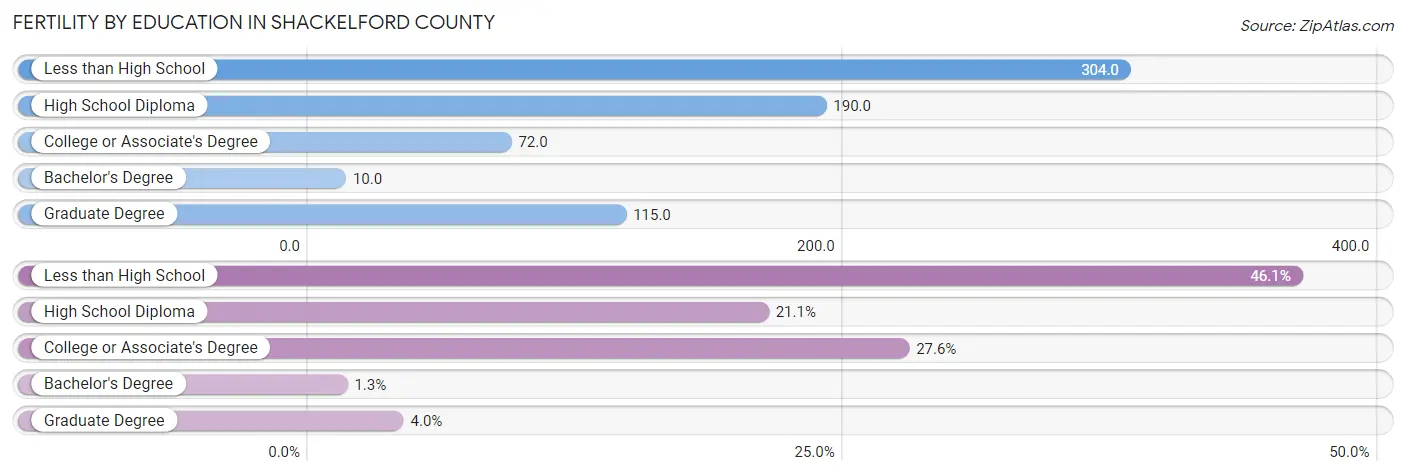
| Educational Attainment | Women with Births | Births / 1,000 Women |
| Less than High School | 35 (46.1%) | 304.0 |
| High School Diploma | 16 (21.0%) | 190.0 |
| College or Associate's Degree | 21 (27.6%) | 72.0 |
| Bachelor's Degree | 1 (1.3%) | 10.0 |
| Graduate Degree | 3 (4.0%) | 115.0 |
| Total | 76 (100.0%) | 124.0 |
Fertility by Education by Marriage Status in Shackelford County
46.1% of women with births in Shackelford County are unmarried. Women with the educational attainment of high school diploma are most likely to be married with 100.0% of them married at childbirth, while women with the educational attainment of less than high school are least likely to be married with 100.0% of them unmarried at childbirth.
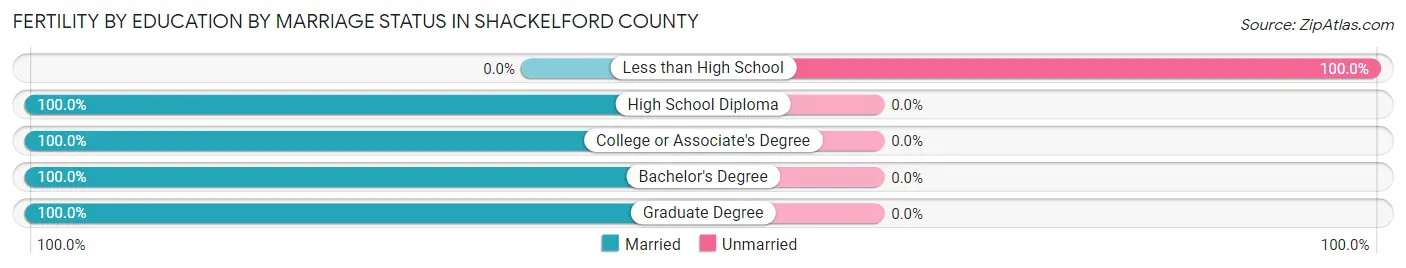
| Educational Attainment | Married | Unmarried |
| Less than High School | 0 (0.0%) | 35 (100.0%) |
| High School Diploma | 16 (100.0%) | 0 (0.0%) |
| College or Associate's Degree | 21 (100.0%) | 0 (0.0%) |
| Bachelor's Degree | 1 (100.0%) | 0 (0.0%) |
| Graduate Degree | 3 (100.0%) | 0 (0.0%) |
| Total | 41 (53.9%) | 35 (46.1%) |
Employment Characteristics in Shackelford County
Employment by Class of Employer in Shackelford County
Among the 1,483 employed individuals in Shackelford County, private company employees (890 | 60.0%), self-employed (not incorporated) (131 | 8.8%), and federal government employees (116 | 7.8%) make up the most common classes of employment.
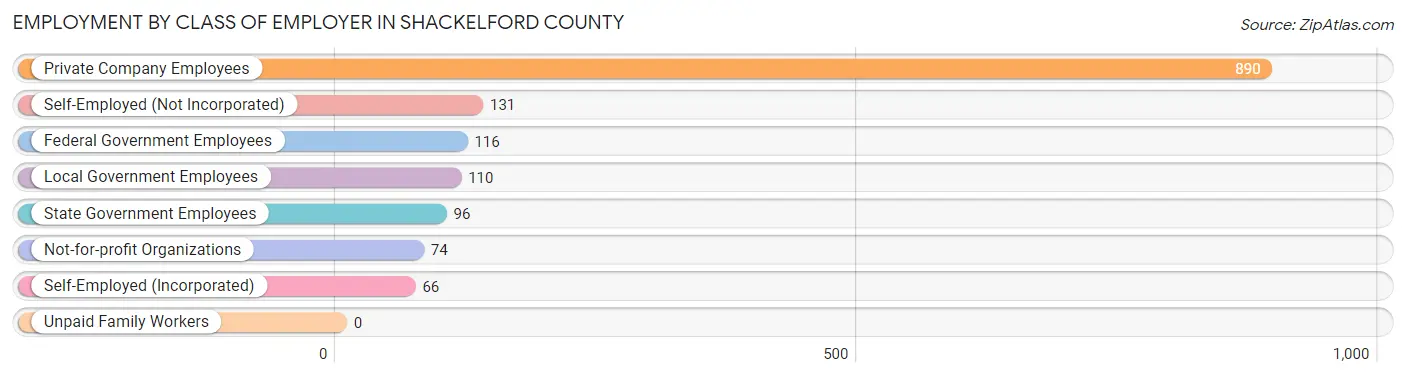
| Employer Class | # Employees | % Employees |
| Private Company Employees | 890 | 60.0% |
| Self-Employed (Incorporated) | 66 | 4.4% |
| Self-Employed (Not Incorporated) | 131 | 8.8% |
| Not-for-profit Organizations | 74 | 5.0% |
| Local Government Employees | 110 | 7.4% |
| State Government Employees | 96 | 6.5% |
| Federal Government Employees | 116 | 7.8% |
| Unpaid Family Workers | 0 | 0.0% |
| Total | 1,483 | 100.0% |
Employment Status by Age in Shackelford County
According to the labor force statistics for Shackelford County, out of the total population over 16 years of age (2,483), 65.2% or 1,619 individuals are in the labor force, with 7.2% or 117 of them unemployed. The age group with the highest labor force participation rate is 35 to 44 years, with 85.6% or 274 individuals in the labor force. Within the labor force, the 25 to 29 years age range has the highest percentage of unemployed individuals, with 12.4% or 19 of them being unemployed.
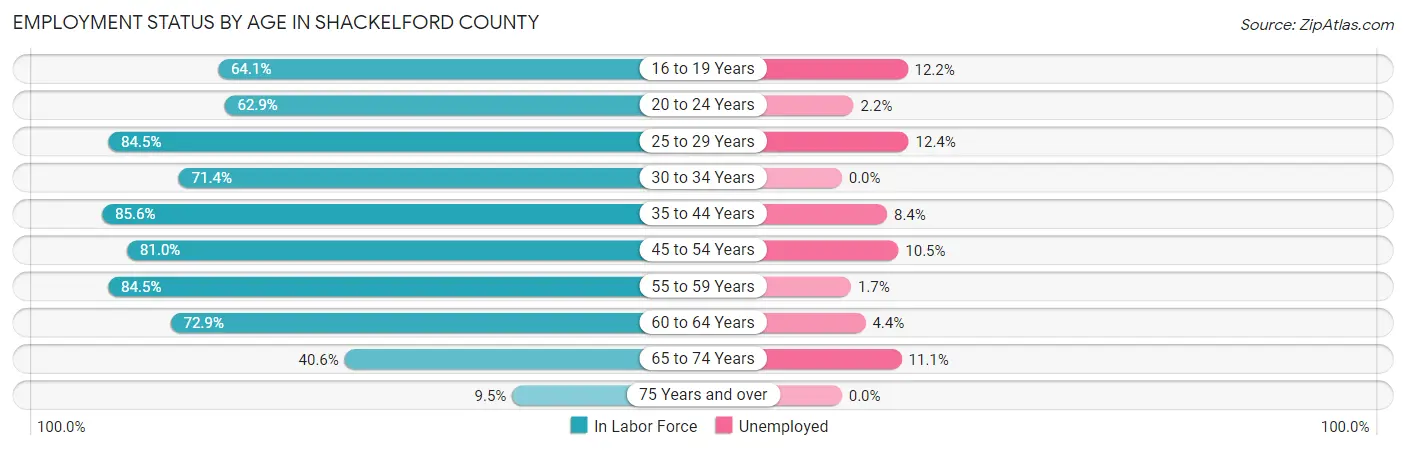
| Age Bracket | In Labor Force | Unemployed |
| 16 to 19 Years | 123 (64.1%) | 15 (12.2%) |
| 20 to 24 Years | 90 (62.9%) | 2 (2.2%) |
| 25 to 29 Years | 153 (84.5%) | 19 (12.4%) |
| 30 to 34 Years | 110 (71.4%) | 0 (0.0%) |
| 35 to 44 Years | 274 (85.6%) | 23 (8.4%) |
| 45 to 54 Years | 285 (81.0%) | 30 (10.5%) |
| 55 to 59 Years | 234 (84.5%) | 4 (1.7%) |
| 60 to 64 Years | 180 (72.9%) | 8 (4.4%) |
| 65 to 74 Years | 144 (40.6%) | 16 (11.1%) |
| 75 Years and over | 25 (9.5%) | 0 (0.0%) |
| Total | 1,619 (65.2%) | 117 (7.2%) |
Employment Status by Educational Attainment in Shackelford County
According to labor force statistics for Shackelford County, 80.7% of individuals (1,236) out of the total population between 25 and 64 years of age (1,531) are in the labor force, with 6.8% or 84 of them being unemployed. The group with the highest labor force participation rate are those with the educational attainment of college / associate degree, with 89.3% or 574 individuals in the labor force. Within the labor force, individuals with college / associate degree education have the highest percentage of unemployment, with 9.2% or 53 of them being unemployed.
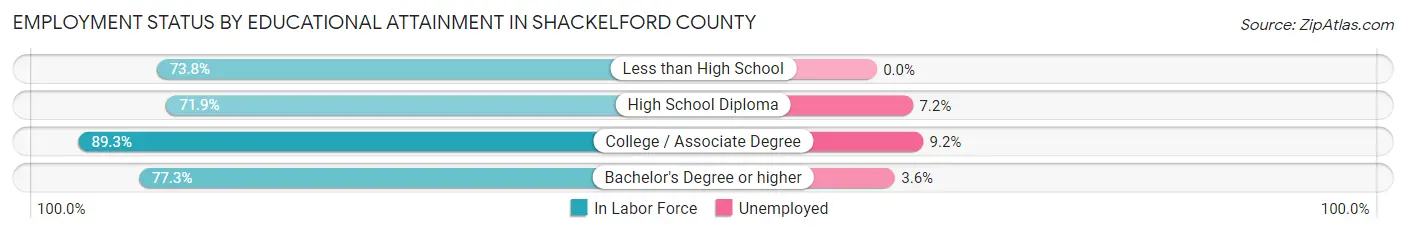
| Educational Attainment | In Labor Force | Unemployed |
| Less than High School | 79 (73.8%) | 0 (0.0%) |
| High School Diploma | 276 (71.9%) | 28 (7.2%) |
| College / Associate Degree | 574 (89.3%) | 59 (9.2%) |
| Bachelor's Degree or higher | 307 (77.3%) | 14 (3.6%) |
| Total | 1,236 (80.7%) | 104 (6.8%) |
Employment Occupations by Sex in Shackelford County
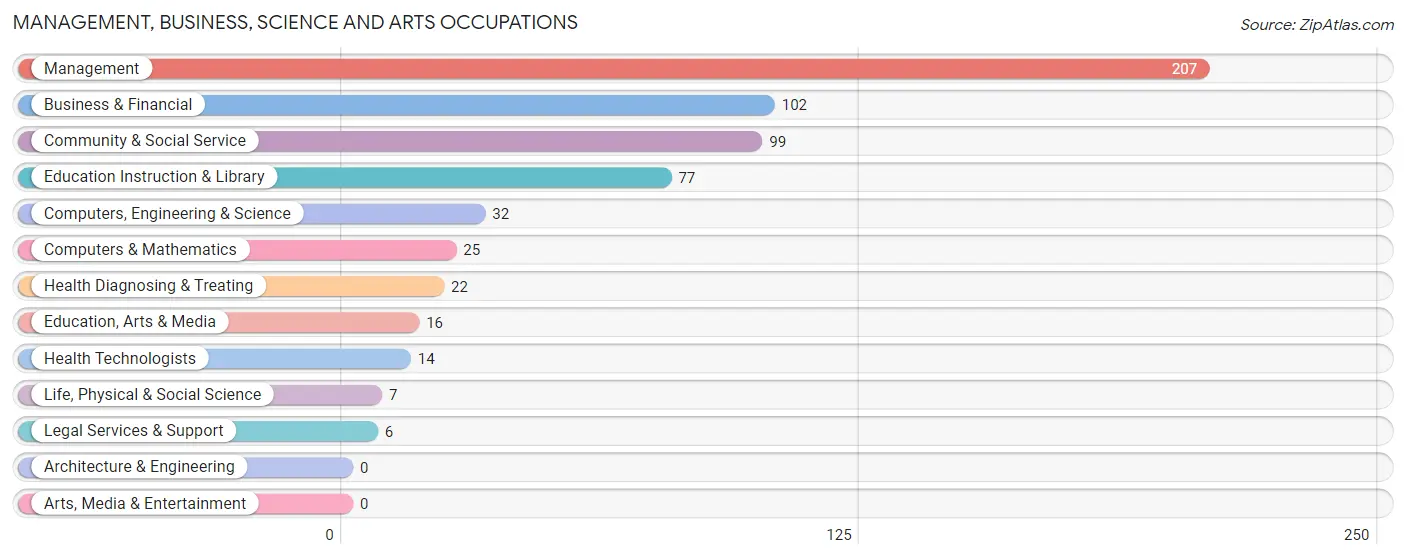
Management, Business, Science and Arts Occupations
The most common Management, Business, Science and Arts occupations in Shackelford County are Management (207 | 13.8%), Business & Financial (102 | 6.8%), Community & Social Service (99 | 6.6%), Education Instruction & Library (77 | 5.1%), and Computers, Engineering & Science (32 | 2.1%).
Management, Business, Science and Arts Occupations by Sex
Within the Management, Business, Science and Arts occupations in Shackelford County, the most male-oriented occupations are Computers, Engineering & Science (100.0%), Computers & Mathematics (100.0%), and Life, Physical & Social Science (100.0%), while the most female-oriented occupations are Legal Services & Support (100.0%), Health Technologists (100.0%), and Education Instruction & Library (93.5%).
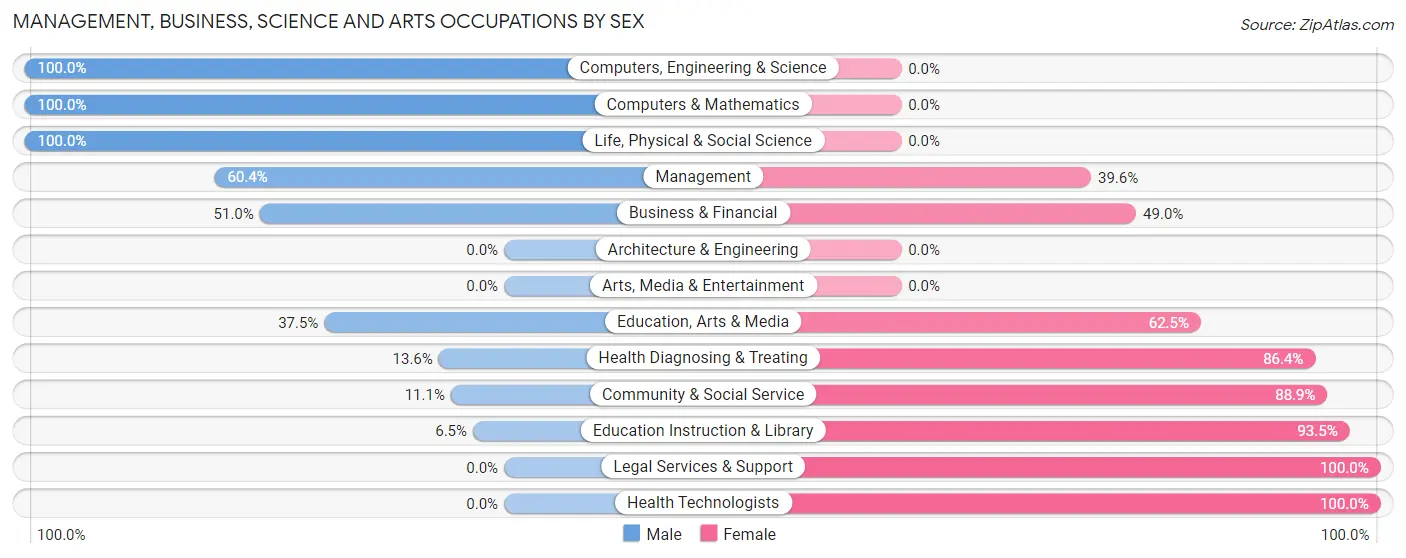
| Occupation | Male | Female |
| Management | 125 (60.4%) | 82 (39.6%) |
| Business & Financial | 52 (51.0%) | 50 (49.0%) |
| Computers, Engineering & Science | 32 (100.0%) | 0 (0.0%) |
| Computers & Mathematics | 25 (100.0%) | 0 (0.0%) |
| Architecture & Engineering | 0 (0.0%) | 0 (0.0%) |
| Life, Physical & Social Science | 7 (100.0%) | 0 (0.0%) |
| Community & Social Service | 11 (11.1%) | 88 (88.9%) |
| Education, Arts & Media | 6 (37.5%) | 10 (62.5%) |
| Legal Services & Support | 0 (0.0%) | 6 (100.0%) |
| Education Instruction & Library | 5 (6.5%) | 72 (93.5%) |
| Arts, Media & Entertainment | 0 (0.0%) | 0 (0.0%) |
| Health Diagnosing & Treating | 3 (13.6%) | 19 (86.4%) |
| Health Technologists | 0 (0.0%) | 14 (100.0%) |
| Total (Category) | 223 (48.3%) | 239 (51.7%) |
| Total (Overall) | 786 (52.4%) | 715 (47.6%) |
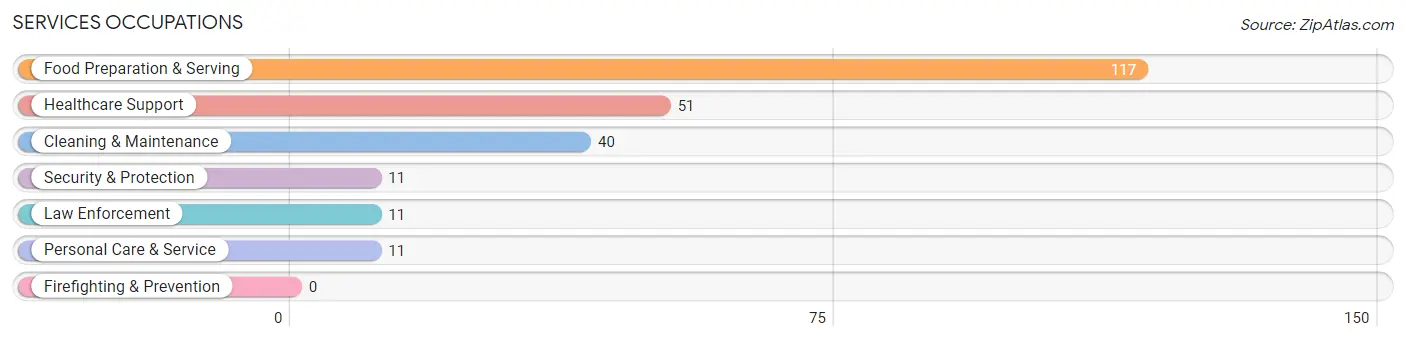
Services Occupations
The most common Services occupations in Shackelford County are Food Preparation & Serving (117 | 7.8%), Healthcare Support (51 | 3.4%), Cleaning & Maintenance (40 | 2.7%), Security & Protection (11 | 0.7%), and Law Enforcement (11 | 0.7%).
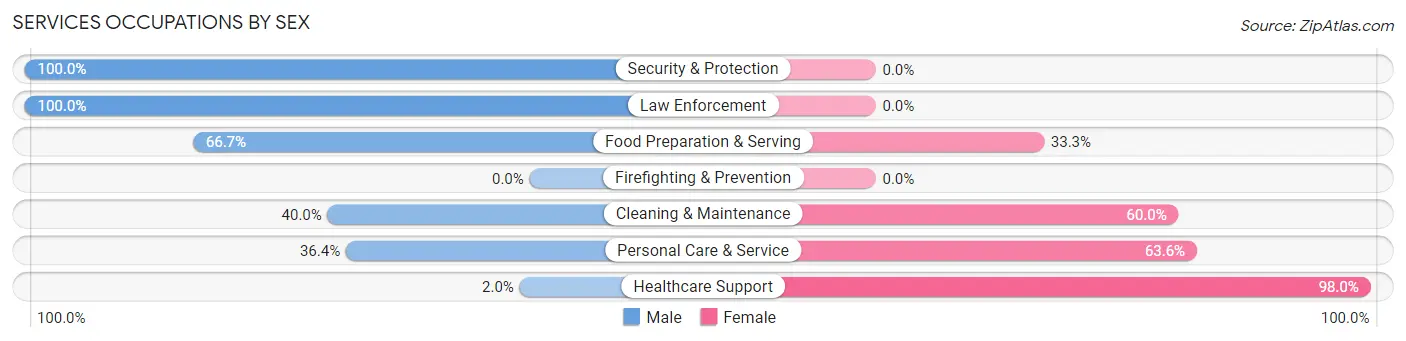
Services Occupations by Sex
Within the Services occupations in Shackelford County, the most male-oriented occupations are Security & Protection (100.0%), Law Enforcement (100.0%), and Food Preparation & Serving (66.7%), while the most female-oriented occupations are Healthcare Support (98.0%), Personal Care & Service (63.6%), and Cleaning & Maintenance (60.0%).
| Occupation | Male | Female |
| Healthcare Support | 1 (2.0%) | 50 (98.0%) |
| Security & Protection | 11 (100.0%) | 0 (0.0%) |
| Firefighting & Prevention | 0 (0.0%) | 0 (0.0%) |
| Law Enforcement | 11 (100.0%) | 0 (0.0%) |
| Food Preparation & Serving | 78 (66.7%) | 39 (33.3%) |
| Cleaning & Maintenance | 16 (40.0%) | 24 (60.0%) |
| Personal Care & Service | 4 (36.4%) | 7 (63.6%) |
| Total (Category) | 110 (47.8%) | 120 (52.2%) |
| Total (Overall) | 786 (52.4%) | 715 (47.6%) |
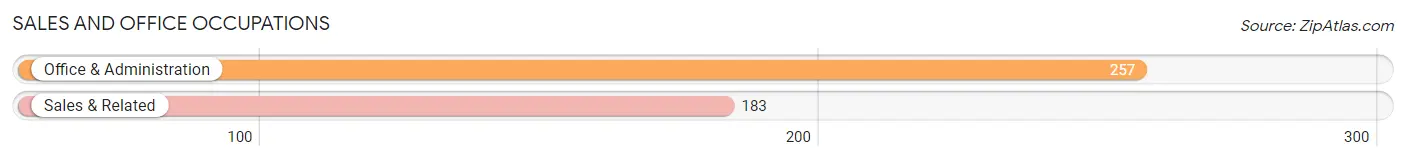
Sales and Office Occupations
The most common Sales and Office occupations in Shackelford County are Office & Administration (257 | 17.1%), and Sales & Related (183 | 12.2%).
Sales and Office Occupations by Sex
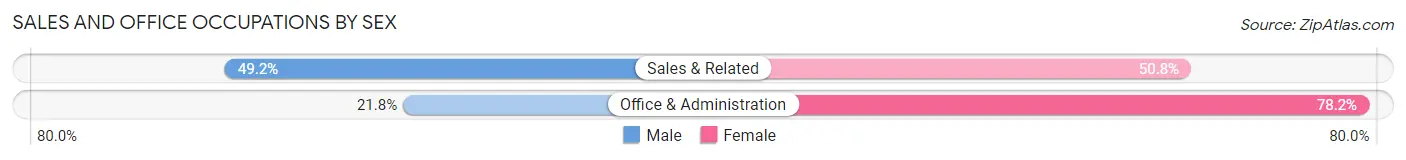
| Occupation | Male | Female |
| Sales & Related | 90 (49.2%) | 93 (50.8%) |
| Office & Administration | 56 (21.8%) | 201 (78.2%) |
| Total (Category) | 146 (33.2%) | 294 (66.8%) |
| Total (Overall) | 786 (52.4%) | 715 (47.6%) |
Natural Resources, Construction and Maintenance Occupations
The most common Natural Resources, Construction and Maintenance occupations in Shackelford County are Construction & Extraction (112 | 7.5%), Installation, Maintenance & Repair (75 | 5.0%), and Farming, Fishing & Forestry (33 | 2.2%).
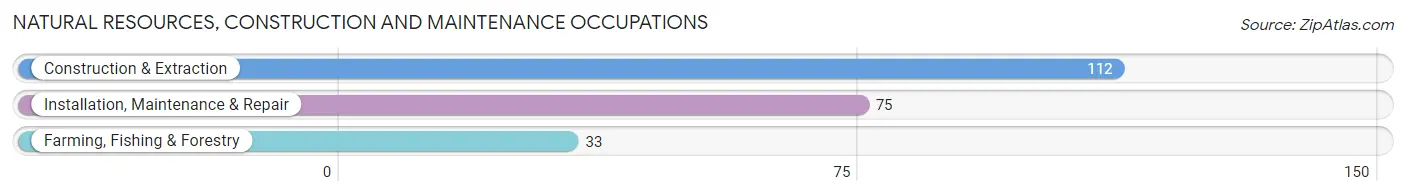
Natural Resources, Construction and Maintenance Occupations by Sex
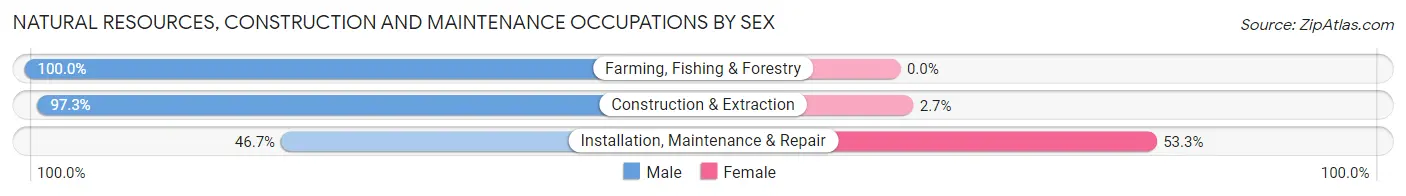
| Occupation | Male | Female |
| Farming, Fishing & Forestry | 33 (100.0%) | 0 (0.0%) |
| Construction & Extraction | 109 (97.3%) | 3 (2.7%) |
| Installation, Maintenance & Repair | 35 (46.7%) | 40 (53.3%) |
| Total (Category) | 177 (80.4%) | 43 (19.6%) |
| Total (Overall) | 786 (52.4%) | 715 (47.6%) |
Production, Transportation and Moving Occupations
The most common Production, Transportation and Moving occupations in Shackelford County are Production (59 | 3.9%), Transportation (54 | 3.6%), and Material Moving (36 | 2.4%).
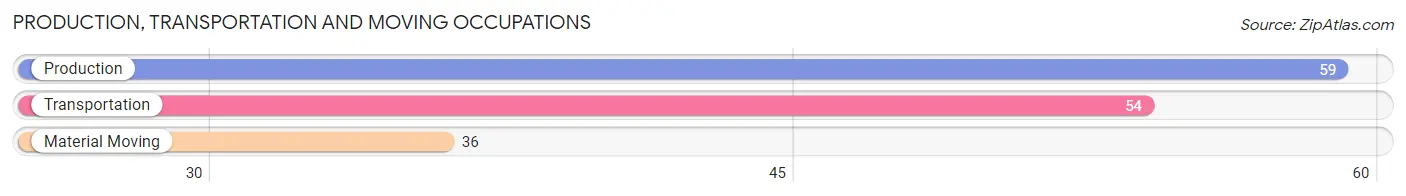
Production, Transportation and Moving Occupations by Sex
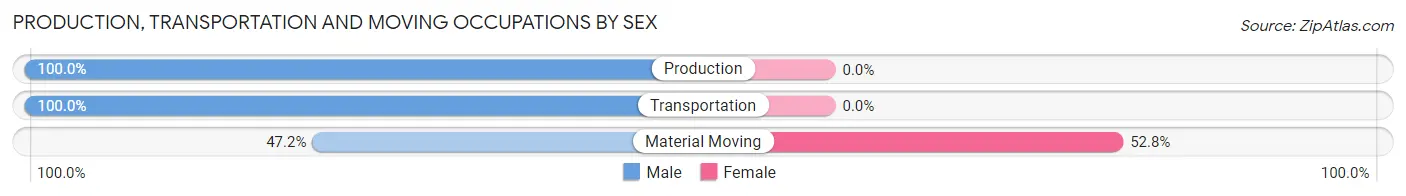
| Occupation | Male | Female |
| Production | 59 (100.0%) | 0 (0.0%) |
| Transportation | 54 (100.0%) | 0 (0.0%) |
| Material Moving | 17 (47.2%) | 19 (52.8%) |
| Total (Category) | 130 (87.3%) | 19 (12.8%) |
| Total (Overall) | 786 (52.4%) | 715 (47.6%) |
Employment Industries by Sex in Shackelford County
Employment Industries in Shackelford County
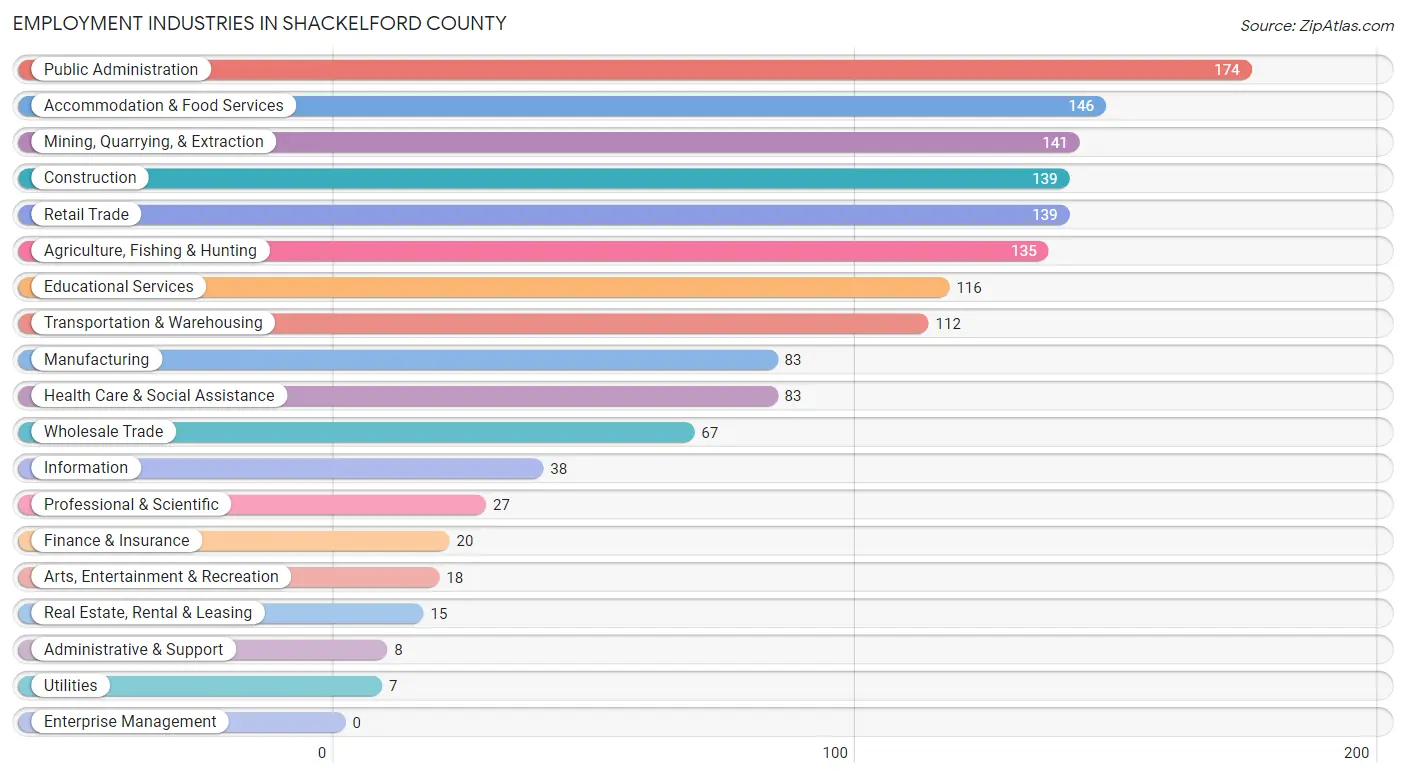
The major employment industries in Shackelford County include Public Administration (174 | 11.6%), Accommodation & Food Services (146 | 9.7%), Mining, Quarrying, & Extraction (141 | 9.4%), Construction (139 | 9.3%), and Retail Trade (139 | 9.3%).
Employment Industries by Sex in Shackelford County
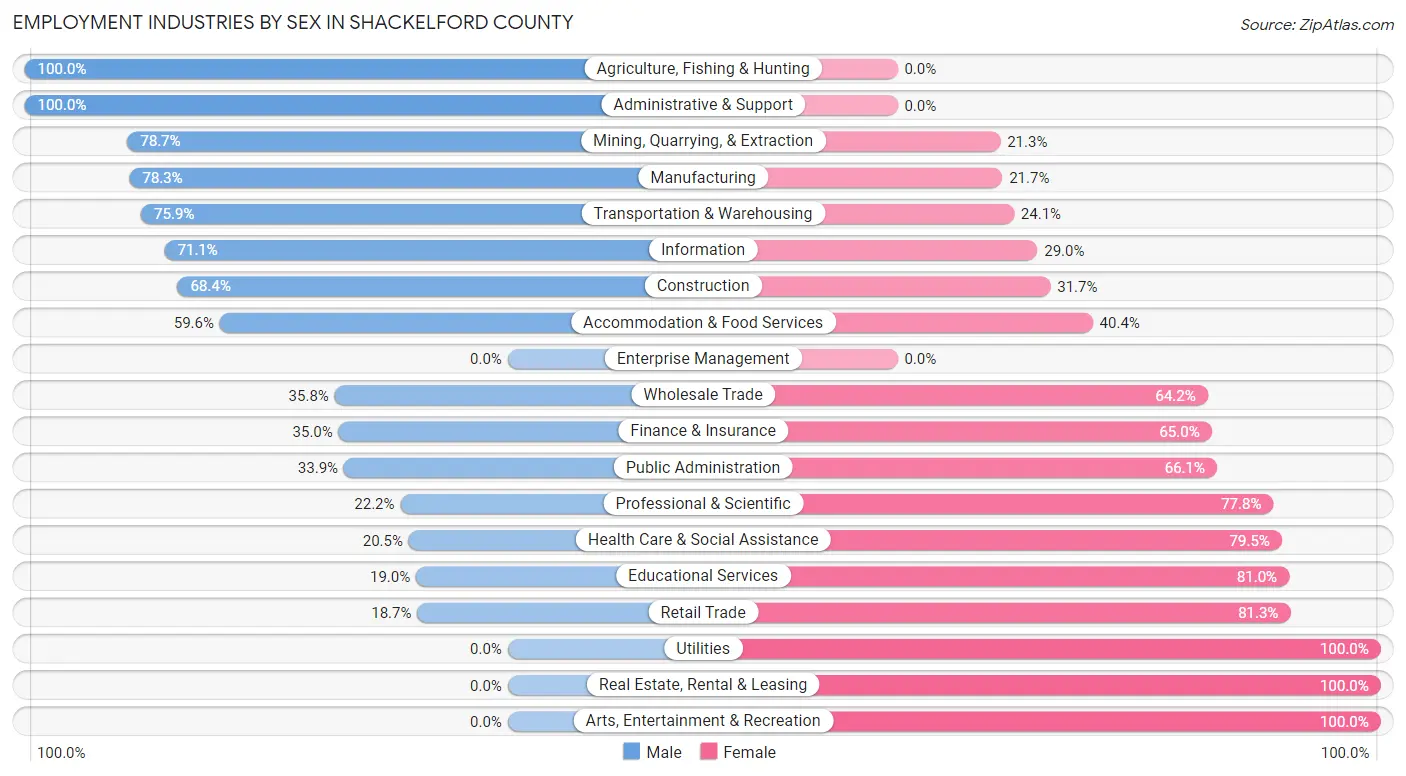
The Shackelford County industries that see more men than women are Agriculture, Fishing & Hunting (100.0%), Administrative & Support (100.0%), and Mining, Quarrying, & Extraction (78.7%), whereas the industries that tend to have a higher number of women are Utilities (100.0%), Real Estate, Rental & Leasing (100.0%), and Arts, Entertainment & Recreation (100.0%).
| Industry | Male | Female |
| Agriculture, Fishing & Hunting | 135 (100.0%) | 0 (0.0%) |
| Mining, Quarrying, & Extraction | 111 (78.7%) | 30 (21.3%) |
| Construction | 95 (68.3%) | 44 (31.7%) |
| Manufacturing | 65 (78.3%) | 18 (21.7%) |
| Wholesale Trade | 24 (35.8%) | 43 (64.2%) |
| Retail Trade | 26 (18.7%) | 113 (81.3%) |
| Transportation & Warehousing | 85 (75.9%) | 27 (24.1%) |
| Utilities | 0 (0.0%) | 7 (100.0%) |
| Information | 27 (71.1%) | 11 (28.9%) |
| Finance & Insurance | 7 (35.0%) | 13 (65.0%) |
| Real Estate, Rental & Leasing | 0 (0.0%) | 15 (100.0%) |
| Professional & Scientific | 6 (22.2%) | 21 (77.8%) |
| Enterprise Management | 0 (0.0%) | 0 (0.0%) |
| Administrative & Support | 8 (100.0%) | 0 (0.0%) |
| Educational Services | 22 (19.0%) | 94 (81.0%) |
| Health Care & Social Assistance | 17 (20.5%) | 66 (79.5%) |
| Arts, Entertainment & Recreation | 0 (0.0%) | 18 (100.0%) |
| Accommodation & Food Services | 87 (59.6%) | 59 (40.4%) |
| Public Administration | 59 (33.9%) | 115 (66.1%) |
| Total | 786 (52.4%) | 715 (47.6%) |
Education in Shackelford County
School Enrollment in Shackelford County
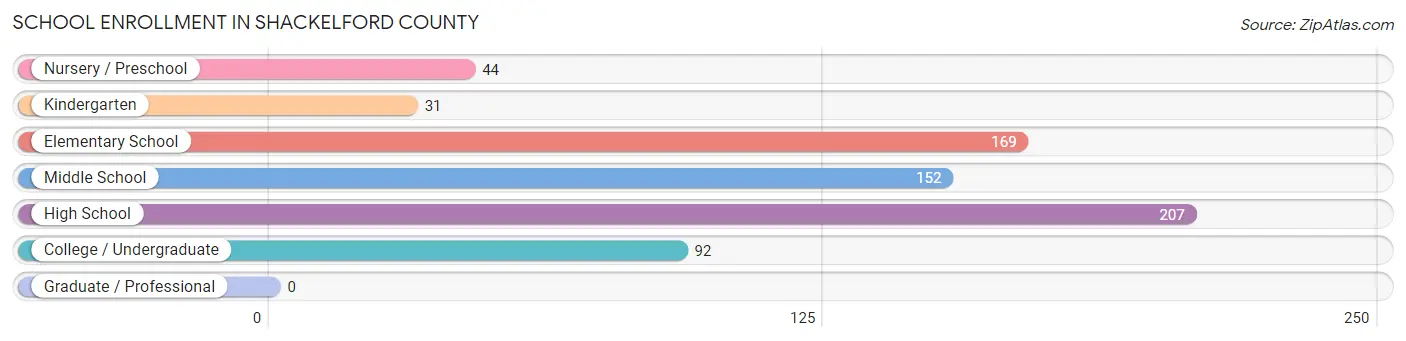
The most common levels of schooling among the 695 students in Shackelford County are high school (207 | 29.8%), elementary school (169 | 24.3%), and middle school (152 | 21.9%).
| School Level | # Students | % Students |
| Nursery / Preschool | 44 | 6.3% |
| Kindergarten | 31 | 4.5% |
| Elementary School | 169 | 24.3% |
| Middle School | 152 | 21.9% |
| High School | 207 | 29.8% |
| College / Undergraduate | 92 | 13.2% |
| Graduate / Professional | 0 | 0.0% |
| Total | 695 | 100.0% |
School Enrollment by Age by Funding Source in Shackelford County
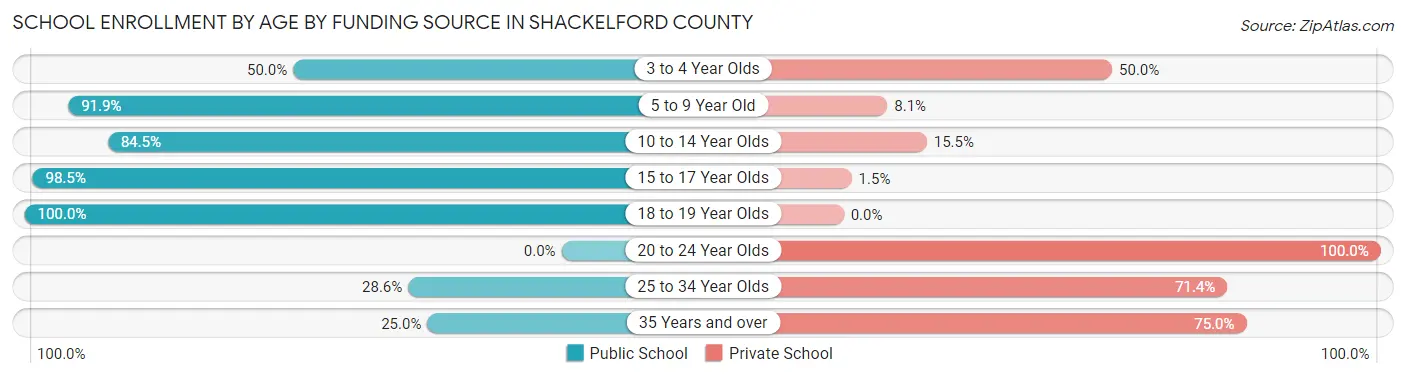
Out of a total of 695 students who are enrolled in schools in Shackelford County, 123 (17.7%) attend a private institution, while the remaining 572 (82.3%) are enrolled in public schools. The age group of 20 to 24 year olds has the highest likelihood of being enrolled in private schools, with 54 (100.0% in the age bracket) enrolled. Conversely, the age group of 18 to 19 year olds has the lowest likelihood of being enrolled in a private school, with 59 (100.0% in the age bracket) attending a public institution.
| Age Bracket | Public School | Private School |
| 3 to 4 Year Olds | 4 (50.0%) | 4 (50.0%) |
| 5 to 9 Year Old | 192 (91.9%) | 17 (8.1%) |
| 10 to 14 Year Olds | 180 (84.5%) | 33 (15.5%) |
| 15 to 17 Year Olds | 132 (98.5%) | 2 (1.5%) |
| 18 to 19 Year Olds | 59 (100.0%) | 0 (0.0%) |
| 20 to 24 Year Olds | 0 (0.0%) | 54 (100.0%) |
| 25 to 34 Year Olds | 4 (28.6%) | 10 (71.4%) |
| 35 Years and over | 1 (25.0%) | 3 (75.0%) |
| Total | 572 (82.3%) | 123 (17.7%) |
Educational Attainment by Field of Study in Shackelford County
Business (186 | 25.7%), education (155 | 21.4%), bio, nature & agricultural (126 | 17.4%), arts & humanities (59 | 8.1%), and liberal arts & history (57 | 7.9%) are the most common fields of study among 725 individuals in Shackelford County who have obtained a bachelor's degree or higher.
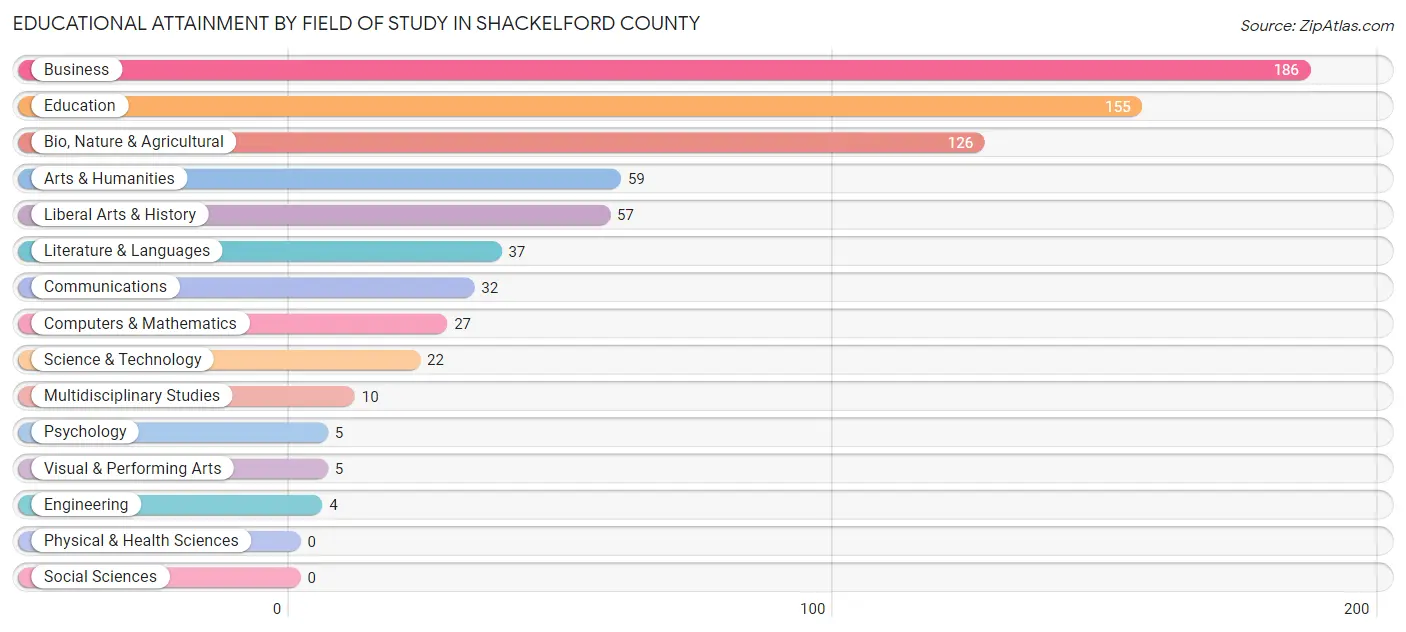
| Field of Study | # Graduates | % Graduates |
| Computers & Mathematics | 27 | 3.7% |
| Bio, Nature & Agricultural | 126 | 17.4% |
| Physical & Health Sciences | 0 | 0.0% |
| Psychology | 5 | 0.7% |
| Social Sciences | 0 | 0.0% |
| Engineering | 4 | 0.5% |
| Multidisciplinary Studies | 10 | 1.4% |
| Science & Technology | 22 | 3.0% |
| Business | 186 | 25.7% |
| Education | 155 | 21.4% |
| Literature & Languages | 37 | 5.1% |
| Liberal Arts & History | 57 | 7.9% |
| Visual & Performing Arts | 5 | 0.7% |
| Communications | 32 | 4.4% |
| Arts & Humanities | 59 | 8.1% |
| Total | 725 | 100.0% |
Transportation & Commute in Shackelford County
Vehicle Availability by Sex in Shackelford County
The most prevalent vehicle ownership categories in Shackelford County are males with 2 vehicles (348, accounting for 45.3%) and females with 2 vehicles (307, making up 49.0%).
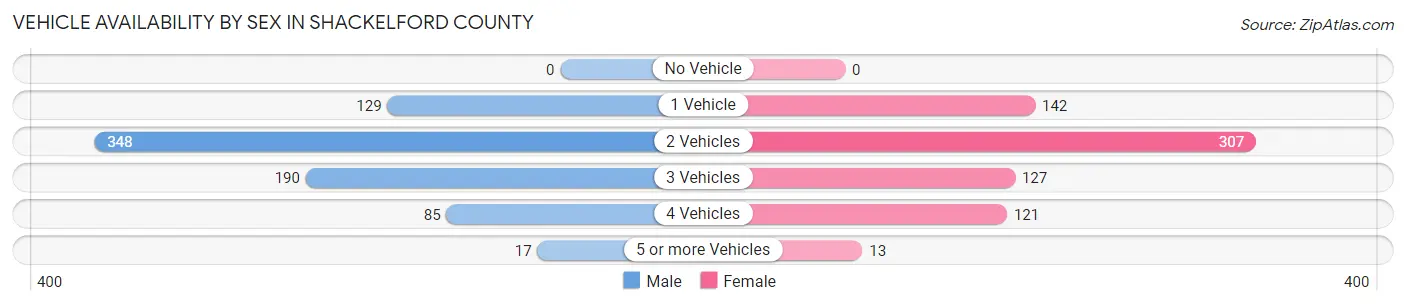
| Vehicles Available | Male | Female |
| No Vehicle | 0 (0.0%) | 0 (0.0%) |
| 1 Vehicle | 129 (16.8%) | 142 (20.0%) |
| 2 Vehicles | 348 (45.3%) | 307 (43.2%) |
| 3 Vehicles | 190 (24.7%) | 127 (17.9%) |
| 4 Vehicles | 85 (11.1%) | 121 (17.0%) |
| 5 or more Vehicles | 17 (2.2%) | 13 (1.8%) |
| Total | 769 (100.0%) | 710 (100.0%) |
Commute Time in Shackelford County
The most frequently occuring commute durations in Shackelford County are 5 to 9 minutes (290 commuters, 21.3%), less than 5 minutes (248 commuters, 18.3%), and 20 to 24 minutes (220 commuters, 16.2%).
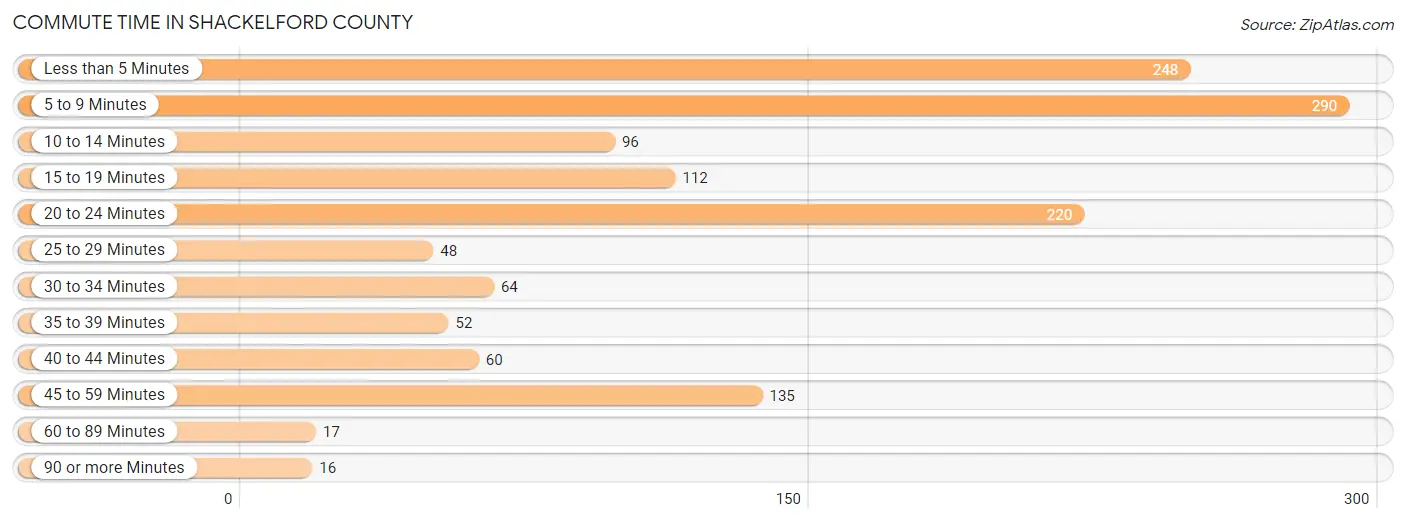
| Commute Time | # Commuters | % Commuters |
| Less than 5 Minutes | 248 | 18.3% |
| 5 to 9 Minutes | 290 | 21.3% |
| 10 to 14 Minutes | 96 | 7.1% |
| 15 to 19 Minutes | 112 | 8.3% |
| 20 to 24 Minutes | 220 | 16.2% |
| 25 to 29 Minutes | 48 | 3.5% |
| 30 to 34 Minutes | 64 | 4.7% |
| 35 to 39 Minutes | 52 | 3.8% |
| 40 to 44 Minutes | 60 | 4.4% |
| 45 to 59 Minutes | 135 | 9.9% |
| 60 to 89 Minutes | 17 | 1.3% |
| 90 or more Minutes | 16 | 1.2% |
Commute Time by Sex in Shackelford County
The most common commute times in Shackelford County are 20 to 24 minutes (195 commuters, 26.6%) for males and 5 to 9 minutes (207 commuters, 33.2%) for females.
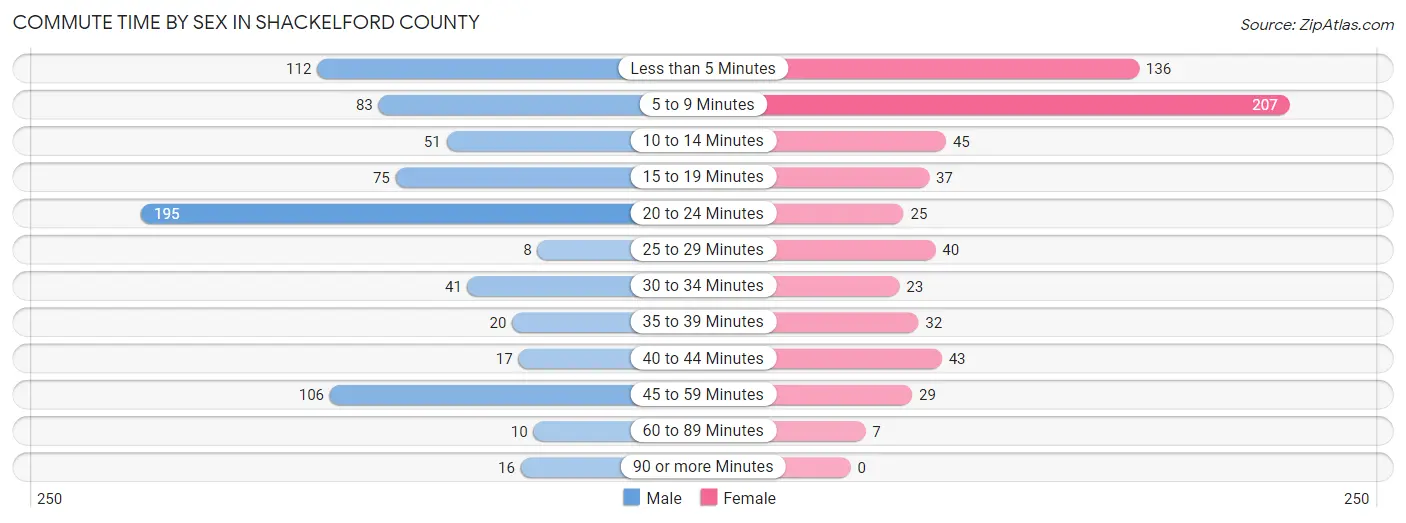
| Commute Time | Male | Female |
| Less than 5 Minutes | 112 (15.3%) | 136 (21.8%) |
| 5 to 9 Minutes | 83 (11.3%) | 207 (33.2%) |
| 10 to 14 Minutes | 51 (7.0%) | 45 (7.2%) |
| 15 to 19 Minutes | 75 (10.2%) | 37 (5.9%) |
| 20 to 24 Minutes | 195 (26.6%) | 25 (4.0%) |
| 25 to 29 Minutes | 8 (1.1%) | 40 (6.4%) |
| 30 to 34 Minutes | 41 (5.6%) | 23 (3.7%) |
| 35 to 39 Minutes | 20 (2.7%) | 32 (5.1%) |
| 40 to 44 Minutes | 17 (2.3%) | 43 (6.9%) |
| 45 to 59 Minutes | 106 (14.4%) | 29 (4.6%) |
| 60 to 89 Minutes | 10 (1.4%) | 7 (1.1%) |
| 90 or more Minutes | 16 (2.2%) | 0 (0.0%) |
Time of Departure to Work by Sex in Shackelford County
The most frequent times of departure to work in Shackelford County are 7:00 AM to 7:29 AM (157, 21.4%) for males and 7:30 AM to 7:59 AM (174, 27.9%) for females.
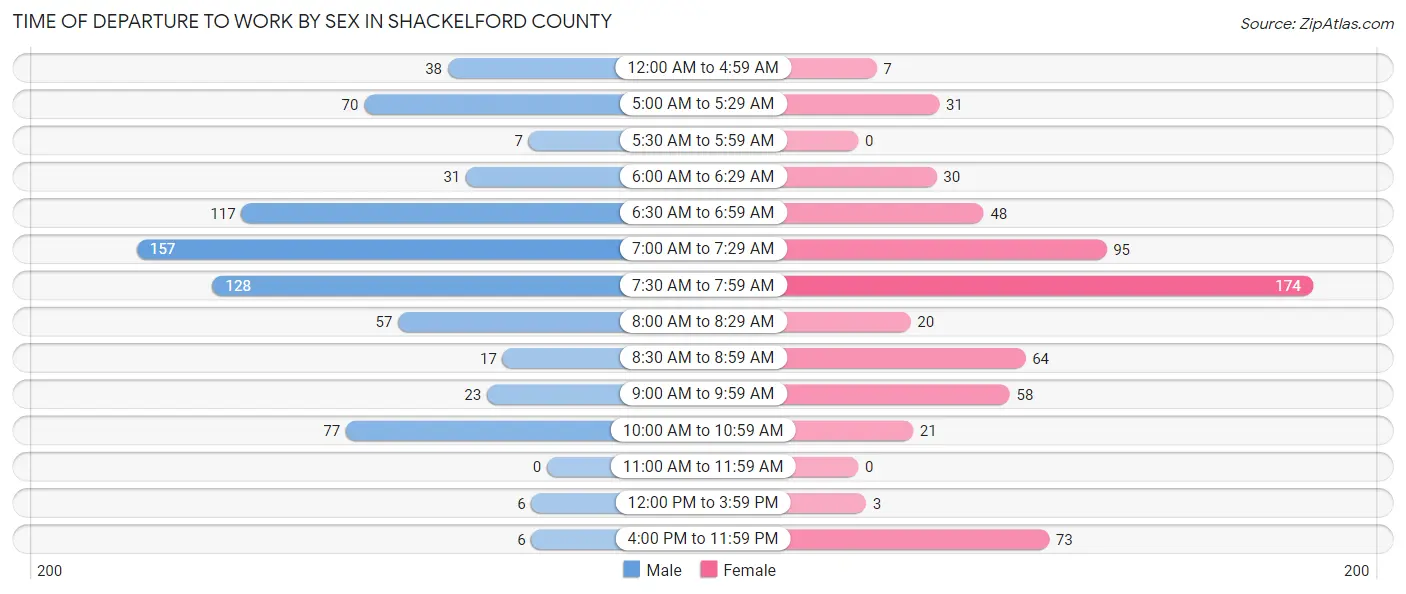
| Time of Departure | Male | Female |
| 12:00 AM to 4:59 AM | 38 (5.2%) | 7 (1.1%) |
| 5:00 AM to 5:29 AM | 70 (9.5%) | 31 (5.0%) |
| 5:30 AM to 5:59 AM | 7 (0.9%) | 0 (0.0%) |
| 6:00 AM to 6:29 AM | 31 (4.2%) | 30 (4.8%) |
| 6:30 AM to 6:59 AM | 117 (15.9%) | 48 (7.7%) |
| 7:00 AM to 7:29 AM | 157 (21.4%) | 95 (15.2%) |
| 7:30 AM to 7:59 AM | 128 (17.4%) | 174 (27.9%) |
| 8:00 AM to 8:29 AM | 57 (7.8%) | 20 (3.2%) |
| 8:30 AM to 8:59 AM | 17 (2.3%) | 64 (10.3%) |
| 9:00 AM to 9:59 AM | 23 (3.1%) | 58 (9.3%) |
| 10:00 AM to 10:59 AM | 77 (10.5%) | 21 (3.4%) |
| 11:00 AM to 11:59 AM | 0 (0.0%) | 0 (0.0%) |
| 12:00 PM to 3:59 PM | 6 (0.8%) | 3 (0.5%) |
| 4:00 PM to 11:59 PM | 6 (0.8%) | 73 (11.7%) |
| Total | 734 (100.0%) | 624 (100.0%) |
Housing Occupancy in Shackelford County
Occupancy by Ownership in Shackelford County
Of the total 1,324 dwellings in Shackelford County, owner-occupied units account for 1,073 (81.0%), while renter-occupied units make up 251 (19.0%).
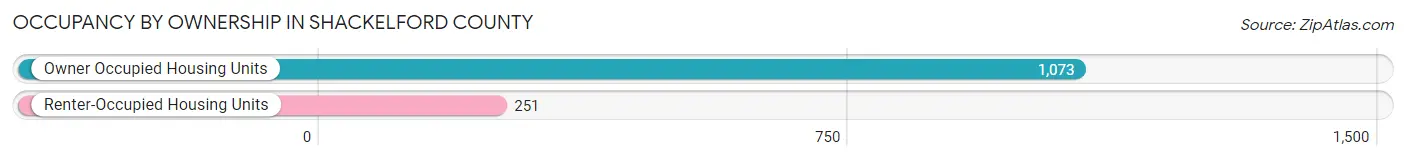
| Occupancy | # Housing Units | % Housing Units |
| Owner Occupied Housing Units | 1,073 | 81.0% |
| Renter-Occupied Housing Units | 251 | 19.0% |
| Total Occupied Housing Units | 1,324 | 100.0% |
Occupancy by Household Size in Shackelford County
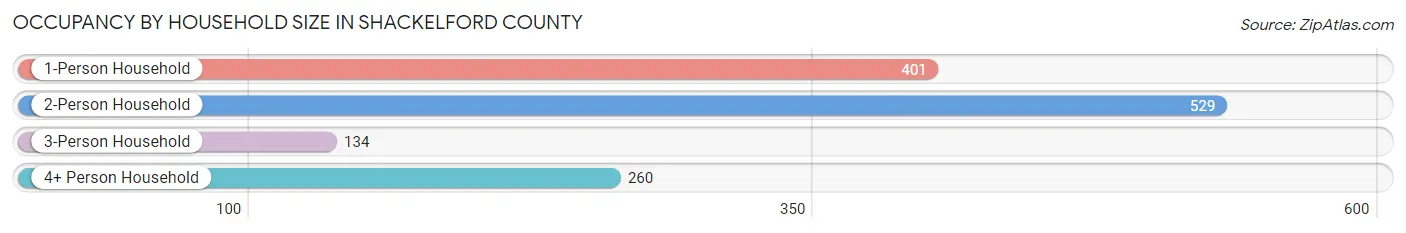
| Household Size | # Housing Units | % Housing Units |
| 1-Person Household | 401 | 30.3% |
| 2-Person Household | 529 | 40.0% |
| 3-Person Household | 134 | 10.1% |
| 4+ Person Household | 260 | 19.6% |
| Total Housing Units | 1,324 | 100.0% |
Occupancy by Ownership by Household Size in Shackelford County
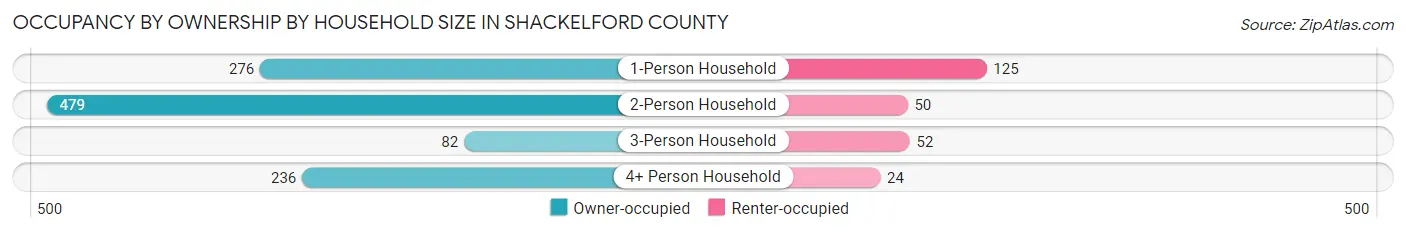
| Household Size | Owner-occupied | Renter-occupied |
| 1-Person Household | 276 (68.8%) | 125 (31.2%) |
| 2-Person Household | 479 (90.5%) | 50 (9.5%) |
| 3-Person Household | 82 (61.2%) | 52 (38.8%) |
| 4+ Person Household | 236 (90.8%) | 24 (9.2%) |
| Total Housing Units | 1,073 (81.0%) | 251 (19.0%) |
Occupancy by Educational Attainment in Shackelford County
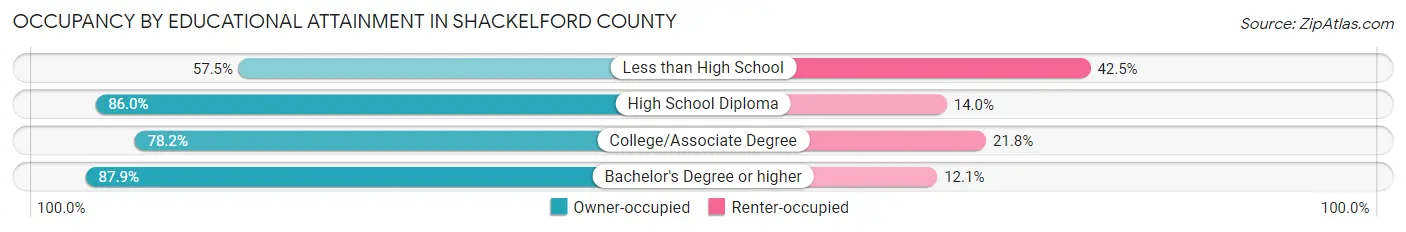
| Household Size | Owner-occupied | Renter-occupied |
| Less than High School | 65 (57.5%) | 48 (42.5%) |
| High School Diploma | 258 (86.0%) | 42 (14.0%) |
| College/Associate Degree | 409 (78.2%) | 114 (21.8%) |
| Bachelor's Degree or higher | 341 (87.9%) | 47 (12.1%) |
Occupancy by Age of Householder in Shackelford County
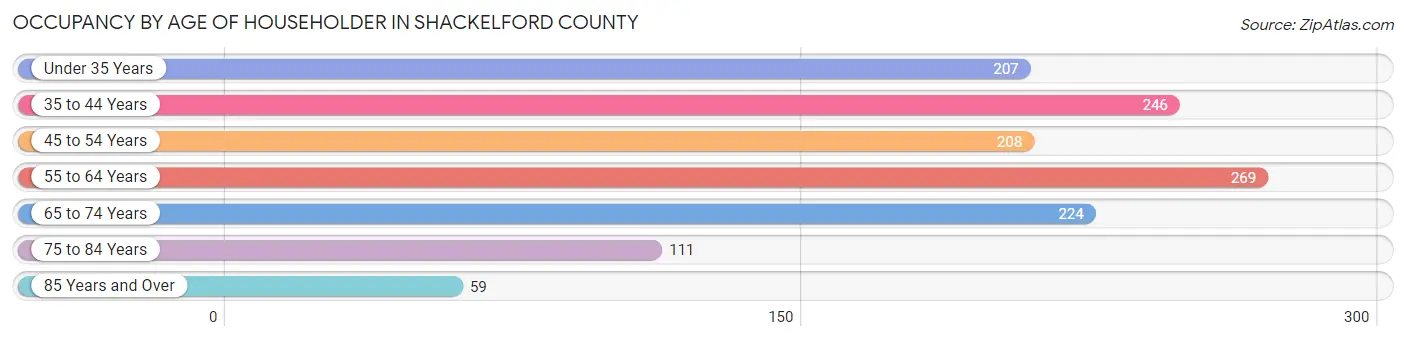
| Age Bracket | # Households | % Households |
| Under 35 Years | 207 | 15.6% |
| 35 to 44 Years | 246 | 18.6% |
| 45 to 54 Years | 208 | 15.7% |
| 55 to 64 Years | 269 | 20.3% |
| 65 to 74 Years | 224 | 16.9% |
| 75 to 84 Years | 111 | 8.4% |
| 85 Years and Over | 59 | 4.5% |
| Total | 1,324 | 100.0% |
Housing Finances in Shackelford County
Median Income by Occupancy in Shackelford County
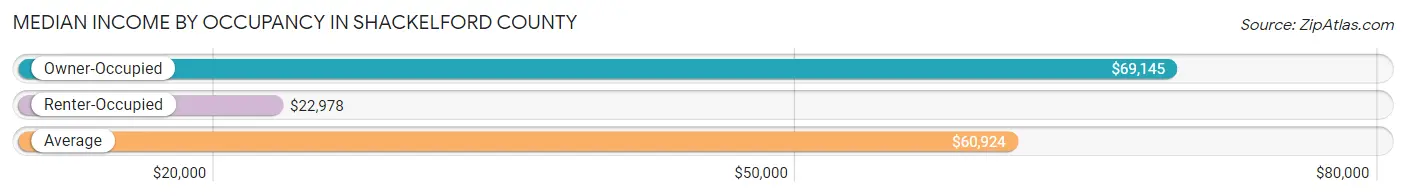
| Occupancy Type | # Households | Median Income |
| Owner-Occupied | 1,073 (81.0%) | $69,145 |
| Renter-Occupied | 251 (19.0%) | $22,978 |
| Average | 1,324 (100.0%) | $60,924 |
Occupancy by Householder Income Bracket in Shackelford County
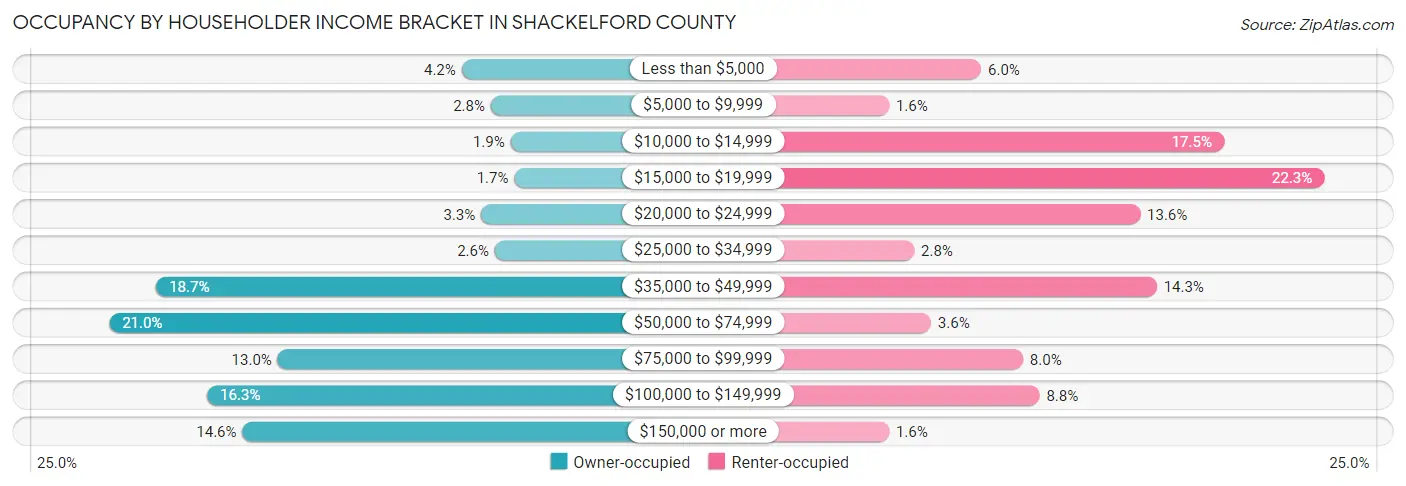
| Income Bracket | Owner-occupied | Renter-occupied |
| Less than $5,000 | 45 (4.2%) | 15 (6.0%) |
| $5,000 to $9,999 | 30 (2.8%) | 4 (1.6%) |
| $10,000 to $14,999 | 20 (1.9%) | 44 (17.5%) |
| $15,000 to $19,999 | 18 (1.7%) | 56 (22.3%) |
| $20,000 to $24,999 | 35 (3.3%) | 34 (13.6%) |
| $25,000 to $34,999 | 28 (2.6%) | 7 (2.8%) |
| $35,000 to $49,999 | 201 (18.7%) | 36 (14.3%) |
| $50,000 to $74,999 | 225 (21.0%) | 9 (3.6%) |
| $75,000 to $99,999 | 139 (13.0%) | 20 (8.0%) |
| $100,000 to $149,999 | 175 (16.3%) | 22 (8.8%) |
| $150,000 or more | 157 (14.6%) | 4 (1.6%) |
| Total | 1,073 (100.0%) | 251 (100.0%) |
Monthly Housing Cost Tiers in Shackelford County
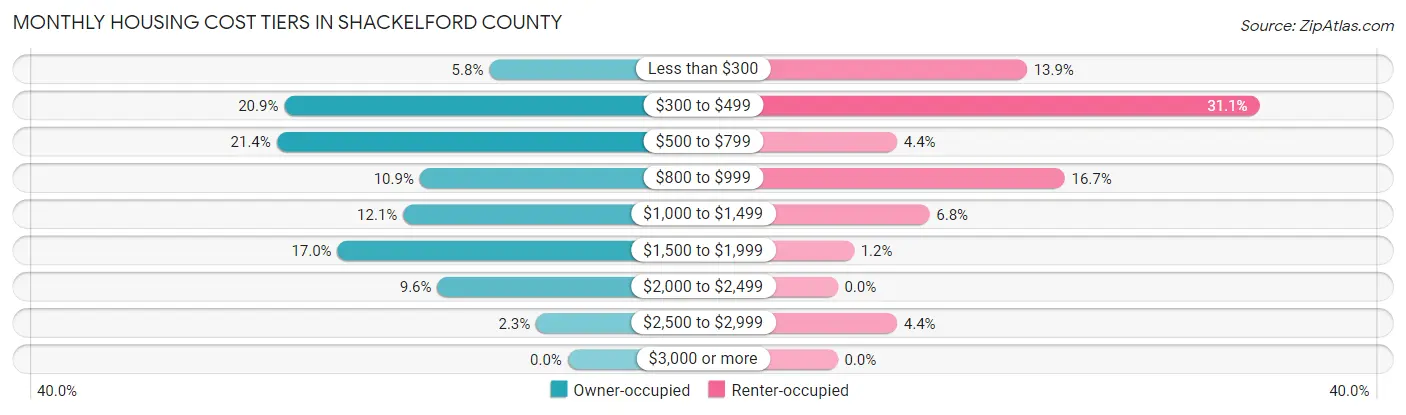
| Monthly Cost | Owner-occupied | Renter-occupied |
| Less than $300 | 62 (5.8%) | 35 (13.9%) |
| $300 to $499 | 224 (20.9%) | 78 (31.1%) |
| $500 to $799 | 230 (21.4%) | 11 (4.4%) |
| $800 to $999 | 117 (10.9%) | 42 (16.7%) |
| $1,000 to $1,499 | 130 (12.1%) | 17 (6.8%) |
| $1,500 to $1,999 | 182 (17.0%) | 3 (1.2%) |
| $2,000 to $2,499 | 103 (9.6%) | 0 (0.0%) |
| $2,500 to $2,999 | 25 (2.3%) | 11 (4.4%) |
| $3,000 or more | 0 (0.0%) | 0 (0.0%) |
| Total | 1,073 (100.0%) | 251 (100.0%) |
Physical Housing Characteristics in Shackelford County
Housing Structures in Shackelford County
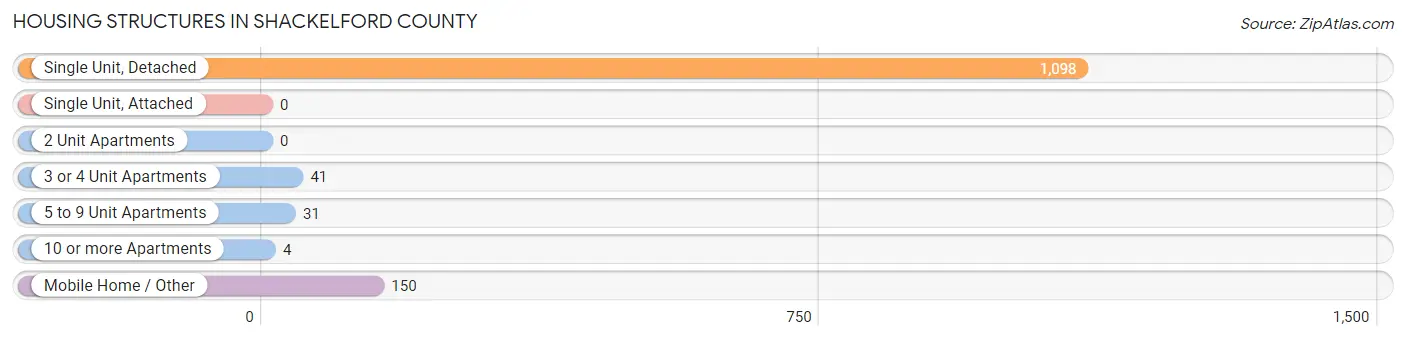
| Structure Type | # Housing Units | % Housing Units |
| Single Unit, Detached | 1,098 | 82.9% |
| Single Unit, Attached | 0 | 0.0% |
| 2 Unit Apartments | 0 | 0.0% |
| 3 or 4 Unit Apartments | 41 | 3.1% |
| 5 to 9 Unit Apartments | 31 | 2.3% |
| 10 or more Apartments | 4 | 0.3% |
| Mobile Home / Other | 150 | 11.3% |
| Total | 1,324 | 100.0% |
Housing Structures by Occupancy in Shackelford County
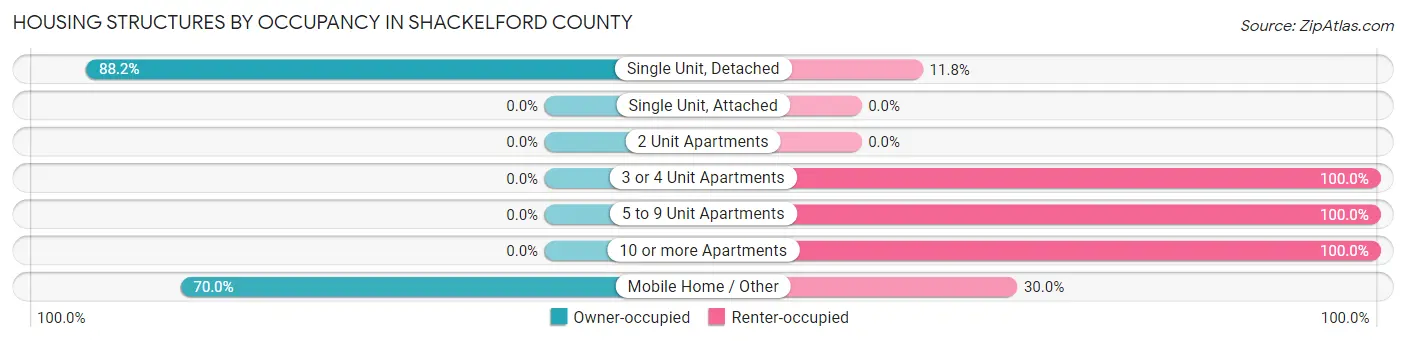
| Structure Type | Owner-occupied | Renter-occupied |
| Single Unit, Detached | 968 (88.2%) | 130 (11.8%) |
| Single Unit, Attached | 0 (0.0%) | 0 (0.0%) |
| 2 Unit Apartments | 0 (0.0%) | 0 (0.0%) |
| 3 or 4 Unit Apartments | 0 (0.0%) | 41 (100.0%) |
| 5 to 9 Unit Apartments | 0 (0.0%) | 31 (100.0%) |
| 10 or more Apartments | 0 (0.0%) | 4 (100.0%) |
| Mobile Home / Other | 105 (70.0%) | 45 (30.0%) |
| Total | 1,073 (81.0%) | 251 (19.0%) |
Housing Structures by Number of Rooms in Shackelford County

| Number of Rooms | Owner-occupied | Renter-occupied |
| 1 Room | 17 (1.6%) | 10 (4.0%) |
| 2 or 3 Rooms | 9 (0.8%) | 68 (27.1%) |
| 4 or 5 Rooms | 375 (34.9%) | 135 (53.8%) |
| 6 or 7 Rooms | 450 (41.9%) | 16 (6.4%) |
| 8 or more Rooms | 222 (20.7%) | 22 (8.8%) |
| Total | 1,073 (100.0%) | 251 (100.0%) |
Housing Structure by Heating Type in Shackelford County
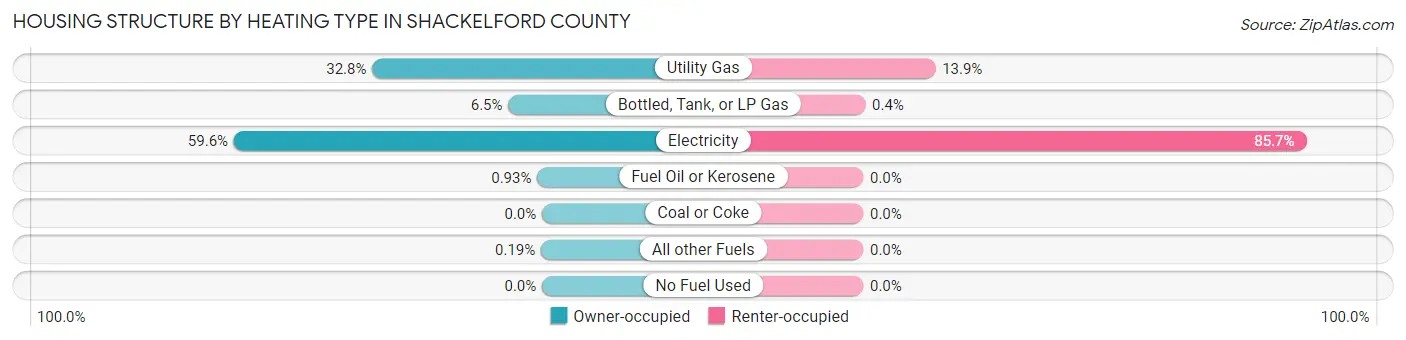
| Heating Type | Owner-occupied | Renter-occupied |
| Utility Gas | 352 (32.8%) | 35 (13.9%) |
| Bottled, Tank, or LP Gas | 70 (6.5%) | 1 (0.4%) |
| Electricity | 639 (59.6%) | 215 (85.7%) |
| Fuel Oil or Kerosene | 10 (0.9%) | 0 (0.0%) |
| Coal or Coke | 0 (0.0%) | 0 (0.0%) |
| All other Fuels | 2 (0.2%) | 0 (0.0%) |
| No Fuel Used | 0 (0.0%) | 0 (0.0%) |
| Total | 1,073 (100.0%) | 251 (100.0%) |
Household Vehicle Usage in Shackelford County
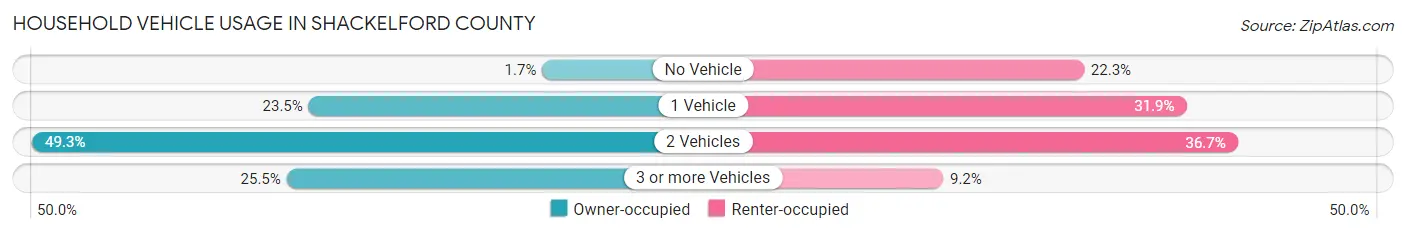
| Vehicles per Household | Owner-occupied | Renter-occupied |
| No Vehicle | 18 (1.7%) | 56 (22.3%) |
| 1 Vehicle | 252 (23.5%) | 80 (31.9%) |
| 2 Vehicles | 529 (49.3%) | 92 (36.6%) |
| 3 or more Vehicles | 274 (25.5%) | 23 (9.2%) |
| Total | 1,073 (100.0%) | 251 (100.0%) |
Real Estate & Mortgages in Shackelford County
Real Estate and Mortgage Overview in Shackelford County
| Characteristic | Without Mortgage | With Mortgage |
| Housing Units | 710 | 363 |
| Median Property Value | $153,100 | $220,100 |
| Median Household Income | $58,281 | $79 |
| Monthly Housing Costs | $578 | $0 |
| Real Estate Taxes | $1,471 | $6 |
Property Value by Mortgage Status in Shackelford County
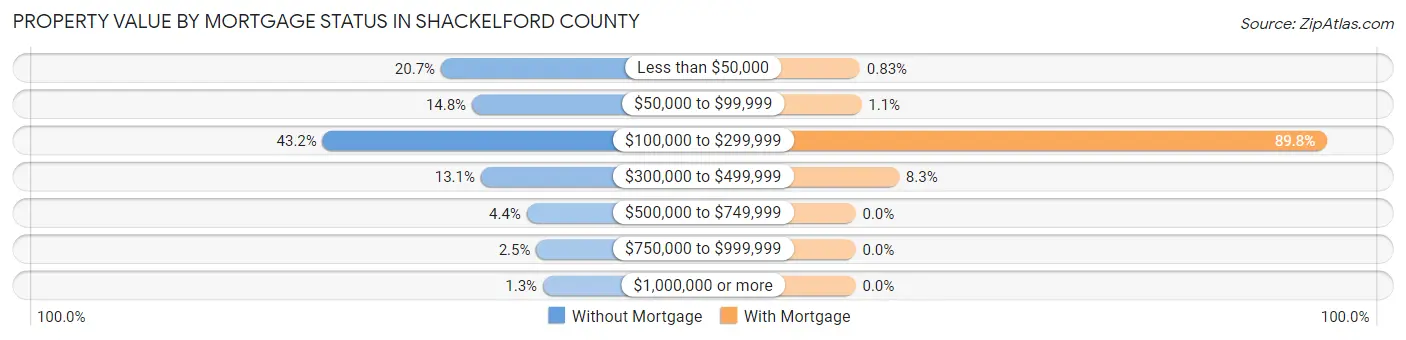
| Property Value | Without Mortgage | With Mortgage |
| Less than $50,000 | 147 (20.7%) | 3 (0.8%) |
| $50,000 to $99,999 | 105 (14.8%) | 4 (1.1%) |
| $100,000 to $299,999 | 307 (43.2%) | 326 (89.8%) |
| $300,000 to $499,999 | 93 (13.1%) | 30 (8.3%) |
| $500,000 to $749,999 | 31 (4.4%) | 0 (0.0%) |
| $750,000 to $999,999 | 18 (2.5%) | 0 (0.0%) |
| $1,000,000 or more | 9 (1.3%) | 0 (0.0%) |
| Total | 710 (100.0%) | 363 (100.0%) |
Household Income by Mortgage Status in Shackelford County
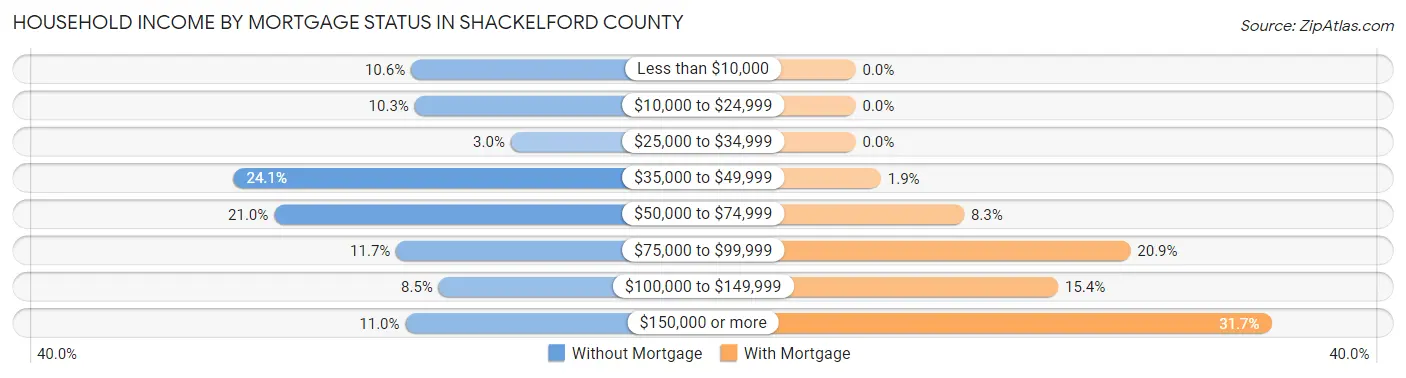
| Household Income | Without Mortgage | With Mortgage |
| Less than $10,000 | 75 (10.6%) | 0 (0.0%) |
| $10,000 to $24,999 | 73 (10.3%) | 0 (0.0%) |
| $25,000 to $34,999 | 21 (3.0%) | 0 (0.0%) |
| $35,000 to $49,999 | 171 (24.1%) | 7 (1.9%) |
| $50,000 to $74,999 | 149 (21.0%) | 30 (8.3%) |
| $75,000 to $99,999 | 83 (11.7%) | 76 (20.9%) |
| $100,000 to $149,999 | 60 (8.5%) | 56 (15.4%) |
| $150,000 or more | 78 (11.0%) | 115 (31.7%) |
| Total | 710 (100.0%) | 363 (100.0%) |
Property Value to Household Income Ratio in Shackelford County
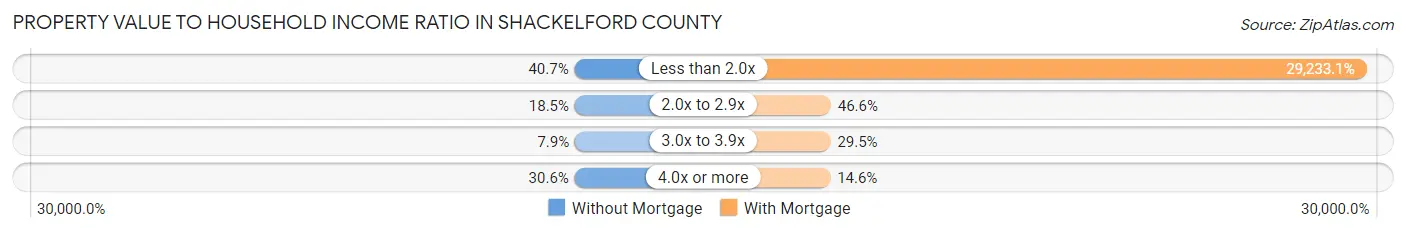
| Value-to-Income Ratio | Without Mortgage | With Mortgage |
| Less than 2.0x | 289 (40.7%) | 106,116 (29,233.1%) |
| 2.0x to 2.9x | 131 (18.4%) | 169 (46.6%) |
| 3.0x to 3.9x | 56 (7.9%) | 107 (29.5%) |
| 4.0x or more | 217 (30.6%) | 53 (14.6%) |
| Total | 710 (100.0%) | 363 (100.0%) |
Real Estate Taxes by Mortgage Status in Shackelford County
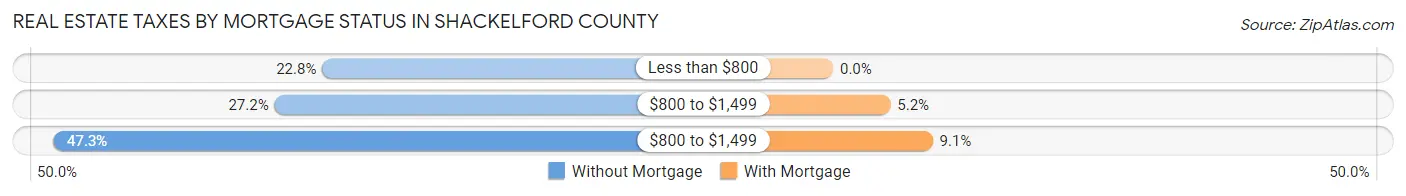
| Property Taxes | Without Mortgage | With Mortgage |
| Less than $800 | 162 (22.8%) | 0 (0.0%) |
| $800 to $1,499 | 193 (27.2%) | 19 (5.2%) |
| $800 to $1,499 | 336 (47.3%) | 33 (9.1%) |
| Total | 710 (100.0%) | 363 (100.0%) |
Health & Disability in Shackelford County
Health Insurance Coverage by Age in Shackelford County
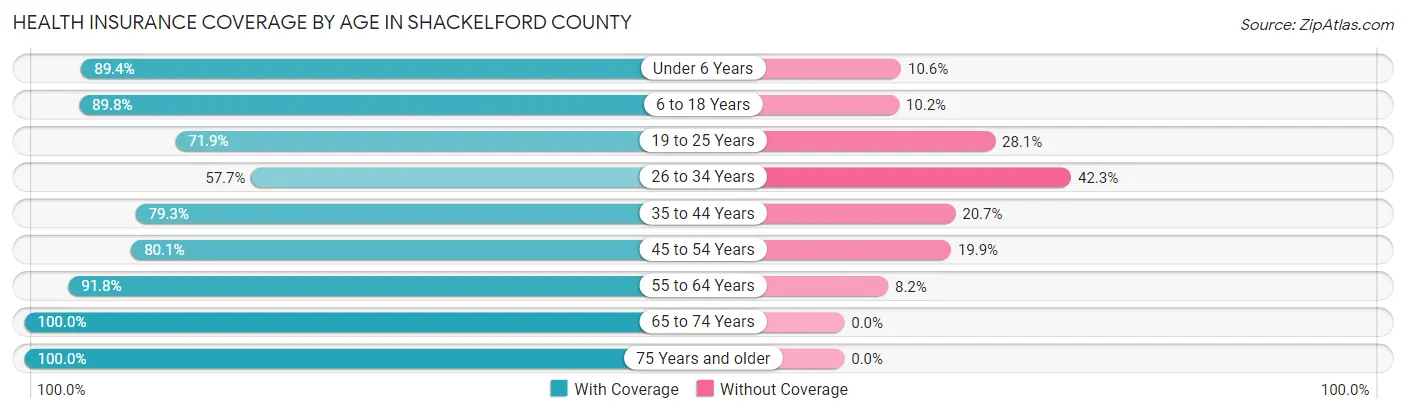
| Age Bracket | With Coverage | Without Coverage |
| Under 6 Years | 186 (89.4%) | 22 (10.6%) |
| 6 to 18 Years | 547 (89.8%) | 62 (10.2%) |
| 19 to 25 Years | 133 (71.9%) | 52 (28.1%) |
| 26 to 34 Years | 172 (57.7%) | 126 (42.3%) |
| 35 to 44 Years | 249 (79.3%) | 65 (20.7%) |
| 45 to 54 Years | 282 (80.1%) | 70 (19.9%) |
| 55 to 64 Years | 473 (91.8%) | 42 (8.2%) |
| 65 to 74 Years | 355 (100.0%) | 0 (0.0%) |
| 75 Years and older | 262 (100.0%) | 0 (0.0%) |
| Total | 2,659 (85.8%) | 439 (14.2%) |
Health Insurance Coverage by Citizenship Status in Shackelford County
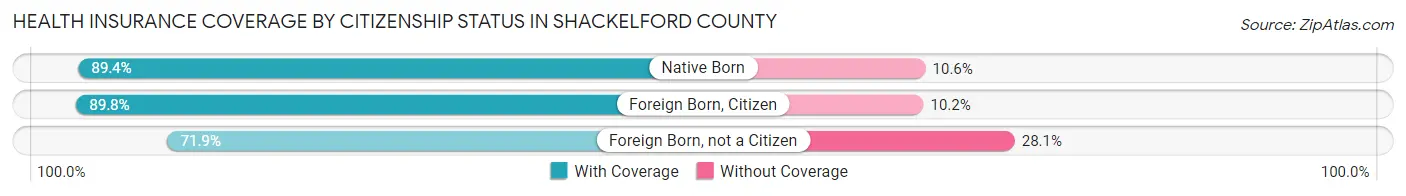
| Citizenship Status | With Coverage | Without Coverage |
| Native Born | 186 (89.4%) | 22 (10.6%) |
| Foreign Born, Citizen | 547 (89.8%) | 62 (10.2%) |
| Foreign Born, not a Citizen | 133 (71.9%) | 52 (28.1%) |
Health Insurance Coverage by Household Income in Shackelford County
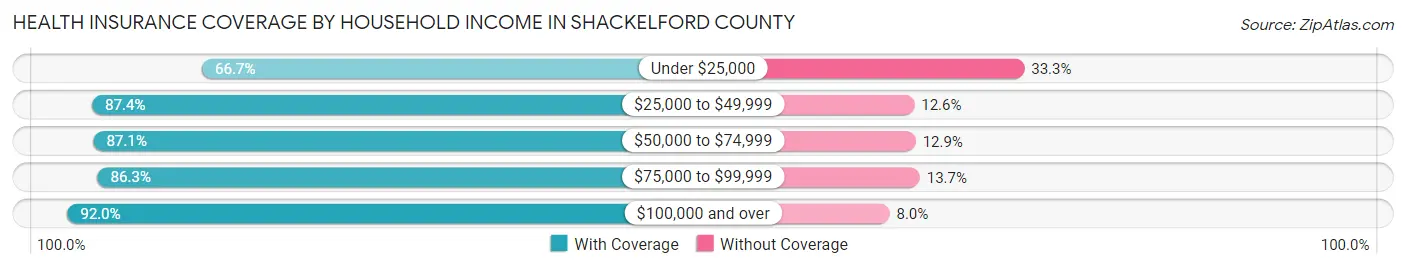
| Household Income | With Coverage | Without Coverage |
| Under $25,000 | 309 (66.7%) | 154 (33.3%) |
| $25,000 to $49,999 | 380 (87.4%) | 55 (12.6%) |
| $50,000 to $74,999 | 499 (87.1%) | 74 (12.9%) |
| $75,000 to $99,999 | 385 (86.3%) | 61 (13.7%) |
| $100,000 and over | 1,079 (92.0%) | 94 (8.0%) |
Public vs Private Health Insurance Coverage by Age in Shackelford County
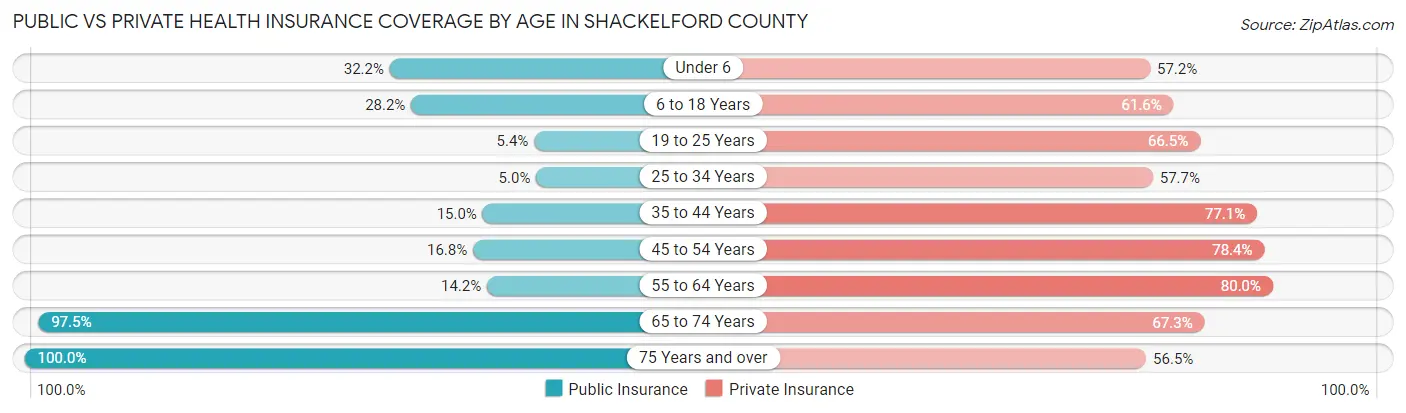
| Age Bracket | Public Insurance | Private Insurance |
| Under 6 | 67 (32.2%) | 119 (57.2%) |
| 6 to 18 Years | 172 (28.2%) | 375 (61.6%) |
| 19 to 25 Years | 10 (5.4%) | 123 (66.5%) |
| 25 to 34 Years | 15 (5.0%) | 172 (57.7%) |
| 35 to 44 Years | 47 (15.0%) | 242 (77.1%) |
| 45 to 54 Years | 59 (16.8%) | 276 (78.4%) |
| 55 to 64 Years | 73 (14.2%) | 412 (80.0%) |
| 65 to 74 Years | 346 (97.5%) | 239 (67.3%) |
| 75 Years and over | 262 (100.0%) | 148 (56.5%) |
| Total | 1,051 (33.9%) | 2,106 (68.0%) |
Disability Status by Sex by Age in Shackelford County
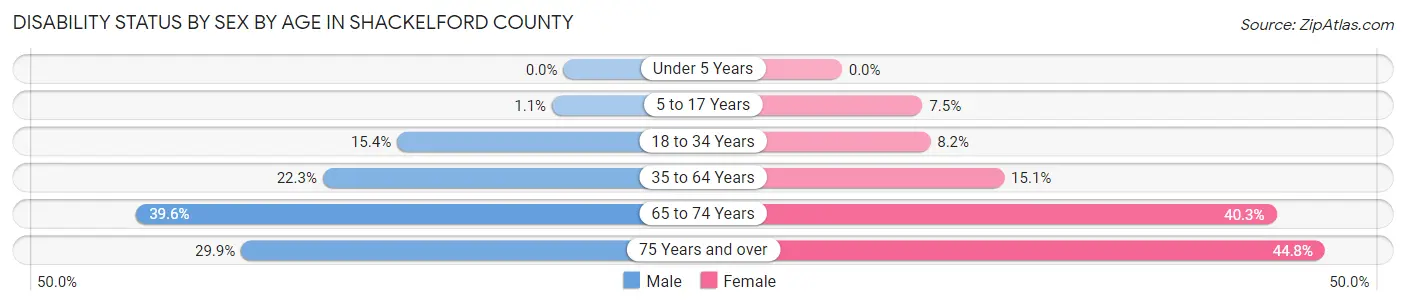
| Age Bracket | Male | Female |
| Under 5 Years | 0 (0.0%) | 0 (0.0%) |
| 5 to 17 Years | 4 (1.1%) | 16 (7.5%) |
| 18 to 34 Years | 46 (15.4%) | 22 (8.2%) |
| 35 to 64 Years | 117 (22.3%) | 99 (15.1%) |
| 65 to 74 Years | 67 (39.6%) | 75 (40.3%) |
| 75 Years and over | 35 (29.9%) | 65 (44.8%) |
Disability Class by Sex by Age in Shackelford County
Disability Class: Hearing Difficulty
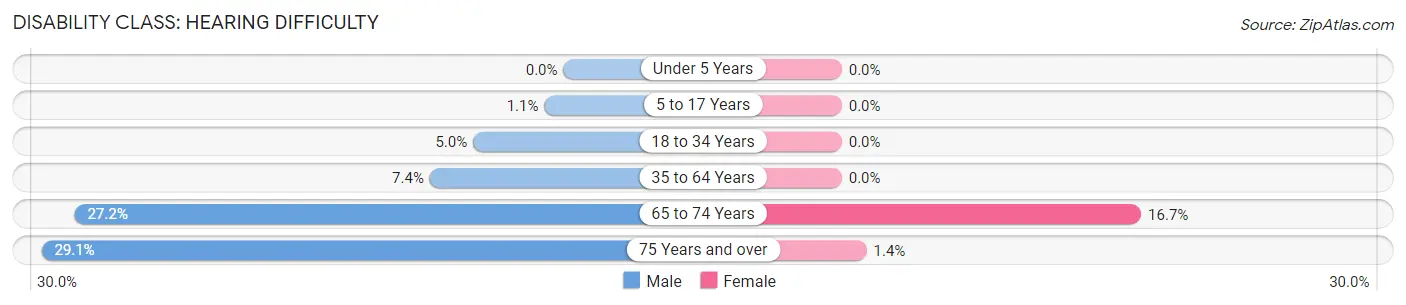
| Age Bracket | Male | Female |
| Under 5 Years | 0 (0.0%) | 0 (0.0%) |
| 5 to 17 Years | 4 (1.1%) | 0 (0.0%) |
| 18 to 34 Years | 15 (5.0%) | 0 (0.0%) |
| 35 to 64 Years | 39 (7.4%) | 0 (0.0%) |
| 65 to 74 Years | 46 (27.2%) | 31 (16.7%) |
| 75 Years and over | 34 (29.1%) | 2 (1.4%) |
Disability Class: Vision Difficulty
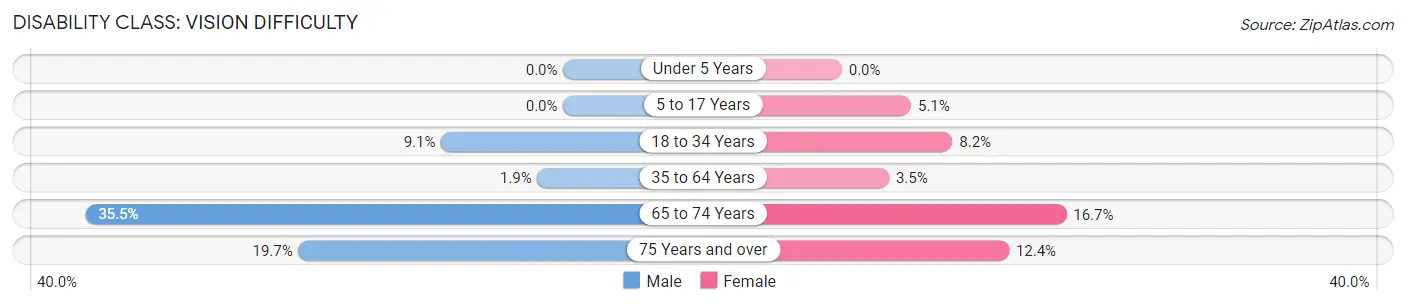
| Age Bracket | Male | Female |
| Under 5 Years | 0 (0.0%) | 0 (0.0%) |
| 5 to 17 Years | 0 (0.0%) | 11 (5.1%) |
| 18 to 34 Years | 27 (9.1%) | 22 (8.2%) |
| 35 to 64 Years | 10 (1.9%) | 23 (3.5%) |
| 65 to 74 Years | 60 (35.5%) | 31 (16.7%) |
| 75 Years and over | 23 (19.7%) | 18 (12.4%) |
Disability Class: Cognitive Difficulty
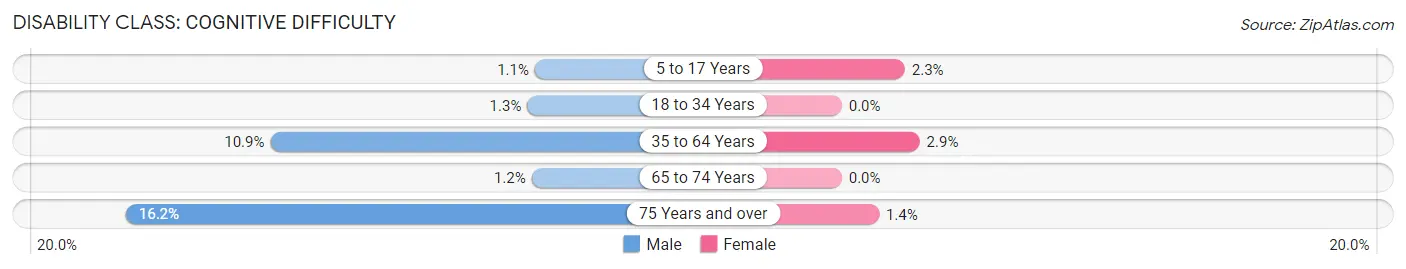
| Age Bracket | Male | Female |
| 5 to 17 Years | 4 (1.1%) | 5 (2.3%) |
| 18 to 34 Years | 4 (1.3%) | 0 (0.0%) |
| 35 to 64 Years | 57 (10.9%) | 19 (2.9%) |
| 65 to 74 Years | 2 (1.2%) | 0 (0.0%) |
| 75 Years and over | 19 (16.2%) | 2 (1.4%) |
Disability Class: Ambulatory Difficulty
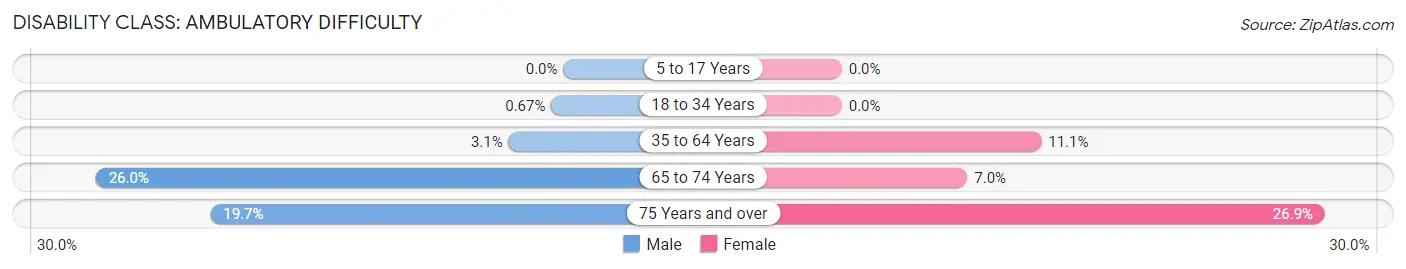
| Age Bracket | Male | Female |
| 5 to 17 Years | 0 (0.0%) | 0 (0.0%) |
| 18 to 34 Years | 2 (0.7%) | 0 (0.0%) |
| 35 to 64 Years | 16 (3.0%) | 73 (11.1%) |
| 65 to 74 Years | 44 (26.0%) | 13 (7.0%) |
| 75 Years and over | 23 (19.7%) | 39 (26.9%) |
Disability Class: Self-Care Difficulty
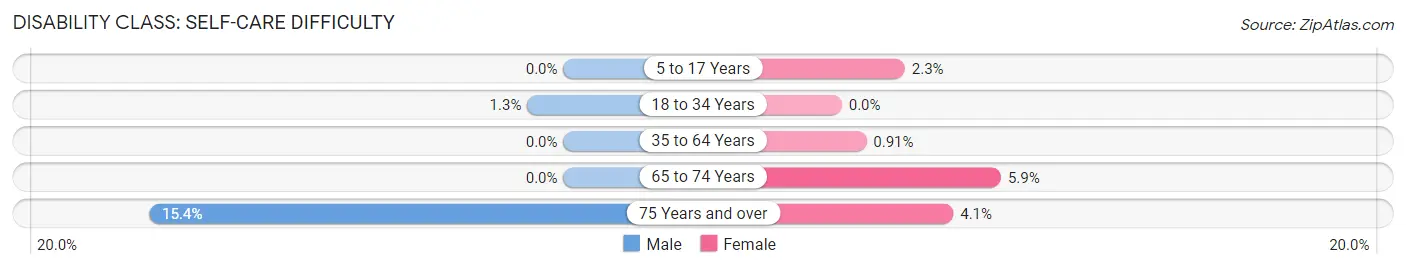
| Age Bracket | Male | Female |
| 5 to 17 Years | 0 (0.0%) | 5 (2.3%) |
| 18 to 34 Years | 4 (1.3%) | 0 (0.0%) |
| 35 to 64 Years | 0 (0.0%) | 6 (0.9%) |
| 65 to 74 Years | 0 (0.0%) | 11 (5.9%) |
| 75 Years and over | 18 (15.4%) | 6 (4.1%) |
Technology Access in Shackelford County
Computing Device Access in Shackelford County
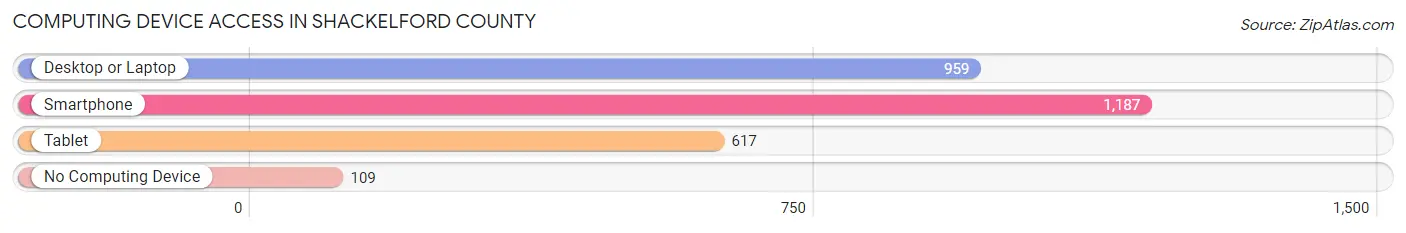
| Device Type | # Households | % Households |
| Desktop or Laptop | 959 | 72.4% |
| Smartphone | 1,187 | 89.6% |
| Tablet | 617 | 46.6% |
| No Computing Device | 109 | 8.2% |
| Total | 1,324 | 100.0% |
Internet Access in Shackelford County
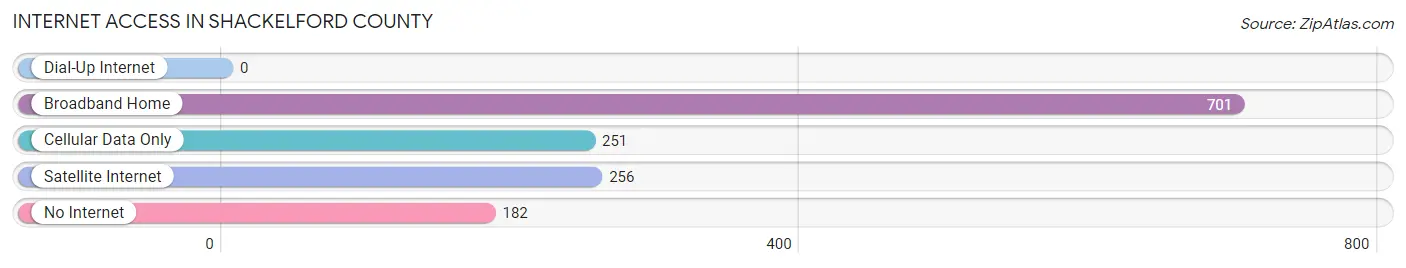
| Internet Type | # Households | % Households |
| Dial-Up Internet | 0 | 0.0% |
| Broadband Home | 701 | 52.9% |
| Cellular Data Only | 251 | 19.0% |
| Satellite Internet | 256 | 19.3% |
| No Internet | 182 | 13.8% |
| Total | 1,324 | 100.0% |
Shackelford County Summary
Shackelford County is located in the north-central region of Texas, and is part of the Big Country region. It is bordered by Stephens County to the north, Eastland County to the east, Callahan County to the south, and Jones and Taylor Counties to the west. The county seat is located in the city of Albany, which is the largest city in the county.
History
Shackelford County was established in 1858 and named after Dr. Jack Shackelford, a doctor and soldier who served in the Texas Revolution. The county was originally part of Bosque County, but was later divided into its own county. The first settlers in the area were ranchers, who were attracted to the area due to its abundance of grass and water.
The county was home to several Native American tribes, including the Comanche, Kiowa, and Apache. The Comanche were the dominant tribe in the area, and they used the area as a hunting ground. The first white settlers in the area were ranchers, who were attracted to the area due to its abundance of grass and water.
The county was also home to several military posts, including Fort Griffin, which was established in 1867. The fort was used to protect settlers from Native American raids. The fort was abandoned in 1881, and the town of Albany was established in its place.
Geography
Shackelford County is located in the north-central region of Texas, and is part of the Big Country region. It is bordered by Stephens County to the north, Eastland County to the east, Callahan County to the south, and Jones and Taylor Counties to the west. The county has a total area of 902 square miles, of which 899 square miles is land and 3 square miles is water.
The county is mostly flat, with some rolling hills in the western part of the county. The terrain is mostly covered in grasslands, with some areas of woodlands. The county is home to several creeks and rivers, including the Clear Fork of the Brazos River, which runs through the county.
Economy
The economy of Shackelford County is largely based on agriculture and ranching. The county is home to several large ranches, which raise cattle, sheep, and goats. The county is also home to several oil and gas fields, which provide jobs for many of the county’s residents.
The county is also home to several manufacturing companies, which produce a variety of products, including furniture, clothing, and electronics. The county is also home to several retail stores, which provide jobs for many of the county’s residents.
Demographics
As of the 2010 census, the population of Shackelford County was 3,541. The population is mostly white (90.2%), with small percentages of African American (3.2%), Hispanic (3.1%), and Native American (1.2%) residents. The median household income in the county is $41,945, and the median home value is $90,400.
The county is home to several small towns, including Albany, which is the largest city in the county. Other towns in the county include Moran, Moran Junction, and Clyde. The county is also home to several unincorporated communities, including Lueders, Putnam, and Olden.
Conclusion
Shackelford County is located in the north-central region of Texas, and is part of the Big Country region. It is bordered by Stephens County to the north, Eastland County to the east, Callahan County to the south, and Jones and Taylor Counties to the west. The county has a total area of 902 square miles, of which 899 square miles is land and 3 square miles is water. The economy of Shackelford County is largely based on agriculture and ranching, and the county is home to several large ranches, manufacturing companies, and retail stores. As of the 2010 census, the population of Shackelford County was 3,541, and the median household income in the county is $41,945. The county is home to several small towns, including Albany, which is the largest city in the county.
Common Questions
What is Per Capita Income in Shackelford County?
Per Capita income in Shackelford County is $32,245.
What is the Median Family Income in Shackelford County?
Median Family Income in Shackelford County is $83,083.
What is the Median Household income in Shackelford County?
Median Household Income in Shackelford County is $60,924.
What is Income or Wage Gap in Shackelford County?
Income or Wage Gap in Shackelford County is 28.6%.
Women in Shackelford County earn 71.4 cents for every dollar earned by a man.
What is Inequality or Gini Index in Shackelford County?
Inequality or Gini Index in Shackelford County is 0.44.
What is the Total Population of Shackelford County?
Total Population of Shackelford County is 3,134.
What is the Total Male Population of Shackelford County?
Total Male Population of Shackelford County is 1,583.
What is the Total Female Population of Shackelford County?
Total Female Population of Shackelford County is 1,551.
What is the Ratio of Males per 100 Females in Shackelford County?
There are 102.06 Males per 100 Females in Shackelford County.
What is the Ratio of Females per 100 Males in Shackelford County?
There are 97.98 Females per 100 Males in Shackelford County.
What is the Median Population Age in Shackelford County?
Median Population Age in Shackelford County is 42.9 Years.
What is the Average Family Size in Shackelford County
Average Family Size in Shackelford County is 2.9 People.
What is the Average Household Size in Shackelford County
Average Household Size in Shackelford County is 2.3 People.
How Large is the Labor Force in Shackelford County?
There are 1,619 People in the Labor Forcein in Shackelford County.
What is the Percentage of People in the Labor Force in Shackelford County?
65.2% of People are in the Labor Force in Shackelford County.
What is the Unemployment Rate in Shackelford County?
Unemployment Rate in Shackelford County is 7.2%.