Schleicher County, TX Map & Demographics
Schleicher County Map
Schleicher County Overview
$28,084
PER CAPITA INCOME
$79,076
AVG FAMILY INCOME
$53,774
AVG HOUSEHOLD INCOME
62.1%
WAGE / INCOME GAP [ % ]
37.9¢/ $1
WAGE / INCOME GAP [ $ ]
0.42
INEQUALITY / GINI INDEX
2,474
TOTAL POPULATION
1,181
MALE POPULATION
1,293
FEMALE POPULATION
91.34
MALES / 100 FEMALES
109.48
FEMALES / 100 MALES
39.4
MEDIAN AGE
3.5
AVG FAMILY SIZE
2.7
AVG HOUSEHOLD SIZE
1,138
LABOR FORCE [ PEOPLE ]
58.4%
PERCENT IN LABOR FORCE
6.9%
UNEMPLOYMENT RATE
Schleicher County Area Codes
Income in Schleicher County
Income Overview in Schleicher County
Per Capita Income in Schleicher County is $28,084, while median incomes of families and households are $79,076 and $53,774 respectively.
| Characteristic | Number | Measure |
| Per Capita Income | 2,474 | $28,084 |
| Median Family Income | 599 | $79,076 |
| Mean Family Income | 599 | $81,581 |
| Median Household Income | 899 | $53,774 |
| Mean Household Income | 899 | $70,578 |
| Income Deficit | 599 | $0 |
| Wage / Income Gap (%) | 2,474 | 62.09% |
| Wage / Income Gap ($) | 2,474 | 37.91¢ per $1 |
| Gini / Inequality Index | 2,474 | 0.42 |
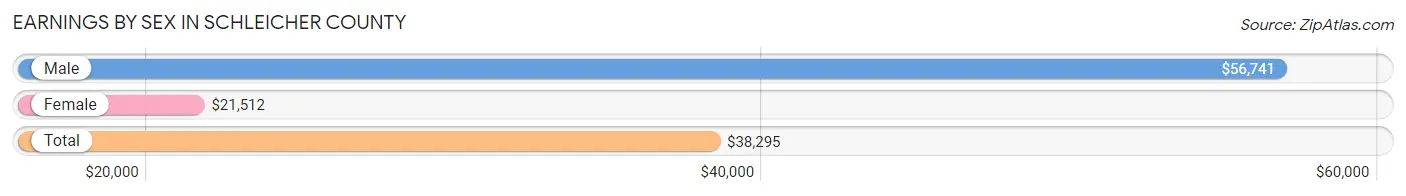
Earnings by Sex in Schleicher County
Average Earnings in Schleicher County are $38,295, $56,741 for men and $21,512 for women, a difference of 62.1%.
| Sex | Number | Average Earnings |
| Male | 691 (58.6%) | $56,741 |
| Female | 488 (41.4%) | $21,512 |
| Total | 1,179 (100.0%) | $38,295 |
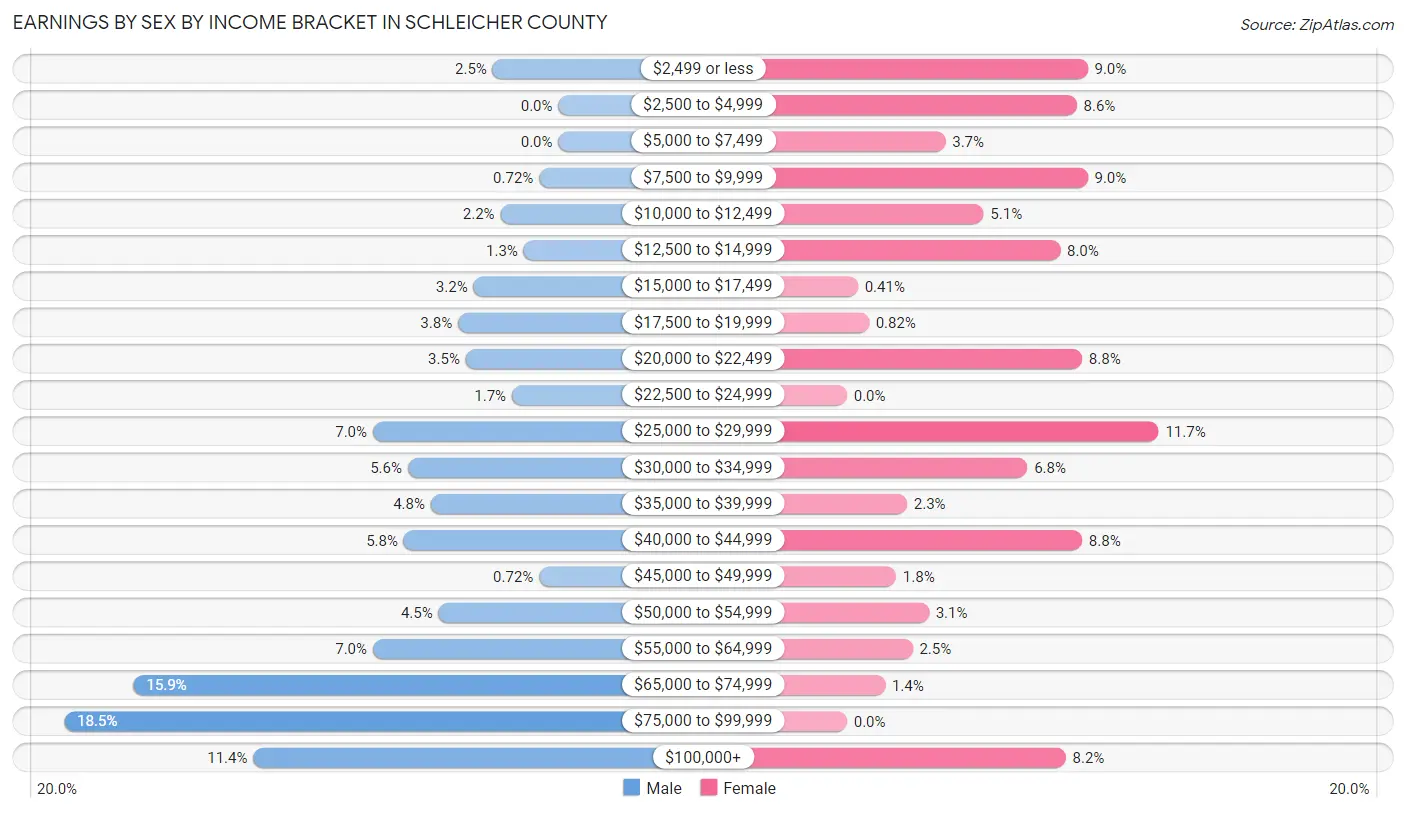
Earnings by Sex by Income Bracket in Schleicher County
The most common earnings brackets in Schleicher County are $75,000 to $99,999 for men (128 | 18.5%) and $25,000 to $29,999 for women (57 | 11.7%).
| Income | Male | Female |
| $2,499 or less | 17 (2.5%) | 44 (9.0%) |
| $2,500 to $4,999 | 0 (0.0%) | 42 (8.6%) |
| $5,000 to $7,499 | 0 (0.0%) | 18 (3.7%) |
| $7,500 to $9,999 | 5 (0.7%) | 44 (9.0%) |
| $10,000 to $12,499 | 15 (2.2%) | 25 (5.1%) |
| $12,500 to $14,999 | 9 (1.3%) | 39 (8.0%) |
| $15,000 to $17,499 | 22 (3.2%) | 2 (0.4%) |
| $17,500 to $19,999 | 26 (3.8%) | 4 (0.8%) |
| $20,000 to $22,499 | 24 (3.5%) | 43 (8.8%) |
| $22,500 to $24,999 | 12 (1.7%) | 0 (0.0%) |
| $25,000 to $29,999 | 48 (7.0%) | 57 (11.7%) |
| $30,000 to $34,999 | 39 (5.6%) | 33 (6.8%) |
| $35,000 to $39,999 | 33 (4.8%) | 11 (2.2%) |
| $40,000 to $44,999 | 40 (5.8%) | 43 (8.8%) |
| $45,000 to $49,999 | 5 (0.7%) | 9 (1.8%) |
| $50,000 to $54,999 | 31 (4.5%) | 15 (3.1%) |
| $55,000 to $64,999 | 48 (7.0%) | 12 (2.5%) |
| $65,000 to $74,999 | 110 (15.9%) | 7 (1.4%) |
| $75,000 to $99,999 | 128 (18.5%) | 0 (0.0%) |
| $100,000+ | 79 (11.4%) | 40 (8.2%) |
| Total | 691 (100.0%) | 488 (100.0%) |
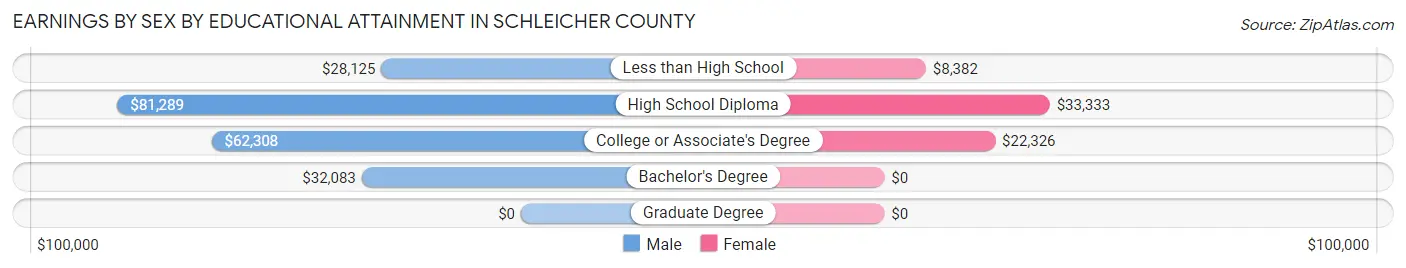
Earnings by Sex by Educational Attainment in Schleicher County
Average earnings in Schleicher County are $65,403 for men and $28,750 for women, a difference of 56.0%. Men with an educational attainment of high school diploma enjoy the highest average annual earnings of $81,289, while those with less than high school education earn the least with $28,125. Women with an educational attainment of high school diploma earn the most with the average annual earnings of $33,333, while those with less than high school education have the smallest earnings of $8,382.
| Educational Attainment | Male Income | Female Income |
| Less than High School | $28,125 | $8,382 |
| High School Diploma | $81,289 | $33,333 |
| College or Associate's Degree | $62,308 | $22,326 |
| Bachelor's Degree | $32,083 | $0 |
| Graduate Degree | - | - |
| Total | $65,403 | $28,750 |
Family Income in Schleicher County
Family Income Brackets in Schleicher County
According to the Schleicher County family income data, there are 147 families falling into the $100,000 to $149,999 income range, which is the most common income bracket and makes up 24.5% of all families. Conversely, the $200,000+ income bracket is the least frequent group with only 6 families (1.0%) belonging to this category.
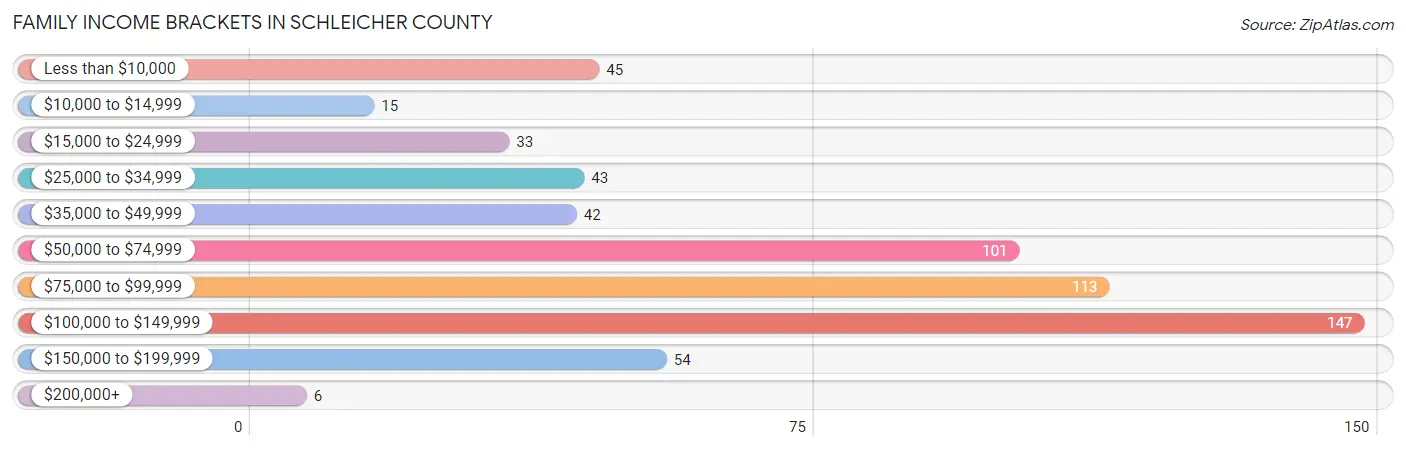
| Income Bracket | # Families | % Families |
| Less than $10,000 | 45 | 7.5% |
| $10,000 to $14,999 | 15 | 2.5% |
| $15,000 to $24,999 | 33 | 5.5% |
| $25,000 to $34,999 | 43 | 7.2% |
| $35,000 to $49,999 | 42 | 7.0% |
| $50,000 to $74,999 | 101 | 16.9% |
| $75,000 to $99,999 | 113 | 18.9% |
| $100,000 to $149,999 | 147 | 24.5% |
| $150,000 to $199,999 | 54 | 9.0% |
| $200,000+ | 6 | 1.0% |
Family Income by Famaliy Size in Schleicher County
3-person families (116 | 19.4%) account for the highest median family income in Schleicher County with $120,417 per family, while 3-person families (116 | 19.4%) have the highest median income of $40,139 per family member.
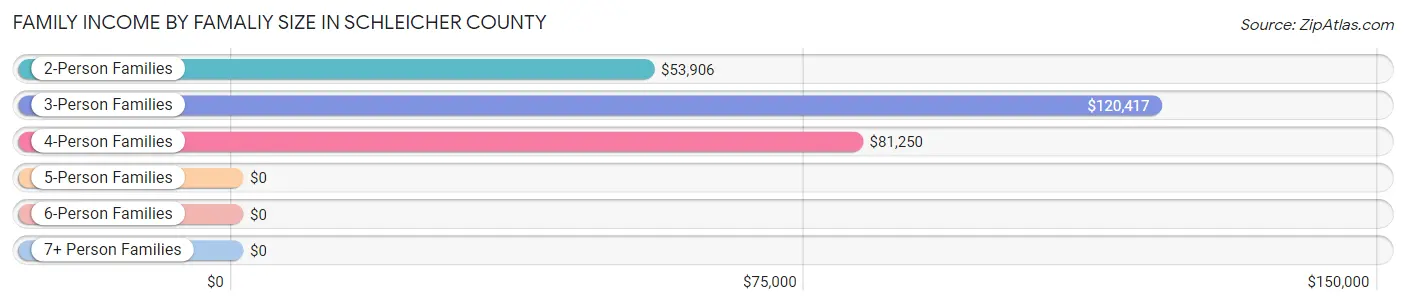
| Income Bracket | # Families | Median Income |
| 2-Person Families | 265 (44.2%) | $53,906 |
| 3-Person Families | 116 (19.4%) | $120,417 |
| 4-Person Families | 98 (16.4%) | $81,250 |
| 5-Person Families | 84 (14.0%) | $0 |
| 6-Person Families | 15 (2.5%) | $0 |
| 7+ Person Families | 21 (3.5%) | $0 |
| Total | 599 (100.0%) | $79,076 |
Family Income by Number of Earners in Schleicher County
The median family income in Schleicher County is $79,076, with families comprising 3+ earners (50) having the highest median family income of $195,238, while families with no earners (113) have the lowest median family income of $18,698, accounting for 8.4% and 18.9% of families, respectively.
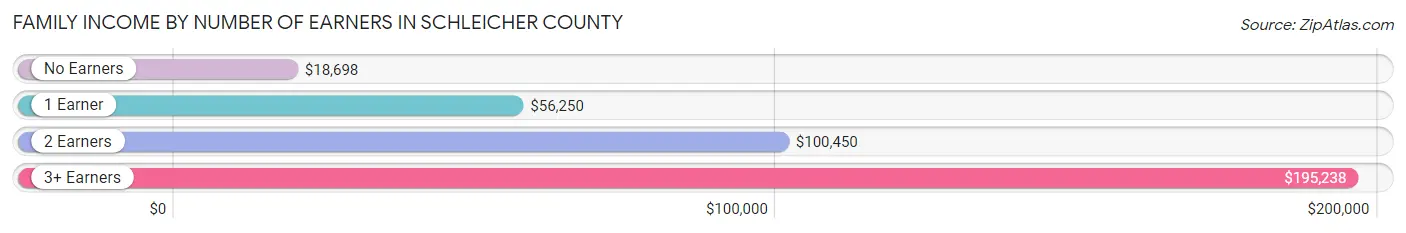
| Number of Earners | # Families | Median Income |
| No Earners | 113 (18.9%) | $18,698 |
| 1 Earner | 217 (36.2%) | $56,250 |
| 2 Earners | 219 (36.6%) | $100,450 |
| 3+ Earners | 50 (8.4%) | $195,238 |
| Total | 599 (100.0%) | $79,076 |
Household Income in Schleicher County
Household Income Brackets in Schleicher County
With 169 households falling in the category, the $100,000 to $149,999 income range is the most frequent in Schleicher County, accounting for 18.8% of all households. In contrast, only 6 households (0.7%) fall into the $200,000+ income bracket, making it the least populous group.
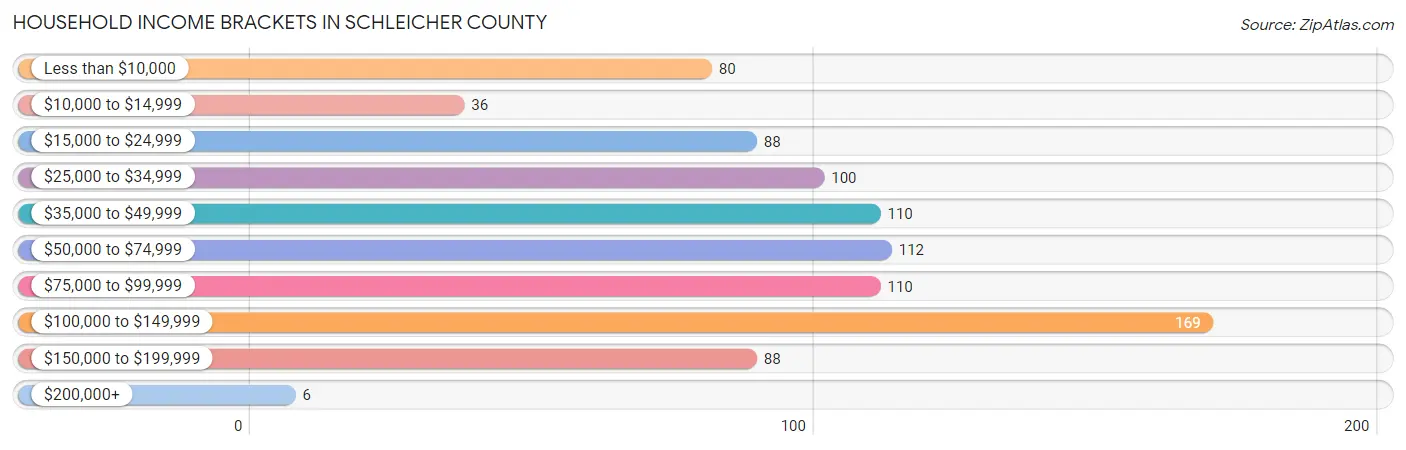
| Income Bracket | # Households | % Households |
| Less than $10,000 | 80 | 8.9% |
| $10,000 to $14,999 | 36 | 4.0% |
| $15,000 to $24,999 | 88 | 9.8% |
| $25,000 to $34,999 | 100 | 11.1% |
| $35,000 to $49,999 | 110 | 12.2% |
| $50,000 to $74,999 | 112 | 12.5% |
| $75,000 to $99,999 | 110 | 12.2% |
| $100,000 to $149,999 | 169 | 18.8% |
| $150,000 to $199,999 | 88 | 9.8% |
| $200,000+ | 6 | 0.7% |
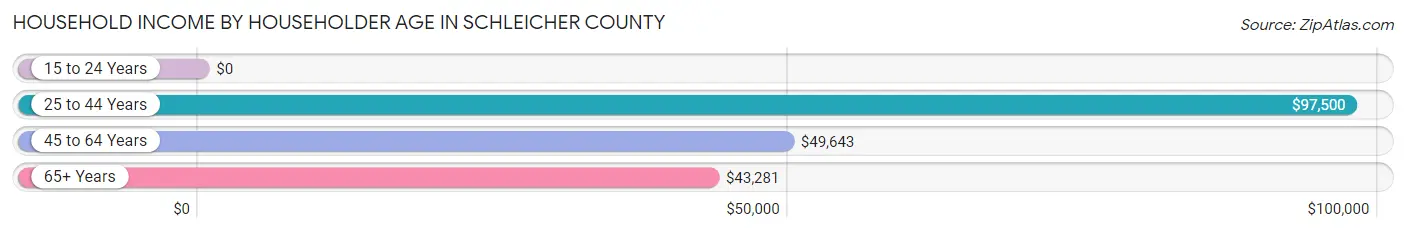
Household Income by Householder Age in Schleicher County
The median household income in Schleicher County is $53,774, with the highest median household income of $97,500 found in the 25 to 44 years age bracket for the primary householder. A total of 222 households (24.7%) fall into this category. Meanwhile, the 15 to 24 years age bracket for the primary householder has the lowest median household income of $0, with 2 households (0.2%) in this group.
| Income Bracket | # Households | Median Income |
| 15 to 24 Years | 2 (0.2%) | $0 |
| 25 to 44 Years | 222 (24.7%) | $97,500 |
| 45 to 64 Years | 252 (28.0%) | $49,643 |
| 65+ Years | 423 (47.0%) | $43,281 |
| Total | 899 (100.0%) | $53,774 |
Poverty in Schleicher County
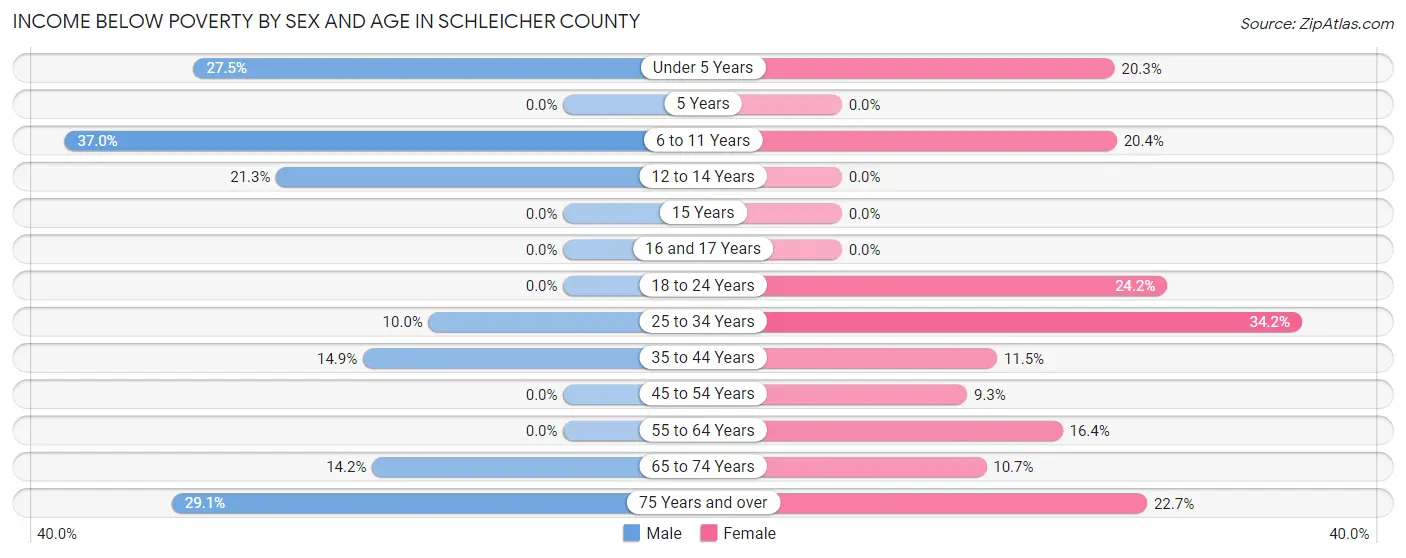
Income Below Poverty by Sex and Age in Schleicher County
With 12.4% poverty level for males and 16.3% for females among the residents of Schleicher County, 6 to 11 year old males and 25 to 34 year old females are the most vulnerable to poverty, with 20 males (37.0%) and 28 females (34.2%) in their respective age groups living below the poverty level.
| Age Bracket | Male | Female |
| Under 5 Years | 14 (27.5%) | 32 (20.3%) |
| 5 Years | 0 (0.0%) | 0 (0.0%) |
| 6 to 11 Years | 20 (37.0%) | 20 (20.4%) |
| 12 to 14 Years | 13 (21.3%) | 0 (0.0%) |
| 15 Years | 0 (0.0%) | 0 (0.0%) |
| 16 and 17 Years | 0 (0.0%) | 0 (0.0%) |
| 18 to 24 Years | 0 (0.0%) | 36 (24.2%) |
| 25 to 34 Years | 15 (10.0%) | 28 (34.2%) |
| 35 to 44 Years | 29 (14.9%) | 19 (11.5%) |
| 45 to 54 Years | 0 (0.0%) | 12 (9.3%) |
| 55 to 64 Years | 0 (0.0%) | 10 (16.4%) |
| 65 to 74 Years | 21 (14.2%) | 25 (10.7%) |
| 75 Years and over | 34 (29.1%) | 29 (22.7%) |
| Total | 146 (12.4%) | 211 (16.3%) |
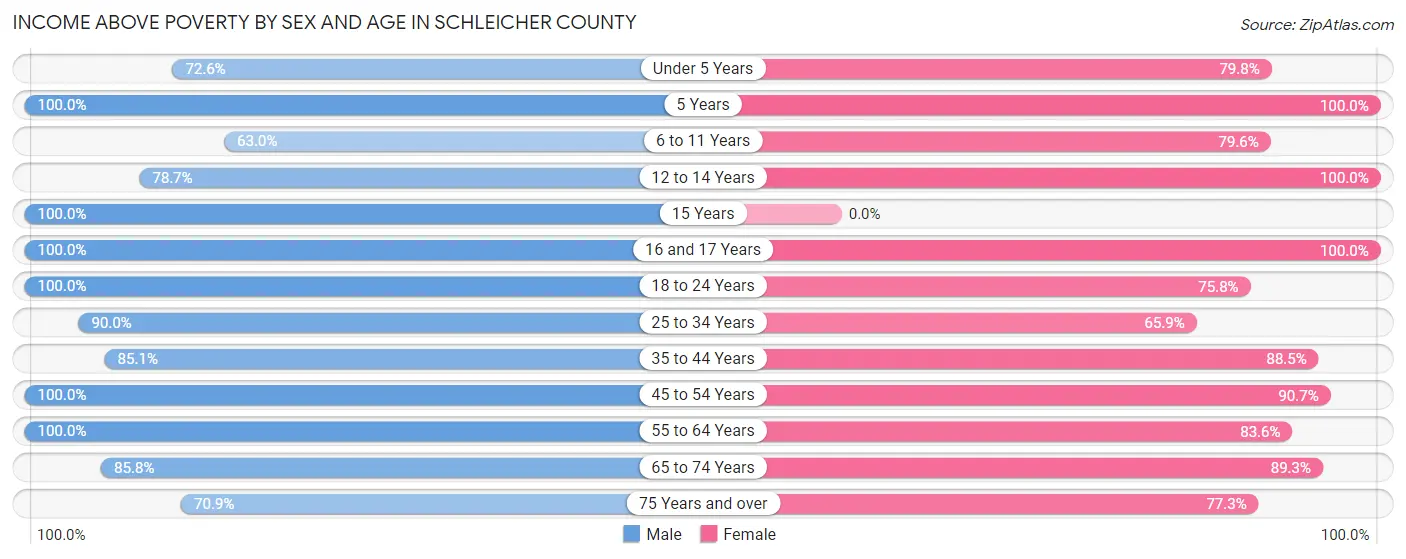
Income Above Poverty by Sex and Age in Schleicher County
According to the poverty statistics in Schleicher County, males aged 5 years and females aged 5 years are the age groups that are most secure financially, with 100.0% of males and 100.0% of females in these age groups living above the poverty line.
| Age Bracket | Male | Female |
| Under 5 Years | 37 (72.6%) | 126 (79.7%) |
| 5 Years | 23 (100.0%) | 19 (100.0%) |
| 6 to 11 Years | 34 (63.0%) | 78 (79.6%) |
| 12 to 14 Years | 48 (78.7%) | 27 (100.0%) |
| 15 Years | 34 (100.0%) | 0 (0.0%) |
| 16 and 17 Years | 29 (100.0%) | 44 (100.0%) |
| 18 to 24 Years | 72 (100.0%) | 113 (75.8%) |
| 25 to 34 Years | 135 (90.0%) | 54 (65.8%) |
| 35 to 44 Years | 166 (85.1%) | 146 (88.5%) |
| 45 to 54 Years | 115 (100.0%) | 117 (90.7%) |
| 55 to 64 Years | 124 (100.0%) | 51 (83.6%) |
| 65 to 74 Years | 127 (85.8%) | 208 (89.3%) |
| 75 Years and over | 83 (70.9%) | 99 (77.3%) |
| Total | 1,027 (87.5%) | 1,082 (83.7%) |
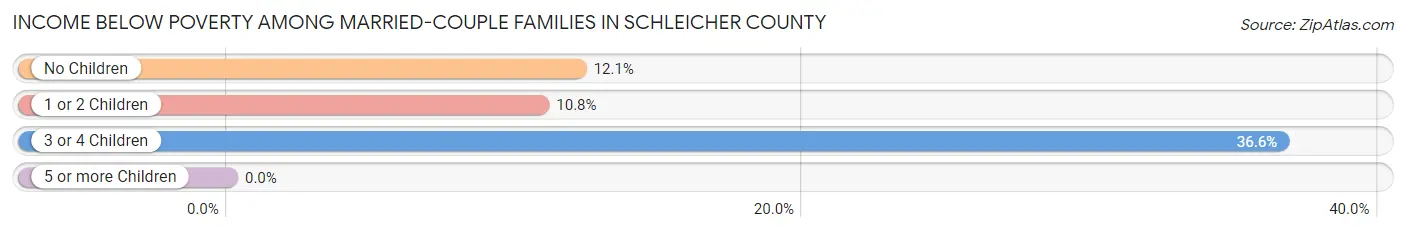
Income Below Poverty Among Married-Couple Families in Schleicher County
The poverty statistics for married-couple families in Schleicher County show that 13.6% or 71 of the total 524 families live below the poverty line. Families with 3 or 4 children have the highest poverty rate of 36.6%, comprising of 15 families. On the other hand, families with 1 or 2 children have the lowest poverty rate of 10.8%, which includes 22 families.
| Children | Above Poverty | Below Poverty |
| No Children | 246 (87.9%) | 34 (12.1%) |
| 1 or 2 Children | 181 (89.2%) | 22 (10.8%) |
| 3 or 4 Children | 26 (63.4%) | 15 (36.6%) |
| 5 or more Children | 0 (0.0%) | 0 (0.0%) |
| Total | 453 (86.5%) | 71 (13.6%) |
Income Below Poverty Among Single-Parent Households in Schleicher County
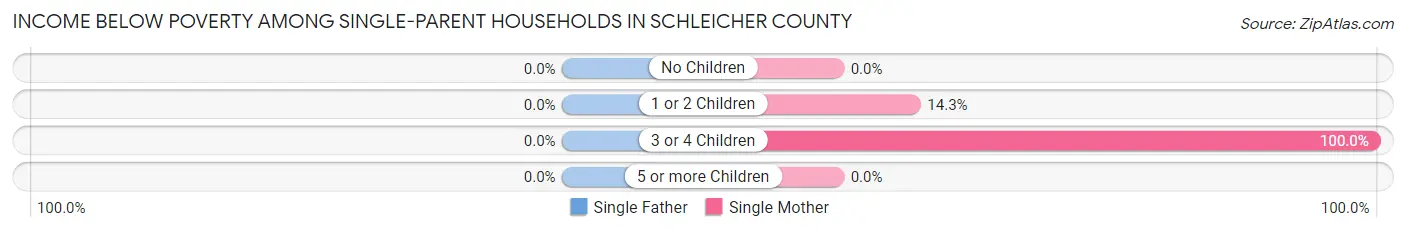
| Children | Single Father | Single Mother |
| No Children | 0 (0.0%) | 0 (0.0%) |
| 1 or 2 Children | 0 (0.0%) | 4 (14.3%) |
| 3 or 4 Children | 0 (0.0%) | 11 (100.0%) |
| 5 or more Children | 0 (0.0%) | 0 (0.0%) |
| Total | 0 (0.0%) | 15 (25.0%) |
Income Below Poverty Among Married-Couple vs Single-Parent Households in Schleicher County
The poverty data for Schleicher County shows that 71 of the married-couple family households (13.6%) and 15 of the single-parent households (20.0%) are living below the poverty level. Within the married-couple family households, those with 3 or 4 children have the highest poverty rate, with 15 households (36.6%) falling below the poverty line. Among the single-parent households, those with 3 or 4 children have the highest poverty rate, with 11 household (100.0%) living below poverty.
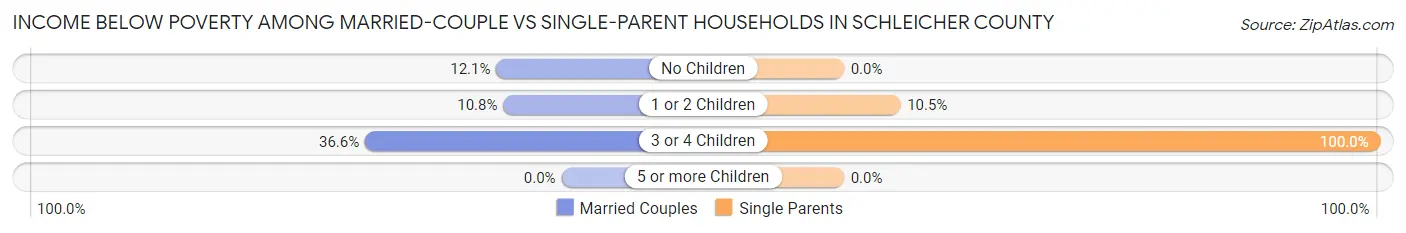
| Children | Married-Couple Families | Single-Parent Households |
| No Children | 34 (12.1%) | 0 (0.0%) |
| 1 or 2 Children | 22 (10.8%) | 4 (10.5%) |
| 3 or 4 Children | 15 (36.6%) | 11 (100.0%) |
| 5 or more Children | 0 (0.0%) | 0 (0.0%) |
| Total | 71 (13.6%) | 15 (20.0%) |
Race in Schleicher County
The most populous races in Schleicher County are White / Caucasian (1,413 | 57.1%), Hispanic or Latino (1,343 | 54.3%), and Some other Race (802 | 32.4%).
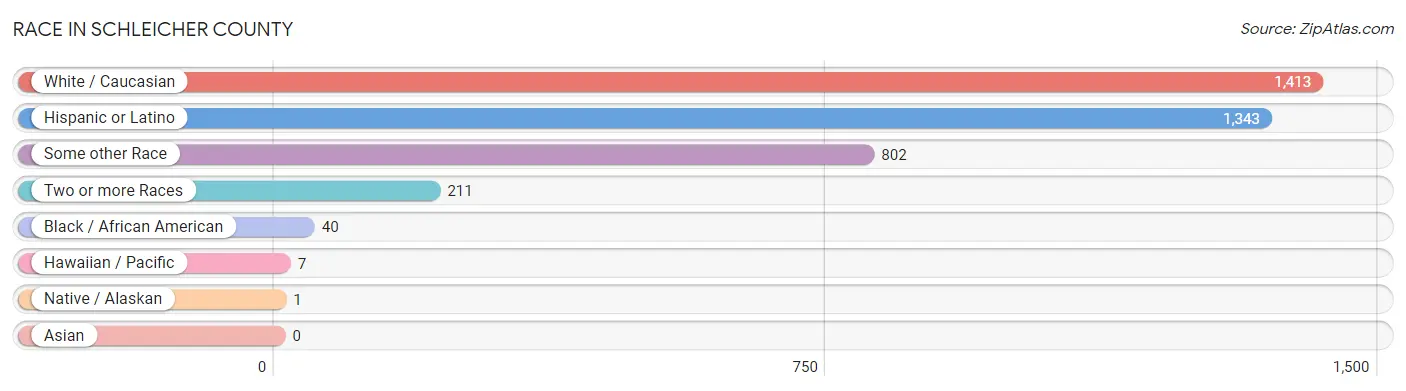
| Race | # Population | % Population |
| Asian | 0 | 0.0% |
| Black / African American | 40 | 1.6% |
| Hawaiian / Pacific | 7 | 0.3% |
| Hispanic or Latino | 1,343 | 54.3% |
| Native / Alaskan | 1 | 0.0% |
| White / Caucasian | 1,413 | 57.1% |
| Two or more Races | 211 | 8.5% |
| Some other Race | 802 | 32.4% |
| Total | 2,474 | 100.0% |
Ancestry in Schleicher County
The most populous ancestries reported in Schleicher County are Mexican (1,289 | 52.1%), English (279 | 11.3%), German (127 | 5.1%), Irish (67 | 2.7%), and Scotch-Irish (49 | 2.0%), together accounting for 73.2% of all Schleicher County residents.
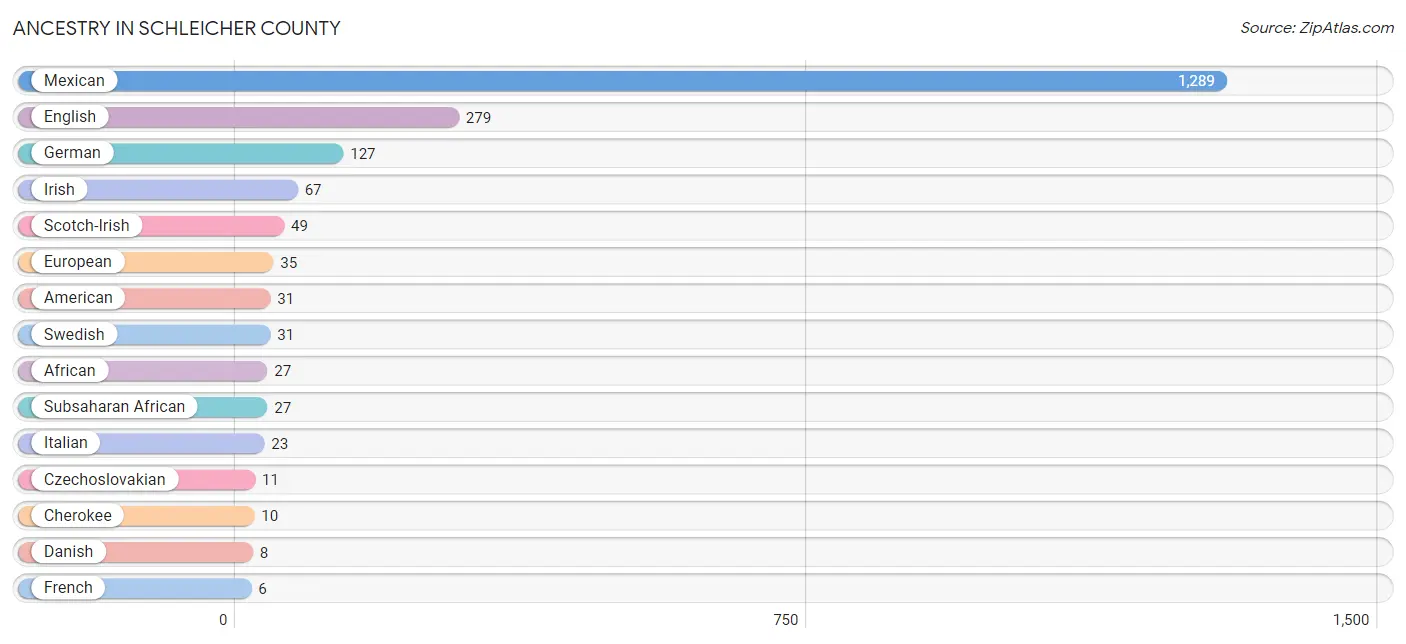
| Ancestry | # Population | % Population |
| African | 27 | 1.1% |
| American | 31 | 1.3% |
| Central American | 2 | 0.1% |
| Cherokee | 10 | 0.4% |
| Czechoslovakian | 11 | 0.4% |
| Danish | 8 | 0.3% |
| English | 279 | 11.3% |
| European | 35 | 1.4% |
| French | 6 | 0.2% |
| German | 127 | 5.1% |
| Irish | 67 | 2.7% |
| Italian | 23 | 0.9% |
| Mexican | 1,289 | 52.1% |
| Polish | 3 | 0.1% |
| Salvadoran | 2 | 0.1% |
| Scotch-Irish | 49 | 2.0% |
| Scottish | 3 | 0.1% |
| Subsaharan African | 27 | 1.1% |
| Swedish | 31 | 1.3% | View All 19 Rows |
Immigrants in Schleicher County
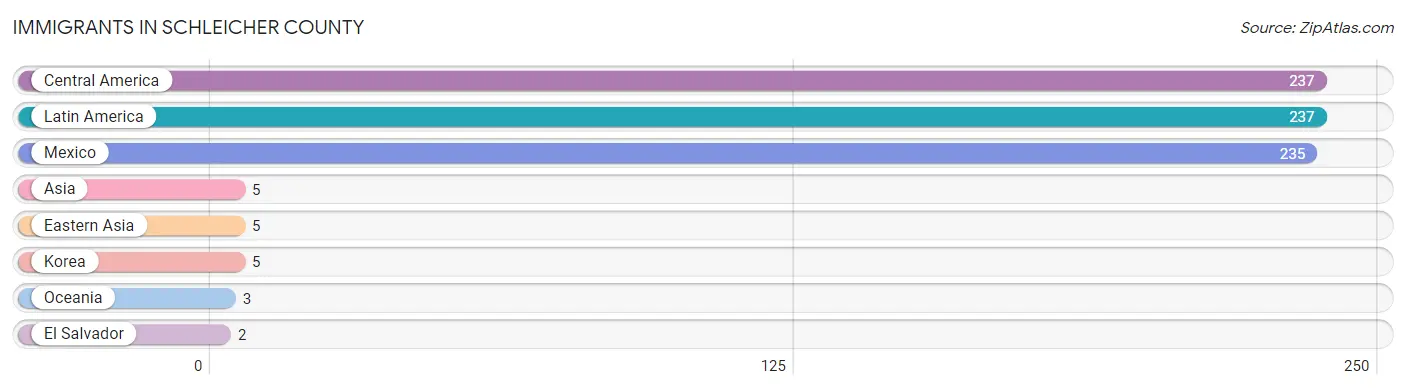
The most numerous immigrant groups reported in Schleicher County came from Central America (237 | 9.6%), Latin America (237 | 9.6%), Mexico (235 | 9.5%), Asia (5 | 0.2%), and Eastern Asia (5 | 0.2%), together accounting for 29.1% of all Schleicher County residents.
| Immigration Origin | # Population | % Population |
| Asia | 5 | 0.2% |
| Central America | 237 | 9.6% |
| Eastern Asia | 5 | 0.2% |
| El Salvador | 2 | 0.1% |
| Korea | 5 | 0.2% |
| Latin America | 237 | 9.6% |
| Mexico | 235 | 9.5% |
| Oceania | 3 | 0.1% | View All 8 Rows |
Sex and Age in Schleicher County
Sex and Age in Schleicher County
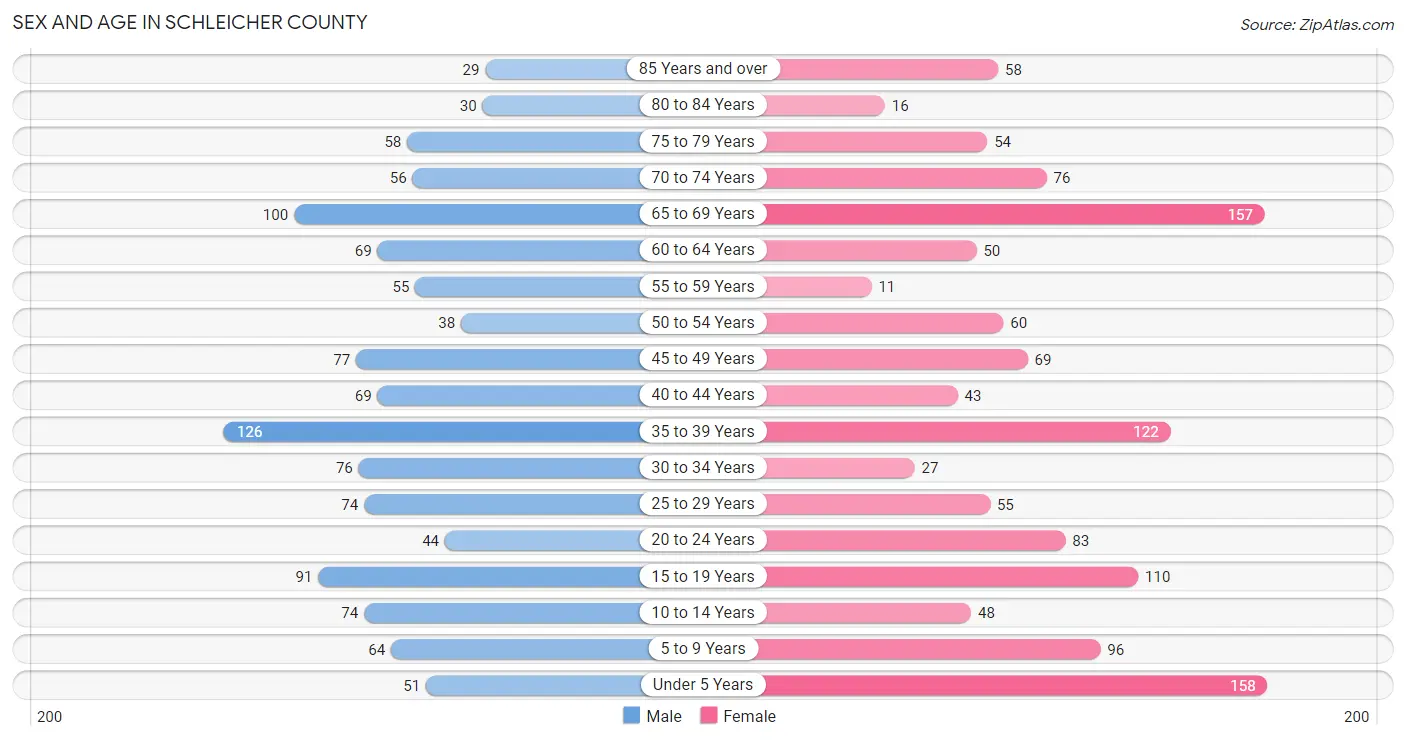
The most populous age groups in Schleicher County are 35 to 39 Years (126 | 10.7%) for men and Under 5 Years (158 | 12.2%) for women.
| Age Bracket | Male | Female |
| Under 5 Years | 51 (4.3%) | 158 (12.2%) |
| 5 to 9 Years | 64 (5.4%) | 96 (7.4%) |
| 10 to 14 Years | 74 (6.3%) | 48 (3.7%) |
| 15 to 19 Years | 91 (7.7%) | 110 (8.5%) |
| 20 to 24 Years | 44 (3.7%) | 83 (6.4%) |
| 25 to 29 Years | 74 (6.3%) | 55 (4.3%) |
| 30 to 34 Years | 76 (6.4%) | 27 (2.1%) |
| 35 to 39 Years | 126 (10.7%) | 122 (9.4%) |
| 40 to 44 Years | 69 (5.8%) | 43 (3.3%) |
| 45 to 49 Years | 77 (6.5%) | 69 (5.3%) |
| 50 to 54 Years | 38 (3.2%) | 60 (4.6%) |
| 55 to 59 Years | 55 (4.7%) | 11 (0.9%) |
| 60 to 64 Years | 69 (5.8%) | 50 (3.9%) |
| 65 to 69 Years | 100 (8.5%) | 157 (12.1%) |
| 70 to 74 Years | 56 (4.7%) | 76 (5.9%) |
| 75 to 79 Years | 58 (4.9%) | 54 (4.2%) |
| 80 to 84 Years | 30 (2.5%) | 16 (1.2%) |
| 85 Years and over | 29 (2.5%) | 58 (4.5%) |
| Total | 1,181 (100.0%) | 1,293 (100.0%) |
Families and Households in Schleicher County
Median Family Size in Schleicher County
The median family size in Schleicher County is 3.52 persons per family, with single female/mother families (60 | 10.0%) accounting for the largest median family size of 4.43 persons per family. On the other hand, single male/father families (15 | 2.5%) represent the smallest median family size with 3.07 persons per family.
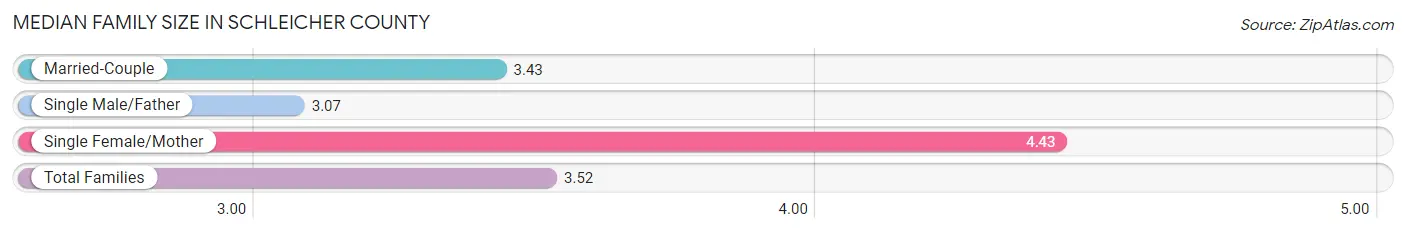
| Family Type | # Families | Family Size |
| Married-Couple | 524 (87.5%) | 3.43 |
| Single Male/Father | 15 (2.5%) | 3.07 |
| Single Female/Mother | 60 (10.0%) | 4.43 |
| Total Families | 599 (100.0%) | 3.52 |
Median Household Size in Schleicher County
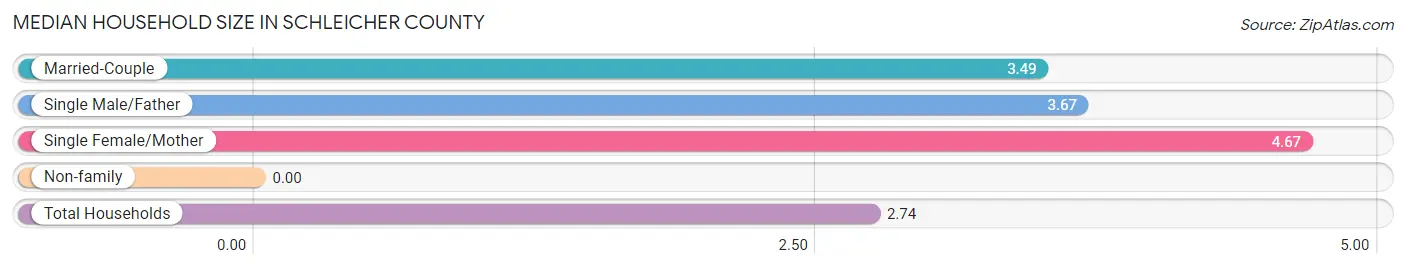
| Household Type | # Households | Household Size |
| Married-Couple | 524 (58.3%) | 3.49 |
| Single Male/Father | 15 (1.7%) | 3.67 |
| Single Female/Mother | 60 (6.7%) | 4.67 |
| Non-family | 300 (33.4%) | - |
| Total Households | 899 (100.0%) | 2.74 |
Household Size by Marriage Status in Schleicher County
Out of a total of 899 households in Schleicher County, 599 (66.6%) are family households, while 300 (33.4%) are nonfamily households. The most numerous type of family households are 2-person households, comprising 254, and the most common type of nonfamily households are 1-person households, comprising 300.
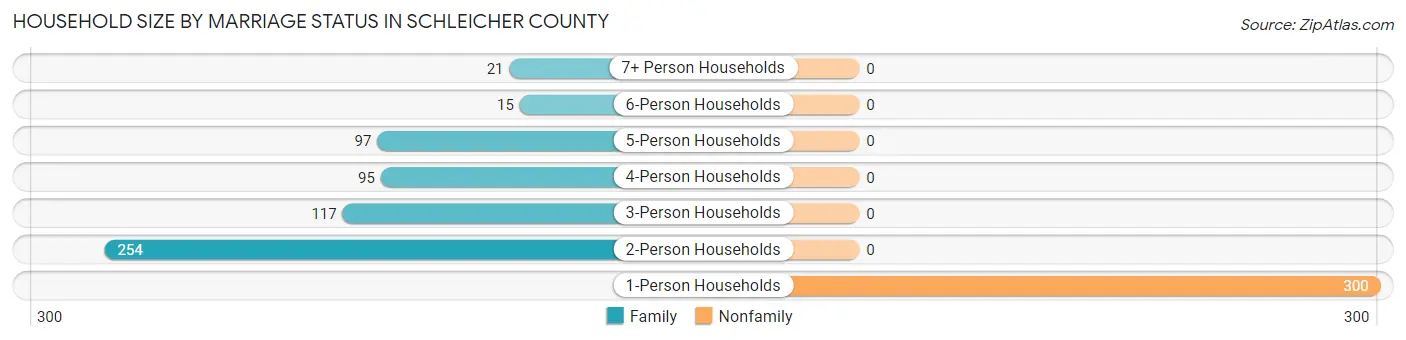
| Household Size | Family Households | Nonfamily Households |
| 1-Person Households | - | 300 (33.4%) |
| 2-Person Households | 254 (28.2%) | 0 (0.0%) |
| 3-Person Households | 117 (13.0%) | 0 (0.0%) |
| 4-Person Households | 95 (10.6%) | 0 (0.0%) |
| 5-Person Households | 97 (10.8%) | 0 (0.0%) |
| 6-Person Households | 15 (1.7%) | 0 (0.0%) |
| 7+ Person Households | 21 (2.3%) | 0 (0.0%) |
| Total | 599 (66.6%) | 300 (33.4%) |
Female Fertility in Schleicher County
Fertility by Age in Schleicher County
Average fertility rate in Schleicher County is 57.0 births per 1,000 women. Women in the age bracket of 20 to 34 years have the highest fertility rate with 182.0 births per 1,000 women. Women in the age bracket of 20 to 34 years acount for 100.0% of all women with births.
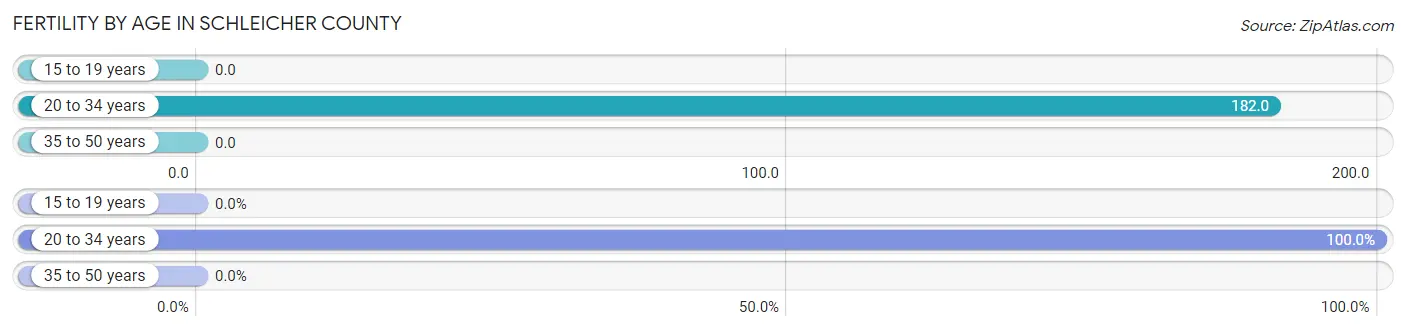
| Age Bracket | Women with Births | Births / 1,000 Women |
| 15 to 19 years | 0 (0.0%) | 0.0 |
| 20 to 34 years | 30 (100.0%) | 182.0 |
| 35 to 50 years | 0 (0.0%) | 0.0 |
| Total | 30 (100.0%) | 57.0 |
Fertility by Age by Marriage Status in Schleicher County
13.3% of women with births (30) in Schleicher County are married. The highest percentage of unmarried women with births falls into 20 to 34 years age bracket with 86.7% of them unmarried at the time of birth, while the lowest percentage of unmarried women with births belong to 20 to 34 years age bracket with 86.7% of them unmarried.
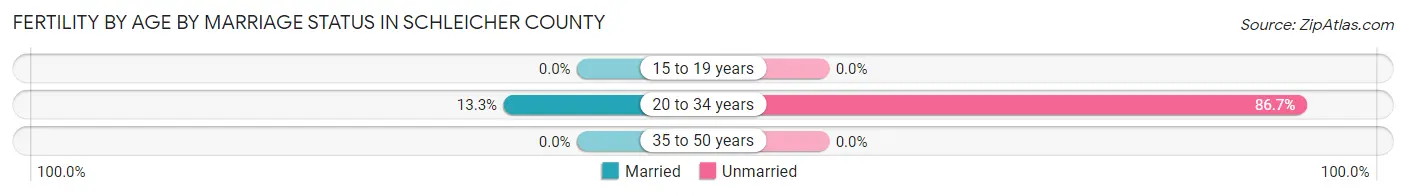
| Age Bracket | Married | Unmarried |
| 15 to 19 years | 0 (0.0%) | 0 (0.0%) |
| 20 to 34 years | 4 (13.3%) | 26 (86.7%) |
| 35 to 50 years | 0 (0.0%) | 0 (0.0%) |
| Total | 4 (13.3%) | 26 (86.7%) |
Fertility by Education in Schleicher County
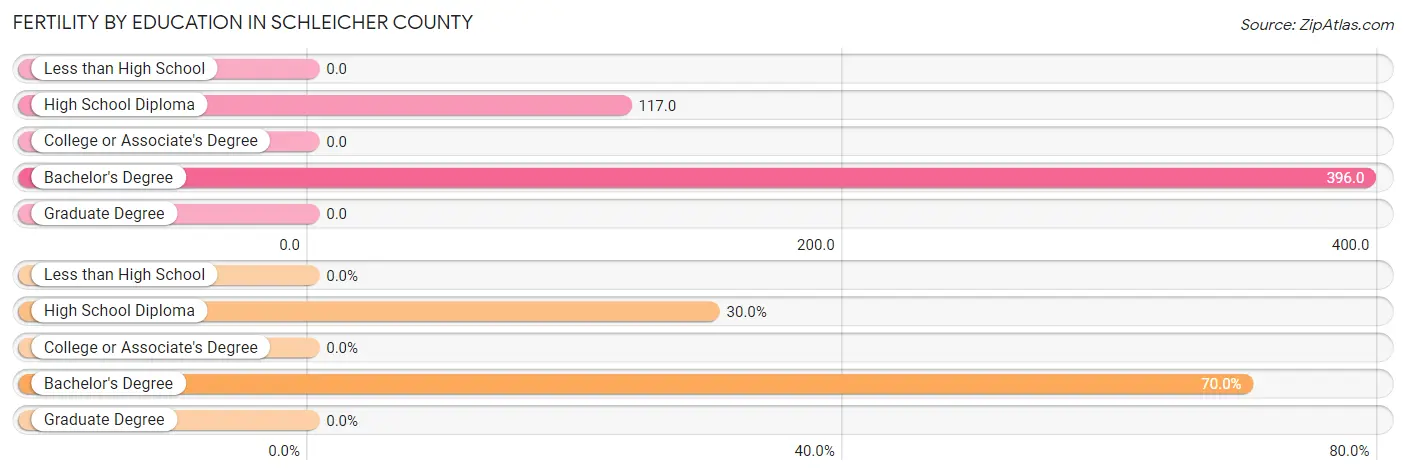
| Educational Attainment | Women with Births | Births / 1,000 Women |
| Less than High School | 0 (0.0%) | 0.0 |
| High School Diploma | 9 (30.0%) | 117.0 |
| College or Associate's Degree | 0 (0.0%) | 0.0 |
| Bachelor's Degree | 21 (70.0%) | 396.0 |
| Graduate Degree | 0 (0.0%) | 0.0 |
| Total | 30 (100.0%) | 57.0 |
Fertility by Education by Marriage Status in Schleicher County
86.7% of women with births in Schleicher County are unmarried. Women with the educational attainment of bachelor's degree are most likely to be married with 19.1% of them married at childbirth, while women with the educational attainment of high school diploma are least likely to be married with 100.0% of them unmarried at childbirth.
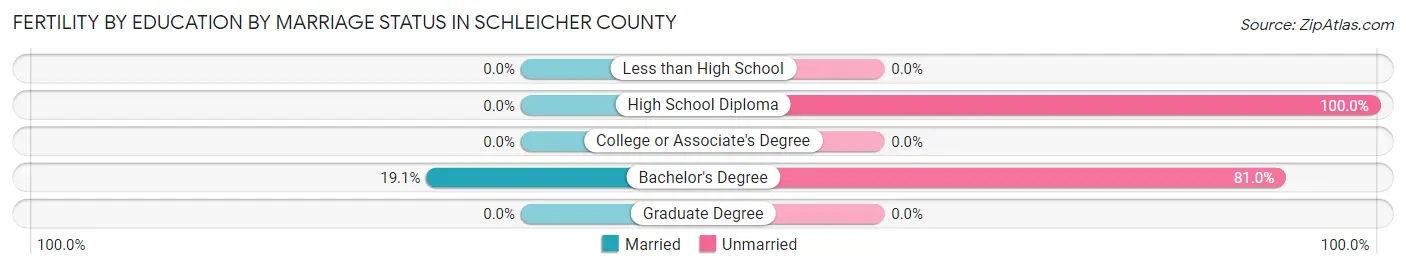
| Educational Attainment | Married | Unmarried |
| Less than High School | 0 (0.0%) | 0 (0.0%) |
| High School Diploma | 0 (0.0%) | 9 (100.0%) |
| College or Associate's Degree | 0 (0.0%) | 0 (0.0%) |
| Bachelor's Degree | 4 (19.1%) | 17 (80.9%) |
| Graduate Degree | 0 (0.0%) | 0 (0.0%) |
| Total | 4 (13.3%) | 26 (86.7%) |
Employment Characteristics in Schleicher County
Employment by Class of Employer in Schleicher County
Among the 1,058 employed individuals in Schleicher County, private company employees (641 | 60.6%), self-employed (not incorporated) (145 | 13.7%), and local government employees (99 | 9.4%) make up the most common classes of employment.
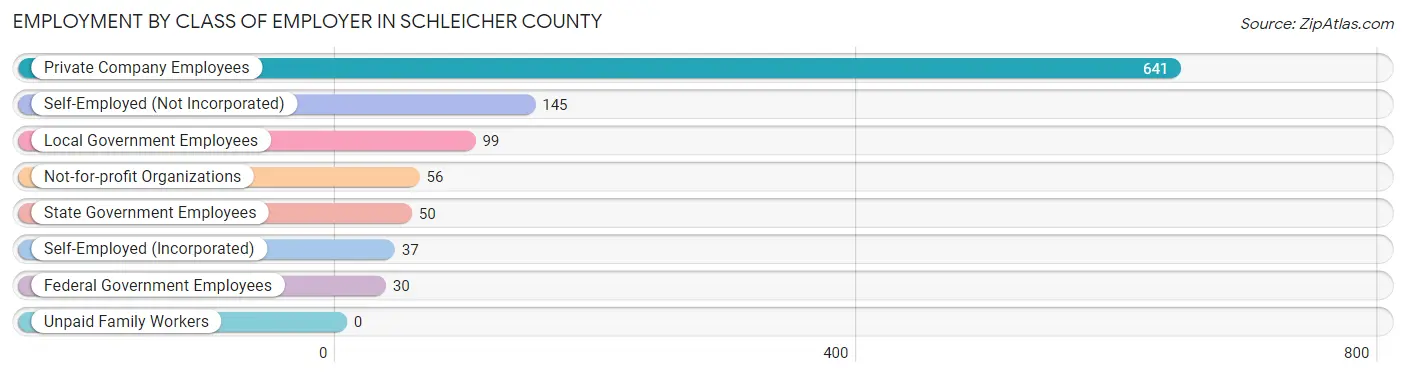
| Employer Class | # Employees | % Employees |
| Private Company Employees | 641 | 60.6% |
| Self-Employed (Incorporated) | 37 | 3.5% |
| Self-Employed (Not Incorporated) | 145 | 13.7% |
| Not-for-profit Organizations | 56 | 5.3% |
| Local Government Employees | 99 | 9.4% |
| State Government Employees | 50 | 4.7% |
| Federal Government Employees | 30 | 2.8% |
| Unpaid Family Workers | 0 | 0.0% |
| Total | 1,058 | 100.0% |
Employment Status by Age in Schleicher County
According to the labor force statistics for Schleicher County, out of the total population over 16 years of age (1,949), 58.4% or 1,138 individuals are in the labor force, with 6.9% or 79 of them unemployed. The age group with the highest labor force participation rate is 55 to 59 years, with 98.5% or 65 individuals in the labor force. Within the labor force, the 25 to 29 years age range has the highest percentage of unemployed individuals, with 50.5% or 51 of them being unemployed.
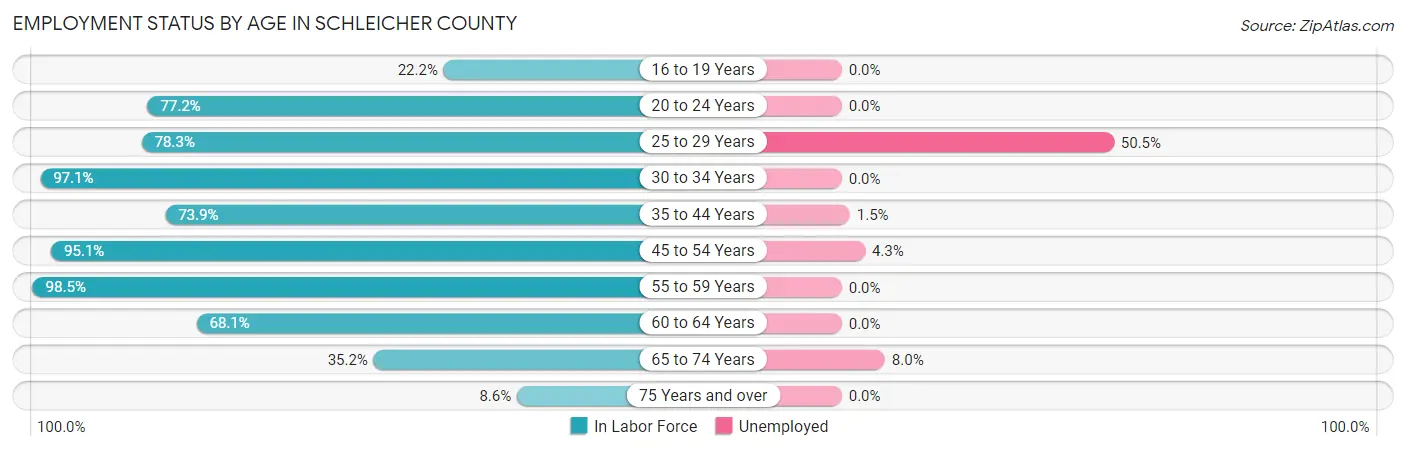
| Age Bracket | In Labor Force | Unemployed |
| 16 to 19 Years | 37 (22.2%) | 0 (0.0%) |
| 20 to 24 Years | 98 (77.2%) | 0 (0.0%) |
| 25 to 29 Years | 101 (78.3%) | 51 (50.5%) |
| 30 to 34 Years | 100 (97.1%) | 0 (0.0%) |
| 35 to 44 Years | 266 (73.9%) | 4 (1.5%) |
| 45 to 54 Years | 232 (95.1%) | 10 (4.3%) |
| 55 to 59 Years | 65 (98.5%) | 0 (0.0%) |
| 60 to 64 Years | 81 (68.1%) | 0 (0.0%) |
| 65 to 74 Years | 137 (35.2%) | 11 (8.0%) |
| 75 Years and over | 21 (8.6%) | 0 (0.0%) |
| Total | 1,138 (58.4%) | 79 (6.9%) |
Employment Status by Educational Attainment in Schleicher County
According to labor force statistics for Schleicher County, 82.8% of individuals (845) out of the total population between 25 and 64 years of age (1,021) are in the labor force, with 8.0% or 68 of them being unemployed. The group with the highest labor force participation rate are those with the educational attainment of bachelor's degree or higher, with 90.8% or 89 individuals in the labor force. Within the labor force, individuals with high school diploma education have the highest percentage of unemployment, with 14.2% or 40 of them being unemployed.
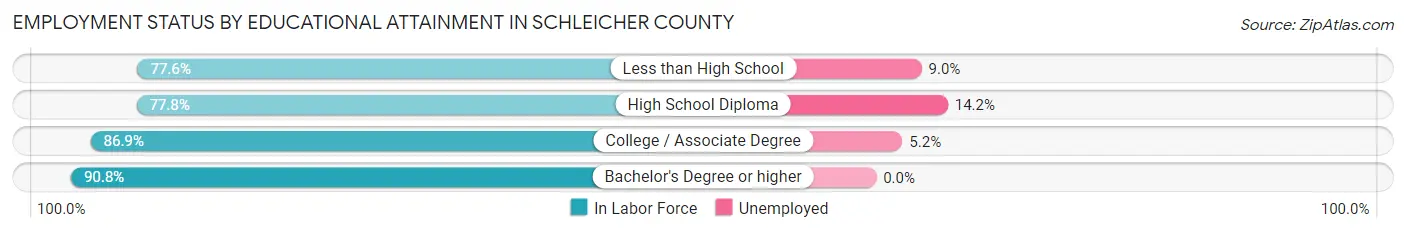
| Educational Attainment | In Labor Force | Unemployed |
| Less than High School | 111 (77.6%) | 13 (9.0%) |
| High School Diploma | 281 (77.8%) | 51 (14.2%) |
| College / Associate Degree | 364 (86.9%) | 22 (5.2%) |
| Bachelor's Degree or higher | 89 (90.8%) | 0 (0.0%) |
| Total | 845 (82.8%) | 82 (8.0%) |
Employment Occupations by Sex in Schleicher County
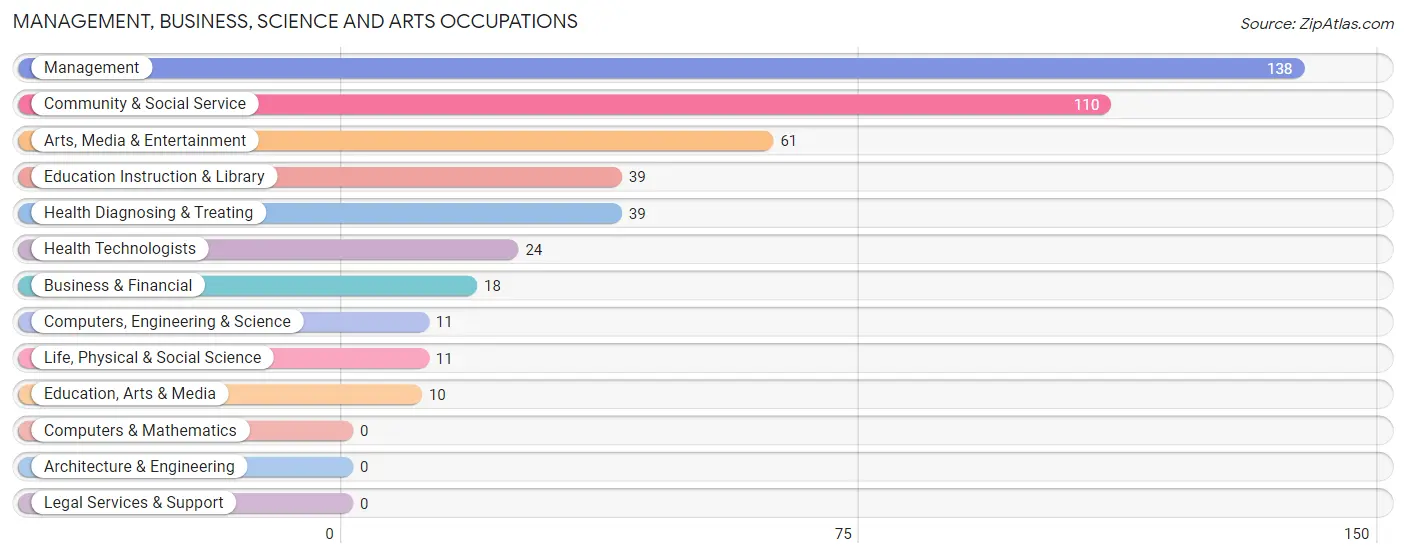
Management, Business, Science and Arts Occupations
The most common Management, Business, Science and Arts occupations in Schleicher County are Management (138 | 13.4%), Community & Social Service (110 | 10.7%), Arts, Media & Entertainment (61 | 5.9%), Education Instruction & Library (39 | 3.8%), and Health Diagnosing & Treating (39 | 3.8%).
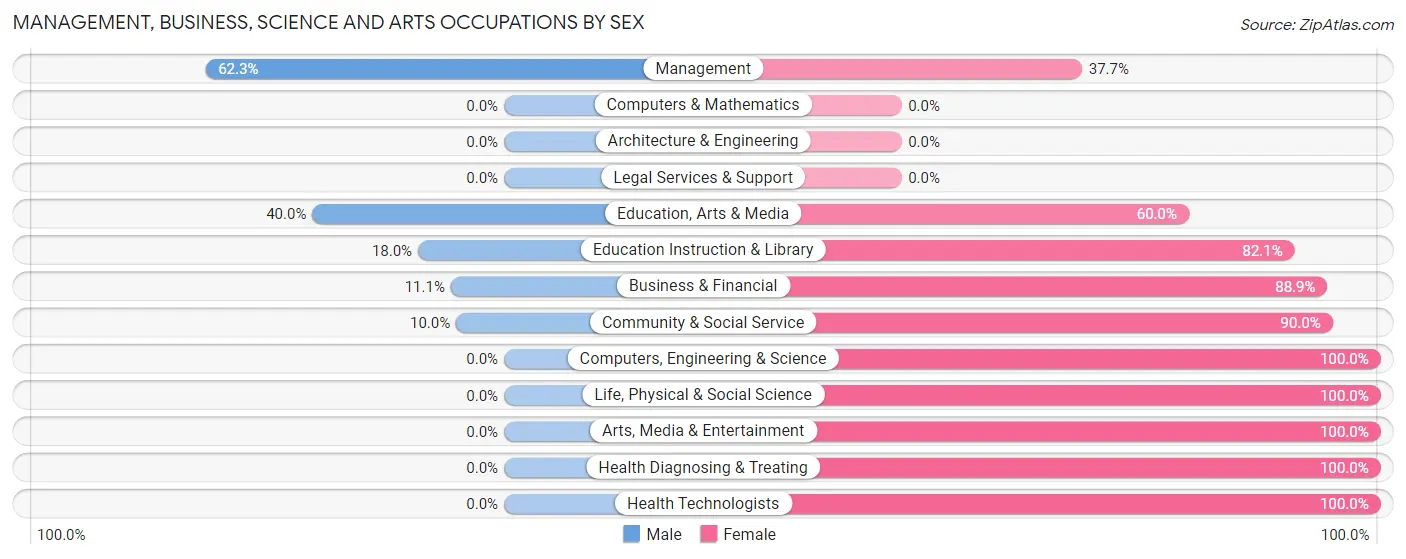
Management, Business, Science and Arts Occupations by Sex
Within the Management, Business, Science and Arts occupations in Schleicher County, the most male-oriented occupations are Management (62.3%), Education, Arts & Media (40.0%), and Education Instruction & Library (17.9%), while the most female-oriented occupations are Computers, Engineering & Science (100.0%), Life, Physical & Social Science (100.0%), and Arts, Media & Entertainment (100.0%).
| Occupation | Male | Female |
| Management | 86 (62.3%) | 52 (37.7%) |
| Business & Financial | 2 (11.1%) | 16 (88.9%) |
| Computers, Engineering & Science | 0 (0.0%) | 11 (100.0%) |
| Computers & Mathematics | 0 (0.0%) | 0 (0.0%) |
| Architecture & Engineering | 0 (0.0%) | 0 (0.0%) |
| Life, Physical & Social Science | 0 (0.0%) | 11 (100.0%) |
| Community & Social Service | 11 (10.0%) | 99 (90.0%) |
| Education, Arts & Media | 4 (40.0%) | 6 (60.0%) |
| Legal Services & Support | 0 (0.0%) | 0 (0.0%) |
| Education Instruction & Library | 7 (17.9%) | 32 (82.1%) |
| Arts, Media & Entertainment | 0 (0.0%) | 61 (100.0%) |
| Health Diagnosing & Treating | 0 (0.0%) | 39 (100.0%) |
| Health Technologists | 0 (0.0%) | 24 (100.0%) |
| Total (Category) | 99 (31.3%) | 217 (68.7%) |
| Total (Overall) | 584 (56.6%) | 448 (43.4%) |
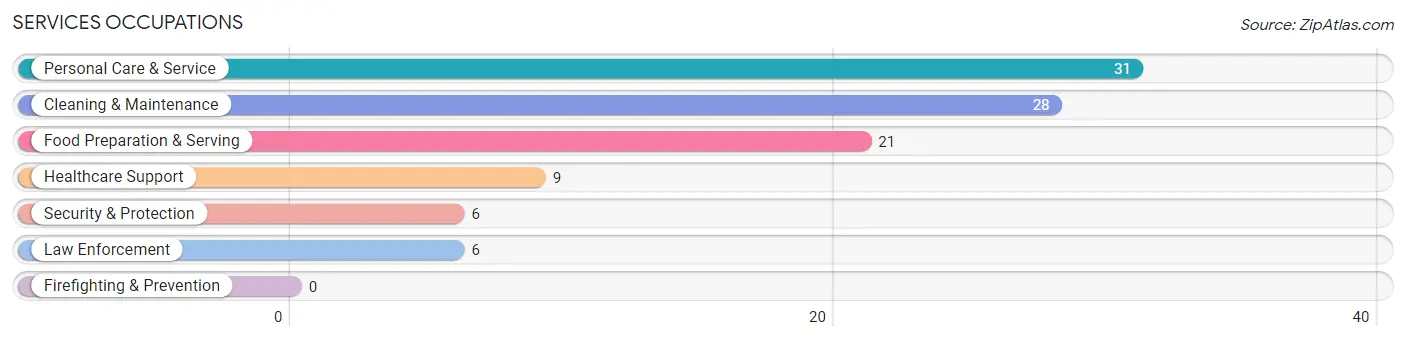
Services Occupations
The most common Services occupations in Schleicher County are Personal Care & Service (31 | 3.0%), Cleaning & Maintenance (28 | 2.7%), Food Preparation & Serving (21 | 2.0%), Healthcare Support (9 | 0.9%), and Security & Protection (6 | 0.6%).
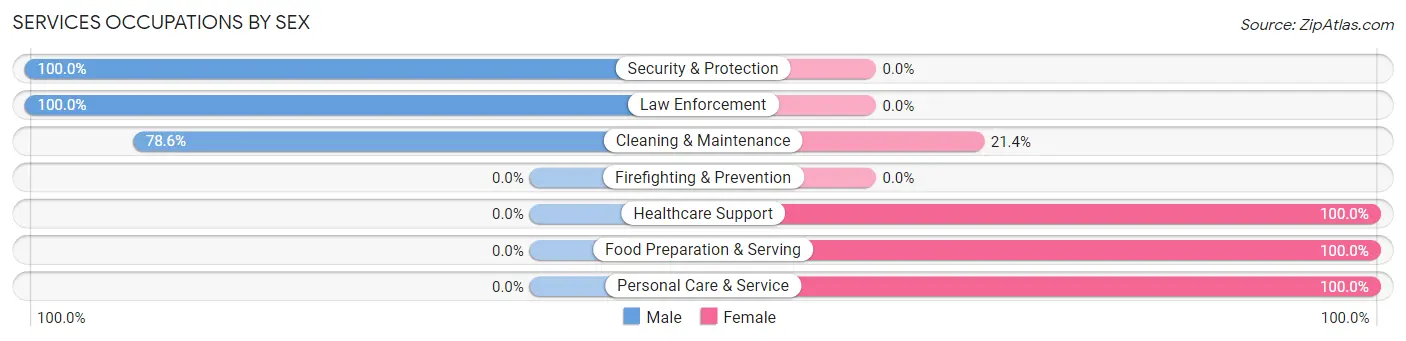
Services Occupations by Sex
Within the Services occupations in Schleicher County, the most male-oriented occupations are Security & Protection (100.0%), Law Enforcement (100.0%), and Cleaning & Maintenance (78.6%), while the most female-oriented occupations are Healthcare Support (100.0%), Food Preparation & Serving (100.0%), and Personal Care & Service (100.0%).
| Occupation | Male | Female |
| Healthcare Support | 0 (0.0%) | 9 (100.0%) |
| Security & Protection | 6 (100.0%) | 0 (0.0%) |
| Firefighting & Prevention | 0 (0.0%) | 0 (0.0%) |
| Law Enforcement | 6 (100.0%) | 0 (0.0%) |
| Food Preparation & Serving | 0 (0.0%) | 21 (100.0%) |
| Cleaning & Maintenance | 22 (78.6%) | 6 (21.4%) |
| Personal Care & Service | 0 (0.0%) | 31 (100.0%) |
| Total (Category) | 28 (29.5%) | 67 (70.5%) |
| Total (Overall) | 584 (56.6%) | 448 (43.4%) |
Sales and Office Occupations
The most common Sales and Office occupations in Schleicher County are Sales & Related (125 | 12.1%), and Office & Administration (95 | 9.2%).
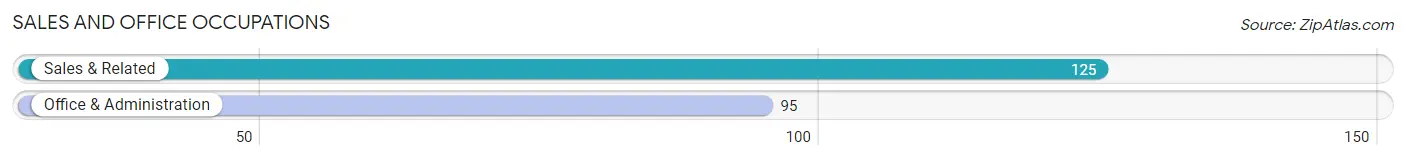
Sales and Office Occupations by Sex
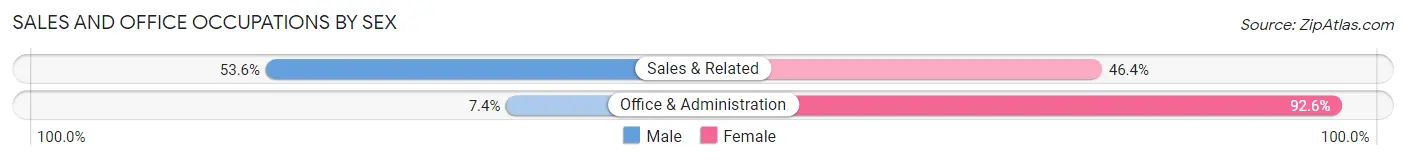
| Occupation | Male | Female |
| Sales & Related | 67 (53.6%) | 58 (46.4%) |
| Office & Administration | 7 (7.4%) | 88 (92.6%) |
| Total (Category) | 74 (33.6%) | 146 (66.4%) |
| Total (Overall) | 584 (56.6%) | 448 (43.4%) |
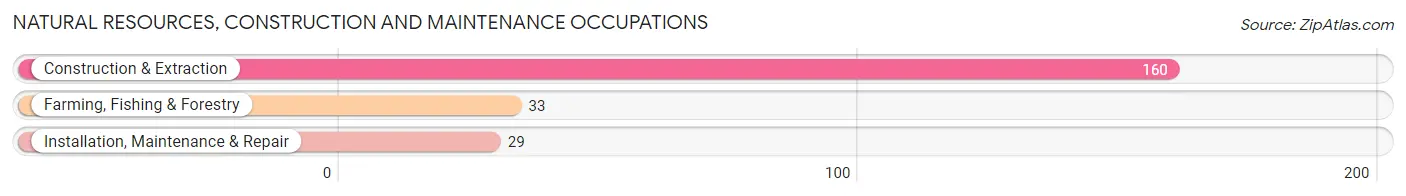
Natural Resources, Construction and Maintenance Occupations
The most common Natural Resources, Construction and Maintenance occupations in Schleicher County are Construction & Extraction (160 | 15.5%), Farming, Fishing & Forestry (33 | 3.2%), and Installation, Maintenance & Repair (29 | 2.8%).
Natural Resources, Construction and Maintenance Occupations by Sex
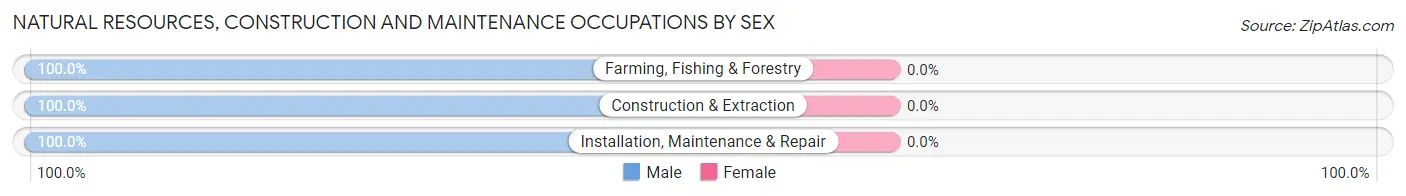
| Occupation | Male | Female |
| Farming, Fishing & Forestry | 33 (100.0%) | 0 (0.0%) |
| Construction & Extraction | 160 (100.0%) | 0 (0.0%) |
| Installation, Maintenance & Repair | 29 (100.0%) | 0 (0.0%) |
| Total (Category) | 222 (100.0%) | 0 (0.0%) |
| Total (Overall) | 584 (56.6%) | 448 (43.4%) |
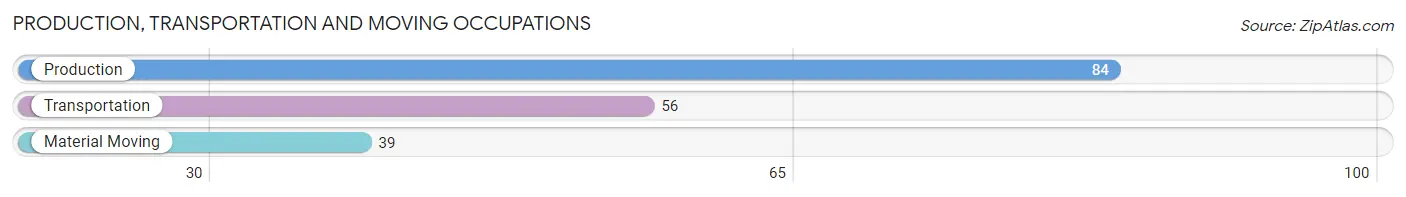
Production, Transportation and Moving Occupations
The most common Production, Transportation and Moving occupations in Schleicher County are Production (84 | 8.1%), Transportation (56 | 5.4%), and Material Moving (39 | 3.8%).
Production, Transportation and Moving Occupations by Sex
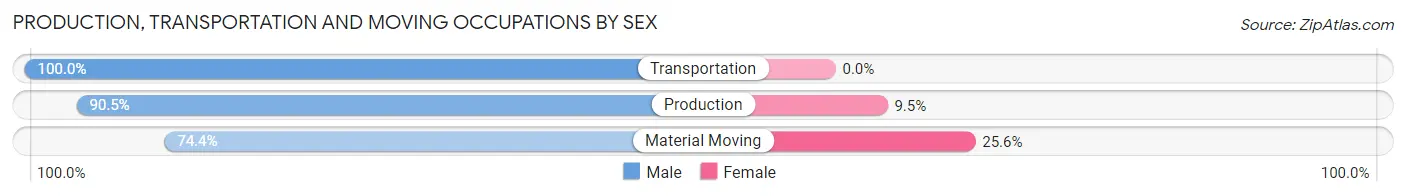
| Occupation | Male | Female |
| Production | 76 (90.5%) | 8 (9.5%) |
| Transportation | 56 (100.0%) | 0 (0.0%) |
| Material Moving | 29 (74.4%) | 10 (25.6%) |
| Total (Category) | 161 (89.9%) | 18 (10.1%) |
| Total (Overall) | 584 (56.6%) | 448 (43.4%) |
Employment Industries by Sex in Schleicher County
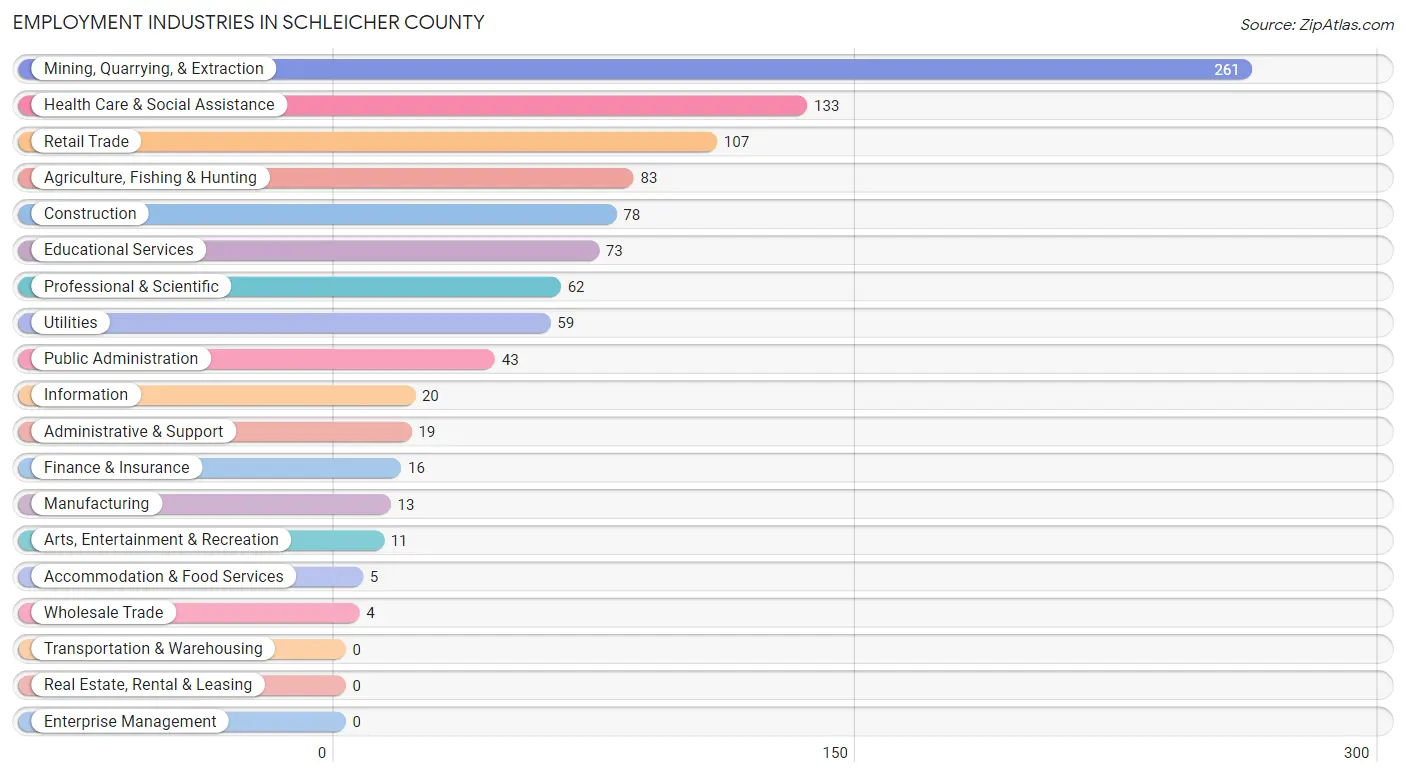
Employment Industries in Schleicher County
The major employment industries in Schleicher County include Mining, Quarrying, & Extraction (261 | 25.3%), Health Care & Social Assistance (133 | 12.9%), Retail Trade (107 | 10.4%), Agriculture, Fishing & Hunting (83 | 8.0%), and Construction (78 | 7.6%).
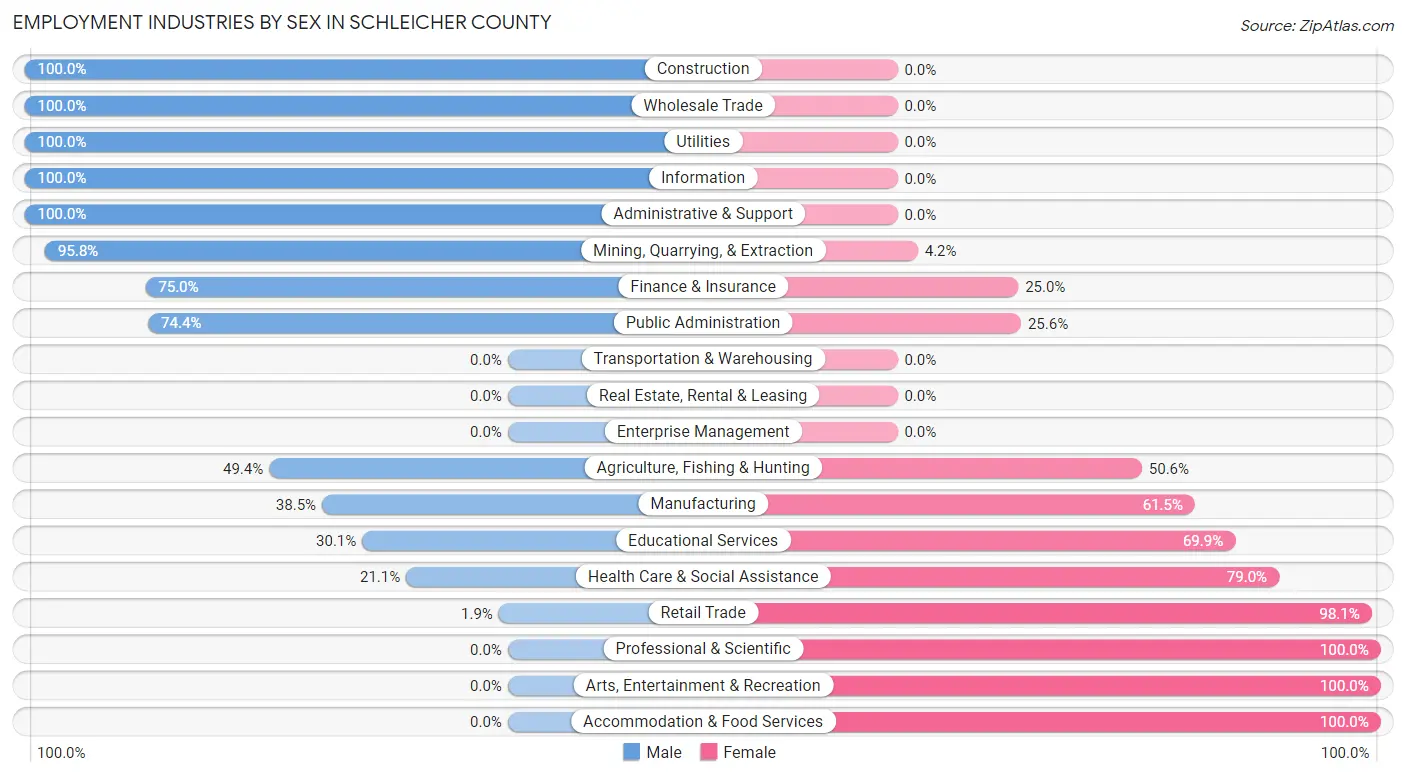
Employment Industries by Sex in Schleicher County
The Schleicher County industries that see more men than women are Construction (100.0%), Wholesale Trade (100.0%), and Utilities (100.0%), whereas the industries that tend to have a higher number of women are Professional & Scientific (100.0%), Arts, Entertainment & Recreation (100.0%), and Accommodation & Food Services (100.0%).
| Industry | Male | Female |
| Agriculture, Fishing & Hunting | 41 (49.4%) | 42 (50.6%) |
| Mining, Quarrying, & Extraction | 250 (95.8%) | 11 (4.2%) |
| Construction | 78 (100.0%) | 0 (0.0%) |
| Manufacturing | 5 (38.5%) | 8 (61.5%) |
| Wholesale Trade | 4 (100.0%) | 0 (0.0%) |
| Retail Trade | 2 (1.9%) | 105 (98.1%) |
| Transportation & Warehousing | 0 (0.0%) | 0 (0.0%) |
| Utilities | 59 (100.0%) | 0 (0.0%) |
| Information | 20 (100.0%) | 0 (0.0%) |
| Finance & Insurance | 12 (75.0%) | 4 (25.0%) |
| Real Estate, Rental & Leasing | 0 (0.0%) | 0 (0.0%) |
| Professional & Scientific | 0 (0.0%) | 62 (100.0%) |
| Enterprise Management | 0 (0.0%) | 0 (0.0%) |
| Administrative & Support | 19 (100.0%) | 0 (0.0%) |
| Educational Services | 22 (30.1%) | 51 (69.9%) |
| Health Care & Social Assistance | 28 (21.0%) | 105 (78.9%) |
| Arts, Entertainment & Recreation | 0 (0.0%) | 11 (100.0%) |
| Accommodation & Food Services | 0 (0.0%) | 5 (100.0%) |
| Public Administration | 32 (74.4%) | 11 (25.6%) |
| Total | 584 (56.6%) | 448 (43.4%) |
Education in Schleicher County
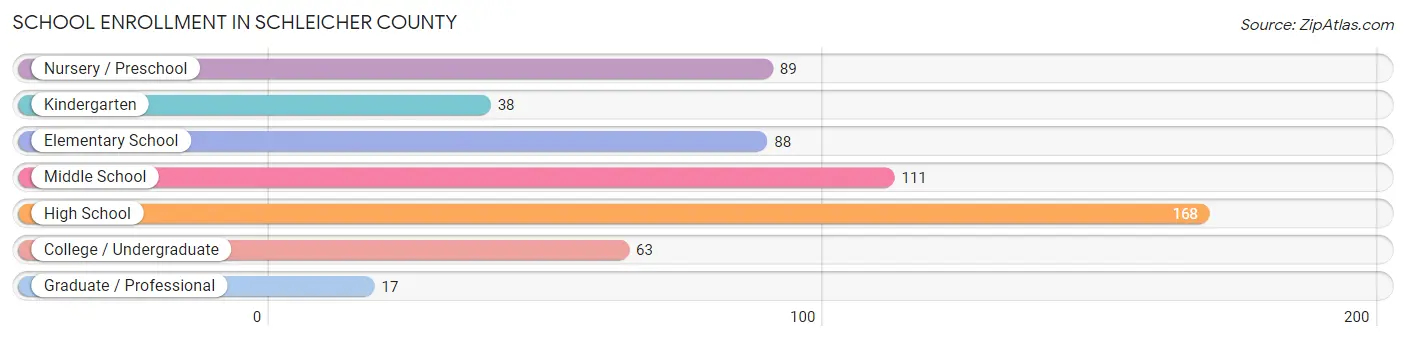
School Enrollment in Schleicher County
The most common levels of schooling among the 574 students in Schleicher County are high school (168 | 29.3%), middle school (111 | 19.3%), and nursery / preschool (89 | 15.5%).
| School Level | # Students | % Students |
| Nursery / Preschool | 89 | 15.5% |
| Kindergarten | 38 | 6.6% |
| Elementary School | 88 | 15.3% |
| Middle School | 111 | 19.3% |
| High School | 168 | 29.3% |
| College / Undergraduate | 63 | 11.0% |
| Graduate / Professional | 17 | 3.0% |
| Total | 574 | 100.0% |
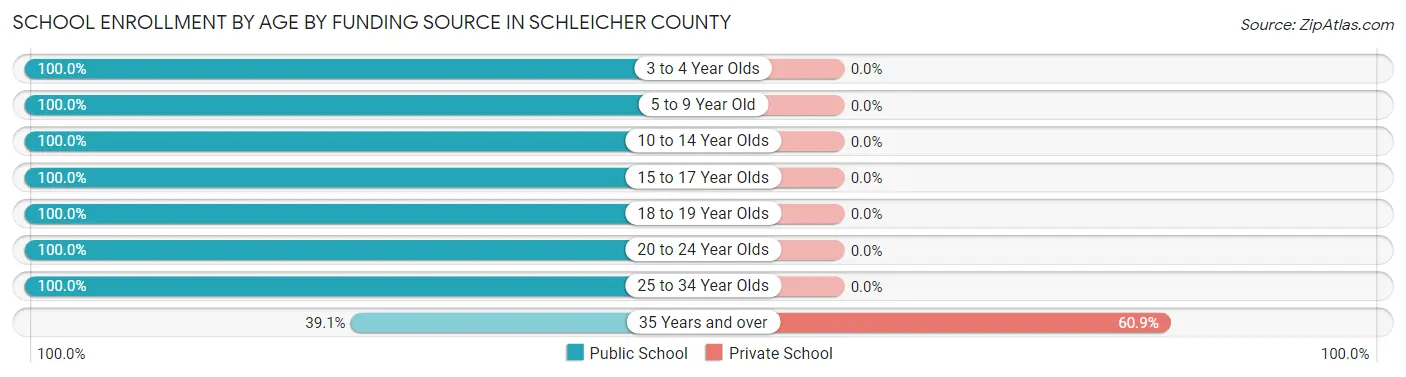
School Enrollment by Age by Funding Source in Schleicher County
Out of a total of 574 students who are enrolled in schools in Schleicher County, 14 (2.4%) attend a private institution, while the remaining 560 (97.6%) are enrolled in public schools. The age group of 35 years and over has the highest likelihood of being enrolled in private schools, with 14 (60.9% in the age bracket) enrolled. Conversely, the age group of 3 to 4 year olds has the lowest likelihood of being enrolled in a private school, with 53 (100.0% in the age bracket) attending a public institution.
| Age Bracket | Public School | Private School |
| 3 to 4 Year Olds | 53 (100.0%) | 0 (0.0%) |
| 5 to 9 Year Old | 155 (100.0%) | 0 (0.0%) |
| 10 to 14 Year Olds | 122 (100.0%) | 0 (0.0%) |
| 15 to 17 Year Olds | 107 (100.0%) | 0 (0.0%) |
| 18 to 19 Year Olds | 74 (100.0%) | 0 (0.0%) |
| 20 to 24 Year Olds | 37 (100.0%) | 0 (0.0%) |
| 25 to 34 Year Olds | 3 (100.0%) | 0 (0.0%) |
| 35 Years and over | 9 (39.1%) | 14 (60.9%) |
| Total | 560 (97.6%) | 14 (2.4%) |
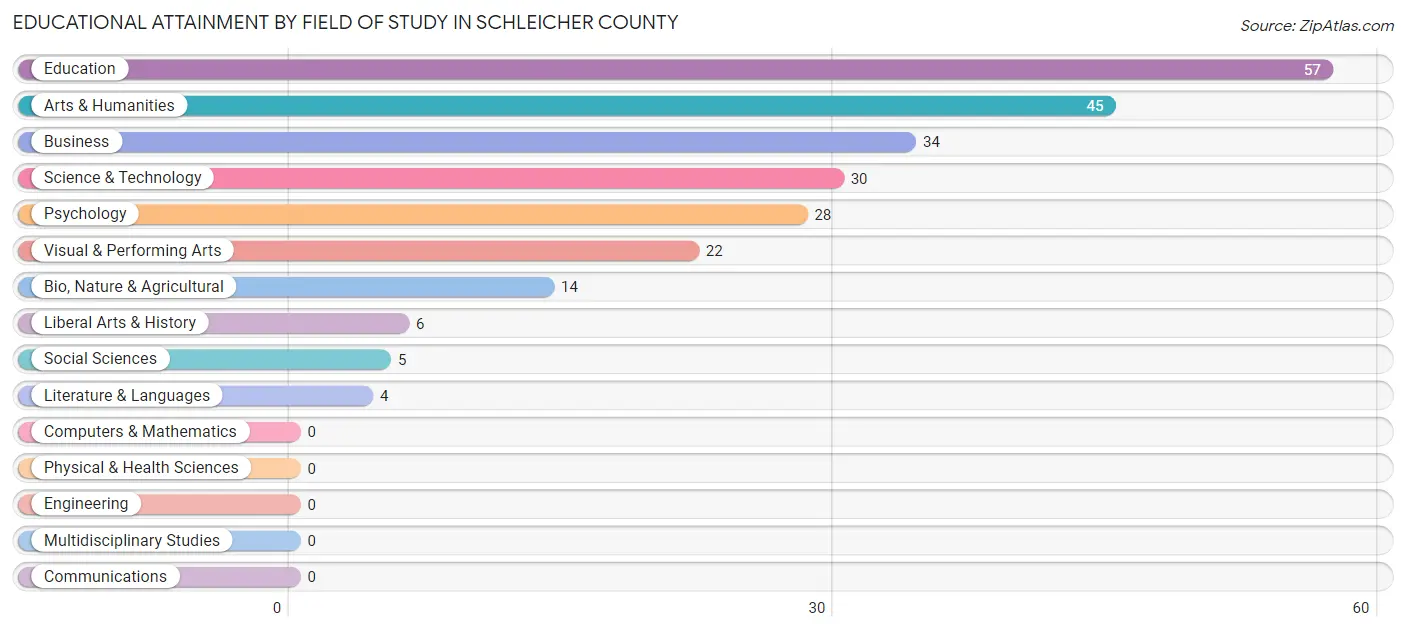
Educational Attainment by Field of Study in Schleicher County
Education (57 | 23.3%), arts & humanities (45 | 18.4%), business (34 | 13.9%), science & technology (30 | 12.2%), and psychology (28 | 11.4%) are the most common fields of study among 245 individuals in Schleicher County who have obtained a bachelor's degree or higher.
| Field of Study | # Graduates | % Graduates |
| Computers & Mathematics | 0 | 0.0% |
| Bio, Nature & Agricultural | 14 | 5.7% |
| Physical & Health Sciences | 0 | 0.0% |
| Psychology | 28 | 11.4% |
| Social Sciences | 5 | 2.0% |
| Engineering | 0 | 0.0% |
| Multidisciplinary Studies | 0 | 0.0% |
| Science & Technology | 30 | 12.2% |
| Business | 34 | 13.9% |
| Education | 57 | 23.3% |
| Literature & Languages | 4 | 1.6% |
| Liberal Arts & History | 6 | 2.5% |
| Visual & Performing Arts | 22 | 9.0% |
| Communications | 0 | 0.0% |
| Arts & Humanities | 45 | 18.4% |
| Total | 245 | 100.0% |
Transportation & Commute in Schleicher County
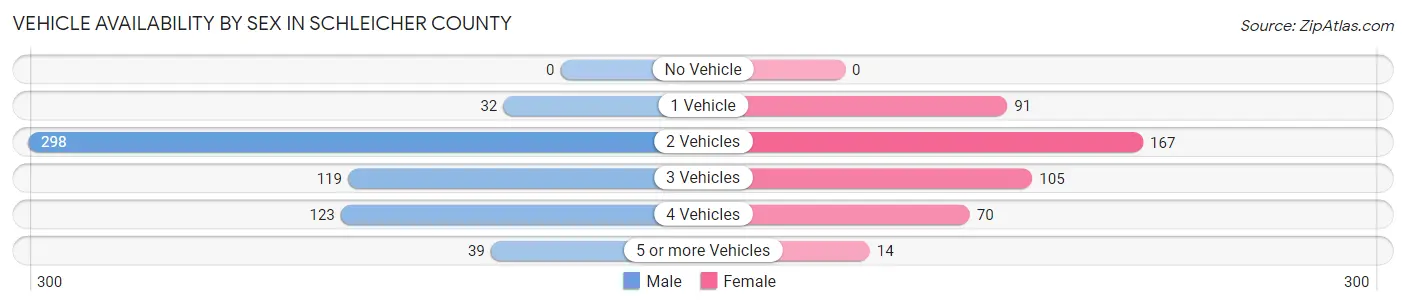
Vehicle Availability by Sex in Schleicher County
The most prevalent vehicle ownership categories in Schleicher County are males with 2 vehicles (298, accounting for 48.8%) and females with 2 vehicles (167, making up 66.7%).
| Vehicles Available | Male | Female |
| No Vehicle | 0 (0.0%) | 0 (0.0%) |
| 1 Vehicle | 32 (5.2%) | 91 (20.4%) |
| 2 Vehicles | 298 (48.8%) | 167 (37.4%) |
| 3 Vehicles | 119 (19.5%) | 105 (23.5%) |
| 4 Vehicles | 123 (20.1%) | 70 (15.7%) |
| 5 or more Vehicles | 39 (6.4%) | 14 (3.1%) |
| Total | 611 (100.0%) | 447 (100.0%) |
Commute Time in Schleicher County
The most frequently occuring commute durations in Schleicher County are 5 to 9 minutes (267 commuters, 27.9%), less than 5 minutes (149 commuters, 15.6%), and 20 to 24 minutes (90 commuters, 9.4%).
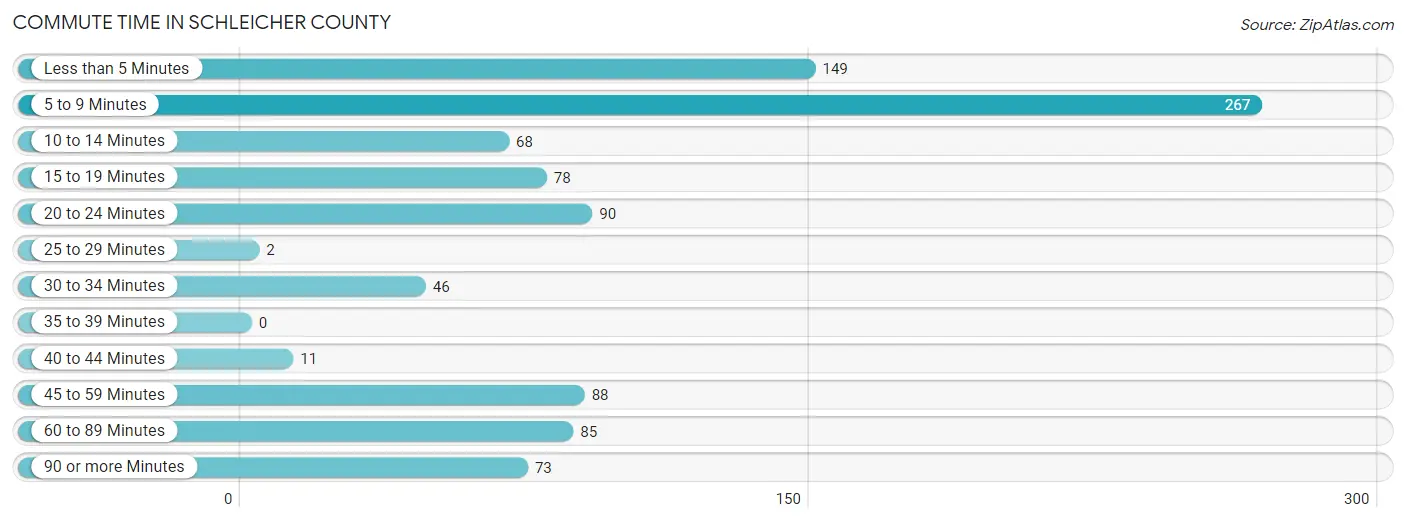
| Commute Time | # Commuters | % Commuters |
| Less than 5 Minutes | 149 | 15.6% |
| 5 to 9 Minutes | 267 | 27.9% |
| 10 to 14 Minutes | 68 | 7.1% |
| 15 to 19 Minutes | 78 | 8.2% |
| 20 to 24 Minutes | 90 | 9.4% |
| 25 to 29 Minutes | 2 | 0.2% |
| 30 to 34 Minutes | 46 | 4.8% |
| 35 to 39 Minutes | 0 | 0.0% |
| 40 to 44 Minutes | 11 | 1.1% |
| 45 to 59 Minutes | 88 | 9.2% |
| 60 to 89 Minutes | 85 | 8.9% |
| 90 or more Minutes | 73 | 7.6% |
Commute Time by Sex in Schleicher County
The most common commute times in Schleicher County are 5 to 9 minutes (127 commuters, 22.1%) for males and 5 to 9 minutes (140 commuters, 36.7%) for females.
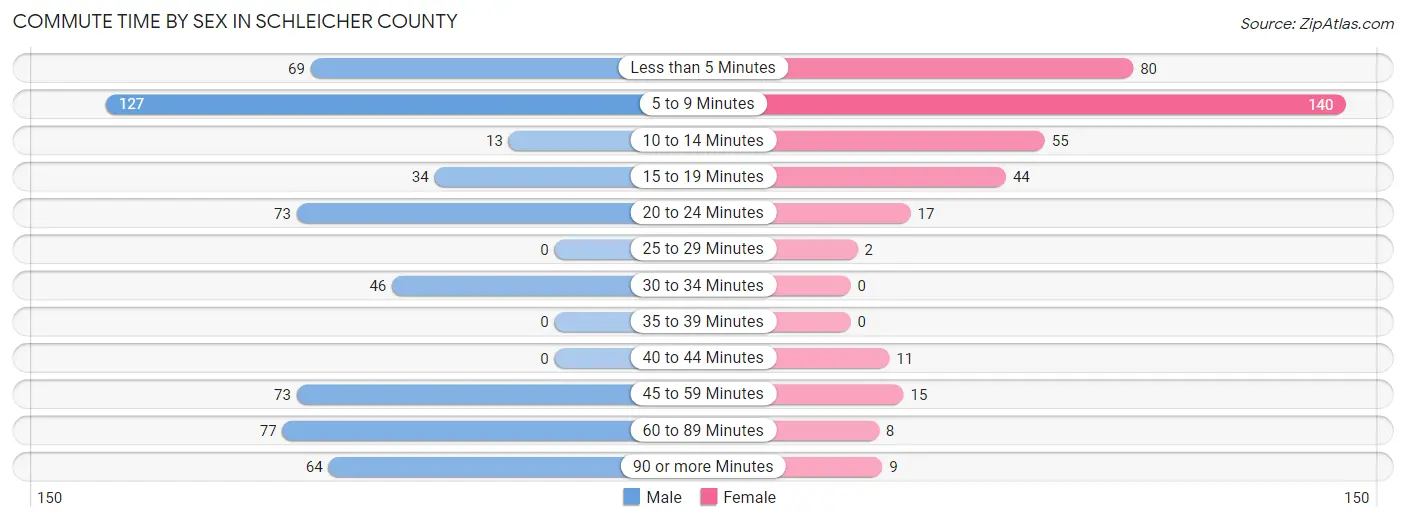
| Commute Time | Male | Female |
| Less than 5 Minutes | 69 (12.0%) | 80 (21.0%) |
| 5 to 9 Minutes | 127 (22.1%) | 140 (36.7%) |
| 10 to 14 Minutes | 13 (2.3%) | 55 (14.4%) |
| 15 to 19 Minutes | 34 (5.9%) | 44 (11.6%) |
| 20 to 24 Minutes | 73 (12.7%) | 17 (4.5%) |
| 25 to 29 Minutes | 0 (0.0%) | 2 (0.5%) |
| 30 to 34 Minutes | 46 (8.0%) | 0 (0.0%) |
| 35 to 39 Minutes | 0 (0.0%) | 0 (0.0%) |
| 40 to 44 Minutes | 0 (0.0%) | 11 (2.9%) |
| 45 to 59 Minutes | 73 (12.7%) | 15 (3.9%) |
| 60 to 89 Minutes | 77 (13.4%) | 8 (2.1%) |
| 90 or more Minutes | 64 (11.1%) | 9 (2.4%) |
Time of Departure to Work by Sex in Schleicher County
The most frequent times of departure to work in Schleicher County are 7:00 AM to 7:29 AM (101, 17.5%) for males and 8:00 AM to 8:29 AM (127, 33.3%) for females.
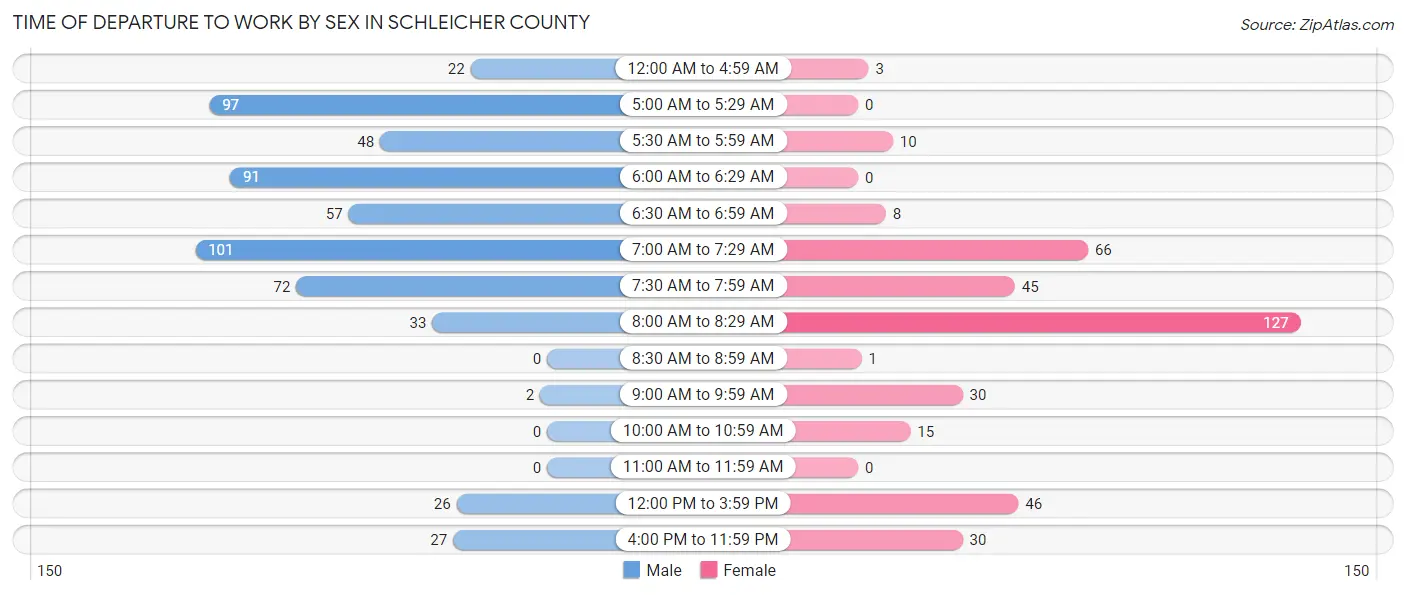
| Time of Departure | Male | Female |
| 12:00 AM to 4:59 AM | 22 (3.8%) | 3 (0.8%) |
| 5:00 AM to 5:29 AM | 97 (16.8%) | 0 (0.0%) |
| 5:30 AM to 5:59 AM | 48 (8.3%) | 10 (2.6%) |
| 6:00 AM to 6:29 AM | 91 (15.8%) | 0 (0.0%) |
| 6:30 AM to 6:59 AM | 57 (9.9%) | 8 (2.1%) |
| 7:00 AM to 7:29 AM | 101 (17.5%) | 66 (17.3%) |
| 7:30 AM to 7:59 AM | 72 (12.5%) | 45 (11.8%) |
| 8:00 AM to 8:29 AM | 33 (5.7%) | 127 (33.3%) |
| 8:30 AM to 8:59 AM | 0 (0.0%) | 1 (0.3%) |
| 9:00 AM to 9:59 AM | 2 (0.4%) | 30 (7.9%) |
| 10:00 AM to 10:59 AM | 0 (0.0%) | 15 (3.9%) |
| 11:00 AM to 11:59 AM | 0 (0.0%) | 0 (0.0%) |
| 12:00 PM to 3:59 PM | 26 (4.5%) | 46 (12.1%) |
| 4:00 PM to 11:59 PM | 27 (4.7%) | 30 (7.9%) |
| Total | 576 (100.0%) | 381 (100.0%) |
Housing Occupancy in Schleicher County
Occupancy by Ownership in Schleicher County
Of the total 899 dwellings in Schleicher County, owner-occupied units account for 757 (84.2%), while renter-occupied units make up 142 (15.8%).
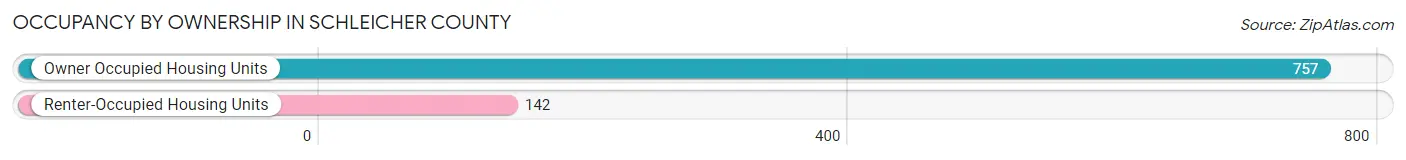
| Occupancy | # Housing Units | % Housing Units |
| Owner Occupied Housing Units | 757 | 84.2% |
| Renter-Occupied Housing Units | 142 | 15.8% |
| Total Occupied Housing Units | 899 | 100.0% |
Occupancy by Household Size in Schleicher County
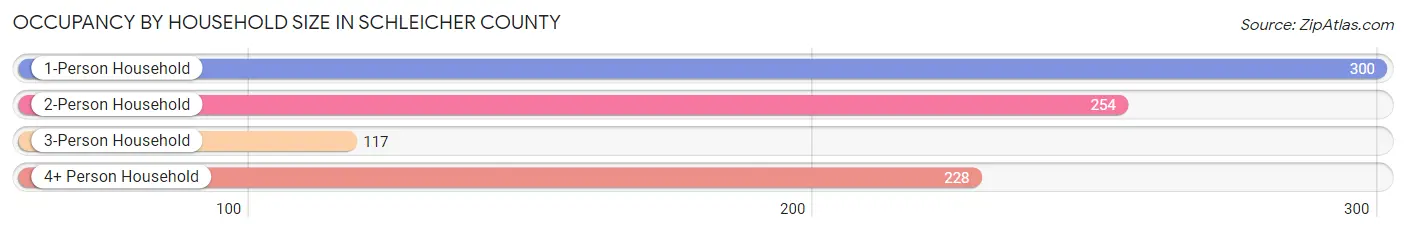
| Household Size | # Housing Units | % Housing Units |
| 1-Person Household | 300 | 33.4% |
| 2-Person Household | 254 | 28.2% |
| 3-Person Household | 117 | 13.0% |
| 4+ Person Household | 228 | 25.4% |
| Total Housing Units | 899 | 100.0% |
Occupancy by Ownership by Household Size in Schleicher County
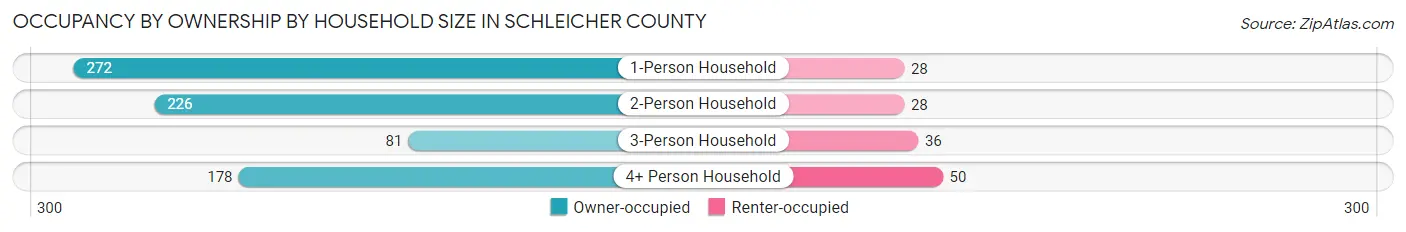
| Household Size | Owner-occupied | Renter-occupied |
| 1-Person Household | 272 (90.7%) | 28 (9.3%) |
| 2-Person Household | 226 (89.0%) | 28 (11.0%) |
| 3-Person Household | 81 (69.2%) | 36 (30.8%) |
| 4+ Person Household | 178 (78.1%) | 50 (21.9%) |
| Total Housing Units | 757 (84.2%) | 142 (15.8%) |
Occupancy by Educational Attainment in Schleicher County
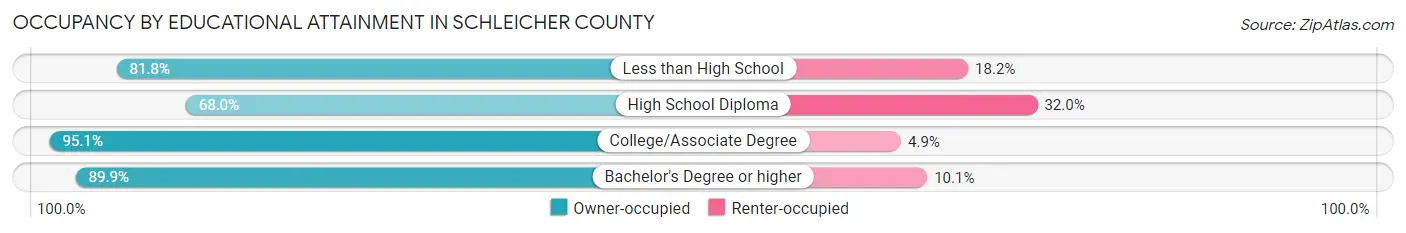
| Household Size | Owner-occupied | Renter-occupied |
| Less than High School | 139 (81.8%) | 31 (18.2%) |
| High School Diploma | 168 (68.0%) | 79 (32.0%) |
| College/Associate Degree | 308 (95.1%) | 16 (4.9%) |
| Bachelor's Degree or higher | 142 (89.9%) | 16 (10.1%) |
Occupancy by Age of Householder in Schleicher County
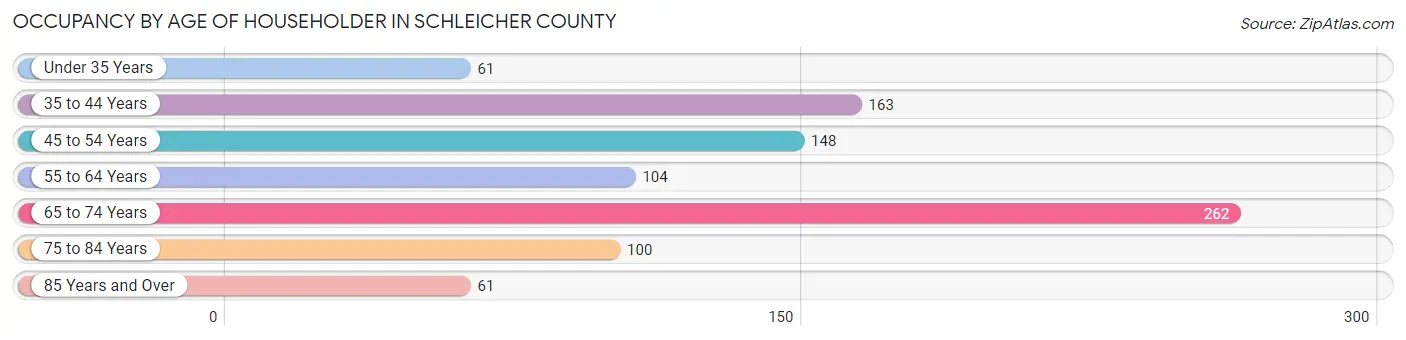
| Age Bracket | # Households | % Households |
| Under 35 Years | 61 | 6.8% |
| 35 to 44 Years | 163 | 18.1% |
| 45 to 54 Years | 148 | 16.5% |
| 55 to 64 Years | 104 | 11.6% |
| 65 to 74 Years | 262 | 29.1% |
| 75 to 84 Years | 100 | 11.1% |
| 85 Years and Over | 61 | 6.8% |
| Total | 899 | 100.0% |
Housing Finances in Schleicher County
Median Income by Occupancy in Schleicher County
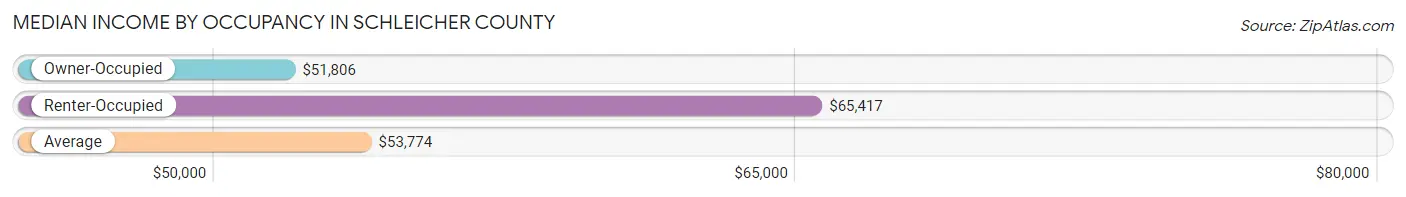
| Occupancy Type | # Households | Median Income |
| Owner-Occupied | 757 (84.2%) | $51,806 |
| Renter-Occupied | 142 (15.8%) | $65,417 |
| Average | 899 (100.0%) | $53,774 |
Occupancy by Householder Income Bracket in Schleicher County
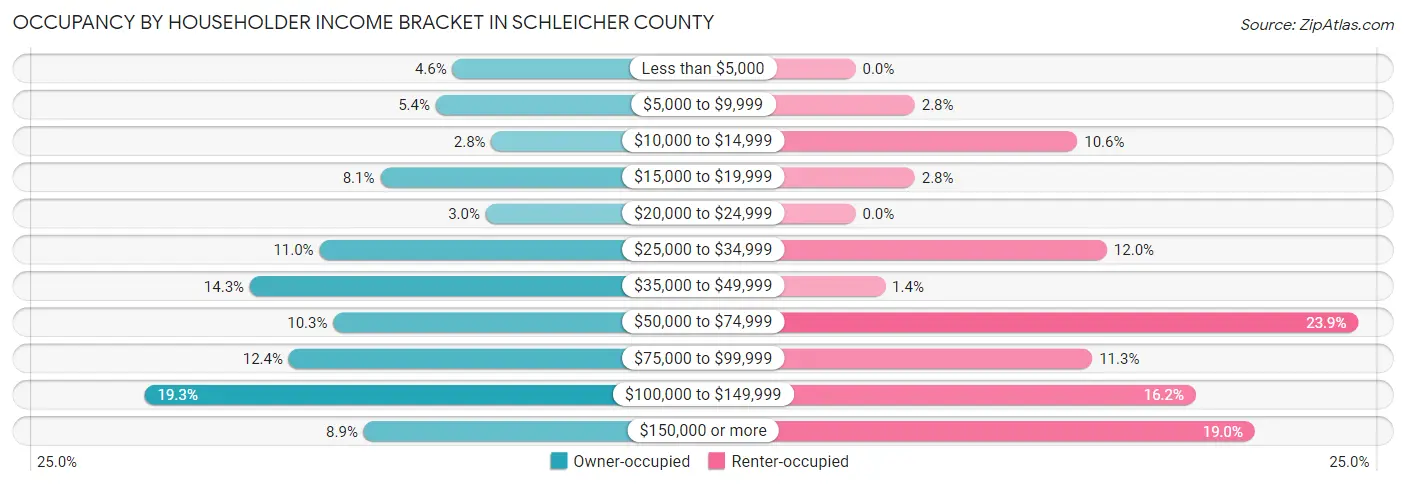
| Income Bracket | Owner-occupied | Renter-occupied |
| Less than $5,000 | 35 (4.6%) | 0 (0.0%) |
| $5,000 to $9,999 | 41 (5.4%) | 4 (2.8%) |
| $10,000 to $14,999 | 21 (2.8%) | 15 (10.6%) |
| $15,000 to $19,999 | 61 (8.1%) | 4 (2.8%) |
| $20,000 to $24,999 | 23 (3.0%) | 0 (0.0%) |
| $25,000 to $34,999 | 83 (11.0%) | 17 (12.0%) |
| $35,000 to $49,999 | 108 (14.3%) | 2 (1.4%) |
| $50,000 to $74,999 | 78 (10.3%) | 34 (23.9%) |
| $75,000 to $99,999 | 94 (12.4%) | 16 (11.3%) |
| $100,000 to $149,999 | 146 (19.3%) | 23 (16.2%) |
| $150,000 or more | 67 (8.8%) | 27 (19.0%) |
| Total | 757 (100.0%) | 142 (100.0%) |
Monthly Housing Cost Tiers in Schleicher County
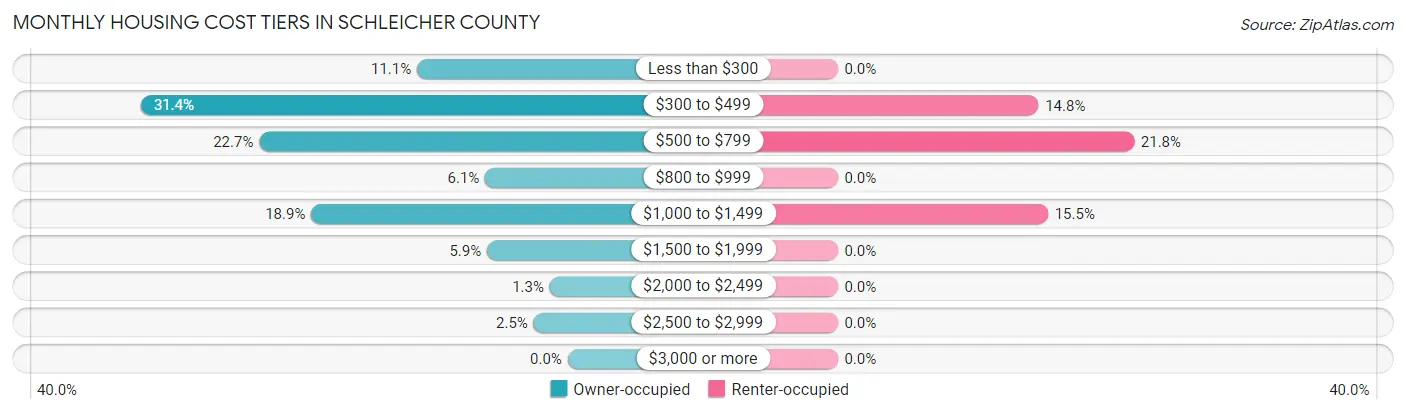
| Monthly Cost | Owner-occupied | Renter-occupied |
| Less than $300 | 84 (11.1%) | 0 (0.0%) |
| $300 to $499 | 238 (31.4%) | 21 (14.8%) |
| $500 to $799 | 172 (22.7%) | 31 (21.8%) |
| $800 to $999 | 46 (6.1%) | 0 (0.0%) |
| $1,000 to $1,499 | 143 (18.9%) | 22 (15.5%) |
| $1,500 to $1,999 | 45 (5.9%) | 0 (0.0%) |
| $2,000 to $2,499 | 10 (1.3%) | 0 (0.0%) |
| $2,500 to $2,999 | 19 (2.5%) | 0 (0.0%) |
| $3,000 or more | 0 (0.0%) | 0 (0.0%) |
| Total | 757 (100.0%) | 142 (100.0%) |
Physical Housing Characteristics in Schleicher County
Housing Structures in Schleicher County
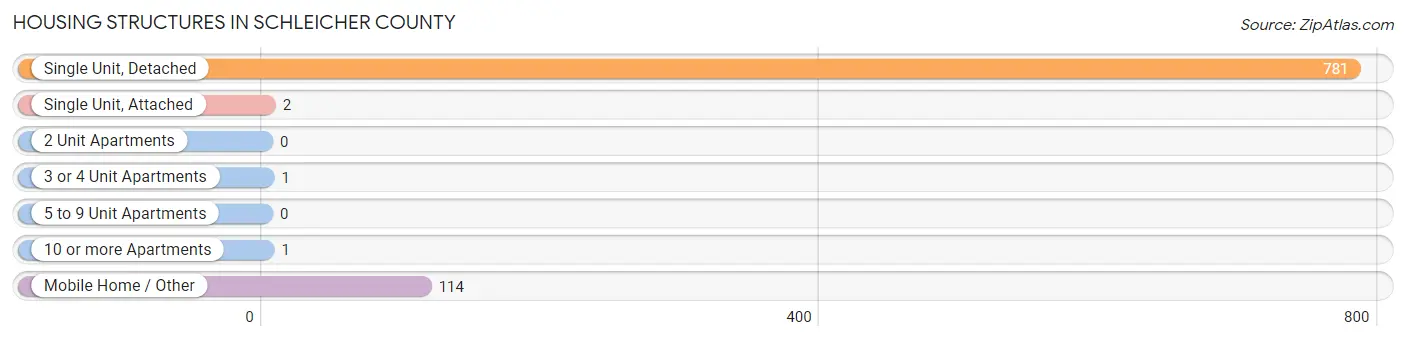
| Structure Type | # Housing Units | % Housing Units |
| Single Unit, Detached | 781 | 86.9% |
| Single Unit, Attached | 2 | 0.2% |
| 2 Unit Apartments | 0 | 0.0% |
| 3 or 4 Unit Apartments | 1 | 0.1% |
| 5 to 9 Unit Apartments | 0 | 0.0% |
| 10 or more Apartments | 1 | 0.1% |
| Mobile Home / Other | 114 | 12.7% |
| Total | 899 | 100.0% |
Housing Structures by Occupancy in Schleicher County
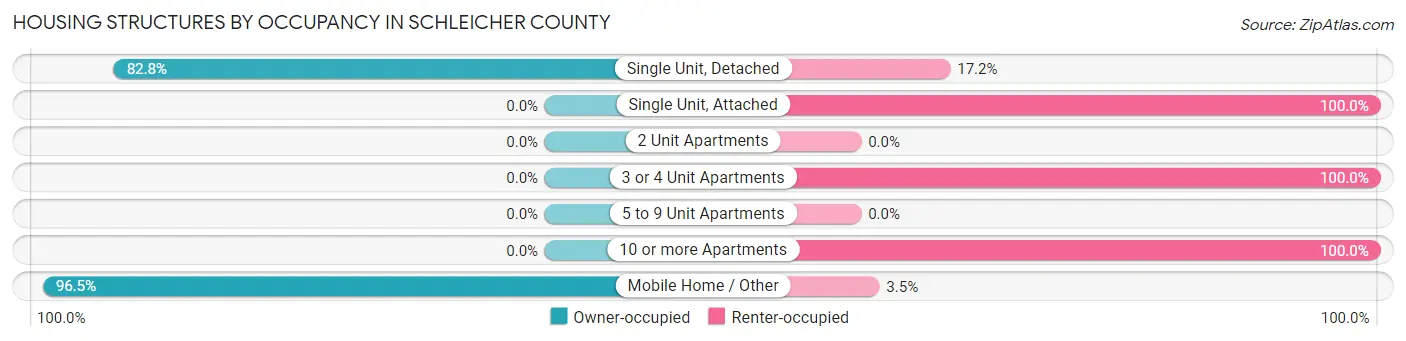
| Structure Type | Owner-occupied | Renter-occupied |
| Single Unit, Detached | 647 (82.8%) | 134 (17.2%) |
| Single Unit, Attached | 0 (0.0%) | 2 (100.0%) |
| 2 Unit Apartments | 0 (0.0%) | 0 (0.0%) |
| 3 or 4 Unit Apartments | 0 (0.0%) | 1 (100.0%) |
| 5 to 9 Unit Apartments | 0 (0.0%) | 0 (0.0%) |
| 10 or more Apartments | 0 (0.0%) | 1 (100.0%) |
| Mobile Home / Other | 110 (96.5%) | 4 (3.5%) |
| Total | 757 (84.2%) | 142 (15.8%) |
Housing Structures by Number of Rooms in Schleicher County
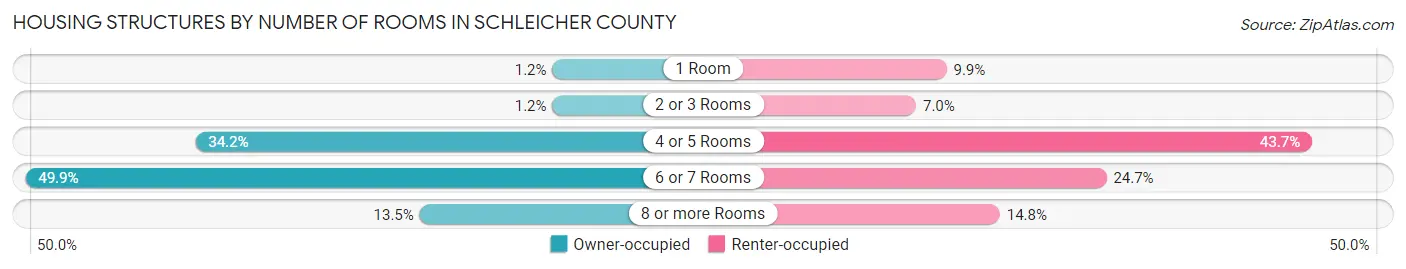
| Number of Rooms | Owner-occupied | Renter-occupied |
| 1 Room | 9 (1.2%) | 14 (9.9%) |
| 2 or 3 Rooms | 9 (1.2%) | 10 (7.0%) |
| 4 or 5 Rooms | 259 (34.2%) | 62 (43.7%) |
| 6 or 7 Rooms | 378 (49.9%) | 35 (24.6%) |
| 8 or more Rooms | 102 (13.5%) | 21 (14.8%) |
| Total | 757 (100.0%) | 142 (100.0%) |
Housing Structure by Heating Type in Schleicher County
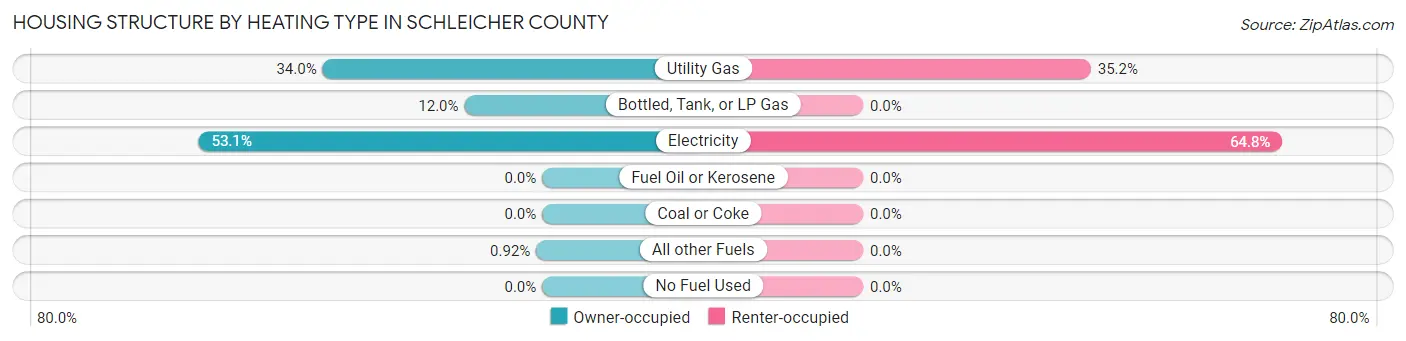
| Heating Type | Owner-occupied | Renter-occupied |
| Utility Gas | 257 (34.0%) | 50 (35.2%) |
| Bottled, Tank, or LP Gas | 91 (12.0%) | 0 (0.0%) |
| Electricity | 402 (53.1%) | 92 (64.8%) |
| Fuel Oil or Kerosene | 0 (0.0%) | 0 (0.0%) |
| Coal or Coke | 0 (0.0%) | 0 (0.0%) |
| All other Fuels | 7 (0.9%) | 0 (0.0%) |
| No Fuel Used | 0 (0.0%) | 0 (0.0%) |
| Total | 757 (100.0%) | 142 (100.0%) |
Household Vehicle Usage in Schleicher County
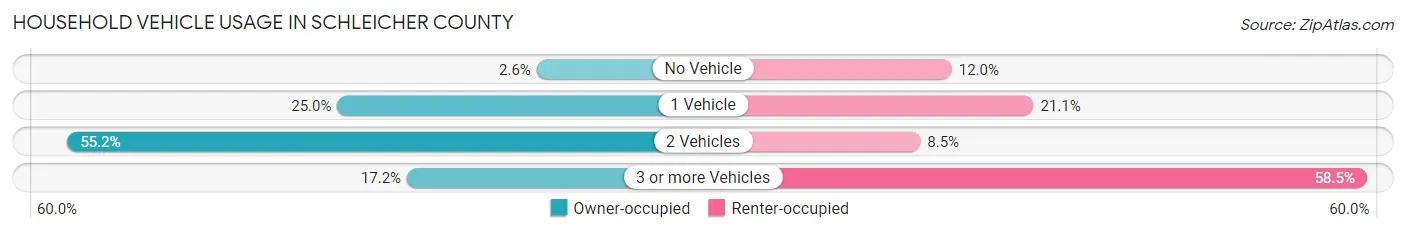
| Vehicles per Household | Owner-occupied | Renter-occupied |
| No Vehicle | 20 (2.6%) | 17 (12.0%) |
| 1 Vehicle | 189 (25.0%) | 30 (21.1%) |
| 2 Vehicles | 418 (55.2%) | 12 (8.5%) |
| 3 or more Vehicles | 130 (17.2%) | 83 (58.5%) |
| Total | 757 (100.0%) | 142 (100.0%) |
Real Estate & Mortgages in Schleicher County
Real Estate and Mortgage Overview in Schleicher County
| Characteristic | Without Mortgage | With Mortgage |
| Housing Units | 534 | 223 |
| Median Property Value | $93,300 | $99,300 |
| Median Household Income | $40,547 | $23 |
| Monthly Housing Costs | $452 | $0 |
| Real Estate Taxes | $932 | $3 |
Property Value by Mortgage Status in Schleicher County
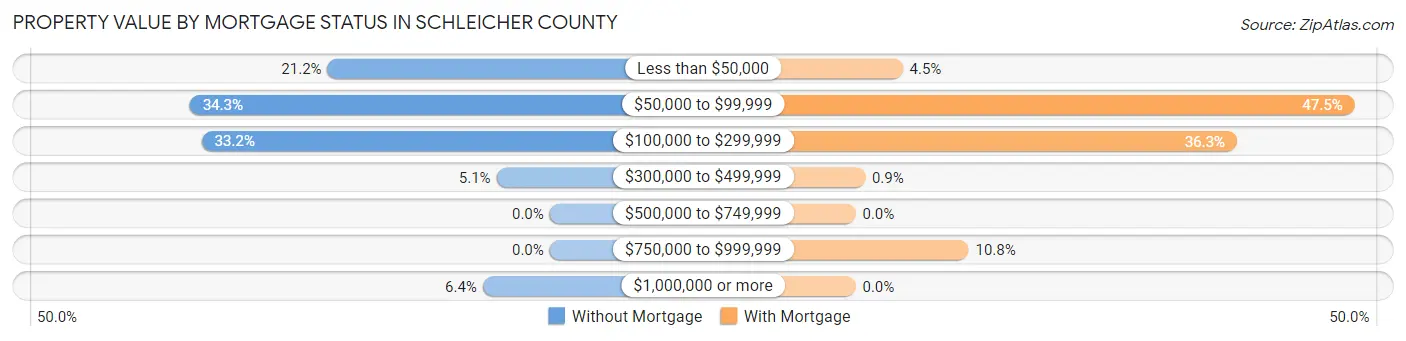
| Property Value | Without Mortgage | With Mortgage |
| Less than $50,000 | 113 (21.2%) | 10 (4.5%) |
| $50,000 to $99,999 | 183 (34.3%) | 106 (47.5%) |
| $100,000 to $299,999 | 177 (33.2%) | 81 (36.3%) |
| $300,000 to $499,999 | 27 (5.1%) | 2 (0.9%) |
| $500,000 to $749,999 | 0 (0.0%) | 0 (0.0%) |
| $750,000 to $999,999 | 0 (0.0%) | 24 (10.8%) |
| $1,000,000 or more | 34 (6.4%) | 0 (0.0%) |
| Total | 534 (100.0%) | 223 (100.0%) |
Household Income by Mortgage Status in Schleicher County
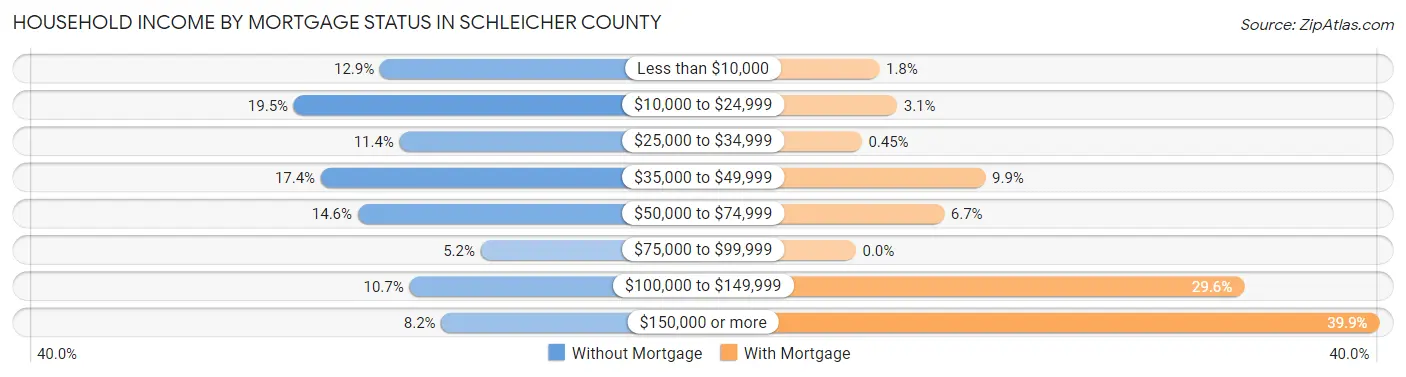
| Household Income | Without Mortgage | With Mortgage |
| Less than $10,000 | 69 (12.9%) | 4 (1.8%) |
| $10,000 to $24,999 | 104 (19.5%) | 7 (3.1%) |
| $25,000 to $34,999 | 61 (11.4%) | 1 (0.4%) |
| $35,000 to $49,999 | 93 (17.4%) | 22 (9.9%) |
| $50,000 to $74,999 | 78 (14.6%) | 15 (6.7%) |
| $75,000 to $99,999 | 28 (5.2%) | 0 (0.0%) |
| $100,000 to $149,999 | 57 (10.7%) | 66 (29.6%) |
| $150,000 or more | 44 (8.2%) | 89 (39.9%) |
| Total | 534 (100.0%) | 223 (100.0%) |
Property Value to Household Income Ratio in Schleicher County
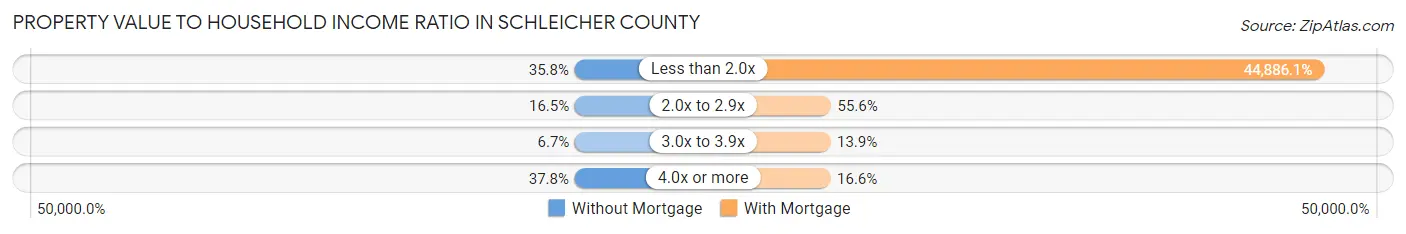
| Value-to-Income Ratio | Without Mortgage | With Mortgage |
| Less than 2.0x | 191 (35.8%) | 100,096 (44,886.1%) |
| 2.0x to 2.9x | 88 (16.5%) | 124 (55.6%) |
| 3.0x to 3.9x | 36 (6.7%) | 31 (13.9%) |
| 4.0x or more | 202 (37.8%) | 37 (16.6%) |
| Total | 534 (100.0%) | 223 (100.0%) |
Real Estate Taxes by Mortgage Status in Schleicher County
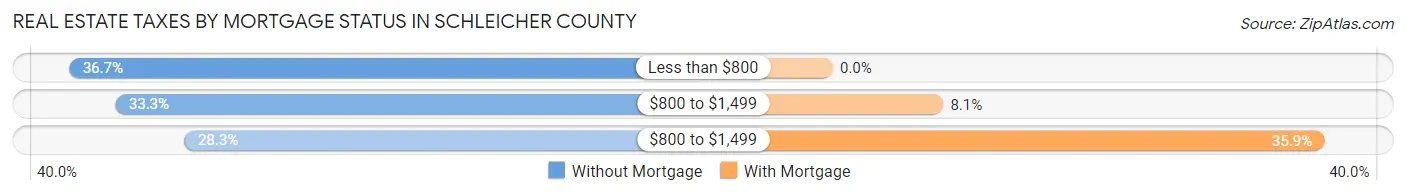
| Property Taxes | Without Mortgage | With Mortgage |
| Less than $800 | 196 (36.7%) | 0 (0.0%) |
| $800 to $1,499 | 178 (33.3%) | 18 (8.1%) |
| $800 to $1,499 | 151 (28.3%) | 80 (35.9%) |
| Total | 534 (100.0%) | 223 (100.0%) |
Health & Disability in Schleicher County
Health Insurance Coverage by Age in Schleicher County
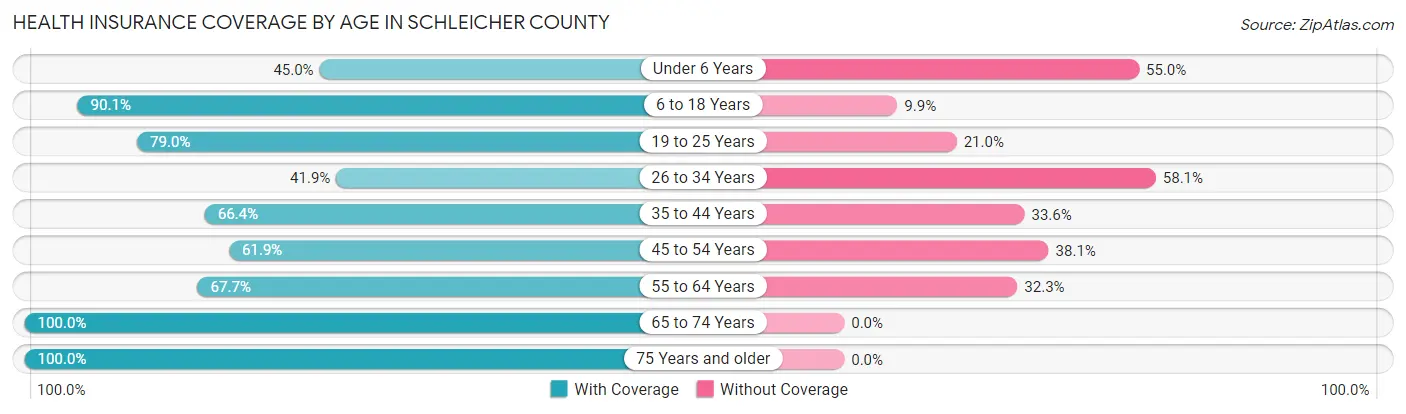
| Age Bracket | With Coverage | Without Coverage |
| Under 6 Years | 113 (45.0%) | 138 (55.0%) |
| 6 to 18 Years | 364 (90.1%) | 40 (9.9%) |
| 19 to 25 Years | 147 (79.0%) | 39 (21.0%) |
| 26 to 34 Years | 88 (41.9%) | 122 (58.1%) |
| 35 to 44 Years | 237 (66.4%) | 120 (33.6%) |
| 45 to 54 Years | 151 (61.9%) | 93 (38.1%) |
| 55 to 64 Years | 107 (67.7%) | 51 (32.3%) |
| 65 to 74 Years | 381 (100.0%) | 0 (0.0%) |
| 75 Years and older | 245 (100.0%) | 0 (0.0%) |
| Total | 1,833 (75.2%) | 603 (24.7%) |
Health Insurance Coverage by Citizenship Status in Schleicher County
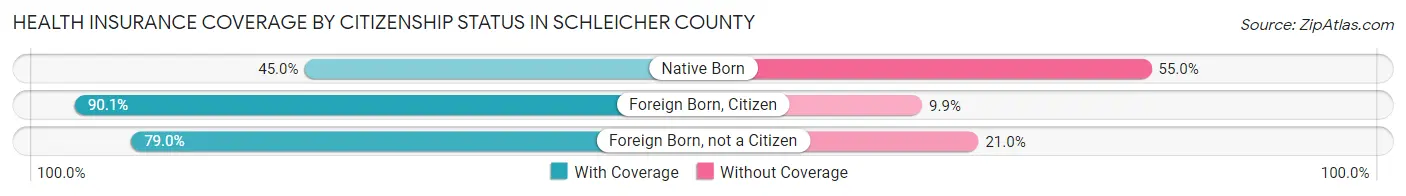
| Citizenship Status | With Coverage | Without Coverage |
| Native Born | 113 (45.0%) | 138 (55.0%) |
| Foreign Born, Citizen | 364 (90.1%) | 40 (9.9%) |
| Foreign Born, not a Citizen | 147 (79.0%) | 39 (21.0%) |
Health Insurance Coverage by Household Income in Schleicher County
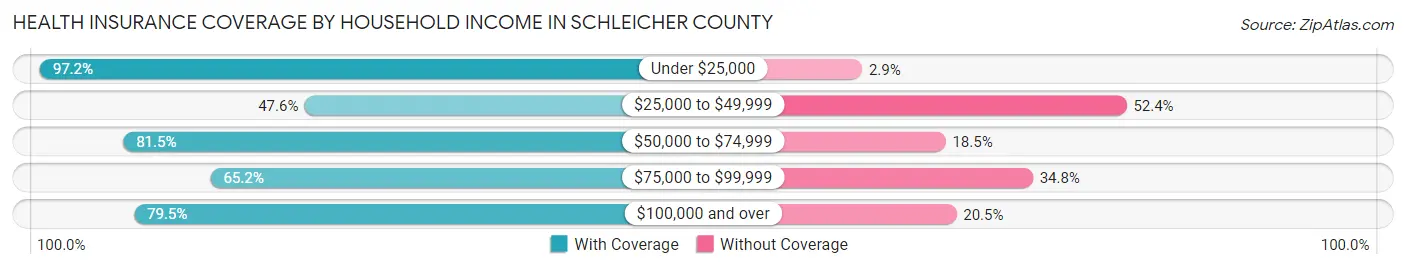
| Household Income | With Coverage | Without Coverage |
| Under $25,000 | 375 (97.2%) | 11 (2.9%) |
| $25,000 to $49,999 | 169 (47.6%) | 186 (52.4%) |
| $50,000 to $74,999 | 216 (81.5%) | 49 (18.5%) |
| $75,000 to $99,999 | 290 (65.2%) | 155 (34.8%) |
| $100,000 and over | 783 (79.5%) | 202 (20.5%) |
Public vs Private Health Insurance Coverage by Age in Schleicher County
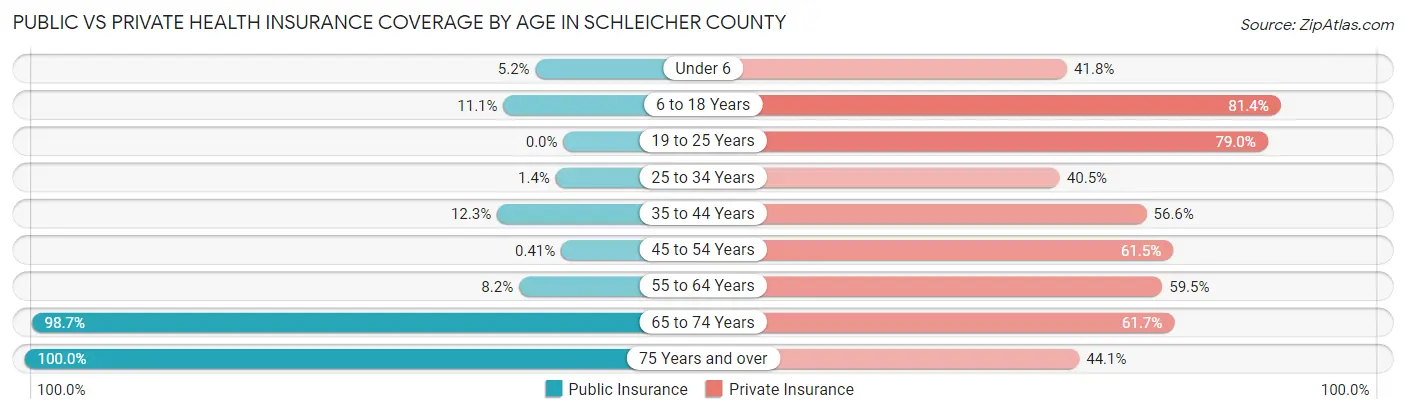
| Age Bracket | Public Insurance | Private Insurance |
| Under 6 | 13 (5.2%) | 105 (41.8%) |
| 6 to 18 Years | 45 (11.1%) | 329 (81.4%) |
| 19 to 25 Years | 0 (0.0%) | 147 (79.0%) |
| 25 to 34 Years | 3 (1.4%) | 85 (40.5%) |
| 35 to 44 Years | 44 (12.3%) | 202 (56.6%) |
| 45 to 54 Years | 1 (0.4%) | 150 (61.5%) |
| 55 to 64 Years | 13 (8.2%) | 94 (59.5%) |
| 65 to 74 Years | 376 (98.7%) | 235 (61.7%) |
| 75 Years and over | 245 (100.0%) | 108 (44.1%) |
| Total | 740 (30.4%) | 1,455 (59.7%) |
Disability Status by Sex by Age in Schleicher County
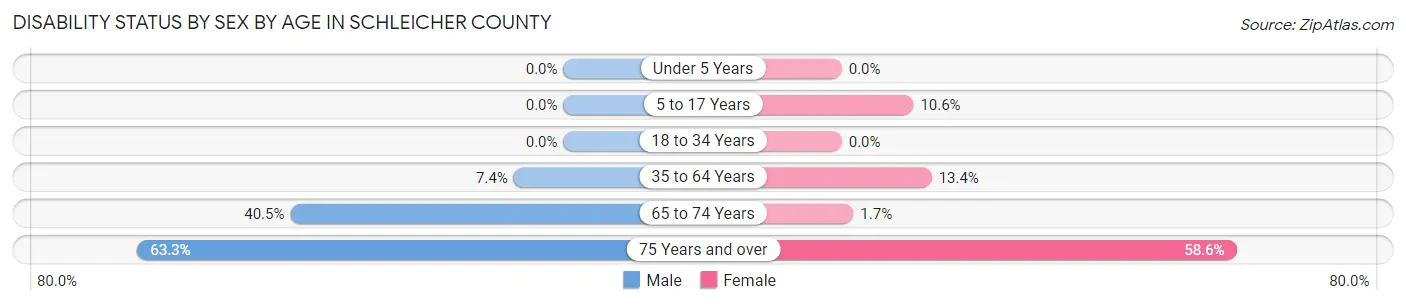
| Age Bracket | Male | Female |
| Under 5 Years | 0 (0.0%) | 0 (0.0%) |
| 5 to 17 Years | 0 (0.0%) | 20 (10.6%) |
| 18 to 34 Years | 0 (0.0%) | 0 (0.0%) |
| 35 to 64 Years | 30 (7.4%) | 47 (13.4%) |
| 65 to 74 Years | 60 (40.5%) | 4 (1.7%) |
| 75 Years and over | 74 (63.2%) | 75 (58.6%) |
Disability Class by Sex by Age in Schleicher County
Disability Class: Hearing Difficulty
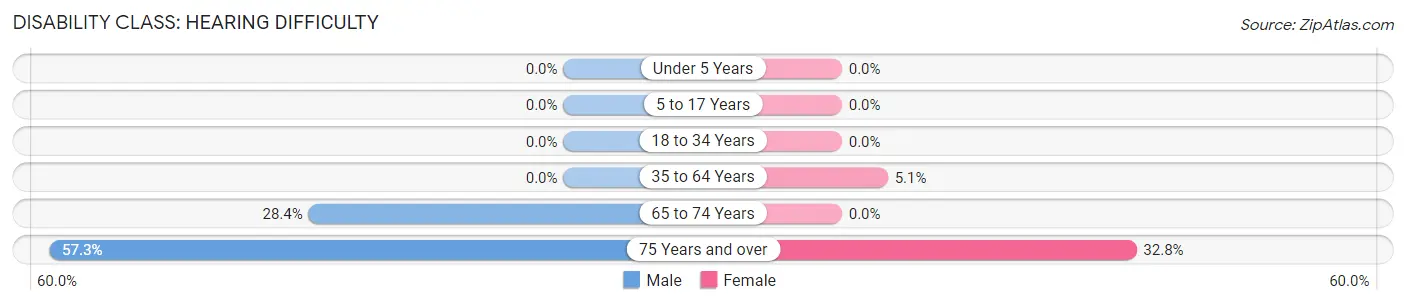
| Age Bracket | Male | Female |
| Under 5 Years | 0 (0.0%) | 0 (0.0%) |
| 5 to 17 Years | 0 (0.0%) | 0 (0.0%) |
| 18 to 34 Years | 0 (0.0%) | 0 (0.0%) |
| 35 to 64 Years | 0 (0.0%) | 18 (5.1%) |
| 65 to 74 Years | 42 (28.4%) | 0 (0.0%) |
| 75 Years and over | 67 (57.3%) | 42 (32.8%) |
Disability Class: Vision Difficulty
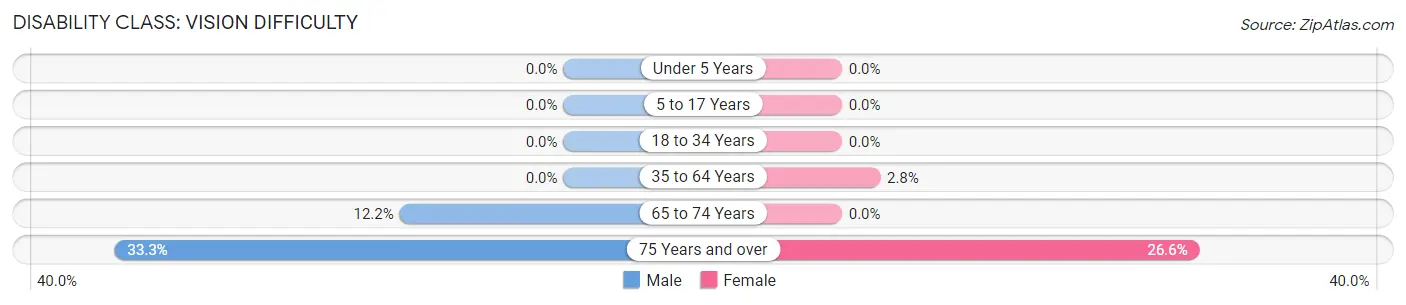
| Age Bracket | Male | Female |
| Under 5 Years | 0 (0.0%) | 0 (0.0%) |
| 5 to 17 Years | 0 (0.0%) | 0 (0.0%) |
| 18 to 34 Years | 0 (0.0%) | 0 (0.0%) |
| 35 to 64 Years | 0 (0.0%) | 10 (2.8%) |
| 65 to 74 Years | 18 (12.2%) | 0 (0.0%) |
| 75 Years and over | 39 (33.3%) | 34 (26.6%) |
Disability Class: Cognitive Difficulty
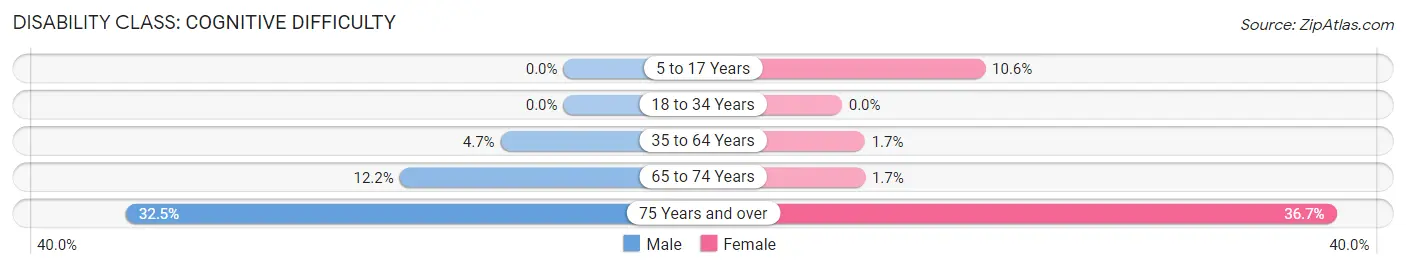
| Age Bracket | Male | Female |
| 5 to 17 Years | 0 (0.0%) | 20 (10.6%) |
| 18 to 34 Years | 0 (0.0%) | 0 (0.0%) |
| 35 to 64 Years | 19 (4.7%) | 6 (1.7%) |
| 65 to 74 Years | 18 (12.2%) | 4 (1.7%) |
| 75 Years and over | 38 (32.5%) | 47 (36.7%) |
Disability Class: Ambulatory Difficulty
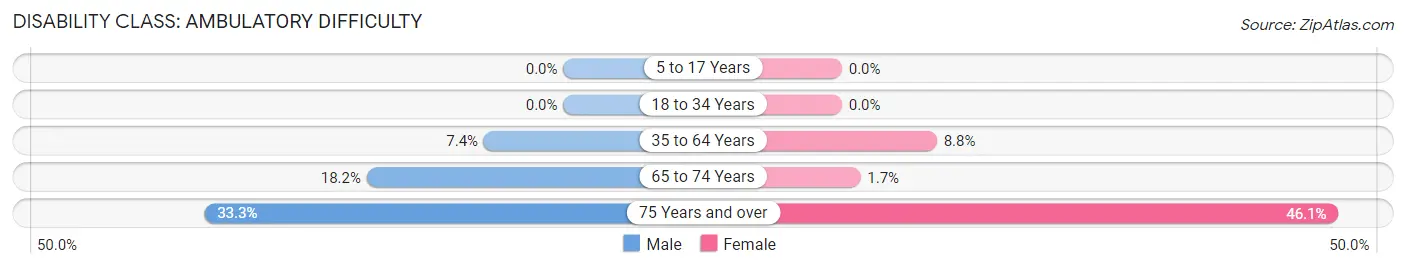
| Age Bracket | Male | Female |
| 5 to 17 Years | 0 (0.0%) | 0 (0.0%) |
| 18 to 34 Years | 0 (0.0%) | 0 (0.0%) |
| 35 to 64 Years | 30 (7.4%) | 31 (8.8%) |
| 65 to 74 Years | 27 (18.2%) | 4 (1.7%) |
| 75 Years and over | 39 (33.3%) | 59 (46.1%) |
Disability Class: Self-Care Difficulty
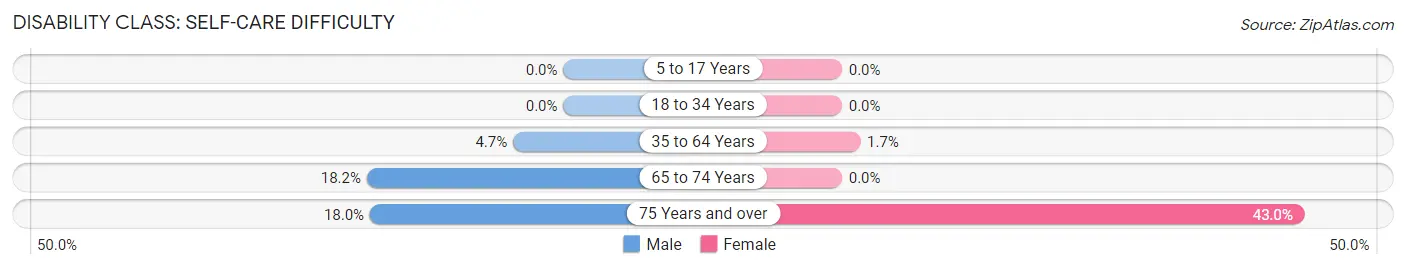
| Age Bracket | Male | Female |
| 5 to 17 Years | 0 (0.0%) | 0 (0.0%) |
| 18 to 34 Years | 0 (0.0%) | 0 (0.0%) |
| 35 to 64 Years | 19 (4.7%) | 6 (1.7%) |
| 65 to 74 Years | 27 (18.2%) | 0 (0.0%) |
| 75 Years and over | 21 (17.9%) | 55 (43.0%) |
Technology Access in Schleicher County
Computing Device Access in Schleicher County
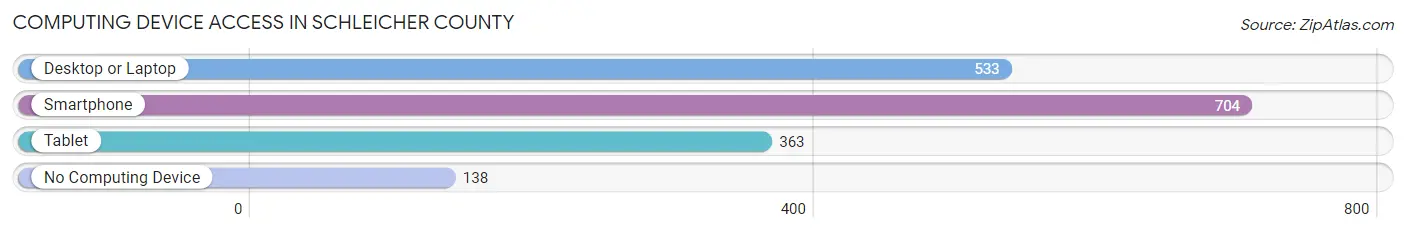
| Device Type | # Households | % Households |
| Desktop or Laptop | 533 | 59.3% |
| Smartphone | 704 | 78.3% |
| Tablet | 363 | 40.4% |
| No Computing Device | 138 | 15.3% |
| Total | 899 | 100.0% |
Internet Access in Schleicher County
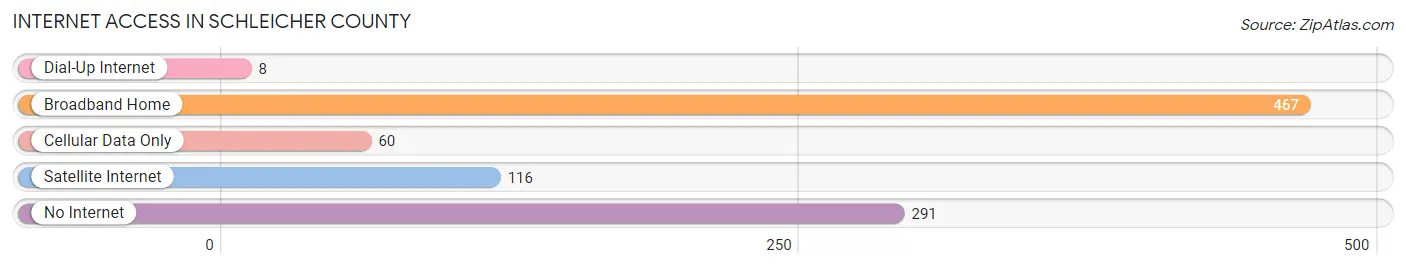
| Internet Type | # Households | % Households |
| Dial-Up Internet | 8 | 0.9% |
| Broadband Home | 467 | 51.9% |
| Cellular Data Only | 60 | 6.7% |
| Satellite Internet | 116 | 12.9% |
| No Internet | 291 | 32.4% |
| Total | 899 | 100.0% |
Schleicher County Summary
Schleicher County is located in the state of Texas, in the United States of America. It is situated in the western part of the state, and is bordered by Tom Green County to the north, Sutton County to the east, Crockett County to the south, and Menard County to the west. The county seat is Eldorado, and the county has a total area of 914 square miles. As of the 2010 census, the population of Schleicher County was 3,461, making it the second least populous county in Texas.
History
Schleicher County was established in 1887, and was named after Gustav Schleicher, a German-born surveyor and politician who served in the Texas House of Representatives from 1876 to 1878. The county was originally part of Tom Green County, and was created out of parts of Tom Green, Crockett, and Sutton Counties. The first settlers in the area were ranchers, who were attracted to the area by the abundance of grass and water. The first town in the county was Eldorado, which was founded in 1881.
Geography
Schleicher County is located in the western part of Texas, and is bordered by Tom Green County to the north, Sutton County to the east, Crockett County to the south, and Menard County to the west. The county has a total area of 914 square miles, and is mostly flat, with some rolling hills. The terrain is mostly covered in grasslands, with some areas of mesquite and cedar trees. The county is home to several creeks and rivers, including the San Saba River, which runs through the county.
Economy
The economy of Schleicher County is largely based on agriculture and ranching. The county is home to several large ranches, and the main crops grown in the area are cotton, wheat, and sorghum. The county also has a small oil and gas industry, and there are several small businesses in the area. The county is also home to several state and federal prisons, which provide employment for many of the county's residents.
Demographics
As of the 2010 census, the population of Schleicher County was 3,461, with a population density of 4 people per square mile. The racial makeup of the county was 81.3% White, 0.3% African American, 0.7% Native American, 0.2% Asian, 0.1% Pacific Islander, 15.7% from other races, and 1.9% from two or more races. Hispanic or Latino of any race were 33.2% of the population. The median income for a household in the county was $30,938, and the median income for a family was $35,938. The per capita income for the county was $14,938. The poverty rate was 22.3%.
Conclusion
Schleicher County is a rural county located in the western part of Texas. It was established in 1887, and is named after Gustav Schleicher, a German-born surveyor and politician. The county has a total area of 914 square miles, and is mostly flat, with some rolling hills. The economy of the county is largely based on agriculture and ranching, and the main crops grown in the area are cotton, wheat, and sorghum. As of the 2010 census, the population of Schleicher County was 3,461, with a population density of 4 people per square mile. The median income for a household in the county was $30,938, and the poverty rate was 22.3%.
Common Questions
What is Per Capita Income in Schleicher County?
Per Capita income in Schleicher County is $28,084.
What is the Median Family Income in Schleicher County?
Median Family Income in Schleicher County is $79,076.
What is the Median Household income in Schleicher County?
Median Household Income in Schleicher County is $53,774.
What is Income or Wage Gap in Schleicher County?
Income or Wage Gap in Schleicher County is 62.1%.
Women in Schleicher County earn 37.9 cents for every dollar earned by a man.
What is Inequality or Gini Index in Schleicher County?
Inequality or Gini Index in Schleicher County is 0.42.
What is the Total Population of Schleicher County?
Total Population of Schleicher County is 2,474.
What is the Total Male Population of Schleicher County?
Total Male Population of Schleicher County is 1,181.
What is the Total Female Population of Schleicher County?
Total Female Population of Schleicher County is 1,293.
What is the Ratio of Males per 100 Females in Schleicher County?
There are 91.34 Males per 100 Females in Schleicher County.
What is the Ratio of Females per 100 Males in Schleicher County?
There are 109.48 Females per 100 Males in Schleicher County.
What is the Median Population Age in Schleicher County?
Median Population Age in Schleicher County is 39.4 Years.
What is the Average Family Size in Schleicher County
Average Family Size in Schleicher County is 3.5 People.
What is the Average Household Size in Schleicher County
Average Household Size in Schleicher County is 2.7 People.
How Large is the Labor Force in Schleicher County?
There are 1,138 People in the Labor Forcein in Schleicher County.
What is the Percentage of People in the Labor Force in Schleicher County?
58.4% of People are in the Labor Force in Schleicher County.
What is the Unemployment Rate in Schleicher County?
Unemployment Rate in Schleicher County is 6.9%.