San Saba County, TX Map & Demographics
San Saba County Map
San Saba County Overview
$26,377
PER CAPITA INCOME
$64,395
AVG FAMILY INCOME
$54,087
AVG HOUSEHOLD INCOME
26.7%
WAGE / INCOME GAP [ % ]
73.3¢/ $1
WAGE / INCOME GAP [ $ ]
$9,502
FAMILY INCOME DEFICIT
0.42
INEQUALITY / GINI INDEX
5,779
TOTAL POPULATION
3,086
MALE POPULATION
2,693
FEMALE POPULATION
114.59
MALES / 100 FEMALES
87.27
FEMALES / 100 MALES
41.9
MEDIAN AGE
3.2
AVG FAMILY SIZE
2.5
AVG HOUSEHOLD SIZE
2,416
LABOR FORCE [ PEOPLE ]
50.4%
PERCENT IN LABOR FORCE
3.8%
UNEMPLOYMENT RATE
San Saba County Area Codes
Income in San Saba County
Income Overview in San Saba County
Per Capita Income in San Saba County is $26,377, while median incomes of families and households are $64,395 and $54,087 respectively.
| Characteristic | Number | Measure |
| Per Capita Income | 5,779 | $26,377 |
| Median Family Income | 1,333 | $64,395 |
| Mean Family Income | 1,333 | $80,404 |
| Median Household Income | 2,014 | $54,087 |
| Mean Household Income | 2,014 | $71,975 |
| Income Deficit | 1,333 | $9,502 |
| Wage / Income Gap (%) | 5,779 | 26.73% |
| Wage / Income Gap ($) | 5,779 | 73.27¢ per $1 |
| Gini / Inequality Index | 5,779 | 0.42 |
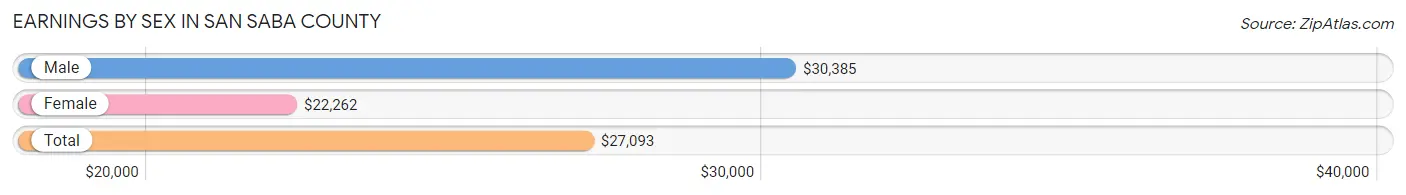
Earnings by Sex in San Saba County
Average Earnings in San Saba County are $27,093, $30,385 for men and $22,262 for women, a difference of 26.7%.
| Sex | Number | Average Earnings |
| Male | 1,628 (59.5%) | $30,385 |
| Female | 1,110 (40.5%) | $22,262 |
| Total | 2,738 (100.0%) | $27,093 |
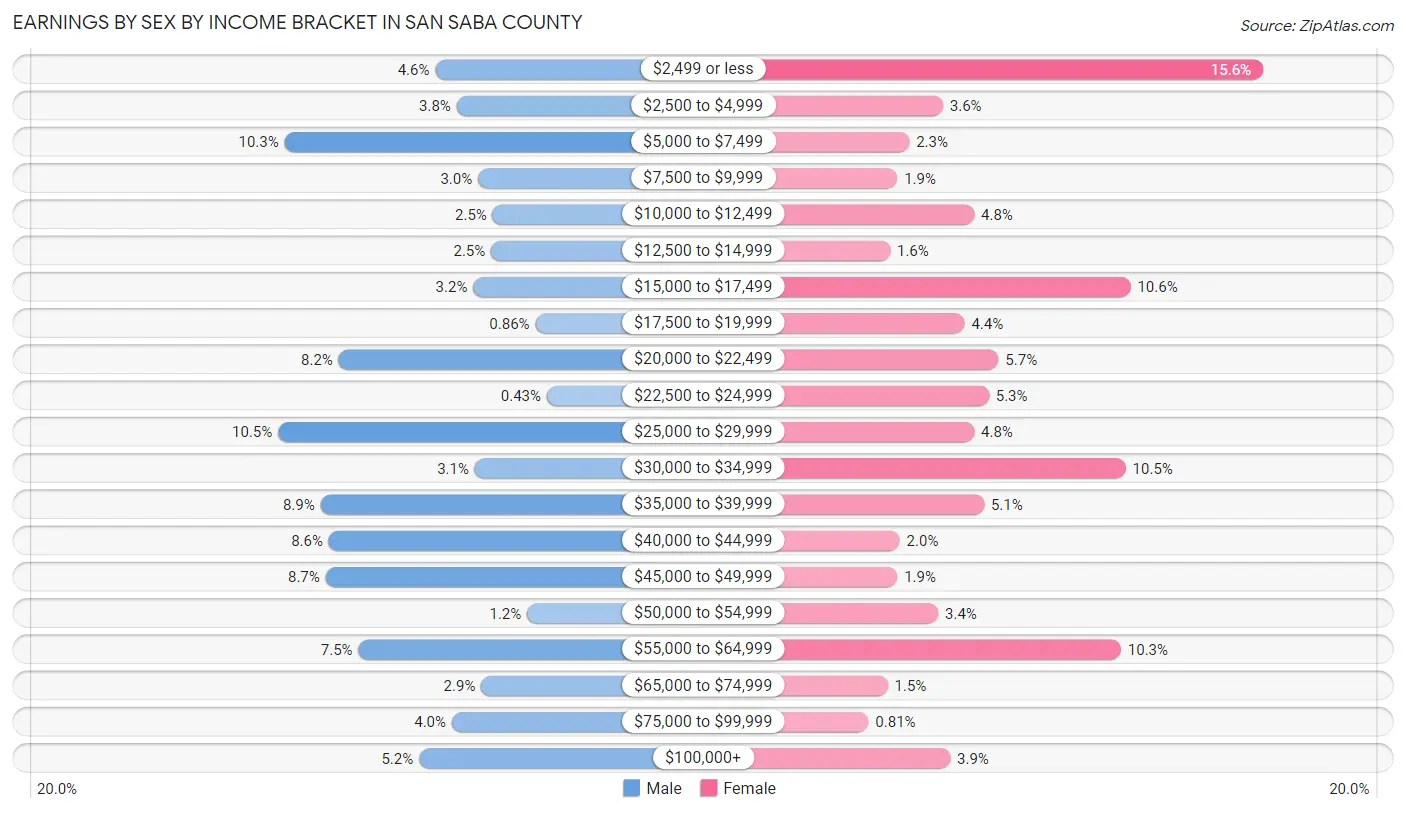
Earnings by Sex by Income Bracket in San Saba County
The most common earnings brackets in San Saba County are $25,000 to $29,999 for men (171 | 10.5%) and $2,499 or less for women (173 | 15.6%).
| Income | Male | Female |
| $2,499 or less | 75 (4.6%) | 173 (15.6%) |
| $2,500 to $4,999 | 62 (3.8%) | 40 (3.6%) |
| $5,000 to $7,499 | 167 (10.3%) | 26 (2.3%) |
| $7,500 to $9,999 | 49 (3.0%) | 21 (1.9%) |
| $10,000 to $12,499 | 40 (2.5%) | 53 (4.8%) |
| $12,500 to $14,999 | 41 (2.5%) | 18 (1.6%) |
| $15,000 to $17,499 | 52 (3.2%) | 118 (10.6%) |
| $17,500 to $19,999 | 14 (0.9%) | 49 (4.4%) |
| $20,000 to $22,499 | 134 (8.2%) | 63 (5.7%) |
| $22,500 to $24,999 | 7 (0.4%) | 59 (5.3%) |
| $25,000 to $29,999 | 171 (10.5%) | 53 (4.8%) |
| $30,000 to $34,999 | 51 (3.1%) | 116 (10.4%) |
| $35,000 to $39,999 | 145 (8.9%) | 57 (5.1%) |
| $40,000 to $44,999 | 140 (8.6%) | 22 (2.0%) |
| $45,000 to $49,999 | 142 (8.7%) | 21 (1.9%) |
| $50,000 to $54,999 | 19 (1.2%) | 38 (3.4%) |
| $55,000 to $64,999 | 122 (7.5%) | 114 (10.3%) |
| $65,000 to $74,999 | 47 (2.9%) | 17 (1.5%) |
| $75,000 to $99,999 | 65 (4.0%) | 9 (0.8%) |
| $100,000+ | 85 (5.2%) | 43 (3.9%) |
| Total | 1,628 (100.0%) | 1,110 (100.0%) |
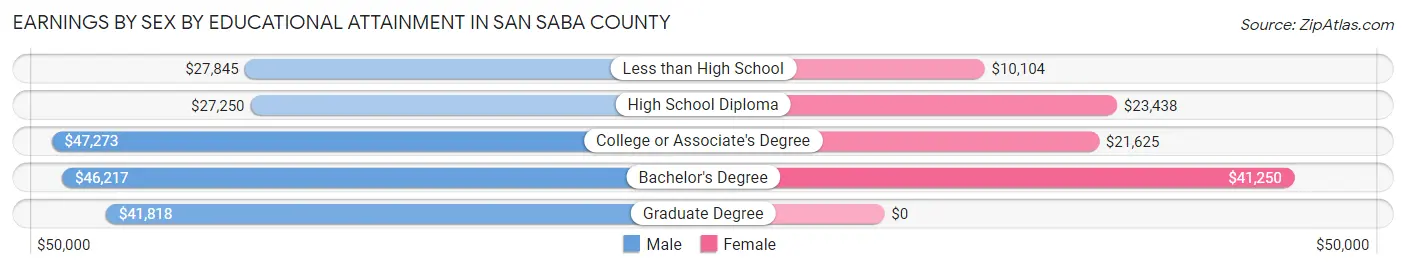
Earnings by Sex by Educational Attainment in San Saba County
Average earnings in San Saba County are $35,625 for men and $24,867 for women, a difference of 30.2%. Men with an educational attainment of college or associate's degree enjoy the highest average annual earnings of $47,273, while those with high school diploma education earn the least with $27,250. Women with an educational attainment of bachelor's degree earn the most with the average annual earnings of $41,250, while those with less than high school education have the smallest earnings of $10,104.
| Educational Attainment | Male Income | Female Income |
| Less than High School | $27,845 | $10,104 |
| High School Diploma | $27,250 | $23,438 |
| College or Associate's Degree | $47,273 | $21,625 |
| Bachelor's Degree | $46,217 | $41,250 |
| Graduate Degree | $41,818 | $0 |
| Total | $35,625 | $24,867 |
Family Income in San Saba County
Family Income Brackets in San Saba County
According to the San Saba County family income data, there are 277 families falling into the $50,000 to $74,999 income range, which is the most common income bracket and makes up 20.8% of all families. Conversely, the less than $10,000 income bracket is the least frequent group with only 20 families (1.5%) belonging to this category.
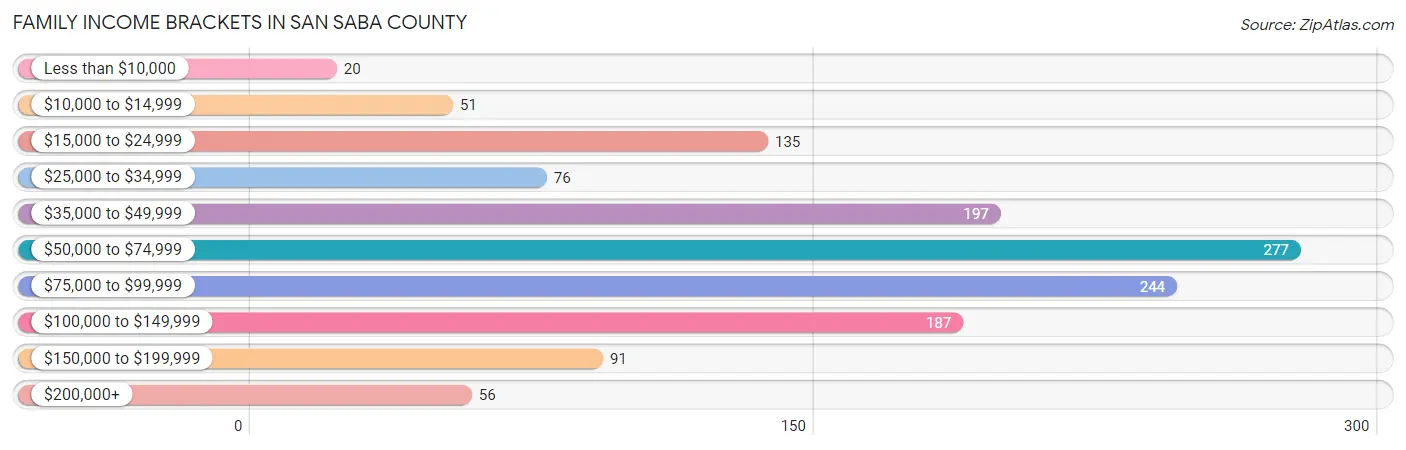
| Income Bracket | # Families | % Families |
| Less than $10,000 | 20 | 1.5% |
| $10,000 to $14,999 | 51 | 3.8% |
| $15,000 to $24,999 | 135 | 10.1% |
| $25,000 to $34,999 | 76 | 5.7% |
| $35,000 to $49,999 | 197 | 14.8% |
| $50,000 to $74,999 | 277 | 20.8% |
| $75,000 to $99,999 | 244 | 18.3% |
| $100,000 to $149,999 | 187 | 14.0% |
| $150,000 to $199,999 | 91 | 6.8% |
| $200,000+ | 56 | 4.2% |
Family Income by Famaliy Size in San Saba County
7+ person families (32 | 2.4%) account for the highest median family income in San Saba County with $187,647 per family, while 2-person families (772 | 57.9%) have the highest median income of $34,028 per family member.
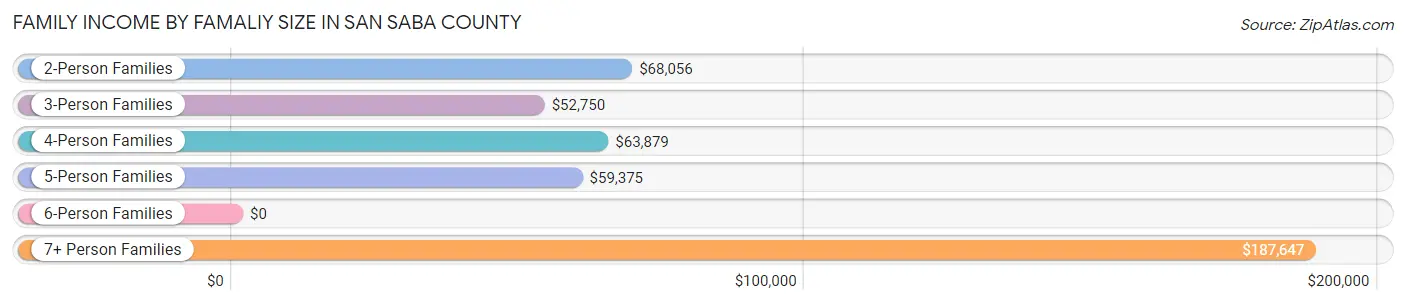
| Income Bracket | # Families | Median Income |
| 2-Person Families | 772 (57.9%) | $68,056 |
| 3-Person Families | 258 (19.4%) | $52,750 |
| 4-Person Families | 220 (16.5%) | $63,879 |
| 5-Person Families | 51 (3.8%) | $59,375 |
| 6-Person Families | 0 (0.0%) | $0 |
| 7+ Person Families | 32 (2.4%) | $187,647 |
| Total | 1,333 (100.0%) | $64,395 |
Family Income by Number of Earners in San Saba County
The median family income in San Saba County is $64,395, with families comprising 3+ earners (85) having the highest median family income of $125,114, while families with 1 earner (388) have the lowest median family income of $42,734, accounting for 6.4% and 29.1% of families, respectively.
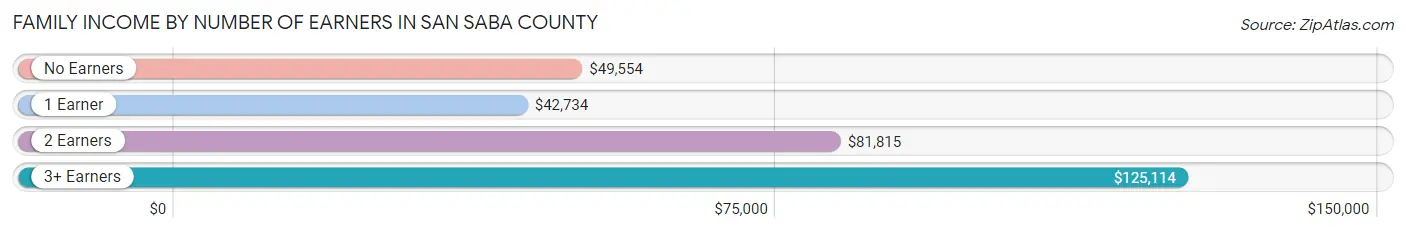
| Number of Earners | # Families | Median Income |
| No Earners | 297 (22.3%) | $49,554 |
| 1 Earner | 388 (29.1%) | $42,734 |
| 2 Earners | 563 (42.2%) | $81,815 |
| 3+ Earners | 85 (6.4%) | $125,114 |
| Total | 1,333 (100.0%) | $64,395 |
Household Income in San Saba County
Household Income Brackets in San Saba County
With 363 households falling in the category, the $50,000 to $74,999 income range is the most frequent in San Saba County, accounting for 18.0% of all households. In contrast, only 75 households (3.7%) fall into the less than $10,000 income bracket, making it the least populous group.
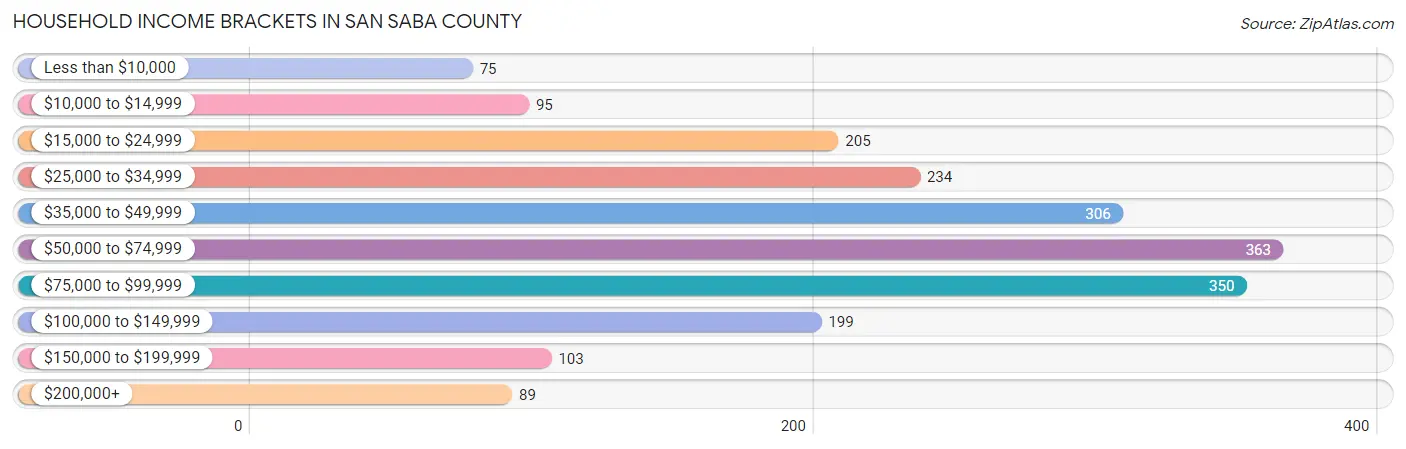
| Income Bracket | # Households | % Households |
| Less than $10,000 | 75 | 3.7% |
| $10,000 to $14,999 | 95 | 4.7% |
| $15,000 to $24,999 | 205 | 10.2% |
| $25,000 to $34,999 | 234 | 11.6% |
| $35,000 to $49,999 | 306 | 15.2% |
| $50,000 to $74,999 | 363 | 18.0% |
| $75,000 to $99,999 | 350 | 17.4% |
| $100,000 to $149,999 | 199 | 9.9% |
| $150,000 to $199,999 | 103 | 5.1% |
| $200,000+ | 89 | 4.4% |
Household Income by Householder Age in San Saba County
The median household income in San Saba County is $54,087, with the highest median household income of $76,250 found in the 45 to 64 years age bracket for the primary householder. A total of 624 households (31.0%) fall into this category. Meanwhile, the 15 to 24 years age bracket for the primary householder has the lowest median household income of $0, with 27 households (1.3%) in this group.
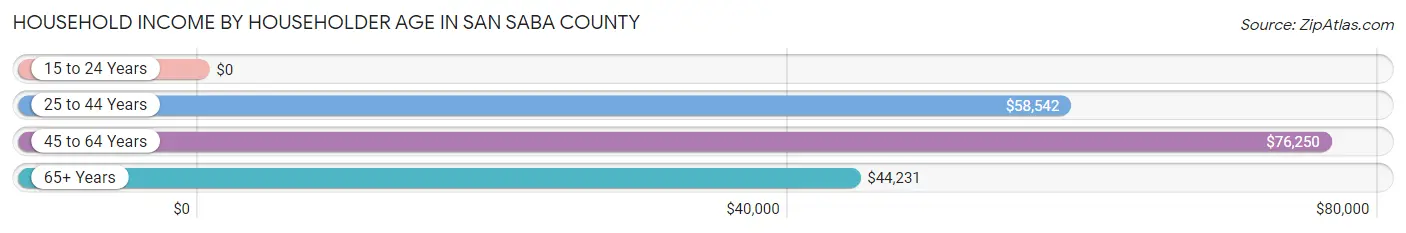
| Income Bracket | # Households | Median Income |
| 15 to 24 Years | 27 (1.3%) | $0 |
| 25 to 44 Years | 507 (25.2%) | $58,542 |
| 45 to 64 Years | 624 (31.0%) | $76,250 |
| 65+ Years | 856 (42.5%) | $44,231 |
| Total | 2,014 (100.0%) | $54,087 |
Poverty in San Saba County
Income Below Poverty by Sex and Age in San Saba County
With 14.2% poverty level for males and 14.3% for females among the residents of San Saba County, under 5 year old males and 35 to 44 year old females are the most vulnerable to poverty, with 68 males (63.0%) and 90 females (37.5%) in their respective age groups living below the poverty level.
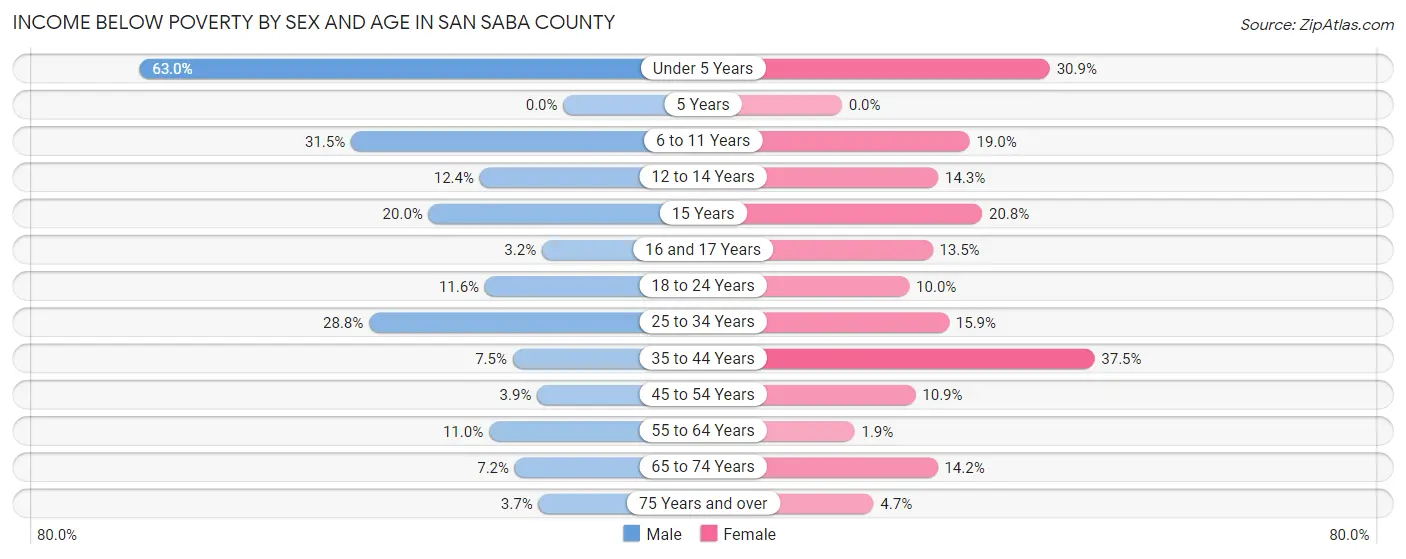
| Age Bracket | Male | Female |
| Under 5 Years | 68 (63.0%) | 42 (30.9%) |
| 5 Years | 0 (0.0%) | 0 (0.0%) |
| 6 to 11 Years | 58 (31.5%) | 41 (19.0%) |
| 12 to 14 Years | 17 (12.4%) | 6 (14.3%) |
| 15 Years | 12 (20.0%) | 5 (20.8%) |
| 16 and 17 Years | 2 (3.2%) | 7 (13.5%) |
| 18 to 24 Years | 34 (11.6%) | 16 (10.0%) |
| 25 to 34 Years | 92 (28.8%) | 31 (15.9%) |
| 35 to 44 Years | 30 (7.5%) | 90 (37.5%) |
| 45 to 54 Years | 9 (3.9%) | 31 (10.9%) |
| 55 to 64 Years | 35 (11.0%) | 7 (1.9%) |
| 65 to 74 Years | 26 (7.2%) | 54 (14.2%) |
| 75 Years and over | 10 (3.7%) | 13 (4.7%) |
| Total | 393 (14.2%) | 343 (14.3%) |
Income Above Poverty by Sex and Age in San Saba County
According to the poverty statistics in San Saba County, males aged 5 years and females aged 5 years are the age groups that are most secure financially, with 100.0% of males and 100.0% of females in these age groups living above the poverty line.
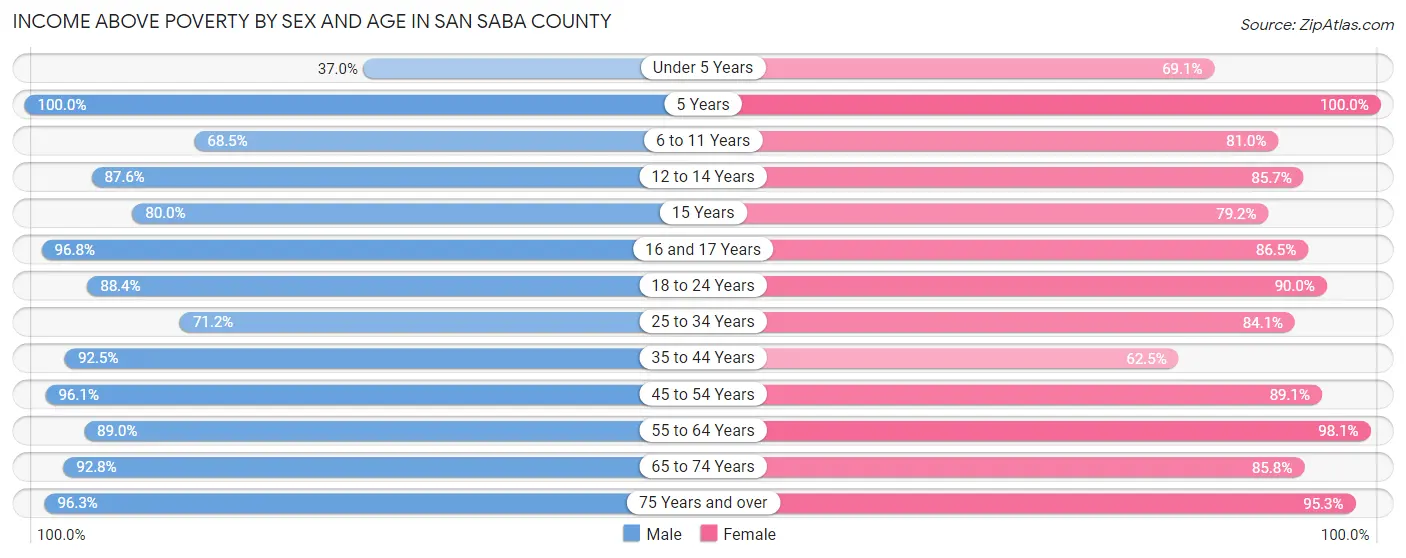
| Age Bracket | Male | Female |
| Under 5 Years | 40 (37.0%) | 94 (69.1%) |
| 5 Years | 13 (100.0%) | 21 (100.0%) |
| 6 to 11 Years | 126 (68.5%) | 175 (81.0%) |
| 12 to 14 Years | 120 (87.6%) | 36 (85.7%) |
| 15 Years | 48 (80.0%) | 19 (79.2%) |
| 16 and 17 Years | 61 (96.8%) | 45 (86.5%) |
| 18 to 24 Years | 258 (88.4%) | 144 (90.0%) |
| 25 to 34 Years | 227 (71.2%) | 164 (84.1%) |
| 35 to 44 Years | 370 (92.5%) | 150 (62.5%) |
| 45 to 54 Years | 223 (96.1%) | 253 (89.1%) |
| 55 to 64 Years | 282 (89.0%) | 363 (98.1%) |
| 65 to 74 Years | 335 (92.8%) | 326 (85.8%) |
| 75 Years and over | 261 (96.3%) | 264 (95.3%) |
| Total | 2,364 (85.8%) | 2,054 (85.7%) |
Income Below Poverty Among Married-Couple Families in San Saba County
The poverty statistics for married-couple families in San Saba County show that 6.3% or 67 of the total 1,071 families live below the poverty line. Families with 3 or 4 children have the highest poverty rate of 18.2%, comprising of 8 families. On the other hand, families with no children have the lowest poverty rate of 2.9%, which includes 21 families.
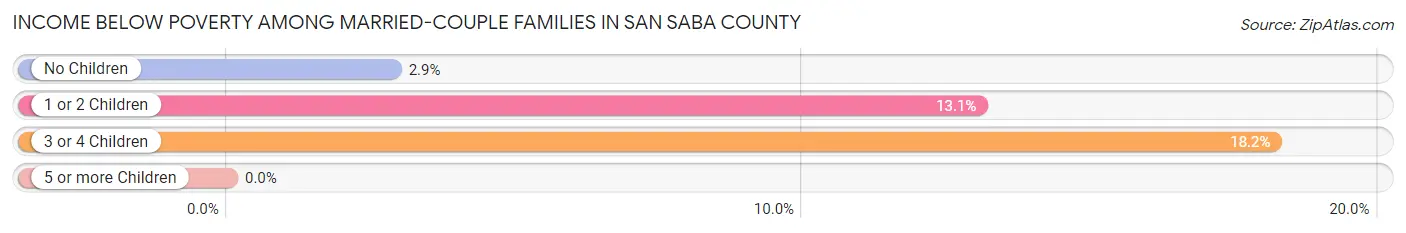
| Children | Above Poverty | Below Poverty |
| No Children | 715 (97.2%) | 21 (2.9%) |
| 1 or 2 Children | 253 (86.9%) | 38 (13.1%) |
| 3 or 4 Children | 36 (81.8%) | 8 (18.2%) |
| 5 or more Children | 0 (0.0%) | 0 (0.0%) |
| Total | 1,004 (93.7%) | 67 (6.3%) |
Income Below Poverty Among Single-Parent Households in San Saba County
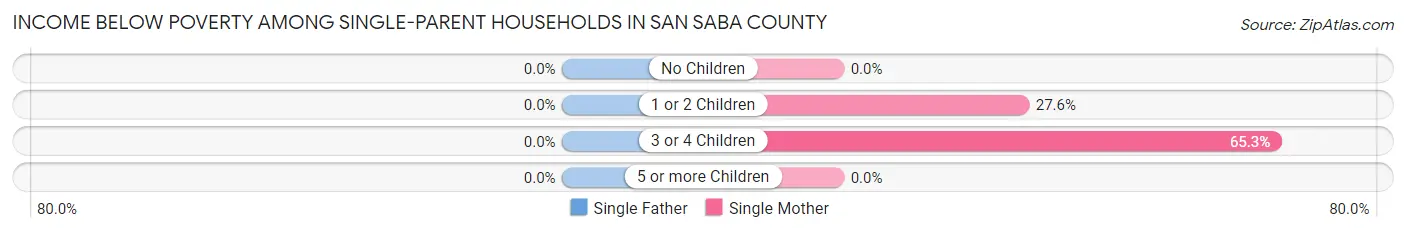
| Children | Single Father | Single Mother |
| No Children | 0 (0.0%) | 0 (0.0%) |
| 1 or 2 Children | 0 (0.0%) | 24 (27.6%) |
| 3 or 4 Children | 0 (0.0%) | 32 (65.3%) |
| 5 or more Children | 0 (0.0%) | 0 (0.0%) |
| Total | 0 (0.0%) | 56 (27.2%) |
Income Below Poverty Among Married-Couple vs Single-Parent Households in San Saba County
The poverty data for San Saba County shows that 67 of the married-couple family households (6.3%) and 56 of the single-parent households (21.4%) are living below the poverty level. Within the married-couple family households, those with 3 or 4 children have the highest poverty rate, with 8 households (18.2%) falling below the poverty line. Among the single-parent households, those with 3 or 4 children have the highest poverty rate, with 32 household (65.3%) living below poverty.
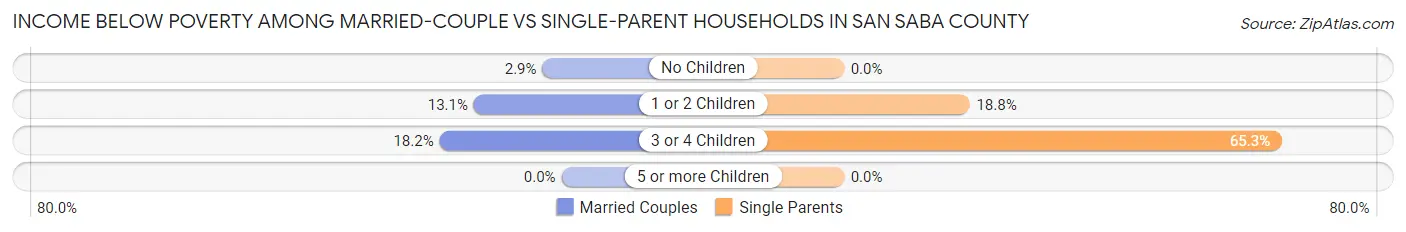
| Children | Married-Couple Families | Single-Parent Households |
| No Children | 21 (2.9%) | 0 (0.0%) |
| 1 or 2 Children | 38 (13.1%) | 24 (18.8%) |
| 3 or 4 Children | 8 (18.2%) | 32 (65.3%) |
| 5 or more Children | 0 (0.0%) | 0 (0.0%) |
| Total | 67 (6.3%) | 56 (21.4%) |
Race in San Saba County
The most populous races in San Saba County are White / Caucasian (4,783 | 82.8%), Hispanic or Latino (1,793 | 31.0%), and Two or more Races (572 | 9.9%).
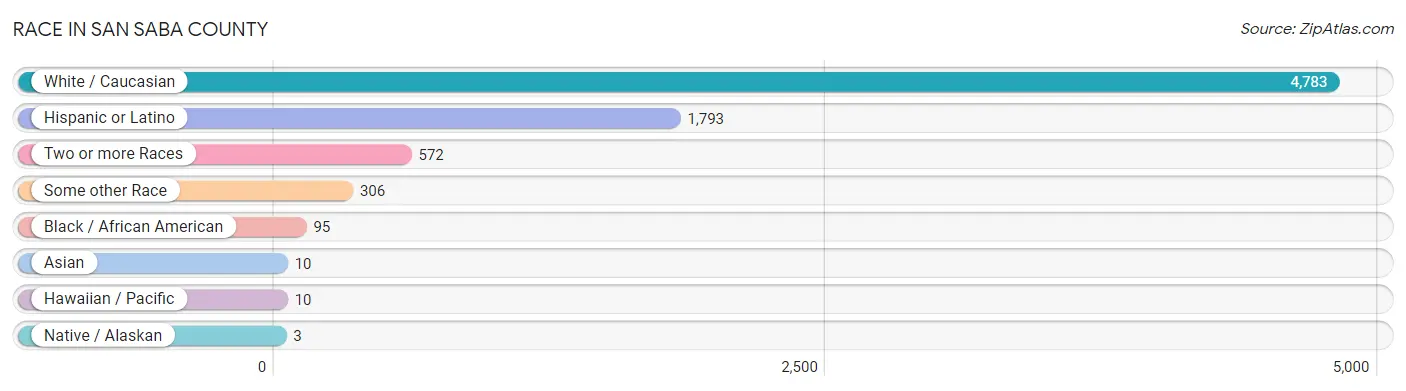
| Race | # Population | % Population |
| Asian | 10 | 0.2% |
| Black / African American | 95 | 1.6% |
| Hawaiian / Pacific | 10 | 0.2% |
| Hispanic or Latino | 1,793 | 31.0% |
| Native / Alaskan | 3 | 0.1% |
| White / Caucasian | 4,783 | 82.8% |
| Two or more Races | 572 | 9.9% |
| Some other Race | 306 | 5.3% |
| Total | 5,779 | 100.0% |
Ancestry in San Saba County
The most populous ancestries reported in San Saba County are Mexican (1,685 | 29.2%), German (841 | 14.5%), Irish (752 | 13.0%), English (653 | 11.3%), and American (304 | 5.3%), together accounting for 73.3% of all San Saba County residents.
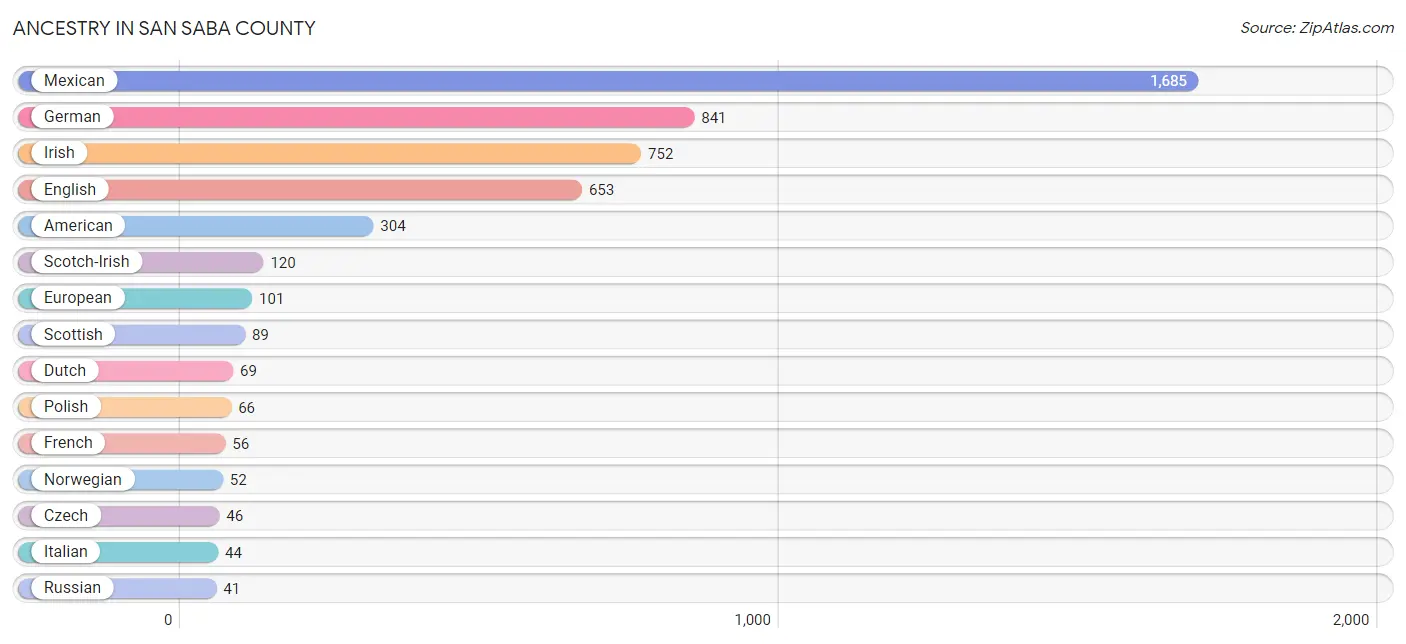
| Ancestry | # Population | % Population |
| African | 9 | 0.2% |
| American | 304 | 5.3% |
| British | 27 | 0.5% |
| Central American | 35 | 0.6% |
| Cherokee | 19 | 0.3% |
| Chickasaw | 23 | 0.4% |
| Comanche | 9 | 0.2% |
| Czech | 46 | 0.8% |
| Dominican | 11 | 0.2% |
| Dutch | 69 | 1.2% |
| English | 653 | 11.3% |
| European | 101 | 1.8% |
| French | 56 | 1.0% |
| German | 841 | 14.5% |
| Honduran | 25 | 0.4% |
| Irish | 752 | 13.0% |
| Iroquois | 3 | 0.1% |
| Italian | 44 | 0.8% |
| Latvian | 17 | 0.3% |
| Mexican | 1,685 | 29.2% |
| Mexican American Indian | 5 | 0.1% |
| Norwegian | 52 | 0.9% |
| Polish | 66 | 1.1% |
| Portuguese | 2 | 0.0% |
| Russian | 41 | 0.7% |
| Salvadoran | 10 | 0.2% |
| Scandinavian | 30 | 0.5% |
| Scotch-Irish | 120 | 2.1% |
| Scottish | 89 | 1.5% |
| Shoshone | 10 | 0.2% |
| Slavic | 8 | 0.1% |
| South American | 7 | 0.1% |
| Spaniard | 2 | 0.0% |
| Spanish | 15 | 0.3% |
| Sri Lankan | 10 | 0.2% |
| Subsaharan African | 9 | 0.2% |
| Swedish | 36 | 0.6% |
| Tongan | 10 | 0.2% |
| Ukrainian | 25 | 0.4% |
| Venezuelan | 7 | 0.1% |
| Welsh | 14 | 0.2% | View All 41 Rows |
Immigrants in San Saba County
The most numerous immigrant groups reported in San Saba County came from Central America (332 | 5.7%), Latin America (332 | 5.7%), Mexico (323 | 5.6%), Asia (10 | 0.2%), and South Eastern Asia (10 | 0.2%), together accounting for 17.4% of all San Saba County residents.
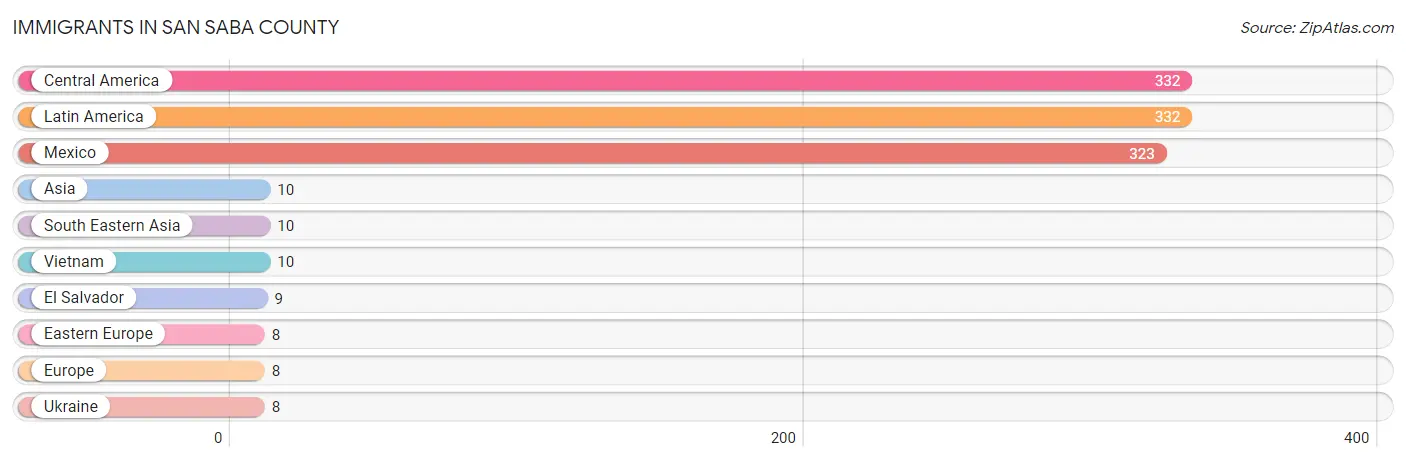
| Immigration Origin | # Population | % Population |
| Asia | 10 | 0.2% |
| Central America | 332 | 5.7% |
| Eastern Europe | 8 | 0.1% |
| El Salvador | 9 | 0.2% |
| Europe | 8 | 0.1% |
| Latin America | 332 | 5.7% |
| Mexico | 323 | 5.6% |
| South Eastern Asia | 10 | 0.2% |
| Ukraine | 8 | 0.1% |
| Vietnam | 10 | 0.2% | View All 10 Rows |
Sex and Age in San Saba County
Sex and Age in San Saba County
The most populous age groups in San Saba County are 40 to 44 Years (304 | 9.9%) for men and 65 to 69 Years (259 | 9.6%) for women.
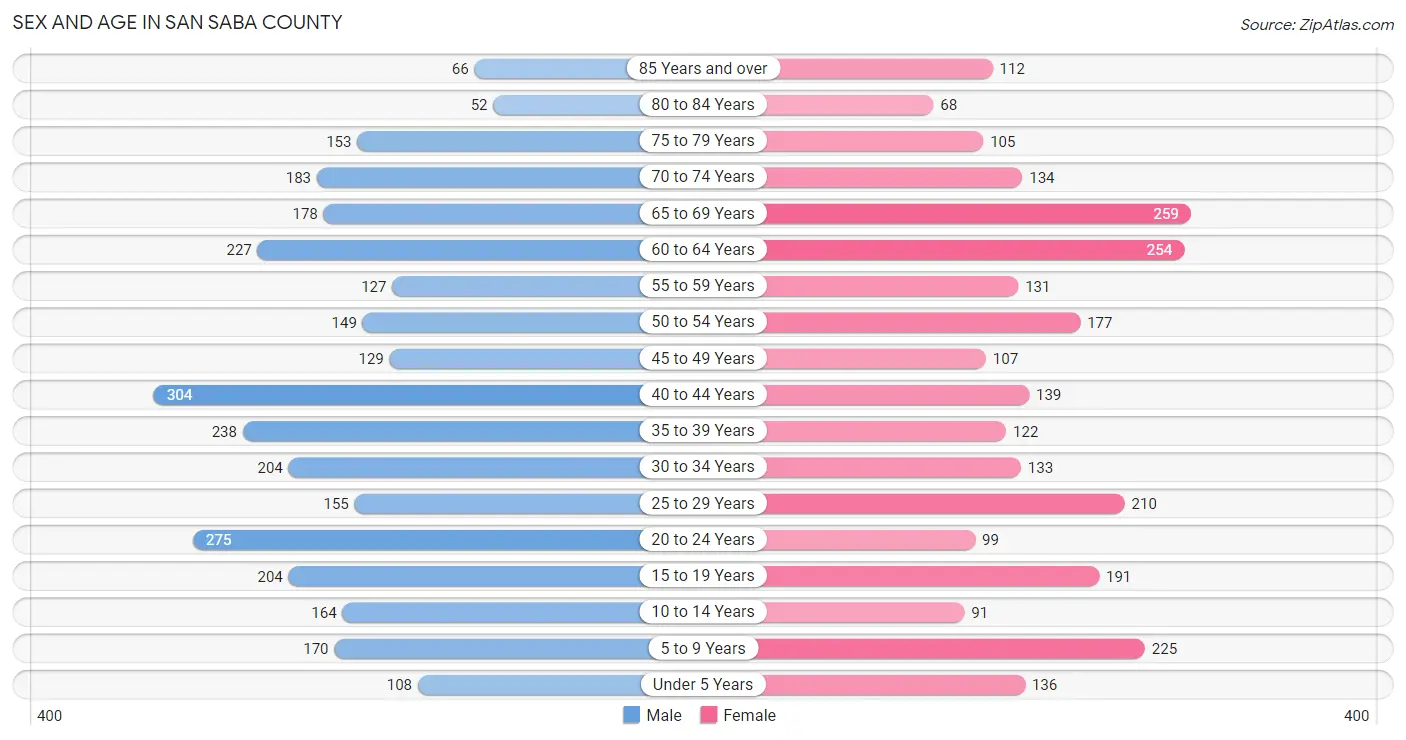
| Age Bracket | Male | Female |
| Under 5 Years | 108 (3.5%) | 136 (5.1%) |
| 5 to 9 Years | 170 (5.5%) | 225 (8.4%) |
| 10 to 14 Years | 164 (5.3%) | 91 (3.4%) |
| 15 to 19 Years | 204 (6.6%) | 191 (7.1%) |
| 20 to 24 Years | 275 (8.9%) | 99 (3.7%) |
| 25 to 29 Years | 155 (5.0%) | 210 (7.8%) |
| 30 to 34 Years | 204 (6.6%) | 133 (4.9%) |
| 35 to 39 Years | 238 (7.7%) | 122 (4.5%) |
| 40 to 44 Years | 304 (9.9%) | 139 (5.2%) |
| 45 to 49 Years | 129 (4.2%) | 107 (4.0%) |
| 50 to 54 Years | 149 (4.8%) | 177 (6.6%) |
| 55 to 59 Years | 127 (4.1%) | 131 (4.9%) |
| 60 to 64 Years | 227 (7.4%) | 254 (9.4%) |
| 65 to 69 Years | 178 (5.8%) | 259 (9.6%) |
| 70 to 74 Years | 183 (5.9%) | 134 (5.0%) |
| 75 to 79 Years | 153 (5.0%) | 105 (3.9%) |
| 80 to 84 Years | 52 (1.7%) | 68 (2.5%) |
| 85 Years and over | 66 (2.1%) | 112 (4.2%) |
| Total | 3,086 (100.0%) | 2,693 (100.0%) |
Families and Households in San Saba County
Median Family Size in San Saba County
The median family size in San Saba County is 3.21 persons per family, with single female/mother families (206 | 15.4%) accounting for the largest median family size of 4.52 persons per family. On the other hand, single male/father families (56 | 4.2%) represent the smallest median family size with 2.39 persons per family.
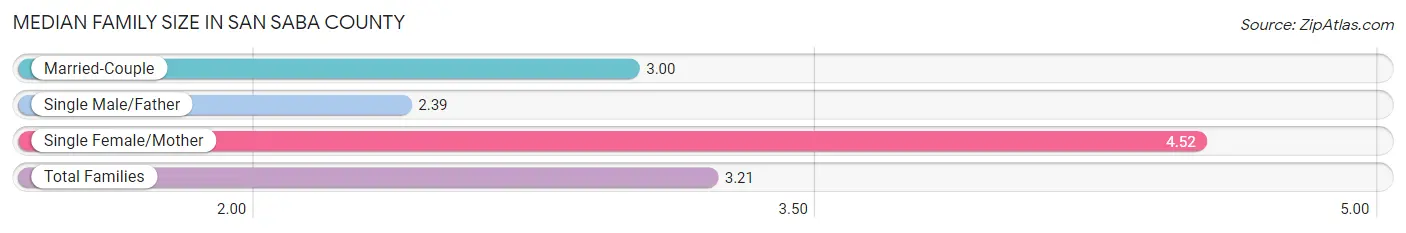
| Family Type | # Families | Family Size |
| Married-Couple | 1,071 (80.3%) | 3.00 |
| Single Male/Father | 56 (4.2%) | 2.39 |
| Single Female/Mother | 206 (15.4%) | 4.52 |
| Total Families | 1,333 (100.0%) | 3.21 |
Median Household Size in San Saba County
The median household size in San Saba County is 2.55 persons per household, with single female/mother households (206 | 10.2%) accounting for the largest median household size of 4.76 persons per household. non-family households (681 | 33.8%) represent the smallest median household size with 1.10 persons per household.
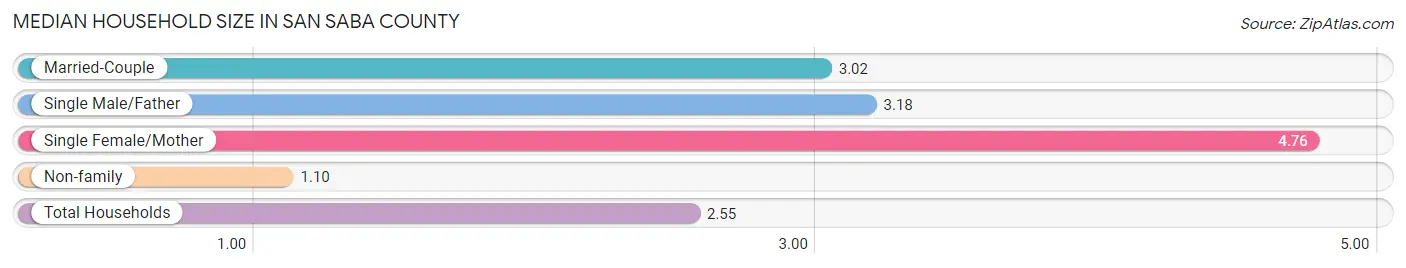
| Household Type | # Households | Household Size |
| Married-Couple | 1,071 (53.2%) | 3.02 |
| Single Male/Father | 56 (2.8%) | 3.18 |
| Single Female/Mother | 206 (10.2%) | 4.76 |
| Non-family | 681 (33.8%) | 1.10 |
| Total Households | 2,014 (100.0%) | 2.55 |
Household Size by Marriage Status in San Saba County
Out of a total of 2,014 households in San Saba County, 1,333 (66.2%) are family households, while 681 (33.8%) are nonfamily households. The most numerous type of family households are 2-person households, comprising 725, and the most common type of nonfamily households are 1-person households, comprising 599.
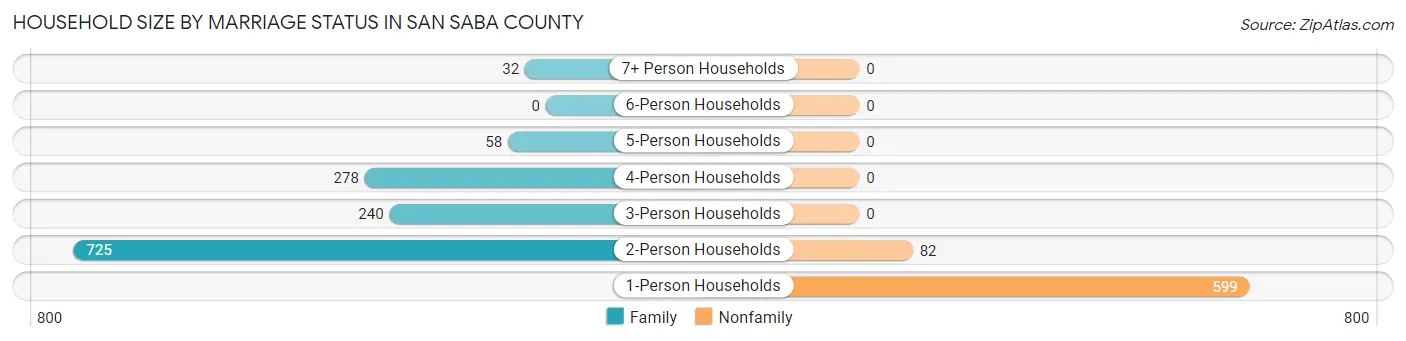
| Household Size | Family Households | Nonfamily Households |
| 1-Person Households | - | 599 (29.7%) |
| 2-Person Households | 725 (36.0%) | 82 (4.1%) |
| 3-Person Households | 240 (11.9%) | 0 (0.0%) |
| 4-Person Households | 278 (13.8%) | 0 (0.0%) |
| 5-Person Households | 58 (2.9%) | 0 (0.0%) |
| 6-Person Households | 0 (0.0%) | 0 (0.0%) |
| 7+ Person Households | 32 (1.6%) | 0 (0.0%) |
| Total | 1,333 (66.2%) | 681 (33.8%) |
Female Fertility in San Saba County
Fertility by Age in San Saba County
Average fertility rate in San Saba County is 73.0 births per 1,000 women. Women in the age bracket of 35 to 50 years have the highest fertility rate with 106.0 births per 1,000 women. Women in the age bracket of 35 to 50 years acount for 56.0% of all women with births.
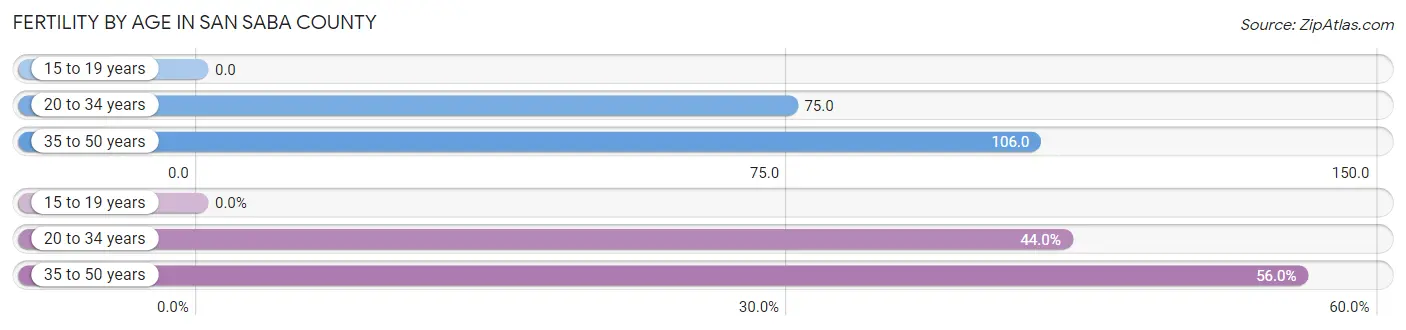
| Age Bracket | Women with Births | Births / 1,000 Women |
| 15 to 19 years | 0 (0.0%) | 0.0 |
| 20 to 34 years | 33 (44.0%) | 75.0 |
| 35 to 50 years | 42 (56.0%) | 106.0 |
| Total | 75 (100.0%) | 73.0 |
Fertility by Age by Marriage Status in San Saba County
72.0% of women with births (75) in San Saba County are married. The highest percentage of unmarried women with births falls into 20 to 34 years age bracket with 63.6% of them unmarried at the time of birth, while the lowest percentage of unmarried women with births belong to 35 to 50 years age bracket with 0.0% of them unmarried.
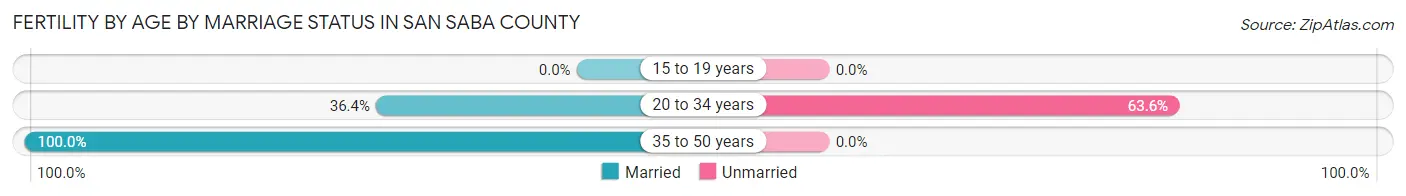
| Age Bracket | Married | Unmarried |
| 15 to 19 years | 0 (0.0%) | 0 (0.0%) |
| 20 to 34 years | 12 (36.4%) | 21 (63.6%) |
| 35 to 50 years | 42 (100.0%) | 0 (0.0%) |
| Total | 54 (72.0%) | 21 (28.0%) |
Fertility by Education in San Saba County
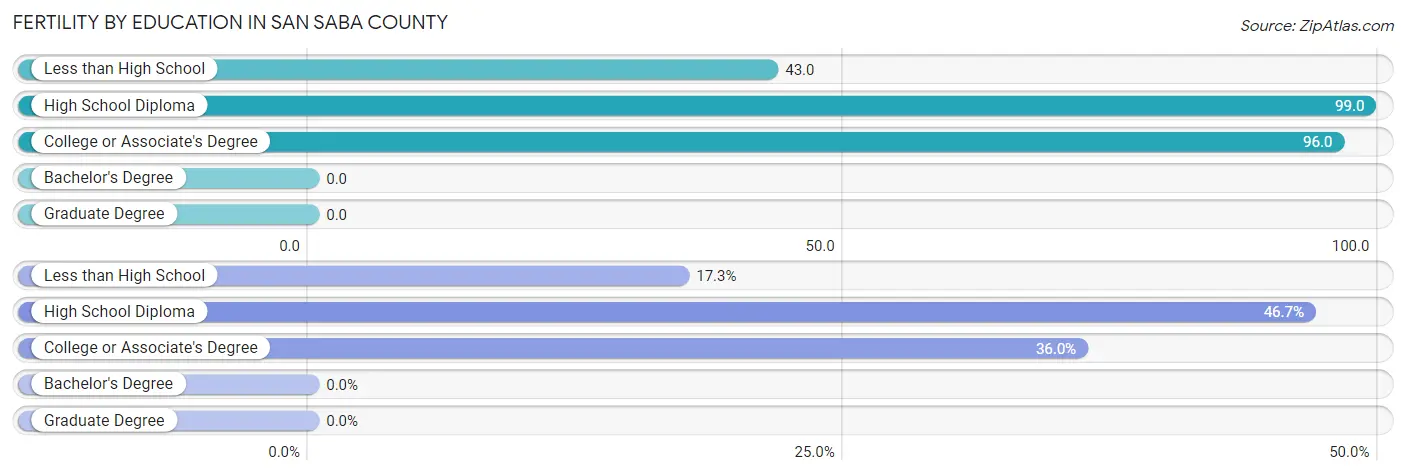
| Educational Attainment | Women with Births | Births / 1,000 Women |
| Less than High School | 13 (17.3%) | 43.0 |
| High School Diploma | 35 (46.7%) | 99.0 |
| College or Associate's Degree | 27 (36.0%) | 96.0 |
| Bachelor's Degree | 0 (0.0%) | 0.0 |
| Graduate Degree | 0 (0.0%) | 0.0 |
| Total | 75 (100.0%) | 73.0 |
Fertility by Education by Marriage Status in San Saba County
28.0% of women with births in San Saba County are unmarried. Women with the educational attainment of less than high school are most likely to be married with 100.0% of them married at childbirth, while women with the educational attainment of college or associate's degree are least likely to be married with 77.8% of them unmarried at childbirth.
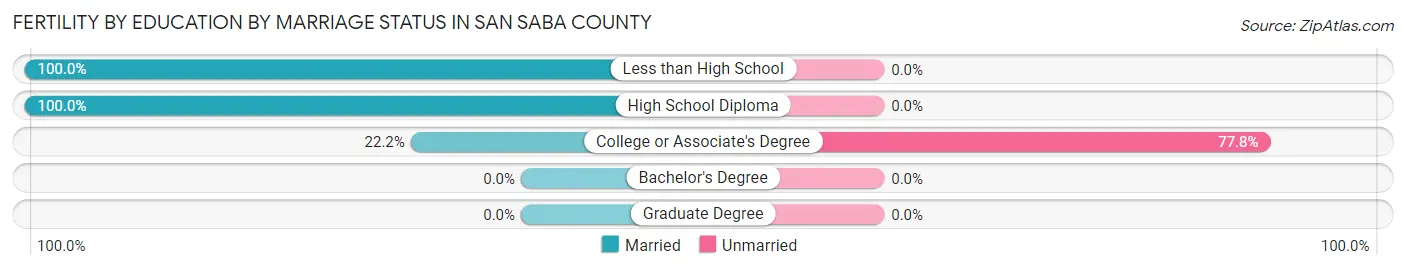
| Educational Attainment | Married | Unmarried |
| Less than High School | 13 (100.0%) | 0 (0.0%) |
| High School Diploma | 35 (100.0%) | 0 (0.0%) |
| College or Associate's Degree | 6 (22.2%) | 21 (77.8%) |
| Bachelor's Degree | 0 (0.0%) | 0 (0.0%) |
| Graduate Degree | 0 (0.0%) | 0 (0.0%) |
| Total | 54 (72.0%) | 21 (28.0%) |
Employment Characteristics in San Saba County
Employment by Class of Employer in San Saba County
Among the 2,312 employed individuals in San Saba County, private company employees (1,187 | 51.3%), self-employed (not incorporated) (353 | 15.3%), and local government employees (276 | 11.9%) make up the most common classes of employment.
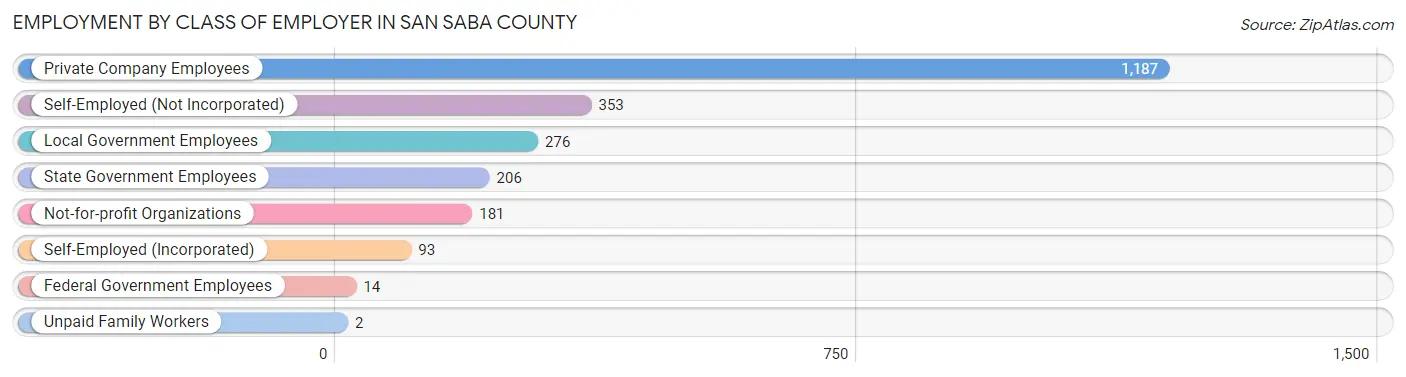
| Employer Class | # Employees | % Employees |
| Private Company Employees | 1,187 | 51.3% |
| Self-Employed (Incorporated) | 93 | 4.0% |
| Self-Employed (Not Incorporated) | 353 | 15.3% |
| Not-for-profit Organizations | 181 | 7.8% |
| Local Government Employees | 276 | 11.9% |
| State Government Employees | 206 | 8.9% |
| Federal Government Employees | 14 | 0.6% |
| Unpaid Family Workers | 2 | 0.1% |
| Total | 2,312 | 100.0% |
Employment Status by Age in San Saba County
According to the labor force statistics for San Saba County, out of the total population over 16 years of age (4,794), 50.4% or 2,416 individuals are in the labor force, with 3.8% or 92 of them unemployed. The age group with the highest labor force participation rate is 30 to 34 years, with 81.6% or 275 individuals in the labor force. Within the labor force, the 16 to 19 years age range has the highest percentage of unemployed individuals, with 14.3% or 13 of them being unemployed.
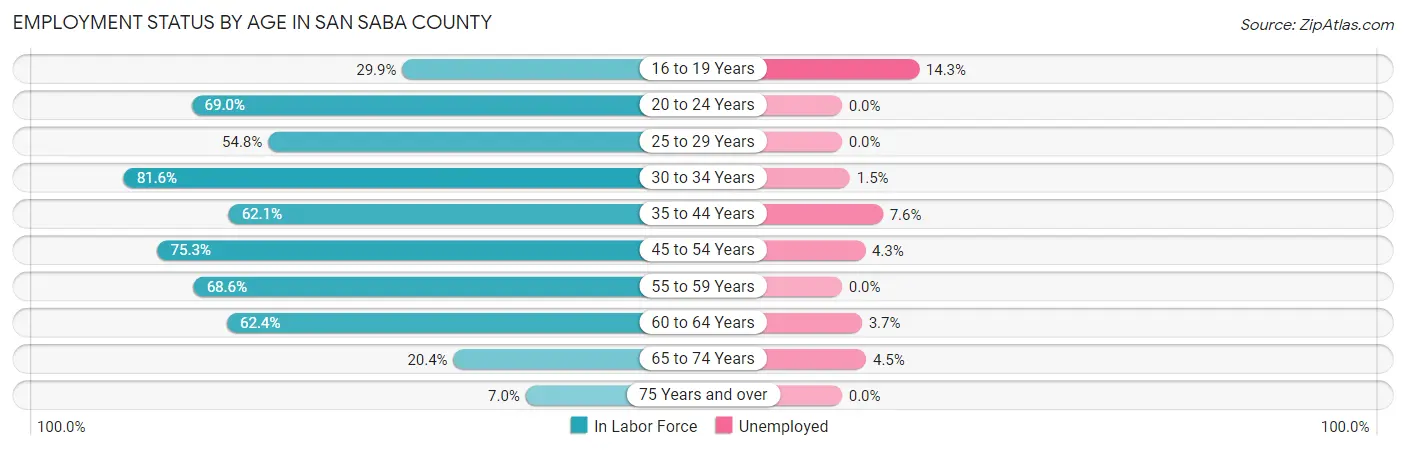
| Age Bracket | In Labor Force | Unemployed |
| 16 to 19 Years | 91 (29.9%) | 13 (14.3%) |
| 20 to 24 Years | 258 (69.0%) | 0 (0.0%) |
| 25 to 29 Years | 200 (54.8%) | 0 (0.0%) |
| 30 to 34 Years | 275 (81.6%) | 4 (1.5%) |
| 35 to 44 Years | 499 (62.1%) | 38 (7.6%) |
| 45 to 54 Years | 423 (75.3%) | 18 (4.3%) |
| 55 to 59 Years | 177 (68.6%) | 0 (0.0%) |
| 60 to 64 Years | 300 (62.4%) | 11 (3.7%) |
| 65 to 74 Years | 154 (20.4%) | 7 (4.5%) |
| 75 Years and over | 39 (7.0%) | 0 (0.0%) |
| Total | 2,416 (50.4%) | 92 (3.8%) |
Employment Status by Educational Attainment in San Saba County
According to labor force statistics for San Saba County, 66.8% of individuals (1,874) out of the total population between 25 and 64 years of age (2,806) are in the labor force, with 3.8% or 71 of them being unemployed. The group with the highest labor force participation rate are those with the educational attainment of bachelor's degree or higher, with 88.6% or 441 individuals in the labor force. Within the labor force, individuals with less than high school education have the highest percentage of unemployment, with 12.4% or 28 of them being unemployed.
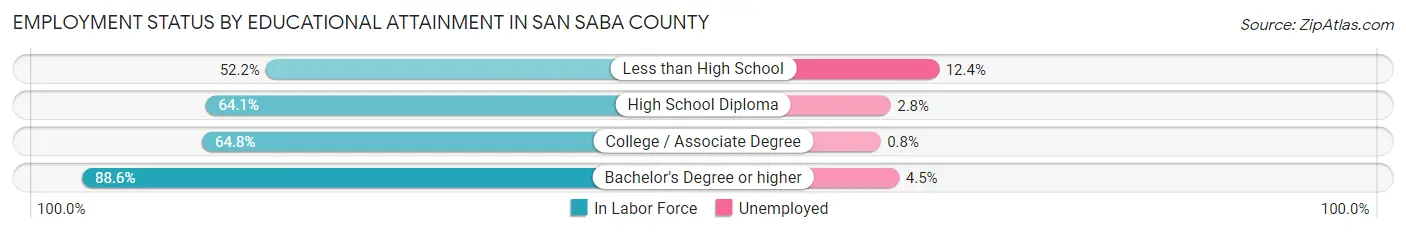
| Educational Attainment | In Labor Force | Unemployed |
| Less than High School | 226 (52.2%) | 54 (12.4%) |
| High School Diploma | 687 (64.1%) | 30 (2.8%) |
| College / Associate Degree | 520 (64.8%) | 6 (0.8%) |
| Bachelor's Degree or higher | 441 (88.6%) | 22 (4.5%) |
| Total | 1,874 (66.8%) | 107 (3.8%) |
Employment Occupations by Sex in San Saba County
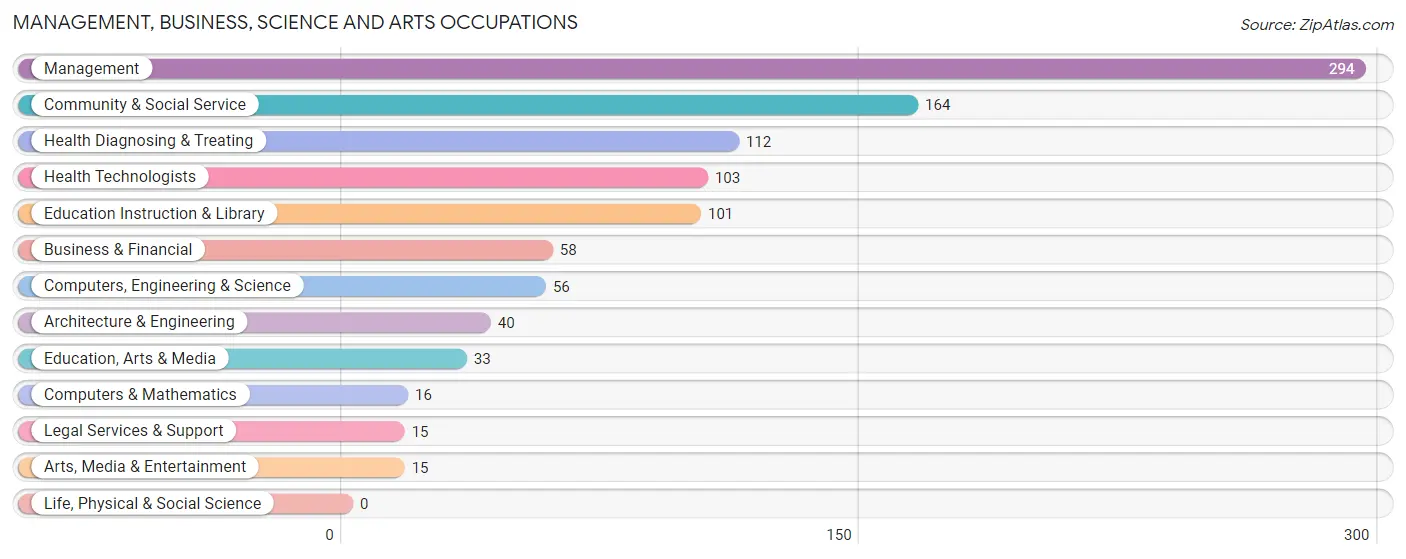
Management, Business, Science and Arts Occupations
The most common Management, Business, Science and Arts occupations in San Saba County are Management (294 | 12.7%), Community & Social Service (164 | 7.0%), Health Diagnosing & Treating (112 | 4.8%), Health Technologists (103 | 4.4%), and Education Instruction & Library (101 | 4.3%).
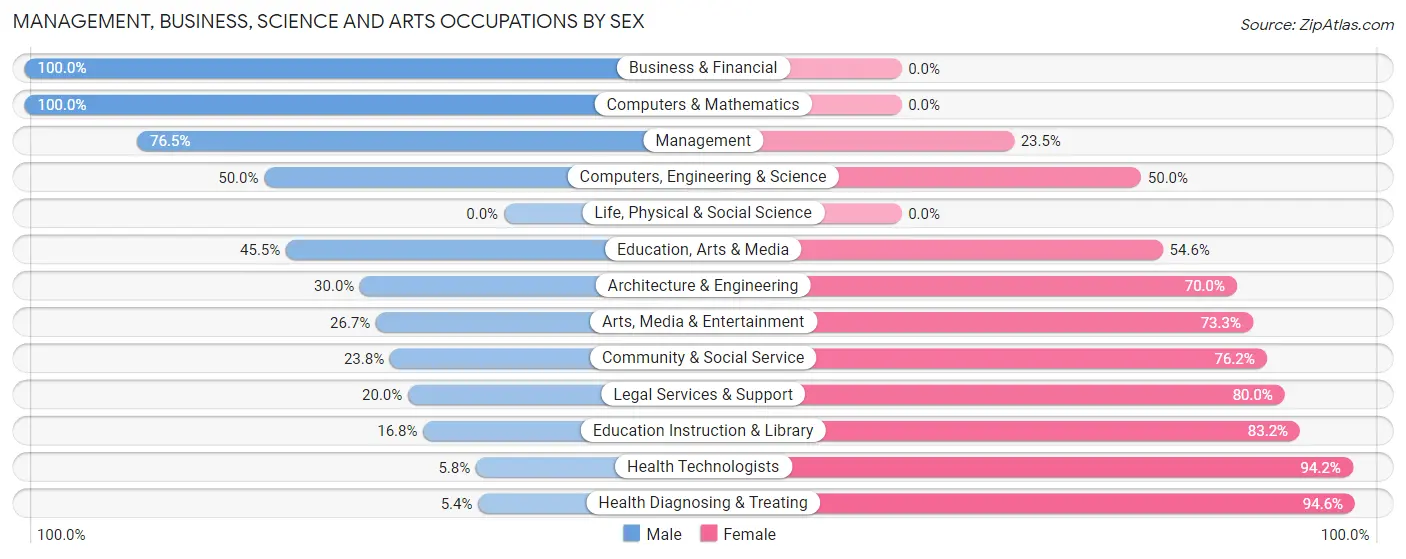
Management, Business, Science and Arts Occupations by Sex
Within the Management, Business, Science and Arts occupations in San Saba County, the most male-oriented occupations are Business & Financial (100.0%), Computers & Mathematics (100.0%), and Management (76.5%), while the most female-oriented occupations are Health Diagnosing & Treating (94.6%), Health Technologists (94.2%), and Education Instruction & Library (83.2%).
| Occupation | Male | Female |
| Management | 225 (76.5%) | 69 (23.5%) |
| Business & Financial | 58 (100.0%) | 0 (0.0%) |
| Computers, Engineering & Science | 28 (50.0%) | 28 (50.0%) |
| Computers & Mathematics | 16 (100.0%) | 0 (0.0%) |
| Architecture & Engineering | 12 (30.0%) | 28 (70.0%) |
| Life, Physical & Social Science | 0 (0.0%) | 0 (0.0%) |
| Community & Social Service | 39 (23.8%) | 125 (76.2%) |
| Education, Arts & Media | 15 (45.5%) | 18 (54.5%) |
| Legal Services & Support | 3 (20.0%) | 12 (80.0%) |
| Education Instruction & Library | 17 (16.8%) | 84 (83.2%) |
| Arts, Media & Entertainment | 4 (26.7%) | 11 (73.3%) |
| Health Diagnosing & Treating | 6 (5.4%) | 106 (94.6%) |
| Health Technologists | 6 (5.8%) | 97 (94.2%) |
| Total (Category) | 356 (52.0%) | 328 (47.9%) |
| Total (Overall) | 1,421 (61.1%) | 904 (38.9%) |
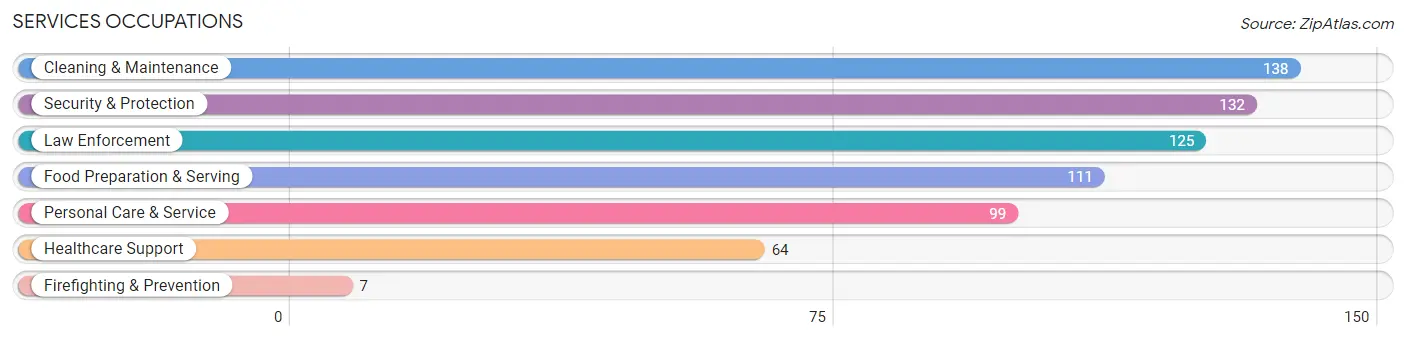
Services Occupations
The most common Services occupations in San Saba County are Cleaning & Maintenance (138 | 5.9%), Security & Protection (132 | 5.7%), Law Enforcement (125 | 5.4%), Food Preparation & Serving (111 | 4.8%), and Personal Care & Service (99 | 4.3%).
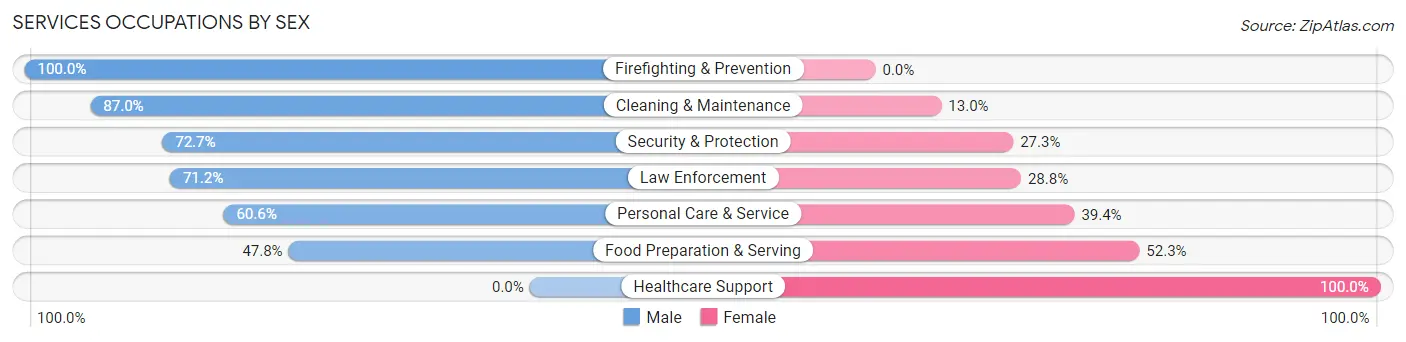
Services Occupations by Sex
Within the Services occupations in San Saba County, the most male-oriented occupations are Firefighting & Prevention (100.0%), Cleaning & Maintenance (87.0%), and Security & Protection (72.7%), while the most female-oriented occupations are Healthcare Support (100.0%), Food Preparation & Serving (52.2%), and Personal Care & Service (39.4%).
| Occupation | Male | Female |
| Healthcare Support | 0 (0.0%) | 64 (100.0%) |
| Security & Protection | 96 (72.7%) | 36 (27.3%) |
| Firefighting & Prevention | 7 (100.0%) | 0 (0.0%) |
| Law Enforcement | 89 (71.2%) | 36 (28.8%) |
| Food Preparation & Serving | 53 (47.7%) | 58 (52.2%) |
| Cleaning & Maintenance | 120 (87.0%) | 18 (13.0%) |
| Personal Care & Service | 60 (60.6%) | 39 (39.4%) |
| Total (Category) | 329 (60.5%) | 215 (39.5%) |
| Total (Overall) | 1,421 (61.1%) | 904 (38.9%) |
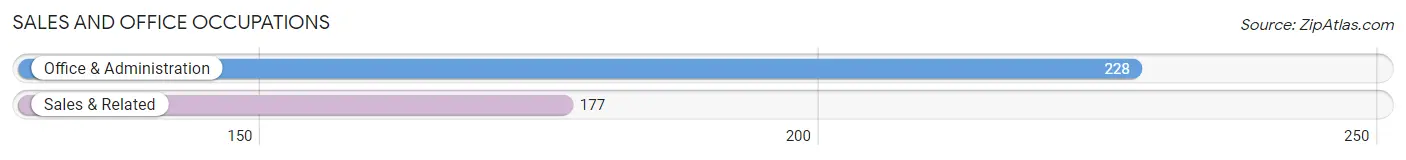
Sales and Office Occupations
The most common Sales and Office occupations in San Saba County are Office & Administration (228 | 9.8%), and Sales & Related (177 | 7.6%).
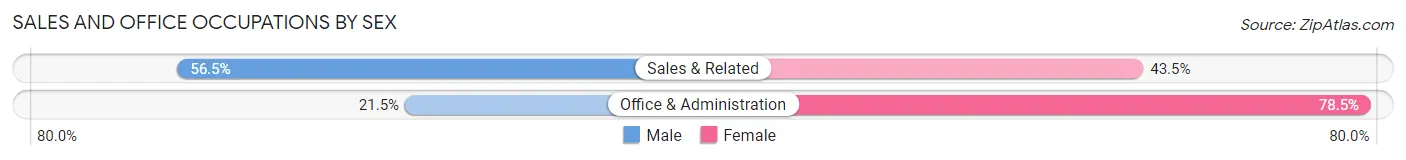
Sales and Office Occupations by Sex
| Occupation | Male | Female |
| Sales & Related | 100 (56.5%) | 77 (43.5%) |
| Office & Administration | 49 (21.5%) | 179 (78.5%) |
| Total (Category) | 149 (36.8%) | 256 (63.2%) |
| Total (Overall) | 1,421 (61.1%) | 904 (38.9%) |
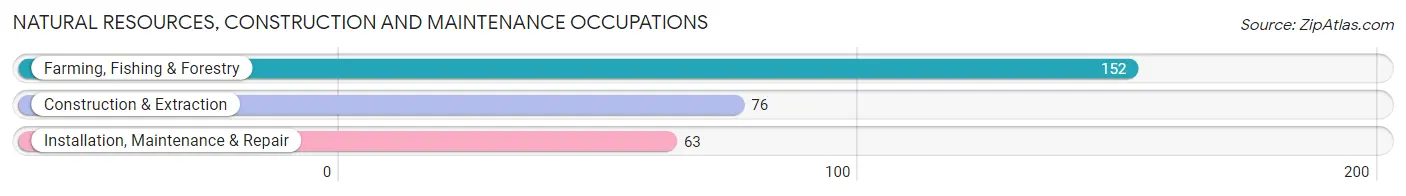
Natural Resources, Construction and Maintenance Occupations
The most common Natural Resources, Construction and Maintenance occupations in San Saba County are Farming, Fishing & Forestry (152 | 6.5%), Construction & Extraction (76 | 3.3%), and Installation, Maintenance & Repair (63 | 2.7%).
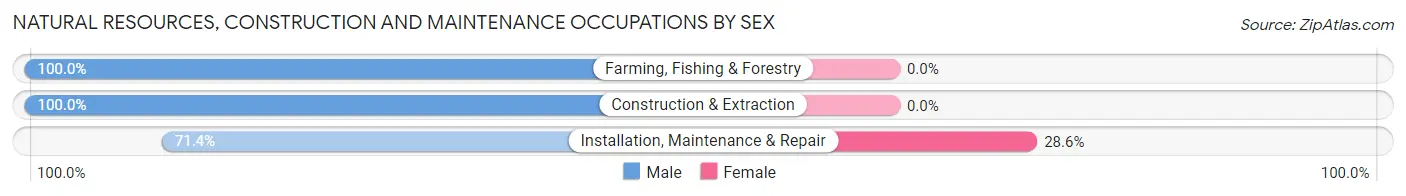
Natural Resources, Construction and Maintenance Occupations by Sex
| Occupation | Male | Female |
| Farming, Fishing & Forestry | 152 (100.0%) | 0 (0.0%) |
| Construction & Extraction | 76 (100.0%) | 0 (0.0%) |
| Installation, Maintenance & Repair | 45 (71.4%) | 18 (28.6%) |
| Total (Category) | 273 (93.8%) | 18 (6.2%) |
| Total (Overall) | 1,421 (61.1%) | 904 (38.9%) |
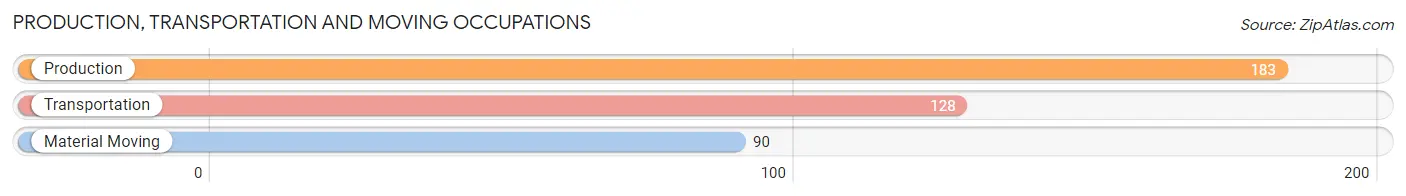
Production, Transportation and Moving Occupations
The most common Production, Transportation and Moving occupations in San Saba County are Production (183 | 7.9%), Transportation (128 | 5.5%), and Material Moving (90 | 3.9%).
Production, Transportation and Moving Occupations by Sex
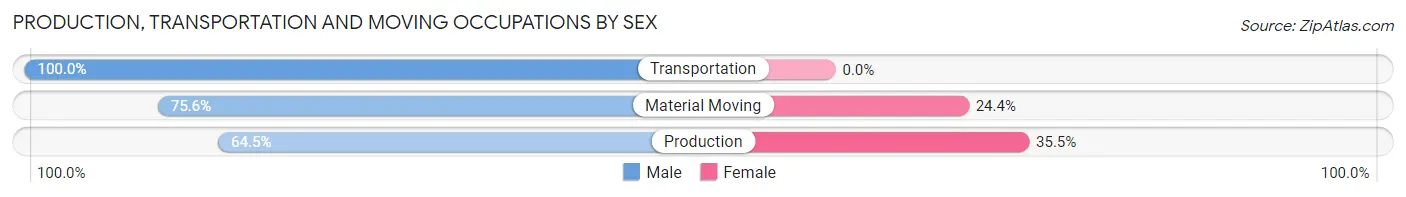
| Occupation | Male | Female |
| Production | 118 (64.5%) | 65 (35.5%) |
| Transportation | 128 (100.0%) | 0 (0.0%) |
| Material Moving | 68 (75.6%) | 22 (24.4%) |
| Total (Category) | 314 (78.3%) | 87 (21.7%) |
| Total (Overall) | 1,421 (61.1%) | 904 (38.9%) |
Employment Industries by Sex in San Saba County
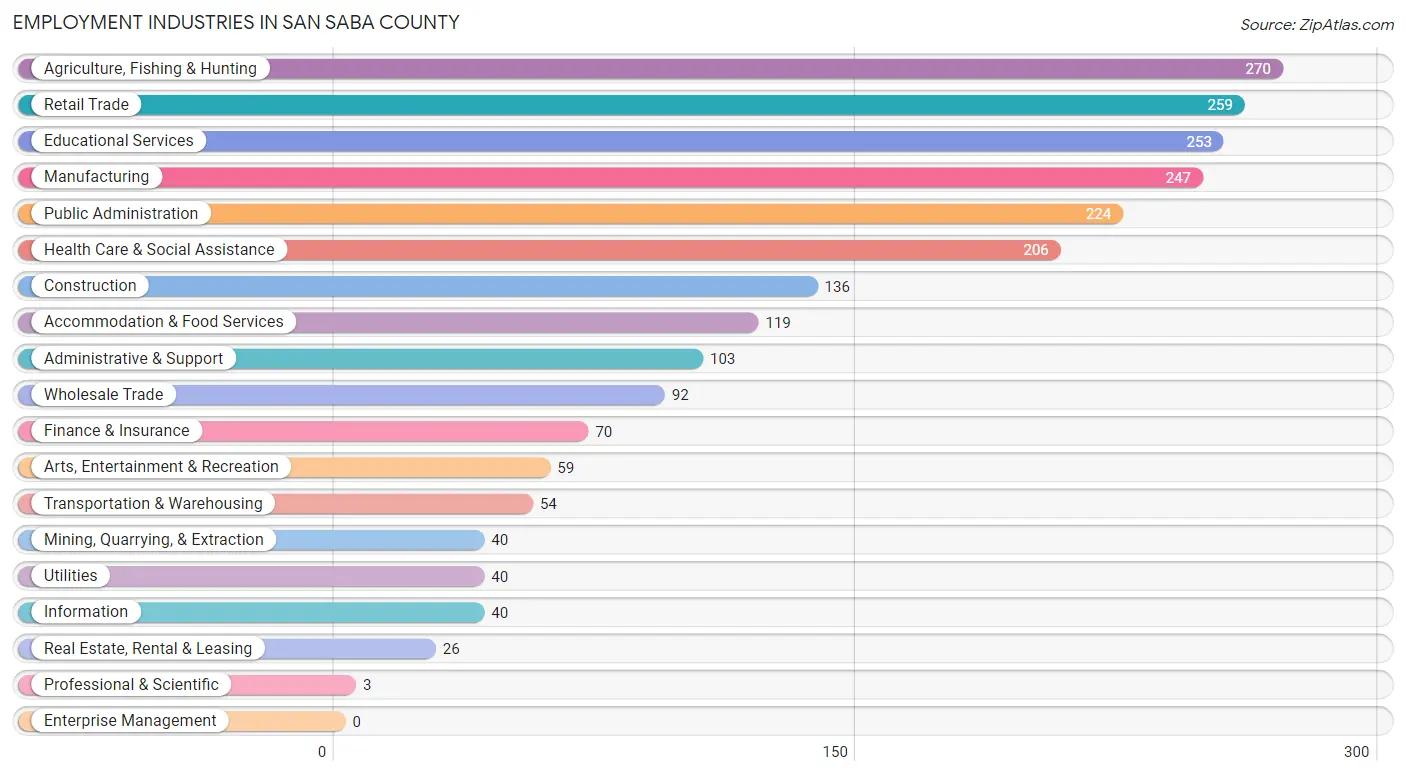
Employment Industries in San Saba County
The major employment industries in San Saba County include Agriculture, Fishing & Hunting (270 | 11.6%), Retail Trade (259 | 11.1%), Educational Services (253 | 10.9%), Manufacturing (247 | 10.6%), and Public Administration (224 | 9.6%).
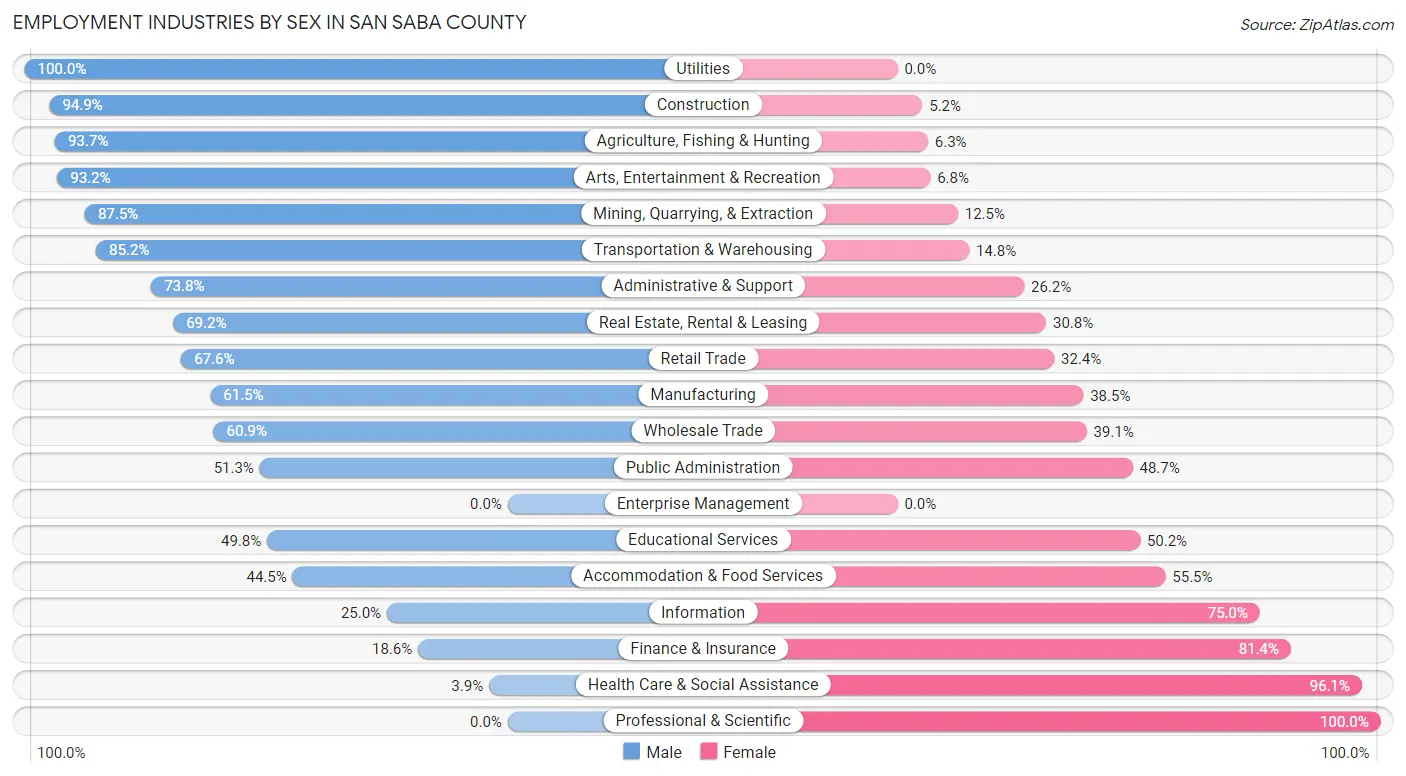
Employment Industries by Sex in San Saba County
The San Saba County industries that see more men than women are Utilities (100.0%), Construction (94.9%), and Agriculture, Fishing & Hunting (93.7%), whereas the industries that tend to have a higher number of women are Professional & Scientific (100.0%), Health Care & Social Assistance (96.1%), and Finance & Insurance (81.4%).
| Industry | Male | Female |
| Agriculture, Fishing & Hunting | 253 (93.7%) | 17 (6.3%) |
| Mining, Quarrying, & Extraction | 35 (87.5%) | 5 (12.5%) |
| Construction | 129 (94.9%) | 7 (5.1%) |
| Manufacturing | 152 (61.5%) | 95 (38.5%) |
| Wholesale Trade | 56 (60.9%) | 36 (39.1%) |
| Retail Trade | 175 (67.6%) | 84 (32.4%) |
| Transportation & Warehousing | 46 (85.2%) | 8 (14.8%) |
| Utilities | 40 (100.0%) | 0 (0.0%) |
| Information | 10 (25.0%) | 30 (75.0%) |
| Finance & Insurance | 13 (18.6%) | 57 (81.4%) |
| Real Estate, Rental & Leasing | 18 (69.2%) | 8 (30.8%) |
| Professional & Scientific | 0 (0.0%) | 3 (100.0%) |
| Enterprise Management | 0 (0.0%) | 0 (0.0%) |
| Administrative & Support | 76 (73.8%) | 27 (26.2%) |
| Educational Services | 126 (49.8%) | 127 (50.2%) |
| Health Care & Social Assistance | 8 (3.9%) | 198 (96.1%) |
| Arts, Entertainment & Recreation | 55 (93.2%) | 4 (6.8%) |
| Accommodation & Food Services | 53 (44.5%) | 66 (55.5%) |
| Public Administration | 115 (51.3%) | 109 (48.7%) |
| Total | 1,421 (61.1%) | 904 (38.9%) |
Education in San Saba County
School Enrollment in San Saba County
The most common levels of schooling among the 1,207 students in San Saba County are high school (448 | 37.1%), elementary school (309 | 25.6%), and middle school (211 | 17.5%).
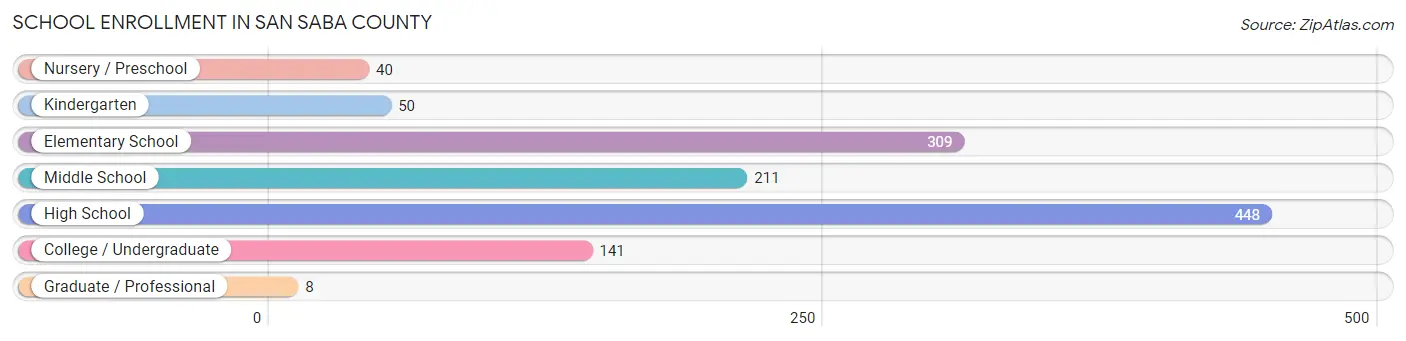
| School Level | # Students | % Students |
| Nursery / Preschool | 40 | 3.3% |
| Kindergarten | 50 | 4.1% |
| Elementary School | 309 | 25.6% |
| Middle School | 211 | 17.5% |
| High School | 448 | 37.1% |
| College / Undergraduate | 141 | 11.7% |
| Graduate / Professional | 8 | 0.7% |
| Total | 1,207 | 100.0% |
School Enrollment by Age by Funding Source in San Saba County
Out of a total of 1,207 students who are enrolled in schools in San Saba County, 87 (7.2%) attend a private institution, while the remaining 1,120 (92.8%) are enrolled in public schools. The age group of 25 to 34 year olds has the highest likelihood of being enrolled in private schools, with 23 (41.8% in the age bracket) enrolled. Conversely, the age group of 3 to 4 year olds has the lowest likelihood of being enrolled in a private school, with 40 (100.0% in the age bracket) attending a public institution.
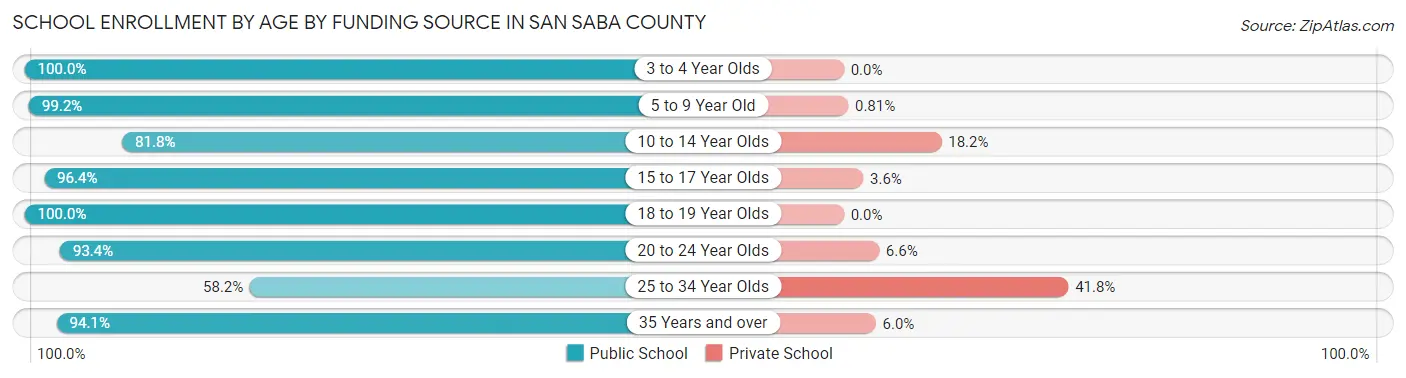
| Age Bracket | Public School | Private School |
| 3 to 4 Year Olds | 40 (100.0%) | 0 (0.0%) |
| 5 to 9 Year Old | 366 (99.2%) | 3 (0.8%) |
| 10 to 14 Year Olds | 198 (81.8%) | 44 (18.2%) |
| 15 to 17 Year Olds | 213 (96.4%) | 8 (3.6%) |
| 18 to 19 Year Olds | 135 (100.0%) | 0 (0.0%) |
| 20 to 24 Year Olds | 57 (93.4%) | 4 (6.6%) |
| 25 to 34 Year Olds | 32 (58.2%) | 23 (41.8%) |
| 35 Years and over | 79 (94.1%) | 5 (5.9%) |
| Total | 1,120 (92.8%) | 87 (7.2%) |
Educational Attainment by Field of Study in San Saba County
Education (241 | 28.5%), bio, nature & agricultural (149 | 17.6%), science & technology (93 | 11.0%), arts & humanities (64 | 7.6%), and business (59 | 7.0%) are the most common fields of study among 845 individuals in San Saba County who have obtained a bachelor's degree or higher.
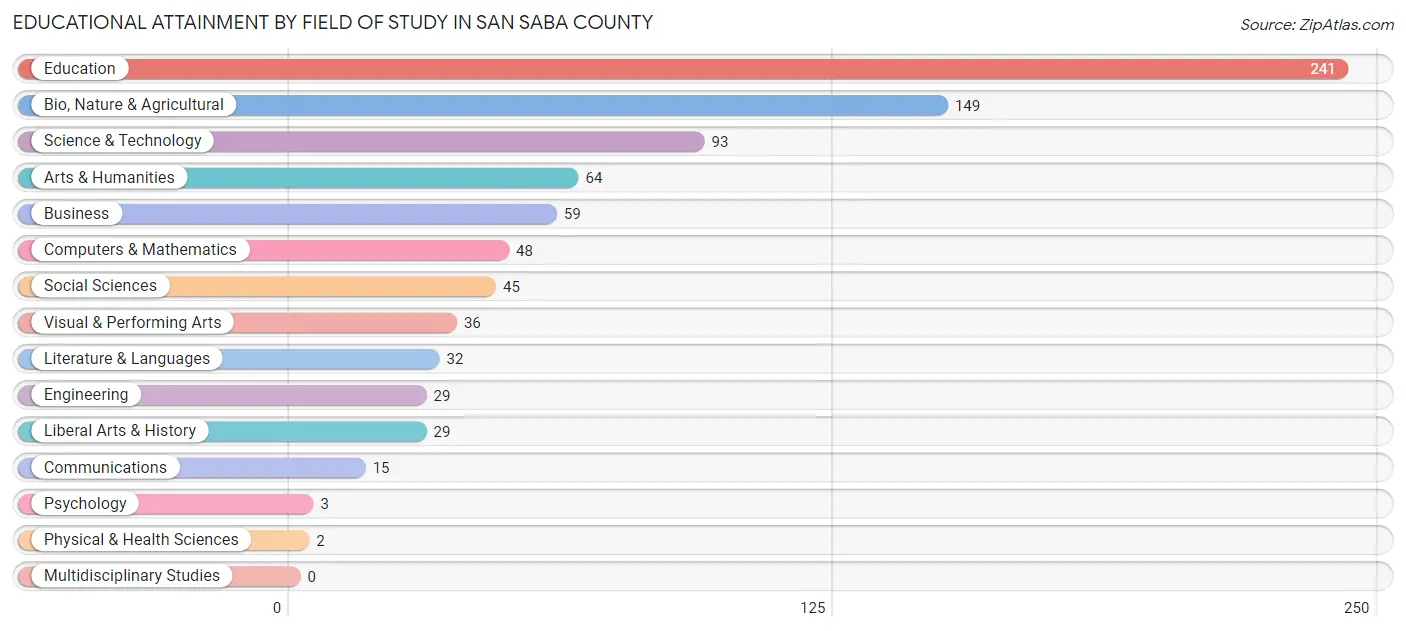
| Field of Study | # Graduates | % Graduates |
| Computers & Mathematics | 48 | 5.7% |
| Bio, Nature & Agricultural | 149 | 17.6% |
| Physical & Health Sciences | 2 | 0.2% |
| Psychology | 3 | 0.4% |
| Social Sciences | 45 | 5.3% |
| Engineering | 29 | 3.4% |
| Multidisciplinary Studies | 0 | 0.0% |
| Science & Technology | 93 | 11.0% |
| Business | 59 | 7.0% |
| Education | 241 | 28.5% |
| Literature & Languages | 32 | 3.8% |
| Liberal Arts & History | 29 | 3.4% |
| Visual & Performing Arts | 36 | 4.3% |
| Communications | 15 | 1.8% |
| Arts & Humanities | 64 | 7.6% |
| Total | 845 | 100.0% |
Transportation & Commute in San Saba County
Vehicle Availability by Sex in San Saba County
The most prevalent vehicle ownership categories in San Saba County are males with 2 vehicles (612, accounting for 43.3%) and females with 2 vehicles (442, making up 69.4%).
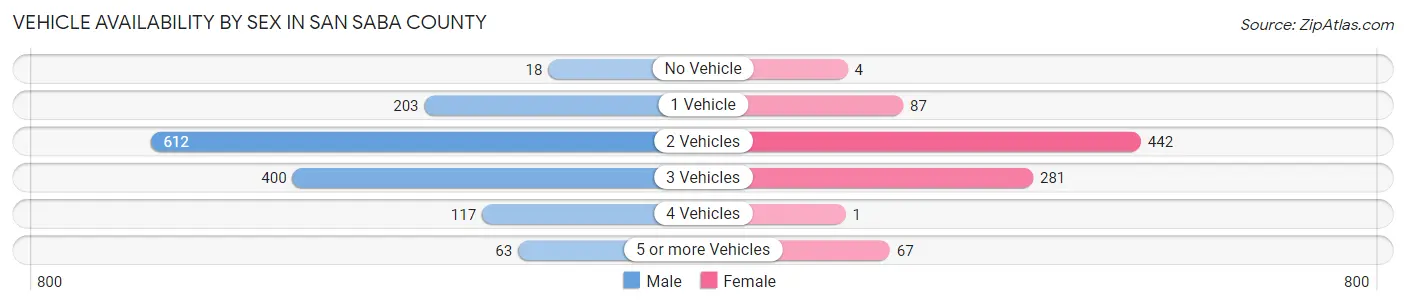
| Vehicles Available | Male | Female |
| No Vehicle | 18 (1.3%) | 4 (0.4%) |
| 1 Vehicle | 203 (14.4%) | 87 (9.9%) |
| 2 Vehicles | 612 (43.3%) | 442 (50.1%) |
| 3 Vehicles | 400 (28.3%) | 281 (31.9%) |
| 4 Vehicles | 117 (8.3%) | 1 (0.1%) |
| 5 or more Vehicles | 63 (4.5%) | 67 (7.6%) |
| Total | 1,413 (100.0%) | 882 (100.0%) |
Commute Time in San Saba County
The most frequently occuring commute durations in San Saba County are 5 to 9 minutes (468 commuters, 21.6%), less than 5 minutes (451 commuters, 20.8%), and 45 to 59 minutes (209 commuters, 9.6%).
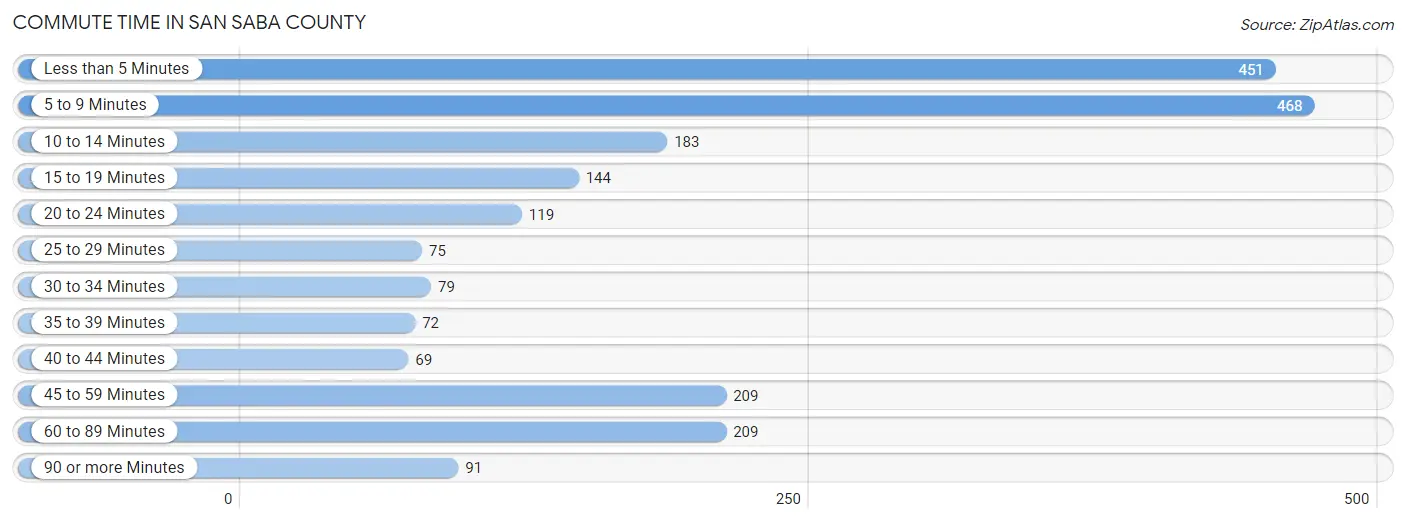
| Commute Time | # Commuters | % Commuters |
| Less than 5 Minutes | 451 | 20.8% |
| 5 to 9 Minutes | 468 | 21.6% |
| 10 to 14 Minutes | 183 | 8.4% |
| 15 to 19 Minutes | 144 | 6.6% |
| 20 to 24 Minutes | 119 | 5.5% |
| 25 to 29 Minutes | 75 | 3.5% |
| 30 to 34 Minutes | 79 | 3.6% |
| 35 to 39 Minutes | 72 | 3.3% |
| 40 to 44 Minutes | 69 | 3.2% |
| 45 to 59 Minutes | 209 | 9.6% |
| 60 to 89 Minutes | 209 | 9.6% |
| 90 or more Minutes | 91 | 4.2% |
Commute Time by Sex in San Saba County
The most common commute times in San Saba County are less than 5 minutes (307 commuters, 22.3%) for males and 5 to 9 minutes (171 commuters, 21.6%) for females.
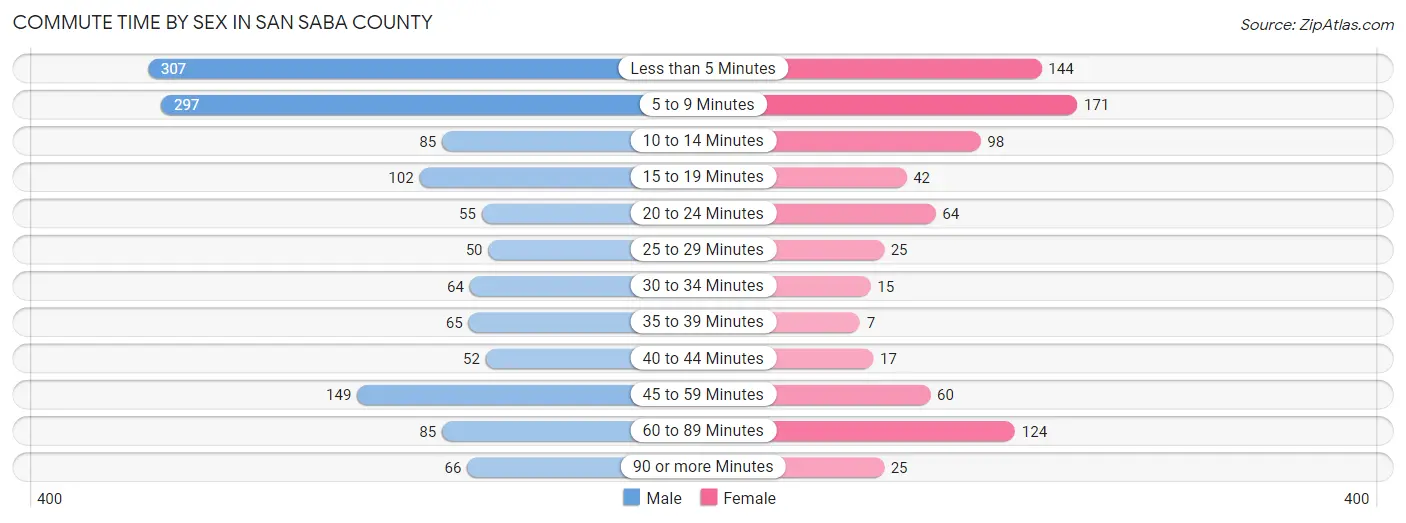
| Commute Time | Male | Female |
| Less than 5 Minutes | 307 (22.3%) | 144 (18.2%) |
| 5 to 9 Minutes | 297 (21.6%) | 171 (21.6%) |
| 10 to 14 Minutes | 85 (6.2%) | 98 (12.4%) |
| 15 to 19 Minutes | 102 (7.4%) | 42 (5.3%) |
| 20 to 24 Minutes | 55 (4.0%) | 64 (8.1%) |
| 25 to 29 Minutes | 50 (3.6%) | 25 (3.2%) |
| 30 to 34 Minutes | 64 (4.6%) | 15 (1.9%) |
| 35 to 39 Minutes | 65 (4.7%) | 7 (0.9%) |
| 40 to 44 Minutes | 52 (3.8%) | 17 (2.1%) |
| 45 to 59 Minutes | 149 (10.8%) | 60 (7.6%) |
| 60 to 89 Minutes | 85 (6.2%) | 124 (15.7%) |
| 90 or more Minutes | 66 (4.8%) | 25 (3.2%) |
Time of Departure to Work by Sex in San Saba County
The most frequent times of departure to work in San Saba County are 7:00 AM to 7:29 AM (299, 21.7%) for males and 7:30 AM to 7:59 AM (159, 20.1%) for females.
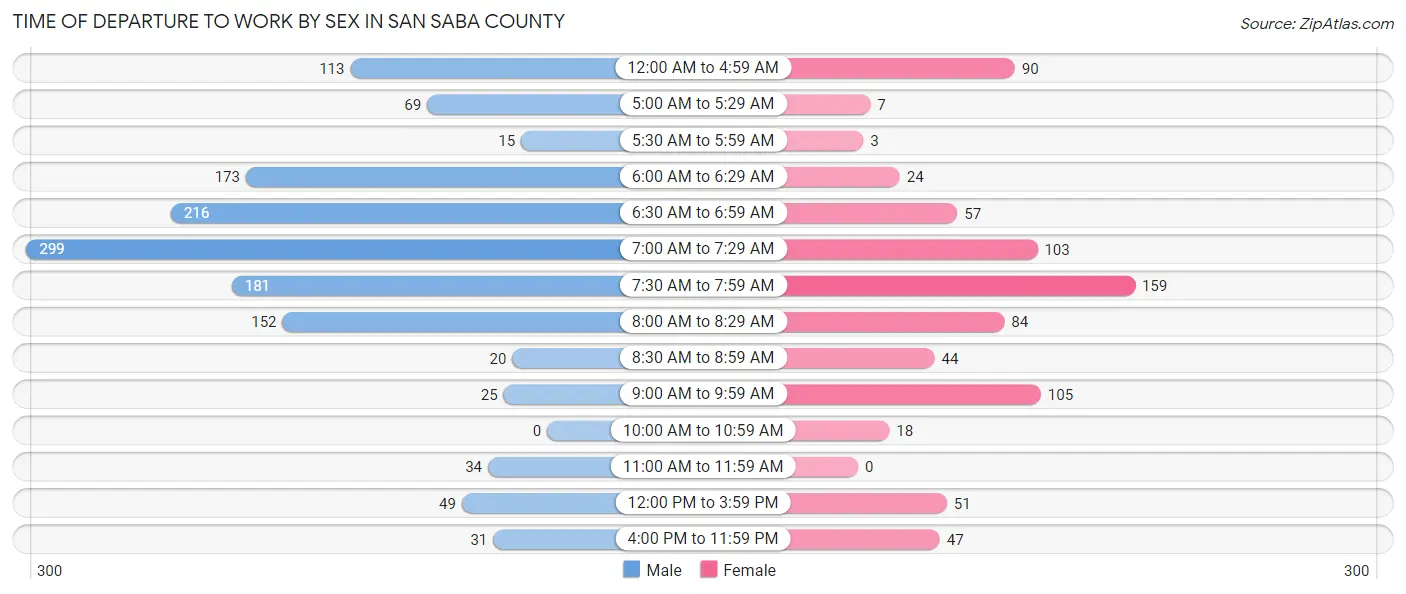
| Time of Departure | Male | Female |
| 12:00 AM to 4:59 AM | 113 (8.2%) | 90 (11.4%) |
| 5:00 AM to 5:29 AM | 69 (5.0%) | 7 (0.9%) |
| 5:30 AM to 5:59 AM | 15 (1.1%) | 3 (0.4%) |
| 6:00 AM to 6:29 AM | 173 (12.6%) | 24 (3.0%) |
| 6:30 AM to 6:59 AM | 216 (15.7%) | 57 (7.2%) |
| 7:00 AM to 7:29 AM | 299 (21.7%) | 103 (13.0%) |
| 7:30 AM to 7:59 AM | 181 (13.1%) | 159 (20.1%) |
| 8:00 AM to 8:29 AM | 152 (11.0%) | 84 (10.6%) |
| 8:30 AM to 8:59 AM | 20 (1.5%) | 44 (5.6%) |
| 9:00 AM to 9:59 AM | 25 (1.8%) | 105 (13.3%) |
| 10:00 AM to 10:59 AM | 0 (0.0%) | 18 (2.3%) |
| 11:00 AM to 11:59 AM | 34 (2.5%) | 0 (0.0%) |
| 12:00 PM to 3:59 PM | 49 (3.6%) | 51 (6.4%) |
| 4:00 PM to 11:59 PM | 31 (2.2%) | 47 (5.9%) |
| Total | 1,377 (100.0%) | 792 (100.0%) |
Housing Occupancy in San Saba County
Occupancy by Ownership in San Saba County
Of the total 2,014 dwellings in San Saba County, owner-occupied units account for 1,532 (76.1%), while renter-occupied units make up 482 (23.9%).
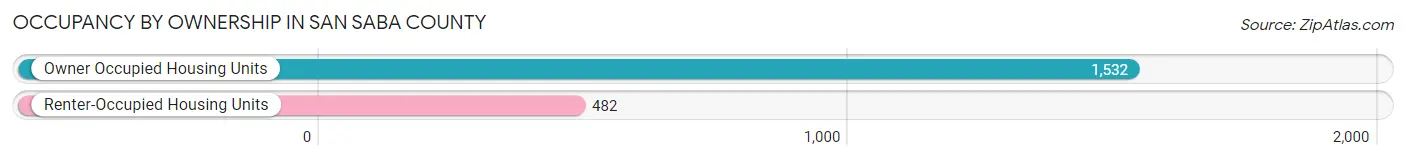
| Occupancy | # Housing Units | % Housing Units |
| Owner Occupied Housing Units | 1,532 | 76.1% |
| Renter-Occupied Housing Units | 482 | 23.9% |
| Total Occupied Housing Units | 2,014 | 100.0% |
Occupancy by Household Size in San Saba County
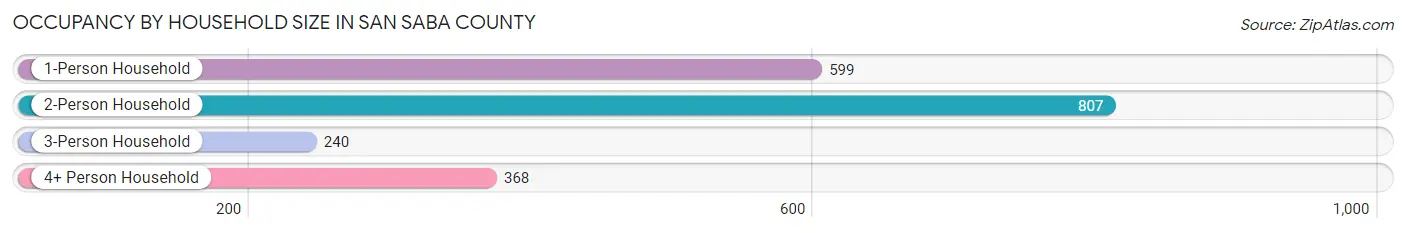
| Household Size | # Housing Units | % Housing Units |
| 1-Person Household | 599 | 29.7% |
| 2-Person Household | 807 | 40.1% |
| 3-Person Household | 240 | 11.9% |
| 4+ Person Household | 368 | 18.3% |
| Total Housing Units | 2,014 | 100.0% |
Occupancy by Ownership by Household Size in San Saba County
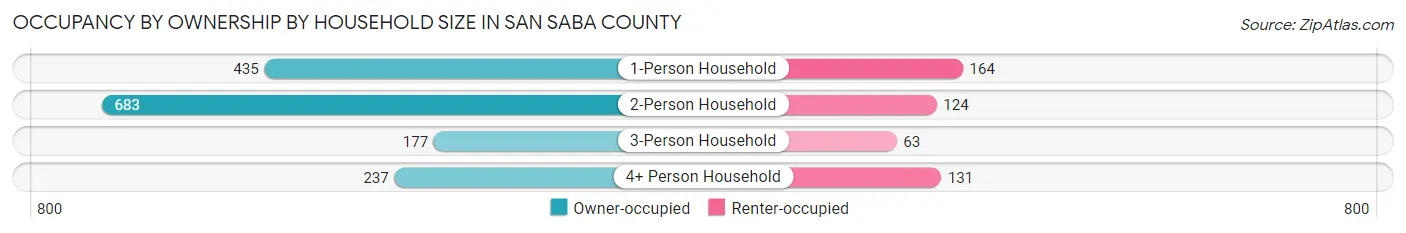
| Household Size | Owner-occupied | Renter-occupied |
| 1-Person Household | 435 (72.6%) | 164 (27.4%) |
| 2-Person Household | 683 (84.6%) | 124 (15.4%) |
| 3-Person Household | 177 (73.8%) | 63 (26.3%) |
| 4+ Person Household | 237 (64.4%) | 131 (35.6%) |
| Total Housing Units | 1,532 (76.1%) | 482 (23.9%) |
Occupancy by Educational Attainment in San Saba County
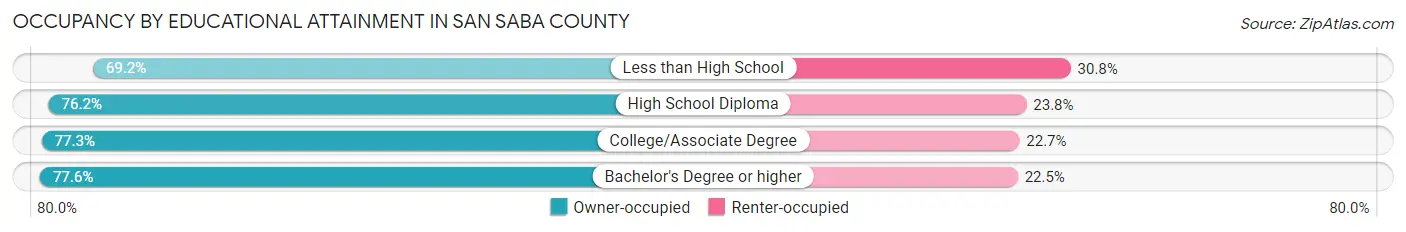
| Household Size | Owner-occupied | Renter-occupied |
| Less than High School | 148 (69.2%) | 66 (30.8%) |
| High School Diploma | 582 (76.2%) | 182 (23.8%) |
| College/Associate Degree | 422 (77.3%) | 124 (22.7%) |
| Bachelor's Degree or higher | 380 (77.5%) | 110 (22.5%) |
Occupancy by Age of Householder in San Saba County
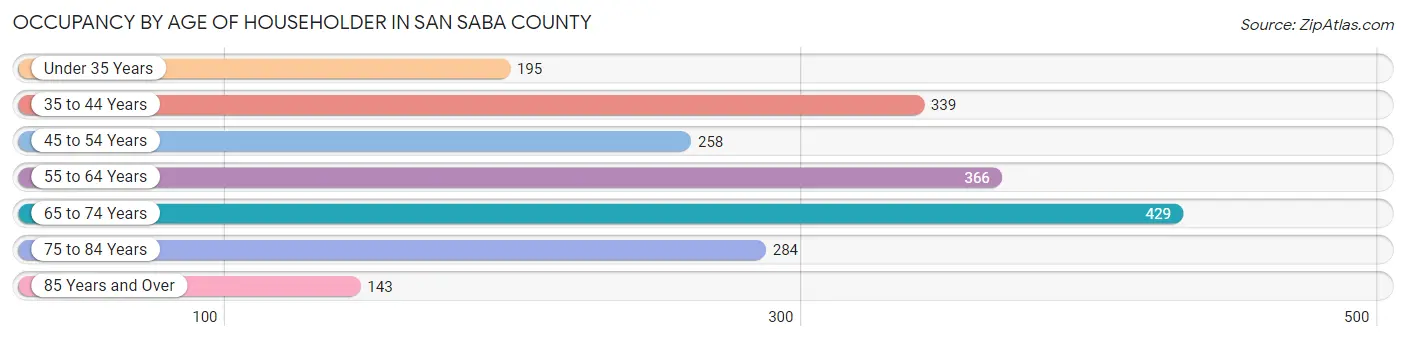
| Age Bracket | # Households | % Households |
| Under 35 Years | 195 | 9.7% |
| 35 to 44 Years | 339 | 16.8% |
| 45 to 54 Years | 258 | 12.8% |
| 55 to 64 Years | 366 | 18.2% |
| 65 to 74 Years | 429 | 21.3% |
| 75 to 84 Years | 284 | 14.1% |
| 85 Years and Over | 143 | 7.1% |
| Total | 2,014 | 100.0% |
Housing Finances in San Saba County
Median Income by Occupancy in San Saba County
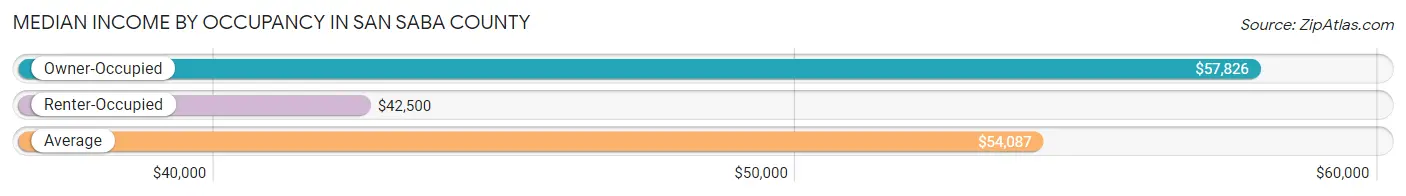
| Occupancy Type | # Households | Median Income |
| Owner-Occupied | 1,532 (76.1%) | $57,826 |
| Renter-Occupied | 482 (23.9%) | $42,500 |
| Average | 2,014 (100.0%) | $54,087 |
Occupancy by Householder Income Bracket in San Saba County
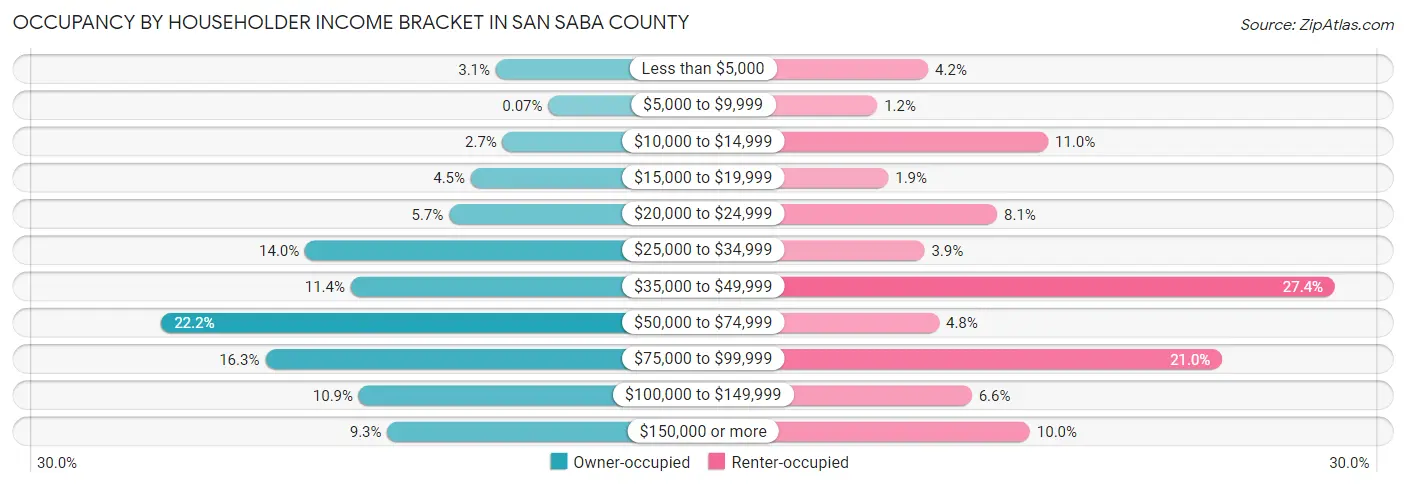
| Income Bracket | Owner-occupied | Renter-occupied |
| Less than $5,000 | 47 (3.1%) | 20 (4.2%) |
| $5,000 to $9,999 | 1 (0.1%) | 6 (1.2%) |
| $10,000 to $14,999 | 41 (2.7%) | 53 (11.0%) |
| $15,000 to $19,999 | 69 (4.5%) | 9 (1.9%) |
| $20,000 to $24,999 | 88 (5.7%) | 39 (8.1%) |
| $25,000 to $34,999 | 214 (14.0%) | 19 (3.9%) |
| $35,000 to $49,999 | 174 (11.4%) | 132 (27.4%) |
| $50,000 to $74,999 | 340 (22.2%) | 23 (4.8%) |
| $75,000 to $99,999 | 249 (16.3%) | 101 (20.9%) |
| $100,000 to $149,999 | 167 (10.9%) | 32 (6.6%) |
| $150,000 or more | 142 (9.3%) | 48 (10.0%) |
| Total | 1,532 (100.0%) | 482 (100.0%) |
Monthly Housing Cost Tiers in San Saba County
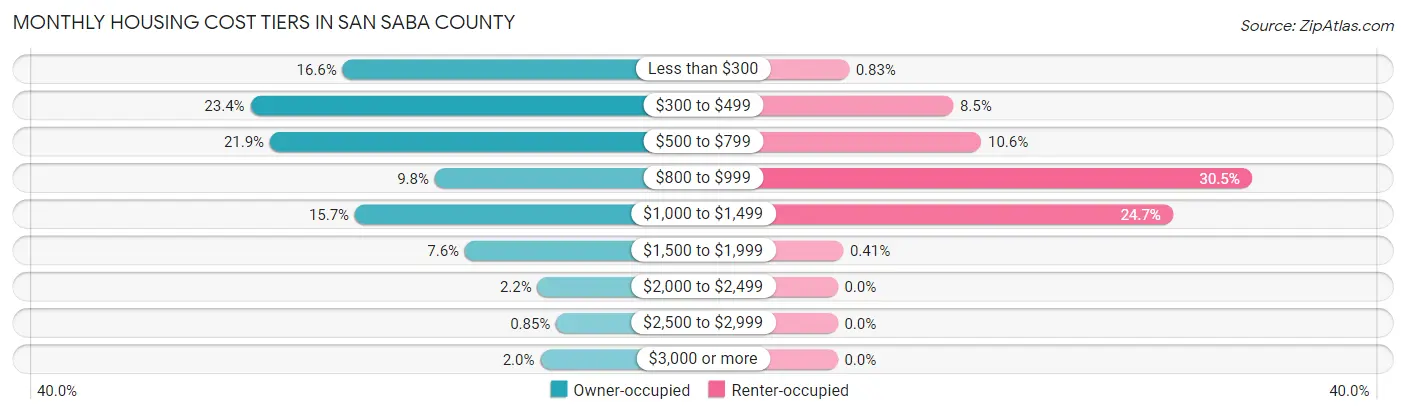
| Monthly Cost | Owner-occupied | Renter-occupied |
| Less than $300 | 254 (16.6%) | 4 (0.8%) |
| $300 to $499 | 358 (23.4%) | 41 (8.5%) |
| $500 to $799 | 336 (21.9%) | 51 (10.6%) |
| $800 to $999 | 150 (9.8%) | 147 (30.5%) |
| $1,000 to $1,499 | 240 (15.7%) | 119 (24.7%) |
| $1,500 to $1,999 | 116 (7.6%) | 2 (0.4%) |
| $2,000 to $2,499 | 34 (2.2%) | 0 (0.0%) |
| $2,500 to $2,999 | 13 (0.9%) | 0 (0.0%) |
| $3,000 or more | 31 (2.0%) | 0 (0.0%) |
| Total | 1,532 (100.0%) | 482 (100.0%) |
Physical Housing Characteristics in San Saba County
Housing Structures in San Saba County
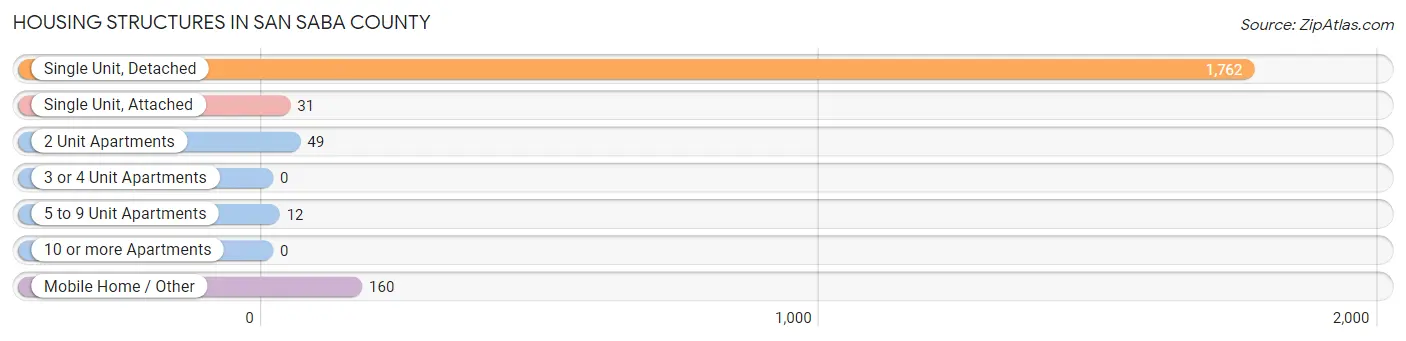
| Structure Type | # Housing Units | % Housing Units |
| Single Unit, Detached | 1,762 | 87.5% |
| Single Unit, Attached | 31 | 1.5% |
| 2 Unit Apartments | 49 | 2.4% |
| 3 or 4 Unit Apartments | 0 | 0.0% |
| 5 to 9 Unit Apartments | 12 | 0.6% |
| 10 or more Apartments | 0 | 0.0% |
| Mobile Home / Other | 160 | 7.9% |
| Total | 2,014 | 100.0% |
Housing Structures by Occupancy in San Saba County
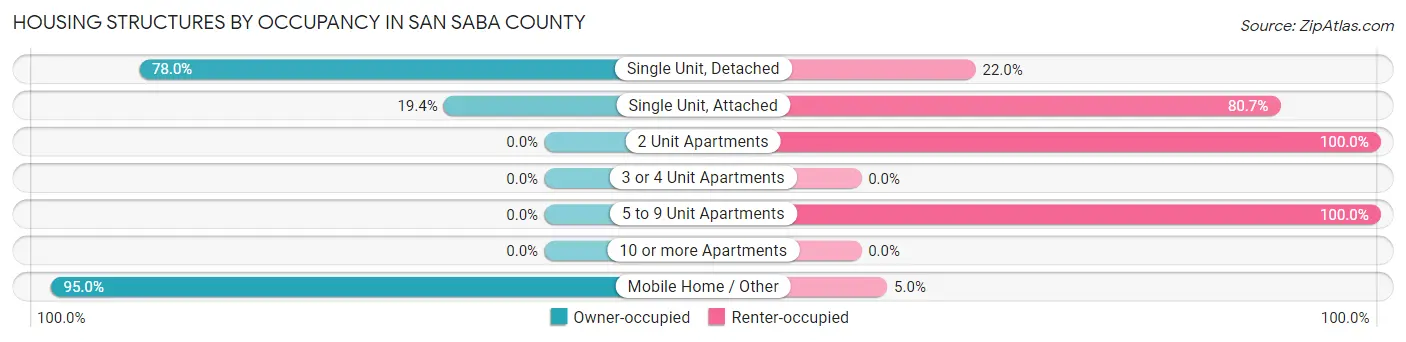
| Structure Type | Owner-occupied | Renter-occupied |
| Single Unit, Detached | 1,374 (78.0%) | 388 (22.0%) |
| Single Unit, Attached | 6 (19.4%) | 25 (80.6%) |
| 2 Unit Apartments | 0 (0.0%) | 49 (100.0%) |
| 3 or 4 Unit Apartments | 0 (0.0%) | 0 (0.0%) |
| 5 to 9 Unit Apartments | 0 (0.0%) | 12 (100.0%) |
| 10 or more Apartments | 0 (0.0%) | 0 (0.0%) |
| Mobile Home / Other | 152 (95.0%) | 8 (5.0%) |
| Total | 1,532 (76.1%) | 482 (23.9%) |
Housing Structures by Number of Rooms in San Saba County
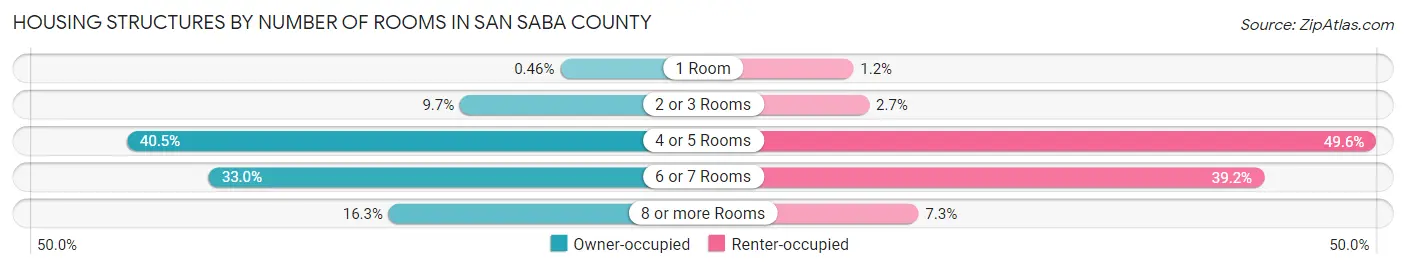
| Number of Rooms | Owner-occupied | Renter-occupied |
| 1 Room | 7 (0.5%) | 6 (1.2%) |
| 2 or 3 Rooms | 149 (9.7%) | 13 (2.7%) |
| 4 or 5 Rooms | 621 (40.5%) | 239 (49.6%) |
| 6 or 7 Rooms | 505 (33.0%) | 189 (39.2%) |
| 8 or more Rooms | 250 (16.3%) | 35 (7.3%) |
| Total | 1,532 (100.0%) | 482 (100.0%) |
Housing Structure by Heating Type in San Saba County
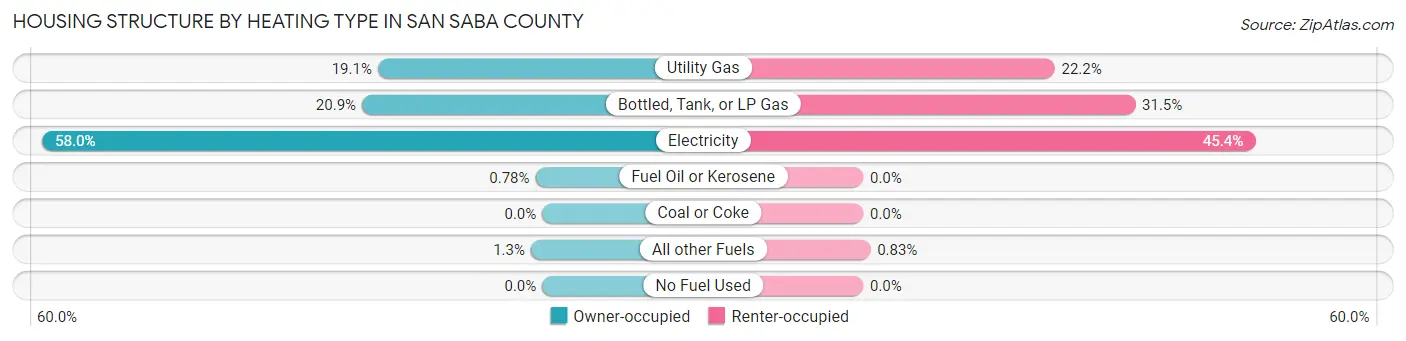
| Heating Type | Owner-occupied | Renter-occupied |
| Utility Gas | 292 (19.1%) | 107 (22.2%) |
| Bottled, Tank, or LP Gas | 320 (20.9%) | 152 (31.5%) |
| Electricity | 888 (58.0%) | 219 (45.4%) |
| Fuel Oil or Kerosene | 12 (0.8%) | 0 (0.0%) |
| Coal or Coke | 0 (0.0%) | 0 (0.0%) |
| All other Fuels | 20 (1.3%) | 4 (0.8%) |
| No Fuel Used | 0 (0.0%) | 0 (0.0%) |
| Total | 1,532 (100.0%) | 482 (100.0%) |
Household Vehicle Usage in San Saba County
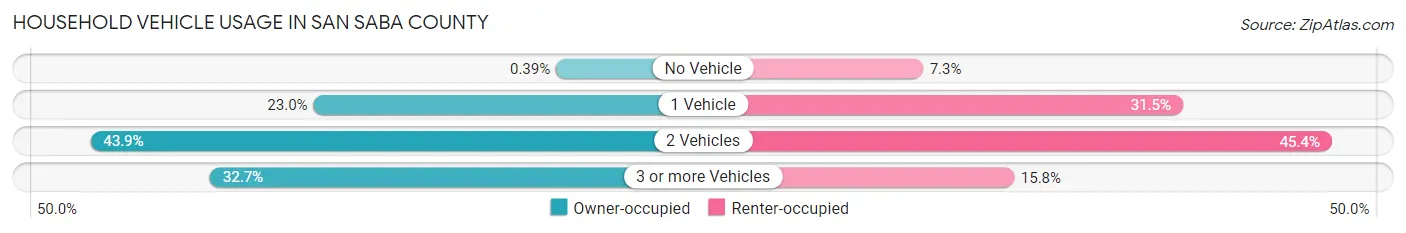
| Vehicles per Household | Owner-occupied | Renter-occupied |
| No Vehicle | 6 (0.4%) | 35 (7.3%) |
| 1 Vehicle | 353 (23.0%) | 152 (31.5%) |
| 2 Vehicles | 672 (43.9%) | 219 (45.4%) |
| 3 or more Vehicles | 501 (32.7%) | 76 (15.8%) |
| Total | 1,532 (100.0%) | 482 (100.0%) |
Real Estate & Mortgages in San Saba County
Real Estate and Mortgage Overview in San Saba County
| Characteristic | Without Mortgage | With Mortgage |
| Housing Units | 1,049 | 483 |
| Median Property Value | $117,000 | $148,000 |
| Median Household Income | $53,139 | $48 |
| Monthly Housing Costs | $466 | $31 |
| Real Estate Taxes | $1,397 | $0 |
Property Value by Mortgage Status in San Saba County
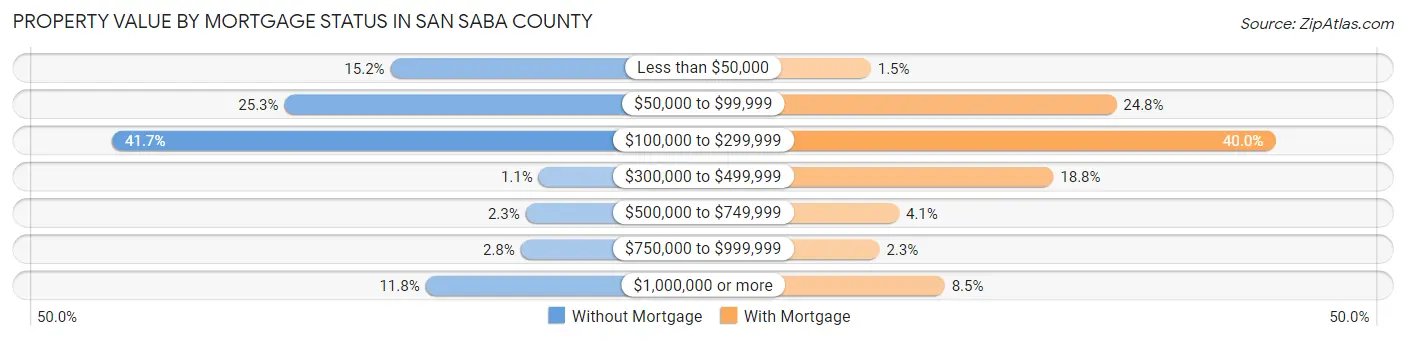
| Property Value | Without Mortgage | With Mortgage |
| Less than $50,000 | 159 (15.2%) | 7 (1.5%) |
| $50,000 to $99,999 | 265 (25.3%) | 120 (24.8%) |
| $100,000 to $299,999 | 437 (41.7%) | 193 (40.0%) |
| $300,000 to $499,999 | 11 (1.1%) | 91 (18.8%) |
| $500,000 to $749,999 | 24 (2.3%) | 20 (4.1%) |
| $750,000 to $999,999 | 29 (2.8%) | 11 (2.3%) |
| $1,000,000 or more | 124 (11.8%) | 41 (8.5%) |
| Total | 1,049 (100.0%) | 483 (100.0%) |
Household Income by Mortgage Status in San Saba County
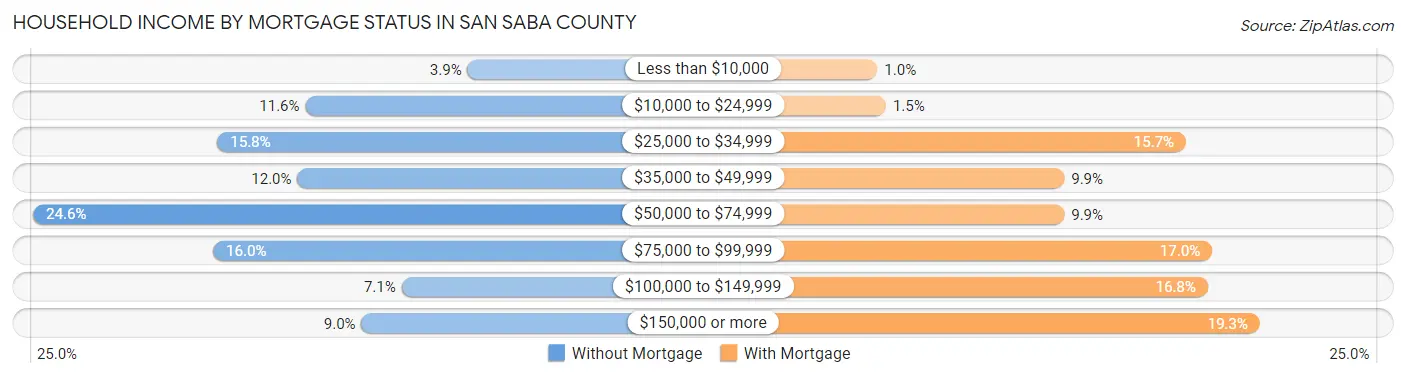
| Household Income | Without Mortgage | With Mortgage |
| Less than $10,000 | 41 (3.9%) | 5 (1.0%) |
| $10,000 to $24,999 | 122 (11.6%) | 7 (1.5%) |
| $25,000 to $34,999 | 166 (15.8%) | 76 (15.7%) |
| $35,000 to $49,999 | 126 (12.0%) | 48 (9.9%) |
| $50,000 to $74,999 | 258 (24.6%) | 48 (9.9%) |
| $75,000 to $99,999 | 168 (16.0%) | 82 (17.0%) |
| $100,000 to $149,999 | 74 (7.0%) | 81 (16.8%) |
| $150,000 or more | 94 (9.0%) | 93 (19.3%) |
| Total | 1,049 (100.0%) | 483 (100.0%) |
Property Value to Household Income Ratio in San Saba County
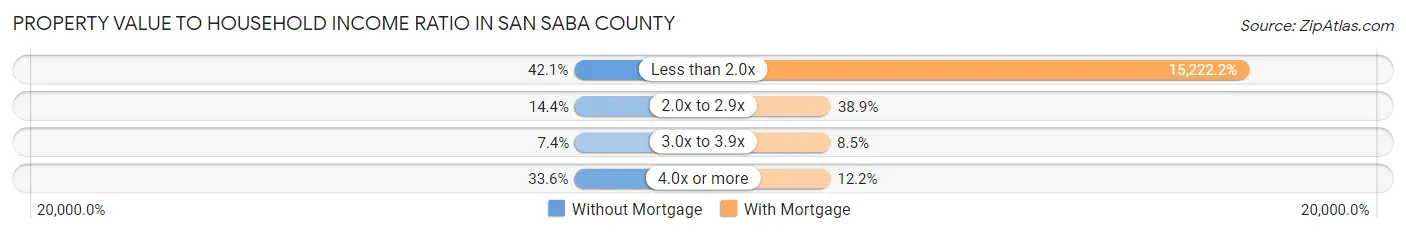
| Value-to-Income Ratio | Without Mortgage | With Mortgage |
| Less than 2.0x | 442 (42.1%) | 73,523 (15,222.1%) |
| 2.0x to 2.9x | 151 (14.4%) | 188 (38.9%) |
| 3.0x to 3.9x | 78 (7.4%) | 41 (8.5%) |
| 4.0x or more | 352 (33.6%) | 59 (12.2%) |
| Total | 1,049 (100.0%) | 483 (100.0%) |
Real Estate Taxes by Mortgage Status in San Saba County
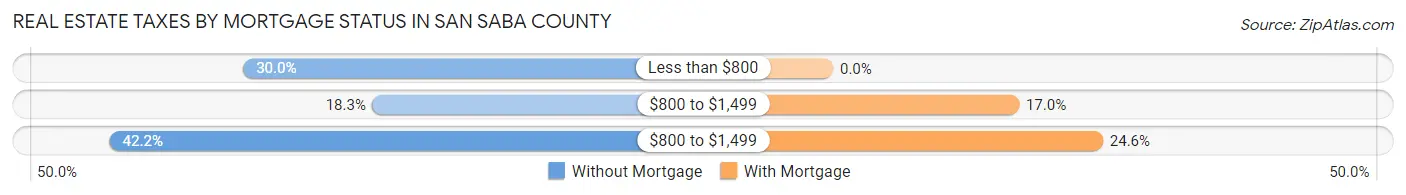
| Property Taxes | Without Mortgage | With Mortgage |
| Less than $800 | 315 (30.0%) | 0 (0.0%) |
| $800 to $1,499 | 192 (18.3%) | 82 (17.0%) |
| $800 to $1,499 | 443 (42.2%) | 119 (24.6%) |
| Total | 1,049 (100.0%) | 483 (100.0%) |
Health & Disability in San Saba County
Health Insurance Coverage by Age in San Saba County
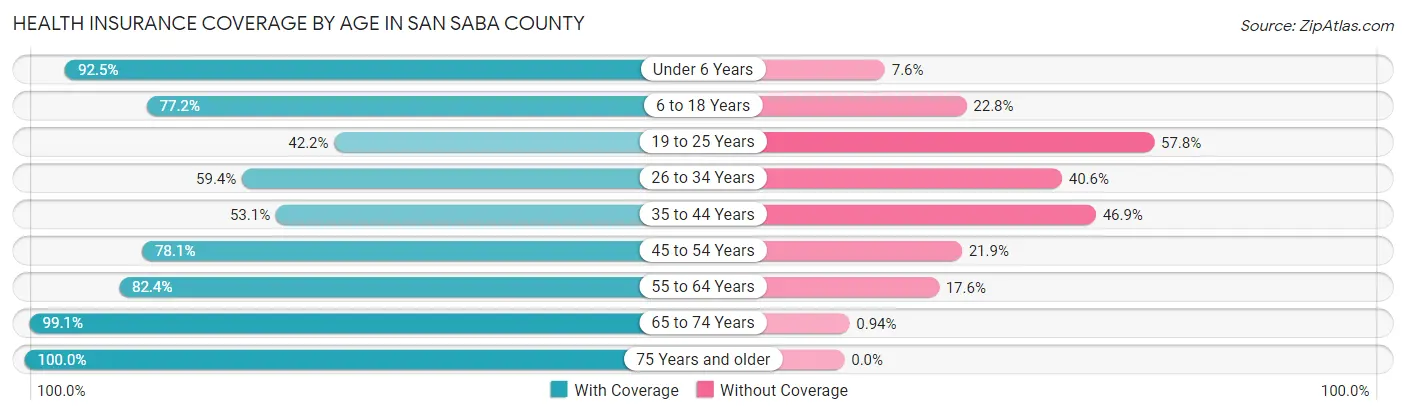
| Age Bracket | With Coverage | Without Coverage |
| Under 6 Years | 257 (92.4%) | 21 (7.5%) |
| 6 to 18 Years | 716 (77.2%) | 211 (22.8%) |
| 19 to 25 Years | 147 (42.2%) | 201 (57.8%) |
| 26 to 34 Years | 296 (59.4%) | 202 (40.6%) |
| 35 to 44 Years | 340 (53.1%) | 300 (46.9%) |
| 45 to 54 Years | 403 (78.1%) | 113 (21.9%) |
| 55 to 64 Years | 566 (82.4%) | 121 (17.6%) |
| 65 to 74 Years | 734 (99.1%) | 7 (0.9%) |
| 75 Years and older | 548 (100.0%) | 0 (0.0%) |
| Total | 4,007 (77.3%) | 1,176 (22.7%) |
Health Insurance Coverage by Citizenship Status in San Saba County
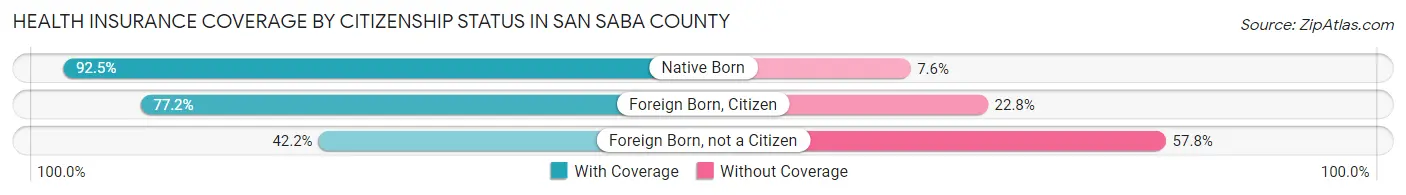
| Citizenship Status | With Coverage | Without Coverage |
| Native Born | 257 (92.4%) | 21 (7.5%) |
| Foreign Born, Citizen | 716 (77.2%) | 211 (22.8%) |
| Foreign Born, not a Citizen | 147 (42.2%) | 201 (57.8%) |
Health Insurance Coverage by Household Income in San Saba County
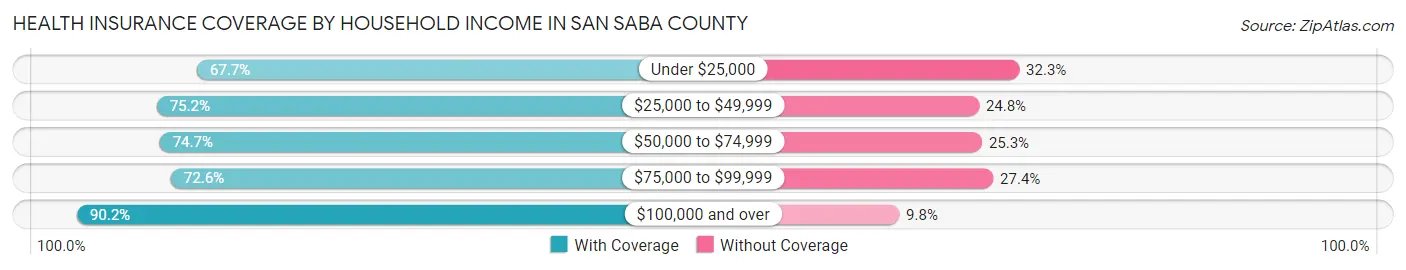
| Household Income | With Coverage | Without Coverage |
| Under $25,000 | 541 (67.7%) | 258 (32.3%) |
| $25,000 to $49,999 | 936 (75.2%) | 308 (24.8%) |
| $50,000 to $74,999 | 708 (74.7%) | 240 (25.3%) |
| $75,000 to $99,999 | 556 (72.6%) | 210 (27.4%) |
| $100,000 and over | 1,250 (90.2%) | 136 (9.8%) |
Public vs Private Health Insurance Coverage by Age in San Saba County
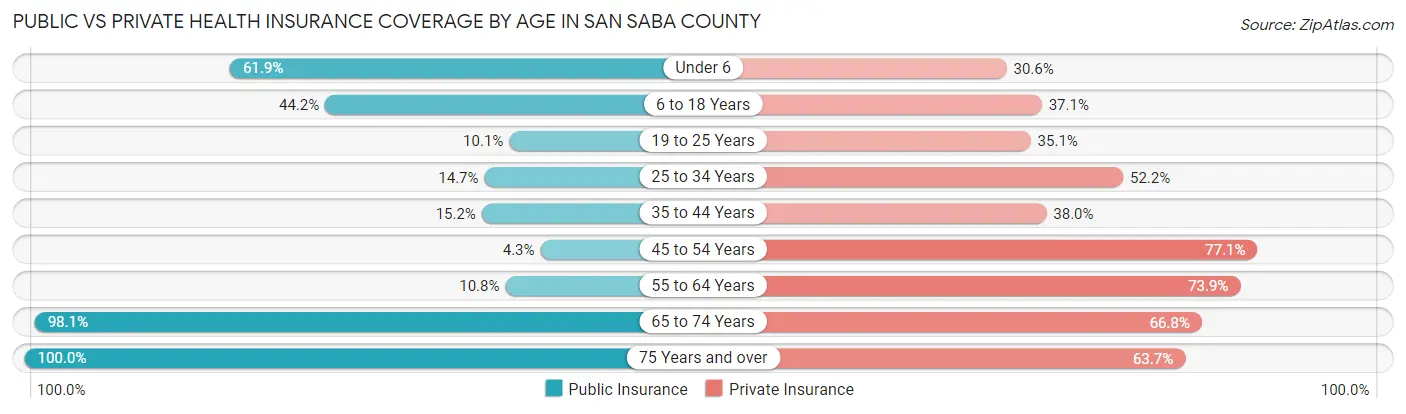
| Age Bracket | Public Insurance | Private Insurance |
| Under 6 | 172 (61.9%) | 85 (30.6%) |
| 6 to 18 Years | 410 (44.2%) | 344 (37.1%) |
| 19 to 25 Years | 35 (10.1%) | 122 (35.1%) |
| 25 to 34 Years | 73 (14.7%) | 260 (52.2%) |
| 35 to 44 Years | 97 (15.2%) | 243 (38.0%) |
| 45 to 54 Years | 22 (4.3%) | 398 (77.1%) |
| 55 to 64 Years | 74 (10.8%) | 508 (73.9%) |
| 65 to 74 Years | 727 (98.1%) | 495 (66.8%) |
| 75 Years and over | 548 (100.0%) | 349 (63.7%) |
| Total | 2,158 (41.6%) | 2,804 (54.1%) |
Disability Status by Sex by Age in San Saba County
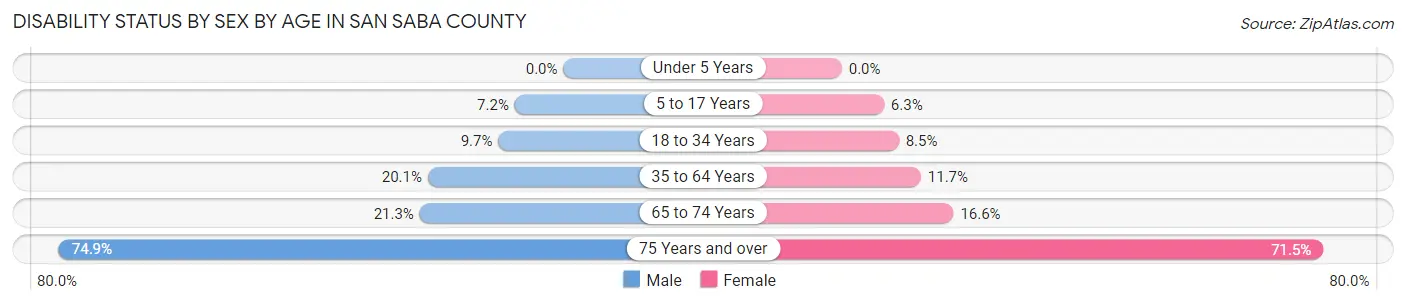
| Age Bracket | Male | Female |
| Under 5 Years | 0 (0.0%) | 0 (0.0%) |
| 5 to 17 Years | 33 (7.2%) | 24 (6.2%) |
| 18 to 34 Years | 59 (9.7%) | 30 (8.5%) |
| 35 to 64 Years | 191 (20.1%) | 105 (11.7%) |
| 65 to 74 Years | 77 (21.3%) | 63 (16.6%) |
| 75 Years and over | 203 (74.9%) | 198 (71.5%) |
Disability Class by Sex by Age in San Saba County
Disability Class: Hearing Difficulty
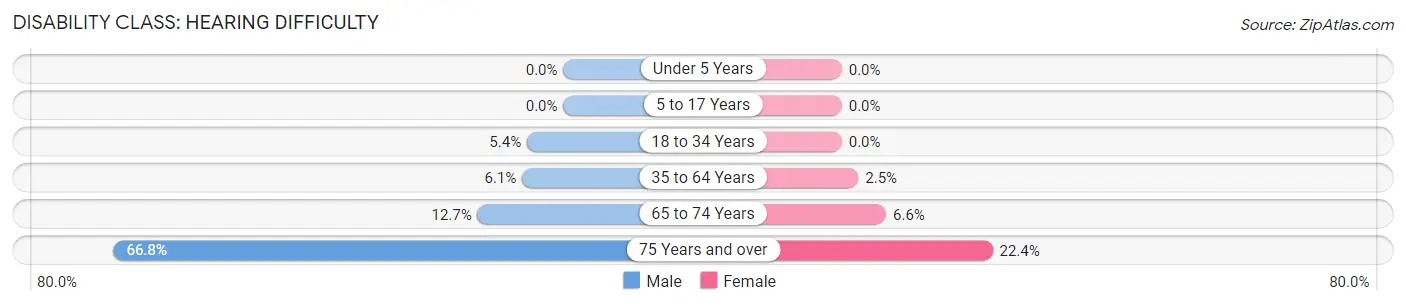
| Age Bracket | Male | Female |
| Under 5 Years | 0 (0.0%) | 0 (0.0%) |
| 5 to 17 Years | 0 (0.0%) | 0 (0.0%) |
| 18 to 34 Years | 33 (5.4%) | 0 (0.0%) |
| 35 to 64 Years | 58 (6.1%) | 22 (2.5%) |
| 65 to 74 Years | 46 (12.7%) | 25 (6.6%) |
| 75 Years and over | 181 (66.8%) | 62 (22.4%) |
Disability Class: Vision Difficulty
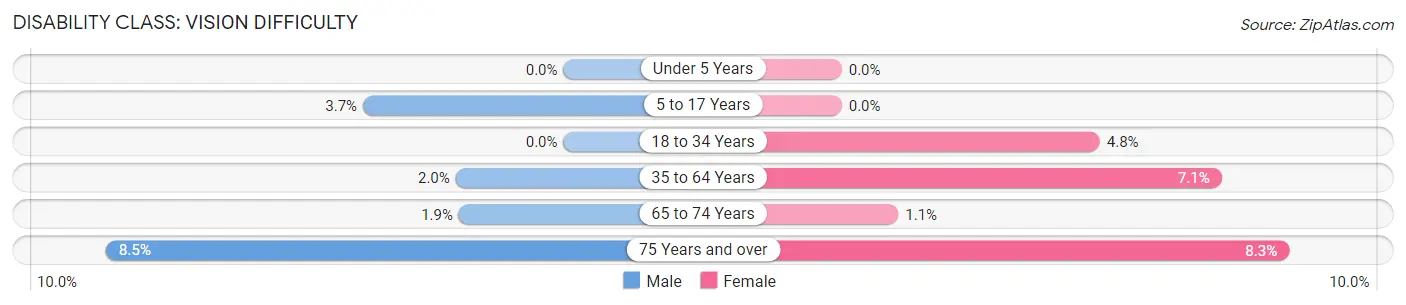
| Age Bracket | Male | Female |
| Under 5 Years | 0 (0.0%) | 0 (0.0%) |
| 5 to 17 Years | 17 (3.7%) | 0 (0.0%) |
| 18 to 34 Years | 0 (0.0%) | 17 (4.8%) |
| 35 to 64 Years | 19 (2.0%) | 63 (7.0%) |
| 65 to 74 Years | 7 (1.9%) | 4 (1.1%) |
| 75 Years and over | 23 (8.5%) | 23 (8.3%) |
Disability Class: Cognitive Difficulty
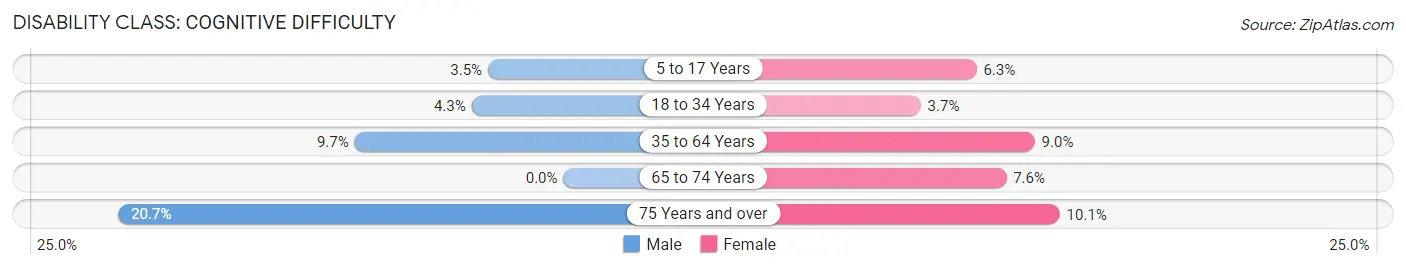
| Age Bracket | Male | Female |
| 5 to 17 Years | 16 (3.5%) | 24 (6.2%) |
| 18 to 34 Years | 26 (4.3%) | 13 (3.7%) |
| 35 to 64 Years | 92 (9.7%) | 80 (8.9%) |
| 65 to 74 Years | 0 (0.0%) | 29 (7.6%) |
| 75 Years and over | 56 (20.7%) | 28 (10.1%) |
Disability Class: Ambulatory Difficulty
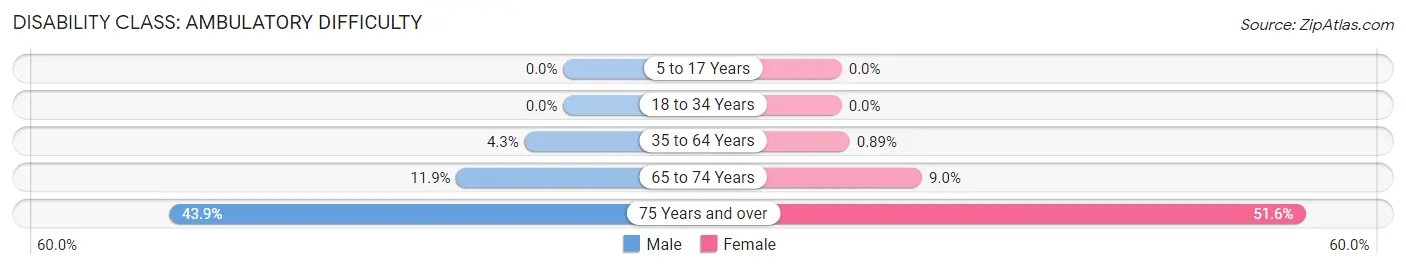
| Age Bracket | Male | Female |
| 5 to 17 Years | 0 (0.0%) | 0 (0.0%) |
| 18 to 34 Years | 0 (0.0%) | 0 (0.0%) |
| 35 to 64 Years | 41 (4.3%) | 8 (0.9%) |
| 65 to 74 Years | 43 (11.9%) | 34 (8.9%) |
| 75 Years and over | 119 (43.9%) | 143 (51.6%) |
Disability Class: Self-Care Difficulty
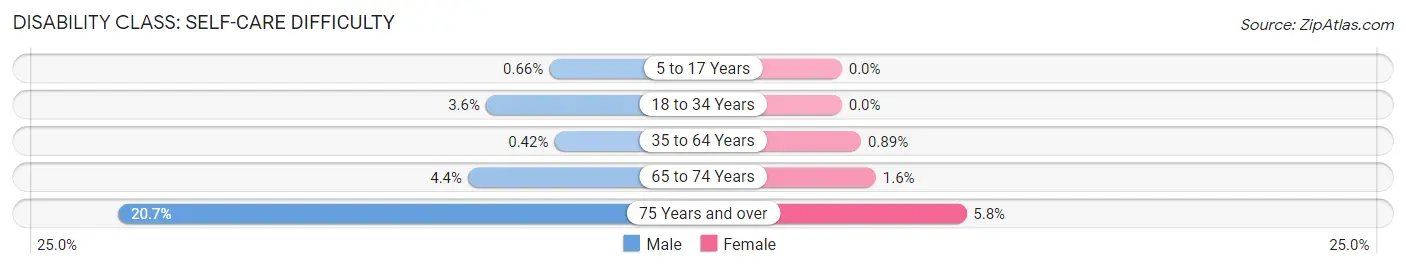
| Age Bracket | Male | Female |
| 5 to 17 Years | 3 (0.7%) | 0 (0.0%) |
| 18 to 34 Years | 22 (3.6%) | 0 (0.0%) |
| 35 to 64 Years | 4 (0.4%) | 8 (0.9%) |
| 65 to 74 Years | 16 (4.4%) | 6 (1.6%) |
| 75 Years and over | 56 (20.7%) | 16 (5.8%) |
Technology Access in San Saba County
Computing Device Access in San Saba County
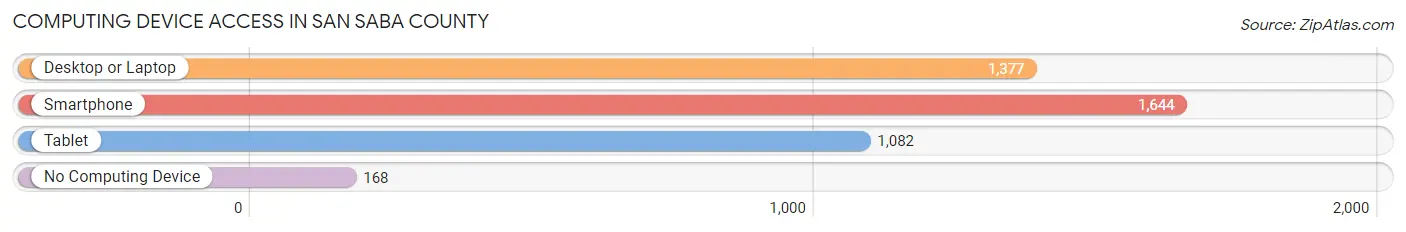
| Device Type | # Households | % Households |
| Desktop or Laptop | 1,377 | 68.4% |
| Smartphone | 1,644 | 81.6% |
| Tablet | 1,082 | 53.7% |
| No Computing Device | 168 | 8.3% |
| Total | 2,014 | 100.0% |
Internet Access in San Saba County
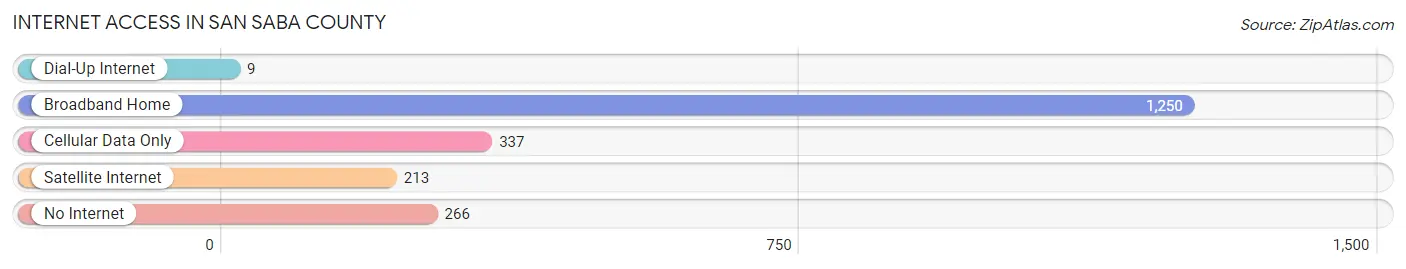
| Internet Type | # Households | % Households |
| Dial-Up Internet | 9 | 0.4% |
| Broadband Home | 1,250 | 62.1% |
| Cellular Data Only | 337 | 16.7% |
| Satellite Internet | 213 | 10.6% |
| No Internet | 266 | 13.2% |
| Total | 2,014 | 100.0% |
San Saba County Summary
San Saba County is located in the heart of Central Texas, and is part of the Edwards Plateau region. It is bordered by Brown, McCulloch, Mason, Lampasas, and Mills counties. The county seat is San Saba, and the county has a total area of 919 square miles.
History
San Saba County was established in 1856 from parts of Bexar, Travis, and Gillespie counties. It was named after the San Saba River, which was named after the Spanish mission San Sabá de las Nueces, which was established in 1757. The mission was abandoned in 1759 due to hostile Native American tribes.
The first settlers in the area were ranchers, who were attracted by the abundance of grass and water. The first town in the county was Richland Springs, which was established in 1854. The town was named after the nearby Richland Springs, which was a popular watering hole for travelers.
The county was home to several Native American tribes, including the Comanche, Kiowa, and Apache. The Comanche were the dominant tribe in the area, and they used the area as a hunting ground.
In the late 19th century, the county experienced a population boom due to the discovery of oil and gas. The first oil well was drilled in 1891, and by the early 20th century, the county was producing more than 1 million barrels of oil per year.
The county also experienced a population boom due to the introduction of cotton farming. Cotton was first grown in the county in the late 19th century, and by the early 20th century, the county was producing more than 1 million bales of cotton per year.
Geography
San Saba County is located in the Edwards Plateau region of Central Texas. The county is mostly flat, with some rolling hills in the western part of the county. The San Saba River runs through the county, and there are several creeks and streams in the area.
The county is home to several state parks, including Fort McKavett State Historic Site, Fort Griffin State Historic Site, and San Saba County Park.
Economy
The economy of San Saba County is largely based on agriculture and oil and gas production. The county is home to several large ranches, and the main crops grown in the area are cotton, corn, wheat, and hay.
Oil and gas production is also an important part of the economy. The county is home to several oil and gas fields, and the county produces more than 1 million barrels of oil per year.
Demographics
As of the 2010 census, the population of San Saba County was 6,131. The population is mostly white (90.2%), with small percentages of Hispanic (7.2%), African American (1.2%), and Native American (0.7%) residents.
The median household income in the county is $41,945, and the median home value is $90,400. The unemployment rate is 4.2%.
Conclusion
San Saba County is a rural county located in Central Texas. The county is home to several large ranches, and the main crops grown in the area are cotton, corn, wheat, and hay. Oil and gas production is also an important part of the economy. The population of the county is mostly white, with small percentages of Hispanic, African American, and Native American residents.
Common Questions
What is Per Capita Income in San Saba County?
Per Capita income in San Saba County is $26,377.
What is the Median Family Income in San Saba County?
Median Family Income in San Saba County is $64,395.
What is the Median Household income in San Saba County?
Median Household Income in San Saba County is $54,087.
What is Income or Wage Gap in San Saba County?
Income or Wage Gap in San Saba County is 26.7%.
Women in San Saba County earn 73.3 cents for every dollar earned by a man.
What is Family Income Deficit in San Saba County?
Family Income Deficit in San Saba County is $9,502.
Families that are below poverty line in San Saba County earn $9,502 less on average than the poverty threshold level.
What is Inequality or Gini Index in San Saba County?
Inequality or Gini Index in San Saba County is 0.42.
What is the Total Population of San Saba County?
Total Population of San Saba County is 5,779.
What is the Total Male Population of San Saba County?
Total Male Population of San Saba County is 3,086.
What is the Total Female Population of San Saba County?
Total Female Population of San Saba County is 2,693.
What is the Ratio of Males per 100 Females in San Saba County?
There are 114.59 Males per 100 Females in San Saba County.
What is the Ratio of Females per 100 Males in San Saba County?
There are 87.27 Females per 100 Males in San Saba County.
What is the Median Population Age in San Saba County?
Median Population Age in San Saba County is 41.9 Years.
What is the Average Family Size in San Saba County
Average Family Size in San Saba County is 3.2 People.
What is the Average Household Size in San Saba County
Average Household Size in San Saba County is 2.5 People.
How Large is the Labor Force in San Saba County?
There are 2,416 People in the Labor Forcein in San Saba County.
What is the Percentage of People in the Labor Force in San Saba County?
50.4% of People are in the Labor Force in San Saba County.
What is the Unemployment Rate in San Saba County?
Unemployment Rate in San Saba County is 3.8%.