San Patricio County, TX Map & Demographics
San Patricio County Overview
$30,692
PER CAPITA INCOME
$73,458
AVG FAMILY INCOME
$63,842
AVG HOUSEHOLD INCOME
38.6%
WAGE / INCOME GAP [ % ]
61.4¢/ $1
WAGE / INCOME GAP [ $ ]
$12,631
FAMILY INCOME DEFICIT
0.46
INEQUALITY / GINI INDEX
68,942
TOTAL POPULATION
35,185
MALE POPULATION
33,757
FEMALE POPULATION
104.23
MALES / 100 FEMALES
95.94
FEMALES / 100 MALES
36.0
MEDIAN AGE
3.4
AVG FAMILY SIZE
2.9
AVG HOUSEHOLD SIZE
30,182
LABOR FORCE [ PEOPLE ]
57.1%
PERCENT IN LABOR FORCE
4.4%
UNEMPLOYMENT RATE
San Patricio County Area Codes
Income in San Patricio County
Income Overview in San Patricio County
Per Capita Income in San Patricio County is $30,692, while median incomes of families and households are $73,458 and $63,842 respectively.
| Characteristic | Number | Measure |
| Per Capita Income | 68,942 | $30,692 |
| Median Family Income | 17,171 | $73,458 |
| Mean Family Income | 17,171 | $93,898 |
| Median Household Income | 23,920 | $63,842 |
| Mean Household Income | 23,920 | $85,477 |
| Income Deficit | 17,171 | $12,631 |
| Wage / Income Gap (%) | 68,942 | 38.58% |
| Wage / Income Gap ($) | 68,942 | 61.42¢ per $1 |
| Gini / Inequality Index | 68,942 | 0.46 |
Earnings by Sex in San Patricio County
Average Earnings in San Patricio County are $38,259, $46,984 for men and $28,856 for women, a difference of 38.6%.
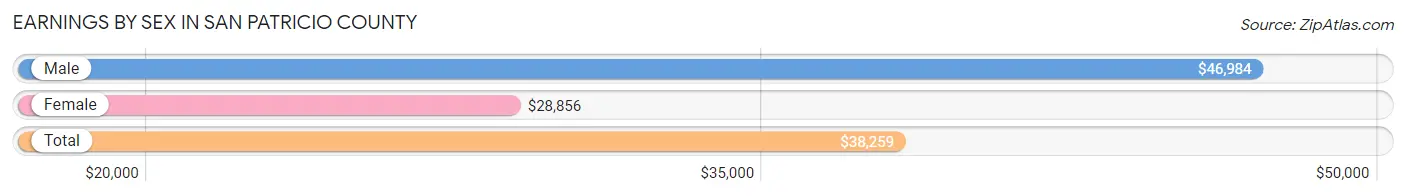
| Sex | Number | Average Earnings |
| Male | 18,025 (57.2%) | $46,984 |
| Female | 13,517 (42.8%) | $28,856 |
| Total | 31,542 (100.0%) | $38,259 |
Earnings by Sex by Income Bracket in San Patricio County
The most common earnings brackets in San Patricio County are $100,000+ for men (3,102 | 17.2%) and $25,000 to $29,999 for women (1,142 | 8.5%).
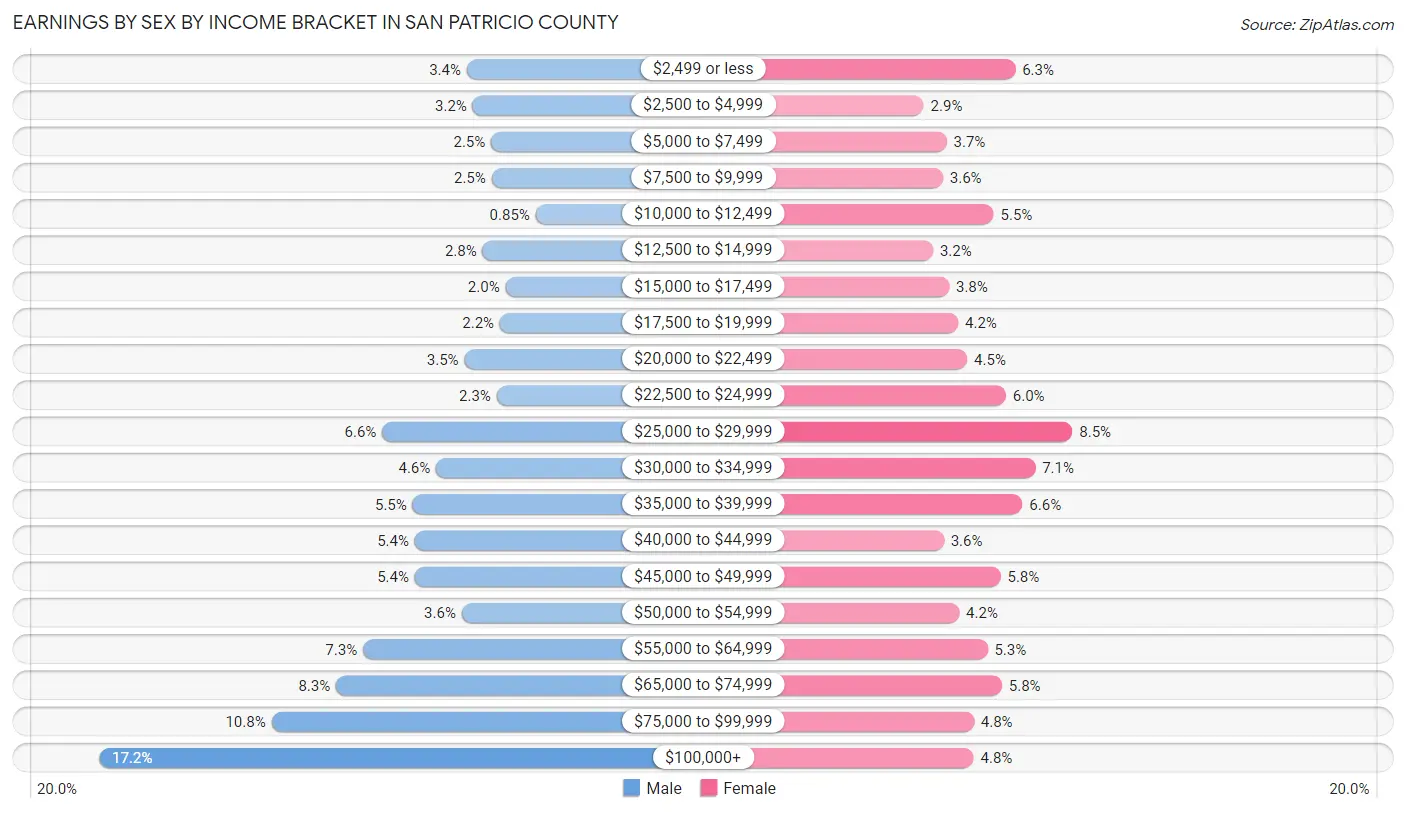
| Income | Male | Female |
| $2,499 or less | 619 (3.4%) | 853 (6.3%) |
| $2,500 to $4,999 | 578 (3.2%) | 389 (2.9%) |
| $5,000 to $7,499 | 455 (2.5%) | 505 (3.7%) |
| $7,500 to $9,999 | 451 (2.5%) | 486 (3.6%) |
| $10,000 to $12,499 | 153 (0.9%) | 744 (5.5%) |
| $12,500 to $14,999 | 512 (2.8%) | 436 (3.2%) |
| $15,000 to $17,499 | 357 (2.0%) | 518 (3.8%) |
| $17,500 to $19,999 | 395 (2.2%) | 563 (4.2%) |
| $20,000 to $22,499 | 635 (3.5%) | 610 (4.5%) |
| $22,500 to $24,999 | 417 (2.3%) | 805 (6.0%) |
| $25,000 to $29,999 | 1,190 (6.6%) | 1,142 (8.5%) |
| $30,000 to $34,999 | 825 (4.6%) | 954 (7.1%) |
| $35,000 to $39,999 | 985 (5.5%) | 889 (6.6%) |
| $40,000 to $44,999 | 970 (5.4%) | 490 (3.6%) |
| $45,000 to $49,999 | 970 (5.4%) | 779 (5.8%) |
| $50,000 to $54,999 | 652 (3.6%) | 569 (4.2%) |
| $55,000 to $64,999 | 1,320 (7.3%) | 713 (5.3%) |
| $65,000 to $74,999 | 1,502 (8.3%) | 786 (5.8%) |
| $75,000 to $99,999 | 1,937 (10.7%) | 644 (4.8%) |
| $100,000+ | 3,102 (17.2%) | 642 (4.8%) |
| Total | 18,025 (100.0%) | 13,517 (100.0%) |
Earnings by Sex by Educational Attainment in San Patricio County
Average earnings in San Patricio County are $53,643 for men and $31,699 for women, a difference of 40.9%. Men with an educational attainment of graduate degree enjoy the highest average annual earnings of $94,350, while those with less than high school education earn the least with $30,894. Women with an educational attainment of graduate degree earn the most with the average annual earnings of $61,667, while those with less than high school education have the smallest earnings of $21,070.
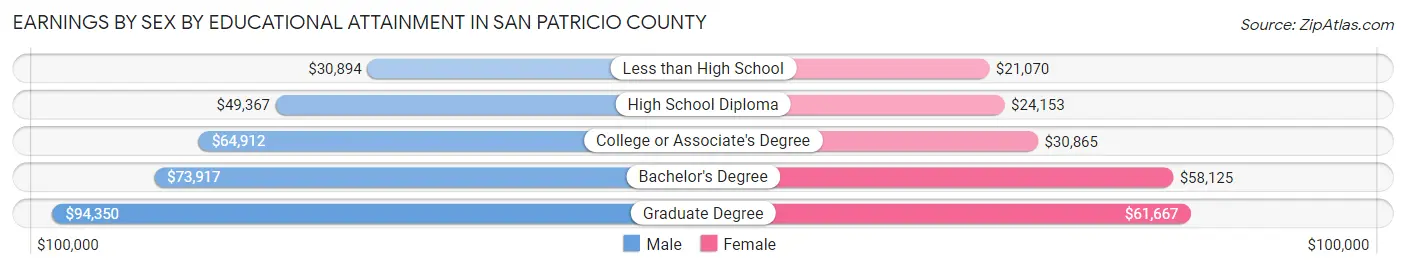
| Educational Attainment | Male Income | Female Income |
| Less than High School | $30,894 | $21,070 |
| High School Diploma | $49,367 | $24,153 |
| College or Associate's Degree | $64,912 | $30,865 |
| Bachelor's Degree | $73,917 | $58,125 |
| Graduate Degree | $94,350 | $61,667 |
| Total | $53,643 | $31,699 |
Family Income in San Patricio County
Family Income Brackets in San Patricio County
According to the San Patricio County family income data, there are 3,194 families falling into the $100,000 to $149,999 income range, which is the most common income bracket and makes up 18.6% of all families. Conversely, the $10,000 to $14,999 income bracket is the least frequent group with only 446 families (2.6%) belonging to this category.
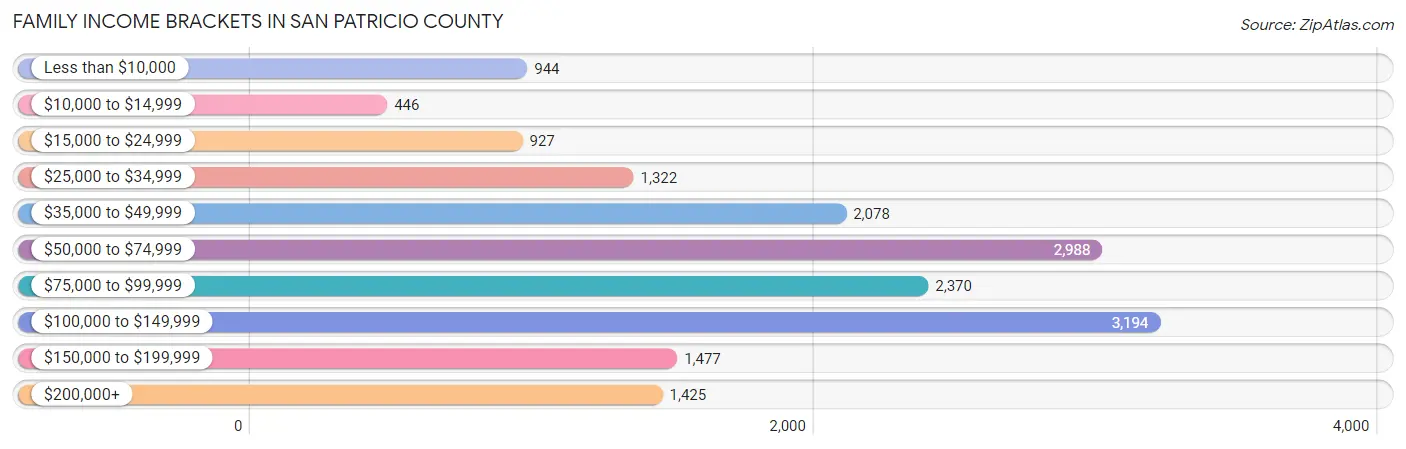
| Income Bracket | # Families | % Families |
| Less than $10,000 | 944 | 5.5% |
| $10,000 to $14,999 | 446 | 2.6% |
| $15,000 to $24,999 | 927 | 5.4% |
| $25,000 to $34,999 | 1,322 | 7.7% |
| $35,000 to $49,999 | 2,078 | 12.1% |
| $50,000 to $74,999 | 2,988 | 17.4% |
| $75,000 to $99,999 | 2,370 | 13.8% |
| $100,000 to $149,999 | 3,194 | 18.6% |
| $150,000 to $199,999 | 1,477 | 8.6% |
| $200,000+ | 1,425 | 8.3% |
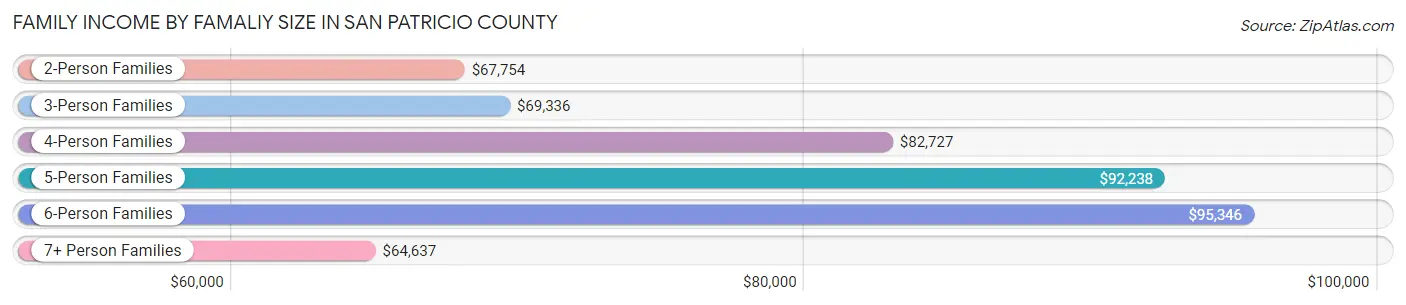
Family Income by Famaliy Size in San Patricio County
6-person families (625 | 3.6%) account for the highest median family income in San Patricio County with $95,346 per family, while 2-person families (6,637 | 38.7%) have the highest median income of $33,877 per family member.
| Income Bracket | # Families | Median Income |
| 2-Person Families | 6,637 (38.7%) | $67,754 |
| 3-Person Families | 4,483 (26.1%) | $69,336 |
| 4-Person Families | 3,014 (17.5%) | $82,727 |
| 5-Person Families | 1,743 (10.2%) | $92,238 |
| 6-Person Families | 625 (3.6%) | $95,346 |
| 7+ Person Families | 669 (3.9%) | $64,637 |
| Total | 17,171 (100.0%) | $73,458 |
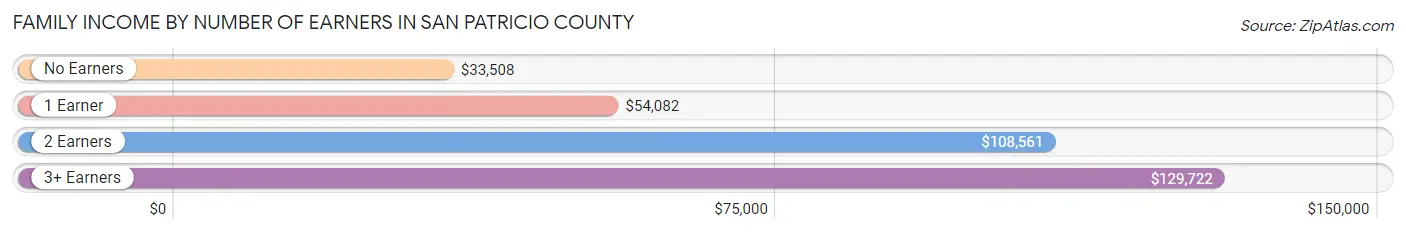
Family Income by Number of Earners in San Patricio County
The median family income in San Patricio County is $73,458, with families comprising 3+ earners (1,390) having the highest median family income of $129,722, while families with no earners (2,534) have the lowest median family income of $33,508, accounting for 8.1% and 14.8% of families, respectively.
| Number of Earners | # Families | Median Income |
| No Earners | 2,534 (14.8%) | $33,508 |
| 1 Earner | 6,499 (37.9%) | $54,082 |
| 2 Earners | 6,748 (39.3%) | $108,561 |
| 3+ Earners | 1,390 (8.1%) | $129,722 |
| Total | 17,171 (100.0%) | $73,458 |
Household Income in San Patricio County
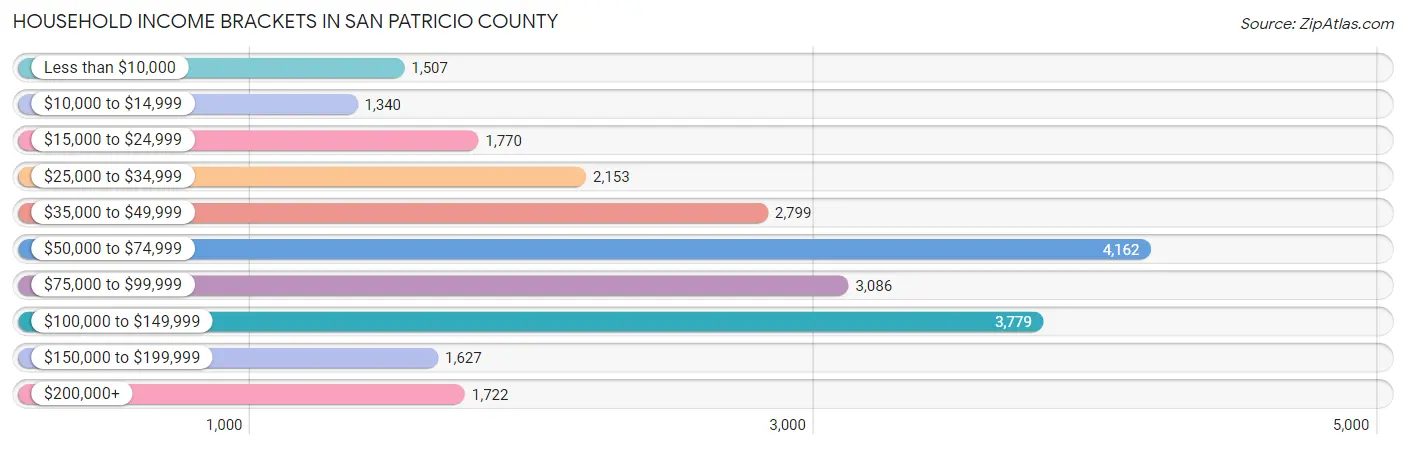
Household Income Brackets in San Patricio County
With 4,162 households falling in the category, the $50,000 to $74,999 income range is the most frequent in San Patricio County, accounting for 17.4% of all households. In contrast, only 1,340 households (5.6%) fall into the $10,000 to $14,999 income bracket, making it the least populous group.
| Income Bracket | # Households | % Households |
| Less than $10,000 | 1,507 | 6.3% |
| $10,000 to $14,999 | 1,340 | 5.6% |
| $15,000 to $24,999 | 1,770 | 7.4% |
| $25,000 to $34,999 | 2,153 | 9.0% |
| $35,000 to $49,999 | 2,799 | 11.7% |
| $50,000 to $74,999 | 4,162 | 17.4% |
| $75,000 to $99,999 | 3,086 | 12.9% |
| $100,000 to $149,999 | 3,779 | 15.8% |
| $150,000 to $199,999 | 1,627 | 6.8% |
| $200,000+ | 1,722 | 7.2% |
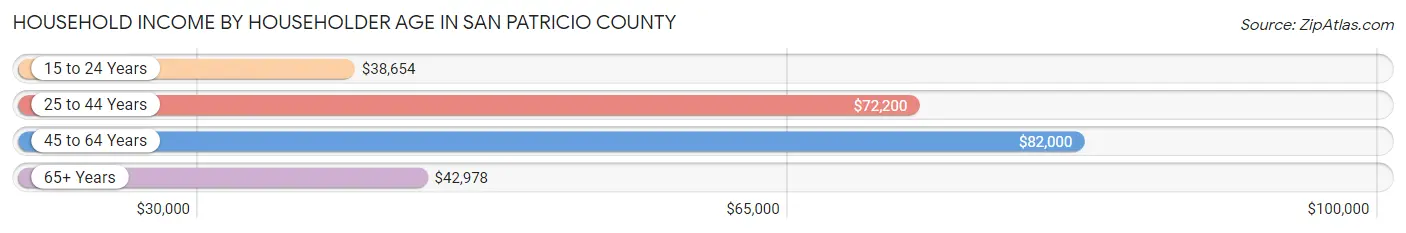
Household Income by Householder Age in San Patricio County
The median household income in San Patricio County is $63,842, with the highest median household income of $82,000 found in the 45 to 64 years age bracket for the primary householder. A total of 8,458 households (35.4%) fall into this category. Meanwhile, the 15 to 24 years age bracket for the primary householder has the lowest median household income of $38,654, with 556 households (2.3%) in this group.
| Income Bracket | # Households | Median Income |
| 15 to 24 Years | 556 (2.3%) | $38,654 |
| 25 to 44 Years | 8,348 (34.9%) | $72,200 |
| 45 to 64 Years | 8,458 (35.4%) | $82,000 |
| 65+ Years | 6,558 (27.4%) | $42,978 |
| Total | 23,920 (100.0%) | $63,842 |
Poverty in San Patricio County
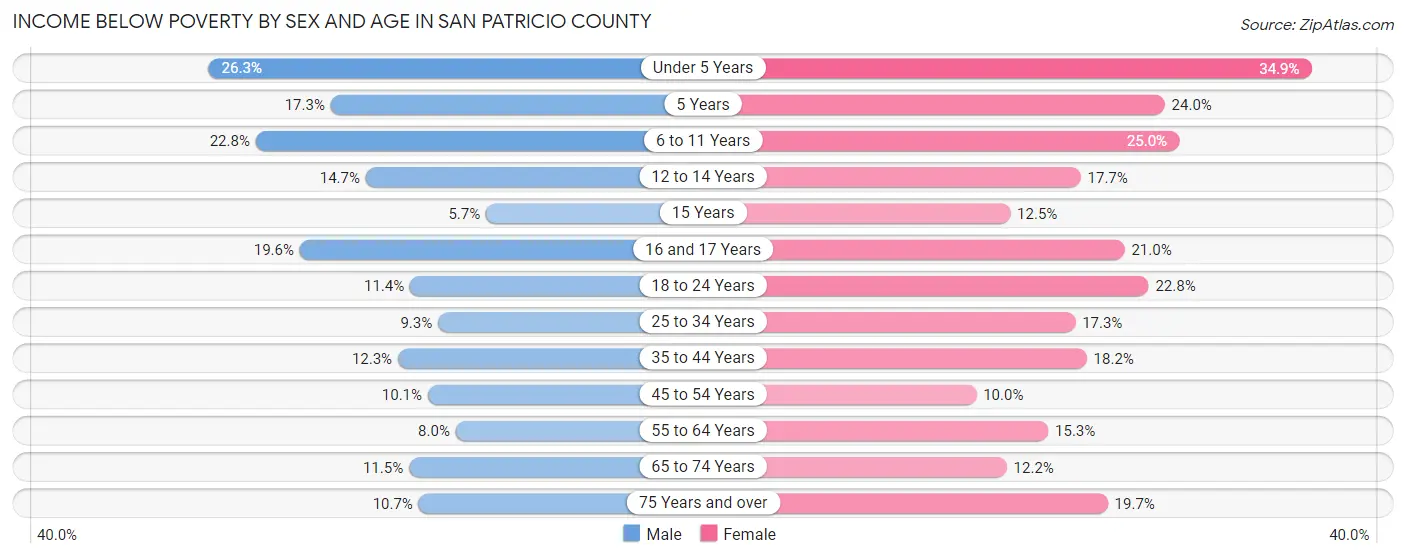
Income Below Poverty by Sex and Age in San Patricio County
With 13.3% poverty level for males and 18.3% for females among the residents of San Patricio County, under 5 year old males and under 5 year old females are the most vulnerable to poverty, with 614 males (26.3%) and 767 females (34.9%) in their respective age groups living below the poverty level.
| Age Bracket | Male | Female |
| Under 5 Years | 614 (26.3%) | 767 (34.9%) |
| 5 Years | 81 (17.3%) | 116 (24.0%) |
| 6 to 11 Years | 810 (22.8%) | 618 (25.0%) |
| 12 to 14 Years | 203 (14.7%) | 306 (17.7%) |
| 15 Years | 21 (5.7%) | 93 (12.5%) |
| 16 and 17 Years | 243 (19.6%) | 157 (21.0%) |
| 18 to 24 Years | 360 (11.4%) | 659 (22.8%) |
| 25 to 34 Years | 435 (9.3%) | 729 (17.3%) |
| 35 to 44 Years | 574 (12.3%) | 823 (18.2%) |
| 45 to 54 Years | 409 (10.1%) | 389 (10.0%) |
| 55 to 64 Years | 313 (8.0%) | 612 (15.3%) |
| 65 to 74 Years | 344 (11.5%) | 379 (12.2%) |
| 75 Years and over | 189 (10.7%) | 457 (19.7%) |
| Total | 4,596 (13.3%) | 6,105 (18.3%) |
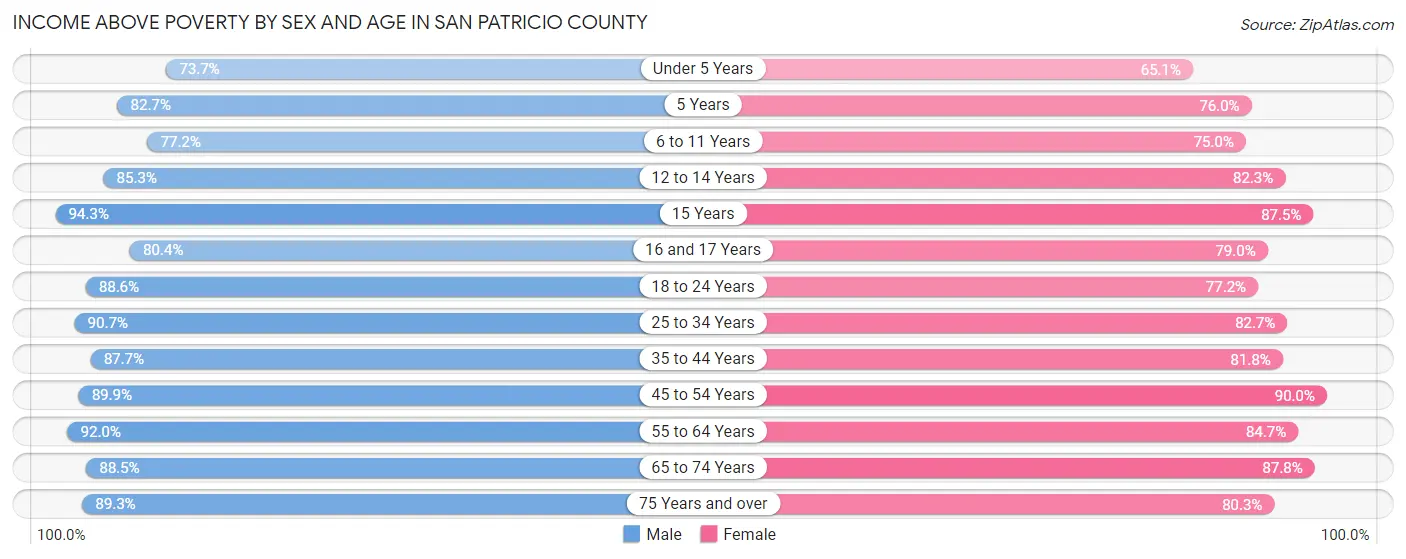
Income Above Poverty by Sex and Age in San Patricio County
According to the poverty statistics in San Patricio County, males aged 15 years and females aged 45 to 54 years are the age groups that are most secure financially, with 94.3% of males and 90.0% of females in these age groups living above the poverty line.
| Age Bracket | Male | Female |
| Under 5 Years | 1,718 (73.7%) | 1,433 (65.1%) |
| 5 Years | 388 (82.7%) | 368 (76.0%) |
| 6 to 11 Years | 2,736 (77.2%) | 1,851 (75.0%) |
| 12 to 14 Years | 1,181 (85.3%) | 1,420 (82.3%) |
| 15 Years | 345 (94.3%) | 651 (87.5%) |
| 16 and 17 Years | 999 (80.4%) | 591 (79.0%) |
| 18 to 24 Years | 2,803 (88.6%) | 2,235 (77.2%) |
| 25 to 34 Years | 4,243 (90.7%) | 3,478 (82.7%) |
| 35 to 44 Years | 4,099 (87.7%) | 3,704 (81.8%) |
| 45 to 54 Years | 3,655 (89.9%) | 3,510 (90.0%) |
| 55 to 64 Years | 3,605 (92.0%) | 3,382 (84.7%) |
| 65 to 74 Years | 2,658 (88.5%) | 2,717 (87.8%) |
| 75 Years and over | 1,571 (89.3%) | 1,858 (80.3%) |
| Total | 30,001 (86.7%) | 27,198 (81.7%) |
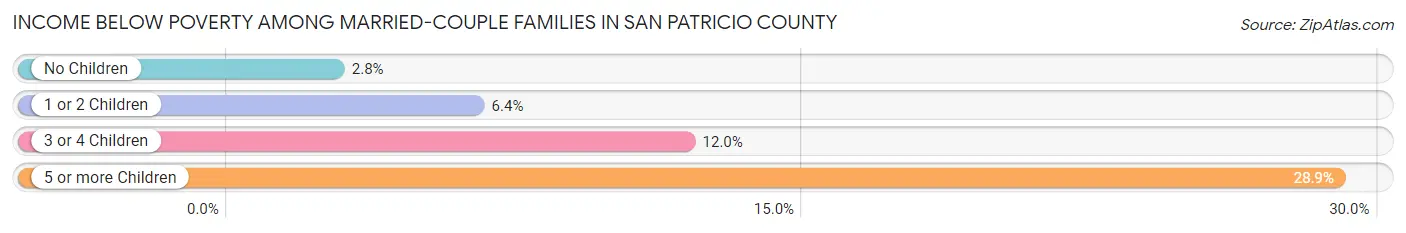
Income Below Poverty Among Married-Couple Families in San Patricio County
The poverty statistics for married-couple families in San Patricio County show that 5.4% or 624 of the total 11,571 families live below the poverty line. Families with 5 or more children have the highest poverty rate of 28.9%, comprising of 35 families. On the other hand, families with no children have the lowest poverty rate of 2.8%, which includes 179 families.
| Children | Above Poverty | Below Poverty |
| No Children | 6,227 (97.2%) | 179 (2.8%) |
| 1 or 2 Children | 3,271 (93.6%) | 225 (6.4%) |
| 3 or 4 Children | 1,363 (88.0%) | 185 (11.9%) |
| 5 or more Children | 86 (71.1%) | 35 (28.9%) |
| Total | 10,947 (94.6%) | 624 (5.4%) |
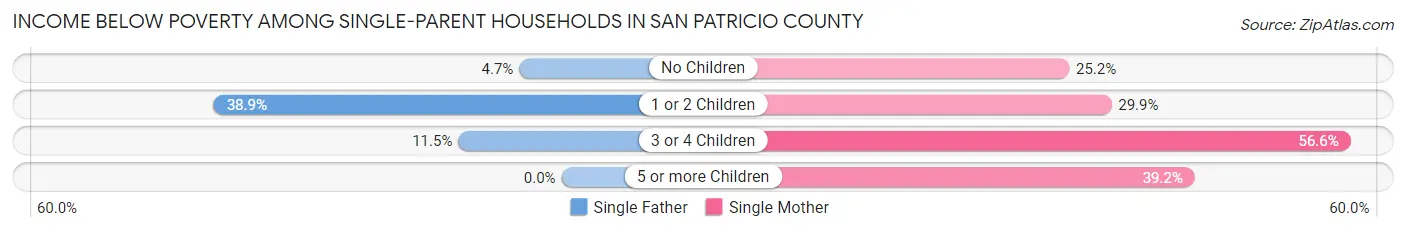
Income Below Poverty Among Single-Parent Households in San Patricio County
According to the poverty data in San Patricio County, 19.5% or 284 single-father households and 32.5% or 1,348 single-mother households are living below the poverty line. Among single-father households, those with 1 or 2 children have the highest poverty rate, with 239 households (38.9%) experiencing poverty. Likewise, among single-mother households, those with 3 or 4 children have the highest poverty rate, with 324 households (56.6%) falling below the poverty line.
| Children | Single Father | Single Mother |
| No Children | 36 (4.7%) | 304 (25.2%) |
| 1 or 2 Children | 239 (38.9%) | 669 (29.9%) |
| 3 or 4 Children | 9 (11.5%) | 324 (56.6%) |
| 5 or more Children | 0 (0.0%) | 51 (39.2%) |
| Total | 284 (19.5%) | 1,348 (32.5%) |
Income Below Poverty Among Married-Couple vs Single-Parent Households in San Patricio County
The poverty data for San Patricio County shows that 624 of the married-couple family households (5.4%) and 1,632 of the single-parent households (29.1%) are living below the poverty level. Within the married-couple family households, those with 5 or more children have the highest poverty rate, with 35 households (28.9%) falling below the poverty line. Among the single-parent households, those with 3 or 4 children have the highest poverty rate, with 333 household (51.2%) living below poverty.
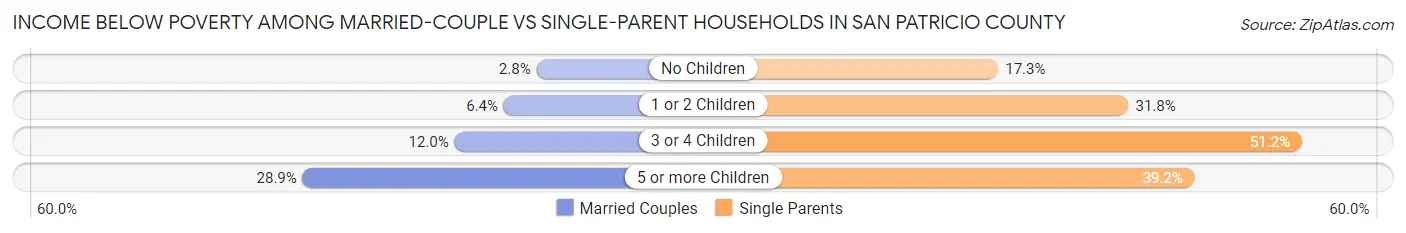
| Children | Married-Couple Families | Single-Parent Households |
| No Children | 179 (2.8%) | 340 (17.3%) |
| 1 or 2 Children | 225 (6.4%) | 908 (31.8%) |
| 3 or 4 Children | 185 (11.9%) | 333 (51.2%) |
| 5 or more Children | 35 (28.9%) | 51 (39.2%) |
| Total | 624 (5.4%) | 1,632 (29.1%) |
Race in San Patricio County
The most populous races in San Patricio County are White / Caucasian (49,487 | 71.8%), Hispanic or Latino (40,446 | 58.7%), and Two or more Races (13,895 | 20.2%).
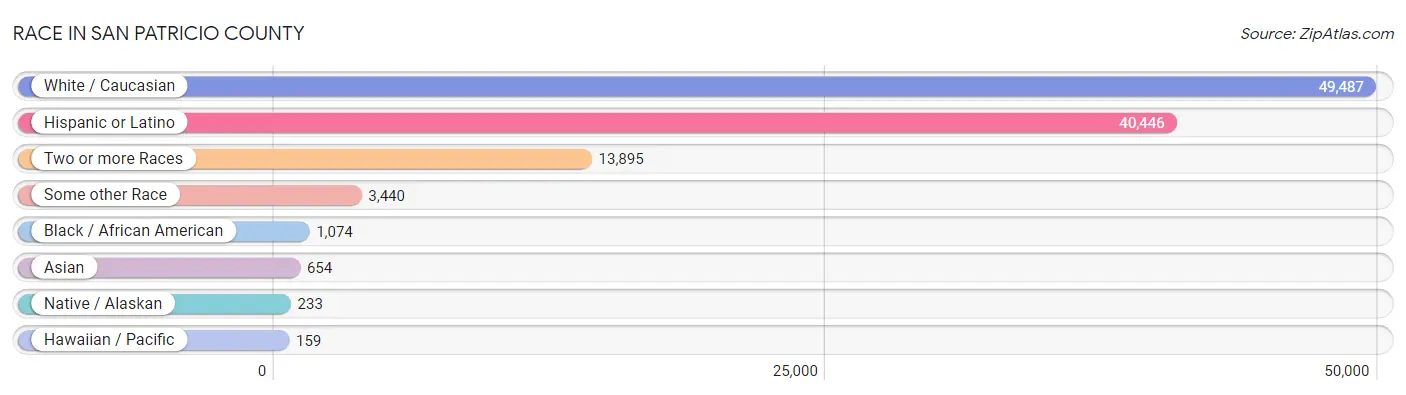
| Race | # Population | % Population |
| Asian | 654 | 0.9% |
| Black / African American | 1,074 | 1.6% |
| Hawaiian / Pacific | 159 | 0.2% |
| Hispanic or Latino | 40,446 | 58.7% |
| Native / Alaskan | 233 | 0.3% |
| White / Caucasian | 49,487 | 71.8% |
| Two or more Races | 13,895 | 20.2% |
| Some other Race | 3,440 | 5.0% |
| Total | 68,942 | 100.0% |
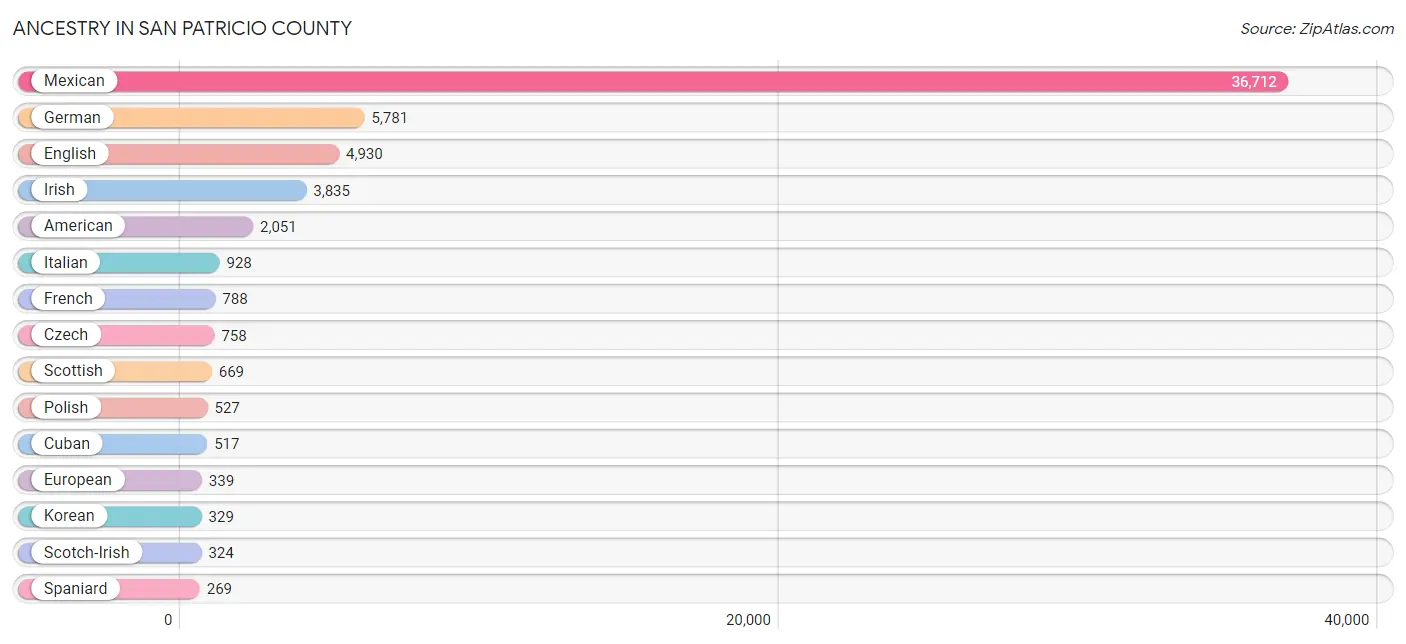
Ancestry in San Patricio County
The most populous ancestries reported in San Patricio County are Mexican (36,712 | 53.2%), German (5,781 | 8.4%), English (4,930 | 7.1%), Irish (3,835 | 5.6%), and American (2,051 | 3.0%), together accounting for 77.3% of all San Patricio County residents.
| Ancestry | # Population | % Population |
| Afghan | 25 | 0.0% |
| African | 27 | 0.0% |
| American | 2,051 | 3.0% |
| Apache | 38 | 0.1% |
| Arab | 53 | 0.1% |
| Argentinean | 44 | 0.1% |
| Australian | 28 | 0.0% |
| Austrian | 56 | 0.1% |
| Barbadian | 17 | 0.0% |
| Belgian | 32 | 0.1% |
| Bhutanese | 62 | 0.1% |
| Brazilian | 134 | 0.2% |
| British | 158 | 0.2% |
| Bulgarian | 16 | 0.0% |
| Burmese | 35 | 0.1% |
| Cajun | 49 | 0.1% |
| Canadian | 47 | 0.1% |
| Celtic | 16 | 0.0% |
| Central American | 89 | 0.1% |
| Central American Indian | 81 | 0.1% |
| Cherokee | 102 | 0.2% |
| Chilean | 35 | 0.1% |
| Chinese | 38 | 0.1% |
| Choctaw | 14 | 0.0% |
| Colombian | 144 | 0.2% |
| Creek | 4 | 0.0% |
| Croatian | 36 | 0.1% |
| Cuban | 517 | 0.7% |
| Czech | 758 | 1.1% |
| Czechoslovakian | 93 | 0.1% |
| Danish | 116 | 0.2% |
| Dominican | 15 | 0.0% |
| Dutch | 254 | 0.4% |
| Eastern European | 71 | 0.1% |
| English | 4,930 | 7.1% |
| European | 339 | 0.5% |
| Filipino | 55 | 0.1% |
| Finnish | 69 | 0.1% |
| French | 788 | 1.1% |
| French Canadian | 83 | 0.1% |
| German | 5,781 | 8.4% |
| Greek | 56 | 0.1% |
| Guamanian / Chamorro | 54 | 0.1% |
| Guatemalan | 7 | 0.0% |
| Honduran | 66 | 0.1% |
| Hungarian | 55 | 0.1% |
| Indian (Asian) | 156 | 0.2% |
| Indonesian | 19 | 0.0% |
| Iranian | 28 | 0.0% |
| Irish | 3,835 | 5.6% |
| Israeli | 38 | 0.1% |
| Italian | 928 | 1.3% |
| Jamaican | 15 | 0.0% |
| Jordanian | 7 | 0.0% |
| Korean | 329 | 0.5% |
| Laotian | 68 | 0.1% |
| Lebanese | 26 | 0.0% |
| Malaysian | 44 | 0.1% |
| Mexican | 36,712 | 53.2% |
| Mexican American Indian | 83 | 0.1% |
| Moroccan | 3 | 0.0% |
| Native Hawaiian | 175 | 0.3% |
| Navajo | 54 | 0.1% |
| Nigerian | 6 | 0.0% |
| Northern European | 14 | 0.0% |
| Norwegian | 260 | 0.4% |
| Pakistani | 49 | 0.1% |
| Peruvian | 6 | 0.0% |
| Polish | 527 | 0.8% |
| Portuguese | 14 | 0.0% |
| Puerto Rican | 240 | 0.4% |
| Romanian | 47 | 0.1% |
| Russian | 36 | 0.1% |
| Salvadoran | 16 | 0.0% |
| Samoan | 132 | 0.2% |
| Scandinavian | 103 | 0.2% |
| Scotch-Irish | 324 | 0.5% |
| Scottish | 669 | 1.0% |
| Slavic | 2 | 0.0% |
| Slovak | 24 | 0.0% |
| South American | 229 | 0.3% |
| Spaniard | 269 | 0.4% |
| Spanish | 148 | 0.2% |
| Sri Lankan | 55 | 0.1% |
| Subsaharan African | 33 | 0.1% |
| Swedish | 219 | 0.3% |
| Swiss | 54 | 0.1% |
| Syrian | 9 | 0.0% |
| Thai | 63 | 0.1% |
| Turkish | 1 | 0.0% |
| Ukrainian | 94 | 0.1% |
| Welsh | 95 | 0.1% |
| West Indian | 4 | 0.0% |
| Yugoslavian | 88 | 0.1% | View All 94 Rows |
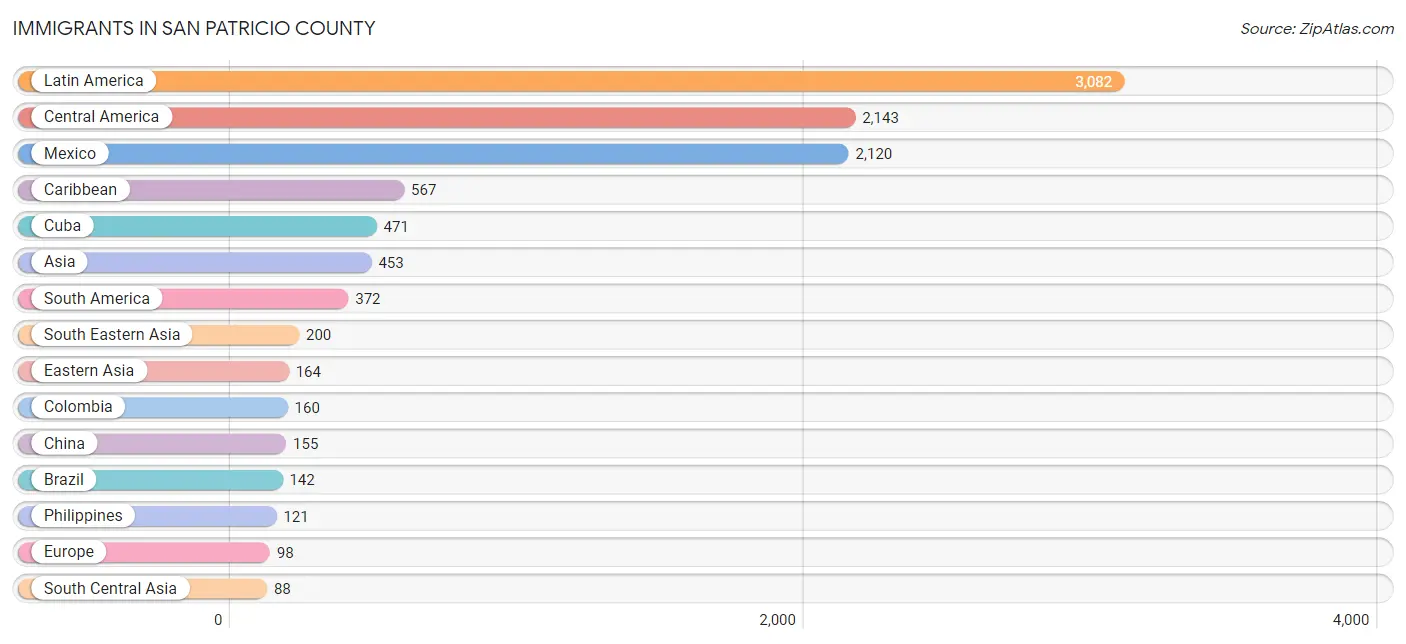
Immigrants in San Patricio County
The most numerous immigrant groups reported in San Patricio County came from Latin America (3,082 | 4.5%), Central America (2,143 | 3.1%), Mexico (2,120 | 3.1%), Caribbean (567 | 0.8%), and Cuba (471 | 0.7%), together accounting for 12.2% of all San Patricio County residents.
| Immigration Origin | # Population | % Population |
| Afghanistan | 25 | 0.0% |
| Africa | 1 | 0.0% |
| Argentina | 29 | 0.0% |
| Asia | 453 | 0.7% |
| Belgium | 11 | 0.0% |
| Brazil | 142 | 0.2% |
| Canada | 45 | 0.1% |
| Caribbean | 567 | 0.8% |
| Central America | 2,143 | 3.1% |
| Chile | 35 | 0.1% |
| China | 155 | 0.2% |
| Colombia | 160 | 0.2% |
| Cuba | 471 | 0.7% |
| Denmark | 5 | 0.0% |
| Dominica | 38 | 0.1% |
| Eastern Africa | 1 | 0.0% |
| Eastern Asia | 164 | 0.2% |
| Eastern Europe | 19 | 0.0% |
| El Salvador | 16 | 0.0% |
| Europe | 98 | 0.1% |
| Germany | 22 | 0.0% |
| Guatemala | 7 | 0.0% |
| Hong Kong | 8 | 0.0% |
| India | 63 | 0.1% |
| Indonesia | 17 | 0.0% |
| Italy | 12 | 0.0% |
| Jamaica | 24 | 0.0% |
| Korea | 9 | 0.0% |
| Laos | 12 | 0.0% |
| Latin America | 3,082 | 4.5% |
| Mexico | 2,120 | 3.1% |
| Moldova | 7 | 0.0% |
| Northern Europe | 34 | 0.1% |
| Peru | 6 | 0.0% |
| Philippines | 121 | 0.2% |
| Scotland | 21 | 0.0% |
| Serbia | 5 | 0.0% |
| Singapore | 6 | 0.0% |
| South America | 372 | 0.5% |
| South Central Asia | 88 | 0.1% |
| South Eastern Asia | 200 | 0.3% |
| Southern Europe | 12 | 0.0% |
| Taiwan | 31 | 0.0% |
| Thailand | 9 | 0.0% |
| Trinidad and Tobago | 34 | 0.1% |
| Turkey | 1 | 0.0% |
| Ukraine | 7 | 0.0% |
| Vietnam | 16 | 0.0% |
| Western Asia | 1 | 0.0% |
| Western Europe | 33 | 0.1% | View All 50 Rows |
Sex and Age in San Patricio County
Sex and Age in San Patricio County
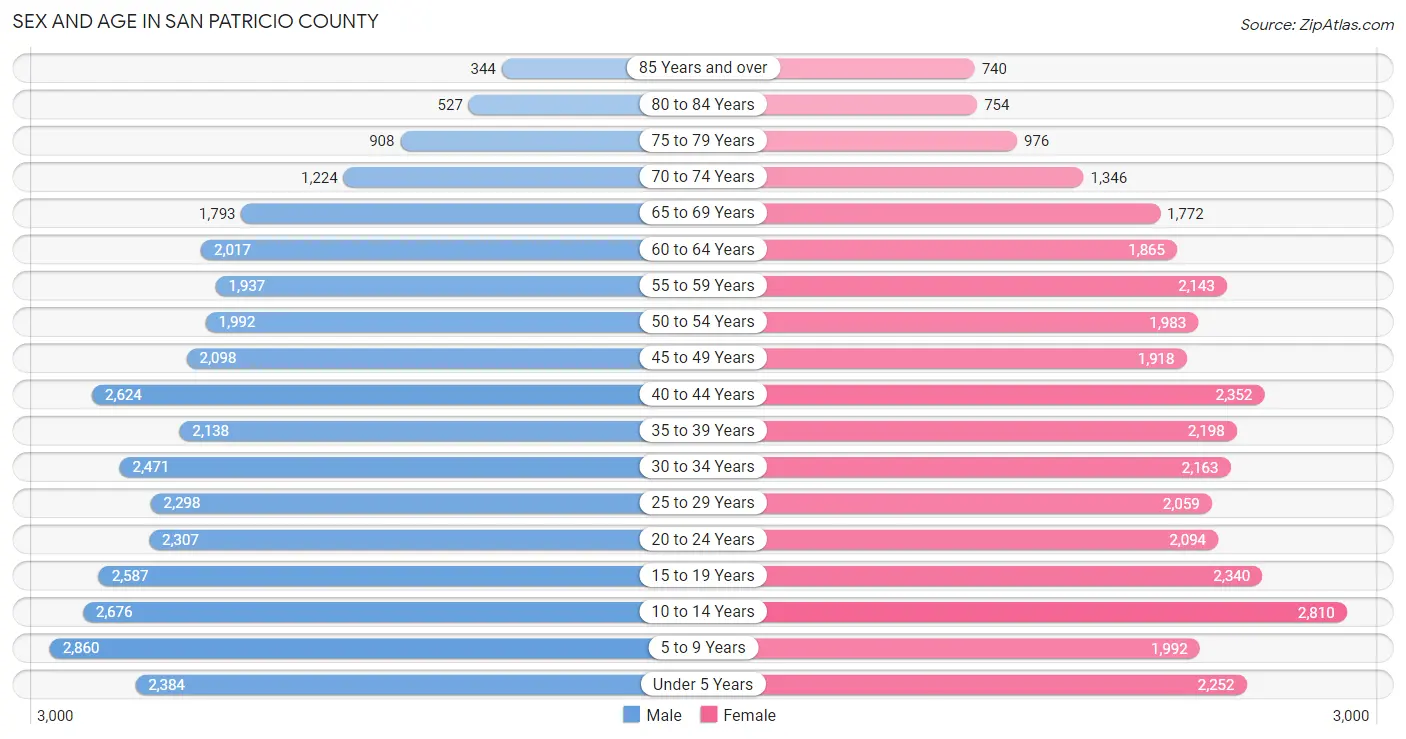
The most populous age groups in San Patricio County are 5 to 9 Years (2,860 | 8.1%) for men and 10 to 14 Years (2,810 | 8.3%) for women.
| Age Bracket | Male | Female |
| Under 5 Years | 2,384 (6.8%) | 2,252 (6.7%) |
| 5 to 9 Years | 2,860 (8.1%) | 1,992 (5.9%) |
| 10 to 14 Years | 2,676 (7.6%) | 2,810 (8.3%) |
| 15 to 19 Years | 2,587 (7.3%) | 2,340 (6.9%) |
| 20 to 24 Years | 2,307 (6.6%) | 2,094 (6.2%) |
| 25 to 29 Years | 2,298 (6.5%) | 2,059 (6.1%) |
| 30 to 34 Years | 2,471 (7.0%) | 2,163 (6.4%) |
| 35 to 39 Years | 2,138 (6.1%) | 2,198 (6.5%) |
| 40 to 44 Years | 2,624 (7.5%) | 2,352 (7.0%) |
| 45 to 49 Years | 2,098 (6.0%) | 1,918 (5.7%) |
| 50 to 54 Years | 1,992 (5.7%) | 1,983 (5.9%) |
| 55 to 59 Years | 1,937 (5.5%) | 2,143 (6.4%) |
| 60 to 64 Years | 2,017 (5.7%) | 1,865 (5.5%) |
| 65 to 69 Years | 1,793 (5.1%) | 1,772 (5.2%) |
| 70 to 74 Years | 1,224 (3.5%) | 1,346 (4.0%) |
| 75 to 79 Years | 908 (2.6%) | 976 (2.9%) |
| 80 to 84 Years | 527 (1.5%) | 754 (2.2%) |
| 85 Years and over | 344 (1.0%) | 740 (2.2%) |
| Total | 35,185 (100.0%) | 33,757 (100.0%) |
Families and Households in San Patricio County
Median Family Size in San Patricio County
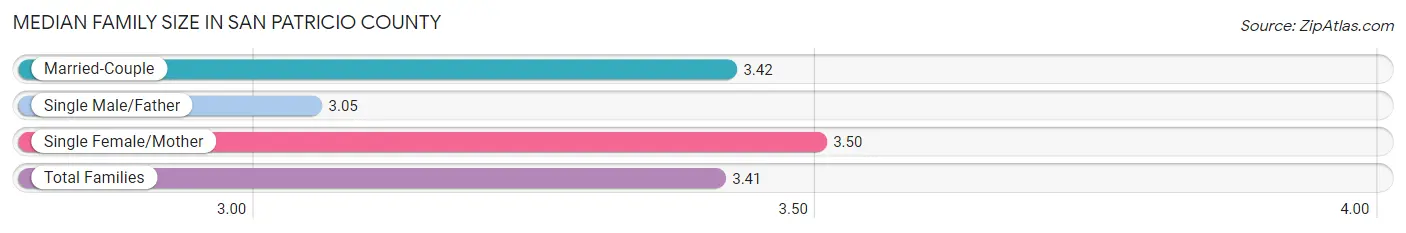
The median family size in San Patricio County is 3.41 persons per family, with single female/mother families (4,146 | 24.1%) accounting for the largest median family size of 3.5 persons per family. On the other hand, single male/father families (1,454 | 8.5%) represent the smallest median family size with 3.05 persons per family.
| Family Type | # Families | Family Size |
| Married-Couple | 11,571 (67.4%) | 3.42 |
| Single Male/Father | 1,454 (8.5%) | 3.05 |
| Single Female/Mother | 4,146 (24.1%) | 3.50 |
| Total Families | 17,171 (100.0%) | 3.41 |
Median Household Size in San Patricio County
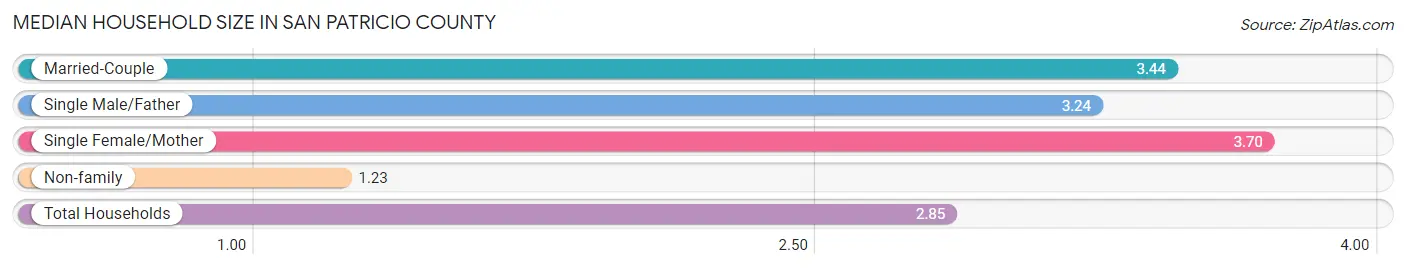
The median household size in San Patricio County is 2.85 persons per household, with single female/mother households (4,146 | 17.3%) accounting for the largest median household size of 3.7 persons per household. non-family households (6,749 | 28.2%) represent the smallest median household size with 1.23 persons per household.
| Household Type | # Households | Household Size |
| Married-Couple | 11,571 (48.4%) | 3.44 |
| Single Male/Father | 1,454 (6.1%) | 3.24 |
| Single Female/Mother | 4,146 (17.3%) | 3.70 |
| Non-family | 6,749 (28.2%) | 1.23 |
| Total Households | 23,920 (100.0%) | 2.85 |
Household Size by Marriage Status in San Patricio County
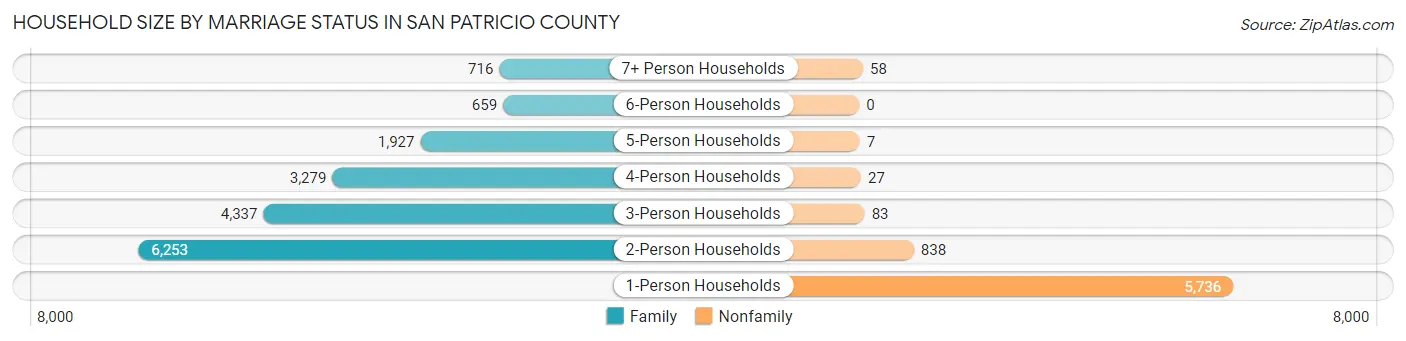
Out of a total of 23,920 households in San Patricio County, 17,171 (71.8%) are family households, while 6,749 (28.2%) are nonfamily households. The most numerous type of family households are 2-person households, comprising 6,253, and the most common type of nonfamily households are 1-person households, comprising 5,736.
| Household Size | Family Households | Nonfamily Households |
| 1-Person Households | - | 5,736 (24.0%) |
| 2-Person Households | 6,253 (26.1%) | 838 (3.5%) |
| 3-Person Households | 4,337 (18.1%) | 83 (0.4%) |
| 4-Person Households | 3,279 (13.7%) | 27 (0.1%) |
| 5-Person Households | 1,927 (8.1%) | 7 (0.0%) |
| 6-Person Households | 659 (2.8%) | 0 (0.0%) |
| 7+ Person Households | 716 (3.0%) | 58 (0.2%) |
| Total | 17,171 (71.8%) | 6,749 (28.2%) |
Female Fertility in San Patricio County
Fertility by Age in San Patricio County
Average fertility rate in San Patricio County is 71.0 births per 1,000 women. Women in the age bracket of 20 to 34 years have the highest fertility rate with 134.0 births per 1,000 women. Women in the age bracket of 20 to 34 years acount for 77.2% of all women with births.
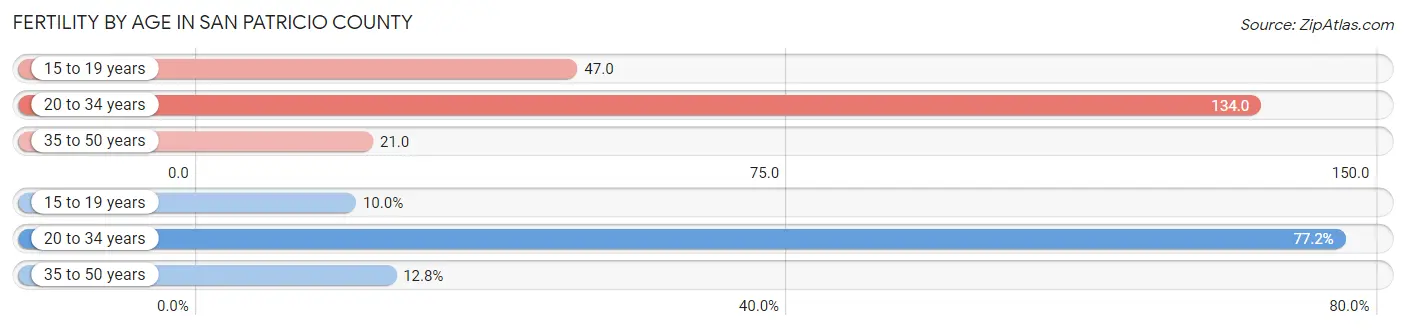
| Age Bracket | Women with Births | Births / 1,000 Women |
| 15 to 19 years | 110 (10.0%) | 47.0 |
| 20 to 34 years | 846 (77.2%) | 134.0 |
| 35 to 50 years | 140 (12.8%) | 21.0 |
| Total | 1,096 (100.0%) | 71.0 |
Fertility by Age by Marriage Status in San Patricio County
48.9% of women with births (1,096) in San Patricio County are married. The highest percentage of unmarried women with births falls into 20 to 34 years age bracket with 59.8% of them unmarried at the time of birth, while the lowest percentage of unmarried women with births belong to 35 to 50 years age bracket with 8.6% of them unmarried.
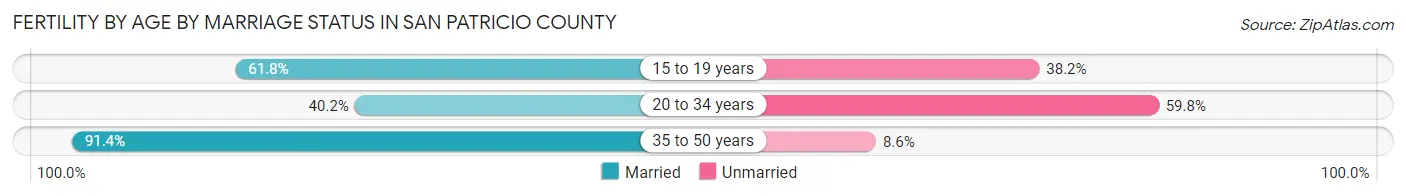
| Age Bracket | Married | Unmarried |
| 15 to 19 years | 68 (61.8%) | 42 (38.2%) |
| 20 to 34 years | 340 (40.2%) | 506 (59.8%) |
| 35 to 50 years | 128 (91.4%) | 12 (8.6%) |
| Total | 536 (48.9%) | 560 (51.1%) |
Fertility by Education in San Patricio County
Average fertility rate in San Patricio County is 71.0 births per 1,000 women. Women with the education attainment of high school diploma have the highest fertility rate of 115.0 births per 1,000 women, while women with the education attainment of less than high school have the lowest fertility at 27.0 births per 1,000 women. Women with the education attainment of high school diploma represent 47.4% of all women with births.
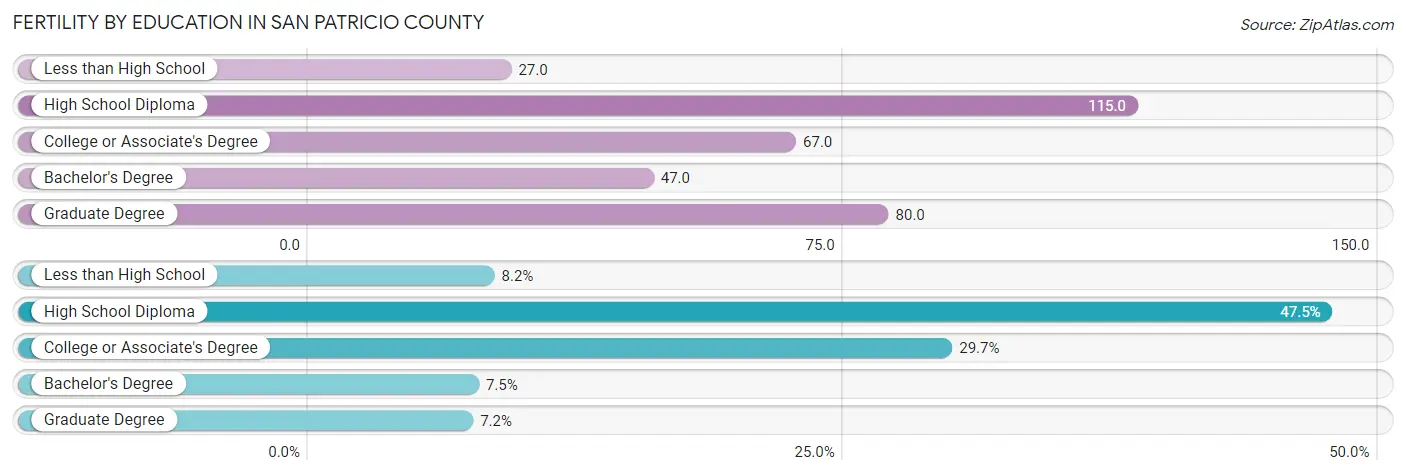
| Educational Attainment | Women with Births | Births / 1,000 Women |
| Less than High School | 90 (8.2%) | 27.0 |
| High School Diploma | 520 (47.4%) | 115.0 |
| College or Associate's Degree | 325 (29.6%) | 67.0 |
| Bachelor's Degree | 82 (7.5%) | 47.0 |
| Graduate Degree | 79 (7.2%) | 80.0 |
| Total | 1,096 (100.0%) | 71.0 |
Fertility by Education by Marriage Status in San Patricio County
51.1% of women with births in San Patricio County are unmarried. Women with the educational attainment of bachelor's degree are most likely to be married with 100.0% of them married at childbirth, while women with the educational attainment of less than high school are least likely to be married with 91.1% of them unmarried at childbirth.
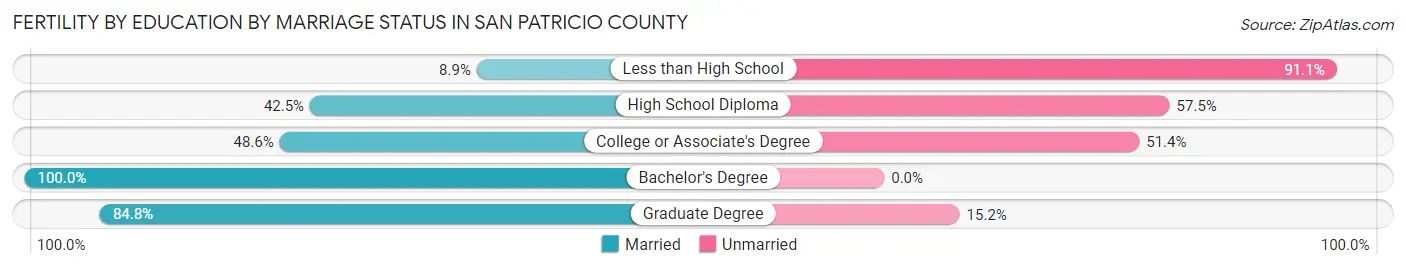
| Educational Attainment | Married | Unmarried |
| Less than High School | 8 (8.9%) | 82 (91.1%) |
| High School Diploma | 221 (42.5%) | 299 (57.5%) |
| College or Associate's Degree | 158 (48.6%) | 167 (51.4%) |
| Bachelor's Degree | 82 (100.0%) | 0 (0.0%) |
| Graduate Degree | 67 (84.8%) | 12 (15.2%) |
| Total | 536 (48.9%) | 560 (51.1%) |
Employment Characteristics in San Patricio County
Employment by Class of Employer in San Patricio County
Among the 28,393 employed individuals in San Patricio County, private company employees (20,407 | 71.9%), local government employees (2,759 | 9.7%), and not-for-profit organizations (1,497 | 5.3%) make up the most common classes of employment.
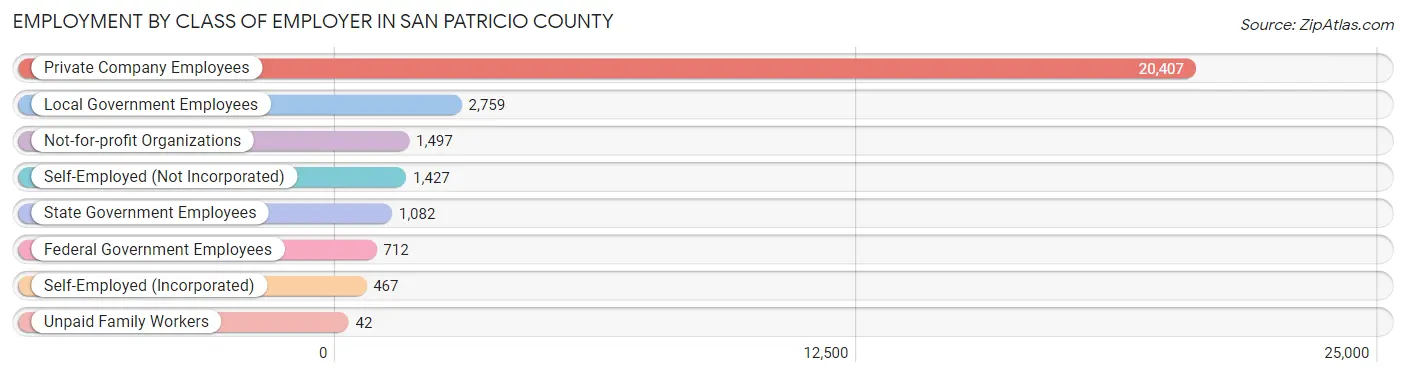
| Employer Class | # Employees | % Employees |
| Private Company Employees | 20,407 | 71.9% |
| Self-Employed (Incorporated) | 467 | 1.6% |
| Self-Employed (Not Incorporated) | 1,427 | 5.0% |
| Not-for-profit Organizations | 1,497 | 5.3% |
| Local Government Employees | 2,759 | 9.7% |
| State Government Employees | 1,082 | 3.8% |
| Federal Government Employees | 712 | 2.5% |
| Unpaid Family Workers | 42 | 0.2% |
| Total | 28,393 | 100.0% |
Employment Status by Age in San Patricio County
According to the labor force statistics for San Patricio County, out of the total population over 16 years of age (52,858), 57.1% or 30,182 individuals are in the labor force, with 4.4% or 1,328 of them unemployed. The age group with the highest labor force participation rate is 25 to 29 years, with 79.1% or 3,446 individuals in the labor force. Within the labor force, the 16 to 19 years age range has the highest percentage of unemployed individuals, with 16.0% or 98 of them being unemployed.
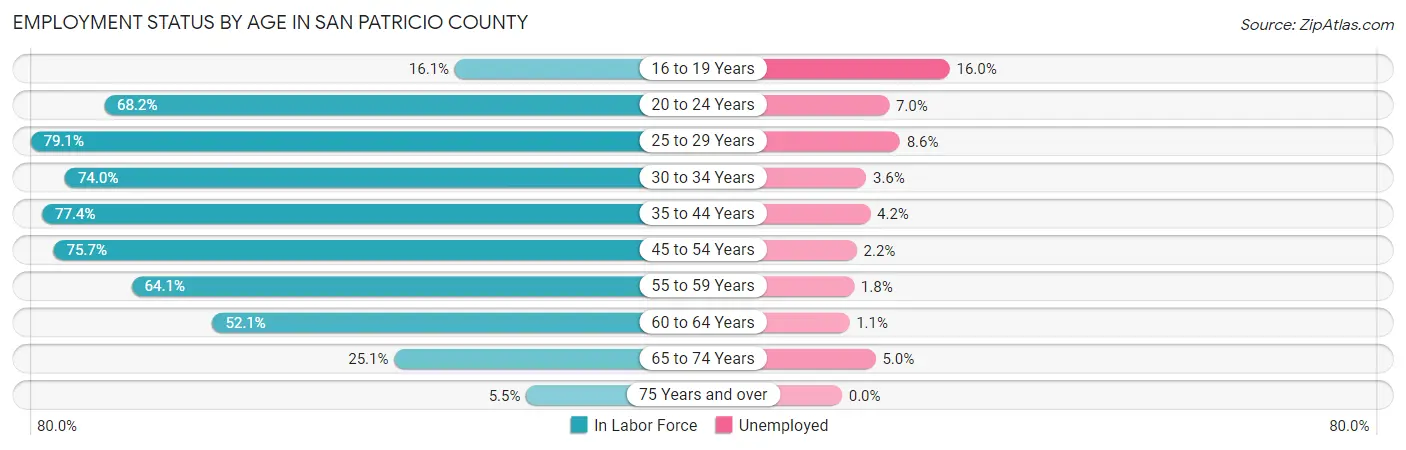
| Age Bracket | In Labor Force | Unemployed |
| 16 to 19 Years | 615 (16.1%) | 98 (16.0%) |
| 20 to 24 Years | 3,001 (68.2%) | 210 (7.0%) |
| 25 to 29 Years | 3,446 (79.1%) | 296 (8.6%) |
| 30 to 34 Years | 3,429 (74.0%) | 123 (3.6%) |
| 35 to 44 Years | 7,207 (77.4%) | 303 (4.2%) |
| 45 to 54 Years | 6,049 (75.7%) | 133 (2.2%) |
| 55 to 59 Years | 2,615 (64.1%) | 47 (1.8%) |
| 60 to 64 Years | 2,023 (52.1%) | 22 (1.1%) |
| 65 to 74 Years | 1,540 (25.1%) | 77 (5.0%) |
| 75 Years and over | 234 (5.5%) | 0 (0.0%) |
| Total | 30,182 (57.1%) | 1,328 (4.4%) |
Employment Status by Educational Attainment in San Patricio County
According to labor force statistics for San Patricio County, 72.3% of individuals (24,767) out of the total population between 25 and 64 years of age (34,256) are in the labor force, with 3.8% or 941 of them being unemployed. The group with the highest labor force participation rate are those with the educational attainment of bachelor's degree or higher, with 83.5% or 5,156 individuals in the labor force. Within the labor force, individuals with high school diploma education have the highest percentage of unemployment, with 5.9% or 513 of them being unemployed.
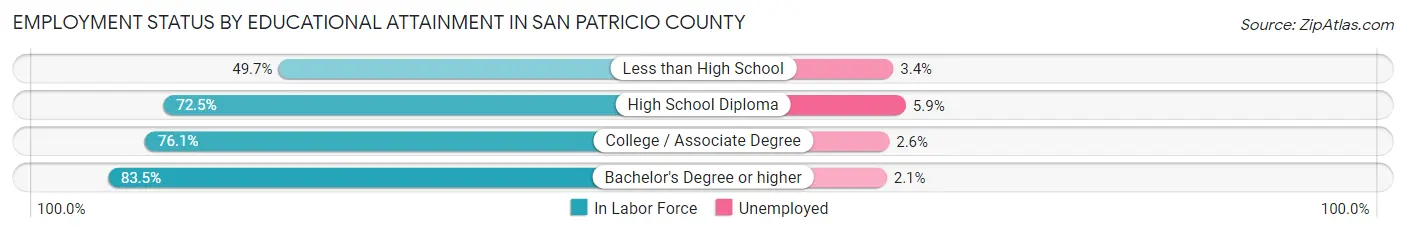
| Educational Attainment | In Labor Force | Unemployed |
| Less than High School | 2,485 (49.7%) | 170 (3.4%) |
| High School Diploma | 8,696 (72.5%) | 708 (5.9%) |
| College / Associate Degree | 8,436 (76.1%) | 288 (2.6%) |
| Bachelor's Degree or higher | 5,156 (83.5%) | 130 (2.1%) |
| Total | 24,767 (72.3%) | 1,302 (3.8%) |
Employment Occupations by Sex in San Patricio County
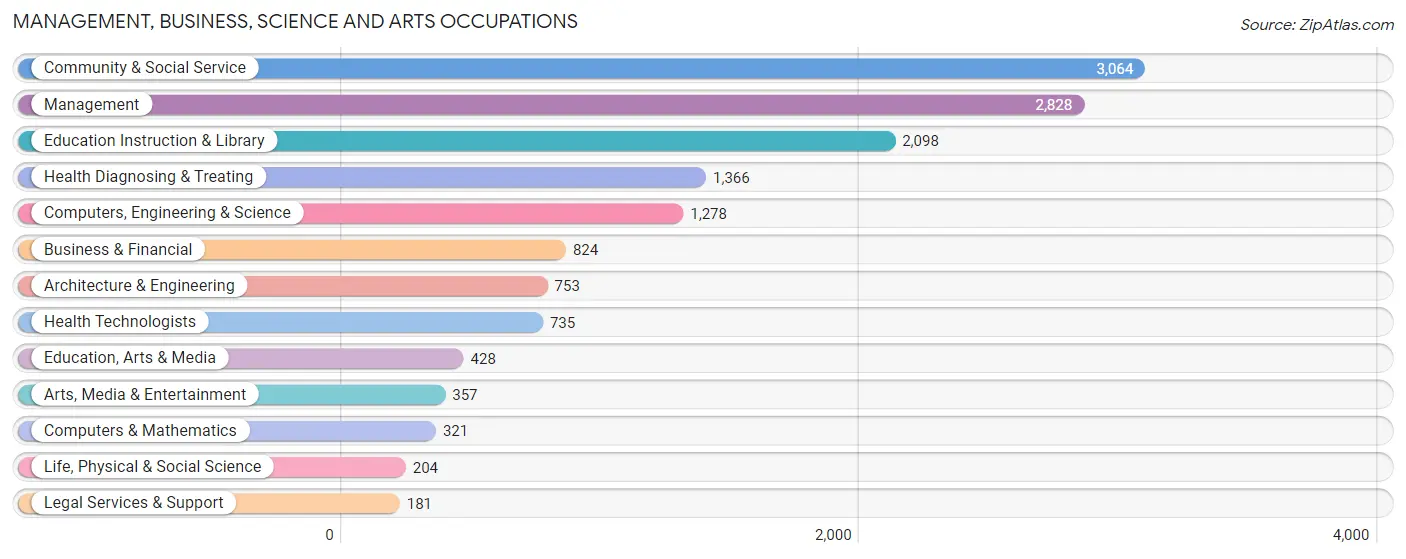
Management, Business, Science and Arts Occupations
The most common Management, Business, Science and Arts occupations in San Patricio County are Community & Social Service (3,064 | 10.7%), Management (2,828 | 9.9%), Education Instruction & Library (2,098 | 7.3%), Health Diagnosing & Treating (1,366 | 4.8%), and Computers, Engineering & Science (1,278 | 4.5%).
Management, Business, Science and Arts Occupations by Sex
Within the Management, Business, Science and Arts occupations in San Patricio County, the most male-oriented occupations are Architecture & Engineering (91.2%), Life, Physical & Social Science (87.3%), and Computers, Engineering & Science (86.9%), while the most female-oriented occupations are Education, Arts & Media (83.6%), Education Instruction & Library (81.3%), and Community & Social Service (75.2%).
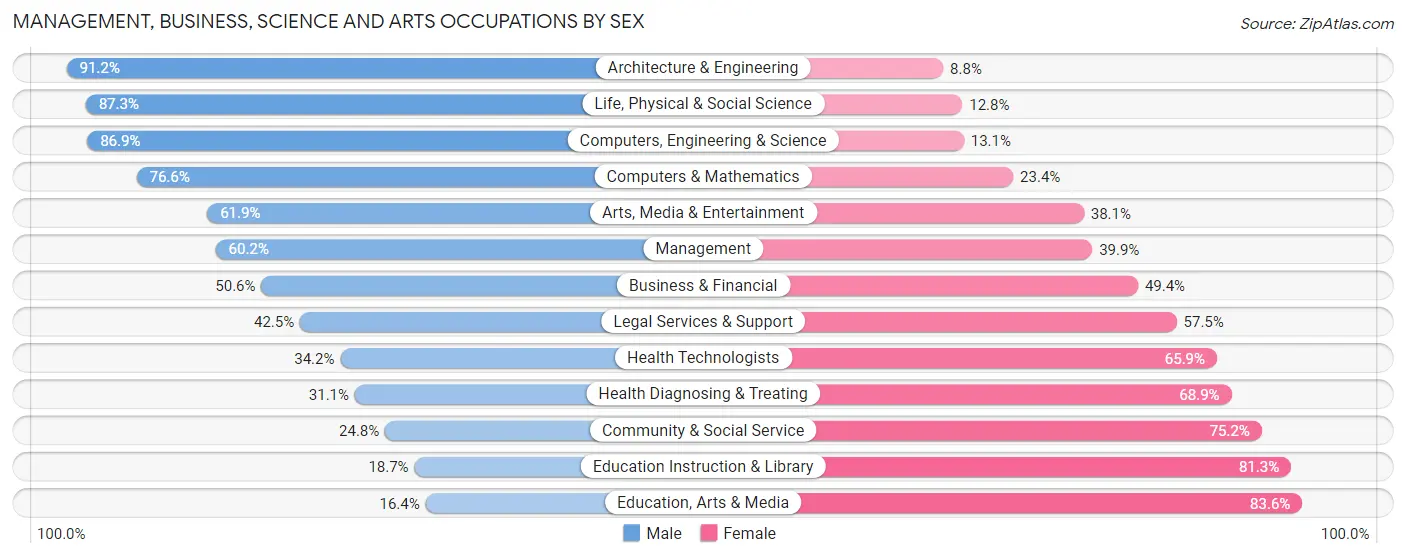
| Occupation | Male | Female |
| Management | 1,701 (60.2%) | 1,127 (39.9%) |
| Business & Financial | 417 (50.6%) | 407 (49.4%) |
| Computers, Engineering & Science | 1,111 (86.9%) | 167 (13.1%) |
| Computers & Mathematics | 246 (76.6%) | 75 (23.4%) |
| Architecture & Engineering | 687 (91.2%) | 66 (8.8%) |
| Life, Physical & Social Science | 178 (87.3%) | 26 (12.8%) |
| Community & Social Service | 760 (24.8%) | 2,304 (75.2%) |
| Education, Arts & Media | 70 (16.4%) | 358 (83.6%) |
| Legal Services & Support | 77 (42.5%) | 104 (57.5%) |
| Education Instruction & Library | 392 (18.7%) | 1,706 (81.3%) |
| Arts, Media & Entertainment | 221 (61.9%) | 136 (38.1%) |
| Health Diagnosing & Treating | 425 (31.1%) | 941 (68.9%) |
| Health Technologists | 251 (34.2%) | 484 (65.8%) |
| Total (Category) | 4,414 (47.2%) | 4,946 (52.8%) |
| Total (Overall) | 16,330 (56.9%) | 12,355 (43.1%) |
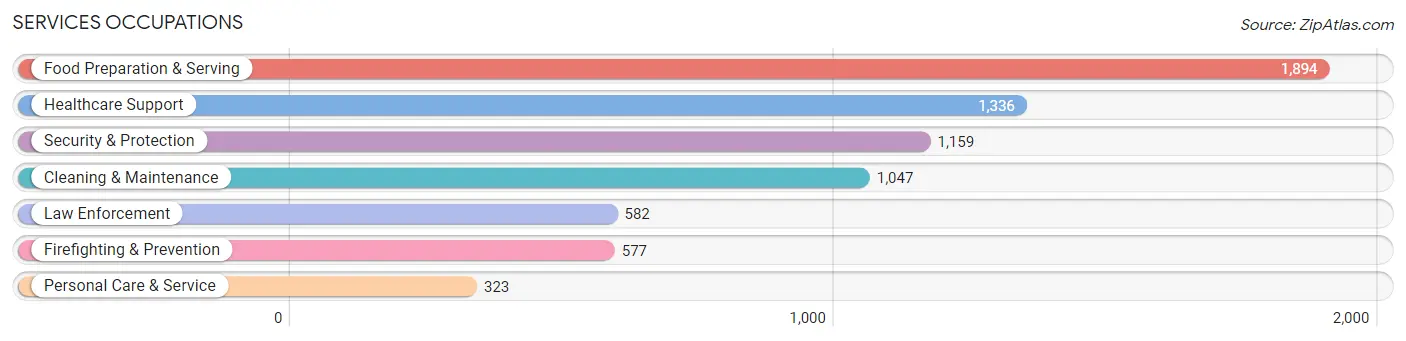
Services Occupations
The most common Services occupations in San Patricio County are Food Preparation & Serving (1,894 | 6.6%), Healthcare Support (1,336 | 4.7%), Security & Protection (1,159 | 4.0%), Cleaning & Maintenance (1,047 | 3.6%), and Law Enforcement (582 | 2.0%).
Services Occupations by Sex
Within the Services occupations in San Patricio County, the most male-oriented occupations are Firefighting & Prevention (89.9%), Security & Protection (79.8%), and Law Enforcement (69.8%), while the most female-oriented occupations are Healthcare Support (84.0%), Food Preparation & Serving (66.2%), and Personal Care & Service (61.0%).
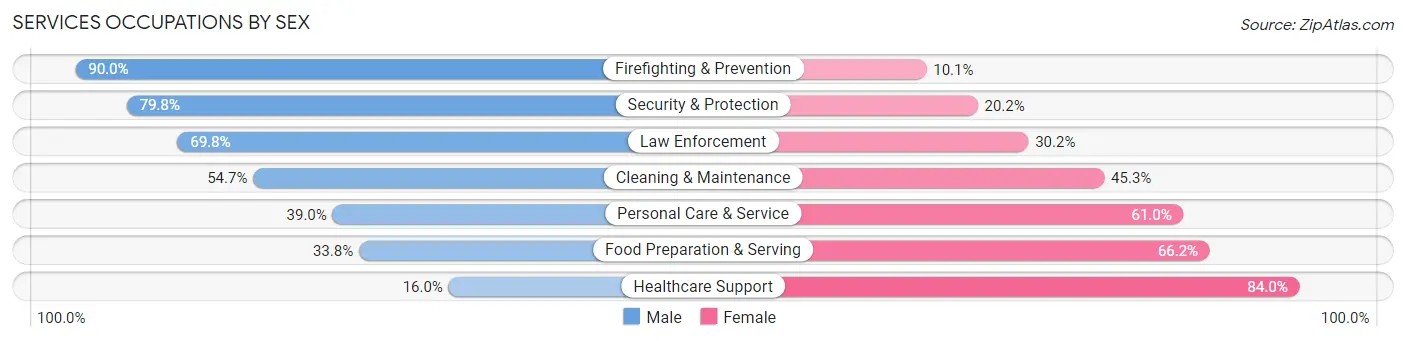
| Occupation | Male | Female |
| Healthcare Support | 214 (16.0%) | 1,122 (84.0%) |
| Security & Protection | 925 (79.8%) | 234 (20.2%) |
| Firefighting & Prevention | 519 (89.9%) | 58 (10.1%) |
| Law Enforcement | 406 (69.8%) | 176 (30.2%) |
| Food Preparation & Serving | 640 (33.8%) | 1,254 (66.2%) |
| Cleaning & Maintenance | 573 (54.7%) | 474 (45.3%) |
| Personal Care & Service | 126 (39.0%) | 197 (61.0%) |
| Total (Category) | 2,478 (43.0%) | 3,281 (57.0%) |
| Total (Overall) | 16,330 (56.9%) | 12,355 (43.1%) |
Sales and Office Occupations
The most common Sales and Office occupations in San Patricio County are Office & Administration (2,745 | 9.6%), and Sales & Related (2,422 | 8.4%).

Sales and Office Occupations by Sex

| Occupation | Male | Female |
| Sales & Related | 1,048 (43.3%) | 1,374 (56.7%) |
| Office & Administration | 586 (21.3%) | 2,159 (78.6%) |
| Total (Category) | 1,634 (31.6%) | 3,533 (68.4%) |
| Total (Overall) | 16,330 (56.9%) | 12,355 (43.1%) |
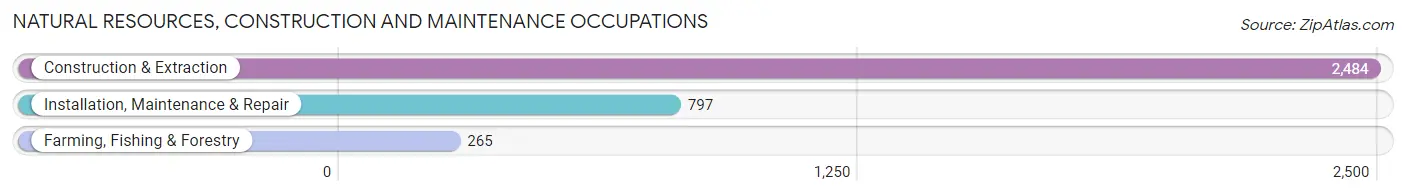
Natural Resources, Construction and Maintenance Occupations
The most common Natural Resources, Construction and Maintenance occupations in San Patricio County are Construction & Extraction (2,484 | 8.7%), Installation, Maintenance & Repair (797 | 2.8%), and Farming, Fishing & Forestry (265 | 0.9%).
Natural Resources, Construction and Maintenance Occupations by Sex

| Occupation | Male | Female |
| Farming, Fishing & Forestry | 264 (99.6%) | 1 (0.4%) |
| Construction & Extraction | 2,461 (99.1%) | 23 (0.9%) |
| Installation, Maintenance & Repair | 761 (95.5%) | 36 (4.5%) |
| Total (Category) | 3,486 (98.3%) | 60 (1.7%) |
| Total (Overall) | 16,330 (56.9%) | 12,355 (43.1%) |
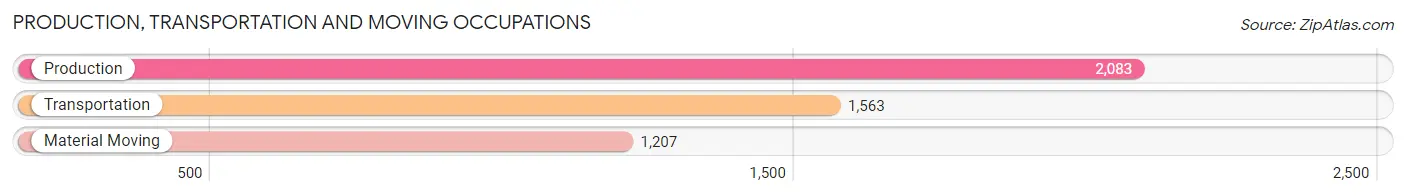
Production, Transportation and Moving Occupations
The most common Production, Transportation and Moving occupations in San Patricio County are Production (2,083 | 7.3%), Transportation (1,563 | 5.4%), and Material Moving (1,207 | 4.2%).
Production, Transportation and Moving Occupations by Sex
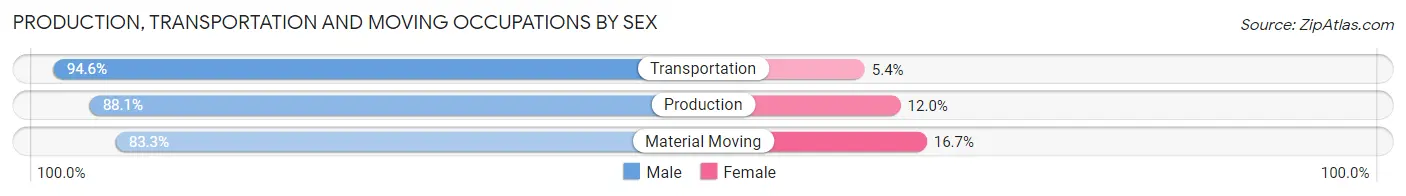
| Occupation | Male | Female |
| Production | 1,834 (88.0%) | 249 (11.9%) |
| Transportation | 1,479 (94.6%) | 84 (5.4%) |
| Material Moving | 1,005 (83.3%) | 202 (16.7%) |
| Total (Category) | 4,318 (89.0%) | 535 (11.0%) |
| Total (Overall) | 16,330 (56.9%) | 12,355 (43.1%) |
Employment Industries by Sex in San Patricio County
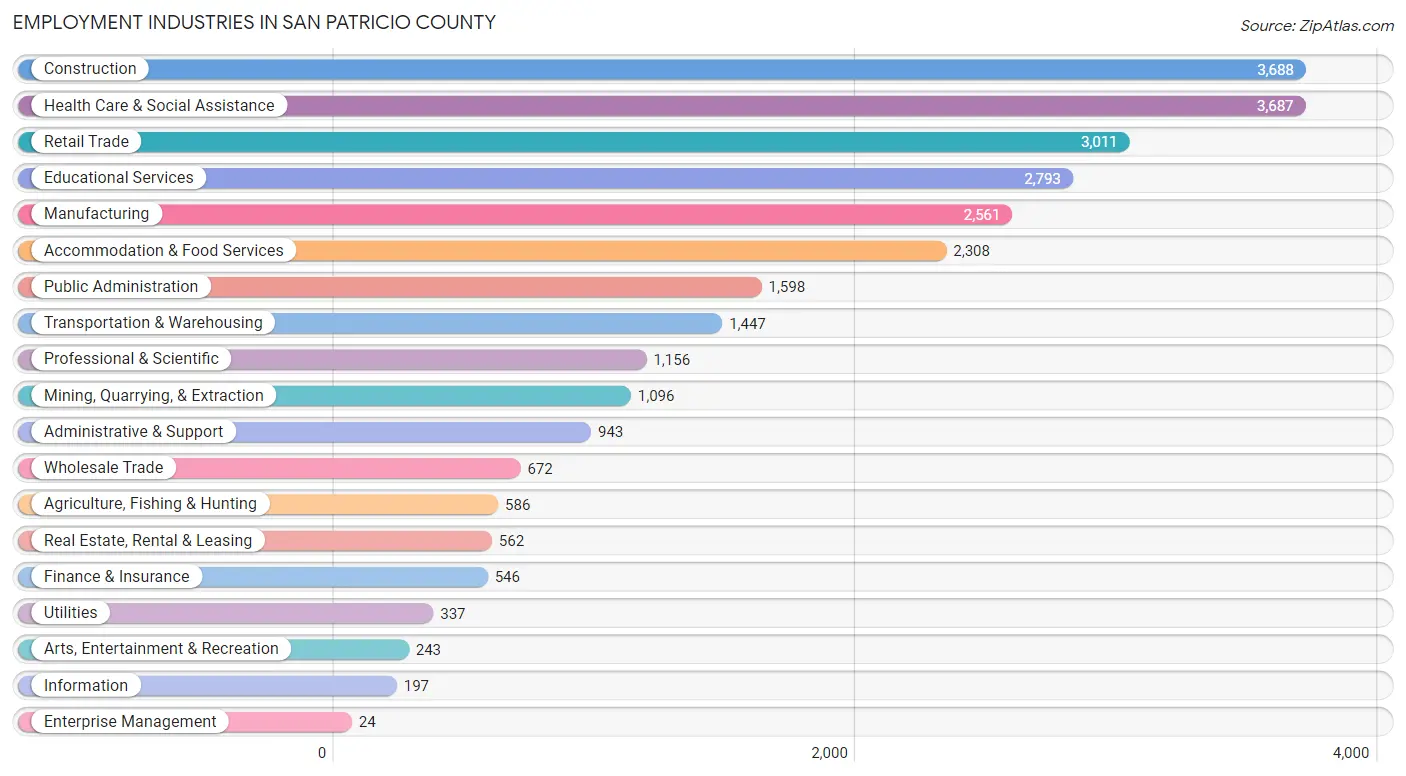
Employment Industries in San Patricio County
The major employment industries in San Patricio County include Construction (3,688 | 12.9%), Health Care & Social Assistance (3,687 | 12.9%), Retail Trade (3,011 | 10.5%), Educational Services (2,793 | 9.7%), and Manufacturing (2,561 | 8.9%).
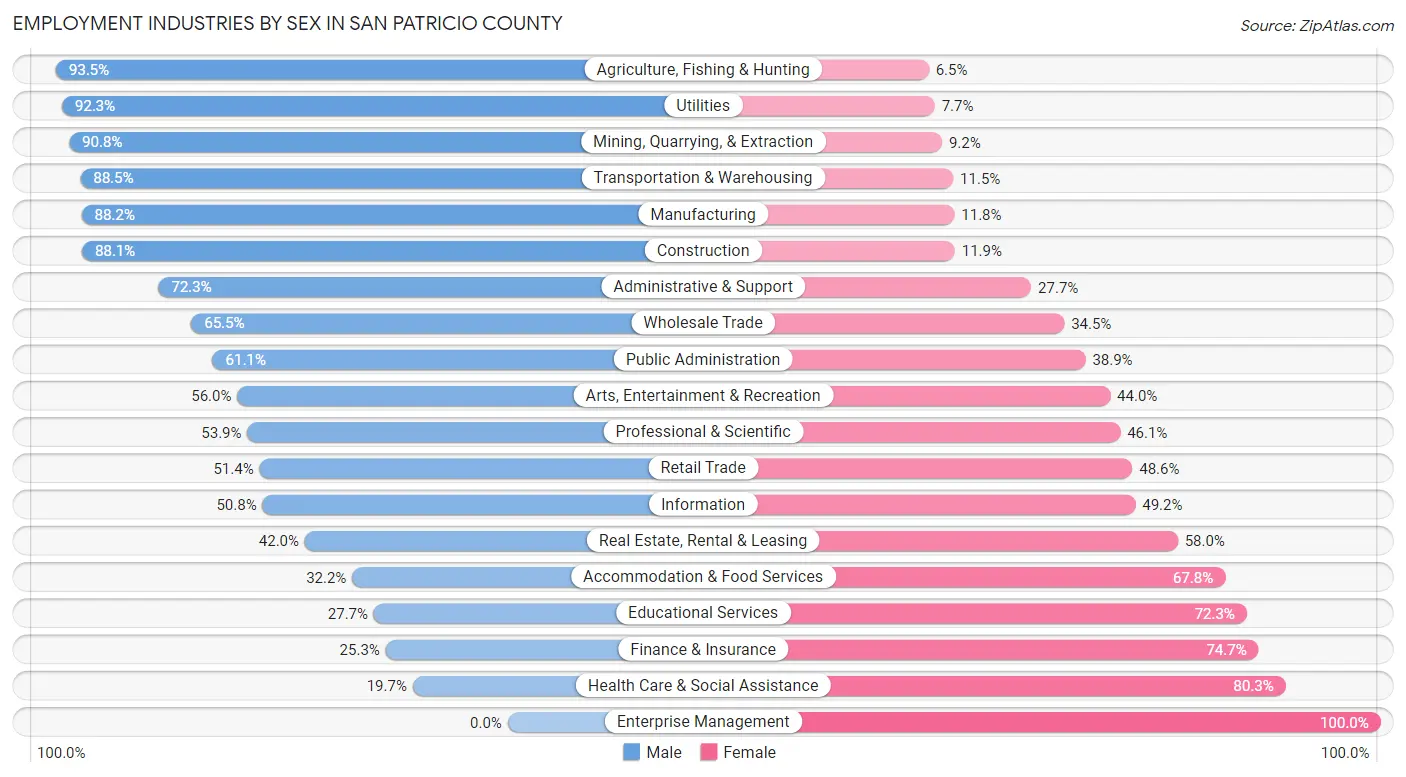
Employment Industries by Sex in San Patricio County
The San Patricio County industries that see more men than women are Agriculture, Fishing & Hunting (93.5%), Utilities (92.3%), and Mining, Quarrying, & Extraction (90.8%), whereas the industries that tend to have a higher number of women are Enterprise Management (100.0%), Health Care & Social Assistance (80.3%), and Finance & Insurance (74.7%).
| Industry | Male | Female |
| Agriculture, Fishing & Hunting | 548 (93.5%) | 38 (6.5%) |
| Mining, Quarrying, & Extraction | 995 (90.8%) | 101 (9.2%) |
| Construction | 3,250 (88.1%) | 438 (11.9%) |
| Manufacturing | 2,259 (88.2%) | 302 (11.8%) |
| Wholesale Trade | 440 (65.5%) | 232 (34.5%) |
| Retail Trade | 1,547 (51.4%) | 1,464 (48.6%) |
| Transportation & Warehousing | 1,280 (88.5%) | 167 (11.5%) |
| Utilities | 311 (92.3%) | 26 (7.7%) |
| Information | 100 (50.8%) | 97 (49.2%) |
| Finance & Insurance | 138 (25.3%) | 408 (74.7%) |
| Real Estate, Rental & Leasing | 236 (42.0%) | 326 (58.0%) |
| Professional & Scientific | 623 (53.9%) | 533 (46.1%) |
| Enterprise Management | 0 (0.0%) | 24 (100.0%) |
| Administrative & Support | 682 (72.3%) | 261 (27.7%) |
| Educational Services | 774 (27.7%) | 2,019 (72.3%) |
| Health Care & Social Assistance | 725 (19.7%) | 2,962 (80.3%) |
| Arts, Entertainment & Recreation | 136 (56.0%) | 107 (44.0%) |
| Accommodation & Food Services | 743 (32.2%) | 1,565 (67.8%) |
| Public Administration | 976 (61.1%) | 622 (38.9%) |
| Total | 16,330 (56.9%) | 12,355 (43.1%) |
Education in San Patricio County
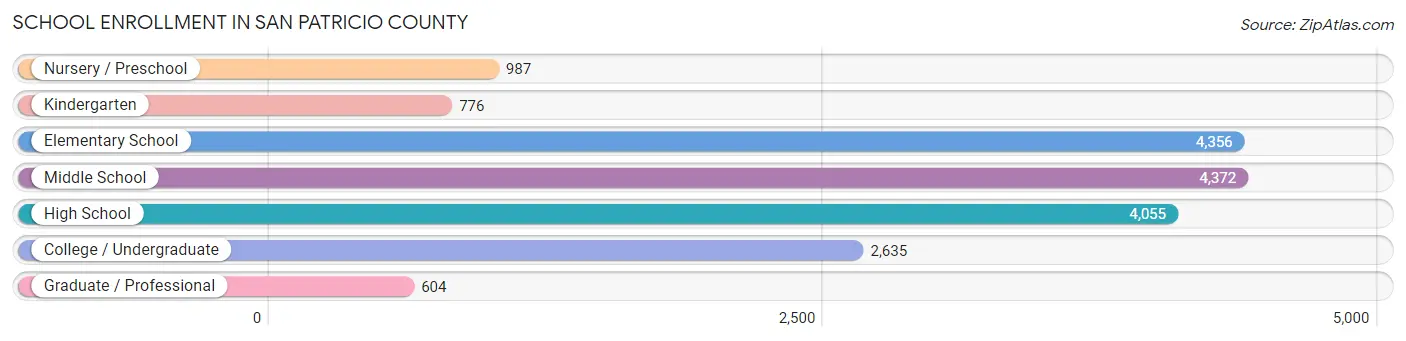
School Enrollment in San Patricio County
The most common levels of schooling among the 17,785 students in San Patricio County are middle school (4,372 | 24.6%), elementary school (4,356 | 24.5%), and high school (4,055 | 22.8%).
| School Level | # Students | % Students |
| Nursery / Preschool | 987 | 5.6% |
| Kindergarten | 776 | 4.4% |
| Elementary School | 4,356 | 24.5% |
| Middle School | 4,372 | 24.6% |
| High School | 4,055 | 22.8% |
| College / Undergraduate | 2,635 | 14.8% |
| Graduate / Professional | 604 | 3.4% |
| Total | 17,785 | 100.0% |
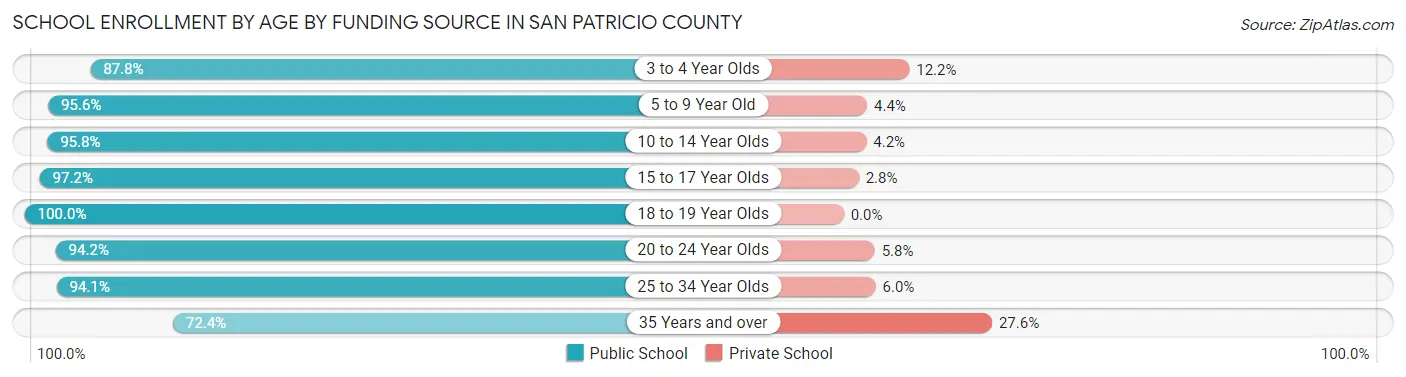
School Enrollment by Age by Funding Source in San Patricio County
Out of a total of 17,785 students who are enrolled in schools in San Patricio County, 925 (5.2%) attend a private institution, while the remaining 16,860 (94.8%) are enrolled in public schools. The age group of 35 years and over has the highest likelihood of being enrolled in private schools, with 192 (27.6% in the age bracket) enrolled. Conversely, the age group of 18 to 19 year olds has the lowest likelihood of being enrolled in a private school, with 933 (100.0% in the age bracket) attending a public institution.
| Age Bracket | Public School | Private School |
| 3 to 4 Year Olds | 653 (87.8%) | 91 (12.2%) |
| 5 to 9 Year Old | 4,429 (95.6%) | 202 (4.4%) |
| 10 to 14 Year Olds | 5,219 (95.8%) | 230 (4.2%) |
| 15 to 17 Year Olds | 2,983 (97.2%) | 86 (2.8%) |
| 18 to 19 Year Olds | 933 (100.0%) | 0 (0.0%) |
| 20 to 24 Year Olds | 1,531 (94.2%) | 94 (5.8%) |
| 25 to 34 Year Olds | 601 (94.1%) | 38 (5.9%) |
| 35 Years and over | 503 (72.4%) | 192 (27.6%) |
| Total | 16,860 (94.8%) | 925 (5.2%) |
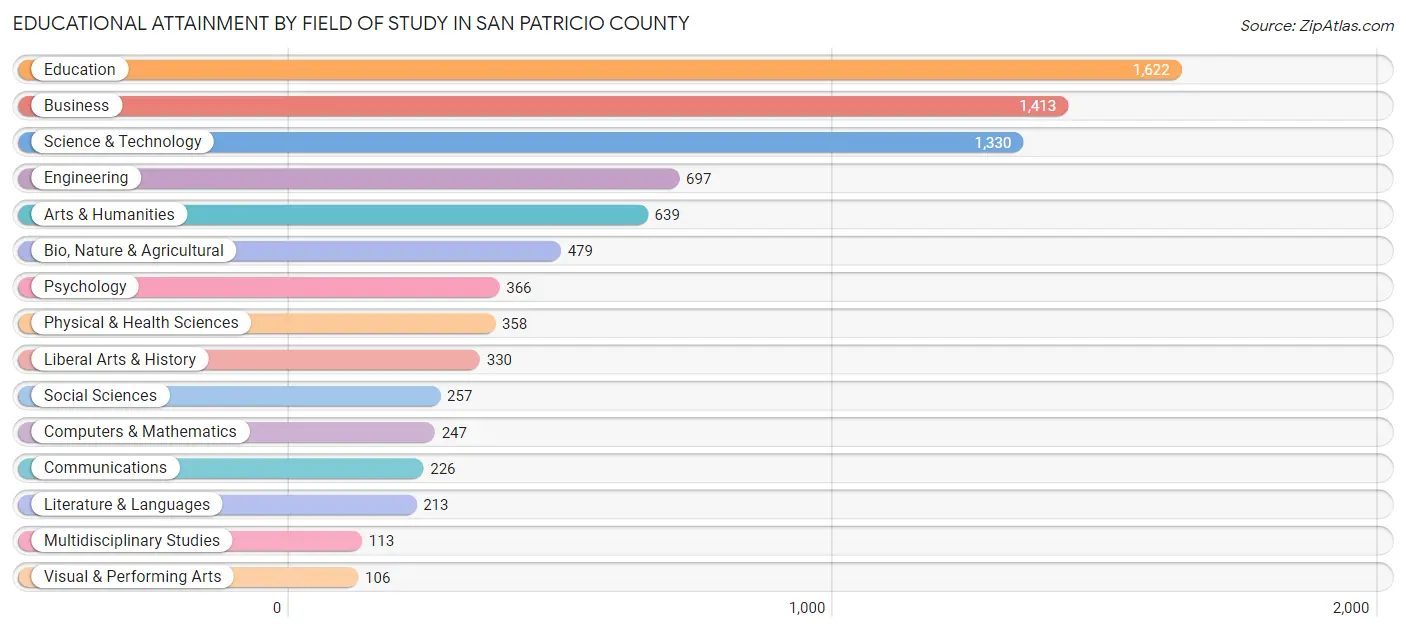
Educational Attainment by Field of Study in San Patricio County
Education (1,622 | 19.3%), business (1,413 | 16.8%), science & technology (1,330 | 15.8%), engineering (697 | 8.3%), and arts & humanities (639 | 7.6%) are the most common fields of study among 8,396 individuals in San Patricio County who have obtained a bachelor's degree or higher.
| Field of Study | # Graduates | % Graduates |
| Computers & Mathematics | 247 | 2.9% |
| Bio, Nature & Agricultural | 479 | 5.7% |
| Physical & Health Sciences | 358 | 4.3% |
| Psychology | 366 | 4.4% |
| Social Sciences | 257 | 3.1% |
| Engineering | 697 | 8.3% |
| Multidisciplinary Studies | 113 | 1.3% |
| Science & Technology | 1,330 | 15.8% |
| Business | 1,413 | 16.8% |
| Education | 1,622 | 19.3% |
| Literature & Languages | 213 | 2.5% |
| Liberal Arts & History | 330 | 3.9% |
| Visual & Performing Arts | 106 | 1.3% |
| Communications | 226 | 2.7% |
| Arts & Humanities | 639 | 7.6% |
| Total | 8,396 | 100.0% |
Transportation & Commute in San Patricio County
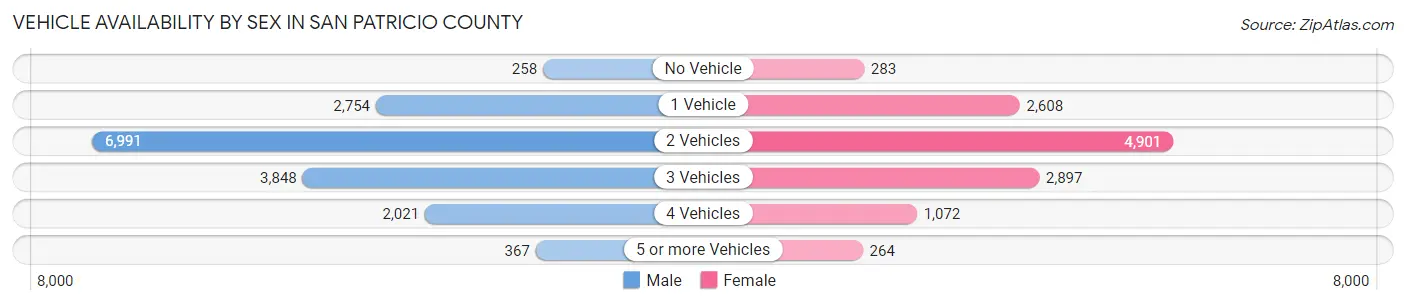
Vehicle Availability by Sex in San Patricio County
The most prevalent vehicle ownership categories in San Patricio County are males with 2 vehicles (6,991, accounting for 43.0%) and females with 2 vehicles (4,901, making up 58.1%).
| Vehicles Available | Male | Female |
| No Vehicle | 258 (1.6%) | 283 (2.4%) |
| 1 Vehicle | 2,754 (17.0%) | 2,608 (21.7%) |
| 2 Vehicles | 6,991 (43.0%) | 4,901 (40.8%) |
| 3 Vehicles | 3,848 (23.7%) | 2,897 (24.1%) |
| 4 Vehicles | 2,021 (12.4%) | 1,072 (8.9%) |
| 5 or more Vehicles | 367 (2.3%) | 264 (2.2%) |
| Total | 16,239 (100.0%) | 12,025 (100.0%) |
Commute Time in San Patricio County
The most frequently occuring commute durations in San Patricio County are 5 to 9 minutes (4,515 commuters, 16.7%), 15 to 19 minutes (3,686 commuters, 13.7%), and 30 to 34 minutes (3,644 commuters, 13.5%).
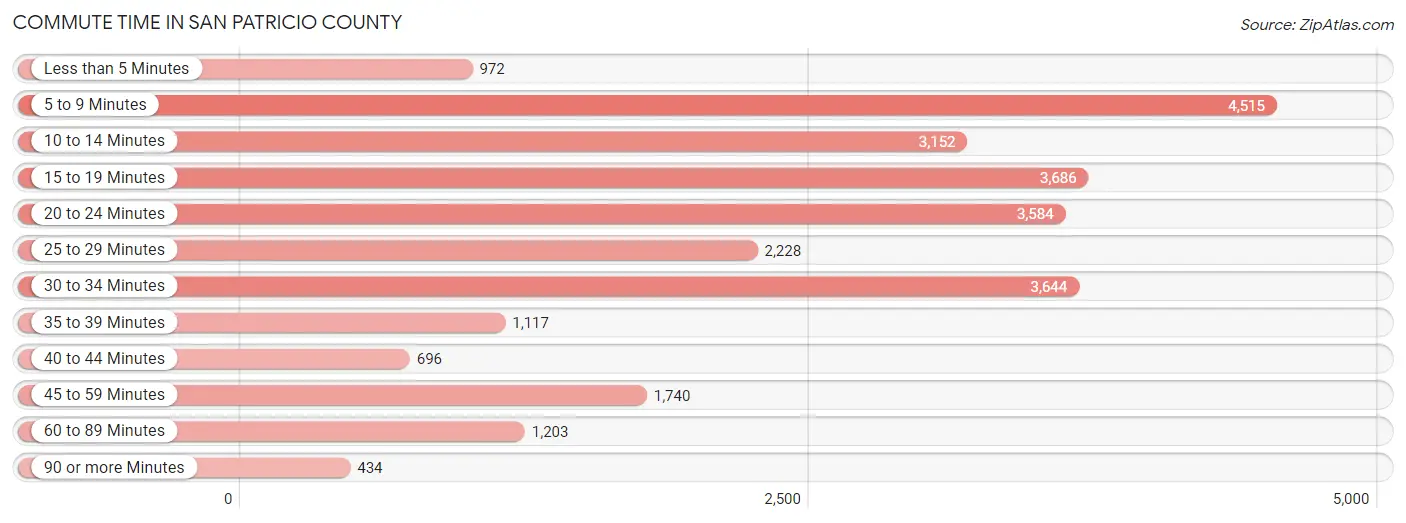
| Commute Time | # Commuters | % Commuters |
| Less than 5 Minutes | 972 | 3.6% |
| 5 to 9 Minutes | 4,515 | 16.7% |
| 10 to 14 Minutes | 3,152 | 11.7% |
| 15 to 19 Minutes | 3,686 | 13.7% |
| 20 to 24 Minutes | 3,584 | 13.3% |
| 25 to 29 Minutes | 2,228 | 8.3% |
| 30 to 34 Minutes | 3,644 | 13.5% |
| 35 to 39 Minutes | 1,117 | 4.1% |
| 40 to 44 Minutes | 696 | 2.6% |
| 45 to 59 Minutes | 1,740 | 6.5% |
| 60 to 89 Minutes | 1,203 | 4.5% |
| 90 or more Minutes | 434 | 1.6% |
Commute Time by Sex in San Patricio County
The most common commute times in San Patricio County are 30 to 34 minutes (2,471 commuters, 15.8%) for males and 5 to 9 minutes (2,696 commuters, 23.9%) for females.
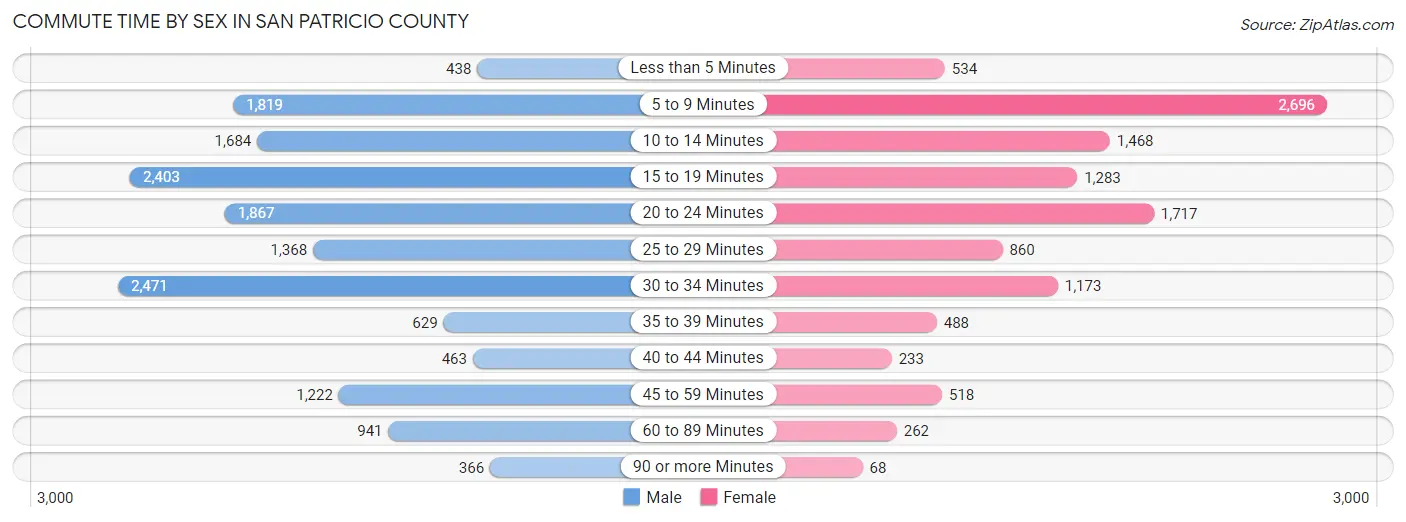
| Commute Time | Male | Female |
| Less than 5 Minutes | 438 (2.8%) | 534 (4.7%) |
| 5 to 9 Minutes | 1,819 (11.6%) | 2,696 (23.9%) |
| 10 to 14 Minutes | 1,684 (10.7%) | 1,468 (13.0%) |
| 15 to 19 Minutes | 2,403 (15.3%) | 1,283 (11.4%) |
| 20 to 24 Minutes | 1,867 (11.9%) | 1,717 (15.2%) |
| 25 to 29 Minutes | 1,368 (8.7%) | 860 (7.6%) |
| 30 to 34 Minutes | 2,471 (15.8%) | 1,173 (10.4%) |
| 35 to 39 Minutes | 629 (4.0%) | 488 (4.3%) |
| 40 to 44 Minutes | 463 (2.9%) | 233 (2.1%) |
| 45 to 59 Minutes | 1,222 (7.8%) | 518 (4.6%) |
| 60 to 89 Minutes | 941 (6.0%) | 262 (2.3%) |
| 90 or more Minutes | 366 (2.3%) | 68 (0.6%) |
Time of Departure to Work by Sex in San Patricio County
The most frequent times of departure to work in San Patricio County are 6:00 AM to 6:29 AM (2,576, 16.4%) for males and 7:30 AM to 7:59 AM (2,292, 20.3%) for females.
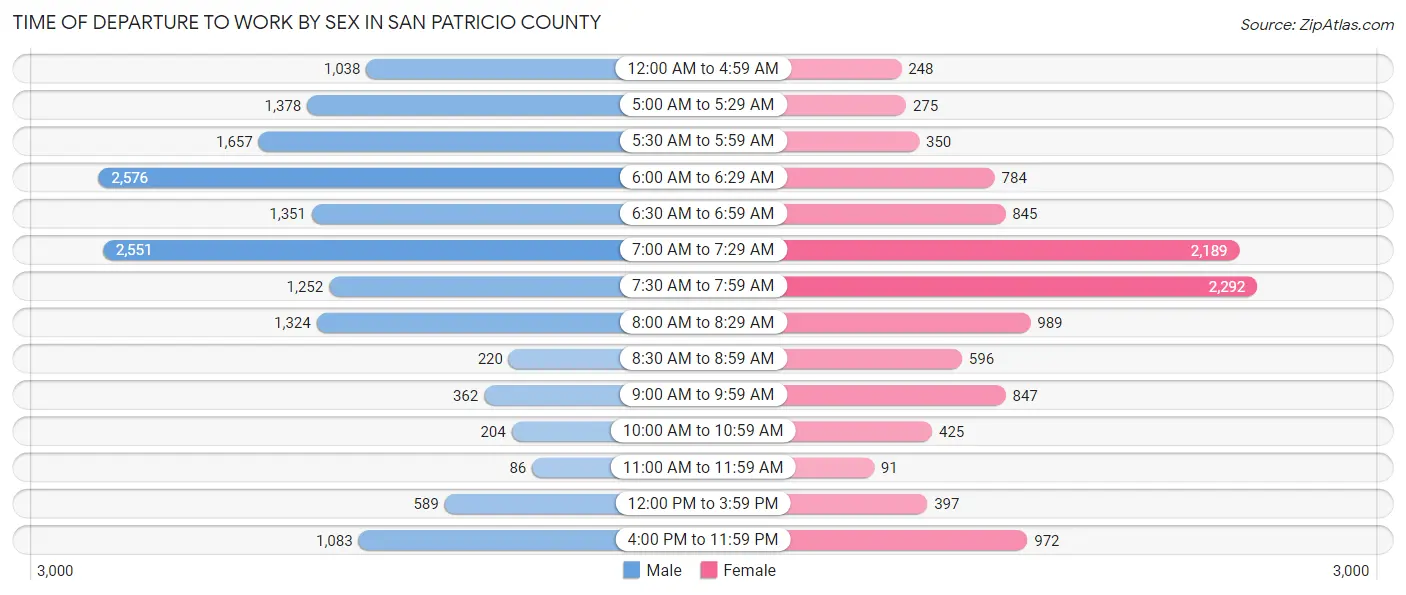
| Time of Departure | Male | Female |
| 12:00 AM to 4:59 AM | 1,038 (6.6%) | 248 (2.2%) |
| 5:00 AM to 5:29 AM | 1,378 (8.8%) | 275 (2.4%) |
| 5:30 AM to 5:59 AM | 1,657 (10.6%) | 350 (3.1%) |
| 6:00 AM to 6:29 AM | 2,576 (16.4%) | 784 (6.9%) |
| 6:30 AM to 6:59 AM | 1,351 (8.6%) | 845 (7.5%) |
| 7:00 AM to 7:29 AM | 2,551 (16.3%) | 2,189 (19.4%) |
| 7:30 AM to 7:59 AM | 1,252 (8.0%) | 2,292 (20.3%) |
| 8:00 AM to 8:29 AM | 1,324 (8.5%) | 989 (8.7%) |
| 8:30 AM to 8:59 AM | 220 (1.4%) | 596 (5.3%) |
| 9:00 AM to 9:59 AM | 362 (2.3%) | 847 (7.5%) |
| 10:00 AM to 10:59 AM | 204 (1.3%) | 425 (3.8%) |
| 11:00 AM to 11:59 AM | 86 (0.5%) | 91 (0.8%) |
| 12:00 PM to 3:59 PM | 589 (3.8%) | 397 (3.5%) |
| 4:00 PM to 11:59 PM | 1,083 (6.9%) | 972 (8.6%) |
| Total | 15,671 (100.0%) | 11,300 (100.0%) |
Housing Occupancy in San Patricio County
Occupancy by Ownership in San Patricio County
Of the total 23,920 dwellings in San Patricio County, owner-occupied units account for 16,229 (67.8%), while renter-occupied units make up 7,691 (32.2%).
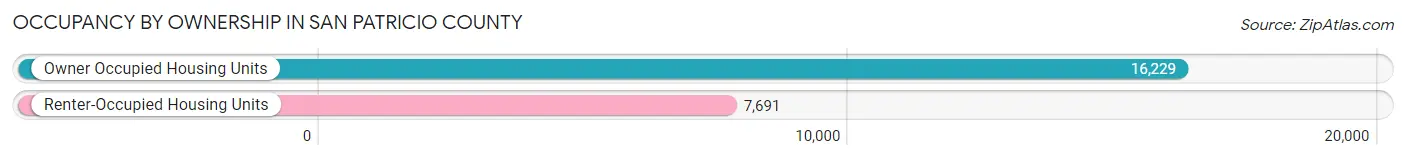
| Occupancy | # Housing Units | % Housing Units |
| Owner Occupied Housing Units | 16,229 | 67.8% |
| Renter-Occupied Housing Units | 7,691 | 32.2% |
| Total Occupied Housing Units | 23,920 | 100.0% |
Occupancy by Household Size in San Patricio County
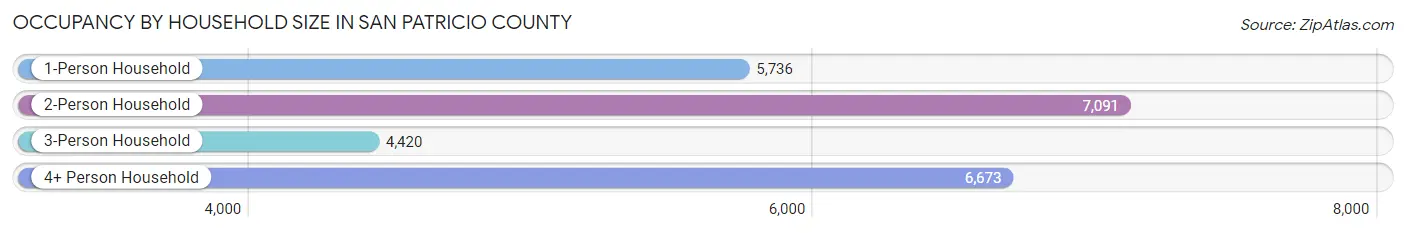
| Household Size | # Housing Units | % Housing Units |
| 1-Person Household | 5,736 | 24.0% |
| 2-Person Household | 7,091 | 29.6% |
| 3-Person Household | 4,420 | 18.5% |
| 4+ Person Household | 6,673 | 27.9% |
| Total Housing Units | 23,920 | 100.0% |
Occupancy by Ownership by Household Size in San Patricio County
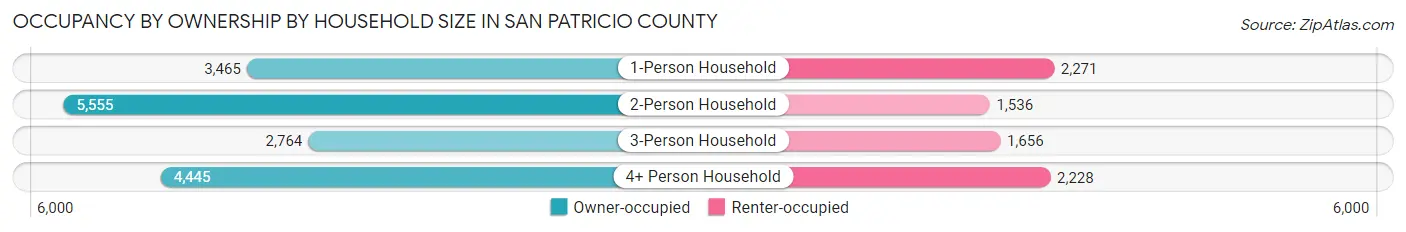
| Household Size | Owner-occupied | Renter-occupied |
| 1-Person Household | 3,465 (60.4%) | 2,271 (39.6%) |
| 2-Person Household | 5,555 (78.3%) | 1,536 (21.7%) |
| 3-Person Household | 2,764 (62.5%) | 1,656 (37.5%) |
| 4+ Person Household | 4,445 (66.6%) | 2,228 (33.4%) |
| Total Housing Units | 16,229 (67.8%) | 7,691 (32.2%) |
Occupancy by Educational Attainment in San Patricio County
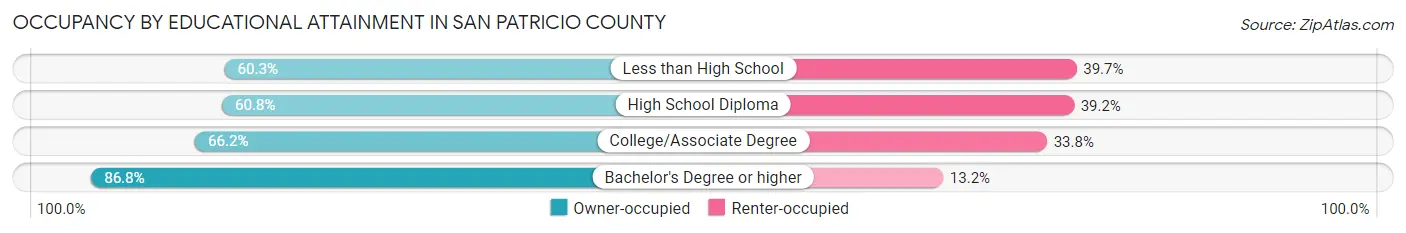
| Household Size | Owner-occupied | Renter-occupied |
| Less than High School | 2,217 (60.3%) | 1,458 (39.7%) |
| High School Diploma | 4,550 (60.8%) | 2,929 (39.2%) |
| College/Associate Degree | 5,192 (66.2%) | 2,653 (33.8%) |
| Bachelor's Degree or higher | 4,270 (86.8%) | 651 (13.2%) |
Occupancy by Age of Householder in San Patricio County
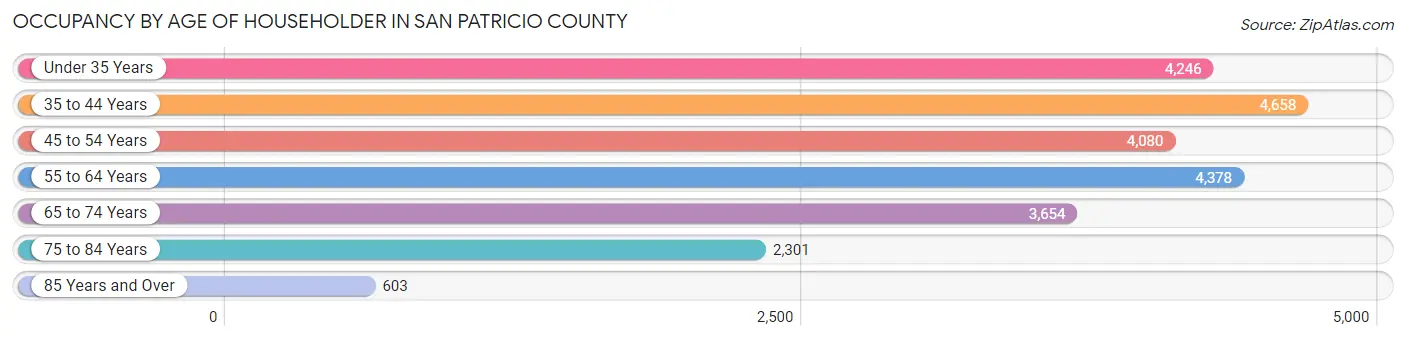
| Age Bracket | # Households | % Households |
| Under 35 Years | 4,246 | 17.7% |
| 35 to 44 Years | 4,658 | 19.5% |
| 45 to 54 Years | 4,080 | 17.1% |
| 55 to 64 Years | 4,378 | 18.3% |
| 65 to 74 Years | 3,654 | 15.3% |
| 75 to 84 Years | 2,301 | 9.6% |
| 85 Years and Over | 603 | 2.5% |
| Total | 23,920 | 100.0% |
Housing Finances in San Patricio County
Median Income by Occupancy in San Patricio County
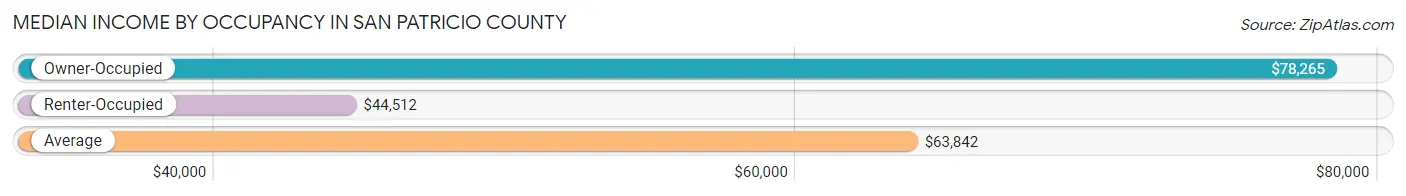
| Occupancy Type | # Households | Median Income |
| Owner-Occupied | 16,229 (67.8%) | $78,265 |
| Renter-Occupied | 7,691 (32.2%) | $44,512 |
| Average | 23,920 (100.0%) | $63,842 |
Occupancy by Householder Income Bracket in San Patricio County
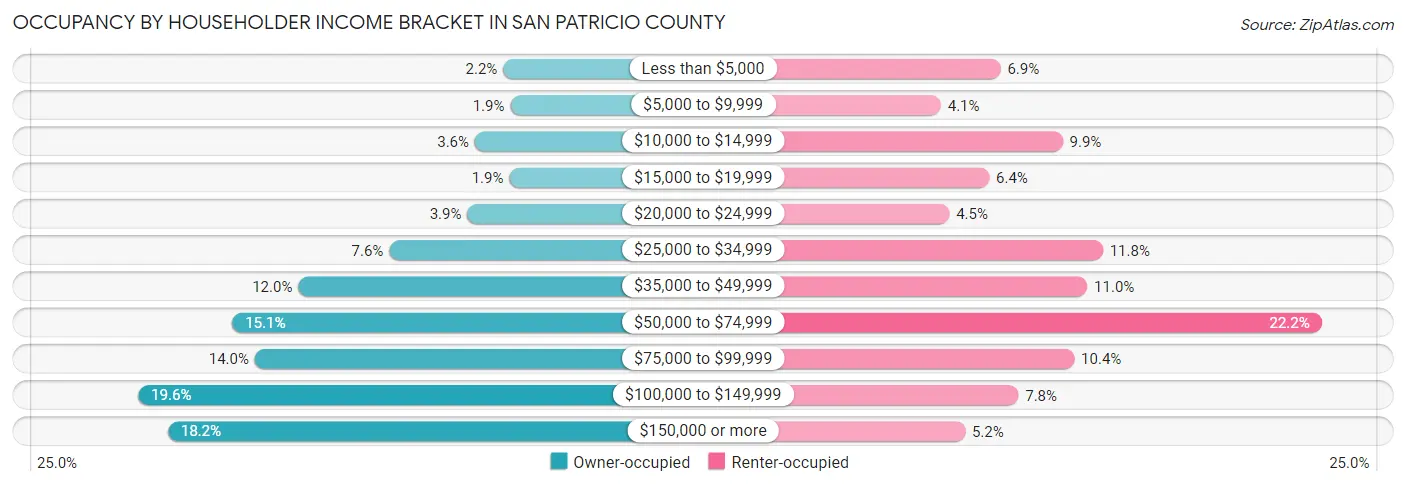
| Income Bracket | Owner-occupied | Renter-occupied |
| Less than $5,000 | 359 (2.2%) | 531 (6.9%) |
| $5,000 to $9,999 | 303 (1.9%) | 312 (4.1%) |
| $10,000 to $14,999 | 577 (3.6%) | 758 (9.9%) |
| $15,000 to $19,999 | 311 (1.9%) | 489 (6.4%) |
| $20,000 to $24,999 | 636 (3.9%) | 343 (4.5%) |
| $25,000 to $34,999 | 1,240 (7.6%) | 905 (11.8%) |
| $35,000 to $49,999 | 1,943 (12.0%) | 848 (11.0%) |
| $50,000 to $74,999 | 2,452 (15.1%) | 1,707 (22.2%) |
| $75,000 to $99,999 | 2,278 (14.0%) | 801 (10.4%) |
| $100,000 to $149,999 | 3,179 (19.6%) | 596 (7.7%) |
| $150,000 or more | 2,951 (18.2%) | 401 (5.2%) |
| Total | 16,229 (100.0%) | 7,691 (100.0%) |
Monthly Housing Cost Tiers in San Patricio County
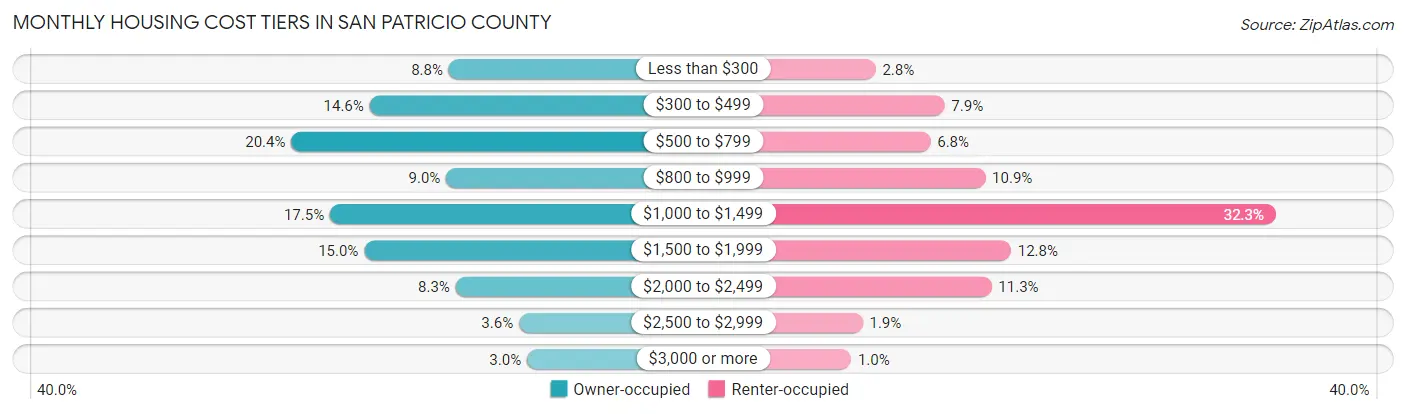
| Monthly Cost | Owner-occupied | Renter-occupied |
| Less than $300 | 1,422 (8.8%) | 215 (2.8%) |
| $300 to $499 | 2,368 (14.6%) | 606 (7.9%) |
| $500 to $799 | 3,304 (20.4%) | 526 (6.8%) |
| $800 to $999 | 1,453 (8.9%) | 837 (10.9%) |
| $1,000 to $1,499 | 2,841 (17.5%) | 2,483 (32.3%) |
| $1,500 to $1,999 | 2,432 (15.0%) | 982 (12.8%) |
| $2,000 to $2,499 | 1,339 (8.3%) | 872 (11.3%) |
| $2,500 to $2,999 | 583 (3.6%) | 142 (1.8%) |
| $3,000 or more | 487 (3.0%) | 77 (1.0%) |
| Total | 16,229 (100.0%) | 7,691 (100.0%) |
Physical Housing Characteristics in San Patricio County
Housing Structures in San Patricio County
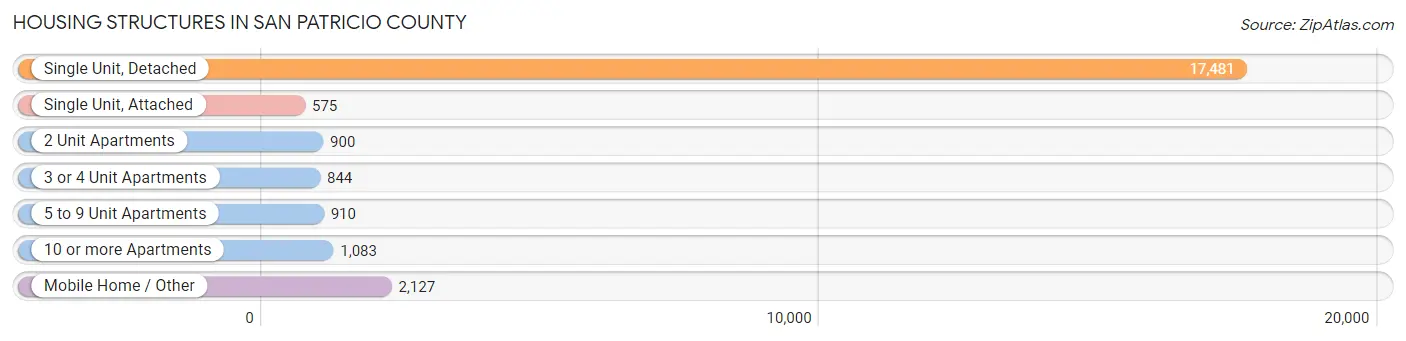
| Structure Type | # Housing Units | % Housing Units |
| Single Unit, Detached | 17,481 | 73.1% |
| Single Unit, Attached | 575 | 2.4% |
| 2 Unit Apartments | 900 | 3.8% |
| 3 or 4 Unit Apartments | 844 | 3.5% |
| 5 to 9 Unit Apartments | 910 | 3.8% |
| 10 or more Apartments | 1,083 | 4.5% |
| Mobile Home / Other | 2,127 | 8.9% |
| Total | 23,920 | 100.0% |
Housing Structures by Occupancy in San Patricio County
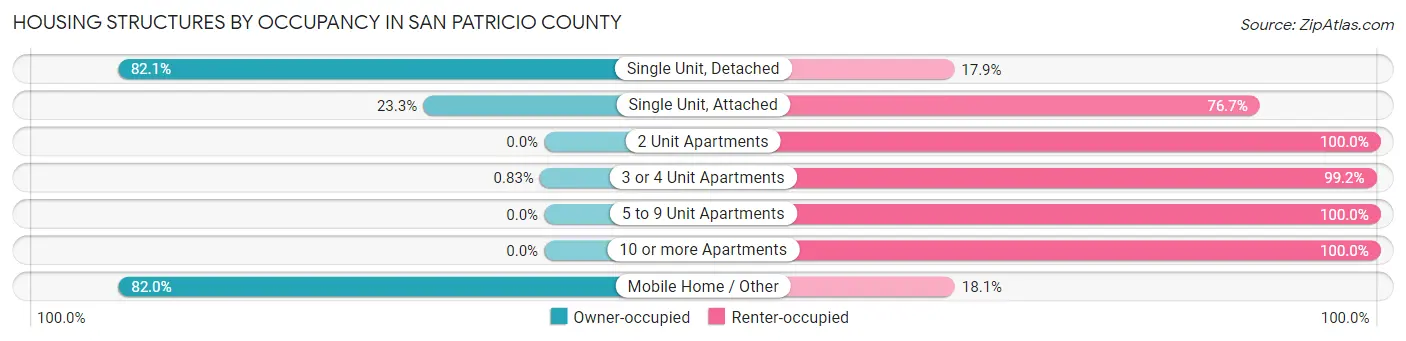
| Structure Type | Owner-occupied | Renter-occupied |
| Single Unit, Detached | 14,345 (82.1%) | 3,136 (17.9%) |
| Single Unit, Attached | 134 (23.3%) | 441 (76.7%) |
| 2 Unit Apartments | 0 (0.0%) | 900 (100.0%) |
| 3 or 4 Unit Apartments | 7 (0.8%) | 837 (99.2%) |
| 5 to 9 Unit Apartments | 0 (0.0%) | 910 (100.0%) |
| 10 or more Apartments | 0 (0.0%) | 1,083 (100.0%) |
| Mobile Home / Other | 1,743 (82.0%) | 384 (18.0%) |
| Total | 16,229 (67.8%) | 7,691 (32.2%) |
Housing Structures by Number of Rooms in San Patricio County
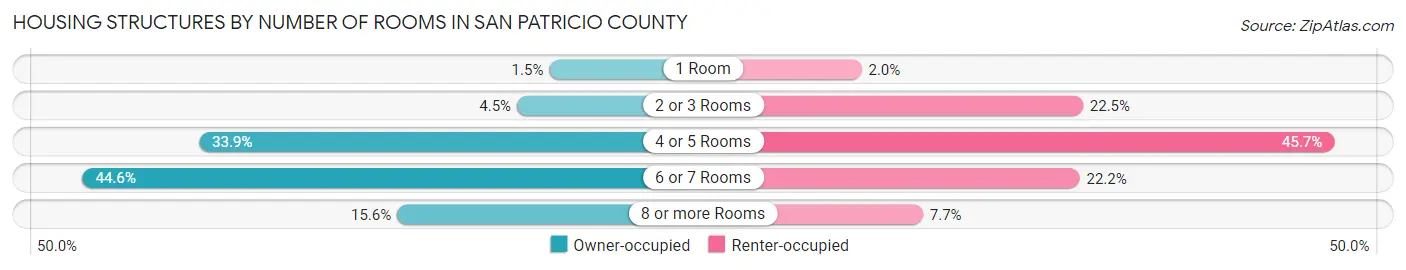
| Number of Rooms | Owner-occupied | Renter-occupied |
| 1 Room | 240 (1.5%) | 154 (2.0%) |
| 2 or 3 Rooms | 726 (4.5%) | 1,728 (22.5%) |
| 4 or 5 Rooms | 5,495 (33.9%) | 3,515 (45.7%) |
| 6 or 7 Rooms | 7,245 (44.6%) | 1,704 (22.2%) |
| 8 or more Rooms | 2,523 (15.5%) | 590 (7.7%) |
| Total | 16,229 (100.0%) | 7,691 (100.0%) |
Housing Structure by Heating Type in San Patricio County
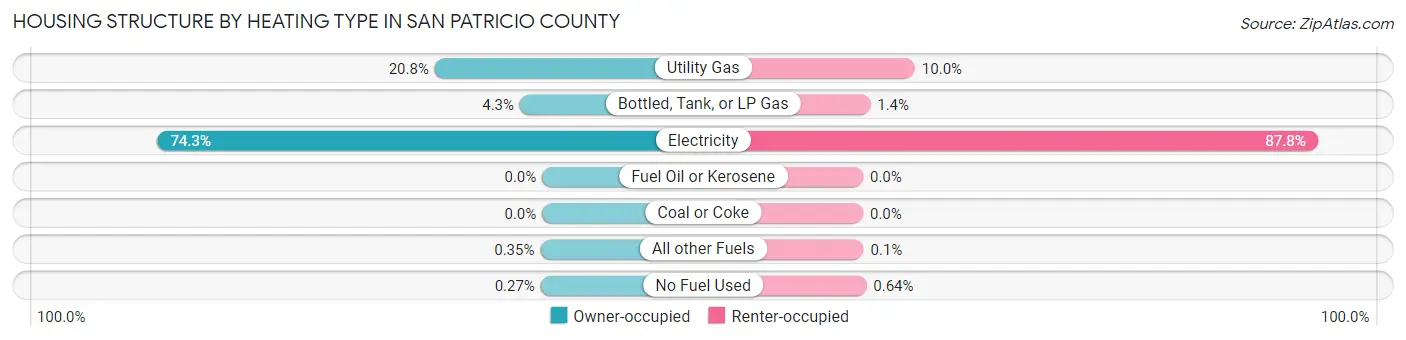
| Heating Type | Owner-occupied | Renter-occupied |
| Utility Gas | 3,368 (20.7%) | 771 (10.0%) |
| Bottled, Tank, or LP Gas | 698 (4.3%) | 108 (1.4%) |
| Electricity | 12,062 (74.3%) | 6,755 (87.8%) |
| Fuel Oil or Kerosene | 0 (0.0%) | 0 (0.0%) |
| Coal or Coke | 0 (0.0%) | 0 (0.0%) |
| All other Fuels | 57 (0.4%) | 8 (0.1%) |
| No Fuel Used | 44 (0.3%) | 49 (0.6%) |
| Total | 16,229 (100.0%) | 7,691 (100.0%) |
Household Vehicle Usage in San Patricio County
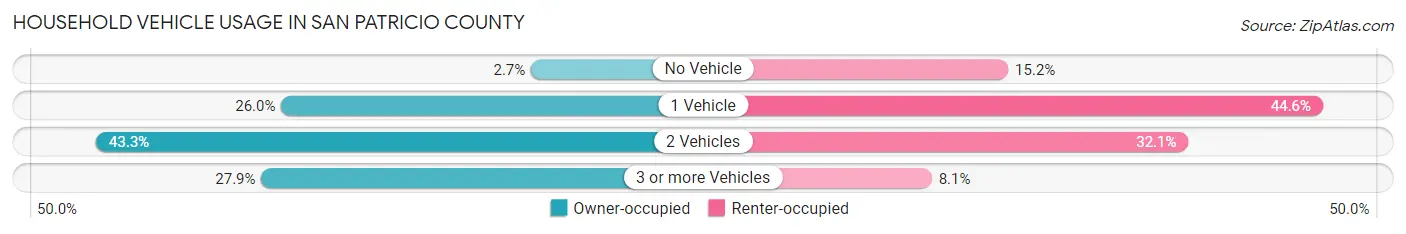
| Vehicles per Household | Owner-occupied | Renter-occupied |
| No Vehicle | 442 (2.7%) | 1,172 (15.2%) |
| 1 Vehicle | 4,226 (26.0%) | 3,431 (44.6%) |
| 2 Vehicles | 7,033 (43.3%) | 2,465 (32.1%) |
| 3 or more Vehicles | 4,528 (27.9%) | 623 (8.1%) |
| Total | 16,229 (100.0%) | 7,691 (100.0%) |
Real Estate & Mortgages in San Patricio County
Real Estate and Mortgage Overview in San Patricio County
| Characteristic | Without Mortgage | With Mortgage |
| Housing Units | 9,001 | 7,228 |
| Median Property Value | $124,100 | $199,800 |
| Median Household Income | $52,543 | $2,010 |
| Monthly Housing Costs | $559 | $484 |
| Real Estate Taxes | $1,919 | $329 |
Property Value by Mortgage Status in San Patricio County
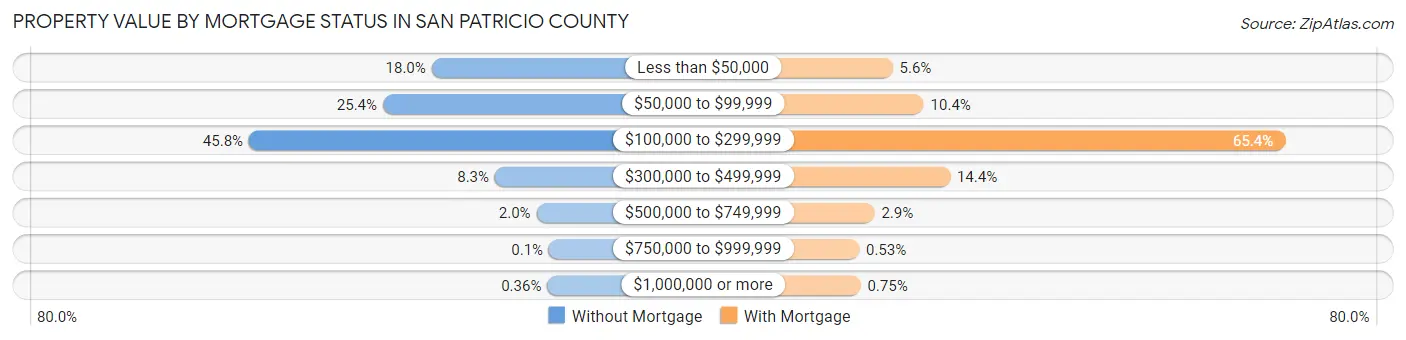
| Property Value | Without Mortgage | With Mortgage |
| Less than $50,000 | 1,618 (18.0%) | 408 (5.6%) |
| $50,000 to $99,999 | 2,287 (25.4%) | 750 (10.4%) |
| $100,000 to $299,999 | 4,124 (45.8%) | 4,730 (65.4%) |
| $300,000 to $499,999 | 751 (8.3%) | 1,040 (14.4%) |
| $500,000 to $749,999 | 180 (2.0%) | 208 (2.9%) |
| $750,000 to $999,999 | 9 (0.1%) | 38 (0.5%) |
| $1,000,000 or more | 32 (0.4%) | 54 (0.7%) |
| Total | 9,001 (100.0%) | 7,228 (100.0%) |
Household Income by Mortgage Status in San Patricio County
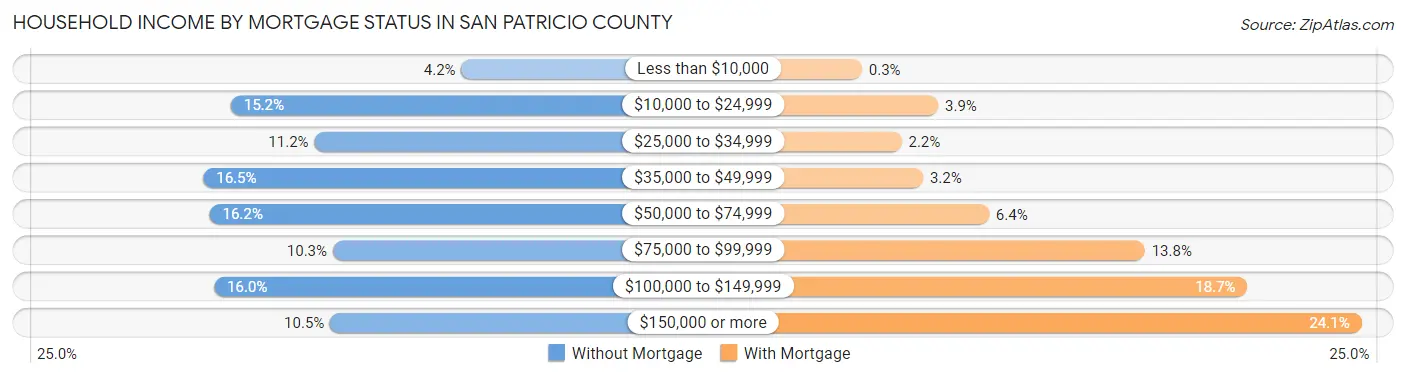
| Household Income | Without Mortgage | With Mortgage |
| Less than $10,000 | 378 (4.2%) | 22 (0.3%) |
| $10,000 to $24,999 | 1,366 (15.2%) | 284 (3.9%) |
| $25,000 to $34,999 | 1,008 (11.2%) | 158 (2.2%) |
| $35,000 to $49,999 | 1,484 (16.5%) | 232 (3.2%) |
| $50,000 to $74,999 | 1,457 (16.2%) | 459 (6.4%) |
| $75,000 to $99,999 | 929 (10.3%) | 995 (13.8%) |
| $100,000 to $149,999 | 1,438 (16.0%) | 1,349 (18.7%) |
| $150,000 or more | 941 (10.4%) | 1,741 (24.1%) |
| Total | 9,001 (100.0%) | 7,228 (100.0%) |
Property Value to Household Income Ratio in San Patricio County
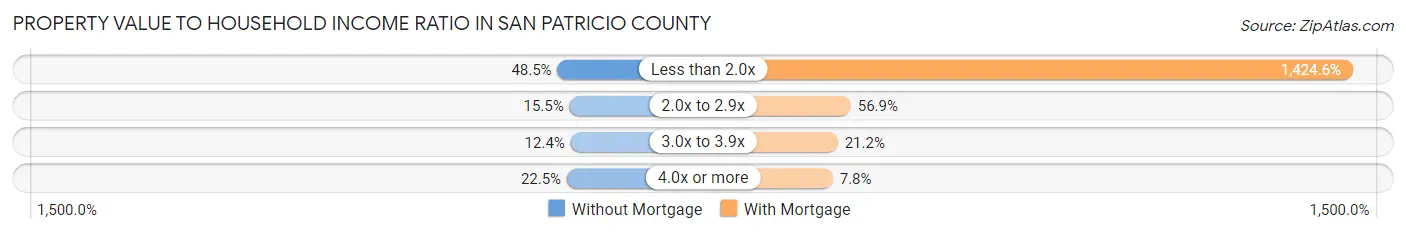
| Value-to-Income Ratio | Without Mortgage | With Mortgage |
| Less than 2.0x | 4,362 (48.5%) | 102,970 (1,424.6%) |
| 2.0x to 2.9x | 1,392 (15.5%) | 4,112 (56.9%) |
| 3.0x to 3.9x | 1,120 (12.4%) | 1,535 (21.2%) |
| 4.0x or more | 2,028 (22.5%) | 564 (7.8%) |
| Total | 9,001 (100.0%) | 7,228 (100.0%) |
Real Estate Taxes by Mortgage Status in San Patricio County
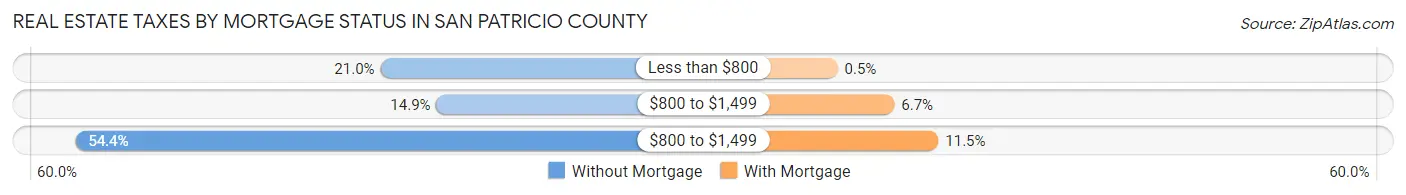
| Property Taxes | Without Mortgage | With Mortgage |
| Less than $800 | 1,891 (21.0%) | 36 (0.5%) |
| $800 to $1,499 | 1,338 (14.9%) | 486 (6.7%) |
| $800 to $1,499 | 4,900 (54.4%) | 834 (11.5%) |
| Total | 9,001 (100.0%) | 7,228 (100.0%) |
Health & Disability in San Patricio County
Health Insurance Coverage by Age in San Patricio County
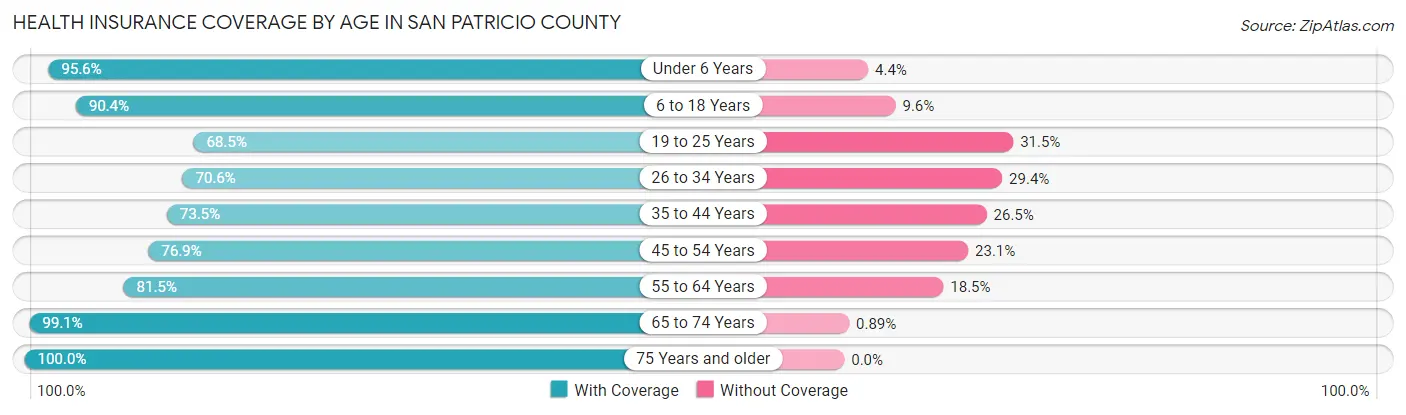
| Age Bracket | With Coverage | Without Coverage |
| Under 6 Years | 5,378 (95.6%) | 250 (4.4%) |
| 6 to 18 Years | 12,244 (90.4%) | 1,294 (9.6%) |
| 19 to 25 Years | 3,739 (68.5%) | 1,719 (31.5%) |
| 26 to 34 Years | 5,899 (70.6%) | 2,461 (29.4%) |
| 35 to 44 Years | 6,756 (73.5%) | 2,441 (26.5%) |
| 45 to 54 Years | 6,084 (76.9%) | 1,827 (23.1%) |
| 55 to 64 Years | 6,451 (81.5%) | 1,461 (18.5%) |
| 65 to 74 Years | 6,044 (99.1%) | 54 (0.9%) |
| 75 Years and older | 4,075 (100.0%) | 0 (0.0%) |
| Total | 56,670 (83.1%) | 11,507 (16.9%) |
Health Insurance Coverage by Citizenship Status in San Patricio County
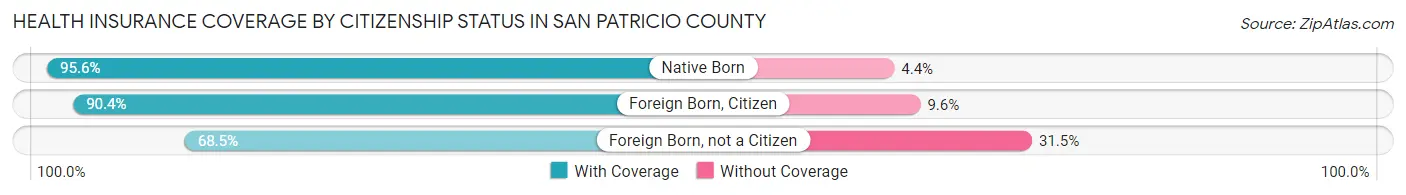
| Citizenship Status | With Coverage | Without Coverage |
| Native Born | 5,378 (95.6%) | 250 (4.4%) |
| Foreign Born, Citizen | 12,244 (90.4%) | 1,294 (9.6%) |
| Foreign Born, not a Citizen | 3,739 (68.5%) | 1,719 (31.5%) |
Health Insurance Coverage by Household Income in San Patricio County
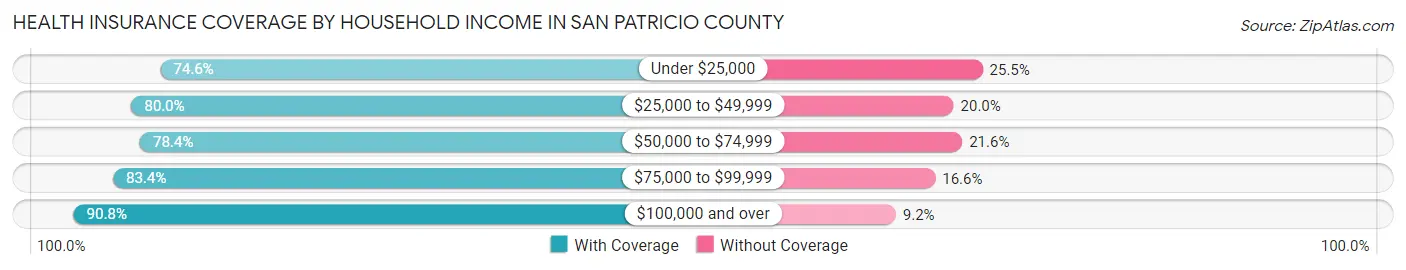
| Household Income | With Coverage | Without Coverage |
| Under $25,000 | 7,261 (74.6%) | 2,479 (25.5%) |
| $25,000 to $49,999 | 9,861 (80.0%) | 2,467 (20.0%) |
| $50,000 to $74,999 | 9,460 (78.4%) | 2,611 (21.6%) |
| $75,000 to $99,999 | 9,173 (83.4%) | 1,823 (16.6%) |
| $100,000 and over | 20,891 (90.8%) | 2,113 (9.2%) |
Public vs Private Health Insurance Coverage by Age in San Patricio County
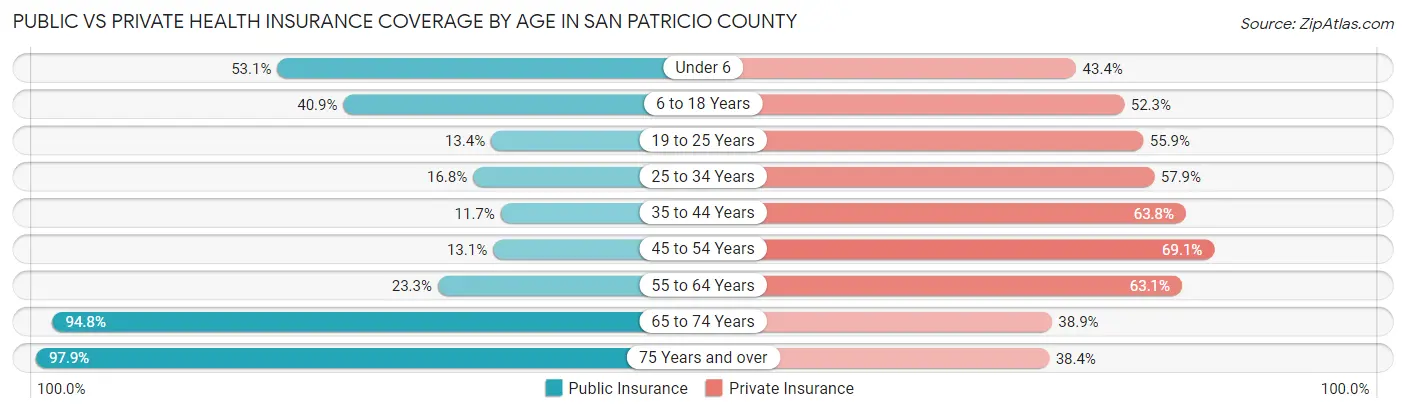
| Age Bracket | Public Insurance | Private Insurance |
| Under 6 | 2,989 (53.1%) | 2,443 (43.4%) |
| 6 to 18 Years | 5,530 (40.8%) | 7,086 (52.3%) |
| 19 to 25 Years | 733 (13.4%) | 3,050 (55.9%) |
| 25 to 34 Years | 1,402 (16.8%) | 4,842 (57.9%) |
| 35 to 44 Years | 1,071 (11.7%) | 5,871 (63.8%) |
| 45 to 54 Years | 1,033 (13.1%) | 5,467 (69.1%) |
| 55 to 64 Years | 1,844 (23.3%) | 4,993 (63.1%) |
| 65 to 74 Years | 5,781 (94.8%) | 2,373 (38.9%) |
| 75 Years and over | 3,989 (97.9%) | 1,565 (38.4%) |
| Total | 24,372 (35.7%) | 37,690 (55.3%) |
Disability Status by Sex by Age in San Patricio County
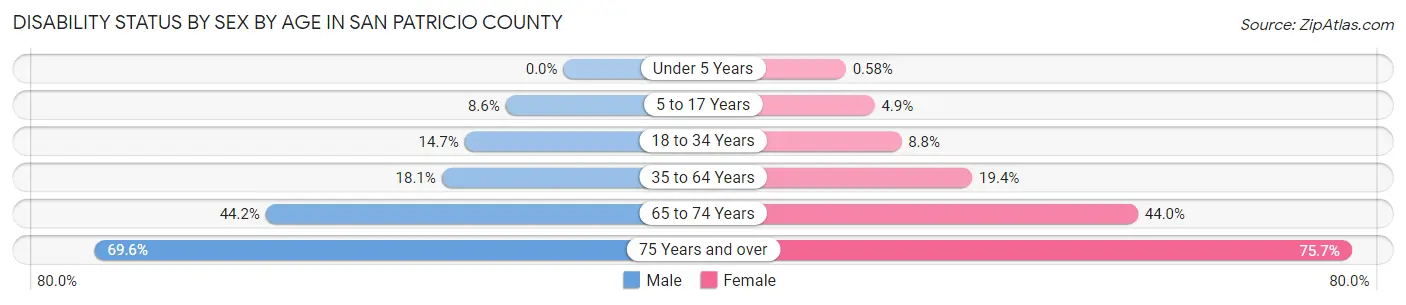
| Age Bracket | Male | Female |
| Under 5 Years | 0 (0.0%) | 13 (0.6%) |
| 5 to 17 Years | 613 (8.6%) | 305 (4.9%) |
| 18 to 34 Years | 1,146 (14.7%) | 626 (8.8%) |
| 35 to 64 Years | 2,278 (18.1%) | 2,405 (19.4%) |
| 65 to 74 Years | 1,327 (44.2%) | 1,361 (44.0%) |
| 75 Years and over | 1,225 (69.6%) | 1,752 (75.7%) |
Disability Class by Sex by Age in San Patricio County
Disability Class: Hearing Difficulty
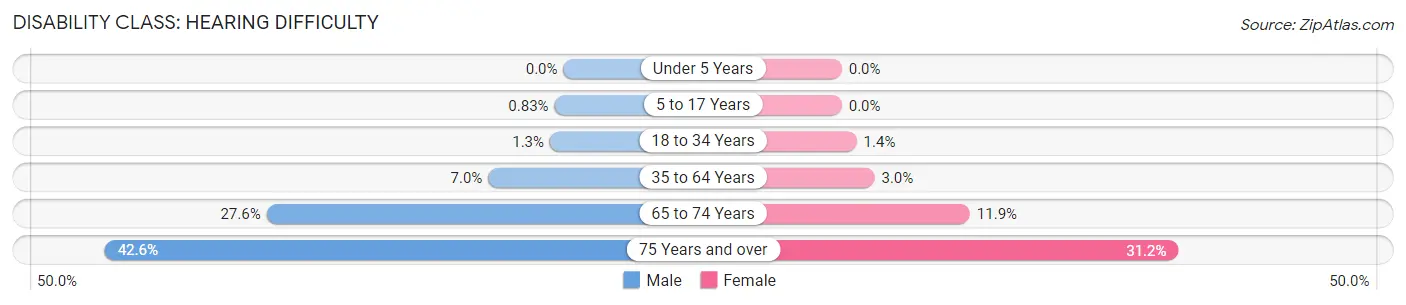
| Age Bracket | Male | Female |
| Under 5 Years | 0 (0.0%) | 0 (0.0%) |
| 5 to 17 Years | 59 (0.8%) | 0 (0.0%) |
| 18 to 34 Years | 98 (1.3%) | 98 (1.4%) |
| 35 to 64 Years | 879 (7.0%) | 377 (3.0%) |
| 65 to 74 Years | 827 (27.6%) | 368 (11.9%) |
| 75 Years and over | 749 (42.6%) | 723 (31.2%) |
Disability Class: Vision Difficulty
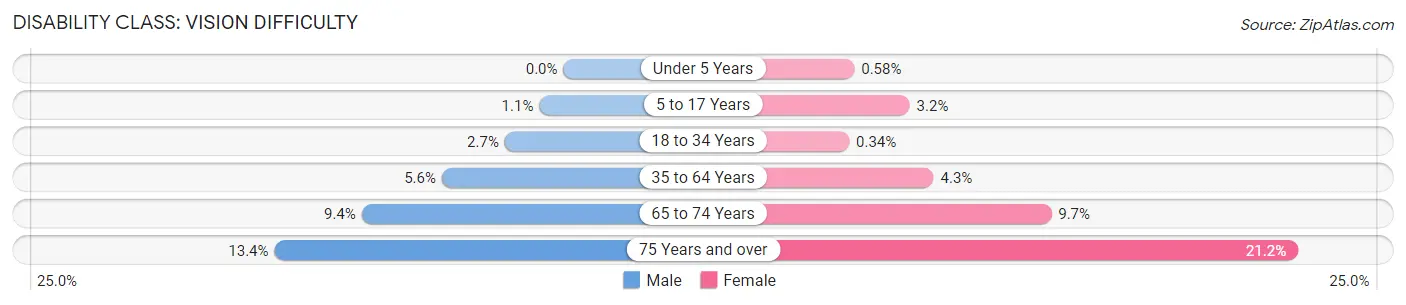
| Age Bracket | Male | Female |
| Under 5 Years | 0 (0.0%) | 13 (0.6%) |
| 5 to 17 Years | 80 (1.1%) | 198 (3.2%) |
| 18 to 34 Years | 213 (2.7%) | 24 (0.3%) |
| 35 to 64 Years | 711 (5.6%) | 529 (4.3%) |
| 65 to 74 Years | 281 (9.4%) | 301 (9.7%) |
| 75 Years and over | 236 (13.4%) | 490 (21.2%) |
Disability Class: Cognitive Difficulty
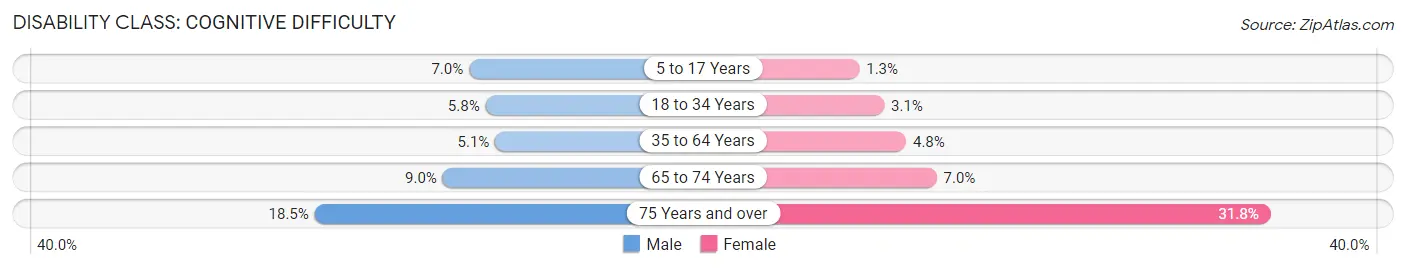
| Age Bracket | Male | Female |
| 5 to 17 Years | 500 (7.0%) | 82 (1.3%) |
| 18 to 34 Years | 452 (5.8%) | 223 (3.1%) |
| 35 to 64 Years | 638 (5.1%) | 592 (4.8%) |
| 65 to 74 Years | 269 (9.0%) | 218 (7.0%) |
| 75 Years and over | 325 (18.5%) | 737 (31.8%) |
Disability Class: Ambulatory Difficulty
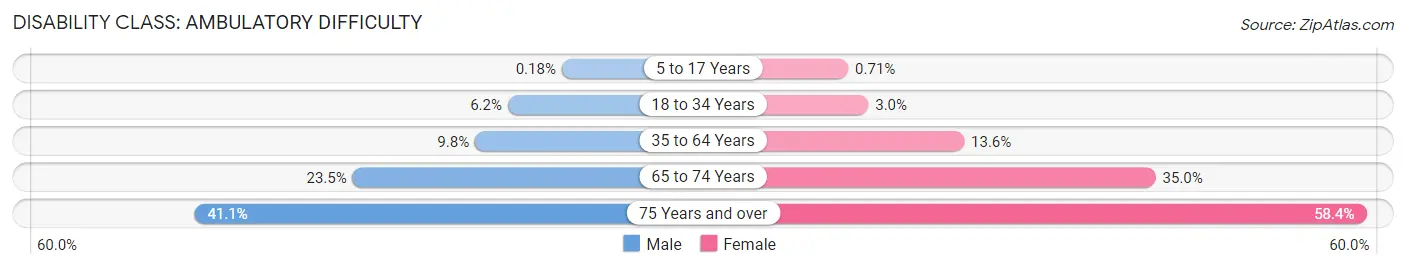
| Age Bracket | Male | Female |
| 5 to 17 Years | 13 (0.2%) | 45 (0.7%) |
| 18 to 34 Years | 484 (6.2%) | 209 (2.9%) |
| 35 to 64 Years | 1,240 (9.8%) | 1,691 (13.6%) |
| 65 to 74 Years | 705 (23.5%) | 1,082 (34.9%) |
| 75 Years and over | 723 (41.1%) | 1,352 (58.4%) |
Disability Class: Self-Care Difficulty
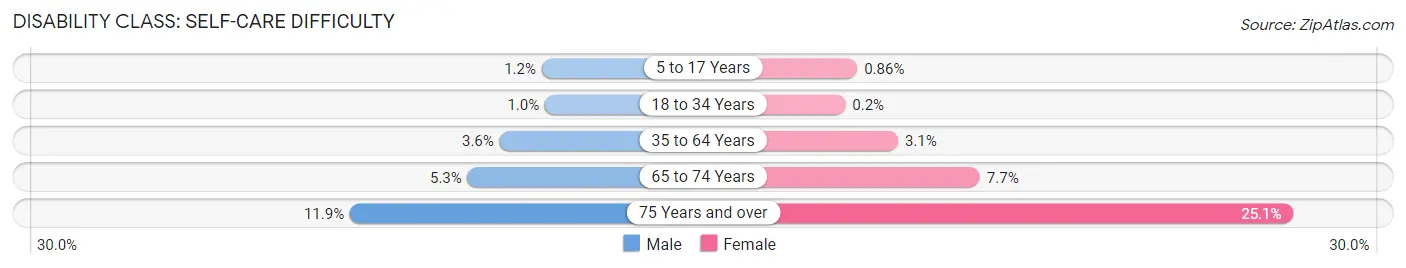
| Age Bracket | Male | Female |
| 5 to 17 Years | 86 (1.2%) | 54 (0.9%) |
| 18 to 34 Years | 80 (1.0%) | 14 (0.2%) |
| 35 to 64 Years | 447 (3.5%) | 389 (3.1%) |
| 65 to 74 Years | 160 (5.3%) | 238 (7.7%) |
| 75 Years and over | 209 (11.9%) | 582 (25.1%) |
Technology Access in San Patricio County
Computing Device Access in San Patricio County
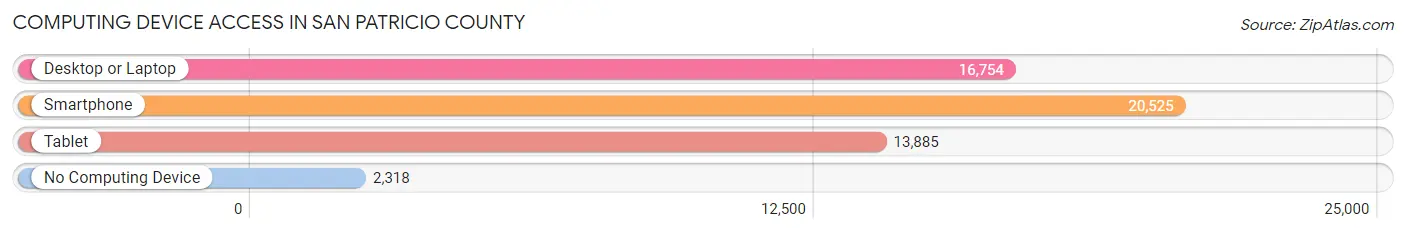
| Device Type | # Households | % Households |
| Desktop or Laptop | 16,754 | 70.0% |
| Smartphone | 20,525 | 85.8% |
| Tablet | 13,885 | 58.1% |
| No Computing Device | 2,318 | 9.7% |
| Total | 23,920 | 100.0% |
Internet Access in San Patricio County
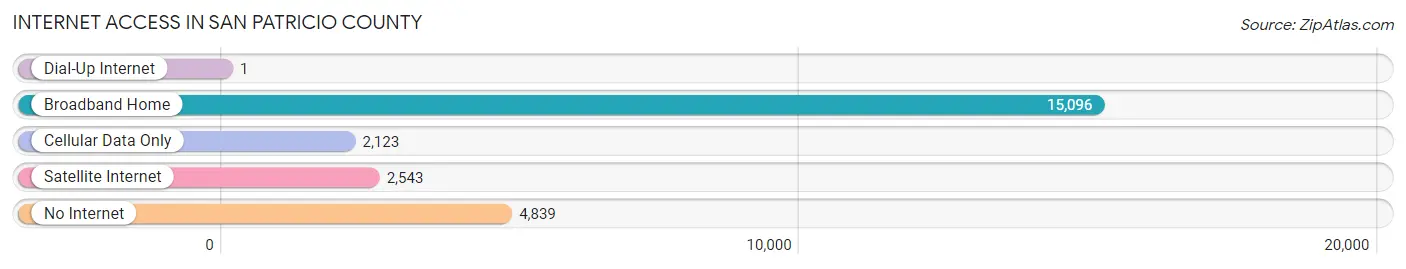
| Internet Type | # Households | % Households |
| Dial-Up Internet | 1 | 0.0% |
| Broadband Home | 15,096 | 63.1% |
| Cellular Data Only | 2,123 | 8.9% |
| Satellite Internet | 2,543 | 10.6% |
| No Internet | 4,839 | 20.2% |
| Total | 23,920 | 100.0% |
San Patricio County Summary
San Patricio County is located in the southern part of Texas, along the Gulf Coast. It is bordered by Nueces County to the east, Aransas County to the south, Refugio County to the west, and San Patricio County to the north. The county seat is Sinton, and the largest city is Corpus Christi. The county was named after Saint Patrick, the patron saint of Ireland.
History
San Patricio County was established in 1836, when Texas was still a part of Mexico. The county was named after Saint Patrick, the patron saint of Ireland. The county was originally part of Refugio County, but was later split off in 1846.
The county was home to several Native American tribes, including the Karankawa, Coahuiltecan, and Tonkawa. The first European settlers arrived in the area in the early 1800s, and the county was officially established in 1836.
The county was an important part of the Texas Revolution, and the Battle of San Patricio was fought in the county in 1836. The county was also the site of the Battle of Corpus Christi in 1845.
The county was home to several prominent figures in Texas history, including Stephen F. Austin, Sam Houston, and William B. Travis.
Geography
San Patricio County is located in the southern part of Texas, along the Gulf Coast. It is bordered by Nueces County to the east, Aransas County to the south, Refugio County to the west, and San Patricio County to the north. The county covers an area of 1,072 square miles, and has a population of approximately 64,000 people.
The county is mostly flat, with some rolling hills in the northern part of the county. The county is home to several rivers, including the Nueces River, San Patricio River, and Corpus Christi Bay. The county is also home to several lakes, including Lake Corpus Christi and Lake Mathis.
Economy
San Patricio County has a diverse economy, with a mix of agriculture, manufacturing, and tourism. The county is home to several large employers, including Valero Energy Corporation, Citgo Petroleum Corporation, and the Port of Corpus Christi.
Agriculture is an important part of the county’s economy, with crops such as cotton, corn, sorghum, and wheat being grown in the area. The county is also home to several large cattle ranches.
Manufacturing is also an important part of the county’s economy, with several large companies located in the area. The county is home to several large oil refineries, as well as several chemical plants.
Tourism is also an important part of the county’s economy, with several popular attractions located in the area. The county is home to several beaches, as well as the USS Lexington Museum on the Bay.
Demographics
As of the 2010 census, San Patricio County had a population of 64,804 people. The racial makeup of the county was 75.3% White, 8.2% African American, 0.7% Native American, 0.5% Asian, 0.1% Pacific Islander, 12.7% from other races, and 2.5% from two or more races. Hispanic or Latino of any race were 33.2% of the population.
The median income for a household in the county was $41,945, and the median income for a family was $50,945. The per capita income for the county was $20,945. About 17.2% of the population was below the poverty line.
San Patricio County is a diverse and vibrant county, with a mix of cultures and economic opportunities. The county is home to several large employers, as well as several popular tourist attractions. The county is also home to several Native American tribes, and is an important part of Texas history.
Common Questions
What is Per Capita Income in San Patricio County?
Per Capita income in San Patricio County is $30,692.
What is the Median Family Income in San Patricio County?
Median Family Income in San Patricio County is $73,458.
What is the Median Household income in San Patricio County?
Median Household Income in San Patricio County is $63,842.
What is Income or Wage Gap in San Patricio County?
Income or Wage Gap in San Patricio County is 38.6%.
Women in San Patricio County earn 61.4 cents for every dollar earned by a man.
What is Family Income Deficit in San Patricio County?
Family Income Deficit in San Patricio County is $12,631.
Families that are below poverty line in San Patricio County earn $12,631 less on average than the poverty threshold level.
What is Inequality or Gini Index in San Patricio County?
Inequality or Gini Index in San Patricio County is 0.46.
What is the Total Population of San Patricio County?
Total Population of San Patricio County is 68,942.
What is the Total Male Population of San Patricio County?
Total Male Population of San Patricio County is 35,185.
What is the Total Female Population of San Patricio County?
Total Female Population of San Patricio County is 33,757.
What is the Ratio of Males per 100 Females in San Patricio County?
There are 104.23 Males per 100 Females in San Patricio County.
What is the Ratio of Females per 100 Males in San Patricio County?
There are 95.94 Females per 100 Males in San Patricio County.
What is the Median Population Age in San Patricio County?
Median Population Age in San Patricio County is 36.0 Years.
What is the Average Family Size in San Patricio County
Average Family Size in San Patricio County is 3.4 People.
What is the Average Household Size in San Patricio County
Average Household Size in San Patricio County is 2.9 People.
How Large is the Labor Force in San Patricio County?
There are 30,182 People in the Labor Forcein in San Patricio County.
What is the Percentage of People in the Labor Force in San Patricio County?
57.1% of People are in the Labor Force in San Patricio County.
What is the Unemployment Rate in San Patricio County?
Unemployment Rate in San Patricio County is 4.4%.