San Jacinto County, TX Map & Demographics
San Jacinto County Map
San Jacinto County Overview
$28,124
PER CAPITA INCOME
$72,961
AVG FAMILY INCOME
$54,839
AVG HOUSEHOLD INCOME
34.7%
WAGE / INCOME GAP [ % ]
65.3¢/ $1
WAGE / INCOME GAP [ $ ]
$9,675
FAMILY INCOME DEFICIT
0.45
INEQUALITY / GINI INDEX
27,666
TOTAL POPULATION
13,794
MALE POPULATION
13,872
FEMALE POPULATION
99.44
MALES / 100 FEMALES
100.57
FEMALES / 100 MALES
45.3
MEDIAN AGE
3.2
AVG FAMILY SIZE
2.7
AVG HOUSEHOLD SIZE
11,687
LABOR FORCE [ PEOPLE ]
52.2%
PERCENT IN LABOR FORCE
7.1%
UNEMPLOYMENT RATE
Income in San Jacinto County
Income Overview in San Jacinto County
Per Capita Income in San Jacinto County is $28,124, while median incomes of families and households are $72,961 and $54,839 respectively.
| Characteristic | Number | Measure |
| Per Capita Income | 27,666 | $28,124 |
| Median Family Income | 7,279 | $72,961 |
| Mean Family Income | 7,279 | $90,071 |
| Median Household Income | 10,064 | $54,839 |
| Mean Household Income | 10,064 | $76,309 |
| Income Deficit | 7,279 | $9,675 |
| Wage / Income Gap (%) | 27,666 | 34.69% |
| Wage / Income Gap ($) | 27,666 | 65.31¢ per $1 |
| Gini / Inequality Index | 27,666 | 0.45 |
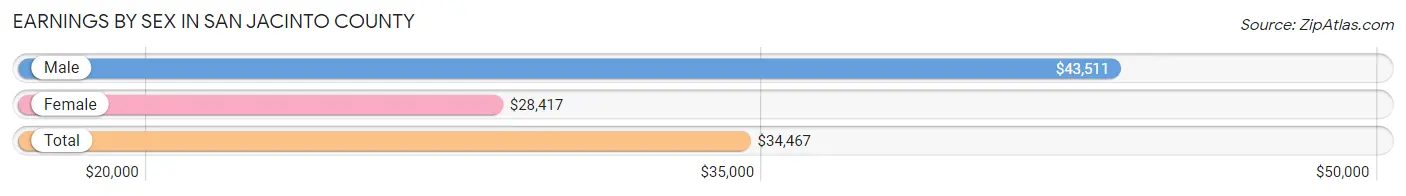
Earnings by Sex in San Jacinto County
Average Earnings in San Jacinto County are $34,467, $43,511 for men and $28,417 for women, a difference of 34.7%.
| Sex | Number | Average Earnings |
| Male | 7,031 (59.0%) | $43,511 |
| Female | 4,881 (41.0%) | $28,417 |
| Total | 11,912 (100.0%) | $34,467 |
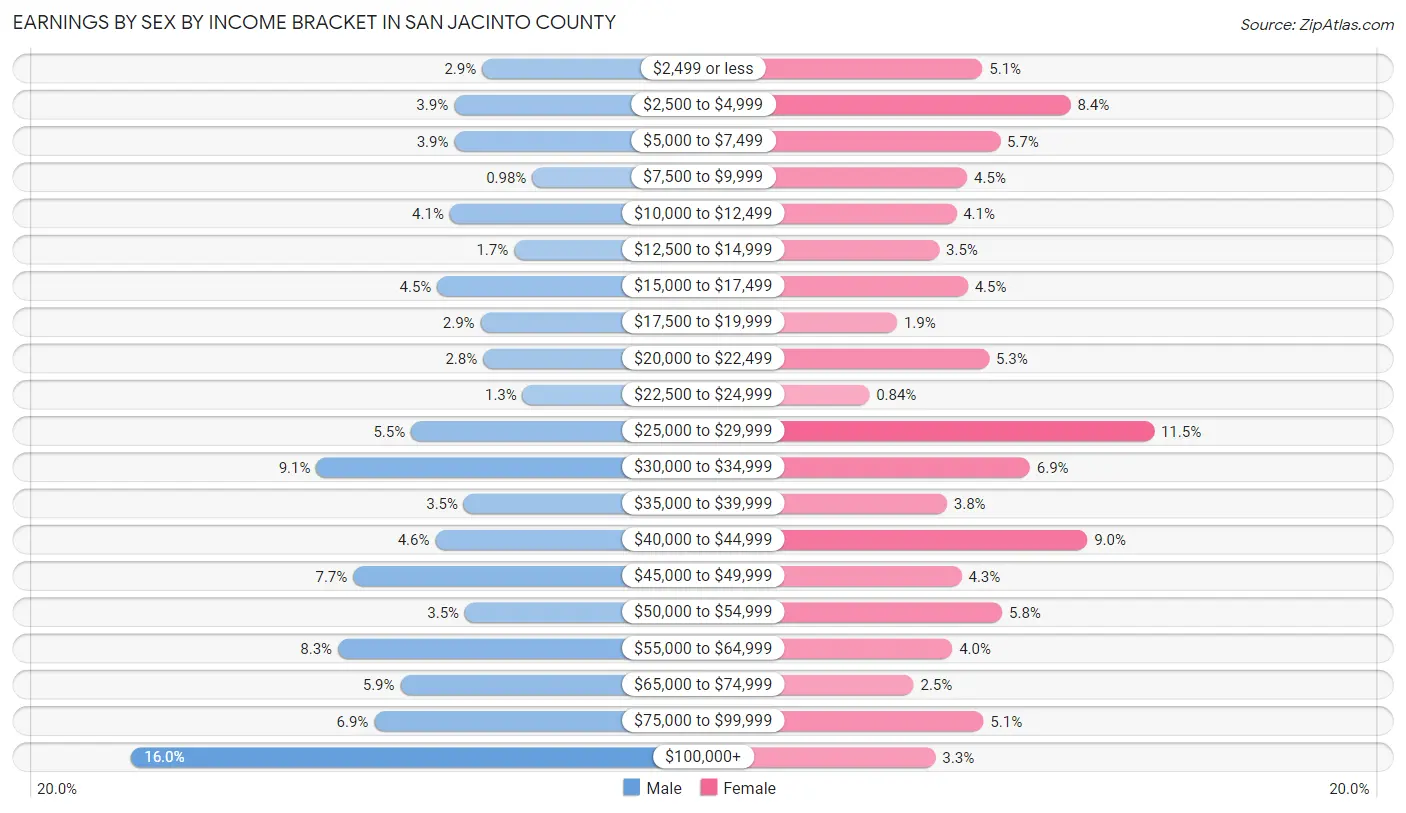
Earnings by Sex by Income Bracket in San Jacinto County
The most common earnings brackets in San Jacinto County are $100,000+ for men (1,125 | 16.0%) and $25,000 to $29,999 for women (562 | 11.5%).
| Income | Male | Female |
| $2,499 or less | 201 (2.9%) | 248 (5.1%) |
| $2,500 to $4,999 | 275 (3.9%) | 409 (8.4%) |
| $5,000 to $7,499 | 274 (3.9%) | 280 (5.7%) |
| $7,500 to $9,999 | 69 (1.0%) | 220 (4.5%) |
| $10,000 to $12,499 | 286 (4.1%) | 200 (4.1%) |
| $12,500 to $14,999 | 117 (1.7%) | 169 (3.5%) |
| $15,000 to $17,499 | 319 (4.5%) | 221 (4.5%) |
| $17,500 to $19,999 | 205 (2.9%) | 92 (1.9%) |
| $20,000 to $22,499 | 198 (2.8%) | 260 (5.3%) |
| $22,500 to $24,999 | 94 (1.3%) | 41 (0.8%) |
| $25,000 to $29,999 | 388 (5.5%) | 562 (11.5%) |
| $30,000 to $34,999 | 638 (9.1%) | 335 (6.9%) |
| $35,000 to $39,999 | 249 (3.5%) | 183 (3.7%) |
| $40,000 to $44,999 | 324 (4.6%) | 440 (9.0%) |
| $45,000 to $49,999 | 541 (7.7%) | 210 (4.3%) |
| $50,000 to $54,999 | 246 (3.5%) | 284 (5.8%) |
| $55,000 to $64,999 | 581 (8.3%) | 193 (4.0%) |
| $65,000 to $74,999 | 416 (5.9%) | 122 (2.5%) |
| $75,000 to $99,999 | 485 (6.9%) | 250 (5.1%) |
| $100,000+ | 1,125 (16.0%) | 162 (3.3%) |
| Total | 7,031 (100.0%) | 4,881 (100.0%) |
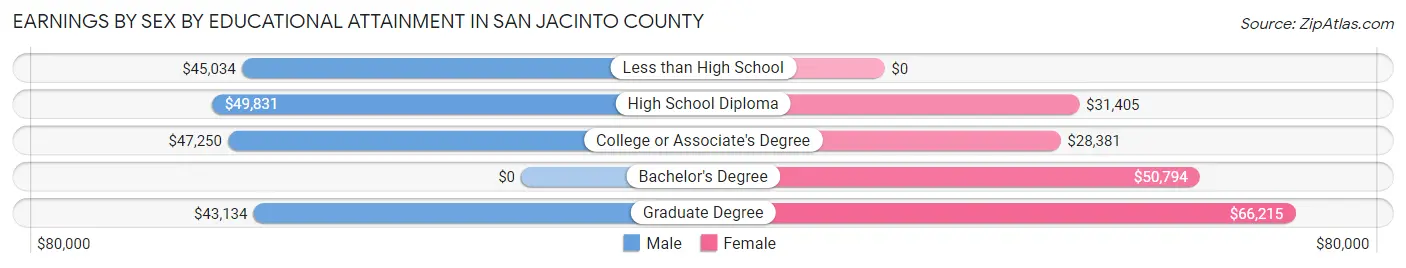
Earnings by Sex by Educational Attainment in San Jacinto County
Average earnings in San Jacinto County are $46,430 for men and $30,827 for women, a difference of 33.6%. Men with an educational attainment of high school diploma enjoy the highest average annual earnings of $49,831, while those with graduate degree education earn the least with $43,134. Women with an educational attainment of graduate degree earn the most with the average annual earnings of $66,215, while those with college or associate's degree education have the smallest earnings of $28,381.
| Educational Attainment | Male Income | Female Income |
| Less than High School | $45,034 | $0 |
| High School Diploma | $49,831 | $31,405 |
| College or Associate's Degree | $47,250 | $28,381 |
| Bachelor's Degree | - | - |
| Graduate Degree | $43,134 | $66,215 |
| Total | $46,430 | $30,827 |
Family Income in San Jacinto County
Family Income Brackets in San Jacinto County
According to the San Jacinto County family income data, there are 1,237 families falling into the $100,000 to $149,999 income range, which is the most common income bracket and makes up 17.0% of all families. Conversely, the less than $10,000 income bracket is the least frequent group with only 211 families (2.9%) belonging to this category.
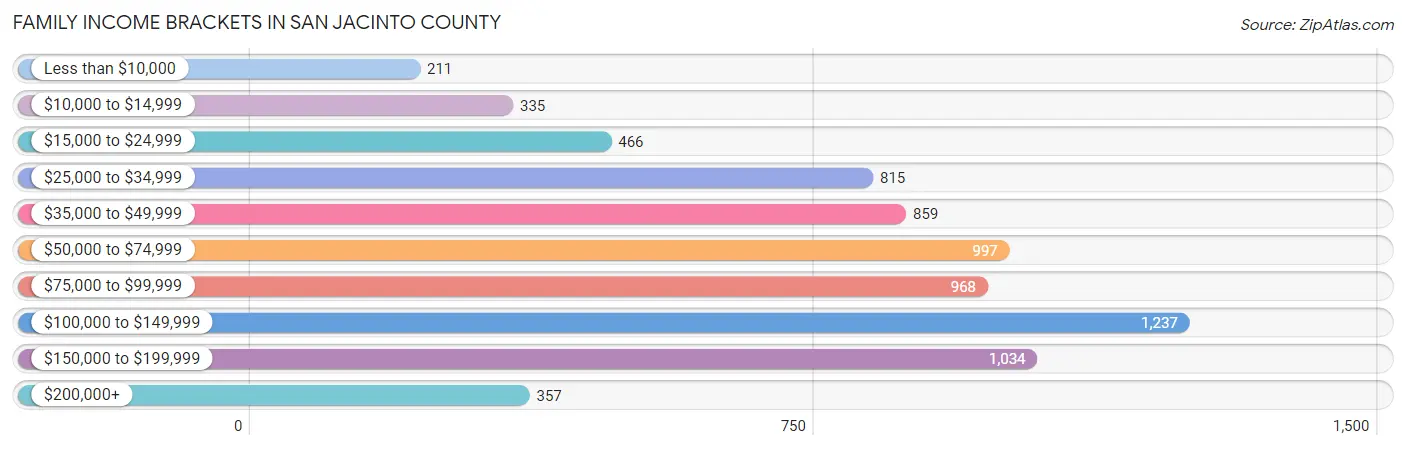
| Income Bracket | # Families | % Families |
| Less than $10,000 | 211 | 2.9% |
| $10,000 to $14,999 | 335 | 4.6% |
| $15,000 to $24,999 | 466 | 6.4% |
| $25,000 to $34,999 | 815 | 11.2% |
| $35,000 to $49,999 | 859 | 11.8% |
| $50,000 to $74,999 | 997 | 13.7% |
| $75,000 to $99,999 | 968 | 13.3% |
| $100,000 to $149,999 | 1,237 | 17.0% |
| $150,000 to $199,999 | 1,034 | 14.2% |
| $200,000+ | 357 | 4.9% |
Family Income by Famaliy Size in San Jacinto County
4-person families (1,057 | 14.5%) account for the highest median family income in San Jacinto County with $116,470 per family, while 3-person families (1,518 | 20.8%) have the highest median income of $33,697 per family member.
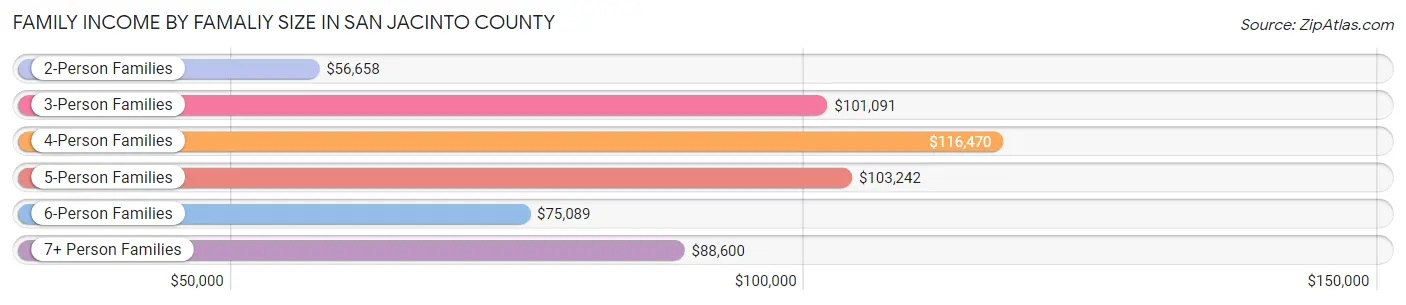
| Income Bracket | # Families | Median Income |
| 2-Person Families | 3,678 (50.5%) | $56,658 |
| 3-Person Families | 1,518 (20.8%) | $101,091 |
| 4-Person Families | 1,057 (14.5%) | $116,470 |
| 5-Person Families | 415 (5.7%) | $103,242 |
| 6-Person Families | 293 (4.0%) | $75,089 |
| 7+ Person Families | 318 (4.4%) | $88,600 |
| Total | 7,279 (100.0%) | $72,961 |
Family Income by Number of Earners in San Jacinto County
The median family income in San Jacinto County is $72,961, with families comprising 3+ earners (821) having the highest median family income of $136,275, while families with no earners (1,541) have the lowest median family income of $35,680, accounting for 11.3% and 21.2% of families, respectively.
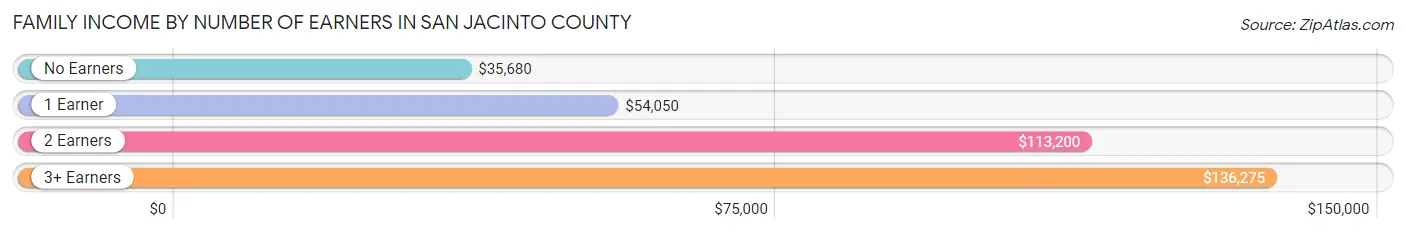
| Number of Earners | # Families | Median Income |
| No Earners | 1,541 (21.2%) | $35,680 |
| 1 Earner | 2,879 (39.6%) | $54,050 |
| 2 Earners | 2,038 (28.0%) | $113,200 |
| 3+ Earners | 821 (11.3%) | $136,275 |
| Total | 7,279 (100.0%) | $72,961 |
Household Income in San Jacinto County
Household Income Brackets in San Jacinto County
With 1,791 households falling in the category, the $35,000 to $49,999 income range is the most frequent in San Jacinto County, accounting for 17.8% of all households. In contrast, only 372 households (3.7%) fall into the $200,000+ income bracket, making it the least populous group.
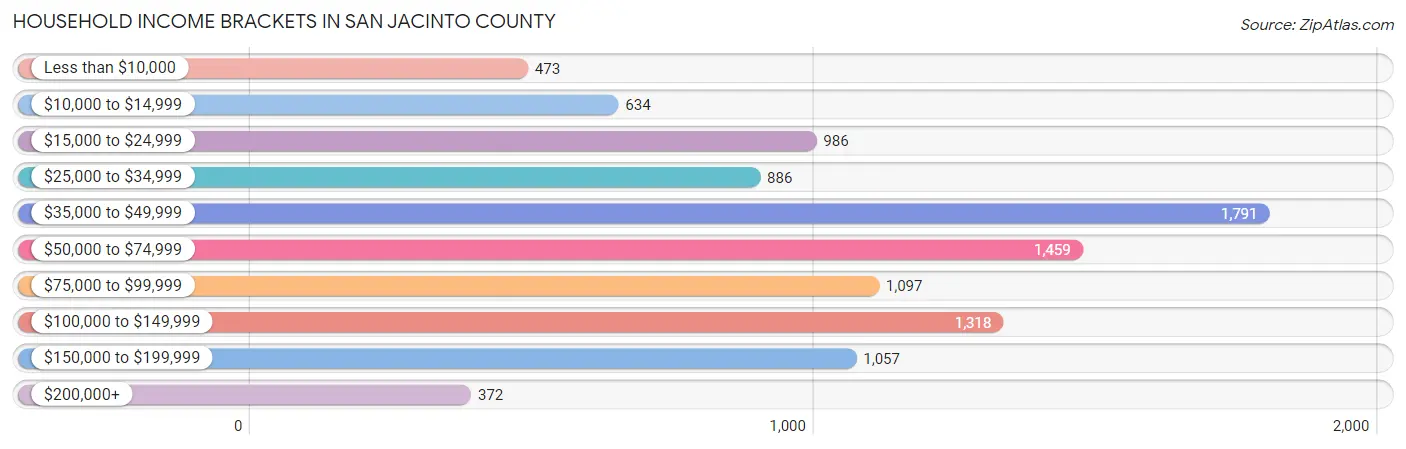
| Income Bracket | # Households | % Households |
| Less than $10,000 | 473 | 4.7% |
| $10,000 to $14,999 | 634 | 6.3% |
| $15,000 to $24,999 | 986 | 9.8% |
| $25,000 to $34,999 | 886 | 8.8% |
| $35,000 to $49,999 | 1,791 | 17.8% |
| $50,000 to $74,999 | 1,459 | 14.5% |
| $75,000 to $99,999 | 1,097 | 10.9% |
| $100,000 to $149,999 | 1,318 | 13.1% |
| $150,000 to $199,999 | 1,057 | 10.5% |
| $200,000+ | 372 | 3.7% |
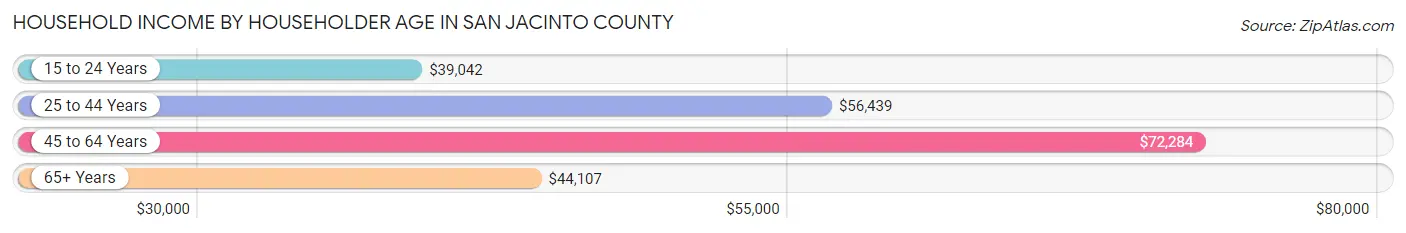
Household Income by Householder Age in San Jacinto County
The median household income in San Jacinto County is $54,839, with the highest median household income of $72,284 found in the 45 to 64 years age bracket for the primary householder. A total of 4,117 households (40.9%) fall into this category. Meanwhile, the 15 to 24 years age bracket for the primary householder has the lowest median household income of $39,042, with 236 households (2.3%) in this group.
| Income Bracket | # Households | Median Income |
| 15 to 24 Years | 236 (2.3%) | $39,042 |
| 25 to 44 Years | 1,998 (19.9%) | $56,439 |
| 45 to 64 Years | 4,117 (40.9%) | $72,284 |
| 65+ Years | 3,713 (36.9%) | $44,107 |
| Total | 10,064 (100.0%) | $54,839 |
Poverty in San Jacinto County
Income Below Poverty by Sex and Age in San Jacinto County
With 15.2% poverty level for males and 19.5% for females among the residents of San Jacinto County, 5 year old males and 18 to 24 year old females are the most vulnerable to poverty, with 91 males (40.4%) and 419 females (40.4%) in their respective age groups living below the poverty level.
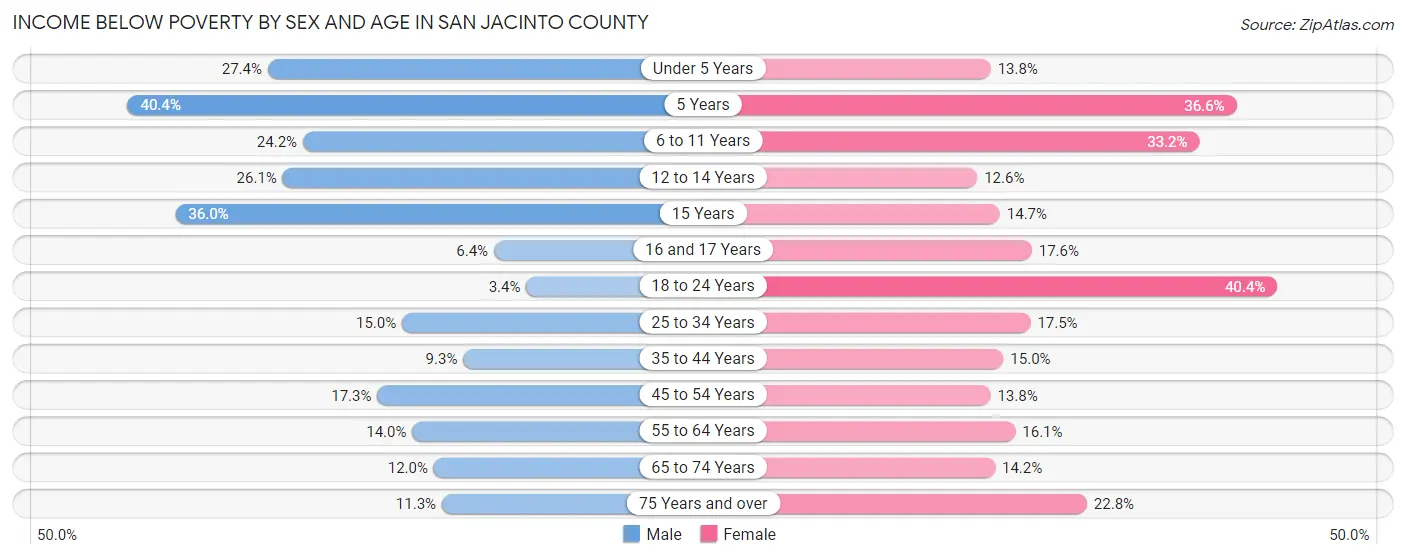
| Age Bracket | Male | Female |
| Under 5 Years | 192 (27.4%) | 89 (13.8%) |
| 5 Years | 91 (40.4%) | 26 (36.6%) |
| 6 to 11 Years | 247 (24.2%) | 425 (33.2%) |
| 12 to 14 Years | 136 (26.1%) | 43 (12.6%) |
| 15 Years | 81 (36.0%) | 33 (14.7%) |
| 16 and 17 Years | 15 (6.4%) | 64 (17.6%) |
| 18 to 24 Years | 41 (3.4%) | 419 (40.4%) |
| 25 to 34 Years | 215 (15.0%) | 234 (17.5%) |
| 35 to 44 Years | 118 (9.3%) | 219 (15.0%) |
| 45 to 54 Years | 286 (17.3%) | 241 (13.8%) |
| 55 to 64 Years | 322 (14.0%) | 357 (16.1%) |
| 65 to 74 Years | 215 (12.0%) | 270 (14.2%) |
| 75 Years and over | 125 (11.3%) | 276 (22.8%) |
| Total | 2,084 (15.2%) | 2,696 (19.5%) |
Income Above Poverty by Sex and Age in San Jacinto County
According to the poverty statistics in San Jacinto County, males aged 18 to 24 years and females aged 12 to 14 years are the age groups that are most secure financially, with 96.6% of males and 87.4% of females in these age groups living above the poverty line.
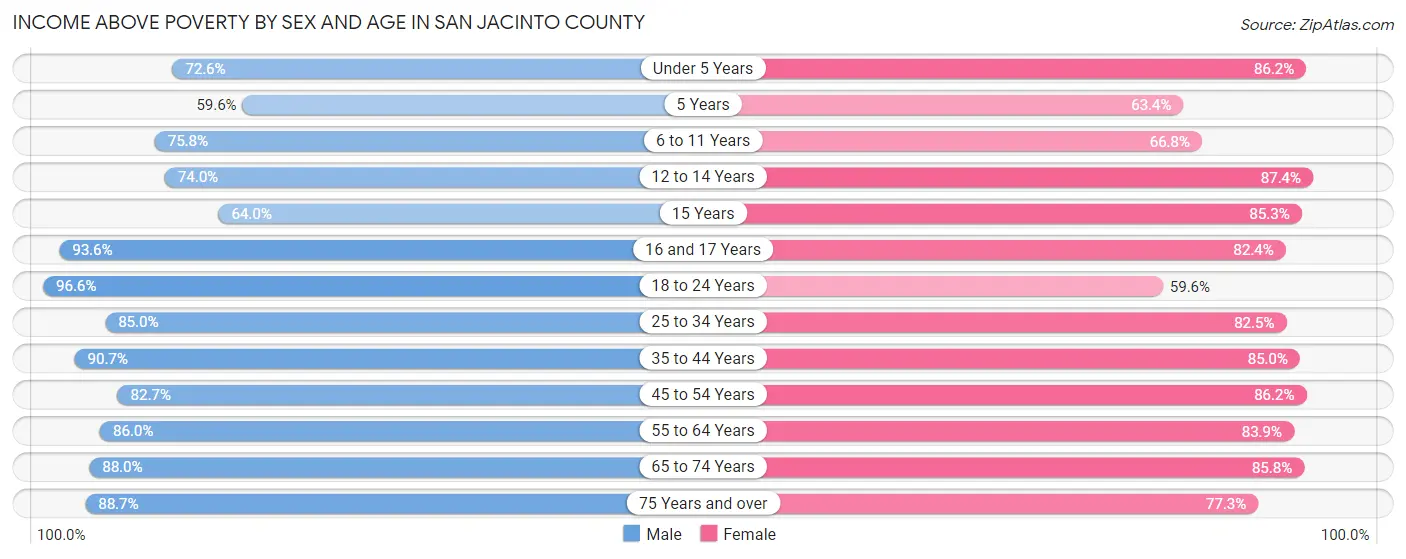
| Age Bracket | Male | Female |
| Under 5 Years | 508 (72.6%) | 555 (86.2%) |
| 5 Years | 134 (59.6%) | 45 (63.4%) |
| 6 to 11 Years | 775 (75.8%) | 856 (66.8%) |
| 12 to 14 Years | 386 (74.0%) | 299 (87.4%) |
| 15 Years | 144 (64.0%) | 192 (85.3%) |
| 16 and 17 Years | 218 (93.6%) | 299 (82.4%) |
| 18 to 24 Years | 1,151 (96.6%) | 618 (59.6%) |
| 25 to 34 Years | 1,221 (85.0%) | 1,102 (82.5%) |
| 35 to 44 Years | 1,152 (90.7%) | 1,241 (85.0%) |
| 45 to 54 Years | 1,370 (82.7%) | 1,505 (86.2%) |
| 55 to 64 Years | 1,974 (86.0%) | 1,859 (83.9%) |
| 65 to 74 Years | 1,573 (88.0%) | 1,629 (85.8%) |
| 75 Years and over | 984 (88.7%) | 937 (77.2%) |
| Total | 11,590 (84.8%) | 11,137 (80.5%) |
Income Below Poverty Among Married-Couple Families in San Jacinto County
The poverty statistics for married-couple families in San Jacinto County show that 8.6% or 485 of the total 5,663 families live below the poverty line. Families with 3 or 4 children have the highest poverty rate of 26.9%, comprising of 133 families. On the other hand, families with 1 or 2 children have the lowest poverty rate of 5.7%, which includes 73 families.
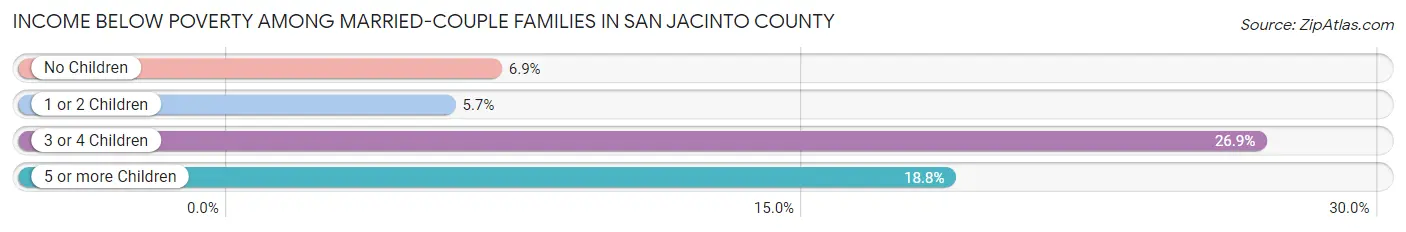
| Children | Above Poverty | Below Poverty |
| No Children | 3,526 (93.1%) | 261 (6.9%) |
| 1 or 2 Children | 1,212 (94.3%) | 73 (5.7%) |
| 3 or 4 Children | 362 (73.1%) | 133 (26.9%) |
| 5 or more Children | 78 (81.2%) | 18 (18.8%) |
| Total | 5,178 (91.4%) | 485 (8.6%) |
Income Below Poverty Among Single-Parent Households in San Jacinto County
According to the poverty data in San Jacinto County, 39.2% or 232 single-father households and 27.1% or 277 single-mother households are living below the poverty line. Among single-father households, those with 3 or 4 children have the highest poverty rate, with 16 households (59.3%) experiencing poverty. Likewise, among single-mother households, those with 3 or 4 children have the highest poverty rate, with 95 households (79.2%) falling below the poverty line.
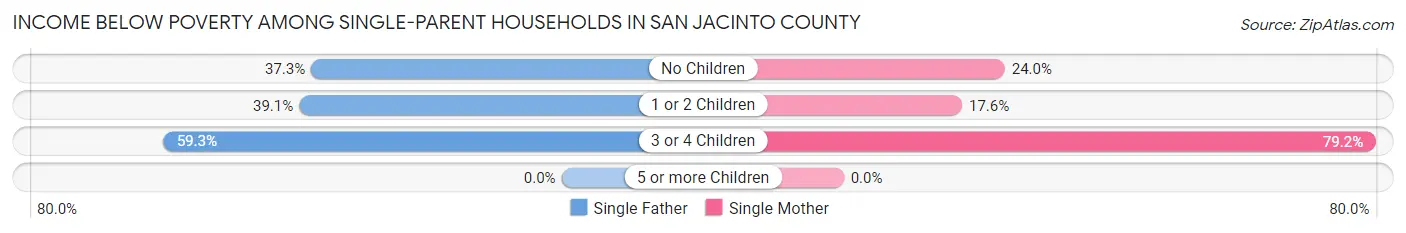
| Children | Single Father | Single Mother |
| No Children | 103 (37.3%) | 85 (24.0%) |
| 1 or 2 Children | 113 (39.1%) | 97 (17.6%) |
| 3 or 4 Children | 16 (59.3%) | 95 (79.2%) |
| 5 or more Children | 0 (0.0%) | 0 (0.0%) |
| Total | 232 (39.2%) | 277 (27.1%) |
Income Below Poverty Among Married-Couple vs Single-Parent Households in San Jacinto County
The poverty data for San Jacinto County shows that 485 of the married-couple family households (8.6%) and 509 of the single-parent households (31.5%) are living below the poverty level. Within the married-couple family households, those with 3 or 4 children have the highest poverty rate, with 133 households (26.9%) falling below the poverty line. Among the single-parent households, those with 3 or 4 children have the highest poverty rate, with 111 household (75.5%) living below poverty.
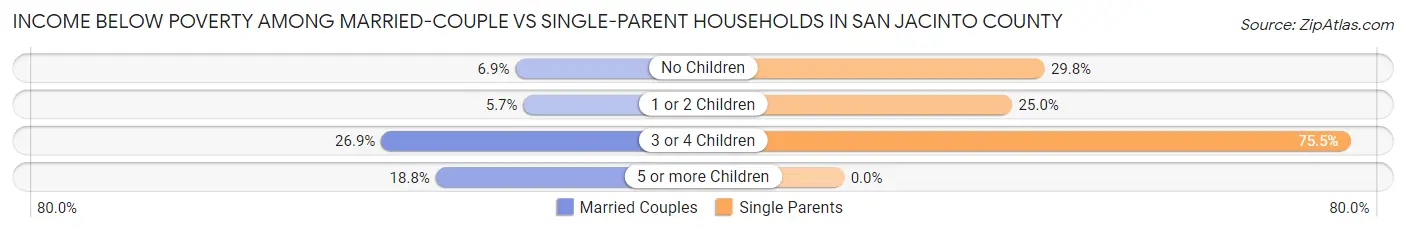
| Children | Married-Couple Families | Single-Parent Households |
| No Children | 261 (6.9%) | 188 (29.8%) |
| 1 or 2 Children | 73 (5.7%) | 210 (25.0%) |
| 3 or 4 Children | 133 (26.9%) | 111 (75.5%) |
| 5 or more Children | 18 (18.8%) | 0 (0.0%) |
| Total | 485 (8.6%) | 509 (31.5%) |
Race in San Jacinto County
The most populous races in San Jacinto County are White / Caucasian (21,088 | 76.2%), Hispanic or Latino (4,147 | 15.0%), and Two or more Races (2,948 | 10.7%).
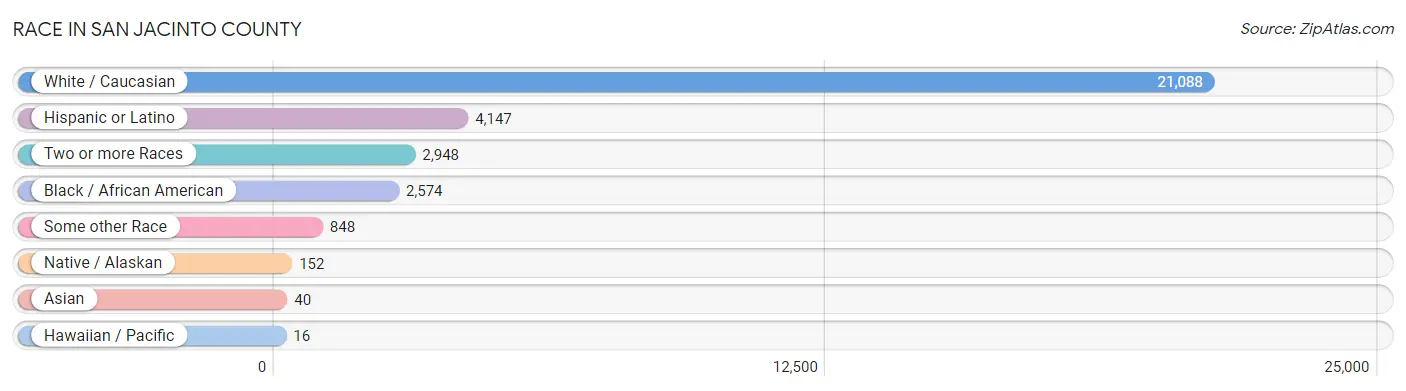
| Race | # Population | % Population |
| Asian | 40 | 0.1% |
| Black / African American | 2,574 | 9.3% |
| Hawaiian / Pacific | 16 | 0.1% |
| Hispanic or Latino | 4,147 | 15.0% |
| Native / Alaskan | 152 | 0.5% |
| White / Caucasian | 21,088 | 76.2% |
| Two or more Races | 2,948 | 10.7% |
| Some other Race | 848 | 3.1% |
| Total | 27,666 | 100.0% |
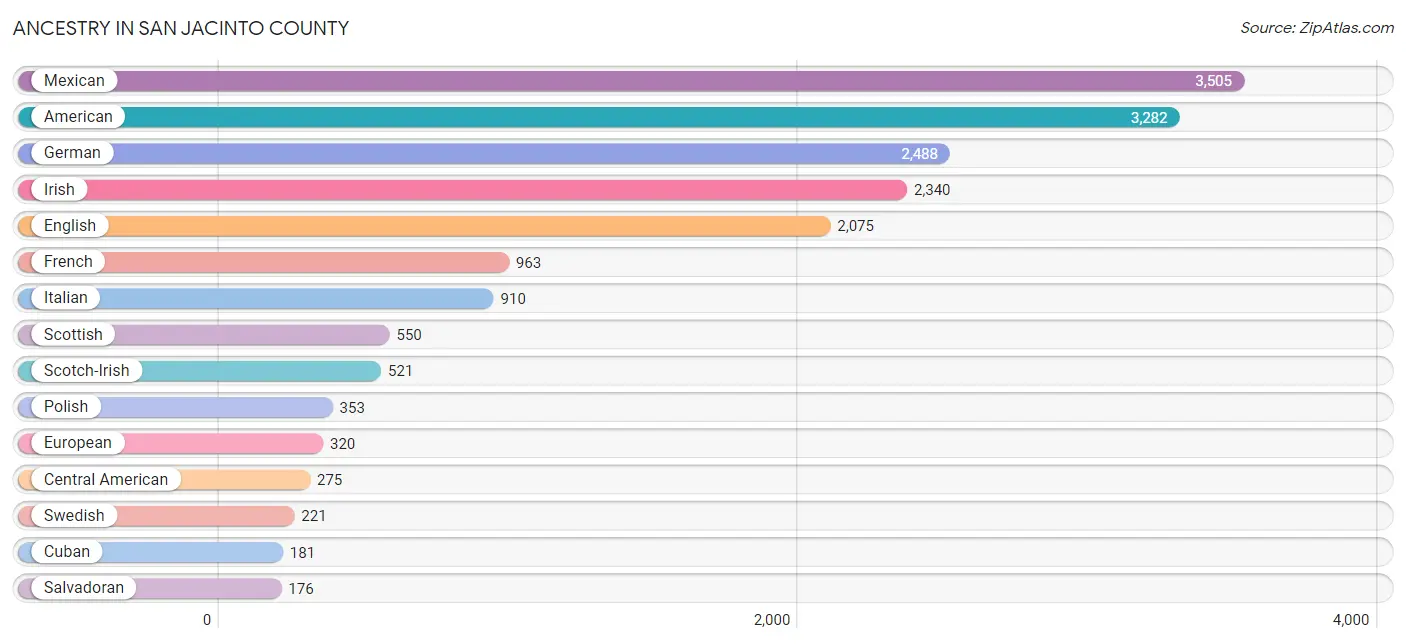
Ancestry in San Jacinto County
The most populous ancestries reported in San Jacinto County are Mexican (3,505 | 12.7%), American (3,282 | 11.9%), German (2,488 | 9.0%), Irish (2,340 | 8.5%), and English (2,075 | 7.5%), together accounting for 49.5% of all San Jacinto County residents.
| Ancestry | # Population | % Population |
| African | 32 | 0.1% |
| American | 3,282 | 11.9% |
| Apache | 3 | 0.0% |
| Arab | 32 | 0.1% |
| Austrian | 67 | 0.2% |
| Belgian | 53 | 0.2% |
| British | 62 | 0.2% |
| Burmese | 38 | 0.1% |
| Cajun | 13 | 0.1% |
| Central American | 275 | 1.0% |
| Central American Indian | 35 | 0.1% |
| Cherokee | 171 | 0.6% |
| Chilean | 5 | 0.0% |
| Choctaw | 71 | 0.3% |
| Colombian | 40 | 0.1% |
| Comanche | 5 | 0.0% |
| Cuban | 181 | 0.6% |
| Czech | 164 | 0.6% |
| Czechoslovakian | 4 | 0.0% |
| Danish | 21 | 0.1% |
| Dutch | 125 | 0.4% |
| English | 2,075 | 7.5% |
| European | 320 | 1.2% |
| French | 963 | 3.5% |
| French Canadian | 125 | 0.4% |
| German | 2,488 | 9.0% |
| Greek | 40 | 0.1% |
| Guatemalan | 12 | 0.0% |
| Honduran | 87 | 0.3% |
| Hungarian | 3 | 0.0% |
| Indian (Asian) | 4 | 0.0% |
| Irish | 2,340 | 8.5% |
| Italian | 910 | 3.3% |
| Jamaican | 8 | 0.0% |
| Korean | 2 | 0.0% |
| Mexican | 3,505 | 12.7% |
| Mexican American Indian | 108 | 0.4% |
| Native Hawaiian | 16 | 0.1% |
| Northern European | 21 | 0.1% |
| Norwegian | 94 | 0.3% |
| Osage | 29 | 0.1% |
| Ottawa | 4 | 0.0% |
| Polish | 353 | 1.3% |
| Portuguese | 99 | 0.4% |
| Puerto Rican | 82 | 0.3% |
| Russian | 33 | 0.1% |
| Salvadoran | 176 | 0.6% |
| Samoan | 117 | 0.4% |
| Scandinavian | 18 | 0.1% |
| Scotch-Irish | 521 | 1.9% |
| Scottish | 550 | 2.0% |
| South American | 45 | 0.2% |
| Subsaharan African | 32 | 0.1% |
| Swedish | 221 | 0.8% |
| Swiss | 8 | 0.0% |
| Syrian | 26 | 0.1% |
| Ukrainian | 14 | 0.1% |
| Welsh | 110 | 0.4% | View All 58 Rows |
Immigrants in San Jacinto County
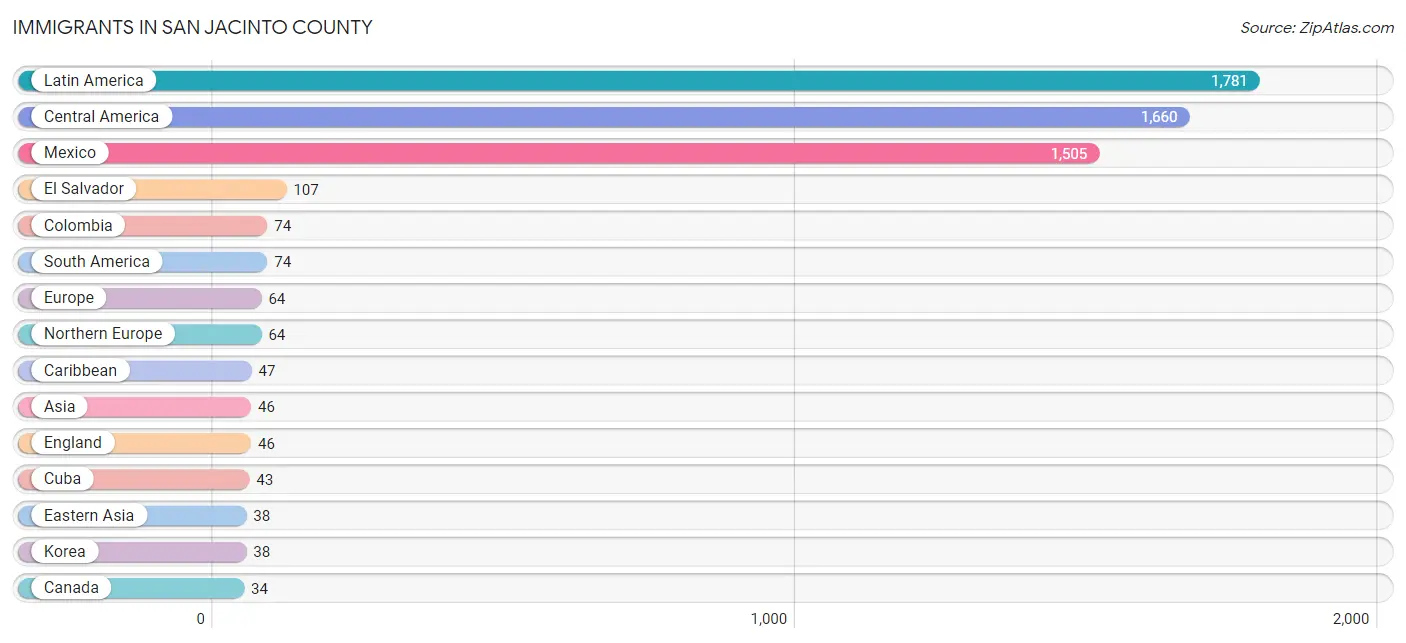
The most numerous immigrant groups reported in San Jacinto County came from Latin America (1,781 | 6.4%), Central America (1,660 | 6.0%), Mexico (1,505 | 5.4%), El Salvador (107 | 0.4%), and Colombia (74 | 0.3%), together accounting for 18.5% of all San Jacinto County residents.
| Immigration Origin | # Population | % Population |
| Africa | 14 | 0.1% |
| Asia | 46 | 0.2% |
| Canada | 34 | 0.1% |
| Caribbean | 47 | 0.2% |
| Central America | 1,660 | 6.0% |
| Colombia | 74 | 0.3% |
| Cuba | 43 | 0.2% |
| Eastern Asia | 38 | 0.1% |
| El Salvador | 107 | 0.4% |
| England | 46 | 0.2% |
| Europe | 64 | 0.2% |
| Guatemala | 14 | 0.1% |
| Honduras | 34 | 0.1% |
| Israel | 6 | 0.0% |
| Jamaica | 4 | 0.0% |
| Korea | 38 | 0.1% |
| Latin America | 1,781 | 6.4% |
| Mexico | 1,505 | 5.4% |
| Northern Europe | 64 | 0.2% |
| Norway | 2 | 0.0% |
| Philippines | 2 | 0.0% |
| Scotland | 16 | 0.1% |
| South Africa | 14 | 0.1% |
| South America | 74 | 0.3% |
| South Eastern Asia | 2 | 0.0% |
| Western Asia | 6 | 0.0% | View All 26 Rows |
Sex and Age in San Jacinto County
Sex and Age in San Jacinto County
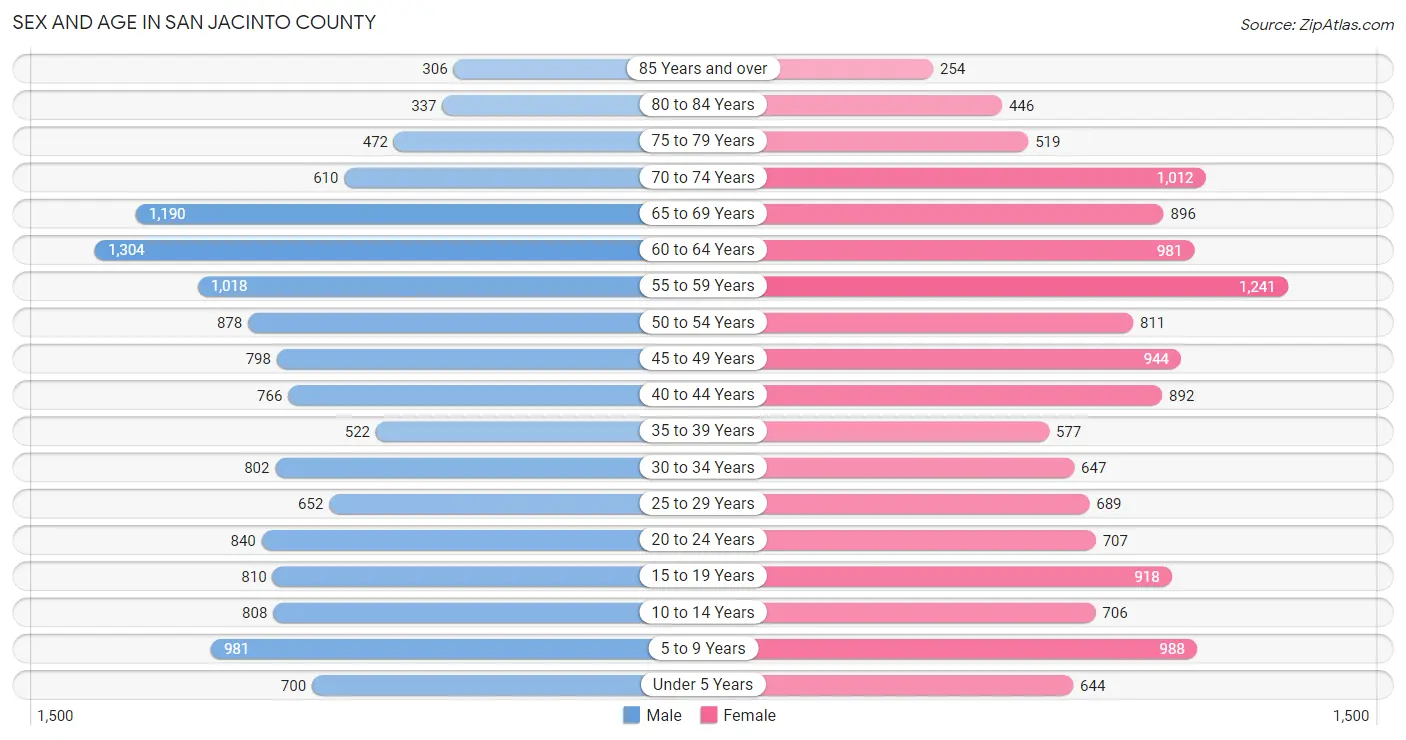
The most populous age groups in San Jacinto County are 60 to 64 Years (1,304 | 9.5%) for men and 55 to 59 Years (1,241 | 8.9%) for women.
| Age Bracket | Male | Female |
| Under 5 Years | 700 (5.1%) | 644 (4.6%) |
| 5 to 9 Years | 981 (7.1%) | 988 (7.1%) |
| 10 to 14 Years | 808 (5.9%) | 706 (5.1%) |
| 15 to 19 Years | 810 (5.9%) | 918 (6.6%) |
| 20 to 24 Years | 840 (6.1%) | 707 (5.1%) |
| 25 to 29 Years | 652 (4.7%) | 689 (5.0%) |
| 30 to 34 Years | 802 (5.8%) | 647 (4.7%) |
| 35 to 39 Years | 522 (3.8%) | 577 (4.2%) |
| 40 to 44 Years | 766 (5.6%) | 892 (6.4%) |
| 45 to 49 Years | 798 (5.8%) | 944 (6.8%) |
| 50 to 54 Years | 878 (6.4%) | 811 (5.9%) |
| 55 to 59 Years | 1,018 (7.4%) | 1,241 (8.9%) |
| 60 to 64 Years | 1,304 (9.5%) | 981 (7.1%) |
| 65 to 69 Years | 1,190 (8.6%) | 896 (6.5%) |
| 70 to 74 Years | 610 (4.4%) | 1,012 (7.3%) |
| 75 to 79 Years | 472 (3.4%) | 519 (3.7%) |
| 80 to 84 Years | 337 (2.4%) | 446 (3.2%) |
| 85 Years and over | 306 (2.2%) | 254 (1.8%) |
| Total | 13,794 (100.0%) | 13,872 (100.0%) |
Families and Households in San Jacinto County
Median Family Size in San Jacinto County
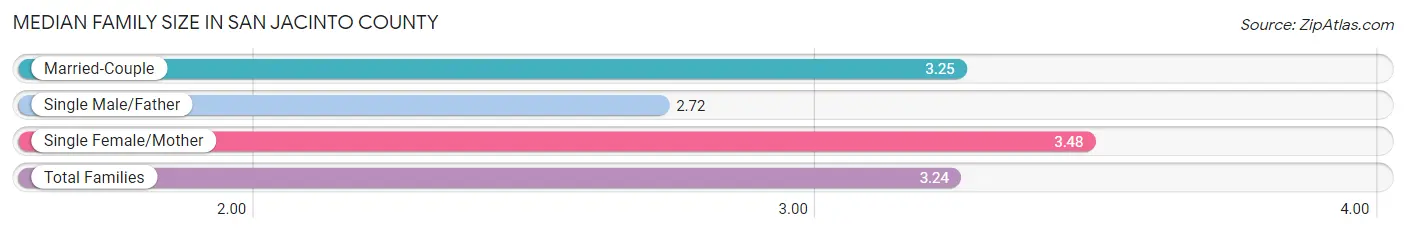
The median family size in San Jacinto County is 3.24 persons per family, with single female/mother families (1,024 | 14.1%) accounting for the largest median family size of 3.48 persons per family. On the other hand, single male/father families (592 | 8.1%) represent the smallest median family size with 2.72 persons per family.
| Family Type | # Families | Family Size |
| Married-Couple | 5,663 (77.8%) | 3.25 |
| Single Male/Father | 592 (8.1%) | 2.72 |
| Single Female/Mother | 1,024 (14.1%) | 3.48 |
| Total Families | 7,279 (100.0%) | 3.24 |
Median Household Size in San Jacinto County
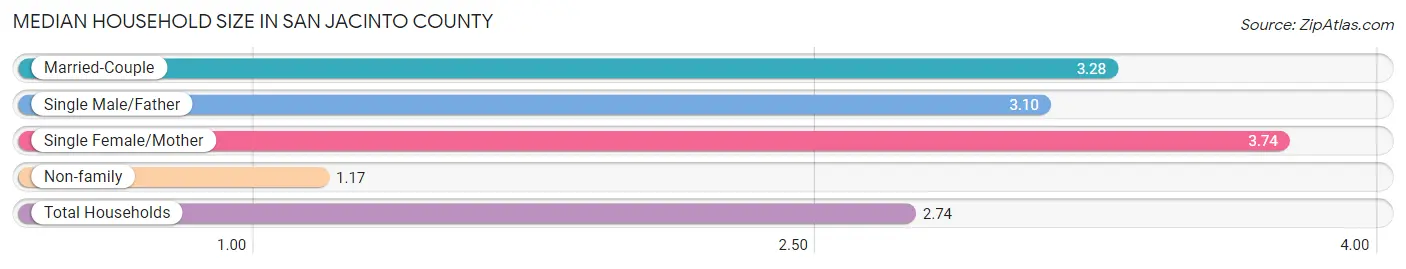
The median household size in San Jacinto County is 2.74 persons per household, with single female/mother households (1,024 | 10.2%) accounting for the largest median household size of 3.74 persons per household. non-family households (2,785 | 27.7%) represent the smallest median household size with 1.17 persons per household.
| Household Type | # Households | Household Size |
| Married-Couple | 5,663 (56.3%) | 3.28 |
| Single Male/Father | 592 (5.9%) | 3.10 |
| Single Female/Mother | 1,024 (10.2%) | 3.74 |
| Non-family | 2,785 (27.7%) | 1.17 |
| Total Households | 10,064 (100.0%) | 2.74 |
Household Size by Marriage Status in San Jacinto County
Out of a total of 10,064 households in San Jacinto County, 7,279 (72.3%) are family households, while 2,785 (27.7%) are nonfamily households. The most numerous type of family households are 2-person households, comprising 3,436, and the most common type of nonfamily households are 1-person households, comprising 2,279.
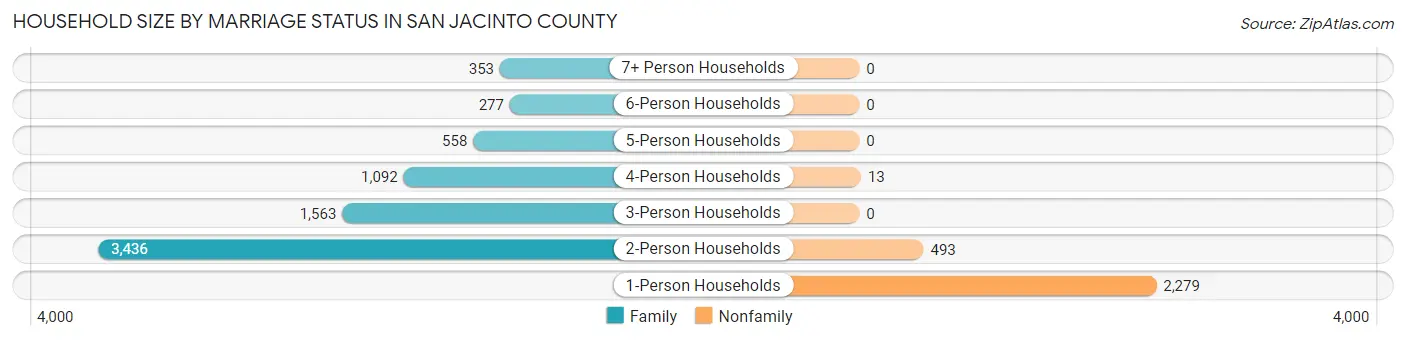
| Household Size | Family Households | Nonfamily Households |
| 1-Person Households | - | 2,279 (22.7%) |
| 2-Person Households | 3,436 (34.1%) | 493 (4.9%) |
| 3-Person Households | 1,563 (15.5%) | 0 (0.0%) |
| 4-Person Households | 1,092 (10.8%) | 13 (0.1%) |
| 5-Person Households | 558 (5.5%) | 0 (0.0%) |
| 6-Person Households | 277 (2.8%) | 0 (0.0%) |
| 7+ Person Households | 353 (3.5%) | 0 (0.0%) |
| Total | 7,279 (72.3%) | 2,785 (27.7%) |
Female Fertility in San Jacinto County
Fertility by Age in San Jacinto County
Average fertility rate in San Jacinto County is 117.0 births per 1,000 women. Women in the age bracket of 15 to 19 years have the highest fertility rate with 202.0 births per 1,000 women. Women in the age bracket of 20 to 34 years acount for 51.8% of all women with births.
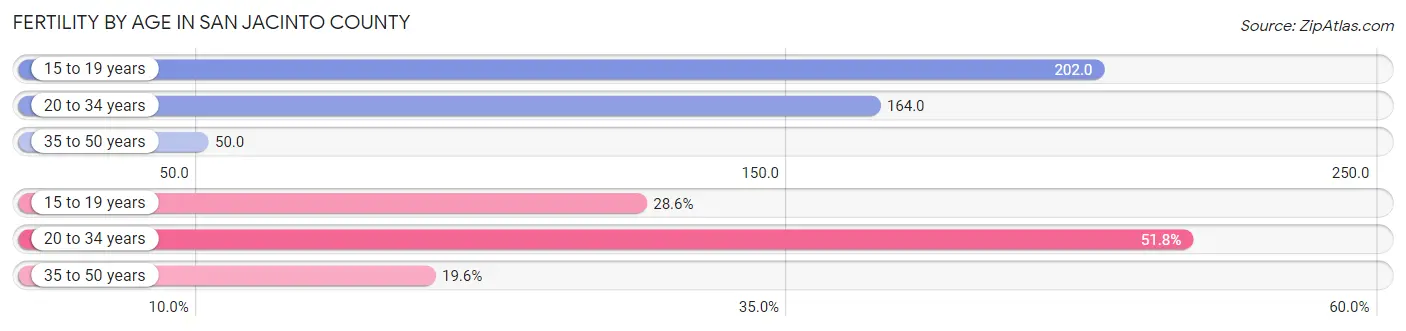
| Age Bracket | Women with Births | Births / 1,000 Women |
| 15 to 19 years | 185 (28.6%) | 202.0 |
| 20 to 34 years | 335 (51.8%) | 164.0 |
| 35 to 50 years | 127 (19.6%) | 50.0 |
| Total | 647 (100.0%) | 117.0 |
Fertility by Age by Marriage Status in San Jacinto County
58.3% of women with births (647) in San Jacinto County are married. The highest percentage of unmarried women with births falls into 15 to 19 years age bracket with 100.0% of them unmarried at the time of birth, while the lowest percentage of unmarried women with births belong to 20 to 34 years age bracket with 16.4% of them unmarried.
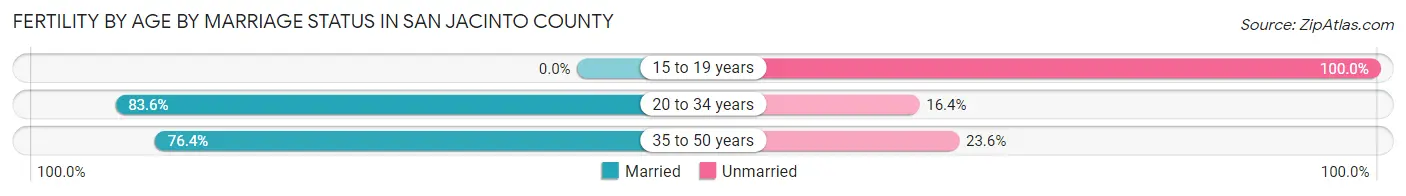
| Age Bracket | Married | Unmarried |
| 15 to 19 years | 0 (0.0%) | 185 (100.0%) |
| 20 to 34 years | 280 (83.6%) | 55 (16.4%) |
| 35 to 50 years | 97 (76.4%) | 30 (23.6%) |
| Total | 377 (58.3%) | 270 (41.7%) |
Fertility by Education in San Jacinto County
Average fertility rate in San Jacinto County is 117.0 births per 1,000 women. Women with the education attainment of college or associate's degree have the highest fertility rate of 232.0 births per 1,000 women, while women with the education attainment of less than high school have the lowest fertility at 22.0 births per 1,000 women. Women with the education attainment of college or associate's degree represent 57.2% of all women with births.
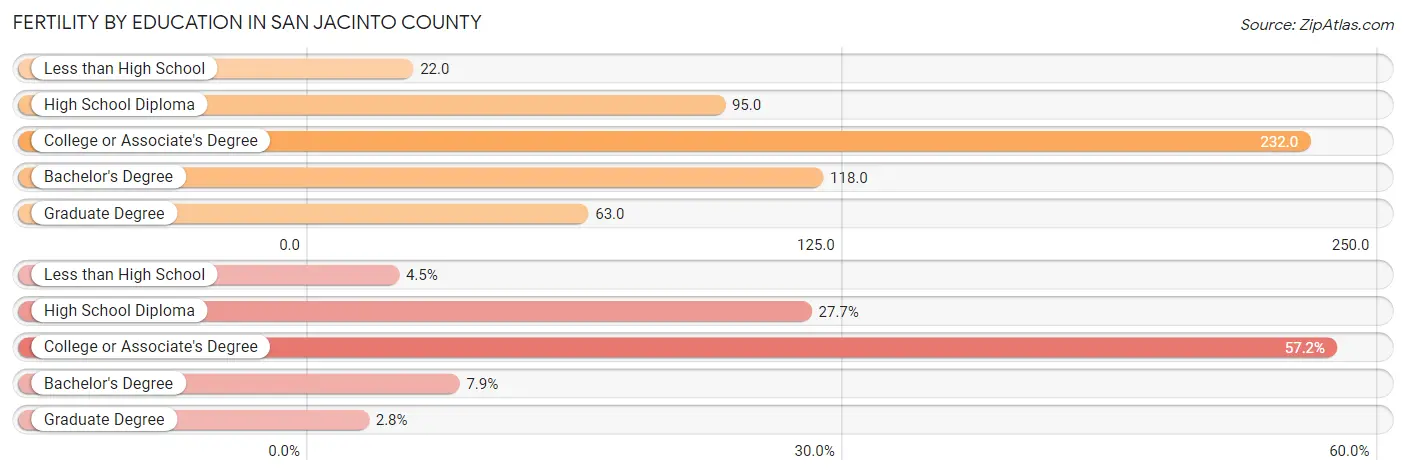
| Educational Attainment | Women with Births | Births / 1,000 Women |
| Less than High School | 29 (4.5%) | 22.0 |
| High School Diploma | 179 (27.7%) | 95.0 |
| College or Associate's Degree | 370 (57.2%) | 232.0 |
| Bachelor's Degree | 51 (7.9%) | 118.0 |
| Graduate Degree | 18 (2.8%) | 63.0 |
| Total | 647 (100.0%) | 117.0 |
Fertility by Education by Marriage Status in San Jacinto County
41.7% of women with births in San Jacinto County are unmarried. Women with the educational attainment of less than high school are most likely to be married with 100.0% of them married at childbirth, while women with the educational attainment of college or associate's degree are least likely to be married with 55.1% of them unmarried at childbirth.
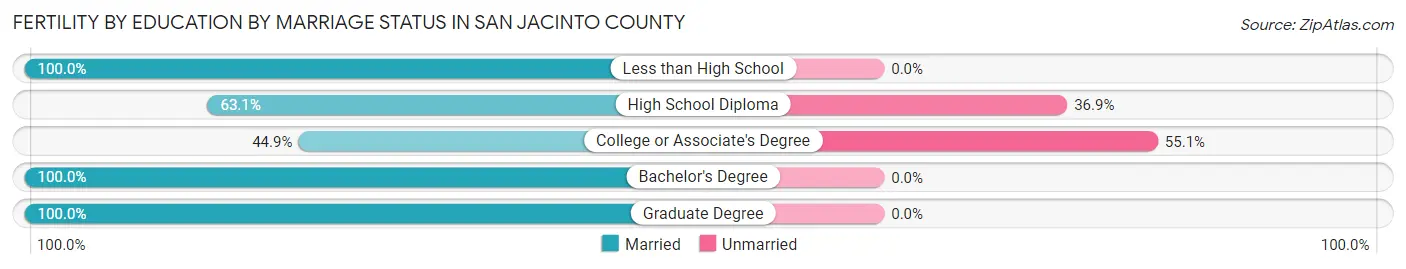
| Educational Attainment | Married | Unmarried |
| Less than High School | 29 (100.0%) | 0 (0.0%) |
| High School Diploma | 113 (63.1%) | 66 (36.9%) |
| College or Associate's Degree | 166 (44.9%) | 204 (55.1%) |
| Bachelor's Degree | 51 (100.0%) | 0 (0.0%) |
| Graduate Degree | 18 (100.0%) | 0 (0.0%) |
| Total | 377 (58.3%) | 270 (41.7%) |
Employment Characteristics in San Jacinto County
Employment by Class of Employer in San Jacinto County
Among the 10,378 employed individuals in San Jacinto County, private company employees (6,684 | 64.4%), self-employed (not incorporated) (1,163 | 11.2%), and local government employees (672 | 6.5%) make up the most common classes of employment.
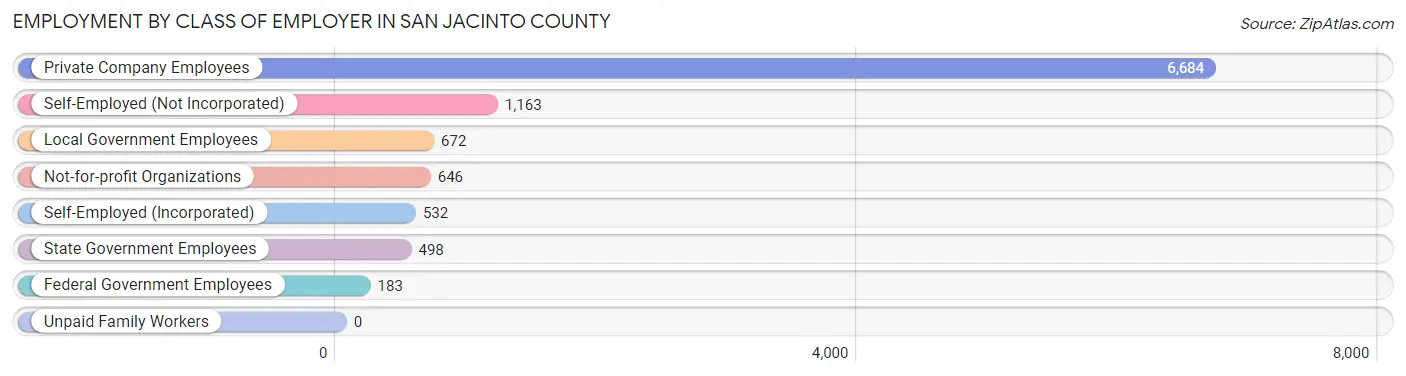
| Employer Class | # Employees | % Employees |
| Private Company Employees | 6,684 | 64.4% |
| Self-Employed (Incorporated) | 532 | 5.1% |
| Self-Employed (Not Incorporated) | 1,163 | 11.2% |
| Not-for-profit Organizations | 646 | 6.2% |
| Local Government Employees | 672 | 6.5% |
| State Government Employees | 498 | 4.8% |
| Federal Government Employees | 183 | 1.8% |
| Unpaid Family Workers | 0 | 0.0% |
| Total | 10,378 | 100.0% |
Employment Status by Age in San Jacinto County
According to the labor force statistics for San Jacinto County, out of the total population over 16 years of age (22,389), 52.2% or 11,687 individuals are in the labor force, with 7.1% or 830 of them unemployed. The age group with the highest labor force participation rate is 25 to 29 years, with 76.7% or 1,029 individuals in the labor force. Within the labor force, the 16 to 19 years age range has the highest percentage of unemployed individuals, with 27.9% or 106 of them being unemployed.
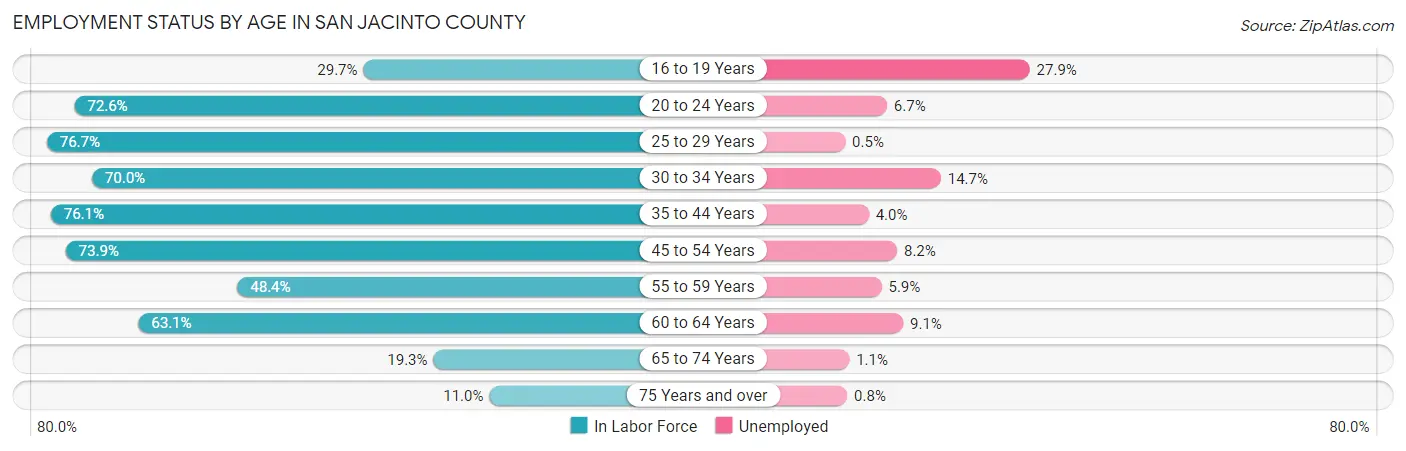
| Age Bracket | In Labor Force | Unemployed |
| 16 to 19 Years | 380 (29.7%) | 106 (27.9%) |
| 20 to 24 Years | 1,123 (72.6%) | 75 (6.7%) |
| 25 to 29 Years | 1,029 (76.7%) | 5 (0.5%) |
| 30 to 34 Years | 1,014 (70.0%) | 149 (14.7%) |
| 35 to 44 Years | 2,098 (76.1%) | 84 (4.0%) |
| 45 to 54 Years | 2,536 (73.9%) | 208 (8.2%) |
| 55 to 59 Years | 1,093 (48.4%) | 64 (5.9%) |
| 60 to 64 Years | 1,442 (63.1%) | 131 (9.1%) |
| 65 to 74 Years | 716 (19.3%) | 8 (1.1%) |
| 75 Years and over | 257 (11.0%) | 2 (0.8%) |
| Total | 11,687 (52.2%) | 830 (7.1%) |
Employment Status by Educational Attainment in San Jacinto County
According to labor force statistics for San Jacinto County, 68.1% of individuals (9,208) out of the total population between 25 and 64 years of age (13,522) are in the labor force, with 7.0% or 645 of them being unemployed. The group with the highest labor force participation rate are those with the educational attainment of college / associate degree, with 77.2% or 3,232 individuals in the labor force. Within the labor force, individuals with less than high school education have the highest percentage of unemployment, with 9.8% or 115 of them being unemployed.
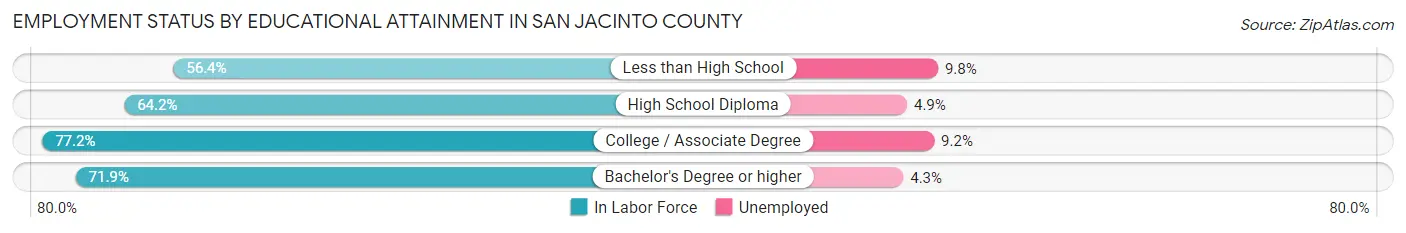
| Educational Attainment | In Labor Force | Unemployed |
| Less than High School | 1,177 (56.4%) | 204 (9.8%) |
| High School Diploma | 3,439 (64.2%) | 262 (4.9%) |
| College / Associate Degree | 3,232 (77.2%) | 385 (9.2%) |
| Bachelor's Degree or higher | 1,361 (71.9%) | 81 (4.3%) |
| Total | 9,208 (68.1%) | 947 (7.0%) |
Employment Occupations by Sex in San Jacinto County
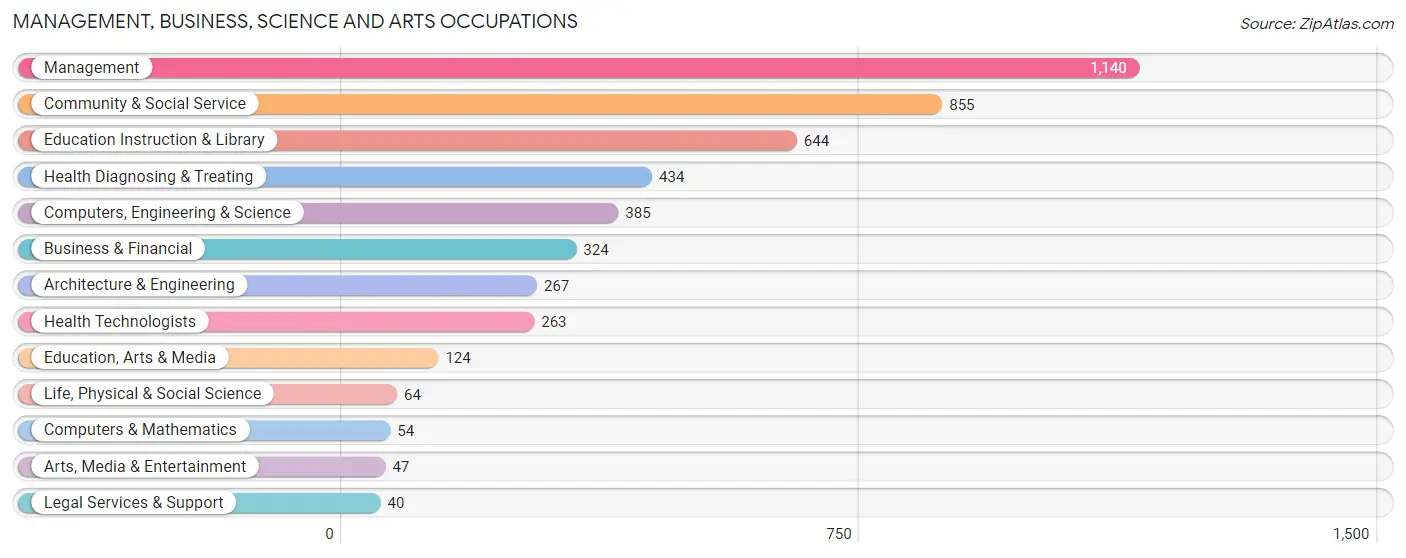
Management, Business, Science and Arts Occupations
The most common Management, Business, Science and Arts occupations in San Jacinto County are Management (1,140 | 10.5%), Community & Social Service (855 | 7.9%), Education Instruction & Library (644 | 6.0%), Health Diagnosing & Treating (434 | 4.0%), and Computers, Engineering & Science (385 | 3.6%).
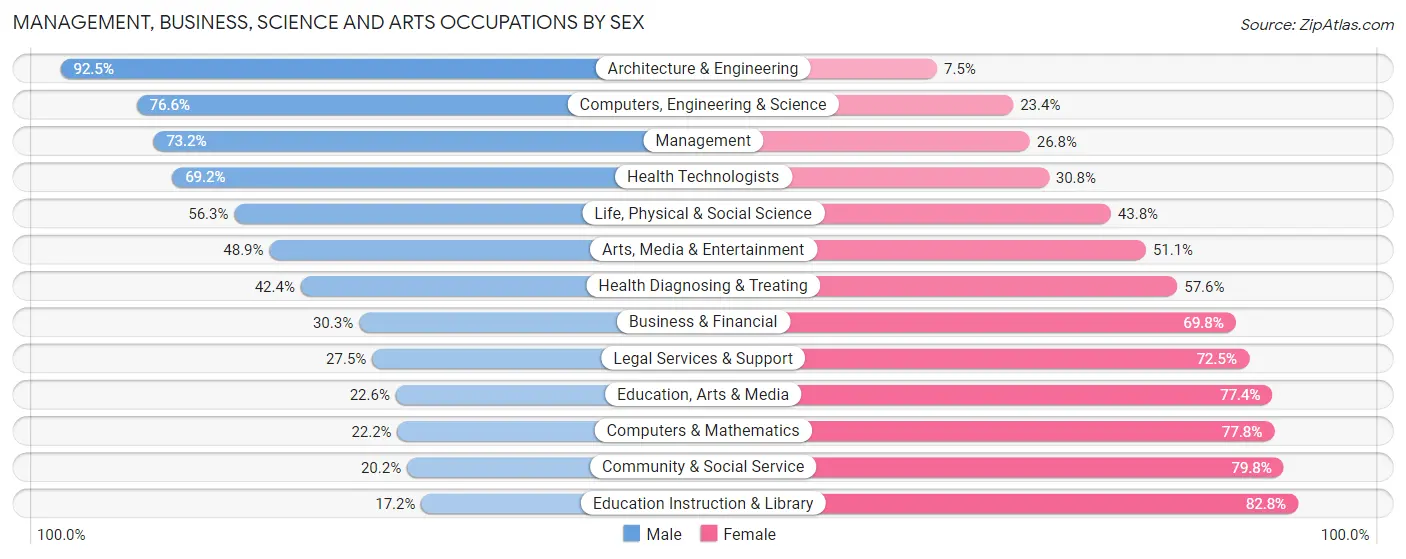
Management, Business, Science and Arts Occupations by Sex
Within the Management, Business, Science and Arts occupations in San Jacinto County, the most male-oriented occupations are Architecture & Engineering (92.5%), Computers, Engineering & Science (76.6%), and Management (73.2%), while the most female-oriented occupations are Education Instruction & Library (82.8%), Community & Social Service (79.8%), and Computers & Mathematics (77.8%).
| Occupation | Male | Female |
| Management | 834 (73.2%) | 306 (26.8%) |
| Business & Financial | 98 (30.2%) | 226 (69.8%) |
| Computers, Engineering & Science | 295 (76.6%) | 90 (23.4%) |
| Computers & Mathematics | 12 (22.2%) | 42 (77.8%) |
| Architecture & Engineering | 247 (92.5%) | 20 (7.5%) |
| Life, Physical & Social Science | 36 (56.2%) | 28 (43.8%) |
| Community & Social Service | 173 (20.2%) | 682 (79.8%) |
| Education, Arts & Media | 28 (22.6%) | 96 (77.4%) |
| Legal Services & Support | 11 (27.5%) | 29 (72.5%) |
| Education Instruction & Library | 111 (17.2%) | 533 (82.8%) |
| Arts, Media & Entertainment | 23 (48.9%) | 24 (51.1%) |
| Health Diagnosing & Treating | 184 (42.4%) | 250 (57.6%) |
| Health Technologists | 182 (69.2%) | 81 (30.8%) |
| Total (Category) | 1,584 (50.5%) | 1,554 (49.5%) |
| Total (Overall) | 6,391 (59.1%) | 4,419 (40.9%) |
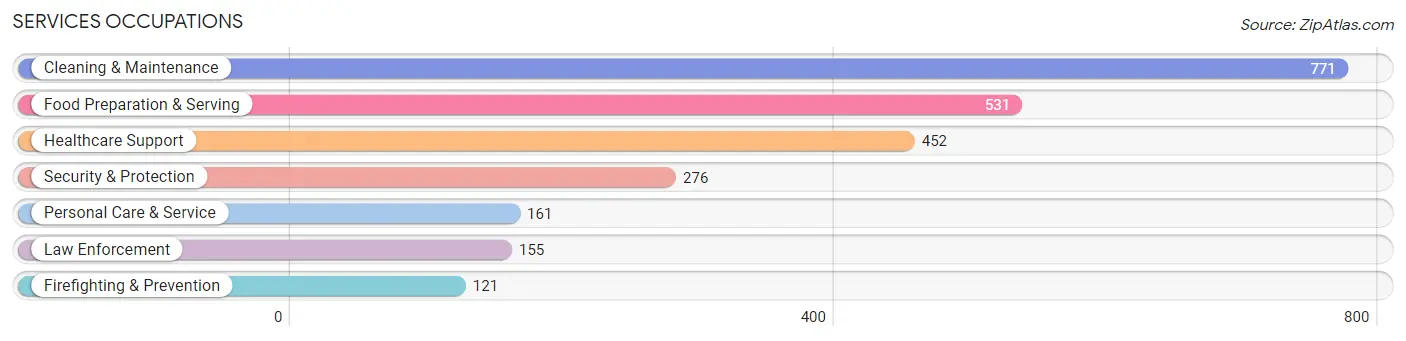
Services Occupations
The most common Services occupations in San Jacinto County are Cleaning & Maintenance (771 | 7.1%), Food Preparation & Serving (531 | 4.9%), Healthcare Support (452 | 4.2%), Security & Protection (276 | 2.5%), and Personal Care & Service (161 | 1.5%).
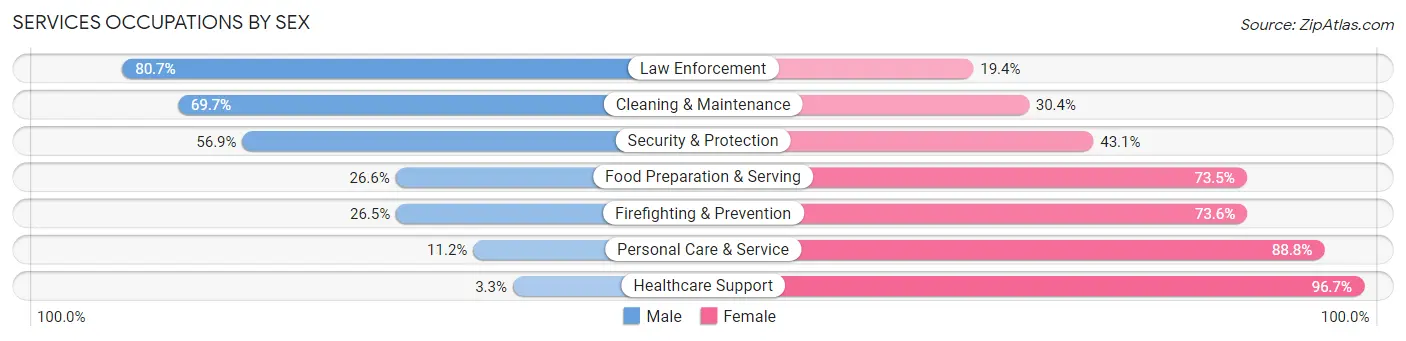
Services Occupations by Sex
Within the Services occupations in San Jacinto County, the most male-oriented occupations are Law Enforcement (80.6%), Cleaning & Maintenance (69.7%), and Security & Protection (56.9%), while the most female-oriented occupations are Healthcare Support (96.7%), Personal Care & Service (88.8%), and Firefighting & Prevention (73.6%).
| Occupation | Male | Female |
| Healthcare Support | 15 (3.3%) | 437 (96.7%) |
| Security & Protection | 157 (56.9%) | 119 (43.1%) |
| Firefighting & Prevention | 32 (26.5%) | 89 (73.6%) |
| Law Enforcement | 125 (80.6%) | 30 (19.4%) |
| Food Preparation & Serving | 141 (26.6%) | 390 (73.5%) |
| Cleaning & Maintenance | 537 (69.7%) | 234 (30.3%) |
| Personal Care & Service | 18 (11.2%) | 143 (88.8%) |
| Total (Category) | 868 (39.6%) | 1,323 (60.4%) |
| Total (Overall) | 6,391 (59.1%) | 4,419 (40.9%) |
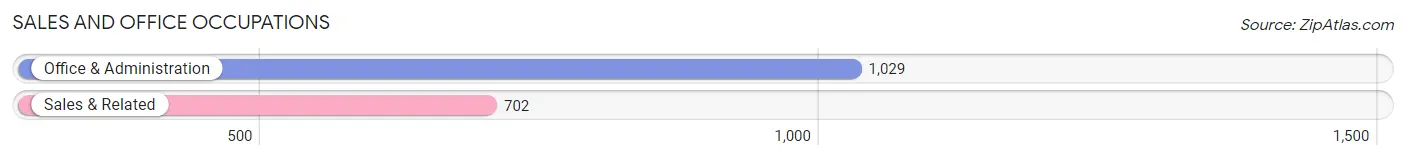
Sales and Office Occupations
The most common Sales and Office occupations in San Jacinto County are Office & Administration (1,029 | 9.5%), and Sales & Related (702 | 6.5%).
Sales and Office Occupations by Sex
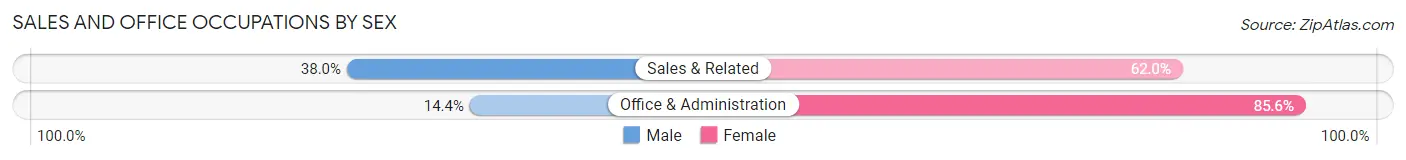
| Occupation | Male | Female |
| Sales & Related | 267 (38.0%) | 435 (62.0%) |
| Office & Administration | 148 (14.4%) | 881 (85.6%) |
| Total (Category) | 415 (24.0%) | 1,316 (76.0%) |
| Total (Overall) | 6,391 (59.1%) | 4,419 (40.9%) |
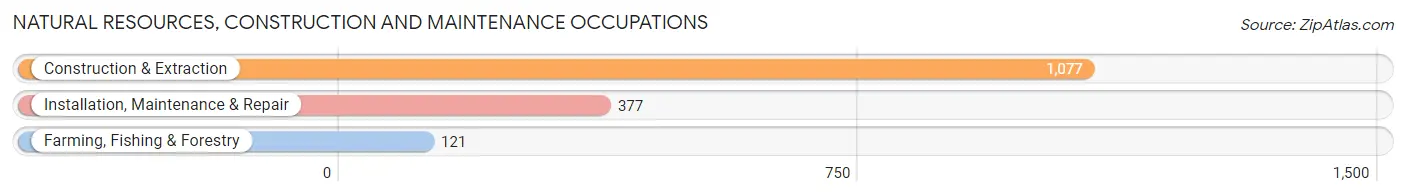
Natural Resources, Construction and Maintenance Occupations
The most common Natural Resources, Construction and Maintenance occupations in San Jacinto County are Construction & Extraction (1,077 | 10.0%), Installation, Maintenance & Repair (377 | 3.5%), and Farming, Fishing & Forestry (121 | 1.1%).
Natural Resources, Construction and Maintenance Occupations by Sex
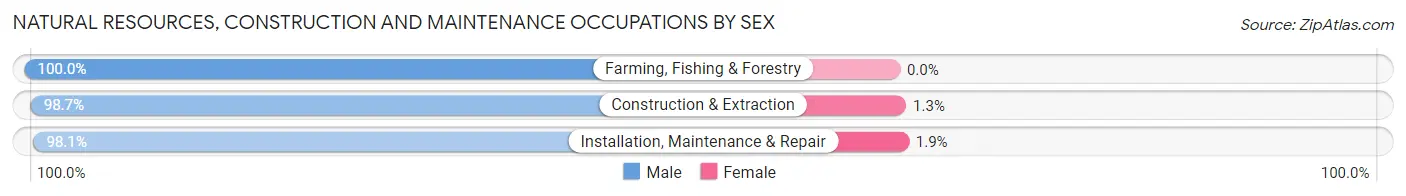
| Occupation | Male | Female |
| Farming, Fishing & Forestry | 121 (100.0%) | 0 (0.0%) |
| Construction & Extraction | 1,063 (98.7%) | 14 (1.3%) |
| Installation, Maintenance & Repair | 370 (98.1%) | 7 (1.9%) |
| Total (Category) | 1,554 (98.7%) | 21 (1.3%) |
| Total (Overall) | 6,391 (59.1%) | 4,419 (40.9%) |
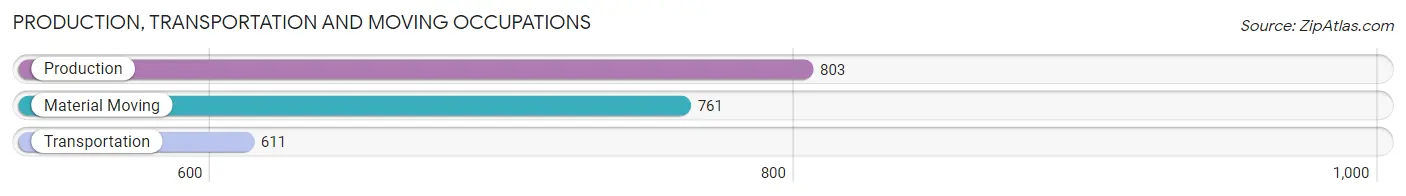
Production, Transportation and Moving Occupations
The most common Production, Transportation and Moving occupations in San Jacinto County are Production (803 | 7.4%), Material Moving (761 | 7.0%), and Transportation (611 | 5.7%).
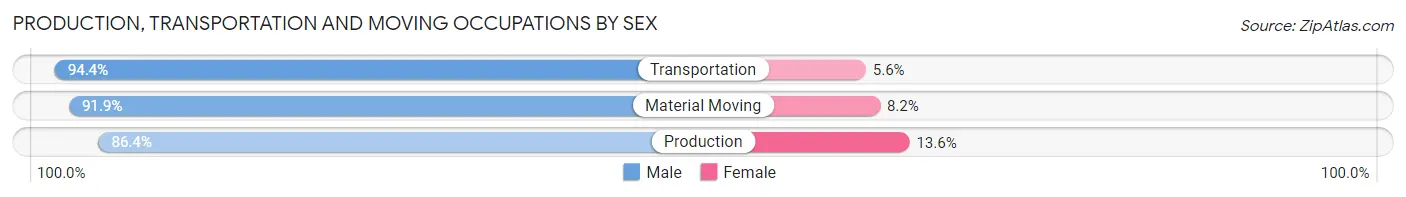
Production, Transportation and Moving Occupations by Sex
| Occupation | Male | Female |
| Production | 694 (86.4%) | 109 (13.6%) |
| Transportation | 577 (94.4%) | 34 (5.6%) |
| Material Moving | 699 (91.8%) | 62 (8.2%) |
| Total (Category) | 1,970 (90.6%) | 205 (9.4%) |
| Total (Overall) | 6,391 (59.1%) | 4,419 (40.9%) |
Employment Industries by Sex in San Jacinto County
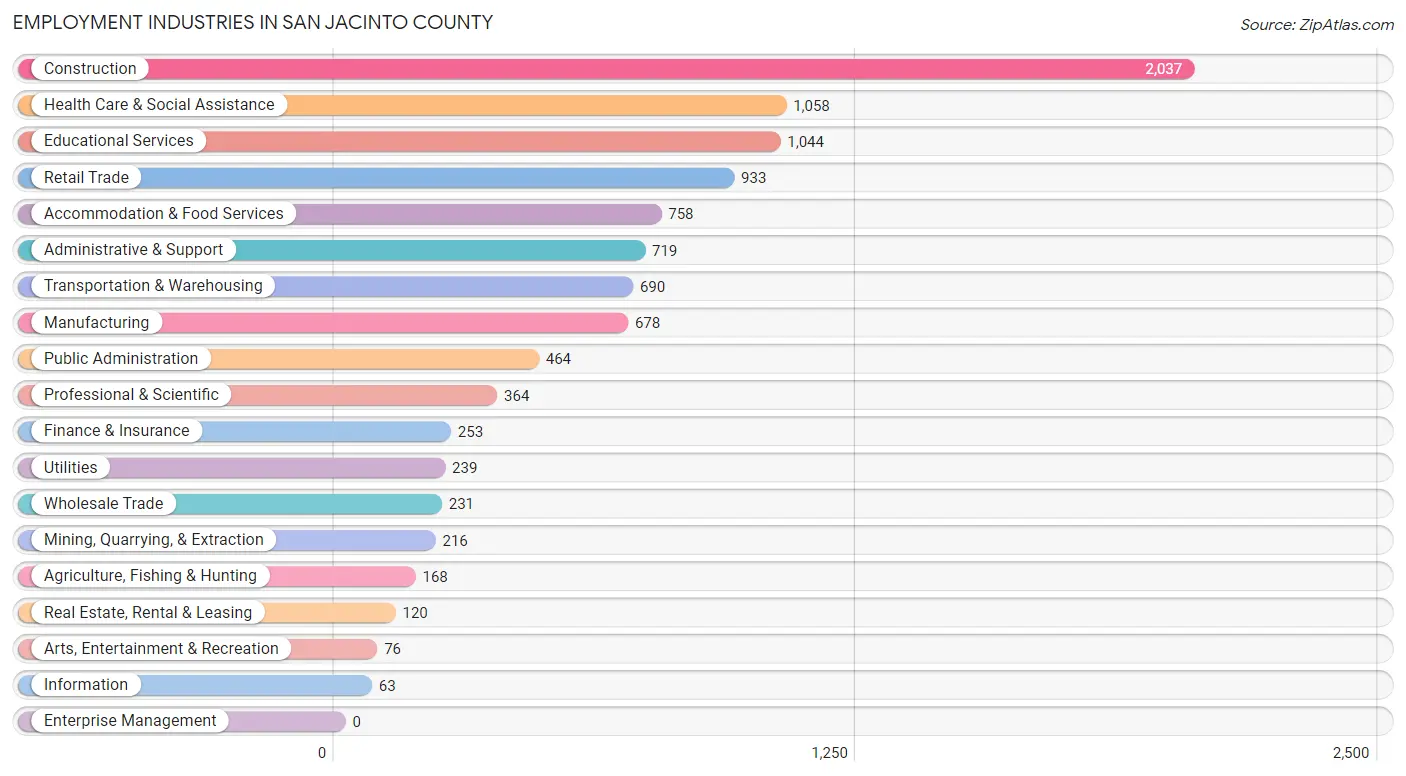
Employment Industries in San Jacinto County
The major employment industries in San Jacinto County include Construction (2,037 | 18.8%), Health Care & Social Assistance (1,058 | 9.8%), Educational Services (1,044 | 9.7%), Retail Trade (933 | 8.6%), and Accommodation & Food Services (758 | 7.0%).
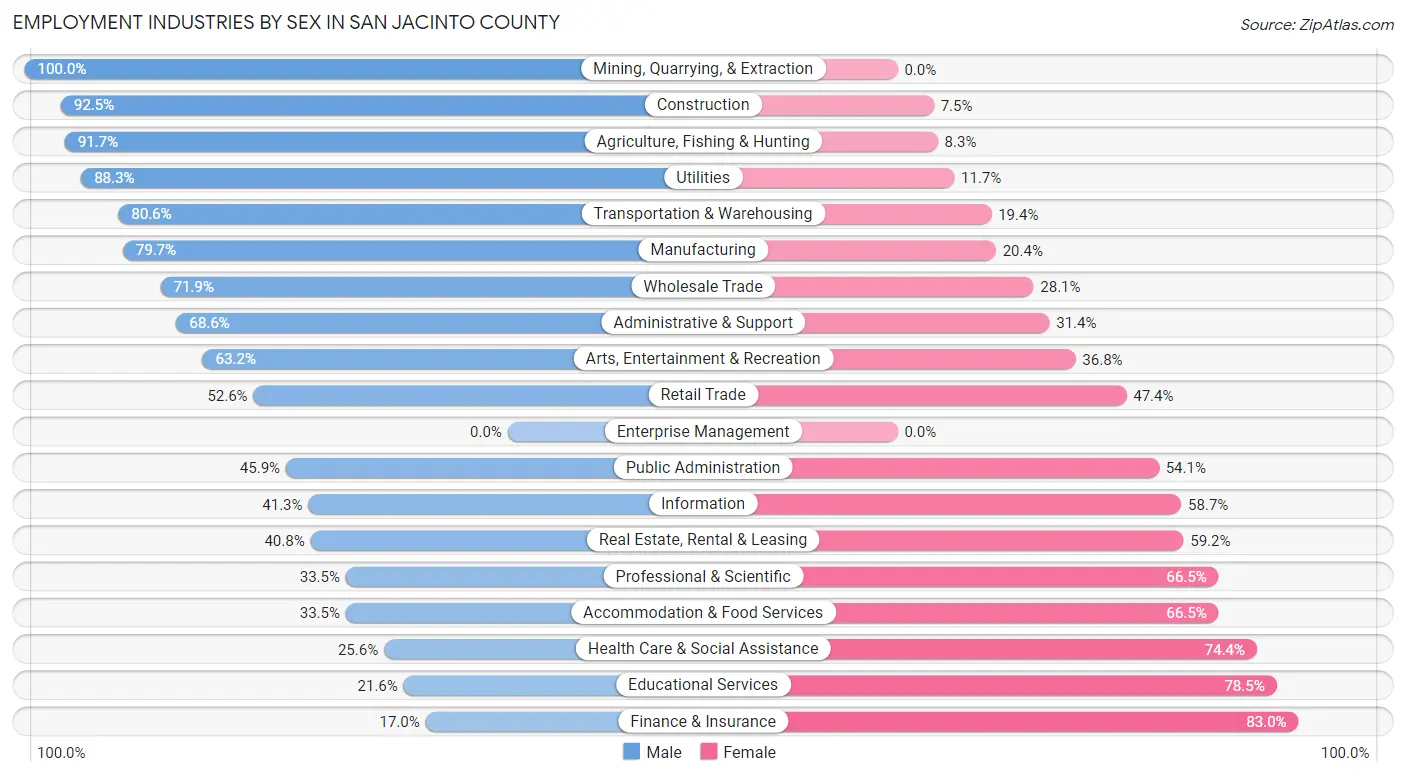
Employment Industries by Sex in San Jacinto County
The San Jacinto County industries that see more men than women are Mining, Quarrying, & Extraction (100.0%), Construction (92.5%), and Agriculture, Fishing & Hunting (91.7%), whereas the industries that tend to have a higher number of women are Finance & Insurance (83.0%), Educational Services (78.4%), and Health Care & Social Assistance (74.4%).
| Industry | Male | Female |
| Agriculture, Fishing & Hunting | 154 (91.7%) | 14 (8.3%) |
| Mining, Quarrying, & Extraction | 216 (100.0%) | 0 (0.0%) |
| Construction | 1,884 (92.5%) | 153 (7.5%) |
| Manufacturing | 540 (79.6%) | 138 (20.3%) |
| Wholesale Trade | 166 (71.9%) | 65 (28.1%) |
| Retail Trade | 491 (52.6%) | 442 (47.4%) |
| Transportation & Warehousing | 556 (80.6%) | 134 (19.4%) |
| Utilities | 211 (88.3%) | 28 (11.7%) |
| Information | 26 (41.3%) | 37 (58.7%) |
| Finance & Insurance | 43 (17.0%) | 210 (83.0%) |
| Real Estate, Rental & Leasing | 49 (40.8%) | 71 (59.2%) |
| Professional & Scientific | 122 (33.5%) | 242 (66.5%) |
| Enterprise Management | 0 (0.0%) | 0 (0.0%) |
| Administrative & Support | 493 (68.6%) | 226 (31.4%) |
| Educational Services | 225 (21.5%) | 819 (78.4%) |
| Health Care & Social Assistance | 271 (25.6%) | 787 (74.4%) |
| Arts, Entertainment & Recreation | 48 (63.2%) | 28 (36.8%) |
| Accommodation & Food Services | 254 (33.5%) | 504 (66.5%) |
| Public Administration | 213 (45.9%) | 251 (54.1%) |
| Total | 6,391 (59.1%) | 4,419 (40.9%) |
Education in San Jacinto County
School Enrollment in San Jacinto County
The most common levels of schooling among the 5,765 students in San Jacinto County are high school (1,455 | 25.2%), elementary school (1,409 | 24.4%), and middle school (1,231 | 21.3%).
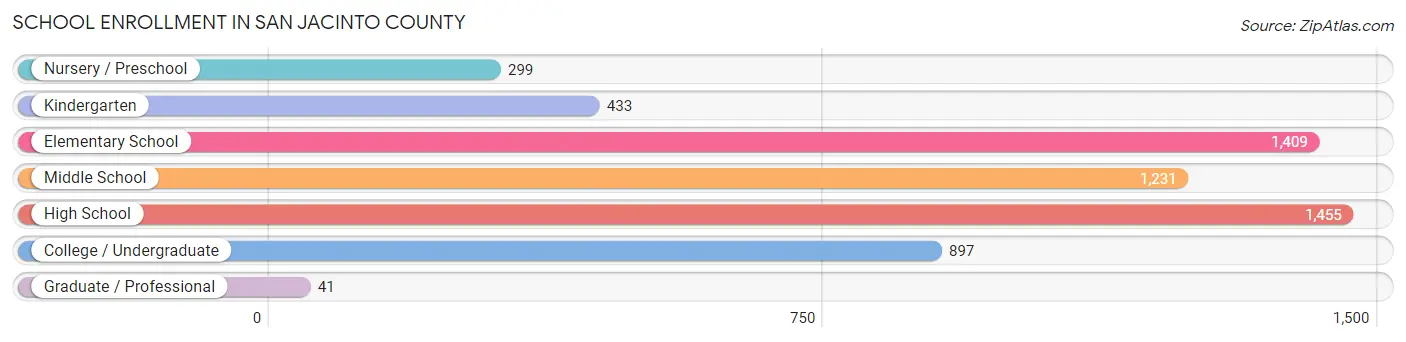
| School Level | # Students | % Students |
| Nursery / Preschool | 299 | 5.2% |
| Kindergarten | 433 | 7.5% |
| Elementary School | 1,409 | 24.4% |
| Middle School | 1,231 | 21.3% |
| High School | 1,455 | 25.2% |
| College / Undergraduate | 897 | 15.6% |
| Graduate / Professional | 41 | 0.7% |
| Total | 5,765 | 100.0% |
School Enrollment by Age by Funding Source in San Jacinto County
Out of a total of 5,765 students who are enrolled in schools in San Jacinto County, 346 (6.0%) attend a private institution, while the remaining 5,419 (94.0%) are enrolled in public schools. The age group of 15 to 17 year olds has the highest likelihood of being enrolled in private schools, with 201 (19.3% in the age bracket) enrolled. Conversely, the age group of 3 to 4 year olds has the lowest likelihood of being enrolled in a private school, with 282 (100.0% in the age bracket) attending a public institution.
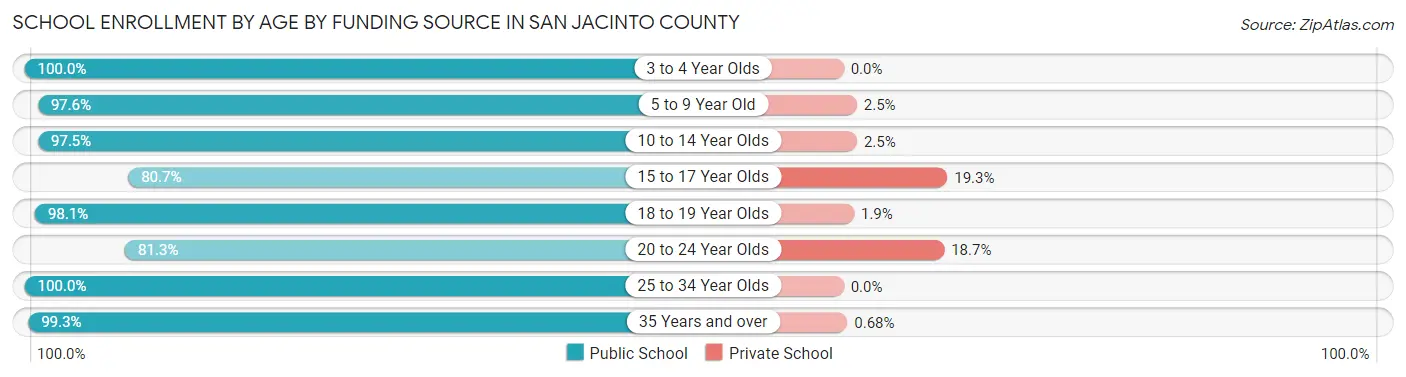
| Age Bracket | Public School | Private School |
| 3 to 4 Year Olds | 282 (100.0%) | 0 (0.0%) |
| 5 to 9 Year Old | 1,674 (97.6%) | 42 (2.5%) |
| 10 to 14 Year Olds | 1,453 (97.5%) | 37 (2.5%) |
| 15 to 17 Year Olds | 840 (80.7%) | 201 (19.3%) |
| 18 to 19 Year Olds | 458 (98.1%) | 9 (1.9%) |
| 20 to 24 Year Olds | 243 (81.3%) | 56 (18.7%) |
| 25 to 34 Year Olds | 175 (100.0%) | 0 (0.0%) |
| 35 Years and over | 293 (99.3%) | 2 (0.7%) |
| Total | 5,419 (94.0%) | 346 (6.0%) |
Educational Attainment by Field of Study in San Jacinto County
Education (578 | 17.3%), business (577 | 17.2%), bio, nature & agricultural (507 | 15.2%), engineering (402 | 12.0%), and science & technology (262 | 7.8%) are the most common fields of study among 3,345 individuals in San Jacinto County who have obtained a bachelor's degree or higher.
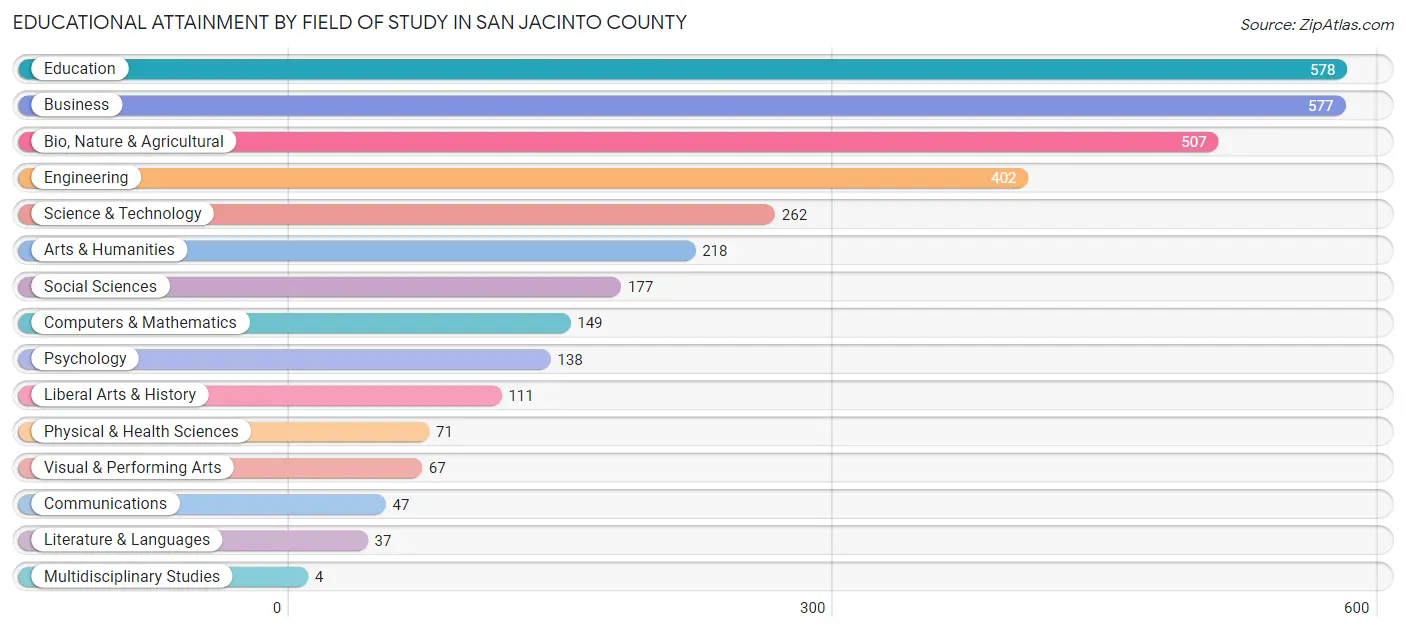
| Field of Study | # Graduates | % Graduates |
| Computers & Mathematics | 149 | 4.4% |
| Bio, Nature & Agricultural | 507 | 15.2% |
| Physical & Health Sciences | 71 | 2.1% |
| Psychology | 138 | 4.1% |
| Social Sciences | 177 | 5.3% |
| Engineering | 402 | 12.0% |
| Multidisciplinary Studies | 4 | 0.1% |
| Science & Technology | 262 | 7.8% |
| Business | 577 | 17.2% |
| Education | 578 | 17.3% |
| Literature & Languages | 37 | 1.1% |
| Liberal Arts & History | 111 | 3.3% |
| Visual & Performing Arts | 67 | 2.0% |
| Communications | 47 | 1.4% |
| Arts & Humanities | 218 | 6.5% |
| Total | 3,345 | 100.0% |
Transportation & Commute in San Jacinto County
Vehicle Availability by Sex in San Jacinto County
The most prevalent vehicle ownership categories in San Jacinto County are males with 2 vehicles (2,238, accounting for 37.2%) and females with 2 vehicles (1,635, making up 51.4%).
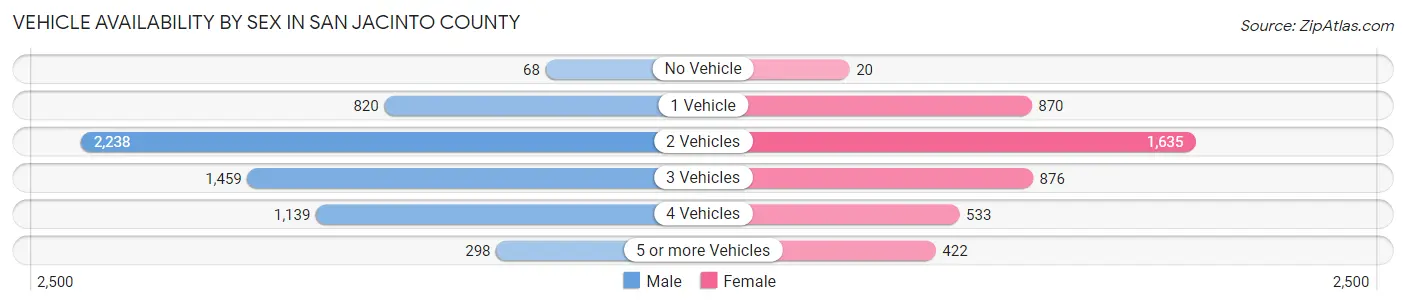
| Vehicles Available | Male | Female |
| No Vehicle | 68 (1.1%) | 20 (0.5%) |
| 1 Vehicle | 820 (13.6%) | 870 (20.0%) |
| 2 Vehicles | 2,238 (37.2%) | 1,635 (37.5%) |
| 3 Vehicles | 1,459 (24.2%) | 876 (20.1%) |
| 4 Vehicles | 1,139 (18.9%) | 533 (12.2%) |
| 5 or more Vehicles | 298 (5.0%) | 422 (9.7%) |
| Total | 6,022 (100.0%) | 4,356 (100.0%) |
Commute Time in San Jacinto County
The most frequently occuring commute durations in San Jacinto County are 60 to 89 minutes (1,794 commuters, 18.3%), 30 to 34 minutes (1,749 commuters, 17.8%), and 20 to 24 minutes (1,029 commuters, 10.5%).
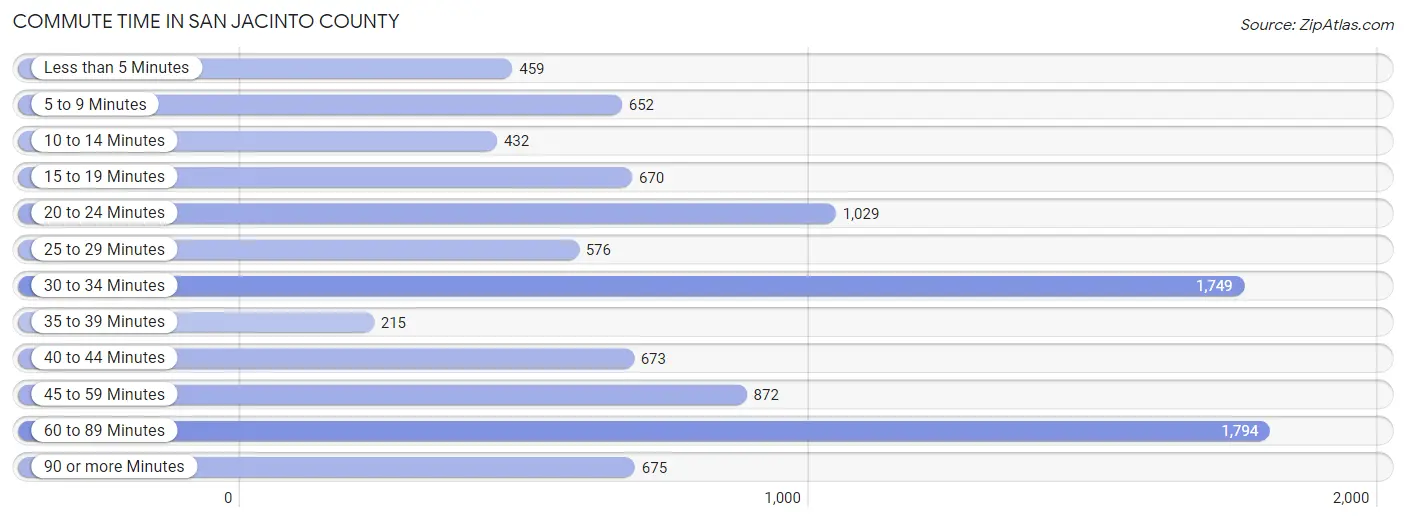
| Commute Time | # Commuters | % Commuters |
| Less than 5 Minutes | 459 | 4.7% |
| 5 to 9 Minutes | 652 | 6.7% |
| 10 to 14 Minutes | 432 | 4.4% |
| 15 to 19 Minutes | 670 | 6.8% |
| 20 to 24 Minutes | 1,029 | 10.5% |
| 25 to 29 Minutes | 576 | 5.9% |
| 30 to 34 Minutes | 1,749 | 17.8% |
| 35 to 39 Minutes | 215 | 2.2% |
| 40 to 44 Minutes | 673 | 6.9% |
| 45 to 59 Minutes | 872 | 8.9% |
| 60 to 89 Minutes | 1,794 | 18.3% |
| 90 or more Minutes | 675 | 6.9% |
Commute Time by Sex in San Jacinto County
The most common commute times in San Jacinto County are 60 to 89 minutes (1,287 commuters, 22.6%) for males and 20 to 24 minutes (736 commuters, 18.0%) for females.
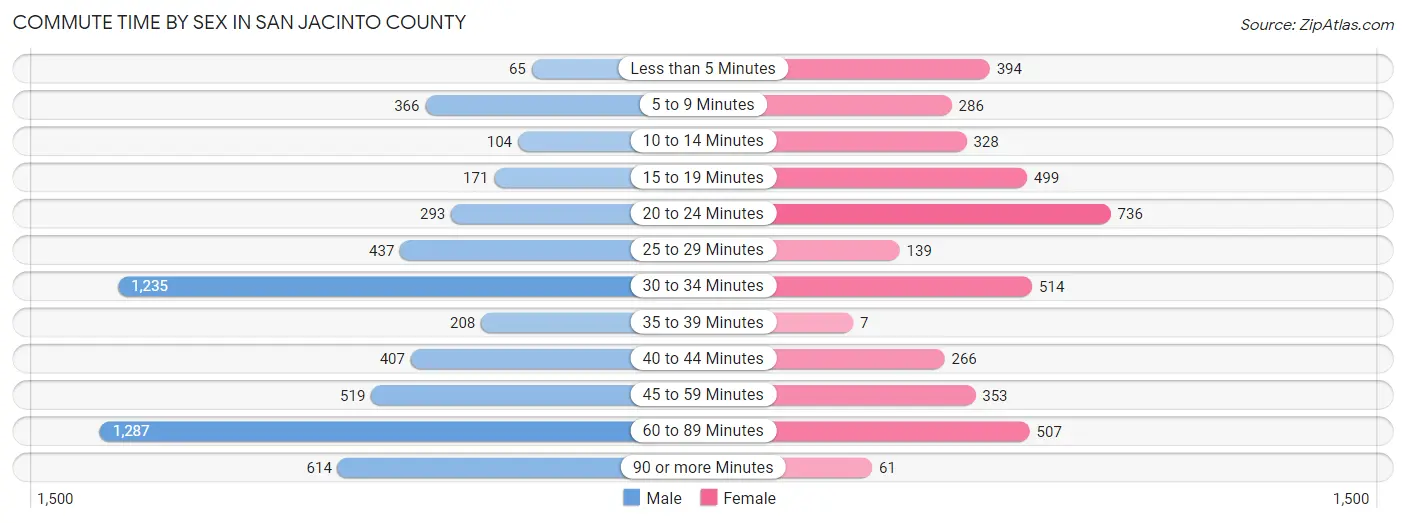
| Commute Time | Male | Female |
| Less than 5 Minutes | 65 (1.1%) | 394 (9.6%) |
| 5 to 9 Minutes | 366 (6.4%) | 286 (7.0%) |
| 10 to 14 Minutes | 104 (1.8%) | 328 (8.0%) |
| 15 to 19 Minutes | 171 (3.0%) | 499 (12.2%) |
| 20 to 24 Minutes | 293 (5.1%) | 736 (18.0%) |
| 25 to 29 Minutes | 437 (7.7%) | 139 (3.4%) |
| 30 to 34 Minutes | 1,235 (21.6%) | 514 (12.6%) |
| 35 to 39 Minutes | 208 (3.6%) | 7 (0.2%) |
| 40 to 44 Minutes | 407 (7.1%) | 266 (6.5%) |
| 45 to 59 Minutes | 519 (9.1%) | 353 (8.6%) |
| 60 to 89 Minutes | 1,287 (22.6%) | 507 (12.4%) |
| 90 or more Minutes | 614 (10.8%) | 61 (1.5%) |
Time of Departure to Work by Sex in San Jacinto County
The most frequent times of departure to work in San Jacinto County are 12:00 AM to 4:59 AM (1,133, 19.9%) for males and 7:00 AM to 7:29 AM (775, 19.0%) for females.
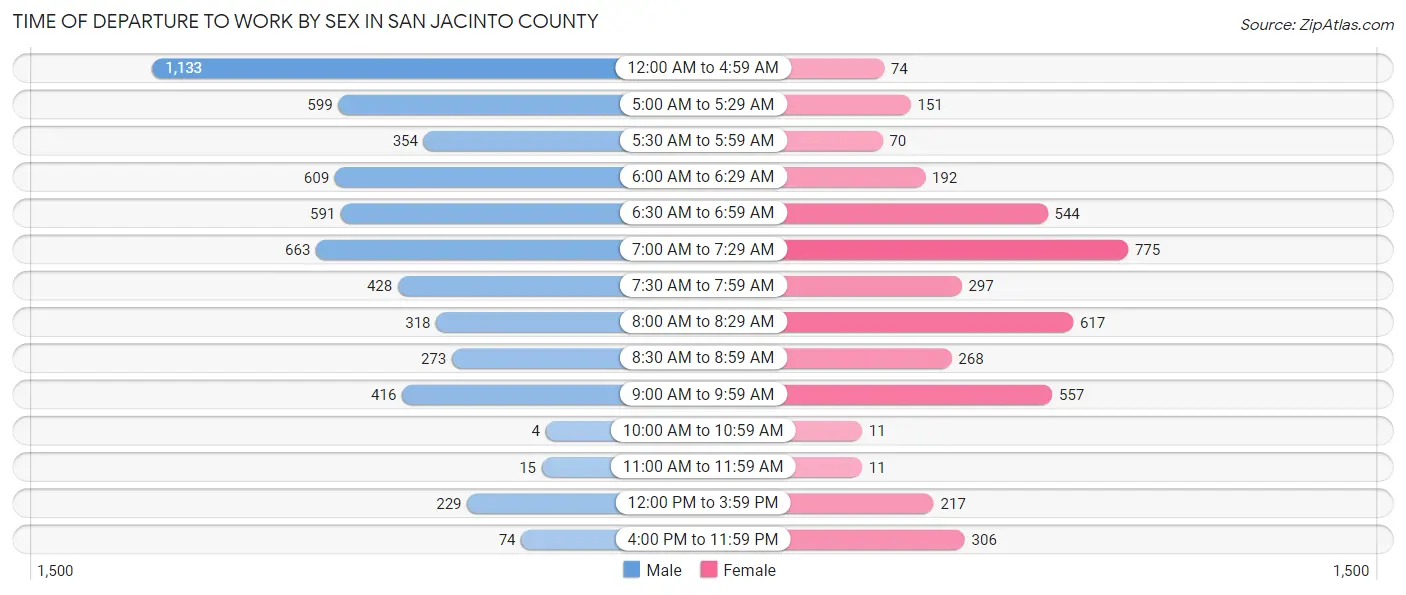
| Time of Departure | Male | Female |
| 12:00 AM to 4:59 AM | 1,133 (19.9%) | 74 (1.8%) |
| 5:00 AM to 5:29 AM | 599 (10.5%) | 151 (3.7%) |
| 5:30 AM to 5:59 AM | 354 (6.2%) | 70 (1.7%) |
| 6:00 AM to 6:29 AM | 609 (10.7%) | 192 (4.7%) |
| 6:30 AM to 6:59 AM | 591 (10.4%) | 544 (13.3%) |
| 7:00 AM to 7:29 AM | 663 (11.6%) | 775 (19.0%) |
| 7:30 AM to 7:59 AM | 428 (7.5%) | 297 (7.3%) |
| 8:00 AM to 8:29 AM | 318 (5.6%) | 617 (15.1%) |
| 8:30 AM to 8:59 AM | 273 (4.8%) | 268 (6.6%) |
| 9:00 AM to 9:59 AM | 416 (7.3%) | 557 (13.6%) |
| 10:00 AM to 10:59 AM | 4 (0.1%) | 11 (0.3%) |
| 11:00 AM to 11:59 AM | 15 (0.3%) | 11 (0.3%) |
| 12:00 PM to 3:59 PM | 229 (4.0%) | 217 (5.3%) |
| 4:00 PM to 11:59 PM | 74 (1.3%) | 306 (7.5%) |
| Total | 5,706 (100.0%) | 4,090 (100.0%) |
Housing Occupancy in San Jacinto County
Occupancy by Ownership in San Jacinto County
Of the total 10,064 dwellings in San Jacinto County, owner-occupied units account for 8,354 (83.0%), while renter-occupied units make up 1,710 (17.0%).
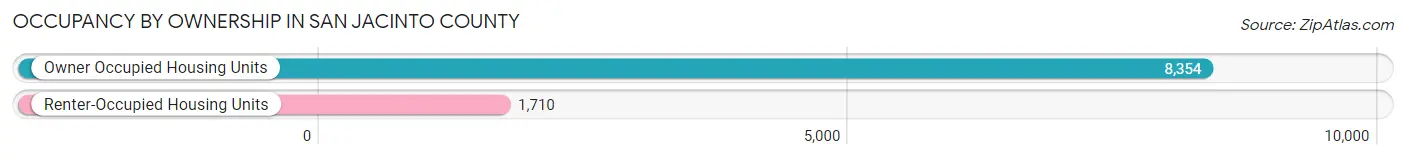
| Occupancy | # Housing Units | % Housing Units |
| Owner Occupied Housing Units | 8,354 | 83.0% |
| Renter-Occupied Housing Units | 1,710 | 17.0% |
| Total Occupied Housing Units | 10,064 | 100.0% |
Occupancy by Household Size in San Jacinto County
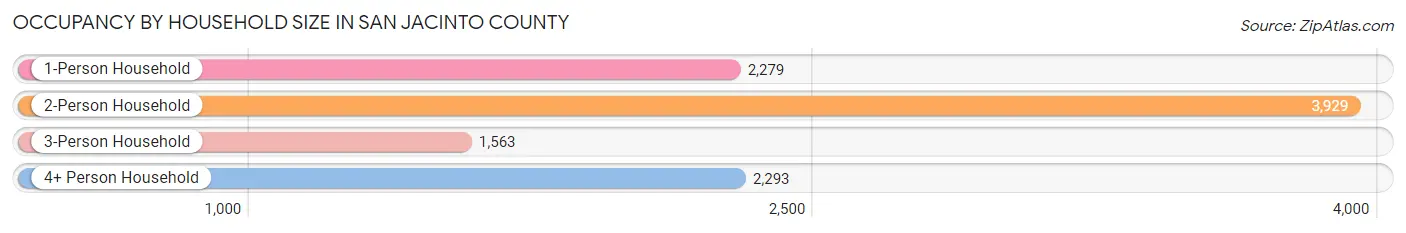
| Household Size | # Housing Units | % Housing Units |
| 1-Person Household | 2,279 | 22.7% |
| 2-Person Household | 3,929 | 39.0% |
| 3-Person Household | 1,563 | 15.5% |
| 4+ Person Household | 2,293 | 22.8% |
| Total Housing Units | 10,064 | 100.0% |
Occupancy by Ownership by Household Size in San Jacinto County
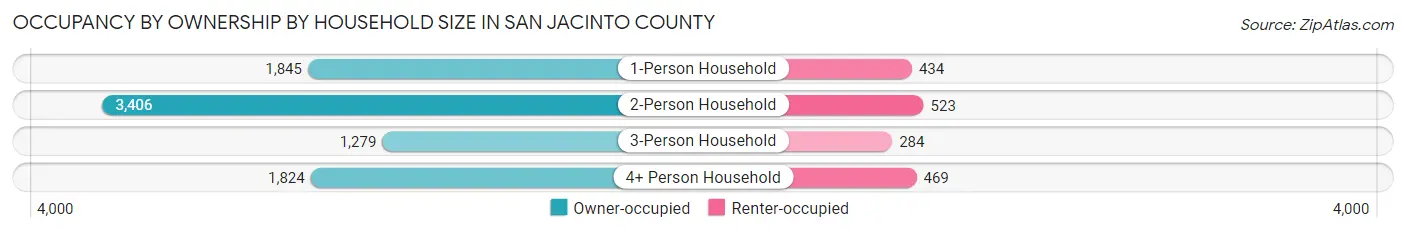
| Household Size | Owner-occupied | Renter-occupied |
| 1-Person Household | 1,845 (81.0%) | 434 (19.0%) |
| 2-Person Household | 3,406 (86.7%) | 523 (13.3%) |
| 3-Person Household | 1,279 (81.8%) | 284 (18.2%) |
| 4+ Person Household | 1,824 (79.5%) | 469 (20.4%) |
| Total Housing Units | 8,354 (83.0%) | 1,710 (17.0%) |
Occupancy by Educational Attainment in San Jacinto County
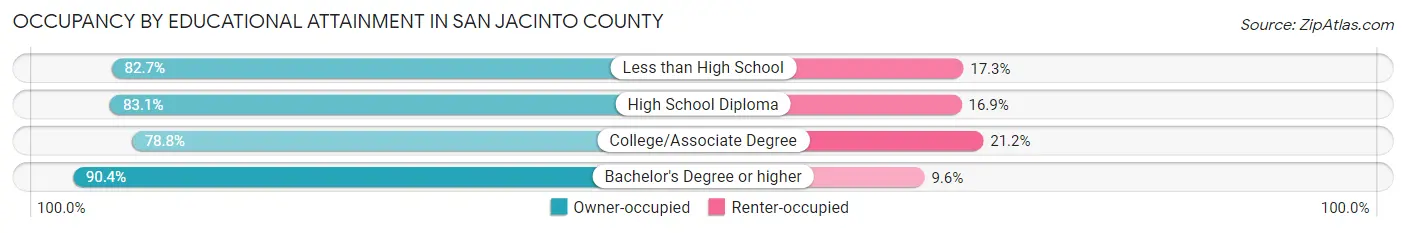
| Household Size | Owner-occupied | Renter-occupied |
| Less than High School | 1,073 (82.7%) | 224 (17.3%) |
| High School Diploma | 3,210 (83.1%) | 654 (16.9%) |
| College/Associate Degree | 2,447 (78.8%) | 660 (21.2%) |
| Bachelor's Degree or higher | 1,624 (90.4%) | 172 (9.6%) |
Occupancy by Age of Householder in San Jacinto County
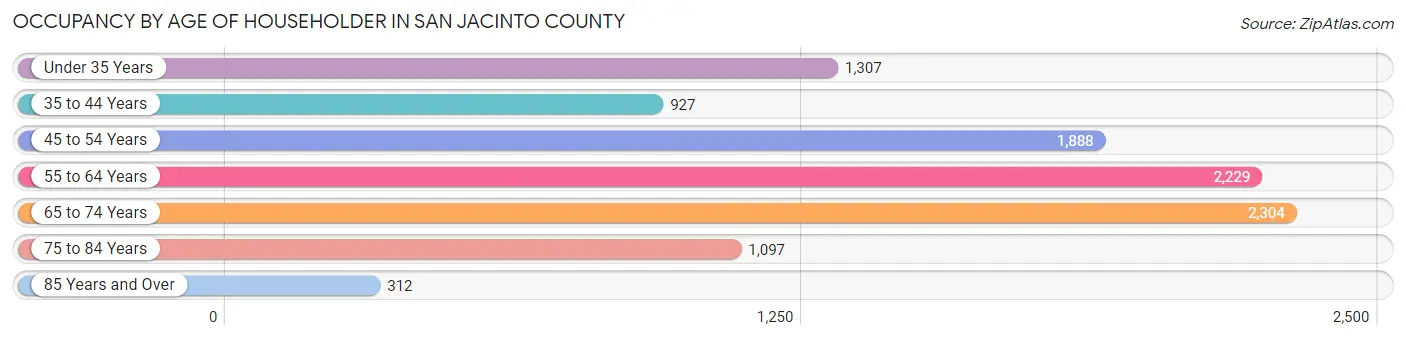
| Age Bracket | # Households | % Households |
| Under 35 Years | 1,307 | 13.0% |
| 35 to 44 Years | 927 | 9.2% |
| 45 to 54 Years | 1,888 | 18.8% |
| 55 to 64 Years | 2,229 | 22.2% |
| 65 to 74 Years | 2,304 | 22.9% |
| 75 to 84 Years | 1,097 | 10.9% |
| 85 Years and Over | 312 | 3.1% |
| Total | 10,064 | 100.0% |
Housing Finances in San Jacinto County
Median Income by Occupancy in San Jacinto County
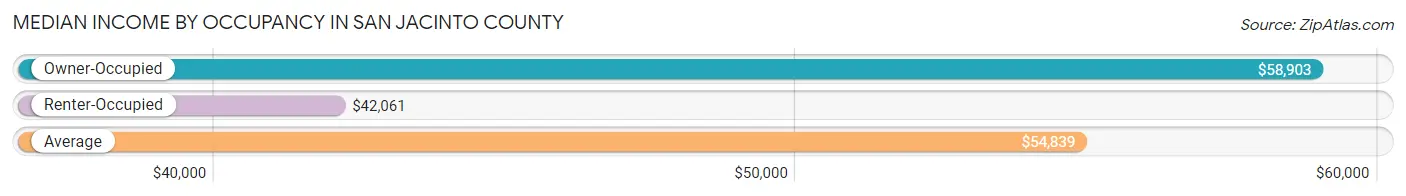
| Occupancy Type | # Households | Median Income |
| Owner-Occupied | 8,354 (83.0%) | $58,903 |
| Renter-Occupied | 1,710 (17.0%) | $42,061 |
| Average | 10,064 (100.0%) | $54,839 |
Occupancy by Householder Income Bracket in San Jacinto County
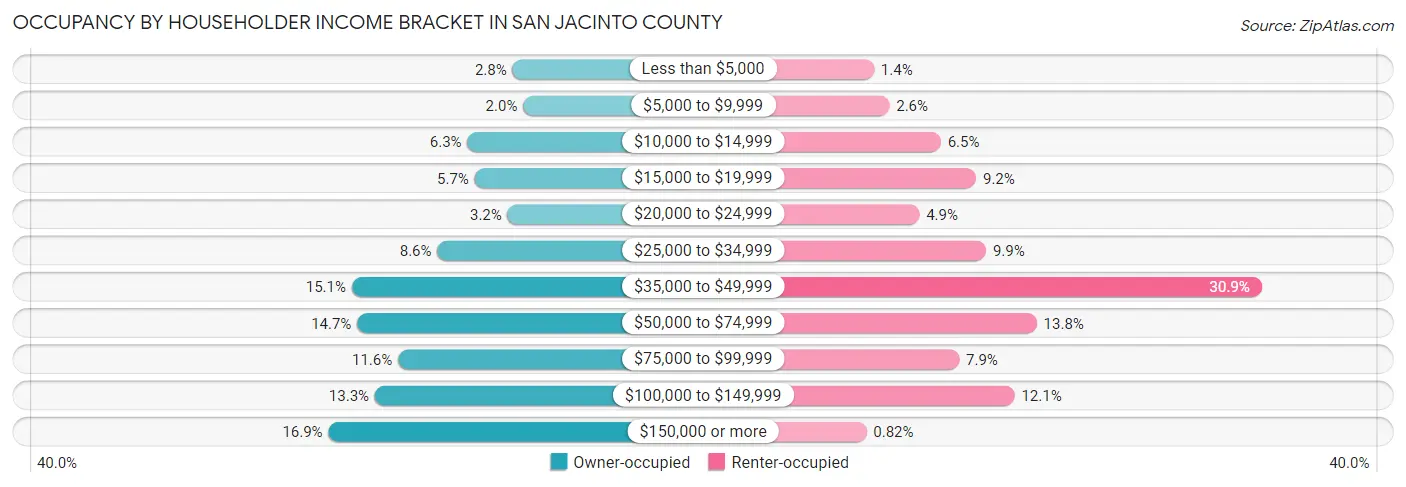
| Income Bracket | Owner-occupied | Renter-occupied |
| Less than $5,000 | 236 (2.8%) | 24 (1.4%) |
| $5,000 to $9,999 | 168 (2.0%) | 44 (2.6%) |
| $10,000 to $14,999 | 523 (6.3%) | 111 (6.5%) |
| $15,000 to $19,999 | 477 (5.7%) | 157 (9.2%) |
| $20,000 to $24,999 | 267 (3.2%) | 83 (4.9%) |
| $25,000 to $34,999 | 714 (8.6%) | 170 (9.9%) |
| $35,000 to $49,999 | 1,259 (15.1%) | 529 (30.9%) |
| $50,000 to $74,999 | 1,225 (14.7%) | 236 (13.8%) |
| $75,000 to $99,999 | 965 (11.6%) | 135 (7.9%) |
| $100,000 to $149,999 | 1,112 (13.3%) | 207 (12.1%) |
| $150,000 or more | 1,408 (16.9%) | 14 (0.8%) |
| Total | 8,354 (100.0%) | 1,710 (100.0%) |
Monthly Housing Cost Tiers in San Jacinto County
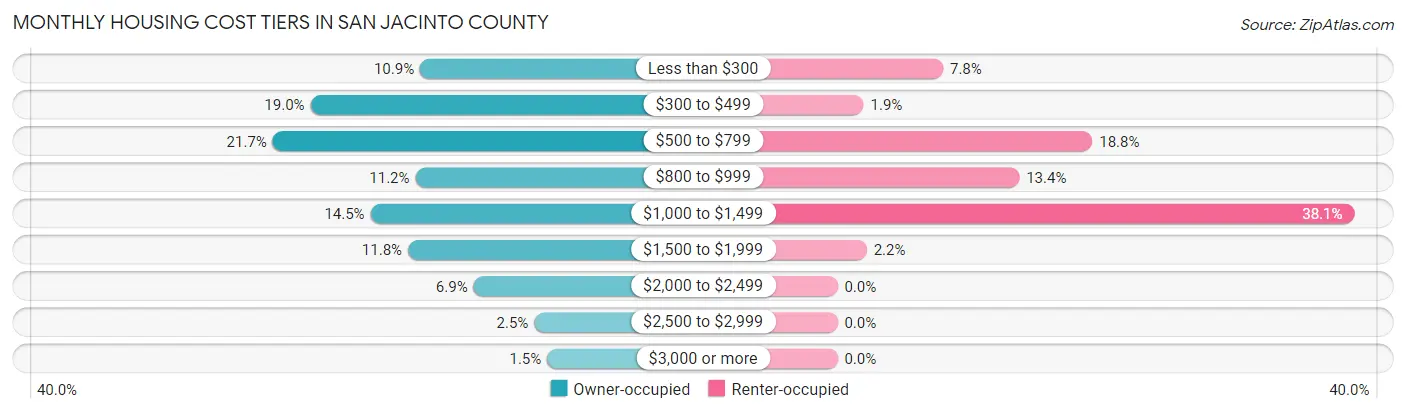
| Monthly Cost | Owner-occupied | Renter-occupied |
| Less than $300 | 909 (10.9%) | 133 (7.8%) |
| $300 to $499 | 1,583 (19.0%) | 33 (1.9%) |
| $500 to $799 | 1,815 (21.7%) | 321 (18.8%) |
| $800 to $999 | 937 (11.2%) | 229 (13.4%) |
| $1,000 to $1,499 | 1,214 (14.5%) | 651 (38.1%) |
| $1,500 to $1,999 | 983 (11.8%) | 37 (2.2%) |
| $2,000 to $2,499 | 580 (6.9%) | 0 (0.0%) |
| $2,500 to $2,999 | 206 (2.5%) | 0 (0.0%) |
| $3,000 or more | 127 (1.5%) | 0 (0.0%) |
| Total | 8,354 (100.0%) | 1,710 (100.0%) |
Physical Housing Characteristics in San Jacinto County
Housing Structures in San Jacinto County
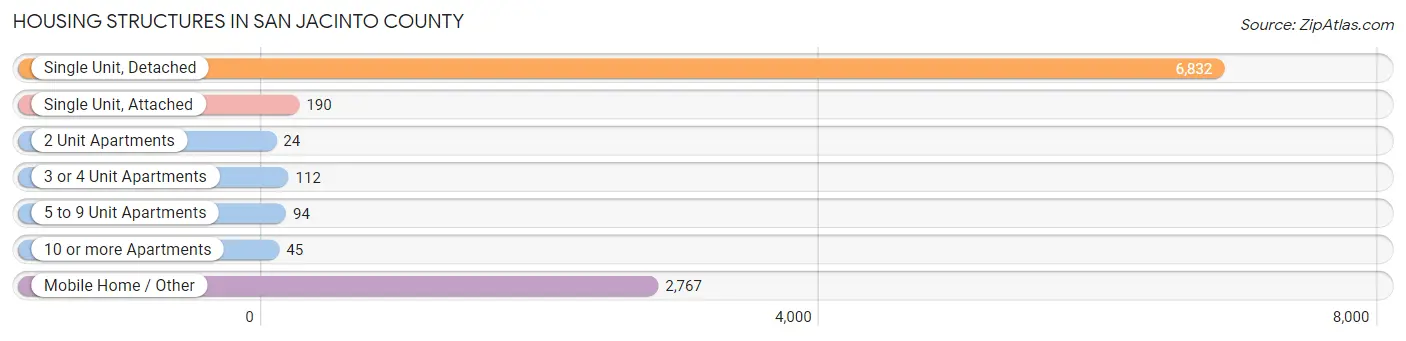
| Structure Type | # Housing Units | % Housing Units |
| Single Unit, Detached | 6,832 | 67.9% |
| Single Unit, Attached | 190 | 1.9% |
| 2 Unit Apartments | 24 | 0.2% |
| 3 or 4 Unit Apartments | 112 | 1.1% |
| 5 to 9 Unit Apartments | 94 | 0.9% |
| 10 or more Apartments | 45 | 0.4% |
| Mobile Home / Other | 2,767 | 27.5% |
| Total | 10,064 | 100.0% |
Housing Structures by Occupancy in San Jacinto County
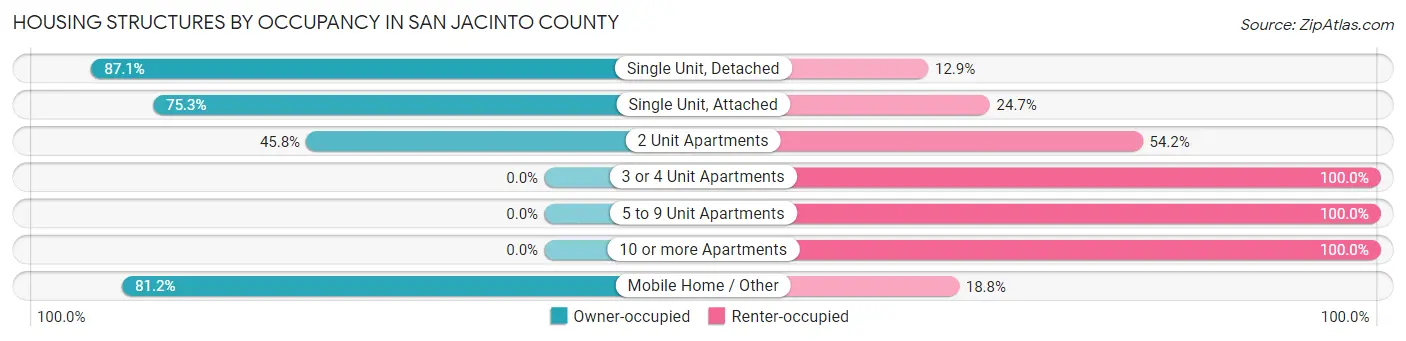
| Structure Type | Owner-occupied | Renter-occupied |
| Single Unit, Detached | 5,953 (87.1%) | 879 (12.9%) |
| Single Unit, Attached | 143 (75.3%) | 47 (24.7%) |
| 2 Unit Apartments | 11 (45.8%) | 13 (54.2%) |
| 3 or 4 Unit Apartments | 0 (0.0%) | 112 (100.0%) |
| 5 to 9 Unit Apartments | 0 (0.0%) | 94 (100.0%) |
| 10 or more Apartments | 0 (0.0%) | 45 (100.0%) |
| Mobile Home / Other | 2,247 (81.2%) | 520 (18.8%) |
| Total | 8,354 (83.0%) | 1,710 (17.0%) |
Housing Structures by Number of Rooms in San Jacinto County
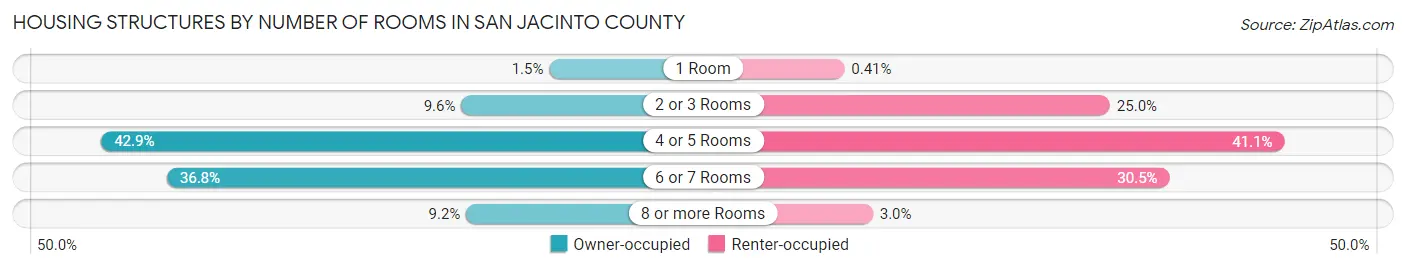
| Number of Rooms | Owner-occupied | Renter-occupied |
| 1 Room | 123 (1.5%) | 7 (0.4%) |
| 2 or 3 Rooms | 803 (9.6%) | 427 (25.0%) |
| 4 or 5 Rooms | 3,585 (42.9%) | 703 (41.1%) |
| 6 or 7 Rooms | 3,078 (36.8%) | 521 (30.5%) |
| 8 or more Rooms | 765 (9.2%) | 52 (3.0%) |
| Total | 8,354 (100.0%) | 1,710 (100.0%) |
Housing Structure by Heating Type in San Jacinto County
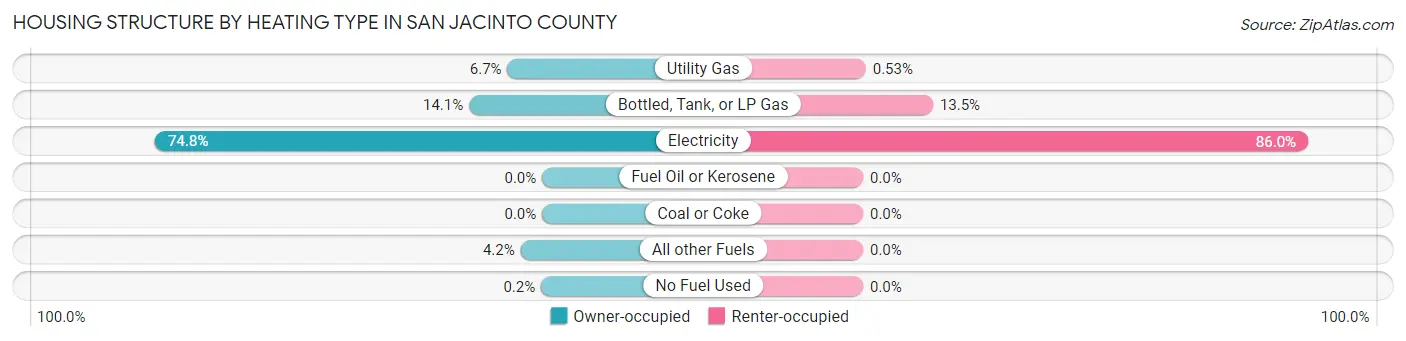
| Heating Type | Owner-occupied | Renter-occupied |
| Utility Gas | 560 (6.7%) | 9 (0.5%) |
| Bottled, Tank, or LP Gas | 1,180 (14.1%) | 231 (13.5%) |
| Electricity | 6,249 (74.8%) | 1,470 (86.0%) |
| Fuel Oil or Kerosene | 0 (0.0%) | 0 (0.0%) |
| Coal or Coke | 0 (0.0%) | 0 (0.0%) |
| All other Fuels | 348 (4.2%) | 0 (0.0%) |
| No Fuel Used | 17 (0.2%) | 0 (0.0%) |
| Total | 8,354 (100.0%) | 1,710 (100.0%) |
Household Vehicle Usage in San Jacinto County
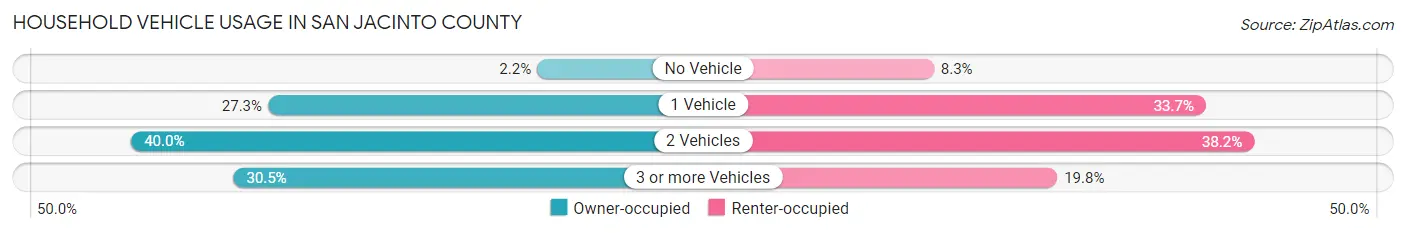
| Vehicles per Household | Owner-occupied | Renter-occupied |
| No Vehicle | 181 (2.2%) | 142 (8.3%) |
| 1 Vehicle | 2,280 (27.3%) | 576 (33.7%) |
| 2 Vehicles | 3,345 (40.0%) | 653 (38.2%) |
| 3 or more Vehicles | 2,548 (30.5%) | 339 (19.8%) |
| Total | 8,354 (100.0%) | 1,710 (100.0%) |
Real Estate & Mortgages in San Jacinto County
Real Estate and Mortgage Overview in San Jacinto County
| Characteristic | Without Mortgage | With Mortgage |
| Housing Units | 4,870 | 3,484 |
| Median Property Value | $143,400 | $197,500 |
| Median Household Income | $46,308 | $1,002 |
| Monthly Housing Costs | $498 | $121 |
| Real Estate Taxes | $1,371 | $150 |
Property Value by Mortgage Status in San Jacinto County
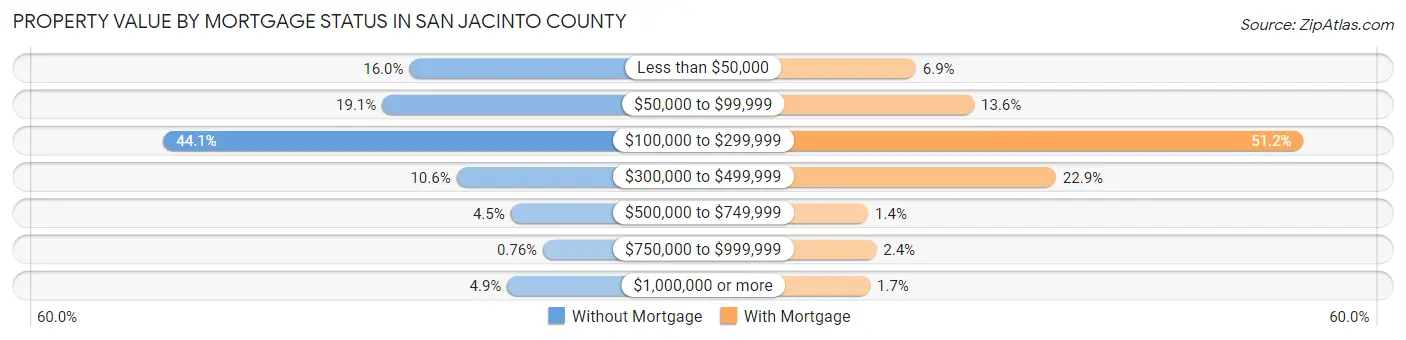
| Property Value | Without Mortgage | With Mortgage |
| Less than $50,000 | 781 (16.0%) | 240 (6.9%) |
| $50,000 to $99,999 | 932 (19.1%) | 472 (13.6%) |
| $100,000 to $299,999 | 2,149 (44.1%) | 1,783 (51.2%) |
| $300,000 to $499,999 | 518 (10.6%) | 798 (22.9%) |
| $500,000 to $749,999 | 217 (4.5%) | 50 (1.4%) |
| $750,000 to $999,999 | 37 (0.8%) | 83 (2.4%) |
| $1,000,000 or more | 236 (4.9%) | 58 (1.7%) |
| Total | 4,870 (100.0%) | 3,484 (100.0%) |
Household Income by Mortgage Status in San Jacinto County
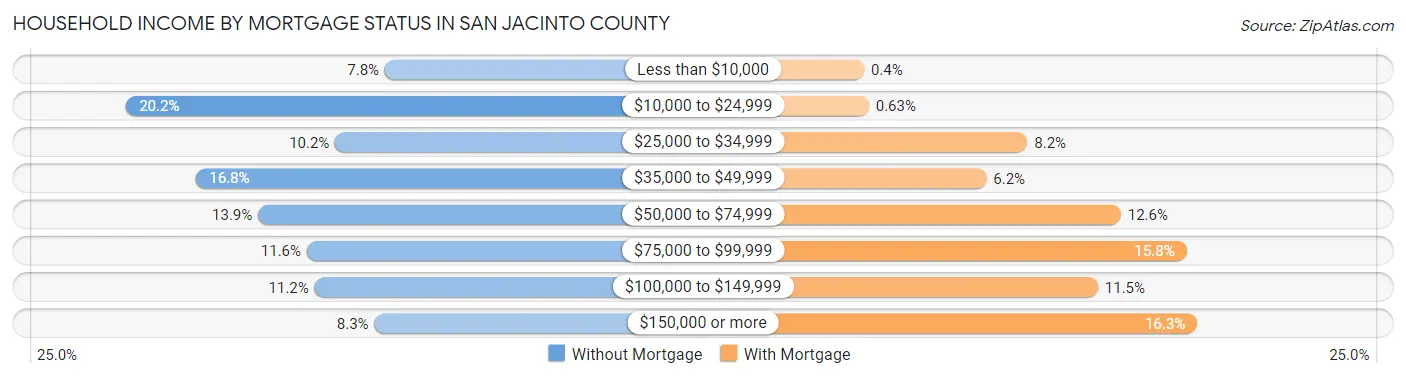
| Household Income | Without Mortgage | With Mortgage |
| Less than $10,000 | 382 (7.8%) | 14 (0.4%) |
| $10,000 to $24,999 | 982 (20.2%) | 22 (0.6%) |
| $25,000 to $34,999 | 497 (10.2%) | 285 (8.2%) |
| $35,000 to $49,999 | 819 (16.8%) | 217 (6.2%) |
| $50,000 to $74,999 | 676 (13.9%) | 440 (12.6%) |
| $75,000 to $99,999 | 563 (11.6%) | 549 (15.8%) |
| $100,000 to $149,999 | 545 (11.2%) | 402 (11.5%) |
| $150,000 or more | 406 (8.3%) | 567 (16.3%) |
| Total | 4,870 (100.0%) | 3,484 (100.0%) |
Property Value to Household Income Ratio in San Jacinto County
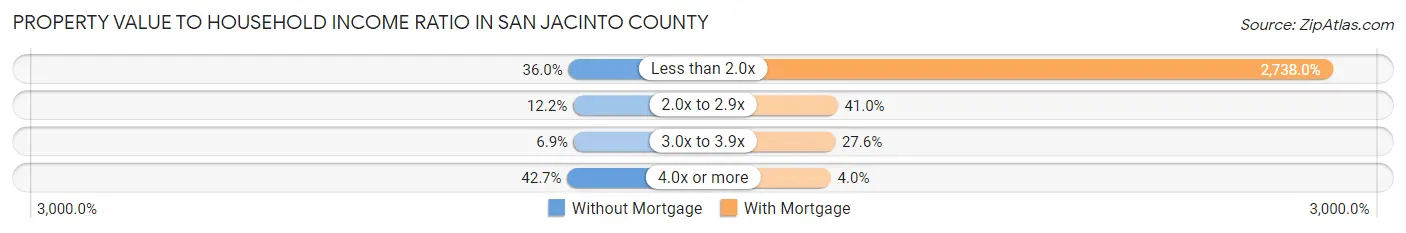
| Value-to-Income Ratio | Without Mortgage | With Mortgage |
| Less than 2.0x | 1,754 (36.0%) | 95,391 (2,738.0%) |
| 2.0x to 2.9x | 596 (12.2%) | 1,429 (41.0%) |
| 3.0x to 3.9x | 338 (6.9%) | 960 (27.6%) |
| 4.0x or more | 2,081 (42.7%) | 139 (4.0%) |
| Total | 4,870 (100.0%) | 3,484 (100.0%) |
Real Estate Taxes by Mortgage Status in San Jacinto County
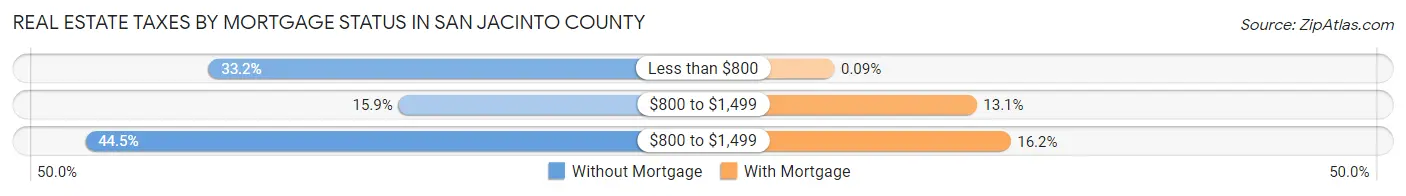
| Property Taxes | Without Mortgage | With Mortgage |
| Less than $800 | 1,618 (33.2%) | 3 (0.1%) |
| $800 to $1,499 | 772 (15.9%) | 456 (13.1%) |
| $800 to $1,499 | 2,165 (44.5%) | 564 (16.2%) |
| Total | 4,870 (100.0%) | 3,484 (100.0%) |
Health & Disability in San Jacinto County
Health Insurance Coverage by Age in San Jacinto County
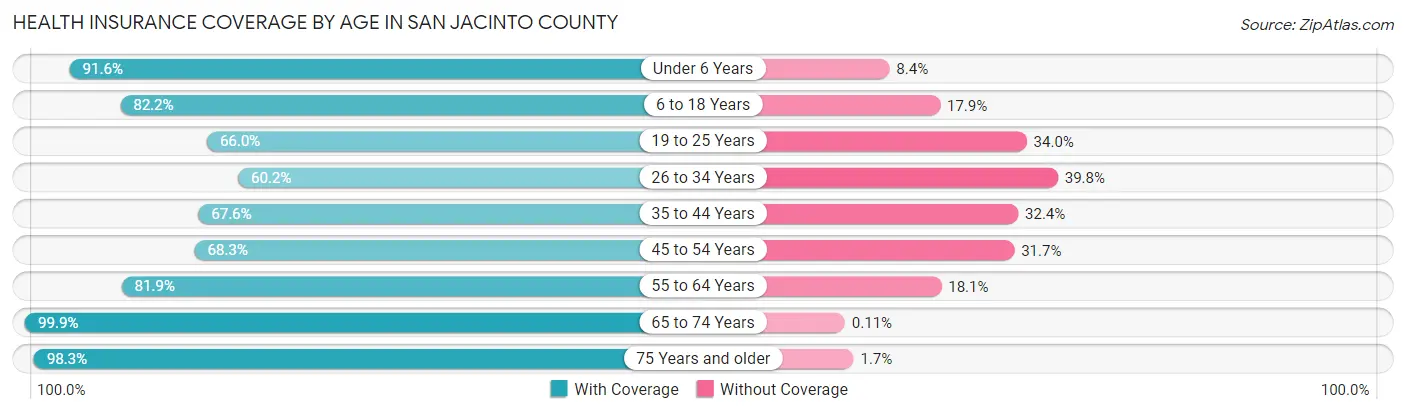
| Age Bracket | With Coverage | Without Coverage |
| Under 6 Years | 1,502 (91.6%) | 138 (8.4%) |
| 6 to 18 Years | 3,775 (82.2%) | 820 (17.8%) |
| 19 to 25 Years | 1,465 (66.0%) | 755 (34.0%) |
| 26 to 34 Years | 1,456 (60.2%) | 963 (39.8%) |
| 35 to 44 Years | 1,812 (67.6%) | 869 (32.4%) |
| 45 to 54 Years | 2,324 (68.3%) | 1,078 (31.7%) |
| 55 to 64 Years | 3,696 (81.9%) | 816 (18.1%) |
| 65 to 74 Years | 3,683 (99.9%) | 4 (0.1%) |
| 75 Years and older | 2,282 (98.3%) | 40 (1.7%) |
| Total | 21,995 (80.0%) | 5,483 (20.0%) |
Health Insurance Coverage by Citizenship Status in San Jacinto County
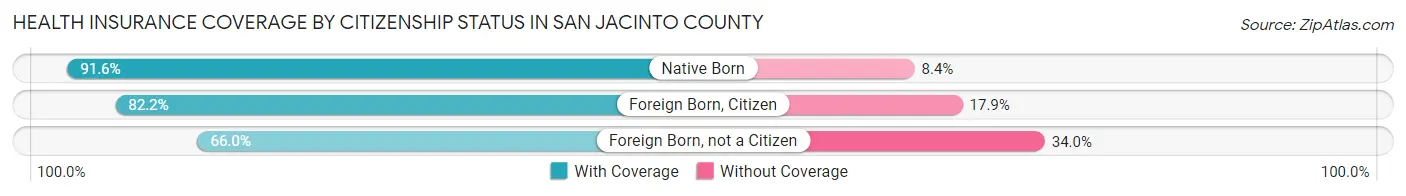
| Citizenship Status | With Coverage | Without Coverage |
| Native Born | 1,502 (91.6%) | 138 (8.4%) |
| Foreign Born, Citizen | 3,775 (82.2%) | 820 (17.8%) |
| Foreign Born, not a Citizen | 1,465 (66.0%) | 755 (34.0%) |
Health Insurance Coverage by Household Income in San Jacinto County
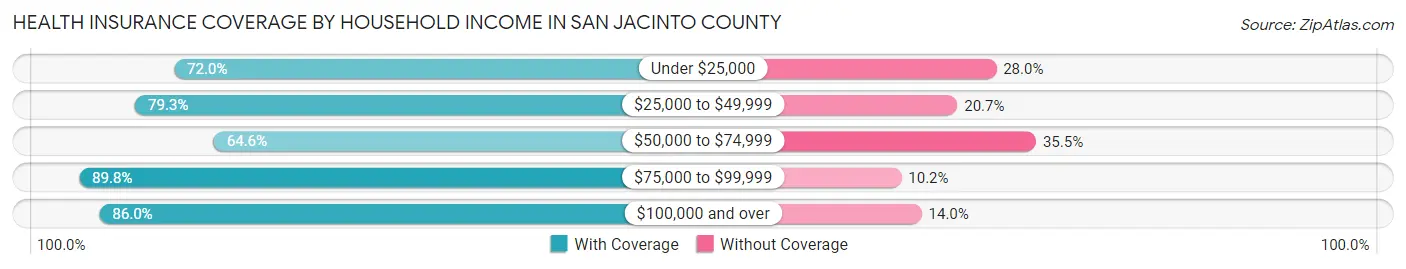
| Household Income | With Coverage | Without Coverage |
| Under $25,000 | 2,733 (72.0%) | 1,063 (28.0%) |
| $25,000 to $49,999 | 5,070 (79.3%) | 1,324 (20.7%) |
| $50,000 to $74,999 | 2,411 (64.5%) | 1,324 (35.4%) |
| $75,000 to $99,999 | 3,030 (89.8%) | 345 (10.2%) |
| $100,000 and over | 8,751 (86.0%) | 1,427 (14.0%) |
Public vs Private Health Insurance Coverage by Age in San Jacinto County
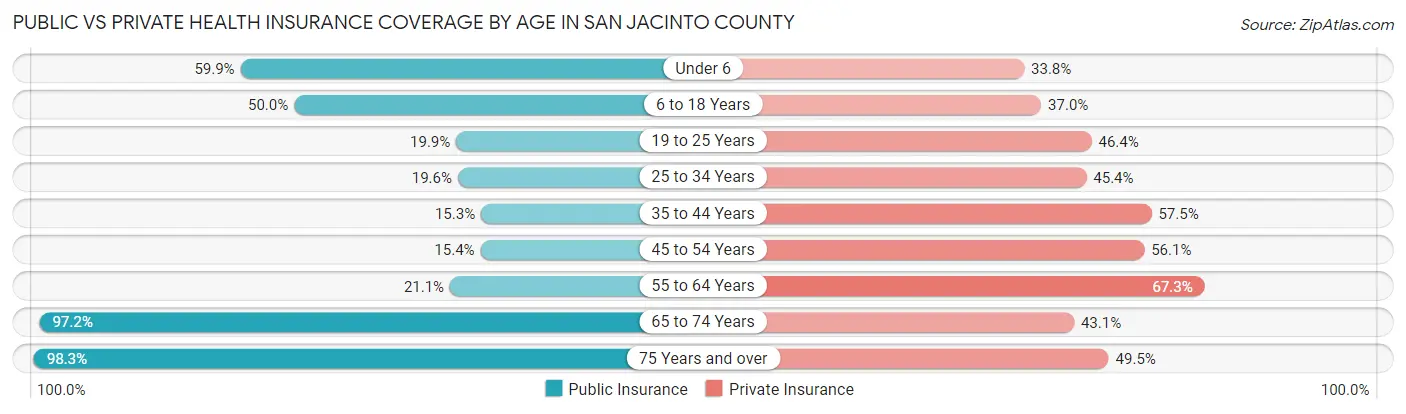
| Age Bracket | Public Insurance | Private Insurance |
| Under 6 | 983 (59.9%) | 555 (33.8%) |
| 6 to 18 Years | 2,297 (50.0%) | 1,700 (37.0%) |
| 19 to 25 Years | 442 (19.9%) | 1,029 (46.4%) |
| 25 to 34 Years | 474 (19.6%) | 1,098 (45.4%) |
| 35 to 44 Years | 410 (15.3%) | 1,541 (57.5%) |
| 45 to 54 Years | 524 (15.4%) | 1,910 (56.1%) |
| 55 to 64 Years | 950 (21.0%) | 3,038 (67.3%) |
| 65 to 74 Years | 3,585 (97.2%) | 1,589 (43.1%) |
| 75 Years and over | 2,282 (98.3%) | 1,150 (49.5%) |
| Total | 11,947 (43.5%) | 13,610 (49.5%) |
Disability Status by Sex by Age in San Jacinto County
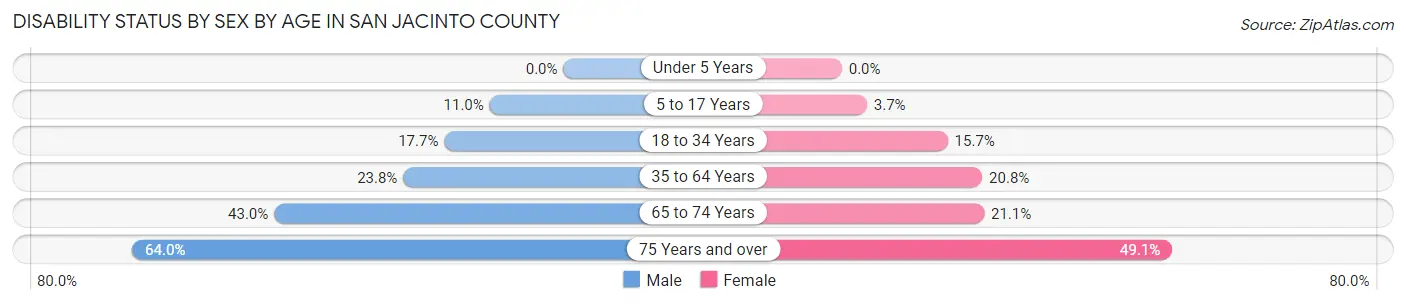
| Age Bracket | Male | Female |
| Under 5 Years | 0 (0.0%) | 0 (0.0%) |
| 5 to 17 Years | 246 (11.0%) | 85 (3.7%) |
| 18 to 34 Years | 465 (17.7%) | 373 (15.7%) |
| 35 to 64 Years | 1,230 (23.8%) | 1,130 (20.8%) |
| 65 to 74 Years | 768 (42.9%) | 401 (21.1%) |
| 75 Years and over | 710 (64.0%) | 595 (49.0%) |
Disability Class by Sex by Age in San Jacinto County
Disability Class: Hearing Difficulty
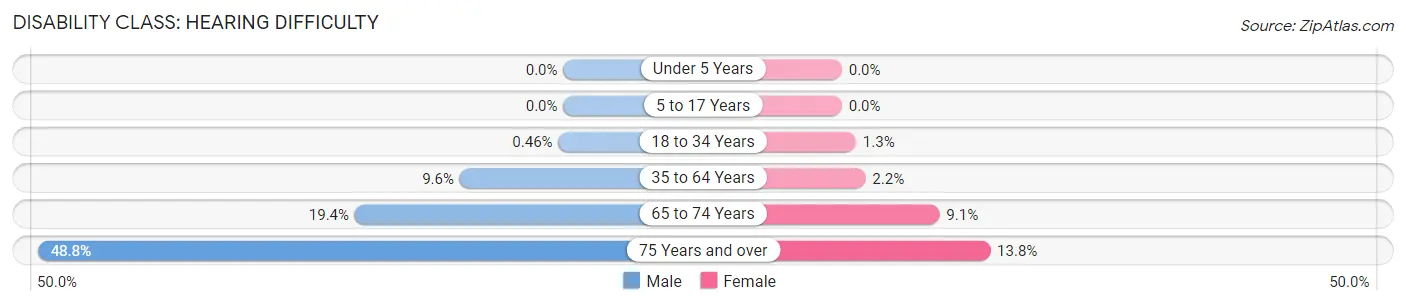
| Age Bracket | Male | Female |
| Under 5 Years | 0 (0.0%) | 0 (0.0%) |
| 5 to 17 Years | 0 (0.0%) | 0 (0.0%) |
| 18 to 34 Years | 12 (0.5%) | 31 (1.3%) |
| 35 to 64 Years | 497 (9.6%) | 119 (2.2%) |
| 65 to 74 Years | 346 (19.4%) | 172 (9.1%) |
| 75 Years and over | 541 (48.8%) | 167 (13.8%) |
Disability Class: Vision Difficulty
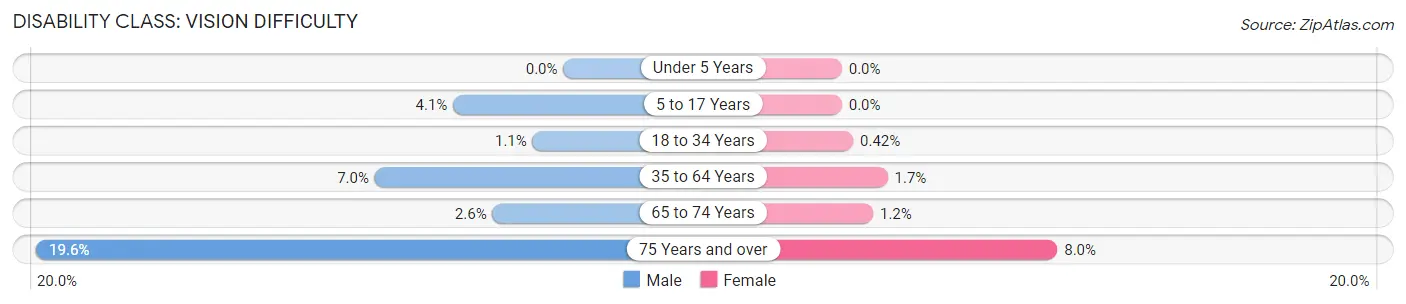
| Age Bracket | Male | Female |
| Under 5 Years | 0 (0.0%) | 0 (0.0%) |
| 5 to 17 Years | 92 (4.1%) | 0 (0.0%) |
| 18 to 34 Years | 30 (1.1%) | 10 (0.4%) |
| 35 to 64 Years | 362 (7.0%) | 92 (1.7%) |
| 65 to 74 Years | 47 (2.6%) | 22 (1.2%) |
| 75 Years and over | 217 (19.6%) | 97 (8.0%) |
Disability Class: Cognitive Difficulty
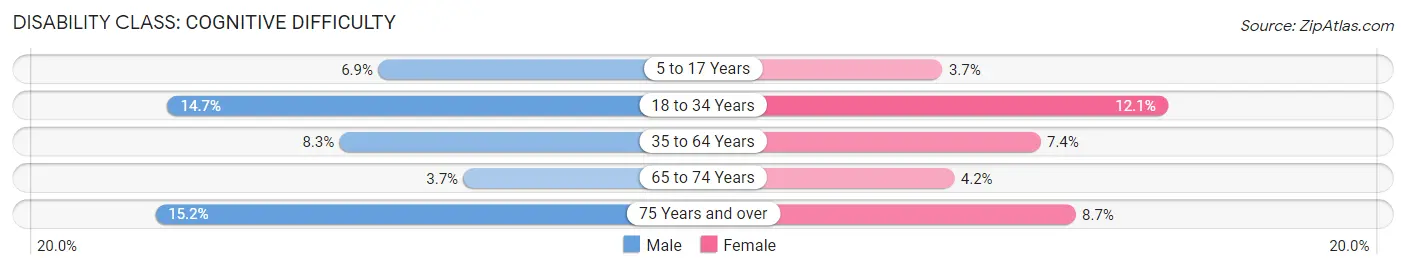
| Age Bracket | Male | Female |
| 5 to 17 Years | 154 (6.9%) | 85 (3.7%) |
| 18 to 34 Years | 386 (14.7%) | 287 (12.1%) |
| 35 to 64 Years | 429 (8.3%) | 399 (7.4%) |
| 65 to 74 Years | 66 (3.7%) | 79 (4.2%) |
| 75 Years and over | 168 (15.1%) | 105 (8.7%) |
Disability Class: Ambulatory Difficulty
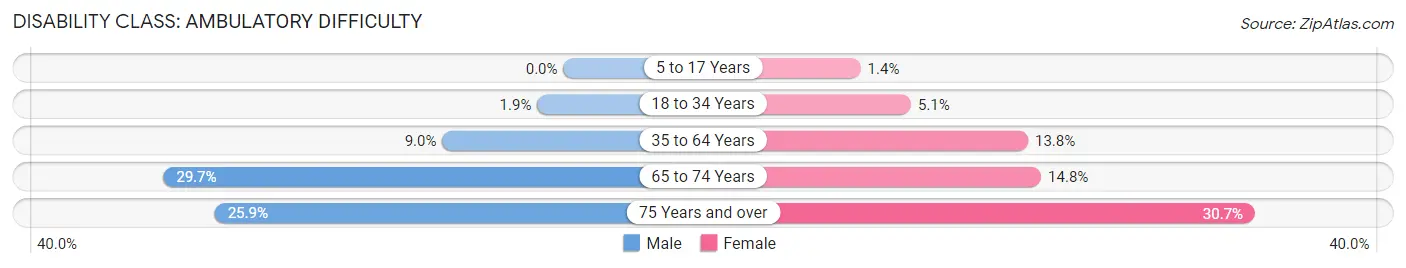
| Age Bracket | Male | Female |
| 5 to 17 Years | 0 (0.0%) | 32 (1.4%) |
| 18 to 34 Years | 51 (1.9%) | 122 (5.1%) |
| 35 to 64 Years | 465 (9.0%) | 750 (13.8%) |
| 65 to 74 Years | 531 (29.7%) | 281 (14.8%) |
| 75 Years and over | 287 (25.9%) | 372 (30.7%) |
Disability Class: Self-Care Difficulty
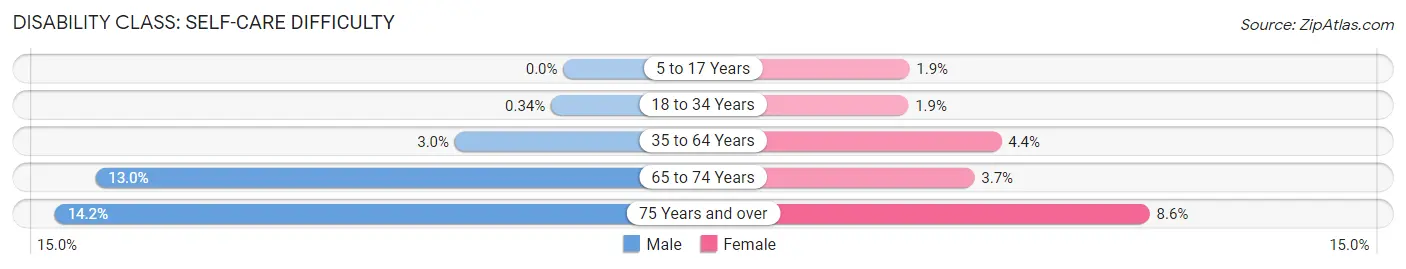
| Age Bracket | Male | Female |
| 5 to 17 Years | 0 (0.0%) | 43 (1.9%) |
| 18 to 34 Years | 9 (0.3%) | 44 (1.8%) |
| 35 to 64 Years | 156 (3.0%) | 241 (4.4%) |
| 65 to 74 Years | 233 (13.0%) | 70 (3.7%) |
| 75 Years and over | 157 (14.2%) | 104 (8.6%) |
Technology Access in San Jacinto County
Computing Device Access in San Jacinto County
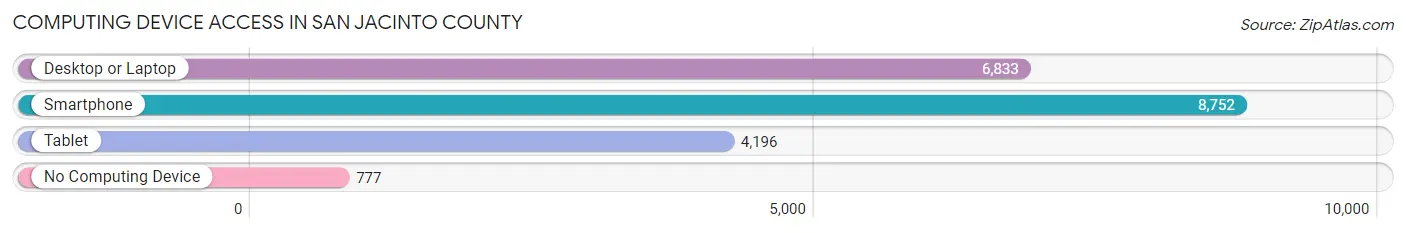
| Device Type | # Households | % Households |
| Desktop or Laptop | 6,833 | 67.9% |
| Smartphone | 8,752 | 87.0% |
| Tablet | 4,196 | 41.7% |
| No Computing Device | 777 | 7.7% |
| Total | 10,064 | 100.0% |
Internet Access in San Jacinto County
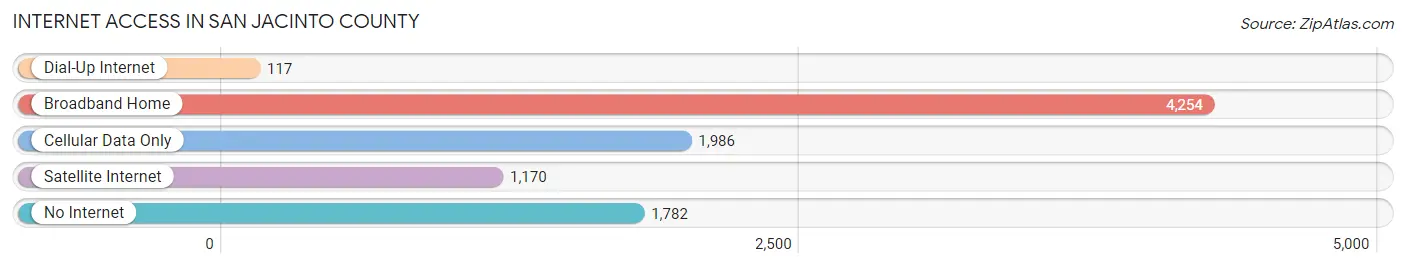
| Internet Type | # Households | % Households |
| Dial-Up Internet | 117 | 1.2% |
| Broadband Home | 4,254 | 42.3% |
| Cellular Data Only | 1,986 | 19.7% |
| Satellite Internet | 1,170 | 11.6% |
| No Internet | 1,782 | 17.7% |
| Total | 10,064 | 100.0% |
San Jacinto County Summary
History
San Jacinto County is located in the East Texas region of the state of Texas. It was established in 1870 and is named after the Battle of San Jacinto, which was fought in 1836 and resulted in the independence of Texas from Mexico. The county seat is Coldspring.
The first inhabitants of the area were Native American tribes, including the Caddo, Cherokee, and Atakapan. The first European settlers arrived in the area in the early 1800s, and the county was officially established in 1870.
The county was largely rural until the early 1900s, when the lumber industry began to boom. The lumber industry was the main source of employment in the county until the 1950s, when the oil and gas industry began to take over.
Geography
San Jacinto County is located in the East Texas region of the state of Texas. It is bordered by Polk County to the north, Trinity County to the east, Walker County to the south, and Montgomery County to the west. The county covers an area of 845 square miles and has a population of 28,845 as of the 2020 census.
The terrain of the county is mostly flat, with some rolling hills in the northern and western parts of the county. The county is drained by the Trinity River and its tributaries, including the San Jacinto River, which flows through the county from north to south.
Economy
San Jacinto County has a diverse economy, with the largest industries being oil and gas, timber, and agriculture.
The oil and gas industry is the largest employer in the county, with over 4,000 people employed in the industry. The county is home to several oil and gas companies, including Chevron, ExxonMobil, and Shell.
The timber industry is also an important part of the county’s economy, with over 1,000 people employed in the industry. The county is home to several sawmills and lumber companies, including Weyerhaeuser and Georgia-Pacific.
Agriculture is also an important part of the county’s economy, with over 1,500 people employed in the industry. The county is home to several farms, including cattle, poultry, and hog farms.
Demographics
As of the 2020 census, San Jacinto County had a population of 28,845. The racial makeup of the county was 79.2% White, 15.2% Hispanic or Latino, 2.7% African American, 0.7% Native American, 0.3% Asian, and 2.1% other.
The median household income in the county was $45,945, and the median family income was $51,945. The per capita income in the county was $20,945.
Conclusion
San Jacinto County is located in the East Texas region of the state of Texas. It was established in 1870 and is named after the Battle of San Jacinto, which was fought in 1836 and resulted in the independence of Texas from Mexico. The county has a diverse economy, with the largest industries being oil and gas, timber, and agriculture. As of the 2020 census, San Jacinto County had a population of 28,845, with the racial makeup of the county being 79.2% White, 15.2% Hispanic or Latino, 2.7% African American, 0.7% Native American, 0.3% Asian, and 2.1% other. The median household income in the county was $45,945, and the median family income was $51,945.
Common Questions
What is Per Capita Income in San Jacinto County?
Per Capita income in San Jacinto County is $28,124.
What is the Median Family Income in San Jacinto County?
Median Family Income in San Jacinto County is $72,961.
What is the Median Household income in San Jacinto County?
Median Household Income in San Jacinto County is $54,839.
What is Income or Wage Gap in San Jacinto County?
Income or Wage Gap in San Jacinto County is 34.7%.
Women in San Jacinto County earn 65.3 cents for every dollar earned by a man.
What is Family Income Deficit in San Jacinto County?
Family Income Deficit in San Jacinto County is $9,675.
Families that are below poverty line in San Jacinto County earn $9,675 less on average than the poverty threshold level.
What is Inequality or Gini Index in San Jacinto County?
Inequality or Gini Index in San Jacinto County is 0.45.
What is the Total Population of San Jacinto County?
Total Population of San Jacinto County is 27,666.
What is the Total Male Population of San Jacinto County?
Total Male Population of San Jacinto County is 13,794.
What is the Total Female Population of San Jacinto County?
Total Female Population of San Jacinto County is 13,872.
What is the Ratio of Males per 100 Females in San Jacinto County?
There are 99.44 Males per 100 Females in San Jacinto County.
What is the Ratio of Females per 100 Males in San Jacinto County?
There are 100.57 Females per 100 Males in San Jacinto County.
What is the Median Population Age in San Jacinto County?
Median Population Age in San Jacinto County is 45.3 Years.
What is the Average Family Size in San Jacinto County
Average Family Size in San Jacinto County is 3.2 People.
What is the Average Household Size in San Jacinto County
Average Household Size in San Jacinto County is 2.7 People.
How Large is the Labor Force in San Jacinto County?
There are 11,687 People in the Labor Forcein in San Jacinto County.
What is the Percentage of People in the Labor Force in San Jacinto County?
52.2% of People are in the Labor Force in San Jacinto County.
What is the Unemployment Rate in San Jacinto County?
Unemployment Rate in San Jacinto County is 7.1%.