San Augustine County, TX Map & Demographics
San Augustine County Map
San Augustine County Overview
$24,673
PER CAPITA INCOME
$49,569
AVG FAMILY INCOME
$45,888
AVG HOUSEHOLD INCOME
55.0%
WAGE / INCOME GAP [ % ]
45.0¢/ $1
WAGE / INCOME GAP [ $ ]
0.48
INEQUALITY / GINI INDEX
7,920
TOTAL POPULATION
3,828
MALE POPULATION
4,092
FEMALE POPULATION
93.55
MALES / 100 FEMALES
106.90
FEMALES / 100 MALES
48.6
MEDIAN AGE
2.9
AVG FAMILY SIZE
2.5
AVG HOUSEHOLD SIZE
2,902
LABOR FORCE [ PEOPLE ]
43.8%
PERCENT IN LABOR FORCE
10.3%
UNEMPLOYMENT RATE
San Augustine County Area Codes
Income in San Augustine County
Income Overview in San Augustine County
Per Capita Income in San Augustine County is $24,673, while median incomes of families and households are $49,569 and $45,888 respectively.
| Characteristic | Number | Measure |
| Per Capita Income | 7,920 | $24,673 |
| Median Family Income | 2,251 | $49,569 |
| Mean Family Income | 2,251 | $65,447 |
| Median Household Income | 3,051 | $45,888 |
| Mean Household Income | 3,051 | $59,266 |
| Income Deficit | 2,251 | $0 |
| Wage / Income Gap (%) | 7,920 | 55.05% |
| Wage / Income Gap ($) | 7,920 | 44.95¢ per $1 |
| Gini / Inequality Index | 7,920 | 0.48 |
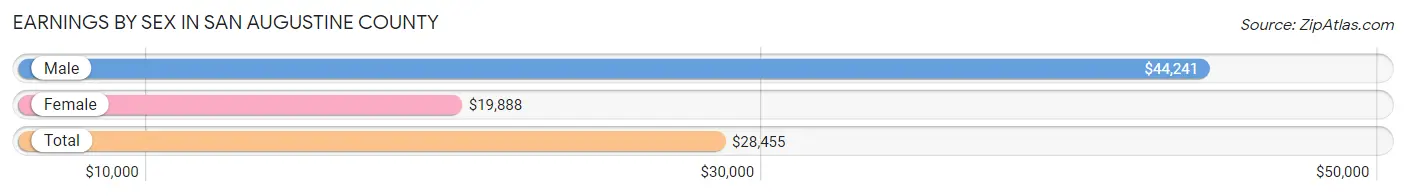
Earnings by Sex in San Augustine County
Average Earnings in San Augustine County are $28,455, $44,241 for men and $19,888 for women, a difference of 55.0%.
| Sex | Number | Average Earnings |
| Male | 1,469 (49.4%) | $44,241 |
| Female | 1,502 (50.6%) | $19,888 |
| Total | 2,971 (100.0%) | $28,455 |
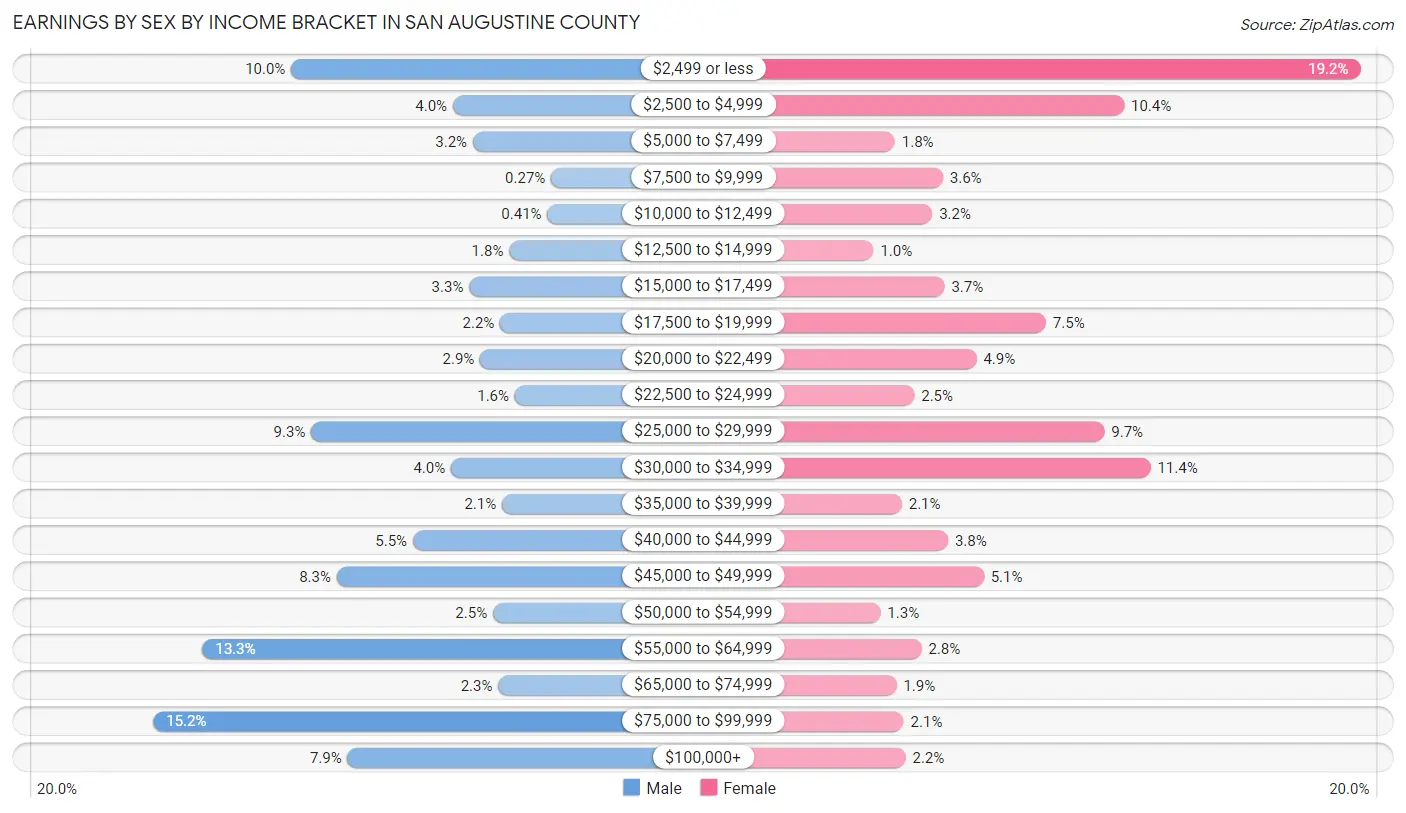
Earnings by Sex by Income Bracket in San Augustine County
The most common earnings brackets in San Augustine County are $75,000 to $99,999 for men (223 | 15.2%) and $2,499 or less for women (289 | 19.2%).
| Income | Male | Female |
| $2,499 or less | 147 (10.0%) | 289 (19.2%) |
| $2,500 to $4,999 | 58 (4.0%) | 156 (10.4%) |
| $5,000 to $7,499 | 47 (3.2%) | 27 (1.8%) |
| $7,500 to $9,999 | 4 (0.3%) | 54 (3.6%) |
| $10,000 to $12,499 | 6 (0.4%) | 48 (3.2%) |
| $12,500 to $14,999 | 27 (1.8%) | 15 (1.0%) |
| $15,000 to $17,499 | 49 (3.3%) | 55 (3.7%) |
| $17,500 to $19,999 | 32 (2.2%) | 112 (7.5%) |
| $20,000 to $22,499 | 43 (2.9%) | 73 (4.9%) |
| $22,500 to $24,999 | 24 (1.6%) | 38 (2.5%) |
| $25,000 to $29,999 | 136 (9.3%) | 145 (9.7%) |
| $30,000 to $34,999 | 59 (4.0%) | 171 (11.4%) |
| $35,000 to $39,999 | 31 (2.1%) | 31 (2.1%) |
| $40,000 to $44,999 | 80 (5.4%) | 57 (3.8%) |
| $45,000 to $49,999 | 122 (8.3%) | 77 (5.1%) |
| $50,000 to $54,999 | 36 (2.5%) | 19 (1.3%) |
| $55,000 to $64,999 | 196 (13.3%) | 42 (2.8%) |
| $65,000 to $74,999 | 33 (2.2%) | 28 (1.9%) |
| $75,000 to $99,999 | 223 (15.2%) | 32 (2.1%) |
| $100,000+ | 116 (7.9%) | 33 (2.2%) |
| Total | 1,469 (100.0%) | 1,502 (100.0%) |
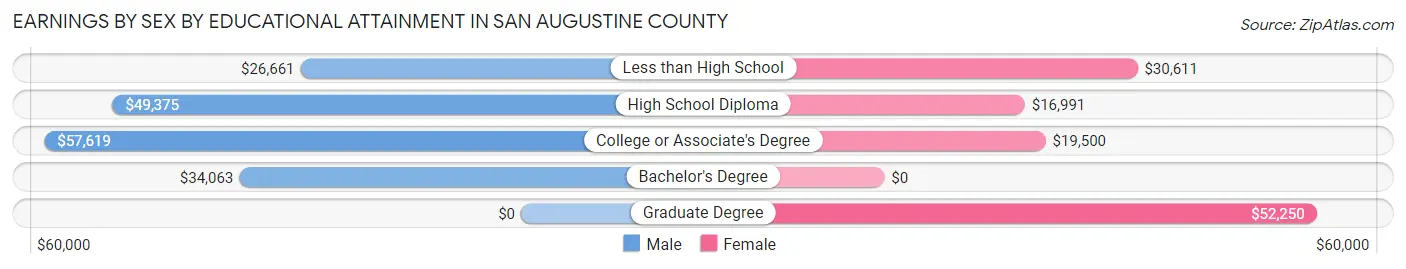
Earnings by Sex by Educational Attainment in San Augustine County
Average earnings in San Augustine County are $48,511 for men and $21,598 for women, a difference of 55.5%. Men with an educational attainment of college or associate's degree enjoy the highest average annual earnings of $57,619, while those with less than high school education earn the least with $26,661. Women with an educational attainment of graduate degree earn the most with the average annual earnings of $52,250, while those with high school diploma education have the smallest earnings of $16,991.
| Educational Attainment | Male Income | Female Income |
| Less than High School | $26,661 | $30,611 |
| High School Diploma | $49,375 | $16,991 |
| College or Associate's Degree | $57,619 | $19,500 |
| Bachelor's Degree | $34,063 | $0 |
| Graduate Degree | - | - |
| Total | $48,511 | $21,598 |
Family Income in San Augustine County
Family Income Brackets in San Augustine County
According to the San Augustine County family income data, there are 479 families falling into the $35,000 to $49,999 income range, which is the most common income bracket and makes up 21.3% of all families. Conversely, the $200,000+ income bracket is the least frequent group with only 27 families (1.2%) belonging to this category.
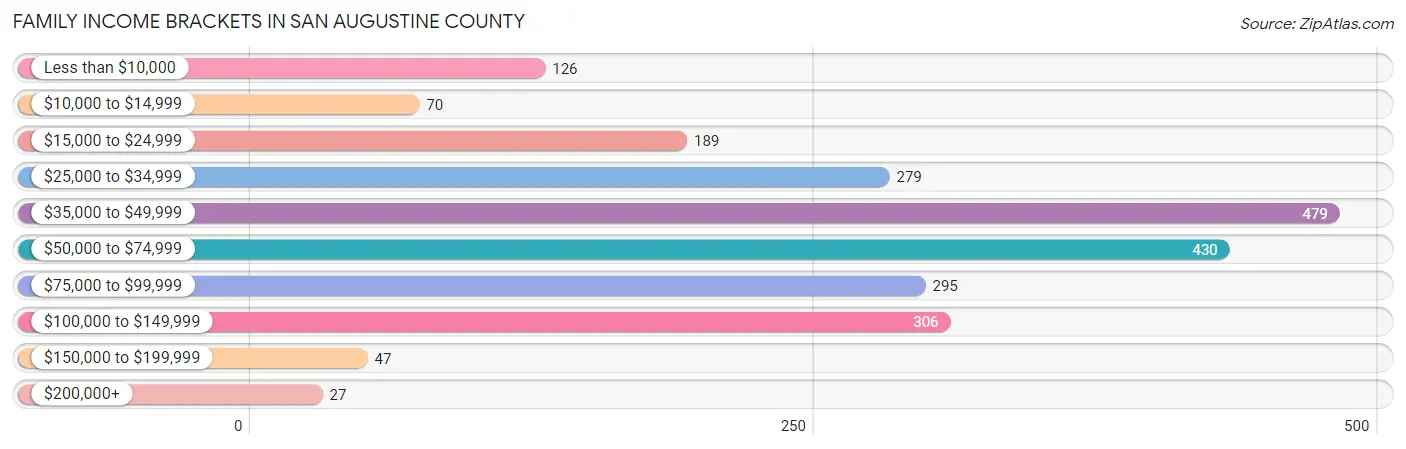
| Income Bracket | # Families | % Families |
| Less than $10,000 | 126 | 5.6% |
| $10,000 to $14,999 | 70 | 3.1% |
| $15,000 to $24,999 | 189 | 8.4% |
| $25,000 to $34,999 | 279 | 12.4% |
| $35,000 to $49,999 | 479 | 21.3% |
| $50,000 to $74,999 | 430 | 19.1% |
| $75,000 to $99,999 | 295 | 13.1% |
| $100,000 to $149,999 | 306 | 13.6% |
| $150,000 to $199,999 | 47 | 2.1% |
| $200,000+ | 27 | 1.2% |
Family Income by Famaliy Size in San Augustine County
3-person families (449 | 20.0%) account for the highest median family income in San Augustine County with $59,361 per family, while 2-person families (1,324 | 58.8%) have the highest median income of $24,547 per family member.
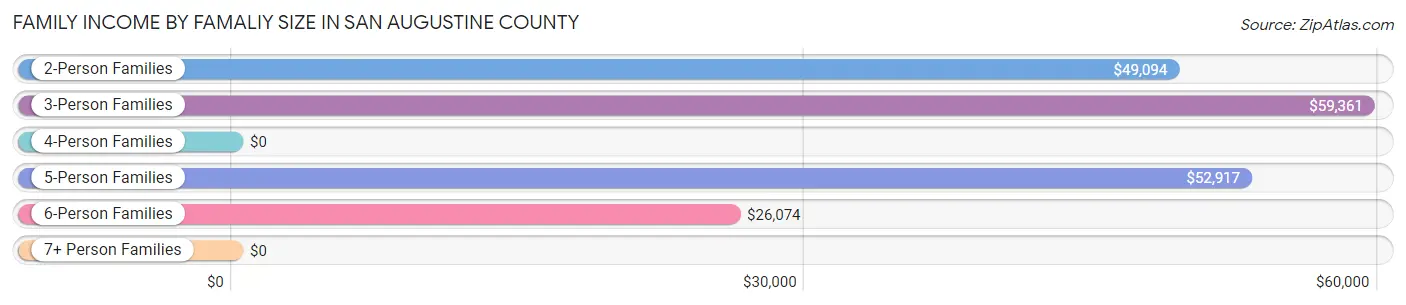
| Income Bracket | # Families | Median Income |
| 2-Person Families | 1,324 (58.8%) | $49,094 |
| 3-Person Families | 449 (20.0%) | $59,361 |
| 4-Person Families | 282 (12.5%) | $0 |
| 5-Person Families | 108 (4.8%) | $52,917 |
| 6-Person Families | 77 (3.4%) | $26,074 |
| 7+ Person Families | 11 (0.5%) | $0 |
| Total | 2,251 (100.0%) | $49,569 |
Family Income by Number of Earners in San Augustine County
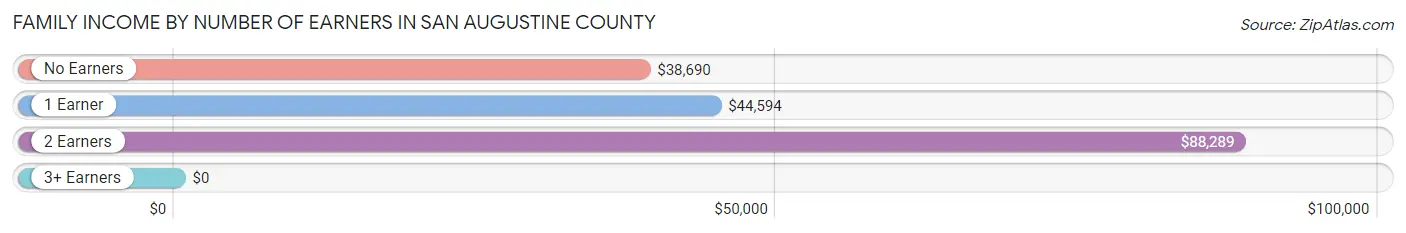
| Number of Earners | # Families | Median Income |
| No Earners | 616 (27.4%) | $38,690 |
| 1 Earner | 1,065 (47.3%) | $44,594 |
| 2 Earners | 554 (24.6%) | $88,289 |
| 3+ Earners | 16 (0.7%) | $0 |
| Total | 2,251 (100.0%) | $49,569 |
Household Income in San Augustine County
Household Income Brackets in San Augustine County
With 610 households falling in the category, the $50,000 to $74,999 income range is the most frequent in San Augustine County, accounting for 20.0% of all households. In contrast, only 49 households (1.6%) fall into the $150,000 to $199,999 income bracket, making it the least populous group.
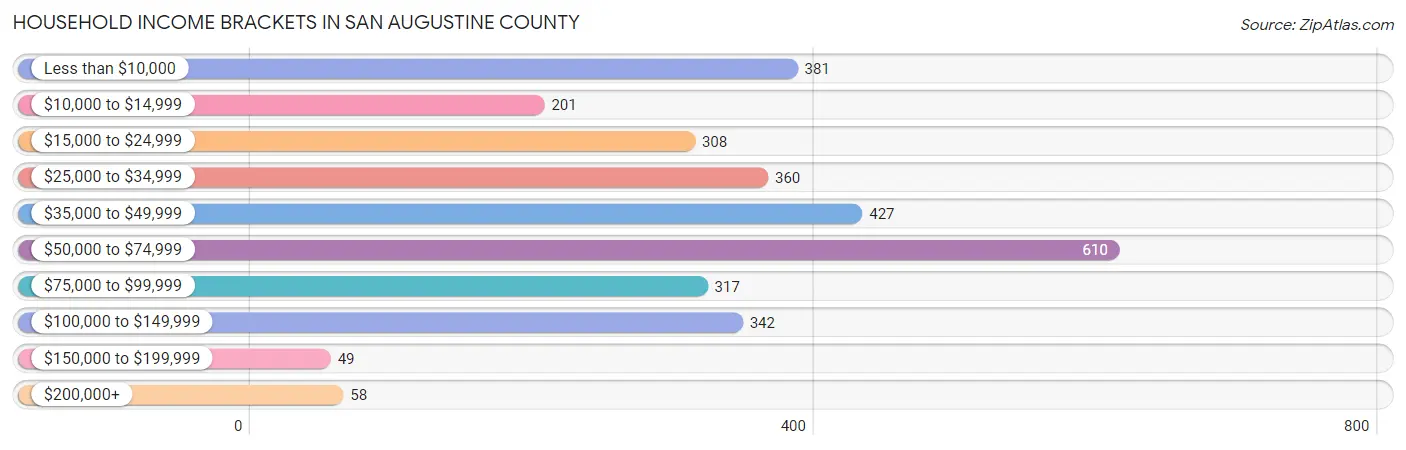
| Income Bracket | # Households | % Households |
| Less than $10,000 | 381 | 12.5% |
| $10,000 to $14,999 | 201 | 6.6% |
| $15,000 to $24,999 | 308 | 10.1% |
| $25,000 to $34,999 | 360 | 11.8% |
| $35,000 to $49,999 | 427 | 14.0% |
| $50,000 to $74,999 | 610 | 20.0% |
| $75,000 to $99,999 | 317 | 10.4% |
| $100,000 to $149,999 | 342 | 11.2% |
| $150,000 to $199,999 | 49 | 1.6% |
| $200,000+ | 58 | 1.9% |
Household Income by Householder Age in San Augustine County
The median household income in San Augustine County is $45,888, with the highest median household income of $48,835 found in the 25 to 44 years age bracket for the primary householder. A total of 571 households (18.7%) fall into this category. Meanwhile, the 15 to 24 years age bracket for the primary householder has the lowest median household income of $0, with 76 households (2.5%) in this group.
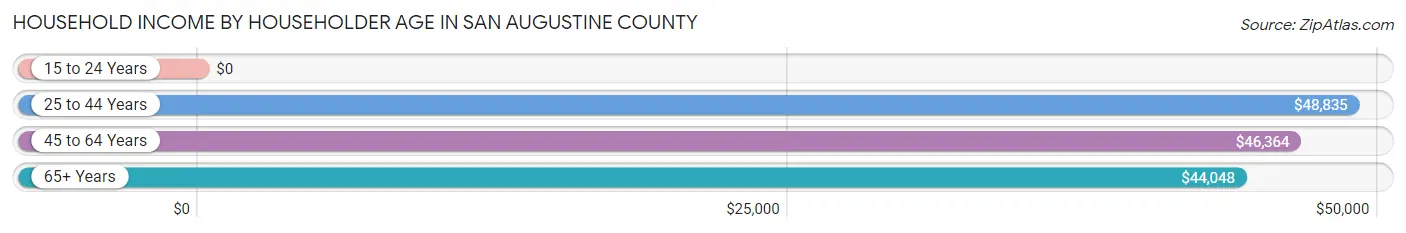
| Income Bracket | # Households | Median Income |
| 15 to 24 Years | 76 (2.5%) | $0 |
| 25 to 44 Years | 571 (18.7%) | $48,835 |
| 45 to 64 Years | 1,098 (36.0%) | $46,364 |
| 65+ Years | 1,306 (42.8%) | $44,048 |
| Total | 3,051 (100.0%) | $45,888 |
Poverty in San Augustine County
Income Below Poverty by Sex and Age in San Augustine County
With 27.9% poverty level for males and 26.7% for females among the residents of San Augustine County, 6 to 11 year old males and 16 and 17 year old females are the most vulnerable to poverty, with 159 males (66.5%) and 99 females (56.9%) in their respective age groups living below the poverty level.
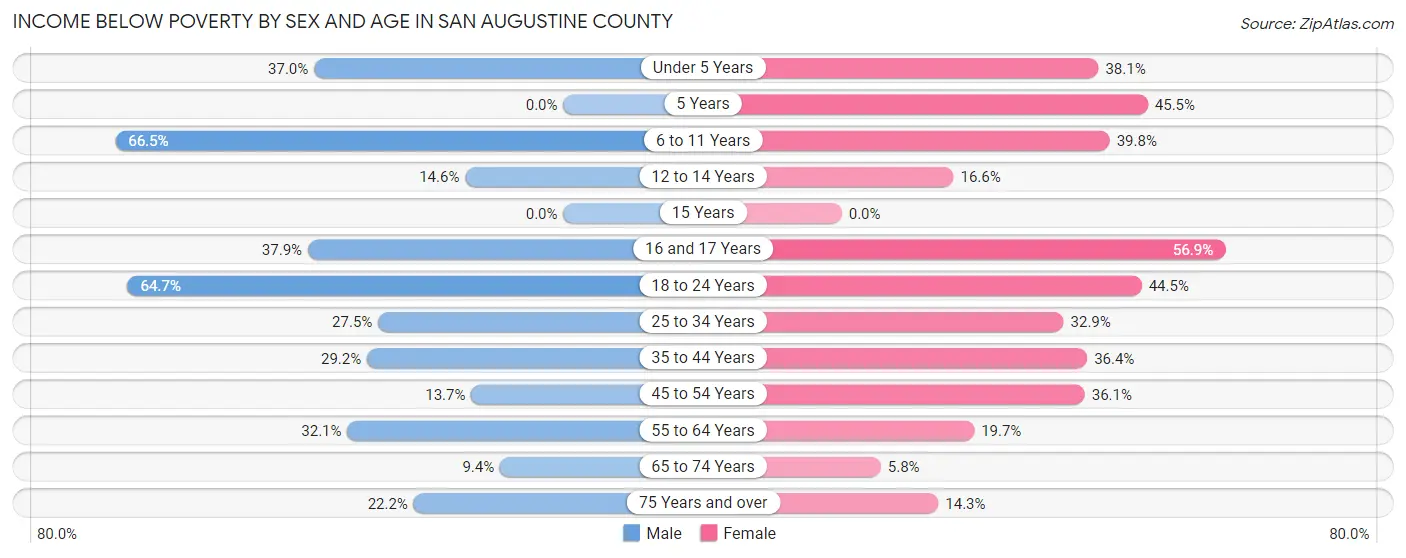
| Age Bracket | Male | Female |
| Under 5 Years | 47 (37.0%) | 61 (38.1%) |
| 5 Years | 0 (0.0%) | 15 (45.5%) |
| 6 to 11 Years | 159 (66.5%) | 76 (39.8%) |
| 12 to 14 Years | 36 (14.6%) | 35 (16.6%) |
| 15 Years | 0 (0.0%) | 0 (0.0%) |
| 16 and 17 Years | 33 (37.9%) | 99 (56.9%) |
| 18 to 24 Years | 187 (64.7%) | 102 (44.5%) |
| 25 to 34 Years | 110 (27.5%) | 84 (32.9%) |
| 35 to 44 Years | 86 (29.1%) | 176 (36.4%) |
| 45 to 54 Years | 67 (13.7%) | 192 (36.1%) |
| 55 to 64 Years | 178 (32.1%) | 104 (19.7%) |
| 65 to 74 Years | 60 (9.4%) | 34 (5.8%) |
| 75 Years and over | 82 (22.2%) | 70 (14.3%) |
| Total | 1,045 (27.9%) | 1,048 (26.7%) |
Income Above Poverty by Sex and Age in San Augustine County
According to the poverty statistics in San Augustine County, males aged 5 years and females aged 15 years are the age groups that are most secure financially, with 100.0% of males and 100.0% of females in these age groups living above the poverty line.
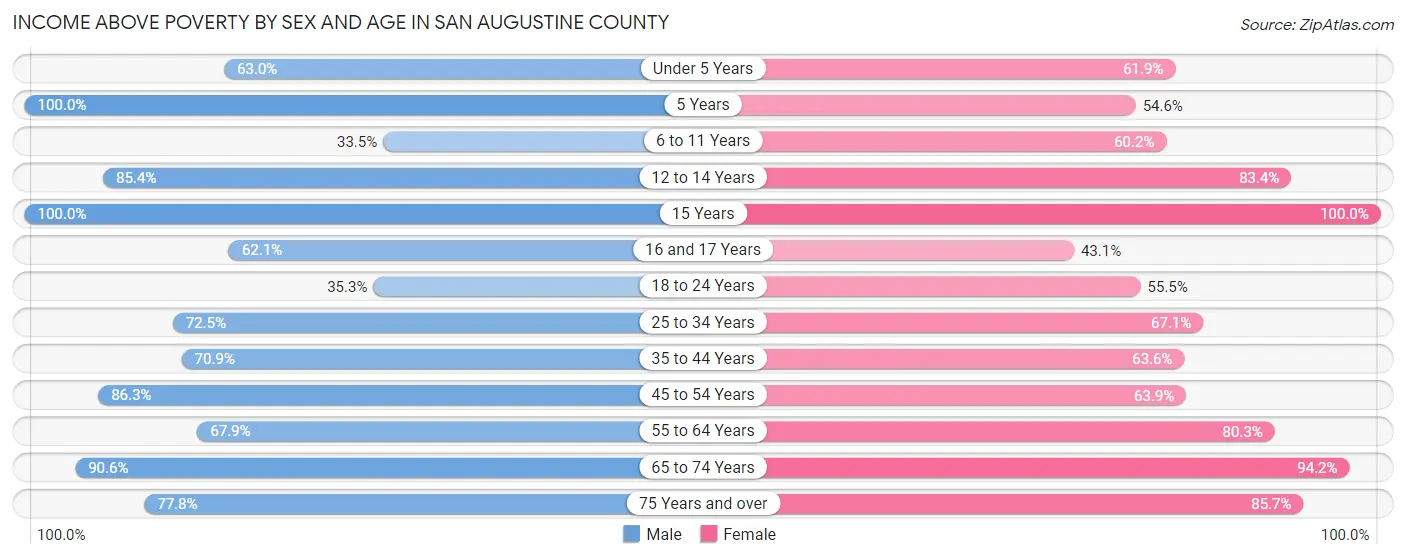
| Age Bracket | Male | Female |
| Under 5 Years | 80 (63.0%) | 99 (61.9%) |
| 5 Years | 12 (100.0%) | 18 (54.5%) |
| 6 to 11 Years | 80 (33.5%) | 115 (60.2%) |
| 12 to 14 Years | 211 (85.4%) | 176 (83.4%) |
| 15 Years | 3 (100.0%) | 49 (100.0%) |
| 16 and 17 Years | 54 (62.1%) | 75 (43.1%) |
| 18 to 24 Years | 102 (35.3%) | 127 (55.5%) |
| 25 to 34 Years | 290 (72.5%) | 171 (67.1%) |
| 35 to 44 Years | 209 (70.9%) | 307 (63.6%) |
| 45 to 54 Years | 423 (86.3%) | 340 (63.9%) |
| 55 to 64 Years | 377 (67.9%) | 425 (80.3%) |
| 65 to 74 Years | 578 (90.6%) | 552 (94.2%) |
| 75 Years and over | 287 (77.8%) | 418 (85.7%) |
| Total | 2,706 (72.1%) | 2,872 (73.3%) |
Income Below Poverty Among Married-Couple Families in San Augustine County
The poverty statistics for married-couple families in San Augustine County show that 13.9% or 215 of the total 1,542 families live below the poverty line. Families with 3 or 4 children have the highest poverty rate of 66.0%, comprising of 70 families. On the other hand, families with no children have the lowest poverty rate of 8.3%, which includes 79 families.
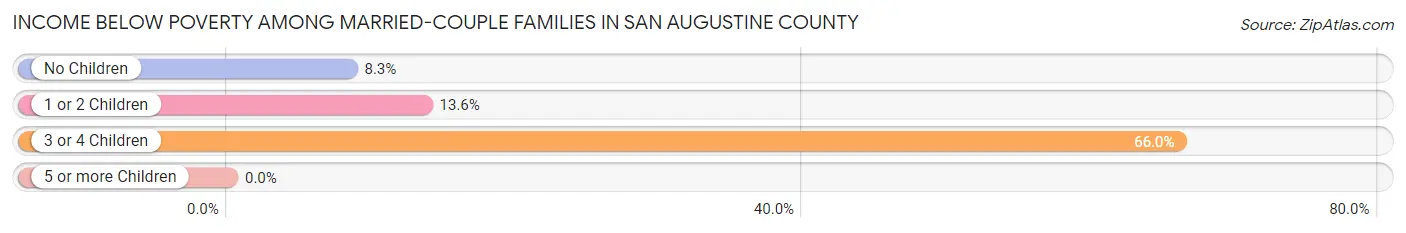
| Children | Above Poverty | Below Poverty |
| No Children | 870 (91.7%) | 79 (8.3%) |
| 1 or 2 Children | 421 (86.5%) | 66 (13.6%) |
| 3 or 4 Children | 36 (34.0%) | 70 (66.0%) |
| 5 or more Children | 0 (0.0%) | 0 (0.0%) |
| Total | 1,327 (86.1%) | 215 (13.9%) |
Income Below Poverty Among Single-Parent Households in San Augustine County
According to the poverty data in San Augustine County, 28.7% or 27 single-father households and 23.7% or 146 single-mother households are living below the poverty line. Among single-father households, those with 1 or 2 children have the highest poverty rate, with 27 households (93.1%) experiencing poverty. Likewise, among single-mother households, those with 3 or 4 children have the highest poverty rate, with 11 households (64.7%) falling below the poverty line.
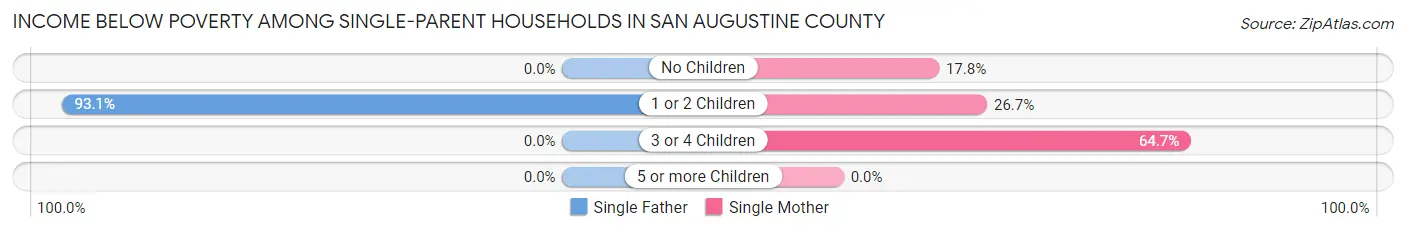
| Children | Single Father | Single Mother |
| No Children | 0 (0.0%) | 49 (17.7%) |
| 1 or 2 Children | 27 (93.1%) | 86 (26.7%) |
| 3 or 4 Children | 0 (0.0%) | 11 (64.7%) |
| 5 or more Children | 0 (0.0%) | 0 (0.0%) |
| Total | 27 (28.7%) | 146 (23.7%) |
Income Below Poverty Among Married-Couple vs Single-Parent Households in San Augustine County
The poverty data for San Augustine County shows that 215 of the married-couple family households (13.9%) and 173 of the single-parent households (24.4%) are living below the poverty level. Within the married-couple family households, those with 3 or 4 children have the highest poverty rate, with 70 households (66.0%) falling below the poverty line. Among the single-parent households, those with 3 or 4 children have the highest poverty rate, with 11 household (64.7%) living below poverty.
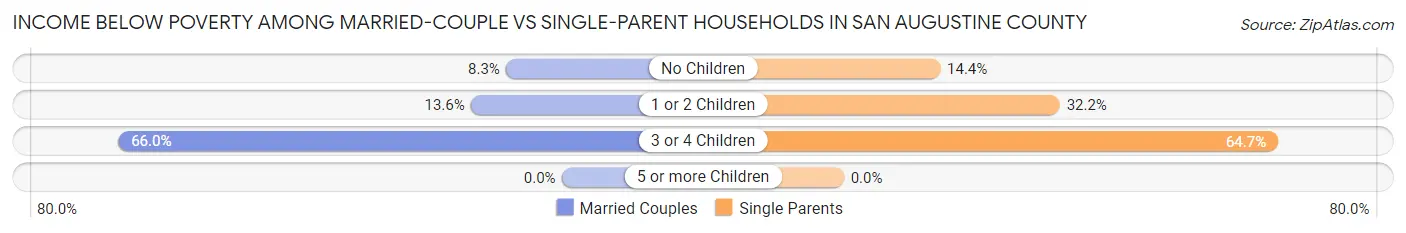
| Children | Married-Couple Families | Single-Parent Households |
| No Children | 79 (8.3%) | 49 (14.4%) |
| 1 or 2 Children | 66 (13.6%) | 113 (32.2%) |
| 3 or 4 Children | 70 (66.0%) | 11 (64.7%) |
| 5 or more Children | 0 (0.0%) | 0 (0.0%) |
| Total | 215 (13.9%) | 173 (24.4%) |
Race in San Augustine County
The most populous races in San Augustine County are White / Caucasian (5,625 | 71.0%), Black / African American (1,763 | 22.3%), and Hispanic or Latino (643 | 8.1%).
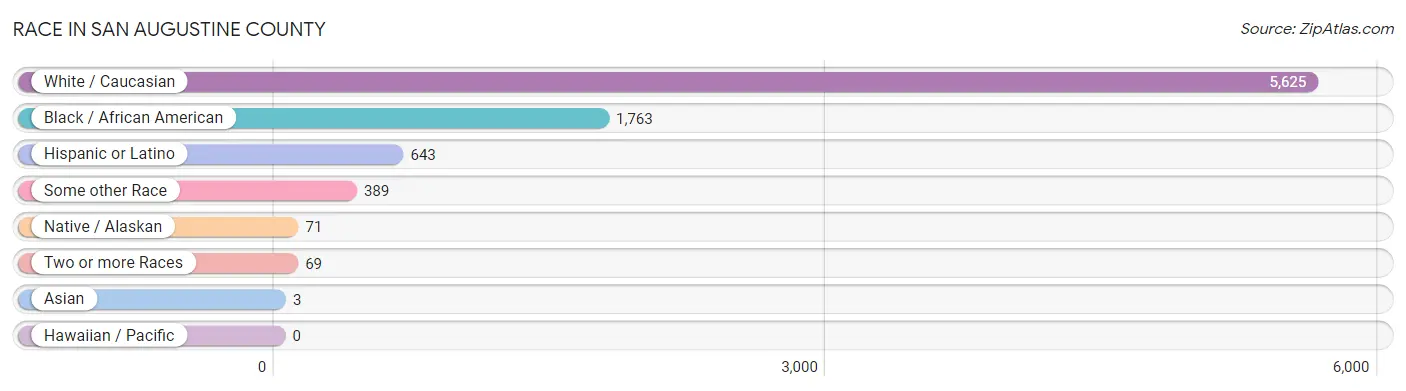
| Race | # Population | % Population |
| Asian | 3 | 0.0% |
| Black / African American | 1,763 | 22.3% |
| Hawaiian / Pacific | 0 | 0.0% |
| Hispanic or Latino | 643 | 8.1% |
| Native / Alaskan | 71 | 0.9% |
| White / Caucasian | 5,625 | 71.0% |
| Two or more Races | 69 | 0.9% |
| Some other Race | 389 | 4.9% |
| Total | 7,920 | 100.0% |
Ancestry in San Augustine County
The most populous ancestries reported in San Augustine County are American (1,166 | 14.7%), Irish (718 | 9.1%), English (661 | 8.4%), Mexican (631 | 8.0%), and German (614 | 7.7%), together accounting for 47.9% of all San Augustine County residents.
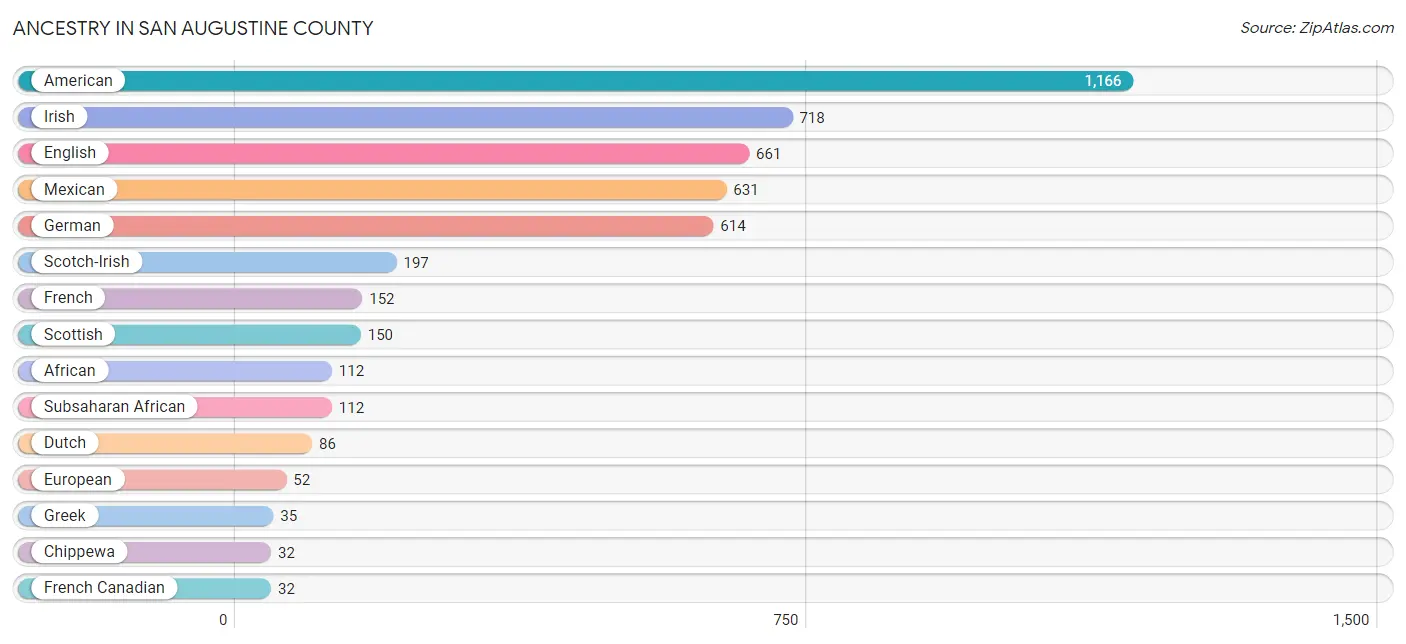
| Ancestry | # Population | % Population |
| African | 112 | 1.4% |
| American | 1,166 | 14.7% |
| Blackfeet | 16 | 0.2% |
| British | 31 | 0.4% |
| Cajun | 26 | 0.3% |
| Cherokee | 17 | 0.2% |
| Chippewa | 32 | 0.4% |
| Czech | 6 | 0.1% |
| Danish | 24 | 0.3% |
| Dutch | 86 | 1.1% |
| Eastern European | 5 | 0.1% |
| English | 661 | 8.4% |
| European | 52 | 0.7% |
| French | 152 | 1.9% |
| French Canadian | 32 | 0.4% |
| German | 614 | 7.7% |
| Greek | 35 | 0.4% |
| Hungarian | 4 | 0.1% |
| Irish | 718 | 9.1% |
| Italian | 30 | 0.4% |
| Mexican | 631 | 8.0% |
| Mexican American Indian | 14 | 0.2% |
| Northern European | 15 | 0.2% |
| Norwegian | 29 | 0.4% |
| Polish | 7 | 0.1% |
| Russian | 7 | 0.1% |
| Scotch-Irish | 197 | 2.5% |
| Scottish | 150 | 1.9% |
| Spanish | 12 | 0.2% |
| Subsaharan African | 112 | 1.4% |
| Swedish | 12 | 0.2% |
| Thai | 3 | 0.0% |
| Welsh | 9 | 0.1% | View All 33 Rows |
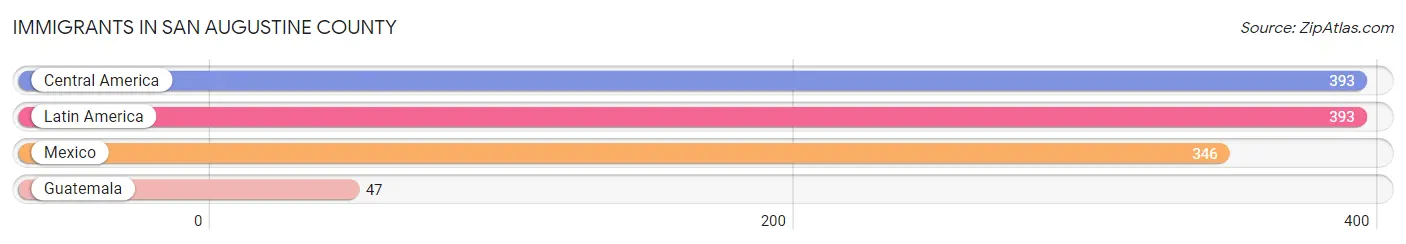
Immigrants in San Augustine County
The most numerous immigrant groups reported in San Augustine County came from Central America (393 | 5.0%), Latin America (393 | 5.0%), Mexico (346 | 4.4%), and Guatemala (47 | 0.6%), together accounting for 14.9% of all San Augustine County residents.
| Immigration Origin | # Population | % Population |
| Central America | 393 | 5.0% |
| Guatemala | 47 | 0.6% |
| Latin America | 393 | 5.0% |
| Mexico | 346 | 4.4% | View All 4 Rows |
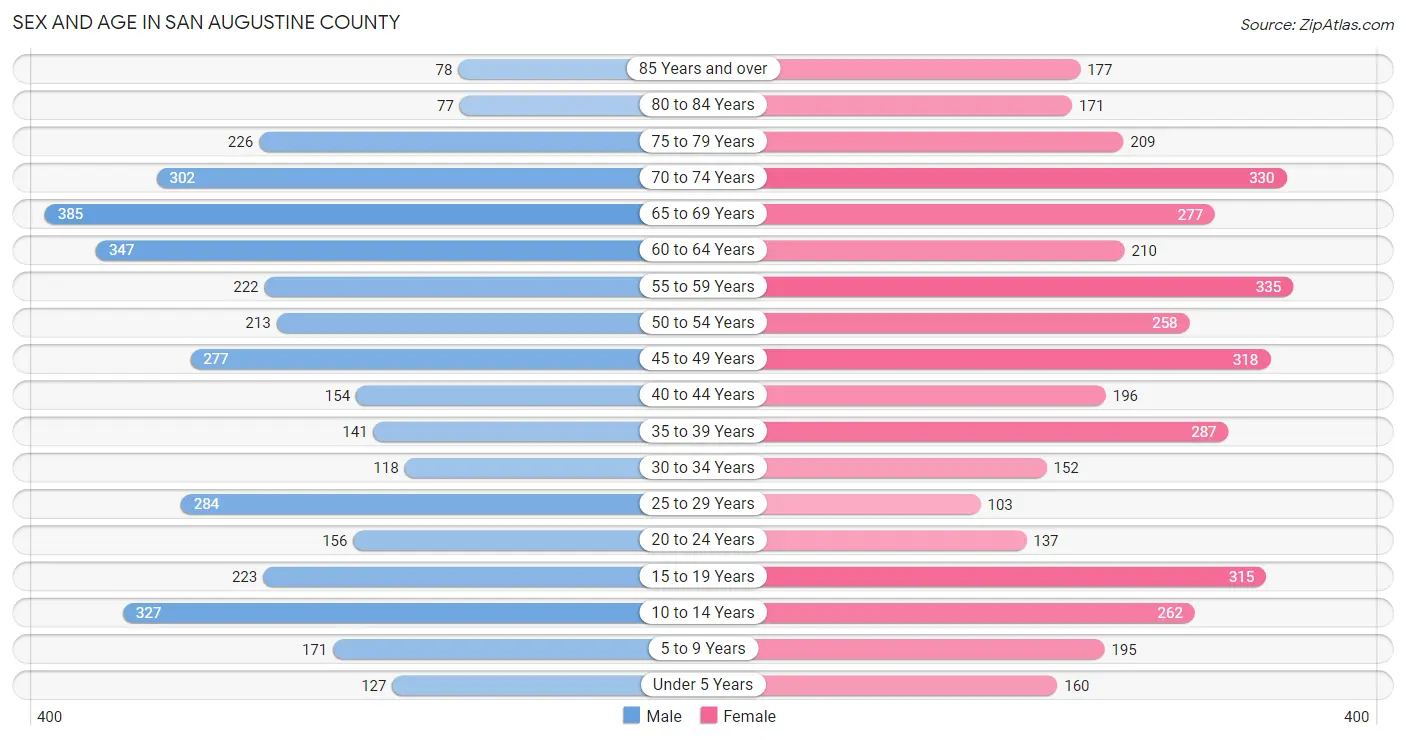
Sex and Age in San Augustine County
Sex and Age in San Augustine County
The most populous age groups in San Augustine County are 65 to 69 Years (385 | 10.1%) for men and 55 to 59 Years (335 | 8.2%) for women.
| Age Bracket | Male | Female |
| Under 5 Years | 127 (3.3%) | 160 (3.9%) |
| 5 to 9 Years | 171 (4.5%) | 195 (4.8%) |
| 10 to 14 Years | 327 (8.5%) | 262 (6.4%) |
| 15 to 19 Years | 223 (5.8%) | 315 (7.7%) |
| 20 to 24 Years | 156 (4.1%) | 137 (3.4%) |
| 25 to 29 Years | 284 (7.4%) | 103 (2.5%) |
| 30 to 34 Years | 118 (3.1%) | 152 (3.7%) |
| 35 to 39 Years | 141 (3.7%) | 287 (7.0%) |
| 40 to 44 Years | 154 (4.0%) | 196 (4.8%) |
| 45 to 49 Years | 277 (7.2%) | 318 (7.8%) |
| 50 to 54 Years | 213 (5.6%) | 258 (6.3%) |
| 55 to 59 Years | 222 (5.8%) | 335 (8.2%) |
| 60 to 64 Years | 347 (9.1%) | 210 (5.1%) |
| 65 to 69 Years | 385 (10.1%) | 277 (6.8%) |
| 70 to 74 Years | 302 (7.9%) | 330 (8.1%) |
| 75 to 79 Years | 226 (5.9%) | 209 (5.1%) |
| 80 to 84 Years | 77 (2.0%) | 171 (4.2%) |
| 85 Years and over | 78 (2.0%) | 177 (4.3%) |
| Total | 3,828 (100.0%) | 4,092 (100.0%) |
Families and Households in San Augustine County
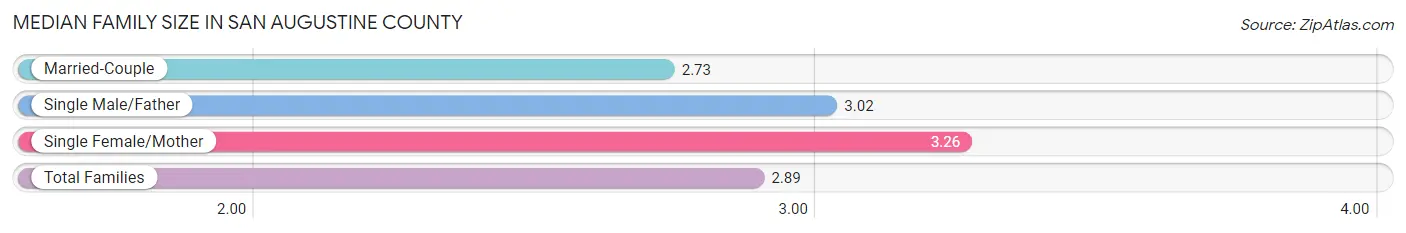
Median Family Size in San Augustine County
The median family size in San Augustine County is 2.89 persons per family, with single female/mother families (615 | 27.3%) accounting for the largest median family size of 3.26 persons per family. On the other hand, married-couple families (1,542 | 68.5%) represent the smallest median family size with 2.73 persons per family.
| Family Type | # Families | Family Size |
| Married-Couple | 1,542 (68.5%) | 2.73 |
| Single Male/Father | 94 (4.2%) | 3.02 |
| Single Female/Mother | 615 (27.3%) | 3.26 |
| Total Families | 2,251 (100.0%) | 2.89 |
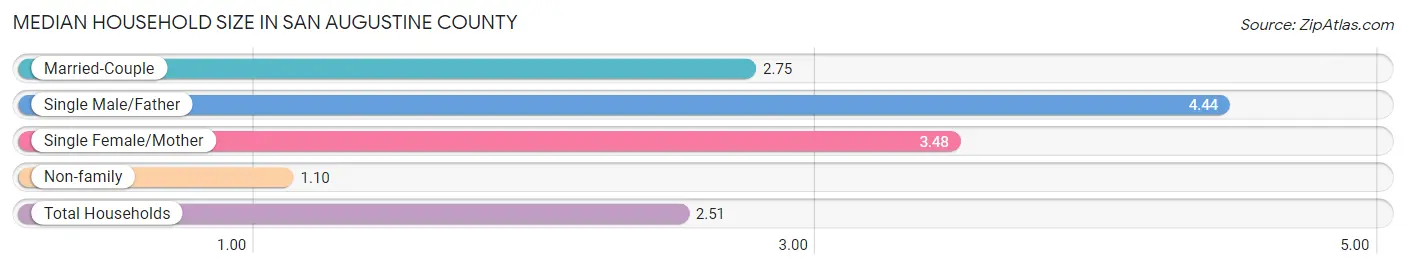
Median Household Size in San Augustine County
The median household size in San Augustine County is 2.51 persons per household, with single male/father households (94 | 3.1%) accounting for the largest median household size of 4.44 persons per household. non-family households (800 | 26.2%) represent the smallest median household size with 1.10 persons per household.
| Household Type | # Households | Household Size |
| Married-Couple | 1,542 (50.5%) | 2.75 |
| Single Male/Father | 94 (3.1%) | 4.44 |
| Single Female/Mother | 615 (20.2%) | 3.48 |
| Non-family | 800 (26.2%) | 1.10 |
| Total Households | 3,051 (100.0%) | 2.51 |
Household Size by Marriage Status in San Augustine County
Out of a total of 3,051 households in San Augustine County, 2,251 (73.8%) are family households, while 800 (26.2%) are nonfamily households. The most numerous type of family households are 2-person households, comprising 1,246, and the most common type of nonfamily households are 1-person households, comprising 764.
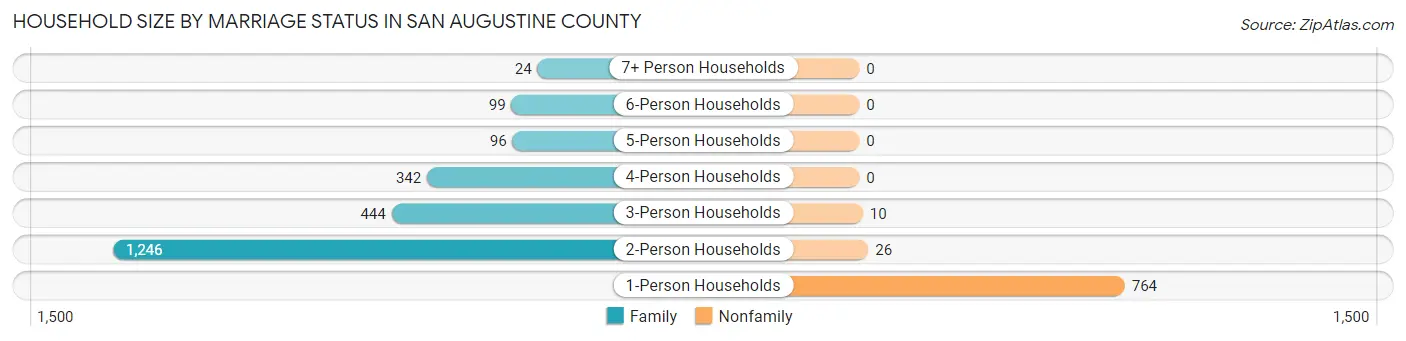
| Household Size | Family Households | Nonfamily Households |
| 1-Person Households | - | 764 (25.0%) |
| 2-Person Households | 1,246 (40.8%) | 26 (0.9%) |
| 3-Person Households | 444 (14.5%) | 10 (0.3%) |
| 4-Person Households | 342 (11.2%) | 0 (0.0%) |
| 5-Person Households | 96 (3.2%) | 0 (0.0%) |
| 6-Person Households | 99 (3.2%) | 0 (0.0%) |
| 7+ Person Households | 24 (0.8%) | 0 (0.0%) |
| Total | 2,251 (73.8%) | 800 (26.2%) |
Female Fertility in San Augustine County
Fertility by Age in San Augustine County
Average fertility rate in San Augustine County is 14.0 births per 1,000 women. Women in the age bracket of 15 to 19 years have the highest fertility rate with 51.0 births per 1,000 women. Women in the age bracket of 15 to 19 years acount for 72.7% of all women with births.
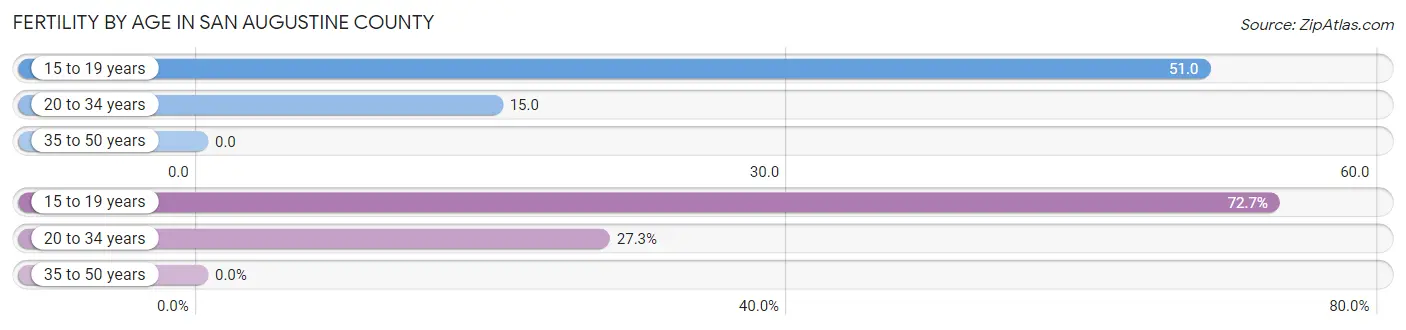
| Age Bracket | Women with Births | Births / 1,000 Women |
| 15 to 19 years | 16 (72.7%) | 51.0 |
| 20 to 34 years | 6 (27.3%) | 15.0 |
| 35 to 50 years | 0 (0.0%) | 0.0 |
| Total | 22 (100.0%) | 14.0 |
Fertility by Age by Marriage Status in San Augustine County
27.3% of women with births (22) in San Augustine County are married. The highest percentage of unmarried women with births falls into 15 to 19 years age bracket with 100.0% of them unmarried at the time of birth, while the lowest percentage of unmarried women with births belong to 20 to 34 years age bracket with 0.0% of them unmarried.
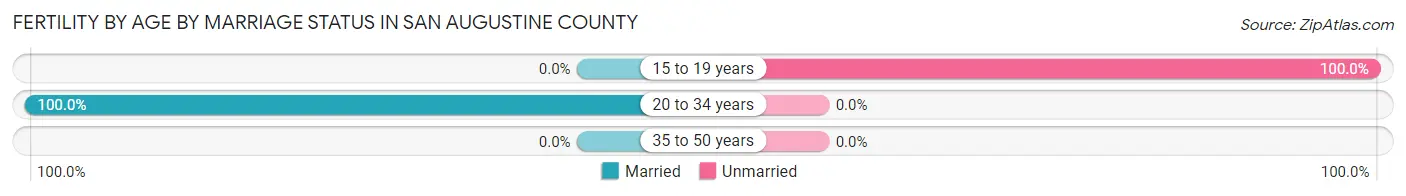
| Age Bracket | Married | Unmarried |
| 15 to 19 years | 0 (0.0%) | 16 (100.0%) |
| 20 to 34 years | 6 (100.0%) | 0 (0.0%) |
| 35 to 50 years | 0 (0.0%) | 0 (0.0%) |
| Total | 6 (27.3%) | 16 (72.7%) |
Fertility by Education in San Augustine County
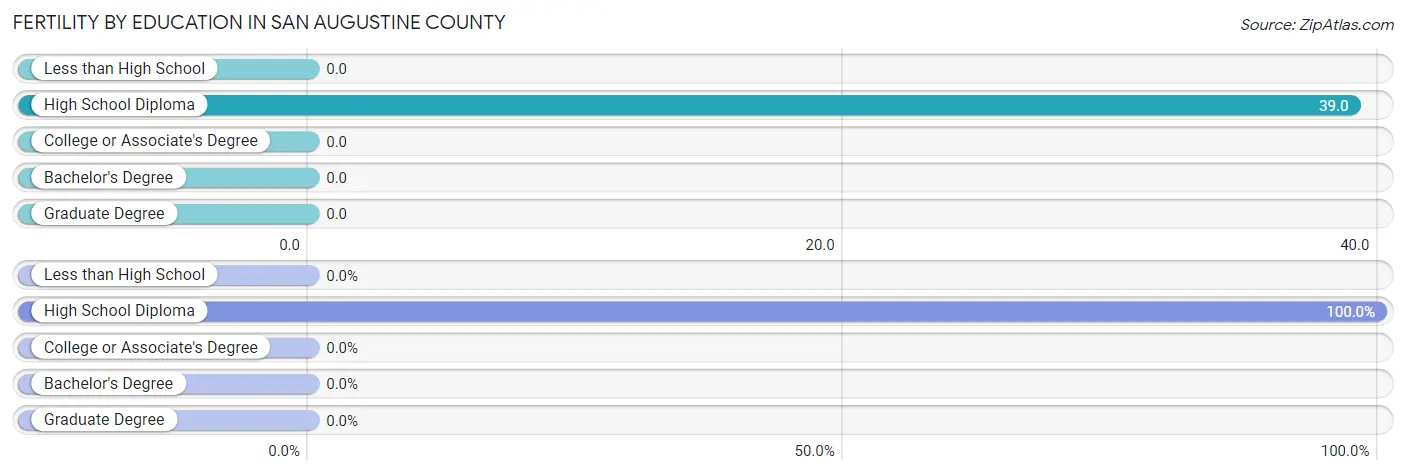
| Educational Attainment | Women with Births | Births / 1,000 Women |
| Less than High School | 0 (0.0%) | 0.0 |
| High School Diploma | 22 (100.0%) | 39.0 |
| College or Associate's Degree | 0 (0.0%) | 0.0 |
| Bachelor's Degree | 0 (0.0%) | 0.0 |
| Graduate Degree | 0 (0.0%) | 0.0 |
| Total | 22 (100.0%) | 14.0 |
Fertility by Education by Marriage Status in San Augustine County
72.7% of women with births in San Augustine County are unmarried. Women with the educational attainment of high school diploma are most likely to be married with 27.3% of them married at childbirth, while women with the educational attainment of high school diploma are least likely to be married with 72.7% of them unmarried at childbirth.
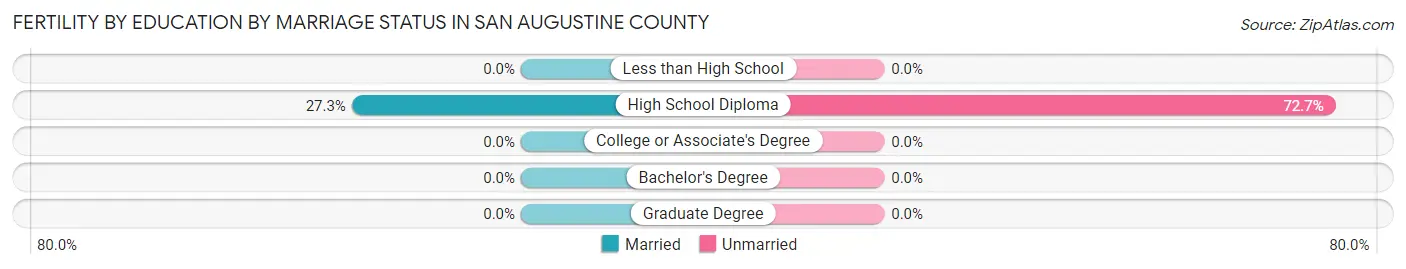
| Educational Attainment | Married | Unmarried |
| Less than High School | 0 (0.0%) | 0 (0.0%) |
| High School Diploma | 6 (27.3%) | 16 (72.7%) |
| College or Associate's Degree | 0 (0.0%) | 0 (0.0%) |
| Bachelor's Degree | 0 (0.0%) | 0 (0.0%) |
| Graduate Degree | 0 (0.0%) | 0 (0.0%) |
| Total | 6 (27.3%) | 16 (72.7%) |
Employment Characteristics in San Augustine County
Employment by Class of Employer in San Augustine County
Among the 2,585 employed individuals in San Augustine County, private company employees (1,864 | 72.1%), self-employed (not incorporated) (211 | 8.2%), and local government employees (178 | 6.9%) make up the most common classes of employment.
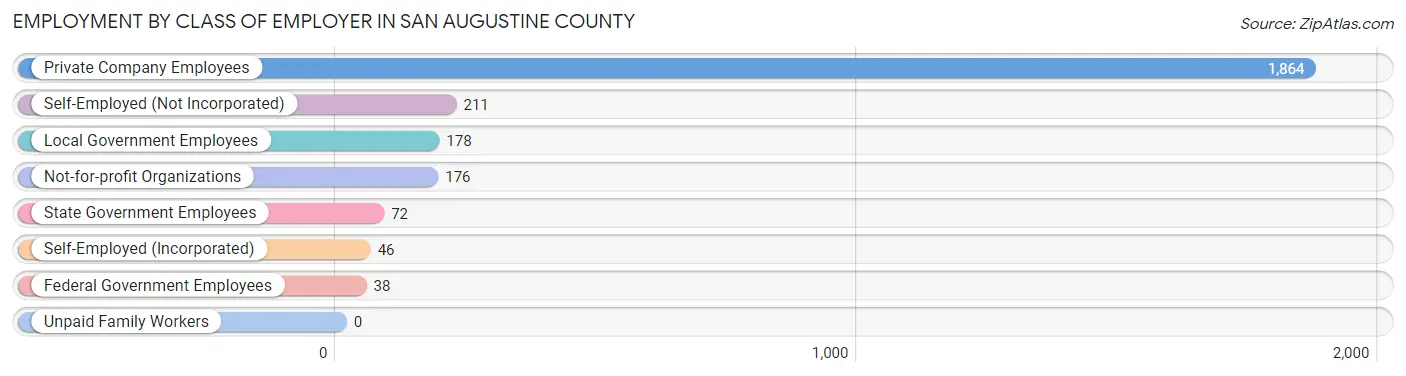
| Employer Class | # Employees | % Employees |
| Private Company Employees | 1,864 | 72.1% |
| Self-Employed (Incorporated) | 46 | 1.8% |
| Self-Employed (Not Incorporated) | 211 | 8.2% |
| Not-for-profit Organizations | 176 | 6.8% |
| Local Government Employees | 178 | 6.9% |
| State Government Employees | 72 | 2.8% |
| Federal Government Employees | 38 | 1.5% |
| Unpaid Family Workers | 0 | 0.0% |
| Total | 2,585 | 100.0% |
Employment Status by Age in San Augustine County
According to the labor force statistics for San Augustine County, out of the total population over 16 years of age (6,626), 43.8% or 2,902 individuals are in the labor force, with 10.3% or 299 of them unemployed. The age group with the highest labor force participation rate is 20 to 24 years, with 79.5% or 233 individuals in the labor force. Within the labor force, the 20 to 24 years age range has the highest percentage of unemployed individuals, with 44.2% or 103 of them being unemployed.
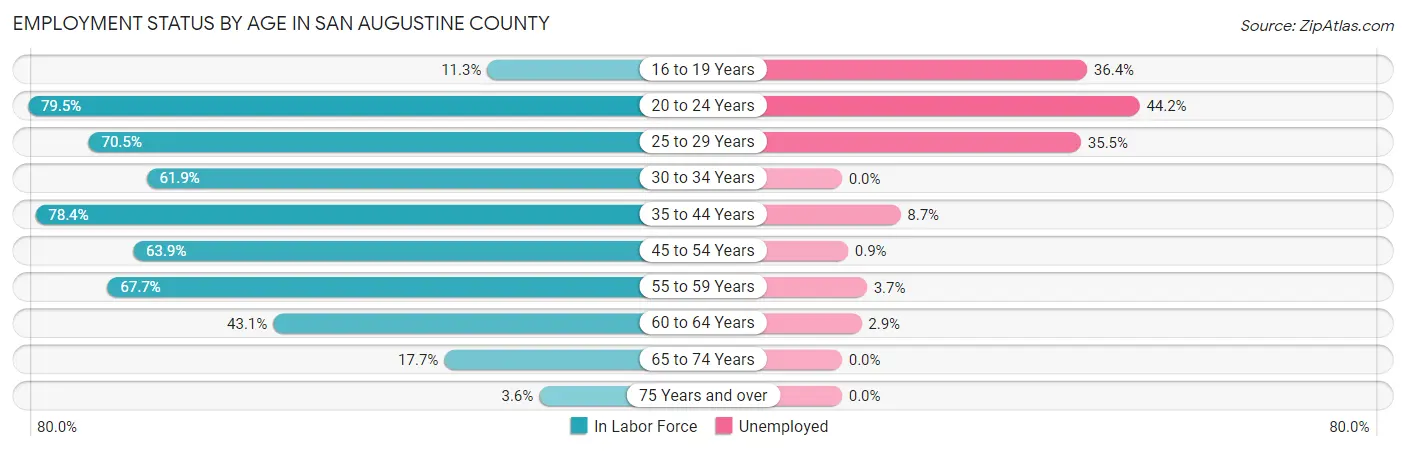
| Age Bracket | In Labor Force | Unemployed |
| 16 to 19 Years | 55 (11.3%) | 20 (36.4%) |
| 20 to 24 Years | 233 (79.5%) | 103 (44.2%) |
| 25 to 29 Years | 273 (70.5%) | 97 (35.5%) |
| 30 to 34 Years | 167 (61.9%) | 0 (0.0%) |
| 35 to 44 Years | 610 (78.4%) | 53 (8.7%) |
| 45 to 54 Years | 681 (63.9%) | 6 (0.9%) |
| 55 to 59 Years | 377 (67.7%) | 14 (3.7%) |
| 60 to 64 Years | 240 (43.1%) | 7 (2.9%) |
| 65 to 74 Years | 229 (17.7%) | 0 (0.0%) |
| 75 Years and over | 34 (3.6%) | 0 (0.0%) |
| Total | 2,902 (43.8%) | 299 (10.3%) |
Employment Status by Educational Attainment in San Augustine County
According to labor force statistics for San Augustine County, 65.0% of individuals (2,350) out of the total population between 25 and 64 years of age (3,615) are in the labor force, with 7.5% or 176 of them being unemployed. The group with the highest labor force participation rate are those with the educational attainment of bachelor's degree or higher, with 77.0% or 275 individuals in the labor force. Within the labor force, individuals with bachelor's degree or higher education have the highest percentage of unemployment, with 9.5% or 26 of them being unemployed.
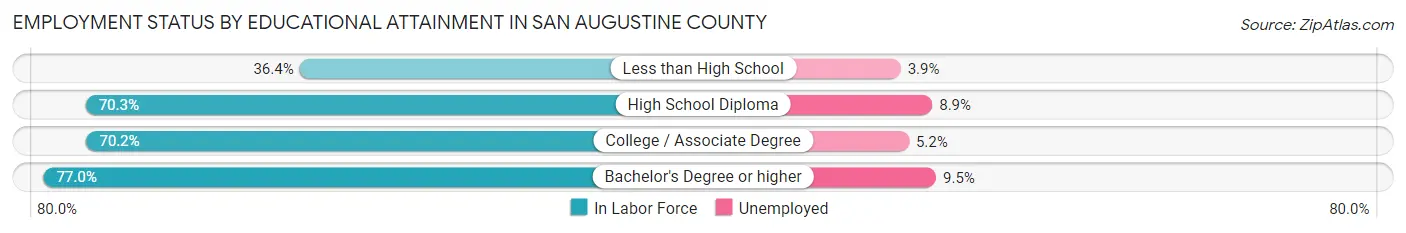
| Educational Attainment | In Labor Force | Unemployed |
| Less than High School | 232 (36.4%) | 25 (3.9%) |
| High School Diploma | 1,245 (70.3%) | 158 (8.9%) |
| College / Associate Degree | 596 (70.2%) | 44 (5.2%) |
| Bachelor's Degree or higher | 275 (77.0%) | 34 (9.5%) |
| Total | 2,350 (65.0%) | 271 (7.5%) |
Employment Occupations by Sex in San Augustine County
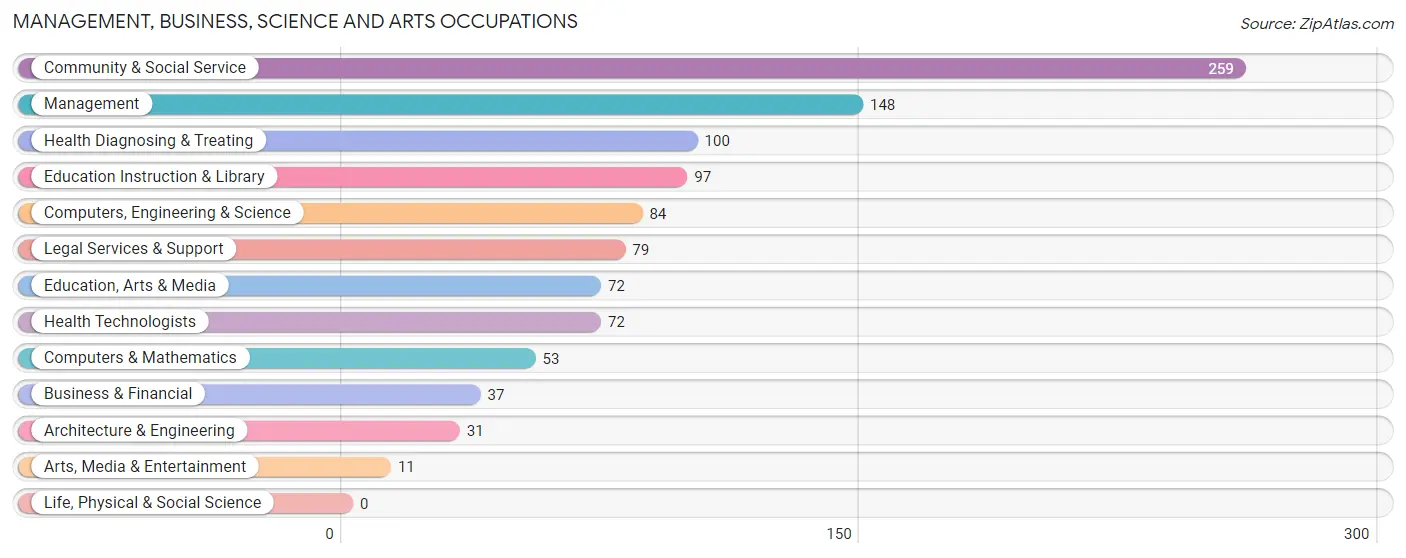
Management, Business, Science and Arts Occupations
The most common Management, Business, Science and Arts occupations in San Augustine County are Community & Social Service (259 | 10.0%), Management (148 | 5.7%), Health Diagnosing & Treating (100 | 3.8%), Education Instruction & Library (97 | 3.7%), and Computers, Engineering & Science (84 | 3.2%).
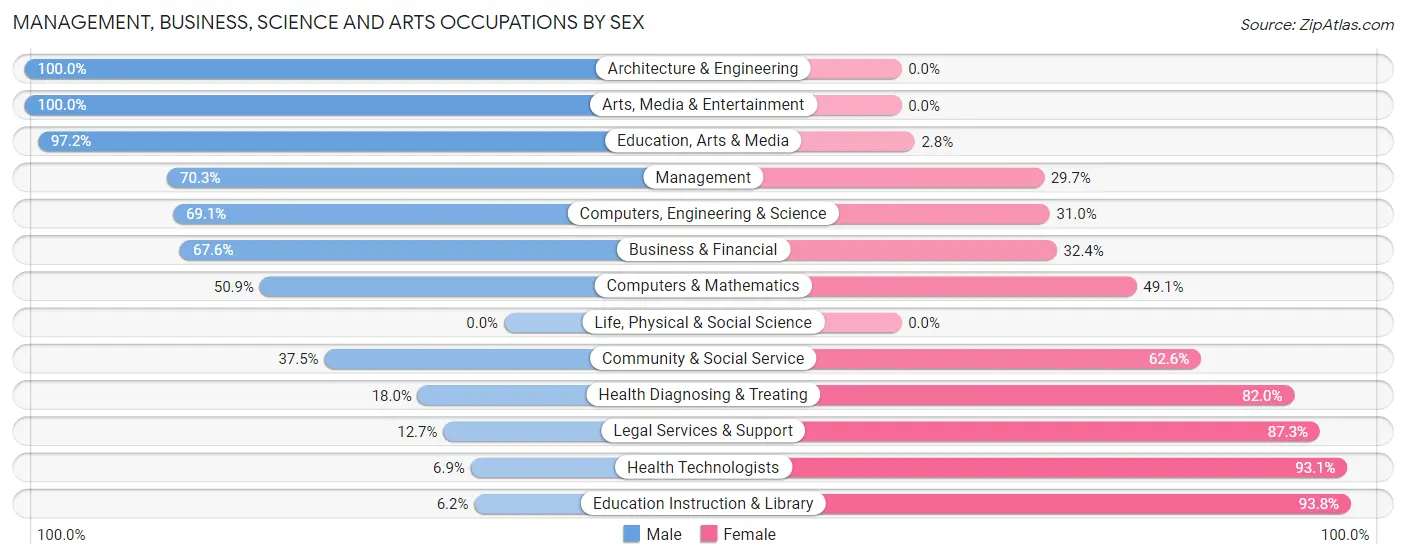
Management, Business, Science and Arts Occupations by Sex
Within the Management, Business, Science and Arts occupations in San Augustine County, the most male-oriented occupations are Architecture & Engineering (100.0%), Arts, Media & Entertainment (100.0%), and Education, Arts & Media (97.2%), while the most female-oriented occupations are Education Instruction & Library (93.8%), Health Technologists (93.1%), and Legal Services & Support (87.3%).
| Occupation | Male | Female |
| Management | 104 (70.3%) | 44 (29.7%) |
| Business & Financial | 25 (67.6%) | 12 (32.4%) |
| Computers, Engineering & Science | 58 (69.1%) | 26 (30.9%) |
| Computers & Mathematics | 27 (50.9%) | 26 (49.1%) |
| Architecture & Engineering | 31 (100.0%) | 0 (0.0%) |
| Life, Physical & Social Science | 0 (0.0%) | 0 (0.0%) |
| Community & Social Service | 97 (37.4%) | 162 (62.5%) |
| Education, Arts & Media | 70 (97.2%) | 2 (2.8%) |
| Legal Services & Support | 10 (12.7%) | 69 (87.3%) |
| Education Instruction & Library | 6 (6.2%) | 91 (93.8%) |
| Arts, Media & Entertainment | 11 (100.0%) | 0 (0.0%) |
| Health Diagnosing & Treating | 18 (18.0%) | 82 (82.0%) |
| Health Technologists | 5 (6.9%) | 67 (93.1%) |
| Total (Category) | 302 (48.1%) | 326 (51.9%) |
| Total (Overall) | 1,331 (51.2%) | 1,268 (48.8%) |
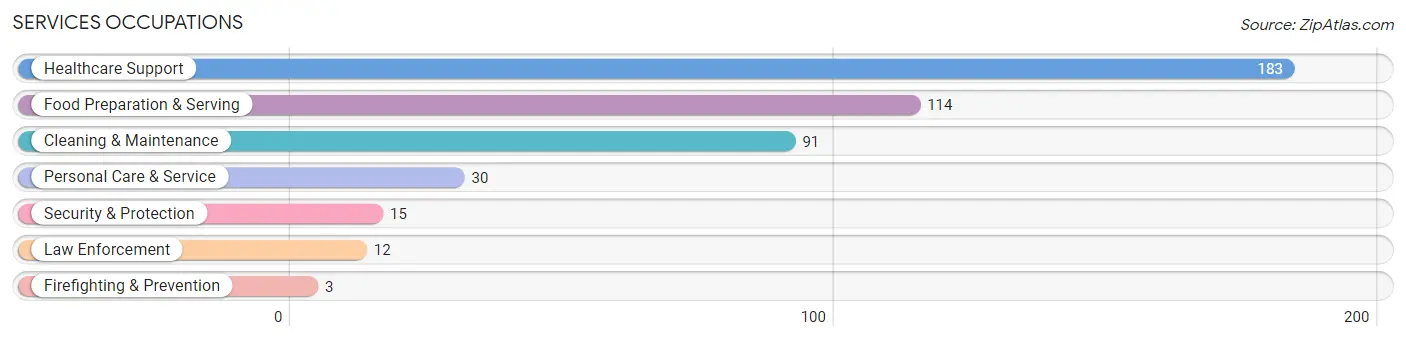
Services Occupations
The most common Services occupations in San Augustine County are Healthcare Support (183 | 7.0%), Food Preparation & Serving (114 | 4.4%), Cleaning & Maintenance (91 | 3.5%), Personal Care & Service (30 | 1.1%), and Security & Protection (15 | 0.6%).
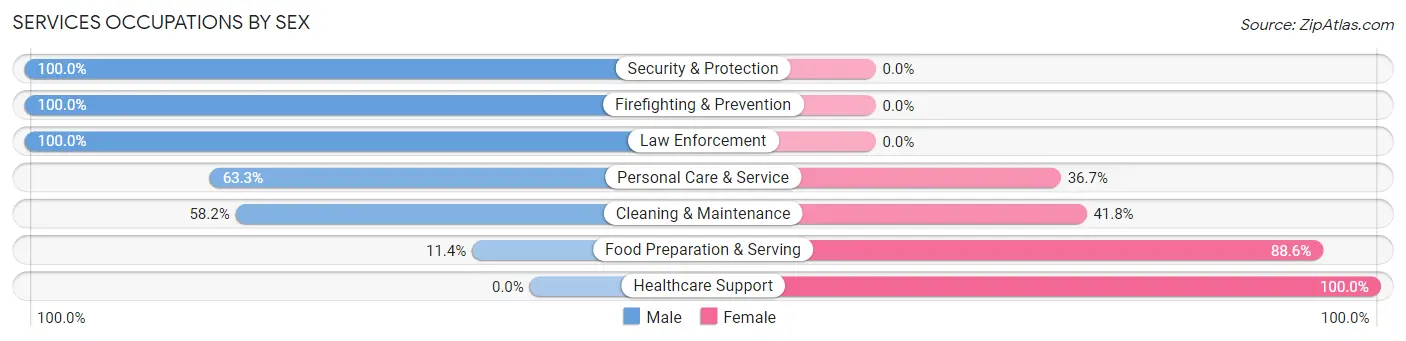
Services Occupations by Sex
Within the Services occupations in San Augustine County, the most male-oriented occupations are Security & Protection (100.0%), Firefighting & Prevention (100.0%), and Law Enforcement (100.0%), while the most female-oriented occupations are Healthcare Support (100.0%), Food Preparation & Serving (88.6%), and Cleaning & Maintenance (41.8%).
| Occupation | Male | Female |
| Healthcare Support | 0 (0.0%) | 183 (100.0%) |
| Security & Protection | 15 (100.0%) | 0 (0.0%) |
| Firefighting & Prevention | 3 (100.0%) | 0 (0.0%) |
| Law Enforcement | 12 (100.0%) | 0 (0.0%) |
| Food Preparation & Serving | 13 (11.4%) | 101 (88.6%) |
| Cleaning & Maintenance | 53 (58.2%) | 38 (41.8%) |
| Personal Care & Service | 19 (63.3%) | 11 (36.7%) |
| Total (Category) | 100 (23.1%) | 333 (76.9%) |
| Total (Overall) | 1,331 (51.2%) | 1,268 (48.8%) |
Sales and Office Occupations
The most common Sales and Office occupations in San Augustine County are Office & Administration (351 | 13.5%), and Sales & Related (205 | 7.9%).
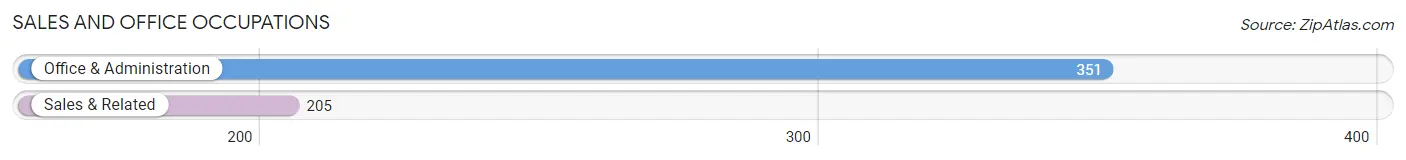
Sales and Office Occupations by Sex
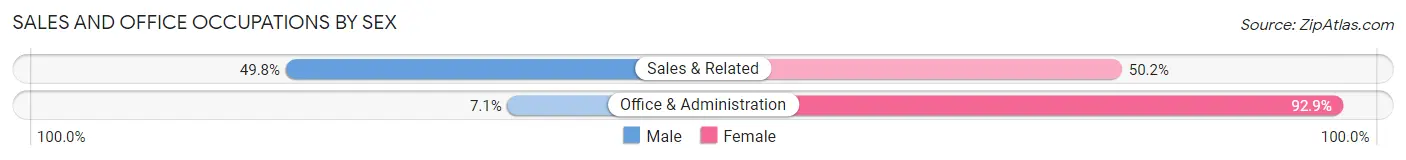
| Occupation | Male | Female |
| Sales & Related | 102 (49.8%) | 103 (50.2%) |
| Office & Administration | 25 (7.1%) | 326 (92.9%) |
| Total (Category) | 127 (22.8%) | 429 (77.2%) |
| Total (Overall) | 1,331 (51.2%) | 1,268 (48.8%) |
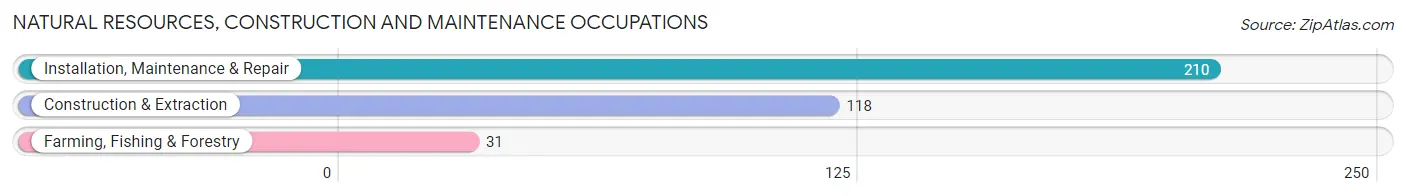
Natural Resources, Construction and Maintenance Occupations
The most common Natural Resources, Construction and Maintenance occupations in San Augustine County are Installation, Maintenance & Repair (210 | 8.1%), Construction & Extraction (118 | 4.5%), and Farming, Fishing & Forestry (31 | 1.2%).
Natural Resources, Construction and Maintenance Occupations by Sex
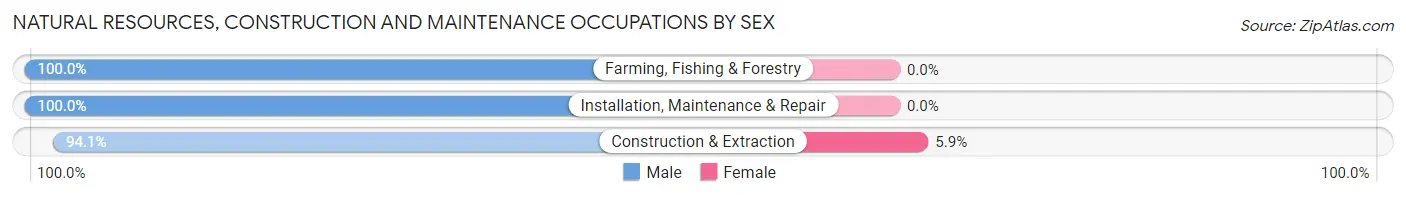
| Occupation | Male | Female |
| Farming, Fishing & Forestry | 31 (100.0%) | 0 (0.0%) |
| Construction & Extraction | 111 (94.1%) | 7 (5.9%) |
| Installation, Maintenance & Repair | 210 (100.0%) | 0 (0.0%) |
| Total (Category) | 352 (98.1%) | 7 (1.9%) |
| Total (Overall) | 1,331 (51.2%) | 1,268 (48.8%) |
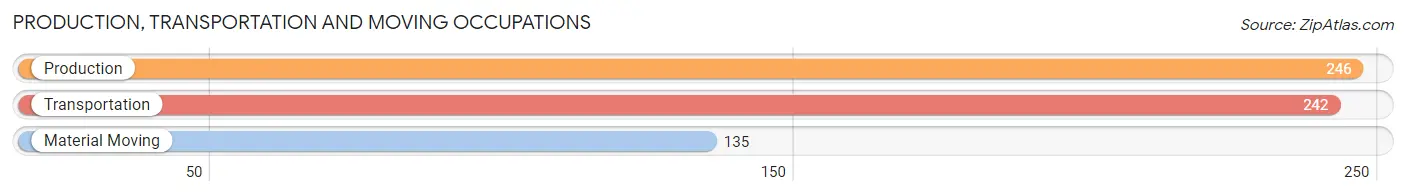
Production, Transportation and Moving Occupations
The most common Production, Transportation and Moving occupations in San Augustine County are Production (246 | 9.5%), Transportation (242 | 9.3%), and Material Moving (135 | 5.2%).
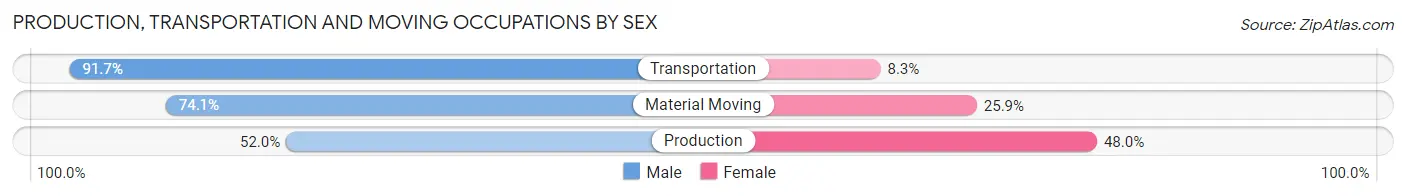
Production, Transportation and Moving Occupations by Sex
| Occupation | Male | Female |
| Production | 128 (52.0%) | 118 (48.0%) |
| Transportation | 222 (91.7%) | 20 (8.3%) |
| Material Moving | 100 (74.1%) | 35 (25.9%) |
| Total (Category) | 450 (72.2%) | 173 (27.8%) |
| Total (Overall) | 1,331 (51.2%) | 1,268 (48.8%) |
Employment Industries by Sex in San Augustine County
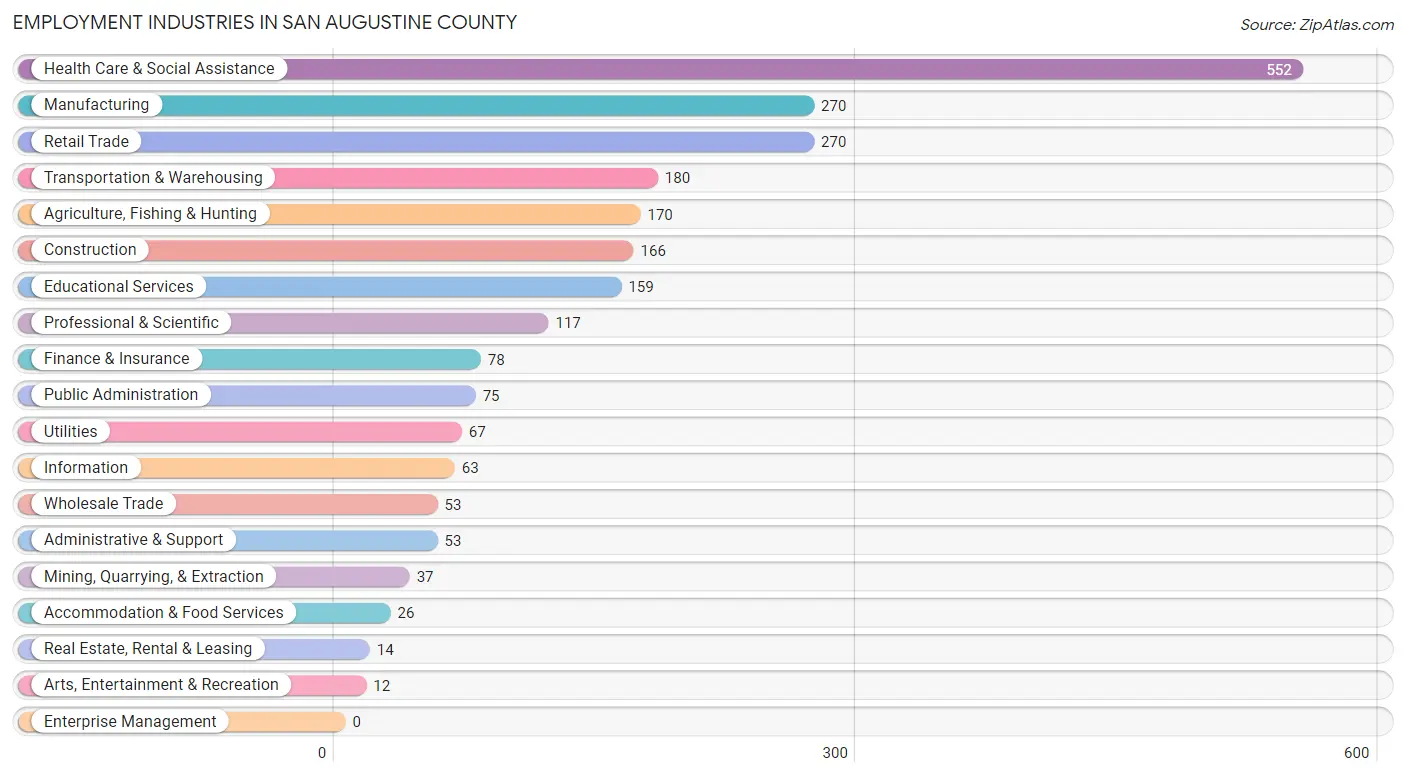
Employment Industries in San Augustine County
The major employment industries in San Augustine County include Health Care & Social Assistance (552 | 21.2%), Manufacturing (270 | 10.4%), Retail Trade (270 | 10.4%), Transportation & Warehousing (180 | 6.9%), and Agriculture, Fishing & Hunting (170 | 6.5%).
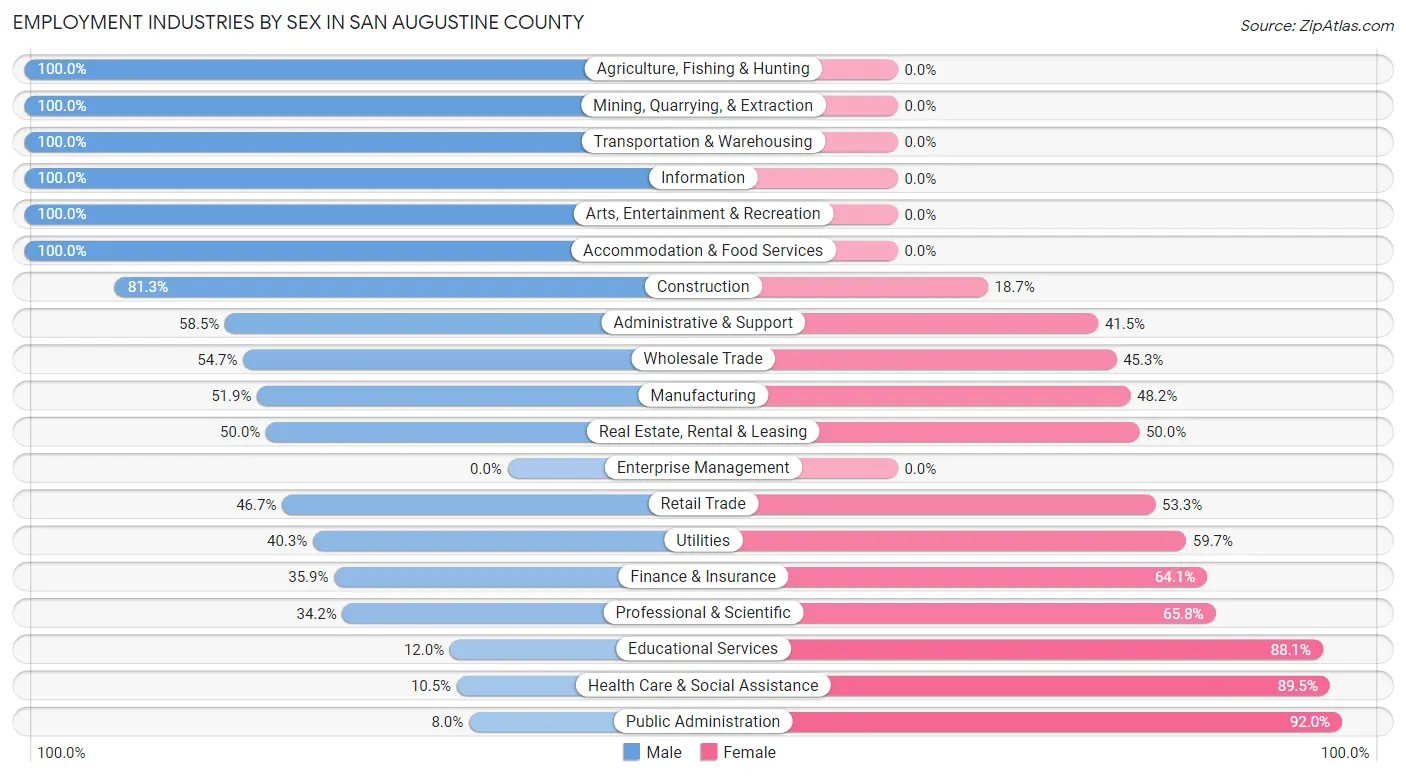
Employment Industries by Sex in San Augustine County
The San Augustine County industries that see more men than women are Agriculture, Fishing & Hunting (100.0%), Mining, Quarrying, & Extraction (100.0%), and Transportation & Warehousing (100.0%), whereas the industries that tend to have a higher number of women are Public Administration (92.0%), Health Care & Social Assistance (89.5%), and Educational Services (88.0%).
| Industry | Male | Female |
| Agriculture, Fishing & Hunting | 170 (100.0%) | 0 (0.0%) |
| Mining, Quarrying, & Extraction | 37 (100.0%) | 0 (0.0%) |
| Construction | 135 (81.3%) | 31 (18.7%) |
| Manufacturing | 140 (51.8%) | 130 (48.1%) |
| Wholesale Trade | 29 (54.7%) | 24 (45.3%) |
| Retail Trade | 126 (46.7%) | 144 (53.3%) |
| Transportation & Warehousing | 180 (100.0%) | 0 (0.0%) |
| Utilities | 27 (40.3%) | 40 (59.7%) |
| Information | 63 (100.0%) | 0 (0.0%) |
| Finance & Insurance | 28 (35.9%) | 50 (64.1%) |
| Real Estate, Rental & Leasing | 7 (50.0%) | 7 (50.0%) |
| Professional & Scientific | 40 (34.2%) | 77 (65.8%) |
| Enterprise Management | 0 (0.0%) | 0 (0.0%) |
| Administrative & Support | 31 (58.5%) | 22 (41.5%) |
| Educational Services | 19 (11.9%) | 140 (88.0%) |
| Health Care & Social Assistance | 58 (10.5%) | 494 (89.5%) |
| Arts, Entertainment & Recreation | 12 (100.0%) | 0 (0.0%) |
| Accommodation & Food Services | 26 (100.0%) | 0 (0.0%) |
| Public Administration | 6 (8.0%) | 69 (92.0%) |
| Total | 1,331 (51.2%) | 1,268 (48.8%) |
Education in San Augustine County
School Enrollment in San Augustine County
The most common levels of schooling among the 1,676 students in San Augustine County are high school (455 | 27.2%), middle school (429 | 25.6%), and elementary school (414 | 24.7%).
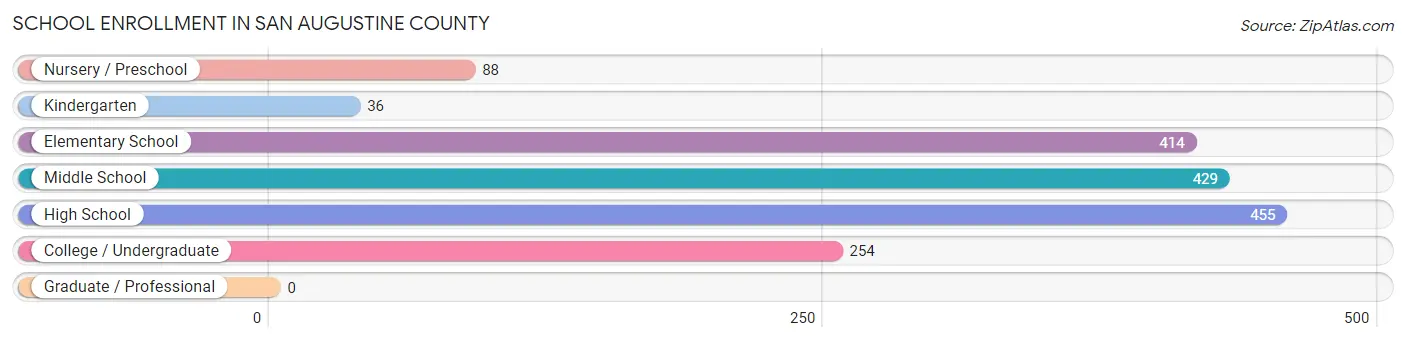
| School Level | # Students | % Students |
| Nursery / Preschool | 88 | 5.2% |
| Kindergarten | 36 | 2.1% |
| Elementary School | 414 | 24.7% |
| Middle School | 429 | 25.6% |
| High School | 455 | 27.2% |
| College / Undergraduate | 254 | 15.2% |
| Graduate / Professional | 0 | 0.0% |
| Total | 1,676 | 100.0% |
School Enrollment by Age by Funding Source in San Augustine County
Out of a total of 1,676 students who are enrolled in schools in San Augustine County, 178 (10.6%) attend a private institution, while the remaining 1,498 (89.4%) are enrolled in public schools. The age group of 35 years and over has the highest likelihood of being enrolled in private schools, with 63 (77.8% in the age bracket) enrolled. Conversely, the age group of 3 to 4 year olds has the lowest likelihood of being enrolled in a private school, with 83 (100.0% in the age bracket) attending a public institution.
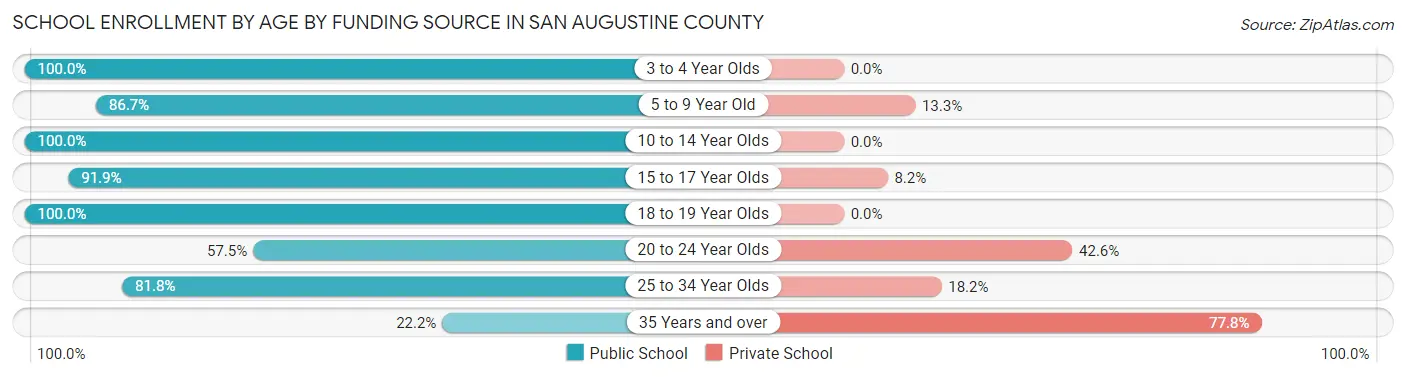
| Age Bracket | Public School | Private School |
| 3 to 4 Year Olds | 83 (100.0%) | 0 (0.0%) |
| 5 to 9 Year Old | 307 (86.7%) | 47 (13.3%) |
| 10 to 14 Year Olds | 572 (100.0%) | 0 (0.0%) |
| 15 to 17 Year Olds | 248 (91.8%) | 22 (8.2%) |
| 18 to 19 Year Olds | 189 (100.0%) | 0 (0.0%) |
| 20 to 24 Year Olds | 54 (57.5%) | 40 (42.5%) |
| 25 to 34 Year Olds | 27 (81.8%) | 6 (18.2%) |
| 35 Years and over | 18 (22.2%) | 63 (77.8%) |
| Total | 1,498 (89.4%) | 178 (10.6%) |
Educational Attainment by Field of Study in San Augustine County
Education (196 | 25.8%), business (176 | 23.1%), liberal arts & history (76 | 10.0%), bio, nature & agricultural (55 | 7.2%), and arts & humanities (47 | 6.2%) are the most common fields of study among 761 individuals in San Augustine County who have obtained a bachelor's degree or higher.
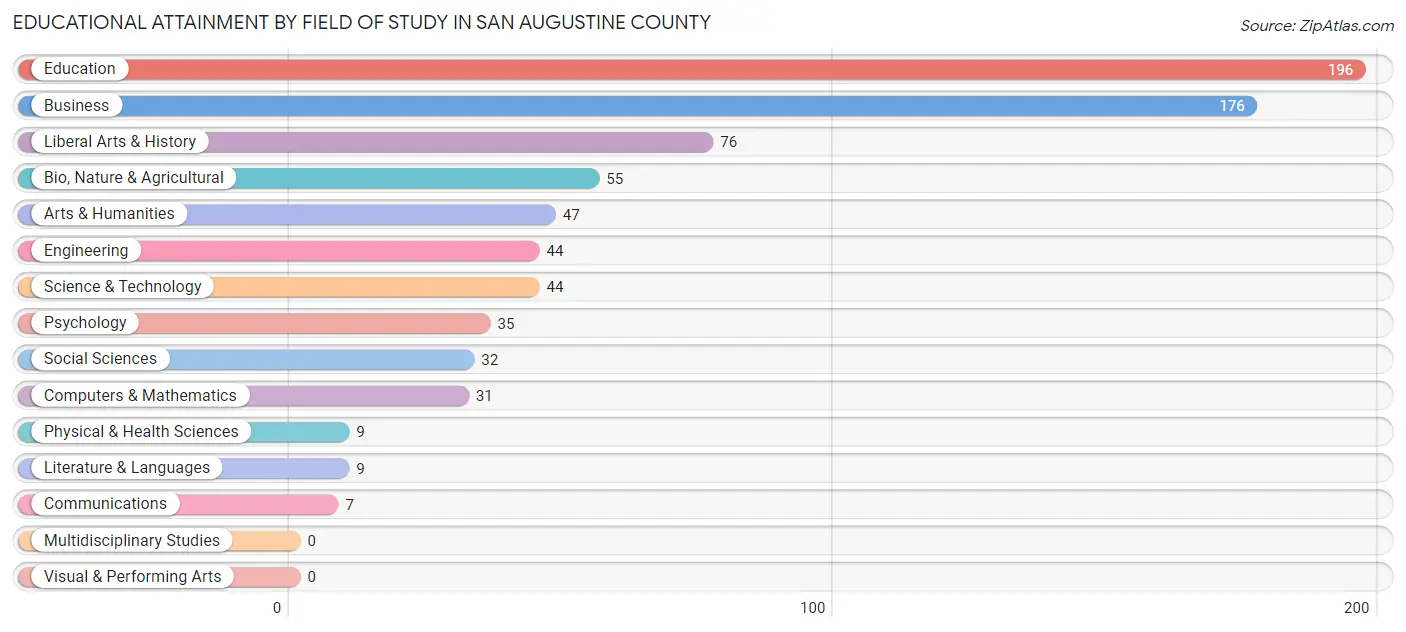
| Field of Study | # Graduates | % Graduates |
| Computers & Mathematics | 31 | 4.1% |
| Bio, Nature & Agricultural | 55 | 7.2% |
| Physical & Health Sciences | 9 | 1.2% |
| Psychology | 35 | 4.6% |
| Social Sciences | 32 | 4.2% |
| Engineering | 44 | 5.8% |
| Multidisciplinary Studies | 0 | 0.0% |
| Science & Technology | 44 | 5.8% |
| Business | 176 | 23.1% |
| Education | 196 | 25.8% |
| Literature & Languages | 9 | 1.2% |
| Liberal Arts & History | 76 | 10.0% |
| Visual & Performing Arts | 0 | 0.0% |
| Communications | 7 | 0.9% |
| Arts & Humanities | 47 | 6.2% |
| Total | 761 | 100.0% |
Transportation & Commute in San Augustine County
Vehicle Availability by Sex in San Augustine County
The most prevalent vehicle ownership categories in San Augustine County are males with 2 vehicles (644, accounting for 48.9%) and females with 2 vehicles (505, making up 50.8%).
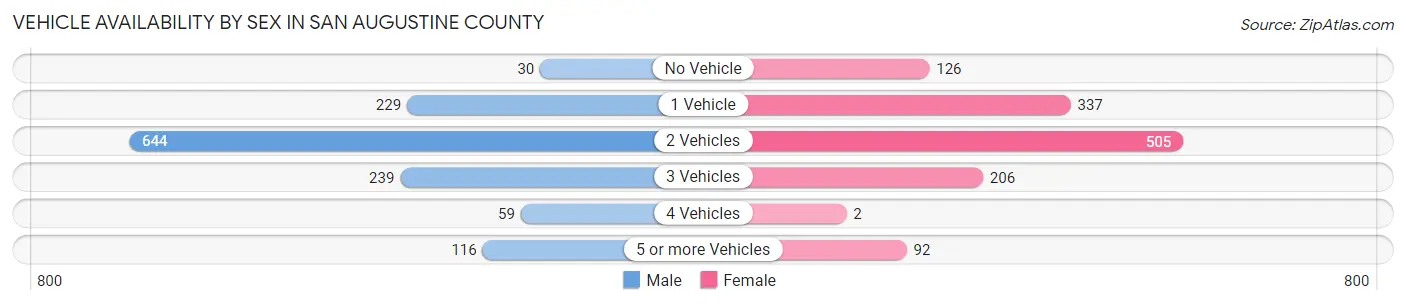
| Vehicles Available | Male | Female |
| No Vehicle | 30 (2.3%) | 126 (9.9%) |
| 1 Vehicle | 229 (17.4%) | 337 (26.6%) |
| 2 Vehicles | 644 (48.9%) | 505 (39.8%) |
| 3 Vehicles | 239 (18.1%) | 206 (16.3%) |
| 4 Vehicles | 59 (4.5%) | 2 (0.2%) |
| 5 or more Vehicles | 116 (8.8%) | 92 (7.3%) |
| Total | 1,317 (100.0%) | 1,268 (100.0%) |
Commute Time in San Augustine County
The most frequently occuring commute durations in San Augustine County are less than 5 minutes (358 commuters, 14.6%), 10 to 14 minutes (354 commuters, 14.5%), and 30 to 34 minutes (311 commuters, 12.7%).
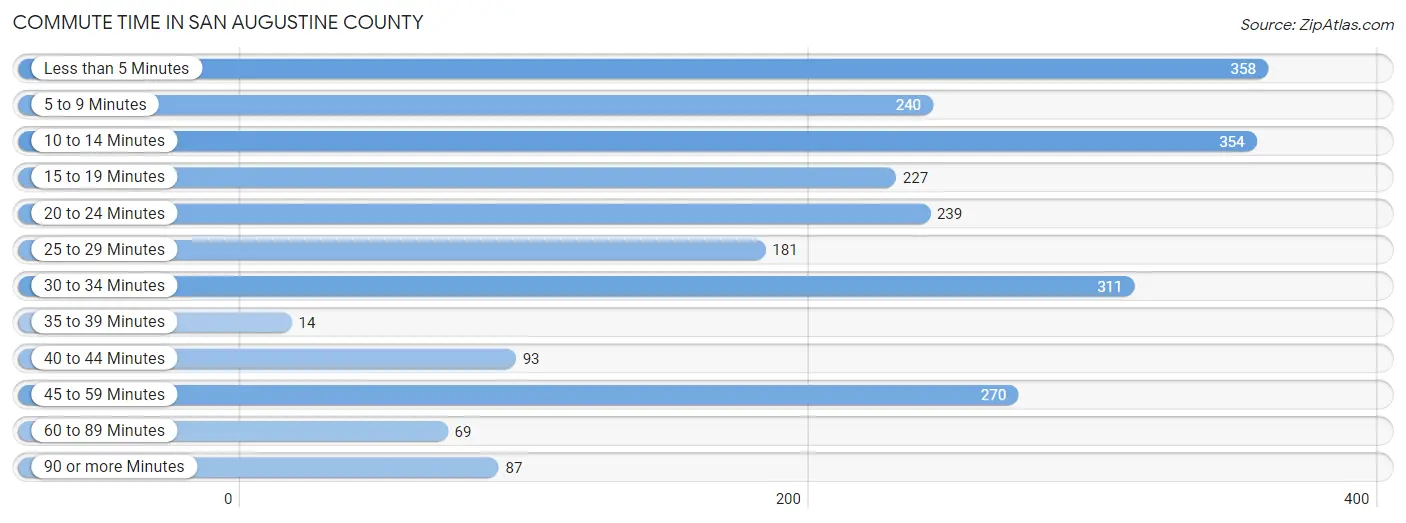
| Commute Time | # Commuters | % Commuters |
| Less than 5 Minutes | 358 | 14.6% |
| 5 to 9 Minutes | 240 | 9.8% |
| 10 to 14 Minutes | 354 | 14.5% |
| 15 to 19 Minutes | 227 | 9.3% |
| 20 to 24 Minutes | 239 | 9.8% |
| 25 to 29 Minutes | 181 | 7.4% |
| 30 to 34 Minutes | 311 | 12.7% |
| 35 to 39 Minutes | 14 | 0.6% |
| 40 to 44 Minutes | 93 | 3.8% |
| 45 to 59 Minutes | 270 | 11.1% |
| 60 to 89 Minutes | 69 | 2.8% |
| 90 or more Minutes | 87 | 3.6% |
Commute Time by Sex in San Augustine County
The most common commute times in San Augustine County are 30 to 34 minutes (196 commuters, 15.8%) for males and 10 to 14 minutes (252 commuters, 21.0%) for females.
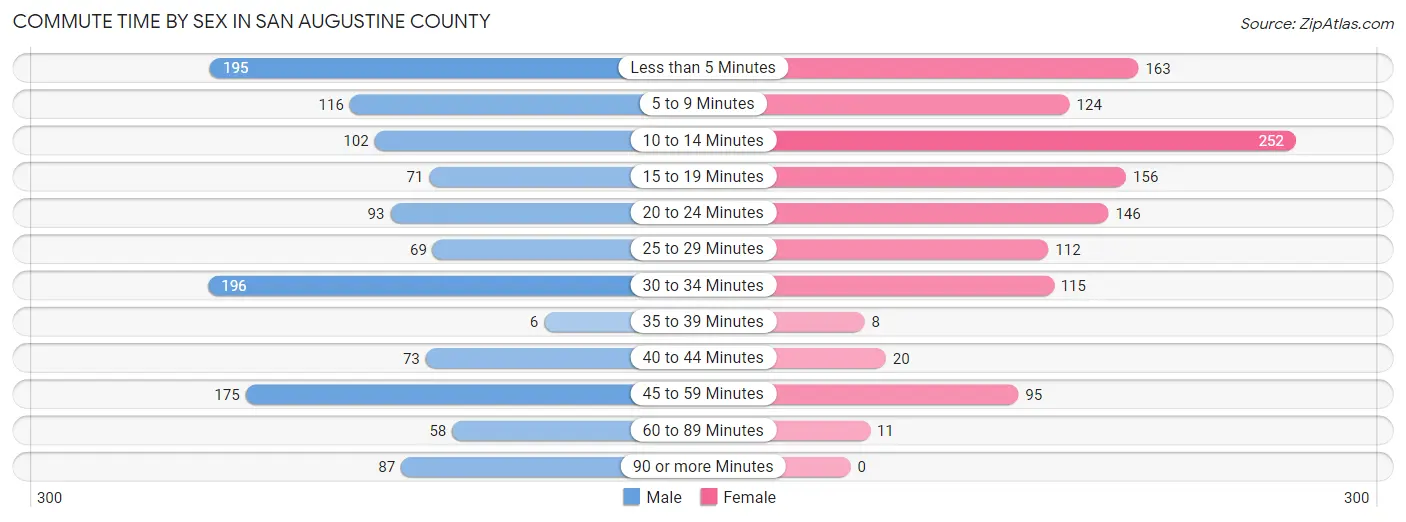
| Commute Time | Male | Female |
| Less than 5 Minutes | 195 (15.7%) | 163 (13.6%) |
| 5 to 9 Minutes | 116 (9.3%) | 124 (10.3%) |
| 10 to 14 Minutes | 102 (8.2%) | 252 (21.0%) |
| 15 to 19 Minutes | 71 (5.7%) | 156 (13.0%) |
| 20 to 24 Minutes | 93 (7.5%) | 146 (12.1%) |
| 25 to 29 Minutes | 69 (5.6%) | 112 (9.3%) |
| 30 to 34 Minutes | 196 (15.8%) | 115 (9.6%) |
| 35 to 39 Minutes | 6 (0.5%) | 8 (0.7%) |
| 40 to 44 Minutes | 73 (5.9%) | 20 (1.7%) |
| 45 to 59 Minutes | 175 (14.1%) | 95 (7.9%) |
| 60 to 89 Minutes | 58 (4.7%) | 11 (0.9%) |
| 90 or more Minutes | 87 (7.0%) | 0 (0.0%) |
Time of Departure to Work by Sex in San Augustine County
The most frequent times of departure to work in San Augustine County are 6:00 AM to 6:29 AM (233, 18.8%) for males and 7:30 AM to 7:59 AM (320, 26.6%) for females.
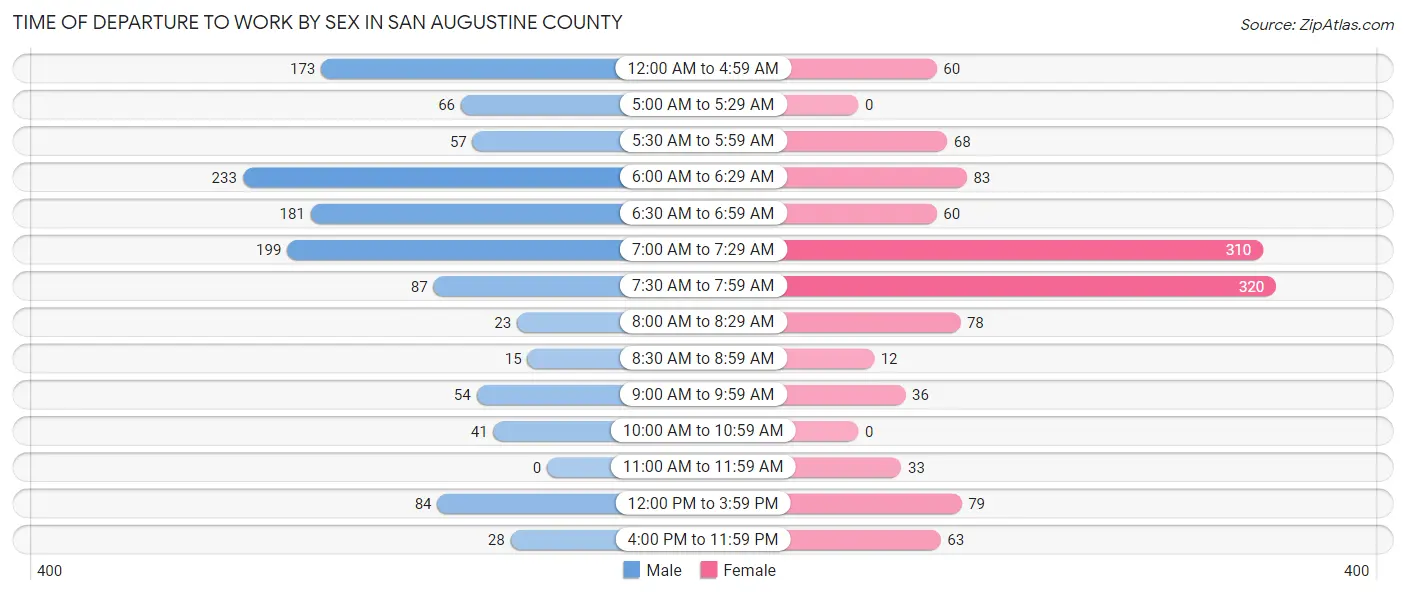
| Time of Departure | Male | Female |
| 12:00 AM to 4:59 AM | 173 (13.9%) | 60 (5.0%) |
| 5:00 AM to 5:29 AM | 66 (5.3%) | 0 (0.0%) |
| 5:30 AM to 5:59 AM | 57 (4.6%) | 68 (5.7%) |
| 6:00 AM to 6:29 AM | 233 (18.8%) | 83 (6.9%) |
| 6:30 AM to 6:59 AM | 181 (14.6%) | 60 (5.0%) |
| 7:00 AM to 7:29 AM | 199 (16.0%) | 310 (25.8%) |
| 7:30 AM to 7:59 AM | 87 (7.0%) | 320 (26.6%) |
| 8:00 AM to 8:29 AM | 23 (1.8%) | 78 (6.5%) |
| 8:30 AM to 8:59 AM | 15 (1.2%) | 12 (1.0%) |
| 9:00 AM to 9:59 AM | 54 (4.3%) | 36 (3.0%) |
| 10:00 AM to 10:59 AM | 41 (3.3%) | 0 (0.0%) |
| 11:00 AM to 11:59 AM | 0 (0.0%) | 33 (2.8%) |
| 12:00 PM to 3:59 PM | 84 (6.8%) | 79 (6.6%) |
| 4:00 PM to 11:59 PM | 28 (2.3%) | 63 (5.2%) |
| Total | 1,241 (100.0%) | 1,202 (100.0%) |
Housing Occupancy in San Augustine County
Occupancy by Ownership in San Augustine County
Of the total 3,051 dwellings in San Augustine County, owner-occupied units account for 2,212 (72.5%), while renter-occupied units make up 839 (27.5%).
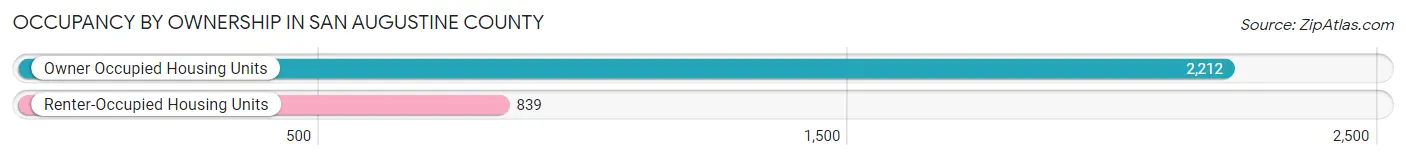
| Occupancy | # Housing Units | % Housing Units |
| Owner Occupied Housing Units | 2,212 | 72.5% |
| Renter-Occupied Housing Units | 839 | 27.5% |
| Total Occupied Housing Units | 3,051 | 100.0% |
Occupancy by Household Size in San Augustine County
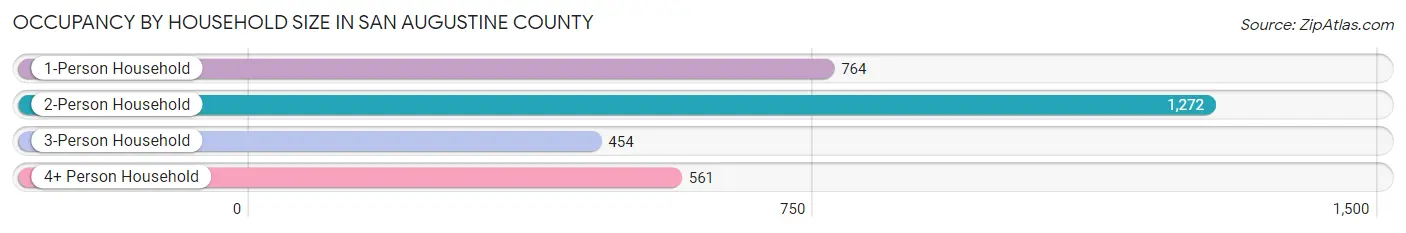
| Household Size | # Housing Units | % Housing Units |
| 1-Person Household | 764 | 25.0% |
| 2-Person Household | 1,272 | 41.7% |
| 3-Person Household | 454 | 14.9% |
| 4+ Person Household | 561 | 18.4% |
| Total Housing Units | 3,051 | 100.0% |
Occupancy by Ownership by Household Size in San Augustine County
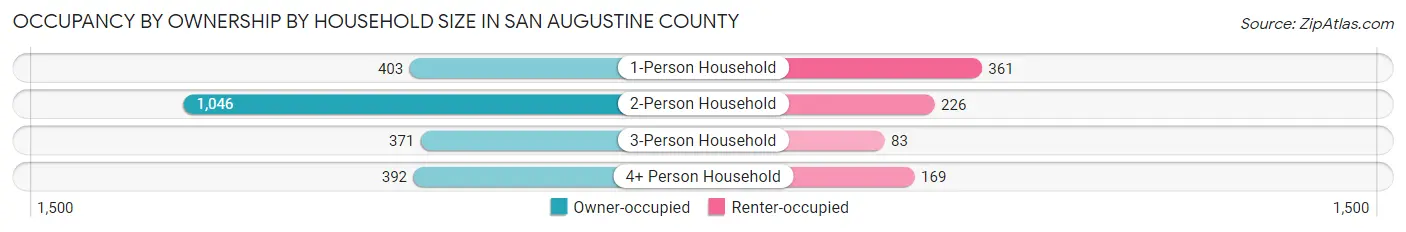
| Household Size | Owner-occupied | Renter-occupied |
| 1-Person Household | 403 (52.7%) | 361 (47.2%) |
| 2-Person Household | 1,046 (82.2%) | 226 (17.8%) |
| 3-Person Household | 371 (81.7%) | 83 (18.3%) |
| 4+ Person Household | 392 (69.9%) | 169 (30.1%) |
| Total Housing Units | 2,212 (72.5%) | 839 (27.5%) |
Occupancy by Educational Attainment in San Augustine County
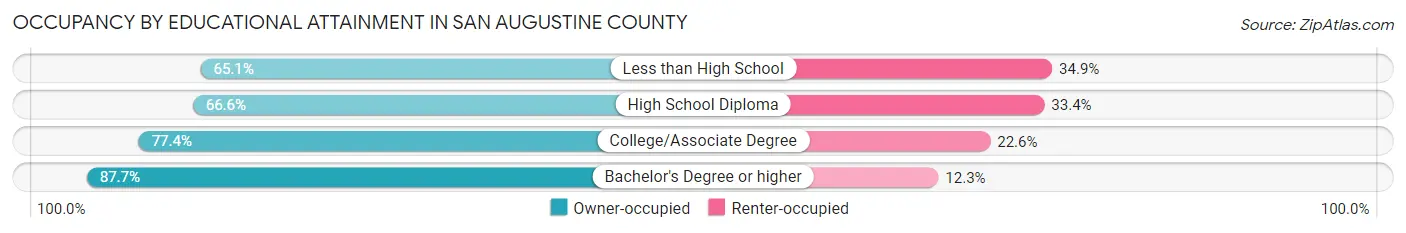
| Household Size | Owner-occupied | Renter-occupied |
| Less than High School | 377 (65.1%) | 202 (34.9%) |
| High School Diploma | 787 (66.6%) | 394 (33.4%) |
| College/Associate Degree | 629 (77.4%) | 184 (22.6%) |
| Bachelor's Degree or higher | 419 (87.7%) | 59 (12.3%) |
Occupancy by Age of Householder in San Augustine County
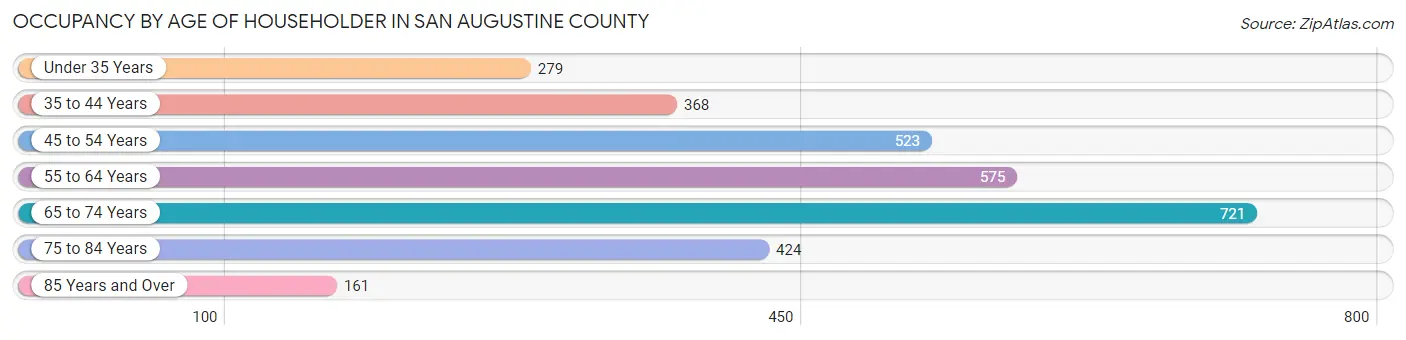
| Age Bracket | # Households | % Households |
| Under 35 Years | 279 | 9.1% |
| 35 to 44 Years | 368 | 12.1% |
| 45 to 54 Years | 523 | 17.1% |
| 55 to 64 Years | 575 | 18.9% |
| 65 to 74 Years | 721 | 23.6% |
| 75 to 84 Years | 424 | 13.9% |
| 85 Years and Over | 161 | 5.3% |
| Total | 3,051 | 100.0% |
Housing Finances in San Augustine County
Median Income by Occupancy in San Augustine County
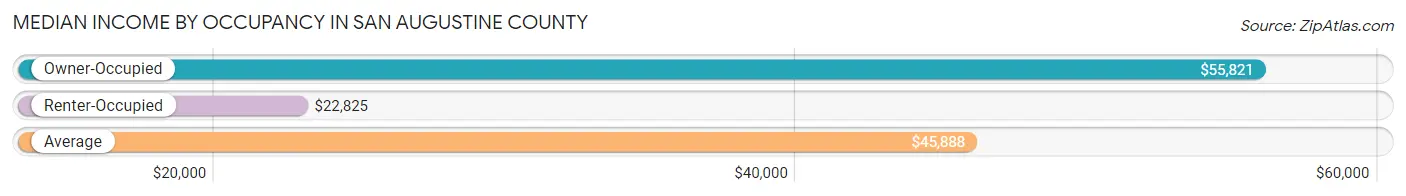
| Occupancy Type | # Households | Median Income |
| Owner-Occupied | 2,212 (72.5%) | $55,821 |
| Renter-Occupied | 839 (27.5%) | $22,825 |
| Average | 3,051 (100.0%) | $45,888 |
Occupancy by Householder Income Bracket in San Augustine County
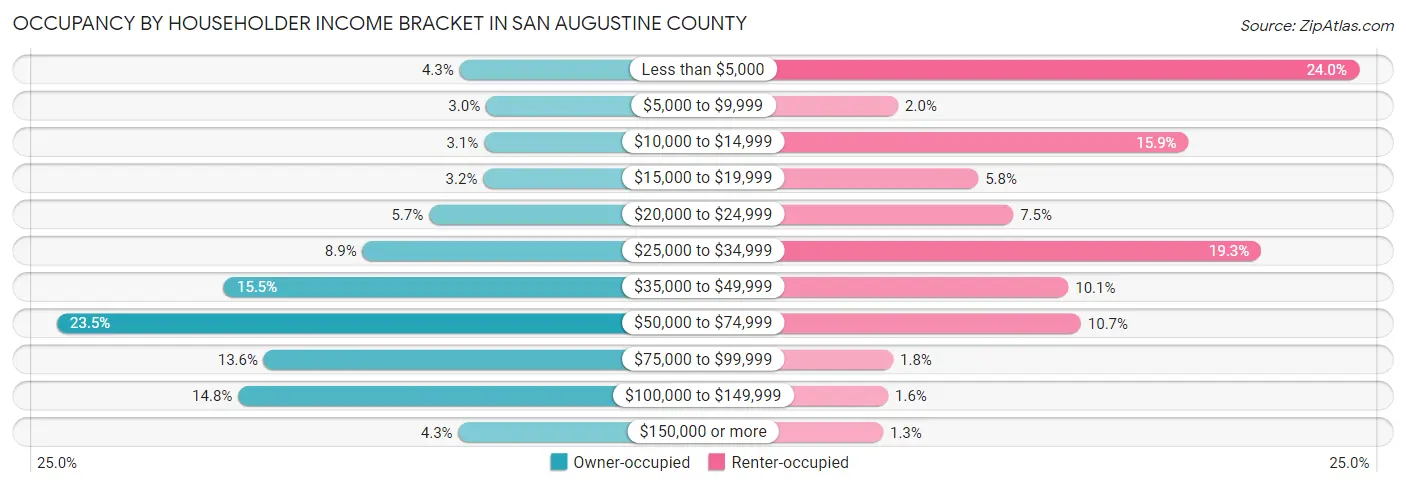
| Income Bracket | Owner-occupied | Renter-occupied |
| Less than $5,000 | 95 (4.3%) | 201 (24.0%) |
| $5,000 to $9,999 | 67 (3.0%) | 17 (2.0%) |
| $10,000 to $14,999 | 69 (3.1%) | 133 (15.9%) |
| $15,000 to $19,999 | 70 (3.2%) | 49 (5.8%) |
| $20,000 to $24,999 | 127 (5.7%) | 63 (7.5%) |
| $25,000 to $34,999 | 197 (8.9%) | 162 (19.3%) |
| $35,000 to $49,999 | 343 (15.5%) | 85 (10.1%) |
| $50,000 to $74,999 | 519 (23.5%) | 90 (10.7%) |
| $75,000 to $99,999 | 301 (13.6%) | 15 (1.8%) |
| $100,000 to $149,999 | 328 (14.8%) | 13 (1.5%) |
| $150,000 or more | 96 (4.3%) | 11 (1.3%) |
| Total | 2,212 (100.0%) | 839 (100.0%) |
Monthly Housing Cost Tiers in San Augustine County
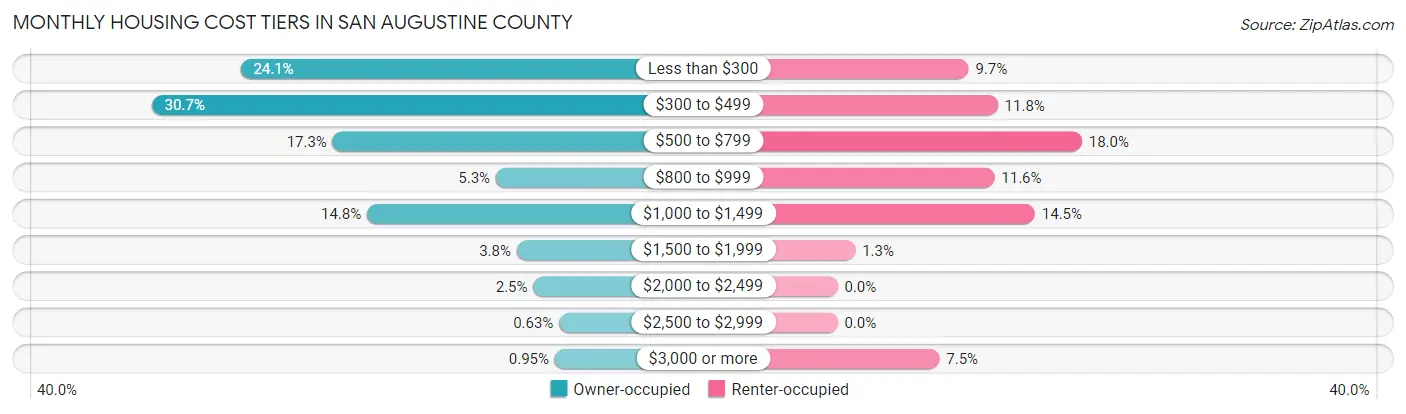
| Monthly Cost | Owner-occupied | Renter-occupied |
| Less than $300 | 533 (24.1%) | 81 (9.7%) |
| $300 to $499 | 678 (30.6%) | 99 (11.8%) |
| $500 to $799 | 383 (17.3%) | 151 (18.0%) |
| $800 to $999 | 117 (5.3%) | 97 (11.6%) |
| $1,000 to $1,499 | 327 (14.8%) | 122 (14.5%) |
| $1,500 to $1,999 | 83 (3.7%) | 11 (1.3%) |
| $2,000 to $2,499 | 56 (2.5%) | 0 (0.0%) |
| $2,500 to $2,999 | 14 (0.6%) | 0 (0.0%) |
| $3,000 or more | 21 (0.9%) | 63 (7.5%) |
| Total | 2,212 (100.0%) | 839 (100.0%) |
Physical Housing Characteristics in San Augustine County
Housing Structures in San Augustine County
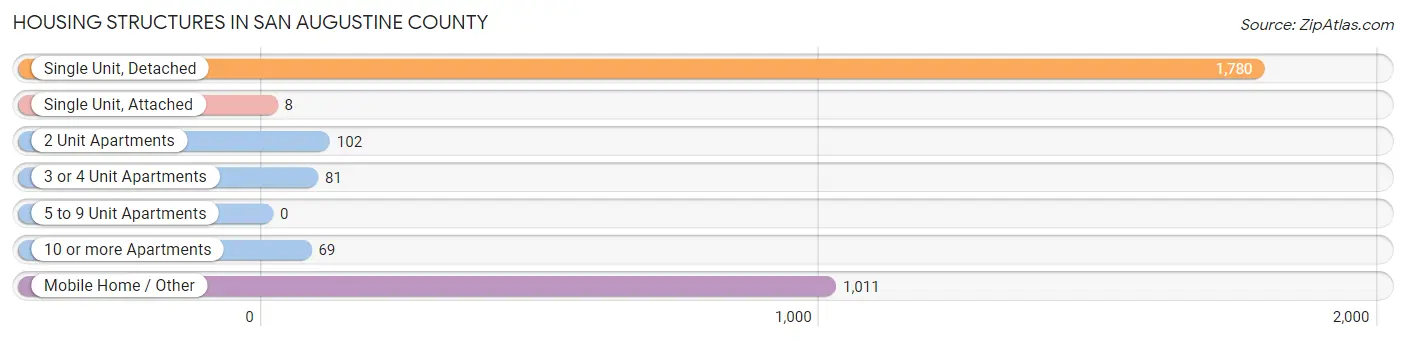
| Structure Type | # Housing Units | % Housing Units |
| Single Unit, Detached | 1,780 | 58.3% |
| Single Unit, Attached | 8 | 0.3% |
| 2 Unit Apartments | 102 | 3.3% |
| 3 or 4 Unit Apartments | 81 | 2.6% |
| 5 to 9 Unit Apartments | 0 | 0.0% |
| 10 or more Apartments | 69 | 2.3% |
| Mobile Home / Other | 1,011 | 33.1% |
| Total | 3,051 | 100.0% |
Housing Structures by Occupancy in San Augustine County
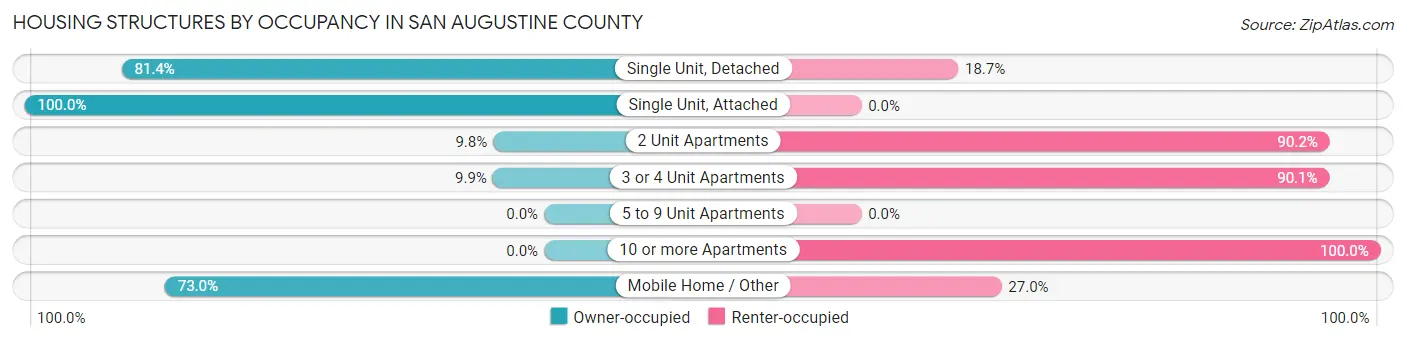
| Structure Type | Owner-occupied | Renter-occupied |
| Single Unit, Detached | 1,448 (81.4%) | 332 (18.6%) |
| Single Unit, Attached | 8 (100.0%) | 0 (0.0%) |
| 2 Unit Apartments | 10 (9.8%) | 92 (90.2%) |
| 3 or 4 Unit Apartments | 8 (9.9%) | 73 (90.1%) |
| 5 to 9 Unit Apartments | 0 (0.0%) | 0 (0.0%) |
| 10 or more Apartments | 0 (0.0%) | 69 (100.0%) |
| Mobile Home / Other | 738 (73.0%) | 273 (27.0%) |
| Total | 2,212 (72.5%) | 839 (27.5%) |
Housing Structures by Number of Rooms in San Augustine County
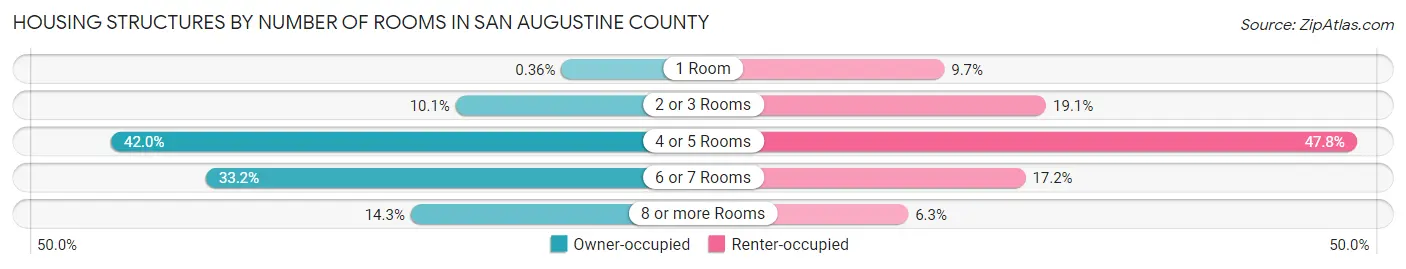
| Number of Rooms | Owner-occupied | Renter-occupied |
| 1 Room | 8 (0.4%) | 81 (9.7%) |
| 2 or 3 Rooms | 224 (10.1%) | 160 (19.1%) |
| 4 or 5 Rooms | 929 (42.0%) | 401 (47.8%) |
| 6 or 7 Rooms | 735 (33.2%) | 144 (17.2%) |
| 8 or more Rooms | 316 (14.3%) | 53 (6.3%) |
| Total | 2,212 (100.0%) | 839 (100.0%) |
Housing Structure by Heating Type in San Augustine County
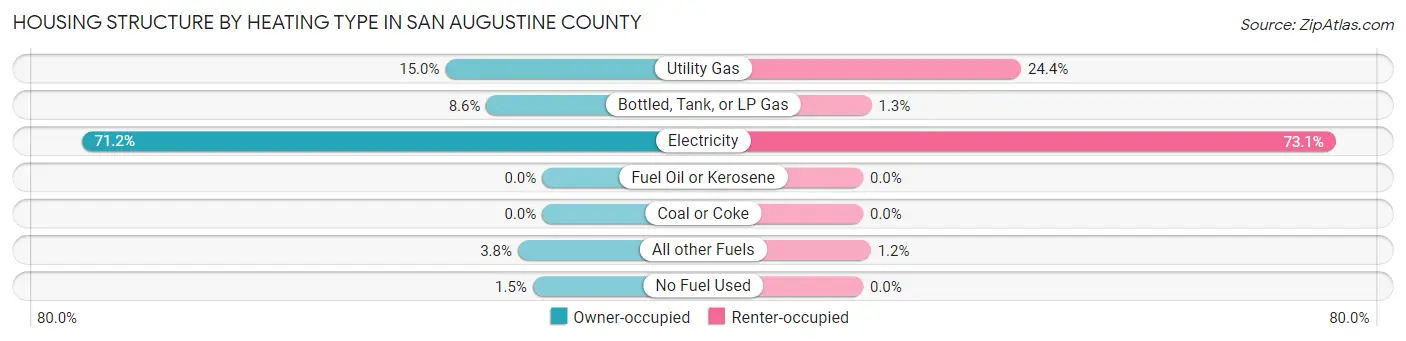
| Heating Type | Owner-occupied | Renter-occupied |
| Utility Gas | 331 (15.0%) | 205 (24.4%) |
| Bottled, Tank, or LP Gas | 191 (8.6%) | 11 (1.3%) |
| Electricity | 1,575 (71.2%) | 613 (73.1%) |
| Fuel Oil or Kerosene | 0 (0.0%) | 0 (0.0%) |
| Coal or Coke | 0 (0.0%) | 0 (0.0%) |
| All other Fuels | 83 (3.7%) | 10 (1.2%) |
| No Fuel Used | 32 (1.5%) | 0 (0.0%) |
| Total | 2,212 (100.0%) | 839 (100.0%) |
Household Vehicle Usage in San Augustine County
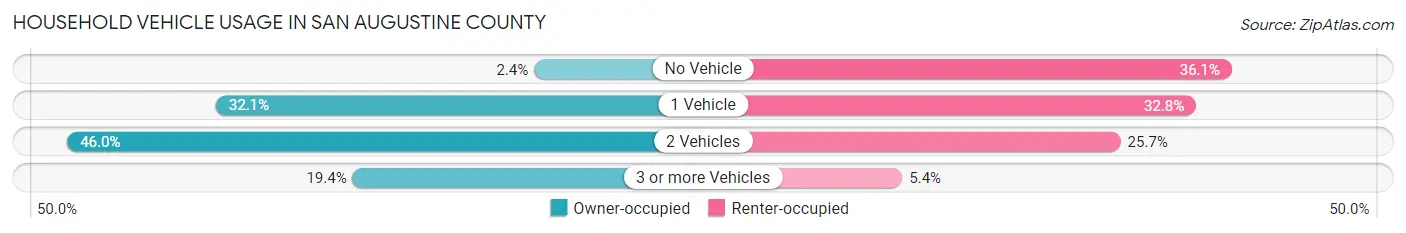
| Vehicles per Household | Owner-occupied | Renter-occupied |
| No Vehicle | 54 (2.4%) | 303 (36.1%) |
| 1 Vehicle | 711 (32.1%) | 275 (32.8%) |
| 2 Vehicles | 1,018 (46.0%) | 216 (25.7%) |
| 3 or more Vehicles | 429 (19.4%) | 45 (5.4%) |
| Total | 2,212 (100.0%) | 839 (100.0%) |
Real Estate & Mortgages in San Augustine County
Real Estate and Mortgage Overview in San Augustine County
| Characteristic | Without Mortgage | With Mortgage |
| Housing Units | 1,589 | 623 |
| Median Property Value | $68,100 | $87,600 |
| Median Household Income | $47,261 | $73 |
| Monthly Housing Costs | $367 | $21 |
| Real Estate Taxes | $523 | $19 |
Property Value by Mortgage Status in San Augustine County
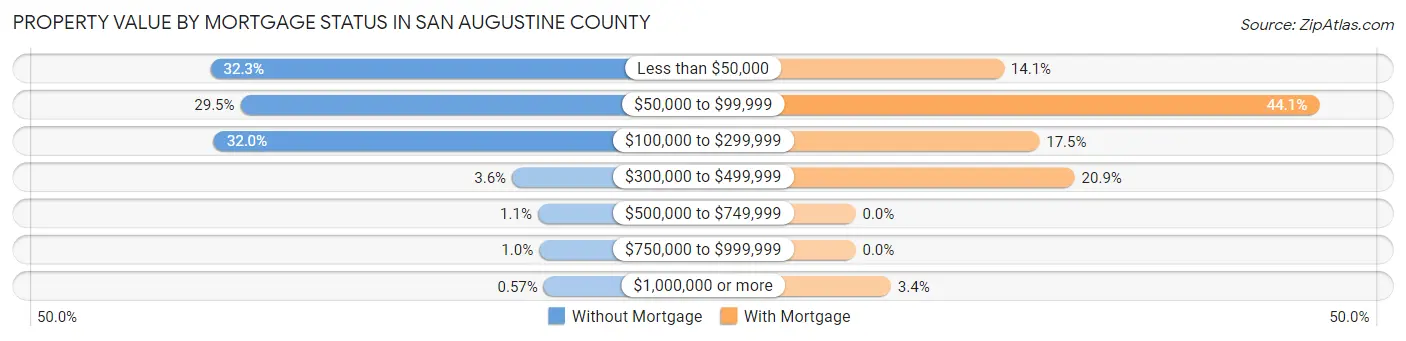
| Property Value | Without Mortgage | With Mortgage |
| Less than $50,000 | 513 (32.3%) | 88 (14.1%) |
| $50,000 to $99,999 | 468 (29.4%) | 275 (44.1%) |
| $100,000 to $299,999 | 508 (32.0%) | 109 (17.5%) |
| $300,000 to $499,999 | 57 (3.6%) | 130 (20.9%) |
| $500,000 to $749,999 | 18 (1.1%) | 0 (0.0%) |
| $750,000 to $999,999 | 16 (1.0%) | 0 (0.0%) |
| $1,000,000 or more | 9 (0.6%) | 21 (3.4%) |
| Total | 1,589 (100.0%) | 623 (100.0%) |
Household Income by Mortgage Status in San Augustine County
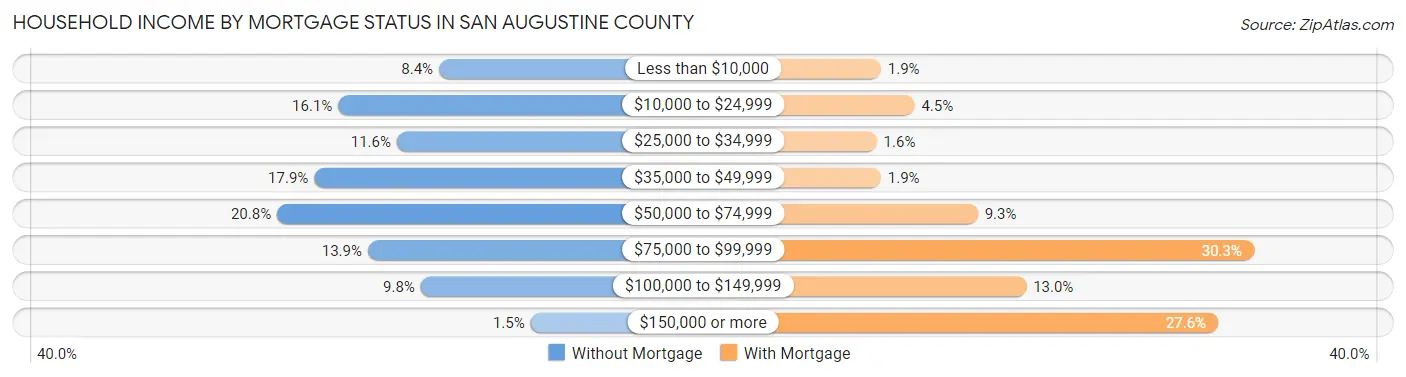
| Household Income | Without Mortgage | With Mortgage |
| Less than $10,000 | 134 (8.4%) | 12 (1.9%) |
| $10,000 to $24,999 | 256 (16.1%) | 28 (4.5%) |
| $25,000 to $34,999 | 185 (11.6%) | 10 (1.6%) |
| $35,000 to $49,999 | 285 (17.9%) | 12 (1.9%) |
| $50,000 to $74,999 | 330 (20.8%) | 58 (9.3%) |
| $75,000 to $99,999 | 220 (13.9%) | 189 (30.3%) |
| $100,000 to $149,999 | 156 (9.8%) | 81 (13.0%) |
| $150,000 or more | 23 (1.5%) | 172 (27.6%) |
| Total | 1,589 (100.0%) | 623 (100.0%) |
Property Value to Household Income Ratio in San Augustine County
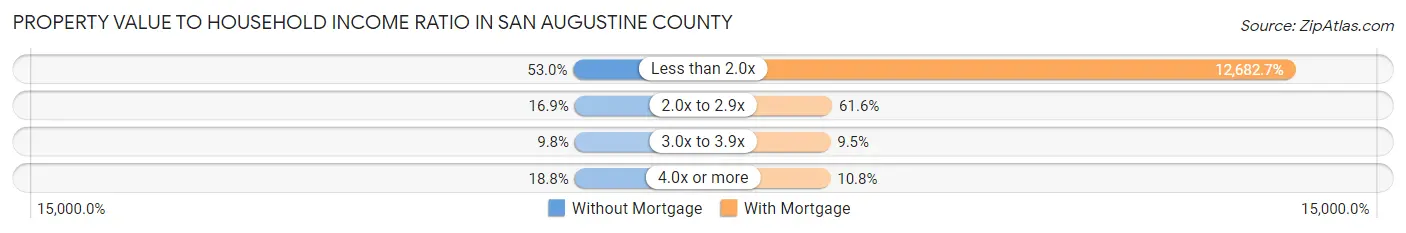
| Value-to-Income Ratio | Without Mortgage | With Mortgage |
| Less than 2.0x | 842 (53.0%) | 79,013 (12,682.7%) |
| 2.0x to 2.9x | 268 (16.9%) | 384 (61.6%) |
| 3.0x to 3.9x | 155 (9.8%) | 59 (9.5%) |
| 4.0x or more | 298 (18.8%) | 67 (10.7%) |
| Total | 1,589 (100.0%) | 623 (100.0%) |
Real Estate Taxes by Mortgage Status in San Augustine County
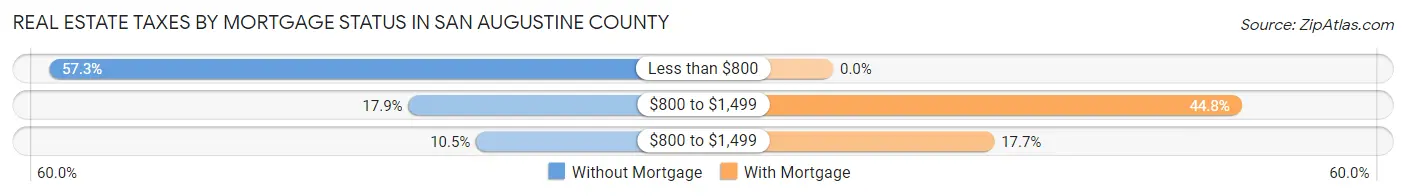
| Property Taxes | Without Mortgage | With Mortgage |
| Less than $800 | 911 (57.3%) | 0 (0.0%) |
| $800 to $1,499 | 285 (17.9%) | 279 (44.8%) |
| $800 to $1,499 | 167 (10.5%) | 110 (17.7%) |
| Total | 1,589 (100.0%) | 623 (100.0%) |
Health & Disability in San Augustine County
Health Insurance Coverage by Age in San Augustine County
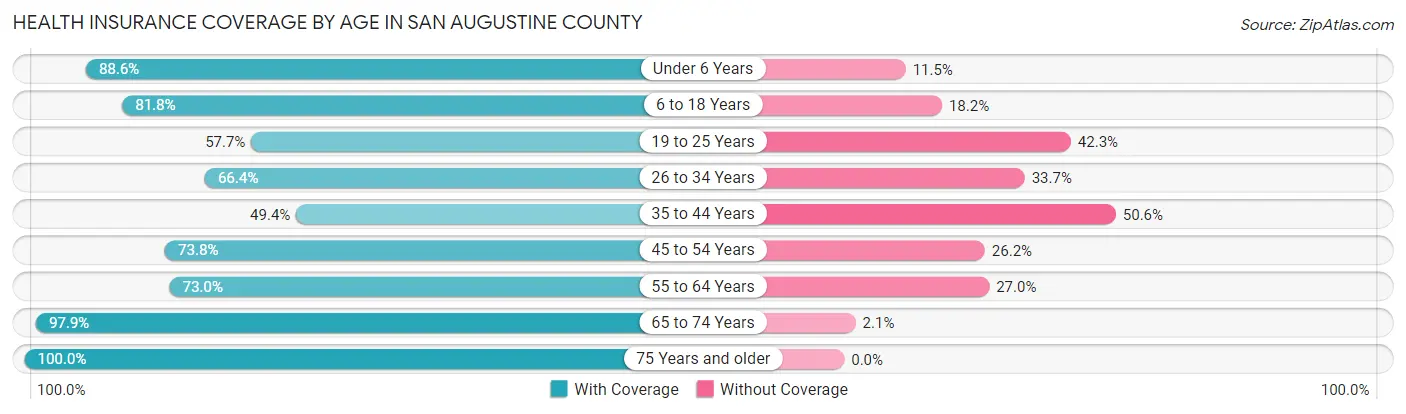
| Age Bracket | With Coverage | Without Coverage |
| Under 6 Years | 294 (88.5%) | 38 (11.5%) |
| 6 to 18 Years | 1,091 (81.8%) | 243 (18.2%) |
| 19 to 25 Years | 306 (57.7%) | 224 (42.3%) |
| 26 to 34 Years | 353 (66.3%) | 179 (33.7%) |
| 35 to 44 Years | 384 (49.4%) | 394 (50.6%) |
| 45 to 54 Years | 754 (73.8%) | 268 (26.2%) |
| 55 to 64 Years | 791 (73.0%) | 293 (27.0%) |
| 65 to 74 Years | 1,198 (97.9%) | 26 (2.1%) |
| 75 Years and older | 857 (100.0%) | 0 (0.0%) |
| Total | 6,028 (78.4%) | 1,665 (21.6%) |
Health Insurance Coverage by Citizenship Status in San Augustine County
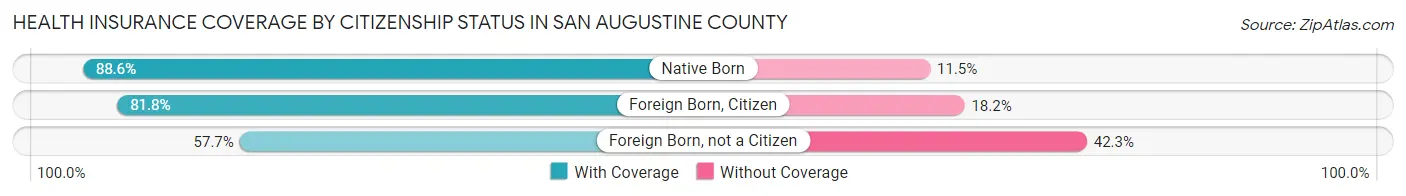
| Citizenship Status | With Coverage | Without Coverage |
| Native Born | 294 (88.5%) | 38 (11.5%) |
| Foreign Born, Citizen | 1,091 (81.8%) | 243 (18.2%) |
| Foreign Born, not a Citizen | 306 (57.7%) | 224 (42.3%) |
Health Insurance Coverage by Household Income in San Augustine County
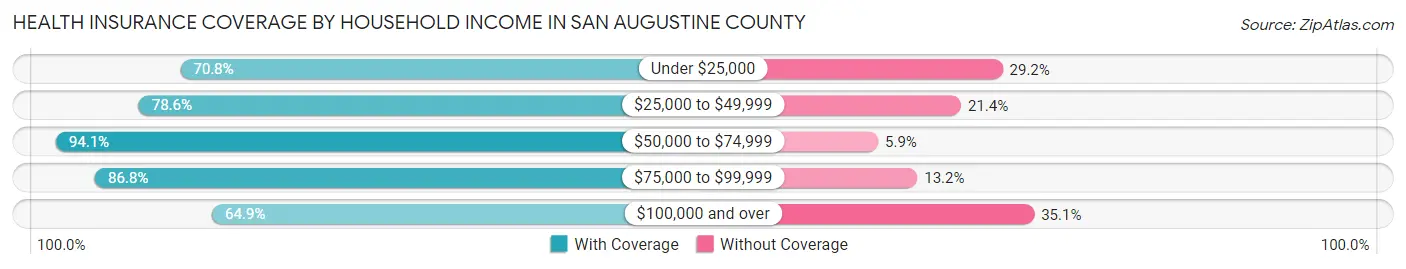
| Household Income | With Coverage | Without Coverage |
| Under $25,000 | 1,378 (70.8%) | 568 (29.2%) |
| $25,000 to $49,999 | 1,564 (78.6%) | 426 (21.4%) |
| $50,000 to $74,999 | 1,491 (94.1%) | 93 (5.9%) |
| $75,000 to $99,999 | 703 (86.8%) | 107 (13.2%) |
| $100,000 and over | 870 (64.9%) | 471 (35.1%) |
Public vs Private Health Insurance Coverage by Age in San Augustine County
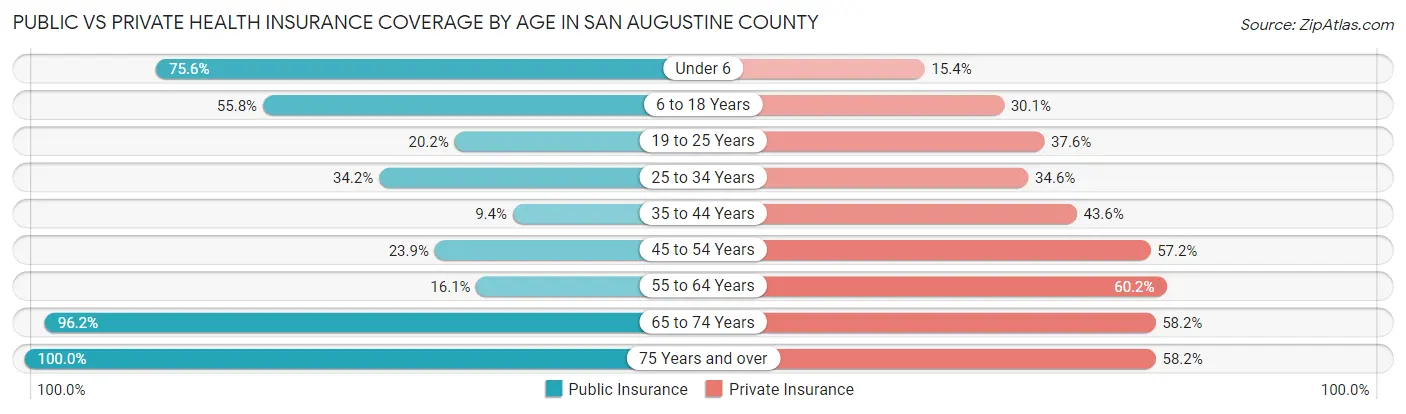
| Age Bracket | Public Insurance | Private Insurance |
| Under 6 | 251 (75.6%) | 51 (15.4%) |
| 6 to 18 Years | 744 (55.8%) | 401 (30.1%) |
| 19 to 25 Years | 107 (20.2%) | 199 (37.6%) |
| 25 to 34 Years | 182 (34.2%) | 184 (34.6%) |
| 35 to 44 Years | 73 (9.4%) | 339 (43.6%) |
| 45 to 54 Years | 244 (23.9%) | 585 (57.2%) |
| 55 to 64 Years | 175 (16.1%) | 653 (60.2%) |
| 65 to 74 Years | 1,178 (96.2%) | 712 (58.2%) |
| 75 Years and over | 857 (100.0%) | 499 (58.2%) |
| Total | 3,811 (49.5%) | 3,623 (47.1%) |
Disability Status by Sex by Age in San Augustine County
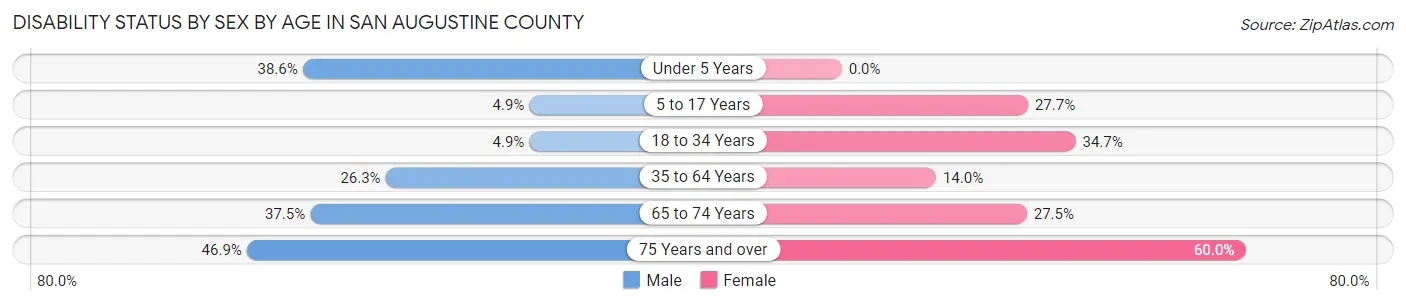
| Age Bracket | Male | Female |
| Under 5 Years | 49 (38.6%) | 0 (0.0%) |
| 5 to 17 Years | 29 (4.9%) | 188 (27.7%) |
| 18 to 34 Years | 34 (4.9%) | 168 (34.7%) |
| 35 to 64 Years | 352 (26.3%) | 216 (14.0%) |
| 65 to 74 Years | 239 (37.5%) | 161 (27.5%) |
| 75 Years and over | 173 (46.9%) | 293 (60.0%) |
Disability Class by Sex by Age in San Augustine County
Disability Class: Hearing Difficulty
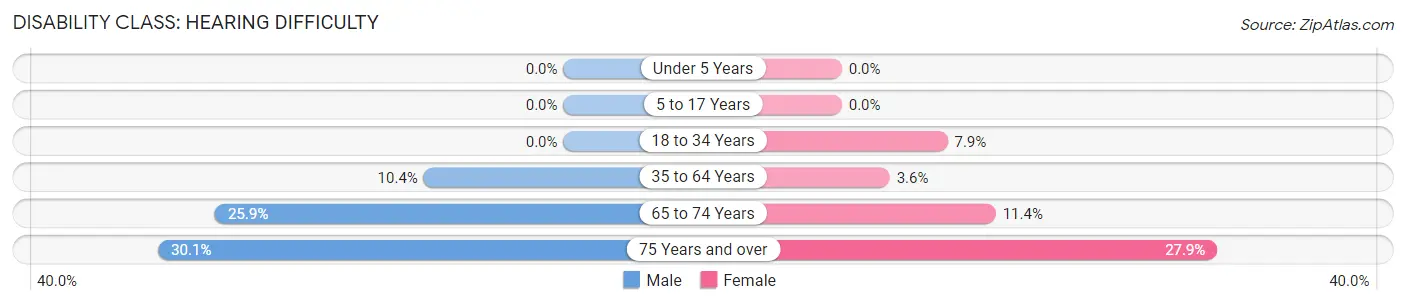
| Age Bracket | Male | Female |
| Under 5 Years | 0 (0.0%) | 0 (0.0%) |
| 5 to 17 Years | 0 (0.0%) | 0 (0.0%) |
| 18 to 34 Years | 0 (0.0%) | 38 (7.9%) |
| 35 to 64 Years | 139 (10.4%) | 55 (3.6%) |
| 65 to 74 Years | 165 (25.9%) | 67 (11.4%) |
| 75 Years and over | 111 (30.1%) | 136 (27.9%) |
Disability Class: Vision Difficulty
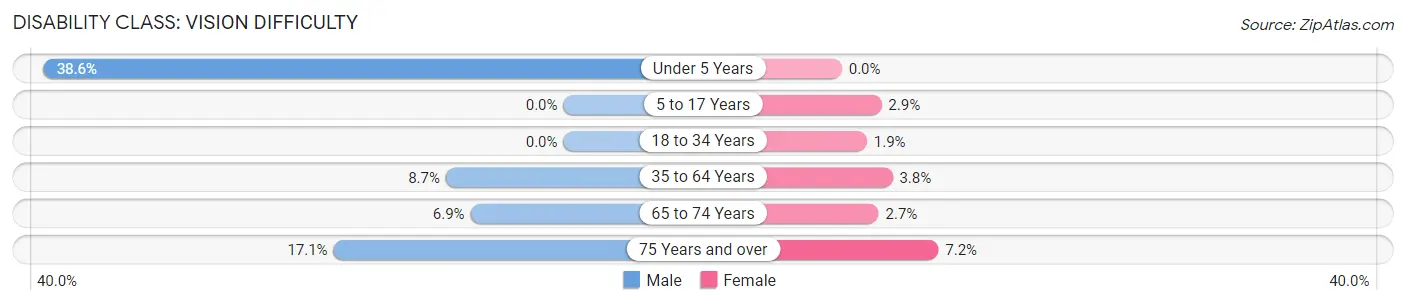
| Age Bracket | Male | Female |
| Under 5 Years | 49 (38.6%) | 0 (0.0%) |
| 5 to 17 Years | 0 (0.0%) | 20 (2.9%) |
| 18 to 34 Years | 0 (0.0%) | 9 (1.9%) |
| 35 to 64 Years | 117 (8.7%) | 58 (3.8%) |
| 65 to 74 Years | 44 (6.9%) | 16 (2.7%) |
| 75 Years and over | 63 (17.1%) | 35 (7.2%) |
Disability Class: Cognitive Difficulty
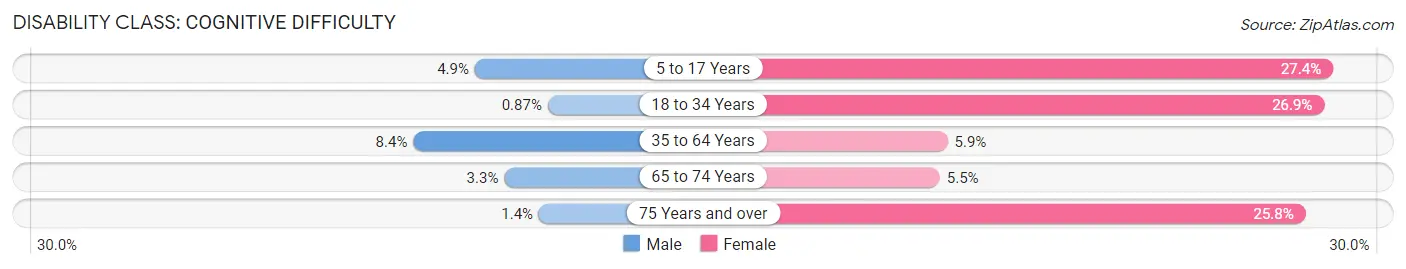
| Age Bracket | Male | Female |
| 5 to 17 Years | 29 (4.9%) | 186 (27.4%) |
| 18 to 34 Years | 6 (0.9%) | 130 (26.9%) |
| 35 to 64 Years | 112 (8.4%) | 91 (5.9%) |
| 65 to 74 Years | 21 (3.3%) | 32 (5.5%) |
| 75 Years and over | 5 (1.4%) | 126 (25.8%) |
Disability Class: Ambulatory Difficulty
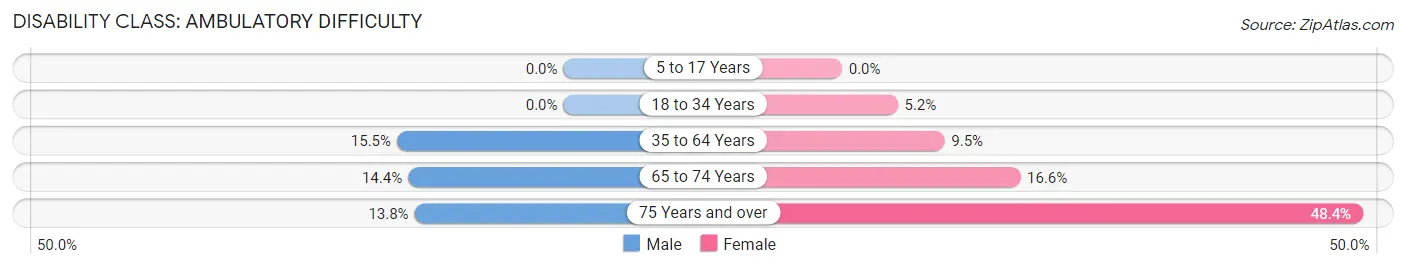
| Age Bracket | Male | Female |
| 5 to 17 Years | 0 (0.0%) | 0 (0.0%) |
| 18 to 34 Years | 0 (0.0%) | 25 (5.2%) |
| 35 to 64 Years | 207 (15.4%) | 147 (9.5%) |
| 65 to 74 Years | 92 (14.4%) | 97 (16.6%) |
| 75 Years and over | 51 (13.8%) | 236 (48.4%) |
Disability Class: Self-Care Difficulty
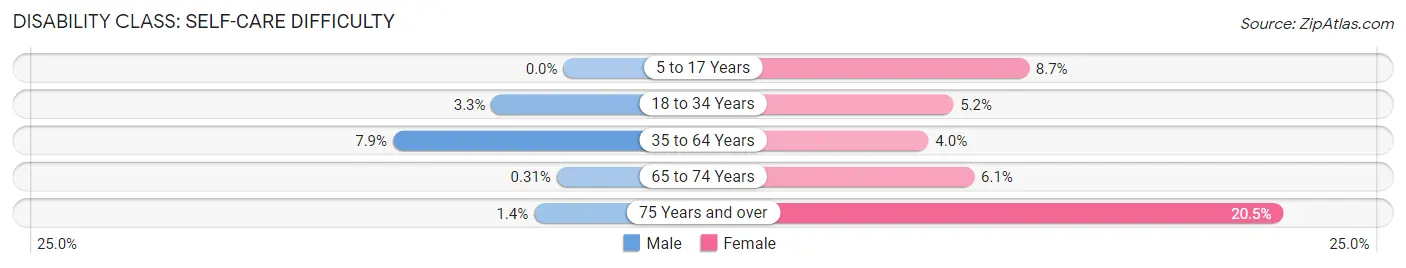
| Age Bracket | Male | Female |
| 5 to 17 Years | 0 (0.0%) | 59 (8.7%) |
| 18 to 34 Years | 23 (3.3%) | 25 (5.2%) |
| 35 to 64 Years | 106 (7.9%) | 62 (4.0%) |
| 65 to 74 Years | 2 (0.3%) | 36 (6.1%) |
| 75 Years and over | 5 (1.4%) | 100 (20.5%) |
Technology Access in San Augustine County
Computing Device Access in San Augustine County
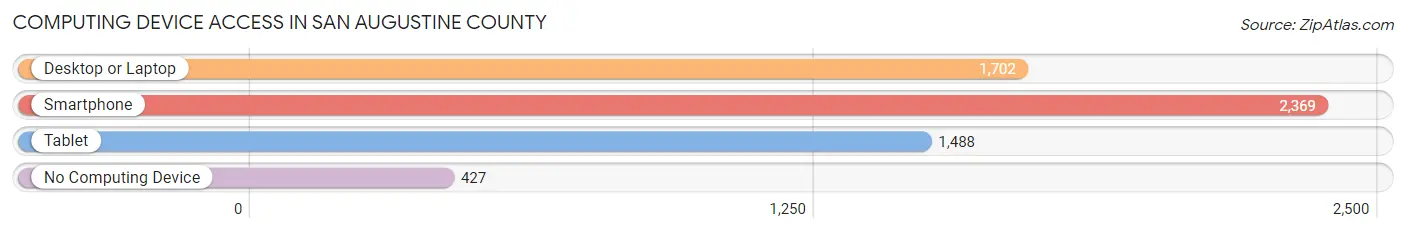
| Device Type | # Households | % Households |
| Desktop or Laptop | 1,702 | 55.8% |
| Smartphone | 2,369 | 77.6% |
| Tablet | 1,488 | 48.8% |
| No Computing Device | 427 | 14.0% |
| Total | 3,051 | 100.0% |
Internet Access in San Augustine County
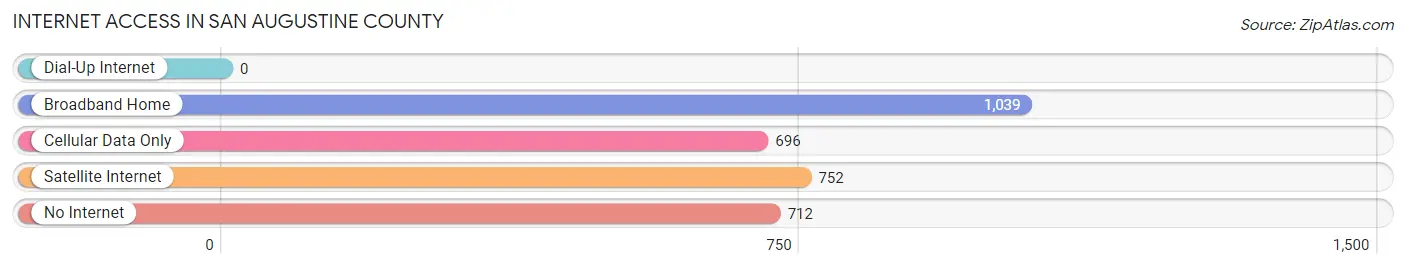
| Internet Type | # Households | % Households |
| Dial-Up Internet | 0 | 0.0% |
| Broadband Home | 1,039 | 34.1% |
| Cellular Data Only | 696 | 22.8% |
| Satellite Internet | 752 | 24.6% |
| No Internet | 712 | 23.3% |
| Total | 3,051 | 100.0% |
San Augustine County Summary
San Augustine County is located in the eastern part of Texas, in the Piney Woods region. It is bordered by Sabine County to the north, Shelby County to the east, Angelina County to the south, and Nacogdoches County to the west. The county seat is San Augustine, and the county has a total area of 590 square miles.
History
San Augustine County was established in 1837, and was named after the city of San Augustine, which was founded in 1717 by Spanish missionaries. The county was originally part of Nacogdoches County, but was later divided into its own county. The county was home to several Native American tribes, including the Caddo, Cherokee, and Choctaw.
The county was an important part of the Texas Revolution, and was the site of several battles, including the Battle of San Jacinto. After the war, the county was divided into several smaller counties, including Sabine, Shelby, and Angelina.
In the late 19th century, the county was home to several large plantations, and the economy was largely based on cotton and timber. The county was also home to several sawmills and gristmills.
Geography
San Augustine County is located in the eastern part of Texas, in the Piney Woods region. The county is bordered by Sabine County to the north, Shelby County to the east, Angelina County to the south, and Nacogdoches County to the west. The county has a total area of 590 square miles, and is mostly forested. The terrain is mostly flat, with some rolling hills.
The county is home to several rivers and creeks, including the Sabine River, the Neches River, and the Angelina River. The county is also home to several lakes, including Lake Sam Rayburn, Lake Nacogdoches, and Lake San Augustine.
Economy
The economy of San Augustine County is largely based on agriculture and timber. The county is home to several large farms, and the main crops grown in the county are cotton, corn, soybeans, and wheat. The county is also home to several timber companies, and the main products produced are lumber and paper products.
The county is also home to several manufacturing companies, including a paper mill, a furniture factory, and a plastics factory. The county is also home to several oil and gas companies, and the main products produced are crude oil and natural gas.
Demographics
As of the 2010 census, the population of San Augustine County was 8,895. The population is mostly white (77.3%), with a small African American population (17.2%), and a small Hispanic population (4.5%). The median household income is $37,945, and the median home value is $90,000.
The county is home to several small towns, including San Augustine, Broaddus, and Pineland. The county is also home to several unincorporated communities, including Geneva, Milam, and Woden. The county is served by several school districts, including the San Augustine Independent School District, the Broaddus Independent School District, and the Pineland Independent School District.
Common Questions
What is Per Capita Income in San Augustine County?
Per Capita income in San Augustine County is $24,673.
What is the Median Family Income in San Augustine County?
Median Family Income in San Augustine County is $49,569.
What is the Median Household income in San Augustine County?
Median Household Income in San Augustine County is $45,888.
What is Income or Wage Gap in San Augustine County?
Income or Wage Gap in San Augustine County is 55.0%.
Women in San Augustine County earn 45.0 cents for every dollar earned by a man.
What is Inequality or Gini Index in San Augustine County?
Inequality or Gini Index in San Augustine County is 0.48.
What is the Total Population of San Augustine County?
Total Population of San Augustine County is 7,920.
What is the Total Male Population of San Augustine County?
Total Male Population of San Augustine County is 3,828.
What is the Total Female Population of San Augustine County?
Total Female Population of San Augustine County is 4,092.
What is the Ratio of Males per 100 Females in San Augustine County?
There are 93.55 Males per 100 Females in San Augustine County.
What is the Ratio of Females per 100 Males in San Augustine County?
There are 106.90 Females per 100 Males in San Augustine County.
What is the Median Population Age in San Augustine County?
Median Population Age in San Augustine County is 48.6 Years.
What is the Average Family Size in San Augustine County
Average Family Size in San Augustine County is 2.9 People.
What is the Average Household Size in San Augustine County
Average Household Size in San Augustine County is 2.5 People.
How Large is the Labor Force in San Augustine County?
There are 2,902 People in the Labor Forcein in San Augustine County.
What is the Percentage of People in the Labor Force in San Augustine County?
43.8% of People are in the Labor Force in San Augustine County.
What is the Unemployment Rate in San Augustine County?
Unemployment Rate in San Augustine County is 10.3%.