Sabine County, TX Map & Demographics
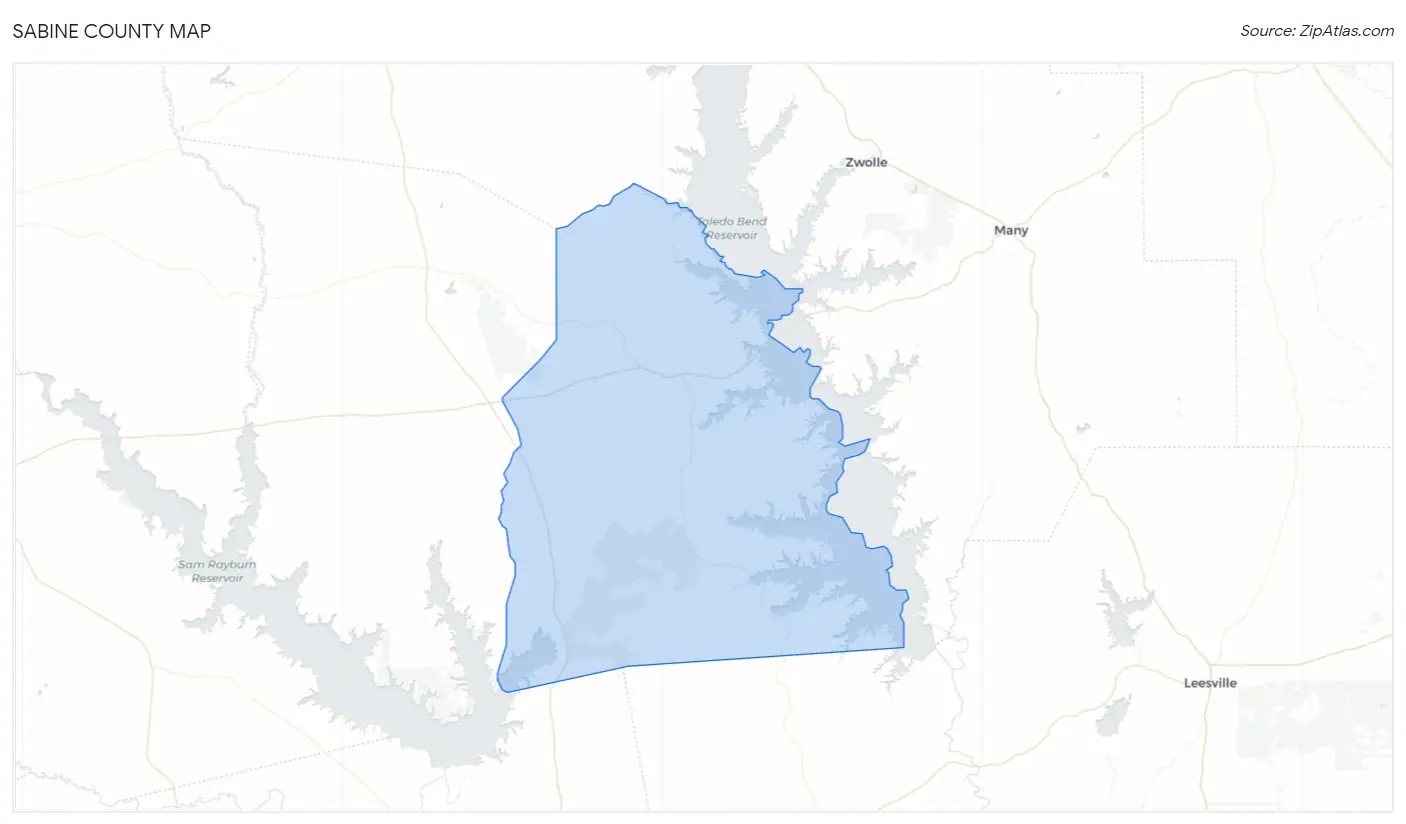
Sabine County Map
Sabine County Overview
$33,953
PER CAPITA INCOME
$62,674
AVG FAMILY INCOME
$47,061
AVG HOUSEHOLD INCOME
44.9%
WAGE / INCOME GAP [ % ]
55.1¢/ $1
WAGE / INCOME GAP [ $ ]
0.52
INEQUALITY / GINI INDEX
9,980
TOTAL POPULATION
4,989
MALE POPULATION
4,991
FEMALE POPULATION
99.96
MALES / 100 FEMALES
100.04
FEMALES / 100 MALES
54.1
MEDIAN AGE
2.7
AVG FAMILY SIZE
2.2
AVG HOUSEHOLD SIZE
3,485
LABOR FORCE [ PEOPLE ]
41.2%
PERCENT IN LABOR FORCE
8.4%
UNEMPLOYMENT RATE
Income in Sabine County
Income Overview in Sabine County
Per Capita Income in Sabine County is $33,953, while median incomes of families and households are $62,674 and $47,061 respectively.
| Characteristic | Number | Measure |
| Per Capita Income | 9,980 | $33,953 |
| Median Family Income | 3,021 | $62,674 |
| Mean Family Income | 3,021 | $88,858 |
| Median Household Income | 4,471 | $47,061 |
| Mean Household Income | 4,471 | $73,675 |
| Income Deficit | 3,021 | $0 |
| Wage / Income Gap (%) | 9,980 | 44.90% |
| Wage / Income Gap ($) | 9,980 | 55.10¢ per $1 |
| Gini / Inequality Index | 9,980 | 0.52 |
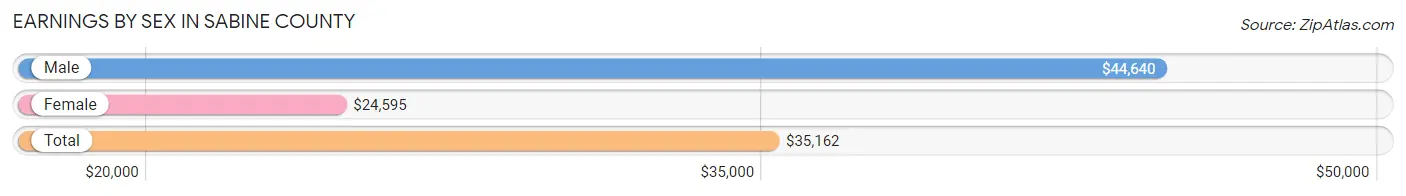
Earnings by Sex in Sabine County
Average Earnings in Sabine County are $35,162, $44,640 for men and $24,595 for women, a difference of 44.9%.
| Sex | Number | Average Earnings |
| Male | 1,809 (49.2%) | $44,640 |
| Female | 1,864 (50.7%) | $24,595 |
| Total | 3,673 (100.0%) | $35,162 |
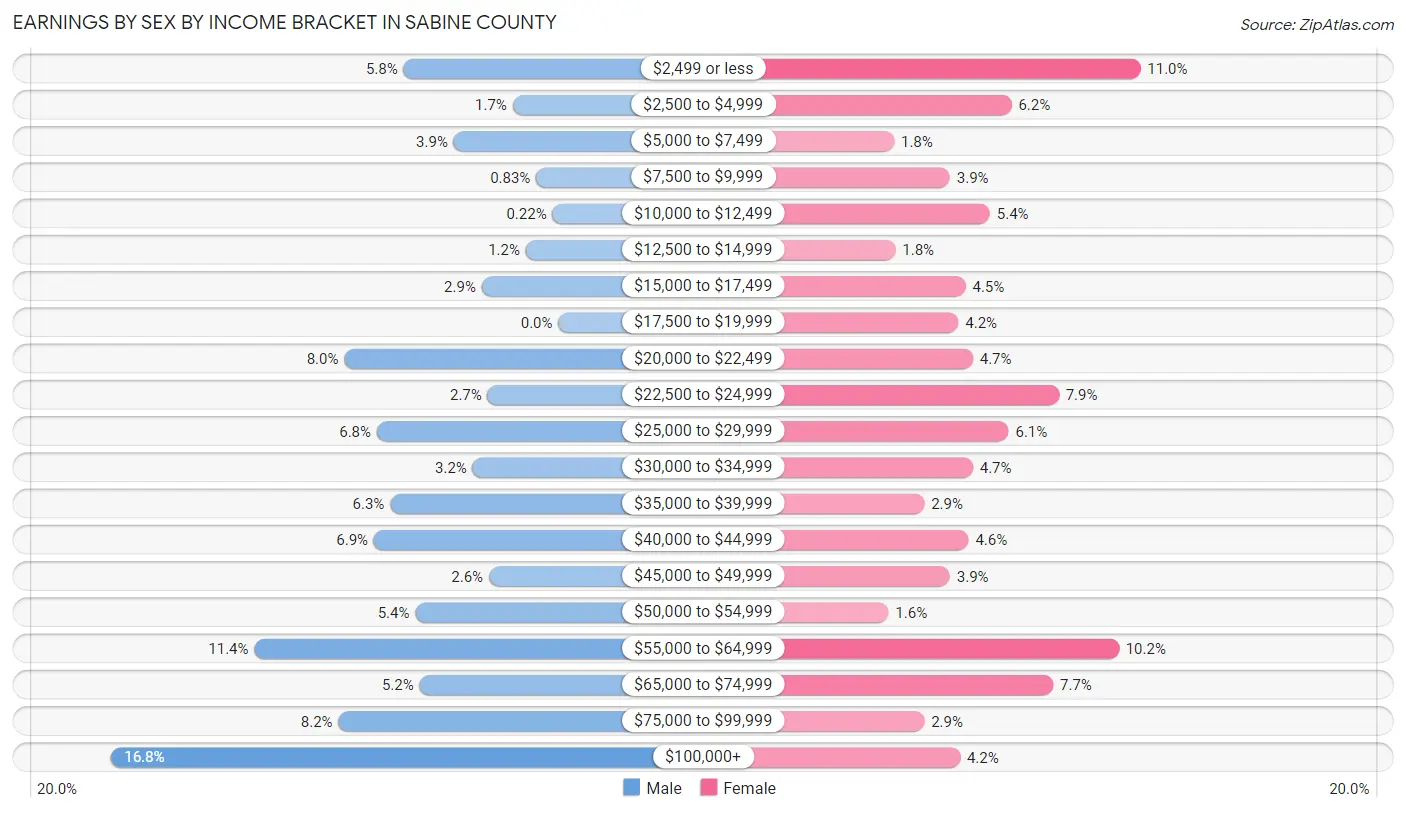
Earnings by Sex by Income Bracket in Sabine County
The most common earnings brackets in Sabine County are $100,000+ for men (303 | 16.8%) and $2,499 or less for women (205 | 11.0%).
| Income | Male | Female |
| $2,499 or less | 105 (5.8%) | 205 (11.0%) |
| $2,500 to $4,999 | 31 (1.7%) | 115 (6.2%) |
| $5,000 to $7,499 | 71 (3.9%) | 33 (1.8%) |
| $7,500 to $9,999 | 15 (0.8%) | 72 (3.9%) |
| $10,000 to $12,499 | 4 (0.2%) | 100 (5.4%) |
| $12,500 to $14,999 | 22 (1.2%) | 34 (1.8%) |
| $15,000 to $17,499 | 52 (2.9%) | 83 (4.4%) |
| $17,500 to $19,999 | 0 (0.0%) | 78 (4.2%) |
| $20,000 to $22,499 | 145 (8.0%) | 88 (4.7%) |
| $22,500 to $24,999 | 48 (2.6%) | 148 (7.9%) |
| $25,000 to $29,999 | 123 (6.8%) | 113 (6.1%) |
| $30,000 to $34,999 | 58 (3.2%) | 88 (4.7%) |
| $35,000 to $39,999 | 114 (6.3%) | 54 (2.9%) |
| $40,000 to $44,999 | 125 (6.9%) | 85 (4.6%) |
| $45,000 to $49,999 | 47 (2.6%) | 72 (3.9%) |
| $50,000 to $54,999 | 97 (5.4%) | 29 (1.6%) |
| $55,000 to $64,999 | 206 (11.4%) | 190 (10.2%) |
| $65,000 to $74,999 | 94 (5.2%) | 144 (7.7%) |
| $75,000 to $99,999 | 149 (8.2%) | 54 (2.9%) |
| $100,000+ | 303 (16.8%) | 79 (4.2%) |
| Total | 1,809 (100.0%) | 1,864 (100.0%) |
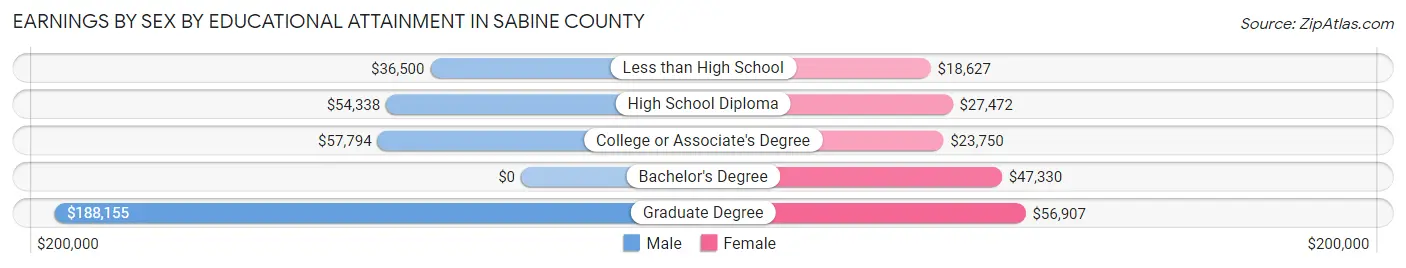
Earnings by Sex by Educational Attainment in Sabine County
Average earnings in Sabine County are $52,546 for men and $26,897 for women, a difference of 48.8%. Men with an educational attainment of graduate degree enjoy the highest average annual earnings of $188,155, while those with less than high school education earn the least with $36,500. Women with an educational attainment of graduate degree earn the most with the average annual earnings of $56,907, while those with less than high school education have the smallest earnings of $18,627.
| Educational Attainment | Male Income | Female Income |
| Less than High School | $36,500 | $18,627 |
| High School Diploma | $54,338 | $27,472 |
| College or Associate's Degree | $57,794 | $23,750 |
| Bachelor's Degree | - | - |
| Graduate Degree | $188,155 | $56,907 |
| Total | $52,546 | $26,897 |
Family Income in Sabine County
Family Income Brackets in Sabine County
According to the Sabine County family income data, there are 825 families falling into the $50,000 to $74,999 income range, which is the most common income bracket and makes up 27.3% of all families. Conversely, the $15,000 to $24,999 income bracket is the least frequent group with only 88 families (2.9%) belonging to this category.
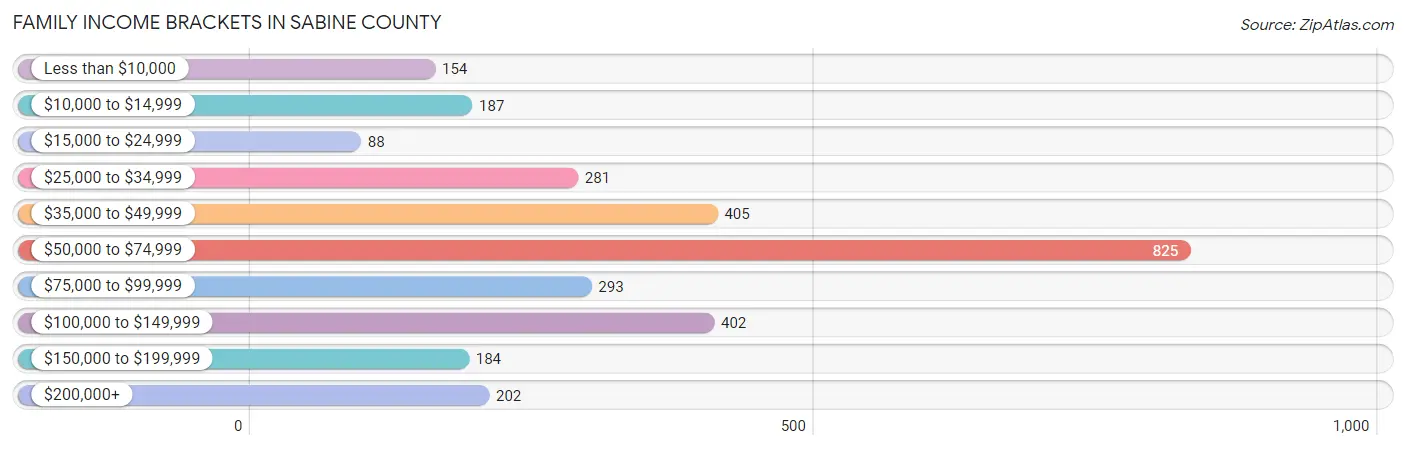
| Income Bracket | # Families | % Families |
| Less than $10,000 | 154 | 5.1% |
| $10,000 to $14,999 | 187 | 6.2% |
| $15,000 to $24,999 | 88 | 2.9% |
| $25,000 to $34,999 | 281 | 9.3% |
| $35,000 to $49,999 | 405 | 13.4% |
| $50,000 to $74,999 | 825 | 27.3% |
| $75,000 to $99,999 | 293 | 9.7% |
| $100,000 to $149,999 | 402 | 13.3% |
| $150,000 to $199,999 | 184 | 6.1% |
| $200,000+ | 202 | 6.7% |
Family Income by Famaliy Size in Sabine County
7+ person families (16 | 0.5%) account for the highest median family income in Sabine County with $78,889 per family, while 2-person families (1,956 | 64.7%) have the highest median income of $32,663 per family member.
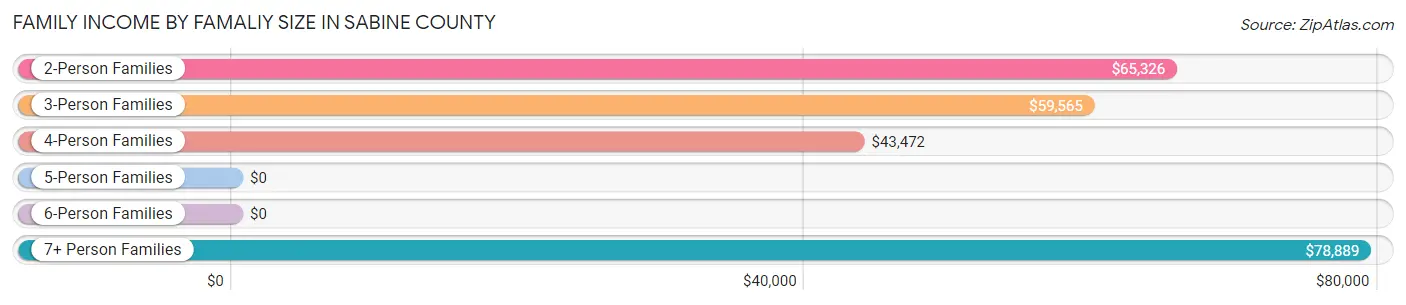
| Income Bracket | # Families | Median Income |
| 2-Person Families | 1,956 (64.7%) | $65,326 |
| 3-Person Families | 554 (18.3%) | $59,565 |
| 4-Person Families | 337 (11.2%) | $43,472 |
| 5-Person Families | 122 (4.0%) | $0 |
| 6-Person Families | 36 (1.2%) | $0 |
| 7+ Person Families | 16 (0.5%) | $78,889 |
| Total | 3,021 (100.0%) | $62,674 |
Family Income by Number of Earners in Sabine County
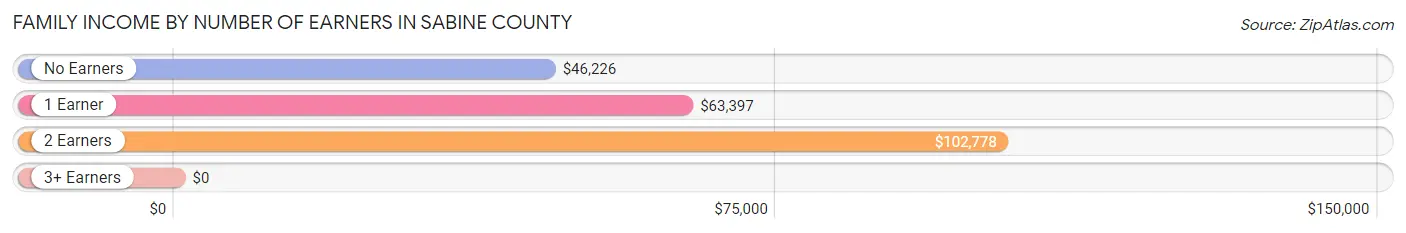
| Number of Earners | # Families | Median Income |
| No Earners | 1,021 (33.8%) | $46,226 |
| 1 Earner | 1,128 (37.3%) | $63,397 |
| 2 Earners | 842 (27.9%) | $102,778 |
| 3+ Earners | 30 (1.0%) | $0 |
| Total | 3,021 (100.0%) | $62,674 |
Household Income in Sabine County
Household Income Brackets in Sabine County
With 966 households falling in the category, the $50,000 to $74,999 income range is the most frequent in Sabine County, accounting for 21.6% of all households. In contrast, only 183 households (4.1%) fall into the $150,000 to $199,999 income bracket, making it the least populous group.
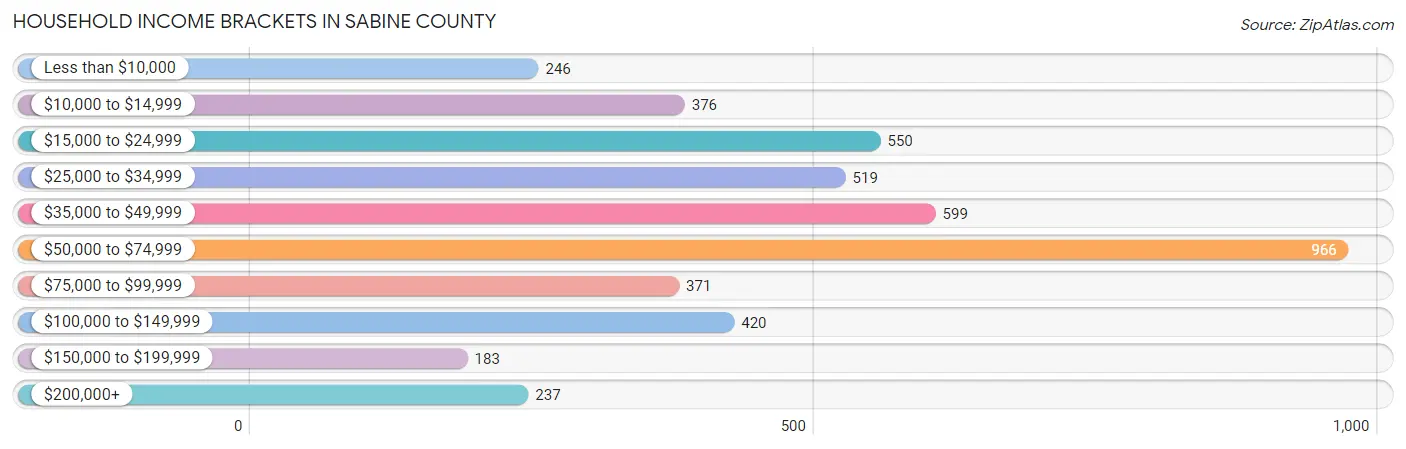
| Income Bracket | # Households | % Households |
| Less than $10,000 | 246 | 5.5% |
| $10,000 to $14,999 | 376 | 8.4% |
| $15,000 to $24,999 | 550 | 12.3% |
| $25,000 to $34,999 | 519 | 11.6% |
| $35,000 to $49,999 | 599 | 13.4% |
| $50,000 to $74,999 | 966 | 21.6% |
| $75,000 to $99,999 | 371 | 8.3% |
| $100,000 to $149,999 | 420 | 9.4% |
| $150,000 to $199,999 | 183 | 4.1% |
| $200,000+ | 237 | 5.3% |
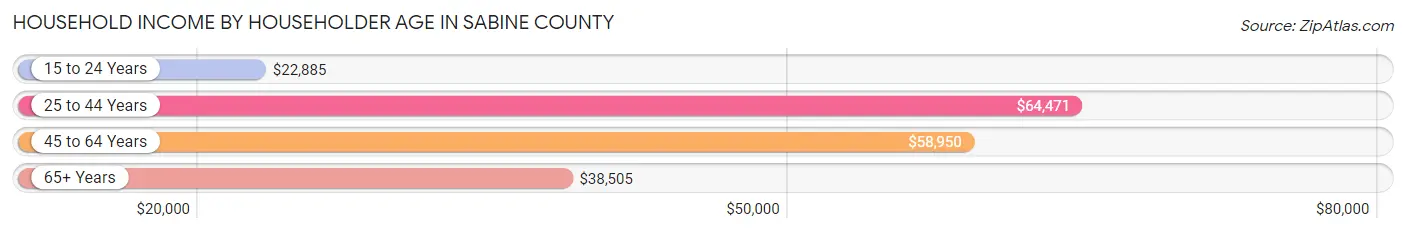
Household Income by Householder Age in Sabine County
The median household income in Sabine County is $47,061, with the highest median household income of $64,471 found in the 25 to 44 years age bracket for the primary householder. A total of 857 households (19.2%) fall into this category. Meanwhile, the 15 to 24 years age bracket for the primary householder has the lowest median household income of $22,885, with 134 households (3.0%) in this group.
| Income Bracket | # Households | Median Income |
| 15 to 24 Years | 134 (3.0%) | $22,885 |
| 25 to 44 Years | 857 (19.2%) | $64,471 |
| 45 to 64 Years | 1,499 (33.5%) | $58,950 |
| 65+ Years | 1,981 (44.3%) | $38,505 |
| Total | 4,471 (100.0%) | $47,061 |
Poverty in Sabine County
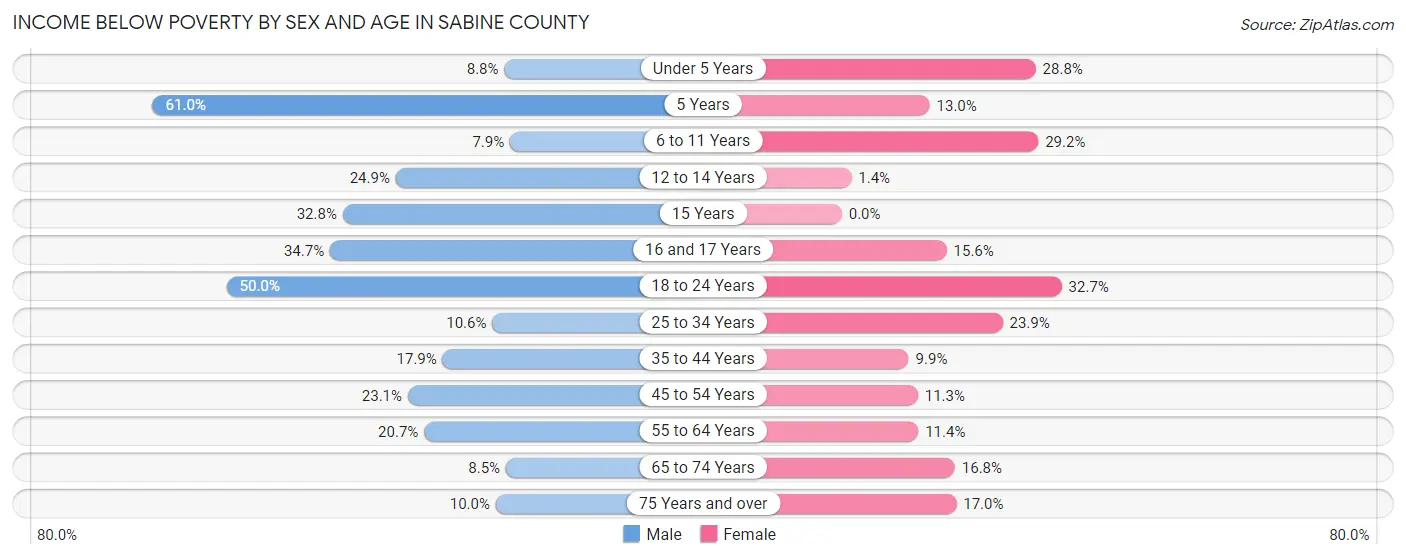
Income Below Poverty by Sex and Age in Sabine County
With 18.0% poverty level for males and 16.6% for females among the residents of Sabine County, 5 year old males and 18 to 24 year old females are the most vulnerable to poverty, with 25 males (61.0%) and 95 females (32.7%) in their respective age groups living below the poverty level.
| Age Bracket | Male | Female |
| Under 5 Years | 22 (8.8%) | 57 (28.8%) |
| 5 Years | 25 (61.0%) | 3 (13.0%) |
| 6 to 11 Years | 17 (7.9%) | 70 (29.2%) |
| 12 to 14 Years | 59 (24.9%) | 3 (1.4%) |
| 15 Years | 19 (32.8%) | 0 (0.0%) |
| 16 and 17 Years | 35 (34.6%) | 21 (15.6%) |
| 18 to 24 Years | 159 (50.0%) | 95 (32.7%) |
| 25 to 34 Years | 48 (10.5%) | 121 (23.9%) |
| 35 to 44 Years | 71 (17.9%) | 42 (9.9%) |
| 45 to 54 Years | 112 (23.1%) | 62 (11.3%) |
| 55 to 64 Years | 185 (20.7%) | 101 (11.4%) |
| 65 to 74 Years | 73 (8.5%) | 132 (16.8%) |
| 75 Years and over | 61 (10.0%) | 112 (17.0%) |
| Total | 886 (18.0%) | 819 (16.6%) |
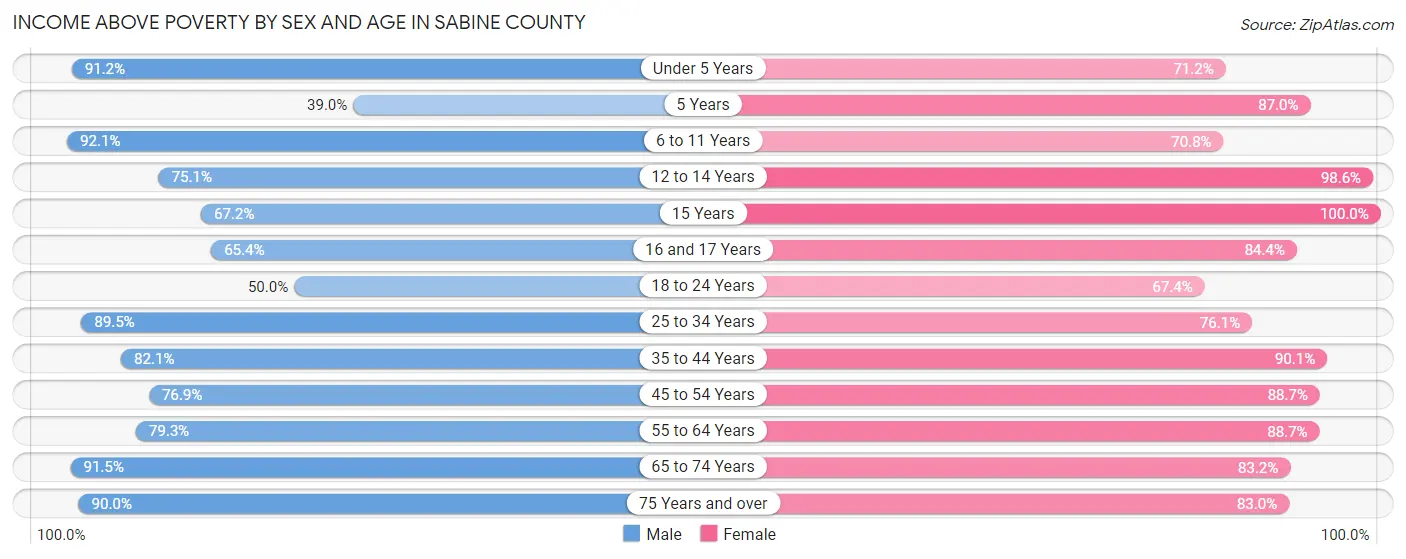
Income Above Poverty by Sex and Age in Sabine County
According to the poverty statistics in Sabine County, males aged 6 to 11 years and females aged 15 years are the age groups that are most secure financially, with 92.1% of males and 100.0% of females in these age groups living above the poverty line.
| Age Bracket | Male | Female |
| Under 5 Years | 229 (91.2%) | 141 (71.2%) |
| 5 Years | 16 (39.0%) | 20 (87.0%) |
| 6 to 11 Years | 198 (92.1%) | 170 (70.8%) |
| 12 to 14 Years | 178 (75.1%) | 208 (98.6%) |
| 15 Years | 39 (67.2%) | 22 (100.0%) |
| 16 and 17 Years | 66 (65.3%) | 114 (84.4%) |
| 18 to 24 Years | 159 (50.0%) | 196 (67.3%) |
| 25 to 34 Years | 407 (89.4%) | 386 (76.1%) |
| 35 to 44 Years | 325 (82.1%) | 381 (90.1%) |
| 45 to 54 Years | 373 (76.9%) | 487 (88.7%) |
| 55 to 64 Years | 710 (79.3%) | 789 (88.6%) |
| 65 to 74 Years | 783 (91.5%) | 654 (83.2%) |
| 75 Years and over | 547 (90.0%) | 547 (83.0%) |
| Total | 4,030 (82.0%) | 4,115 (83.4%) |
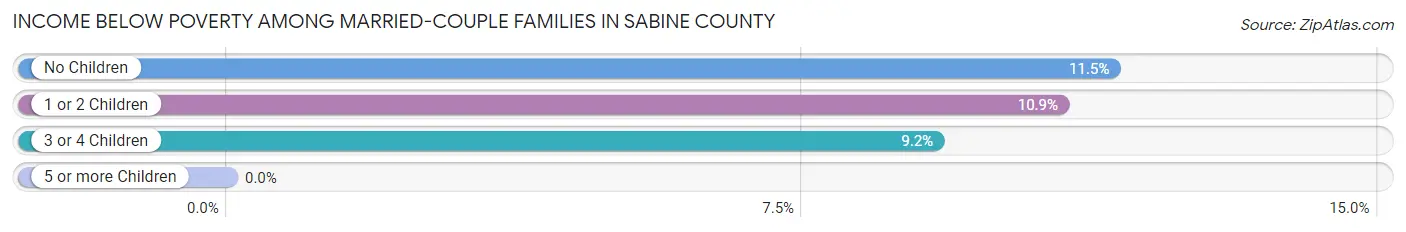
Income Below Poverty Among Married-Couple Families in Sabine County
The poverty statistics for married-couple families in Sabine County show that 11.2% or 269 of the total 2,393 families live below the poverty line. Families with no children have the highest poverty rate of 11.5%, comprising of 209 families. On the other hand, families with 5 or more children have the lowest poverty rate of 0.0%, which includes 0 families.
| Children | Above Poverty | Below Poverty |
| No Children | 1,603 (88.5%) | 209 (11.5%) |
| 1 or 2 Children | 394 (89.1%) | 48 (10.9%) |
| 3 or 4 Children | 118 (90.8%) | 12 (9.2%) |
| 5 or more Children | 9 (100.0%) | 0 (0.0%) |
| Total | 2,124 (88.8%) | 269 (11.2%) |
Income Below Poverty Among Single-Parent Households in Sabine County
According to the poverty data in Sabine County, 4.5% or 9 single-father households and 35.8% or 153 single-mother households are living below the poverty line. Among single-father households, those with 3 or 4 children have the highest poverty rate, with 5 households (100.0%) experiencing poverty. Likewise, among single-mother households, those with 3 or 4 children have the highest poverty rate, with 41 households (100.0%) falling below the poverty line.
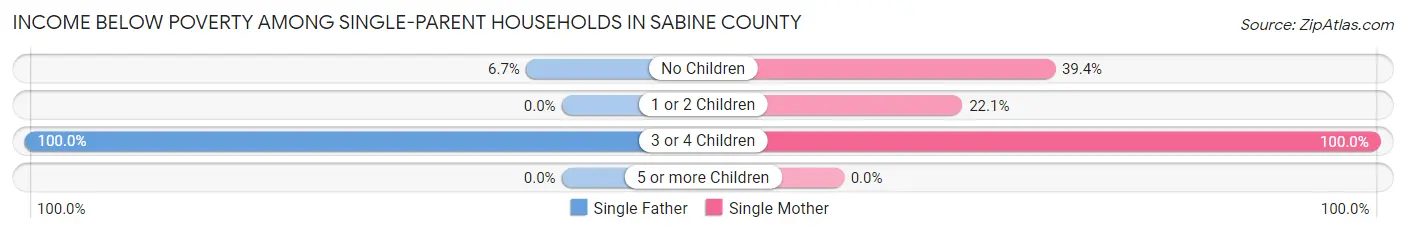
| Children | Single Father | Single Mother |
| No Children | 4 (6.7%) | 61 (39.4%) |
| 1 or 2 Children | 0 (0.0%) | 51 (22.1%) |
| 3 or 4 Children | 5 (100.0%) | 41 (100.0%) |
| 5 or more Children | 0 (0.0%) | 0 (0.0%) |
| Total | 9 (4.5%) | 153 (35.8%) |
Income Below Poverty Among Married-Couple vs Single-Parent Households in Sabine County
The poverty data for Sabine County shows that 269 of the married-couple family households (11.2%) and 162 of the single-parent households (25.8%) are living below the poverty level. Within the married-couple family households, those with no children have the highest poverty rate, with 209 households (11.5%) falling below the poverty line. Among the single-parent households, those with 3 or 4 children have the highest poverty rate, with 46 household (100.0%) living below poverty.
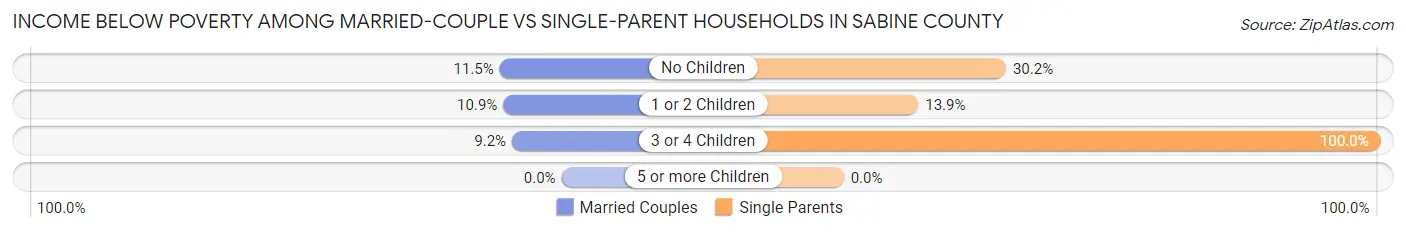
| Children | Married-Couple Families | Single-Parent Households |
| No Children | 209 (11.5%) | 65 (30.2%) |
| 1 or 2 Children | 48 (10.9%) | 51 (13.9%) |
| 3 or 4 Children | 12 (9.2%) | 46 (100.0%) |
| 5 or more Children | 0 (0.0%) | 0 (0.0%) |
| Total | 269 (11.2%) | 162 (25.8%) |
Race in Sabine County
The most populous races in Sabine County are White / Caucasian (8,709 | 87.3%), Hispanic or Latino (509 | 5.1%), and Black / African American (498 | 5.0%).
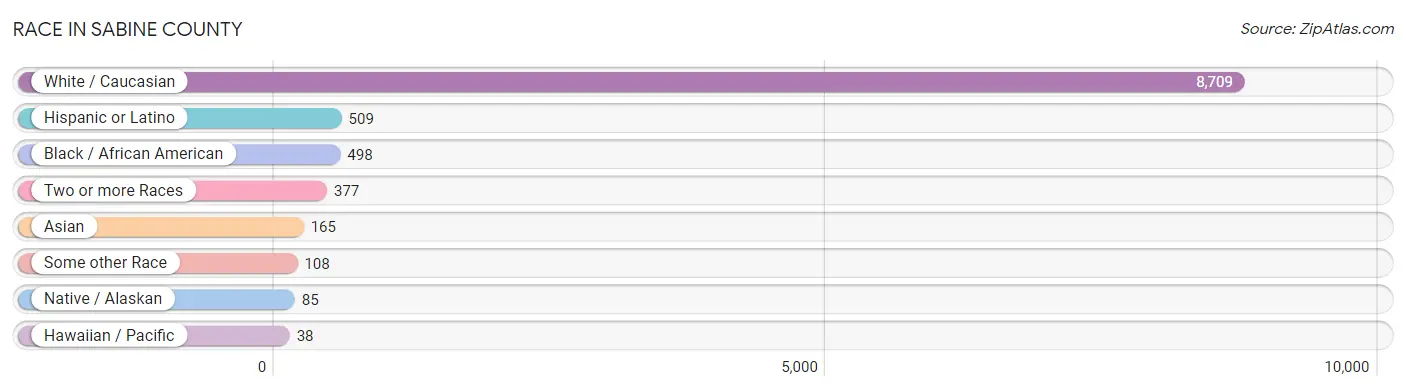
| Race | # Population | % Population |
| Asian | 165 | 1.7% |
| Black / African American | 498 | 5.0% |
| Hawaiian / Pacific | 38 | 0.4% |
| Hispanic or Latino | 509 | 5.1% |
| Native / Alaskan | 85 | 0.9% |
| White / Caucasian | 8,709 | 87.3% |
| Two or more Races | 377 | 3.8% |
| Some other Race | 108 | 1.1% |
| Total | 9,980 | 100.0% |
Ancestry in Sabine County
The most populous ancestries reported in Sabine County are American (2,322 | 23.3%), Irish (942 | 9.4%), German (797 | 8.0%), English (724 | 7.2%), and Mexican (439 | 4.4%), together accounting for 52.4% of all Sabine County residents.
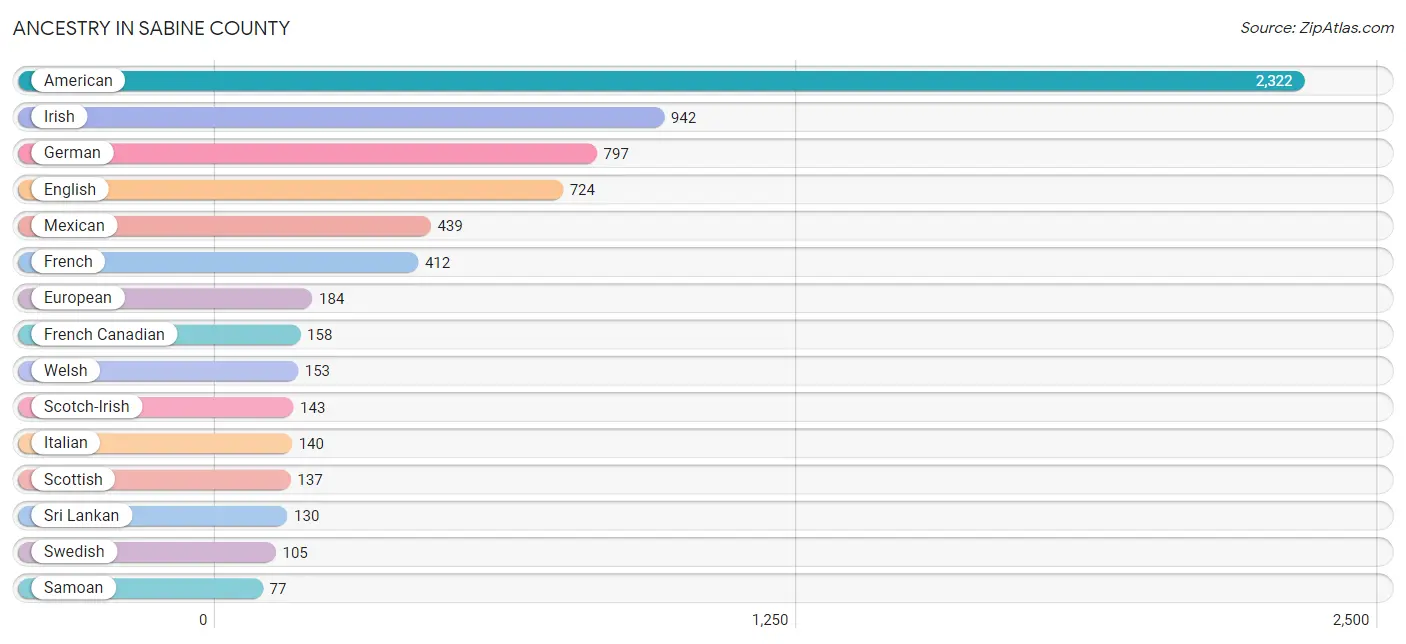
| Ancestry | # Population | % Population |
| African | 10 | 0.1% |
| American | 2,322 | 23.3% |
| Apache | 11 | 0.1% |
| Arab | 33 | 0.3% |
| Brazilian | 12 | 0.1% |
| British | 34 | 0.3% |
| Cajun | 67 | 0.7% |
| Canadian | 14 | 0.1% |
| Central American Indian | 21 | 0.2% |
| Cherokee | 39 | 0.4% |
| Dutch | 20 | 0.2% |
| English | 724 | 7.2% |
| European | 184 | 1.8% |
| French | 412 | 4.1% |
| French Canadian | 158 | 1.6% |
| German | 797 | 8.0% |
| Irish | 942 | 9.4% |
| Italian | 140 | 1.4% |
| Jordanian | 33 | 0.3% |
| Korean | 73 | 0.7% |
| Lithuanian | 38 | 0.4% |
| Mexican | 439 | 4.4% |
| Northern European | 10 | 0.1% |
| Norwegian | 12 | 0.1% |
| Polish | 63 | 0.6% |
| Russian | 9 | 0.1% |
| Samoan | 77 | 0.8% |
| Scandinavian | 21 | 0.2% |
| Scotch-Irish | 143 | 1.4% |
| Scottish | 137 | 1.4% |
| Slavic | 6 | 0.1% |
| Spaniard | 68 | 0.7% |
| Sri Lankan | 130 | 1.3% |
| Subsaharan African | 10 | 0.1% |
| Swedish | 105 | 1.1% |
| Ukrainian | 15 | 0.2% |
| Welsh | 153 | 1.5% | View All 37 Rows |
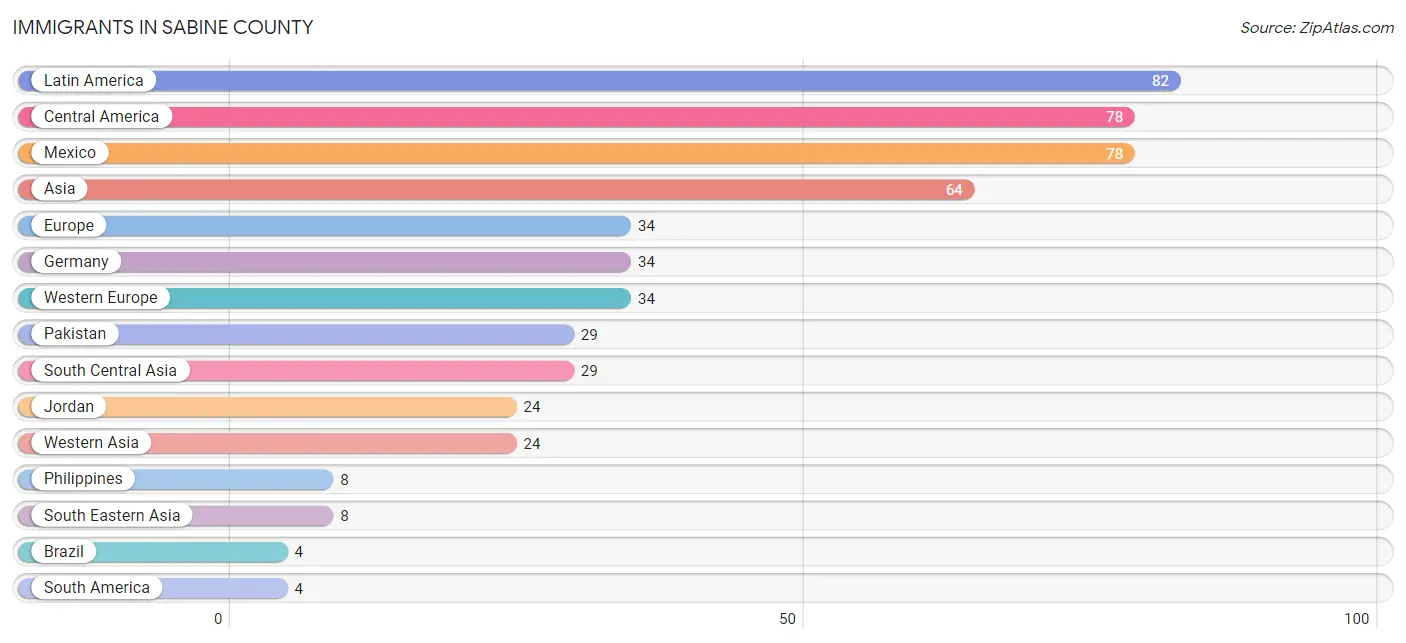
Immigrants in Sabine County
The most numerous immigrant groups reported in Sabine County came from Latin America (82 | 0.8%), Central America (78 | 0.8%), Mexico (78 | 0.8%), Asia (64 | 0.6%), and Europe (34 | 0.3%), together accounting for 3.4% of all Sabine County residents.
| Immigration Origin | # Population | % Population |
| Africa | 2 | 0.0% |
| Asia | 64 | 0.6% |
| Brazil | 4 | 0.0% |
| Central America | 78 | 0.8% |
| China | 3 | 0.0% |
| Eastern Africa | 2 | 0.0% |
| Eastern Asia | 3 | 0.0% |
| Ethiopia | 2 | 0.0% |
| Europe | 34 | 0.3% |
| Germany | 34 | 0.3% |
| Jordan | 24 | 0.2% |
| Latin America | 82 | 0.8% |
| Mexico | 78 | 0.8% |
| Pakistan | 29 | 0.3% |
| Philippines | 8 | 0.1% |
| South America | 4 | 0.0% |
| South Central Asia | 29 | 0.3% |
| South Eastern Asia | 8 | 0.1% |
| Western Asia | 24 | 0.2% |
| Western Europe | 34 | 0.3% | View All 20 Rows |
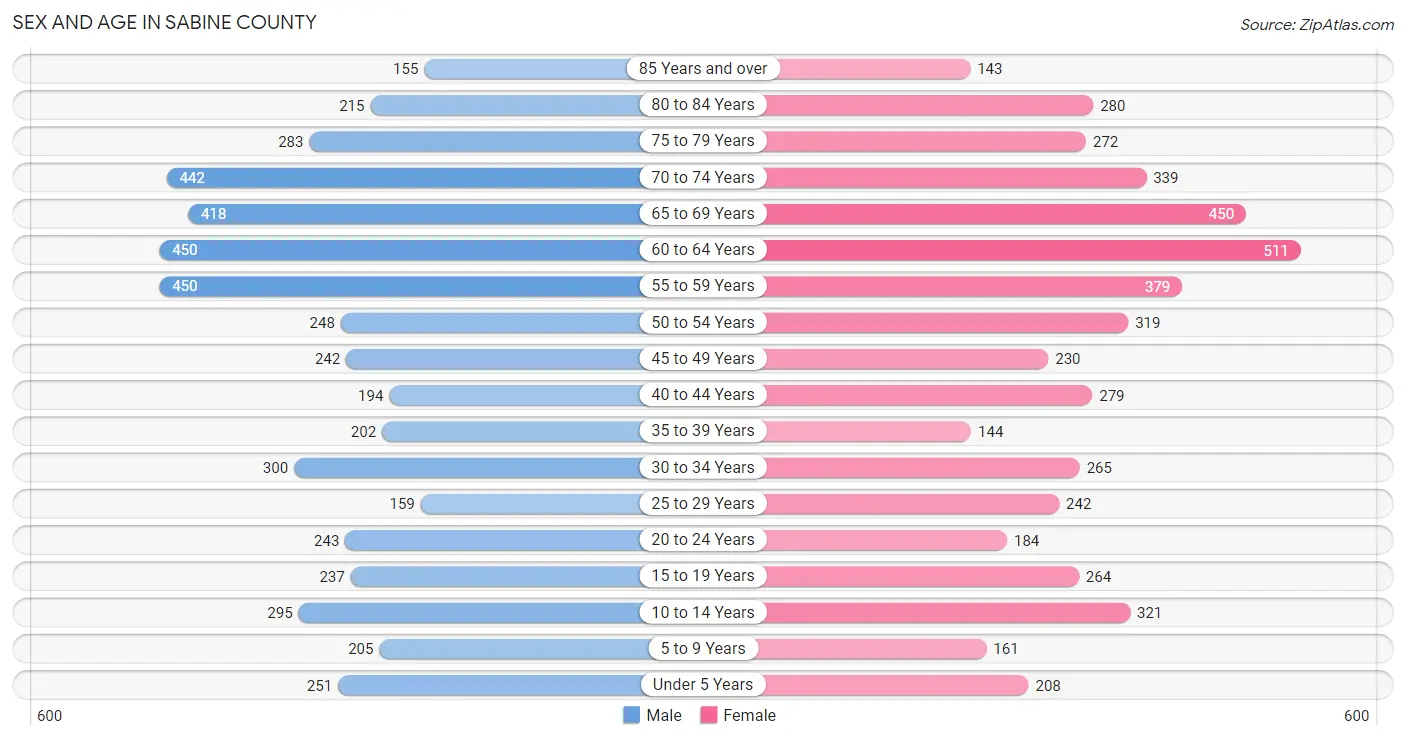
Sex and Age in Sabine County
Sex and Age in Sabine County
The most populous age groups in Sabine County are 55 to 59 Years (450 | 9.0%) for men and 60 to 64 Years (511 | 10.2%) for women.
| Age Bracket | Male | Female |
| Under 5 Years | 251 (5.0%) | 208 (4.2%) |
| 5 to 9 Years | 205 (4.1%) | 161 (3.2%) |
| 10 to 14 Years | 295 (5.9%) | 321 (6.4%) |
| 15 to 19 Years | 237 (4.8%) | 264 (5.3%) |
| 20 to 24 Years | 243 (4.9%) | 184 (3.7%) |
| 25 to 29 Years | 159 (3.2%) | 242 (4.9%) |
| 30 to 34 Years | 300 (6.0%) | 265 (5.3%) |
| 35 to 39 Years | 202 (4.1%) | 144 (2.9%) |
| 40 to 44 Years | 194 (3.9%) | 279 (5.6%) |
| 45 to 49 Years | 242 (4.9%) | 230 (4.6%) |
| 50 to 54 Years | 248 (5.0%) | 319 (6.4%) |
| 55 to 59 Years | 450 (9.0%) | 379 (7.6%) |
| 60 to 64 Years | 450 (9.0%) | 511 (10.2%) |
| 65 to 69 Years | 418 (8.4%) | 450 (9.0%) |
| 70 to 74 Years | 442 (8.9%) | 339 (6.8%) |
| 75 to 79 Years | 283 (5.7%) | 272 (5.4%) |
| 80 to 84 Years | 215 (4.3%) | 280 (5.6%) |
| 85 Years and over | 155 (3.1%) | 143 (2.9%) |
| Total | 4,989 (100.0%) | 4,991 (100.0%) |
Families and Households in Sabine County
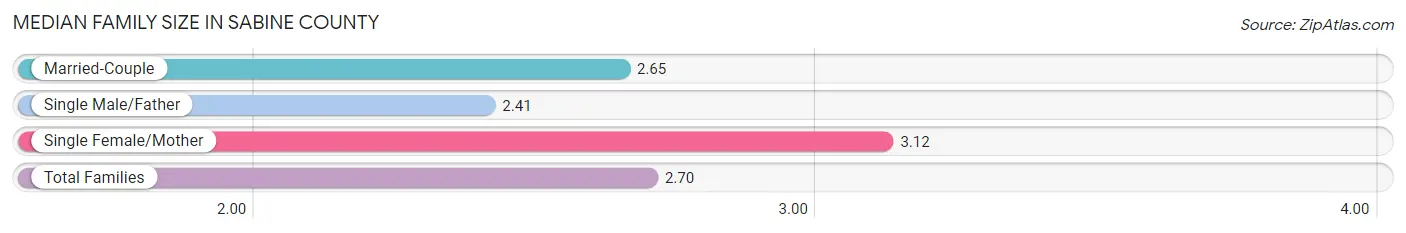
Median Family Size in Sabine County
The median family size in Sabine County is 2.70 persons per family, with single female/mother families (427 | 14.1%) accounting for the largest median family size of 3.12 persons per family. On the other hand, single male/father families (201 | 6.7%) represent the smallest median family size with 2.41 persons per family.
| Family Type | # Families | Family Size |
| Married-Couple | 2,393 (79.2%) | 2.65 |
| Single Male/Father | 201 (6.7%) | 2.41 |
| Single Female/Mother | 427 (14.1%) | 3.12 |
| Total Families | 3,021 (100.0%) | 2.70 |
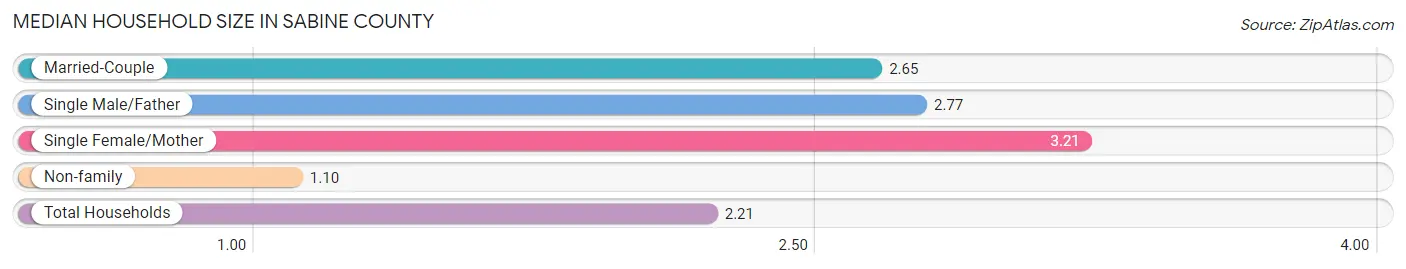
Median Household Size in Sabine County
The median household size in Sabine County is 2.21 persons per household, with single female/mother households (427 | 9.6%) accounting for the largest median household size of 3.21 persons per household. non-family households (1,450 | 32.4%) represent the smallest median household size with 1.10 persons per household.
| Household Type | # Households | Household Size |
| Married-Couple | 2,393 (53.5%) | 2.65 |
| Single Male/Father | 201 (4.5%) | 2.77 |
| Single Female/Mother | 427 (9.6%) | 3.21 |
| Non-family | 1,450 (32.4%) | 1.10 |
| Total Households | 4,471 (100.0%) | 2.21 |
Household Size by Marriage Status in Sabine County
Out of a total of 4,471 households in Sabine County, 3,021 (67.6%) are family households, while 1,450 (32.4%) are nonfamily households. The most numerous type of family households are 2-person households, comprising 1,906, and the most common type of nonfamily households are 1-person households, comprising 1,325.
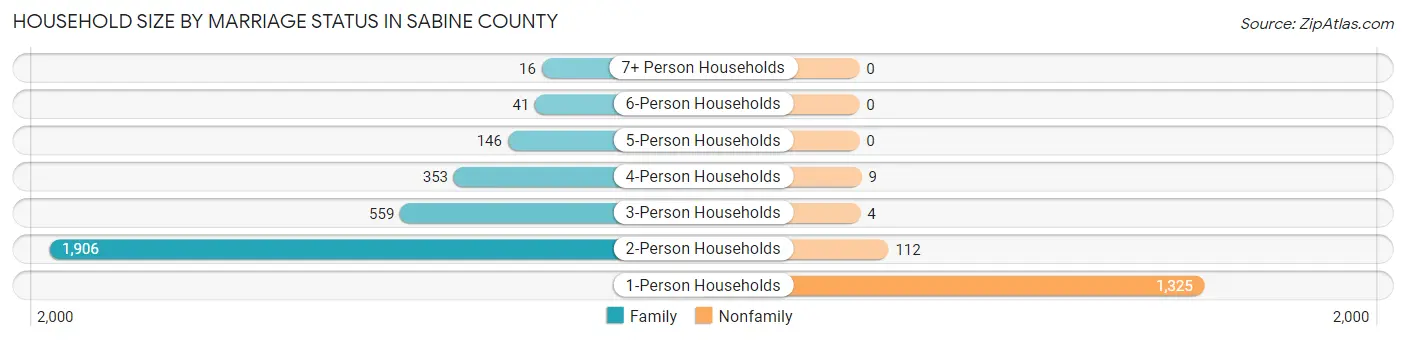
| Household Size | Family Households | Nonfamily Households |
| 1-Person Households | - | 1,325 (29.6%) |
| 2-Person Households | 1,906 (42.6%) | 112 (2.5%) |
| 3-Person Households | 559 (12.5%) | 4 (0.1%) |
| 4-Person Households | 353 (7.9%) | 9 (0.2%) |
| 5-Person Households | 146 (3.3%) | 0 (0.0%) |
| 6-Person Households | 41 (0.9%) | 0 (0.0%) |
| 7+ Person Households | 16 (0.4%) | 0 (0.0%) |
| Total | 3,021 (67.6%) | 1,450 (32.4%) |
Female Fertility in Sabine County
Fertility by Age in Sabine County
Average fertility rate in Sabine County is 109.0 births per 1,000 women. Women in the age bracket of 20 to 34 years have the highest fertility rate with 178.0 births per 1,000 women. Women in the age bracket of 20 to 34 years acount for 66.5% of all women with births.
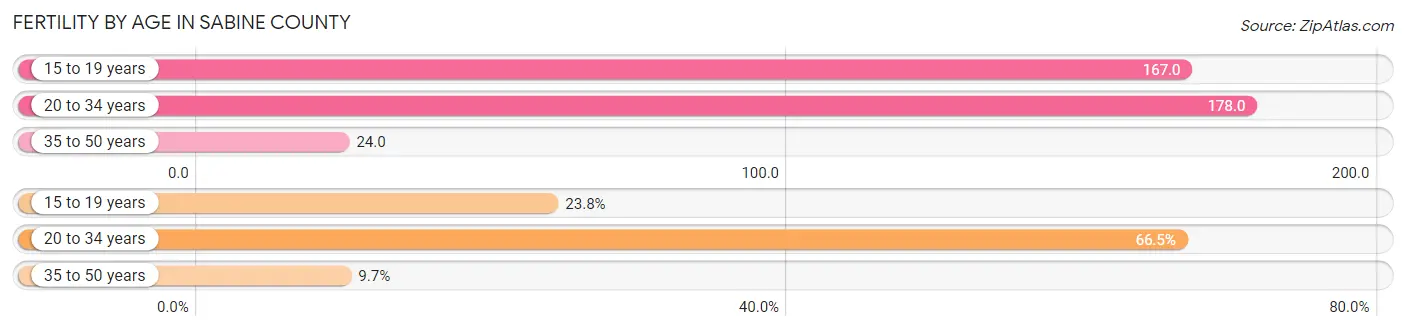
| Age Bracket | Women with Births | Births / 1,000 Women |
| 15 to 19 years | 44 (23.8%) | 167.0 |
| 20 to 34 years | 123 (66.5%) | 178.0 |
| 35 to 50 years | 18 (9.7%) | 24.0 |
| Total | 185 (100.0%) | 109.0 |
Fertility by Age by Marriage Status in Sabine County
61.6% of women with births (185) in Sabine County are married. The highest percentage of unmarried women with births falls into 20 to 34 years age bracket with 40.6% of them unmarried at the time of birth, while the lowest percentage of unmarried women with births belong to 35 to 50 years age bracket with 33.3% of them unmarried.
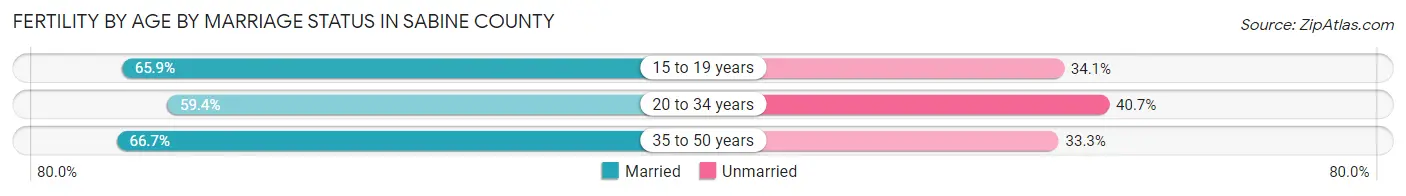
| Age Bracket | Married | Unmarried |
| 15 to 19 years | 29 (65.9%) | 15 (34.1%) |
| 20 to 34 years | 73 (59.4%) | 50 (40.6%) |
| 35 to 50 years | 12 (66.7%) | 6 (33.3%) |
| Total | 114 (61.6%) | 71 (38.4%) |
Fertility by Education in Sabine County
Average fertility rate in Sabine County is 109.0 births per 1,000 women. Women with the education attainment of high school diploma have the highest fertility rate of 177.0 births per 1,000 women, while women with the education attainment of less than high school have the lowest fertility at 42.0 births per 1,000 women. Women with the education attainment of high school diploma represent 54.0% of all women with births.
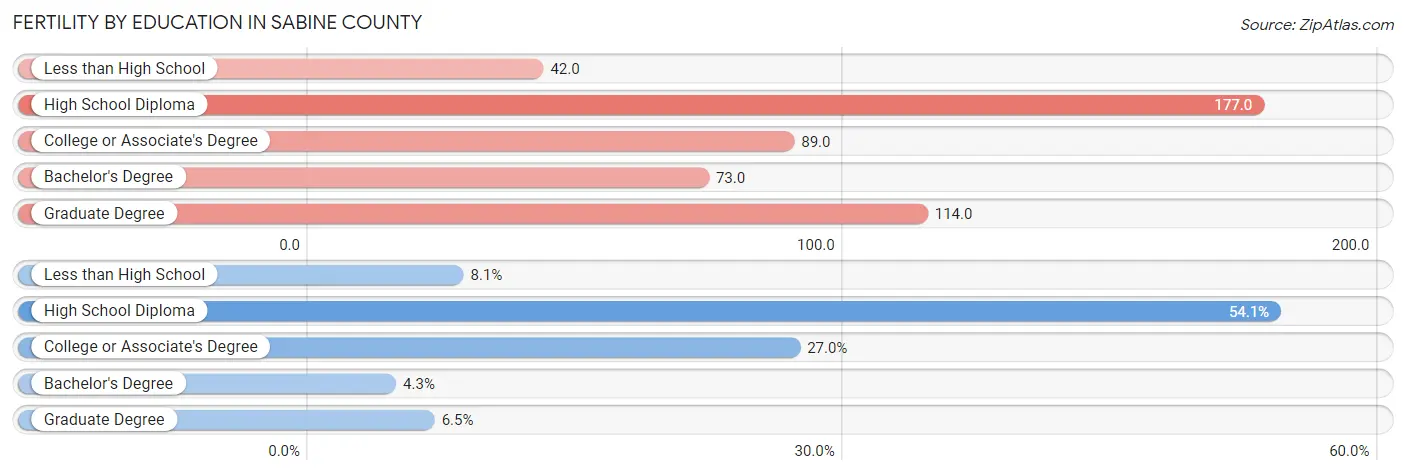
| Educational Attainment | Women with Births | Births / 1,000 Women |
| Less than High School | 15 (8.1%) | 42.0 |
| High School Diploma | 100 (54.0%) | 177.0 |
| College or Associate's Degree | 50 (27.0%) | 89.0 |
| Bachelor's Degree | 8 (4.3%) | 73.0 |
| Graduate Degree | 12 (6.5%) | 114.0 |
| Total | 185 (100.0%) | 109.0 |
Fertility by Education by Marriage Status in Sabine County
38.4% of women with births in Sabine County are unmarried. Women with the educational attainment of bachelor's degree are most likely to be married with 100.0% of them married at childbirth, while women with the educational attainment of less than high school are least likely to be married with 100.0% of them unmarried at childbirth.
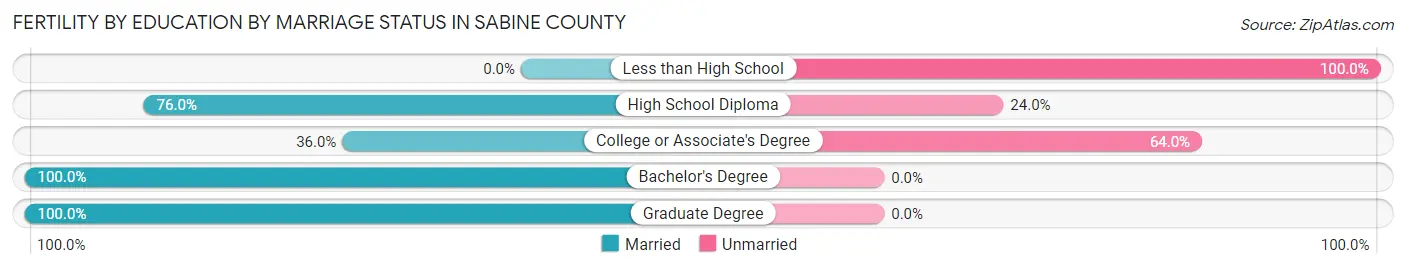
| Educational Attainment | Married | Unmarried |
| Less than High School | 0 (0.0%) | 15 (100.0%) |
| High School Diploma | 76 (76.0%) | 24 (24.0%) |
| College or Associate's Degree | 18 (36.0%) | 32 (64.0%) |
| Bachelor's Degree | 8 (100.0%) | 0 (0.0%) |
| Graduate Degree | 12 (100.0%) | 0 (0.0%) |
| Total | 114 (61.6%) | 71 (38.4%) |
Employment Characteristics in Sabine County
Employment by Class of Employer in Sabine County
Among the 3,029 employed individuals in Sabine County, private company employees (1,890 | 62.4%), local government employees (315 | 10.4%), and state government employees (220 | 7.3%) make up the most common classes of employment.
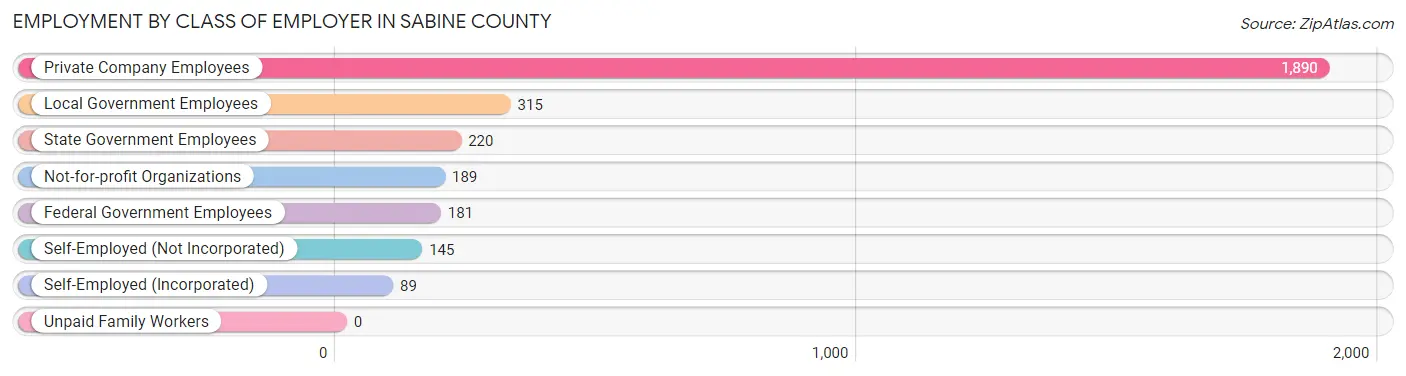
| Employer Class | # Employees | % Employees |
| Private Company Employees | 1,890 | 62.4% |
| Self-Employed (Incorporated) | 89 | 2.9% |
| Self-Employed (Not Incorporated) | 145 | 4.8% |
| Not-for-profit Organizations | 189 | 6.2% |
| Local Government Employees | 315 | 10.4% |
| State Government Employees | 220 | 7.3% |
| Federal Government Employees | 181 | 6.0% |
| Unpaid Family Workers | 0 | 0.0% |
| Total | 3,029 | 100.0% |
Employment Status by Age in Sabine County
According to the labor force statistics for Sabine County, out of the total population over 16 years of age (8,459), 41.2% or 3,485 individuals are in the labor force, with 8.4% or 293 of them unemployed. The age group with the highest labor force participation rate is 30 to 34 years, with 90.6% or 512 individuals in the labor force. Within the labor force, the 16 to 19 years age range has the highest percentage of unemployed individuals, with 41.1% or 39 of them being unemployed.
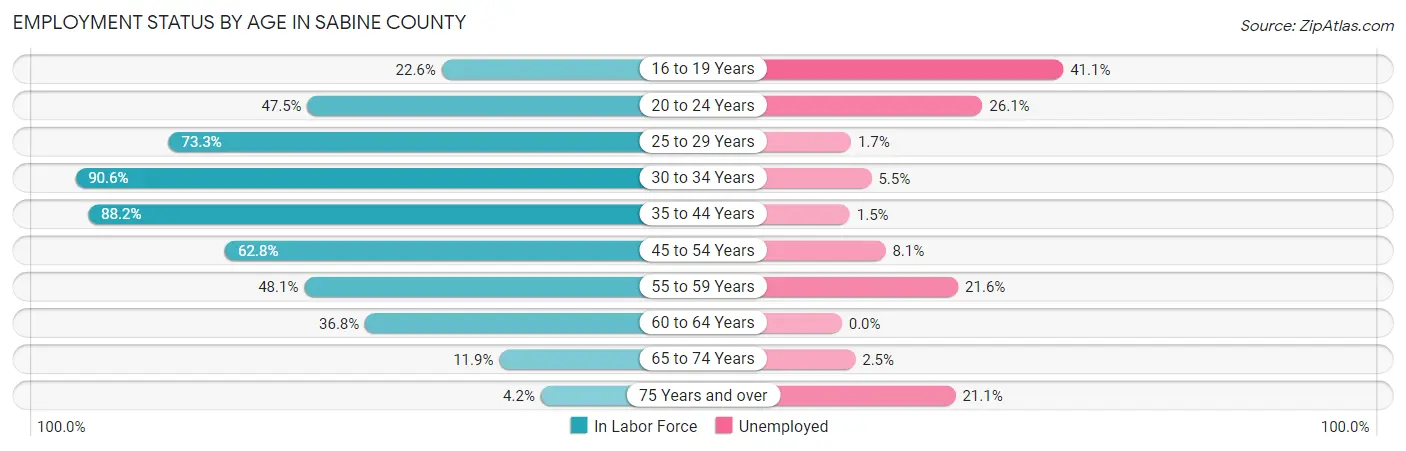
| Age Bracket | In Labor Force | Unemployed |
| 16 to 19 Years | 95 (22.6%) | 39 (41.1%) |
| 20 to 24 Years | 203 (47.5%) | 53 (26.1%) |
| 25 to 29 Years | 294 (73.3%) | 5 (1.7%) |
| 30 to 34 Years | 512 (90.6%) | 28 (5.5%) |
| 35 to 44 Years | 722 (88.2%) | 11 (1.5%) |
| 45 to 54 Years | 652 (62.8%) | 53 (8.1%) |
| 55 to 59 Years | 399 (48.1%) | 86 (21.6%) |
| 60 to 64 Years | 354 (36.8%) | 0 (0.0%) |
| 65 to 74 Years | 196 (11.9%) | 5 (2.5%) |
| 75 Years and over | 57 (4.2%) | 12 (21.1%) |
| Total | 3,485 (41.2%) | 293 (8.4%) |
Employment Status by Educational Attainment in Sabine County
According to labor force statistics for Sabine County, 63.6% of individuals (2,935) out of the total population between 25 and 64 years of age (4,614) are in the labor force, with 6.2% or 182 of them being unemployed. The group with the highest labor force participation rate are those with the educational attainment of bachelor's degree or higher, with 72.0% or 493 individuals in the labor force. Within the labor force, individuals with less than high school education have the highest percentage of unemployment, with 16.8% or 66 of them being unemployed.
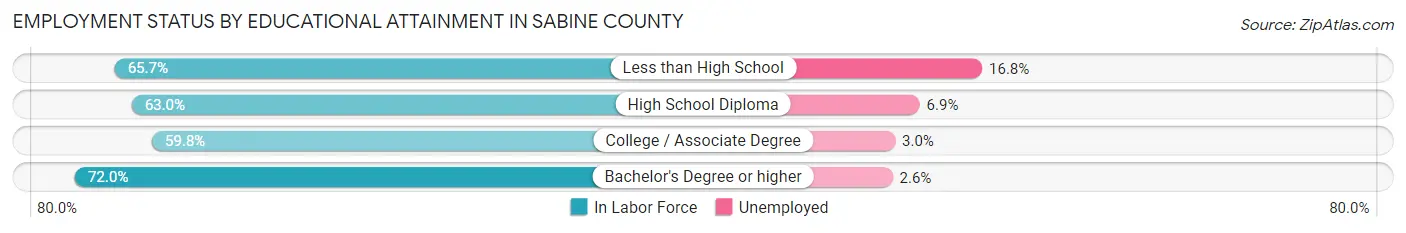
| Educational Attainment | In Labor Force | Unemployed |
| Less than High School | 392 (65.7%) | 100 (16.8%) |
| High School Diploma | 1,084 (63.0%) | 119 (6.9%) |
| College / Associate Degree | 964 (59.8%) | 48 (3.0%) |
| Bachelor's Degree or higher | 493 (72.0%) | 18 (2.6%) |
| Total | 2,935 (63.6%) | 286 (6.2%) |
Employment Occupations by Sex in Sabine County
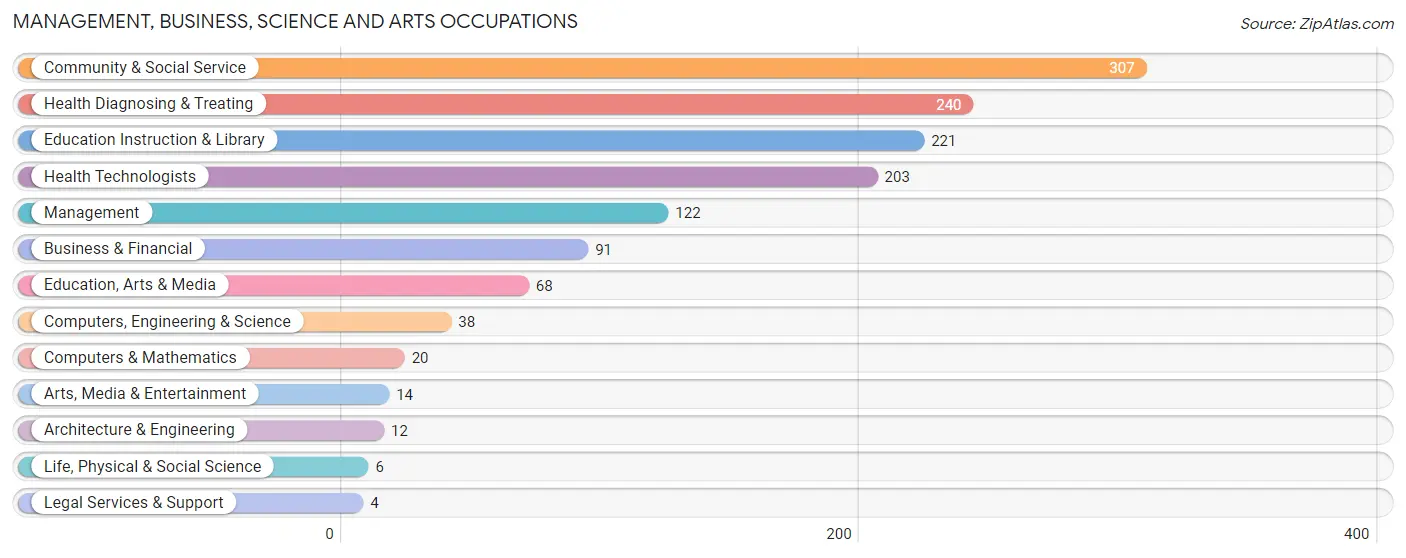
Management, Business, Science and Arts Occupations
The most common Management, Business, Science and Arts occupations in Sabine County are Community & Social Service (307 | 9.6%), Health Diagnosing & Treating (240 | 7.5%), Education Instruction & Library (221 | 6.9%), Health Technologists (203 | 6.4%), and Management (122 | 3.8%).
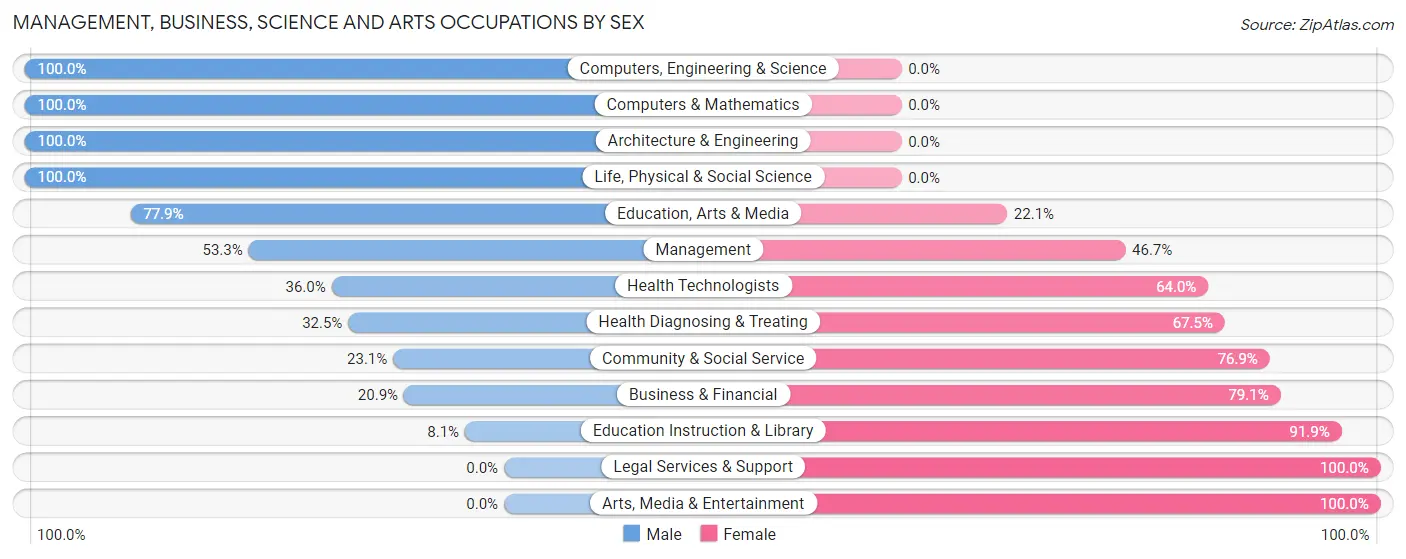
Management, Business, Science and Arts Occupations by Sex
Within the Management, Business, Science and Arts occupations in Sabine County, the most male-oriented occupations are Computers, Engineering & Science (100.0%), Computers & Mathematics (100.0%), and Architecture & Engineering (100.0%), while the most female-oriented occupations are Legal Services & Support (100.0%), Arts, Media & Entertainment (100.0%), and Education Instruction & Library (91.9%).
| Occupation | Male | Female |
| Management | 65 (53.3%) | 57 (46.7%) |
| Business & Financial | 19 (20.9%) | 72 (79.1%) |
| Computers, Engineering & Science | 38 (100.0%) | 0 (0.0%) |
| Computers & Mathematics | 20 (100.0%) | 0 (0.0%) |
| Architecture & Engineering | 12 (100.0%) | 0 (0.0%) |
| Life, Physical & Social Science | 6 (100.0%) | 0 (0.0%) |
| Community & Social Service | 71 (23.1%) | 236 (76.9%) |
| Education, Arts & Media | 53 (77.9%) | 15 (22.1%) |
| Legal Services & Support | 0 (0.0%) | 4 (100.0%) |
| Education Instruction & Library | 18 (8.1%) | 203 (91.9%) |
| Arts, Media & Entertainment | 0 (0.0%) | 14 (100.0%) |
| Health Diagnosing & Treating | 78 (32.5%) | 162 (67.5%) |
| Health Technologists | 73 (36.0%) | 130 (64.0%) |
| Total (Category) | 271 (34.0%) | 527 (66.0%) |
| Total (Overall) | 1,615 (50.6%) | 1,578 (49.4%) |
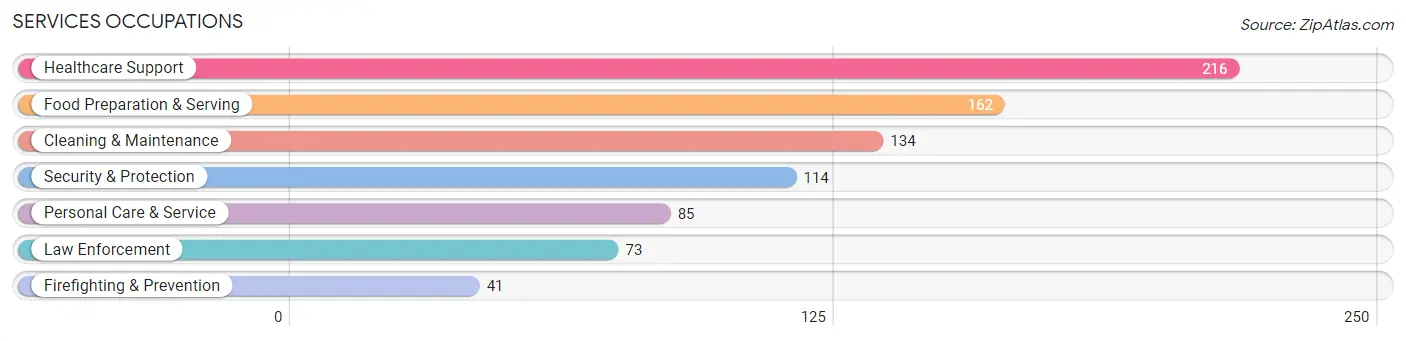
Services Occupations
The most common Services occupations in Sabine County are Healthcare Support (216 | 6.8%), Food Preparation & Serving (162 | 5.1%), Cleaning & Maintenance (134 | 4.2%), Security & Protection (114 | 3.6%), and Personal Care & Service (85 | 2.7%).
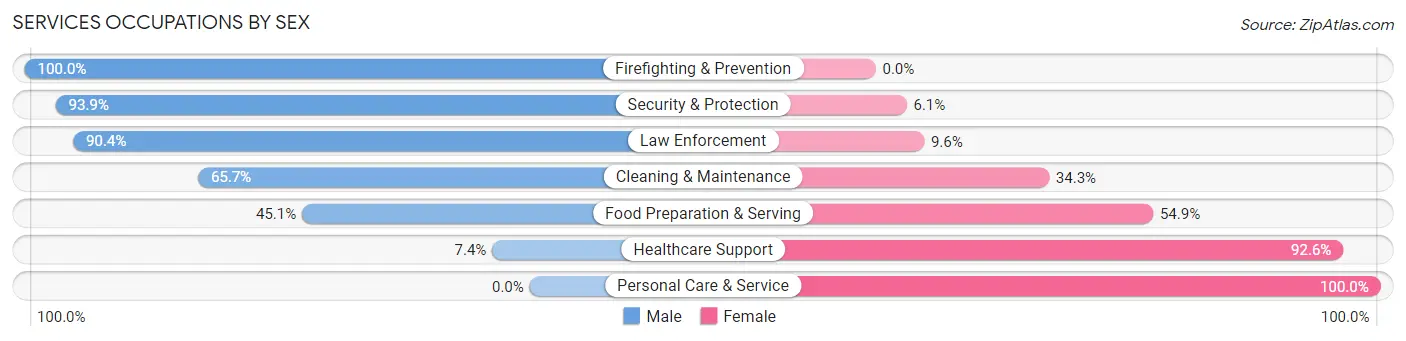
Services Occupations by Sex
Within the Services occupations in Sabine County, the most male-oriented occupations are Firefighting & Prevention (100.0%), Security & Protection (93.9%), and Law Enforcement (90.4%), while the most female-oriented occupations are Personal Care & Service (100.0%), Healthcare Support (92.6%), and Food Preparation & Serving (54.9%).
| Occupation | Male | Female |
| Healthcare Support | 16 (7.4%) | 200 (92.6%) |
| Security & Protection | 107 (93.9%) | 7 (6.1%) |
| Firefighting & Prevention | 41 (100.0%) | 0 (0.0%) |
| Law Enforcement | 66 (90.4%) | 7 (9.6%) |
| Food Preparation & Serving | 73 (45.1%) | 89 (54.9%) |
| Cleaning & Maintenance | 88 (65.7%) | 46 (34.3%) |
| Personal Care & Service | 0 (0.0%) | 85 (100.0%) |
| Total (Category) | 284 (39.9%) | 427 (60.1%) |
| Total (Overall) | 1,615 (50.6%) | 1,578 (49.4%) |
Sales and Office Occupations
The most common Sales and Office occupations in Sabine County are Office & Administration (380 | 11.9%), and Sales & Related (352 | 11.0%).
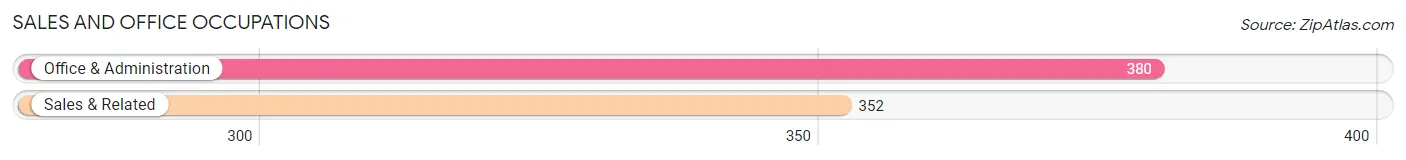
Sales and Office Occupations by Sex
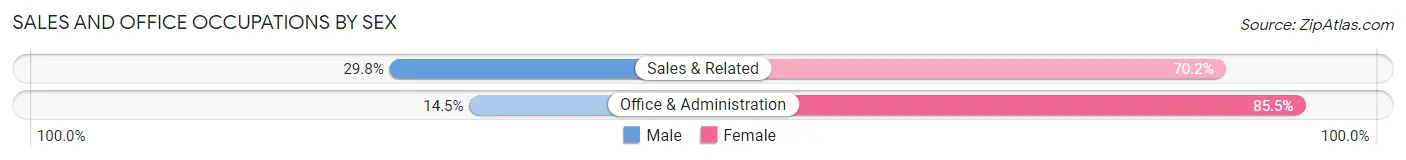
| Occupation | Male | Female |
| Sales & Related | 105 (29.8%) | 247 (70.2%) |
| Office & Administration | 55 (14.5%) | 325 (85.5%) |
| Total (Category) | 160 (21.9%) | 572 (78.1%) |
| Total (Overall) | 1,615 (50.6%) | 1,578 (49.4%) |
Natural Resources, Construction and Maintenance Occupations
The most common Natural Resources, Construction and Maintenance occupations in Sabine County are Construction & Extraction (273 | 8.6%), Installation, Maintenance & Repair (143 | 4.5%), and Farming, Fishing & Forestry (37 | 1.2%).
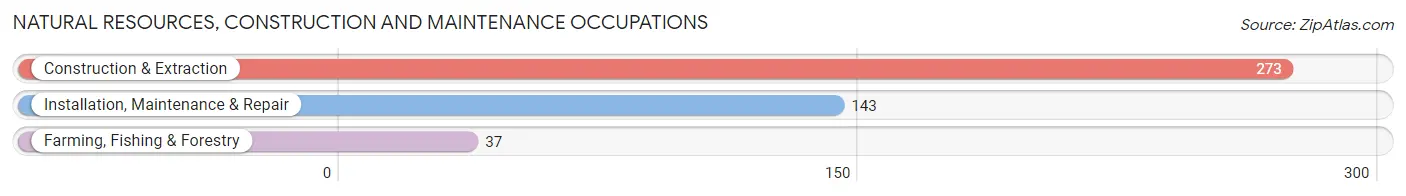
Natural Resources, Construction and Maintenance Occupations by Sex
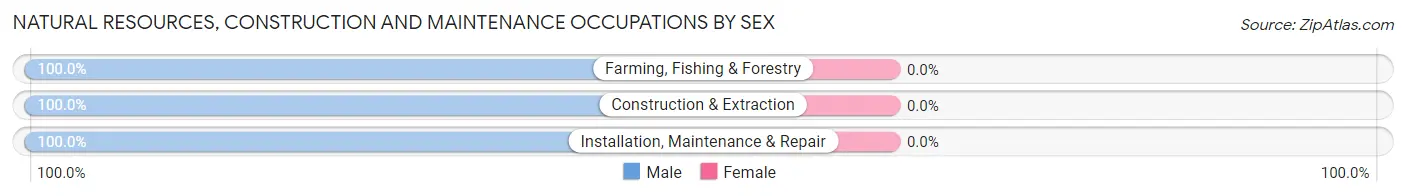
| Occupation | Male | Female |
| Farming, Fishing & Forestry | 37 (100.0%) | 0 (0.0%) |
| Construction & Extraction | 273 (100.0%) | 0 (0.0%) |
| Installation, Maintenance & Repair | 143 (100.0%) | 0 (0.0%) |
| Total (Category) | 453 (100.0%) | 0 (0.0%) |
| Total (Overall) | 1,615 (50.6%) | 1,578 (49.4%) |
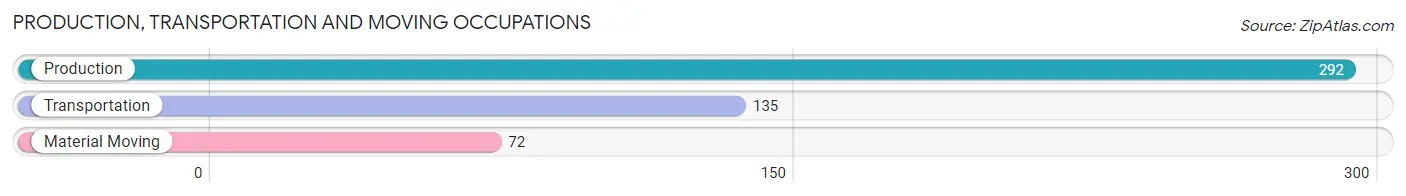
Production, Transportation and Moving Occupations
The most common Production, Transportation and Moving occupations in Sabine County are Production (292 | 9.1%), Transportation (135 | 4.2%), and Material Moving (72 | 2.2%).
Production, Transportation and Moving Occupations by Sex
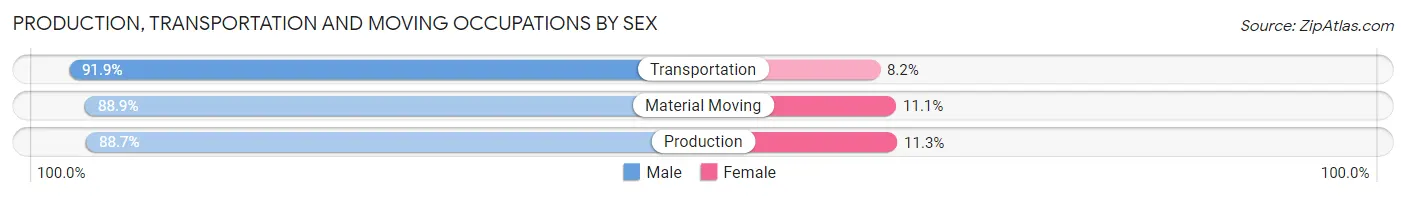
| Occupation | Male | Female |
| Production | 259 (88.7%) | 33 (11.3%) |
| Transportation | 124 (91.8%) | 11 (8.2%) |
| Material Moving | 64 (88.9%) | 8 (11.1%) |
| Total (Category) | 447 (89.6%) | 52 (10.4%) |
| Total (Overall) | 1,615 (50.6%) | 1,578 (49.4%) |
Employment Industries by Sex in Sabine County
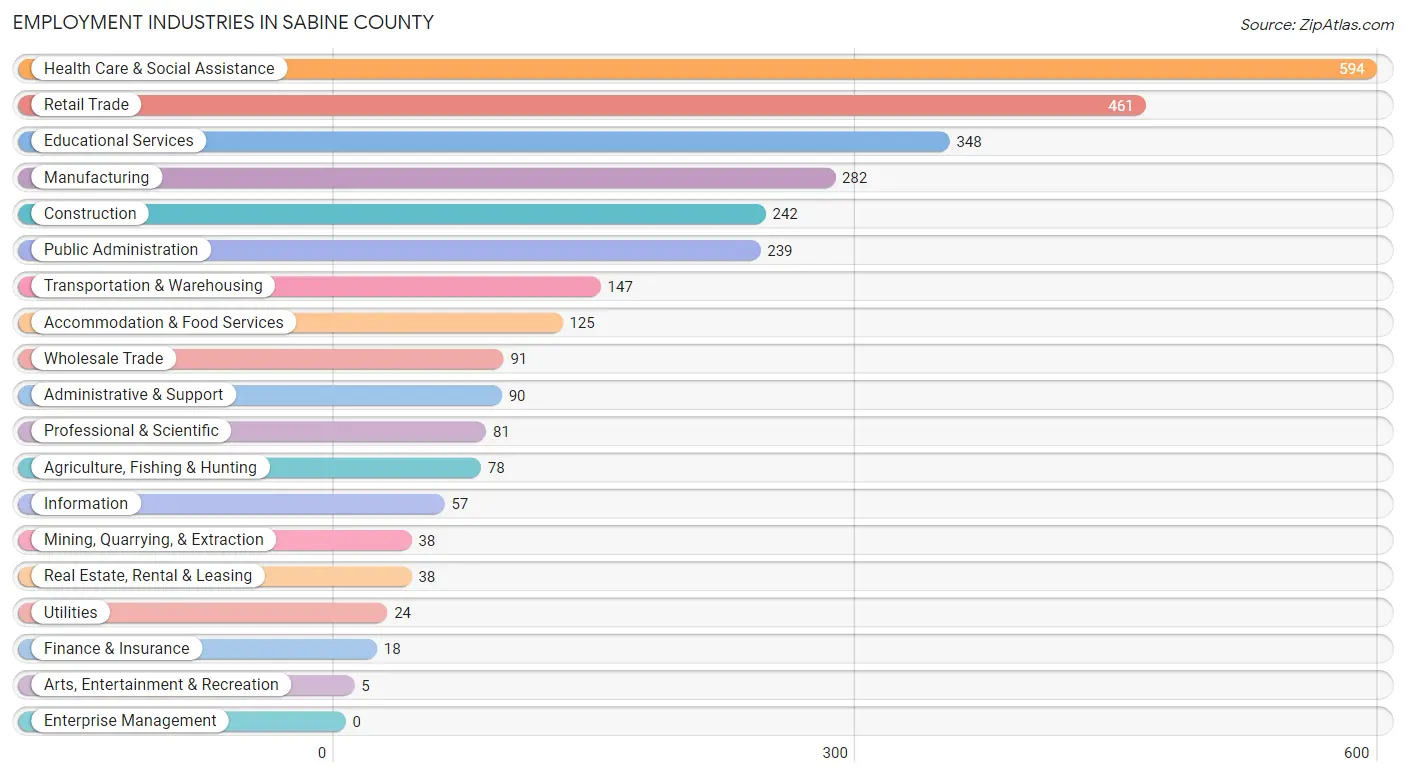
Employment Industries in Sabine County
The major employment industries in Sabine County include Health Care & Social Assistance (594 | 18.6%), Retail Trade (461 | 14.4%), Educational Services (348 | 10.9%), Manufacturing (282 | 8.8%), and Construction (242 | 7.6%).
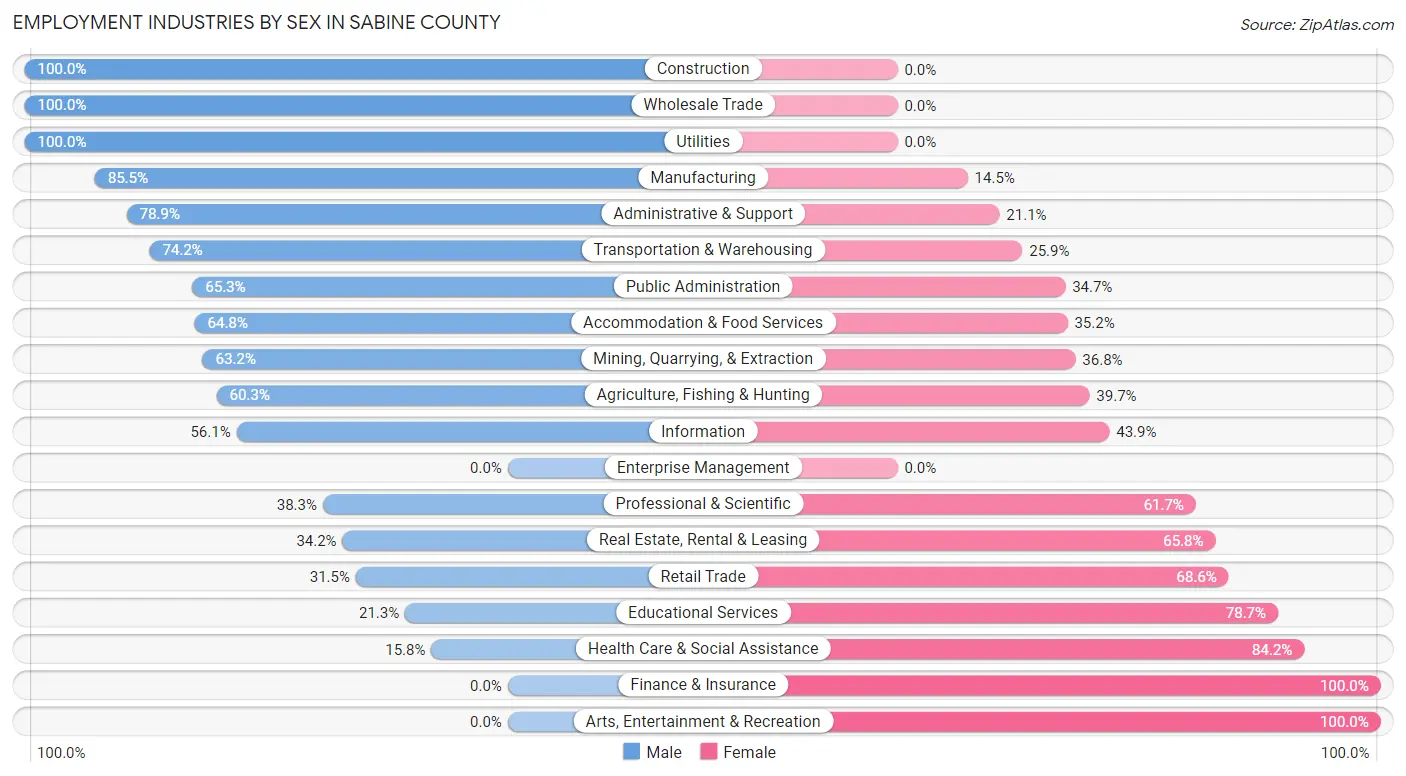
Employment Industries by Sex in Sabine County
The Sabine County industries that see more men than women are Construction (100.0%), Wholesale Trade (100.0%), and Utilities (100.0%), whereas the industries that tend to have a higher number of women are Finance & Insurance (100.0%), Arts, Entertainment & Recreation (100.0%), and Health Care & Social Assistance (84.2%).
| Industry | Male | Female |
| Agriculture, Fishing & Hunting | 47 (60.3%) | 31 (39.7%) |
| Mining, Quarrying, & Extraction | 24 (63.2%) | 14 (36.8%) |
| Construction | 242 (100.0%) | 0 (0.0%) |
| Manufacturing | 241 (85.5%) | 41 (14.5%) |
| Wholesale Trade | 91 (100.0%) | 0 (0.0%) |
| Retail Trade | 145 (31.5%) | 316 (68.5%) |
| Transportation & Warehousing | 109 (74.2%) | 38 (25.9%) |
| Utilities | 24 (100.0%) | 0 (0.0%) |
| Information | 32 (56.1%) | 25 (43.9%) |
| Finance & Insurance | 0 (0.0%) | 18 (100.0%) |
| Real Estate, Rental & Leasing | 13 (34.2%) | 25 (65.8%) |
| Professional & Scientific | 31 (38.3%) | 50 (61.7%) |
| Enterprise Management | 0 (0.0%) | 0 (0.0%) |
| Administrative & Support | 71 (78.9%) | 19 (21.1%) |
| Educational Services | 74 (21.3%) | 274 (78.7%) |
| Health Care & Social Assistance | 94 (15.8%) | 500 (84.2%) |
| Arts, Entertainment & Recreation | 0 (0.0%) | 5 (100.0%) |
| Accommodation & Food Services | 81 (64.8%) | 44 (35.2%) |
| Public Administration | 156 (65.3%) | 83 (34.7%) |
| Total | 1,615 (50.6%) | 1,578 (49.4%) |
Education in Sabine County
School Enrollment in Sabine County
The most common levels of schooling among the 1,611 students in Sabine County are high school (538 | 33.4%), middle school (466 | 28.9%), and elementary school (216 | 13.4%).
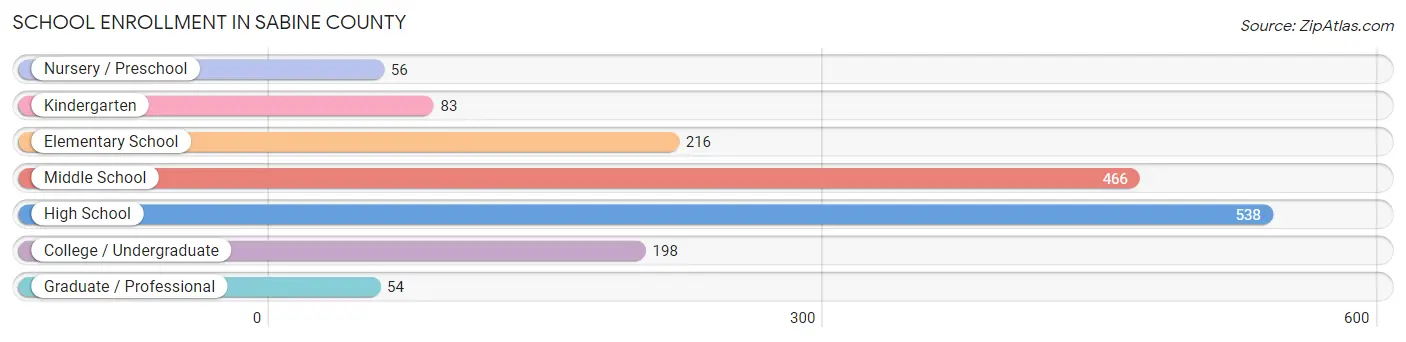
| School Level | # Students | % Students |
| Nursery / Preschool | 56 | 3.5% |
| Kindergarten | 83 | 5.1% |
| Elementary School | 216 | 13.4% |
| Middle School | 466 | 28.9% |
| High School | 538 | 33.4% |
| College / Undergraduate | 198 | 12.3% |
| Graduate / Professional | 54 | 3.4% |
| Total | 1,611 | 100.0% |
School Enrollment by Age by Funding Source in Sabine County
Out of a total of 1,611 students who are enrolled in schools in Sabine County, 140 (8.7%) attend a private institution, while the remaining 1,471 (91.3%) are enrolled in public schools. The age group of 3 to 4 year olds has the highest likelihood of being enrolled in private schools, with 38 (73.1% in the age bracket) enrolled. Conversely, the age group of 5 to 9 year old has the lowest likelihood of being enrolled in a private school, with 271 (100.0% in the age bracket) attending a public institution.
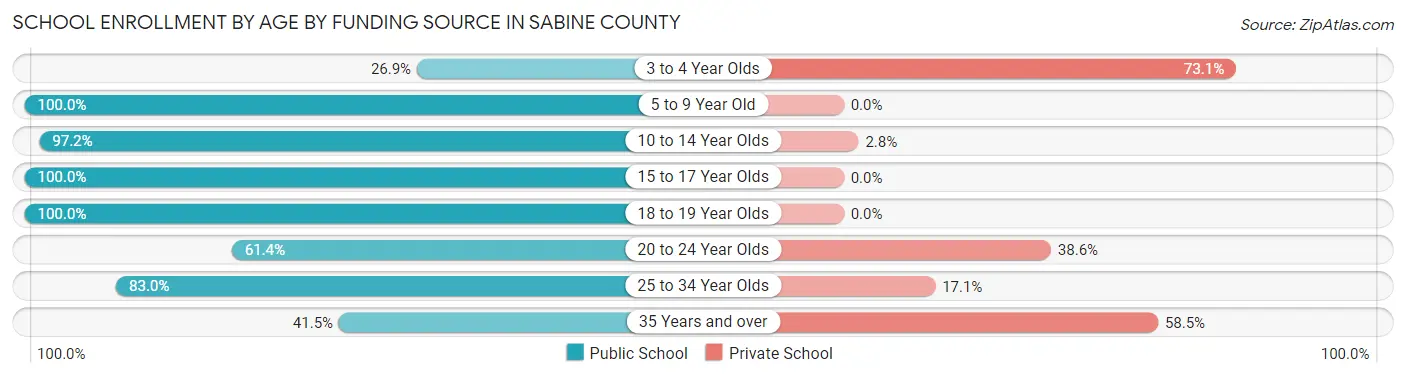
| Age Bracket | Public School | Private School |
| 3 to 4 Year Olds | 14 (26.9%) | 38 (73.1%) |
| 5 to 9 Year Old | 271 (100.0%) | 0 (0.0%) |
| 10 to 14 Year Olds | 599 (97.2%) | 17 (2.8%) |
| 15 to 17 Year Olds | 301 (100.0%) | 0 (0.0%) |
| 18 to 19 Year Olds | 144 (100.0%) | 0 (0.0%) |
| 20 to 24 Year Olds | 35 (61.4%) | 22 (38.6%) |
| 25 to 34 Year Olds | 73 (83.0%) | 15 (17.1%) |
| 35 Years and over | 34 (41.5%) | 48 (58.5%) |
| Total | 1,471 (91.3%) | 140 (8.7%) |
Educational Attainment by Field of Study in Sabine County
Education (338 | 22.5%), business (204 | 13.6%), bio, nature & agricultural (196 | 13.1%), engineering (126 | 8.4%), and social sciences (110 | 7.3%) are the most common fields of study among 1,502 individuals in Sabine County who have obtained a bachelor's degree or higher.
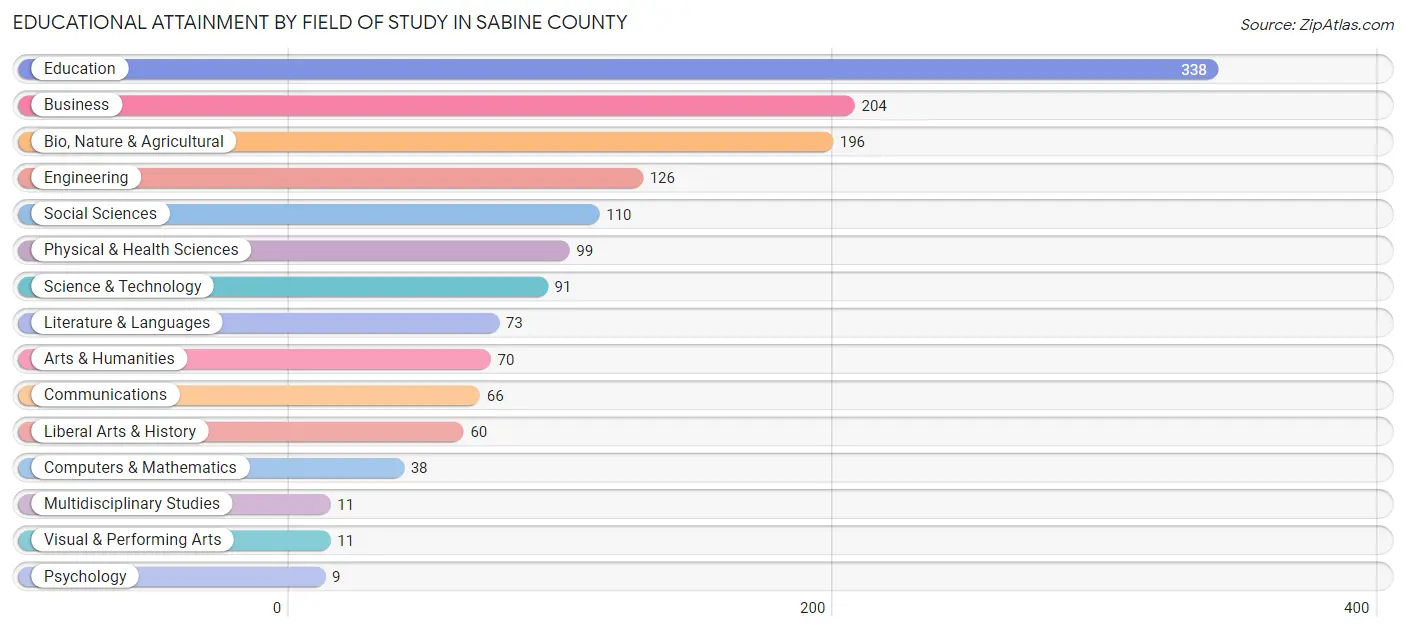
| Field of Study | # Graduates | % Graduates |
| Computers & Mathematics | 38 | 2.5% |
| Bio, Nature & Agricultural | 196 | 13.1% |
| Physical & Health Sciences | 99 | 6.6% |
| Psychology | 9 | 0.6% |
| Social Sciences | 110 | 7.3% |
| Engineering | 126 | 8.4% |
| Multidisciplinary Studies | 11 | 0.7% |
| Science & Technology | 91 | 6.1% |
| Business | 204 | 13.6% |
| Education | 338 | 22.5% |
| Literature & Languages | 73 | 4.9% |
| Liberal Arts & History | 60 | 4.0% |
| Visual & Performing Arts | 11 | 0.7% |
| Communications | 66 | 4.4% |
| Arts & Humanities | 70 | 4.7% |
| Total | 1,502 | 100.0% |
Transportation & Commute in Sabine County
Vehicle Availability by Sex in Sabine County
The most prevalent vehicle ownership categories in Sabine County are males with 2 vehicles (802, accounting for 52.4%) and females with 2 vehicles (567, making up 53.5%).
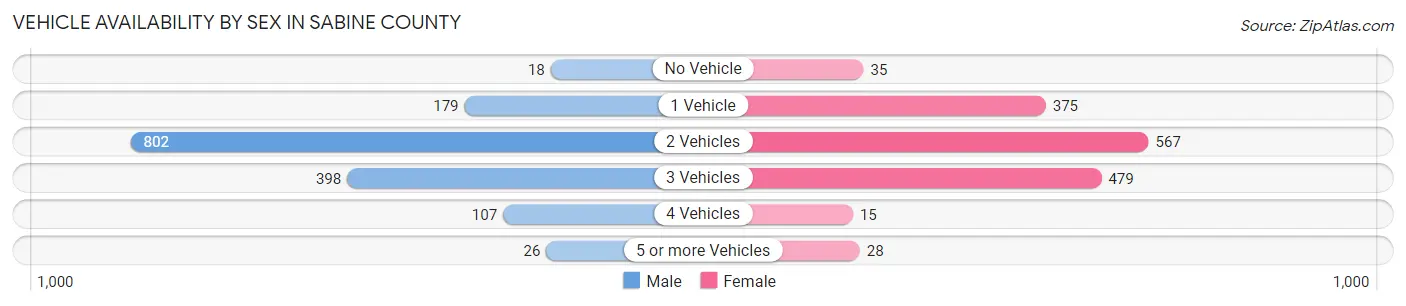
| Vehicles Available | Male | Female |
| No Vehicle | 18 (1.2%) | 35 (2.3%) |
| 1 Vehicle | 179 (11.7%) | 375 (25.0%) |
| 2 Vehicles | 802 (52.4%) | 567 (37.8%) |
| 3 Vehicles | 398 (26.0%) | 479 (32.0%) |
| 4 Vehicles | 107 (7.0%) | 15 (1.0%) |
| 5 or more Vehicles | 26 (1.7%) | 28 (1.9%) |
| Total | 1,530 (100.0%) | 1,499 (100.0%) |
Commute Time in Sabine County
The most frequently occuring commute durations in Sabine County are 15 to 19 minutes (514 commuters, 18.1%), 5 to 9 minutes (480 commuters, 16.9%), and 45 to 59 minutes (386 commuters, 13.6%).
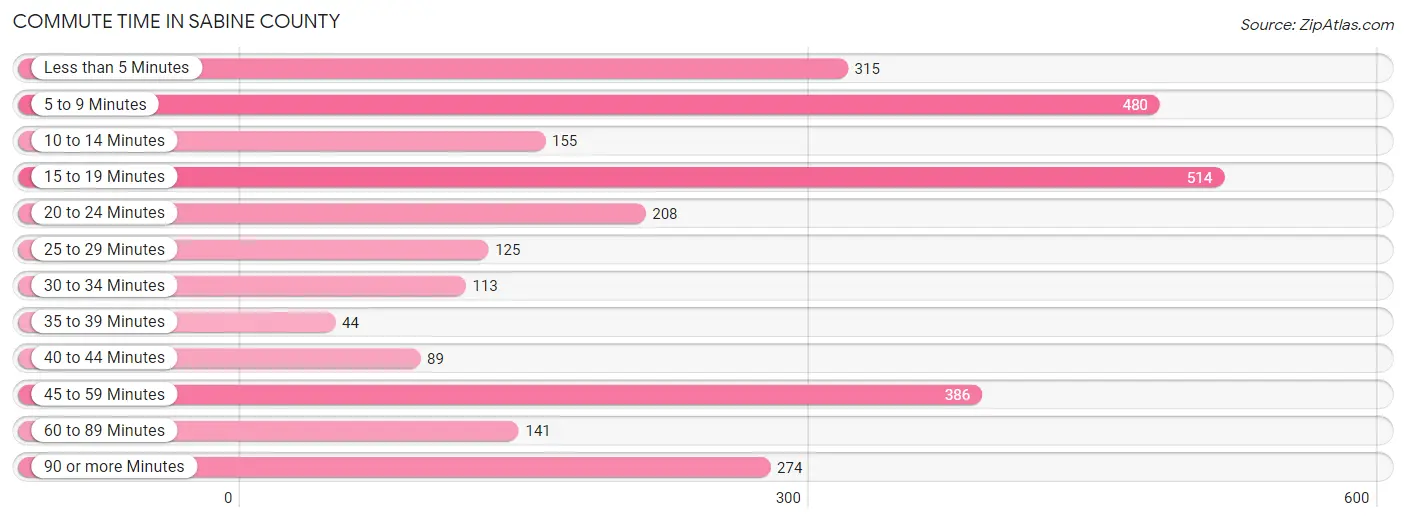
| Commute Time | # Commuters | % Commuters |
| Less than 5 Minutes | 315 | 11.1% |
| 5 to 9 Minutes | 480 | 16.9% |
| 10 to 14 Minutes | 155 | 5.4% |
| 15 to 19 Minutes | 514 | 18.1% |
| 20 to 24 Minutes | 208 | 7.3% |
| 25 to 29 Minutes | 125 | 4.4% |
| 30 to 34 Minutes | 113 | 4.0% |
| 35 to 39 Minutes | 44 | 1.5% |
| 40 to 44 Minutes | 89 | 3.1% |
| 45 to 59 Minutes | 386 | 13.6% |
| 60 to 89 Minutes | 141 | 5.0% |
| 90 or more Minutes | 274 | 9.6% |
Commute Time by Sex in Sabine County
The most common commute times in Sabine County are 15 to 19 minutes (267 commuters, 18.1%) for males and 5 to 9 minutes (296 commuters, 21.6%) for females.
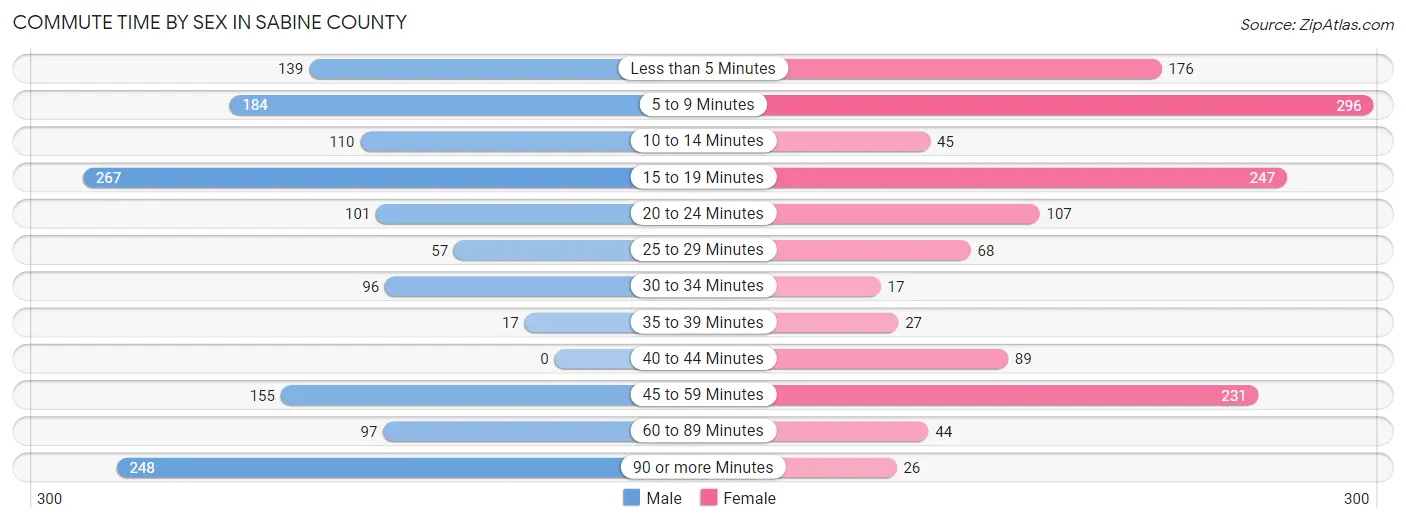
| Commute Time | Male | Female |
| Less than 5 Minutes | 139 (9.5%) | 176 (12.8%) |
| 5 to 9 Minutes | 184 (12.5%) | 296 (21.6%) |
| 10 to 14 Minutes | 110 (7.5%) | 45 (3.3%) |
| 15 to 19 Minutes | 267 (18.1%) | 247 (18.0%) |
| 20 to 24 Minutes | 101 (6.9%) | 107 (7.8%) |
| 25 to 29 Minutes | 57 (3.9%) | 68 (5.0%) |
| 30 to 34 Minutes | 96 (6.5%) | 17 (1.2%) |
| 35 to 39 Minutes | 17 (1.2%) | 27 (2.0%) |
| 40 to 44 Minutes | 0 (0.0%) | 89 (6.5%) |
| 45 to 59 Minutes | 155 (10.5%) | 231 (16.8%) |
| 60 to 89 Minutes | 97 (6.6%) | 44 (3.2%) |
| 90 or more Minutes | 248 (16.9%) | 26 (1.9%) |
Time of Departure to Work by Sex in Sabine County
The most frequent times of departure to work in Sabine County are 12:00 AM to 4:59 AM (297, 20.2%) for males and 7:00 AM to 7:29 AM (254, 18.5%) for females.
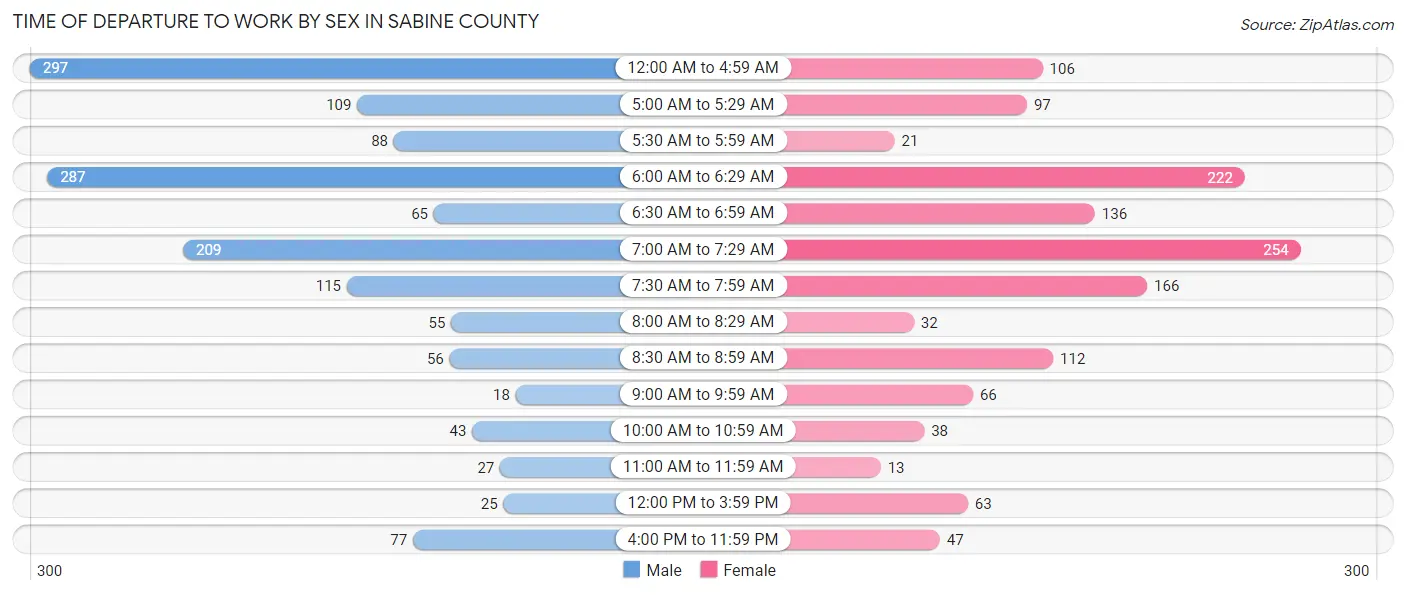
| Time of Departure | Male | Female |
| 12:00 AM to 4:59 AM | 297 (20.2%) | 106 (7.7%) |
| 5:00 AM to 5:29 AM | 109 (7.4%) | 97 (7.1%) |
| 5:30 AM to 5:59 AM | 88 (6.0%) | 21 (1.5%) |
| 6:00 AM to 6:29 AM | 287 (19.5%) | 222 (16.2%) |
| 6:30 AM to 6:59 AM | 65 (4.4%) | 136 (9.9%) |
| 7:00 AM to 7:29 AM | 209 (14.2%) | 254 (18.5%) |
| 7:30 AM to 7:59 AM | 115 (7.8%) | 166 (12.1%) |
| 8:00 AM to 8:29 AM | 55 (3.7%) | 32 (2.3%) |
| 8:30 AM to 8:59 AM | 56 (3.8%) | 112 (8.2%) |
| 9:00 AM to 9:59 AM | 18 (1.2%) | 66 (4.8%) |
| 10:00 AM to 10:59 AM | 43 (2.9%) | 38 (2.8%) |
| 11:00 AM to 11:59 AM | 27 (1.8%) | 13 (0.9%) |
| 12:00 PM to 3:59 PM | 25 (1.7%) | 63 (4.6%) |
| 4:00 PM to 11:59 PM | 77 (5.2%) | 47 (3.4%) |
| Total | 1,471 (100.0%) | 1,373 (100.0%) |
Housing Occupancy in Sabine County
Occupancy by Ownership in Sabine County
Of the total 4,471 dwellings in Sabine County, owner-occupied units account for 3,793 (84.8%), while renter-occupied units make up 678 (15.2%).
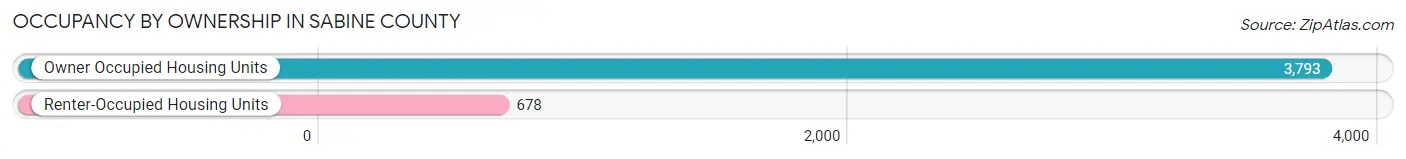
| Occupancy | # Housing Units | % Housing Units |
| Owner Occupied Housing Units | 3,793 | 84.8% |
| Renter-Occupied Housing Units | 678 | 15.2% |
| Total Occupied Housing Units | 4,471 | 100.0% |
Occupancy by Household Size in Sabine County
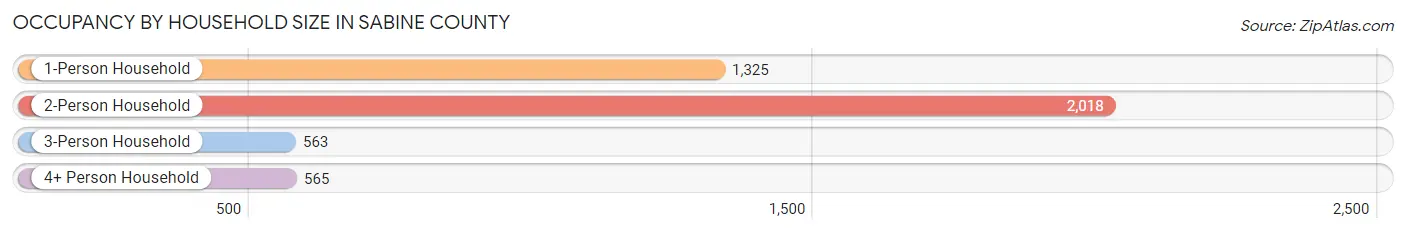
| Household Size | # Housing Units | % Housing Units |
| 1-Person Household | 1,325 | 29.6% |
| 2-Person Household | 2,018 | 45.1% |
| 3-Person Household | 563 | 12.6% |
| 4+ Person Household | 565 | 12.6% |
| Total Housing Units | 4,471 | 100.0% |
Occupancy by Ownership by Household Size in Sabine County
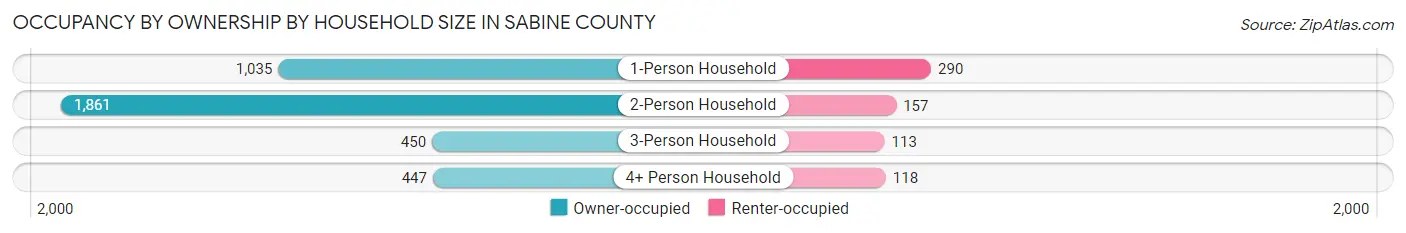
| Household Size | Owner-occupied | Renter-occupied |
| 1-Person Household | 1,035 (78.1%) | 290 (21.9%) |
| 2-Person Household | 1,861 (92.2%) | 157 (7.8%) |
| 3-Person Household | 450 (79.9%) | 113 (20.1%) |
| 4+ Person Household | 447 (79.1%) | 118 (20.9%) |
| Total Housing Units | 3,793 (84.8%) | 678 (15.2%) |
Occupancy by Educational Attainment in Sabine County
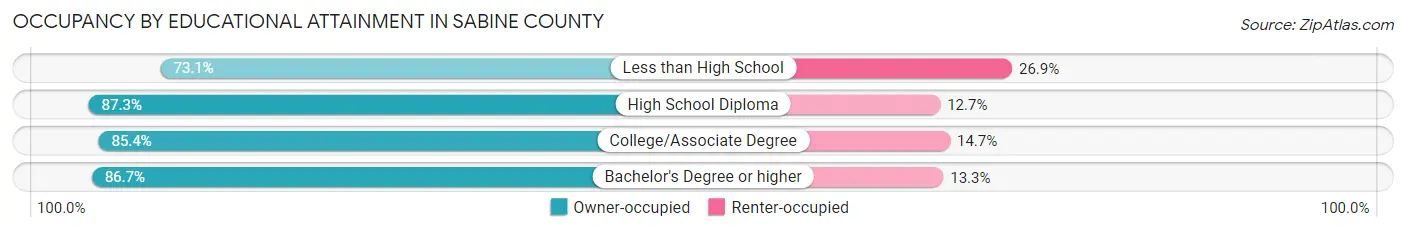
| Household Size | Owner-occupied | Renter-occupied |
| Less than High School | 377 (73.1%) | 139 (26.9%) |
| High School Diploma | 1,196 (87.3%) | 174 (12.7%) |
| College/Associate Degree | 1,334 (85.4%) | 229 (14.6%) |
| Bachelor's Degree or higher | 886 (86.7%) | 136 (13.3%) |
Occupancy by Age of Householder in Sabine County
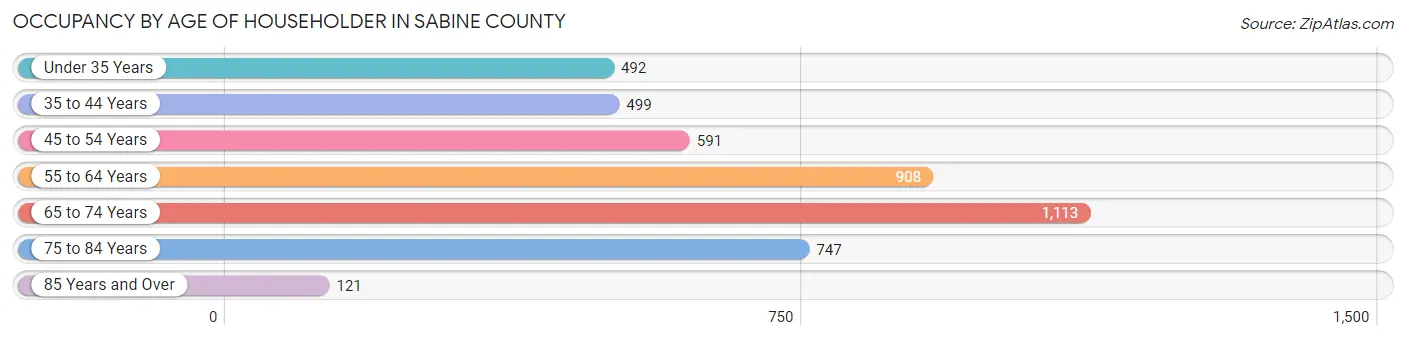
| Age Bracket | # Households | % Households |
| Under 35 Years | 492 | 11.0% |
| 35 to 44 Years | 499 | 11.2% |
| 45 to 54 Years | 591 | 13.2% |
| 55 to 64 Years | 908 | 20.3% |
| 65 to 74 Years | 1,113 | 24.9% |
| 75 to 84 Years | 747 | 16.7% |
| 85 Years and Over | 121 | 2.7% |
| Total | 4,471 | 100.0% |
Housing Finances in Sabine County
Median Income by Occupancy in Sabine County
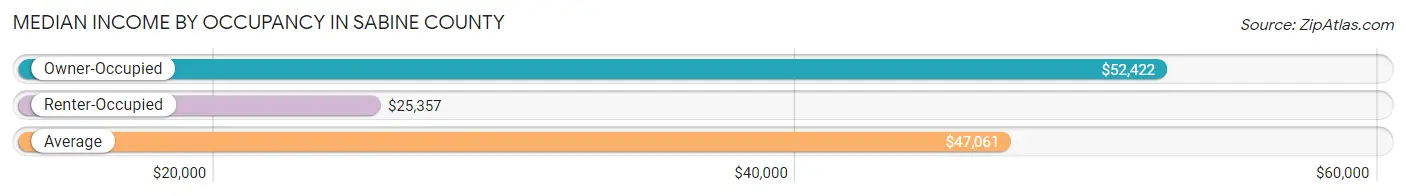
| Occupancy Type | # Households | Median Income |
| Owner-Occupied | 3,793 (84.8%) | $52,422 |
| Renter-Occupied | 678 (15.2%) | $25,357 |
| Average | 4,471 (100.0%) | $47,061 |
Occupancy by Householder Income Bracket in Sabine County
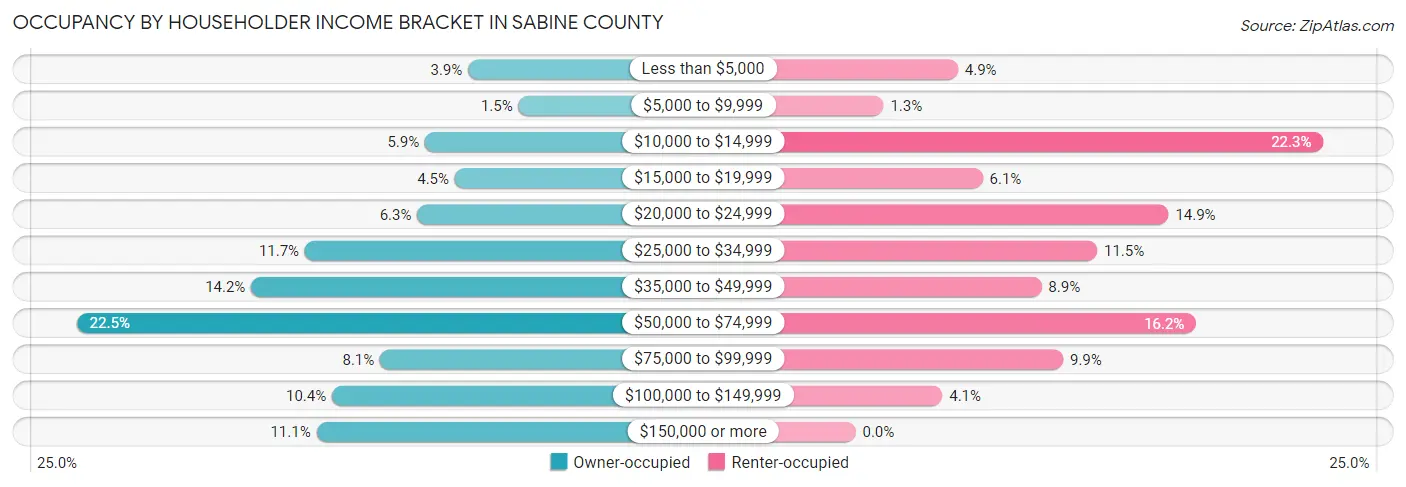
| Income Bracket | Owner-occupied | Renter-occupied |
| Less than $5,000 | 147 (3.9%) | 33 (4.9%) |
| $5,000 to $9,999 | 56 (1.5%) | 9 (1.3%) |
| $10,000 to $14,999 | 225 (5.9%) | 151 (22.3%) |
| $15,000 to $19,999 | 171 (4.5%) | 41 (6.0%) |
| $20,000 to $24,999 | 239 (6.3%) | 101 (14.9%) |
| $25,000 to $34,999 | 442 (11.7%) | 78 (11.5%) |
| $35,000 to $49,999 | 539 (14.2%) | 60 (8.8%) |
| $50,000 to $74,999 | 854 (22.5%) | 110 (16.2%) |
| $75,000 to $99,999 | 306 (8.1%) | 67 (9.9%) |
| $100,000 to $149,999 | 393 (10.4%) | 28 (4.1%) |
| $150,000 or more | 421 (11.1%) | 0 (0.0%) |
| Total | 3,793 (100.0%) | 678 (100.0%) |
Monthly Housing Cost Tiers in Sabine County
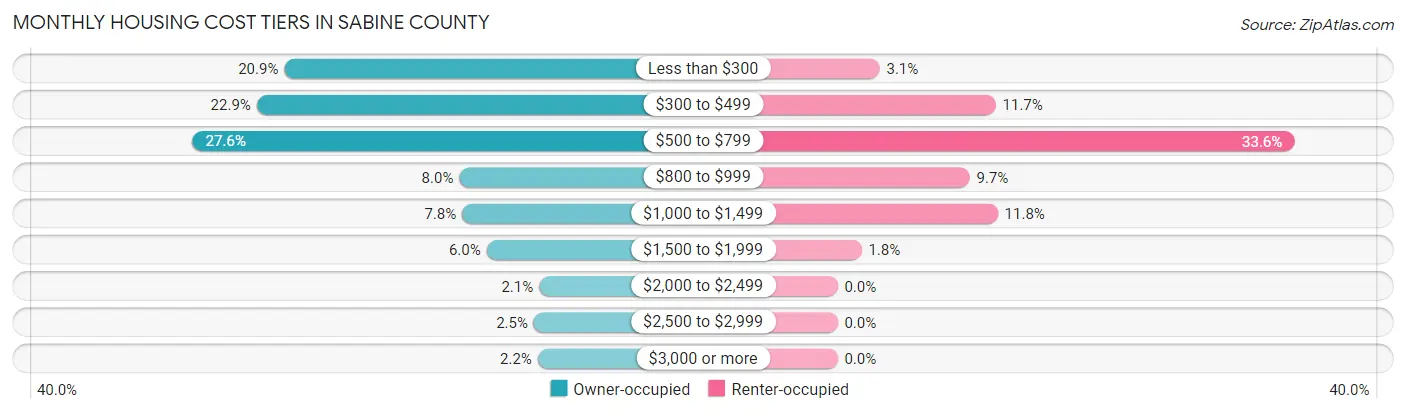
| Monthly Cost | Owner-occupied | Renter-occupied |
| Less than $300 | 792 (20.9%) | 21 (3.1%) |
| $300 to $499 | 869 (22.9%) | 79 (11.7%) |
| $500 to $799 | 1,048 (27.6%) | 228 (33.6%) |
| $800 to $999 | 303 (8.0%) | 66 (9.7%) |
| $1,000 to $1,499 | 295 (7.8%) | 80 (11.8%) |
| $1,500 to $1,999 | 227 (6.0%) | 12 (1.8%) |
| $2,000 to $2,499 | 80 (2.1%) | 0 (0.0%) |
| $2,500 to $2,999 | 95 (2.5%) | 0 (0.0%) |
| $3,000 or more | 84 (2.2%) | 0 (0.0%) |
| Total | 3,793 (100.0%) | 678 (100.0%) |
Physical Housing Characteristics in Sabine County
Housing Structures in Sabine County
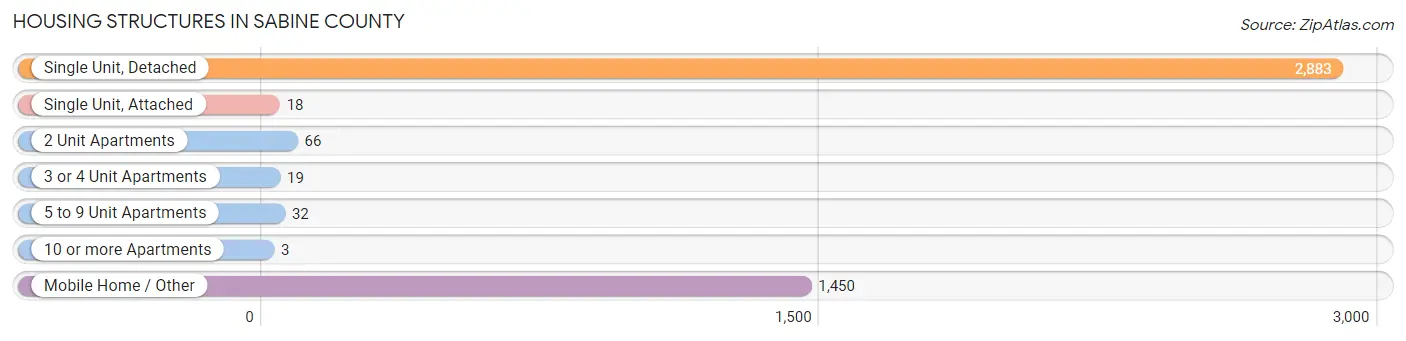
| Structure Type | # Housing Units | % Housing Units |
| Single Unit, Detached | 2,883 | 64.5% |
| Single Unit, Attached | 18 | 0.4% |
| 2 Unit Apartments | 66 | 1.5% |
| 3 or 4 Unit Apartments | 19 | 0.4% |
| 5 to 9 Unit Apartments | 32 | 0.7% |
| 10 or more Apartments | 3 | 0.1% |
| Mobile Home / Other | 1,450 | 32.4% |
| Total | 4,471 | 100.0% |
Housing Structures by Occupancy in Sabine County
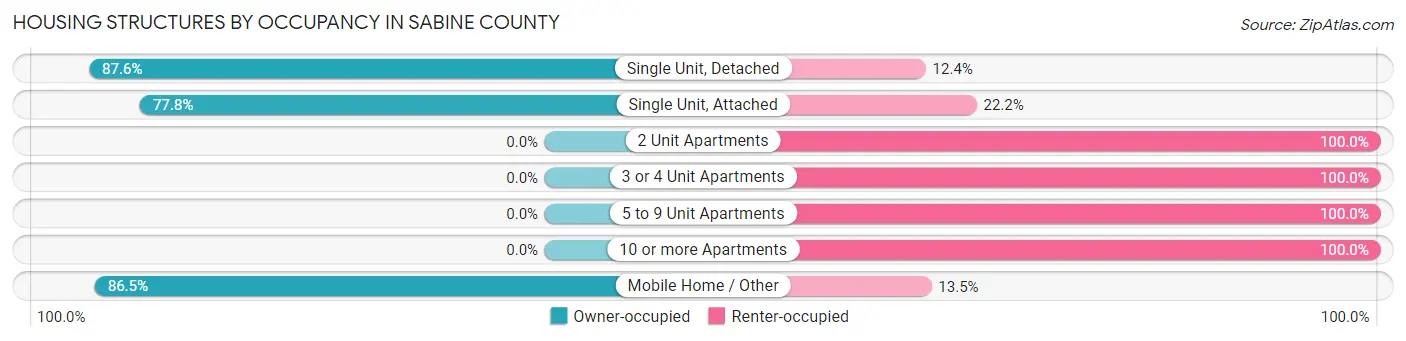
| Structure Type | Owner-occupied | Renter-occupied |
| Single Unit, Detached | 2,525 (87.6%) | 358 (12.4%) |
| Single Unit, Attached | 14 (77.8%) | 4 (22.2%) |
| 2 Unit Apartments | 0 (0.0%) | 66 (100.0%) |
| 3 or 4 Unit Apartments | 0 (0.0%) | 19 (100.0%) |
| 5 to 9 Unit Apartments | 0 (0.0%) | 32 (100.0%) |
| 10 or more Apartments | 0 (0.0%) | 3 (100.0%) |
| Mobile Home / Other | 1,254 (86.5%) | 196 (13.5%) |
| Total | 3,793 (84.8%) | 678 (15.2%) |
Housing Structures by Number of Rooms in Sabine County
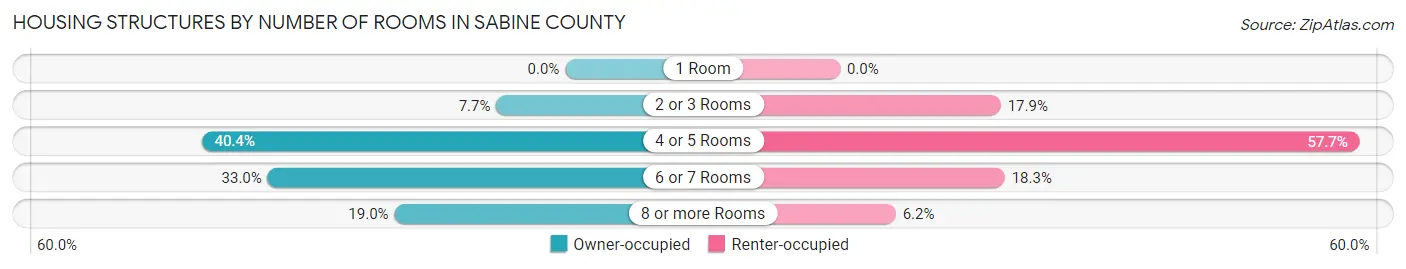
| Number of Rooms | Owner-occupied | Renter-occupied |
| 1 Room | 0 (0.0%) | 0 (0.0%) |
| 2 or 3 Rooms | 290 (7.6%) | 121 (17.8%) |
| 4 or 5 Rooms | 1,531 (40.4%) | 391 (57.7%) |
| 6 or 7 Rooms | 1,253 (33.0%) | 124 (18.3%) |
| 8 or more Rooms | 719 (19.0%) | 42 (6.2%) |
| Total | 3,793 (100.0%) | 678 (100.0%) |
Housing Structure by Heating Type in Sabine County
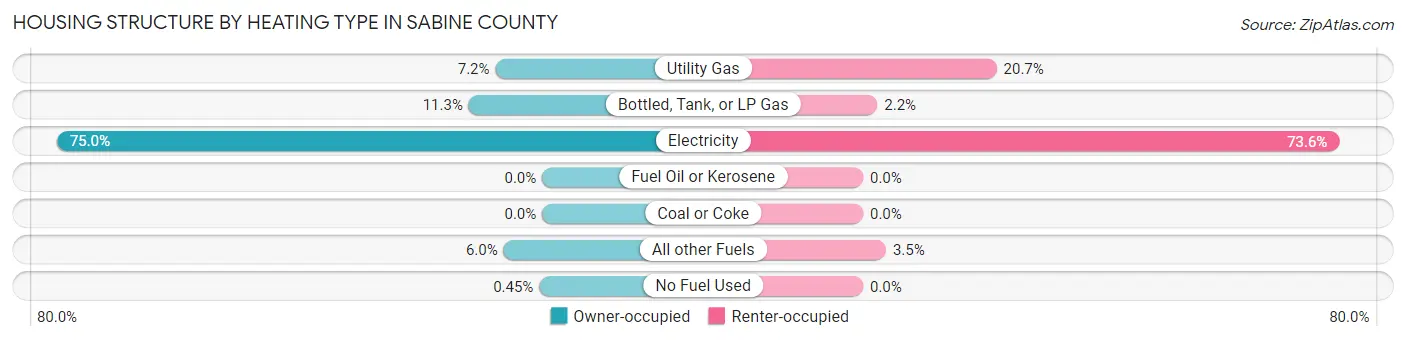
| Heating Type | Owner-occupied | Renter-occupied |
| Utility Gas | 274 (7.2%) | 140 (20.6%) |
| Bottled, Tank, or LP Gas | 430 (11.3%) | 15 (2.2%) |
| Electricity | 2,846 (75.0%) | 499 (73.6%) |
| Fuel Oil or Kerosene | 0 (0.0%) | 0 (0.0%) |
| Coal or Coke | 0 (0.0%) | 0 (0.0%) |
| All other Fuels | 226 (6.0%) | 24 (3.5%) |
| No Fuel Used | 17 (0.4%) | 0 (0.0%) |
| Total | 3,793 (100.0%) | 678 (100.0%) |
Household Vehicle Usage in Sabine County
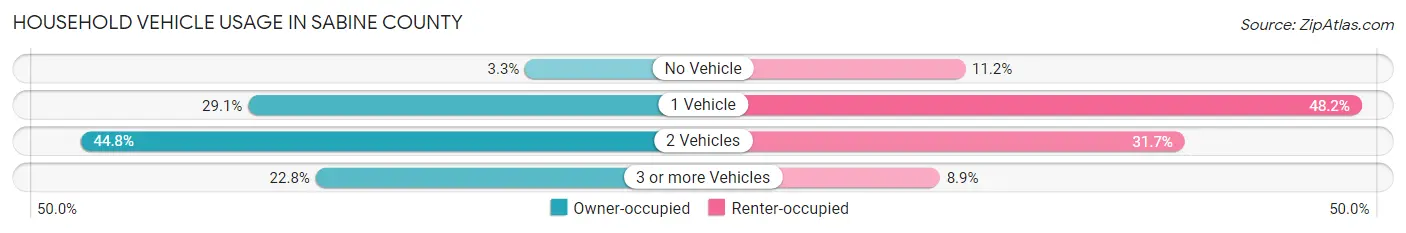
| Vehicles per Household | Owner-occupied | Renter-occupied |
| No Vehicle | 124 (3.3%) | 76 (11.2%) |
| 1 Vehicle | 1,105 (29.1%) | 327 (48.2%) |
| 2 Vehicles | 1,698 (44.8%) | 215 (31.7%) |
| 3 or more Vehicles | 866 (22.8%) | 60 (8.8%) |
| Total | 3,793 (100.0%) | 678 (100.0%) |
Real Estate & Mortgages in Sabine County
Real Estate and Mortgage Overview in Sabine County
| Characteristic | Without Mortgage | With Mortgage |
| Housing Units | 2,782 | 1,011 |
| Median Property Value | $118,000 | $220,000 |
| Median Household Income | $49,524 | $127 |
| Monthly Housing Costs | $445 | $84 |
| Real Estate Taxes | $976 | $35 |
Property Value by Mortgage Status in Sabine County
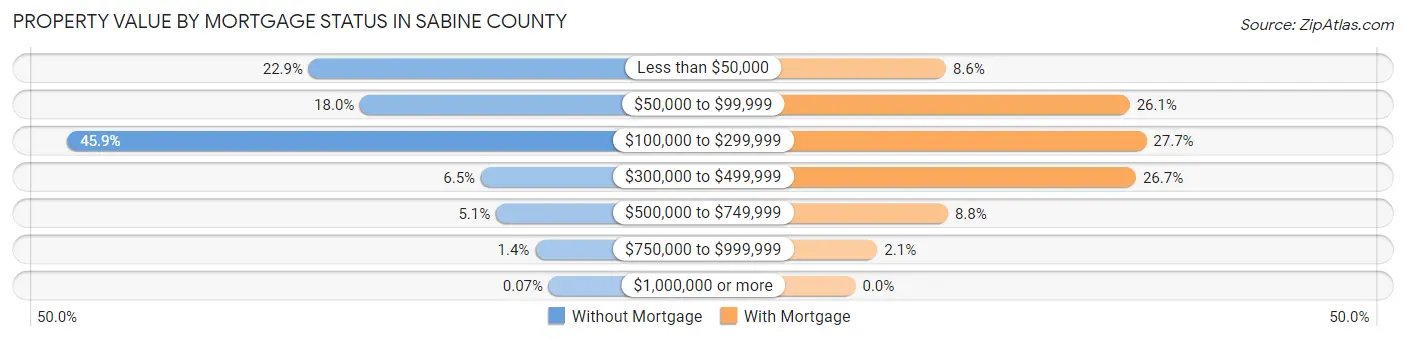
| Property Value | Without Mortgage | With Mortgage |
| Less than $50,000 | 638 (22.9%) | 87 (8.6%) |
| $50,000 to $99,999 | 502 (18.0%) | 264 (26.1%) |
| $100,000 to $299,999 | 1,278 (45.9%) | 280 (27.7%) |
| $300,000 to $499,999 | 182 (6.5%) | 270 (26.7%) |
| $500,000 to $749,999 | 142 (5.1%) | 89 (8.8%) |
| $750,000 to $999,999 | 38 (1.4%) | 21 (2.1%) |
| $1,000,000 or more | 2 (0.1%) | 0 (0.0%) |
| Total | 2,782 (100.0%) | 1,011 (100.0%) |
Household Income by Mortgage Status in Sabine County
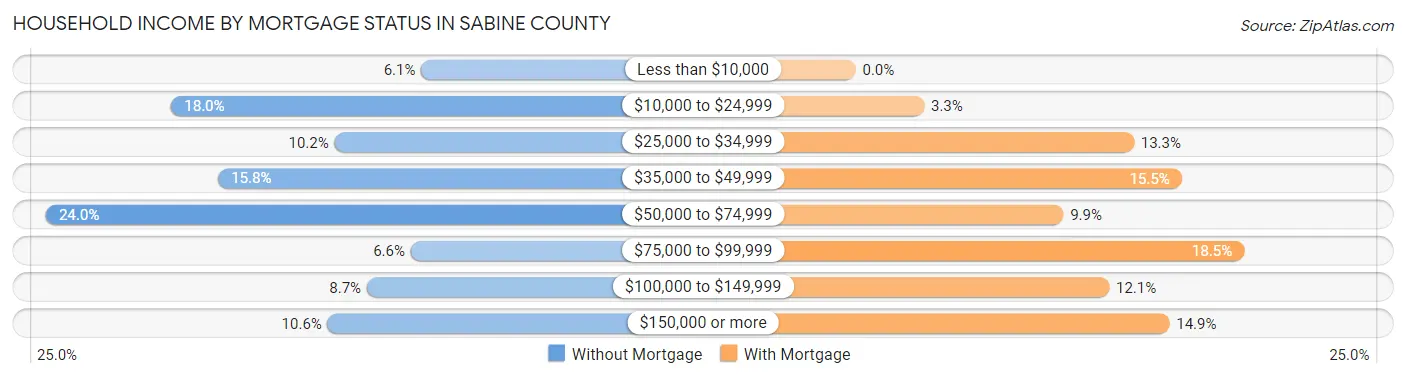
| Household Income | Without Mortgage | With Mortgage |
| Less than $10,000 | 170 (6.1%) | 0 (0.0%) |
| $10,000 to $24,999 | 501 (18.0%) | 33 (3.3%) |
| $25,000 to $34,999 | 285 (10.2%) | 134 (13.3%) |
| $35,000 to $49,999 | 439 (15.8%) | 157 (15.5%) |
| $50,000 to $74,999 | 667 (24.0%) | 100 (9.9%) |
| $75,000 to $99,999 | 184 (6.6%) | 187 (18.5%) |
| $100,000 to $149,999 | 242 (8.7%) | 122 (12.1%) |
| $150,000 or more | 294 (10.6%) | 151 (14.9%) |
| Total | 2,782 (100.0%) | 1,011 (100.0%) |
Property Value to Household Income Ratio in Sabine County
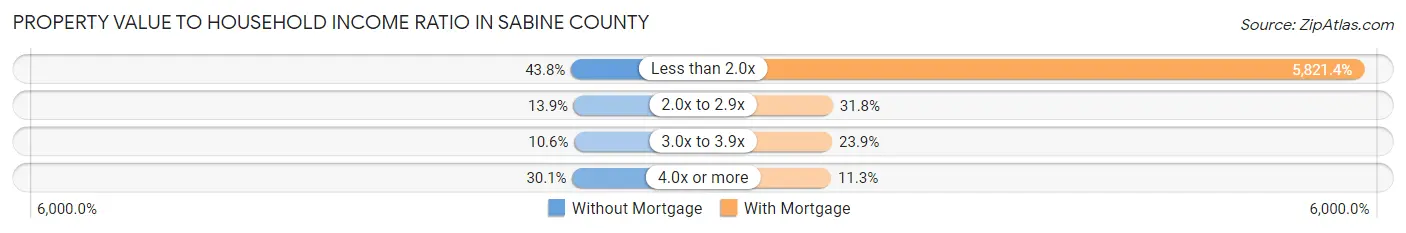
| Value-to-Income Ratio | Without Mortgage | With Mortgage |
| Less than 2.0x | 1,217 (43.8%) | 58,854 (5,821.4%) |
| 2.0x to 2.9x | 387 (13.9%) | 321 (31.8%) |
| 3.0x to 3.9x | 296 (10.6%) | 242 (23.9%) |
| 4.0x or more | 836 (30.0%) | 114 (11.3%) |
| Total | 2,782 (100.0%) | 1,011 (100.0%) |
Real Estate Taxes by Mortgage Status in Sabine County
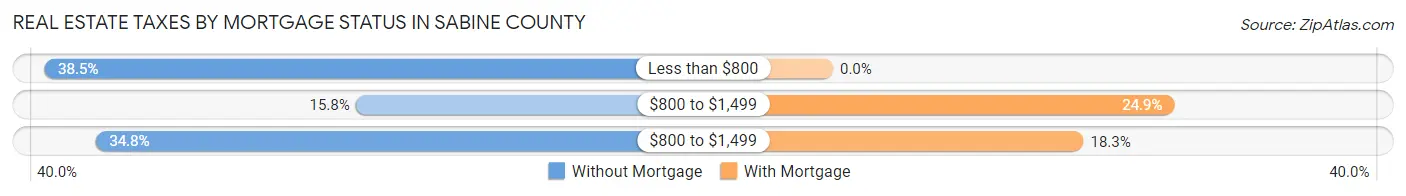
| Property Taxes | Without Mortgage | With Mortgage |
| Less than $800 | 1,071 (38.5%) | 0 (0.0%) |
| $800 to $1,499 | 440 (15.8%) | 252 (24.9%) |
| $800 to $1,499 | 967 (34.8%) | 185 (18.3%) |
| Total | 2,782 (100.0%) | 1,011 (100.0%) |
Health & Disability in Sabine County
Health Insurance Coverage by Age in Sabine County
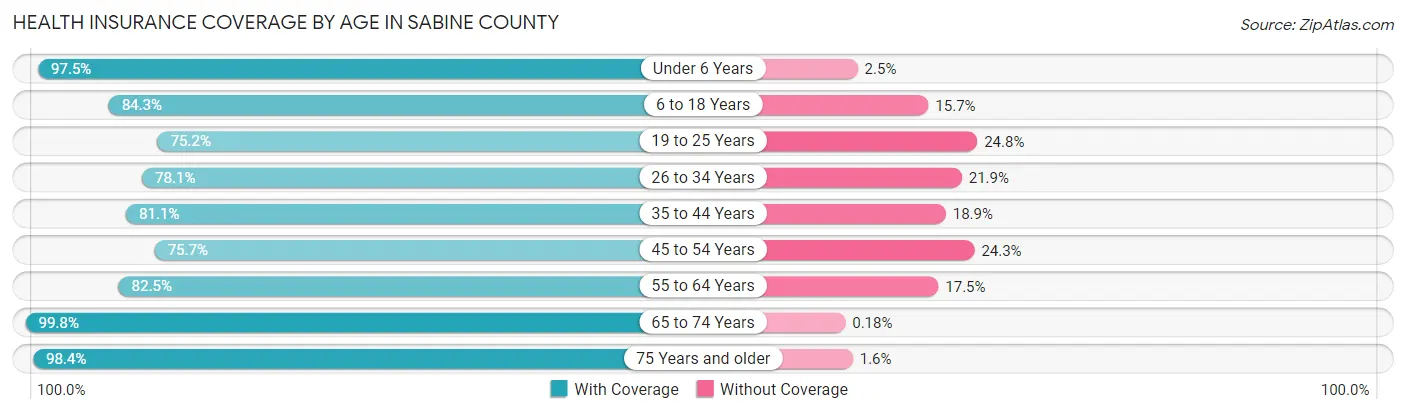
| Age Bracket | With Coverage | Without Coverage |
| Under 6 Years | 510 (97.5%) | 13 (2.5%) |
| 6 to 18 Years | 1,134 (84.3%) | 211 (15.7%) |
| 19 to 25 Years | 452 (75.2%) | 149 (24.8%) |
| 26 to 34 Years | 670 (78.1%) | 188 (21.9%) |
| 35 to 44 Years | 664 (81.1%) | 155 (18.9%) |
| 45 to 54 Years | 783 (75.7%) | 251 (24.3%) |
| 55 to 64 Years | 1,472 (82.5%) | 313 (17.5%) |
| 65 to 74 Years | 1,639 (99.8%) | 3 (0.2%) |
| 75 Years and older | 1,247 (98.4%) | 20 (1.6%) |
| Total | 8,571 (86.8%) | 1,303 (13.2%) |
Health Insurance Coverage by Citizenship Status in Sabine County
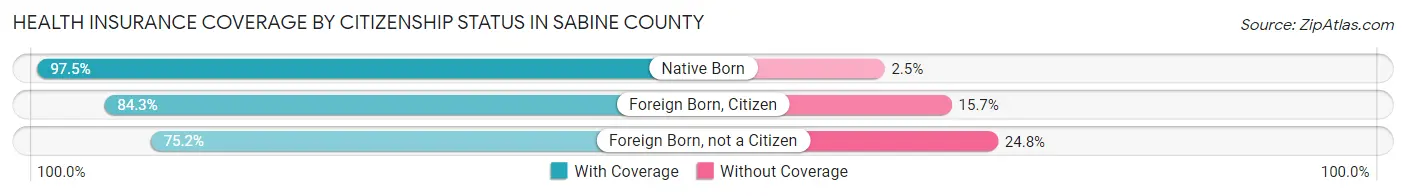
| Citizenship Status | With Coverage | Without Coverage |
| Native Born | 510 (97.5%) | 13 (2.5%) |
| Foreign Born, Citizen | 1,134 (84.3%) | 211 (15.7%) |
| Foreign Born, not a Citizen | 452 (75.2%) | 149 (24.8%) |
Health Insurance Coverage by Household Income in Sabine County
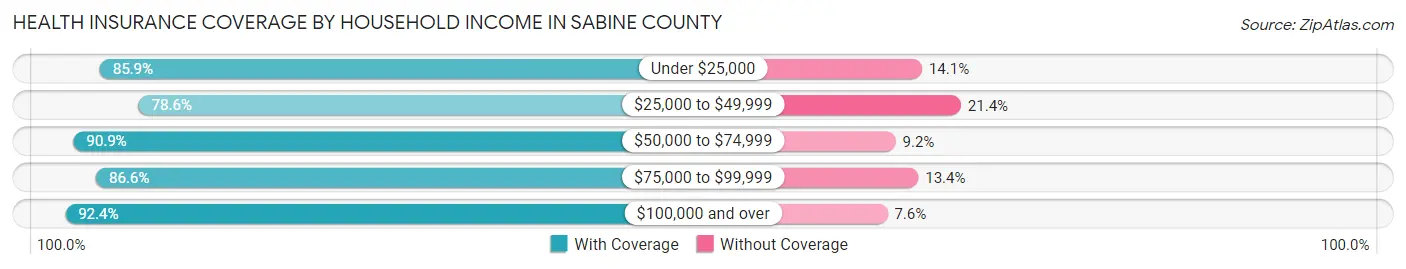
| Household Income | With Coverage | Without Coverage |
| Under $25,000 | 1,603 (85.9%) | 263 (14.1%) |
| $25,000 to $49,999 | 1,923 (78.6%) | 523 (21.4%) |
| $50,000 to $74,999 | 2,115 (90.8%) | 213 (9.1%) |
| $75,000 to $99,999 | 866 (86.6%) | 134 (13.4%) |
| $100,000 and over | 2,060 (92.4%) | 170 (7.6%) |
Public vs Private Health Insurance Coverage by Age in Sabine County
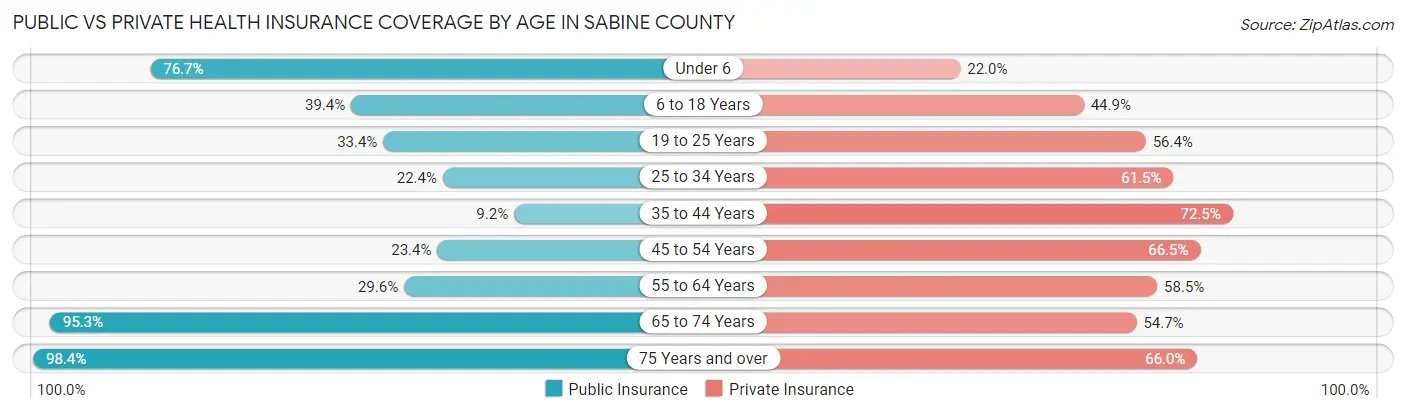
| Age Bracket | Public Insurance | Private Insurance |
| Under 6 | 401 (76.7%) | 115 (22.0%) |
| 6 to 18 Years | 530 (39.4%) | 604 (44.9%) |
| 19 to 25 Years | 201 (33.4%) | 339 (56.4%) |
| 25 to 34 Years | 192 (22.4%) | 528 (61.5%) |
| 35 to 44 Years | 75 (9.2%) | 594 (72.5%) |
| 45 to 54 Years | 242 (23.4%) | 688 (66.5%) |
| 55 to 64 Years | 528 (29.6%) | 1,045 (58.5%) |
| 65 to 74 Years | 1,565 (95.3%) | 898 (54.7%) |
| 75 Years and over | 1,247 (98.4%) | 836 (66.0%) |
| Total | 4,981 (50.4%) | 5,647 (57.2%) |
Disability Status by Sex by Age in Sabine County
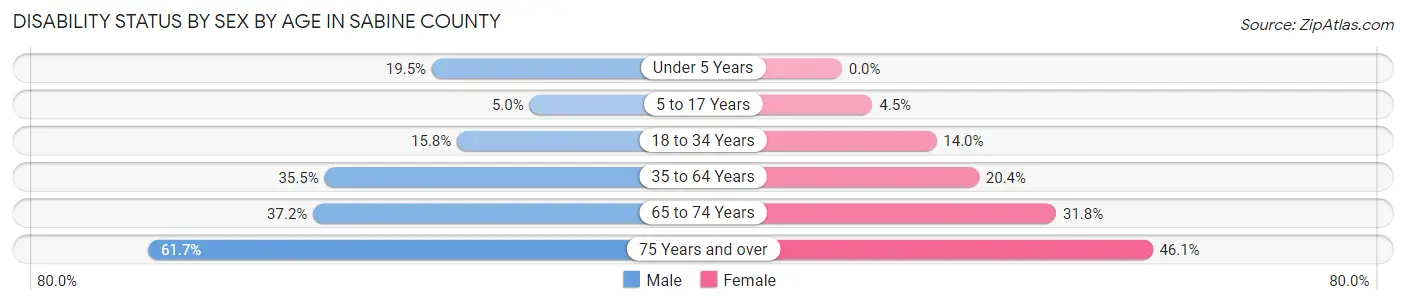
| Age Bracket | Male | Female |
| Under 5 Years | 49 (19.5%) | 0 (0.0%) |
| 5 to 17 Years | 33 (5.0%) | 29 (4.5%) |
| 18 to 34 Years | 122 (15.8%) | 112 (14.0%) |
| 35 to 64 Years | 630 (35.5%) | 379 (20.3%) |
| 65 to 74 Years | 318 (37.1%) | 250 (31.8%) |
| 75 Years and over | 375 (61.7%) | 304 (46.1%) |
Disability Class by Sex by Age in Sabine County
Disability Class: Hearing Difficulty
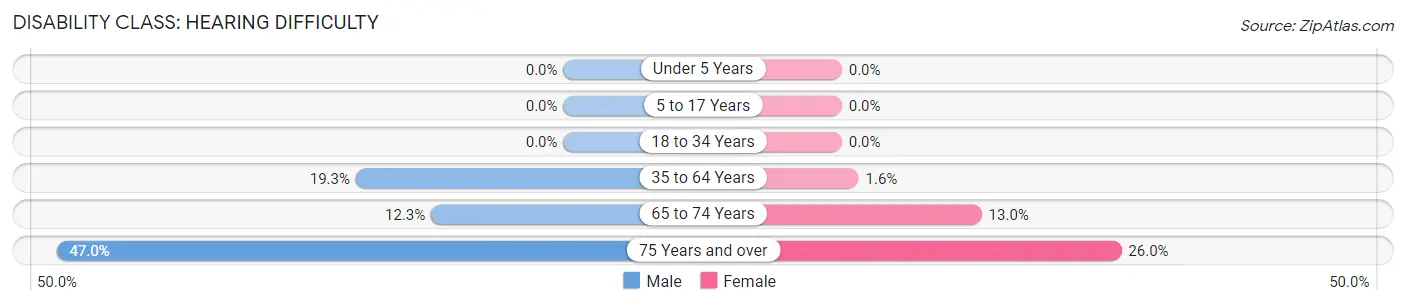
| Age Bracket | Male | Female |
| Under 5 Years | 0 (0.0%) | 0 (0.0%) |
| 5 to 17 Years | 0 (0.0%) | 0 (0.0%) |
| 18 to 34 Years | 0 (0.0%) | 0 (0.0%) |
| 35 to 64 Years | 342 (19.3%) | 29 (1.6%) |
| 65 to 74 Years | 105 (12.3%) | 102 (13.0%) |
| 75 Years and over | 286 (47.0%) | 171 (26.0%) |
Disability Class: Vision Difficulty
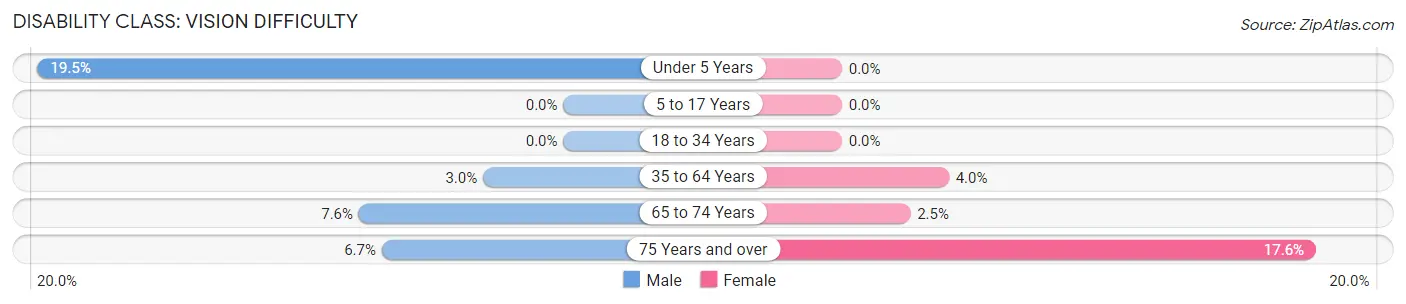
| Age Bracket | Male | Female |
| Under 5 Years | 49 (19.5%) | 0 (0.0%) |
| 5 to 17 Years | 0 (0.0%) | 0 (0.0%) |
| 18 to 34 Years | 0 (0.0%) | 0 (0.0%) |
| 35 to 64 Years | 53 (3.0%) | 74 (4.0%) |
| 65 to 74 Years | 65 (7.6%) | 20 (2.5%) |
| 75 Years and over | 41 (6.7%) | 116 (17.6%) |
Disability Class: Cognitive Difficulty
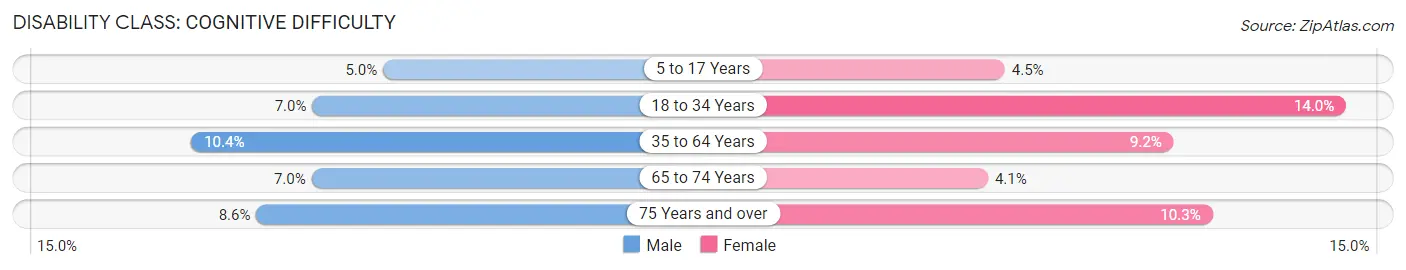
| Age Bracket | Male | Female |
| 5 to 17 Years | 33 (5.0%) | 29 (4.5%) |
| 18 to 34 Years | 54 (7.0%) | 112 (14.0%) |
| 35 to 64 Years | 184 (10.4%) | 172 (9.2%) |
| 65 to 74 Years | 60 (7.0%) | 32 (4.1%) |
| 75 Years and over | 52 (8.6%) | 68 (10.3%) |
Disability Class: Ambulatory Difficulty
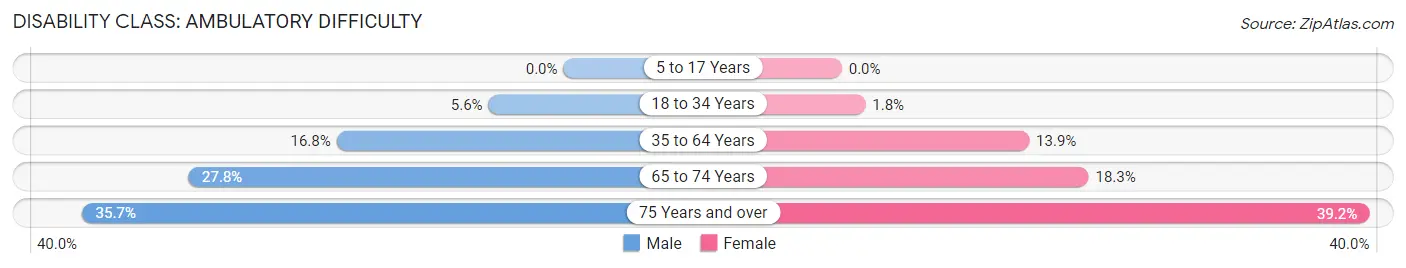
| Age Bracket | Male | Female |
| 5 to 17 Years | 0 (0.0%) | 0 (0.0%) |
| 18 to 34 Years | 43 (5.6%) | 14 (1.8%) |
| 35 to 64 Years | 299 (16.8%) | 259 (13.9%) |
| 65 to 74 Years | 238 (27.8%) | 144 (18.3%) |
| 75 Years and over | 217 (35.7%) | 258 (39.2%) |
Disability Class: Self-Care Difficulty
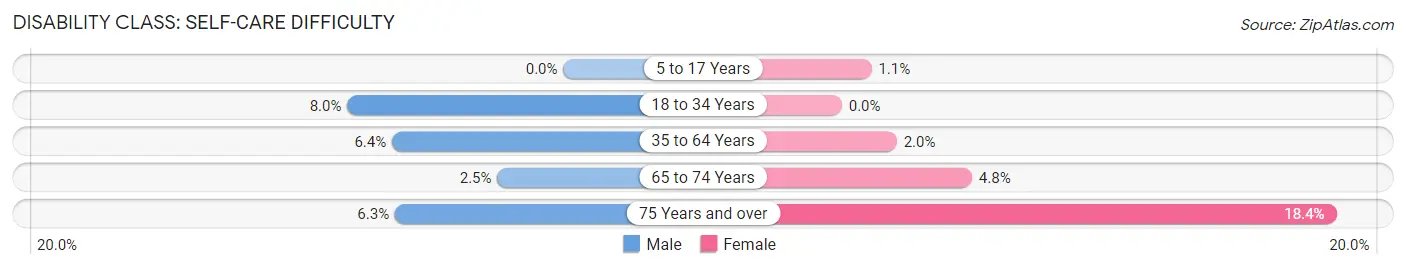
| Age Bracket | Male | Female |
| 5 to 17 Years | 0 (0.0%) | 7 (1.1%) |
| 18 to 34 Years | 62 (8.0%) | 0 (0.0%) |
| 35 to 64 Years | 113 (6.4%) | 38 (2.0%) |
| 65 to 74 Years | 21 (2.5%) | 38 (4.8%) |
| 75 Years and over | 38 (6.2%) | 121 (18.4%) |
Technology Access in Sabine County
Computing Device Access in Sabine County
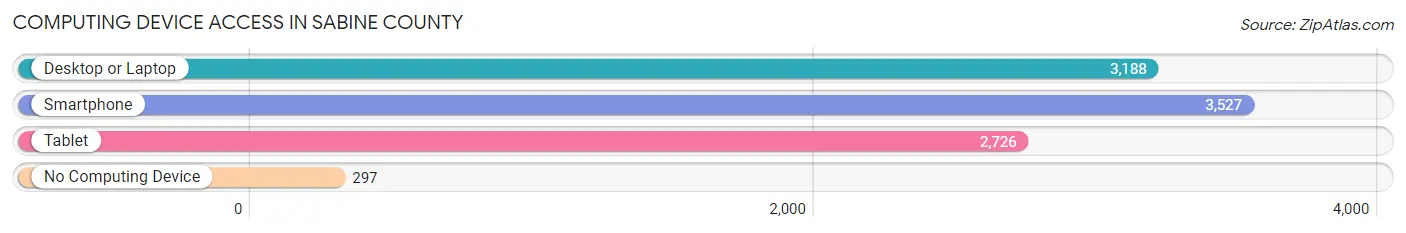
| Device Type | # Households | % Households |
| Desktop or Laptop | 3,188 | 71.3% |
| Smartphone | 3,527 | 78.9% |
| Tablet | 2,726 | 61.0% |
| No Computing Device | 297 | 6.6% |
| Total | 4,471 | 100.0% |
Internet Access in Sabine County
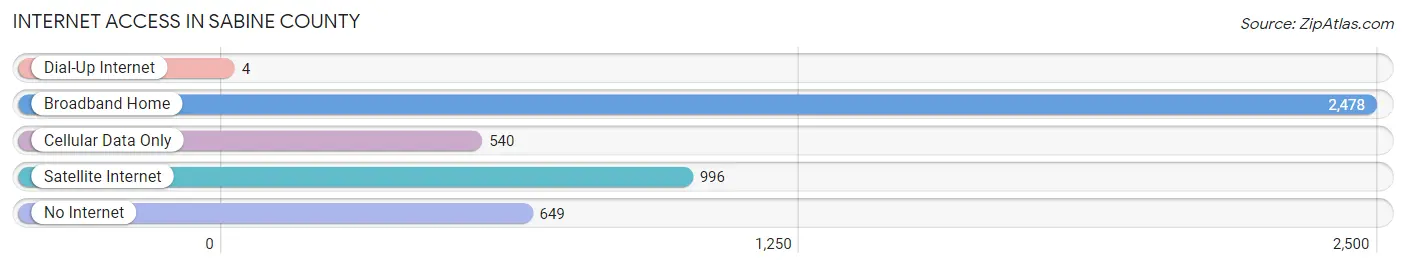
| Internet Type | # Households | % Households |
| Dial-Up Internet | 4 | 0.1% |
| Broadband Home | 2,478 | 55.4% |
| Cellular Data Only | 540 | 12.1% |
| Satellite Internet | 996 | 22.3% |
| No Internet | 649 | 14.5% |
| Total | 4,471 | 100.0% |
Sabine County Summary
Sabine County is located in the eastern part of Texas, and is part of the Deep East Texas region. It is bordered by San Augustine County to the north, Shelby County to the east, Newton County to the south, and Sabine and Jasper Counties to the west. The county seat is Hemphill, and the largest city is Pineland. The county was established in 1837 and named for the Sabine River, which forms its eastern border.
Geography
Sabine County covers an area of 890 square miles, making it the second-smallest county in Texas. The terrain is mostly flat, with some rolling hills in the western part of the county. The Sabine River forms the eastern border of the county, and the Angelina River forms the western border. The county is mostly forested, with pine and hardwood trees dominating the landscape. The soil is mostly sandy loam, with some areas of clay.
Demographics
As of the 2010 census, Sabine County had a population of 10,834. The population was spread out, with 48.3% male and 51.7% female. The median age was 41.2 years. The racial makeup of the county was 79.2% White, 17.3% African American, 0.7% Native American, 0.3% Asian, 0.1% Pacific Islander, 1.2% from other races, and 1.3% from two or more races. Hispanic or Latino of any race were 3.3% of the population.
Economy
The economy of Sabine County is largely based on agriculture and timber. The county is home to several large timber companies, and the timber industry is the largest employer in the county. Other major industries include oil and gas, manufacturing, and tourism. The county is also home to several small businesses, including restaurants, retail stores, and service providers.
History
Sabine County was established in 1837 and named for the Sabine River, which forms its eastern border. The county was originally part of the Mexican state of Coahuila y Tejas, and was later part of the Republic of Texas. The county was organized in 1846, and the first county seat was located in Milam. In 1848, the county seat was moved to Hemphill, where it remains today.
The county was largely rural until the early 20th century, when the timber industry began to take off. The timber industry was the main source of income for the county until the 1950s, when oil and gas production began to increase. The county has since become a major producer of oil and gas, and the industry continues to be a major source of income for the county.
Sabine County has a rich history and culture, and is home to several historic sites. The county is also home to the Big Thicket National Preserve, which is a protected area of forest and wetlands. The preserve is home to a variety of wildlife, including black bears, alligators, and bald eagles.
Conclusion
Sabine County is a rural county located in the eastern part of Texas. It is bordered by San Augustine County to the north, Shelby County to the east, Newton County to the south, and Sabine and Jasper Counties to the west. The county was established in 1837 and named for the Sabine River, which forms its eastern border. The county has a population of 10,834, and the economy is largely based on agriculture and timber. The county is also home to several historic sites and the Big Thicket National Preserve.
Common Questions
What is Per Capita Income in Sabine County?
Per Capita income in Sabine County is $33,953.
What is the Median Family Income in Sabine County?
Median Family Income in Sabine County is $62,674.
What is the Median Household income in Sabine County?
Median Household Income in Sabine County is $47,061.
What is Income or Wage Gap in Sabine County?
Income or Wage Gap in Sabine County is 44.9%.
Women in Sabine County earn 55.1 cents for every dollar earned by a man.
What is Inequality or Gini Index in Sabine County?
Inequality or Gini Index in Sabine County is 0.52.
What is the Total Population of Sabine County?
Total Population of Sabine County is 9,980.
What is the Total Male Population of Sabine County?
Total Male Population of Sabine County is 4,989.
What is the Total Female Population of Sabine County?
Total Female Population of Sabine County is 4,991.
What is the Ratio of Males per 100 Females in Sabine County?
There are 99.96 Males per 100 Females in Sabine County.
What is the Ratio of Females per 100 Males in Sabine County?
There are 100.04 Females per 100 Males in Sabine County.
What is the Median Population Age in Sabine County?
Median Population Age in Sabine County is 54.1 Years.
What is the Average Family Size in Sabine County
Average Family Size in Sabine County is 2.7 People.
What is the Average Household Size in Sabine County
Average Household Size in Sabine County is 2.2 People.
How Large is the Labor Force in Sabine County?
There are 3,485 People in the Labor Forcein in Sabine County.
What is the Percentage of People in the Labor Force in Sabine County?
41.2% of People are in the Labor Force in Sabine County.
What is the Unemployment Rate in Sabine County?
Unemployment Rate in Sabine County is 8.4%.