Rusk County, TX Map & Demographics
Rusk County Map
Rusk County Overview
$30,365
PER CAPITA INCOME
$74,677
AVG FAMILY INCOME
$61,661
AVG HOUSEHOLD INCOME
40.5%
WAGE / INCOME GAP [ % ]
59.5¢/ $1
WAGE / INCOME GAP [ $ ]
0.46
INEQUALITY / GINI INDEX
52,755
TOTAL POPULATION
28,432
MALE POPULATION
24,323
FEMALE POPULATION
116.89
MALES / 100 FEMALES
85.55
FEMALES / 100 MALES
38.8
MEDIAN AGE
3.2
AVG FAMILY SIZE
2.7
AVG HOUSEHOLD SIZE
22,726
LABOR FORCE [ PEOPLE ]
53.5%
PERCENT IN LABOR FORCE
5.5%
UNEMPLOYMENT RATE
Income in Rusk County
Income Overview in Rusk County
Per Capita Income in Rusk County is $30,365, while median incomes of families and households are $74,677 and $61,661 respectively.
| Characteristic | Number | Measure |
| Per Capita Income | 52,755 | $30,365 |
| Median Family Income | 13,013 | $74,677 |
| Mean Family Income | 13,013 | $95,916 |
| Median Household Income | 17,792 | $61,661 |
| Mean Household Income | 17,792 | $84,856 |
| Income Deficit | 13,013 | $0 |
| Wage / Income Gap (%) | 52,755 | 40.48% |
| Wage / Income Gap ($) | 52,755 | 59.52¢ per $1 |
| Gini / Inequality Index | 52,755 | 0.46 |
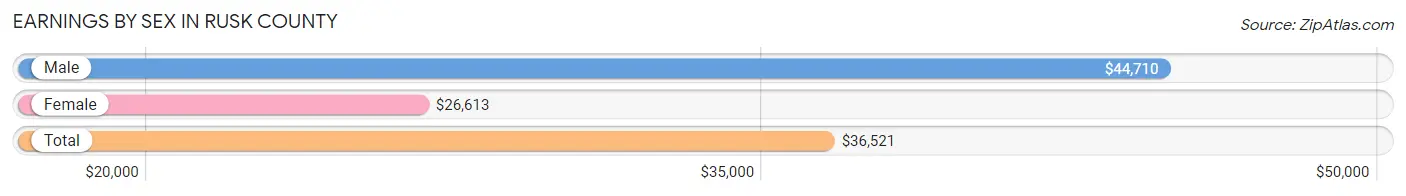
Earnings by Sex in Rusk County
Average Earnings in Rusk County are $36,521, $44,710 for men and $26,613 for women, a difference of 40.5%.
| Sex | Number | Average Earnings |
| Male | 14,325 (58.1%) | $44,710 |
| Female | 10,328 (41.9%) | $26,613 |
| Total | 24,653 (100.0%) | $36,521 |
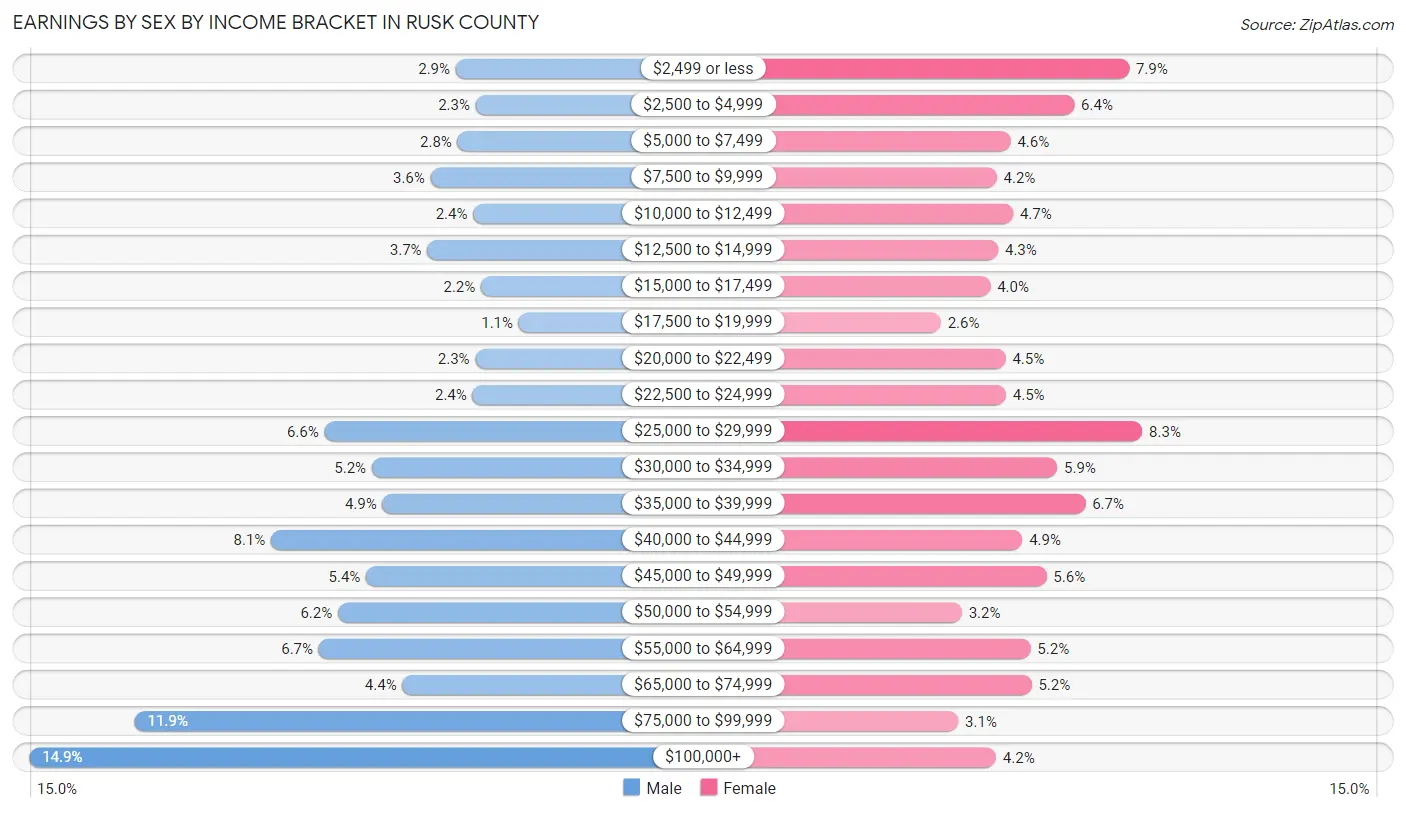
Earnings by Sex by Income Bracket in Rusk County
The most common earnings brackets in Rusk County are $100,000+ for men (2,130 | 14.9%) and $25,000 to $29,999 for women (857 | 8.3%).
| Income | Male | Female |
| $2,499 or less | 412 (2.9%) | 819 (7.9%) |
| $2,500 to $4,999 | 332 (2.3%) | 660 (6.4%) |
| $5,000 to $7,499 | 406 (2.8%) | 475 (4.6%) |
| $7,500 to $9,999 | 514 (3.6%) | 435 (4.2%) |
| $10,000 to $12,499 | 342 (2.4%) | 482 (4.7%) |
| $12,500 to $14,999 | 527 (3.7%) | 439 (4.3%) |
| $15,000 to $17,499 | 311 (2.2%) | 416 (4.0%) |
| $17,500 to $19,999 | 159 (1.1%) | 273 (2.6%) |
| $20,000 to $22,499 | 334 (2.3%) | 461 (4.5%) |
| $22,500 to $24,999 | 345 (2.4%) | 462 (4.5%) |
| $25,000 to $29,999 | 941 (6.6%) | 857 (8.3%) |
| $30,000 to $34,999 | 751 (5.2%) | 610 (5.9%) |
| $35,000 to $39,999 | 707 (4.9%) | 692 (6.7%) |
| $40,000 to $44,999 | 1,156 (8.1%) | 509 (4.9%) |
| $45,000 to $49,999 | 774 (5.4%) | 579 (5.6%) |
| $50,000 to $54,999 | 887 (6.2%) | 334 (3.2%) |
| $55,000 to $64,999 | 964 (6.7%) | 533 (5.2%) |
| $65,000 to $74,999 | 627 (4.4%) | 536 (5.2%) |
| $75,000 to $99,999 | 1,706 (11.9%) | 323 (3.1%) |
| $100,000+ | 2,130 (14.9%) | 433 (4.2%) |
| Total | 14,325 (100.0%) | 10,328 (100.0%) |
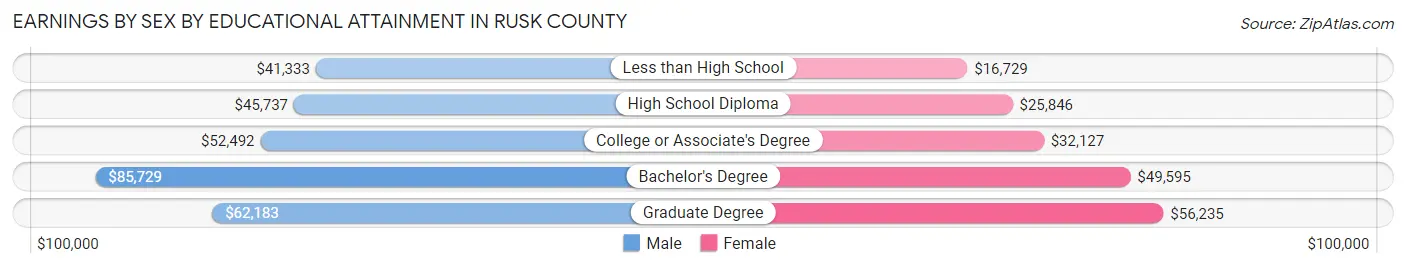
Earnings by Sex by Educational Attainment in Rusk County
Average earnings in Rusk County are $50,509 for men and $31,204 for women, a difference of 38.2%. Men with an educational attainment of bachelor's degree enjoy the highest average annual earnings of $85,729, while those with less than high school education earn the least with $41,333. Women with an educational attainment of graduate degree earn the most with the average annual earnings of $56,235, while those with less than high school education have the smallest earnings of $16,729.
| Educational Attainment | Male Income | Female Income |
| Less than High School | $41,333 | $16,729 |
| High School Diploma | $45,737 | $25,846 |
| College or Associate's Degree | $52,492 | $32,127 |
| Bachelor's Degree | $85,729 | $49,595 |
| Graduate Degree | $62,183 | $56,235 |
| Total | $50,509 | $31,204 |
Family Income in Rusk County
Family Income Brackets in Rusk County
According to the Rusk County family income data, there are 2,238 families falling into the $75,000 to $99,999 income range, which is the most common income bracket and makes up 17.2% of all families. Conversely, the $10,000 to $14,999 income bracket is the least frequent group with only 195 families (1.5%) belonging to this category.
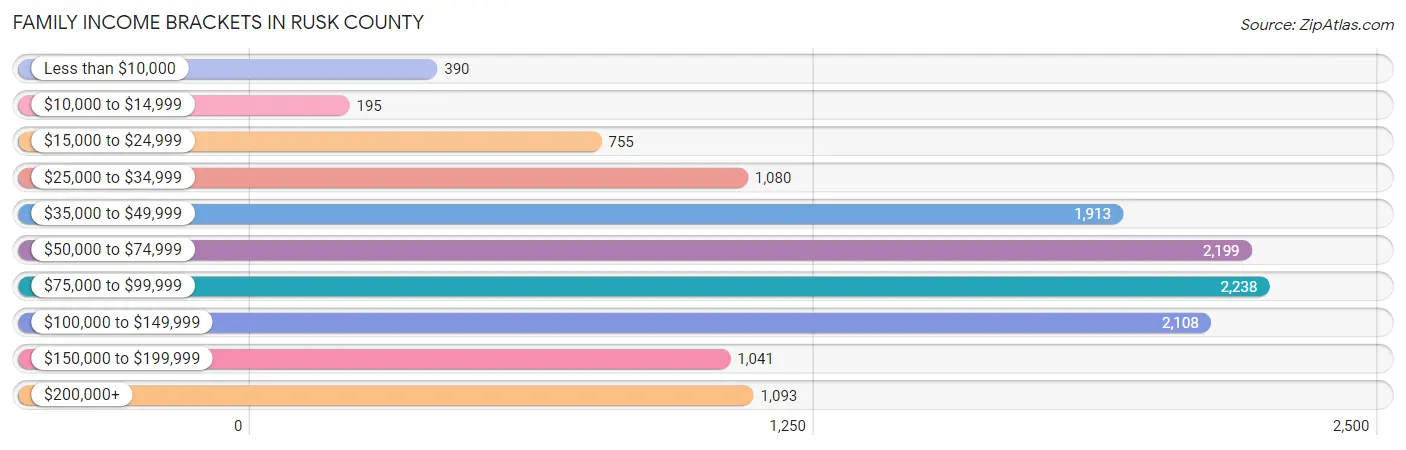
| Income Bracket | # Families | % Families |
| Less than $10,000 | 390 | 3.0% |
| $10,000 to $14,999 | 195 | 1.5% |
| $15,000 to $24,999 | 755 | 5.8% |
| $25,000 to $34,999 | 1,080 | 8.3% |
| $35,000 to $49,999 | 1,913 | 14.7% |
| $50,000 to $74,999 | 2,199 | 16.9% |
| $75,000 to $99,999 | 2,238 | 17.2% |
| $100,000 to $149,999 | 2,108 | 16.2% |
| $150,000 to $199,999 | 1,041 | 8.0% |
| $200,000+ | 1,093 | 8.4% |
Family Income by Famaliy Size in Rusk County
5-person families (983 | 7.5%) account for the highest median family income in Rusk County with $94,943 per family, while 2-person families (6,425 | 49.4%) have the highest median income of $35,418 per family member.
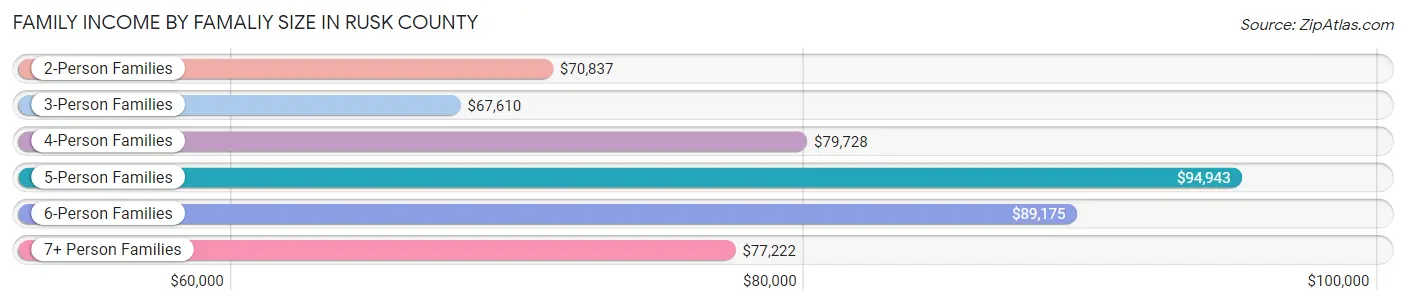
| Income Bracket | # Families | Median Income |
| 2-Person Families | 6,425 (49.4%) | $70,837 |
| 3-Person Families | 2,343 (18.0%) | $67,610 |
| 4-Person Families | 2,685 (20.6%) | $79,728 |
| 5-Person Families | 983 (7.5%) | $94,943 |
| 6-Person Families | 419 (3.2%) | $89,175 |
| 7+ Person Families | 158 (1.2%) | $77,222 |
| Total | 13,013 (100.0%) | $74,677 |
Family Income by Number of Earners in Rusk County
The median family income in Rusk County is $74,677, with families comprising 3+ earners (1,293) having the highest median family income of $105,511, while families with no earners (2,274) have the lowest median family income of $35,714, accounting for 9.9% and 17.5% of families, respectively.
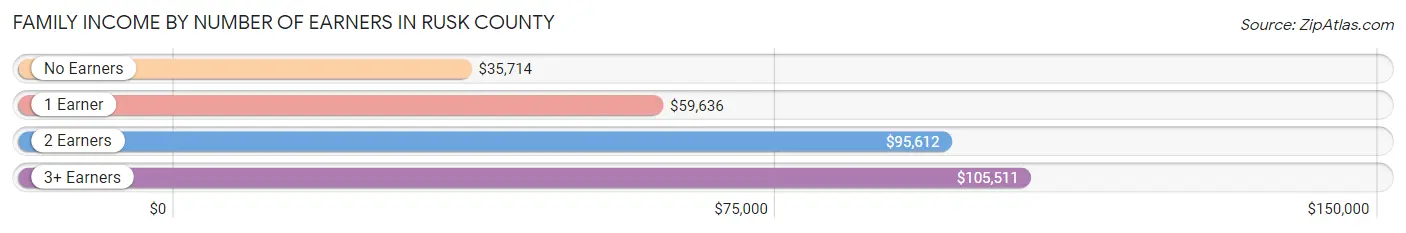
| Number of Earners | # Families | Median Income |
| No Earners | 2,274 (17.5%) | $35,714 |
| 1 Earner | 4,774 (36.7%) | $59,636 |
| 2 Earners | 4,672 (35.9%) | $95,612 |
| 3+ Earners | 1,293 (9.9%) | $105,511 |
| Total | 13,013 (100.0%) | $74,677 |
Household Income in Rusk County
Household Income Brackets in Rusk County
With 2,758 households falling in the category, the $75,000 to $99,999 income range is the most frequent in Rusk County, accounting for 15.5% of all households. In contrast, only 676 households (3.8%) fall into the $10,000 to $14,999 income bracket, making it the least populous group.
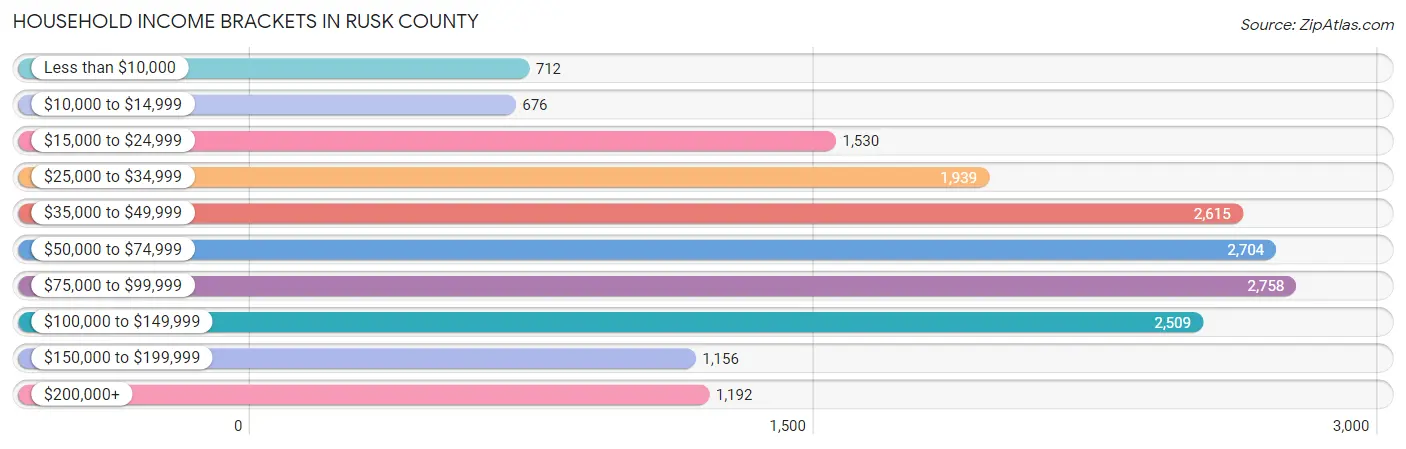
| Income Bracket | # Households | % Households |
| Less than $10,000 | 712 | 4.0% |
| $10,000 to $14,999 | 676 | 3.8% |
| $15,000 to $24,999 | 1,530 | 8.6% |
| $25,000 to $34,999 | 1,939 | 10.9% |
| $35,000 to $49,999 | 2,615 | 14.7% |
| $50,000 to $74,999 | 2,704 | 15.2% |
| $75,000 to $99,999 | 2,758 | 15.5% |
| $100,000 to $149,999 | 2,509 | 14.1% |
| $150,000 to $199,999 | 1,156 | 6.5% |
| $200,000+ | 1,192 | 6.7% |
Household Income by Householder Age in Rusk County
The median household income in Rusk County is $61,661, with the highest median household income of $74,792 found in the 45 to 64 years age bracket for the primary householder. A total of 6,482 households (36.4%) fall into this category. Meanwhile, the 15 to 24 years age bracket for the primary householder has the lowest median household income of $0, with 376 households (2.1%) in this group.
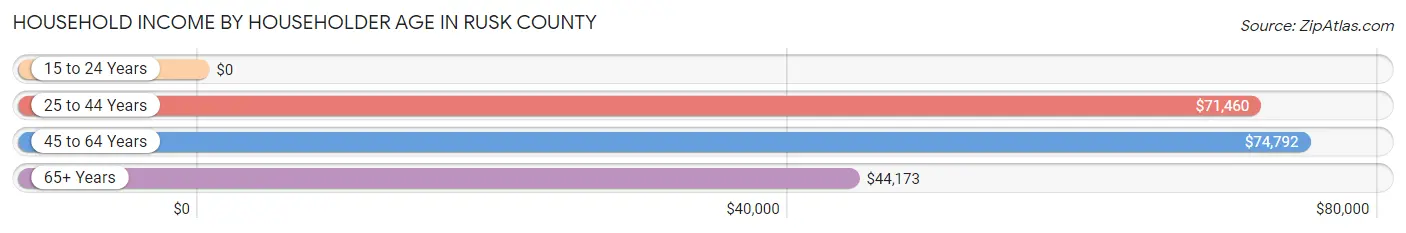
| Income Bracket | # Households | Median Income |
| 15 to 24 Years | 376 (2.1%) | $0 |
| 25 to 44 Years | 5,288 (29.7%) | $71,460 |
| 45 to 64 Years | 6,482 (36.4%) | $74,792 |
| 65+ Years | 5,646 (31.7%) | $44,173 |
| Total | 17,792 (100.0%) | $61,661 |
Poverty in Rusk County
Income Below Poverty by Sex and Age in Rusk County
With 11.6% poverty level for males and 15.2% for females among the residents of Rusk County, 5 year old males and 15 year old females are the most vulnerable to poverty, with 99 males (31.5%) and 63 females (25.5%) in their respective age groups living below the poverty level.
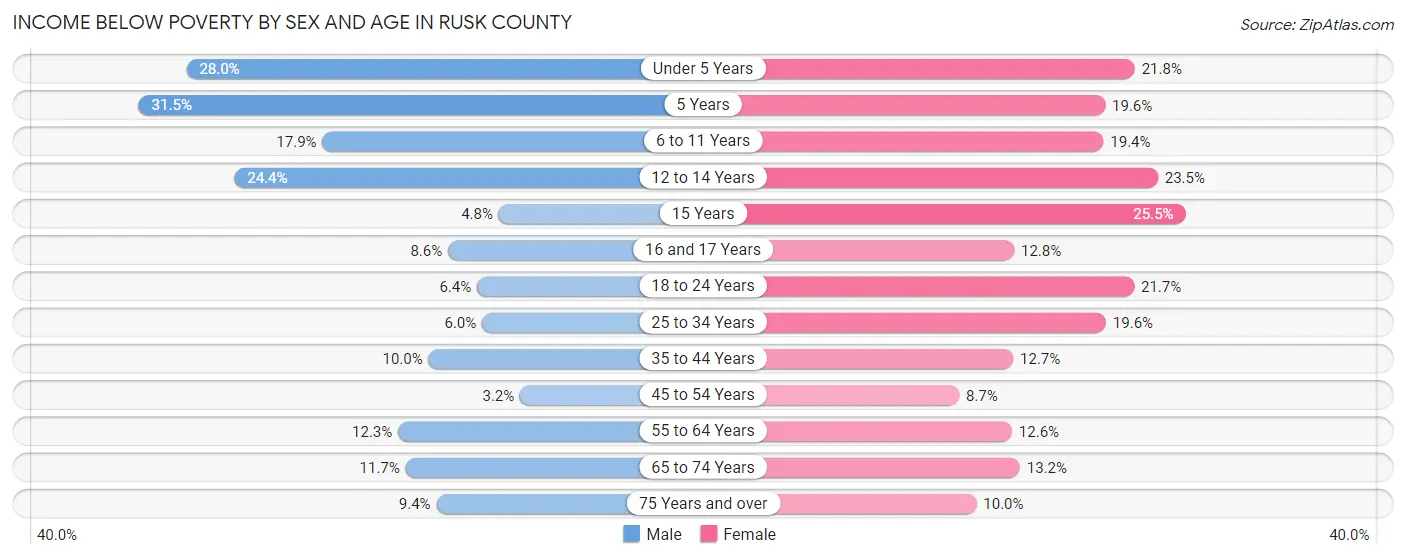
| Age Bracket | Male | Female |
| Under 5 Years | 474 (28.0%) | 266 (21.7%) |
| 5 Years | 99 (31.5%) | 26 (19.6%) |
| 6 to 11 Years | 312 (17.9%) | 400 (19.4%) |
| 12 to 14 Years | 331 (24.4%) | 251 (23.5%) |
| 15 Years | 14 (4.8%) | 63 (25.5%) |
| 16 and 17 Years | 64 (8.6%) | 99 (12.8%) |
| 18 to 24 Years | 155 (6.4%) | 421 (21.7%) |
| 25 to 34 Years | 162 (6.0%) | 499 (19.6%) |
| 35 to 44 Years | 323 (10.0%) | 385 (12.7%) |
| 45 to 54 Years | 91 (3.2%) | 247 (8.7%) |
| 55 to 64 Years | 353 (12.3%) | 419 (12.6%) |
| 65 to 74 Years | 287 (11.7%) | 352 (13.2%) |
| 75 Years and over | 137 (9.4%) | 186 (10.0%) |
| Total | 2,802 (11.6%) | 3,614 (15.2%) |
Income Above Poverty by Sex and Age in Rusk County
According to the poverty statistics in Rusk County, males aged 45 to 54 years and females aged 45 to 54 years are the age groups that are most secure financially, with 96.8% of males and 91.3% of females in these age groups living above the poverty line.
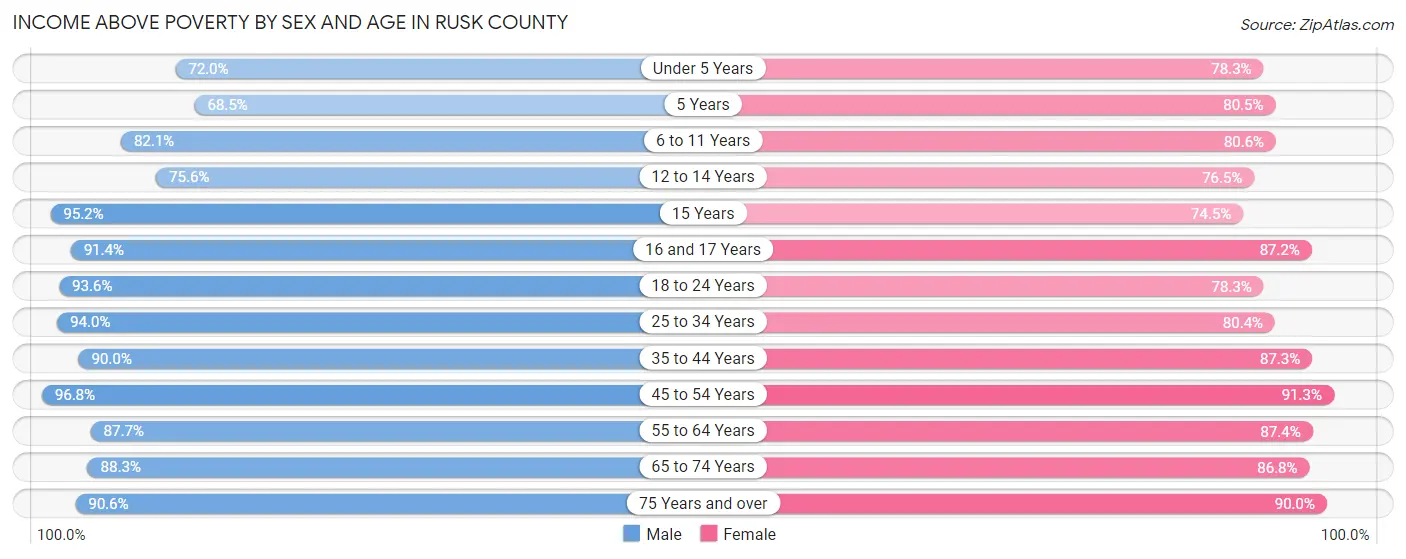
| Age Bracket | Male | Female |
| Under 5 Years | 1,220 (72.0%) | 957 (78.2%) |
| 5 Years | 215 (68.5%) | 107 (80.4%) |
| 6 to 11 Years | 1,432 (82.1%) | 1,660 (80.6%) |
| 12 to 14 Years | 1,024 (75.6%) | 819 (76.5%) |
| 15 Years | 278 (95.2%) | 184 (74.5%) |
| 16 and 17 Years | 684 (91.4%) | 675 (87.2%) |
| 18 to 24 Years | 2,263 (93.6%) | 1,519 (78.3%) |
| 25 to 34 Years | 2,524 (94.0%) | 2,046 (80.4%) |
| 35 to 44 Years | 2,904 (90.0%) | 2,642 (87.3%) |
| 45 to 54 Years | 2,743 (96.8%) | 2,592 (91.3%) |
| 55 to 64 Years | 2,525 (87.7%) | 2,898 (87.4%) |
| 65 to 74 Years | 2,164 (88.3%) | 2,311 (86.8%) |
| 75 Years and over | 1,318 (90.6%) | 1,676 (90.0%) |
| Total | 21,294 (88.4%) | 20,086 (84.8%) |
Income Below Poverty Among Married-Couple Families in Rusk County
The poverty statistics for married-couple families in Rusk County show that 6.1% or 579 of the total 9,441 families live below the poverty line. Families with 3 or 4 children have the highest poverty rate of 14.7%, comprising of 127 families. On the other hand, families with 1 or 2 children have the lowest poverty rate of 4.2%, which includes 127 families.
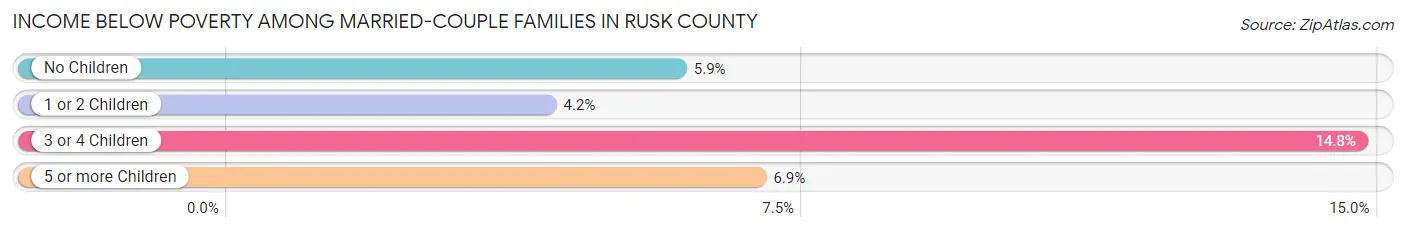
| Children | Above Poverty | Below Poverty |
| No Children | 5,124 (94.1%) | 319 (5.9%) |
| 1 or 2 Children | 2,923 (95.8%) | 127 (4.2%) |
| 3 or 4 Children | 734 (85.3%) | 127 (14.7%) |
| 5 or more Children | 81 (93.1%) | 6 (6.9%) |
| Total | 8,862 (93.9%) | 579 (6.1%) |
Income Below Poverty Among Single-Parent Households in Rusk County
According to the poverty data in Rusk County, 0.7% or 5 single-father households and 23.5% or 666 single-mother households are living below the poverty line. Among single-father households, those with 1 or 2 children have the highest poverty rate, with 5 households (1.3%) experiencing poverty. Likewise, among single-mother households, those with 3 or 4 children have the highest poverty rate, with 289 households (82.8%) falling below the poverty line.
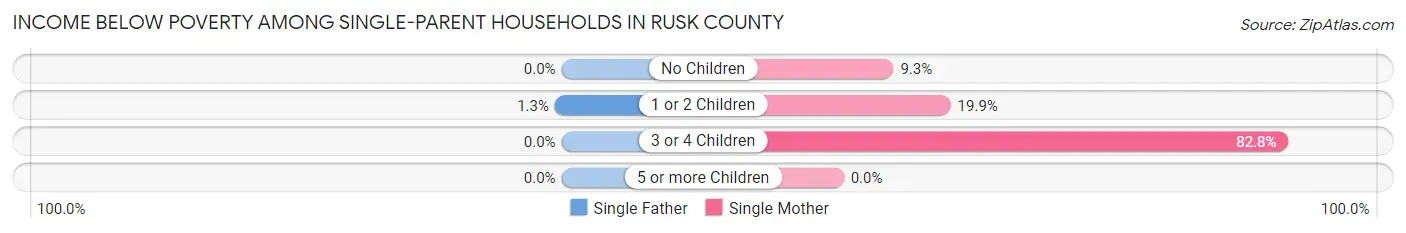
| Children | Single Father | Single Mother |
| No Children | 0 (0.0%) | 102 (9.3%) |
| 1 or 2 Children | 5 (1.3%) | 275 (19.9%) |
| 3 or 4 Children | 0 (0.0%) | 289 (82.8%) |
| 5 or more Children | 0 (0.0%) | 0 (0.0%) |
| Total | 5 (0.7%) | 666 (23.5%) |
Income Below Poverty Among Married-Couple vs Single-Parent Households in Rusk County
The poverty data for Rusk County shows that 579 of the married-couple family households (6.1%) and 671 of the single-parent households (18.8%) are living below the poverty level. Within the married-couple family households, those with 3 or 4 children have the highest poverty rate, with 127 households (14.7%) falling below the poverty line. Among the single-parent households, those with 3 or 4 children have the highest poverty rate, with 289 household (82.8%) living below poverty.
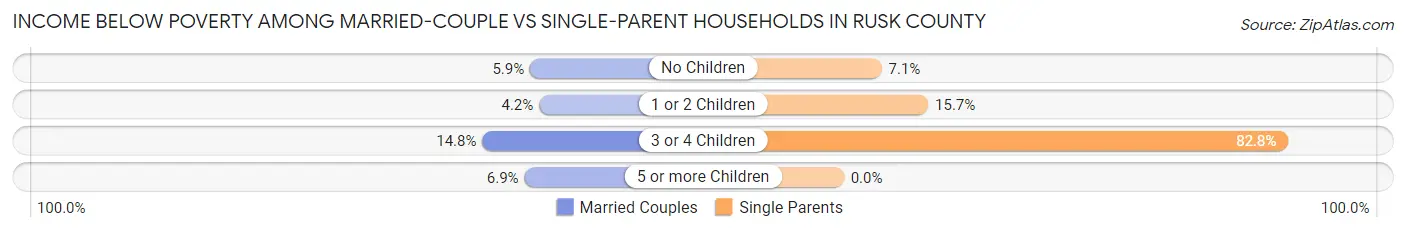
| Children | Married-Couple Families | Single-Parent Households |
| No Children | 319 (5.9%) | 102 (7.1%) |
| 1 or 2 Children | 127 (4.2%) | 280 (15.7%) |
| 3 or 4 Children | 127 (14.7%) | 289 (82.8%) |
| 5 or more Children | 6 (6.9%) | 0 (0.0%) |
| Total | 579 (6.1%) | 671 (18.8%) |
Race in Rusk County
The most populous races in Rusk County are White / Caucasian (36,902 | 70.0%), Hispanic or Latino (9,429 | 17.9%), and Black / African American (8,205 | 15.5%).
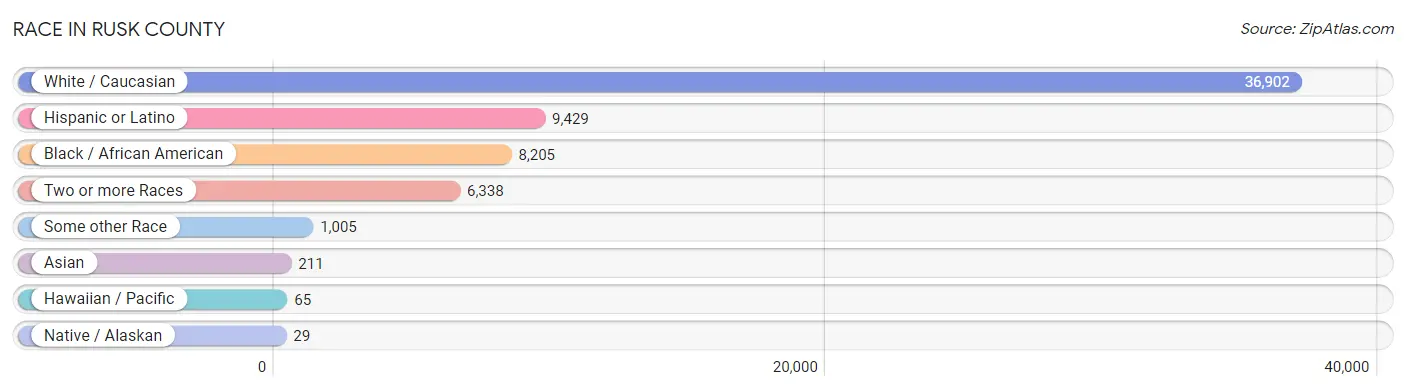
| Race | # Population | % Population |
| Asian | 211 | 0.4% |
| Black / African American | 8,205 | 15.5% |
| Hawaiian / Pacific | 65 | 0.1% |
| Hispanic or Latino | 9,429 | 17.9% |
| Native / Alaskan | 29 | 0.1% |
| White / Caucasian | 36,902 | 70.0% |
| Two or more Races | 6,338 | 12.0% |
| Some other Race | 1,005 | 1.9% |
| Total | 52,755 | 100.0% |
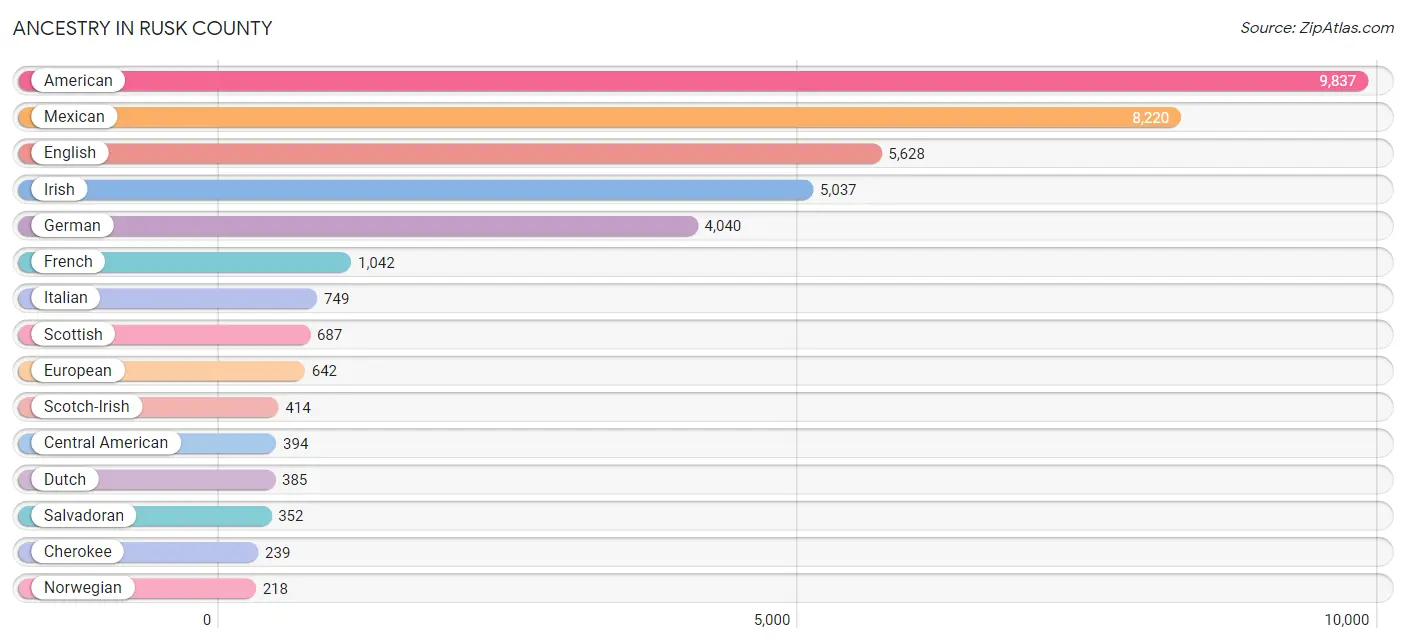
Ancestry in Rusk County
The most populous ancestries reported in Rusk County are American (9,837 | 18.6%), Mexican (8,220 | 15.6%), English (5,628 | 10.7%), Irish (5,037 | 9.6%), and German (4,040 | 7.7%), together accounting for 62.1% of all Rusk County residents.
| Ancestry | # Population | % Population |
| African | 195 | 0.4% |
| American | 9,837 | 18.6% |
| Apache | 3 | 0.0% |
| Arab | 45 | 0.1% |
| Australian | 34 | 0.1% |
| Austrian | 40 | 0.1% |
| Bahamian | 25 | 0.1% |
| Basque | 5 | 0.0% |
| Belgian | 29 | 0.1% |
| Belizean | 32 | 0.1% |
| Bhutanese | 89 | 0.2% |
| Blackfeet | 9 | 0.0% |
| British | 110 | 0.2% |
| Burmese | 28 | 0.1% |
| Cajun | 8 | 0.0% |
| Canadian | 4 | 0.0% |
| Central American | 394 | 0.7% |
| Cherokee | 239 | 0.4% |
| Chickasaw | 18 | 0.0% |
| Chippewa | 3 | 0.0% |
| Choctaw | 40 | 0.1% |
| Comanche | 3 | 0.0% |
| Cuban | 47 | 0.1% |
| Czech | 165 | 0.3% |
| Danish | 71 | 0.1% |
| Dutch | 385 | 0.7% |
| Dutch West Indian | 4 | 0.0% |
| Eastern European | 47 | 0.1% |
| Ecuadorian | 7 | 0.0% |
| English | 5,628 | 10.7% |
| European | 642 | 1.2% |
| Filipino | 69 | 0.1% |
| French | 1,042 | 2.0% |
| French Canadian | 15 | 0.0% |
| German | 4,040 | 7.7% |
| Greek | 19 | 0.0% |
| Guamanian / Chamorro | 3 | 0.0% |
| Guatemalan | 6 | 0.0% |
| Haitian | 6 | 0.0% |
| Honduran | 14 | 0.0% |
| Hungarian | 33 | 0.1% |
| Indian (Asian) | 95 | 0.2% |
| Iranian | 7 | 0.0% |
| Irish | 5,037 | 9.6% |
| Iroquois | 6 | 0.0% |
| Italian | 749 | 1.4% |
| Jamaican | 6 | 0.0% |
| Japanese | 34 | 0.1% |
| Kiowa | 1 | 0.0% |
| Korean | 84 | 0.2% |
| Lebanese | 26 | 0.1% |
| Lithuanian | 5 | 0.0% |
| Mexican | 8,220 | 15.6% |
| Native Hawaiian | 35 | 0.1% |
| Navajo | 21 | 0.0% |
| Nigerian | 4 | 0.0% |
| Norwegian | 218 | 0.4% |
| Osage | 1 | 0.0% |
| Panamanian | 22 | 0.0% |
| Peruvian | 9 | 0.0% |
| Polish | 84 | 0.2% |
| Portuguese | 19 | 0.0% |
| Puerto Rican | 213 | 0.4% |
| Romanian | 13 | 0.0% |
| Russian | 6 | 0.0% |
| Salvadoran | 352 | 0.7% |
| Samoan | 132 | 0.3% |
| Scandinavian | 44 | 0.1% |
| Scotch-Irish | 414 | 0.8% |
| Scottish | 687 | 1.3% |
| Sioux | 1 | 0.0% |
| Slavic | 26 | 0.1% |
| South American | 16 | 0.0% |
| Spaniard | 16 | 0.0% |
| Spanish | 62 | 0.1% |
| Sri Lankan | 63 | 0.1% |
| Subsaharan African | 209 | 0.4% |
| Sudanese | 64 | 0.1% |
| Swedish | 153 | 0.3% |
| Thai | 44 | 0.1% |
| Tongan | 78 | 0.2% |
| Welsh | 159 | 0.3% |
| Yugoslavian | 18 | 0.0% | View All 83 Rows |
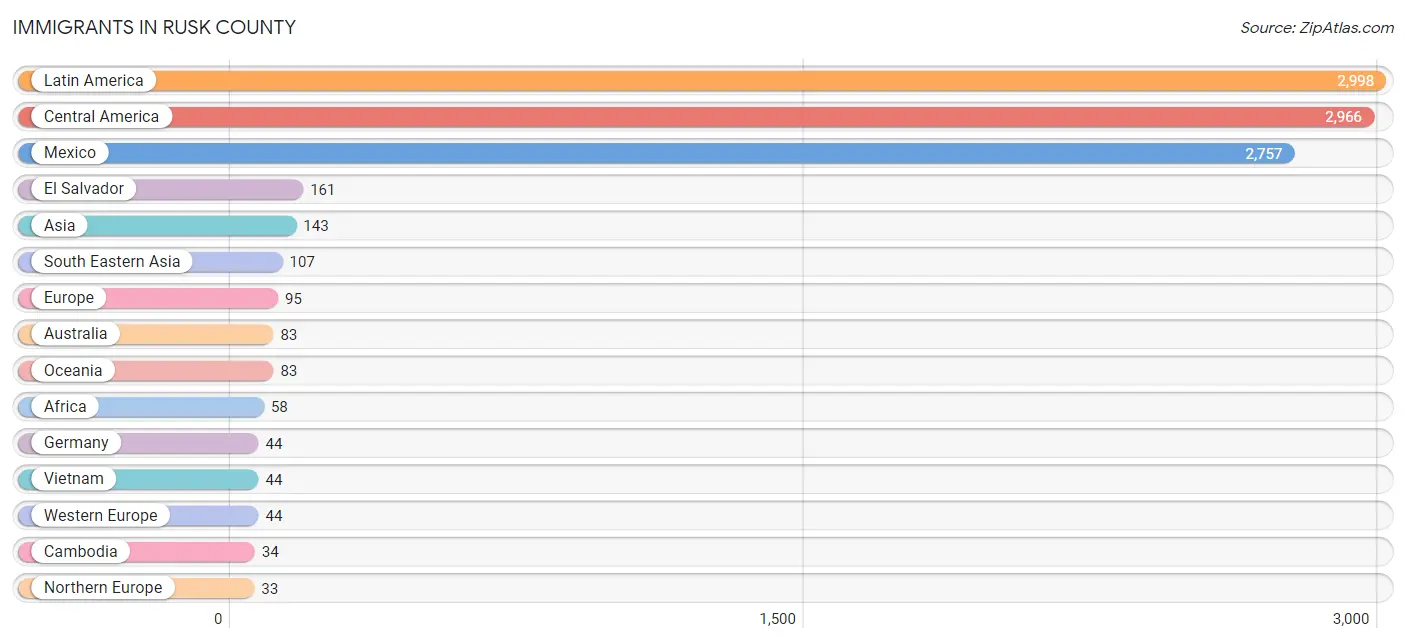
Immigrants in Rusk County
The most numerous immigrant groups reported in Rusk County came from Latin America (2,998 | 5.7%), Central America (2,966 | 5.6%), Mexico (2,757 | 5.2%), El Salvador (161 | 0.3%), and Asia (143 | 0.3%), together accounting for 17.1% of all Rusk County residents.
| Immigration Origin | # Population | % Population |
| Africa | 58 | 0.1% |
| Asia | 143 | 0.3% |
| Australia | 83 | 0.2% |
| Bahamas | 25 | 0.1% |
| Belize | 32 | 0.1% |
| Bosnia and Herzegovina | 18 | 0.0% |
| Cambodia | 34 | 0.1% |
| Canada | 23 | 0.0% |
| Caribbean | 25 | 0.1% |
| Central America | 2,966 | 5.6% |
| China | 31 | 0.1% |
| Eastern Africa | 18 | 0.0% |
| Eastern Asia | 31 | 0.1% |
| Eastern Europe | 18 | 0.0% |
| Ecuador | 7 | 0.0% |
| El Salvador | 161 | 0.3% |
| England | 21 | 0.0% |
| Europe | 95 | 0.2% |
| Germany | 44 | 0.1% |
| Guatemala | 6 | 0.0% |
| Honduras | 10 | 0.0% |
| India | 5 | 0.0% |
| Latin America | 2,998 | 5.7% |
| Mexico | 2,757 | 5.2% |
| Nigeria | 4 | 0.0% |
| Northern Africa | 5 | 0.0% |
| Northern Europe | 33 | 0.1% |
| Oceania | 83 | 0.2% |
| Philippines | 24 | 0.1% |
| South Africa | 31 | 0.1% |
| South America | 7 | 0.0% |
| South Central Asia | 5 | 0.0% |
| South Eastern Asia | 107 | 0.2% |
| Taiwan | 31 | 0.1% |
| Vietnam | 44 | 0.1% |
| Western Africa | 4 | 0.0% |
| Western Europe | 44 | 0.1% | View All 37 Rows |
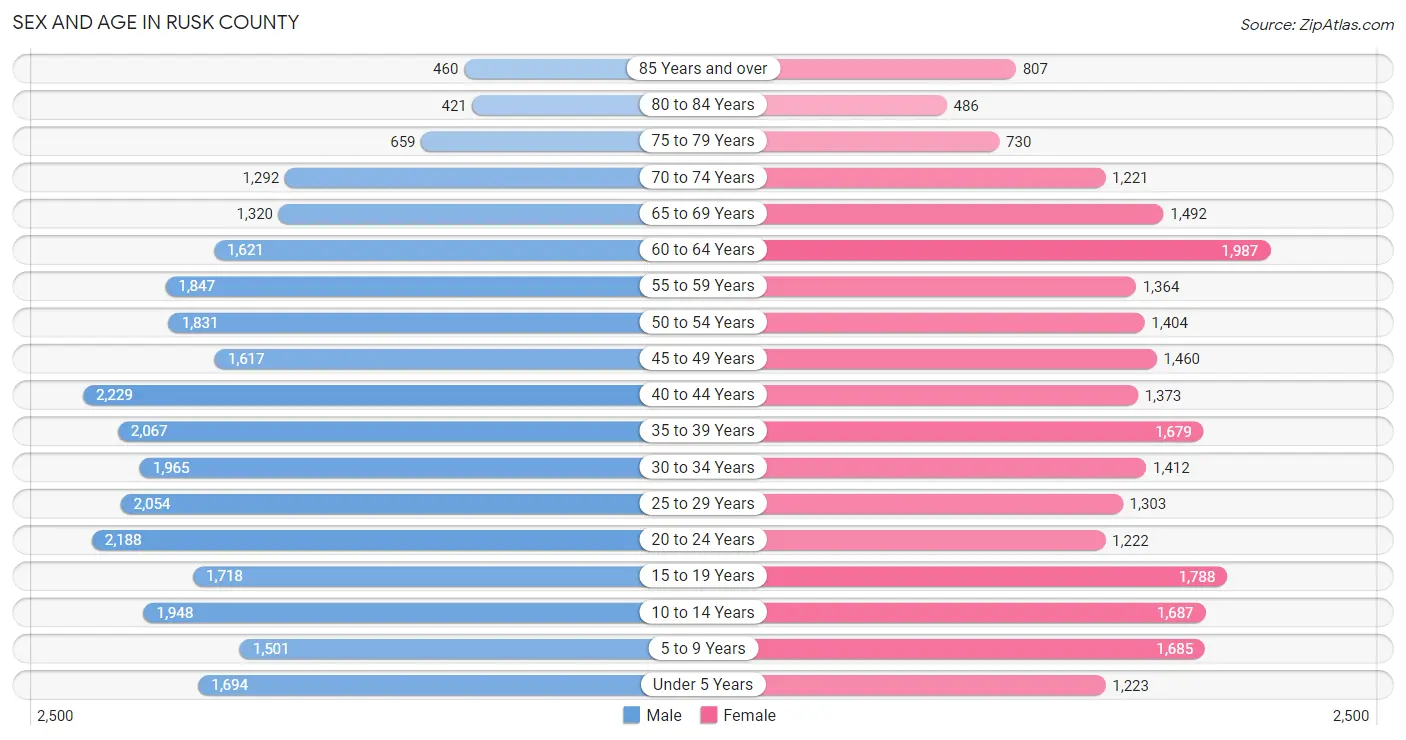
Sex and Age in Rusk County
Sex and Age in Rusk County
The most populous age groups in Rusk County are 40 to 44 Years (2,229 | 7.8%) for men and 60 to 64 Years (1,987 | 8.2%) for women.
| Age Bracket | Male | Female |
| Under 5 Years | 1,694 (6.0%) | 1,223 (5.0%) |
| 5 to 9 Years | 1,501 (5.3%) | 1,685 (6.9%) |
| 10 to 14 Years | 1,948 (6.9%) | 1,687 (6.9%) |
| 15 to 19 Years | 1,718 (6.0%) | 1,788 (7.3%) |
| 20 to 24 Years | 2,188 (7.7%) | 1,222 (5.0%) |
| 25 to 29 Years | 2,054 (7.2%) | 1,303 (5.4%) |
| 30 to 34 Years | 1,965 (6.9%) | 1,412 (5.8%) |
| 35 to 39 Years | 2,067 (7.3%) | 1,679 (6.9%) |
| 40 to 44 Years | 2,229 (7.8%) | 1,373 (5.6%) |
| 45 to 49 Years | 1,617 (5.7%) | 1,460 (6.0%) |
| 50 to 54 Years | 1,831 (6.4%) | 1,404 (5.8%) |
| 55 to 59 Years | 1,847 (6.5%) | 1,364 (5.6%) |
| 60 to 64 Years | 1,621 (5.7%) | 1,987 (8.2%) |
| 65 to 69 Years | 1,320 (4.6%) | 1,492 (6.1%) |
| 70 to 74 Years | 1,292 (4.5%) | 1,221 (5.0%) |
| 75 to 79 Years | 659 (2.3%) | 730 (3.0%) |
| 80 to 84 Years | 421 (1.5%) | 486 (2.0%) |
| 85 Years and over | 460 (1.6%) | 807 (3.3%) |
| Total | 28,432 (100.0%) | 24,323 (100.0%) |
Families and Households in Rusk County
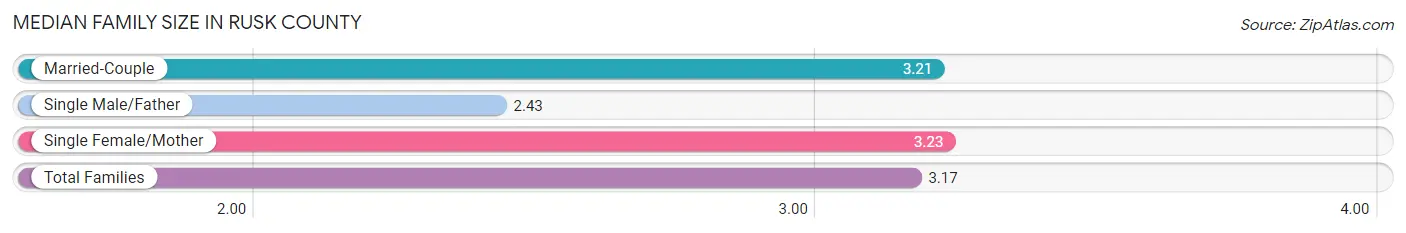
Median Family Size in Rusk County
The median family size in Rusk County is 3.17 persons per family, with single female/mother families (2,828 | 21.7%) accounting for the largest median family size of 3.23 persons per family. On the other hand, single male/father families (744 | 5.7%) represent the smallest median family size with 2.43 persons per family.
| Family Type | # Families | Family Size |
| Married-Couple | 9,441 (72.6%) | 3.21 |
| Single Male/Father | 744 (5.7%) | 2.43 |
| Single Female/Mother | 2,828 (21.7%) | 3.23 |
| Total Families | 13,013 (100.0%) | 3.17 |
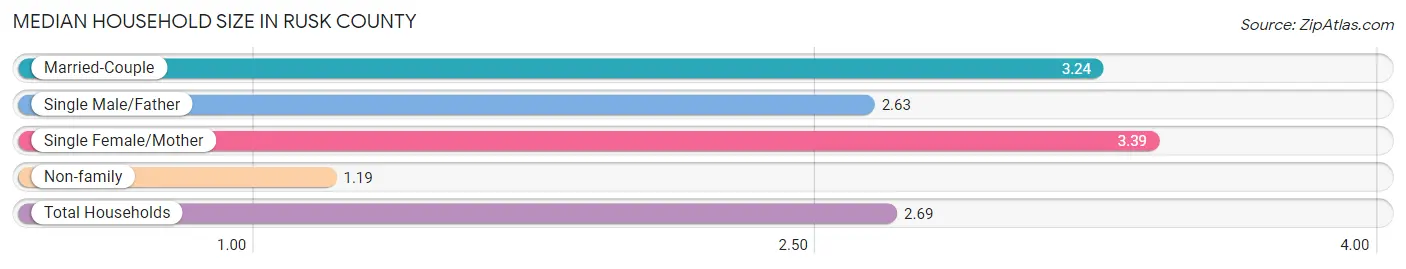
Median Household Size in Rusk County
The median household size in Rusk County is 2.69 persons per household, with single female/mother households (2,828 | 15.9%) accounting for the largest median household size of 3.39 persons per household. non-family households (4,779 | 26.9%) represent the smallest median household size with 1.19 persons per household.
| Household Type | # Households | Household Size |
| Married-Couple | 9,441 (53.1%) | 3.24 |
| Single Male/Father | 744 (4.2%) | 2.63 |
| Single Female/Mother | 2,828 (15.9%) | 3.39 |
| Non-family | 4,779 (26.9%) | 1.19 |
| Total Households | 17,792 (100.0%) | 2.69 |
Household Size by Marriage Status in Rusk County
Out of a total of 17,792 households in Rusk County, 13,013 (73.1%) are family households, while 4,779 (26.9%) are nonfamily households. The most numerous type of family households are 2-person households, comprising 6,264, and the most common type of nonfamily households are 1-person households, comprising 4,081.
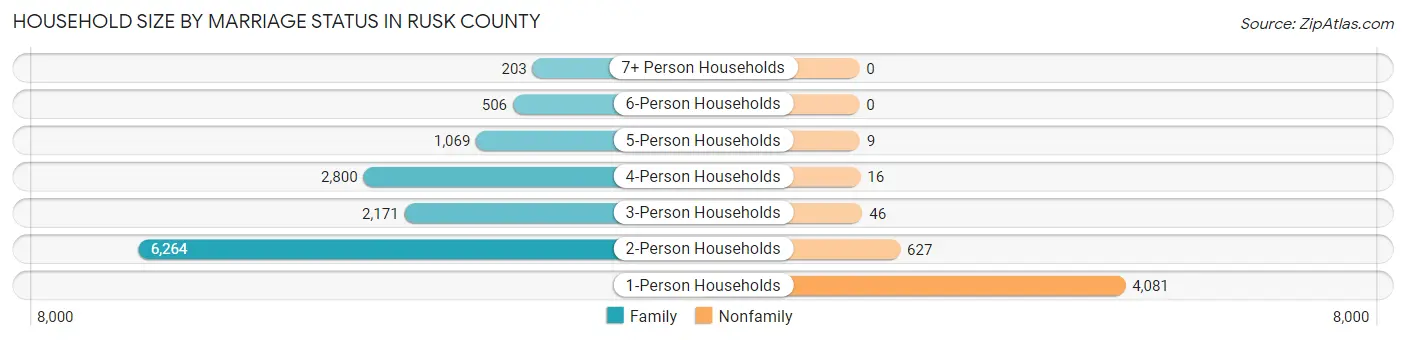
| Household Size | Family Households | Nonfamily Households |
| 1-Person Households | - | 4,081 (22.9%) |
| 2-Person Households | 6,264 (35.2%) | 627 (3.5%) |
| 3-Person Households | 2,171 (12.2%) | 46 (0.3%) |
| 4-Person Households | 2,800 (15.7%) | 16 (0.1%) |
| 5-Person Households | 1,069 (6.0%) | 9 (0.1%) |
| 6-Person Households | 506 (2.8%) | 0 (0.0%) |
| 7+ Person Households | 203 (1.1%) | 0 (0.0%) |
| Total | 13,013 (73.1%) | 4,779 (26.9%) |
Female Fertility in Rusk County
Fertility by Age in Rusk County
Average fertility rate in Rusk County is 35.0 births per 1,000 women. Women in the age bracket of 20 to 34 years have the highest fertility rate with 79.0 births per 1,000 women. Women in the age bracket of 20 to 34 years acount for 84.7% of all women with births.
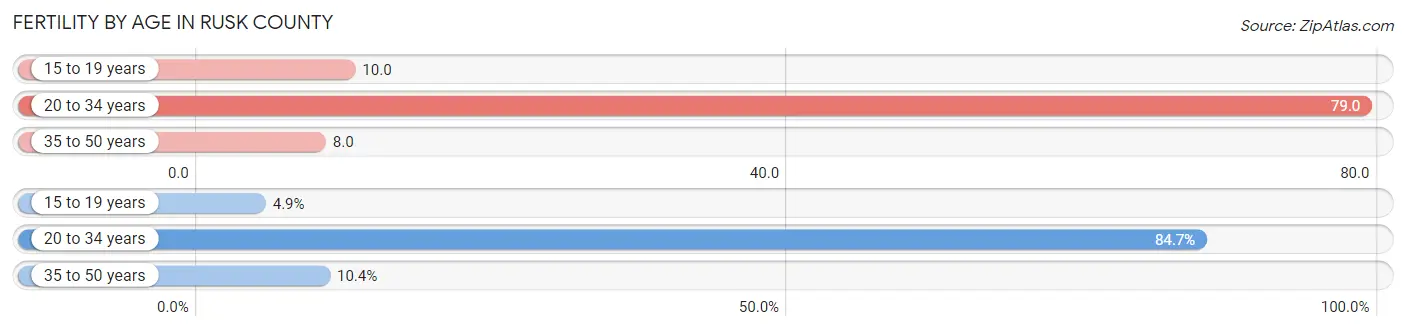
| Age Bracket | Women with Births | Births / 1,000 Women |
| 15 to 19 years | 18 (4.9%) | 10.0 |
| 20 to 34 years | 311 (84.7%) | 79.0 |
| 35 to 50 years | 38 (10.3%) | 8.0 |
| Total | 367 (100.0%) | 35.0 |
Fertility by Age by Marriage Status in Rusk County
73.0% of women with births (367) in Rusk County are married. The highest percentage of unmarried women with births falls into 15 to 19 years age bracket with 100.0% of them unmarried at the time of birth, while the lowest percentage of unmarried women with births belong to 20 to 34 years age bracket with 19.0% of them unmarried.
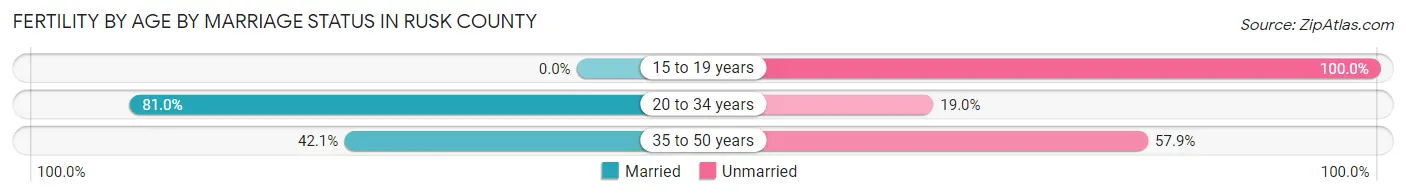
| Age Bracket | Married | Unmarried |
| 15 to 19 years | 0 (0.0%) | 18 (100.0%) |
| 20 to 34 years | 252 (81.0%) | 59 (19.0%) |
| 35 to 50 years | 16 (42.1%) | 22 (57.9%) |
| Total | 268 (73.0%) | 99 (27.0%) |
Fertility by Education in Rusk County
Average fertility rate in Rusk County is 35.0 births per 1,000 women. Women with the education attainment of bachelor's degree have the highest fertility rate of 66.0 births per 1,000 women, while women with the education attainment of less than high school have the lowest fertility at 9.0 births per 1,000 women. Women with the education attainment of high school diploma represent 38.2% of all women with births.
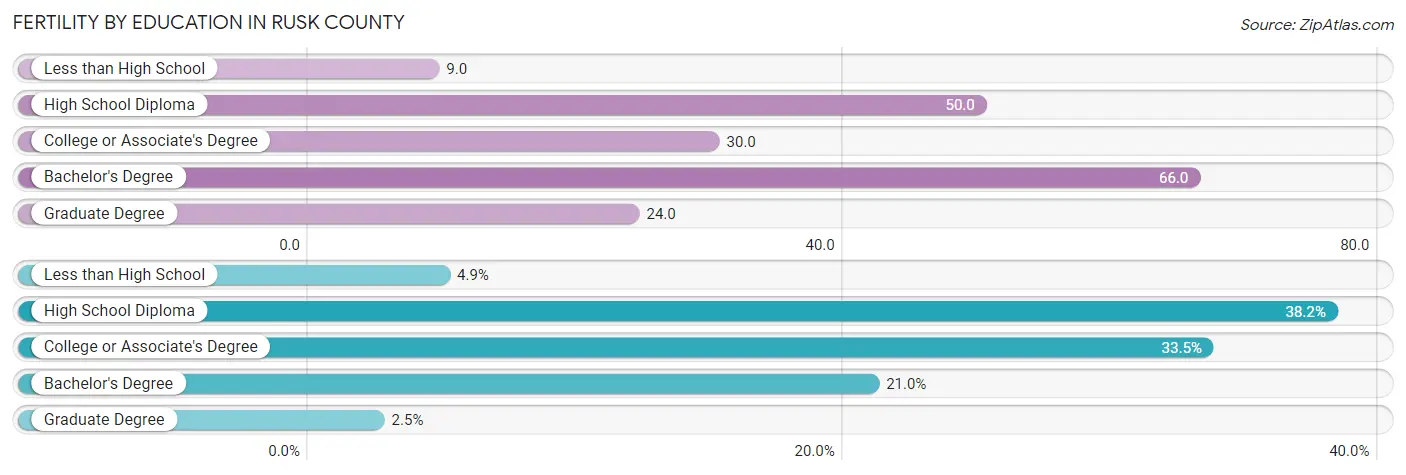
| Educational Attainment | Women with Births | Births / 1,000 Women |
| Less than High School | 18 (4.9%) | 9.0 |
| High School Diploma | 140 (38.2%) | 50.0 |
| College or Associate's Degree | 123 (33.5%) | 30.0 |
| Bachelor's Degree | 77 (21.0%) | 66.0 |
| Graduate Degree | 9 (2.5%) | 24.0 |
| Total | 367 (100.0%) | 35.0 |
Fertility by Education by Marriage Status in Rusk County
27.0% of women with births in Rusk County are unmarried. Women with the educational attainment of bachelor's degree are most likely to be married with 100.0% of them married at childbirth, while women with the educational attainment of less than high school are least likely to be married with 100.0% of them unmarried at childbirth.
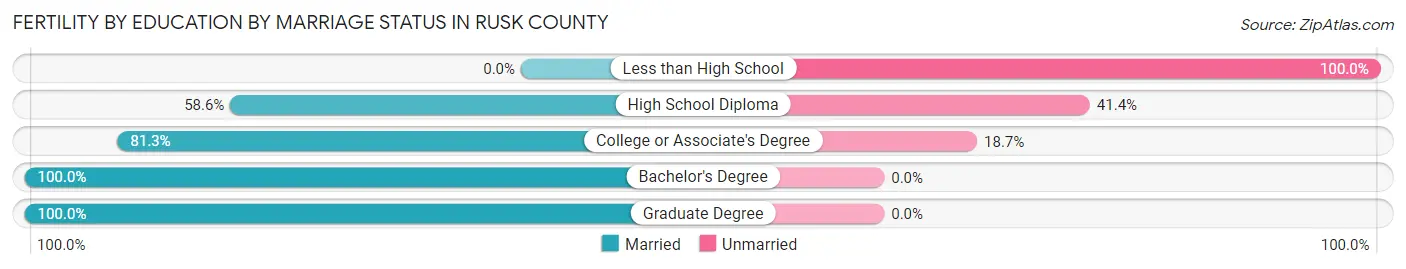
| Educational Attainment | Married | Unmarried |
| Less than High School | 0 (0.0%) | 18 (100.0%) |
| High School Diploma | 82 (58.6%) | 58 (41.4%) |
| College or Associate's Degree | 100 (81.3%) | 23 (18.7%) |
| Bachelor's Degree | 77 (100.0%) | 0 (0.0%) |
| Graduate Degree | 9 (100.0%) | 0 (0.0%) |
| Total | 268 (73.0%) | 99 (27.0%) |
Employment Characteristics in Rusk County
Employment by Class of Employer in Rusk County
Among the 21,072 employed individuals in Rusk County, private company employees (14,364 | 68.2%), not-for-profit organizations (1,556 | 7.4%), and self-employed (not incorporated) (1,334 | 6.3%) make up the most common classes of employment.
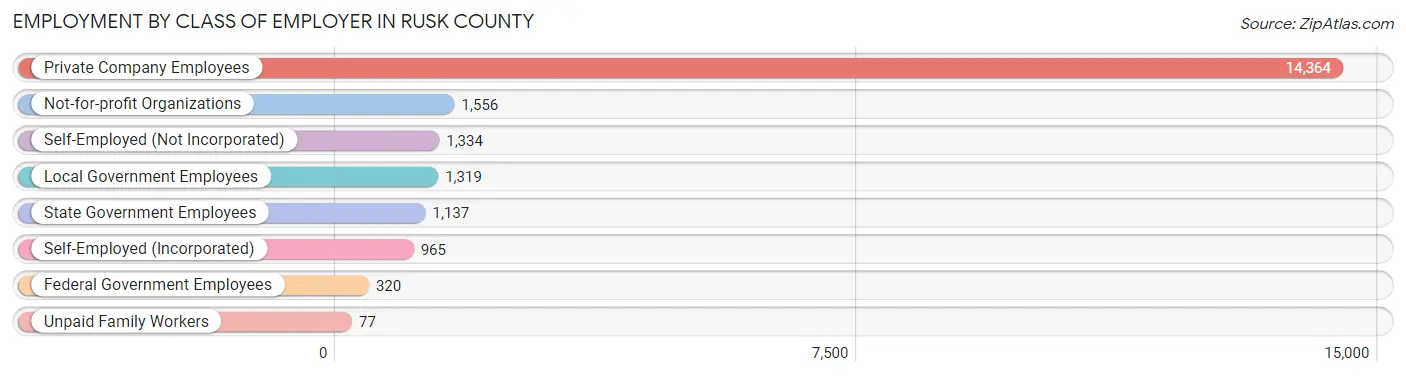
| Employer Class | # Employees | % Employees |
| Private Company Employees | 14,364 | 68.2% |
| Self-Employed (Incorporated) | 965 | 4.6% |
| Self-Employed (Not Incorporated) | 1,334 | 6.3% |
| Not-for-profit Organizations | 1,556 | 7.4% |
| Local Government Employees | 1,319 | 6.3% |
| State Government Employees | 1,137 | 5.4% |
| Federal Government Employees | 320 | 1.5% |
| Unpaid Family Workers | 77 | 0.4% |
| Total | 21,072 | 100.0% |
Employment Status by Age in Rusk County
According to the labor force statistics for Rusk County, out of the total population over 16 years of age (42,478), 53.5% or 22,726 individuals are in the labor force, with 5.5% or 1,250 of them unemployed. The age group with the highest labor force participation rate is 20 to 24 years, with 71.8% or 2,448 individuals in the labor force. Within the labor force, the 16 to 19 years age range has the highest percentage of unemployed individuals, with 20.5% or 254 of them being unemployed.
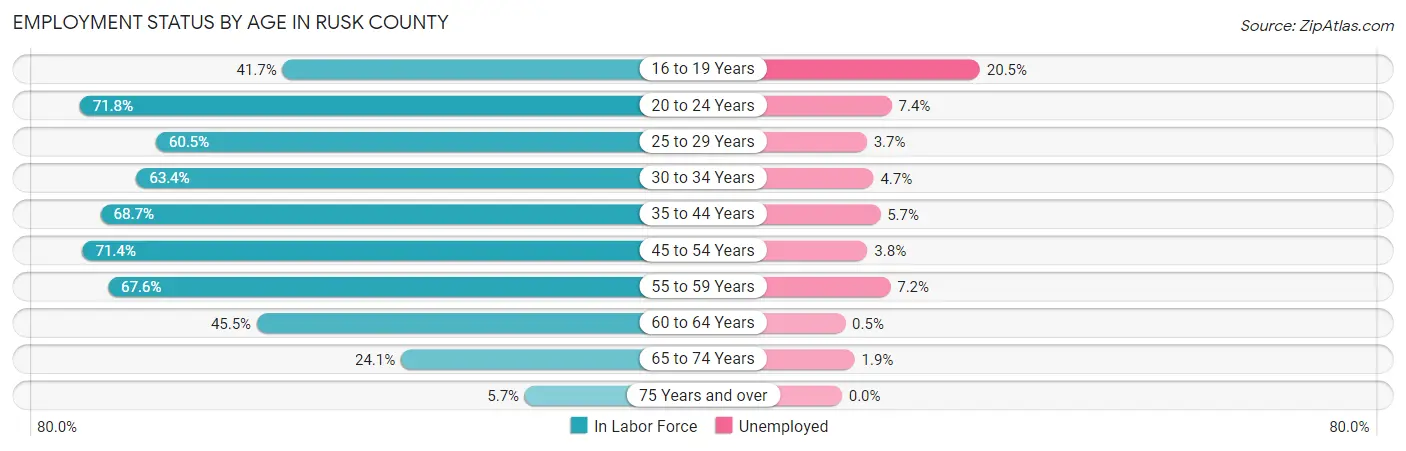
| Age Bracket | In Labor Force | Unemployed |
| 16 to 19 Years | 1,237 (41.7%) | 254 (20.5%) |
| 20 to 24 Years | 2,448 (71.8%) | 181 (7.4%) |
| 25 to 29 Years | 2,031 (60.5%) | 75 (3.7%) |
| 30 to 34 Years | 2,141 (63.4%) | 101 (4.7%) |
| 35 to 44 Years | 5,048 (68.7%) | 288 (5.7%) |
| 45 to 54 Years | 4,507 (71.4%) | 171 (3.8%) |
| 55 to 59 Years | 2,171 (67.6%) | 156 (7.2%) |
| 60 to 64 Years | 1,642 (45.5%) | 8 (0.5%) |
| 65 to 74 Years | 1,283 (24.1%) | 24 (1.9%) |
| 75 Years and over | 203 (5.7%) | 0 (0.0%) |
| Total | 22,726 (53.5%) | 1,250 (5.5%) |
Employment Status by Educational Attainment in Rusk County
According to labor force statistics for Rusk County, 64.5% of individuals (17,552) out of the total population between 25 and 64 years of age (27,213) are in the labor force, with 4.6% or 807 of them being unemployed. The group with the highest labor force participation rate are those with the educational attainment of bachelor's degree or higher, with 83.6% or 3,382 individuals in the labor force. Within the labor force, individuals with less than high school education have the highest percentage of unemployment, with 11.7% or 211 of them being unemployed.
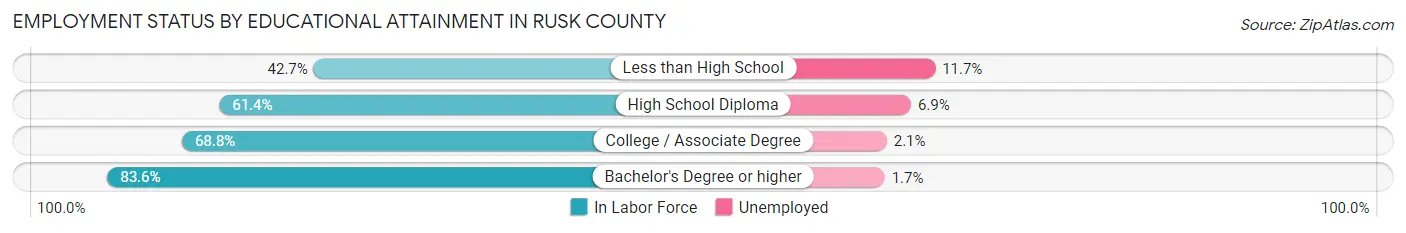
| Educational Attainment | In Labor Force | Unemployed |
| Less than High School | 1,807 (42.7%) | 495 (11.7%) |
| High School Diploma | 5,560 (61.4%) | 625 (6.9%) |
| College / Associate Degree | 6,797 (68.8%) | 207 (2.1%) |
| Bachelor's Degree or higher | 3,382 (83.6%) | 69 (1.7%) |
| Total | 17,552 (64.5%) | 1,252 (4.6%) |
Employment Occupations by Sex in Rusk County
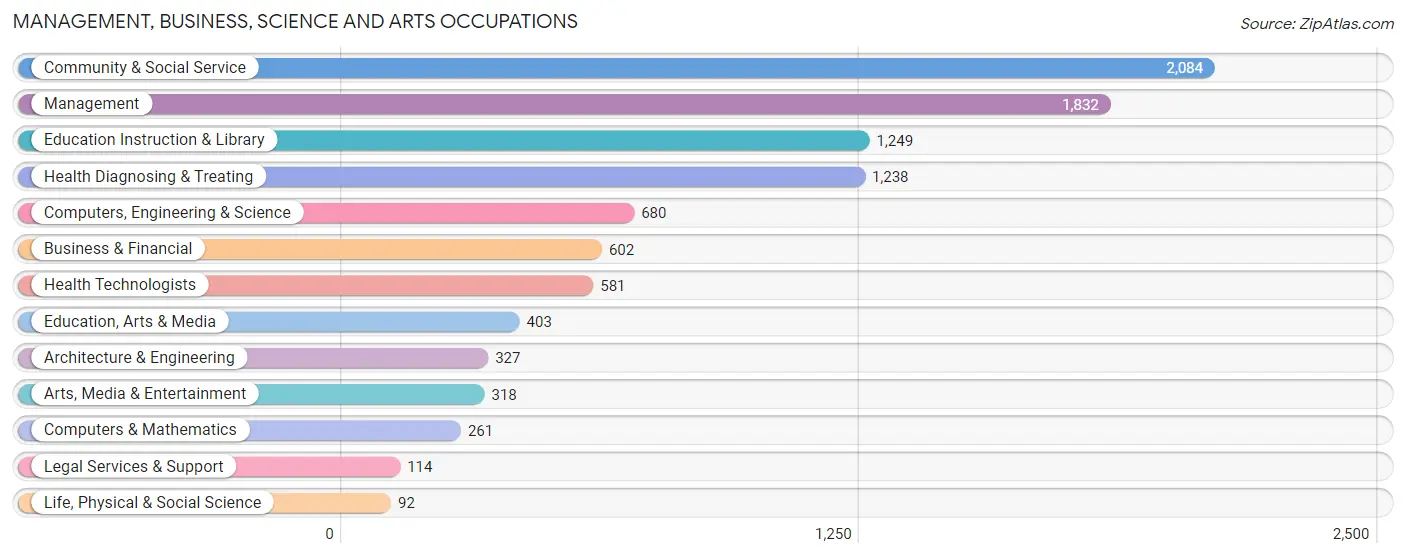
Management, Business, Science and Arts Occupations
The most common Management, Business, Science and Arts occupations in Rusk County are Community & Social Service (2,084 | 9.7%), Management (1,832 | 8.5%), Education Instruction & Library (1,249 | 5.8%), Health Diagnosing & Treating (1,238 | 5.8%), and Computers, Engineering & Science (680 | 3.2%).
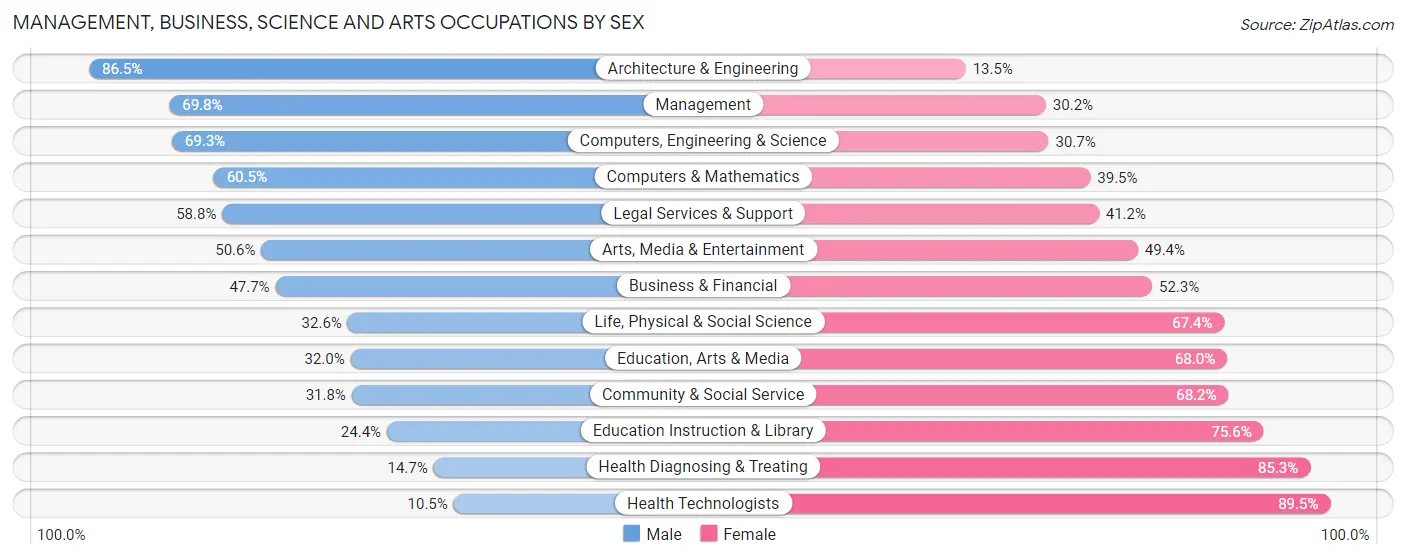
Management, Business, Science and Arts Occupations by Sex
Within the Management, Business, Science and Arts occupations in Rusk County, the most male-oriented occupations are Architecture & Engineering (86.5%), Management (69.8%), and Computers, Engineering & Science (69.3%), while the most female-oriented occupations are Health Technologists (89.5%), Health Diagnosing & Treating (85.3%), and Education Instruction & Library (75.6%).
| Occupation | Male | Female |
| Management | 1,279 (69.8%) | 553 (30.2%) |
| Business & Financial | 287 (47.7%) | 315 (52.3%) |
| Computers, Engineering & Science | 471 (69.3%) | 209 (30.7%) |
| Computers & Mathematics | 158 (60.5%) | 103 (39.5%) |
| Architecture & Engineering | 283 (86.5%) | 44 (13.5%) |
| Life, Physical & Social Science | 30 (32.6%) | 62 (67.4%) |
| Community & Social Service | 662 (31.8%) | 1,422 (68.2%) |
| Education, Arts & Media | 129 (32.0%) | 274 (68.0%) |
| Legal Services & Support | 67 (58.8%) | 47 (41.2%) |
| Education Instruction & Library | 305 (24.4%) | 944 (75.6%) |
| Arts, Media & Entertainment | 161 (50.6%) | 157 (49.4%) |
| Health Diagnosing & Treating | 182 (14.7%) | 1,056 (85.3%) |
| Health Technologists | 61 (10.5%) | 520 (89.5%) |
| Total (Category) | 2,881 (44.8%) | 3,555 (55.2%) |
| Total (Overall) | 12,347 (57.6%) | 9,107 (42.4%) |
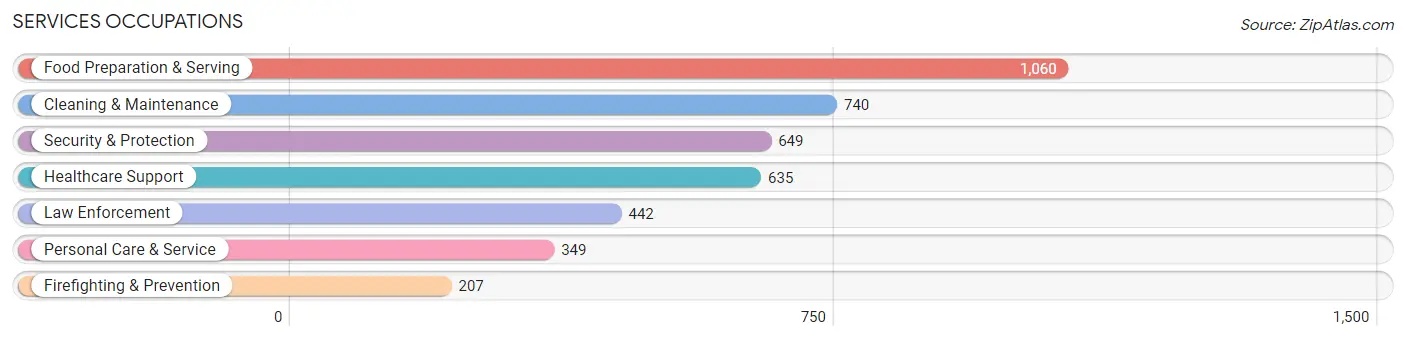
Services Occupations
The most common Services occupations in Rusk County are Food Preparation & Serving (1,060 | 4.9%), Cleaning & Maintenance (740 | 3.5%), Security & Protection (649 | 3.0%), Healthcare Support (635 | 3.0%), and Law Enforcement (442 | 2.1%).
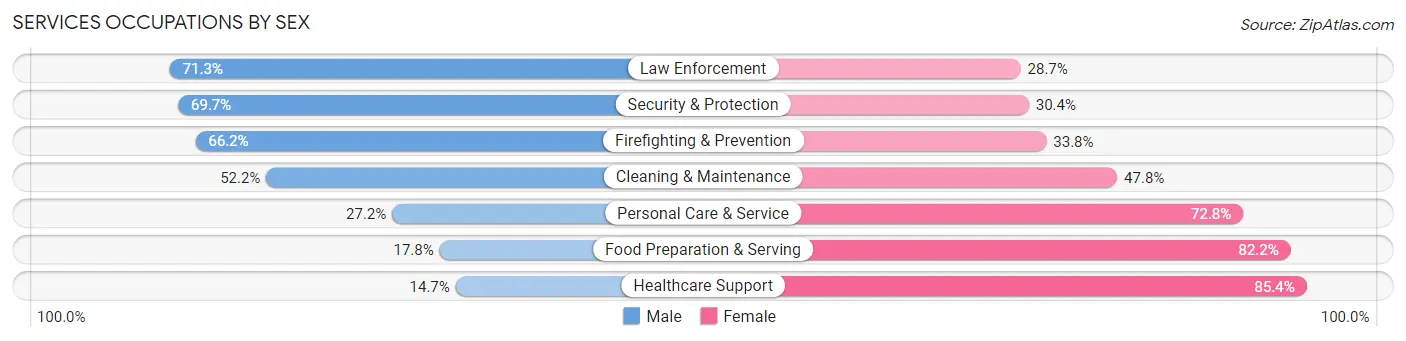
Services Occupations by Sex
Within the Services occupations in Rusk County, the most male-oriented occupations are Law Enforcement (71.3%), Security & Protection (69.7%), and Firefighting & Prevention (66.2%), while the most female-oriented occupations are Healthcare Support (85.4%), Food Preparation & Serving (82.2%), and Personal Care & Service (72.8%).
| Occupation | Male | Female |
| Healthcare Support | 93 (14.6%) | 542 (85.4%) |
| Security & Protection | 452 (69.7%) | 197 (30.3%) |
| Firefighting & Prevention | 137 (66.2%) | 70 (33.8%) |
| Law Enforcement | 315 (71.3%) | 127 (28.7%) |
| Food Preparation & Serving | 189 (17.8%) | 871 (82.2%) |
| Cleaning & Maintenance | 386 (52.2%) | 354 (47.8%) |
| Personal Care & Service | 95 (27.2%) | 254 (72.8%) |
| Total (Category) | 1,215 (35.4%) | 2,218 (64.6%) |
| Total (Overall) | 12,347 (57.6%) | 9,107 (42.4%) |
Sales and Office Occupations
The most common Sales and Office occupations in Rusk County are Office & Administration (2,204 | 10.3%), and Sales & Related (1,962 | 9.1%).

Sales and Office Occupations by Sex

| Occupation | Male | Female |
| Sales & Related | 1,116 (56.9%) | 846 (43.1%) |
| Office & Administration | 380 (17.2%) | 1,824 (82.8%) |
| Total (Category) | 1,496 (35.9%) | 2,670 (64.1%) |
| Total (Overall) | 12,347 (57.6%) | 9,107 (42.4%) |
Natural Resources, Construction and Maintenance Occupations
The most common Natural Resources, Construction and Maintenance occupations in Rusk County are Construction & Extraction (1,635 | 7.6%), Installation, Maintenance & Repair (1,216 | 5.7%), and Farming, Fishing & Forestry (126 | 0.6%).
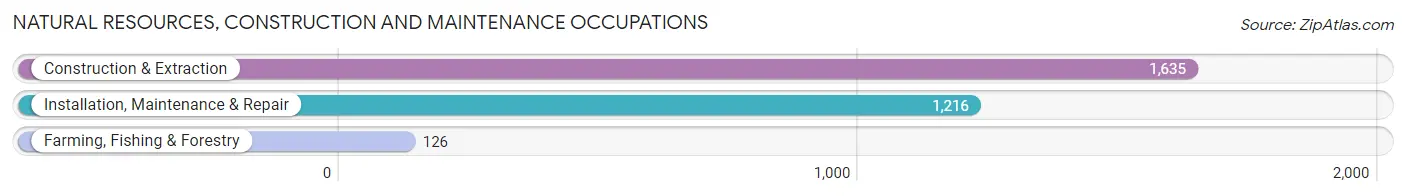
Natural Resources, Construction and Maintenance Occupations by Sex
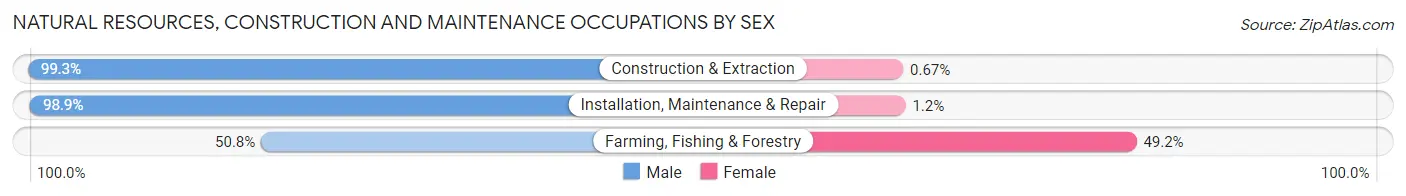
| Occupation | Male | Female |
| Farming, Fishing & Forestry | 64 (50.8%) | 62 (49.2%) |
| Construction & Extraction | 1,624 (99.3%) | 11 (0.7%) |
| Installation, Maintenance & Repair | 1,202 (98.9%) | 14 (1.1%) |
| Total (Category) | 2,890 (97.1%) | 87 (2.9%) |
| Total (Overall) | 12,347 (57.6%) | 9,107 (42.4%) |
Production, Transportation and Moving Occupations
The most common Production, Transportation and Moving occupations in Rusk County are Production (2,265 | 10.6%), Transportation (1,183 | 5.5%), and Material Moving (994 | 4.6%).
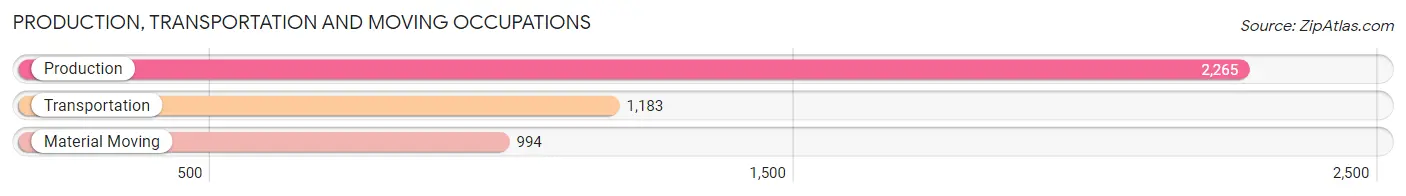
Production, Transportation and Moving Occupations by Sex
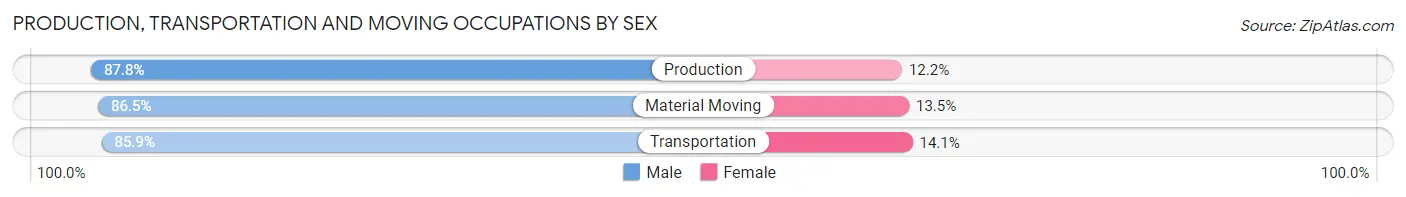
| Occupation | Male | Female |
| Production | 1,989 (87.8%) | 276 (12.2%) |
| Transportation | 1,016 (85.9%) | 167 (14.1%) |
| Material Moving | 860 (86.5%) | 134 (13.5%) |
| Total (Category) | 3,865 (87.0%) | 577 (13.0%) |
| Total (Overall) | 12,347 (57.6%) | 9,107 (42.4%) |
Employment Industries by Sex in Rusk County
Employment Industries in Rusk County
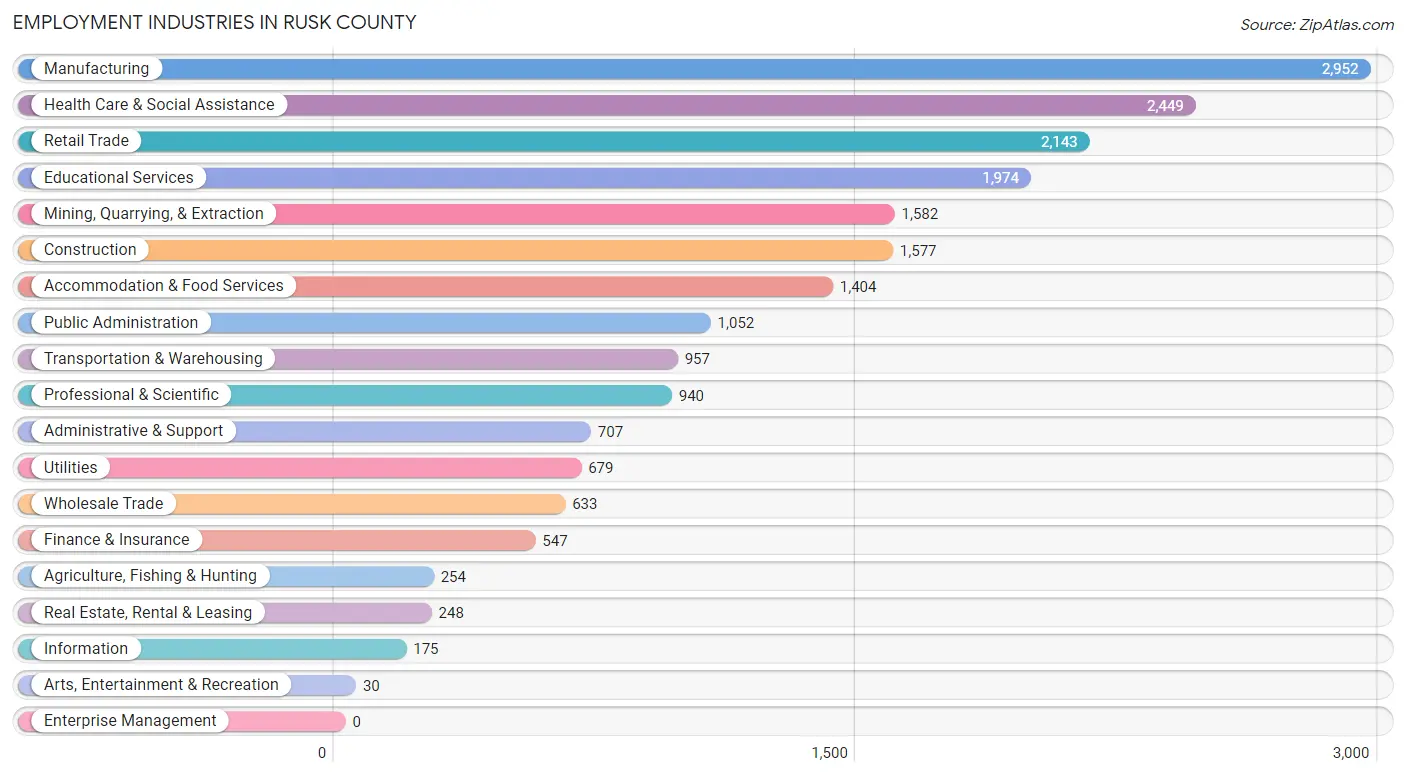
The major employment industries in Rusk County include Manufacturing (2,952 | 13.8%), Health Care & Social Assistance (2,449 | 11.4%), Retail Trade (2,143 | 10.0%), Educational Services (1,974 | 9.2%), and Mining, Quarrying, & Extraction (1,582 | 7.4%).
Employment Industries by Sex in Rusk County
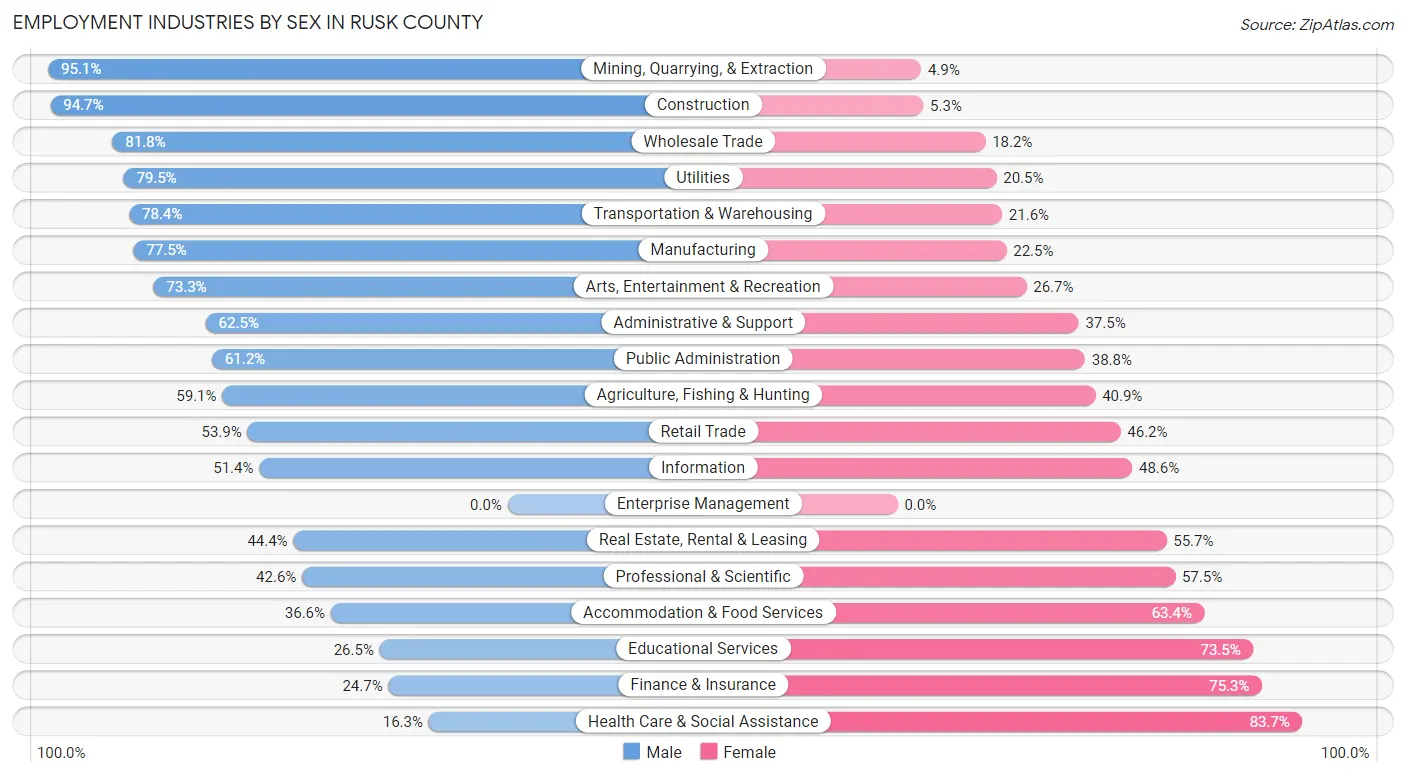
The Rusk County industries that see more men than women are Mining, Quarrying, & Extraction (95.1%), Construction (94.7%), and Wholesale Trade (81.8%), whereas the industries that tend to have a higher number of women are Health Care & Social Assistance (83.7%), Finance & Insurance (75.3%), and Educational Services (73.5%).
| Industry | Male | Female |
| Agriculture, Fishing & Hunting | 150 (59.1%) | 104 (40.9%) |
| Mining, Quarrying, & Extraction | 1,505 (95.1%) | 77 (4.9%) |
| Construction | 1,493 (94.7%) | 84 (5.3%) |
| Manufacturing | 2,287 (77.5%) | 665 (22.5%) |
| Wholesale Trade | 518 (81.8%) | 115 (18.2%) |
| Retail Trade | 1,154 (53.8%) | 989 (46.2%) |
| Transportation & Warehousing | 750 (78.4%) | 207 (21.6%) |
| Utilities | 540 (79.5%) | 139 (20.5%) |
| Information | 90 (51.4%) | 85 (48.6%) |
| Finance & Insurance | 135 (24.7%) | 412 (75.3%) |
| Real Estate, Rental & Leasing | 110 (44.4%) | 138 (55.6%) |
| Professional & Scientific | 400 (42.5%) | 540 (57.5%) |
| Enterprise Management | 0 (0.0%) | 0 (0.0%) |
| Administrative & Support | 442 (62.5%) | 265 (37.5%) |
| Educational Services | 523 (26.5%) | 1,451 (73.5%) |
| Health Care & Social Assistance | 400 (16.3%) | 2,049 (83.7%) |
| Arts, Entertainment & Recreation | 22 (73.3%) | 8 (26.7%) |
| Accommodation & Food Services | 514 (36.6%) | 890 (63.4%) |
| Public Administration | 644 (61.2%) | 408 (38.8%) |
| Total | 12,347 (57.6%) | 9,107 (42.4%) |
Education in Rusk County
School Enrollment in Rusk County
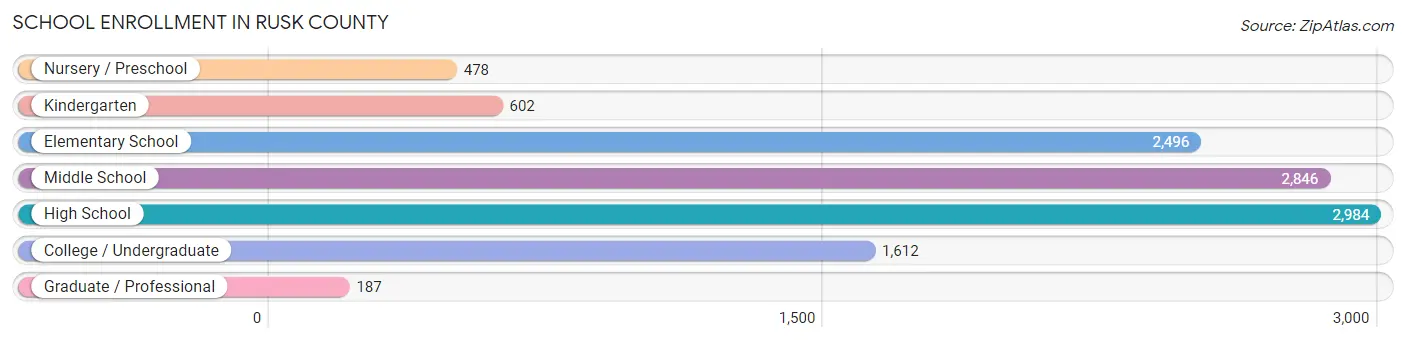
The most common levels of schooling among the 11,205 students in Rusk County are high school (2,984 | 26.6%), middle school (2,846 | 25.4%), and elementary school (2,496 | 22.3%).
| School Level | # Students | % Students |
| Nursery / Preschool | 478 | 4.3% |
| Kindergarten | 602 | 5.4% |
| Elementary School | 2,496 | 22.3% |
| Middle School | 2,846 | 25.4% |
| High School | 2,984 | 26.6% |
| College / Undergraduate | 1,612 | 14.4% |
| Graduate / Professional | 187 | 1.7% |
| Total | 11,205 | 100.0% |
School Enrollment by Age by Funding Source in Rusk County
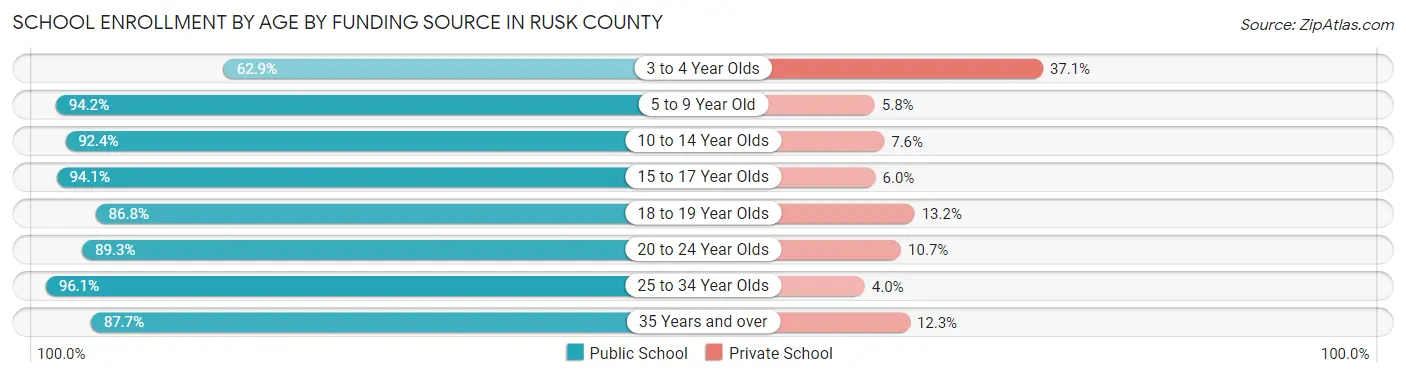
Out of a total of 11,205 students who are enrolled in schools in Rusk County, 997 (8.9%) attend a private institution, while the remaining 10,208 (91.1%) are enrolled in public schools. The age group of 3 to 4 year olds has the highest likelihood of being enrolled in private schools, with 170 (37.1% in the age bracket) enrolled. Conversely, the age group of 25 to 34 year olds has the lowest likelihood of being enrolled in a private school, with 243 (96.1% in the age bracket) attending a public institution.
| Age Bracket | Public School | Private School |
| 3 to 4 Year Olds | 288 (62.9%) | 170 (37.1%) |
| 5 to 9 Year Old | 2,657 (94.2%) | 164 (5.8%) |
| 10 to 14 Year Olds | 3,225 (92.4%) | 264 (7.6%) |
| 15 to 17 Year Olds | 1,850 (94.1%) | 117 (5.9%) |
| 18 to 19 Year Olds | 734 (86.8%) | 112 (13.2%) |
| 20 to 24 Year Olds | 725 (89.3%) | 87 (10.7%) |
| 25 to 34 Year Olds | 243 (96.1%) | 10 (4.0%) |
| 35 Years and over | 490 (87.7%) | 69 (12.3%) |
| Total | 10,208 (91.1%) | 997 (8.9%) |
Educational Attainment by Field of Study in Rusk County
Education (1,252 | 20.2%), business (975 | 15.8%), bio, nature & agricultural (789 | 12.8%), science & technology (570 | 9.2%), and liberal arts & history (479 | 7.7%) are the most common fields of study among 6,187 individuals in Rusk County who have obtained a bachelor's degree or higher.
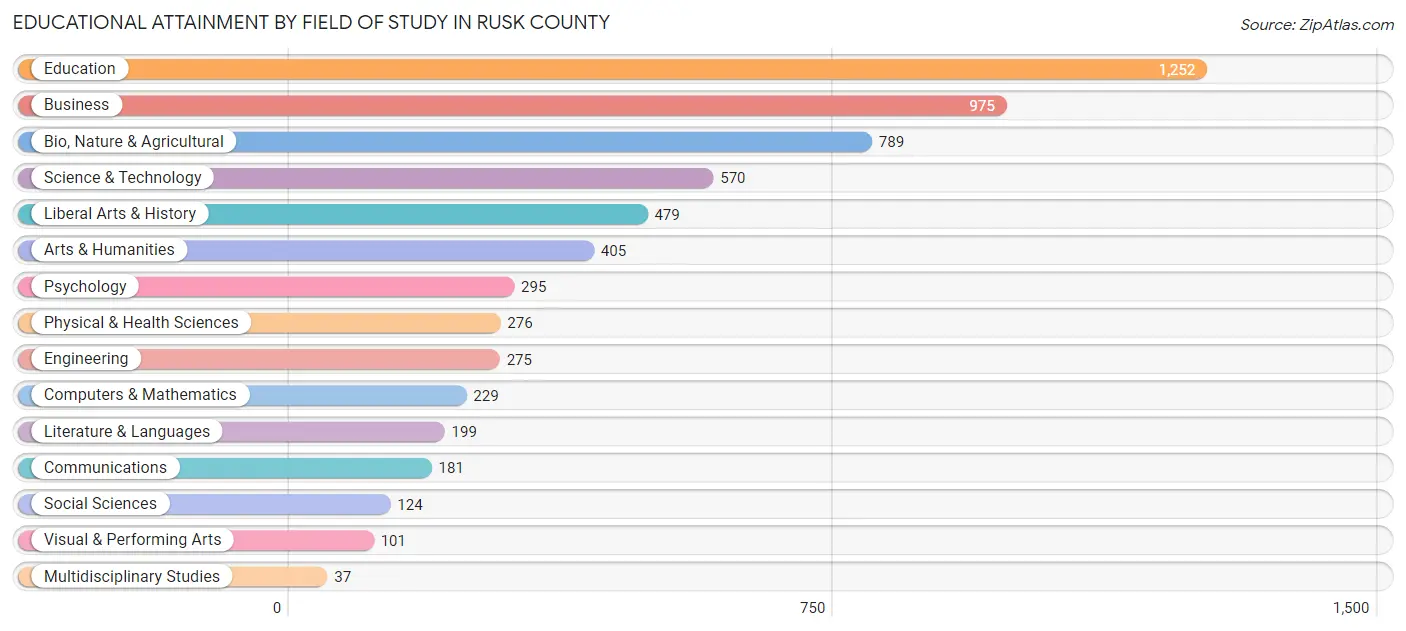
| Field of Study | # Graduates | % Graduates |
| Computers & Mathematics | 229 | 3.7% |
| Bio, Nature & Agricultural | 789 | 12.8% |
| Physical & Health Sciences | 276 | 4.5% |
| Psychology | 295 | 4.8% |
| Social Sciences | 124 | 2.0% |
| Engineering | 275 | 4.4% |
| Multidisciplinary Studies | 37 | 0.6% |
| Science & Technology | 570 | 9.2% |
| Business | 975 | 15.8% |
| Education | 1,252 | 20.2% |
| Literature & Languages | 199 | 3.2% |
| Liberal Arts & History | 479 | 7.7% |
| Visual & Performing Arts | 101 | 1.6% |
| Communications | 181 | 2.9% |
| Arts & Humanities | 405 | 6.6% |
| Total | 6,187 | 100.0% |
Transportation & Commute in Rusk County
Vehicle Availability by Sex in Rusk County
The most prevalent vehicle ownership categories in Rusk County are males with 2 vehicles (5,298, accounting for 43.7%) and females with 2 vehicles (3,895, making up 59.2%).
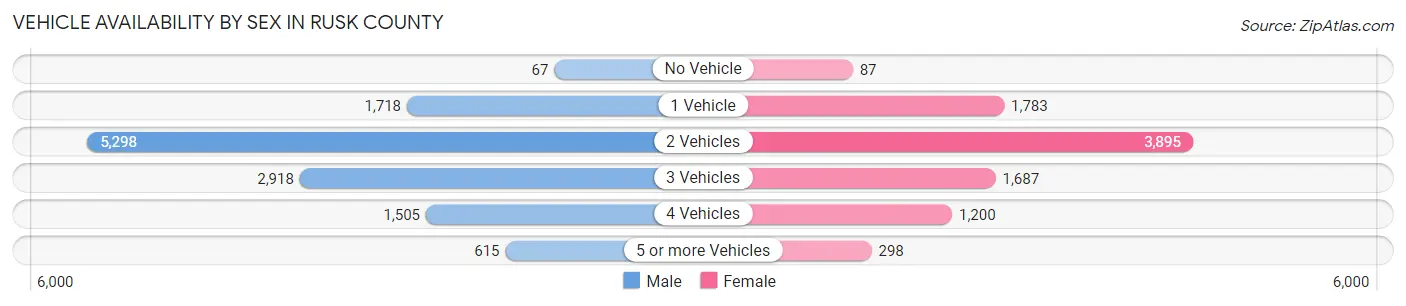
| Vehicles Available | Male | Female |
| No Vehicle | 67 (0.5%) | 87 (1.0%) |
| 1 Vehicle | 1,718 (14.2%) | 1,783 (19.9%) |
| 2 Vehicles | 5,298 (43.7%) | 3,895 (43.5%) |
| 3 Vehicles | 2,918 (24.1%) | 1,687 (18.9%) |
| 4 Vehicles | 1,505 (12.4%) | 1,200 (13.4%) |
| 5 or more Vehicles | 615 (5.1%) | 298 (3.3%) |
| Total | 12,121 (100.0%) | 8,950 (100.0%) |
Commute Time in Rusk County
The most frequently occuring commute durations in Rusk County are 15 to 19 minutes (3,145 commuters, 15.6%), 10 to 14 minutes (3,011 commuters, 14.9%), and 30 to 34 minutes (2,999 commuters, 14.9%).
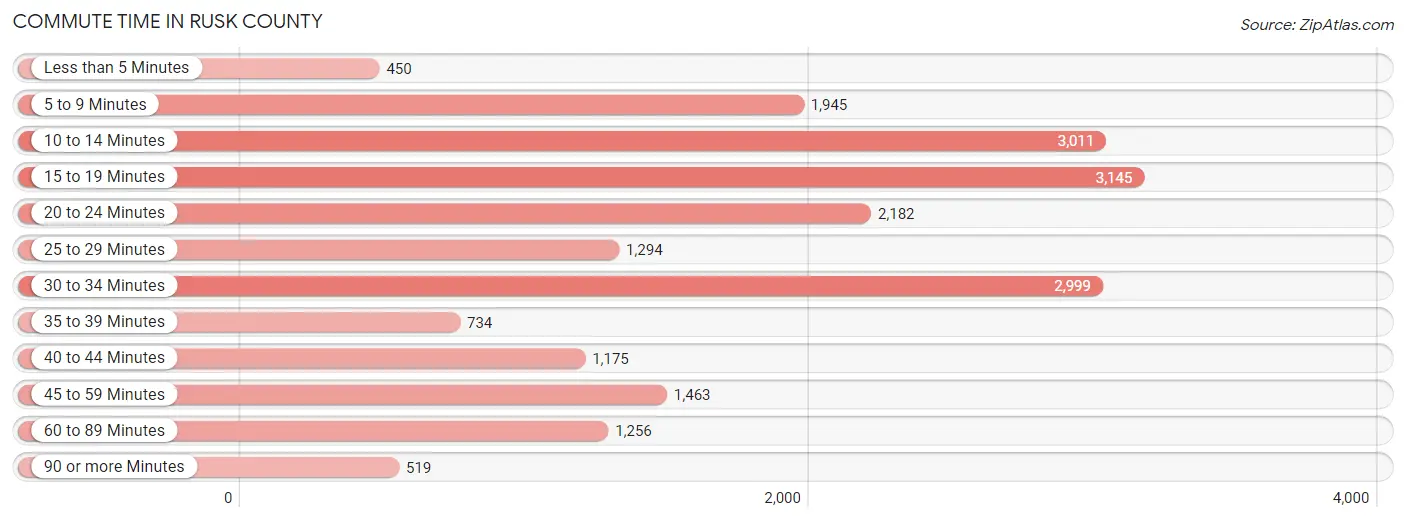
| Commute Time | # Commuters | % Commuters |
| Less than 5 Minutes | 450 | 2.2% |
| 5 to 9 Minutes | 1,945 | 9.6% |
| 10 to 14 Minutes | 3,011 | 14.9% |
| 15 to 19 Minutes | 3,145 | 15.6% |
| 20 to 24 Minutes | 2,182 | 10.8% |
| 25 to 29 Minutes | 1,294 | 6.4% |
| 30 to 34 Minutes | 2,999 | 14.9% |
| 35 to 39 Minutes | 734 | 3.6% |
| 40 to 44 Minutes | 1,175 | 5.8% |
| 45 to 59 Minutes | 1,463 | 7.2% |
| 60 to 89 Minutes | 1,256 | 6.2% |
| 90 or more Minutes | 519 | 2.6% |
Commute Time by Sex in Rusk County
The most common commute times in Rusk County are 30 to 34 minutes (1,728 commuters, 14.8%) for males and 10 to 14 minutes (1,532 commuters, 18.0%) for females.
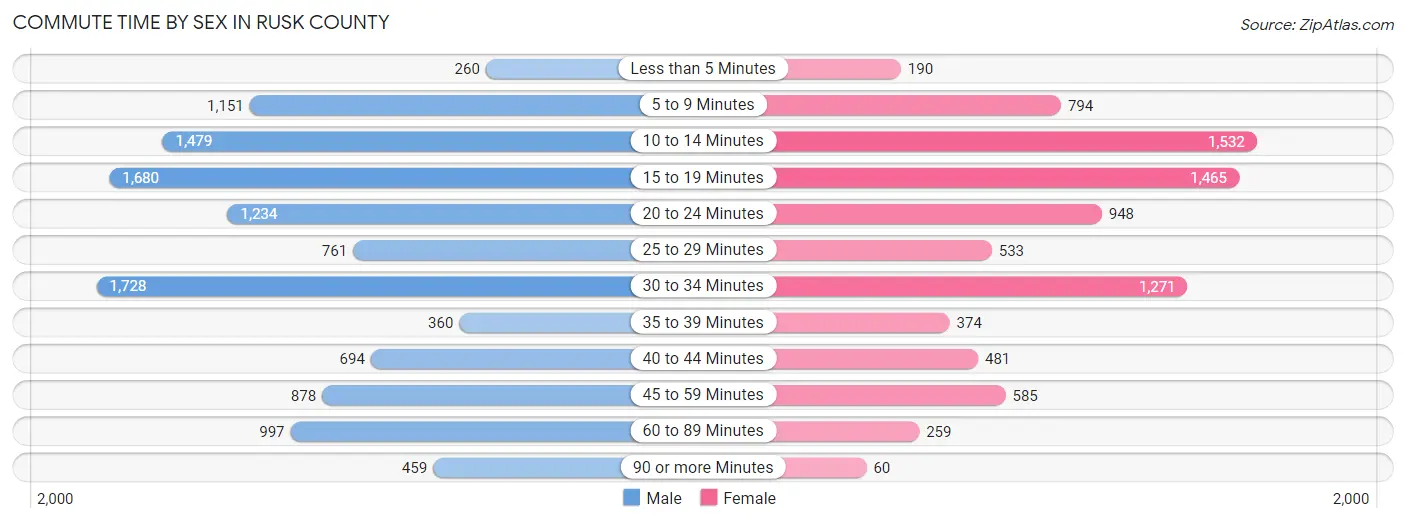
| Commute Time | Male | Female |
| Less than 5 Minutes | 260 (2.2%) | 190 (2.2%) |
| 5 to 9 Minutes | 1,151 (9.9%) | 794 (9.3%) |
| 10 to 14 Minutes | 1,479 (12.7%) | 1,532 (18.0%) |
| 15 to 19 Minutes | 1,680 (14.4%) | 1,465 (17.2%) |
| 20 to 24 Minutes | 1,234 (10.6%) | 948 (11.2%) |
| 25 to 29 Minutes | 761 (6.5%) | 533 (6.3%) |
| 30 to 34 Minutes | 1,728 (14.8%) | 1,271 (15.0%) |
| 35 to 39 Minutes | 360 (3.1%) | 374 (4.4%) |
| 40 to 44 Minutes | 694 (5.9%) | 481 (5.7%) |
| 45 to 59 Minutes | 878 (7.5%) | 585 (6.9%) |
| 60 to 89 Minutes | 997 (8.5%) | 259 (3.0%) |
| 90 or more Minutes | 459 (3.9%) | 60 (0.7%) |
Time of Departure to Work by Sex in Rusk County
The most frequent times of departure to work in Rusk County are 6:00 AM to 6:29 AM (1,916, 16.4%) for males and 7:30 AM to 7:59 AM (1,575, 18.5%) for females.
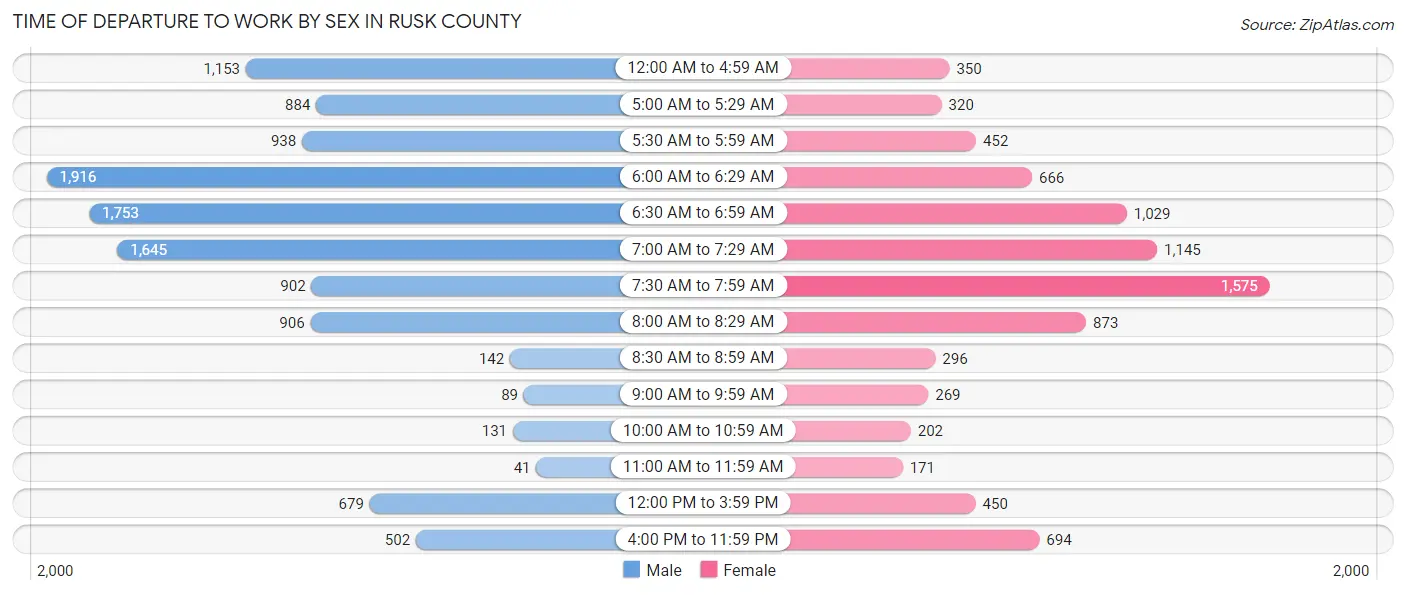
| Time of Departure | Male | Female |
| 12:00 AM to 4:59 AM | 1,153 (9.9%) | 350 (4.1%) |
| 5:00 AM to 5:29 AM | 884 (7.6%) | 320 (3.8%) |
| 5:30 AM to 5:59 AM | 938 (8.0%) | 452 (5.3%) |
| 6:00 AM to 6:29 AM | 1,916 (16.4%) | 666 (7.8%) |
| 6:30 AM to 6:59 AM | 1,753 (15.0%) | 1,029 (12.1%) |
| 7:00 AM to 7:29 AM | 1,645 (14.1%) | 1,145 (13.5%) |
| 7:30 AM to 7:59 AM | 902 (7.7%) | 1,575 (18.5%) |
| 8:00 AM to 8:29 AM | 906 (7.8%) | 873 (10.3%) |
| 8:30 AM to 8:59 AM | 142 (1.2%) | 296 (3.5%) |
| 9:00 AM to 9:59 AM | 89 (0.8%) | 269 (3.2%) |
| 10:00 AM to 10:59 AM | 131 (1.1%) | 202 (2.4%) |
| 11:00 AM to 11:59 AM | 41 (0.4%) | 171 (2.0%) |
| 12:00 PM to 3:59 PM | 679 (5.8%) | 450 (5.3%) |
| 4:00 PM to 11:59 PM | 502 (4.3%) | 694 (8.2%) |
| Total | 11,681 (100.0%) | 8,492 (100.0%) |
Housing Occupancy in Rusk County
Occupancy by Ownership in Rusk County
Of the total 17,792 dwellings in Rusk County, owner-occupied units account for 14,084 (79.2%), while renter-occupied units make up 3,708 (20.8%).
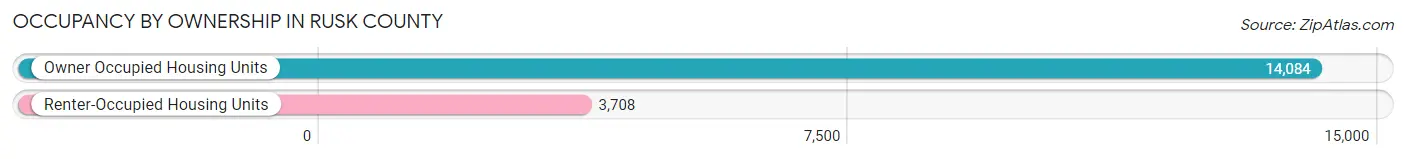
| Occupancy | # Housing Units | % Housing Units |
| Owner Occupied Housing Units | 14,084 | 79.2% |
| Renter-Occupied Housing Units | 3,708 | 20.8% |
| Total Occupied Housing Units | 17,792 | 100.0% |
Occupancy by Household Size in Rusk County
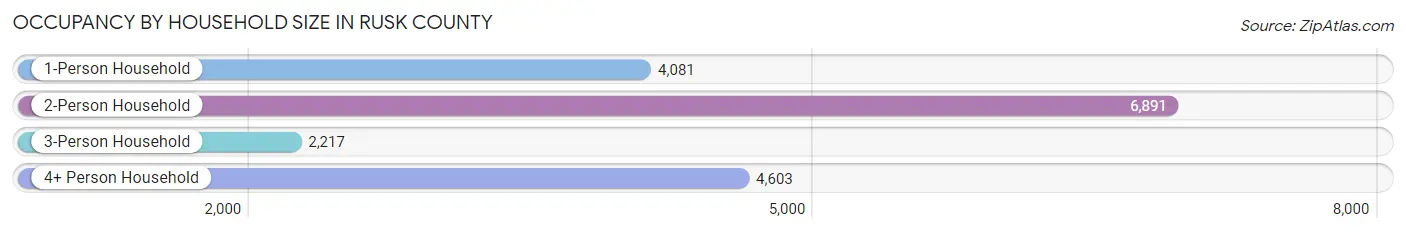
| Household Size | # Housing Units | % Housing Units |
| 1-Person Household | 4,081 | 22.9% |
| 2-Person Household | 6,891 | 38.7% |
| 3-Person Household | 2,217 | 12.5% |
| 4+ Person Household | 4,603 | 25.9% |
| Total Housing Units | 17,792 | 100.0% |
Occupancy by Ownership by Household Size in Rusk County
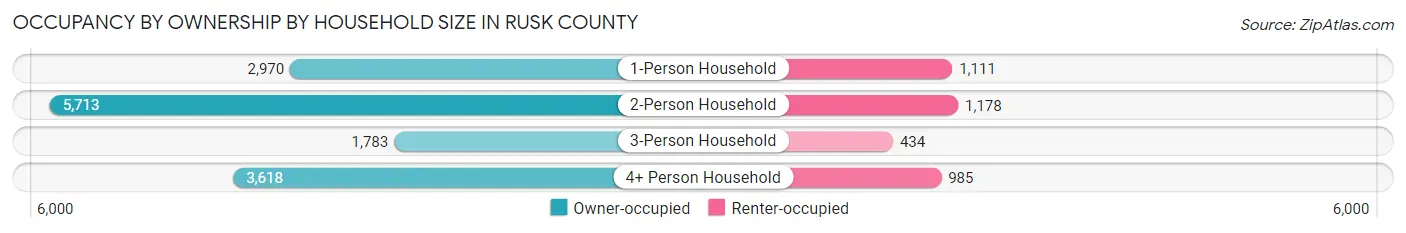
| Household Size | Owner-occupied | Renter-occupied |
| 1-Person Household | 2,970 (72.8%) | 1,111 (27.2%) |
| 2-Person Household | 5,713 (82.9%) | 1,178 (17.1%) |
| 3-Person Household | 1,783 (80.4%) | 434 (19.6%) |
| 4+ Person Household | 3,618 (78.6%) | 985 (21.4%) |
| Total Housing Units | 14,084 (79.2%) | 3,708 (20.8%) |
Occupancy by Educational Attainment in Rusk County
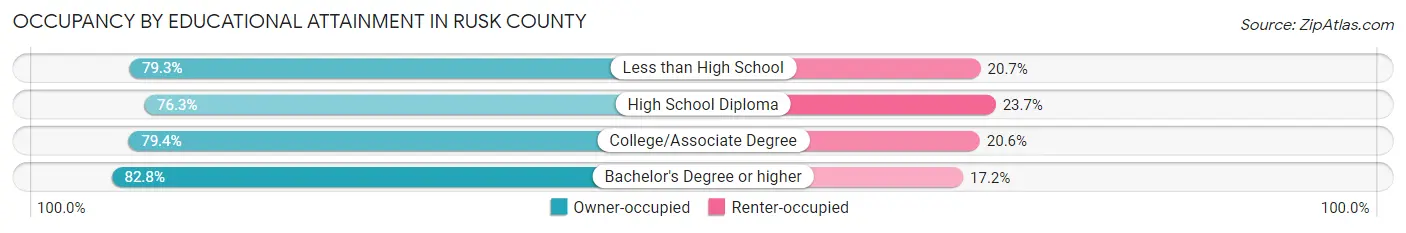
| Household Size | Owner-occupied | Renter-occupied |
| Less than High School | 1,853 (79.3%) | 484 (20.7%) |
| High School Diploma | 3,972 (76.3%) | 1,234 (23.7%) |
| College/Associate Degree | 5,331 (79.4%) | 1,380 (20.6%) |
| Bachelor's Degree or higher | 2,928 (82.8%) | 610 (17.2%) |
Occupancy by Age of Householder in Rusk County
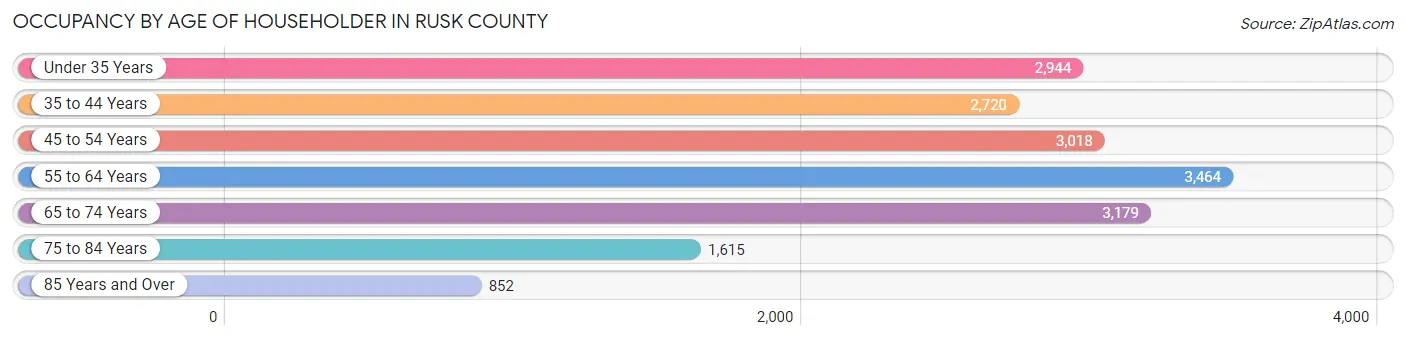
| Age Bracket | # Households | % Households |
| Under 35 Years | 2,944 | 16.6% |
| 35 to 44 Years | 2,720 | 15.3% |
| 45 to 54 Years | 3,018 | 17.0% |
| 55 to 64 Years | 3,464 | 19.5% |
| 65 to 74 Years | 3,179 | 17.9% |
| 75 to 84 Years | 1,615 | 9.1% |
| 85 Years and Over | 852 | 4.8% |
| Total | 17,792 | 100.0% |
Housing Finances in Rusk County
Median Income by Occupancy in Rusk County
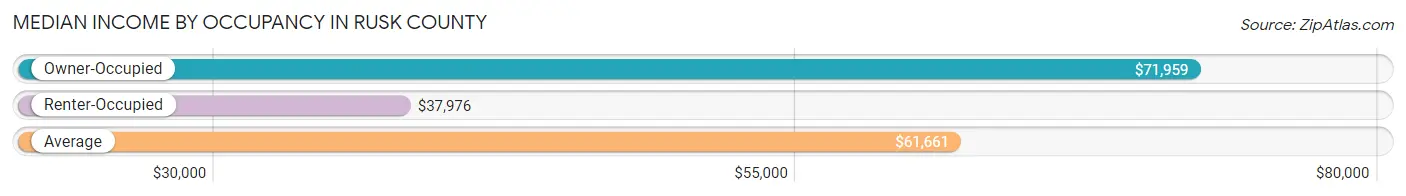
| Occupancy Type | # Households | Median Income |
| Owner-Occupied | 14,084 (79.2%) | $71,959 |
| Renter-Occupied | 3,708 (20.8%) | $37,976 |
| Average | 17,792 (100.0%) | $61,661 |
Occupancy by Householder Income Bracket in Rusk County
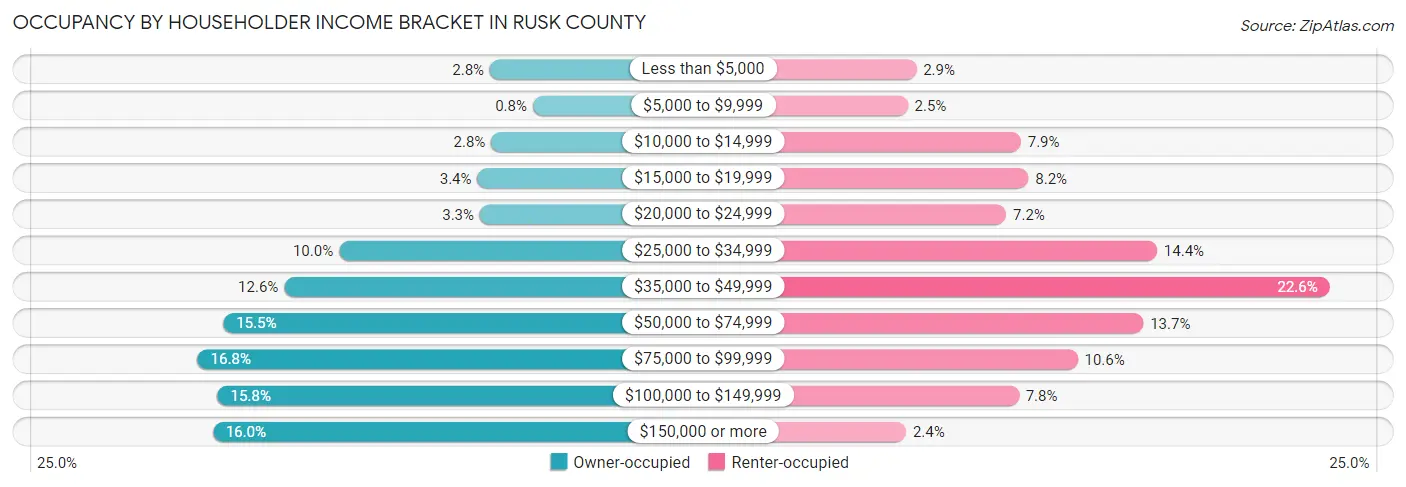
| Income Bracket | Owner-occupied | Renter-occupied |
| Less than $5,000 | 400 (2.8%) | 107 (2.9%) |
| $5,000 to $9,999 | 112 (0.8%) | 92 (2.5%) |
| $10,000 to $14,999 | 392 (2.8%) | 292 (7.9%) |
| $15,000 to $19,999 | 485 (3.4%) | 305 (8.2%) |
| $20,000 to $24,999 | 467 (3.3%) | 266 (7.2%) |
| $25,000 to $34,999 | 1,412 (10.0%) | 532 (14.3%) |
| $35,000 to $49,999 | 1,780 (12.6%) | 837 (22.6%) |
| $50,000 to $74,999 | 2,189 (15.5%) | 508 (13.7%) |
| $75,000 to $99,999 | 2,361 (16.8%) | 392 (10.6%) |
| $100,000 to $149,999 | 2,227 (15.8%) | 288 (7.8%) |
| $150,000 or more | 2,259 (16.0%) | 89 (2.4%) |
| Total | 14,084 (100.0%) | 3,708 (100.0%) |
Monthly Housing Cost Tiers in Rusk County
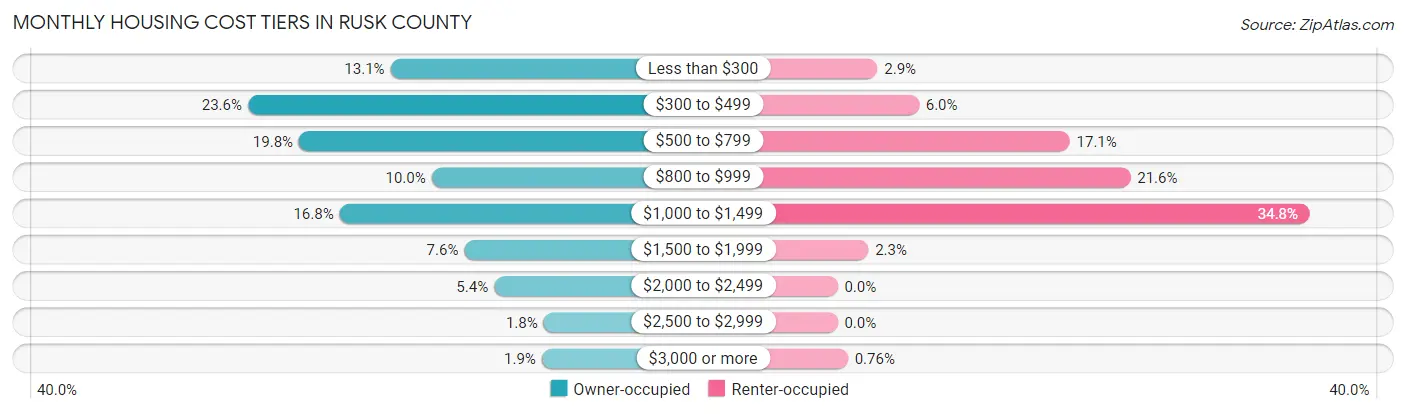
| Monthly Cost | Owner-occupied | Renter-occupied |
| Less than $300 | 1,839 (13.1%) | 109 (2.9%) |
| $300 to $499 | 3,318 (23.6%) | 222 (6.0%) |
| $500 to $799 | 2,789 (19.8%) | 634 (17.1%) |
| $800 to $999 | 1,412 (10.0%) | 800 (21.6%) |
| $1,000 to $1,499 | 2,367 (16.8%) | 1,290 (34.8%) |
| $1,500 to $1,999 | 1,073 (7.6%) | 84 (2.3%) |
| $2,000 to $2,499 | 765 (5.4%) | 0 (0.0%) |
| $2,500 to $2,999 | 251 (1.8%) | 0 (0.0%) |
| $3,000 or more | 270 (1.9%) | 28 (0.8%) |
| Total | 14,084 (100.0%) | 3,708 (100.0%) |
Physical Housing Characteristics in Rusk County
Housing Structures in Rusk County
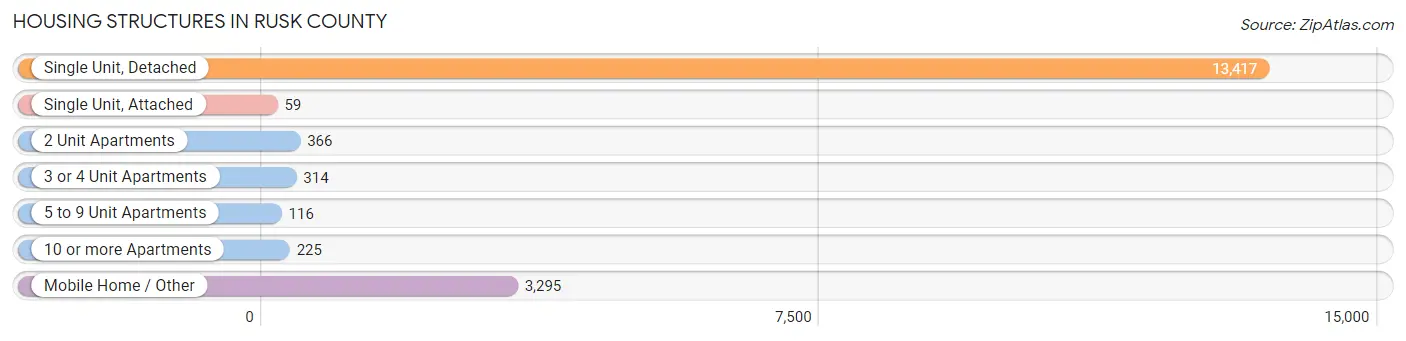
| Structure Type | # Housing Units | % Housing Units |
| Single Unit, Detached | 13,417 | 75.4% |
| Single Unit, Attached | 59 | 0.3% |
| 2 Unit Apartments | 366 | 2.1% |
| 3 or 4 Unit Apartments | 314 | 1.8% |
| 5 to 9 Unit Apartments | 116 | 0.6% |
| 10 or more Apartments | 225 | 1.3% |
| Mobile Home / Other | 3,295 | 18.5% |
| Total | 17,792 | 100.0% |
Housing Structures by Occupancy in Rusk County
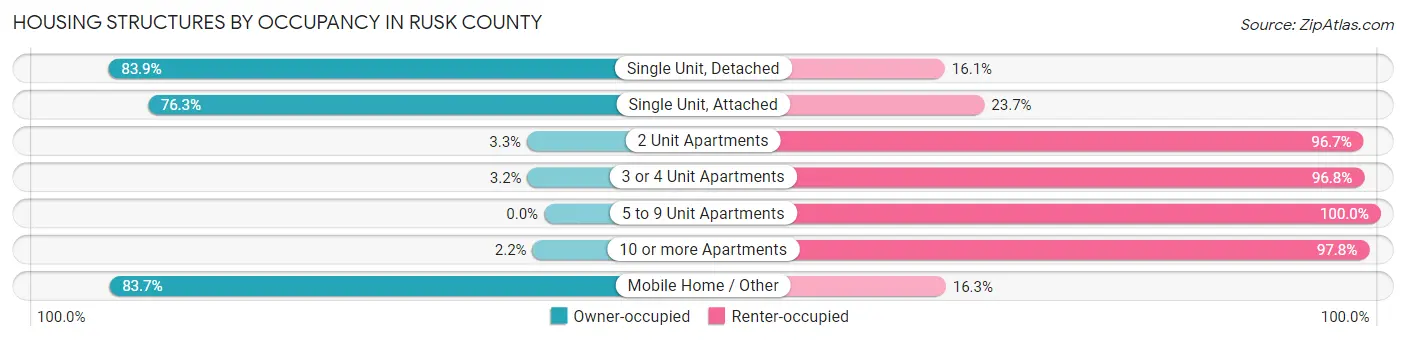
| Structure Type | Owner-occupied | Renter-occupied |
| Single Unit, Detached | 11,254 (83.9%) | 2,163 (16.1%) |
| Single Unit, Attached | 45 (76.3%) | 14 (23.7%) |
| 2 Unit Apartments | 12 (3.3%) | 354 (96.7%) |
| 3 or 4 Unit Apartments | 10 (3.2%) | 304 (96.8%) |
| 5 to 9 Unit Apartments | 0 (0.0%) | 116 (100.0%) |
| 10 or more Apartments | 5 (2.2%) | 220 (97.8%) |
| Mobile Home / Other | 2,758 (83.7%) | 537 (16.3%) |
| Total | 14,084 (79.2%) | 3,708 (20.8%) |
Housing Structures by Number of Rooms in Rusk County
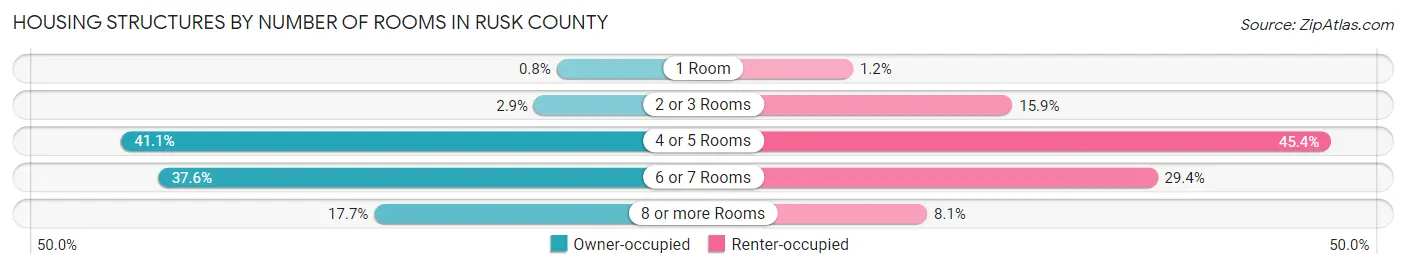
| Number of Rooms | Owner-occupied | Renter-occupied |
| 1 Room | 113 (0.8%) | 45 (1.2%) |
| 2 or 3 Rooms | 408 (2.9%) | 591 (15.9%) |
| 4 or 5 Rooms | 5,781 (41.0%) | 1,684 (45.4%) |
| 6 or 7 Rooms | 5,294 (37.6%) | 1,089 (29.4%) |
| 8 or more Rooms | 2,488 (17.7%) | 299 (8.1%) |
| Total | 14,084 (100.0%) | 3,708 (100.0%) |
Housing Structure by Heating Type in Rusk County
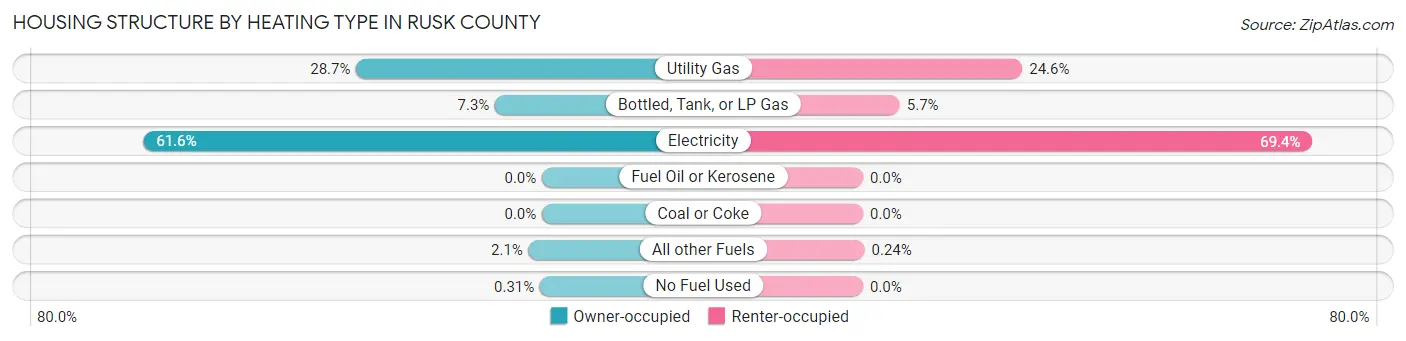
| Heating Type | Owner-occupied | Renter-occupied |
| Utility Gas | 4,045 (28.7%) | 913 (24.6%) |
| Bottled, Tank, or LP Gas | 1,021 (7.2%) | 211 (5.7%) |
| Electricity | 8,682 (61.6%) | 2,575 (69.4%) |
| Fuel Oil or Kerosene | 0 (0.0%) | 0 (0.0%) |
| Coal or Coke | 0 (0.0%) | 0 (0.0%) |
| All other Fuels | 292 (2.1%) | 9 (0.2%) |
| No Fuel Used | 44 (0.3%) | 0 (0.0%) |
| Total | 14,084 (100.0%) | 3,708 (100.0%) |
Household Vehicle Usage in Rusk County
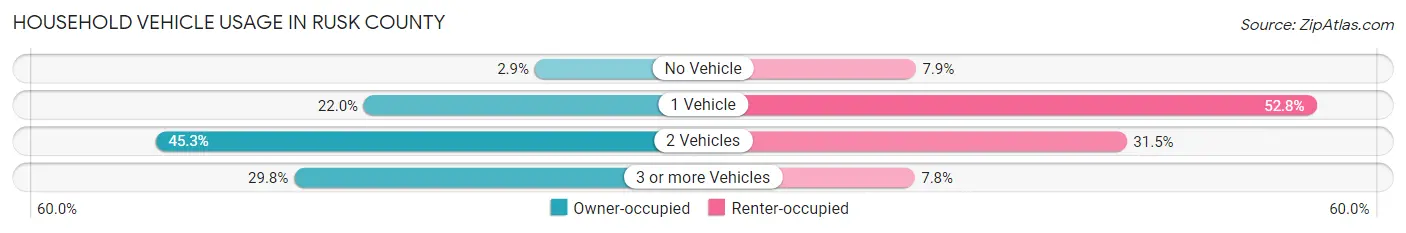
| Vehicles per Household | Owner-occupied | Renter-occupied |
| No Vehicle | 402 (2.9%) | 293 (7.9%) |
| 1 Vehicle | 3,097 (22.0%) | 1,958 (52.8%) |
| 2 Vehicles | 6,386 (45.3%) | 1,169 (31.5%) |
| 3 or more Vehicles | 4,199 (29.8%) | 288 (7.8%) |
| Total | 14,084 (100.0%) | 3,708 (100.0%) |
Real Estate & Mortgages in Rusk County
Real Estate and Mortgage Overview in Rusk County
| Characteristic | Without Mortgage | With Mortgage |
| Housing Units | 8,534 | 5,550 |
| Median Property Value | $135,900 | $168,000 |
| Median Household Income | $56,624 | $1,183 |
| Monthly Housing Costs | $450 | $224 |
| Real Estate Taxes | $1,215 | $313 |
Property Value by Mortgage Status in Rusk County
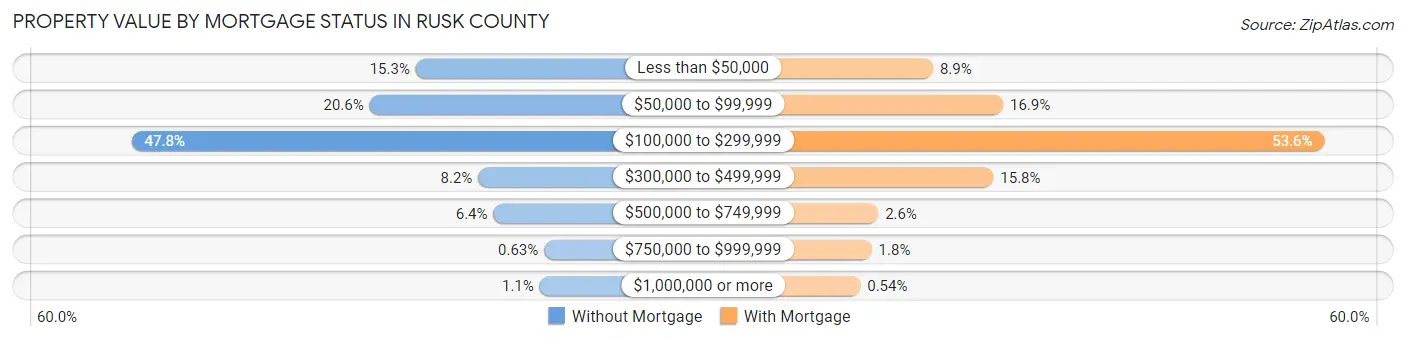
| Property Value | Without Mortgage | With Mortgage |
| Less than $50,000 | 1,306 (15.3%) | 491 (8.8%) |
| $50,000 to $99,999 | 1,756 (20.6%) | 936 (16.9%) |
| $100,000 to $299,999 | 4,076 (47.8%) | 2,973 (53.6%) |
| $300,000 to $499,999 | 696 (8.2%) | 874 (15.8%) |
| $500,000 to $749,999 | 549 (6.4%) | 144 (2.6%) |
| $750,000 to $999,999 | 54 (0.6%) | 102 (1.8%) |
| $1,000,000 or more | 97 (1.1%) | 30 (0.5%) |
| Total | 8,534 (100.0%) | 5,550 (100.0%) |
Household Income by Mortgage Status in Rusk County
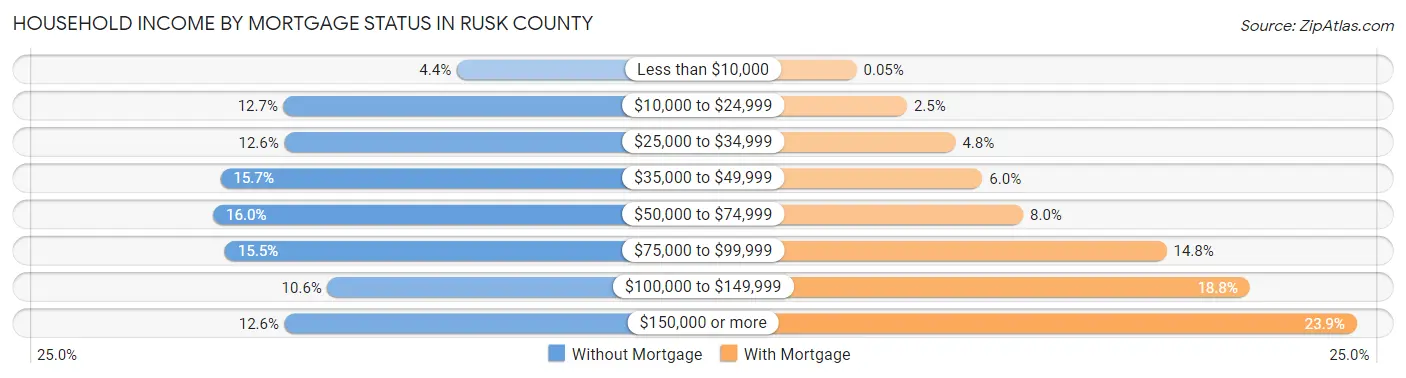
| Household Income | Without Mortgage | With Mortgage |
| Less than $10,000 | 376 (4.4%) | 3 (0.1%) |
| $10,000 to $24,999 | 1,080 (12.7%) | 136 (2.5%) |
| $25,000 to $34,999 | 1,077 (12.6%) | 264 (4.8%) |
| $35,000 to $49,999 | 1,337 (15.7%) | 335 (6.0%) |
| $50,000 to $74,999 | 1,367 (16.0%) | 443 (8.0%) |
| $75,000 to $99,999 | 1,319 (15.5%) | 822 (14.8%) |
| $100,000 to $149,999 | 902 (10.6%) | 1,042 (18.8%) |
| $150,000 or more | 1,076 (12.6%) | 1,325 (23.9%) |
| Total | 8,534 (100.0%) | 5,550 (100.0%) |
Property Value to Household Income Ratio in Rusk County
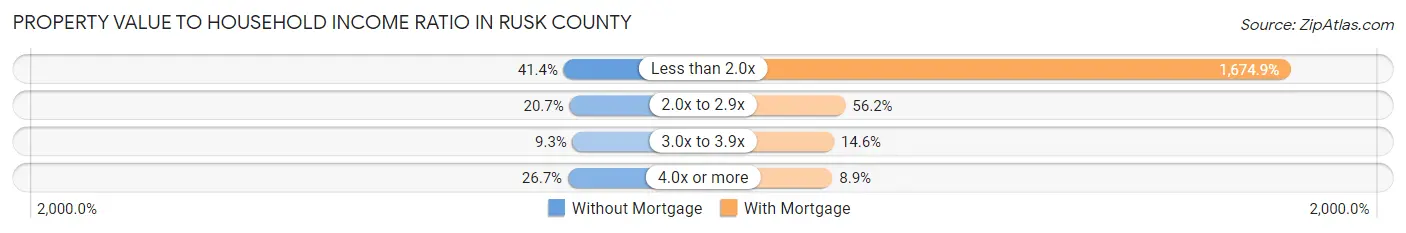
| Value-to-Income Ratio | Without Mortgage | With Mortgage |
| Less than 2.0x | 3,533 (41.4%) | 92,955 (1,674.9%) |
| 2.0x to 2.9x | 1,769 (20.7%) | 3,121 (56.2%) |
| 3.0x to 3.9x | 794 (9.3%) | 809 (14.6%) |
| 4.0x or more | 2,276 (26.7%) | 492 (8.9%) |
| Total | 8,534 (100.0%) | 5,550 (100.0%) |
Real Estate Taxes by Mortgage Status in Rusk County
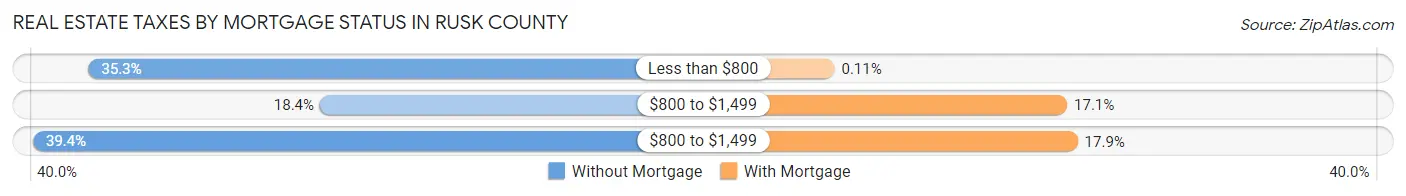
| Property Taxes | Without Mortgage | With Mortgage |
| Less than $800 | 3,016 (35.3%) | 6 (0.1%) |
| $800 to $1,499 | 1,573 (18.4%) | 949 (17.1%) |
| $800 to $1,499 | 3,362 (39.4%) | 992 (17.9%) |
| Total | 8,534 (100.0%) | 5,550 (100.0%) |
Health & Disability in Rusk County
Health Insurance Coverage by Age in Rusk County
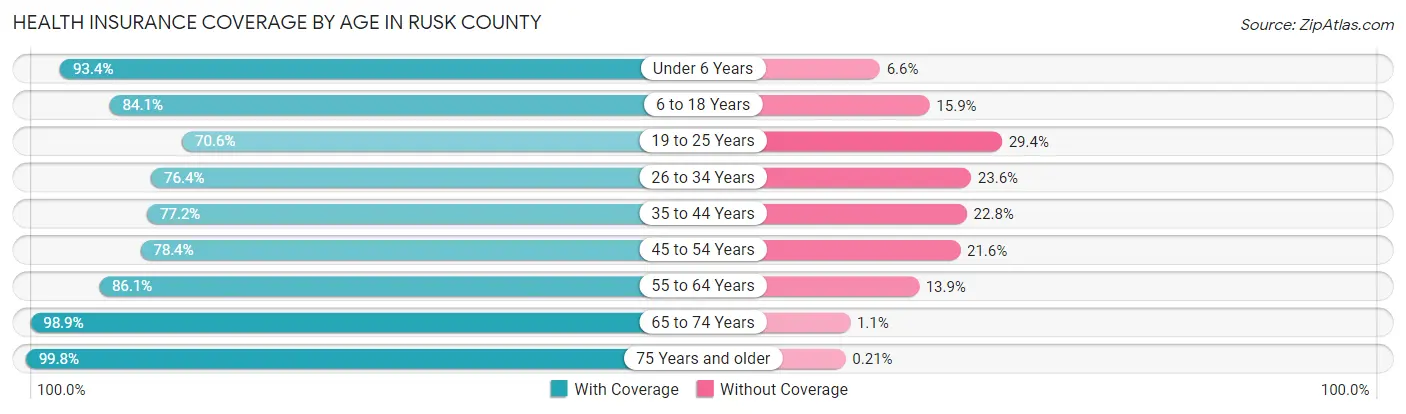
| Age Bracket | With Coverage | Without Coverage |
| Under 6 Years | 3,167 (93.4%) | 224 (6.6%) |
| 6 to 18 Years | 7,626 (84.1%) | 1,439 (15.9%) |
| 19 to 25 Years | 3,007 (70.6%) | 1,250 (29.4%) |
| 26 to 34 Years | 3,571 (76.4%) | 1,104 (23.6%) |
| 35 to 44 Years | 4,827 (77.2%) | 1,427 (22.8%) |
| 45 to 54 Years | 4,448 (78.4%) | 1,225 (21.6%) |
| 55 to 64 Years | 5,336 (86.1%) | 859 (13.9%) |
| 65 to 74 Years | 5,060 (98.9%) | 54 (1.1%) |
| 75 Years and older | 3,310 (99.8%) | 7 (0.2%) |
| Total | 40,352 (84.2%) | 7,589 (15.8%) |
Health Insurance Coverage by Citizenship Status in Rusk County

| Citizenship Status | With Coverage | Without Coverage |
| Native Born | 3,167 (93.4%) | 224 (6.6%) |
| Foreign Born, Citizen | 7,626 (84.1%) | 1,439 (15.9%) |
| Foreign Born, not a Citizen | 3,007 (70.6%) | 1,250 (29.4%) |
Health Insurance Coverage by Household Income in Rusk County
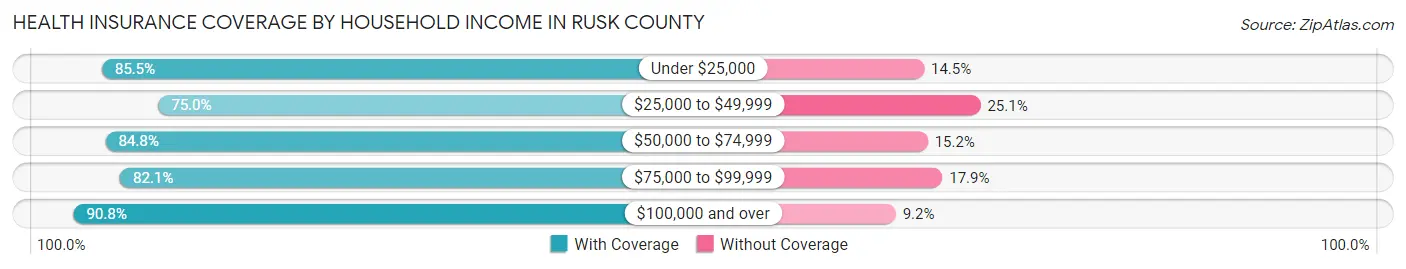
| Household Income | With Coverage | Without Coverage |
| Under $25,000 | 4,464 (85.5%) | 755 (14.5%) |
| $25,000 to $49,999 | 8,185 (75.0%) | 2,736 (25.1%) |
| $50,000 to $74,999 | 6,492 (84.8%) | 1,160 (15.2%) |
| $75,000 to $99,999 | 6,878 (82.1%) | 1,500 (17.9%) |
| $100,000 and over | 14,207 (90.8%) | 1,434 (9.2%) |
Public vs Private Health Insurance Coverage by Age in Rusk County
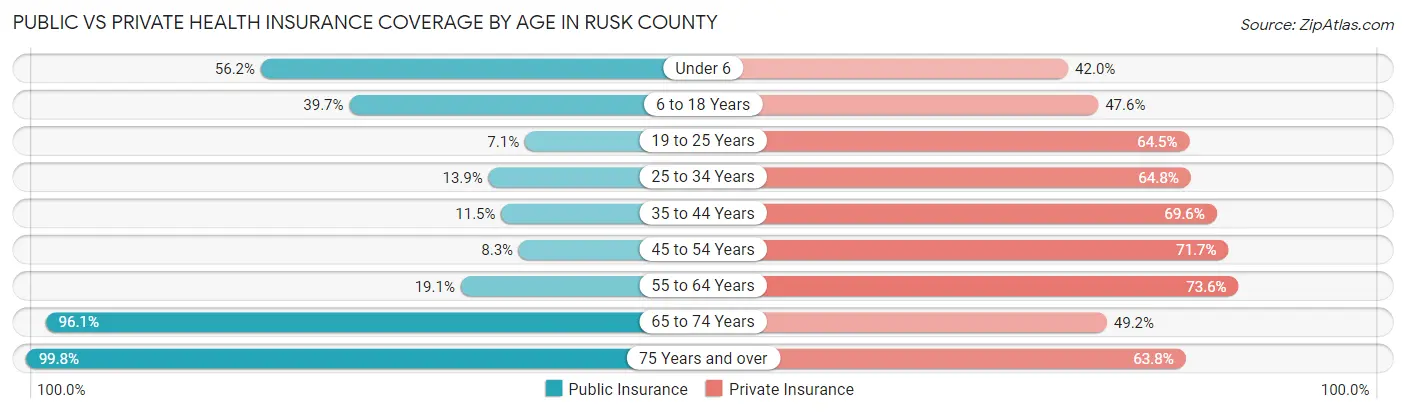
| Age Bracket | Public Insurance | Private Insurance |
| Under 6 | 1,904 (56.1%) | 1,425 (42.0%) |
| 6 to 18 Years | 3,601 (39.7%) | 4,315 (47.6%) |
| 19 to 25 Years | 303 (7.1%) | 2,746 (64.5%) |
| 25 to 34 Years | 649 (13.9%) | 3,027 (64.7%) |
| 35 to 44 Years | 720 (11.5%) | 4,350 (69.6%) |
| 45 to 54 Years | 468 (8.3%) | 4,069 (71.7%) |
| 55 to 64 Years | 1,180 (19.1%) | 4,560 (73.6%) |
| 65 to 74 Years | 4,914 (96.1%) | 2,516 (49.2%) |
| 75 Years and over | 3,310 (99.8%) | 2,116 (63.8%) |
| Total | 17,049 (35.6%) | 29,124 (60.8%) |
Disability Status by Sex by Age in Rusk County
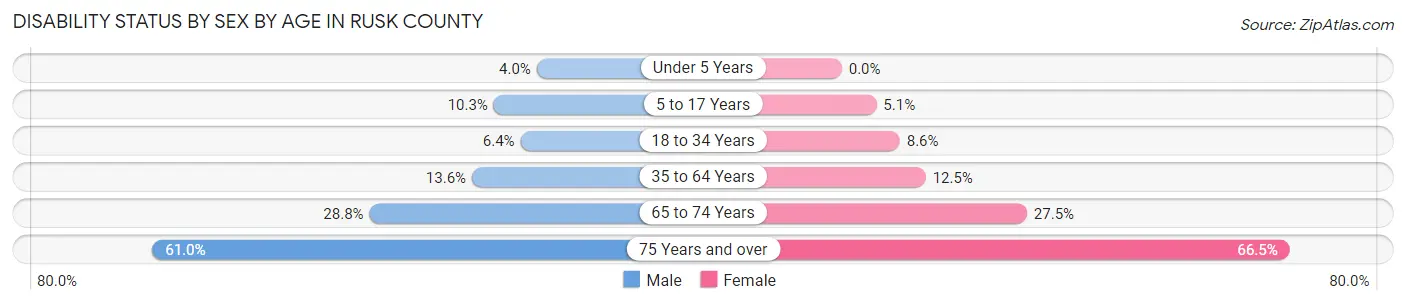
| Age Bracket | Male | Female |
| Under 5 Years | 67 (4.0%) | 0 (0.0%) |
| 5 to 17 Years | 464 (10.3%) | 226 (5.1%) |
| 18 to 34 Years | 325 (6.4%) | 386 (8.6%) |
| 35 to 64 Years | 1,214 (13.6%) | 1,144 (12.5%) |
| 65 to 74 Years | 706 (28.8%) | 732 (27.5%) |
| 75 Years and over | 888 (61.0%) | 1,238 (66.5%) |
Disability Class by Sex by Age in Rusk County
Disability Class: Hearing Difficulty
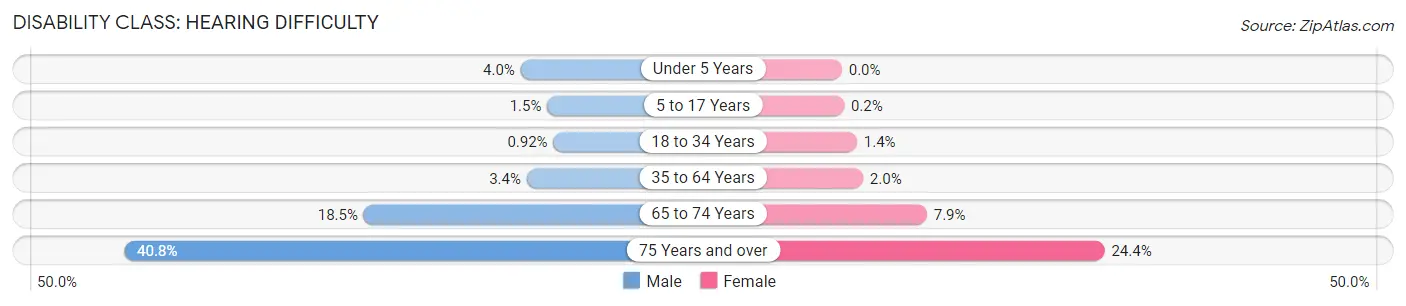
| Age Bracket | Male | Female |
| Under 5 Years | 67 (4.0%) | 0 (0.0%) |
| 5 to 17 Years | 67 (1.5%) | 9 (0.2%) |
| 18 to 34 Years | 47 (0.9%) | 63 (1.4%) |
| 35 to 64 Years | 303 (3.4%) | 180 (2.0%) |
| 65 to 74 Years | 454 (18.5%) | 210 (7.9%) |
| 75 Years and over | 593 (40.8%) | 454 (24.4%) |
Disability Class: Vision Difficulty
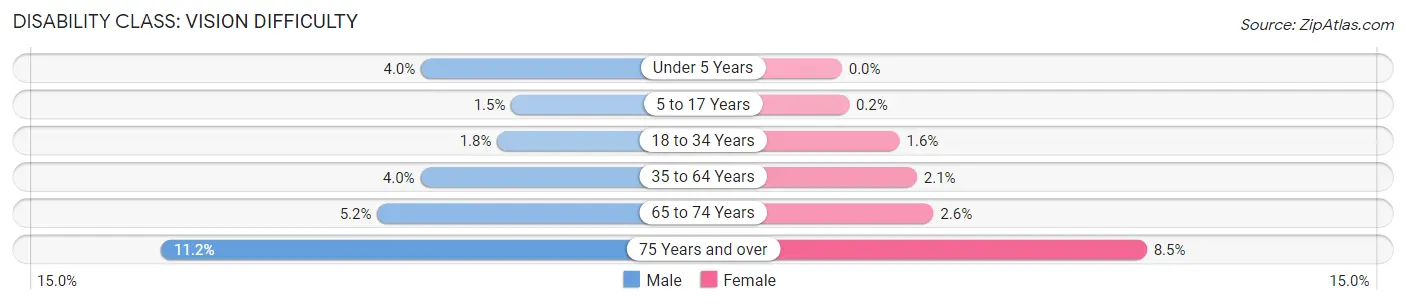
| Age Bracket | Male | Female |
| Under 5 Years | 67 (4.0%) | 0 (0.0%) |
| 5 to 17 Years | 65 (1.5%) | 9 (0.2%) |
| 18 to 34 Years | 94 (1.8%) | 72 (1.6%) |
| 35 to 64 Years | 356 (4.0%) | 192 (2.1%) |
| 65 to 74 Years | 127 (5.2%) | 68 (2.5%) |
| 75 Years and over | 163 (11.2%) | 158 (8.5%) |
Disability Class: Cognitive Difficulty
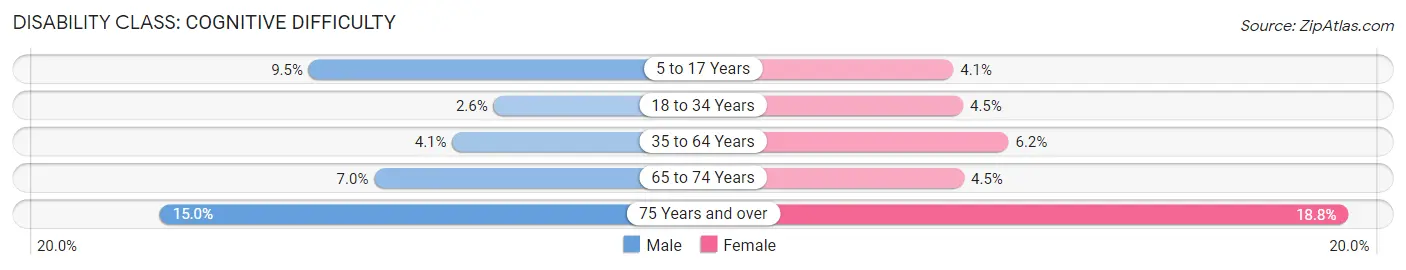
| Age Bracket | Male | Female |
| 5 to 17 Years | 424 (9.5%) | 182 (4.1%) |
| 18 to 34 Years | 132 (2.6%) | 202 (4.5%) |
| 35 to 64 Years | 368 (4.1%) | 568 (6.2%) |
| 65 to 74 Years | 172 (7.0%) | 121 (4.5%) |
| 75 Years and over | 218 (15.0%) | 350 (18.8%) |
Disability Class: Ambulatory Difficulty
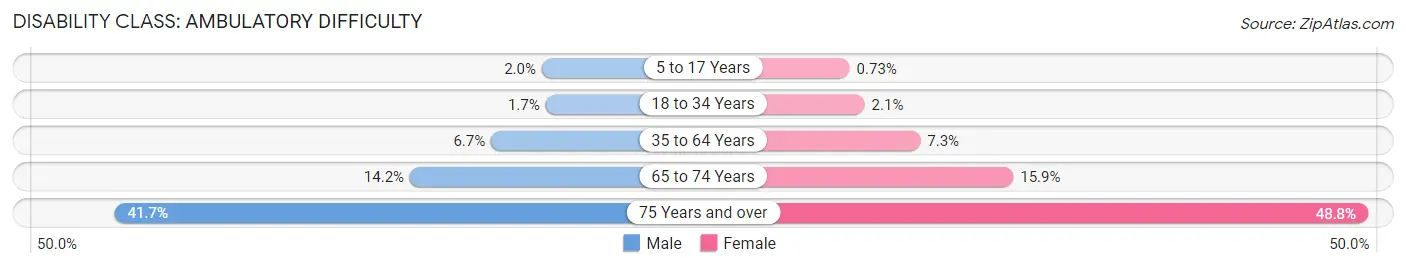
| Age Bracket | Male | Female |
| 5 to 17 Years | 90 (2.0%) | 32 (0.7%) |
| 18 to 34 Years | 84 (1.7%) | 95 (2.1%) |
| 35 to 64 Years | 600 (6.7%) | 669 (7.3%) |
| 65 to 74 Years | 349 (14.2%) | 424 (15.9%) |
| 75 Years and over | 606 (41.6%) | 909 (48.8%) |
Disability Class: Self-Care Difficulty
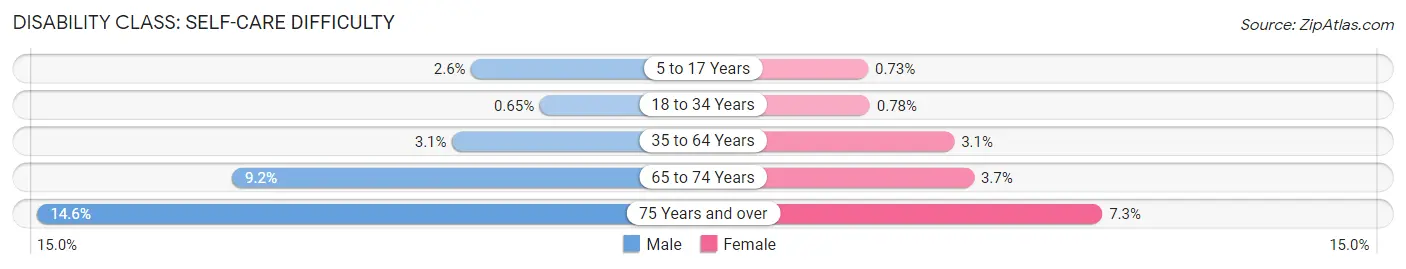
| Age Bracket | Male | Female |
| 5 to 17 Years | 115 (2.6%) | 32 (0.7%) |
| 18 to 34 Years | 33 (0.6%) | 35 (0.8%) |
| 35 to 64 Years | 276 (3.1%) | 287 (3.1%) |
| 65 to 74 Years | 226 (9.2%) | 98 (3.7%) |
| 75 Years and over | 213 (14.6%) | 135 (7.2%) |
Technology Access in Rusk County
Computing Device Access in Rusk County
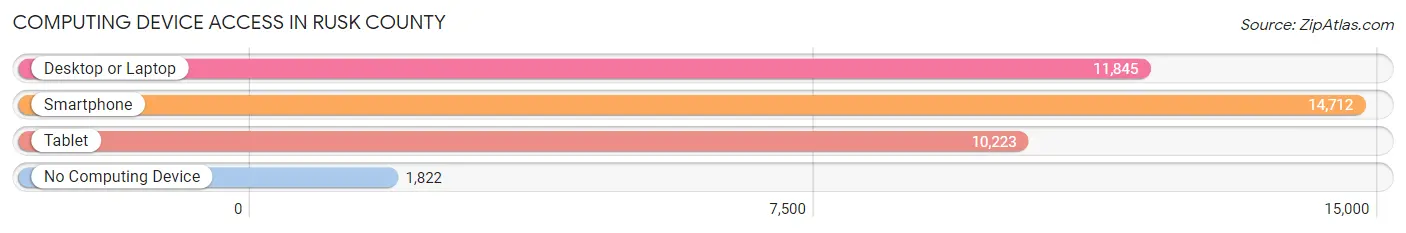
| Device Type | # Households | % Households |
| Desktop or Laptop | 11,845 | 66.6% |
| Smartphone | 14,712 | 82.7% |
| Tablet | 10,223 | 57.5% |
| No Computing Device | 1,822 | 10.2% |
| Total | 17,792 | 100.0% |
Internet Access in Rusk County
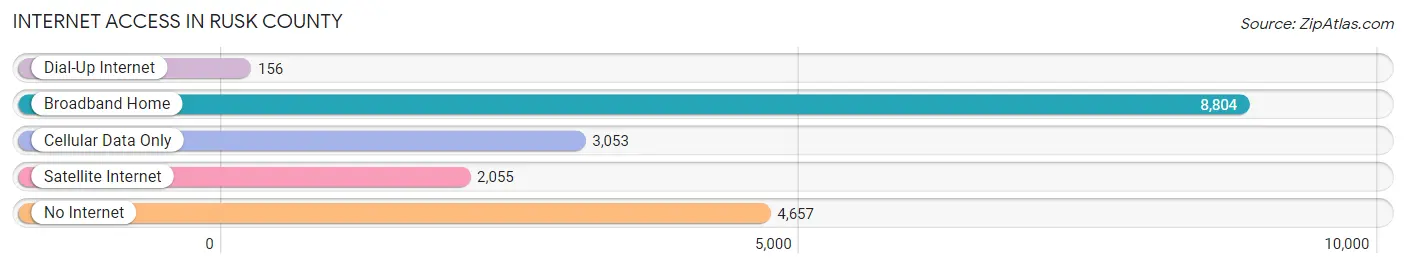
| Internet Type | # Households | % Households |
| Dial-Up Internet | 156 | 0.9% |
| Broadband Home | 8,804 | 49.5% |
| Cellular Data Only | 3,053 | 17.2% |
| Satellite Internet | 2,055 | 11.6% |
| No Internet | 4,657 | 26.2% |
| Total | 17,792 | 100.0% |
Rusk County Summary
Rusk County is located in the eastern part of Texas, in the United States. It is bordered by Gregg County to the north, Smith County to the east, Cherokee County to the south, and Nacogdoches County to the west. The county seat is Henderson, and the largest city is Kilgore. The county was named for Thomas Jefferson Rusk, a signer of the Texas Declaration of Independence.
Geography
Rusk County covers an area of 1,053 square miles, making it the 33rd largest county in Texas. The terrain is mostly flat, with some rolling hills in the northern part of the county. The county is drained by the Neches River, which flows through the center of the county. The county is home to several lakes, including Lake Cherokee, Lake Striker, and Lake Tawakoni.
The climate of Rusk County is humid subtropical, with hot summers and mild winters. The average annual temperature is 68°F, and the average annual precipitation is 44 inches.
Demographics
As of the 2010 census, the population of Rusk County was 53,330. The racial makeup of the county was 79.2% White, 16.2% African American, 0.7% Native American, 0.6% Asian, 0.1% Pacific Islander, 1.7% from other races, and 1.5% from two or more races. Hispanic or Latino of any race were 4.7% of the population.
The median household income in Rusk County was $37,945, and the median family income was $45,945. The per capita income was $19,845. About 17.2% of the population was below the poverty line.
Economy
Rusk County's economy is largely based on agriculture and oil and gas production. The county is home to several large oil and gas companies, including ExxonMobil, Chevron, and Shell. Agriculture is also an important part of the economy, with the county producing cotton, soybeans, corn, and hay.
The county is also home to several manufacturing companies, including Kilgore Manufacturing, which produces industrial equipment, and Henderson Manufacturing, which produces furniture. The county is also home to several retail stores, including Walmart, Lowe's, and Home Depot.
History
Rusk County was established in 1843, and was named for Thomas Jefferson Rusk, a signer of the Texas Declaration of Independence. The county was originally part of Nacogdoches County, but was later divided into its own county.
The county was largely rural until the early 20th century, when oil and gas production began to take off. The discovery of oil in the county in 1930 led to a boom in the local economy, and the population of the county grew rapidly.
In the 1950s, the county began to diversify its economy, and manufacturing and retail businesses began to move into the area. The county has continued to grow and develop since then, and today it is a thriving and diverse economy.
Common Questions
What is Per Capita Income in Rusk County?
Per Capita income in Rusk County is $30,365.
What is the Median Family Income in Rusk County?
Median Family Income in Rusk County is $74,677.
What is the Median Household income in Rusk County?
Median Household Income in Rusk County is $61,661.
What is Income or Wage Gap in Rusk County?
Income or Wage Gap in Rusk County is 40.5%.
Women in Rusk County earn 59.5 cents for every dollar earned by a man.
What is Inequality or Gini Index in Rusk County?
Inequality or Gini Index in Rusk County is 0.46.
What is the Total Population of Rusk County?
Total Population of Rusk County is 52,755.
What is the Total Male Population of Rusk County?
Total Male Population of Rusk County is 28,432.
What is the Total Female Population of Rusk County?
Total Female Population of Rusk County is 24,323.
What is the Ratio of Males per 100 Females in Rusk County?
There are 116.89 Males per 100 Females in Rusk County.
What is the Ratio of Females per 100 Males in Rusk County?
There are 85.55 Females per 100 Males in Rusk County.
What is the Median Population Age in Rusk County?
Median Population Age in Rusk County is 38.8 Years.
What is the Average Family Size in Rusk County
Average Family Size in Rusk County is 3.2 People.
What is the Average Household Size in Rusk County
Average Household Size in Rusk County is 2.7 People.
How Large is the Labor Force in Rusk County?
There are 22,726 People in the Labor Forcein in Rusk County.
What is the Percentage of People in the Labor Force in Rusk County?
53.5% of People are in the Labor Force in Rusk County.
What is the Unemployment Rate in Rusk County?
Unemployment Rate in Rusk County is 5.5%.