Runnels County, TX Map & Demographics
Runnels County Map
Runnels County Overview
$29,784
PER CAPITA INCOME
$65,648
AVG FAMILY INCOME
$55,424
AVG HOUSEHOLD INCOME
28.4%
WAGE / INCOME GAP [ % ]
71.6¢/ $1
WAGE / INCOME GAP [ $ ]
$9,126
FAMILY INCOME DEFICIT
0.43
INEQUALITY / GINI INDEX
9,858
TOTAL POPULATION
4,976
MALE POPULATION
4,882
FEMALE POPULATION
101.93
MALES / 100 FEMALES
98.11
FEMALES / 100 MALES
40.9
MEDIAN AGE
3.1
AVG FAMILY SIZE
2.5
AVG HOUSEHOLD SIZE
4,601
LABOR FORCE [ PEOPLE ]
59.6%
PERCENT IN LABOR FORCE
3.0%
UNEMPLOYMENT RATE
Runnels County Area Codes
Income in Runnels County
Income Overview in Runnels County
Per Capita Income in Runnels County is $29,784, while median incomes of families and households are $65,648 and $55,424 respectively.
| Characteristic | Number | Measure |
| Per Capita Income | 9,858 | $29,784 |
| Median Family Income | 2,538 | $65,648 |
| Mean Family Income | 2,538 | $88,854 |
| Median Household Income | 3,780 | $55,424 |
| Mean Household Income | 3,780 | $75,022 |
| Income Deficit | 2,538 | $9,126 |
| Wage / Income Gap (%) | 9,858 | 28.43% |
| Wage / Income Gap ($) | 9,858 | 71.57¢ per $1 |
| Gini / Inequality Index | 9,858 | 0.43 |
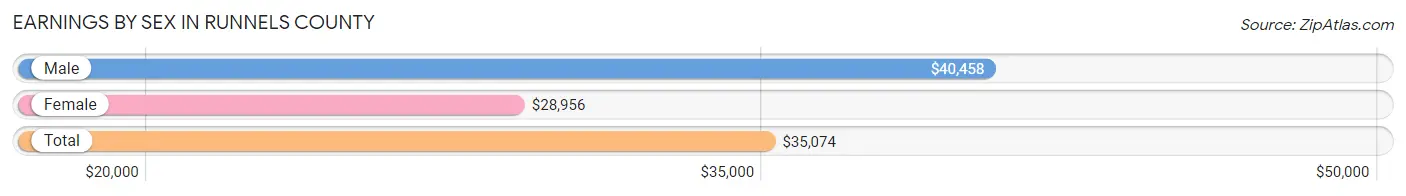
Earnings by Sex in Runnels County
Average Earnings in Runnels County are $35,074, $40,458 for men and $28,956 for women, a difference of 28.4%.
| Sex | Number | Average Earnings |
| Male | 2,910 (59.1%) | $40,458 |
| Female | 2,011 (40.9%) | $28,956 |
| Total | 4,921 (100.0%) | $35,074 |
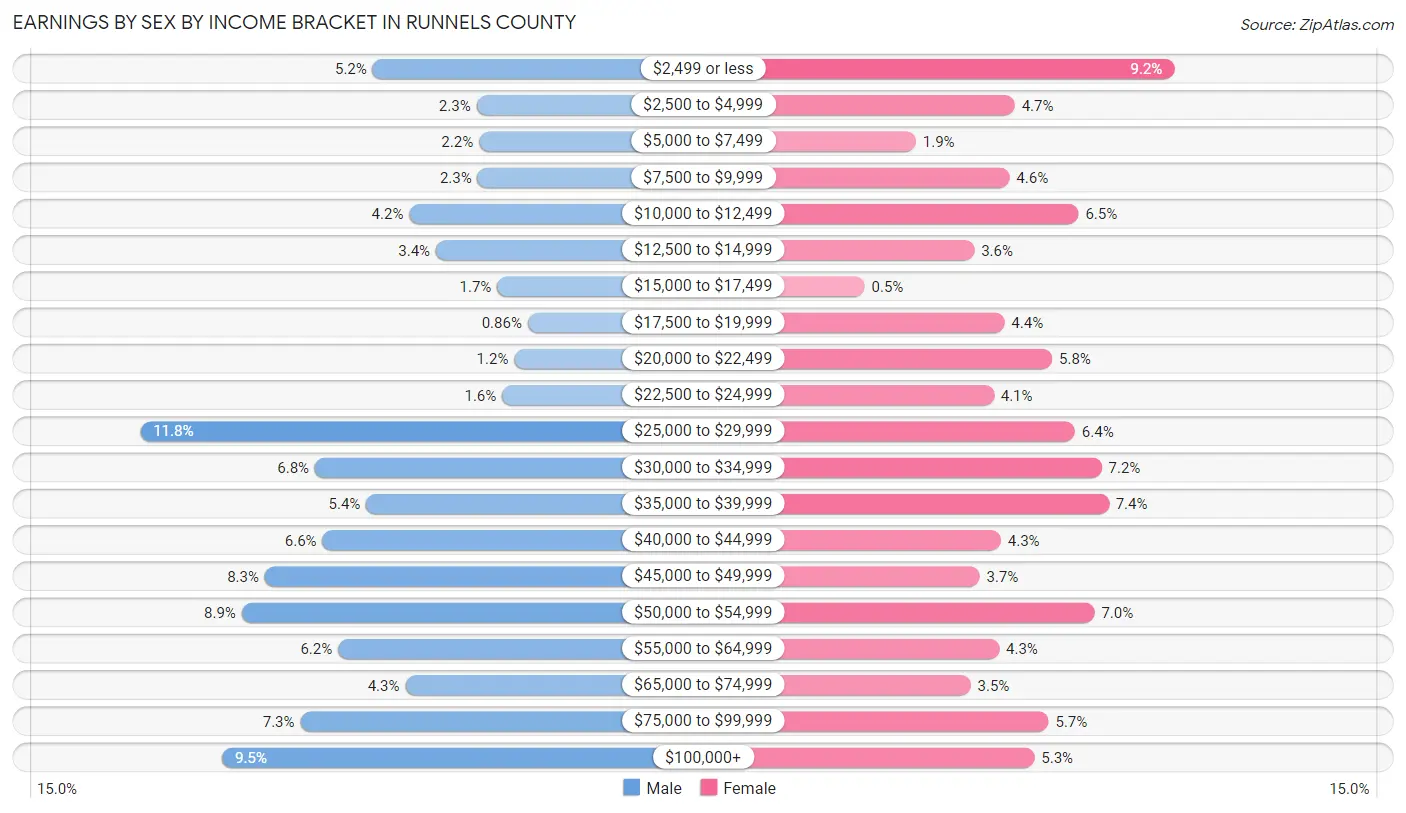
Earnings by Sex by Income Bracket in Runnels County
The most common earnings brackets in Runnels County are $25,000 to $29,999 for men (342 | 11.7%) and $2,499 or less for women (185 | 9.2%).
| Income | Male | Female |
| $2,499 or less | 152 (5.2%) | 185 (9.2%) |
| $2,500 to $4,999 | 67 (2.3%) | 95 (4.7%) |
| $5,000 to $7,499 | 65 (2.2%) | 39 (1.9%) |
| $7,500 to $9,999 | 66 (2.3%) | 92 (4.6%) |
| $10,000 to $12,499 | 122 (4.2%) | 131 (6.5%) |
| $12,500 to $14,999 | 100 (3.4%) | 72 (3.6%) |
| $15,000 to $17,499 | 50 (1.7%) | 10 (0.5%) |
| $17,500 to $19,999 | 25 (0.9%) | 89 (4.4%) |
| $20,000 to $22,499 | 36 (1.2%) | 116 (5.8%) |
| $22,500 to $24,999 | 46 (1.6%) | 83 (4.1%) |
| $25,000 to $29,999 | 342 (11.7%) | 129 (6.4%) |
| $30,000 to $34,999 | 199 (6.8%) | 144 (7.2%) |
| $35,000 to $39,999 | 157 (5.4%) | 148 (7.4%) |
| $40,000 to $44,999 | 193 (6.6%) | 87 (4.3%) |
| $45,000 to $49,999 | 240 (8.3%) | 75 (3.7%) |
| $50,000 to $54,999 | 259 (8.9%) | 140 (7.0%) |
| $55,000 to $64,999 | 180 (6.2%) | 86 (4.3%) |
| $65,000 to $74,999 | 125 (4.3%) | 70 (3.5%) |
| $75,000 to $99,999 | 211 (7.2%) | 114 (5.7%) |
| $100,000+ | 275 (9.5%) | 106 (5.3%) |
| Total | 2,910 (100.0%) | 2,011 (100.0%) |
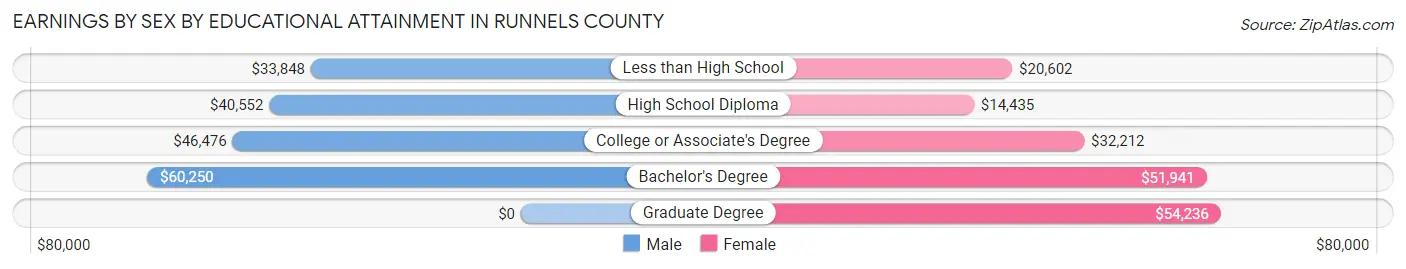
Earnings by Sex by Educational Attainment in Runnels County
Average earnings in Runnels County are $44,750 for men and $30,377 for women, a difference of 32.1%. Men with an educational attainment of bachelor's degree enjoy the highest average annual earnings of $60,250, while those with less than high school education earn the least with $33,848. Women with an educational attainment of graduate degree earn the most with the average annual earnings of $54,236, while those with high school diploma education have the smallest earnings of $14,435.
| Educational Attainment | Male Income | Female Income |
| Less than High School | $33,848 | $20,602 |
| High School Diploma | $40,552 | $14,435 |
| College or Associate's Degree | $46,476 | $32,212 |
| Bachelor's Degree | $60,250 | $51,941 |
| Graduate Degree | - | - |
| Total | $44,750 | $30,377 |
Family Income in Runnels County
Family Income Brackets in Runnels County
According to the Runnels County family income data, there are 670 families falling into the $50,000 to $74,999 income range, which is the most common income bracket and makes up 26.4% of all families. Conversely, the less than $10,000 income bracket is the least frequent group with only 58 families (2.3%) belonging to this category.
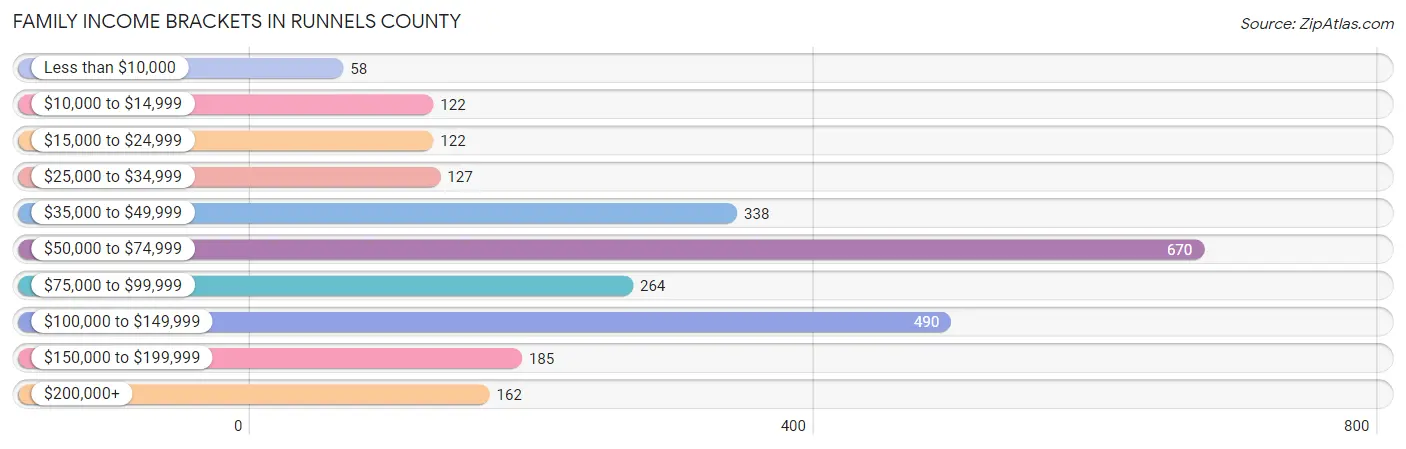
| Income Bracket | # Families | % Families |
| Less than $10,000 | 58 | 2.3% |
| $10,000 to $14,999 | 122 | 4.8% |
| $15,000 to $24,999 | 122 | 4.8% |
| $25,000 to $34,999 | 127 | 5.0% |
| $35,000 to $49,999 | 338 | 13.3% |
| $50,000 to $74,999 | 670 | 26.4% |
| $75,000 to $99,999 | 264 | 10.4% |
| $100,000 to $149,999 | 490 | 19.3% |
| $150,000 to $199,999 | 185 | 7.3% |
| $200,000+ | 162 | 6.4% |
Family Income by Famaliy Size in Runnels County
7+ person families (51 | 2.0%) account for the highest median family income in Runnels County with $220,945 per family, while 7+ person families (51 | 2.0%) have the highest median income of $31,564 per family member.
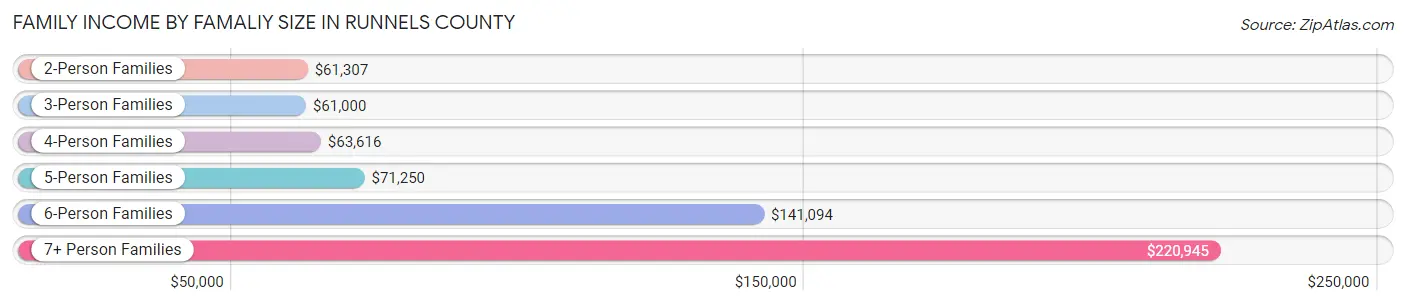
| Income Bracket | # Families | Median Income |
| 2-Person Families | 1,365 (53.8%) | $61,307 |
| 3-Person Families | 480 (18.9%) | $61,000 |
| 4-Person Families | 351 (13.8%) | $63,616 |
| 5-Person Families | 270 (10.6%) | $71,250 |
| 6-Person Families | 21 (0.8%) | $141,094 |
| 7+ Person Families | 51 (2.0%) | $220,945 |
| Total | 2,538 (100.0%) | $65,648 |
Family Income by Number of Earners in Runnels County
The median family income in Runnels County is $65,648, with families comprising 3+ earners (212) having the highest median family income of $142,197, while families with no earners (352) have the lowest median family income of $45,588, accounting for 8.4% and 13.9% of families, respectively.
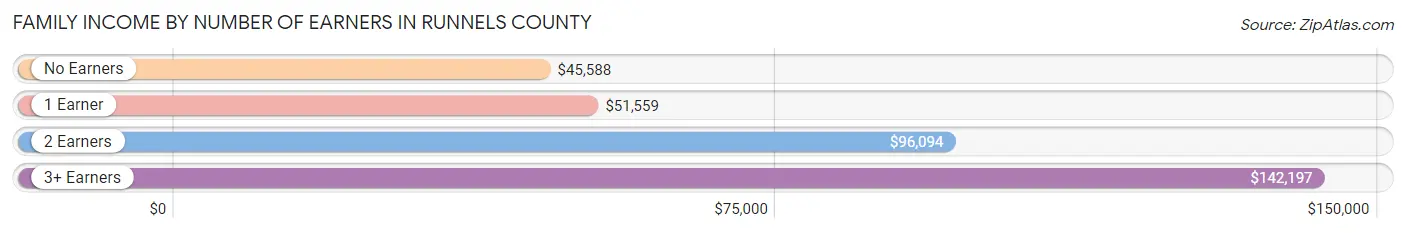
| Number of Earners | # Families | Median Income |
| No Earners | 352 (13.9%) | $45,588 |
| 1 Earner | 996 (39.2%) | $51,559 |
| 2 Earners | 978 (38.5%) | $96,094 |
| 3+ Earners | 212 (8.4%) | $142,197 |
| Total | 2,538 (100.0%) | $65,648 |
Household Income in Runnels County
Household Income Brackets in Runnels County
With 922 households falling in the category, the $50,000 to $74,999 income range is the most frequent in Runnels County, accounting for 24.4% of all households. In contrast, only 155 households (4.1%) fall into the less than $10,000 income bracket, making it the least populous group.
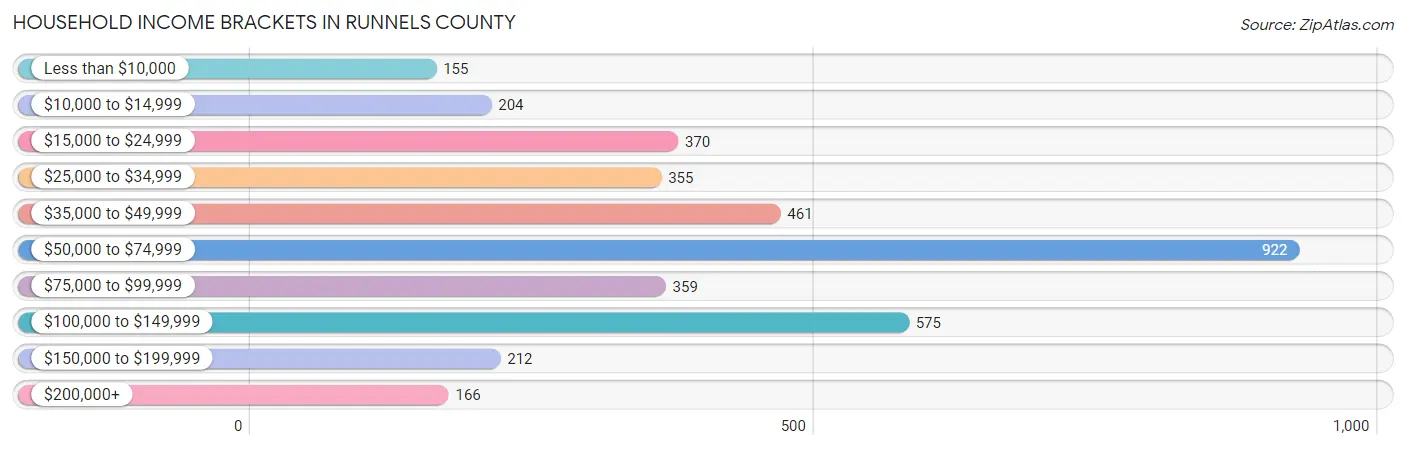
| Income Bracket | # Households | % Households |
| Less than $10,000 | 155 | 4.1% |
| $10,000 to $14,999 | 204 | 5.4% |
| $15,000 to $24,999 | 370 | 9.8% |
| $25,000 to $34,999 | 355 | 9.4% |
| $35,000 to $49,999 | 461 | 12.2% |
| $50,000 to $74,999 | 922 | 24.4% |
| $75,000 to $99,999 | 359 | 9.5% |
| $100,000 to $149,999 | 575 | 15.2% |
| $150,000 to $199,999 | 212 | 5.6% |
| $200,000+ | 166 | 4.4% |
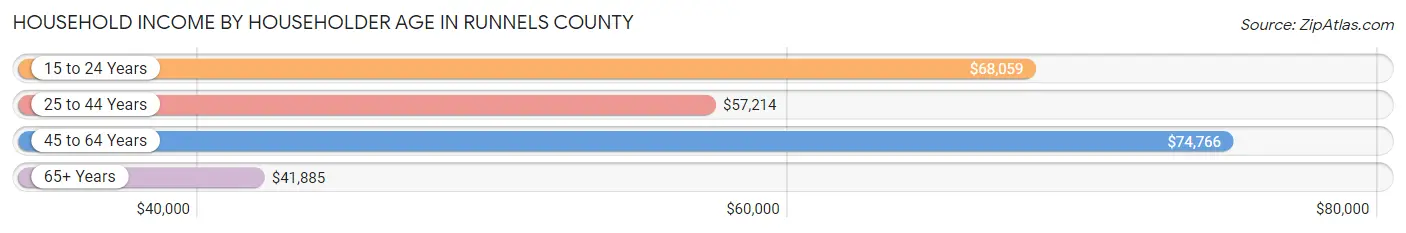
Household Income by Householder Age in Runnels County
The median household income in Runnels County is $55,424, with the highest median household income of $74,766 found in the 45 to 64 years age bracket for the primary householder. A total of 1,427 households (37.8%) fall into this category. Meanwhile, the 65+ years age bracket for the primary householder has the lowest median household income of $41,885, with 1,248 households (33.0%) in this group.
| Income Bracket | # Households | Median Income |
| 15 to 24 Years | 115 (3.0%) | $68,059 |
| 25 to 44 Years | 990 (26.2%) | $57,214 |
| 45 to 64 Years | 1,427 (37.8%) | $74,766 |
| 65+ Years | 1,248 (33.0%) | $41,885 |
| Total | 3,780 (100.0%) | $55,424 |
Poverty in Runnels County
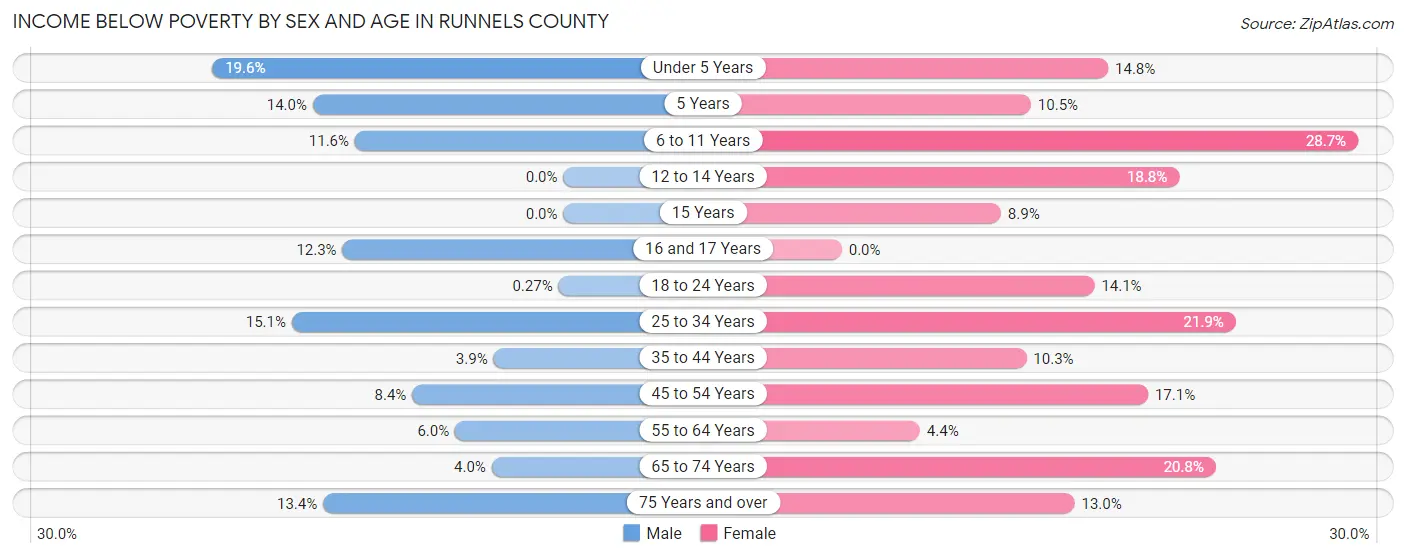
Income Below Poverty by Sex and Age in Runnels County
With 8.6% poverty level for males and 15.2% for females among the residents of Runnels County, under 5 year old males and 6 to 11 year old females are the most vulnerable to poverty, with 61 males (19.6%) and 98 females (28.7%) in their respective age groups living below the poverty level.
| Age Bracket | Male | Female |
| Under 5 Years | 61 (19.6%) | 35 (14.8%) |
| 5 Years | 6 (14.0%) | 12 (10.5%) |
| 6 to 11 Years | 59 (11.6%) | 98 (28.7%) |
| 12 to 14 Years | 0 (0.0%) | 40 (18.8%) |
| 15 Years | 0 (0.0%) | 14 (8.9%) |
| 16 and 17 Years | 15 (12.3%) | 0 (0.0%) |
| 18 to 24 Years | 1 (0.3%) | 47 (14.1%) |
| 25 to 34 Years | 91 (15.1%) | 123 (21.9%) |
| 35 to 44 Years | 23 (3.9%) | 52 (10.3%) |
| 45 to 54 Years | 50 (8.4%) | 104 (17.1%) |
| 55 to 64 Years | 39 (6.0%) | 28 (4.3%) |
| 65 to 74 Years | 22 (4.0%) | 107 (20.8%) |
| 75 Years and over | 53 (13.4%) | 56 (13.0%) |
| Total | 420 (8.6%) | 716 (15.2%) |
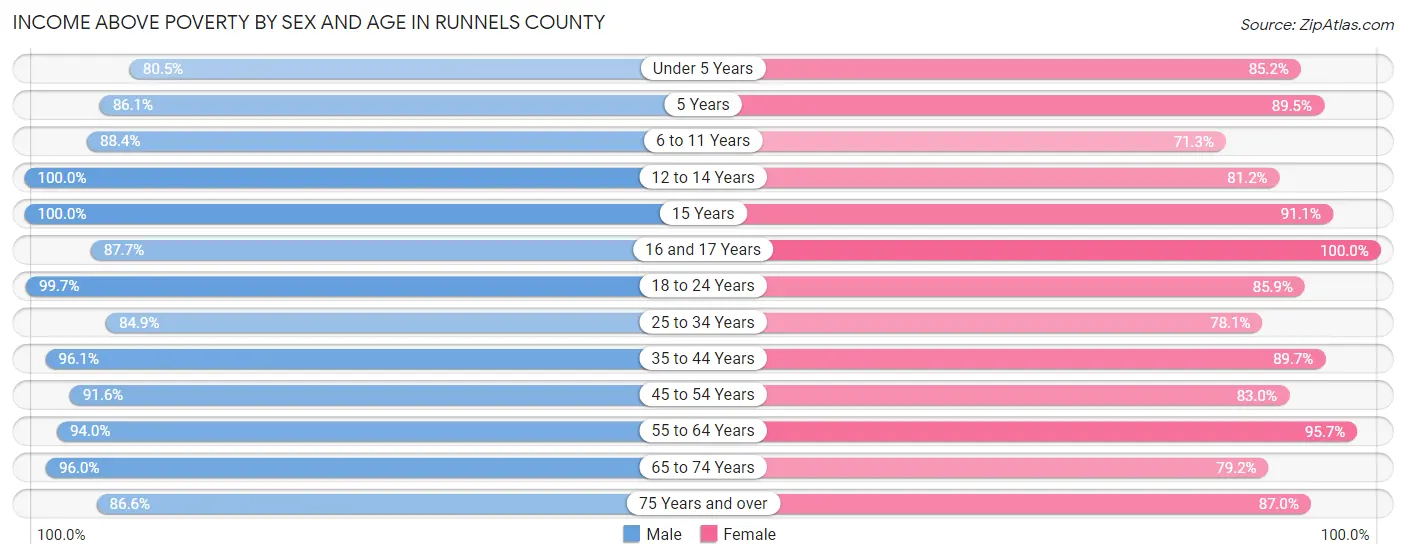
Income Above Poverty by Sex and Age in Runnels County
According to the poverty statistics in Runnels County, males aged 12 to 14 years and females aged 16 and 17 years are the age groups that are most secure financially, with 100.0% of males and 100.0% of females in these age groups living above the poverty line.
| Age Bracket | Male | Female |
| Under 5 Years | 251 (80.4%) | 201 (85.2%) |
| 5 Years | 37 (86.1%) | 102 (89.5%) |
| 6 to 11 Years | 449 (88.4%) | 243 (71.3%) |
| 12 to 14 Years | 101 (100.0%) | 173 (81.2%) |
| 15 Years | 37 (100.0%) | 144 (91.1%) |
| 16 and 17 Years | 107 (87.7%) | 49 (100.0%) |
| 18 to 24 Years | 363 (99.7%) | 287 (85.9%) |
| 25 to 34 Years | 511 (84.9%) | 438 (78.1%) |
| 35 to 44 Years | 568 (96.1%) | 454 (89.7%) |
| 45 to 54 Years | 544 (91.6%) | 506 (83.0%) |
| 55 to 64 Years | 608 (94.0%) | 616 (95.7%) |
| 65 to 74 Years | 529 (96.0%) | 407 (79.2%) |
| 75 Years and over | 343 (86.6%) | 376 (87.0%) |
| Total | 4,448 (91.4%) | 3,996 (84.8%) |
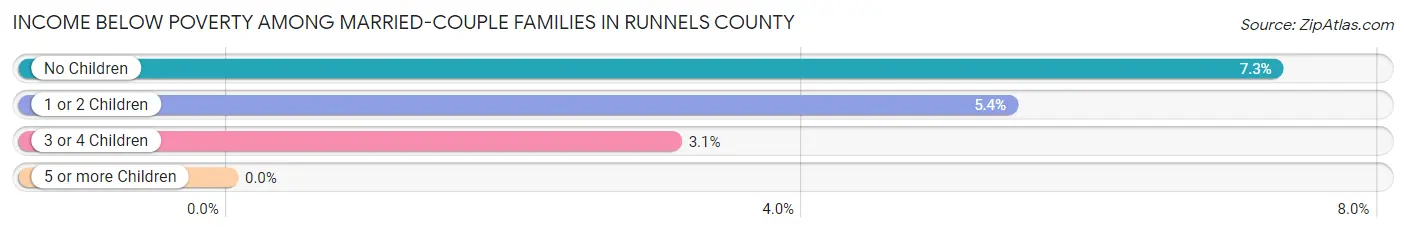
Income Below Poverty Among Married-Couple Families in Runnels County
The poverty statistics for married-couple families in Runnels County show that 6.4% or 118 of the total 1,845 families live below the poverty line. Families with no children have the highest poverty rate of 7.3%, comprising of 86 families. On the other hand, families with 5 or more children have the lowest poverty rate of 0.0%, which includes 0 families.
| Children | Above Poverty | Below Poverty |
| No Children | 1,095 (92.7%) | 86 (7.3%) |
| 1 or 2 Children | 470 (94.6%) | 27 (5.4%) |
| 3 or 4 Children | 157 (96.9%) | 5 (3.1%) |
| 5 or more Children | 5 (100.0%) | 0 (0.0%) |
| Total | 1,727 (93.6%) | 118 (6.4%) |
Income Below Poverty Among Single-Parent Households in Runnels County
According to the poverty data in Runnels County, 11.3% or 22 single-father households and 28.3% or 141 single-mother households are living below the poverty line. Among single-father households, those with 3 or 4 children have the highest poverty rate, with 19 households (57.6%) experiencing poverty. Likewise, among single-mother households, those with 1 or 2 children have the highest poverty rate, with 106 households (48.6%) falling below the poverty line.
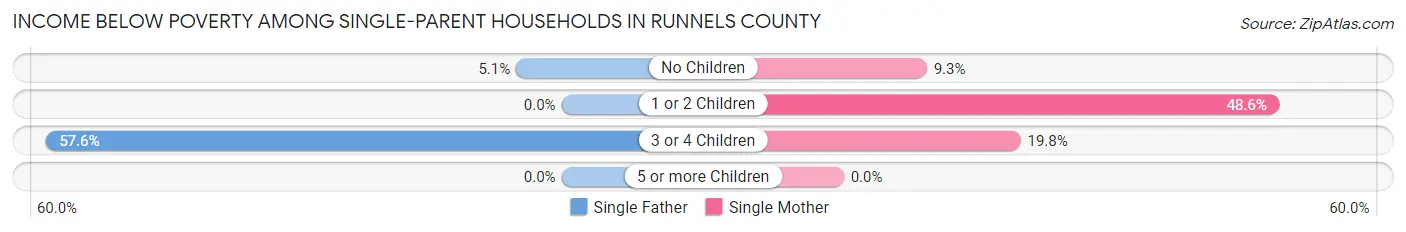
| Children | Single Father | Single Mother |
| No Children | 3 (5.1%) | 18 (9.3%) |
| 1 or 2 Children | 0 (0.0%) | 106 (48.6%) |
| 3 or 4 Children | 19 (57.6%) | 17 (19.8%) |
| 5 or more Children | 0 (0.0%) | 0 (0.0%) |
| Total | 22 (11.3%) | 141 (28.3%) |
Income Below Poverty Among Married-Couple vs Single-Parent Households in Runnels County
The poverty data for Runnels County shows that 118 of the married-couple family households (6.4%) and 163 of the single-parent households (23.5%) are living below the poverty level. Within the married-couple family households, those with no children have the highest poverty rate, with 86 households (7.3%) falling below the poverty line. Among the single-parent households, those with 1 or 2 children have the highest poverty rate, with 106 household (33.0%) living below poverty.
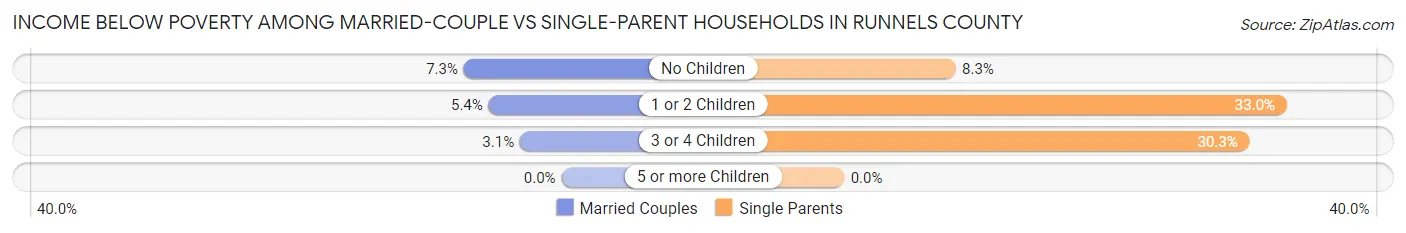
| Children | Married-Couple Families | Single-Parent Households |
| No Children | 86 (7.3%) | 21 (8.3%) |
| 1 or 2 Children | 27 (5.4%) | 106 (33.0%) |
| 3 or 4 Children | 5 (3.1%) | 36 (30.2%) |
| 5 or more Children | 0 (0.0%) | 0 (0.0%) |
| Total | 118 (6.4%) | 163 (23.5%) |
Race in Runnels County
The most populous races in Runnels County are White / Caucasian (7,818 | 79.3%), Hispanic or Latino (3,469 | 35.2%), and Two or more Races (1,377 | 14.0%).
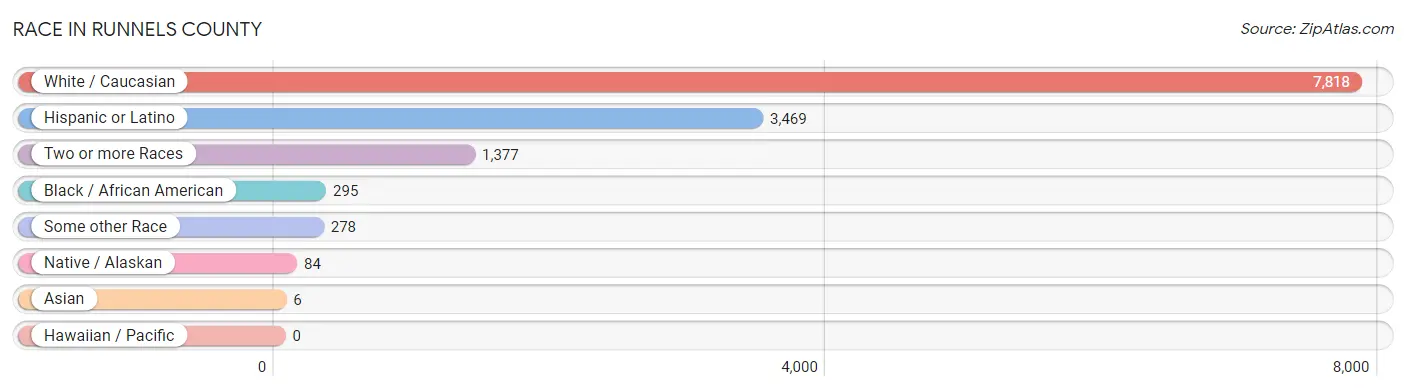
| Race | # Population | % Population |
| Asian | 6 | 0.1% |
| Black / African American | 295 | 3.0% |
| Hawaiian / Pacific | 0 | 0.0% |
| Hispanic or Latino | 3,469 | 35.2% |
| Native / Alaskan | 84 | 0.9% |
| White / Caucasian | 7,818 | 79.3% |
| Two or more Races | 1,377 | 14.0% |
| Some other Race | 278 | 2.8% |
| Total | 9,858 | 100.0% |
Ancestry in Runnels County
The most populous ancestries reported in Runnels County are Mexican (3,182 | 32.3%), German (2,005 | 20.3%), Irish (1,008 | 10.2%), English (660 | 6.7%), and European (483 | 4.9%), together accounting for 74.5% of all Runnels County residents.
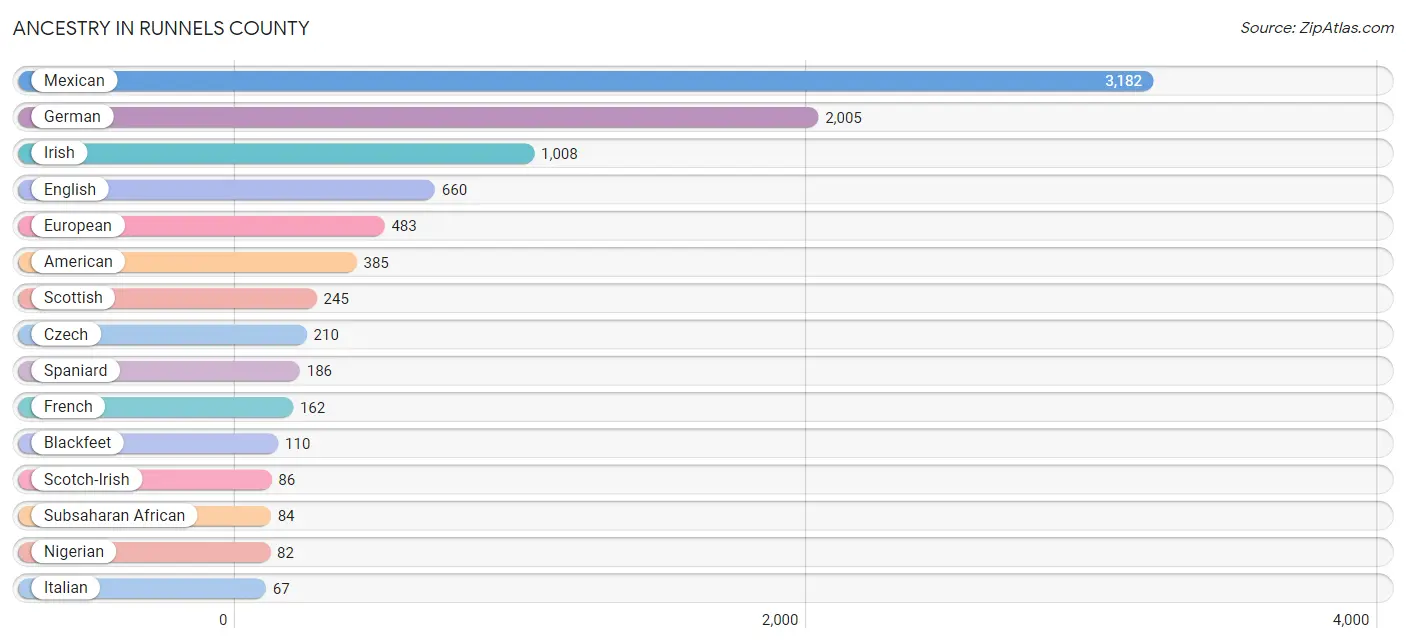
| Ancestry | # Population | % Population |
| African | 2 | 0.0% |
| American | 385 | 3.9% |
| Austrian | 5 | 0.1% |
| Blackfeet | 110 | 1.1% |
| British | 38 | 0.4% |
| Cherokee | 3 | 0.0% |
| Cheyenne | 8 | 0.1% |
| Chickasaw | 6 | 0.1% |
| Choctaw | 1 | 0.0% |
| Comanche | 1 | 0.0% |
| Cuban | 15 | 0.2% |
| Czech | 210 | 2.1% |
| Czechoslovakian | 42 | 0.4% |
| Dutch | 62 | 0.6% |
| English | 660 | 6.7% |
| European | 483 | 4.9% |
| French | 162 | 1.6% |
| German | 2,005 | 20.3% |
| Indian (Asian) | 6 | 0.1% |
| Irish | 1,008 | 10.2% |
| Italian | 67 | 0.7% |
| Mexican | 3,182 | 32.3% |
| Nigerian | 82 | 0.8% |
| Norwegian | 27 | 0.3% |
| Pennsylvania German | 3 | 0.0% |
| Polish | 18 | 0.2% |
| Romanian | 5 | 0.1% |
| Scandinavian | 60 | 0.6% |
| Scotch-Irish | 86 | 0.9% |
| Scottish | 245 | 2.5% |
| Sioux | 1 | 0.0% |
| Spaniard | 186 | 1.9% |
| Spanish | 30 | 0.3% |
| Subsaharan African | 84 | 0.9% |
| Swedish | 34 | 0.3% |
| Welsh | 29 | 0.3% | View All 36 Rows |
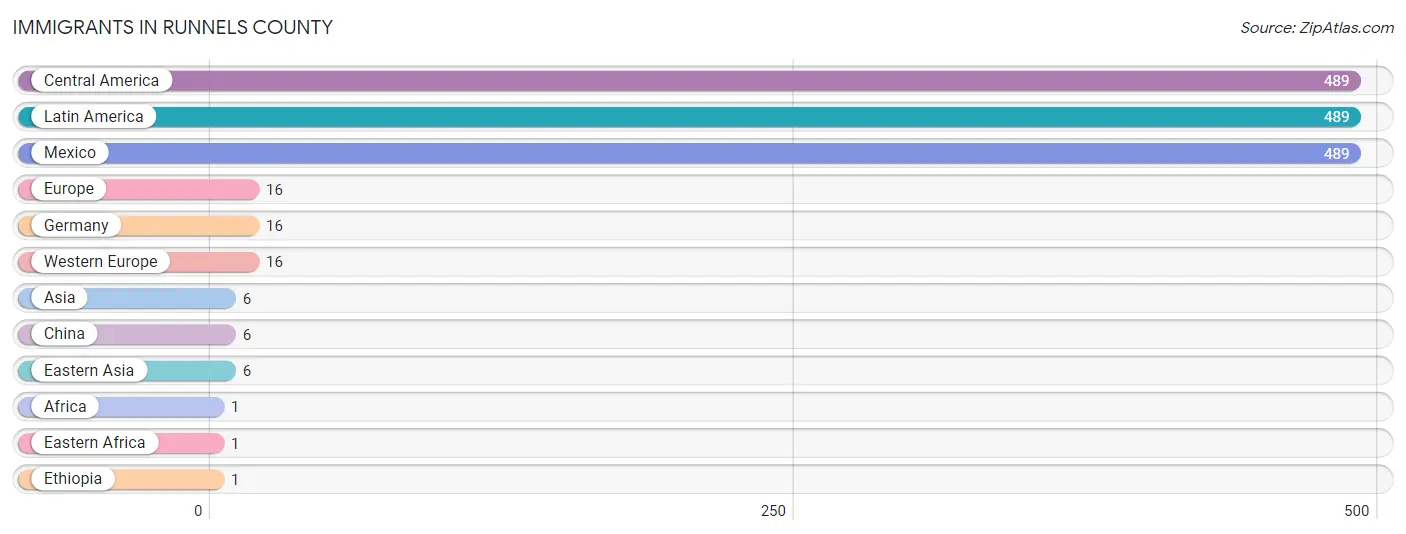
Immigrants in Runnels County
The most numerous immigrant groups reported in Runnels County came from Central America (489 | 5.0%), Latin America (489 | 5.0%), Mexico (489 | 5.0%), Europe (16 | 0.2%), and Germany (16 | 0.2%), together accounting for 15.2% of all Runnels County residents.
| Immigration Origin | # Population | % Population |
| Africa | 1 | 0.0% |
| Asia | 6 | 0.1% |
| Central America | 489 | 5.0% |
| China | 6 | 0.1% |
| Eastern Africa | 1 | 0.0% |
| Eastern Asia | 6 | 0.1% |
| Ethiopia | 1 | 0.0% |
| Europe | 16 | 0.2% |
| Germany | 16 | 0.2% |
| Latin America | 489 | 5.0% |
| Mexico | 489 | 5.0% |
| Western Europe | 16 | 0.2% | View All 12 Rows |
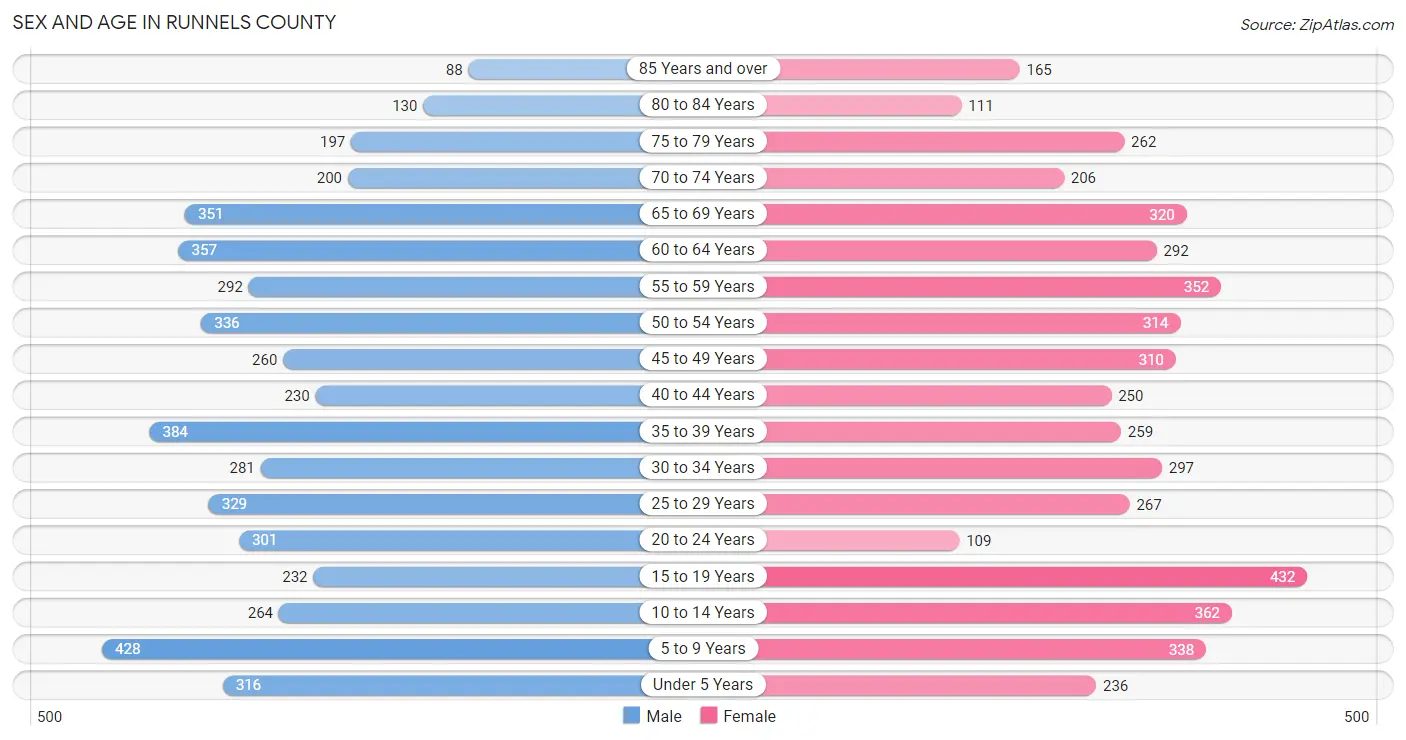
Sex and Age in Runnels County
Sex and Age in Runnels County
The most populous age groups in Runnels County are 5 to 9 Years (428 | 8.6%) for men and 15 to 19 Years (432 | 8.8%) for women.
| Age Bracket | Male | Female |
| Under 5 Years | 316 (6.4%) | 236 (4.8%) |
| 5 to 9 Years | 428 (8.6%) | 338 (6.9%) |
| 10 to 14 Years | 264 (5.3%) | 362 (7.4%) |
| 15 to 19 Years | 232 (4.7%) | 432 (8.8%) |
| 20 to 24 Years | 301 (6.0%) | 109 (2.2%) |
| 25 to 29 Years | 329 (6.6%) | 267 (5.5%) |
| 30 to 34 Years | 281 (5.7%) | 297 (6.1%) |
| 35 to 39 Years | 384 (7.7%) | 259 (5.3%) |
| 40 to 44 Years | 230 (4.6%) | 250 (5.1%) |
| 45 to 49 Years | 260 (5.2%) | 310 (6.4%) |
| 50 to 54 Years | 336 (6.8%) | 314 (6.4%) |
| 55 to 59 Years | 292 (5.9%) | 352 (7.2%) |
| 60 to 64 Years | 357 (7.2%) | 292 (6.0%) |
| 65 to 69 Years | 351 (7.0%) | 320 (6.6%) |
| 70 to 74 Years | 200 (4.0%) | 206 (4.2%) |
| 75 to 79 Years | 197 (4.0%) | 262 (5.4%) |
| 80 to 84 Years | 130 (2.6%) | 111 (2.3%) |
| 85 Years and over | 88 (1.8%) | 165 (3.4%) |
| Total | 4,976 (100.0%) | 4,882 (100.0%) |
Families and Households in Runnels County
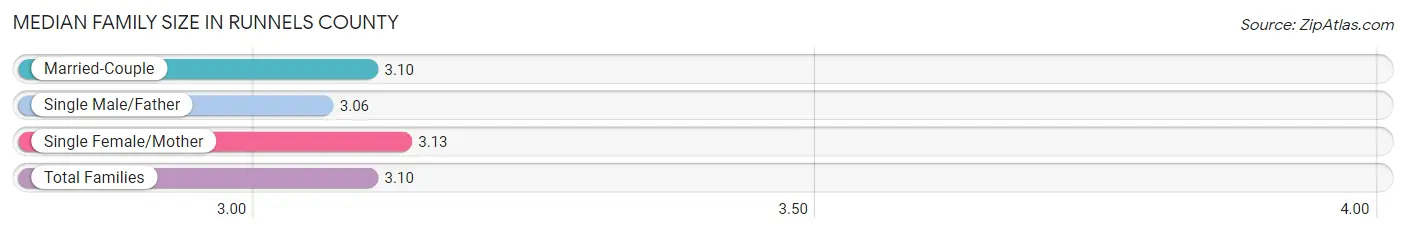
Median Family Size in Runnels County
The median family size in Runnels County is 3.10 persons per family, with single female/mother families (498 | 19.6%) accounting for the largest median family size of 3.13 persons per family. On the other hand, single male/father families (195 | 7.7%) represent the smallest median family size with 3.06 persons per family.
| Family Type | # Families | Family Size |
| Married-Couple | 1,845 (72.7%) | 3.10 |
| Single Male/Father | 195 (7.7%) | 3.06 |
| Single Female/Mother | 498 (19.6%) | 3.13 |
| Total Families | 2,538 (100.0%) | 3.10 |
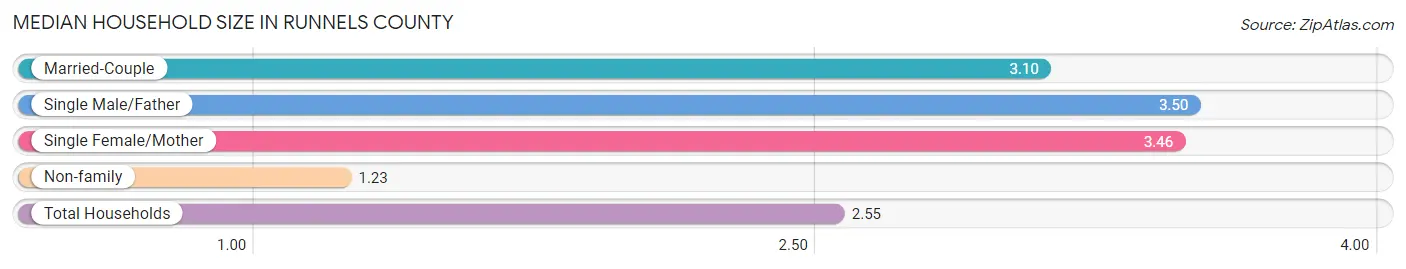
Median Household Size in Runnels County
The median household size in Runnels County is 2.55 persons per household, with single male/father households (195 | 5.2%) accounting for the largest median household size of 3.5 persons per household. non-family households (1,242 | 32.9%) represent the smallest median household size with 1.23 persons per household.
| Household Type | # Households | Household Size |
| Married-Couple | 1,845 (48.8%) | 3.10 |
| Single Male/Father | 195 (5.2%) | 3.50 |
| Single Female/Mother | 498 (13.2%) | 3.46 |
| Non-family | 1,242 (32.9%) | 1.23 |
| Total Households | 3,780 (100.0%) | 2.55 |
Household Size by Marriage Status in Runnels County
Out of a total of 3,780 households in Runnels County, 2,538 (67.1%) are family households, while 1,242 (32.9%) are nonfamily households. The most numerous type of family households are 2-person households, comprising 1,333, and the most common type of nonfamily households are 1-person households, comprising 1,048.
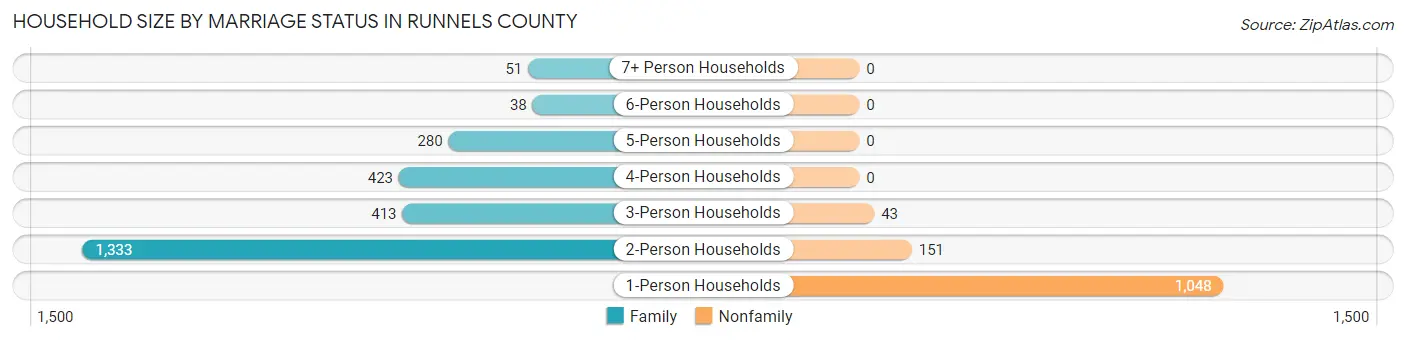
| Household Size | Family Households | Nonfamily Households |
| 1-Person Households | - | 1,048 (27.7%) |
| 2-Person Households | 1,333 (35.3%) | 151 (4.0%) |
| 3-Person Households | 413 (10.9%) | 43 (1.1%) |
| 4-Person Households | 423 (11.2%) | 0 (0.0%) |
| 5-Person Households | 280 (7.4%) | 0 (0.0%) |
| 6-Person Households | 38 (1.0%) | 0 (0.0%) |
| 7+ Person Households | 51 (1.3%) | 0 (0.0%) |
| Total | 2,538 (67.1%) | 1,242 (32.9%) |
Female Fertility in Runnels County
Fertility by Age in Runnels County
Average fertility rate in Runnels County is 76.0 births per 1,000 women. Women in the age bracket of 20 to 34 years have the highest fertility rate with 152.0 births per 1,000 women. Women in the age bracket of 20 to 34 years acount for 68.5% of all women with births.
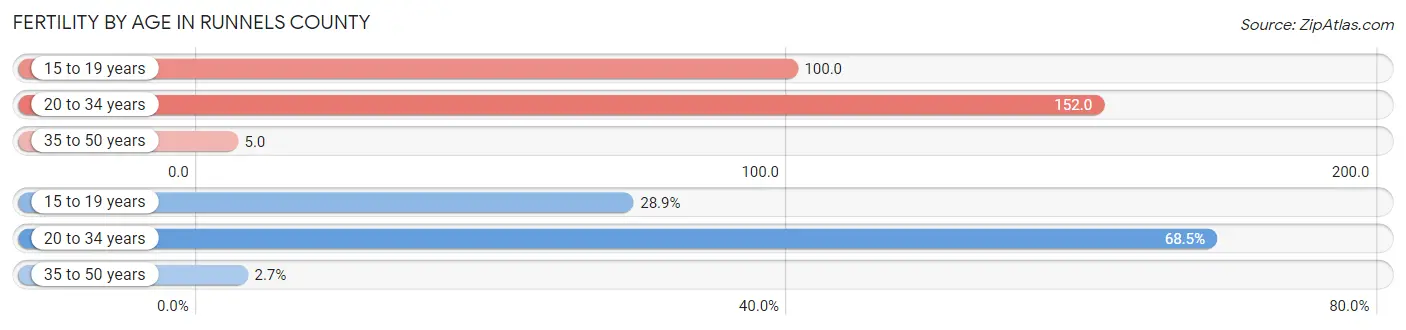
| Age Bracket | Women with Births | Births / 1,000 Women |
| 15 to 19 years | 43 (28.9%) | 100.0 |
| 20 to 34 years | 102 (68.5%) | 152.0 |
| 35 to 50 years | 4 (2.7%) | 5.0 |
| Total | 149 (100.0%) | 76.0 |
Fertility by Age by Marriage Status in Runnels County
55.0% of women with births (149) in Runnels County are married. The highest percentage of unmarried women with births falls into 15 to 19 years age bracket with 100.0% of them unmarried at the time of birth, while the lowest percentage of unmarried women with births belong to 35 to 50 years age bracket with 0.0% of them unmarried.
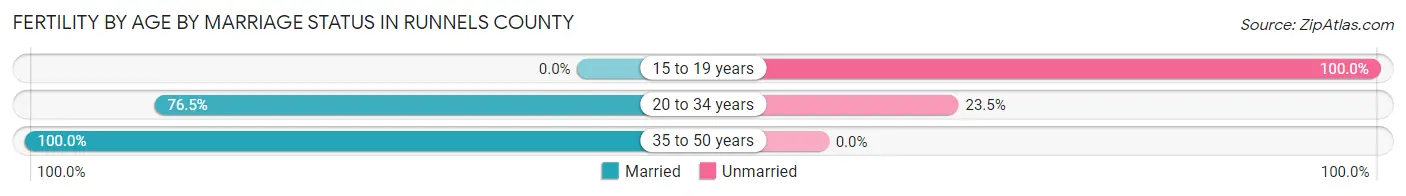
| Age Bracket | Married | Unmarried |
| 15 to 19 years | 0 (0.0%) | 43 (100.0%) |
| 20 to 34 years | 78 (76.5%) | 24 (23.5%) |
| 35 to 50 years | 4 (100.0%) | 0 (0.0%) |
| Total | 82 (55.0%) | 67 (45.0%) |
Fertility by Education in Runnels County
Average fertility rate in Runnels County is 76.0 births per 1,000 women. Women with the education attainment of less than high school have the highest fertility rate of 95.0 births per 1,000 women, while women with the education attainment of graduate degree have the lowest fertility at 51.0 births per 1,000 women. Women with the education attainment of high school diploma represent 32.2% of all women with births.
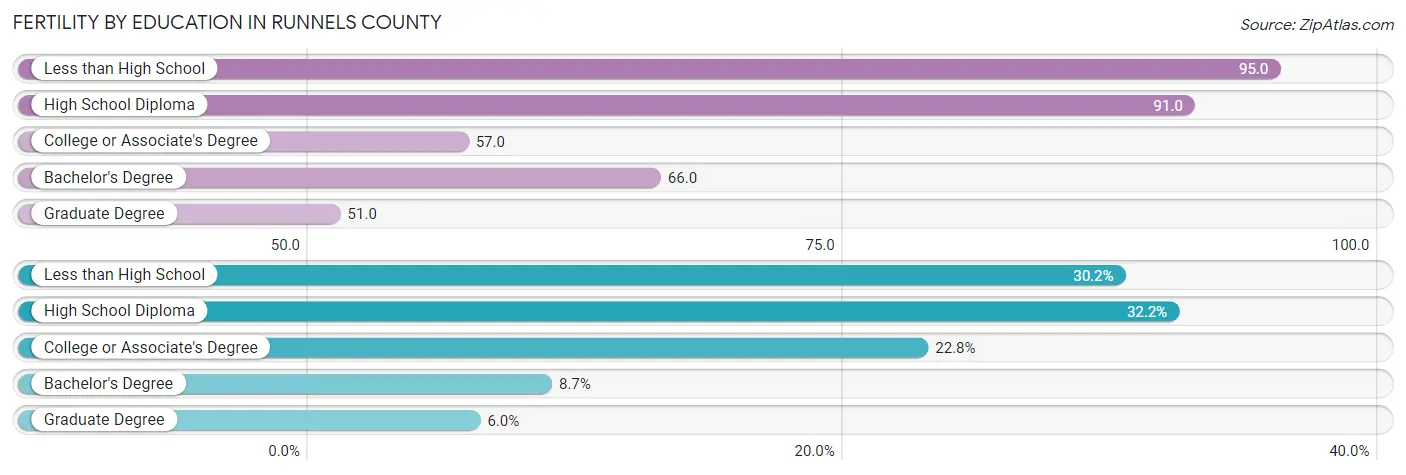
| Educational Attainment | Women with Births | Births / 1,000 Women |
| Less than High School | 45 (30.2%) | 95.0 |
| High School Diploma | 48 (32.2%) | 91.0 |
| College or Associate's Degree | 34 (22.8%) | 57.0 |
| Bachelor's Degree | 13 (8.7%) | 66.0 |
| Graduate Degree | 9 (6.0%) | 51.0 |
| Total | 149 (100.0%) | 76.0 |
Fertility by Education by Marriage Status in Runnels County
45.0% of women with births in Runnels County are unmarried. Women with the educational attainment of bachelor's degree are most likely to be married with 100.0% of them married at childbirth, while women with the educational attainment of less than high school are least likely to be married with 91.1% of them unmarried at childbirth.
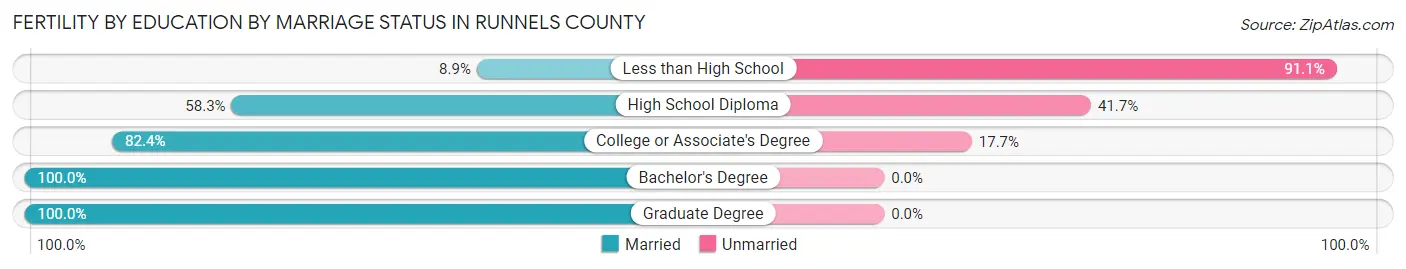
| Educational Attainment | Married | Unmarried |
| Less than High School | 4 (8.9%) | 41 (91.1%) |
| High School Diploma | 28 (58.3%) | 20 (41.7%) |
| College or Associate's Degree | 28 (82.4%) | 6 (17.6%) |
| Bachelor's Degree | 13 (100.0%) | 0 (0.0%) |
| Graduate Degree | 9 (100.0%) | 0 (0.0%) |
| Total | 82 (55.0%) | 67 (45.0%) |
Employment Characteristics in Runnels County
Employment by Class of Employer in Runnels County
Among the 4,404 employed individuals in Runnels County, private company employees (2,883 | 65.5%), local government employees (489 | 11.1%), and self-employed (not incorporated) (461 | 10.5%) make up the most common classes of employment.
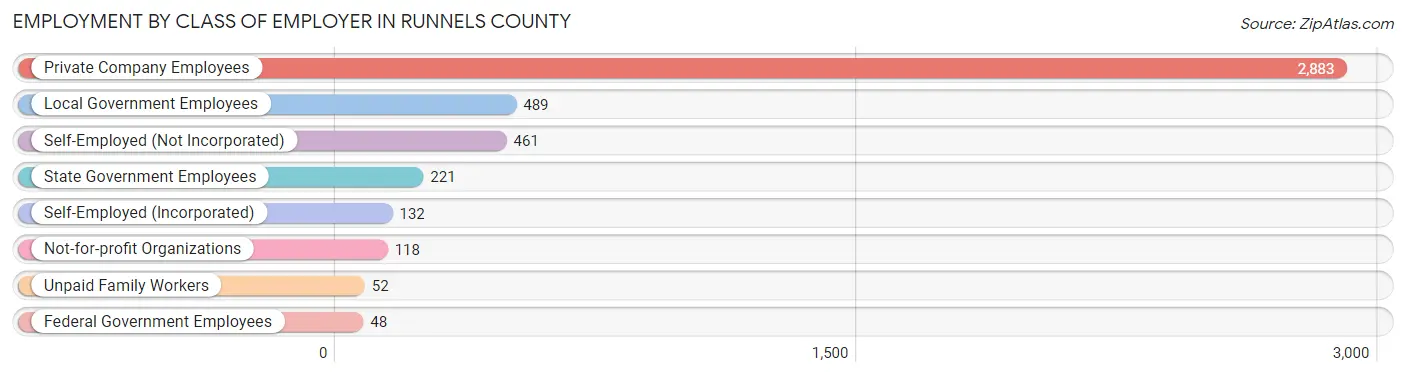
| Employer Class | # Employees | % Employees |
| Private Company Employees | 2,883 | 65.5% |
| Self-Employed (Incorporated) | 132 | 3.0% |
| Self-Employed (Not Incorporated) | 461 | 10.5% |
| Not-for-profit Organizations | 118 | 2.7% |
| Local Government Employees | 489 | 11.1% |
| State Government Employees | 221 | 5.0% |
| Federal Government Employees | 48 | 1.1% |
| Unpaid Family Workers | 52 | 1.2% |
| Total | 4,404 | 100.0% |
Employment Status by Age in Runnels County
According to the labor force statistics for Runnels County, out of the total population over 16 years of age (7,719), 59.6% or 4,601 individuals are in the labor force, with 3.0% or 138 of them unemployed. The age group with the highest labor force participation rate is 35 to 44 years, with 89.5% or 1,005 individuals in the labor force. Within the labor force, the 16 to 19 years age range has the highest percentage of unemployed individuals, with 15.1% or 14 of them being unemployed.
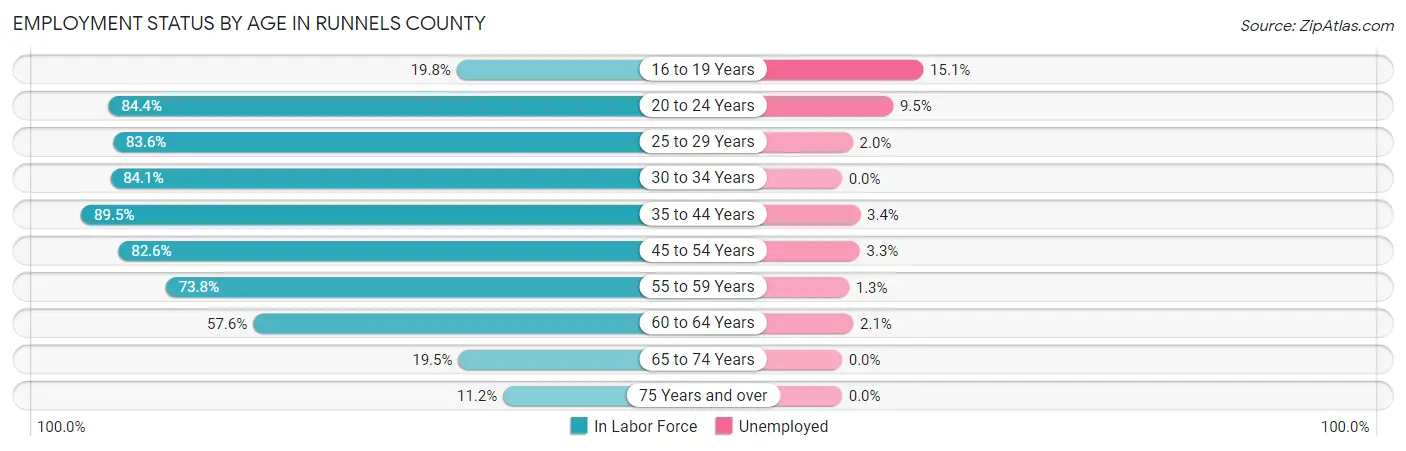
| Age Bracket | In Labor Force | Unemployed |
| 16 to 19 Years | 93 (19.8%) | 14 (15.1%) |
| 20 to 24 Years | 346 (84.4%) | 33 (9.5%) |
| 25 to 29 Years | 498 (83.6%) | 10 (2.0%) |
| 30 to 34 Years | 486 (84.1%) | 0 (0.0%) |
| 35 to 44 Years | 1,005 (89.5%) | 34 (3.4%) |
| 45 to 54 Years | 1,008 (82.6%) | 33 (3.3%) |
| 55 to 59 Years | 475 (73.8%) | 6 (1.3%) |
| 60 to 64 Years | 374 (57.6%) | 8 (2.1%) |
| 65 to 74 Years | 210 (19.5%) | 0 (0.0%) |
| 75 Years and over | 107 (11.2%) | 0 (0.0%) |
| Total | 4,601 (59.6%) | 138 (3.0%) |
Employment Status by Educational Attainment in Runnels County
According to labor force statistics for Runnels County, 80.0% of individuals (3,848) out of the total population between 25 and 64 years of age (4,810) are in the labor force, with 2.4% or 92 of them being unemployed. The group with the highest labor force participation rate are those with the educational attainment of bachelor's degree or higher, with 88.9% or 847 individuals in the labor force. Within the labor force, individuals with high school diploma education have the highest percentage of unemployment, with 5.7% or 68 of them being unemployed.
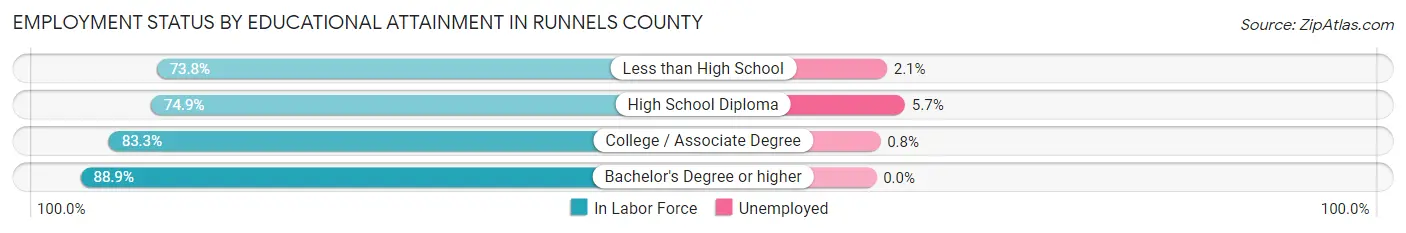
| Educational Attainment | In Labor Force | Unemployed |
| Less than High School | 622 (73.8%) | 18 (2.1%) |
| High School Diploma | 1,186 (74.9%) | 90 (5.7%) |
| College / Associate Degree | 1,191 (83.3%) | 11 (0.8%) |
| Bachelor's Degree or higher | 847 (88.9%) | 0 (0.0%) |
| Total | 3,848 (80.0%) | 115 (2.4%) |
Employment Occupations by Sex in Runnels County
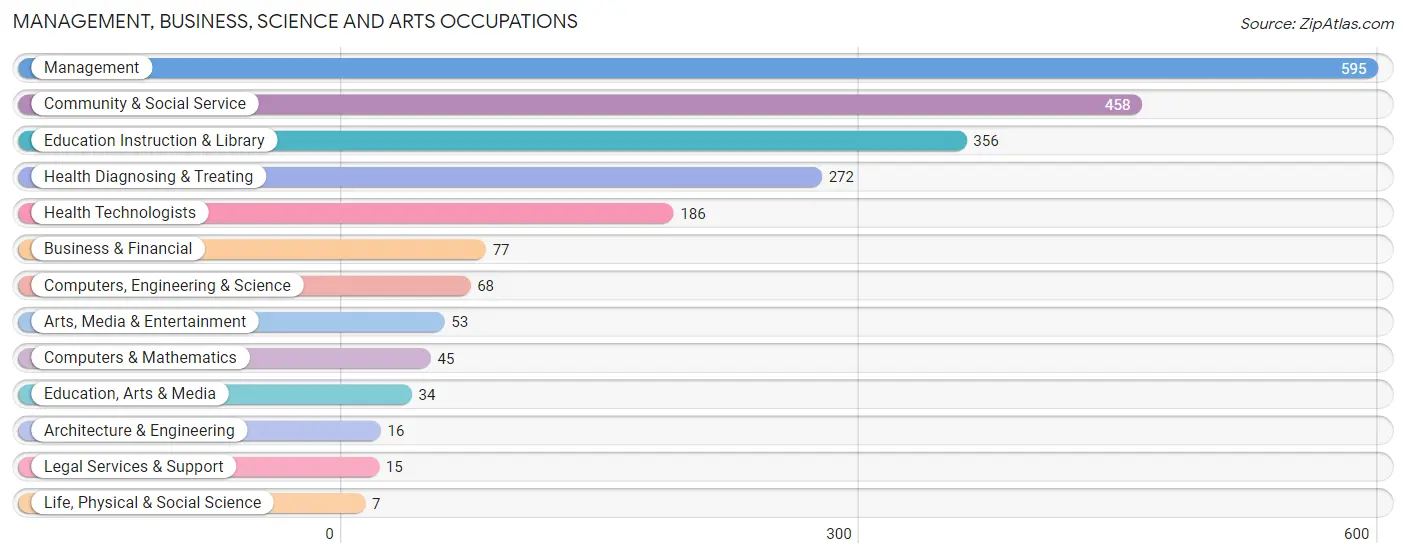
Management, Business, Science and Arts Occupations
The most common Management, Business, Science and Arts occupations in Runnels County are Management (595 | 13.4%), Community & Social Service (458 | 10.3%), Education Instruction & Library (356 | 8.0%), Health Diagnosing & Treating (272 | 6.1%), and Health Technologists (186 | 4.2%).
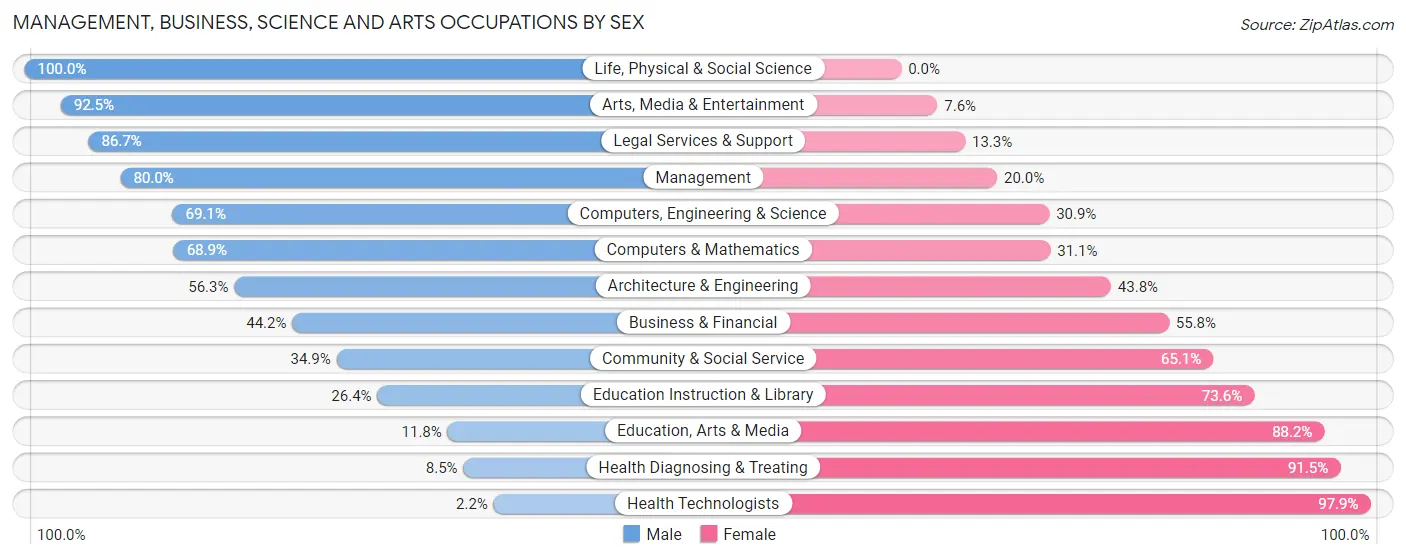
Management, Business, Science and Arts Occupations by Sex
Within the Management, Business, Science and Arts occupations in Runnels County, the most male-oriented occupations are Life, Physical & Social Science (100.0%), Arts, Media & Entertainment (92.4%), and Legal Services & Support (86.7%), while the most female-oriented occupations are Health Technologists (97.9%), Health Diagnosing & Treating (91.5%), and Education, Arts & Media (88.2%).
| Occupation | Male | Female |
| Management | 476 (80.0%) | 119 (20.0%) |
| Business & Financial | 34 (44.2%) | 43 (55.8%) |
| Computers, Engineering & Science | 47 (69.1%) | 21 (30.9%) |
| Computers & Mathematics | 31 (68.9%) | 14 (31.1%) |
| Architecture & Engineering | 9 (56.2%) | 7 (43.8%) |
| Life, Physical & Social Science | 7 (100.0%) | 0 (0.0%) |
| Community & Social Service | 160 (34.9%) | 298 (65.1%) |
| Education, Arts & Media | 4 (11.8%) | 30 (88.2%) |
| Legal Services & Support | 13 (86.7%) | 2 (13.3%) |
| Education Instruction & Library | 94 (26.4%) | 262 (73.6%) |
| Arts, Media & Entertainment | 49 (92.4%) | 4 (7.5%) |
| Health Diagnosing & Treating | 23 (8.5%) | 249 (91.5%) |
| Health Technologists | 4 (2.1%) | 182 (97.9%) |
| Total (Category) | 740 (50.3%) | 730 (49.7%) |
| Total (Overall) | 2,663 (59.8%) | 1,792 (40.2%) |
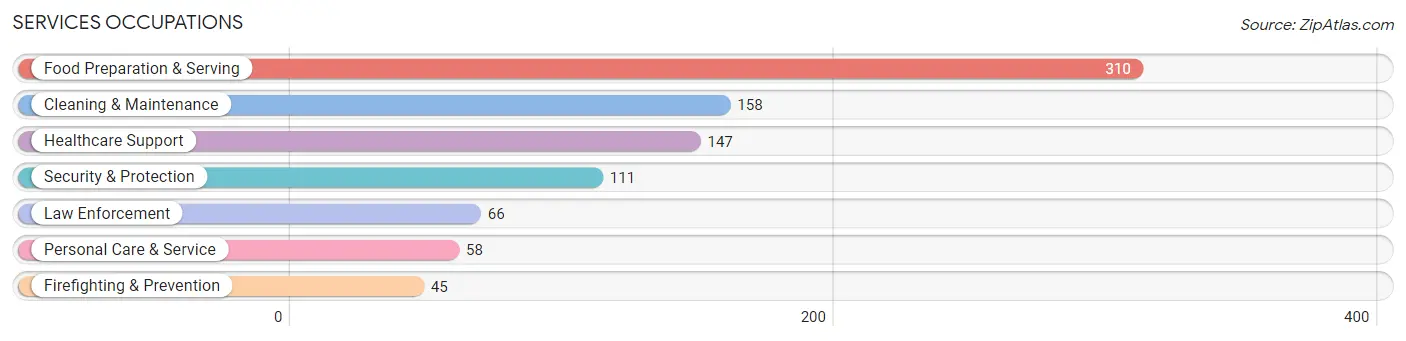
Services Occupations
The most common Services occupations in Runnels County are Food Preparation & Serving (310 | 7.0%), Cleaning & Maintenance (158 | 3.5%), Healthcare Support (147 | 3.3%), Security & Protection (111 | 2.5%), and Law Enforcement (66 | 1.5%).
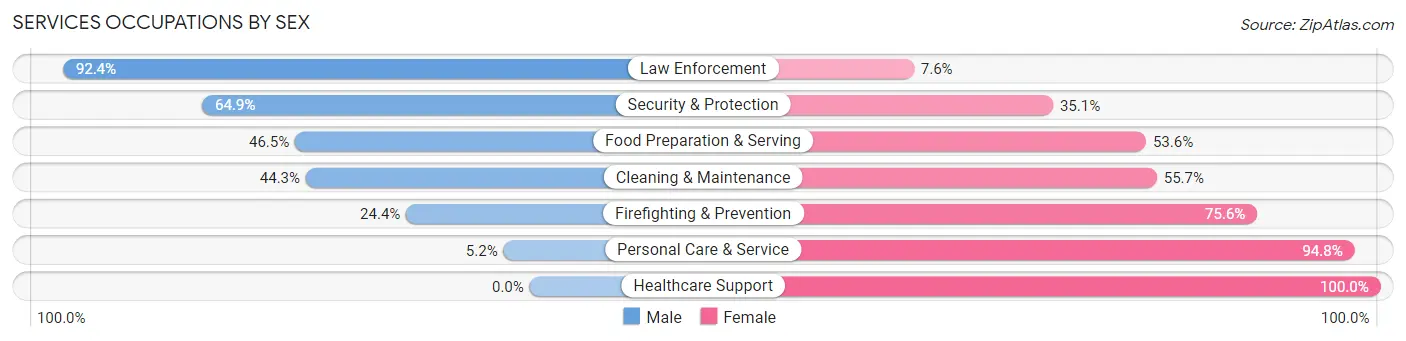
Services Occupations by Sex
Within the Services occupations in Runnels County, the most male-oriented occupations are Law Enforcement (92.4%), Security & Protection (64.9%), and Food Preparation & Serving (46.5%), while the most female-oriented occupations are Healthcare Support (100.0%), Personal Care & Service (94.8%), and Firefighting & Prevention (75.6%).
| Occupation | Male | Female |
| Healthcare Support | 0 (0.0%) | 147 (100.0%) |
| Security & Protection | 72 (64.9%) | 39 (35.1%) |
| Firefighting & Prevention | 11 (24.4%) | 34 (75.6%) |
| Law Enforcement | 61 (92.4%) | 5 (7.6%) |
| Food Preparation & Serving | 144 (46.5%) | 166 (53.5%) |
| Cleaning & Maintenance | 70 (44.3%) | 88 (55.7%) |
| Personal Care & Service | 3 (5.2%) | 55 (94.8%) |
| Total (Category) | 289 (36.9%) | 495 (63.1%) |
| Total (Overall) | 2,663 (59.8%) | 1,792 (40.2%) |
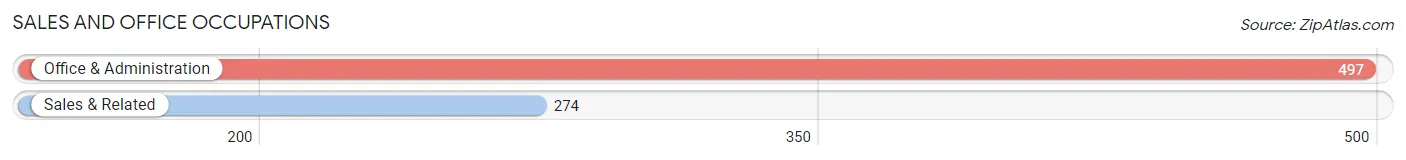
Sales and Office Occupations
The most common Sales and Office occupations in Runnels County are Office & Administration (497 | 11.2%), and Sales & Related (274 | 6.1%).
Sales and Office Occupations by Sex
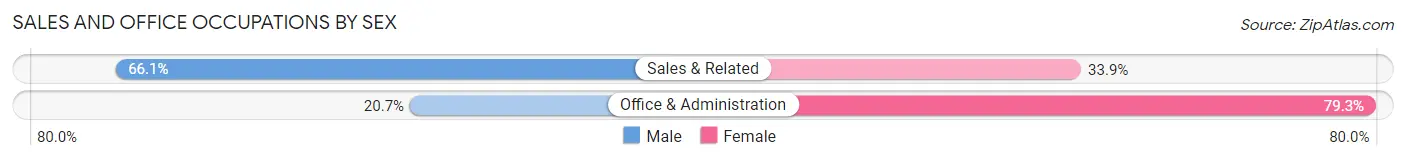
| Occupation | Male | Female |
| Sales & Related | 181 (66.1%) | 93 (33.9%) |
| Office & Administration | 103 (20.7%) | 394 (79.3%) |
| Total (Category) | 284 (36.8%) | 487 (63.2%) |
| Total (Overall) | 2,663 (59.8%) | 1,792 (40.2%) |
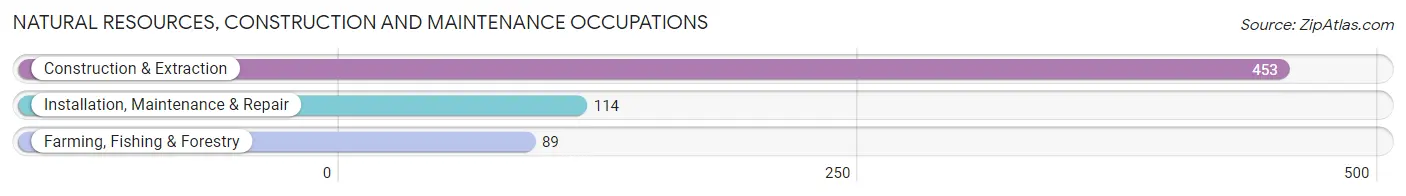
Natural Resources, Construction and Maintenance Occupations
The most common Natural Resources, Construction and Maintenance occupations in Runnels County are Construction & Extraction (453 | 10.2%), Installation, Maintenance & Repair (114 | 2.6%), and Farming, Fishing & Forestry (89 | 2.0%).
Natural Resources, Construction and Maintenance Occupations by Sex
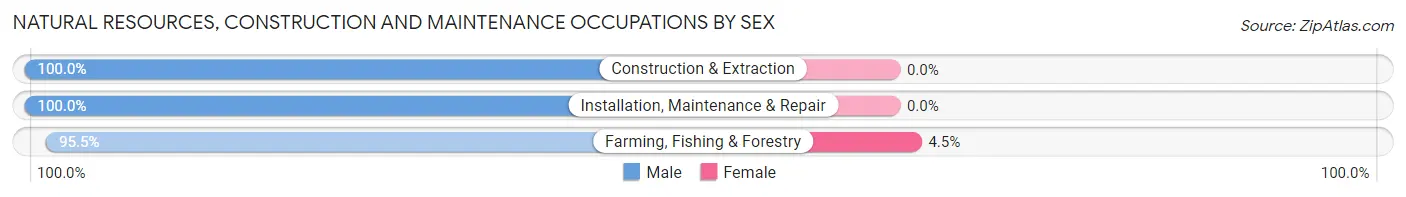
| Occupation | Male | Female |
| Farming, Fishing & Forestry | 85 (95.5%) | 4 (4.5%) |
| Construction & Extraction | 453 (100.0%) | 0 (0.0%) |
| Installation, Maintenance & Repair | 114 (100.0%) | 0 (0.0%) |
| Total (Category) | 652 (99.4%) | 4 (0.6%) |
| Total (Overall) | 2,663 (59.8%) | 1,792 (40.2%) |
Production, Transportation and Moving Occupations
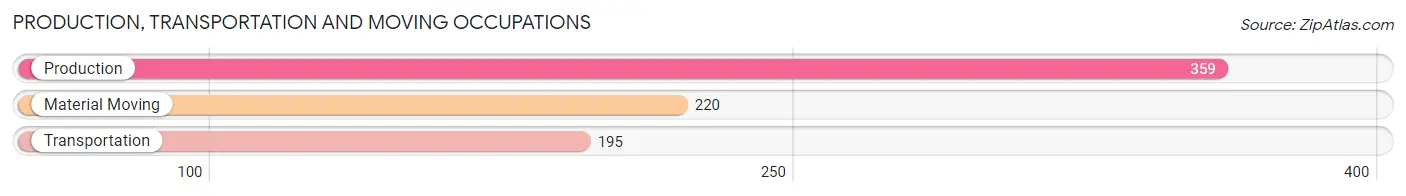
The most common Production, Transportation and Moving occupations in Runnels County are Production (359 | 8.1%), Material Moving (220 | 4.9%), and Transportation (195 | 4.4%).
Production, Transportation and Moving Occupations by Sex
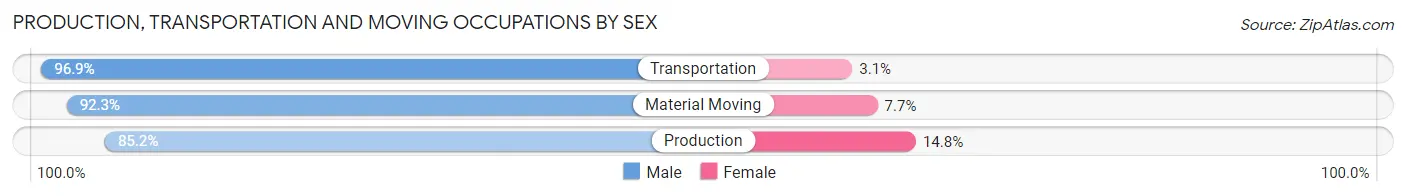
| Occupation | Male | Female |
| Production | 306 (85.2%) | 53 (14.8%) |
| Transportation | 189 (96.9%) | 6 (3.1%) |
| Material Moving | 203 (92.3%) | 17 (7.7%) |
| Total (Category) | 698 (90.2%) | 76 (9.8%) |
| Total (Overall) | 2,663 (59.8%) | 1,792 (40.2%) |
Employment Industries by Sex in Runnels County
Employment Industries in Runnels County
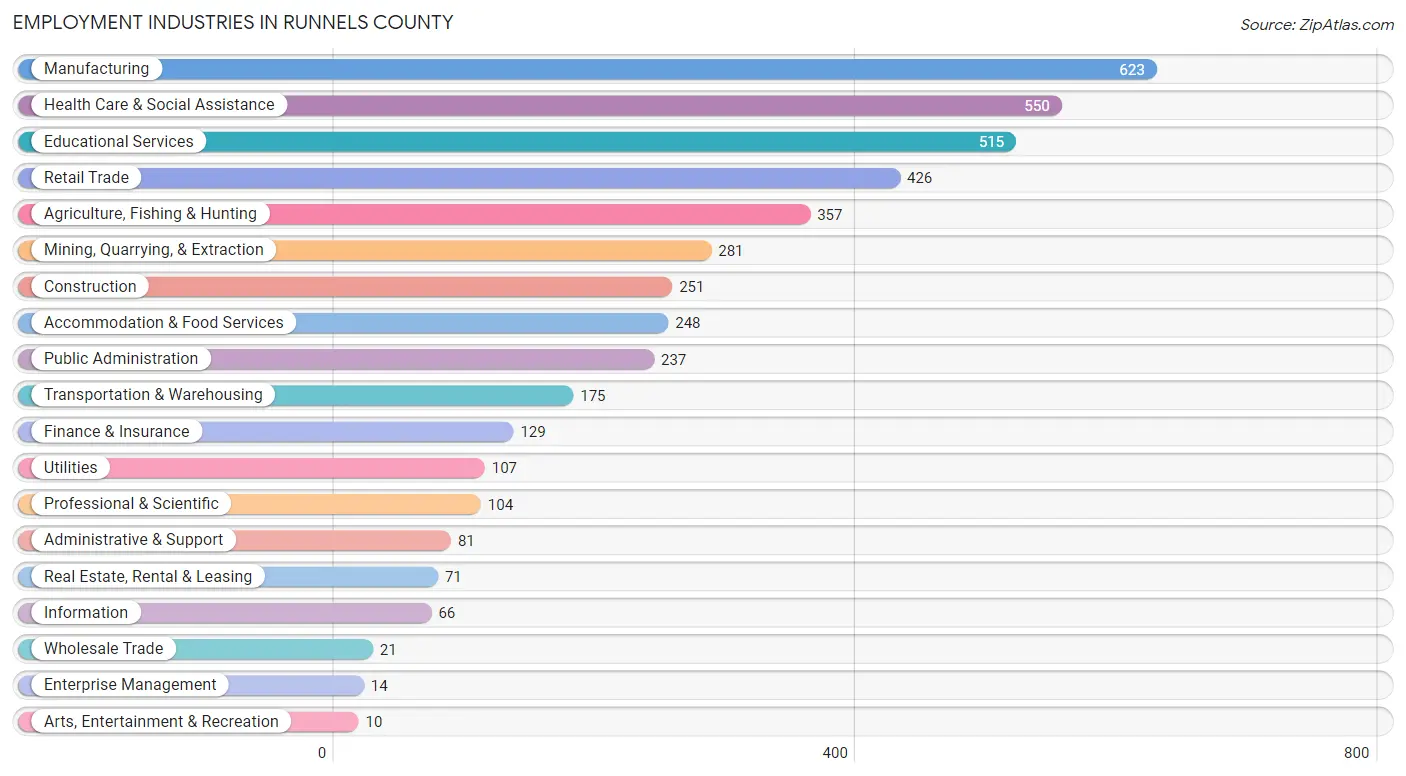
The major employment industries in Runnels County include Manufacturing (623 | 14.0%), Health Care & Social Assistance (550 | 12.3%), Educational Services (515 | 11.6%), Retail Trade (426 | 9.6%), and Agriculture, Fishing & Hunting (357 | 8.0%).
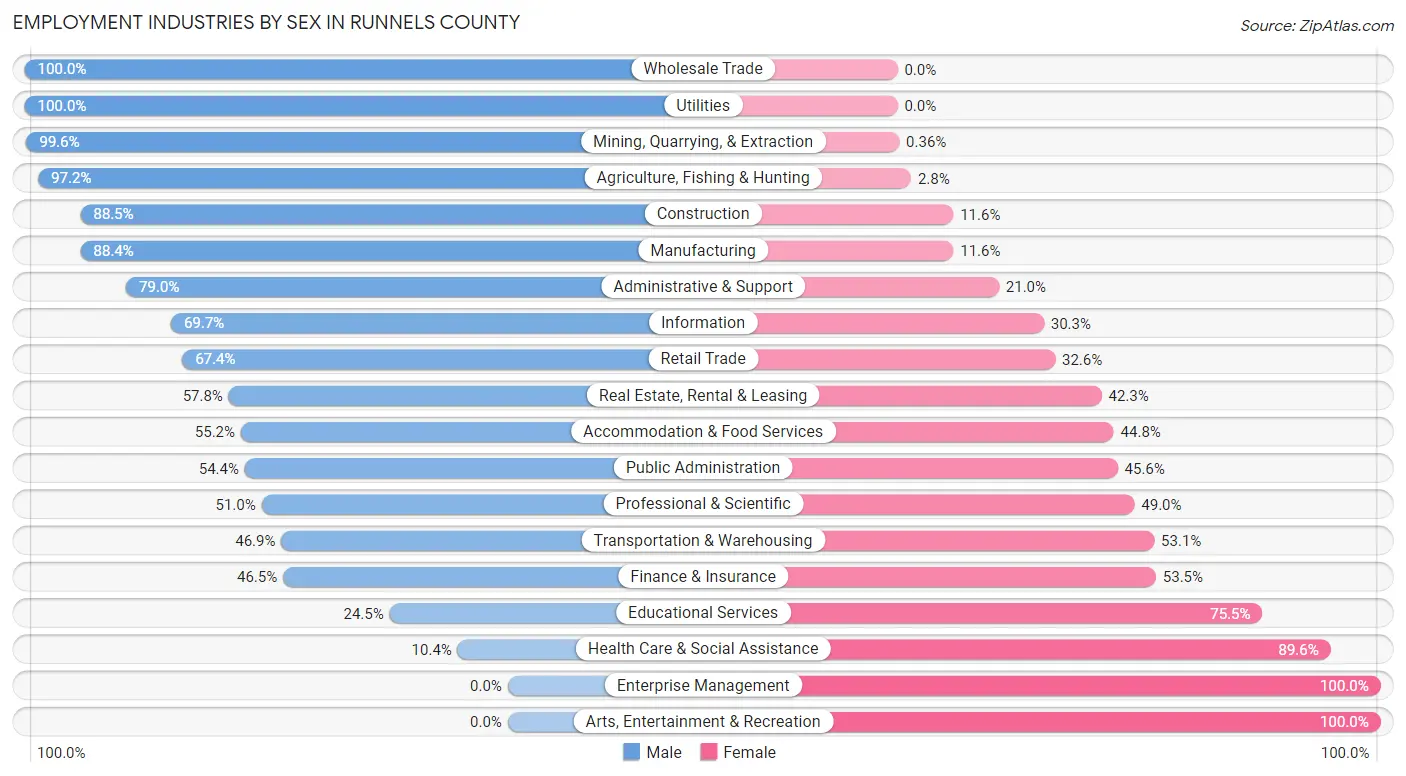
Employment Industries by Sex in Runnels County
The Runnels County industries that see more men than women are Wholesale Trade (100.0%), Utilities (100.0%), and Mining, Quarrying, & Extraction (99.6%), whereas the industries that tend to have a higher number of women are Enterprise Management (100.0%), Arts, Entertainment & Recreation (100.0%), and Health Care & Social Assistance (89.6%).
| Industry | Male | Female |
| Agriculture, Fishing & Hunting | 347 (97.2%) | 10 (2.8%) |
| Mining, Quarrying, & Extraction | 280 (99.6%) | 1 (0.4%) |
| Construction | 222 (88.4%) | 29 (11.6%) |
| Manufacturing | 551 (88.4%) | 72 (11.6%) |
| Wholesale Trade | 21 (100.0%) | 0 (0.0%) |
| Retail Trade | 287 (67.4%) | 139 (32.6%) |
| Transportation & Warehousing | 82 (46.9%) | 93 (53.1%) |
| Utilities | 107 (100.0%) | 0 (0.0%) |
| Information | 46 (69.7%) | 20 (30.3%) |
| Finance & Insurance | 60 (46.5%) | 69 (53.5%) |
| Real Estate, Rental & Leasing | 41 (57.8%) | 30 (42.2%) |
| Professional & Scientific | 53 (51.0%) | 51 (49.0%) |
| Enterprise Management | 0 (0.0%) | 14 (100.0%) |
| Administrative & Support | 64 (79.0%) | 17 (21.0%) |
| Educational Services | 126 (24.5%) | 389 (75.5%) |
| Health Care & Social Assistance | 57 (10.4%) | 493 (89.6%) |
| Arts, Entertainment & Recreation | 0 (0.0%) | 10 (100.0%) |
| Accommodation & Food Services | 137 (55.2%) | 111 (44.8%) |
| Public Administration | 129 (54.4%) | 108 (45.6%) |
| Total | 2,663 (59.8%) | 1,792 (40.2%) |
Education in Runnels County
School Enrollment in Runnels County
The most common levels of schooling among the 2,190 students in Runnels County are elementary school (569 | 26.0%), high school (490 | 22.4%), and middle school (421 | 19.2%).
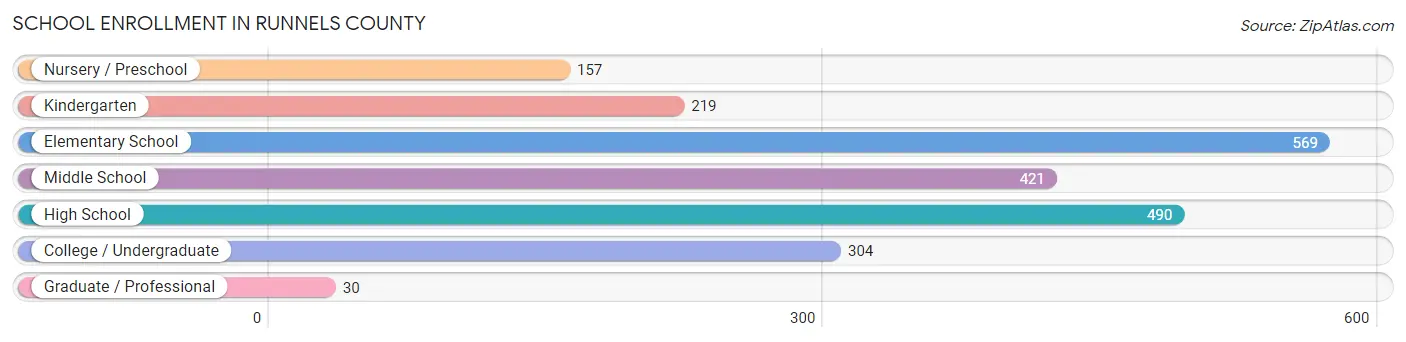
| School Level | # Students | % Students |
| Nursery / Preschool | 157 | 7.2% |
| Kindergarten | 219 | 10.0% |
| Elementary School | 569 | 26.0% |
| Middle School | 421 | 19.2% |
| High School | 490 | 22.4% |
| College / Undergraduate | 304 | 13.9% |
| Graduate / Professional | 30 | 1.4% |
| Total | 2,190 | 100.0% |
School Enrollment by Age by Funding Source in Runnels County
Out of a total of 2,190 students who are enrolled in schools in Runnels County, 206 (9.4%) attend a private institution, while the remaining 1,984 (90.6%) are enrolled in public schools. The age group of 3 to 4 year olds has the highest likelihood of being enrolled in private schools, with 75 (67.0% in the age bracket) enrolled. Conversely, the age group of 20 to 24 year olds has the lowest likelihood of being enrolled in a private school, with 80 (100.0% in the age bracket) attending a public institution.
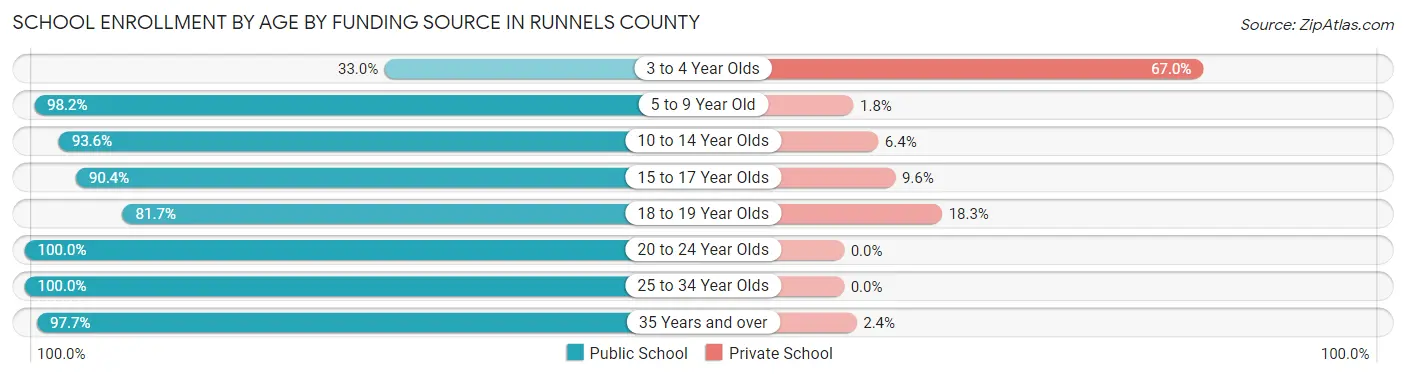
| Age Bracket | Public School | Private School |
| 3 to 4 Year Olds | 37 (33.0%) | 75 (67.0%) |
| 5 to 9 Year Old | 725 (98.2%) | 13 (1.8%) |
| 10 to 14 Year Olds | 528 (93.6%) | 36 (6.4%) |
| 15 to 17 Year Olds | 331 (90.4%) | 35 (9.6%) |
| 18 to 19 Year Olds | 197 (81.7%) | 44 (18.3%) |
| 20 to 24 Year Olds | 80 (100.0%) | 0 (0.0%) |
| 25 to 34 Year Olds | 4 (100.0%) | 0 (0.0%) |
| 35 Years and over | 83 (97.7%) | 2 (2.4%) |
| Total | 1,984 (90.6%) | 206 (9.4%) |
Educational Attainment by Field of Study in Runnels County
Education (385 | 28.9%), bio, nature & agricultural (187 | 14.1%), science & technology (176 | 13.2%), business (160 | 12.0%), and social sciences (85 | 6.4%) are the most common fields of study among 1,331 individuals in Runnels County who have obtained a bachelor's degree or higher.
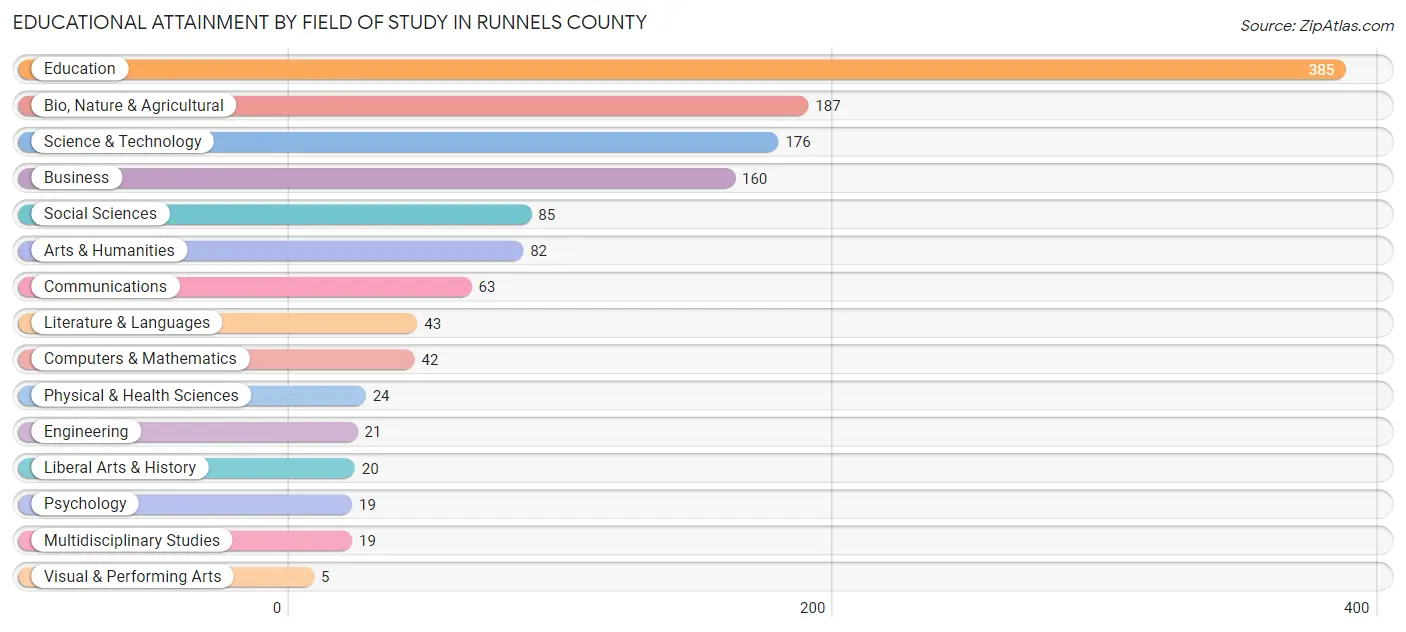
| Field of Study | # Graduates | % Graduates |
| Computers & Mathematics | 42 | 3.2% |
| Bio, Nature & Agricultural | 187 | 14.1% |
| Physical & Health Sciences | 24 | 1.8% |
| Psychology | 19 | 1.4% |
| Social Sciences | 85 | 6.4% |
| Engineering | 21 | 1.6% |
| Multidisciplinary Studies | 19 | 1.4% |
| Science & Technology | 176 | 13.2% |
| Business | 160 | 12.0% |
| Education | 385 | 28.9% |
| Literature & Languages | 43 | 3.2% |
| Liberal Arts & History | 20 | 1.5% |
| Visual & Performing Arts | 5 | 0.4% |
| Communications | 63 | 4.7% |
| Arts & Humanities | 82 | 6.2% |
| Total | 1,331 | 100.0% |
Transportation & Commute in Runnels County
Vehicle Availability by Sex in Runnels County
The most prevalent vehicle ownership categories in Runnels County are males with 2 vehicles (1,206, accounting for 46.2%) and females with 2 vehicles (795, making up 67.3%).
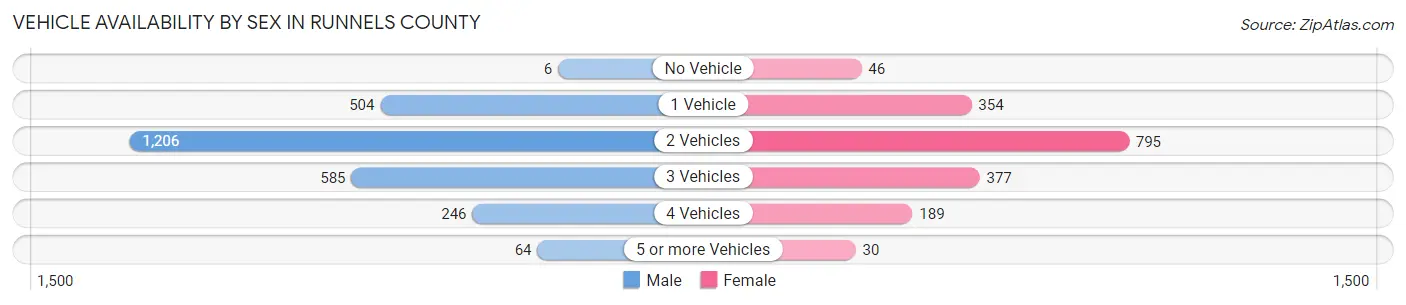
| Vehicles Available | Male | Female |
| No Vehicle | 6 (0.2%) | 46 (2.6%) |
| 1 Vehicle | 504 (19.3%) | 354 (19.8%) |
| 2 Vehicles | 1,206 (46.2%) | 795 (44.4%) |
| 3 Vehicles | 585 (22.4%) | 377 (21.0%) |
| 4 Vehicles | 246 (9.4%) | 189 (10.5%) |
| 5 or more Vehicles | 64 (2.5%) | 30 (1.7%) |
| Total | 2,611 (100.0%) | 1,791 (100.0%) |
Commute Time in Runnels County
The most frequently occuring commute durations in Runnels County are 5 to 9 minutes (914 commuters, 21.5%), 20 to 24 minutes (504 commuters, 11.9%), and 10 to 14 minutes (480 commuters, 11.3%).
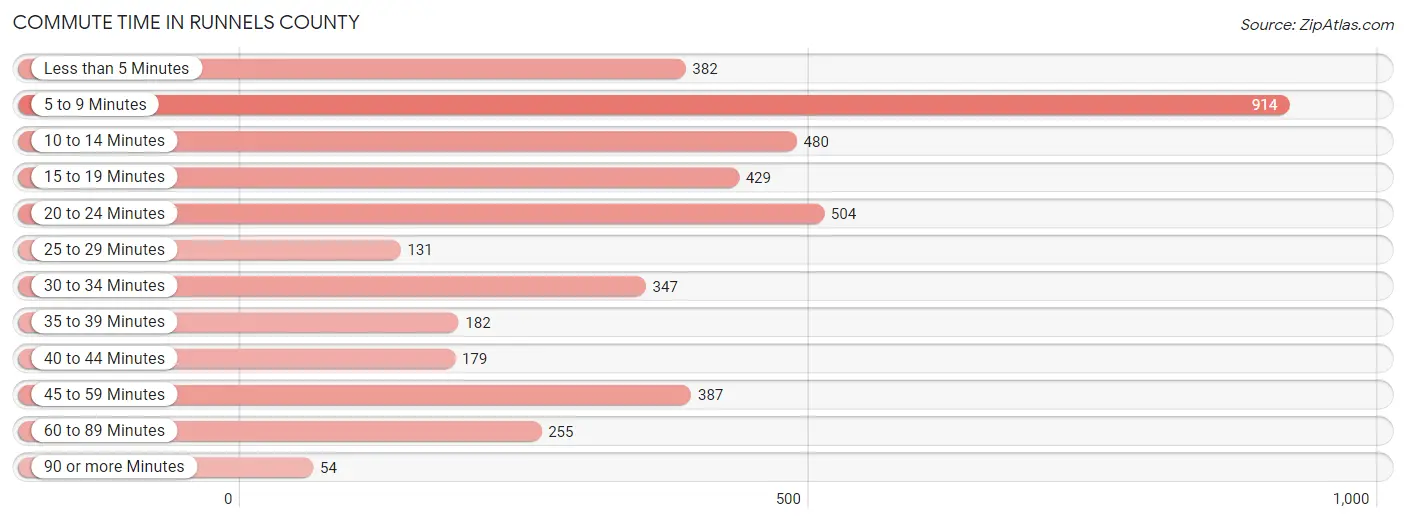
| Commute Time | # Commuters | % Commuters |
| Less than 5 Minutes | 382 | 9.0% |
| 5 to 9 Minutes | 914 | 21.5% |
| 10 to 14 Minutes | 480 | 11.3% |
| 15 to 19 Minutes | 429 | 10.1% |
| 20 to 24 Minutes | 504 | 11.9% |
| 25 to 29 Minutes | 131 | 3.1% |
| 30 to 34 Minutes | 347 | 8.2% |
| 35 to 39 Minutes | 182 | 4.3% |
| 40 to 44 Minutes | 179 | 4.2% |
| 45 to 59 Minutes | 387 | 9.1% |
| 60 to 89 Minutes | 255 | 6.0% |
| 90 or more Minutes | 54 | 1.3% |
Commute Time by Sex in Runnels County
The most common commute times in Runnels County are 5 to 9 minutes (623 commuters, 24.5%) for males and 5 to 9 minutes (291 commuters, 17.1%) for females.
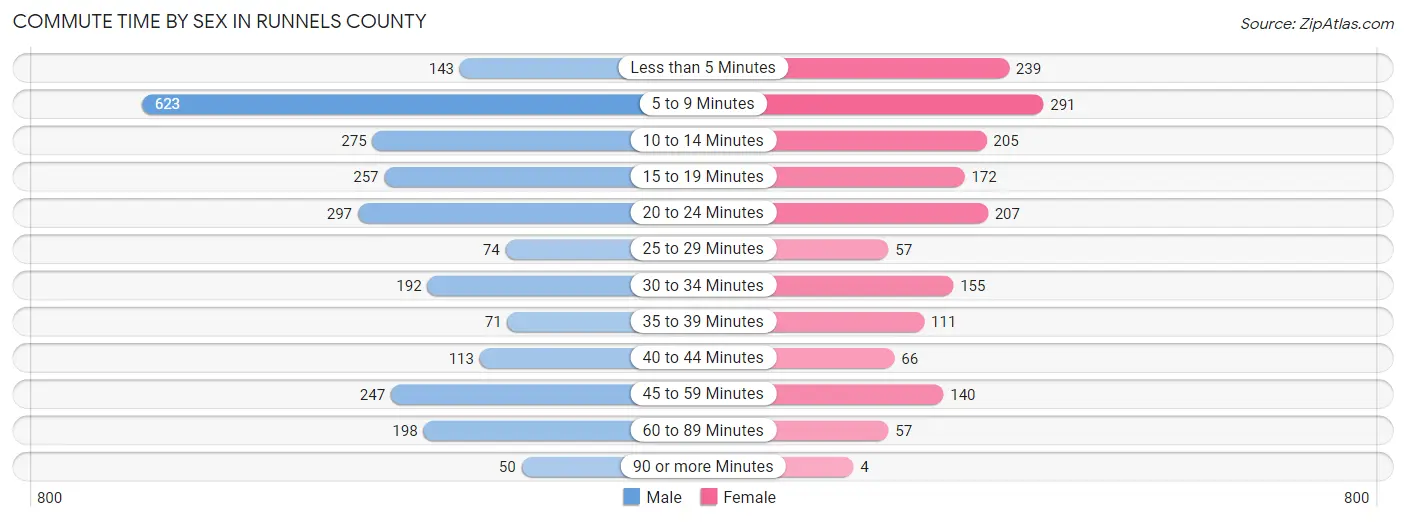
| Commute Time | Male | Female |
| Less than 5 Minutes | 143 (5.6%) | 239 (14.0%) |
| 5 to 9 Minutes | 623 (24.5%) | 291 (17.1%) |
| 10 to 14 Minutes | 275 (10.8%) | 205 (12.0%) |
| 15 to 19 Minutes | 257 (10.1%) | 172 (10.1%) |
| 20 to 24 Minutes | 297 (11.7%) | 207 (12.1%) |
| 25 to 29 Minutes | 74 (2.9%) | 57 (3.4%) |
| 30 to 34 Minutes | 192 (7.6%) | 155 (9.1%) |
| 35 to 39 Minutes | 71 (2.8%) | 111 (6.5%) |
| 40 to 44 Minutes | 113 (4.4%) | 66 (3.9%) |
| 45 to 59 Minutes | 247 (9.7%) | 140 (8.2%) |
| 60 to 89 Minutes | 198 (7.8%) | 57 (3.4%) |
| 90 or more Minutes | 50 (2.0%) | 4 (0.2%) |
Time of Departure to Work by Sex in Runnels County
The most frequent times of departure to work in Runnels County are 7:00 AM to 7:29 AM (509, 20.0%) for males and 7:00 AM to 7:29 AM (395, 23.2%) for females.
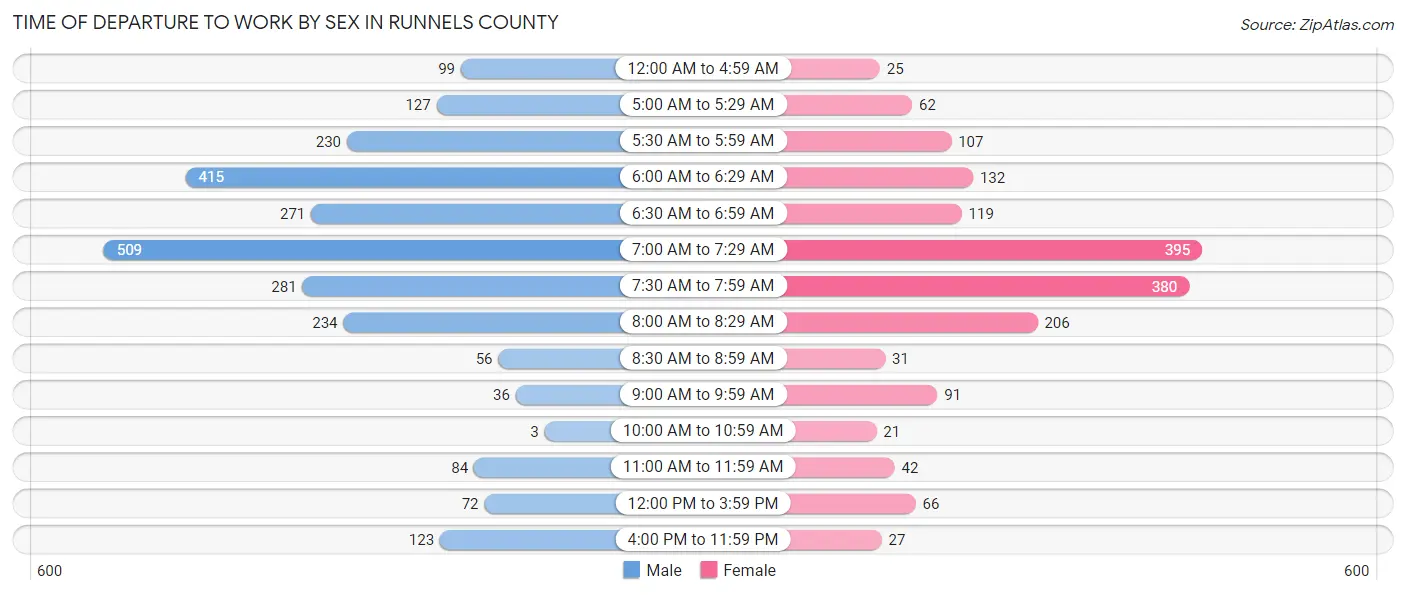
| Time of Departure | Male | Female |
| 12:00 AM to 4:59 AM | 99 (3.9%) | 25 (1.5%) |
| 5:00 AM to 5:29 AM | 127 (5.0%) | 62 (3.6%) |
| 5:30 AM to 5:59 AM | 230 (9.1%) | 107 (6.3%) |
| 6:00 AM to 6:29 AM | 415 (16.3%) | 132 (7.7%) |
| 6:30 AM to 6:59 AM | 271 (10.7%) | 119 (7.0%) |
| 7:00 AM to 7:29 AM | 509 (20.0%) | 395 (23.2%) |
| 7:30 AM to 7:59 AM | 281 (11.1%) | 380 (22.3%) |
| 8:00 AM to 8:29 AM | 234 (9.2%) | 206 (12.1%) |
| 8:30 AM to 8:59 AM | 56 (2.2%) | 31 (1.8%) |
| 9:00 AM to 9:59 AM | 36 (1.4%) | 91 (5.3%) |
| 10:00 AM to 10:59 AM | 3 (0.1%) | 21 (1.2%) |
| 11:00 AM to 11:59 AM | 84 (3.3%) | 42 (2.5%) |
| 12:00 PM to 3:59 PM | 72 (2.8%) | 66 (3.9%) |
| 4:00 PM to 11:59 PM | 123 (4.8%) | 27 (1.6%) |
| Total | 2,540 (100.0%) | 1,704 (100.0%) |
Housing Occupancy in Runnels County
Occupancy by Ownership in Runnels County
Of the total 3,780 dwellings in Runnels County, owner-occupied units account for 2,907 (76.9%), while renter-occupied units make up 873 (23.1%).
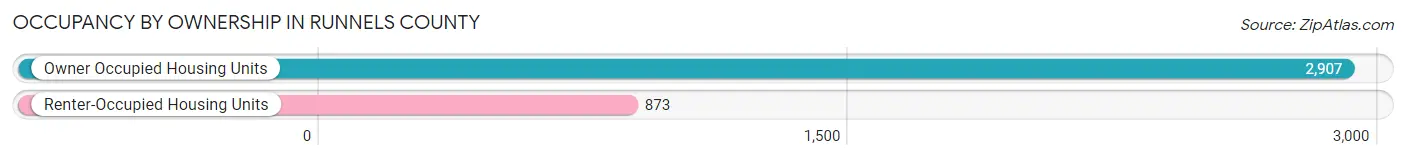
| Occupancy | # Housing Units | % Housing Units |
| Owner Occupied Housing Units | 2,907 | 76.9% |
| Renter-Occupied Housing Units | 873 | 23.1% |
| Total Occupied Housing Units | 3,780 | 100.0% |
Occupancy by Household Size in Runnels County
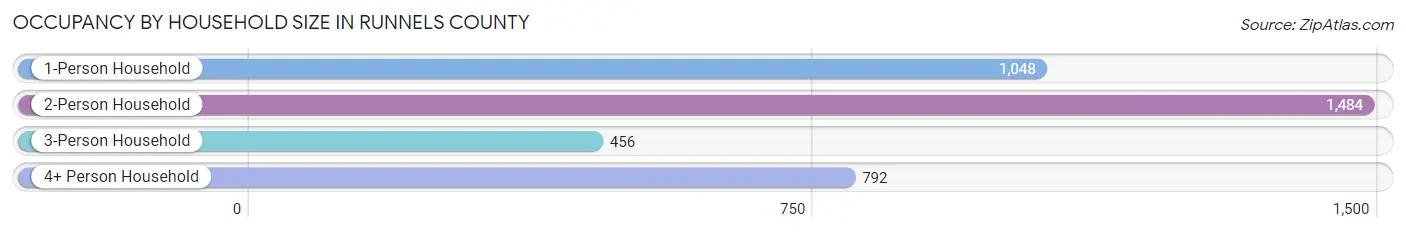
| Household Size | # Housing Units | % Housing Units |
| 1-Person Household | 1,048 | 27.7% |
| 2-Person Household | 1,484 | 39.3% |
| 3-Person Household | 456 | 12.1% |
| 4+ Person Household | 792 | 20.9% |
| Total Housing Units | 3,780 | 100.0% |
Occupancy by Ownership by Household Size in Runnels County
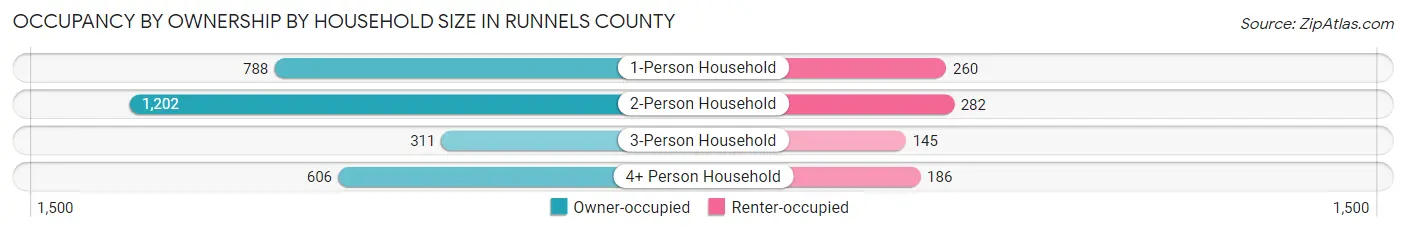
| Household Size | Owner-occupied | Renter-occupied |
| 1-Person Household | 788 (75.2%) | 260 (24.8%) |
| 2-Person Household | 1,202 (81.0%) | 282 (19.0%) |
| 3-Person Household | 311 (68.2%) | 145 (31.8%) |
| 4+ Person Household | 606 (76.5%) | 186 (23.5%) |
| Total Housing Units | 2,907 (76.9%) | 873 (23.1%) |
Occupancy by Educational Attainment in Runnels County
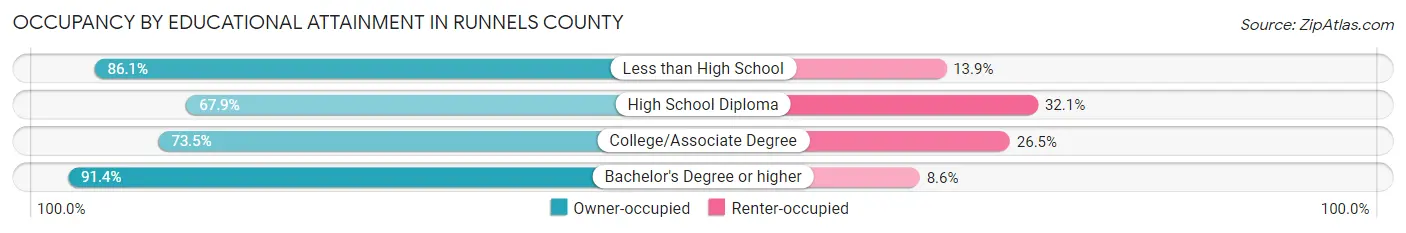
| Household Size | Owner-occupied | Renter-occupied |
| Less than High School | 440 (86.1%) | 71 (13.9%) |
| High School Diploma | 904 (67.9%) | 427 (32.1%) |
| College/Associate Degree | 854 (73.5%) | 308 (26.5%) |
| Bachelor's Degree or higher | 709 (91.4%) | 67 (8.6%) |
Occupancy by Age of Householder in Runnels County
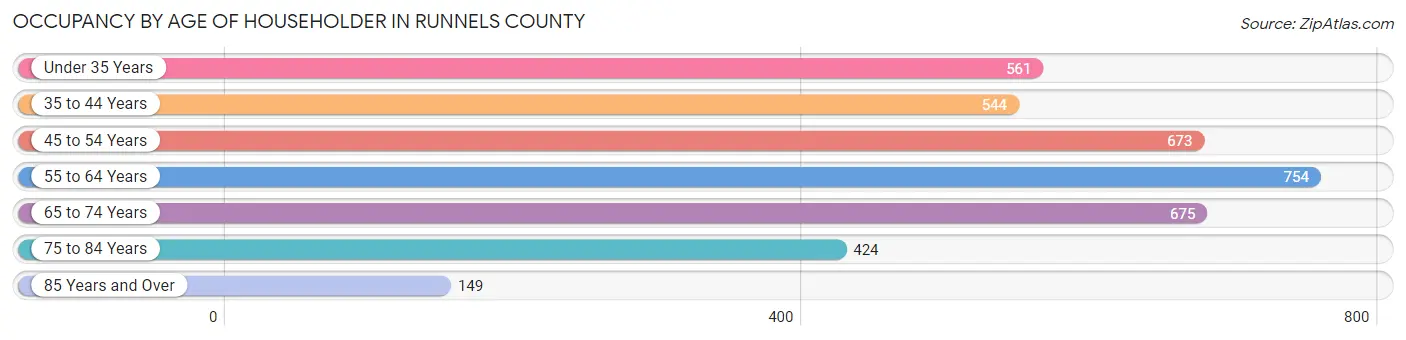
| Age Bracket | # Households | % Households |
| Under 35 Years | 561 | 14.8% |
| 35 to 44 Years | 544 | 14.4% |
| 45 to 54 Years | 673 | 17.8% |
| 55 to 64 Years | 754 | 20.0% |
| 65 to 74 Years | 675 | 17.9% |
| 75 to 84 Years | 424 | 11.2% |
| 85 Years and Over | 149 | 3.9% |
| Total | 3,780 | 100.0% |
Housing Finances in Runnels County
Median Income by Occupancy in Runnels County
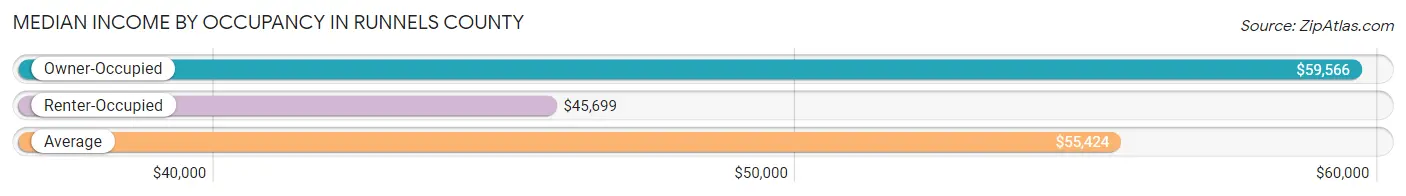
| Occupancy Type | # Households | Median Income |
| Owner-Occupied | 2,907 (76.9%) | $59,566 |
| Renter-Occupied | 873 (23.1%) | $45,699 |
| Average | 3,780 (100.0%) | $55,424 |
Occupancy by Householder Income Bracket in Runnels County
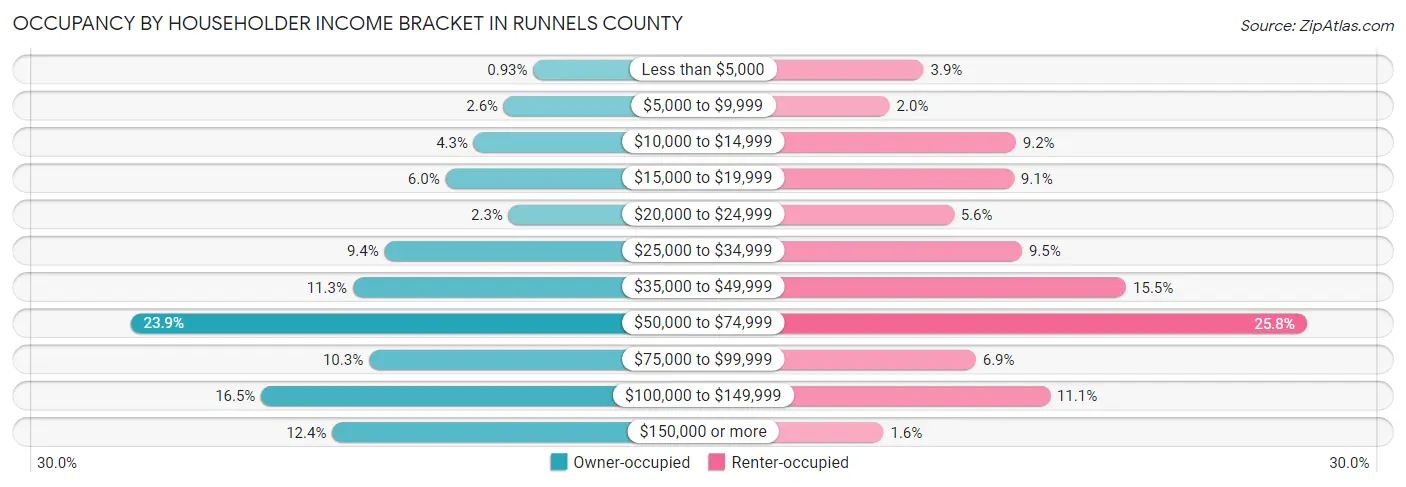
| Income Bracket | Owner-occupied | Renter-occupied |
| Less than $5,000 | 27 (0.9%) | 34 (3.9%) |
| $5,000 to $9,999 | 76 (2.6%) | 17 (1.9%) |
| $10,000 to $14,999 | 126 (4.3%) | 80 (9.2%) |
| $15,000 to $19,999 | 173 (5.9%) | 79 (9.0%) |
| $20,000 to $24,999 | 68 (2.3%) | 49 (5.6%) |
| $25,000 to $34,999 | 274 (9.4%) | 83 (9.5%) |
| $35,000 to $49,999 | 327 (11.3%) | 135 (15.5%) |
| $50,000 to $74,999 | 696 (23.9%) | 225 (25.8%) |
| $75,000 to $99,999 | 300 (10.3%) | 60 (6.9%) |
| $100,000 to $149,999 | 479 (16.5%) | 97 (11.1%) |
| $150,000 or more | 361 (12.4%) | 14 (1.6%) |
| Total | 2,907 (100.0%) | 873 (100.0%) |
Monthly Housing Cost Tiers in Runnels County
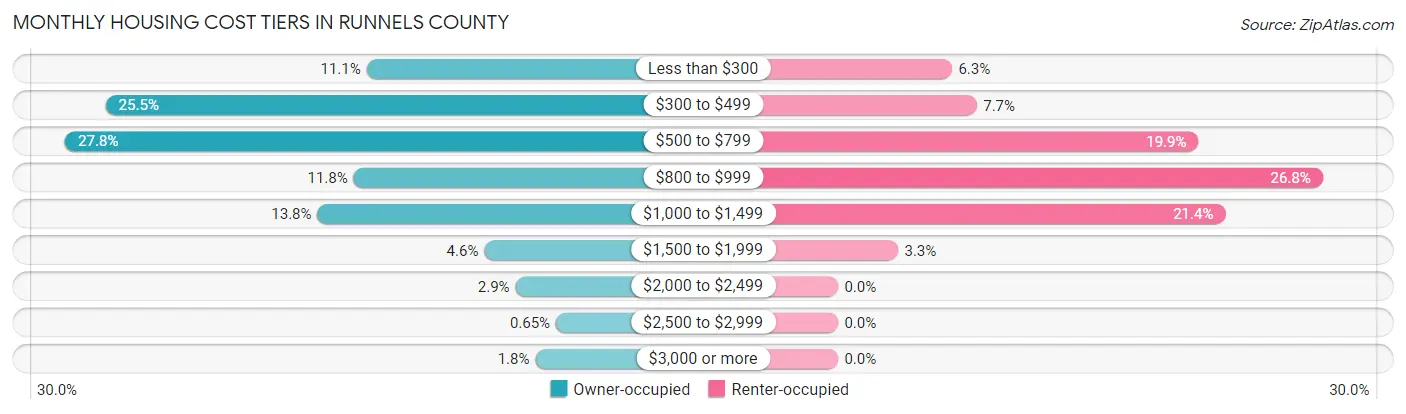
| Monthly Cost | Owner-occupied | Renter-occupied |
| Less than $300 | 323 (11.1%) | 55 (6.3%) |
| $300 to $499 | 742 (25.5%) | 67 (7.7%) |
| $500 to $799 | 807 (27.8%) | 174 (19.9%) |
| $800 to $999 | 344 (11.8%) | 234 (26.8%) |
| $1,000 to $1,499 | 402 (13.8%) | 187 (21.4%) |
| $1,500 to $1,999 | 134 (4.6%) | 29 (3.3%) |
| $2,000 to $2,499 | 84 (2.9%) | 0 (0.0%) |
| $2,500 to $2,999 | 19 (0.6%) | 0 (0.0%) |
| $3,000 or more | 52 (1.8%) | 0 (0.0%) |
| Total | 2,907 (100.0%) | 873 (100.0%) |
Physical Housing Characteristics in Runnels County
Housing Structures in Runnels County
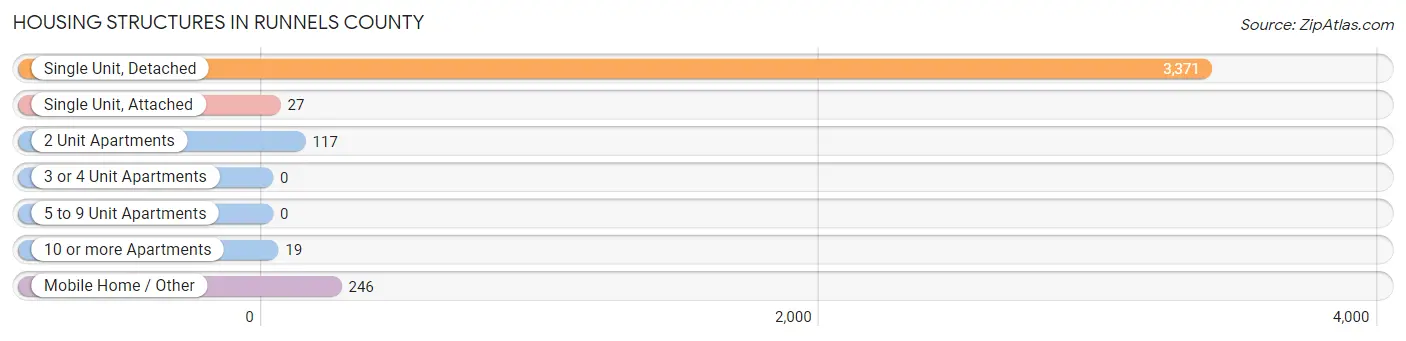
| Structure Type | # Housing Units | % Housing Units |
| Single Unit, Detached | 3,371 | 89.2% |
| Single Unit, Attached | 27 | 0.7% |
| 2 Unit Apartments | 117 | 3.1% |
| 3 or 4 Unit Apartments | 0 | 0.0% |
| 5 to 9 Unit Apartments | 0 | 0.0% |
| 10 or more Apartments | 19 | 0.5% |
| Mobile Home / Other | 246 | 6.5% |
| Total | 3,780 | 100.0% |
Housing Structures by Occupancy in Runnels County
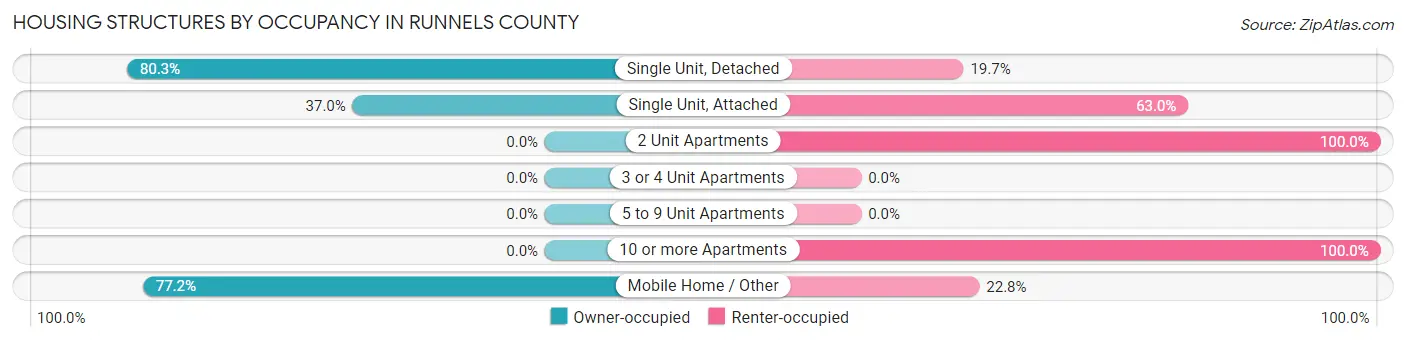
| Structure Type | Owner-occupied | Renter-occupied |
| Single Unit, Detached | 2,707 (80.3%) | 664 (19.7%) |
| Single Unit, Attached | 10 (37.0%) | 17 (63.0%) |
| 2 Unit Apartments | 0 (0.0%) | 117 (100.0%) |
| 3 or 4 Unit Apartments | 0 (0.0%) | 0 (0.0%) |
| 5 to 9 Unit Apartments | 0 (0.0%) | 0 (0.0%) |
| 10 or more Apartments | 0 (0.0%) | 19 (100.0%) |
| Mobile Home / Other | 190 (77.2%) | 56 (22.8%) |
| Total | 2,907 (76.9%) | 873 (23.1%) |
Housing Structures by Number of Rooms in Runnels County
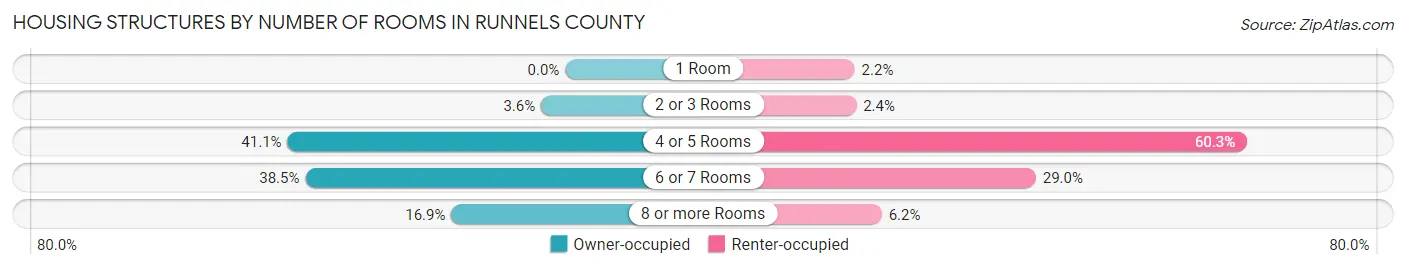
| Number of Rooms | Owner-occupied | Renter-occupied |
| 1 Room | 0 (0.0%) | 19 (2.2%) |
| 2 or 3 Rooms | 104 (3.6%) | 21 (2.4%) |
| 4 or 5 Rooms | 1,195 (41.1%) | 526 (60.3%) |
| 6 or 7 Rooms | 1,118 (38.5%) | 253 (29.0%) |
| 8 or more Rooms | 490 (16.9%) | 54 (6.2%) |
| Total | 2,907 (100.0%) | 873 (100.0%) |
Housing Structure by Heating Type in Runnels County
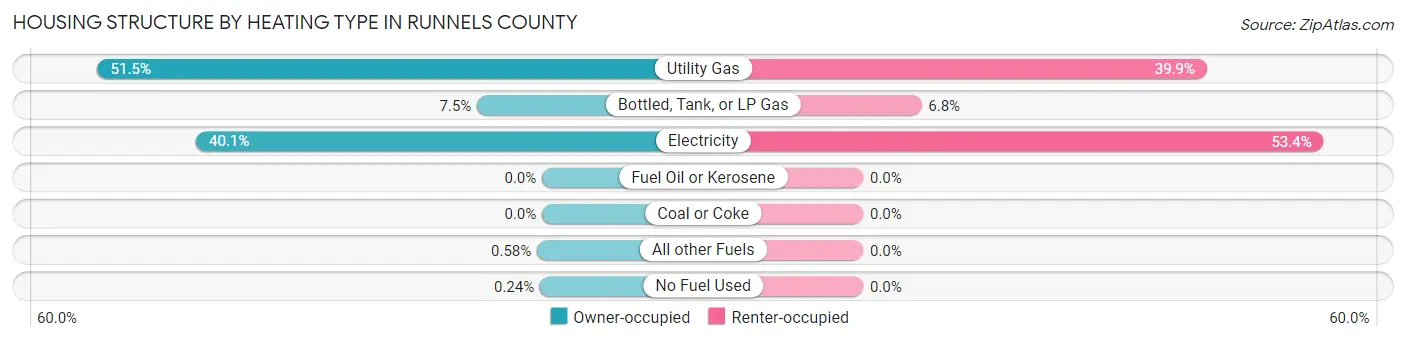
| Heating Type | Owner-occupied | Renter-occupied |
| Utility Gas | 1,498 (51.5%) | 348 (39.9%) |
| Bottled, Tank, or LP Gas | 219 (7.5%) | 59 (6.8%) |
| Electricity | 1,166 (40.1%) | 466 (53.4%) |
| Fuel Oil or Kerosene | 0 (0.0%) | 0 (0.0%) |
| Coal or Coke | 0 (0.0%) | 0 (0.0%) |
| All other Fuels | 17 (0.6%) | 0 (0.0%) |
| No Fuel Used | 7 (0.2%) | 0 (0.0%) |
| Total | 2,907 (100.0%) | 873 (100.0%) |
Household Vehicle Usage in Runnels County
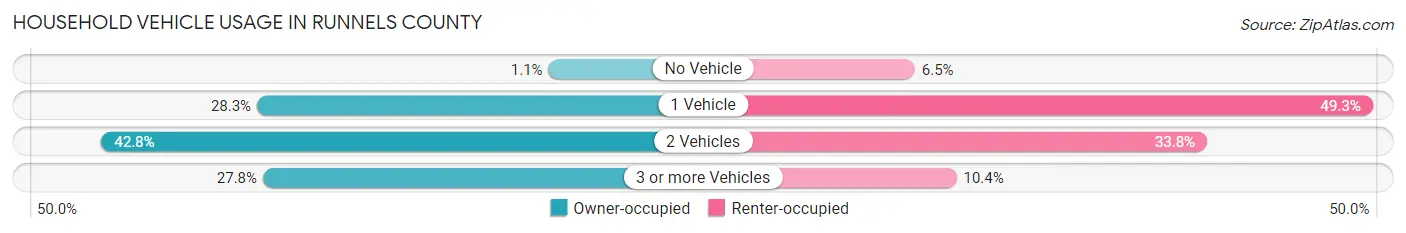
| Vehicles per Household | Owner-occupied | Renter-occupied |
| No Vehicle | 32 (1.1%) | 57 (6.5%) |
| 1 Vehicle | 823 (28.3%) | 430 (49.3%) |
| 2 Vehicles | 1,245 (42.8%) | 295 (33.8%) |
| 3 or more Vehicles | 807 (27.8%) | 91 (10.4%) |
| Total | 2,907 (100.0%) | 873 (100.0%) |
Real Estate & Mortgages in Runnels County
Real Estate and Mortgage Overview in Runnels County
| Characteristic | Without Mortgage | With Mortgage |
| Housing Units | 1,932 | 975 |
| Median Property Value | $74,000 | $115,500 |
| Median Household Income | $52,500 | $223 |
| Monthly Housing Costs | $468 | $52 |
| Real Estate Taxes | $1,205 | $32 |
Property Value by Mortgage Status in Runnels County
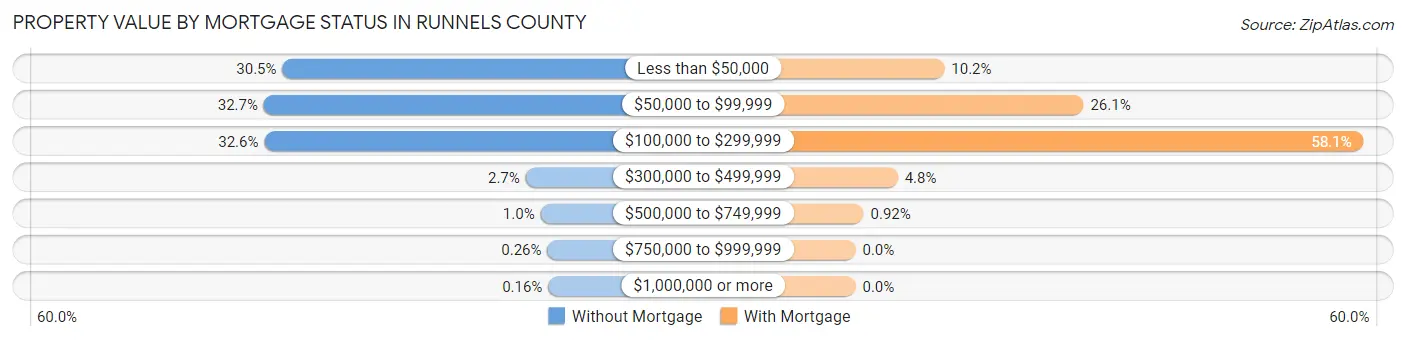
| Property Value | Without Mortgage | With Mortgage |
| Less than $50,000 | 590 (30.5%) | 99 (10.2%) |
| $50,000 to $99,999 | 631 (32.7%) | 254 (26.1%) |
| $100,000 to $299,999 | 630 (32.6%) | 566 (58.1%) |
| $300,000 to $499,999 | 53 (2.7%) | 47 (4.8%) |
| $500,000 to $749,999 | 20 (1.0%) | 9 (0.9%) |
| $750,000 to $999,999 | 5 (0.3%) | 0 (0.0%) |
| $1,000,000 or more | 3 (0.2%) | 0 (0.0%) |
| Total | 1,932 (100.0%) | 975 (100.0%) |
Household Income by Mortgage Status in Runnels County
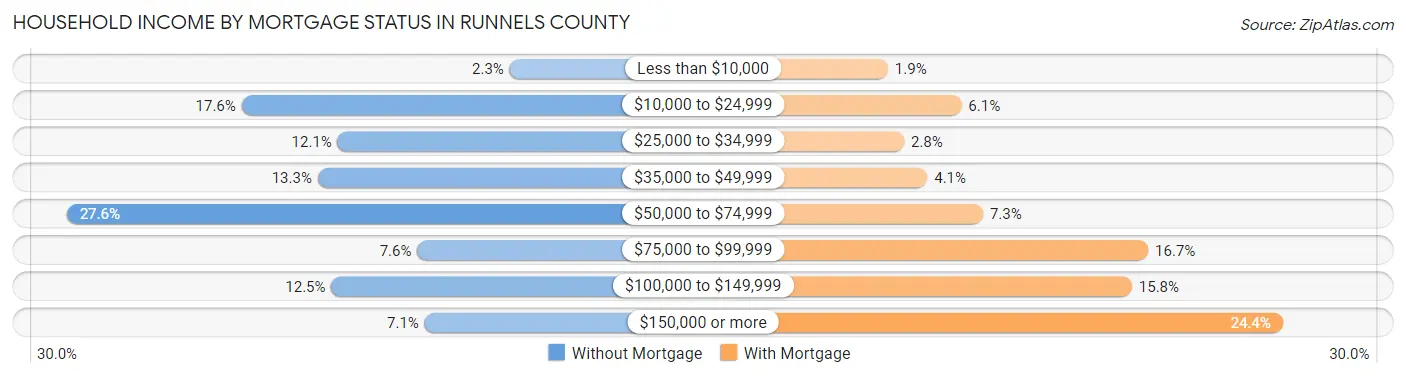
| Household Income | Without Mortgage | With Mortgage |
| Less than $10,000 | 44 (2.3%) | 18 (1.8%) |
| $10,000 to $24,999 | 340 (17.6%) | 59 (6.0%) |
| $25,000 to $34,999 | 234 (12.1%) | 27 (2.8%) |
| $35,000 to $49,999 | 256 (13.3%) | 40 (4.1%) |
| $50,000 to $74,999 | 533 (27.6%) | 71 (7.3%) |
| $75,000 to $99,999 | 146 (7.6%) | 163 (16.7%) |
| $100,000 to $149,999 | 241 (12.5%) | 154 (15.8%) |
| $150,000 or more | 138 (7.1%) | 238 (24.4%) |
| Total | 1,932 (100.0%) | 975 (100.0%) |
Property Value to Household Income Ratio in Runnels County
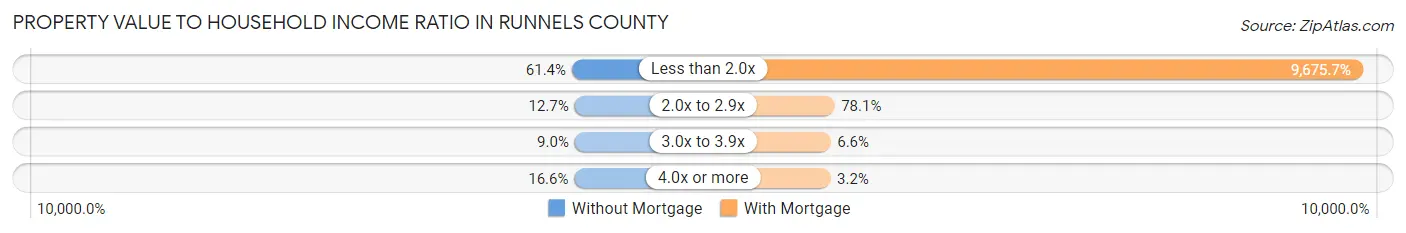
| Value-to-Income Ratio | Without Mortgage | With Mortgage |
| Less than 2.0x | 1,187 (61.4%) | 94,338 (9,675.7%) |
| 2.0x to 2.9x | 245 (12.7%) | 761 (78.0%) |
| 3.0x to 3.9x | 173 (8.9%) | 64 (6.6%) |
| 4.0x or more | 320 (16.6%) | 31 (3.2%) |
| Total | 1,932 (100.0%) | 975 (100.0%) |
Real Estate Taxes by Mortgage Status in Runnels County
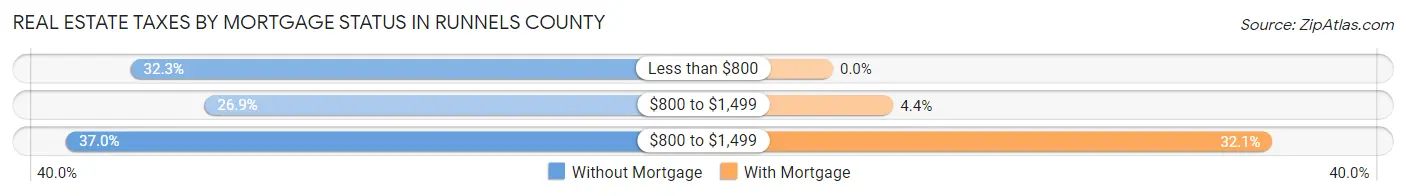
| Property Taxes | Without Mortgage | With Mortgage |
| Less than $800 | 623 (32.3%) | 0 (0.0%) |
| $800 to $1,499 | 519 (26.9%) | 43 (4.4%) |
| $800 to $1,499 | 714 (37.0%) | 313 (32.1%) |
| Total | 1,932 (100.0%) | 975 (100.0%) |
Health & Disability in Runnels County
Health Insurance Coverage by Age in Runnels County
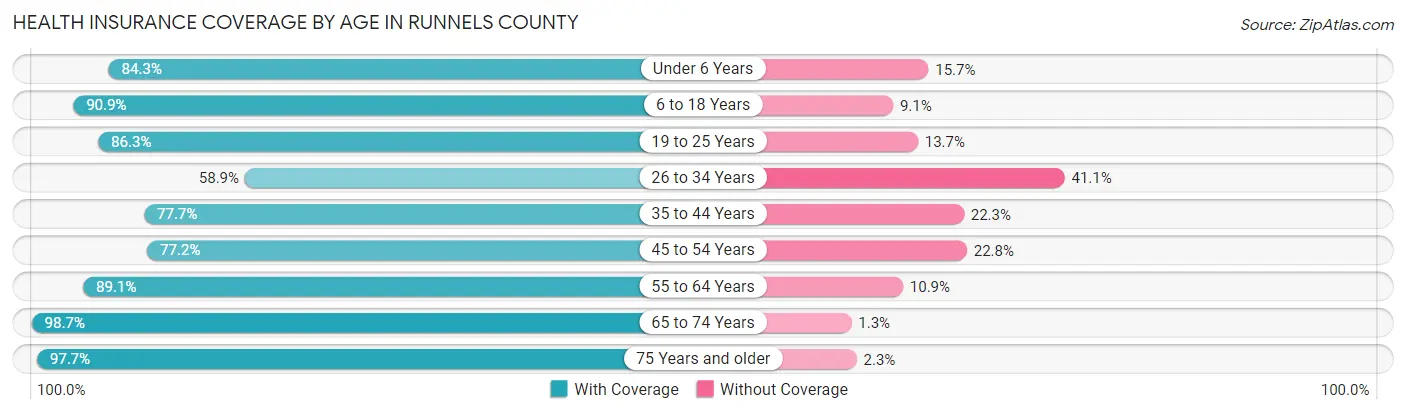
| Age Bracket | With Coverage | Without Coverage |
| Under 6 Years | 598 (84.3%) | 111 (15.7%) |
| 6 to 18 Years | 1,635 (90.9%) | 163 (9.1%) |
| 19 to 25 Years | 510 (86.3%) | 81 (13.7%) |
| 26 to 34 Years | 631 (58.9%) | 440 (41.1%) |
| 35 to 44 Years | 847 (77.7%) | 243 (22.3%) |
| 45 to 54 Years | 929 (77.2%) | 275 (22.8%) |
| 55 to 64 Years | 1,150 (89.1%) | 141 (10.9%) |
| 65 to 74 Years | 1,051 (98.7%) | 14 (1.3%) |
| 75 Years and older | 809 (97.7%) | 19 (2.3%) |
| Total | 8,160 (84.6%) | 1,487 (15.4%) |
Health Insurance Coverage by Citizenship Status in Runnels County
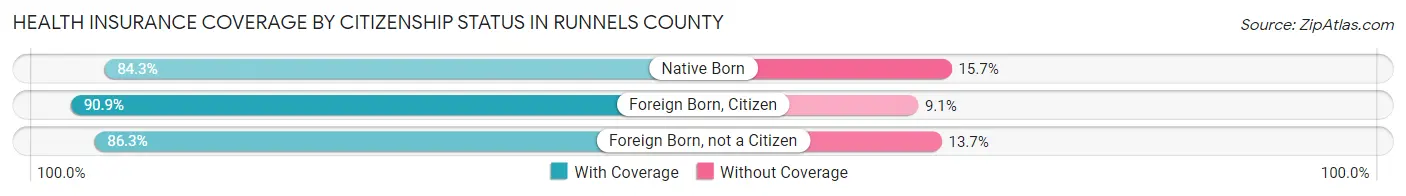
| Citizenship Status | With Coverage | Without Coverage |
| Native Born | 598 (84.3%) | 111 (15.7%) |
| Foreign Born, Citizen | 1,635 (90.9%) | 163 (9.1%) |
| Foreign Born, not a Citizen | 510 (86.3%) | 81 (13.7%) |
Health Insurance Coverage by Household Income in Runnels County
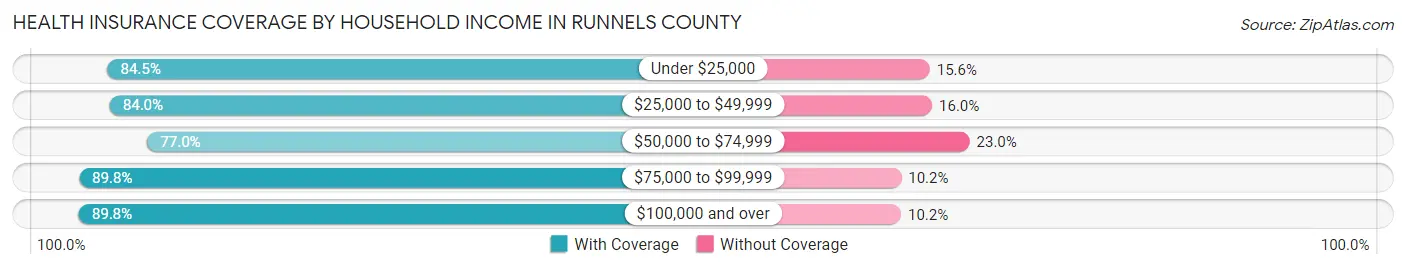
| Household Income | With Coverage | Without Coverage |
| Under $25,000 | 1,021 (84.5%) | 188 (15.5%) |
| $25,000 to $49,999 | 1,509 (84.0%) | 287 (16.0%) |
| $50,000 to $74,999 | 2,018 (77.0%) | 603 (23.0%) |
| $75,000 to $99,999 | 765 (89.8%) | 87 (10.2%) |
| $100,000 and over | 2,843 (89.8%) | 322 (10.2%) |
Public vs Private Health Insurance Coverage by Age in Runnels County
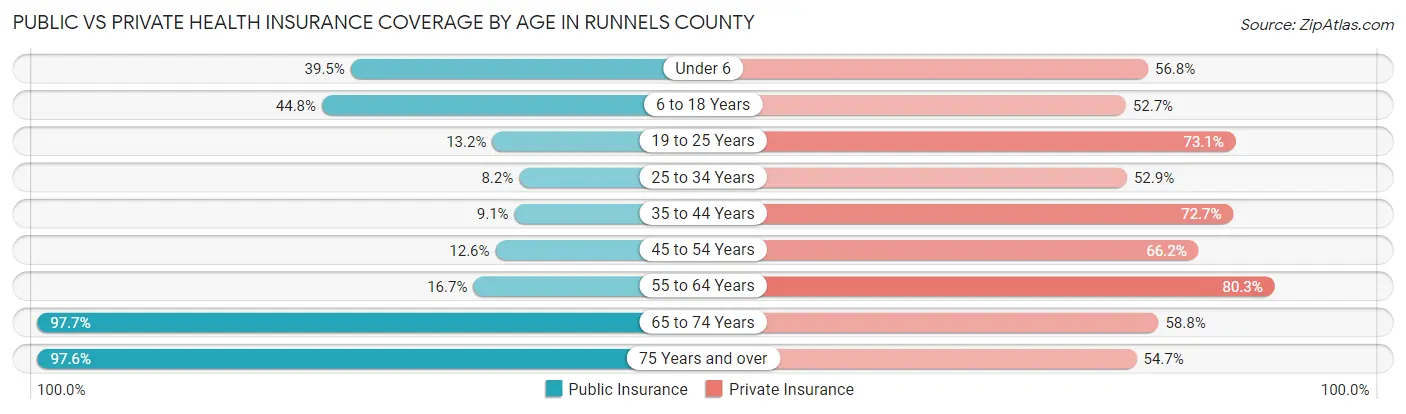
| Age Bracket | Public Insurance | Private Insurance |
| Under 6 | 280 (39.5%) | 403 (56.8%) |
| 6 to 18 Years | 806 (44.8%) | 948 (52.7%) |
| 19 to 25 Years | 78 (13.2%) | 432 (73.1%) |
| 25 to 34 Years | 88 (8.2%) | 567 (52.9%) |
| 35 to 44 Years | 99 (9.1%) | 792 (72.7%) |
| 45 to 54 Years | 152 (12.6%) | 797 (66.2%) |
| 55 to 64 Years | 216 (16.7%) | 1,037 (80.3%) |
| 65 to 74 Years | 1,040 (97.7%) | 626 (58.8%) |
| 75 Years and over | 808 (97.6%) | 453 (54.7%) |
| Total | 3,567 (37.0%) | 6,055 (62.8%) |
Disability Status by Sex by Age in Runnels County
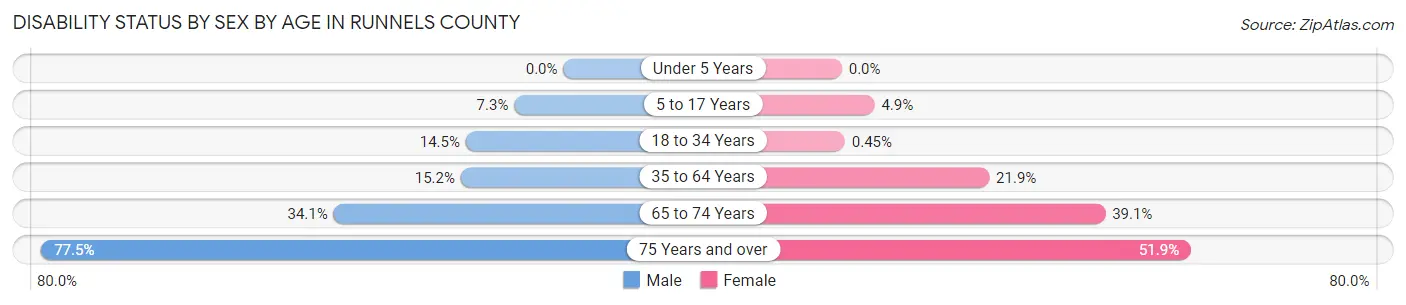
| Age Bracket | Male | Female |
| Under 5 Years | 0 (0.0%) | 0 (0.0%) |
| 5 to 17 Years | 62 (7.3%) | 44 (4.9%) |
| 18 to 34 Years | 140 (14.5%) | 4 (0.4%) |
| 35 to 64 Years | 278 (15.2%) | 385 (21.9%) |
| 65 to 74 Years | 188 (34.1%) | 201 (39.1%) |
| 75 Years and over | 307 (77.5%) | 224 (51.8%) |
Disability Class by Sex by Age in Runnels County
Disability Class: Hearing Difficulty
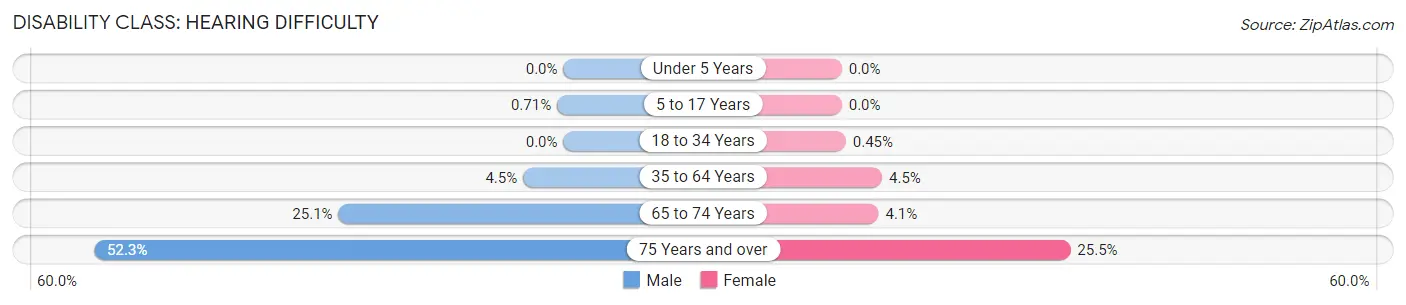
| Age Bracket | Male | Female |
| Under 5 Years | 0 (0.0%) | 0 (0.0%) |
| 5 to 17 Years | 6 (0.7%) | 0 (0.0%) |
| 18 to 34 Years | 0 (0.0%) | 4 (0.4%) |
| 35 to 64 Years | 82 (4.5%) | 79 (4.5%) |
| 65 to 74 Years | 138 (25.1%) | 21 (4.1%) |
| 75 Years and over | 207 (52.3%) | 110 (25.5%) |
Disability Class: Vision Difficulty
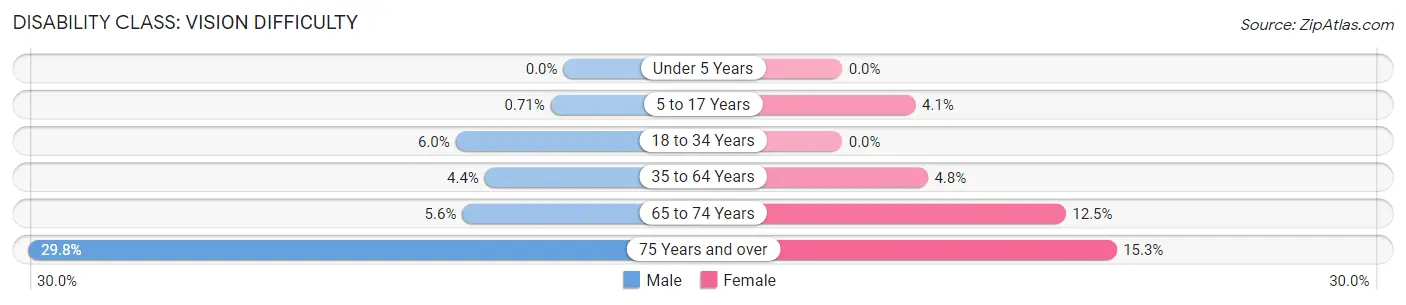
| Age Bracket | Male | Female |
| Under 5 Years | 0 (0.0%) | 0 (0.0%) |
| 5 to 17 Years | 6 (0.7%) | 37 (4.1%) |
| 18 to 34 Years | 58 (6.0%) | 0 (0.0%) |
| 35 to 64 Years | 80 (4.4%) | 84 (4.8%) |
| 65 to 74 Years | 31 (5.6%) | 64 (12.4%) |
| 75 Years and over | 118 (29.8%) | 66 (15.3%) |
Disability Class: Cognitive Difficulty
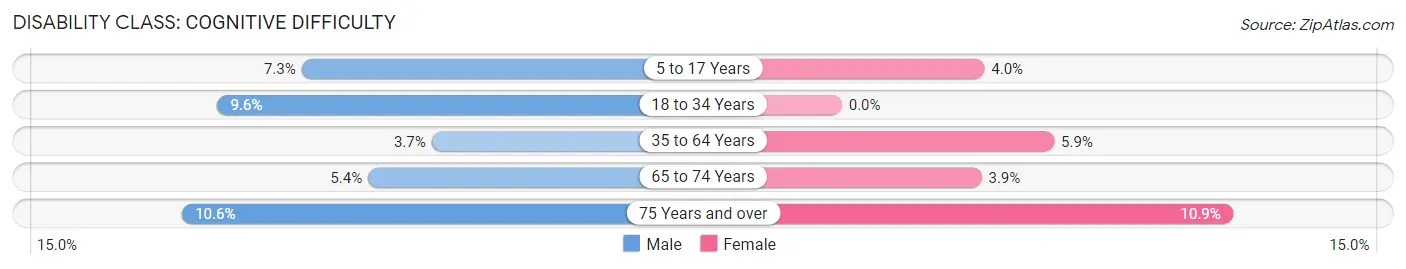
| Age Bracket | Male | Female |
| 5 to 17 Years | 62 (7.3%) | 36 (4.0%) |
| 18 to 34 Years | 93 (9.6%) | 0 (0.0%) |
| 35 to 64 Years | 67 (3.7%) | 104 (5.9%) |
| 65 to 74 Years | 30 (5.4%) | 20 (3.9%) |
| 75 Years and over | 42 (10.6%) | 47 (10.9%) |
Disability Class: Ambulatory Difficulty
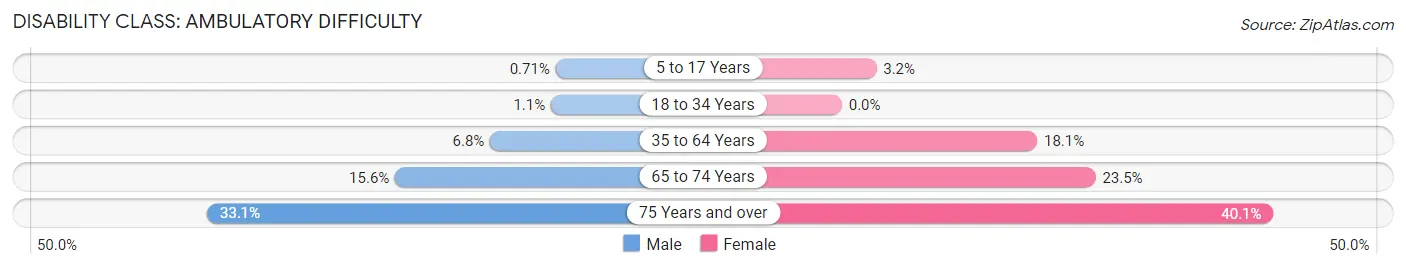
| Age Bracket | Male | Female |
| 5 to 17 Years | 6 (0.7%) | 29 (3.2%) |
| 18 to 34 Years | 11 (1.1%) | 0 (0.0%) |
| 35 to 64 Years | 124 (6.8%) | 319 (18.1%) |
| 65 to 74 Years | 86 (15.6%) | 121 (23.5%) |
| 75 Years and over | 131 (33.1%) | 173 (40.1%) |
Disability Class: Self-Care Difficulty
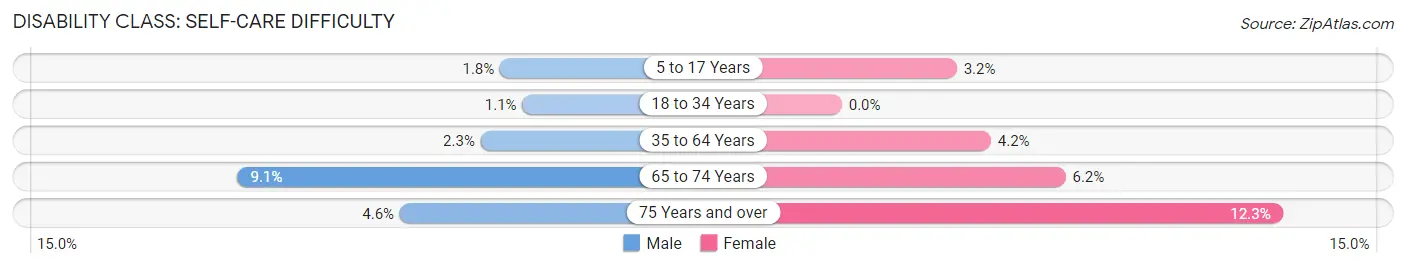
| Age Bracket | Male | Female |
| 5 to 17 Years | 15 (1.8%) | 29 (3.2%) |
| 18 to 34 Years | 11 (1.1%) | 0 (0.0%) |
| 35 to 64 Years | 42 (2.3%) | 73 (4.2%) |
| 65 to 74 Years | 50 (9.1%) | 32 (6.2%) |
| 75 Years and over | 18 (4.5%) | 53 (12.3%) |
Technology Access in Runnels County
Computing Device Access in Runnels County
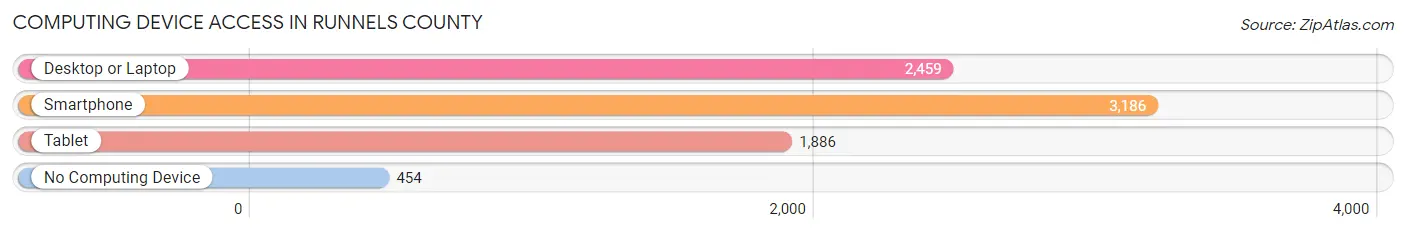
| Device Type | # Households | % Households |
| Desktop or Laptop | 2,459 | 65.0% |
| Smartphone | 3,186 | 84.3% |
| Tablet | 1,886 | 49.9% |
| No Computing Device | 454 | 12.0% |
| Total | 3,780 | 100.0% |
Internet Access in Runnels County
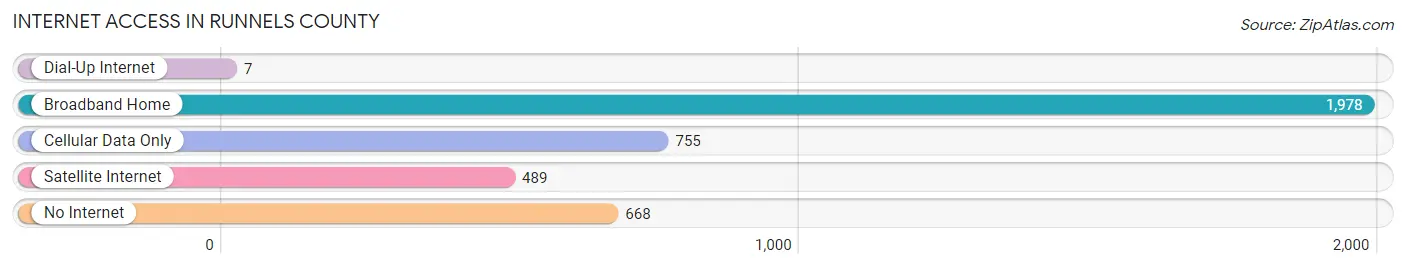
| Internet Type | # Households | % Households |
| Dial-Up Internet | 7 | 0.2% |
| Broadband Home | 1,978 | 52.3% |
| Cellular Data Only | 755 | 20.0% |
| Satellite Internet | 489 | 12.9% |
| No Internet | 668 | 17.7% |
| Total | 3,780 | 100.0% |
Runnels County Summary
Runnels County is located in the west-central region of Texas, and is part of the Concho Valley. It is bordered by Coleman County to the north, Tom Green County to the east, Concho County to the south, and Coke and Irion Counties to the west. The county seat is Ballinger, and the county has a total area of 902 square miles, with 899 square miles of land and 3 square miles of water.
History
Runnels County was established in 1858 and named for Hiram G. Runnels, a former Texas state legislator. The county was originally part of Tom Green County, but was later divided into its own county. The first settlers in the area were ranchers, who were attracted to the area by the abundance of grass and water. The first town in the county was Ballinger, which was established in 1876.
Geography
Runnels County is located in the west-central region of Texas, and is part of the Concho Valley. It is bordered by Coleman County to the north, Tom Green County to the east, Concho County to the south, and Coke and Irion Counties to the west. The county has a total area of 902 square miles, with 899 square miles of land and 3 square miles of water. The terrain is mostly flat, with some rolling hills in the northern part of the county. The county is drained by the Colorado River, which flows through the western part of the county.
Economy
The economy of Runnels County is largely based on agriculture and oil and gas production. The county is home to several large ranches, and the main crops grown in the area are cotton, corn, wheat, and sorghum. The county is also home to several oil and gas fields, and the production of oil and gas is a major contributor to the local economy. In addition, the county is home to several manufacturing companies, including a steel mill and a paper mill.
Demographics
As of the 2010 census, the population of Runnels County was 10,501. The population is largely white (83.3%), with a small Hispanic population (14.2%). The median household income in the county is $41,945, and the median home value is $77,400. The unemployment rate in the county is 4.2%.
Conclusion
Runnels County is a rural county located in the west-central region of Texas. It is bordered by Coleman County to the north, Tom Green County to the east, Concho County to the south, and Coke and Irion Counties to the west. The county has a total area of 902 square miles, with 899 square miles of land and 3 square miles of water. The economy of the county is largely based on agriculture and oil and gas production, and the population is largely white. The median household income in the county is $41,945, and the median home value is $77,400.
Common Questions
What is Per Capita Income in Runnels County?
Per Capita income in Runnels County is $29,784.
What is the Median Family Income in Runnels County?
Median Family Income in Runnels County is $65,648.
What is the Median Household income in Runnels County?
Median Household Income in Runnels County is $55,424.
What is Income or Wage Gap in Runnels County?
Income or Wage Gap in Runnels County is 28.4%.
Women in Runnels County earn 71.6 cents for every dollar earned by a man.
What is Family Income Deficit in Runnels County?
Family Income Deficit in Runnels County is $9,126.
Families that are below poverty line in Runnels County earn $9,126 less on average than the poverty threshold level.
What is Inequality or Gini Index in Runnels County?
Inequality or Gini Index in Runnels County is 0.43.
What is the Total Population of Runnels County?
Total Population of Runnels County is 9,858.
What is the Total Male Population of Runnels County?
Total Male Population of Runnels County is 4,976.
What is the Total Female Population of Runnels County?
Total Female Population of Runnels County is 4,882.
What is the Ratio of Males per 100 Females in Runnels County?
There are 101.93 Males per 100 Females in Runnels County.
What is the Ratio of Females per 100 Males in Runnels County?
There are 98.11 Females per 100 Males in Runnels County.
What is the Median Population Age in Runnels County?
Median Population Age in Runnels County is 40.9 Years.
What is the Average Family Size in Runnels County
Average Family Size in Runnels County is 3.1 People.
What is the Average Household Size in Runnels County
Average Household Size in Runnels County is 2.5 People.
How Large is the Labor Force in Runnels County?
There are 4,601 People in the Labor Forcein in Runnels County.
What is the Percentage of People in the Labor Force in Runnels County?
59.6% of People are in the Labor Force in Runnels County.
What is the Unemployment Rate in Runnels County?
Unemployment Rate in Runnels County is 3.0%.