Rockwall County, TX Map & Demographics
Rockwall County Map
Rockwall County Overview
$53,000
PER CAPITA INCOME
$131,804
AVG FAMILY INCOME
$121,303
AVG HOUSEHOLD INCOME
36.5%
WAGE / INCOME GAP [ % ]
63.5¢/ $1
WAGE / INCOME GAP [ $ ]
$11,302
FAMILY INCOME DEFICIT
0.41
INEQUALITY / GINI INDEX
110,631
TOTAL POPULATION
55,091
MALE POPULATION
55,540
FEMALE POPULATION
99.19
MALES / 100 FEMALES
100.82
FEMALES / 100 MALES
37.6
MEDIAN AGE
3.2
AVG FAMILY SIZE
2.9
AVG HOUSEHOLD SIZE
59,591
LABOR FORCE [ PEOPLE ]
70.3%
PERCENT IN LABOR FORCE
3.9%
UNEMPLOYMENT RATE
Income in Rockwall County
Income Overview in Rockwall County
Per Capita Income in Rockwall County is $53,000, while median incomes of families and households are $131,804 and $121,303 respectively.
| Characteristic | Number | Measure |
| Per Capita Income | 110,631 | $53,000 |
| Median Family Income | 30,522 | $131,804 |
| Mean Family Income | 30,522 | $165,339 |
| Median Household Income | 37,881 | $121,303 |
| Mean Household Income | 37,881 | $154,691 |
| Income Deficit | 30,522 | $11,302 |
| Wage / Income Gap (%) | 110,631 | 36.52% |
| Wage / Income Gap ($) | 110,631 | 63.48¢ per $1 |
| Gini / Inequality Index | 110,631 | 0.41 |
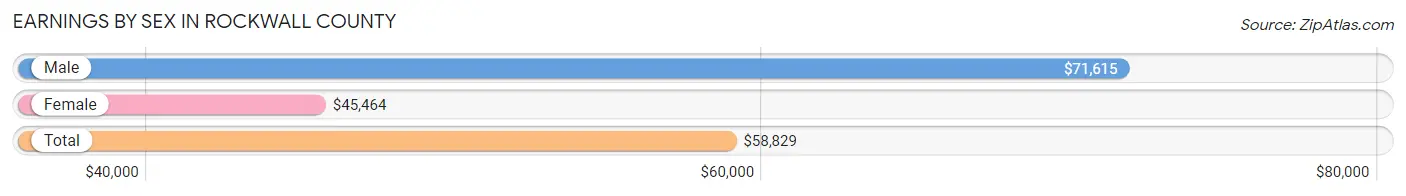
Earnings by Sex in Rockwall County
Average Earnings in Rockwall County are $58,829, $71,615 for men and $45,464 for women, a difference of 36.5%.
| Sex | Number | Average Earnings |
| Male | 33,467 (53.6%) | $71,615 |
| Female | 28,972 (46.4%) | $45,464 |
| Total | 62,439 (100.0%) | $58,829 |
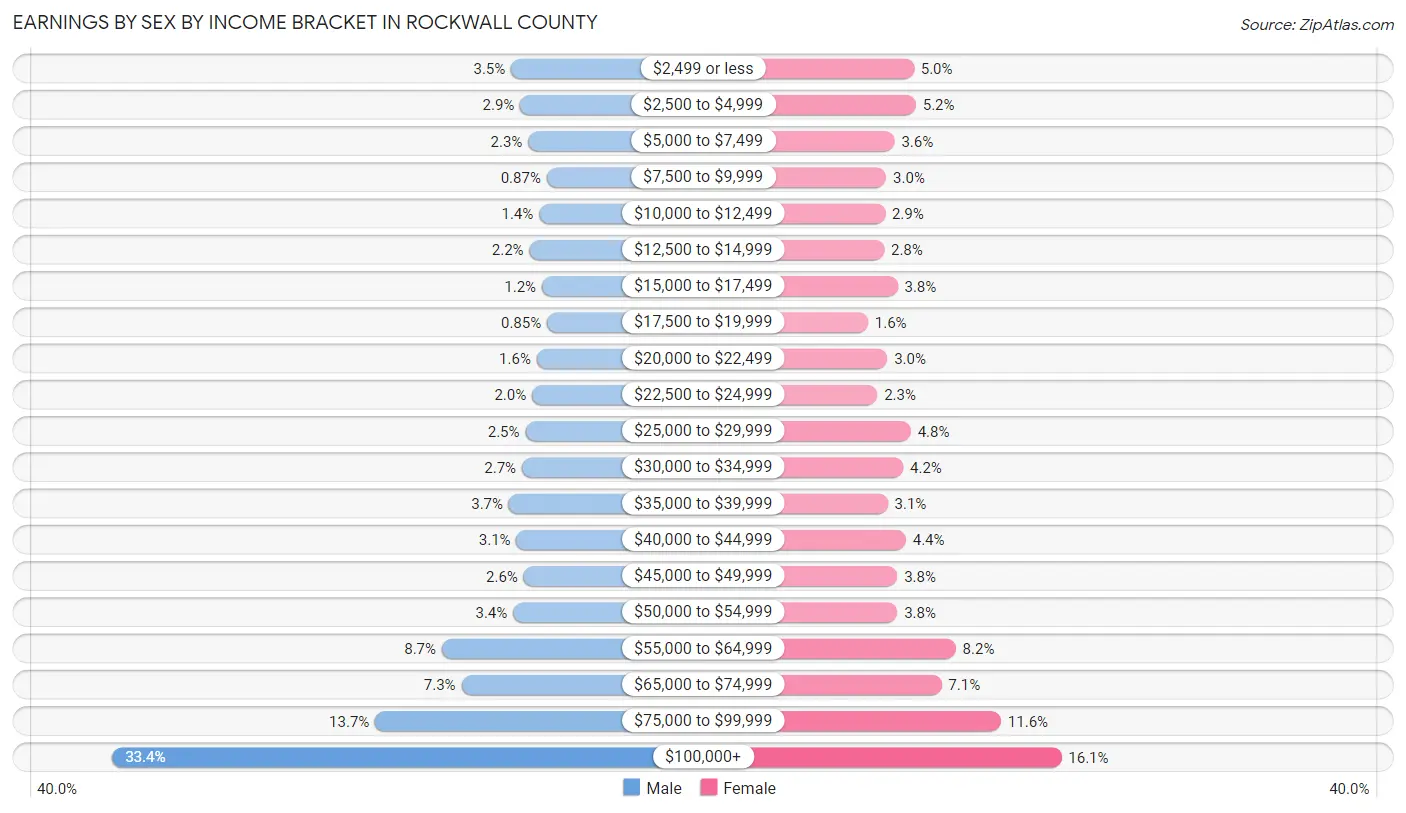
Earnings by Sex by Income Bracket in Rockwall County
The most common earnings brackets in Rockwall County are $100,000+ for men (11,187 | 33.4%) and $100,000+ for women (4,660 | 16.1%).
| Income | Male | Female |
| $2,499 or less | 1,185 (3.5%) | 1,453 (5.0%) |
| $2,500 to $4,999 | 957 (2.9%) | 1,497 (5.2%) |
| $5,000 to $7,499 | 756 (2.3%) | 1,035 (3.6%) |
| $7,500 to $9,999 | 290 (0.9%) | 856 (2.9%) |
| $10,000 to $12,499 | 483 (1.4%) | 828 (2.9%) |
| $12,500 to $14,999 | 726 (2.2%) | 809 (2.8%) |
| $15,000 to $17,499 | 412 (1.2%) | 1,102 (3.8%) |
| $17,500 to $19,999 | 284 (0.9%) | 459 (1.6%) |
| $20,000 to $22,499 | 542 (1.6%) | 879 (3.0%) |
| $22,500 to $24,999 | 659 (2.0%) | 660 (2.3%) |
| $25,000 to $29,999 | 826 (2.5%) | 1,388 (4.8%) |
| $30,000 to $34,999 | 913 (2.7%) | 1,222 (4.2%) |
| $35,000 to $39,999 | 1,243 (3.7%) | 886 (3.1%) |
| $40,000 to $44,999 | 1,050 (3.1%) | 1,282 (4.4%) |
| $45,000 to $49,999 | 871 (2.6%) | 1,095 (3.8%) |
| $50,000 to $54,999 | 1,135 (3.4%) | 1,095 (3.8%) |
| $55,000 to $64,999 | 2,923 (8.7%) | 2,364 (8.2%) |
| $65,000 to $74,999 | 2,430 (7.3%) | 2,055 (7.1%) |
| $75,000 to $99,999 | 4,595 (13.7%) | 3,347 (11.6%) |
| $100,000+ | 11,187 (33.4%) | 4,660 (16.1%) |
| Total | 33,467 (100.0%) | 28,972 (100.0%) |
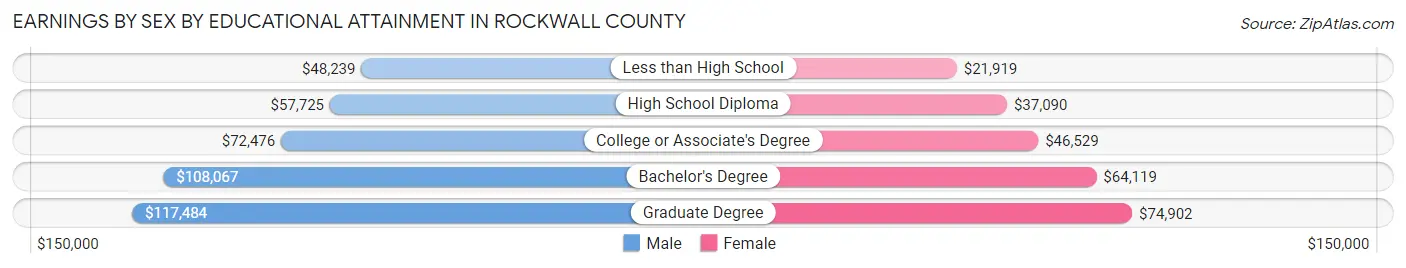
Earnings by Sex by Educational Attainment in Rockwall County
Average earnings in Rockwall County are $83,612 for men and $54,261 for women, a difference of 35.1%. Men with an educational attainment of graduate degree enjoy the highest average annual earnings of $117,484, while those with less than high school education earn the least with $48,239. Women with an educational attainment of graduate degree earn the most with the average annual earnings of $74,902, while those with less than high school education have the smallest earnings of $21,919.
| Educational Attainment | Male Income | Female Income |
| Less than High School | $48,239 | $21,919 |
| High School Diploma | $57,725 | $37,090 |
| College or Associate's Degree | $72,476 | $46,529 |
| Bachelor's Degree | $108,067 | $64,119 |
| Graduate Degree | $117,484 | $74,902 |
| Total | $83,612 | $54,261 |
Family Income in Rockwall County
Family Income Brackets in Rockwall County
According to the Rockwall County family income data, there are 7,905 families falling into the $100,000 to $149,999 income range, which is the most common income bracket and makes up 25.9% of all families. Conversely, the $10,000 to $14,999 income bracket is the least frequent group with only 183 families (0.6%) belonging to this category.
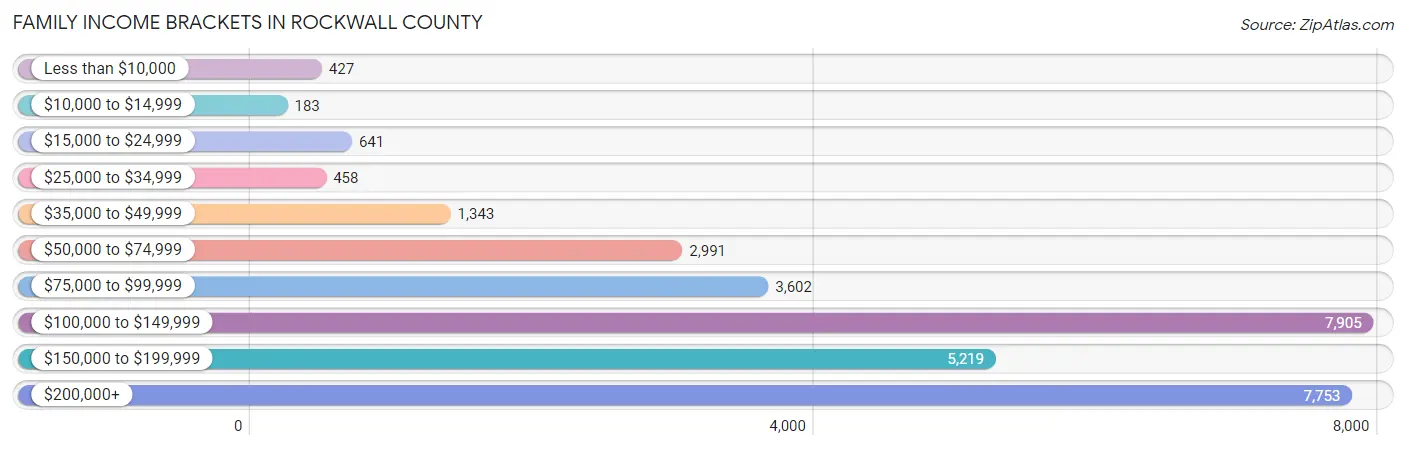
| Income Bracket | # Families | % Families |
| Less than $10,000 | 427 | 1.4% |
| $10,000 to $14,999 | 183 | 0.6% |
| $15,000 to $24,999 | 641 | 2.1% |
| $25,000 to $34,999 | 458 | 1.5% |
| $35,000 to $49,999 | 1,343 | 4.4% |
| $50,000 to $74,999 | 2,991 | 9.8% |
| $75,000 to $99,999 | 3,602 | 11.8% |
| $100,000 to $149,999 | 7,905 | 25.9% |
| $150,000 to $199,999 | 5,219 | 17.1% |
| $200,000+ | 7,753 | 25.4% |
Family Income by Famaliy Size in Rockwall County
5-person families (3,656 | 12.0%) account for the highest median family income in Rockwall County with $170,975 per family, while 2-person families (11,626 | 38.1%) have the highest median income of $55,611 per family member.
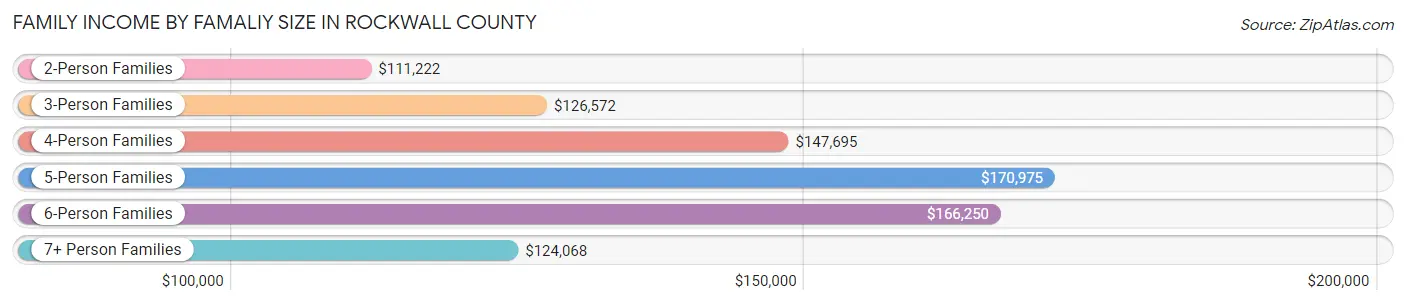
| Income Bracket | # Families | Median Income |
| 2-Person Families | 11,626 (38.1%) | $111,222 |
| 3-Person Families | 6,245 (20.5%) | $126,572 |
| 4-Person Families | 7,014 (23.0%) | $147,695 |
| 5-Person Families | 3,656 (12.0%) | $170,975 |
| 6-Person Families | 1,428 (4.7%) | $166,250 |
| 7+ Person Families | 553 (1.8%) | $124,068 |
| Total | 30,522 (100.0%) | $131,804 |
Family Income by Number of Earners in Rockwall County
The median family income in Rockwall County is $131,804, with families comprising 3+ earners (4,743) having the highest median family income of $173,068, while families with no earners (2,685) have the lowest median family income of $72,917, accounting for 15.5% and 8.8% of families, respectively.
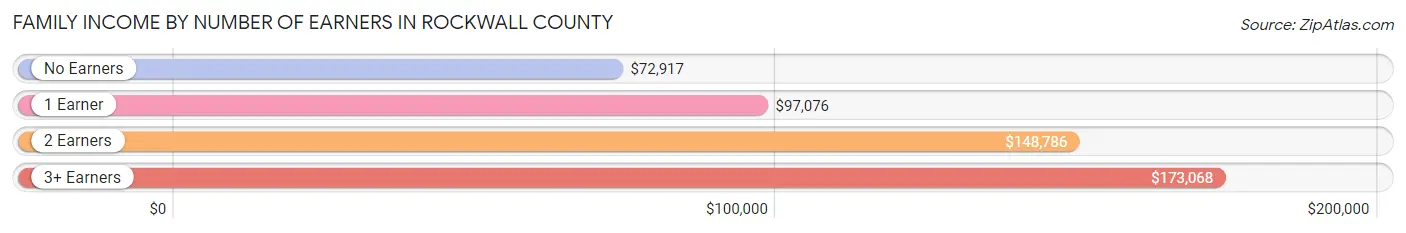
| Number of Earners | # Families | Median Income |
| No Earners | 2,685 (8.8%) | $72,917 |
| 1 Earner | 7,965 (26.1%) | $97,076 |
| 2 Earners | 15,129 (49.6%) | $148,786 |
| 3+ Earners | 4,743 (15.5%) | $173,068 |
| Total | 30,522 (100.0%) | $131,804 |
Household Income in Rockwall County
Household Income Brackets in Rockwall County
With 9,129 households falling in the category, the $100,000 to $149,999 income range is the most frequent in Rockwall County, accounting for 24.1% of all households. In contrast, only 265 households (0.7%) fall into the $10,000 to $14,999 income bracket, making it the least populous group.
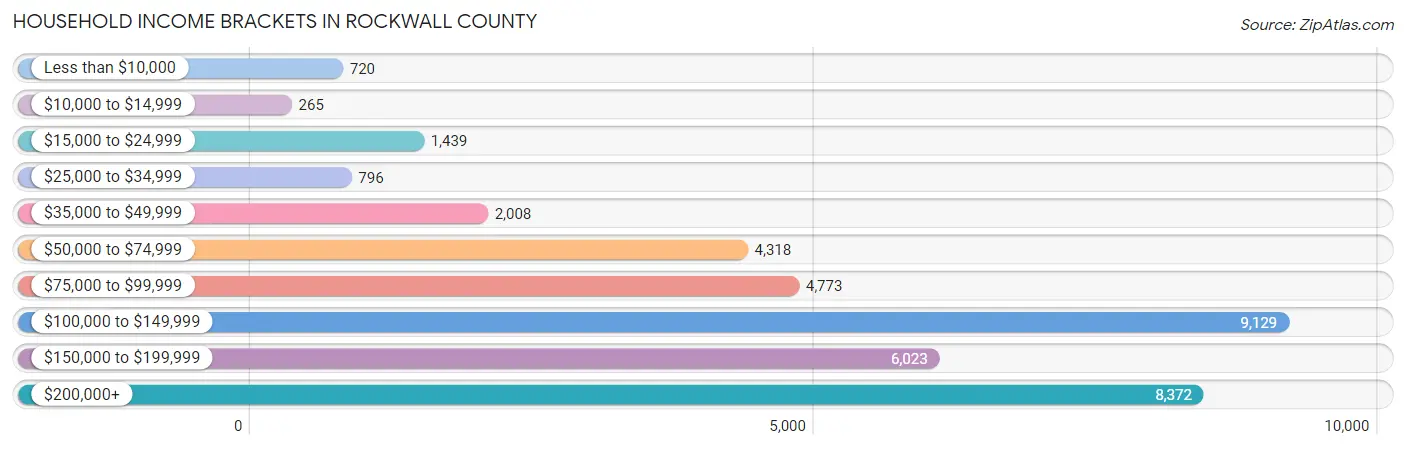
| Income Bracket | # Households | % Households |
| Less than $10,000 | 720 | 1.9% |
| $10,000 to $14,999 | 265 | 0.7% |
| $15,000 to $24,999 | 1,439 | 3.8% |
| $25,000 to $34,999 | 796 | 2.1% |
| $35,000 to $49,999 | 2,008 | 5.3% |
| $50,000 to $74,999 | 4,318 | 11.4% |
| $75,000 to $99,999 | 4,773 | 12.6% |
| $100,000 to $149,999 | 9,129 | 24.1% |
| $150,000 to $199,999 | 6,023 | 15.9% |
| $200,000+ | 8,372 | 22.1% |
Household Income by Householder Age in Rockwall County
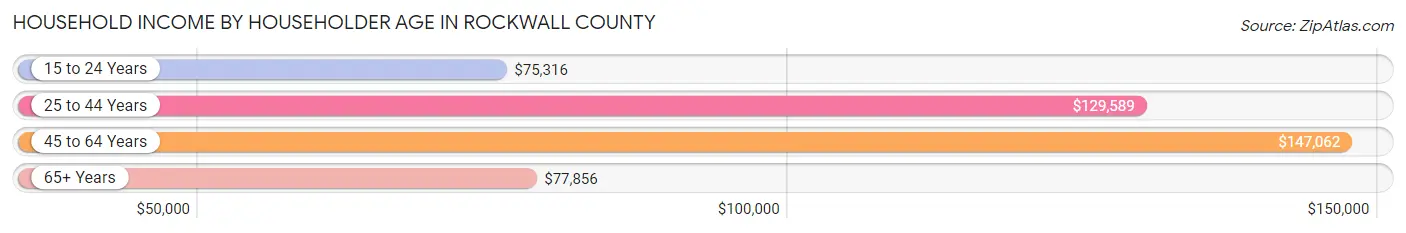
The median household income in Rockwall County is $121,303, with the highest median household income of $147,062 found in the 45 to 64 years age bracket for the primary householder. A total of 14,867 households (39.3%) fall into this category. Meanwhile, the 15 to 24 years age bracket for the primary householder has the lowest median household income of $75,316, with 632 households (1.7%) in this group.
| Income Bracket | # Households | Median Income |
| 15 to 24 Years | 632 (1.7%) | $75,316 |
| 25 to 44 Years | 14,623 (38.6%) | $129,589 |
| 45 to 64 Years | 14,867 (39.3%) | $147,062 |
| 65+ Years | 7,759 (20.5%) | $77,856 |
| Total | 37,881 (100.0%) | $121,303 |
Poverty in Rockwall County
Income Below Poverty by Sex and Age in Rockwall County
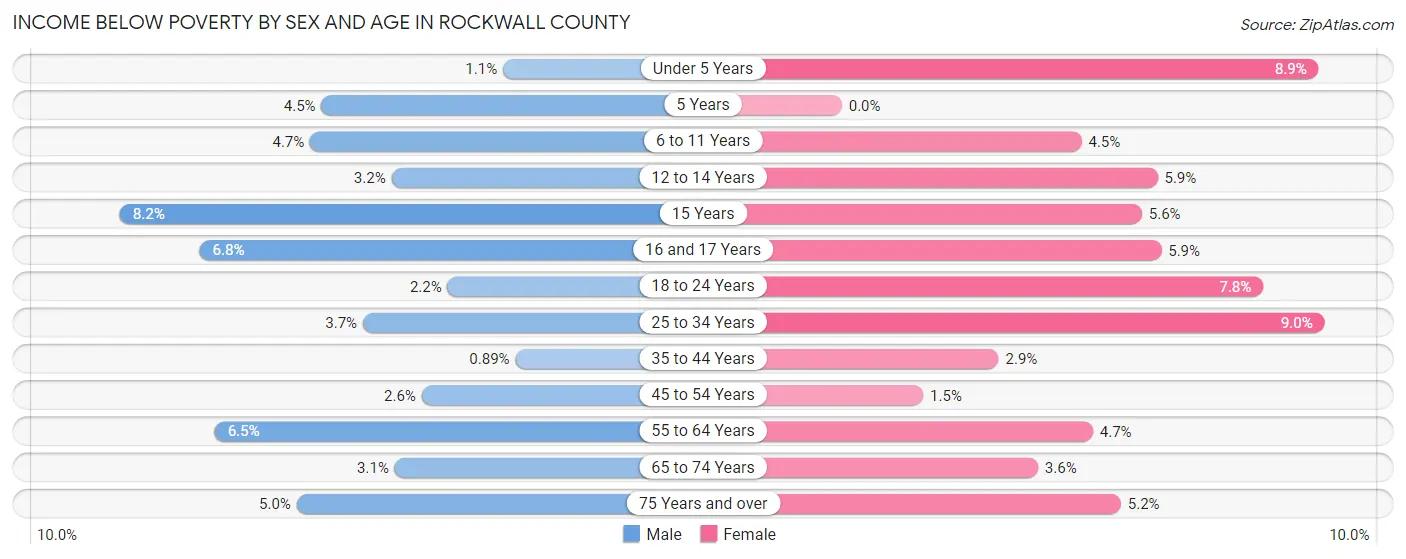
With 3.4% poverty level for males and 4.9% for females among the residents of Rockwall County, 15 year old males and 25 to 34 year old females are the most vulnerable to poverty, with 69 males (8.2%) and 557 females (9.0%) in their respective age groups living below the poverty level.
| Age Bracket | Male | Female |
| Under 5 Years | 37 (1.1%) | 288 (8.8%) |
| 5 Years | 28 (4.5%) | 0 (0.0%) |
| 6 to 11 Years | 256 (4.7%) | 202 (4.4%) |
| 12 to 14 Years | 86 (3.2%) | 171 (5.9%) |
| 15 Years | 69 (8.2%) | 66 (5.6%) |
| 16 and 17 Years | 138 (6.8%) | 91 (5.9%) |
| 18 to 24 Years | 102 (2.1%) | 340 (7.8%) |
| 25 to 34 Years | 228 (3.7%) | 557 (9.0%) |
| 35 to 44 Years | 78 (0.9%) | 248 (2.9%) |
| 45 to 54 Years | 200 (2.6%) | 116 (1.5%) |
| 55 to 64 Years | 425 (6.5%) | 310 (4.7%) |
| 65 to 74 Years | 120 (3.1%) | 159 (3.6%) |
| 75 Years and over | 107 (5.0%) | 153 (5.2%) |
| Total | 1,874 (3.4%) | 2,701 (4.9%) |
Income Above Poverty by Sex and Age in Rockwall County
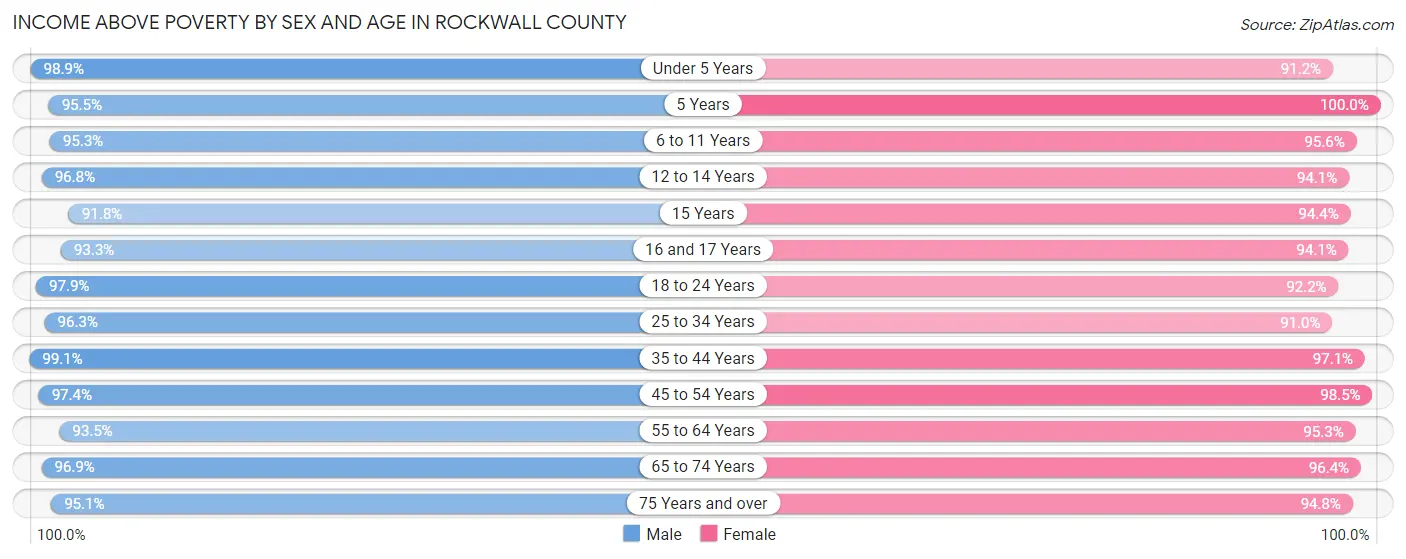
According to the poverty statistics in Rockwall County, males aged 35 to 44 years and females aged 5 years are the age groups that are most secure financially, with 99.1% of males and 100.0% of females in these age groups living above the poverty line.
| Age Bracket | Male | Female |
| Under 5 Years | 3,261 (98.9%) | 2,967 (91.1%) |
| 5 Years | 596 (95.5%) | 766 (100.0%) |
| 6 to 11 Years | 5,188 (95.3%) | 4,335 (95.6%) |
| 12 to 14 Years | 2,608 (96.8%) | 2,748 (94.1%) |
| 15 Years | 769 (91.8%) | 1,119 (94.4%) |
| 16 and 17 Years | 1,907 (93.2%) | 1,443 (94.1%) |
| 18 to 24 Years | 4,640 (97.9%) | 4,008 (92.2%) |
| 25 to 34 Years | 5,893 (96.3%) | 5,660 (91.0%) |
| 35 to 44 Years | 8,641 (99.1%) | 8,262 (97.1%) |
| 45 to 54 Years | 7,396 (97.4%) | 7,582 (98.5%) |
| 55 to 64 Years | 6,142 (93.5%) | 6,346 (95.3%) |
| 65 to 74 Years | 3,718 (96.9%) | 4,208 (96.4%) |
| 75 Years and over | 2,053 (95.1%) | 2,798 (94.8%) |
| Total | 52,812 (96.6%) | 52,242 (95.1%) |
Income Below Poverty Among Married-Couple Families in Rockwall County
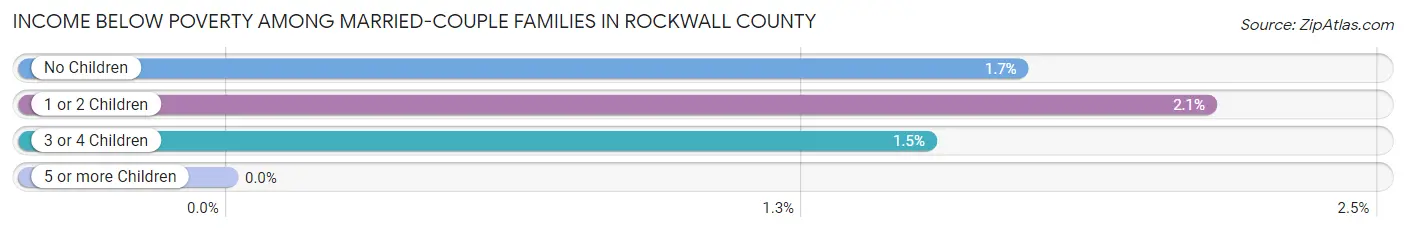
The poverty statistics for married-couple families in Rockwall County show that 1.8% or 479 of the total 26,116 families live below the poverty line. Families with 1 or 2 children have the highest poverty rate of 2.1%, comprising of 218 families. On the other hand, families with 5 or more children have the lowest poverty rate of 0.0%, which includes 0 families.
| Children | Above Poverty | Below Poverty |
| No Children | 12,004 (98.3%) | 210 (1.7%) |
| 1 or 2 Children | 9,996 (97.9%) | 218 (2.1%) |
| 3 or 4 Children | 3,313 (98.5%) | 51 (1.5%) |
| 5 or more Children | 324 (100.0%) | 0 (0.0%) |
| Total | 25,637 (98.2%) | 479 (1.8%) |
Income Below Poverty Among Single-Parent Households in Rockwall County
According to the poverty data in Rockwall County, 17.7% or 191 single-father households and 12.3% or 410 single-mother households are living below the poverty line. Among single-father households, those with 3 or 4 children have the highest poverty rate, with 28 households (40.6%) experiencing poverty. Likewise, among single-mother households, those with 3 or 4 children have the highest poverty rate, with 171 households (55.3%) falling below the poverty line.
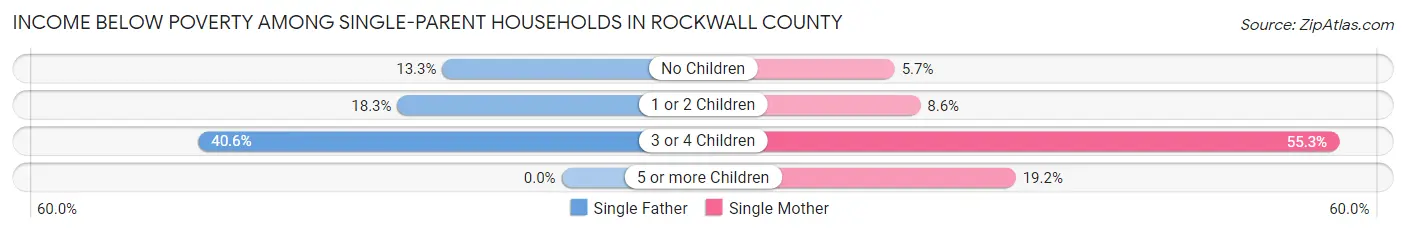
| Children | Single Father | Single Mother |
| No Children | 55 (13.3%) | 67 (5.7%) |
| 1 or 2 Children | 108 (18.3%) | 147 (8.6%) |
| 3 or 4 Children | 28 (40.6%) | 171 (55.3%) |
| 5 or more Children | 0 (0.0%) | 25 (19.2%) |
| Total | 191 (17.7%) | 410 (12.3%) |
Income Below Poverty Among Married-Couple vs Single-Parent Households in Rockwall County
The poverty data for Rockwall County shows that 479 of the married-couple family households (1.8%) and 601 of the single-parent households (13.6%) are living below the poverty level. Within the married-couple family households, those with 1 or 2 children have the highest poverty rate, with 218 households (2.1%) falling below the poverty line. Among the single-parent households, those with 3 or 4 children have the highest poverty rate, with 199 household (52.6%) living below poverty.
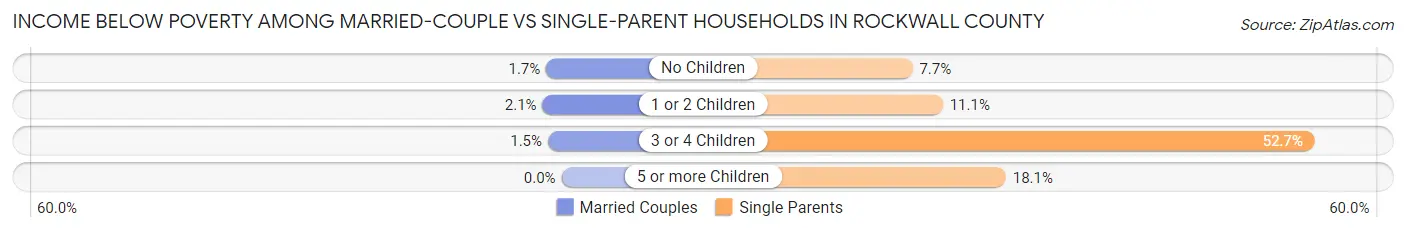
| Children | Married-Couple Families | Single-Parent Households |
| No Children | 210 (1.7%) | 122 (7.7%) |
| 1 or 2 Children | 218 (2.1%) | 255 (11.1%) |
| 3 or 4 Children | 51 (1.5%) | 199 (52.6%) |
| 5 or more Children | 0 (0.0%) | 25 (18.1%) |
| Total | 479 (1.8%) | 601 (13.6%) |
Race in Rockwall County
The most populous races in Rockwall County are White / Caucasian (83,211 | 75.2%), Hispanic or Latino (21,516 | 19.5%), and Two or more Races (10,349 | 9.3%).
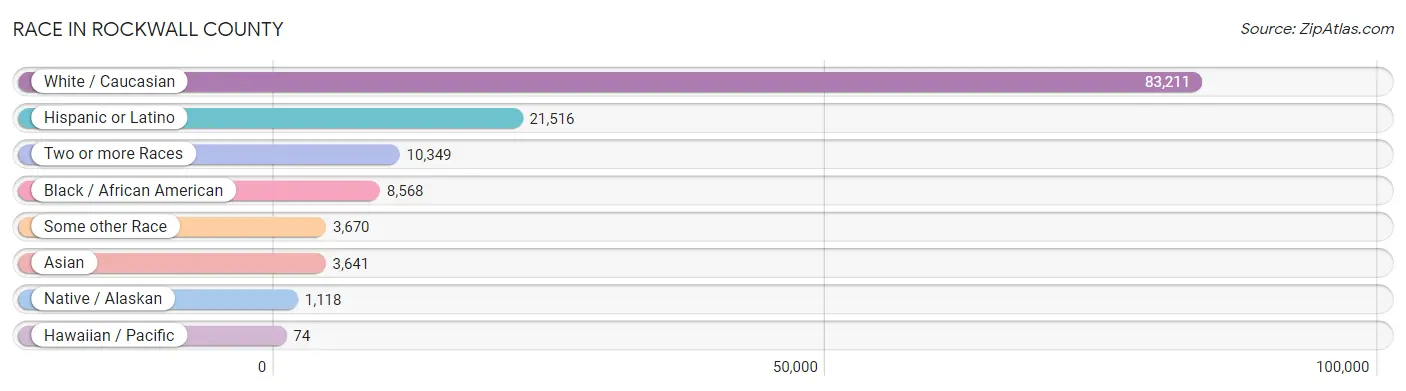
| Race | # Population | % Population |
| Asian | 3,641 | 3.3% |
| Black / African American | 8,568 | 7.7% |
| Hawaiian / Pacific | 74 | 0.1% |
| Hispanic or Latino | 21,516 | 19.5% |
| Native / Alaskan | 1,118 | 1.0% |
| White / Caucasian | 83,211 | 75.2% |
| Two or more Races | 10,349 | 9.3% |
| Some other Race | 3,670 | 3.3% |
| Total | 110,631 | 100.0% |
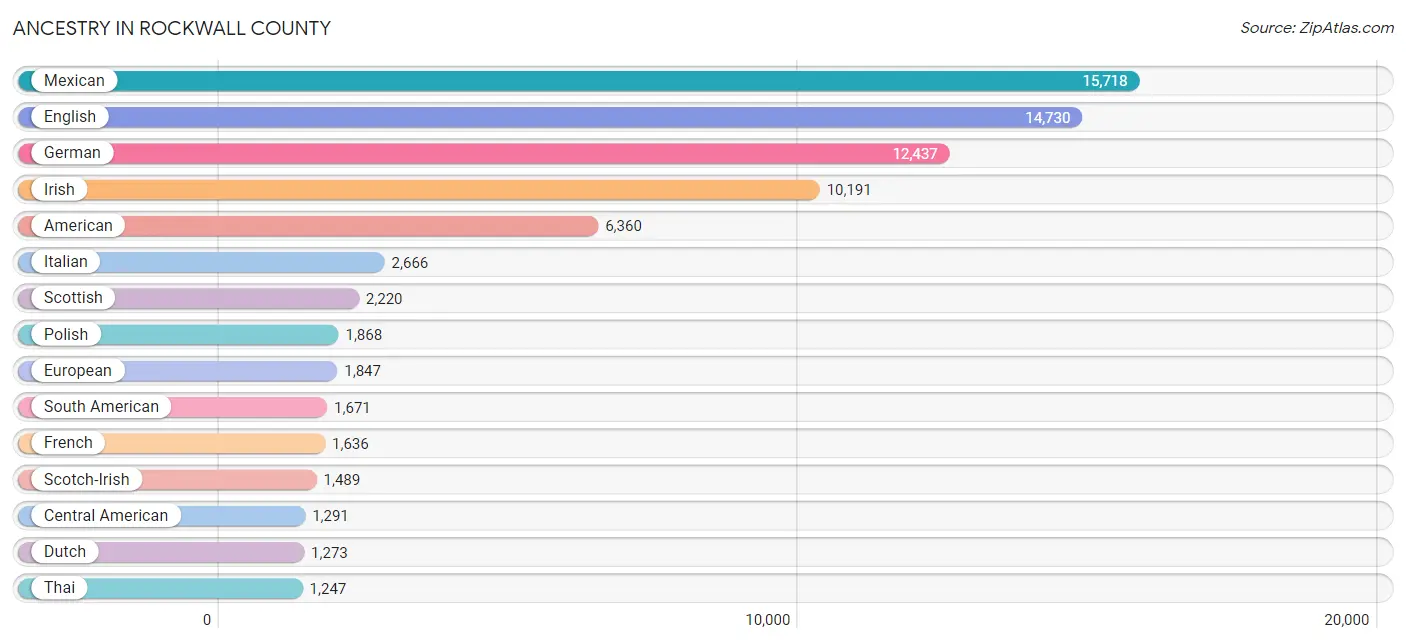
Ancestry in Rockwall County
The most populous ancestries reported in Rockwall County are Mexican (15,718 | 14.2%), English (14,730 | 13.3%), German (12,437 | 11.2%), Irish (10,191 | 9.2%), and American (6,360 | 5.8%), together accounting for 53.7% of all Rockwall County residents.
| Ancestry | # Population | % Population |
| African | 323 | 0.3% |
| Albanian | 45 | 0.0% |
| American | 6,360 | 5.8% |
| Apache | 6 | 0.0% |
| Arab | 712 | 0.6% |
| Argentinean | 168 | 0.2% |
| Armenian | 134 | 0.1% |
| Australian | 82 | 0.1% |
| Austrian | 267 | 0.2% |
| Bahamian | 77 | 0.1% |
| Bangladeshi | 144 | 0.1% |
| Basque | 21 | 0.0% |
| Belgian | 71 | 0.1% |
| Belizean | 42 | 0.0% |
| Bhutanese | 231 | 0.2% |
| Blackfeet | 94 | 0.1% |
| Brazilian | 68 | 0.1% |
| British | 671 | 0.6% |
| Bulgarian | 264 | 0.2% |
| Burmese | 360 | 0.3% |
| Cajun | 5 | 0.0% |
| Canadian | 65 | 0.1% |
| Celtic | 33 | 0.0% |
| Central American | 1,291 | 1.2% |
| Central American Indian | 14 | 0.0% |
| Cherokee | 313 | 0.3% |
| Chickasaw | 87 | 0.1% |
| Chilean | 2 | 0.0% |
| Chippewa | 25 | 0.0% |
| Choctaw | 256 | 0.2% |
| Colombian | 586 | 0.5% |
| Comanche | 26 | 0.0% |
| Costa Rican | 22 | 0.0% |
| Croatian | 52 | 0.1% |
| Cuban | 167 | 0.2% |
| Czech | 386 | 0.4% |
| Czechoslovakian | 48 | 0.0% |
| Danish | 575 | 0.5% |
| Delaware | 82 | 0.1% |
| Dominican | 116 | 0.1% |
| Dutch | 1,273 | 1.1% |
| Dutch West Indian | 102 | 0.1% |
| Eastern European | 304 | 0.3% |
| Ecuadorian | 218 | 0.2% |
| English | 14,730 | 13.3% |
| Ethiopian | 32 | 0.0% |
| European | 1,847 | 1.7% |
| Finnish | 388 | 0.4% |
| French | 1,636 | 1.5% |
| French American Indian | 44 | 0.0% |
| French Canadian | 205 | 0.2% |
| German | 12,437 | 11.2% |
| Ghanaian | 22 | 0.0% |
| Greek | 436 | 0.4% |
| Guamanian / Chamorro | 34 | 0.0% |
| Guatemalan | 468 | 0.4% |
| Honduran | 275 | 0.3% |
| Hungarian | 368 | 0.3% |
| Icelander | 15 | 0.0% |
| Indian (Asian) | 660 | 0.6% |
| Iranian | 122 | 0.1% |
| Iraqi | 50 | 0.1% |
| Irish | 10,191 | 9.2% |
| Italian | 2,666 | 2.4% |
| Jamaican | 36 | 0.0% |
| Japanese | 254 | 0.2% |
| Kenyan | 28 | 0.0% |
| Korean | 766 | 0.7% |
| Laotian | 25 | 0.0% |
| Latvian | 17 | 0.0% |
| Lebanese | 161 | 0.2% |
| Lithuanian | 83 | 0.1% |
| Malaysian | 30 | 0.0% |
| Maltese | 39 | 0.0% |
| Mexican | 15,718 | 14.2% |
| Mexican American Indian | 306 | 0.3% |
| Native Hawaiian | 97 | 0.1% |
| Nicaraguan | 41 | 0.0% |
| Nigerian | 64 | 0.1% |
| Northern European | 254 | 0.2% |
| Norwegian | 788 | 0.7% |
| Osage | 44 | 0.0% |
| Pakistani | 168 | 0.2% |
| Palestinian | 307 | 0.3% |
| Panamanian | 136 | 0.1% |
| Pennsylvania German | 36 | 0.0% |
| Peruvian | 407 | 0.4% |
| Polish | 1,868 | 1.7% |
| Portuguese | 175 | 0.2% |
| Potawatomi | 38 | 0.0% |
| Puerto Rican | 1,090 | 1.0% |
| Romanian | 282 | 0.3% |
| Russian | 419 | 0.4% |
| Salvadoran | 349 | 0.3% |
| Samoan | 8 | 0.0% |
| Scandinavian | 282 | 0.3% |
| Scotch-Irish | 1,489 | 1.3% |
| Scottish | 2,220 | 2.0% |
| Serbian | 23 | 0.0% |
| Sierra Leonean | 62 | 0.1% |
| Slovak | 38 | 0.0% |
| Slovene | 43 | 0.0% |
| South American | 1,671 | 1.5% |
| Spaniard | 458 | 0.4% |
| Spanish | 444 | 0.4% |
| Sri Lankan | 878 | 0.8% |
| Subsaharan African | 750 | 0.7% |
| Sudanese | 71 | 0.1% |
| Swedish | 1,039 | 0.9% |
| Swiss | 270 | 0.2% |
| Syrian | 124 | 0.1% |
| Thai | 1,247 | 1.1% |
| Ukrainian | 44 | 0.0% |
| Venezuelan | 290 | 0.3% |
| Welsh | 609 | 0.5% |
| West Indian | 60 | 0.1% |
| Yugoslavian | 9 | 0.0% |
| Zimbabwean | 52 | 0.1% | View All 118 Rows |
Immigrants in Rockwall County
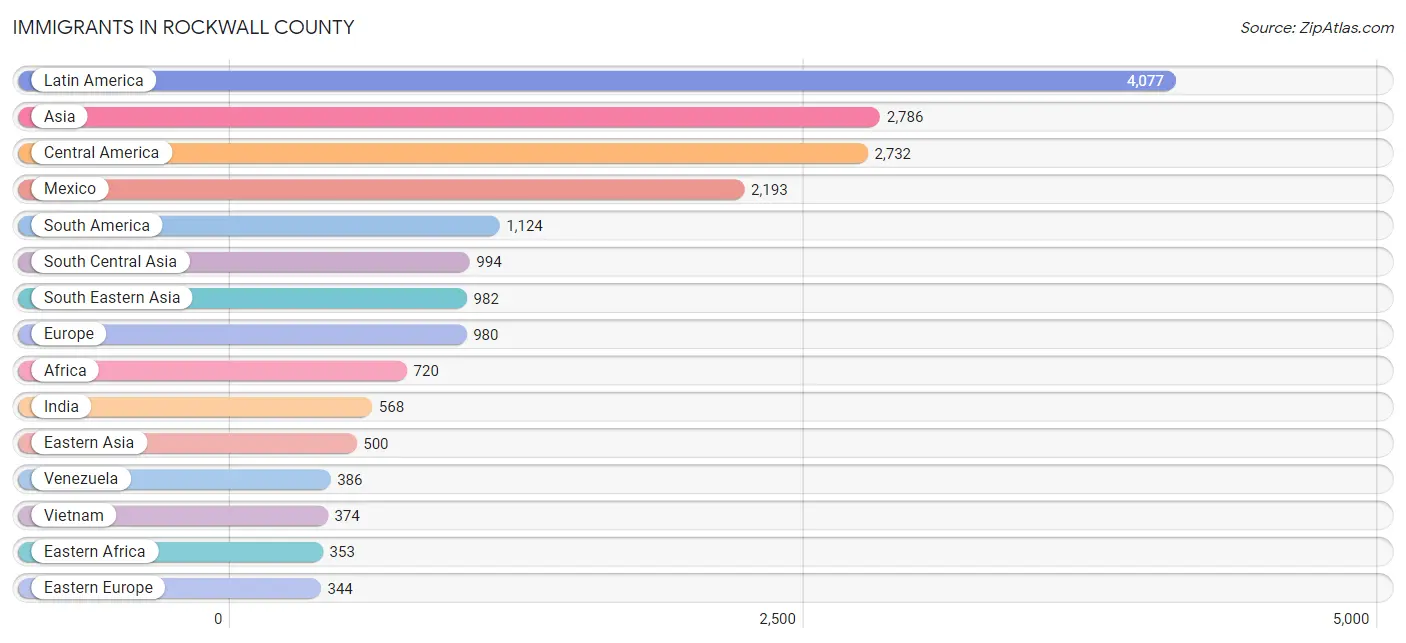
The most numerous immigrant groups reported in Rockwall County came from Latin America (4,077 | 3.7%), Asia (2,786 | 2.5%), Central America (2,732 | 2.5%), Mexico (2,193 | 2.0%), and South America (1,124 | 1.0%), together accounting for 11.7% of all Rockwall County residents.
| Immigration Origin | # Population | % Population |
| Africa | 720 | 0.6% |
| Armenia | 25 | 0.0% |
| Asia | 2,786 | 2.5% |
| Australia | 73 | 0.1% |
| Austria | 14 | 0.0% |
| Bahamas | 77 | 0.1% |
| Belarus | 29 | 0.0% |
| Bosnia and Herzegovina | 26 | 0.0% |
| Brazil | 44 | 0.0% |
| Cambodia | 98 | 0.1% |
| Cameroon | 74 | 0.1% |
| Canada | 333 | 0.3% |
| Caribbean | 221 | 0.2% |
| Central America | 2,732 | 2.5% |
| Chile | 69 | 0.1% |
| China | 141 | 0.1% |
| Colombia | 323 | 0.3% |
| Costa Rica | 93 | 0.1% |
| Cuba | 42 | 0.0% |
| Dominican Republic | 36 | 0.0% |
| Eastern Africa | 353 | 0.3% |
| Eastern Asia | 500 | 0.4% |
| Eastern Europe | 344 | 0.3% |
| Ecuador | 158 | 0.1% |
| Egypt | 41 | 0.0% |
| El Salvador | 165 | 0.2% |
| England | 131 | 0.1% |
| Ethiopia | 62 | 0.1% |
| Europe | 980 | 0.9% |
| Germany | 151 | 0.1% |
| Ghana | 55 | 0.1% |
| Grenada | 50 | 0.1% |
| Guatemala | 165 | 0.2% |
| Guyana | 8 | 0.0% |
| Honduras | 116 | 0.1% |
| Hungary | 4 | 0.0% |
| India | 568 | 0.5% |
| Indonesia | 29 | 0.0% |
| Iran | 158 | 0.1% |
| Iraq | 46 | 0.0% |
| Israel | 84 | 0.1% |
| Jamaica | 16 | 0.0% |
| Japan | 50 | 0.1% |
| Jordan | 15 | 0.0% |
| Kenya | 27 | 0.0% |
| Korea | 309 | 0.3% |
| Kuwait | 18 | 0.0% |
| Laos | 33 | 0.0% |
| Latin America | 4,077 | 3.7% |
| Latvia | 9 | 0.0% |
| Lebanon | 46 | 0.0% |
| Lithuania | 20 | 0.0% |
| Mexico | 2,193 | 2.0% |
| Middle Africa | 74 | 0.1% |
| Moldova | 5 | 0.0% |
| Nepal | 147 | 0.1% |
| Netherlands | 10 | 0.0% |
| Nigeria | 57 | 0.1% |
| Northern Africa | 119 | 0.1% |
| Northern Europe | 321 | 0.3% |
| Oceania | 91 | 0.1% |
| Pakistan | 46 | 0.0% |
| Peru | 136 | 0.1% |
| Philippines | 331 | 0.3% |
| Portugal | 3 | 0.0% |
| Romania | 123 | 0.1% |
| Russia | 39 | 0.0% |
| Scotland | 17 | 0.0% |
| Serbia | 10 | 0.0% |
| Sierra Leone | 62 | 0.1% |
| South America | 1,124 | 1.0% |
| South Central Asia | 994 | 0.9% |
| South Eastern Asia | 982 | 0.9% |
| Southern Europe | 140 | 0.1% |
| Spain | 137 | 0.1% |
| Sudan | 78 | 0.1% |
| Syria | 69 | 0.1% |
| Taiwan | 14 | 0.0% |
| Thailand | 117 | 0.1% |
| Ukraine | 28 | 0.0% |
| Uzbekistan | 75 | 0.1% |
| Venezuela | 386 | 0.4% |
| Vietnam | 374 | 0.3% |
| Western Africa | 174 | 0.2% |
| Western Asia | 303 | 0.3% |
| Western Europe | 175 | 0.2% |
| Zimbabwe | 264 | 0.2% | View All 87 Rows |
Sex and Age in Rockwall County
Sex and Age in Rockwall County
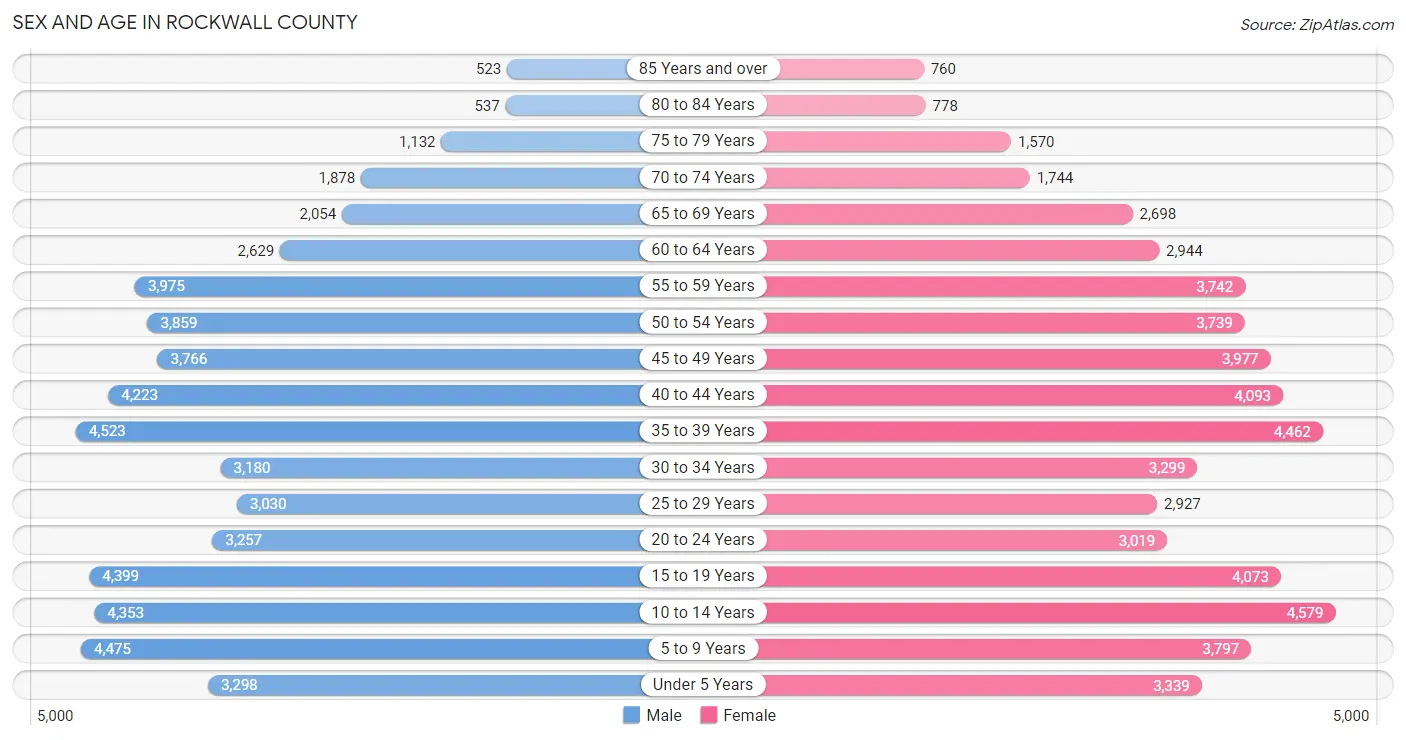
The most populous age groups in Rockwall County are 35 to 39 Years (4,523 | 8.2%) for men and 10 to 14 Years (4,579 | 8.2%) for women.
| Age Bracket | Male | Female |
| Under 5 Years | 3,298 (6.0%) | 3,339 (6.0%) |
| 5 to 9 Years | 4,475 (8.1%) | 3,797 (6.8%) |
| 10 to 14 Years | 4,353 (7.9%) | 4,579 (8.2%) |
| 15 to 19 Years | 4,399 (8.0%) | 4,073 (7.3%) |
| 20 to 24 Years | 3,257 (5.9%) | 3,019 (5.4%) |
| 25 to 29 Years | 3,030 (5.5%) | 2,927 (5.3%) |
| 30 to 34 Years | 3,180 (5.8%) | 3,299 (5.9%) |
| 35 to 39 Years | 4,523 (8.2%) | 4,462 (8.0%) |
| 40 to 44 Years | 4,223 (7.7%) | 4,093 (7.4%) |
| 45 to 49 Years | 3,766 (6.8%) | 3,977 (7.2%) |
| 50 to 54 Years | 3,859 (7.0%) | 3,739 (6.7%) |
| 55 to 59 Years | 3,975 (7.2%) | 3,742 (6.7%) |
| 60 to 64 Years | 2,629 (4.8%) | 2,944 (5.3%) |
| 65 to 69 Years | 2,054 (3.7%) | 2,698 (4.9%) |
| 70 to 74 Years | 1,878 (3.4%) | 1,744 (3.1%) |
| 75 to 79 Years | 1,132 (2.1%) | 1,570 (2.8%) |
| 80 to 84 Years | 537 (1.0%) | 778 (1.4%) |
| 85 Years and over | 523 (0.9%) | 760 (1.4%) |
| Total | 55,091 (100.0%) | 55,540 (100.0%) |
Families and Households in Rockwall County
Median Family Size in Rockwall County
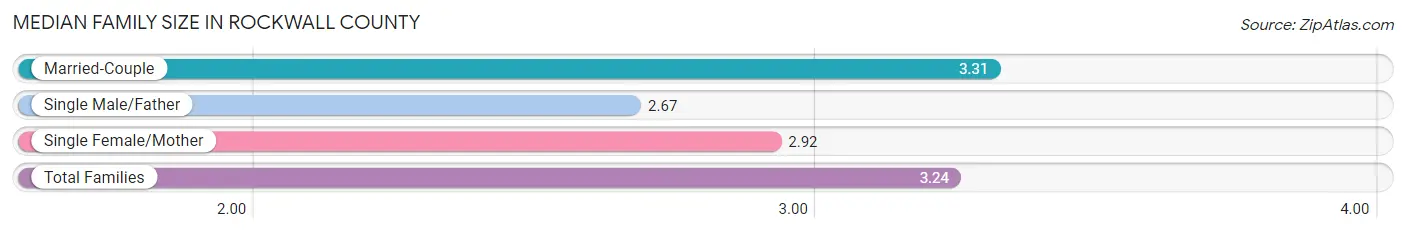
The median family size in Rockwall County is 3.24 persons per family, with married-couple families (26,116 | 85.6%) accounting for the largest median family size of 3.31 persons per family. On the other hand, single male/father families (1,079 | 3.5%) represent the smallest median family size with 2.67 persons per family.
| Family Type | # Families | Family Size |
| Married-Couple | 26,116 (85.6%) | 3.31 |
| Single Male/Father | 1,079 (3.5%) | 2.67 |
| Single Female/Mother | 3,327 (10.9%) | 2.92 |
| Total Families | 30,522 (100.0%) | 3.24 |
Median Household Size in Rockwall County
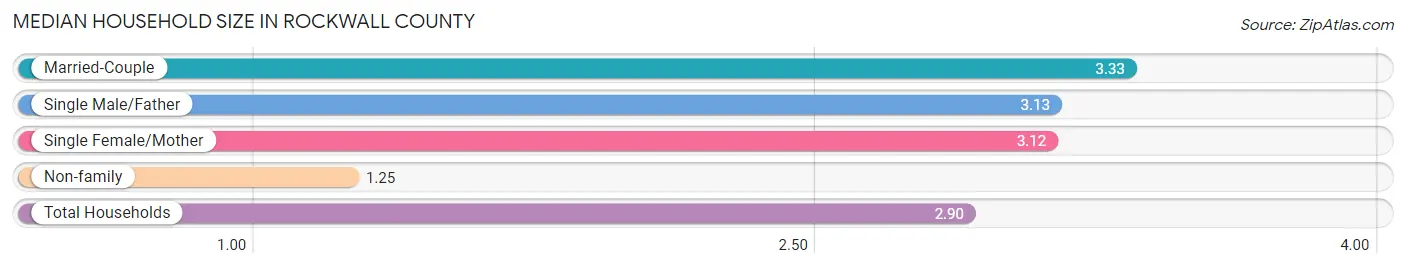
The median household size in Rockwall County is 2.90 persons per household, with married-couple households (26,116 | 68.9%) accounting for the largest median household size of 3.33 persons per household. non-family households (7,359 | 19.4%) represent the smallest median household size with 1.25 persons per household.
| Household Type | # Households | Household Size |
| Married-Couple | 26,116 (68.9%) | 3.33 |
| Single Male/Father | 1,079 (2.9%) | 3.13 |
| Single Female/Mother | 3,327 (8.8%) | 3.12 |
| Non-family | 7,359 (19.4%) | 1.25 |
| Total Households | 37,881 (100.0%) | 2.90 |
Household Size by Marriage Status in Rockwall County
Out of a total of 37,881 households in Rockwall County, 30,522 (80.6%) are family households, while 7,359 (19.4%) are nonfamily households. The most numerous type of family households are 2-person households, comprising 11,012, and the most common type of nonfamily households are 1-person households, comprising 5,704.
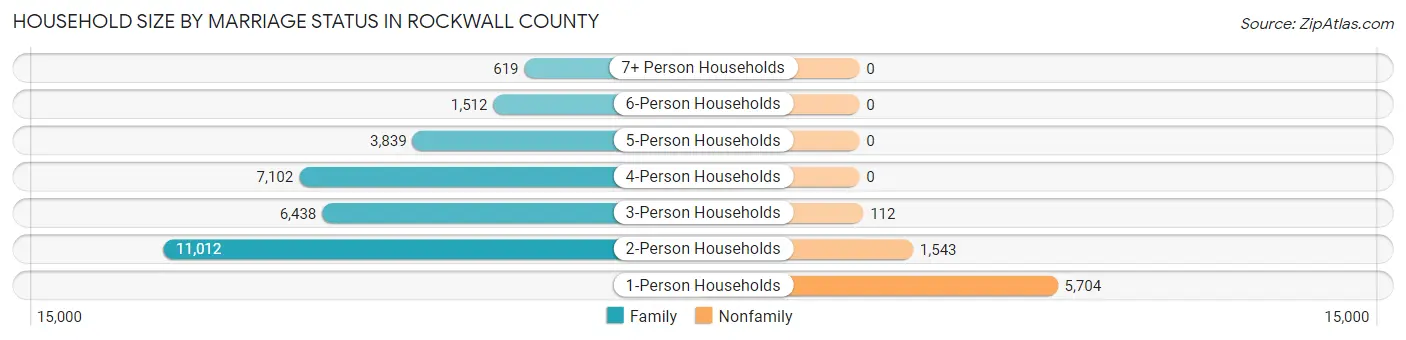
| Household Size | Family Households | Nonfamily Households |
| 1-Person Households | - | 5,704 (15.1%) |
| 2-Person Households | 11,012 (29.1%) | 1,543 (4.1%) |
| 3-Person Households | 6,438 (17.0%) | 112 (0.3%) |
| 4-Person Households | 7,102 (18.8%) | 0 (0.0%) |
| 5-Person Households | 3,839 (10.1%) | 0 (0.0%) |
| 6-Person Households | 1,512 (4.0%) | 0 (0.0%) |
| 7+ Person Households | 619 (1.6%) | 0 (0.0%) |
| Total | 30,522 (80.6%) | 7,359 (19.4%) |
Female Fertility in Rockwall County
Fertility by Age in Rockwall County
Average fertility rate in Rockwall County is 56.0 births per 1,000 women. Women in the age bracket of 20 to 34 years have the highest fertility rate with 115.0 births per 1,000 women. Women in the age bracket of 20 to 34 years acount for 70.1% of all women with births.
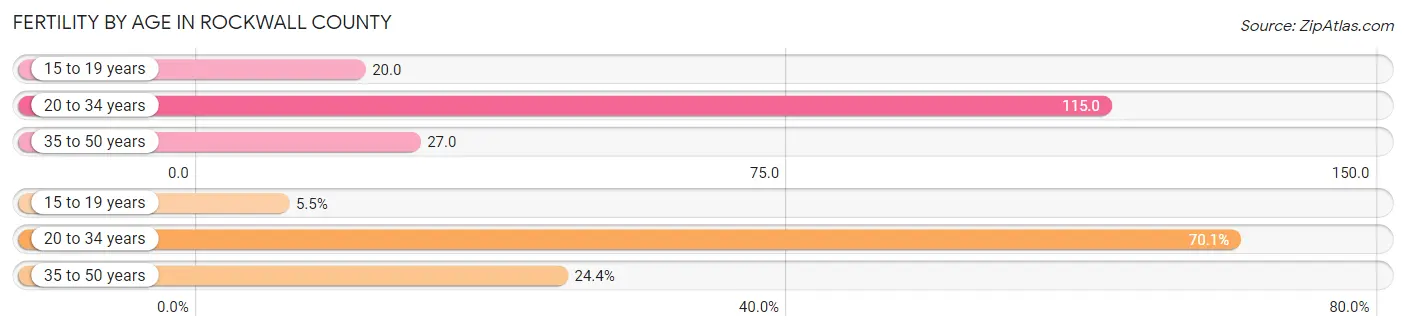
| Age Bracket | Women with Births | Births / 1,000 Women |
| 15 to 19 years | 83 (5.5%) | 20.0 |
| 20 to 34 years | 1,060 (70.1%) | 115.0 |
| 35 to 50 years | 369 (24.4%) | 27.0 |
| Total | 1,512 (100.0%) | 56.0 |
Fertility by Age by Marriage Status in Rockwall County
82.8% of women with births (1,512) in Rockwall County are married. The highest percentage of unmarried women with births falls into 20 to 34 years age bracket with 24.2% of them unmarried at the time of birth, while the lowest percentage of unmarried women with births belong to 35 to 50 years age bracket with 0.0% of them unmarried.
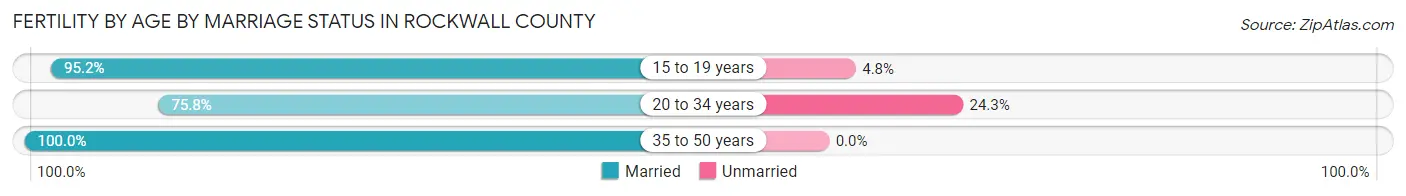
| Age Bracket | Married | Unmarried |
| 15 to 19 years | 79 (95.2%) | 4 (4.8%) |
| 20 to 34 years | 803 (75.7%) | 257 (24.2%) |
| 35 to 50 years | 369 (100.0%) | 0 (0.0%) |
| Total | 1,252 (82.8%) | 260 (17.2%) |
Fertility by Education in Rockwall County
Average fertility rate in Rockwall County is 56.0 births per 1,000 women. Women with the education attainment of graduate degree have the highest fertility rate of 78.0 births per 1,000 women, while women with the education attainment of high school diploma have the lowest fertility at 22.0 births per 1,000 women. Women with the education attainment of college or associate's degree represent 35.8% of all women with births.
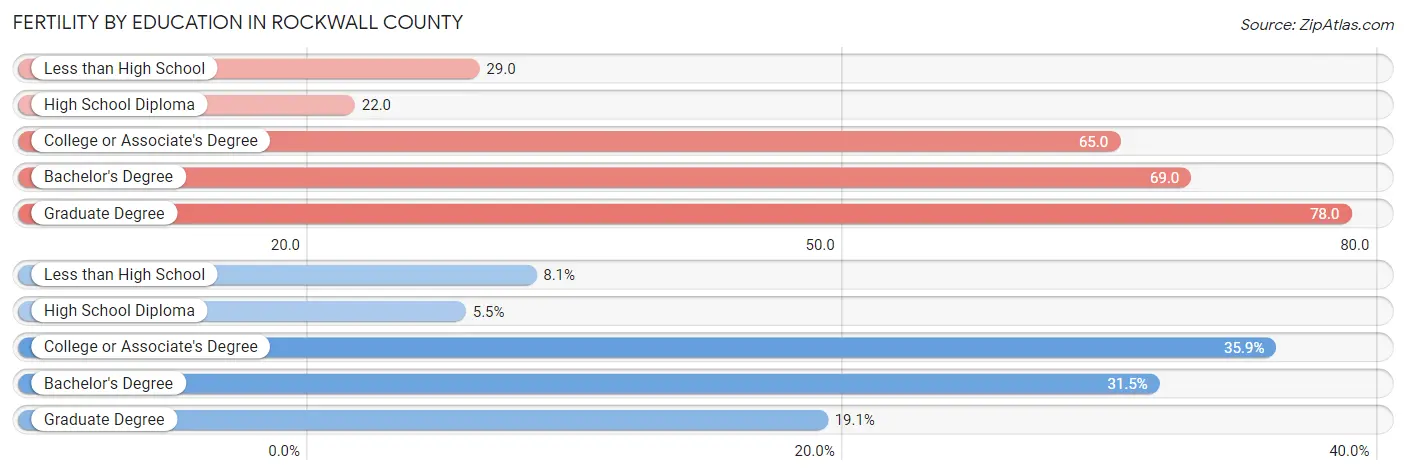
| Educational Attainment | Women with Births | Births / 1,000 Women |
| Less than High School | 123 (8.1%) | 29.0 |
| High School Diploma | 83 (5.5%) | 22.0 |
| College or Associate's Degree | 542 (35.8%) | 65.0 |
| Bachelor's Degree | 476 (31.5%) | 69.0 |
| Graduate Degree | 288 (19.1%) | 78.0 |
| Total | 1,512 (100.0%) | 56.0 |
Fertility by Education by Marriage Status in Rockwall County
17.2% of women with births in Rockwall County are unmarried. Women with the educational attainment of graduate degree are most likely to be married with 100.0% of them married at childbirth, while women with the educational attainment of less than high school are least likely to be married with 42.3% of them unmarried at childbirth.
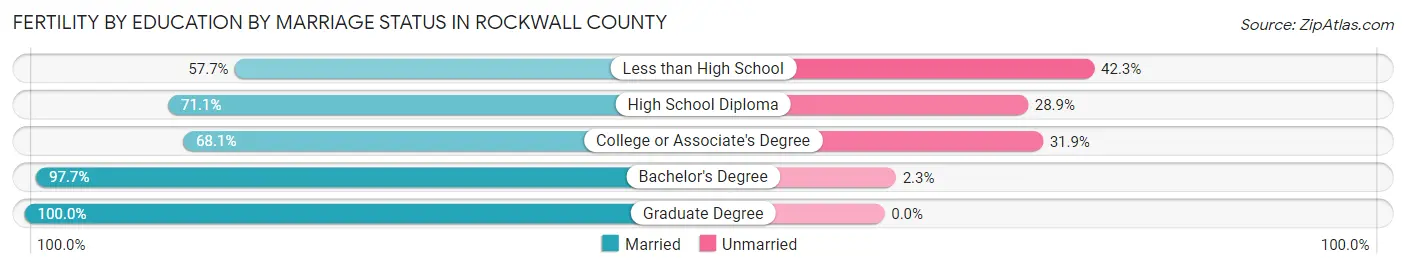
| Educational Attainment | Married | Unmarried |
| Less than High School | 71 (57.7%) | 52 (42.3%) |
| High School Diploma | 59 (71.1%) | 24 (28.9%) |
| College or Associate's Degree | 369 (68.1%) | 173 (31.9%) |
| Bachelor's Degree | 465 (97.7%) | 11 (2.3%) |
| Graduate Degree | 288 (100.0%) | 0 (0.0%) |
| Total | 1,252 (82.8%) | 260 (17.2%) |
Employment Characteristics in Rockwall County
Employment by Class of Employer in Rockwall County
Among the 56,151 employed individuals in Rockwall County, private company employees (39,205 | 69.8%), local government employees (4,366 | 7.8%), and self-employed (not incorporated) (3,199 | 5.7%) make up the most common classes of employment.
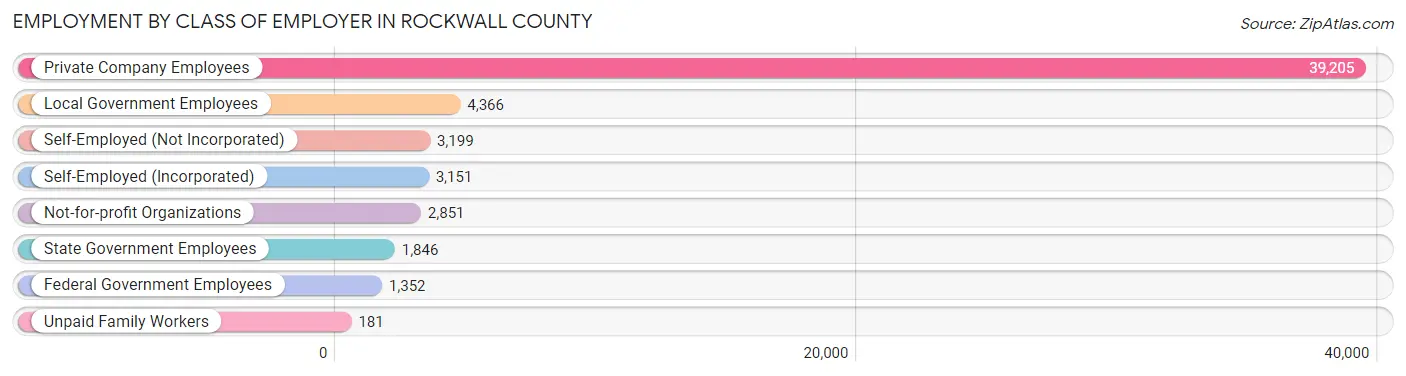
| Employer Class | # Employees | % Employees |
| Private Company Employees | 39,205 | 69.8% |
| Self-Employed (Incorporated) | 3,151 | 5.6% |
| Self-Employed (Not Incorporated) | 3,199 | 5.7% |
| Not-for-profit Organizations | 2,851 | 5.1% |
| Local Government Employees | 4,366 | 7.8% |
| State Government Employees | 1,846 | 3.3% |
| Federal Government Employees | 1,352 | 2.4% |
| Unpaid Family Workers | 181 | 0.3% |
| Total | 56,151 | 100.0% |
Employment Status by Age in Rockwall County
According to the labor force statistics for Rockwall County, out of the total population over 16 years of age (84,767), 70.3% or 59,591 individuals are in the labor force, with 3.9% or 2,324 of them unemployed. The age group with the highest labor force participation rate is 45 to 54 years, with 88.1% or 13,515 individuals in the labor force. Within the labor force, the 16 to 19 years age range has the highest percentage of unemployed individuals, with 18.9% or 503 of them being unemployed.
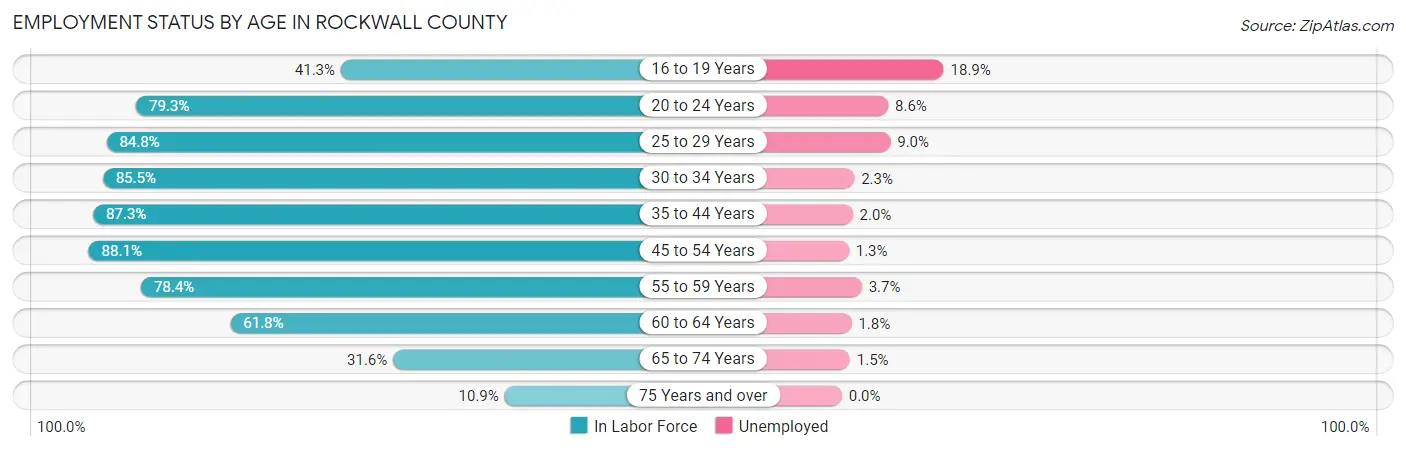
| Age Bracket | In Labor Force | Unemployed |
| 16 to 19 Years | 2,663 (41.3%) | 503 (18.9%) |
| 20 to 24 Years | 4,977 (79.3%) | 428 (8.6%) |
| 25 to 29 Years | 5,052 (84.8%) | 455 (9.0%) |
| 30 to 34 Years | 5,540 (85.5%) | 127 (2.3%) |
| 35 to 44 Years | 15,104 (87.3%) | 302 (2.0%) |
| 45 to 54 Years | 13,515 (88.1%) | 176 (1.3%) |
| 55 to 59 Years | 6,050 (78.4%) | 224 (3.7%) |
| 60 to 64 Years | 3,444 (61.8%) | 62 (1.8%) |
| 65 to 74 Years | 2,646 (31.6%) | 40 (1.5%) |
| 75 Years and over | 578 (10.9%) | 0 (0.0%) |
| Total | 59,591 (70.3%) | 2,324 (3.9%) |
Employment Status by Educational Attainment in Rockwall County
According to labor force statistics for Rockwall County, 83.4% of individuals (48,679) out of the total population between 25 and 64 years of age (58,368) are in the labor force, with 2.7% or 1,314 of them being unemployed. The group with the highest labor force participation rate are those with the educational attainment of bachelor's degree or higher, with 87.9% or 23,315 individuals in the labor force. Within the labor force, individuals with less than high school education have the highest percentage of unemployment, with 5.2% or 126 of them being unemployed.
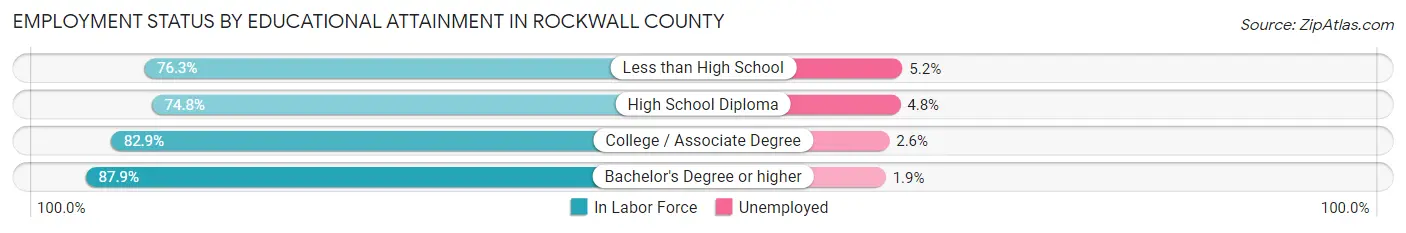
| Educational Attainment | In Labor Force | Unemployed |
| Less than High School | 2,424 (76.3%) | 165 (5.2%) |
| High School Diploma | 7,537 (74.8%) | 484 (4.8%) |
| College / Associate Degree | 15,411 (82.9%) | 483 (2.6%) |
| Bachelor's Degree or higher | 23,315 (87.9%) | 504 (1.9%) |
| Total | 48,679 (83.4%) | 1,576 (2.7%) |
Employment Occupations by Sex in Rockwall County
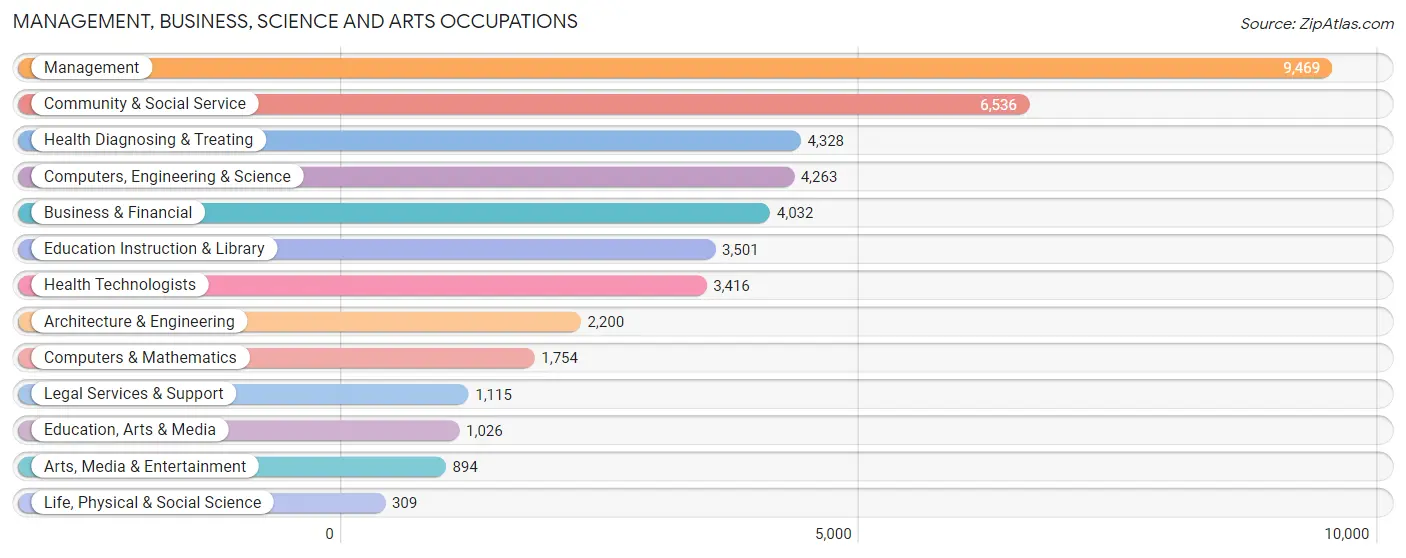
Management, Business, Science and Arts Occupations
The most common Management, Business, Science and Arts occupations in Rockwall County are Management (9,469 | 16.6%), Community & Social Service (6,536 | 11.4%), Health Diagnosing & Treating (4,328 | 7.6%), Computers, Engineering & Science (4,263 | 7.4%), and Business & Financial (4,032 | 7.0%).
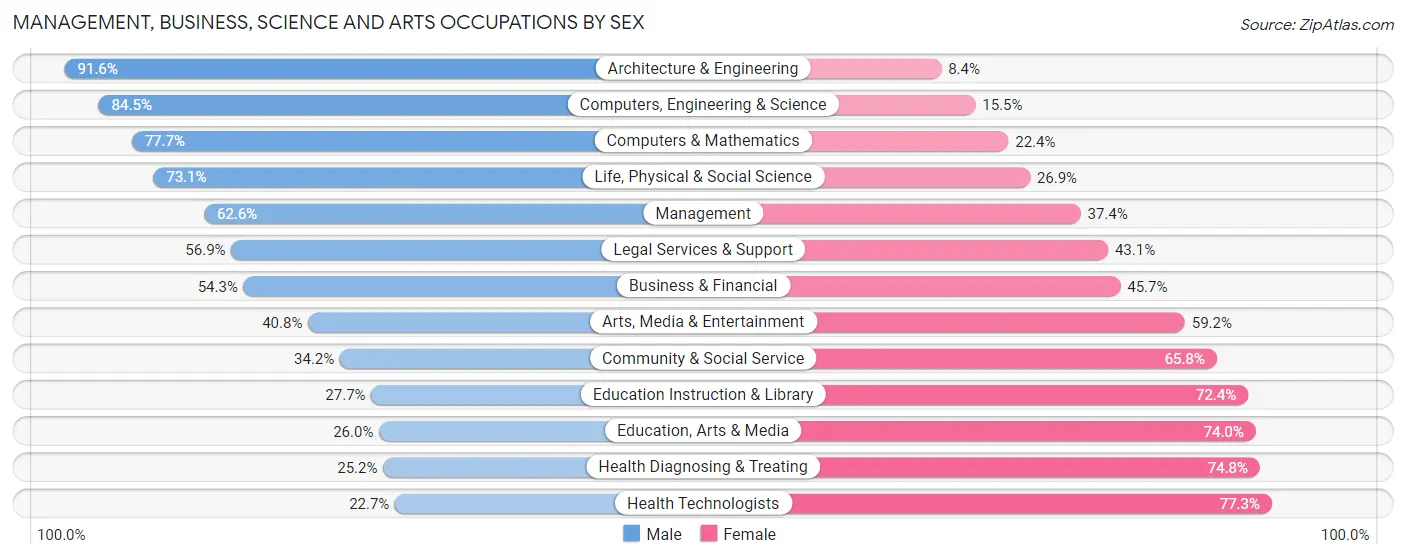
Management, Business, Science and Arts Occupations by Sex
Within the Management, Business, Science and Arts occupations in Rockwall County, the most male-oriented occupations are Architecture & Engineering (91.6%), Computers, Engineering & Science (84.5%), and Computers & Mathematics (77.6%), while the most female-oriented occupations are Health Technologists (77.3%), Health Diagnosing & Treating (74.8%), and Education, Arts & Media (74.0%).
| Occupation | Male | Female |
| Management | 5,926 (62.6%) | 3,543 (37.4%) |
| Business & Financial | 2,189 (54.3%) | 1,843 (45.7%) |
| Computers, Engineering & Science | 3,604 (84.5%) | 659 (15.5%) |
| Computers & Mathematics | 1,362 (77.6%) | 392 (22.4%) |
| Architecture & Engineering | 2,016 (91.6%) | 184 (8.4%) |
| Life, Physical & Social Science | 226 (73.1%) | 83 (26.9%) |
| Community & Social Service | 2,234 (34.2%) | 4,302 (65.8%) |
| Education, Arts & Media | 267 (26.0%) | 759 (74.0%) |
| Legal Services & Support | 634 (56.9%) | 481 (43.1%) |
| Education Instruction & Library | 968 (27.7%) | 2,533 (72.4%) |
| Arts, Media & Entertainment | 365 (40.8%) | 529 (59.2%) |
| Health Diagnosing & Treating | 1,090 (25.2%) | 3,238 (74.8%) |
| Health Technologists | 775 (22.7%) | 2,641 (77.3%) |
| Total (Category) | 15,043 (52.5%) | 13,585 (47.4%) |
| Total (Overall) | 30,761 (53.8%) | 26,428 (46.2%) |
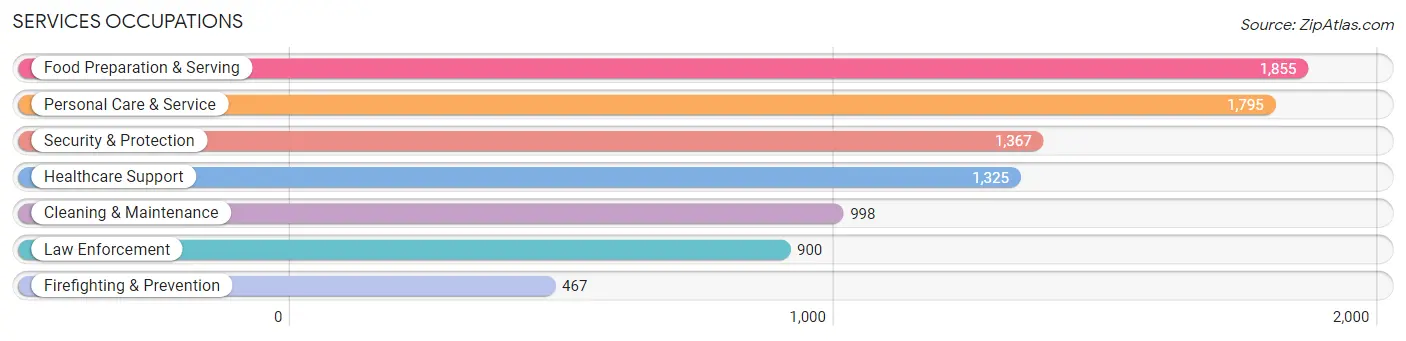
Services Occupations
The most common Services occupations in Rockwall County are Food Preparation & Serving (1,855 | 3.2%), Personal Care & Service (1,795 | 3.1%), Security & Protection (1,367 | 2.4%), Healthcare Support (1,325 | 2.3%), and Cleaning & Maintenance (998 | 1.8%).
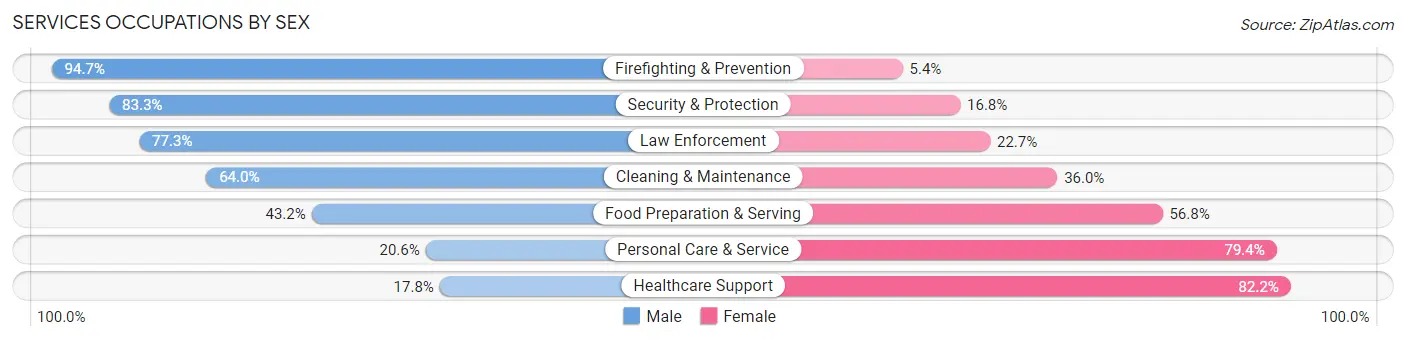
Services Occupations by Sex
Within the Services occupations in Rockwall County, the most male-oriented occupations are Firefighting & Prevention (94.7%), Security & Protection (83.3%), and Law Enforcement (77.3%), while the most female-oriented occupations are Healthcare Support (82.2%), Personal Care & Service (79.4%), and Food Preparation & Serving (56.8%).
| Occupation | Male | Female |
| Healthcare Support | 236 (17.8%) | 1,089 (82.2%) |
| Security & Protection | 1,138 (83.3%) | 229 (16.8%) |
| Firefighting & Prevention | 442 (94.7%) | 25 (5.3%) |
| Law Enforcement | 696 (77.3%) | 204 (22.7%) |
| Food Preparation & Serving | 801 (43.2%) | 1,054 (56.8%) |
| Cleaning & Maintenance | 639 (64.0%) | 359 (36.0%) |
| Personal Care & Service | 370 (20.6%) | 1,425 (79.4%) |
| Total (Category) | 3,184 (43.4%) | 4,156 (56.6%) |
| Total (Overall) | 30,761 (53.8%) | 26,428 (46.2%) |
Sales and Office Occupations
The most common Sales and Office occupations in Rockwall County are Sales & Related (6,521 | 11.4%), and Office & Administration (6,465 | 11.3%).

Sales and Office Occupations by Sex
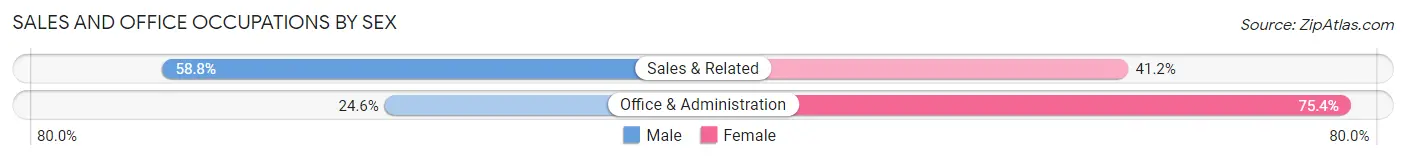
| Occupation | Male | Female |
| Sales & Related | 3,832 (58.8%) | 2,689 (41.2%) |
| Office & Administration | 1,591 (24.6%) | 4,874 (75.4%) |
| Total (Category) | 5,423 (41.8%) | 7,563 (58.2%) |
| Total (Overall) | 30,761 (53.8%) | 26,428 (46.2%) |
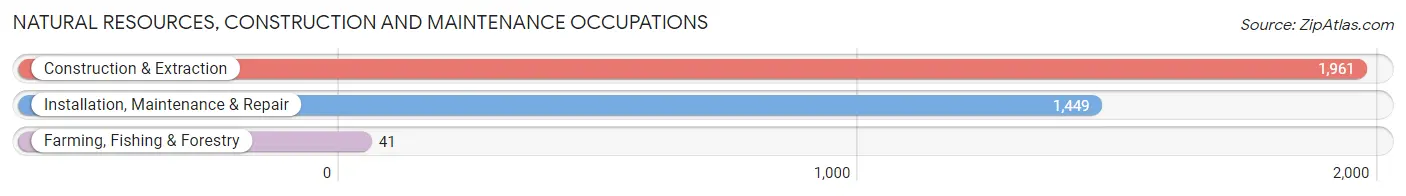
Natural Resources, Construction and Maintenance Occupations
The most common Natural Resources, Construction and Maintenance occupations in Rockwall County are Construction & Extraction (1,961 | 3.4%), Installation, Maintenance & Repair (1,449 | 2.5%), and Farming, Fishing & Forestry (41 | 0.1%).
Natural Resources, Construction and Maintenance Occupations by Sex
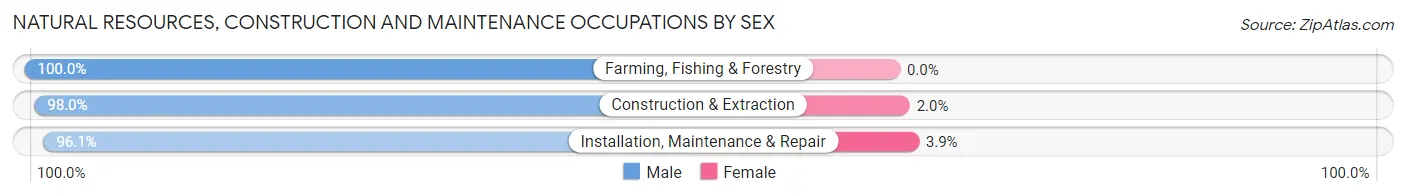
| Occupation | Male | Female |
| Farming, Fishing & Forestry | 41 (100.0%) | 0 (0.0%) |
| Construction & Extraction | 1,921 (98.0%) | 40 (2.0%) |
| Installation, Maintenance & Repair | 1,392 (96.1%) | 57 (3.9%) |
| Total (Category) | 3,354 (97.2%) | 97 (2.8%) |
| Total (Overall) | 30,761 (53.8%) | 26,428 (46.2%) |
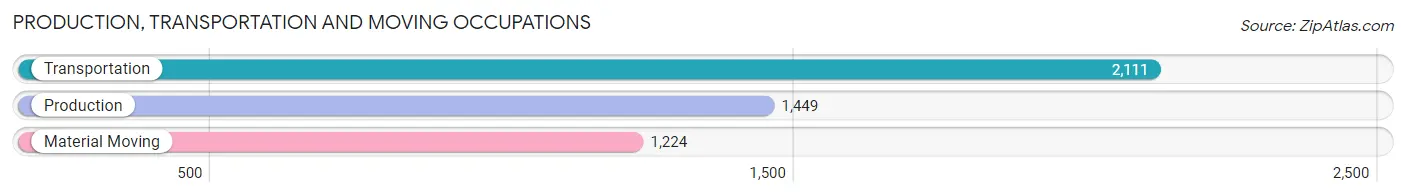
Production, Transportation and Moving Occupations
The most common Production, Transportation and Moving occupations in Rockwall County are Transportation (2,111 | 3.7%), Production (1,449 | 2.5%), and Material Moving (1,224 | 2.1%).
Production, Transportation and Moving Occupations by Sex
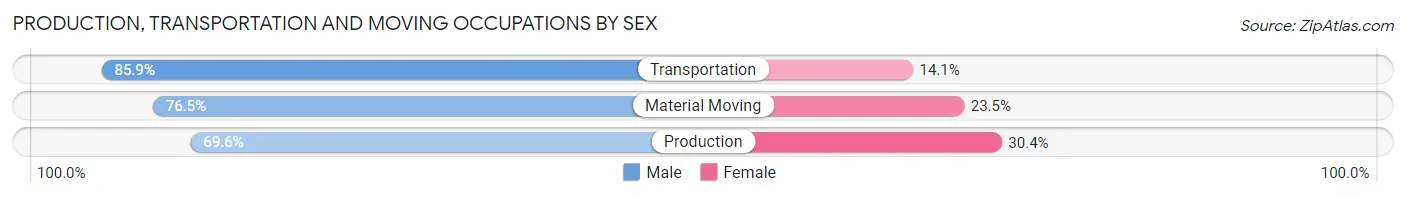
| Occupation | Male | Female |
| Production | 1,008 (69.6%) | 441 (30.4%) |
| Transportation | 1,813 (85.9%) | 298 (14.1%) |
| Material Moving | 936 (76.5%) | 288 (23.5%) |
| Total (Category) | 3,757 (78.5%) | 1,027 (21.5%) |
| Total (Overall) | 30,761 (53.8%) | 26,428 (46.2%) |
Employment Industries by Sex in Rockwall County
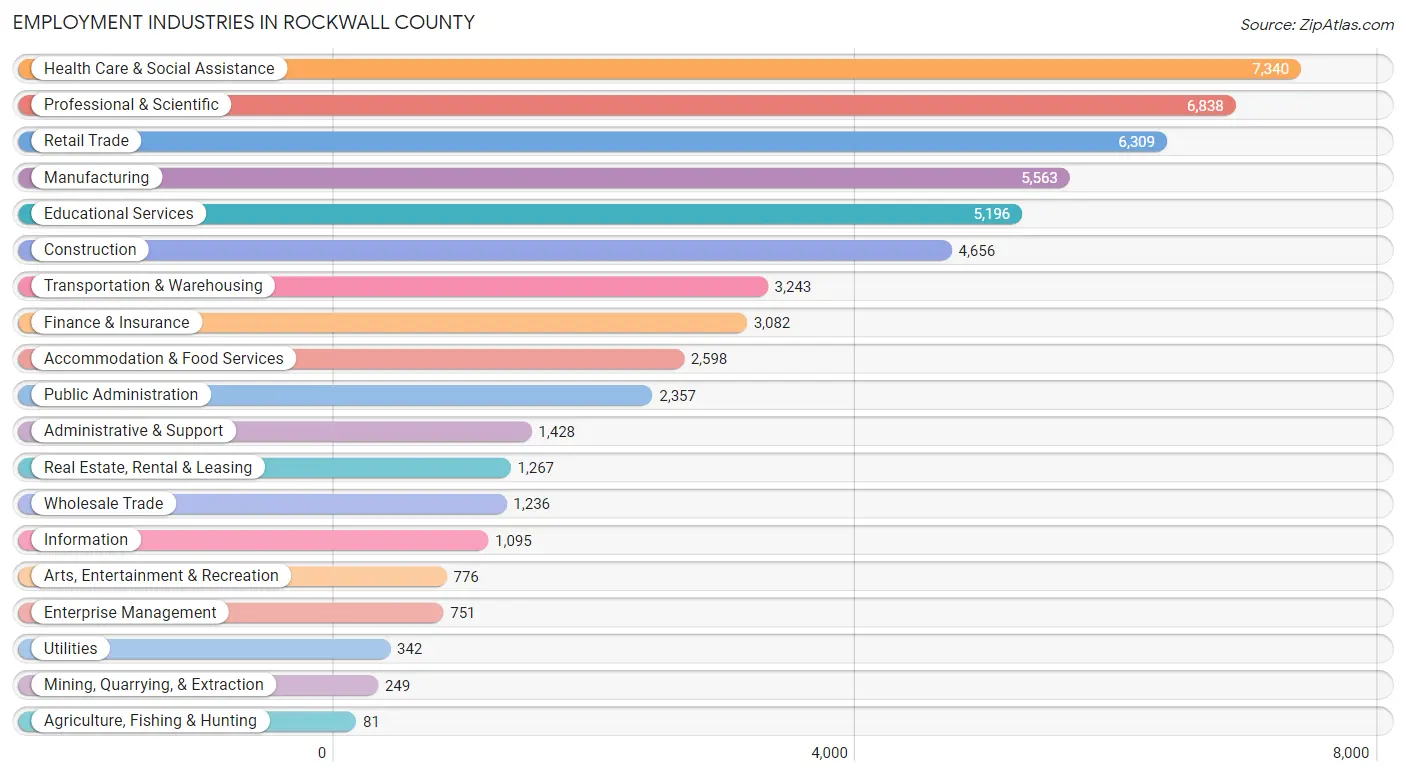
Employment Industries in Rockwall County
The major employment industries in Rockwall County include Health Care & Social Assistance (7,340 | 12.8%), Professional & Scientific (6,838 | 12.0%), Retail Trade (6,309 | 11.0%), Manufacturing (5,563 | 9.7%), and Educational Services (5,196 | 9.1%).
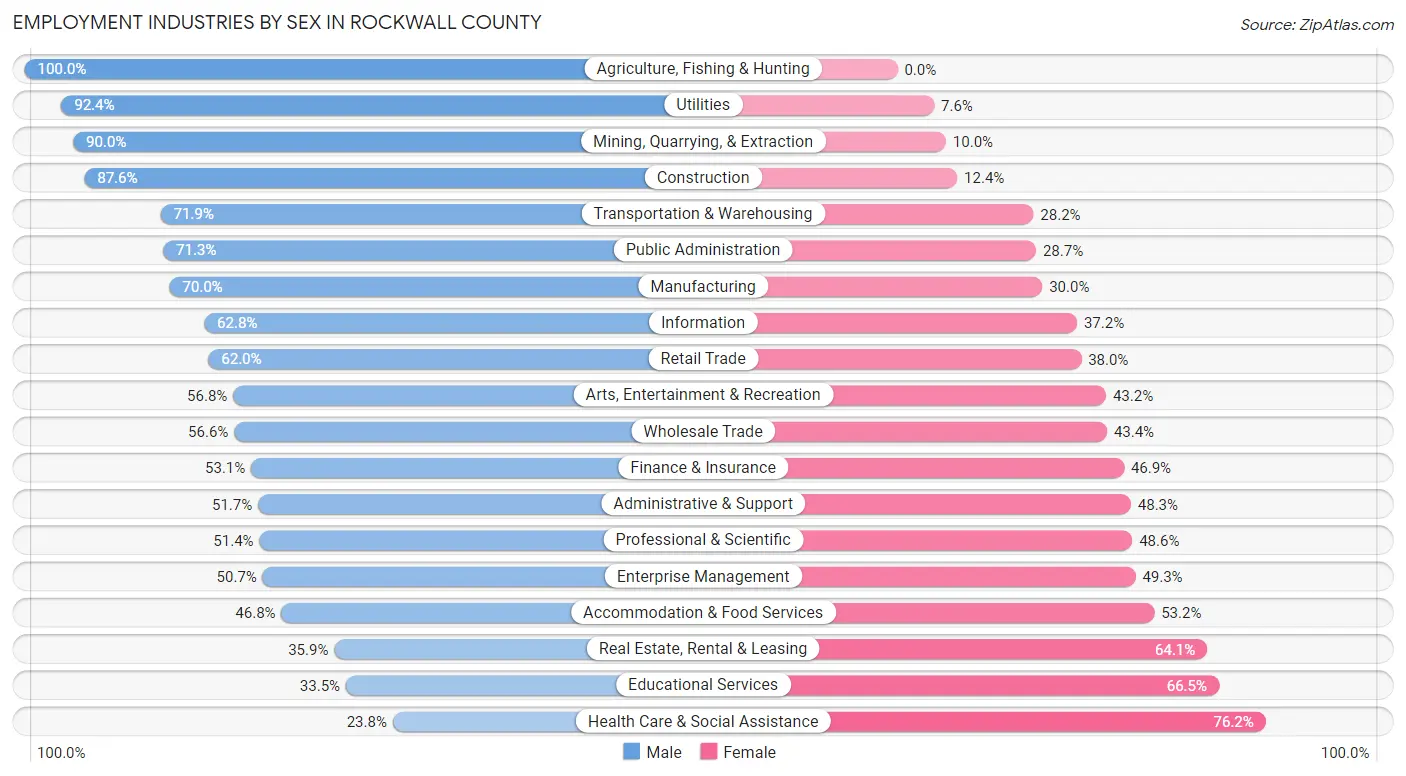
Employment Industries by Sex in Rockwall County
The Rockwall County industries that see more men than women are Agriculture, Fishing & Hunting (100.0%), Utilities (92.4%), and Mining, Quarrying, & Extraction (90.0%), whereas the industries that tend to have a higher number of women are Health Care & Social Assistance (76.2%), Educational Services (66.5%), and Real Estate, Rental & Leasing (64.1%).
| Industry | Male | Female |
| Agriculture, Fishing & Hunting | 81 (100.0%) | 0 (0.0%) |
| Mining, Quarrying, & Extraction | 224 (90.0%) | 25 (10.0%) |
| Construction | 4,080 (87.6%) | 576 (12.4%) |
| Manufacturing | 3,895 (70.0%) | 1,668 (30.0%) |
| Wholesale Trade | 700 (56.6%) | 536 (43.4%) |
| Retail Trade | 3,909 (62.0%) | 2,400 (38.0%) |
| Transportation & Warehousing | 2,330 (71.9%) | 913 (28.1%) |
| Utilities | 316 (92.4%) | 26 (7.6%) |
| Information | 688 (62.8%) | 407 (37.2%) |
| Finance & Insurance | 1,637 (53.1%) | 1,445 (46.9%) |
| Real Estate, Rental & Leasing | 455 (35.9%) | 812 (64.1%) |
| Professional & Scientific | 3,515 (51.4%) | 3,323 (48.6%) |
| Enterprise Management | 381 (50.7%) | 370 (49.3%) |
| Administrative & Support | 738 (51.7%) | 690 (48.3%) |
| Educational Services | 1,740 (33.5%) | 3,456 (66.5%) |
| Health Care & Social Assistance | 1,747 (23.8%) | 5,593 (76.2%) |
| Arts, Entertainment & Recreation | 441 (56.8%) | 335 (43.2%) |
| Accommodation & Food Services | 1,217 (46.8%) | 1,381 (53.2%) |
| Public Administration | 1,681 (71.3%) | 676 (28.7%) |
| Total | 30,761 (53.8%) | 26,428 (46.2%) |
Education in Rockwall County
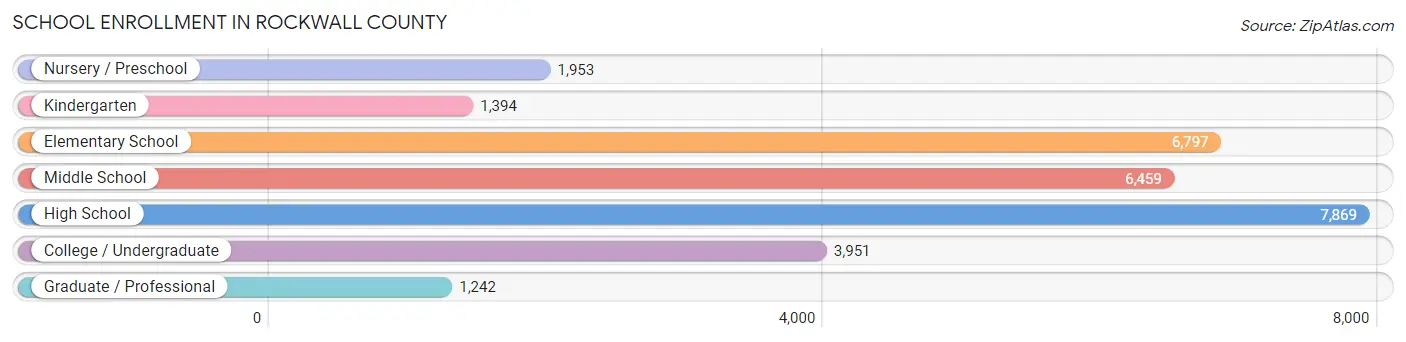
School Enrollment in Rockwall County
The most common levels of schooling among the 29,665 students in Rockwall County are high school (7,869 | 26.5%), elementary school (6,797 | 22.9%), and middle school (6,459 | 21.8%).
| School Level | # Students | % Students |
| Nursery / Preschool | 1,953 | 6.6% |
| Kindergarten | 1,394 | 4.7% |
| Elementary School | 6,797 | 22.9% |
| Middle School | 6,459 | 21.8% |
| High School | 7,869 | 26.5% |
| College / Undergraduate | 3,951 | 13.3% |
| Graduate / Professional | 1,242 | 4.2% |
| Total | 29,665 | 100.0% |
School Enrollment by Age by Funding Source in Rockwall County
Out of a total of 29,665 students who are enrolled in schools in Rockwall County, 4,123 (13.9%) attend a private institution, while the remaining 25,542 (86.1%) are enrolled in public schools. The age group of 3 to 4 year olds has the highest likelihood of being enrolled in private schools, with 796 (55.4% in the age bracket) enrolled. Conversely, the age group of 15 to 17 year olds has the lowest likelihood of being enrolled in a private school, with 5,181 (94.4% in the age bracket) attending a public institution.
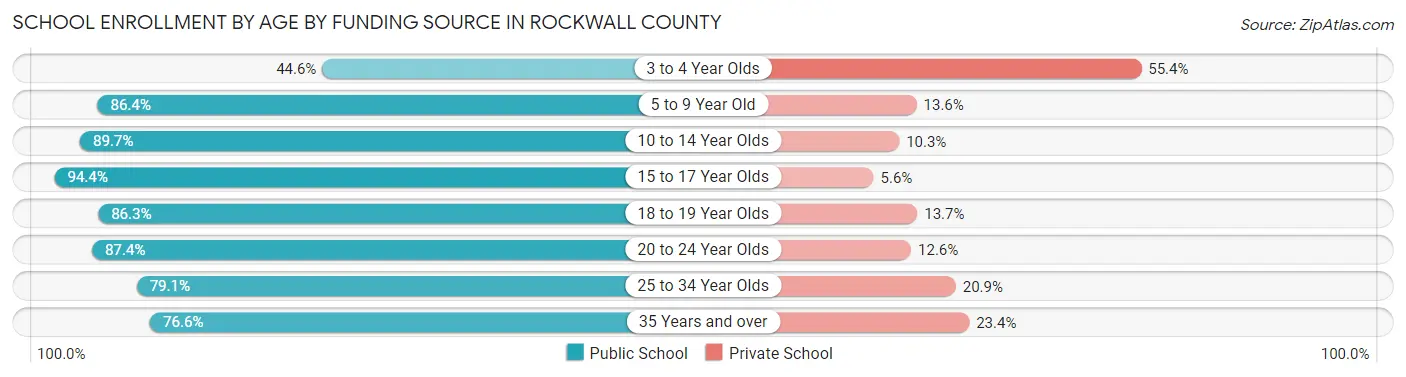
| Age Bracket | Public School | Private School |
| 3 to 4 Year Olds | 640 (44.6%) | 796 (55.4%) |
| 5 to 9 Year Old | 6,757 (86.4%) | 1,063 (13.6%) |
| 10 to 14 Year Olds | 7,737 (89.7%) | 892 (10.3%) |
| 15 to 17 Year Olds | 5,181 (94.4%) | 306 (5.6%) |
| 18 to 19 Year Olds | 1,742 (86.3%) | 277 (13.7%) |
| 20 to 24 Year Olds | 1,504 (87.4%) | 216 (12.6%) |
| 25 to 34 Year Olds | 962 (79.1%) | 254 (20.9%) |
| 35 Years and over | 1,025 (76.6%) | 313 (23.4%) |
| Total | 25,542 (86.1%) | 4,123 (13.9%) |
Educational Attainment by Field of Study in Rockwall County
Business (8,547 | 24.8%), education (3,525 | 10.2%), science & technology (3,494 | 10.2%), engineering (2,977 | 8.6%), and arts & humanities (2,380 | 6.9%) are the most common fields of study among 34,407 individuals in Rockwall County who have obtained a bachelor's degree or higher.
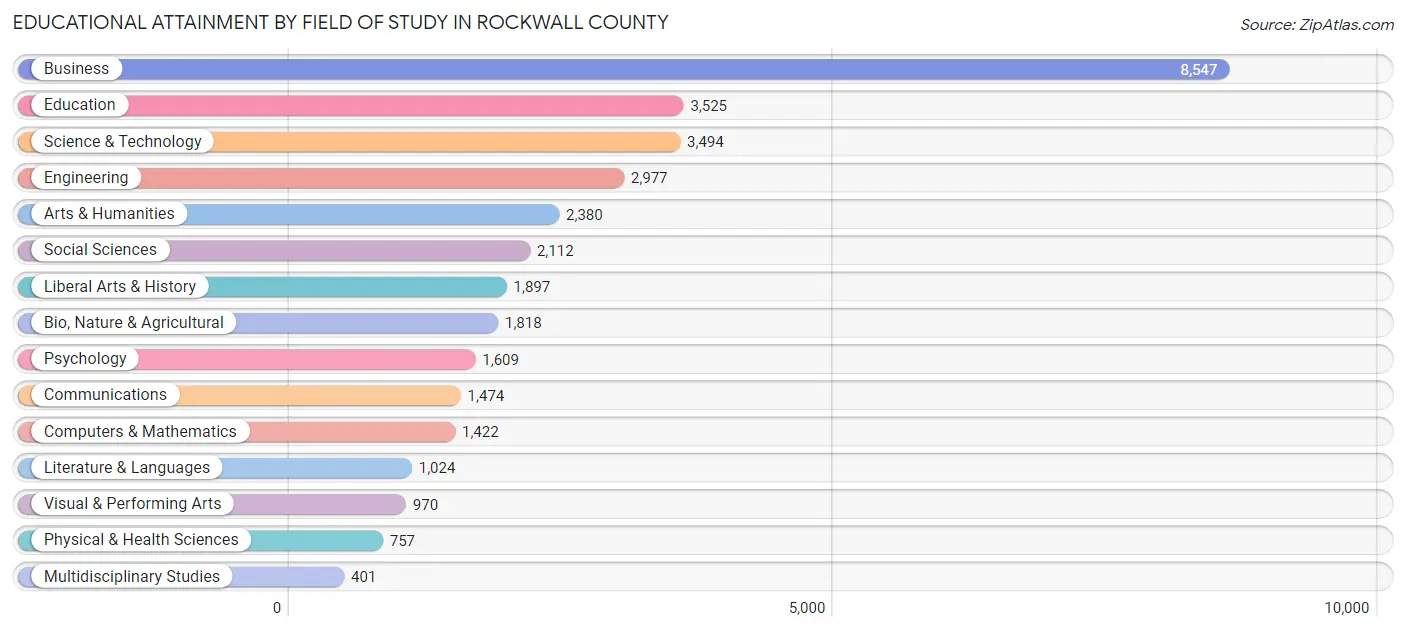
| Field of Study | # Graduates | % Graduates |
| Computers & Mathematics | 1,422 | 4.1% |
| Bio, Nature & Agricultural | 1,818 | 5.3% |
| Physical & Health Sciences | 757 | 2.2% |
| Psychology | 1,609 | 4.7% |
| Social Sciences | 2,112 | 6.1% |
| Engineering | 2,977 | 8.6% |
| Multidisciplinary Studies | 401 | 1.2% |
| Science & Technology | 3,494 | 10.2% |
| Business | 8,547 | 24.8% |
| Education | 3,525 | 10.2% |
| Literature & Languages | 1,024 | 3.0% |
| Liberal Arts & History | 1,897 | 5.5% |
| Visual & Performing Arts | 970 | 2.8% |
| Communications | 1,474 | 4.3% |
| Arts & Humanities | 2,380 | 6.9% |
| Total | 34,407 | 100.0% |
Transportation & Commute in Rockwall County
Vehicle Availability by Sex in Rockwall County
The most prevalent vehicle ownership categories in Rockwall County are males with 2 vehicles (13,995, accounting for 46.3%) and females with 2 vehicles (11,719, making up 53.9%).
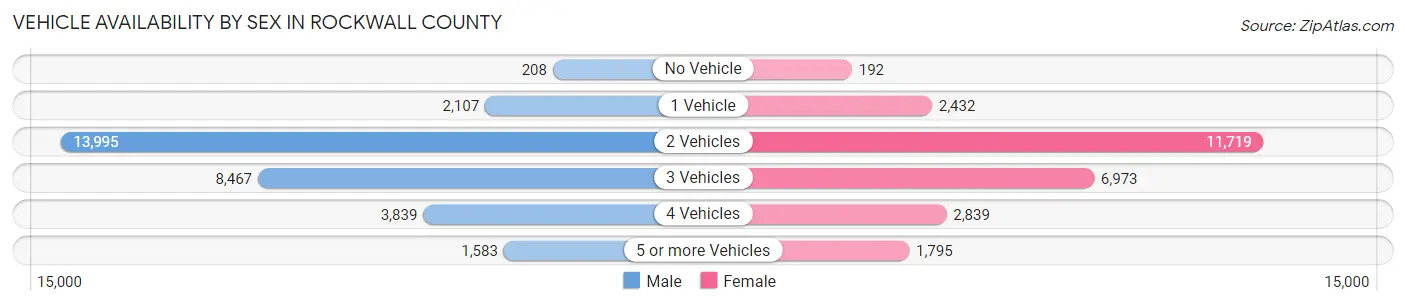
| Vehicles Available | Male | Female |
| No Vehicle | 208 (0.7%) | 192 (0.7%) |
| 1 Vehicle | 2,107 (7.0%) | 2,432 (9.4%) |
| 2 Vehicles | 13,995 (46.3%) | 11,719 (45.2%) |
| 3 Vehicles | 8,467 (28.0%) | 6,973 (26.9%) |
| 4 Vehicles | 3,839 (12.7%) | 2,839 (10.9%) |
| 5 or more Vehicles | 1,583 (5.2%) | 1,795 (6.9%) |
| Total | 30,199 (100.0%) | 25,950 (100.0%) |
Commute Time in Rockwall County
The most frequently occuring commute durations in Rockwall County are 45 to 59 minutes (8,050 commuters, 16.8%), 30 to 34 minutes (6,679 commuters, 14.0%), and 60 to 89 minutes (6,038 commuters, 12.6%).
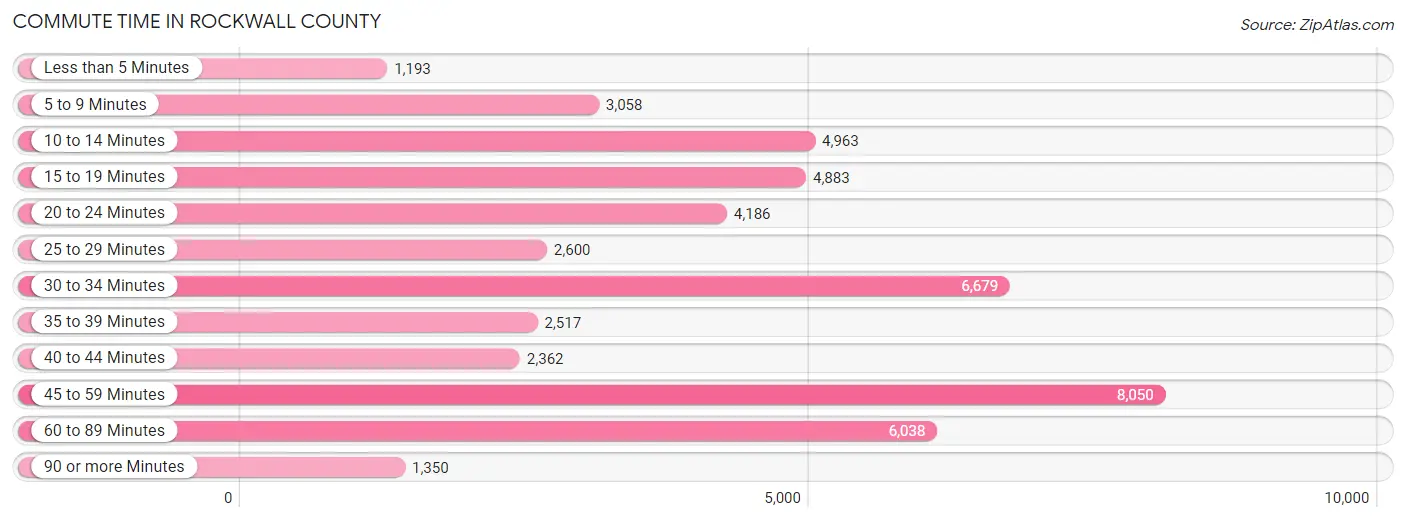
| Commute Time | # Commuters | % Commuters |
| Less than 5 Minutes | 1,193 | 2.5% |
| 5 to 9 Minutes | 3,058 | 6.4% |
| 10 to 14 Minutes | 4,963 | 10.4% |
| 15 to 19 Minutes | 4,883 | 10.2% |
| 20 to 24 Minutes | 4,186 | 8.7% |
| 25 to 29 Minutes | 2,600 | 5.4% |
| 30 to 34 Minutes | 6,679 | 14.0% |
| 35 to 39 Minutes | 2,517 | 5.3% |
| 40 to 44 Minutes | 2,362 | 4.9% |
| 45 to 59 Minutes | 8,050 | 16.8% |
| 60 to 89 Minutes | 6,038 | 12.6% |
| 90 or more Minutes | 1,350 | 2.8% |
Commute Time by Sex in Rockwall County
The most common commute times in Rockwall County are 45 to 59 minutes (4,706 commuters, 18.1%) for males and 45 to 59 minutes (3,344 commuters, 15.3%) for females.
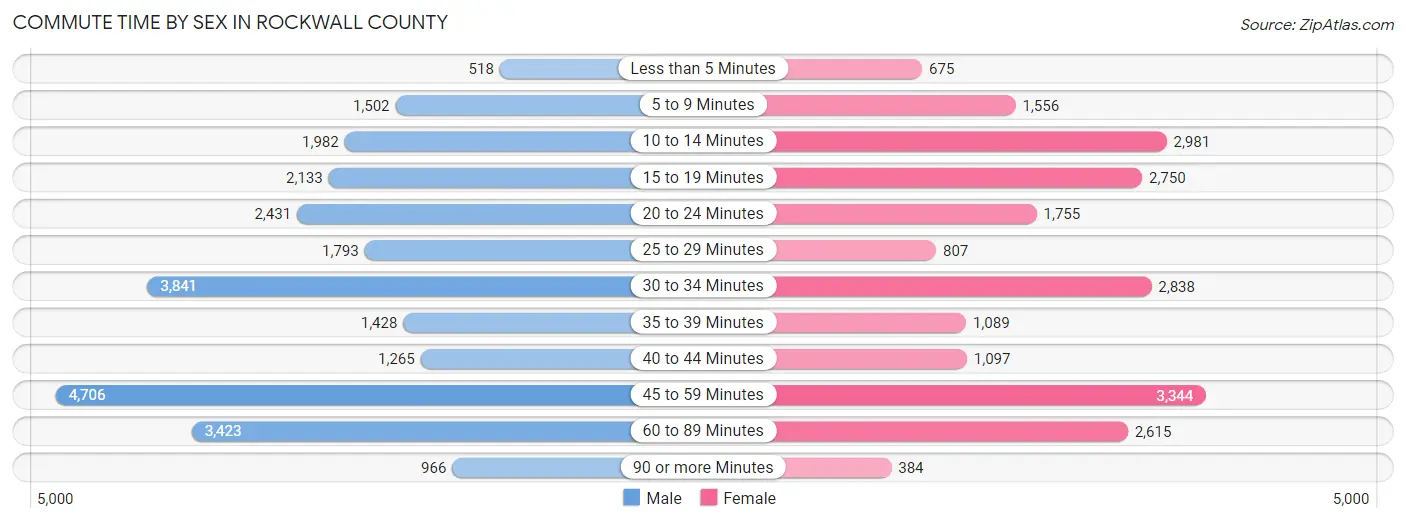
| Commute Time | Male | Female |
| Less than 5 Minutes | 518 (2.0%) | 675 (3.1%) |
| 5 to 9 Minutes | 1,502 (5.8%) | 1,556 (7.1%) |
| 10 to 14 Minutes | 1,982 (7.6%) | 2,981 (13.6%) |
| 15 to 19 Minutes | 2,133 (8.2%) | 2,750 (12.6%) |
| 20 to 24 Minutes | 2,431 (9.3%) | 1,755 (8.0%) |
| 25 to 29 Minutes | 1,793 (6.9%) | 807 (3.7%) |
| 30 to 34 Minutes | 3,841 (14.8%) | 2,838 (13.0%) |
| 35 to 39 Minutes | 1,428 (5.5%) | 1,089 (5.0%) |
| 40 to 44 Minutes | 1,265 (4.9%) | 1,097 (5.0%) |
| 45 to 59 Minutes | 4,706 (18.1%) | 3,344 (15.3%) |
| 60 to 89 Minutes | 3,423 (13.2%) | 2,615 (11.9%) |
| 90 or more Minutes | 966 (3.7%) | 384 (1.8%) |
Time of Departure to Work by Sex in Rockwall County
The most frequent times of departure to work in Rockwall County are 7:00 AM to 7:29 AM (3,712, 14.3%) for males and 7:00 AM to 7:29 AM (3,634, 16.6%) for females.
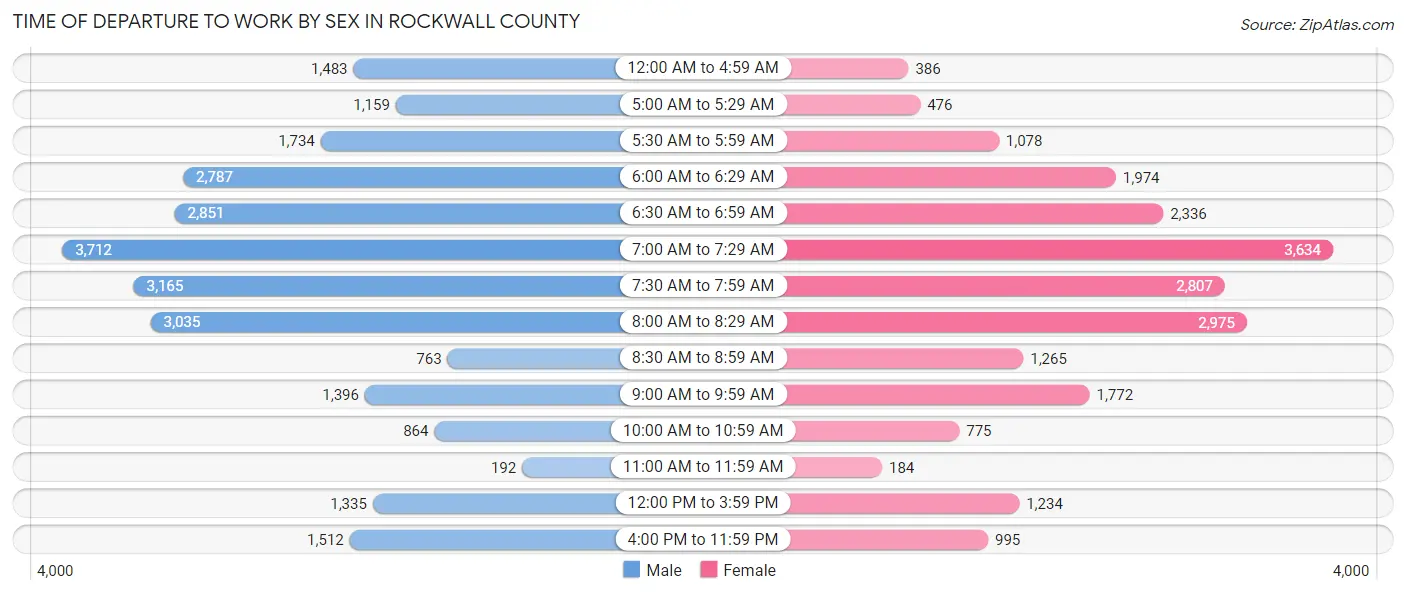
| Time of Departure | Male | Female |
| 12:00 AM to 4:59 AM | 1,483 (5.7%) | 386 (1.8%) |
| 5:00 AM to 5:29 AM | 1,159 (4.5%) | 476 (2.2%) |
| 5:30 AM to 5:59 AM | 1,734 (6.7%) | 1,078 (4.9%) |
| 6:00 AM to 6:29 AM | 2,787 (10.7%) | 1,974 (9.0%) |
| 6:30 AM to 6:59 AM | 2,851 (11.0%) | 2,336 (10.7%) |
| 7:00 AM to 7:29 AM | 3,712 (14.3%) | 3,634 (16.6%) |
| 7:30 AM to 7:59 AM | 3,165 (12.2%) | 2,807 (12.8%) |
| 8:00 AM to 8:29 AM | 3,035 (11.7%) | 2,975 (13.6%) |
| 8:30 AM to 8:59 AM | 763 (2.9%) | 1,265 (5.8%) |
| 9:00 AM to 9:59 AM | 1,396 (5.4%) | 1,772 (8.1%) |
| 10:00 AM to 10:59 AM | 864 (3.3%) | 775 (3.5%) |
| 11:00 AM to 11:59 AM | 192 (0.7%) | 184 (0.8%) |
| 12:00 PM to 3:59 PM | 1,335 (5.1%) | 1,234 (5.6%) |
| 4:00 PM to 11:59 PM | 1,512 (5.8%) | 995 (4.5%) |
| Total | 25,988 (100.0%) | 21,891 (100.0%) |
Housing Occupancy in Rockwall County
Occupancy by Ownership in Rockwall County
Of the total 37,881 dwellings in Rockwall County, owner-occupied units account for 31,503 (83.2%), while renter-occupied units make up 6,378 (16.8%).
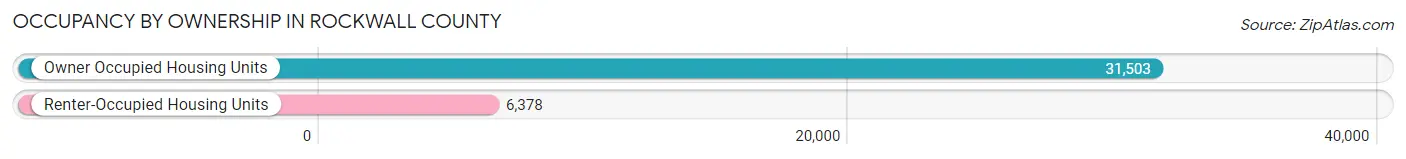
| Occupancy | # Housing Units | % Housing Units |
| Owner Occupied Housing Units | 31,503 | 83.2% |
| Renter-Occupied Housing Units | 6,378 | 16.8% |
| Total Occupied Housing Units | 37,881 | 100.0% |
Occupancy by Household Size in Rockwall County
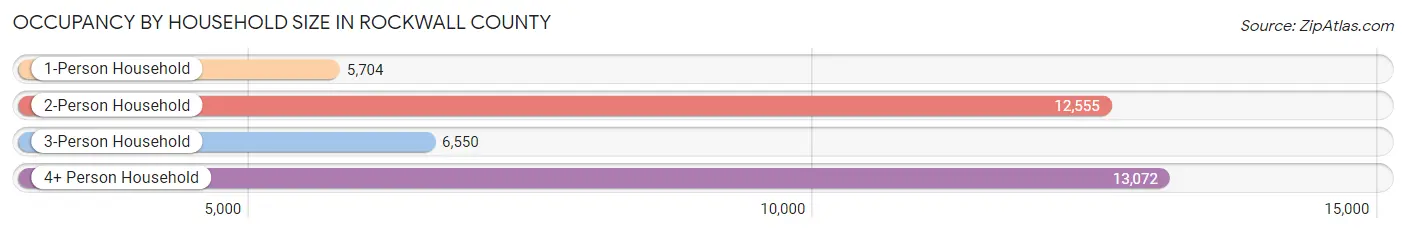
| Household Size | # Housing Units | % Housing Units |
| 1-Person Household | 5,704 | 15.1% |
| 2-Person Household | 12,555 | 33.1% |
| 3-Person Household | 6,550 | 17.3% |
| 4+ Person Household | 13,072 | 34.5% |
| Total Housing Units | 37,881 | 100.0% |
Occupancy by Ownership by Household Size in Rockwall County
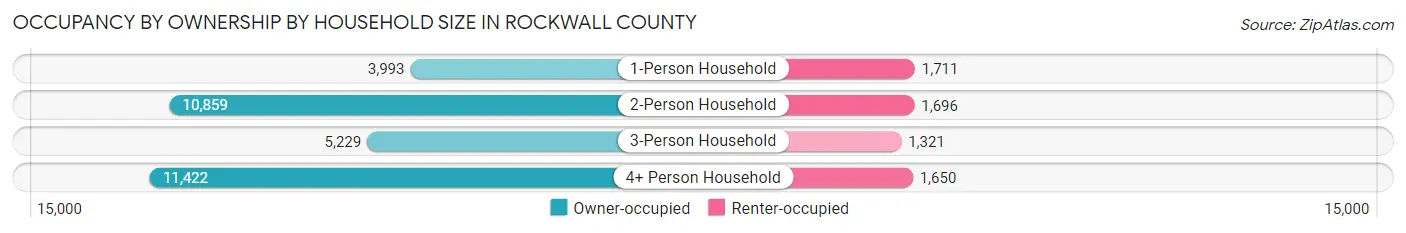
| Household Size | Owner-occupied | Renter-occupied |
| 1-Person Household | 3,993 (70.0%) | 1,711 (30.0%) |
| 2-Person Household | 10,859 (86.5%) | 1,696 (13.5%) |
| 3-Person Household | 5,229 (79.8%) | 1,321 (20.2%) |
| 4+ Person Household | 11,422 (87.4%) | 1,650 (12.6%) |
| Total Housing Units | 31,503 (83.2%) | 6,378 (16.8%) |
Occupancy by Educational Attainment in Rockwall County
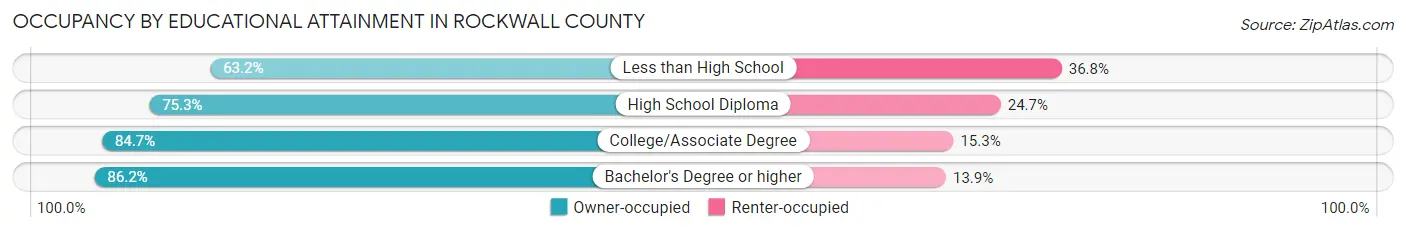
| Household Size | Owner-occupied | Renter-occupied |
| Less than High School | 1,023 (63.2%) | 596 (36.8%) |
| High School Diploma | 4,034 (75.3%) | 1,324 (24.7%) |
| College/Associate Degree | 10,140 (84.7%) | 1,836 (15.3%) |
| Bachelor's Degree or higher | 16,306 (86.2%) | 2,622 (13.9%) |
Occupancy by Age of Householder in Rockwall County
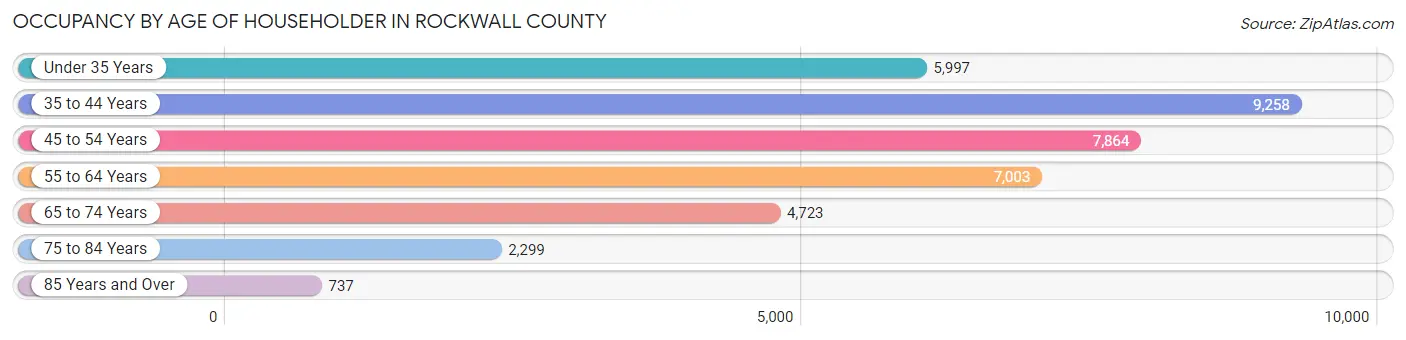
| Age Bracket | # Households | % Households |
| Under 35 Years | 5,997 | 15.8% |
| 35 to 44 Years | 9,258 | 24.4% |
| 45 to 54 Years | 7,864 | 20.8% |
| 55 to 64 Years | 7,003 | 18.5% |
| 65 to 74 Years | 4,723 | 12.5% |
| 75 to 84 Years | 2,299 | 6.1% |
| 85 Years and Over | 737 | 1.9% |
| Total | 37,881 | 100.0% |
Housing Finances in Rockwall County
Median Income by Occupancy in Rockwall County
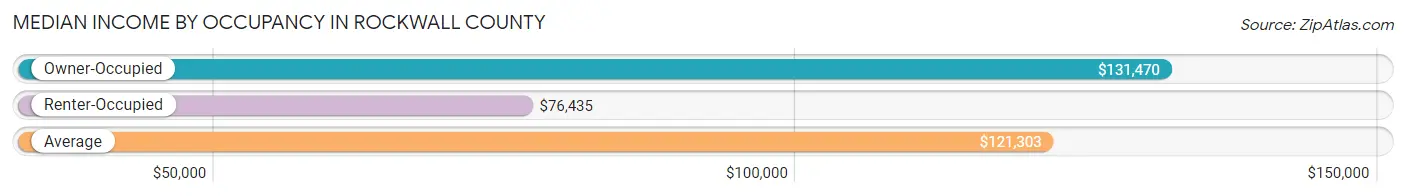
| Occupancy Type | # Households | Median Income |
| Owner-Occupied | 31,503 (83.2%) | $131,470 |
| Renter-Occupied | 6,378 (16.8%) | $76,435 |
| Average | 37,881 (100.0%) | $121,303 |
Occupancy by Householder Income Bracket in Rockwall County
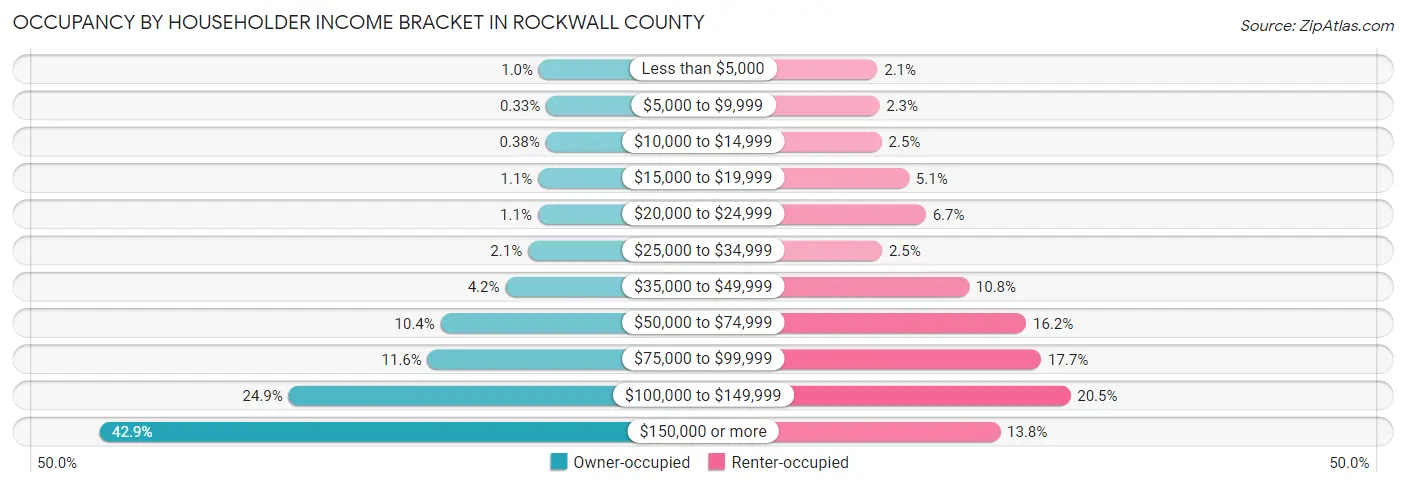
| Income Bracket | Owner-occupied | Renter-occupied |
| Less than $5,000 | 321 (1.0%) | 132 (2.1%) |
| $5,000 to $9,999 | 105 (0.3%) | 144 (2.3%) |
| $10,000 to $14,999 | 121 (0.4%) | 158 (2.5%) |
| $15,000 to $19,999 | 342 (1.1%) | 324 (5.1%) |
| $20,000 to $24,999 | 355 (1.1%) | 426 (6.7%) |
| $25,000 to $34,999 | 649 (2.1%) | 161 (2.5%) |
| $35,000 to $49,999 | 1,328 (4.2%) | 688 (10.8%) |
| $50,000 to $74,999 | 3,271 (10.4%) | 1,036 (16.2%) |
| $75,000 to $99,999 | 3,662 (11.6%) | 1,127 (17.7%) |
| $100,000 to $149,999 | 7,833 (24.9%) | 1,304 (20.4%) |
| $150,000 or more | 13,516 (42.9%) | 878 (13.8%) |
| Total | 31,503 (100.0%) | 6,378 (100.0%) |
Monthly Housing Cost Tiers in Rockwall County
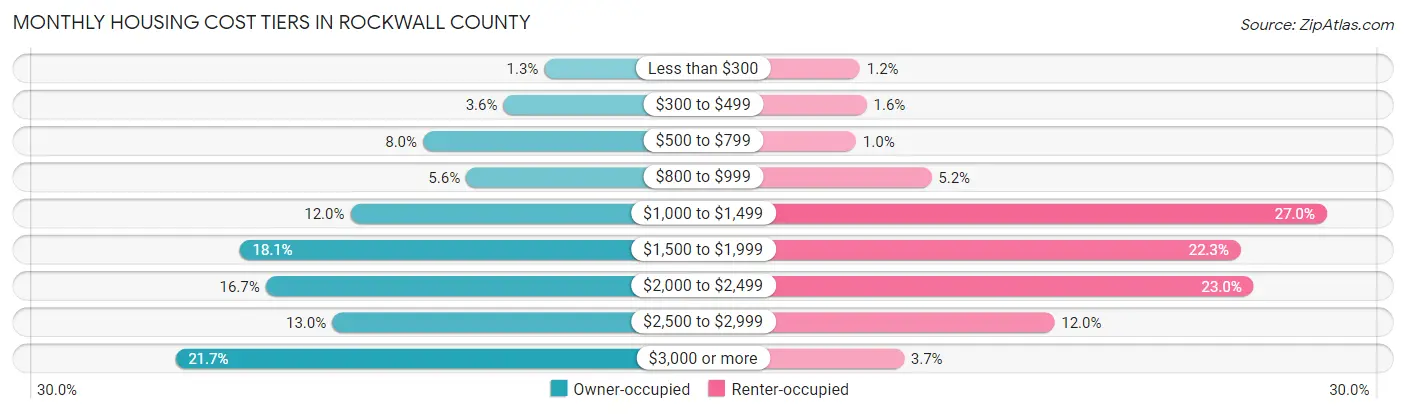
| Monthly Cost | Owner-occupied | Renter-occupied |
| Less than $300 | 408 (1.3%) | 79 (1.2%) |
| $300 to $499 | 1,120 (3.6%) | 103 (1.6%) |
| $500 to $799 | 2,520 (8.0%) | 65 (1.0%) |
| $800 to $999 | 1,770 (5.6%) | 331 (5.2%) |
| $1,000 to $1,499 | 3,784 (12.0%) | 1,724 (27.0%) |
| $1,500 to $1,999 | 5,712 (18.1%) | 1,421 (22.3%) |
| $2,000 to $2,499 | 5,258 (16.7%) | 1,466 (23.0%) |
| $2,500 to $2,999 | 4,102 (13.0%) | 764 (12.0%) |
| $3,000 or more | 6,829 (21.7%) | 234 (3.7%) |
| Total | 31,503 (100.0%) | 6,378 (100.0%) |
Physical Housing Characteristics in Rockwall County
Housing Structures in Rockwall County
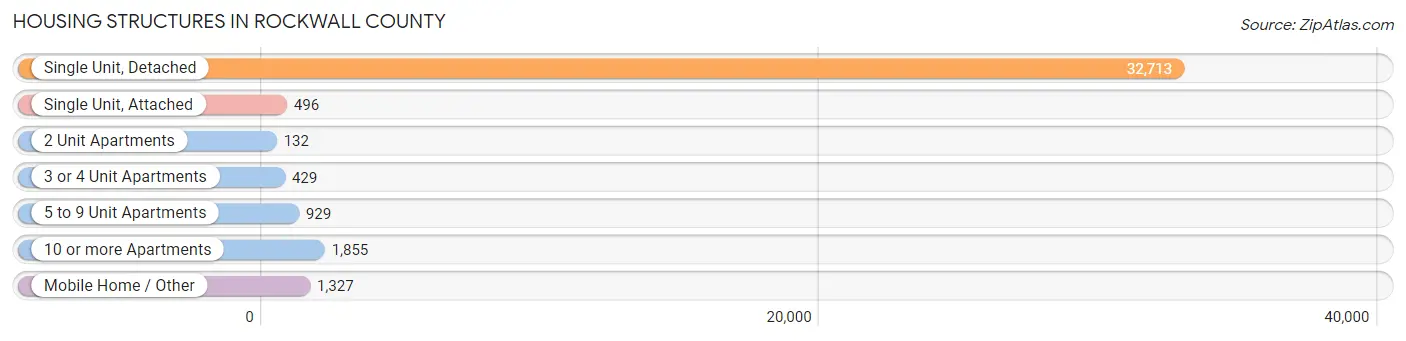
| Structure Type | # Housing Units | % Housing Units |
| Single Unit, Detached | 32,713 | 86.4% |
| Single Unit, Attached | 496 | 1.3% |
| 2 Unit Apartments | 132 | 0.4% |
| 3 or 4 Unit Apartments | 429 | 1.1% |
| 5 to 9 Unit Apartments | 929 | 2.5% |
| 10 or more Apartments | 1,855 | 4.9% |
| Mobile Home / Other | 1,327 | 3.5% |
| Total | 37,881 | 100.0% |
Housing Structures by Occupancy in Rockwall County
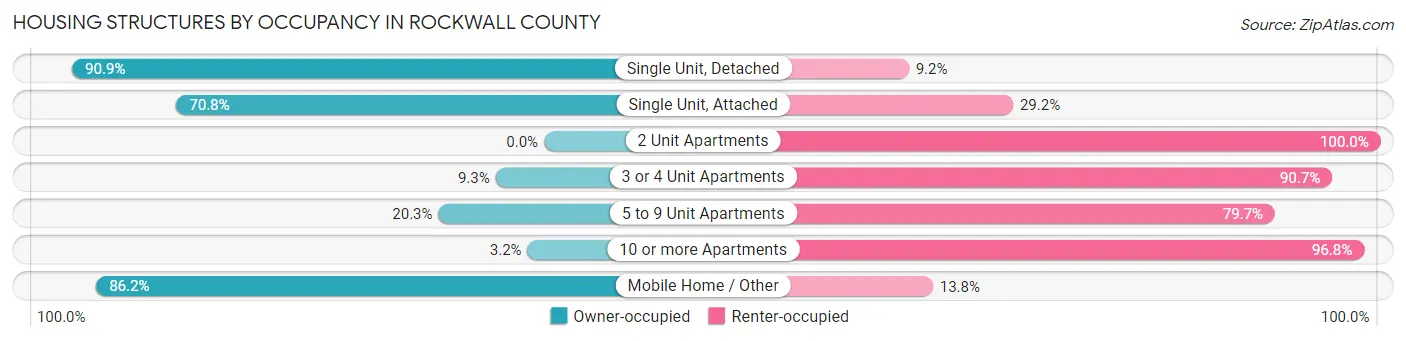
| Structure Type | Owner-occupied | Renter-occupied |
| Single Unit, Detached | 29,720 (90.8%) | 2,993 (9.1%) |
| Single Unit, Attached | 351 (70.8%) | 145 (29.2%) |
| 2 Unit Apartments | 0 (0.0%) | 132 (100.0%) |
| 3 or 4 Unit Apartments | 40 (9.3%) | 389 (90.7%) |
| 5 to 9 Unit Apartments | 189 (20.3%) | 740 (79.7%) |
| 10 or more Apartments | 59 (3.2%) | 1,796 (96.8%) |
| Mobile Home / Other | 1,144 (86.2%) | 183 (13.8%) |
| Total | 31,503 (83.2%) | 6,378 (16.8%) |
Housing Structures by Number of Rooms in Rockwall County
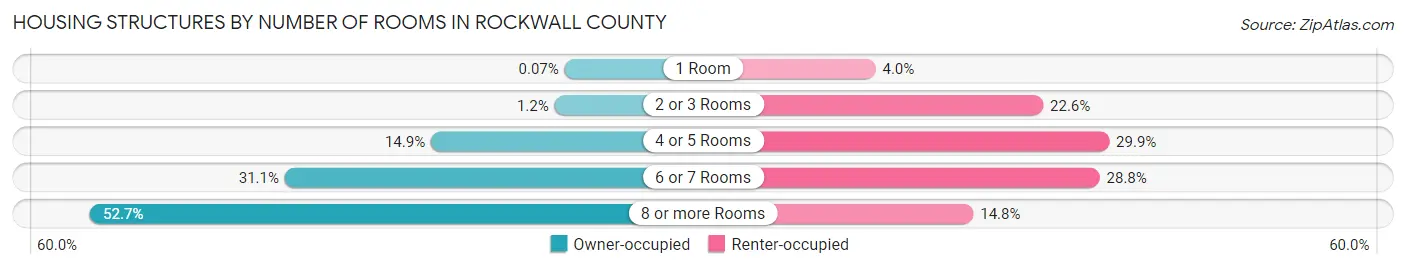
| Number of Rooms | Owner-occupied | Renter-occupied |
| 1 Room | 21 (0.1%) | 252 (4.0%) |
| 2 or 3 Rooms | 376 (1.2%) | 1,438 (22.6%) |
| 4 or 5 Rooms | 4,694 (14.9%) | 1,906 (29.9%) |
| 6 or 7 Rooms | 9,803 (31.1%) | 1,838 (28.8%) |
| 8 or more Rooms | 16,609 (52.7%) | 944 (14.8%) |
| Total | 31,503 (100.0%) | 6,378 (100.0%) |
Housing Structure by Heating Type in Rockwall County
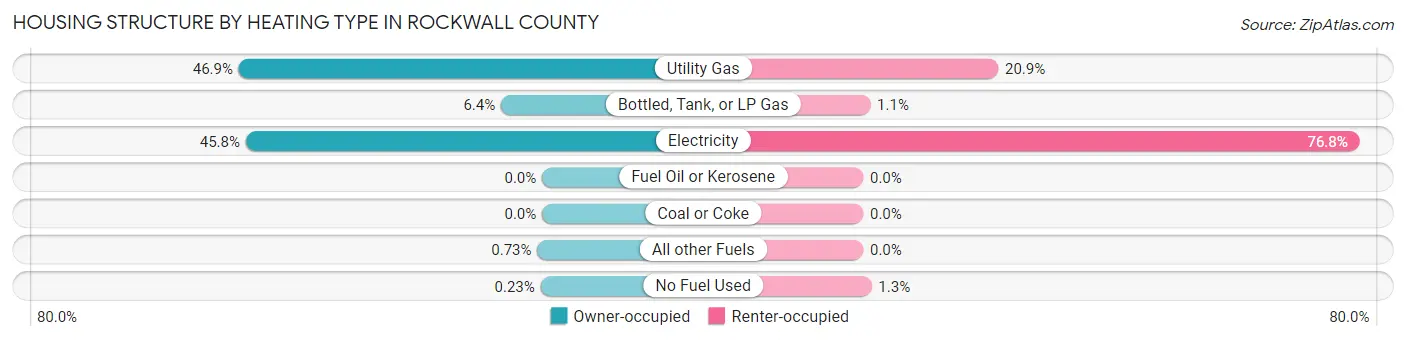
| Heating Type | Owner-occupied | Renter-occupied |
| Utility Gas | 14,771 (46.9%) | 1,331 (20.9%) |
| Bottled, Tank, or LP Gas | 2,000 (6.4%) | 70 (1.1%) |
| Electricity | 14,430 (45.8%) | 4,895 (76.7%) |
| Fuel Oil or Kerosene | 0 (0.0%) | 0 (0.0%) |
| Coal or Coke | 0 (0.0%) | 0 (0.0%) |
| All other Fuels | 229 (0.7%) | 0 (0.0%) |
| No Fuel Used | 73 (0.2%) | 82 (1.3%) |
| Total | 31,503 (100.0%) | 6,378 (100.0%) |
Household Vehicle Usage in Rockwall County
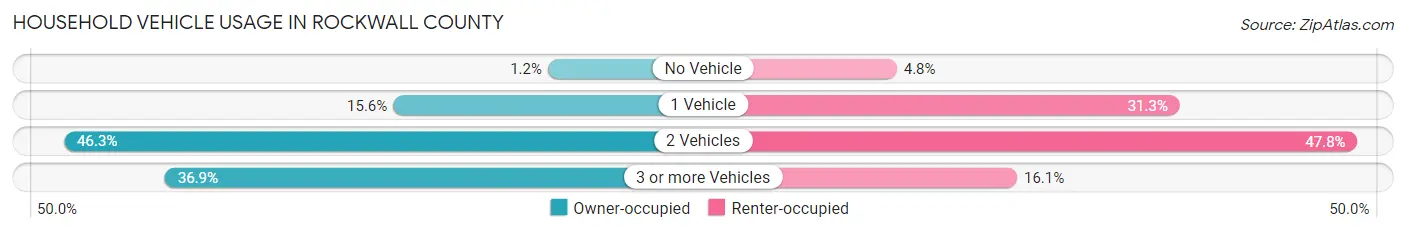
| Vehicles per Household | Owner-occupied | Renter-occupied |
| No Vehicle | 367 (1.2%) | 309 (4.8%) |
| 1 Vehicle | 4,915 (15.6%) | 1,993 (31.2%) |
| 2 Vehicles | 14,593 (46.3%) | 3,051 (47.8%) |
| 3 or more Vehicles | 11,628 (36.9%) | 1,025 (16.1%) |
| Total | 31,503 (100.0%) | 6,378 (100.0%) |
Real Estate & Mortgages in Rockwall County
Real Estate and Mortgage Overview in Rockwall County
| Characteristic | Without Mortgage | With Mortgage |
| Housing Units | 8,847 | 22,656 |
| Median Property Value | $325,500 | $376,800 |
| Median Household Income | $95,183 | $11,133 |
| Monthly Housing Costs | $865 | $6,671 |
| Real Estate Taxes | $4,633 | $497 |
Property Value by Mortgage Status in Rockwall County
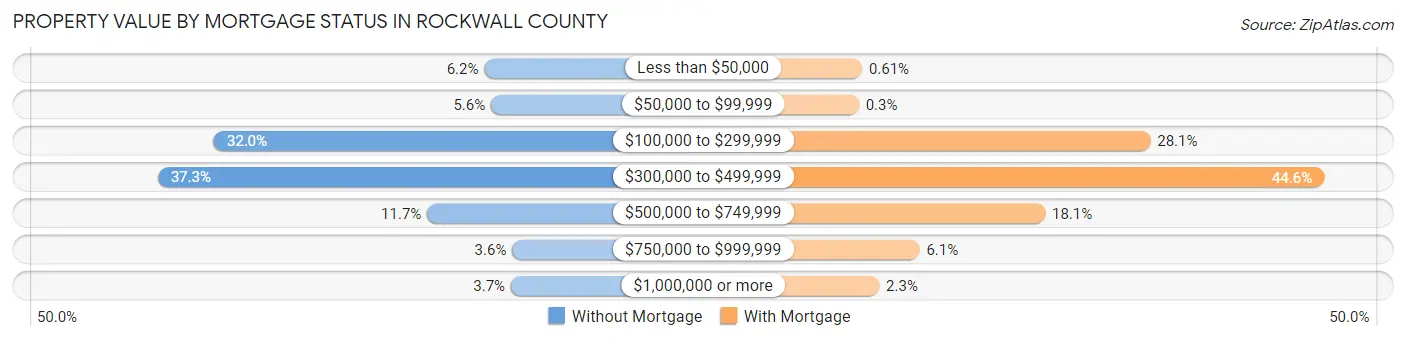
| Property Value | Without Mortgage | With Mortgage |
| Less than $50,000 | 550 (6.2%) | 138 (0.6%) |
| $50,000 to $99,999 | 494 (5.6%) | 69 (0.3%) |
| $100,000 to $299,999 | 2,828 (32.0%) | 6,360 (28.1%) |
| $300,000 to $499,999 | 3,302 (37.3%) | 10,109 (44.6%) |
| $500,000 to $749,999 | 1,032 (11.7%) | 4,090 (18.0%) |
| $750,000 to $999,999 | 315 (3.6%) | 1,380 (6.1%) |
| $1,000,000 or more | 326 (3.7%) | 510 (2.2%) |
| Total | 8,847 (100.0%) | 22,656 (100.0%) |
Household Income by Mortgage Status in Rockwall County
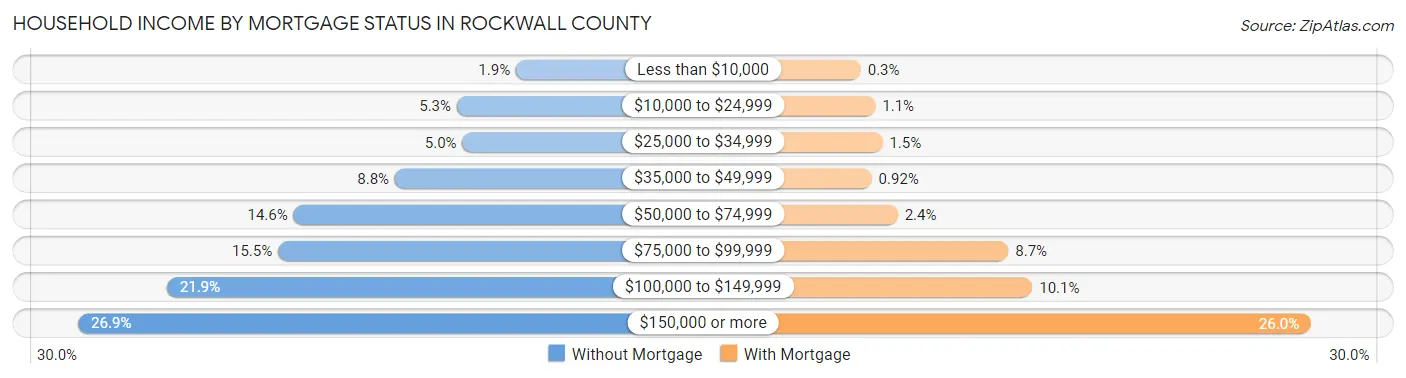
| Household Income | Without Mortgage | With Mortgage |
| Less than $10,000 | 170 (1.9%) | 69 (0.3%) |
| $10,000 to $24,999 | 469 (5.3%) | 256 (1.1%) |
| $25,000 to $34,999 | 441 (5.0%) | 349 (1.5%) |
| $35,000 to $49,999 | 782 (8.8%) | 208 (0.9%) |
| $50,000 to $74,999 | 1,294 (14.6%) | 546 (2.4%) |
| $75,000 to $99,999 | 1,373 (15.5%) | 1,977 (8.7%) |
| $100,000 to $149,999 | 1,935 (21.9%) | 2,289 (10.1%) |
| $150,000 or more | 2,383 (26.9%) | 5,898 (26.0%) |
| Total | 8,847 (100.0%) | 22,656 (100.0%) |
Property Value to Household Income Ratio in Rockwall County
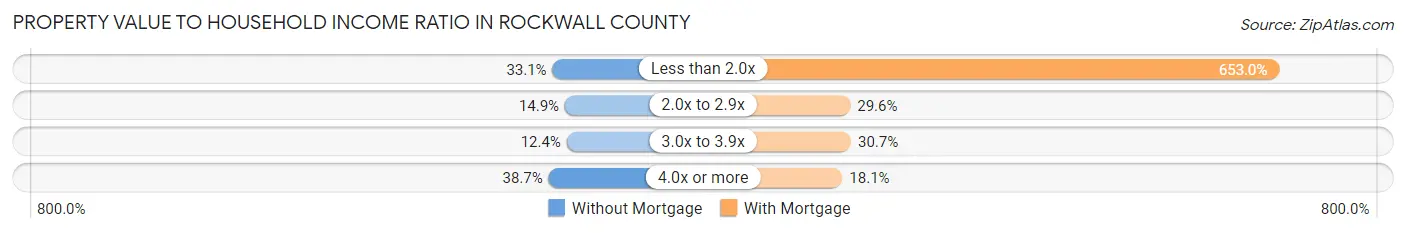
| Value-to-Income Ratio | Without Mortgage | With Mortgage |
| Less than 2.0x | 2,929 (33.1%) | 147,934 (653.0%) |
| 2.0x to 2.9x | 1,322 (14.9%) | 6,704 (29.6%) |
| 3.0x to 3.9x | 1,096 (12.4%) | 6,953 (30.7%) |
| 4.0x or more | 3,427 (38.7%) | 4,102 (18.1%) |
| Total | 8,847 (100.0%) | 22,656 (100.0%) |
Real Estate Taxes by Mortgage Status in Rockwall County
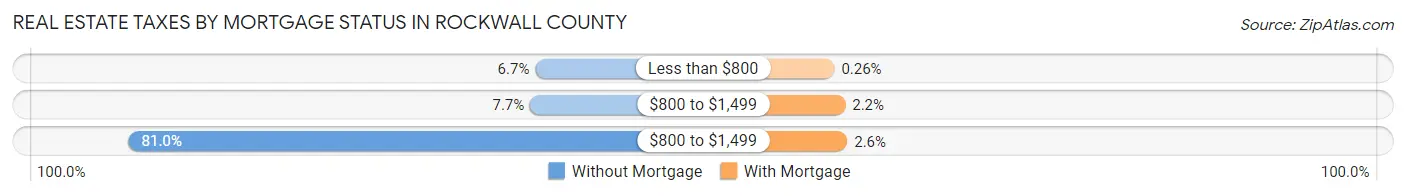
| Property Taxes | Without Mortgage | With Mortgage |
| Less than $800 | 595 (6.7%) | 58 (0.3%) |
| $800 to $1,499 | 679 (7.7%) | 507 (2.2%) |
| $800 to $1,499 | 7,166 (81.0%) | 590 (2.6%) |
| Total | 8,847 (100.0%) | 22,656 (100.0%) |
Health & Disability in Rockwall County
Health Insurance Coverage by Age in Rockwall County
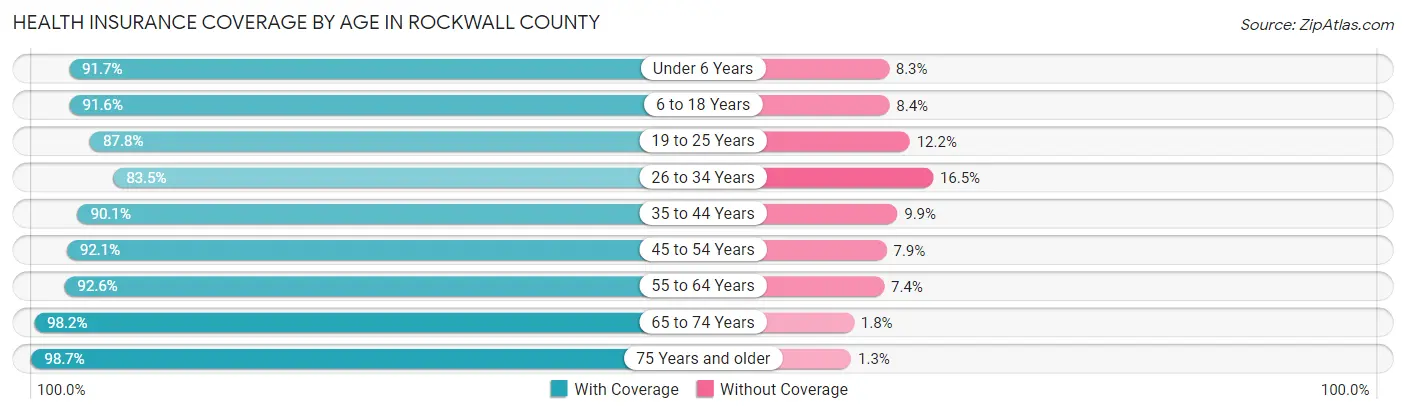
| Age Bracket | With Coverage | Without Coverage |
| Under 6 Years | 7,361 (91.7%) | 666 (8.3%) |
| 6 to 18 Years | 21,117 (91.6%) | 1,936 (8.4%) |
| 19 to 25 Years | 7,787 (87.8%) | 1,082 (12.2%) |
| 26 to 34 Years | 9,094 (83.5%) | 1,801 (16.5%) |
| 35 to 44 Years | 15,494 (90.1%) | 1,698 (9.9%) |
| 45 to 54 Years | 14,089 (92.1%) | 1,205 (7.9%) |
| 55 to 64 Years | 12,241 (92.6%) | 982 (7.4%) |
| 65 to 74 Years | 8,059 (98.2%) | 146 (1.8%) |
| 75 Years and older | 5,046 (98.7%) | 65 (1.3%) |
| Total | 100,288 (91.3%) | 9,581 (8.7%) |
Health Insurance Coverage by Citizenship Status in Rockwall County
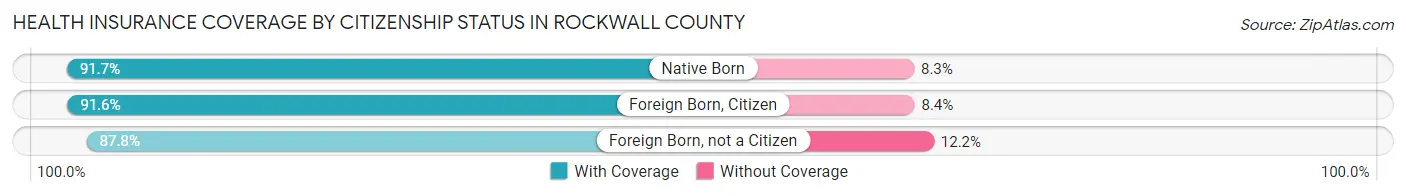
| Citizenship Status | With Coverage | Without Coverage |
| Native Born | 7,361 (91.7%) | 666 (8.3%) |
| Foreign Born, Citizen | 21,117 (91.6%) | 1,936 (8.4%) |
| Foreign Born, not a Citizen | 7,787 (87.8%) | 1,082 (12.2%) |
Health Insurance Coverage by Household Income in Rockwall County
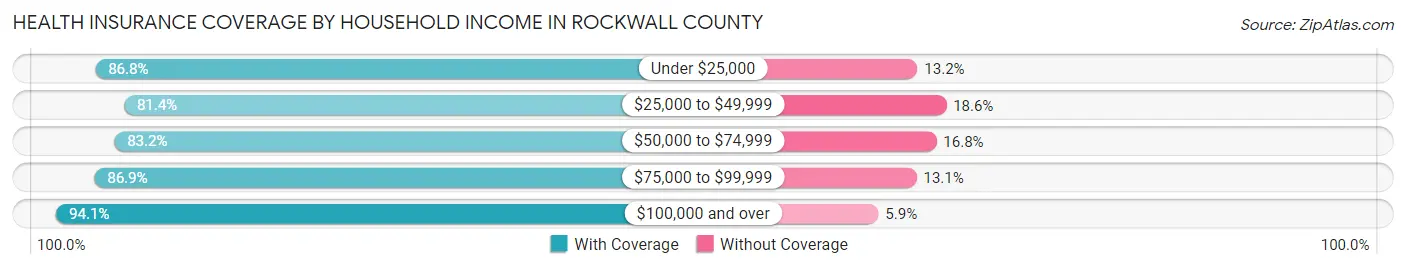
| Household Income | With Coverage | Without Coverage |
| Under $25,000 | 4,317 (86.8%) | 658 (13.2%) |
| $25,000 to $49,999 | 3,952 (81.4%) | 904 (18.6%) |
| $50,000 to $74,999 | 8,951 (83.2%) | 1,806 (16.8%) |
| $75,000 to $99,999 | 11,229 (86.9%) | 1,689 (13.1%) |
| $100,000 and over | 71,824 (94.1%) | 4,518 (5.9%) |
Public vs Private Health Insurance Coverage by Age in Rockwall County
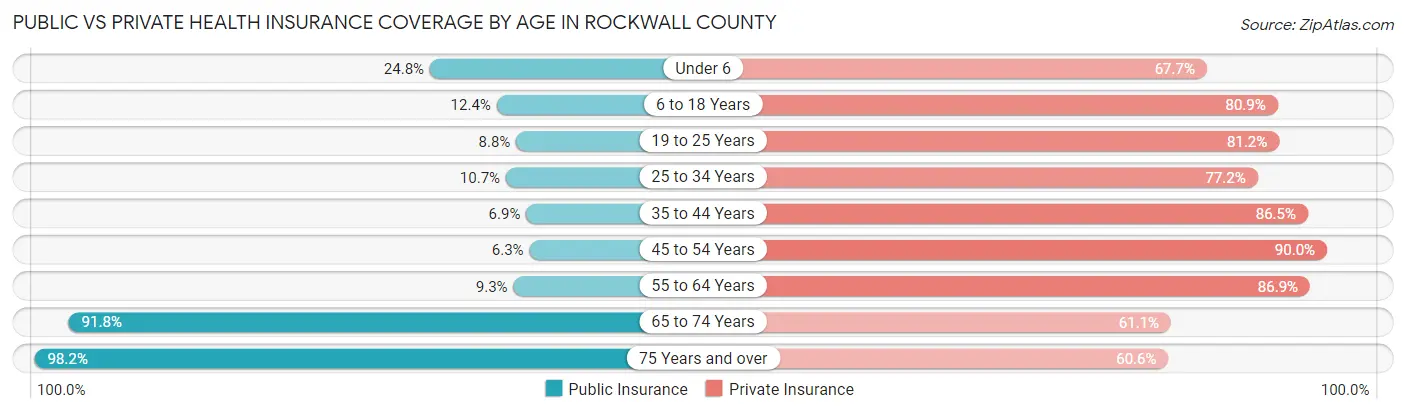
| Age Bracket | Public Insurance | Private Insurance |
| Under 6 | 1,988 (24.8%) | 5,437 (67.7%) |
| 6 to 18 Years | 2,853 (12.4%) | 18,646 (80.9%) |
| 19 to 25 Years | 777 (8.8%) | 7,199 (81.2%) |
| 25 to 34 Years | 1,161 (10.7%) | 8,408 (77.2%) |
| 35 to 44 Years | 1,185 (6.9%) | 14,869 (86.5%) |
| 45 to 54 Years | 962 (6.3%) | 13,771 (90.0%) |
| 55 to 64 Years | 1,224 (9.3%) | 11,488 (86.9%) |
| 65 to 74 Years | 7,534 (91.8%) | 5,012 (61.1%) |
| 75 Years and over | 5,017 (98.2%) | 3,097 (60.6%) |
| Total | 22,701 (20.7%) | 87,927 (80.0%) |
Disability Status by Sex by Age in Rockwall County
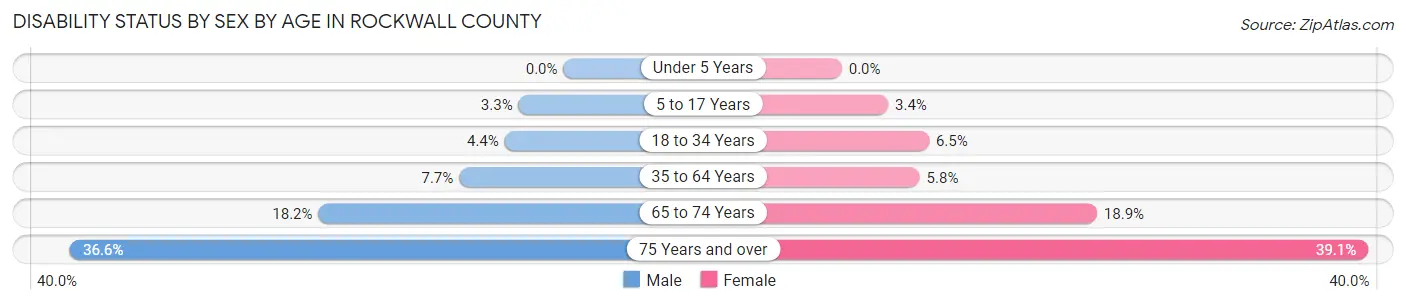
| Age Bracket | Male | Female |
| Under 5 Years | 0 (0.0%) | 0 (0.0%) |
| 5 to 17 Years | 390 (3.3%) | 382 (3.4%) |
| 18 to 34 Years | 474 (4.4%) | 682 (6.5%) |
| 35 to 64 Years | 1,769 (7.7%) | 1,321 (5.8%) |
| 65 to 74 Years | 698 (18.2%) | 827 (18.9%) |
| 75 Years and over | 791 (36.6%) | 1,153 (39.1%) |
Disability Class by Sex by Age in Rockwall County
Disability Class: Hearing Difficulty
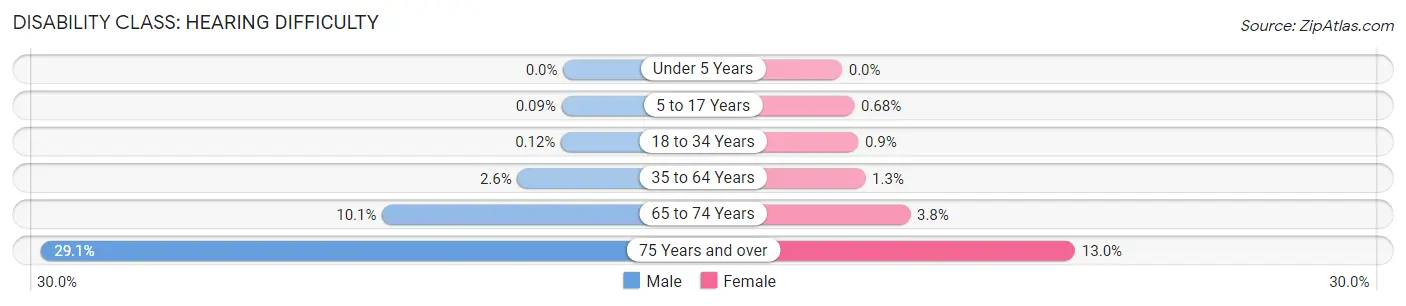
| Age Bracket | Male | Female |
| Under 5 Years | 0 (0.0%) | 0 (0.0%) |
| 5 to 17 Years | 11 (0.1%) | 75 (0.7%) |
| 18 to 34 Years | 13 (0.1%) | 95 (0.9%) |
| 35 to 64 Years | 583 (2.5%) | 298 (1.3%) |
| 65 to 74 Years | 387 (10.1%) | 166 (3.8%) |
| 75 Years and over | 628 (29.1%) | 383 (13.0%) |
Disability Class: Vision Difficulty
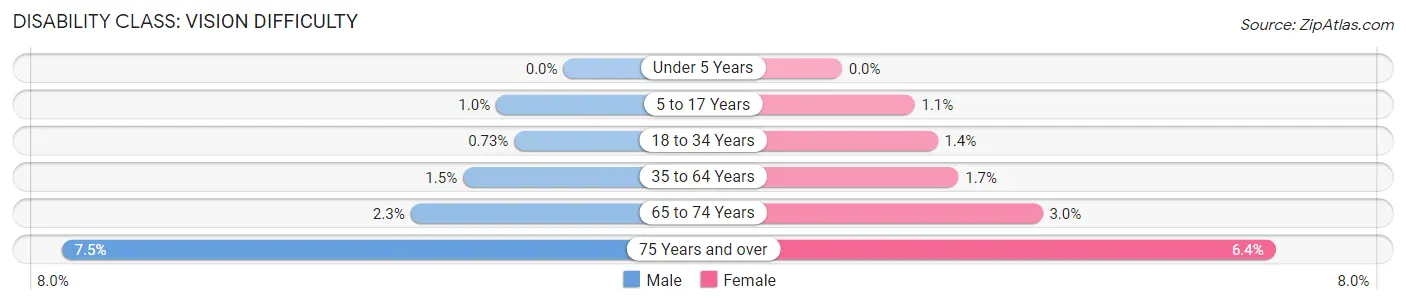
| Age Bracket | Male | Female |
| Under 5 Years | 0 (0.0%) | 0 (0.0%) |
| 5 to 17 Years | 117 (1.0%) | 120 (1.1%) |
| 18 to 34 Years | 79 (0.7%) | 150 (1.4%) |
| 35 to 64 Years | 340 (1.5%) | 395 (1.7%) |
| 65 to 74 Years | 87 (2.3%) | 130 (3.0%) |
| 75 Years and over | 161 (7.4%) | 190 (6.4%) |
Disability Class: Cognitive Difficulty
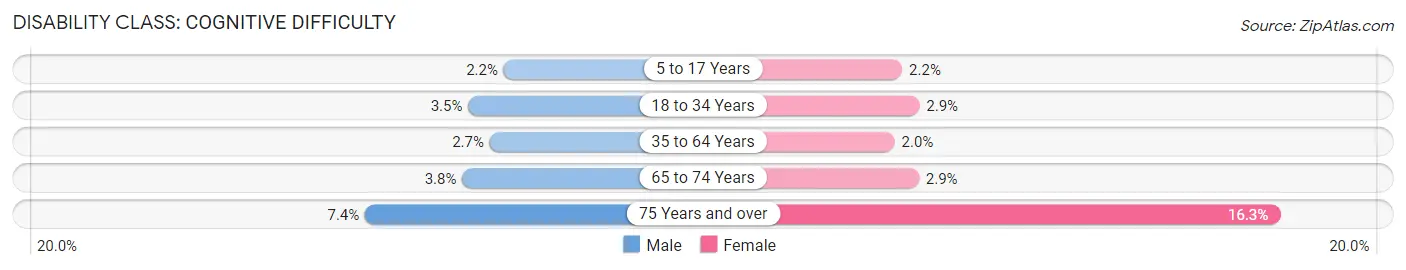
| Age Bracket | Male | Female |
| 5 to 17 Years | 259 (2.2%) | 249 (2.2%) |
| 18 to 34 Years | 384 (3.5%) | 303 (2.9%) |
| 35 to 64 Years | 623 (2.7%) | 447 (2.0%) |
| 65 to 74 Years | 144 (3.7%) | 125 (2.9%) |
| 75 Years and over | 159 (7.4%) | 480 (16.3%) |
Disability Class: Ambulatory Difficulty
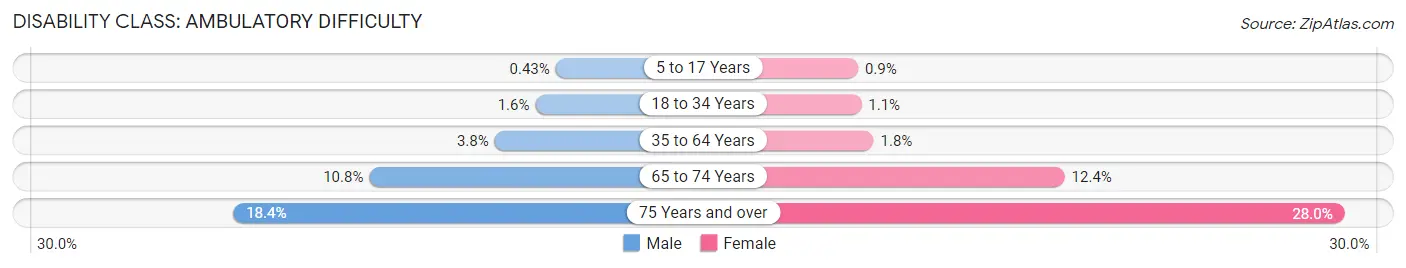
| Age Bracket | Male | Female |
| 5 to 17 Years | 50 (0.4%) | 100 (0.9%) |
| 18 to 34 Years | 169 (1.6%) | 115 (1.1%) |
| 35 to 64 Years | 875 (3.8%) | 405 (1.8%) |
| 65 to 74 Years | 415 (10.8%) | 542 (12.4%) |
| 75 Years and over | 397 (18.4%) | 826 (28.0%) |
Disability Class: Self-Care Difficulty
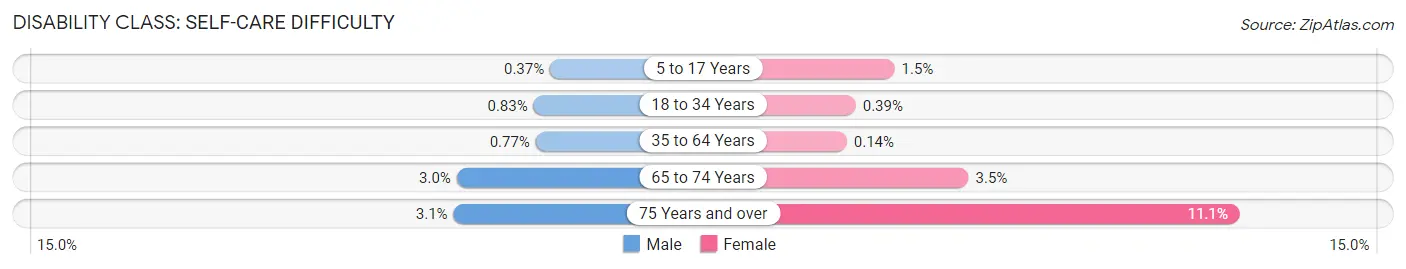
| Age Bracket | Male | Female |
| 5 to 17 Years | 43 (0.4%) | 163 (1.5%) |
| 18 to 34 Years | 90 (0.8%) | 41 (0.4%) |
| 35 to 64 Years | 177 (0.8%) | 33 (0.1%) |
| 65 to 74 Years | 114 (3.0%) | 154 (3.5%) |
| 75 Years and over | 66 (3.1%) | 327 (11.1%) |
Technology Access in Rockwall County
Computing Device Access in Rockwall County
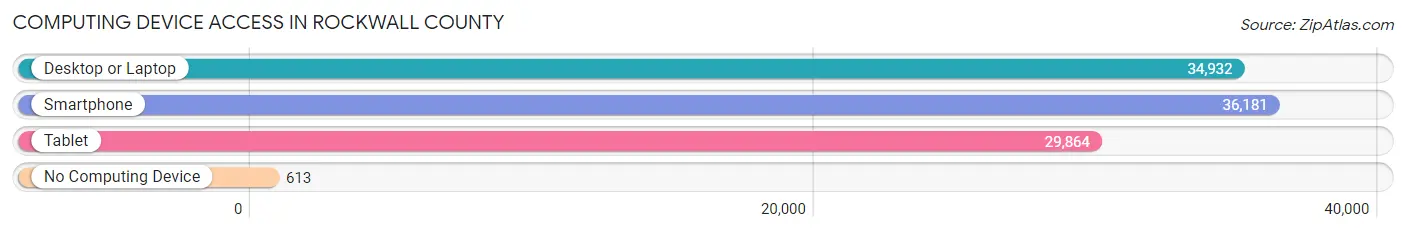
| Device Type | # Households | % Households |
| Desktop or Laptop | 34,932 | 92.2% |
| Smartphone | 36,181 | 95.5% |
| Tablet | 29,864 | 78.8% |
| No Computing Device | 613 | 1.6% |
| Total | 37,881 | 100.0% |
Internet Access in Rockwall County
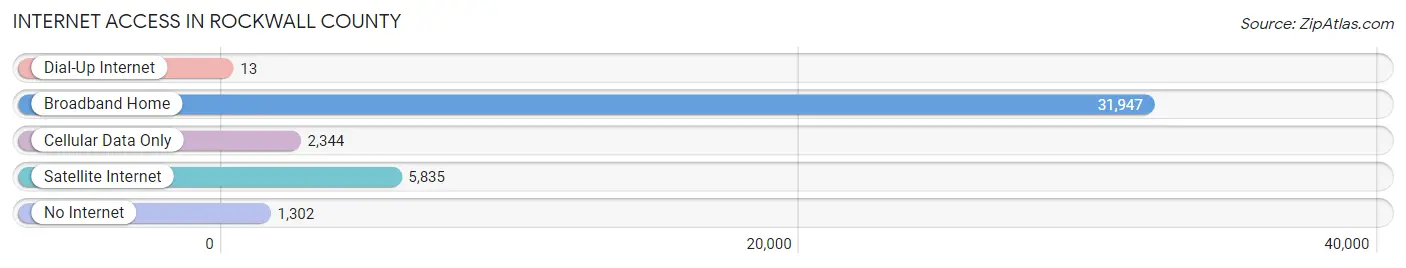
| Internet Type | # Households | % Households |
| Dial-Up Internet | 13 | 0.0% |
| Broadband Home | 31,947 | 84.3% |
| Cellular Data Only | 2,344 | 6.2% |
| Satellite Internet | 5,835 | 15.4% |
| No Internet | 1,302 | 3.4% |
| Total | 37,881 | 100.0% |
Rockwall County Summary
Rockwall County is located in the northeastern part of Texas, and is part of the Dallas-Fort Worth-Arlington metropolitan area. It is bordered by Collin, Kaufman, and Hunt counties to the north, and by Dallas and Ellis counties to the south. The county seat is Rockwall, and the county has a total area of 149 square miles.
Geography
Rockwall County is located in the Blackland Prairie region of Texas, and is characterized by rolling hills and fertile soils. The county is drained by the East Fork of the Trinity River, which flows through the county from north to south. The county is also home to several small lakes, including Lake Ray Hubbard, Lake Lavon, and Lake Tawakoni.
The county is home to several state parks, including Lake Ray Hubbard State Park, Lake Tawakoni State Park, and Lake Lavon State Park. The county also contains several wildlife management areas, including the Cedar Hill State Park, the Lake Tawakoni Wildlife Management Area, and the Lake Ray Hubbard Wildlife Management Area.
History
Rockwall County was established in 1873, and was named after a natural rock wall that was discovered in the area. The county was originally part of Kaufman County, but was later split off to form its own county.
The county was largely rural until the 1950s, when the population began to grow rapidly due to the growth of the Dallas-Fort Worth metropolitan area. The county experienced a population boom in the 1980s and 1990s, and the population has continued to grow since then.
Economy
Rockwall County has a diverse economy, with a mix of manufacturing, retail, and service industries. The county is home to several large employers, including Rockwall ISD, Rockwall County Hospital, and Rockwall County Community College.
The county is also home to several major retail centers, including The Harbor at Rockwall, Rockwall Town Center, and Rockwall Marketplace. The county is also home to several major industrial parks, including the Rockwall Industrial Park, the Rockwall Technology Park, and the Rockwall Business Park.
Demographics
As of the 2010 census, Rockwall County had a population of 78,337. The racial makeup of the county was 79.2% White, 8.3% African American, 0.7% Native American, 3.2% Asian, and 8.6% from other races. Hispanic or Latino of any race were 17.3% of the population.
The median income for a household in the county was $63,945, and the median income for a family was $76,945. The per capita income for the county was $30,945. About 8.2% of families and 10.7% of the population were below the poverty line, including 14.2% of those under age 18 and 6.2% of those age 65 or over.
Rockwall County is a rapidly growing county, and is home to a diverse population. The county has a strong economy, and is home to several major employers and retail centers. The county is also home to several state parks and wildlife management areas, making it a popular destination for outdoor recreation.
Common Questions
What is Per Capita Income in Rockwall County?
Per Capita income in Rockwall County is $53,000.
What is the Median Family Income in Rockwall County?
Median Family Income in Rockwall County is $131,804.
What is the Median Household income in Rockwall County?
Median Household Income in Rockwall County is $121,303.
What is Income or Wage Gap in Rockwall County?
Income or Wage Gap in Rockwall County is 36.5%.
Women in Rockwall County earn 63.5 cents for every dollar earned by a man.
What is Family Income Deficit in Rockwall County?
Family Income Deficit in Rockwall County is $11,302.
Families that are below poverty line in Rockwall County earn $11,302 less on average than the poverty threshold level.
What is Inequality or Gini Index in Rockwall County?
Inequality or Gini Index in Rockwall County is 0.41.
What is the Total Population of Rockwall County?
Total Population of Rockwall County is 110,631.
What is the Total Male Population of Rockwall County?
Total Male Population of Rockwall County is 55,091.
What is the Total Female Population of Rockwall County?
Total Female Population of Rockwall County is 55,540.
What is the Ratio of Males per 100 Females in Rockwall County?
There are 99.19 Males per 100 Females in Rockwall County.
What is the Ratio of Females per 100 Males in Rockwall County?
There are 100.82 Females per 100 Males in Rockwall County.
What is the Median Population Age in Rockwall County?
Median Population Age in Rockwall County is 37.6 Years.
What is the Average Family Size in Rockwall County
Average Family Size in Rockwall County is 3.2 People.
What is the Average Household Size in Rockwall County
Average Household Size in Rockwall County is 2.9 People.
How Large is the Labor Force in Rockwall County?
There are 59,591 People in the Labor Forcein in Rockwall County.
What is the Percentage of People in the Labor Force in Rockwall County?
70.3% of People are in the Labor Force in Rockwall County.
What is the Unemployment Rate in Rockwall County?
Unemployment Rate in Rockwall County is 3.9%.