Robertson County, TX Map & Demographics
Robertson County Map
Robertson County Overview
$30,568
PER CAPITA INCOME
$76,750
AVG FAMILY INCOME
$59,410
AVG HOUSEHOLD INCOME
48.2%
WAGE / INCOME GAP [ % ]
51.8¢/ $1
WAGE / INCOME GAP [ $ ]
$9,668
FAMILY INCOME DEFICIT
0.46
INEQUALITY / GINI INDEX
16,912
TOTAL POPULATION
8,398
MALE POPULATION
8,514
FEMALE POPULATION
98.64
MALES / 100 FEMALES
101.38
FEMALES / 100 MALES
40.6
MEDIAN AGE
3.3
AVG FAMILY SIZE
2.6
AVG HOUSEHOLD SIZE
7,328
LABOR FORCE [ PEOPLE ]
54.7%
PERCENT IN LABOR FORCE
8.7%
UNEMPLOYMENT RATE
Income in Robertson County
Income Overview in Robertson County
Per Capita Income in Robertson County is $30,568, while median incomes of families and households are $76,750 and $59,410 respectively.
| Characteristic | Number | Measure |
| Per Capita Income | 16,912 | $30,568 |
| Median Family Income | 4,284 | $76,750 |
| Mean Family Income | 4,284 | $92,484 |
| Median Household Income | 6,309 | $59,410 |
| Mean Household Income | 6,309 | $79,074 |
| Income Deficit | 4,284 | $9,668 |
| Wage / Income Gap (%) | 16,912 | 48.19% |
| Wage / Income Gap ($) | 16,912 | 51.81¢ per $1 |
| Gini / Inequality Index | 16,912 | 0.46 |
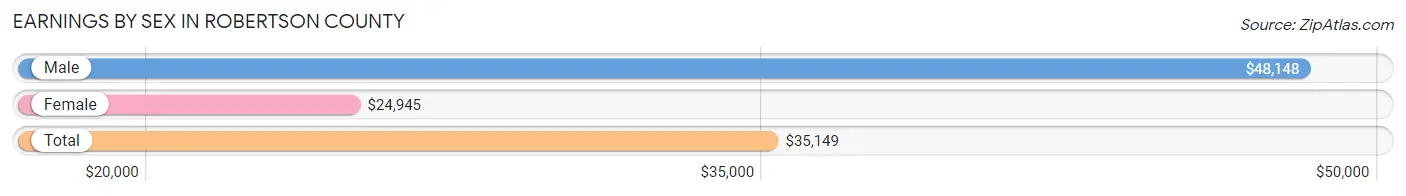
Earnings by Sex in Robertson County
Average Earnings in Robertson County are $35,149, $48,148 for men and $24,945 for women, a difference of 48.2%.
| Sex | Number | Average Earnings |
| Male | 3,802 (49.3%) | $48,148 |
| Female | 3,913 (50.7%) | $24,945 |
| Total | 7,715 (100.0%) | $35,149 |
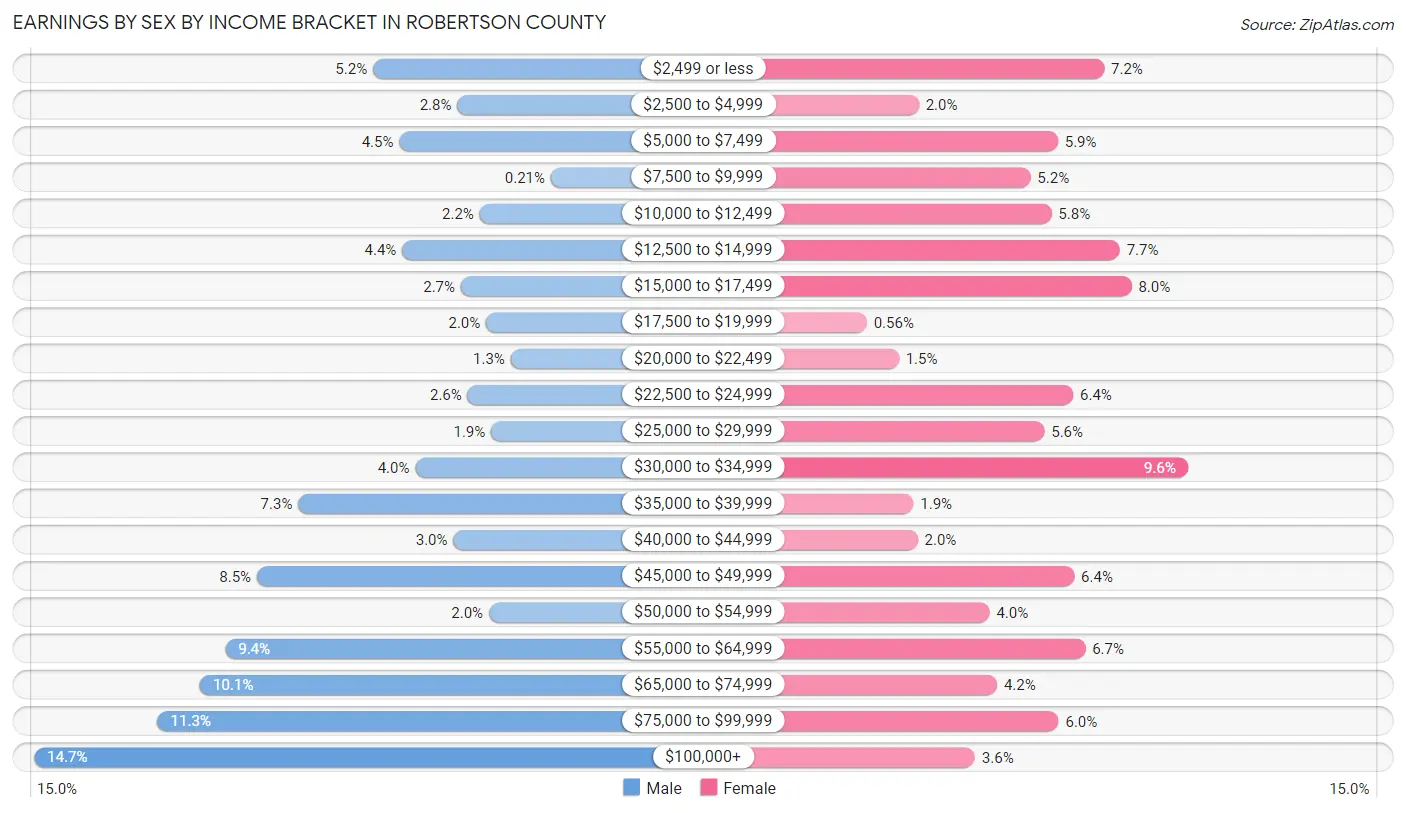
Earnings by Sex by Income Bracket in Robertson County
The most common earnings brackets in Robertson County are $100,000+ for men (560 | 14.7%) and $30,000 to $34,999 for women (375 | 9.6%).
| Income | Male | Female |
| $2,499 or less | 198 (5.2%) | 283 (7.2%) |
| $2,500 to $4,999 | 108 (2.8%) | 79 (2.0%) |
| $5,000 to $7,499 | 170 (4.5%) | 232 (5.9%) |
| $7,500 to $9,999 | 8 (0.2%) | 202 (5.2%) |
| $10,000 to $12,499 | 84 (2.2%) | 225 (5.8%) |
| $12,500 to $14,999 | 167 (4.4%) | 300 (7.7%) |
| $15,000 to $17,499 | 104 (2.7%) | 313 (8.0%) |
| $17,500 to $19,999 | 77 (2.0%) | 22 (0.6%) |
| $20,000 to $22,499 | 51 (1.3%) | 57 (1.5%) |
| $22,500 to $24,999 | 97 (2.5%) | 249 (6.4%) |
| $25,000 to $29,999 | 72 (1.9%) | 217 (5.6%) |
| $30,000 to $34,999 | 153 (4.0%) | 375 (9.6%) |
| $35,000 to $39,999 | 278 (7.3%) | 73 (1.9%) |
| $40,000 to $44,999 | 112 (2.9%) | 78 (2.0%) |
| $45,000 to $49,999 | 322 (8.5%) | 250 (6.4%) |
| $50,000 to $54,999 | 74 (1.9%) | 157 (4.0%) |
| $55,000 to $64,999 | 356 (9.4%) | 262 (6.7%) |
| $65,000 to $74,999 | 383 (10.1%) | 165 (4.2%) |
| $75,000 to $99,999 | 428 (11.3%) | 233 (5.9%) |
| $100,000+ | 560 (14.7%) | 141 (3.6%) |
| Total | 3,802 (100.0%) | 3,913 (100.0%) |
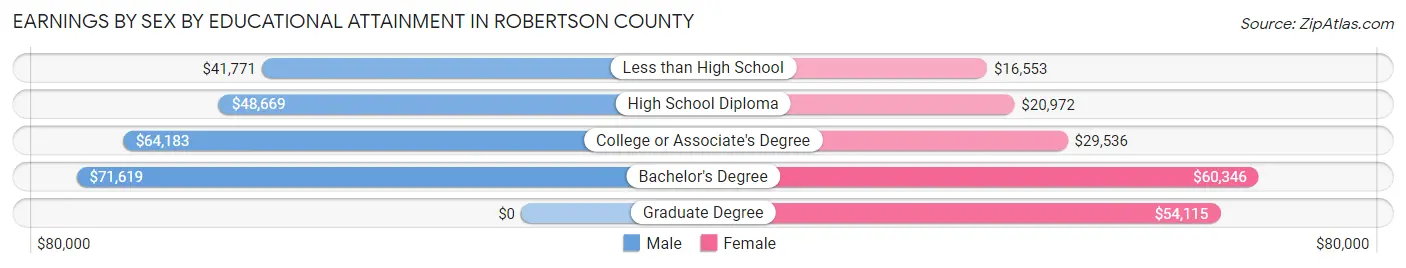
Earnings by Sex by Educational Attainment in Robertson County
Average earnings in Robertson County are $55,435 for men and $29,923 for women, a difference of 46.0%. Men with an educational attainment of bachelor's degree enjoy the highest average annual earnings of $71,619, while those with less than high school education earn the least with $41,771. Women with an educational attainment of bachelor's degree earn the most with the average annual earnings of $60,346, while those with less than high school education have the smallest earnings of $16,553.
| Educational Attainment | Male Income | Female Income |
| Less than High School | $41,771 | $16,553 |
| High School Diploma | $48,669 | $20,972 |
| College or Associate's Degree | $64,183 | $29,536 |
| Bachelor's Degree | $71,619 | $60,346 |
| Graduate Degree | - | - |
| Total | $55,435 | $29,923 |
Family Income in Robertson County
Family Income Brackets in Robertson County
According to the Robertson County family income data, there are 853 families falling into the $100,000 to $149,999 income range, which is the most common income bracket and makes up 19.9% of all families. Conversely, the $10,000 to $14,999 income bracket is the least frequent group with only 90 families (2.1%) belonging to this category.
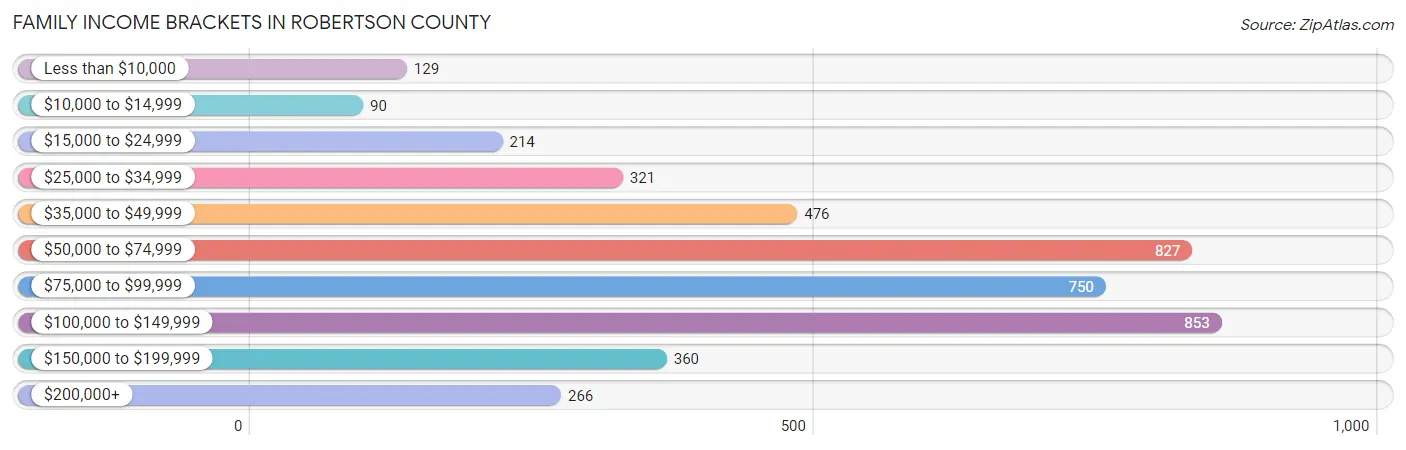
| Income Bracket | # Families | % Families |
| Less than $10,000 | 129 | 3.0% |
| $10,000 to $14,999 | 90 | 2.1% |
| $15,000 to $24,999 | 214 | 5.0% |
| $25,000 to $34,999 | 321 | 7.5% |
| $35,000 to $49,999 | 476 | 11.1% |
| $50,000 to $74,999 | 827 | 19.3% |
| $75,000 to $99,999 | 750 | 17.5% |
| $100,000 to $149,999 | 853 | 19.9% |
| $150,000 to $199,999 | 360 | 8.4% |
| $200,000+ | 266 | 6.2% |
Family Income by Famaliy Size in Robertson County
6-person families (84 | 2.0%) account for the highest median family income in Robertson County with $118,750 per family, while 2-person families (2,184 | 51.0%) have the highest median income of $32,500 per family member.
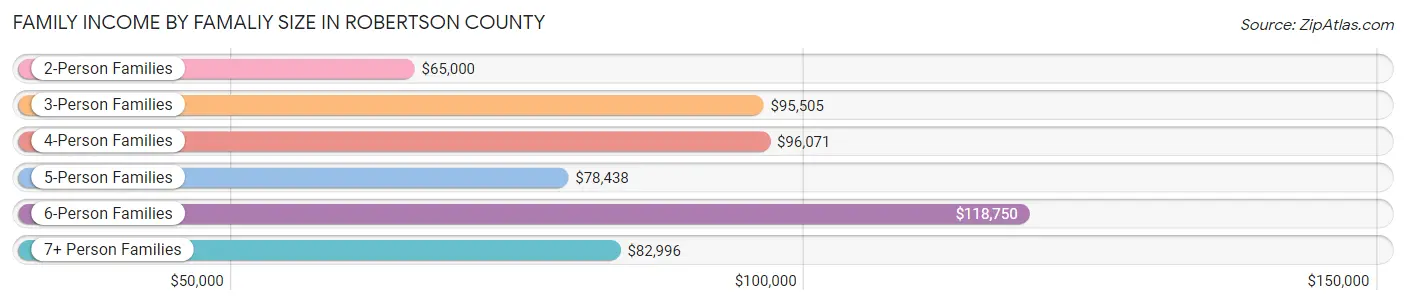
| Income Bracket | # Families | Median Income |
| 2-Person Families | 2,184 (51.0%) | $65,000 |
| 3-Person Families | 855 (20.0%) | $95,505 |
| 4-Person Families | 616 (14.4%) | $96,071 |
| 5-Person Families | 396 (9.2%) | $78,438 |
| 6-Person Families | 84 (2.0%) | $118,750 |
| 7+ Person Families | 149 (3.5%) | $82,996 |
| Total | 4,284 (100.0%) | $76,750 |
Family Income by Number of Earners in Robertson County
The median family income in Robertson County is $76,750, with families comprising 3+ earners (442) having the highest median family income of $110,000, while families with no earners (756) have the lowest median family income of $50,417, accounting for 10.3% and 17.6% of families, respectively.
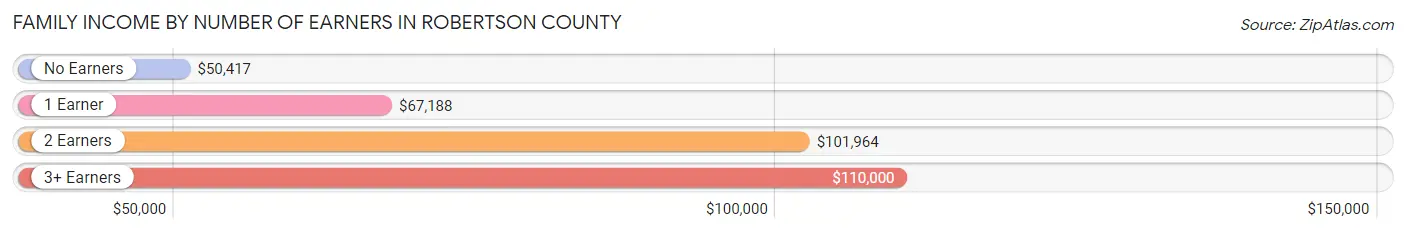
| Number of Earners | # Families | Median Income |
| No Earners | 756 (17.6%) | $50,417 |
| 1 Earner | 1,510 (35.2%) | $67,188 |
| 2 Earners | 1,576 (36.8%) | $101,964 |
| 3+ Earners | 442 (10.3%) | $110,000 |
| Total | 4,284 (100.0%) | $76,750 |
Household Income in Robertson County
Household Income Brackets in Robertson County
With 1,091 households falling in the category, the $50,000 to $74,999 income range is the most frequent in Robertson County, accounting for 17.3% of all households. In contrast, only 309 households (4.9%) fall into the $200,000+ income bracket, making it the least populous group.
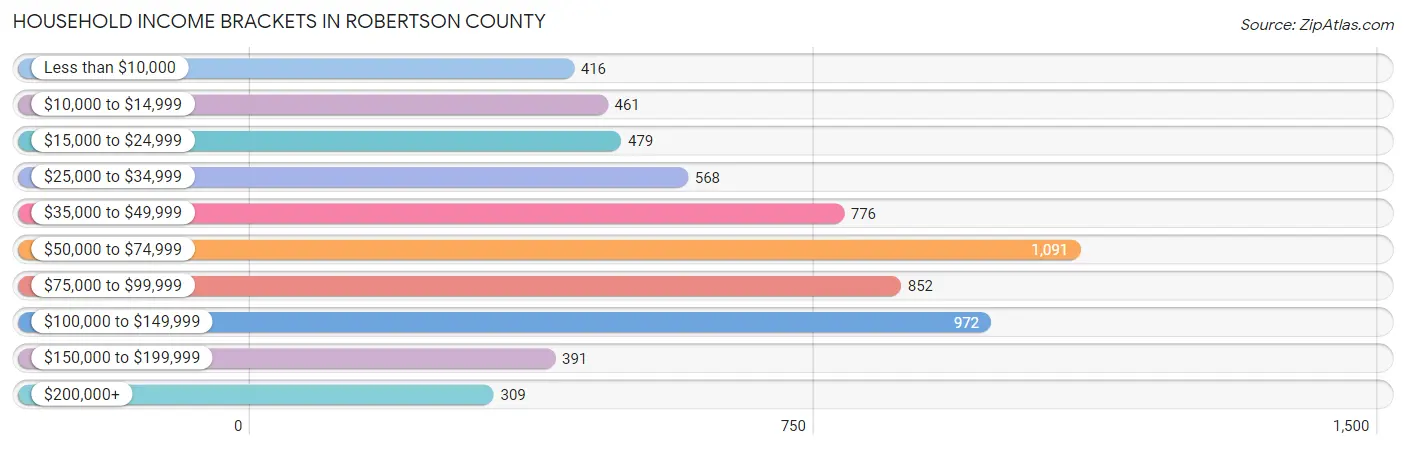
| Income Bracket | # Households | % Households |
| Less than $10,000 | 416 | 6.6% |
| $10,000 to $14,999 | 461 | 7.3% |
| $15,000 to $24,999 | 479 | 7.6% |
| $25,000 to $34,999 | 568 | 9.0% |
| $35,000 to $49,999 | 776 | 12.3% |
| $50,000 to $74,999 | 1,091 | 17.3% |
| $75,000 to $99,999 | 852 | 13.5% |
| $100,000 to $149,999 | 972 | 15.4% |
| $150,000 to $199,999 | 391 | 6.2% |
| $200,000+ | 309 | 4.9% |
Household Income by Householder Age in Robertson County
The median household income in Robertson County is $59,410, with the highest median household income of $84,104 found in the 25 to 44 years age bracket for the primary householder. A total of 1,551 households (24.6%) fall into this category. Meanwhile, the 15 to 24 years age bracket for the primary householder has the lowest median household income of $30,221, with 191 households (3.0%) in this group.
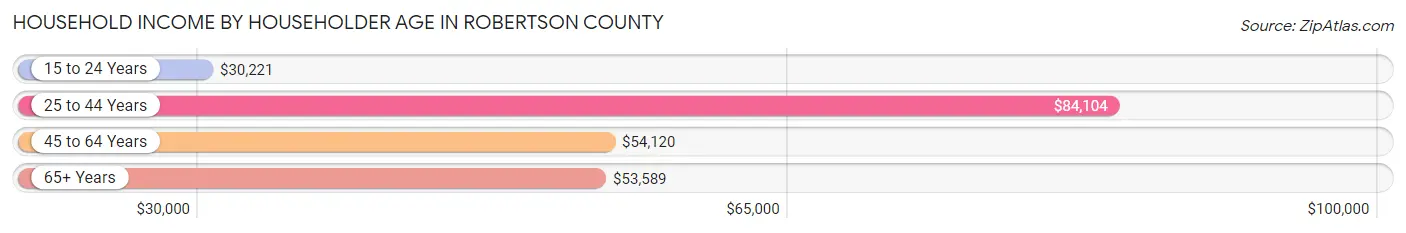
| Income Bracket | # Households | Median Income |
| 15 to 24 Years | 191 (3.0%) | $30,221 |
| 25 to 44 Years | 1,551 (24.6%) | $84,104 |
| 45 to 64 Years | 2,527 (40.1%) | $54,120 |
| 65+ Years | 2,040 (32.3%) | $53,589 |
| Total | 6,309 (100.0%) | $59,410 |
Poverty in Robertson County
Income Below Poverty by Sex and Age in Robertson County
With 14.1% poverty level for males and 14.4% for females among the residents of Robertson County, 5 year old males and 45 to 54 year old females are the most vulnerable to poverty, with 32 males (56.1%) and 241 females (23.8%) in their respective age groups living below the poverty level.
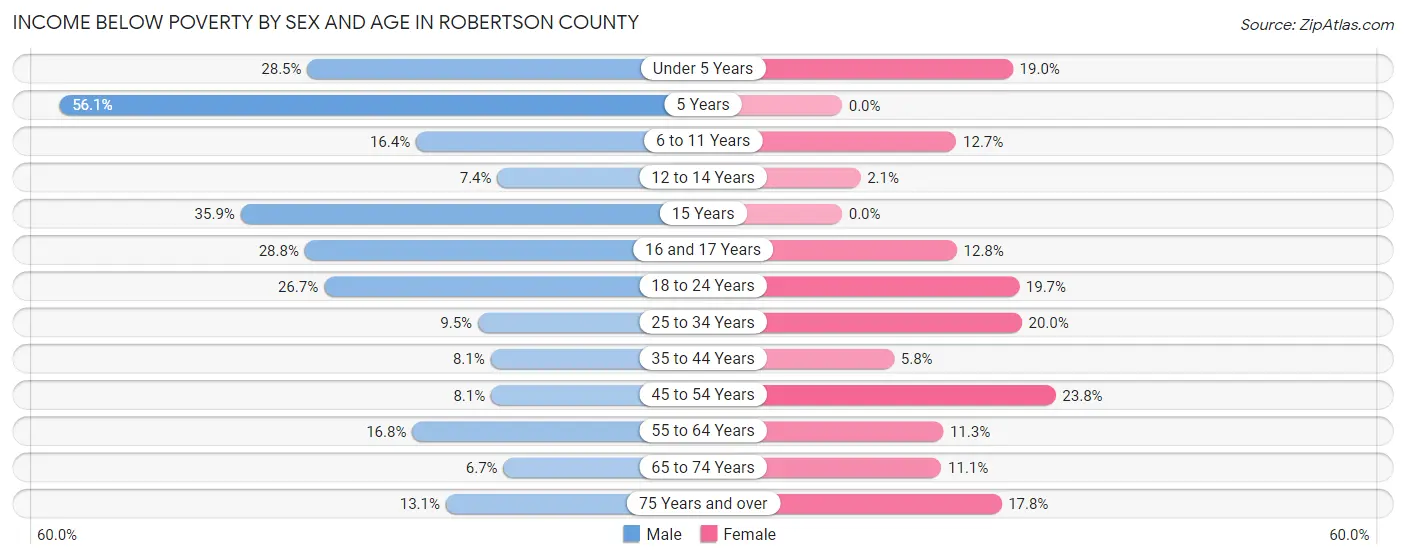
| Age Bracket | Male | Female |
| Under 5 Years | 144 (28.5%) | 106 (19.0%) |
| 5 Years | 32 (56.1%) | 0 (0.0%) |
| 6 to 11 Years | 95 (16.4%) | 69 (12.7%) |
| 12 to 14 Years | 45 (7.3%) | 8 (2.1%) |
| 15 Years | 46 (35.9%) | 0 (0.0%) |
| 16 and 17 Years | 72 (28.8%) | 33 (12.8%) |
| 18 to 24 Years | 161 (26.7%) | 142 (19.7%) |
| 25 to 34 Years | 92 (9.5%) | 183 (20.0%) |
| 35 to 44 Years | 84 (8.1%) | 58 (5.8%) |
| 45 to 54 Years | 72 (8.1%) | 241 (23.8%) |
| 55 to 64 Years | 192 (16.8%) | 125 (11.3%) |
| 65 to 74 Years | 66 (6.7%) | 119 (11.1%) |
| 75 Years and over | 69 (13.1%) | 126 (17.7%) |
| Total | 1,170 (14.1%) | 1,210 (14.4%) |
Income Above Poverty by Sex and Age in Robertson County
According to the poverty statistics in Robertson County, males aged 65 to 74 years and females aged 5 years are the age groups that are most secure financially, with 93.3% of males and 100.0% of females in these age groups living above the poverty line.
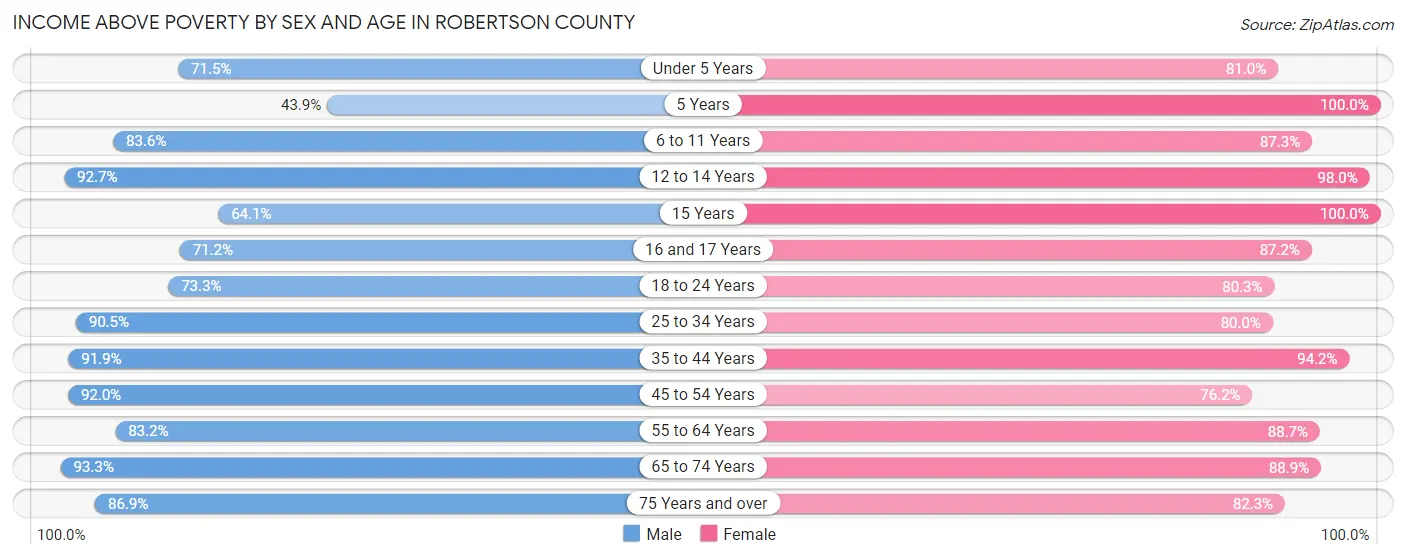
| Age Bracket | Male | Female |
| Under 5 Years | 361 (71.5%) | 451 (81.0%) |
| 5 Years | 25 (43.9%) | 50 (100.0%) |
| 6 to 11 Years | 484 (83.6%) | 473 (87.3%) |
| 12 to 14 Years | 567 (92.6%) | 382 (98.0%) |
| 15 Years | 82 (64.1%) | 74 (100.0%) |
| 16 and 17 Years | 178 (71.2%) | 225 (87.2%) |
| 18 to 24 Years | 443 (73.3%) | 578 (80.3%) |
| 25 to 34 Years | 875 (90.5%) | 731 (80.0%) |
| 35 to 44 Years | 952 (91.9%) | 942 (94.2%) |
| 45 to 54 Years | 822 (91.9%) | 772 (76.2%) |
| 55 to 64 Years | 949 (83.2%) | 984 (88.7%) |
| 65 to 74 Years | 924 (93.3%) | 957 (88.9%) |
| 75 Years and over | 458 (86.9%) | 584 (82.3%) |
| Total | 7,120 (85.9%) | 7,203 (85.6%) |
Income Below Poverty Among Married-Couple Families in Robertson County
The poverty statistics for married-couple families in Robertson County show that 4.7% or 143 of the total 3,067 families live below the poverty line. Families with 1 or 2 children have the highest poverty rate of 6.0%, comprising of 48 families. On the other hand, families with 5 or more children have the lowest poverty rate of 0.0%, which includes 0 families.
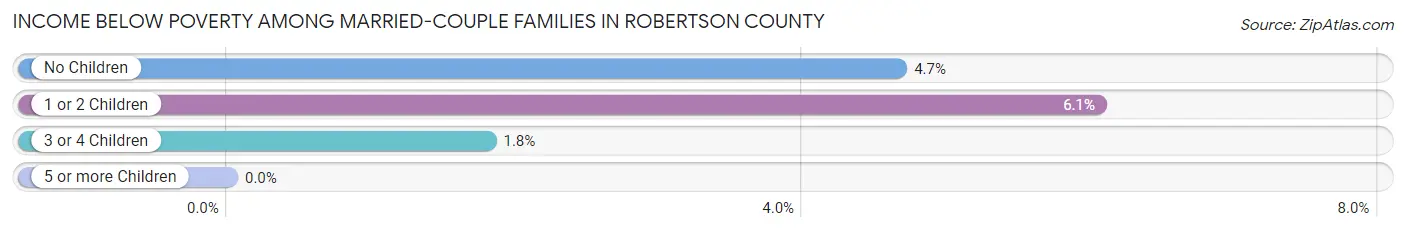
| Children | Above Poverty | Below Poverty |
| No Children | 1,840 (95.3%) | 90 (4.7%) |
| 1 or 2 Children | 745 (94.0%) | 48 (6.0%) |
| 3 or 4 Children | 273 (98.2%) | 5 (1.8%) |
| 5 or more Children | 66 (100.0%) | 0 (0.0%) |
| Total | 2,924 (95.3%) | 143 (4.7%) |
Income Below Poverty Among Single-Parent Households in Robertson County
According to the poverty data in Robertson County, 11.1% or 23 single-father households and 26.1% or 264 single-mother households are living below the poverty line. Among single-father households, those with no children have the highest poverty rate, with 10 households (12.2%) experiencing poverty. Likewise, among single-mother households, those with 5 or more children have the highest poverty rate, with 16 households (100.0%) falling below the poverty line.
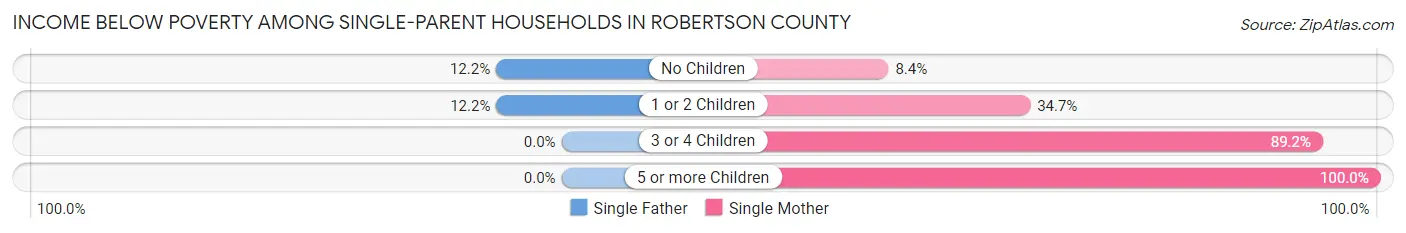
| Children | Single Father | Single Mother |
| No Children | 10 (12.2%) | 42 (8.4%) |
| 1 or 2 Children | 13 (12.1%) | 148 (34.7%) |
| 3 or 4 Children | 0 (0.0%) | 58 (89.2%) |
| 5 or more Children | 0 (0.0%) | 16 (100.0%) |
| Total | 23 (11.1%) | 264 (26.1%) |
Income Below Poverty Among Married-Couple vs Single-Parent Households in Robertson County
The poverty data for Robertson County shows that 143 of the married-couple family households (4.7%) and 287 of the single-parent households (23.6%) are living below the poverty level. Within the married-couple family households, those with 1 or 2 children have the highest poverty rate, with 48 households (6.0%) falling below the poverty line. Among the single-parent households, those with 5 or more children have the highest poverty rate, with 16 household (100.0%) living below poverty.
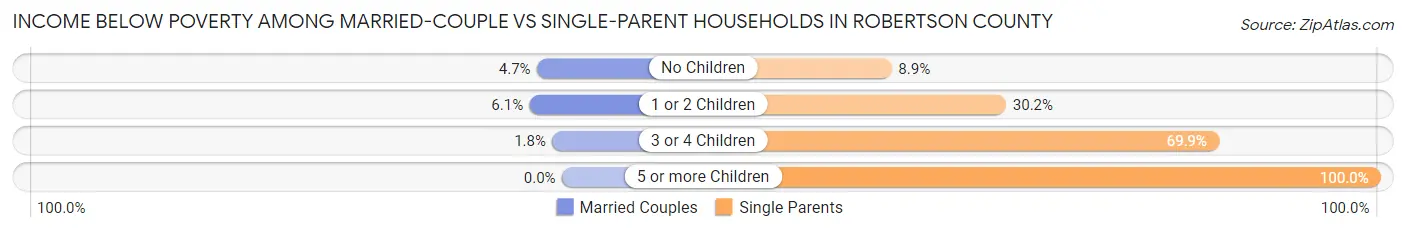
| Children | Married-Couple Families | Single-Parent Households |
| No Children | 90 (4.7%) | 52 (8.9%) |
| 1 or 2 Children | 48 (6.0%) | 161 (30.2%) |
| 3 or 4 Children | 5 (1.8%) | 58 (69.9%) |
| 5 or more Children | 0 (0.0%) | 16 (100.0%) |
| Total | 143 (4.7%) | 287 (23.6%) |
Race in Robertson County
The most populous races in Robertson County are White / Caucasian (11,078 | 65.5%), Hispanic or Latino (3,749 | 22.2%), and Black / African American (3,525 | 20.8%).
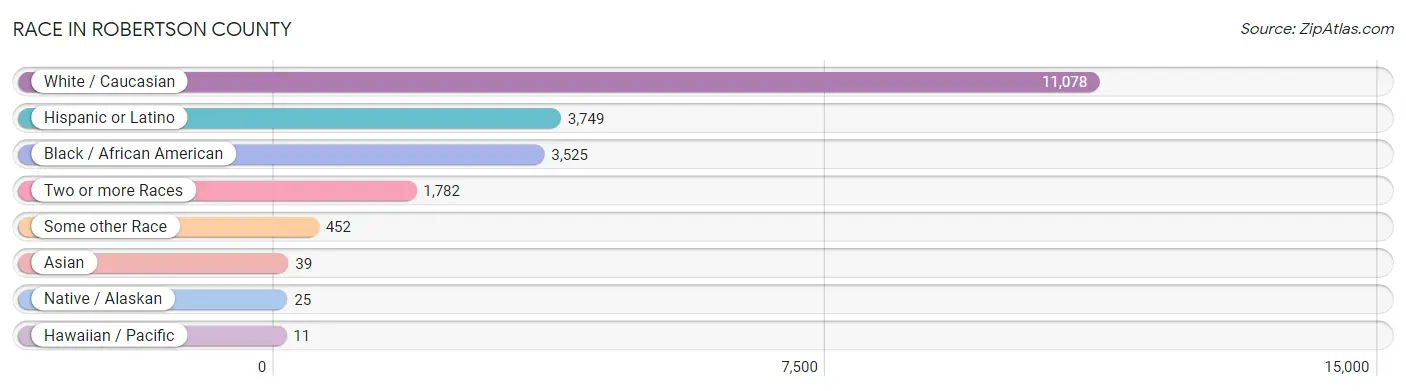
| Race | # Population | % Population |
| Asian | 39 | 0.2% |
| Black / African American | 3,525 | 20.8% |
| Hawaiian / Pacific | 11 | 0.1% |
| Hispanic or Latino | 3,749 | 22.2% |
| Native / Alaskan | 25 | 0.2% |
| White / Caucasian | 11,078 | 65.5% |
| Two or more Races | 1,782 | 10.5% |
| Some other Race | 452 | 2.7% |
| Total | 16,912 | 100.0% |
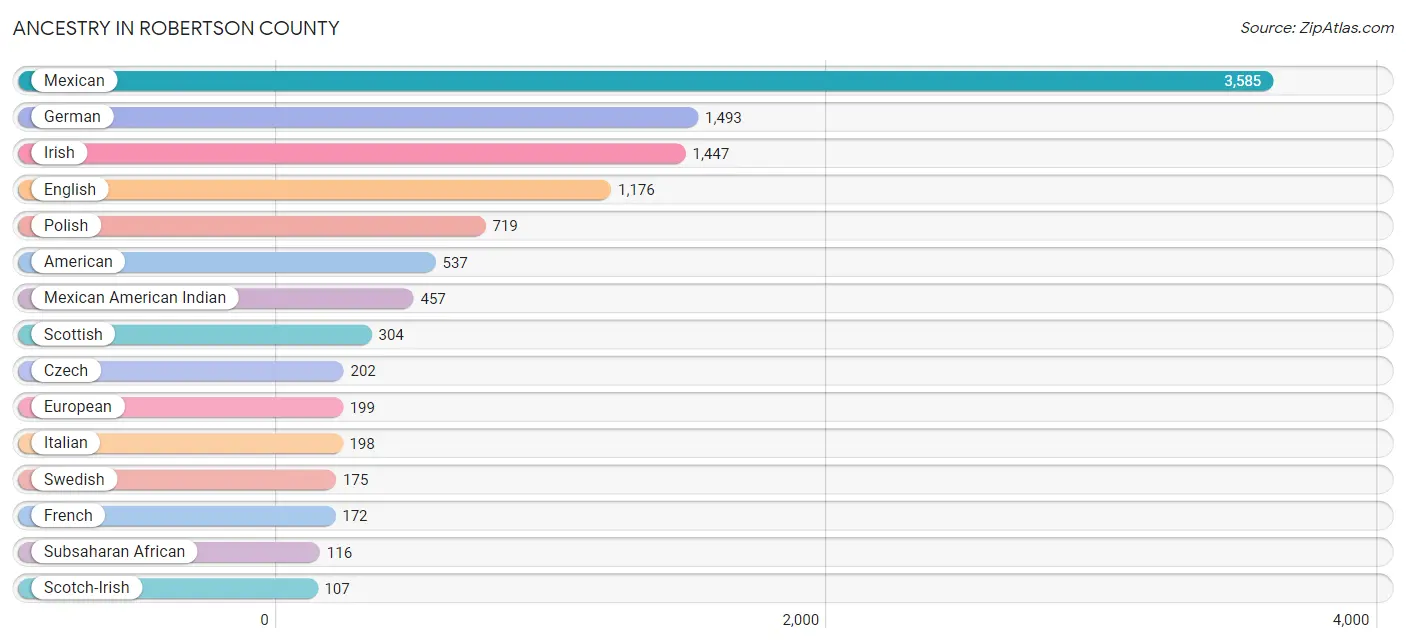
Ancestry in Robertson County
The most populous ancestries reported in Robertson County are Mexican (3,585 | 21.2%), German (1,493 | 8.8%), Irish (1,447 | 8.6%), English (1,176 | 7.0%), and Polish (719 | 4.3%), together accounting for 49.8% of all Robertson County residents.
| Ancestry | # Population | % Population |
| African | 69 | 0.4% |
| American | 537 | 3.2% |
| Arab | 3 | 0.0% |
| Armenian | 4 | 0.0% |
| Belgian | 8 | 0.1% |
| Blackfeet | 9 | 0.1% |
| British | 15 | 0.1% |
| Canadian | 5 | 0.0% |
| Celtic | 6 | 0.0% |
| Central American | 3 | 0.0% |
| Cherokee | 28 | 0.2% |
| Choctaw | 13 | 0.1% |
| Cuban | 6 | 0.0% |
| Czech | 202 | 1.2% |
| Danish | 16 | 0.1% |
| Dutch | 67 | 0.4% |
| Eastern European | 29 | 0.2% |
| English | 1,176 | 7.0% |
| Ethiopian | 47 | 0.3% |
| European | 199 | 1.2% |
| French | 172 | 1.0% |
| French American Indian | 16 | 0.1% |
| French Canadian | 73 | 0.4% |
| German | 1,493 | 8.8% |
| Greek | 24 | 0.1% |
| Honduran | 3 | 0.0% |
| Hungarian | 9 | 0.1% |
| Indian (Asian) | 4 | 0.0% |
| Irish | 1,447 | 8.6% |
| Italian | 198 | 1.2% |
| Lebanese | 3 | 0.0% |
| Lithuanian | 16 | 0.1% |
| Mexican | 3,585 | 21.2% |
| Mexican American Indian | 457 | 2.7% |
| Native Hawaiian | 11 | 0.1% |
| Northern European | 35 | 0.2% |
| Norwegian | 35 | 0.2% |
| Polish | 719 | 4.3% |
| Puerto Rican | 44 | 0.3% |
| Russian | 5 | 0.0% |
| Scandinavian | 32 | 0.2% |
| Scotch-Irish | 107 | 0.6% |
| Scottish | 304 | 1.8% |
| Spaniard | 57 | 0.3% |
| Sri Lankan | 34 | 0.2% |
| Subsaharan African | 116 | 0.7% |
| Swedish | 175 | 1.0% |
| Thai | 21 | 0.1% |
| Ukrainian | 19 | 0.1% |
| Welsh | 37 | 0.2% | View All 50 Rows |
Immigrants in Robertson County
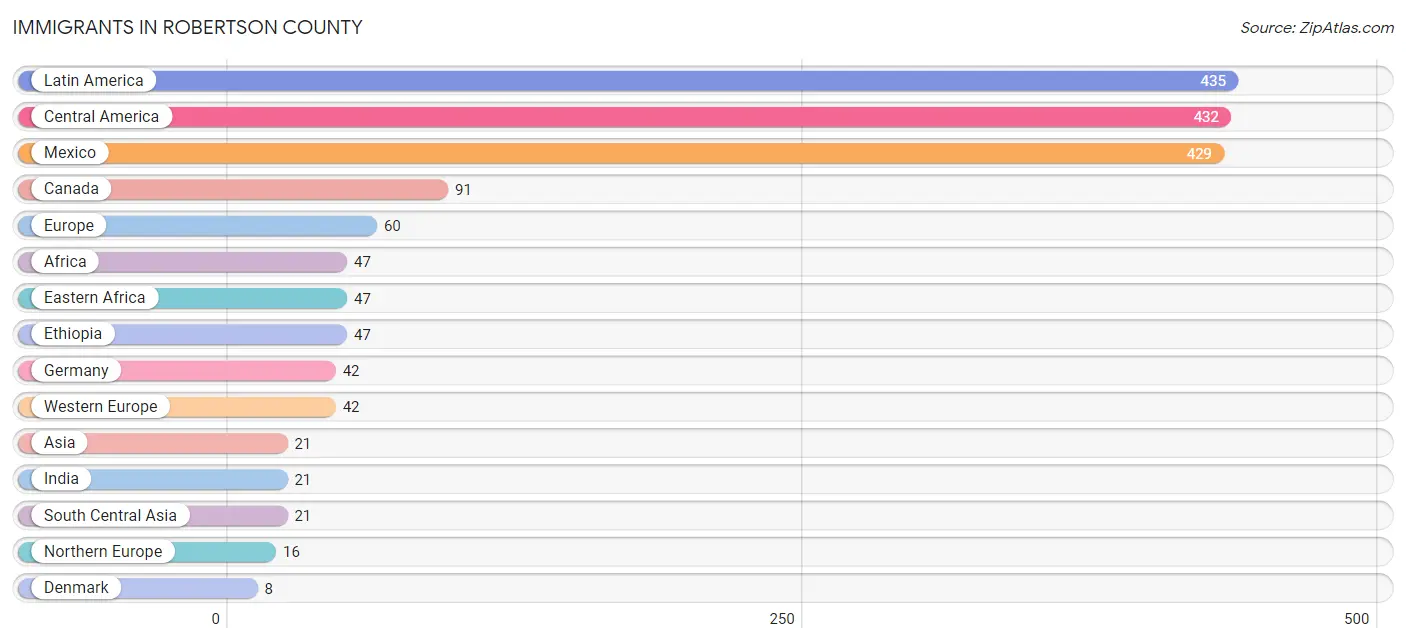
The most numerous immigrant groups reported in Robertson County came from Latin America (435 | 2.6%), Central America (432 | 2.5%), Mexico (429 | 2.5%), Canada (91 | 0.5%), and Europe (60 | 0.4%), together accounting for 8.6% of all Robertson County residents.
| Immigration Origin | # Population | % Population |
| Africa | 47 | 0.3% |
| Asia | 21 | 0.1% |
| Canada | 91 | 0.5% |
| Caribbean | 3 | 0.0% |
| Central America | 432 | 2.5% |
| Cuba | 3 | 0.0% |
| Denmark | 8 | 0.1% |
| Eastern Africa | 47 | 0.3% |
| England | 8 | 0.1% |
| Ethiopia | 47 | 0.3% |
| Europe | 60 | 0.4% |
| Germany | 42 | 0.3% |
| Honduras | 3 | 0.0% |
| India | 21 | 0.1% |
| Italy | 2 | 0.0% |
| Latin America | 435 | 2.6% |
| Mexico | 429 | 2.5% |
| Northern Europe | 16 | 0.1% |
| South Central Asia | 21 | 0.1% |
| Southern Europe | 2 | 0.0% |
| Western Europe | 42 | 0.3% | View All 21 Rows |
Sex and Age in Robertson County
Sex and Age in Robertson County
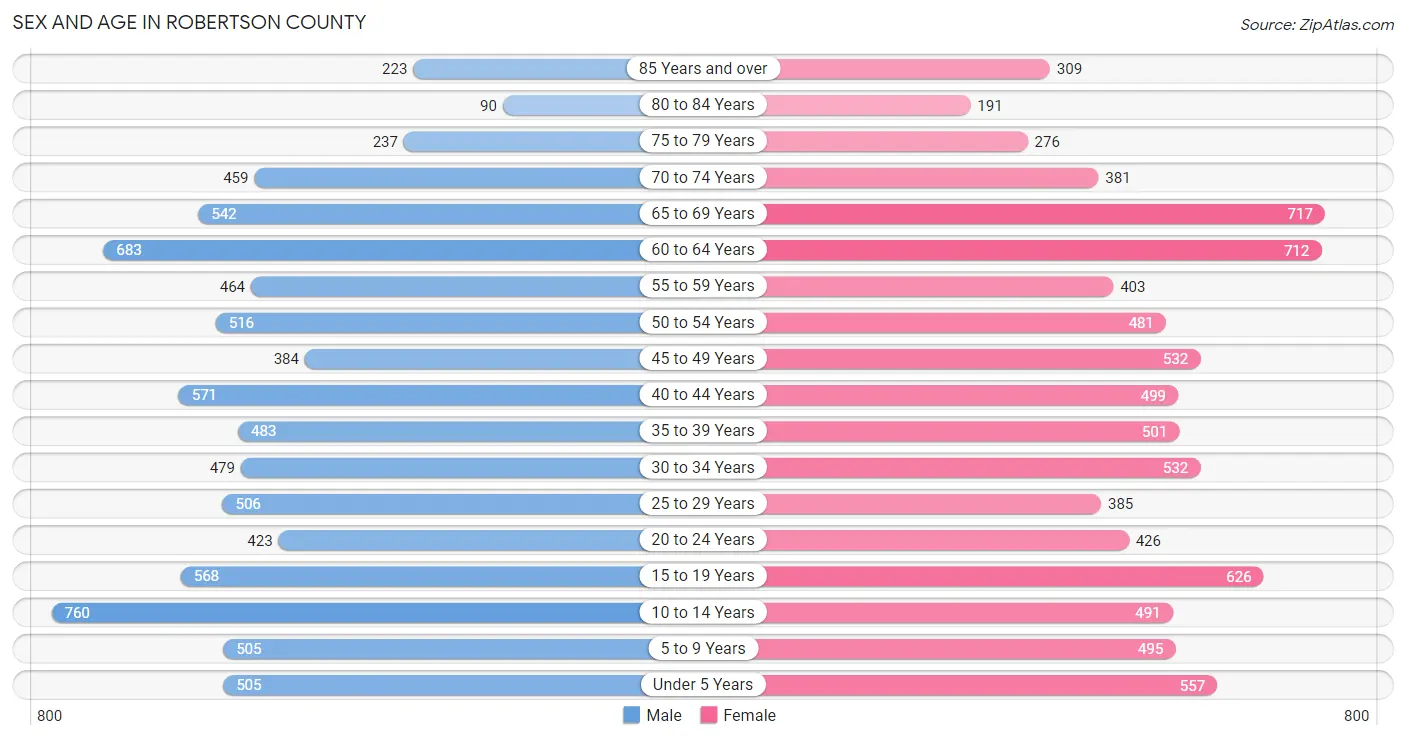
The most populous age groups in Robertson County are 10 to 14 Years (760 | 9.0%) for men and 65 to 69 Years (717 | 8.4%) for women.
| Age Bracket | Male | Female |
| Under 5 Years | 505 (6.0%) | 557 (6.5%) |
| 5 to 9 Years | 505 (6.0%) | 495 (5.8%) |
| 10 to 14 Years | 760 (9.0%) | 491 (5.8%) |
| 15 to 19 Years | 568 (6.8%) | 626 (7.3%) |
| 20 to 24 Years | 423 (5.0%) | 426 (5.0%) |
| 25 to 29 Years | 506 (6.0%) | 385 (4.5%) |
| 30 to 34 Years | 479 (5.7%) | 532 (6.2%) |
| 35 to 39 Years | 483 (5.8%) | 501 (5.9%) |
| 40 to 44 Years | 571 (6.8%) | 499 (5.9%) |
| 45 to 49 Years | 384 (4.6%) | 532 (6.2%) |
| 50 to 54 Years | 516 (6.1%) | 481 (5.7%) |
| 55 to 59 Years | 464 (5.5%) | 403 (4.7%) |
| 60 to 64 Years | 683 (8.1%) | 712 (8.4%) |
| 65 to 69 Years | 542 (6.5%) | 717 (8.4%) |
| 70 to 74 Years | 459 (5.5%) | 381 (4.5%) |
| 75 to 79 Years | 237 (2.8%) | 276 (3.2%) |
| 80 to 84 Years | 90 (1.1%) | 191 (2.2%) |
| 85 Years and over | 223 (2.7%) | 309 (3.6%) |
| Total | 8,398 (100.0%) | 8,514 (100.0%) |
Families and Households in Robertson County
Median Family Size in Robertson County
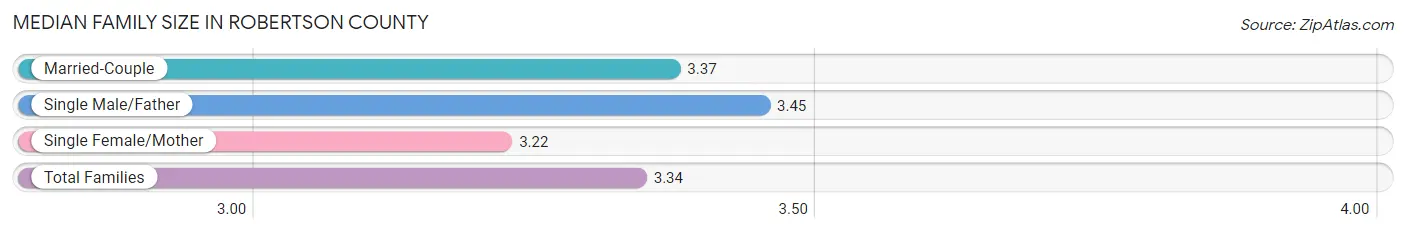
The median family size in Robertson County is 3.34 persons per family, with single male/father families (207 | 4.8%) accounting for the largest median family size of 3.45 persons per family. On the other hand, single female/mother families (1,010 | 23.6%) represent the smallest median family size with 3.22 persons per family.
| Family Type | # Families | Family Size |
| Married-Couple | 3,067 (71.6%) | 3.37 |
| Single Male/Father | 207 (4.8%) | 3.45 |
| Single Female/Mother | 1,010 (23.6%) | 3.22 |
| Total Families | 4,284 (100.0%) | 3.34 |
Median Household Size in Robertson County
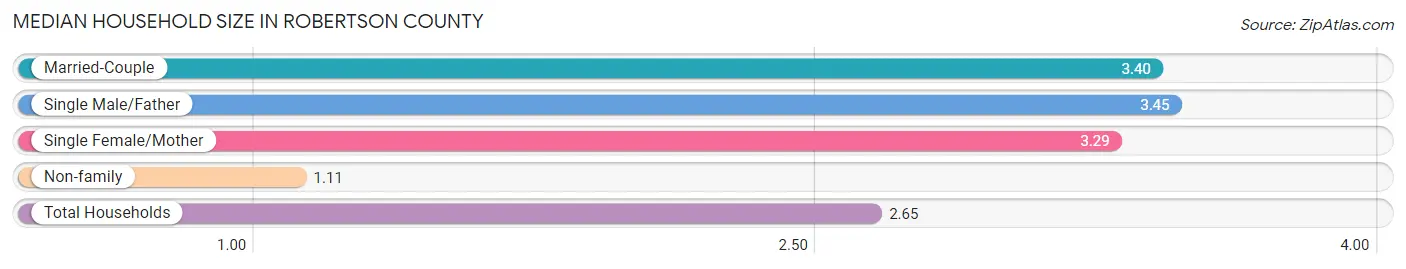
The median household size in Robertson County is 2.65 persons per household, with single male/father households (207 | 3.3%) accounting for the largest median household size of 3.45 persons per household. non-family households (2,025 | 32.1%) represent the smallest median household size with 1.11 persons per household.
| Household Type | # Households | Household Size |
| Married-Couple | 3,067 (48.6%) | 3.40 |
| Single Male/Father | 207 (3.3%) | 3.45 |
| Single Female/Mother | 1,010 (16.0%) | 3.29 |
| Non-family | 2,025 (32.1%) | 1.11 |
| Total Households | 6,309 (100.0%) | 2.65 |
Household Size by Marriage Status in Robertson County
Out of a total of 6,309 households in Robertson County, 4,284 (67.9%) are family households, while 2,025 (32.1%) are nonfamily households. The most numerous type of family households are 2-person households, comprising 2,176, and the most common type of nonfamily households are 1-person households, comprising 1,851.
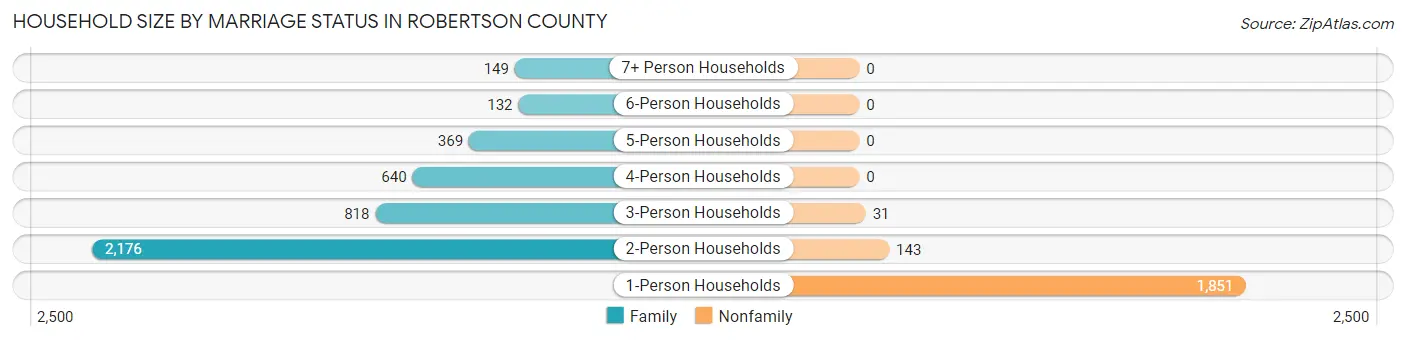
| Household Size | Family Households | Nonfamily Households |
| 1-Person Households | - | 1,851 (29.3%) |
| 2-Person Households | 2,176 (34.5%) | 143 (2.3%) |
| 3-Person Households | 818 (13.0%) | 31 (0.5%) |
| 4-Person Households | 640 (10.1%) | 0 (0.0%) |
| 5-Person Households | 369 (5.9%) | 0 (0.0%) |
| 6-Person Households | 132 (2.1%) | 0 (0.0%) |
| 7+ Person Households | 149 (2.4%) | 0 (0.0%) |
| Total | 4,284 (67.9%) | 2,025 (32.1%) |
Female Fertility in Robertson County
Fertility by Age in Robertson County
Average fertility rate in Robertson County is 101.0 births per 1,000 women. Women in the age bracket of 20 to 34 years have the highest fertility rate with 203.0 births per 1,000 women. Women in the age bracket of 20 to 34 years acount for 74.3% of all women with births.
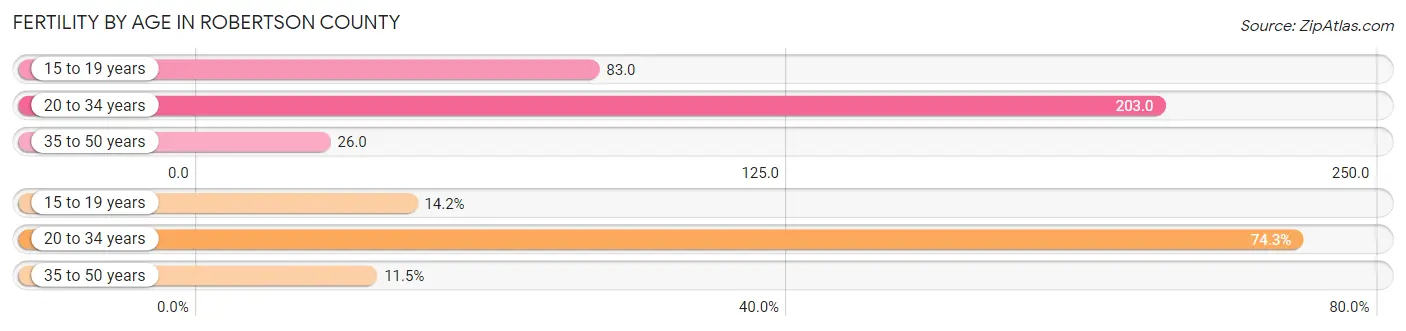
| Age Bracket | Women with Births | Births / 1,000 Women |
| 15 to 19 years | 52 (14.2%) | 83.0 |
| 20 to 34 years | 272 (74.3%) | 203.0 |
| 35 to 50 years | 42 (11.5%) | 26.0 |
| Total | 366 (100.0%) | 101.0 |
Fertility by Age by Marriage Status in Robertson County
43.4% of women with births (366) in Robertson County are married. The highest percentage of unmarried women with births falls into 15 to 19 years age bracket with 100.0% of them unmarried at the time of birth, while the lowest percentage of unmarried women with births belong to 35 to 50 years age bracket with 0.0% of them unmarried.
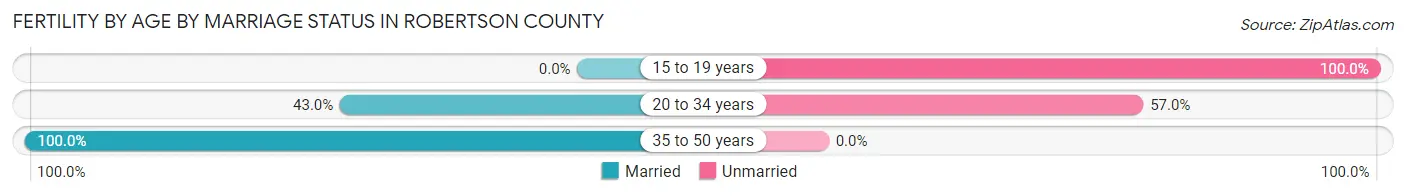
| Age Bracket | Married | Unmarried |
| 15 to 19 years | 0 (0.0%) | 52 (100.0%) |
| 20 to 34 years | 117 (43.0%) | 155 (57.0%) |
| 35 to 50 years | 42 (100.0%) | 0 (0.0%) |
| Total | 159 (43.4%) | 207 (56.6%) |
Fertility by Education in Robertson County
Average fertility rate in Robertson County is 101.0 births per 1,000 women. Women with the education attainment of graduate degree have the highest fertility rate of 275.0 births per 1,000 women, while women with the education attainment of college or associate's degree have the lowest fertility at 18.0 births per 1,000 women. Women with the education attainment of high school diploma represent 42.3% of all women with births.
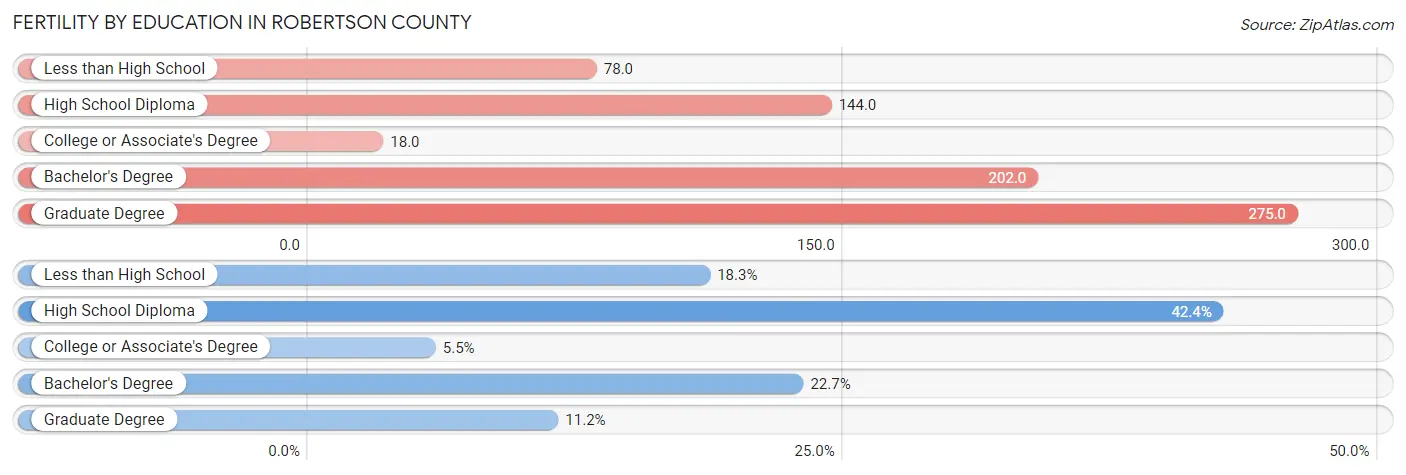
| Educational Attainment | Women with Births | Births / 1,000 Women |
| Less than High School | 67 (18.3%) | 78.0 |
| High School Diploma | 155 (42.3%) | 144.0 |
| College or Associate's Degree | 20 (5.5%) | 18.0 |
| Bachelor's Degree | 83 (22.7%) | 202.0 |
| Graduate Degree | 41 (11.2%) | 275.0 |
| Total | 366 (100.0%) | 101.0 |
Fertility by Education by Marriage Status in Robertson County
56.6% of women with births in Robertson County are unmarried. Women with the educational attainment of college or associate's degree are most likely to be married with 100.0% of them married at childbirth, while women with the educational attainment of high school diploma are least likely to be married with 100.0% of them unmarried at childbirth.
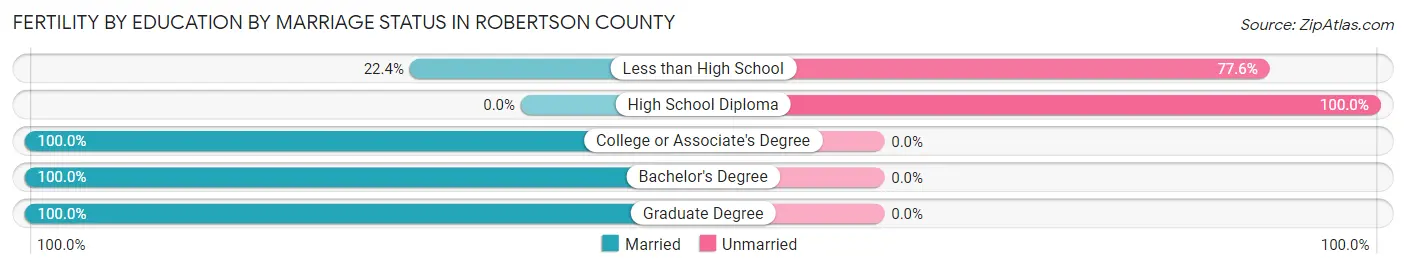
| Educational Attainment | Married | Unmarried |
| Less than High School | 15 (22.4%) | 52 (77.6%) |
| High School Diploma | 0 (0.0%) | 155 (100.0%) |
| College or Associate's Degree | 20 (100.0%) | 0 (0.0%) |
| Bachelor's Degree | 83 (100.0%) | 0 (0.0%) |
| Graduate Degree | 41 (100.0%) | 0 (0.0%) |
| Total | 159 (43.4%) | 207 (56.6%) |
Employment Characteristics in Robertson County
Employment by Class of Employer in Robertson County
Among the 6,617 employed individuals in Robertson County, private company employees (3,994 | 60.4%), state government employees (758 | 11.5%), and local government employees (624 | 9.4%) make up the most common classes of employment.
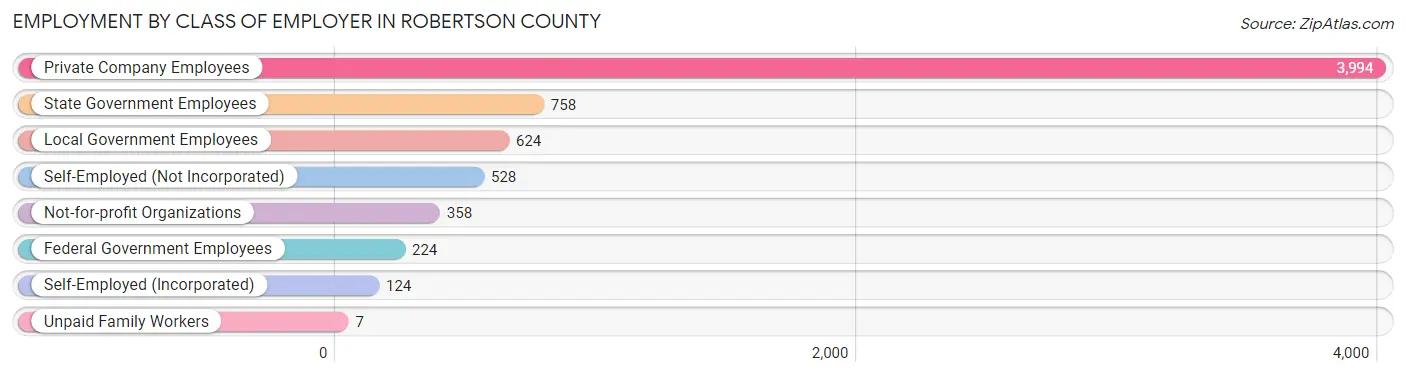
| Employer Class | # Employees | % Employees |
| Private Company Employees | 3,994 | 60.4% |
| Self-Employed (Incorporated) | 124 | 1.9% |
| Self-Employed (Not Incorporated) | 528 | 8.0% |
| Not-for-profit Organizations | 358 | 5.4% |
| Local Government Employees | 624 | 9.4% |
| State Government Employees | 758 | 11.5% |
| Federal Government Employees | 224 | 3.4% |
| Unpaid Family Workers | 7 | 0.1% |
| Total | 6,617 | 100.0% |
Employment Status by Age in Robertson County
According to the labor force statistics for Robertson County, out of the total population over 16 years of age (13,397), 54.7% or 7,328 individuals are in the labor force, with 8.7% or 638 of them unemployed. The age group with the highest labor force participation rate is 35 to 44 years, with 80.7% or 1,658 individuals in the labor force. Within the labor force, the 20 to 24 years age range has the highest percentage of unemployed individuals, with 22.9% or 131 of them being unemployed.
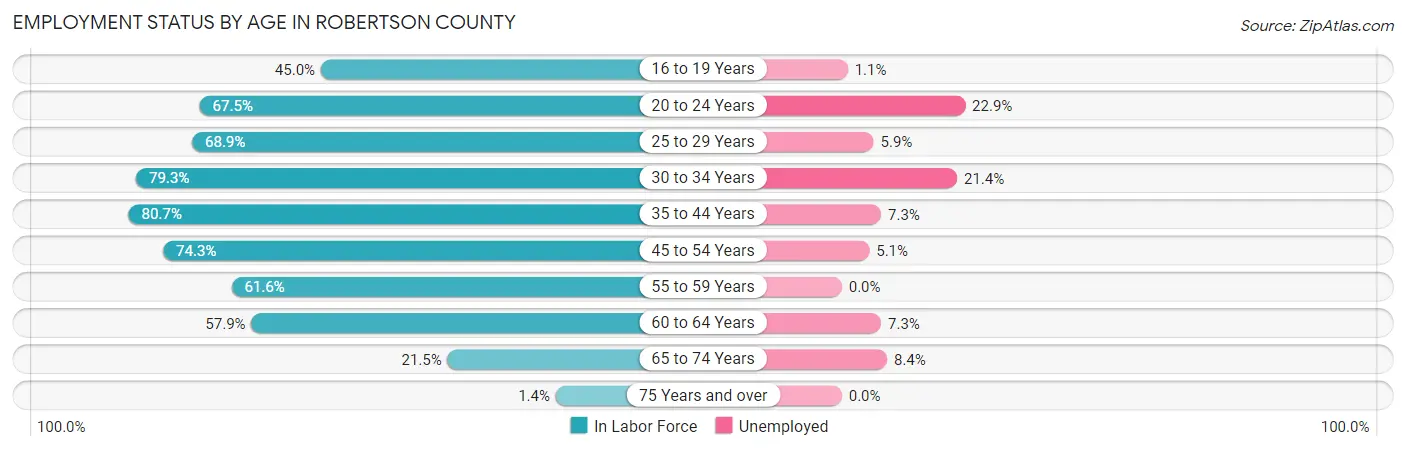
| Age Bracket | In Labor Force | Unemployed |
| 16 to 19 Years | 446 (45.0%) | 5 (1.1%) |
| 20 to 24 Years | 573 (67.5%) | 131 (22.9%) |
| 25 to 29 Years | 614 (68.9%) | 36 (5.9%) |
| 30 to 34 Years | 802 (79.3%) | 172 (21.4%) |
| 35 to 44 Years | 1,658 (80.7%) | 121 (7.3%) |
| 45 to 54 Years | 1,421 (74.3%) | 72 (5.1%) |
| 55 to 59 Years | 534 (61.6%) | 0 (0.0%) |
| 60 to 64 Years | 808 (57.9%) | 59 (7.3%) |
| 65 to 74 Years | 451 (21.5%) | 38 (8.4%) |
| 75 Years and over | 19 (1.4%) | 0 (0.0%) |
| Total | 7,328 (54.7%) | 638 (8.7%) |
Employment Status by Educational Attainment in Robertson County
According to labor force statistics for Robertson County, 71.8% of individuals (5,838) out of the total population between 25 and 64 years of age (8,131) are in the labor force, with 7.9% or 461 of them being unemployed. The group with the highest labor force participation rate are those with the educational attainment of bachelor's degree or higher, with 83.0% or 1,132 individuals in the labor force. Within the labor force, individuals with high school diploma education have the highest percentage of unemployment, with 14.0% or 308 of them being unemployed.
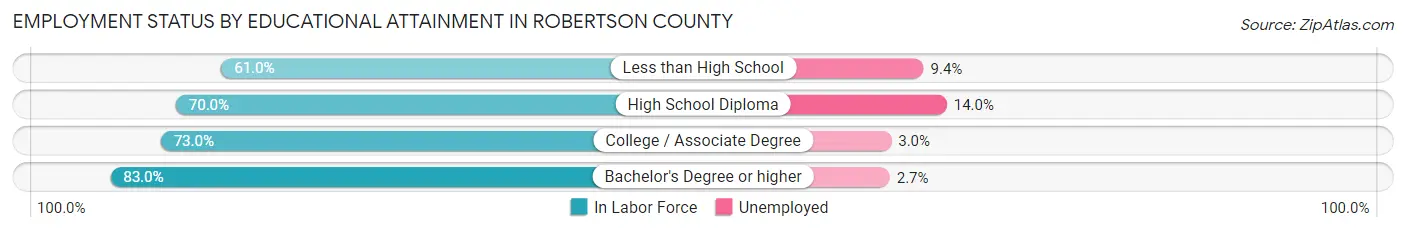
| Educational Attainment | In Labor Force | Unemployed |
| Less than High School | 712 (61.0%) | 110 (9.4%) |
| High School Diploma | 2,203 (70.0%) | 441 (14.0%) |
| College / Associate Degree | 1,790 (73.0%) | 74 (3.0%) |
| Bachelor's Degree or higher | 1,132 (83.0%) | 37 (2.7%) |
| Total | 5,838 (71.8%) | 642 (7.9%) |
Employment Occupations by Sex in Robertson County
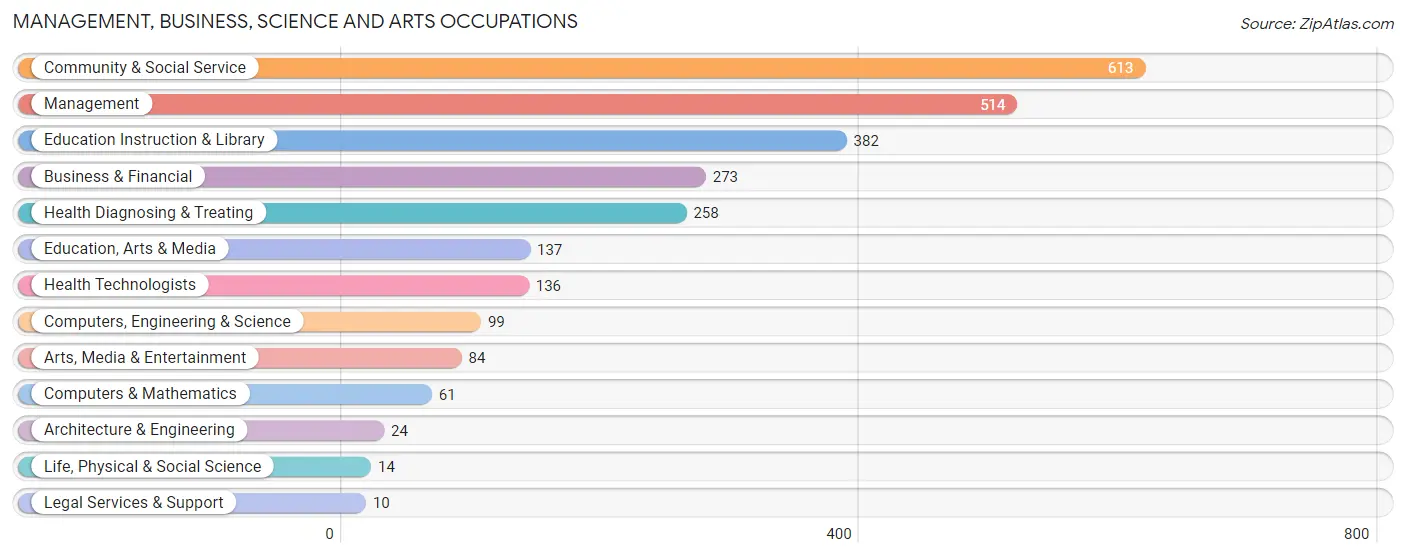
Management, Business, Science and Arts Occupations
The most common Management, Business, Science and Arts occupations in Robertson County are Community & Social Service (613 | 9.2%), Management (514 | 7.7%), Education Instruction & Library (382 | 5.7%), Business & Financial (273 | 4.1%), and Health Diagnosing & Treating (258 | 3.9%).
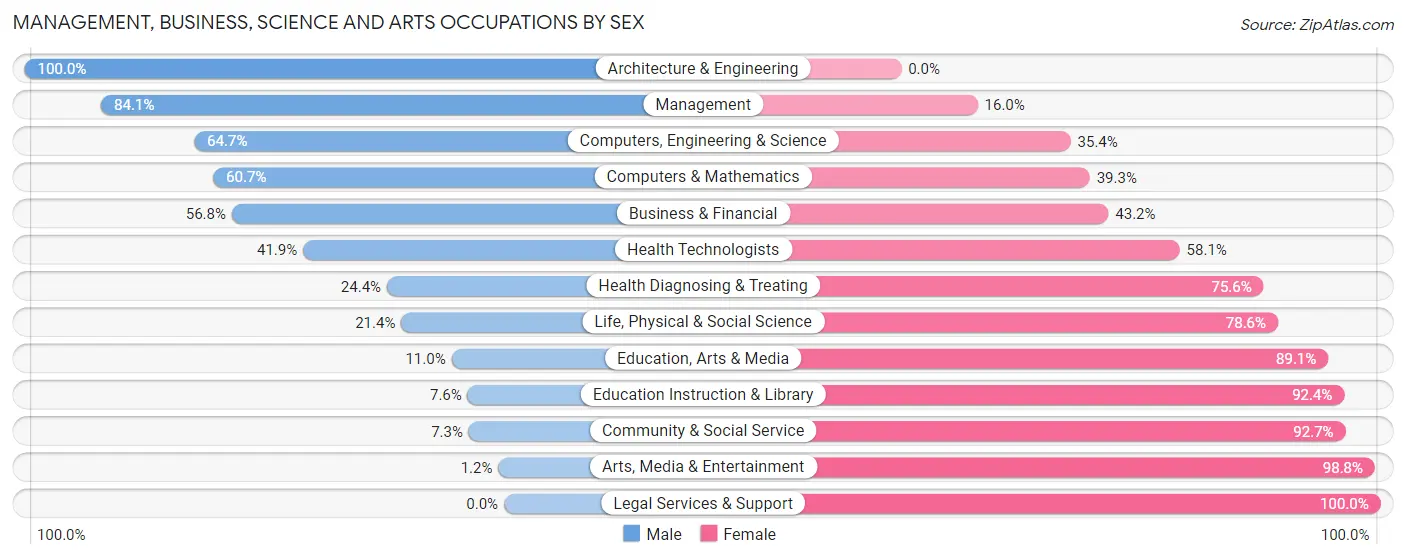
Management, Business, Science and Arts Occupations by Sex
Within the Management, Business, Science and Arts occupations in Robertson County, the most male-oriented occupations are Architecture & Engineering (100.0%), Management (84.1%), and Computers, Engineering & Science (64.6%), while the most female-oriented occupations are Legal Services & Support (100.0%), Arts, Media & Entertainment (98.8%), and Community & Social Service (92.7%).
| Occupation | Male | Female |
| Management | 432 (84.1%) | 82 (16.0%) |
| Business & Financial | 155 (56.8%) | 118 (43.2%) |
| Computers, Engineering & Science | 64 (64.6%) | 35 (35.3%) |
| Computers & Mathematics | 37 (60.7%) | 24 (39.3%) |
| Architecture & Engineering | 24 (100.0%) | 0 (0.0%) |
| Life, Physical & Social Science | 3 (21.4%) | 11 (78.6%) |
| Community & Social Service | 45 (7.3%) | 568 (92.7%) |
| Education, Arts & Media | 15 (11.0%) | 122 (89.0%) |
| Legal Services & Support | 0 (0.0%) | 10 (100.0%) |
| Education Instruction & Library | 29 (7.6%) | 353 (92.4%) |
| Arts, Media & Entertainment | 1 (1.2%) | 83 (98.8%) |
| Health Diagnosing & Treating | 63 (24.4%) | 195 (75.6%) |
| Health Technologists | 57 (41.9%) | 79 (58.1%) |
| Total (Category) | 759 (43.2%) | 998 (56.8%) |
| Total (Overall) | 3,249 (48.6%) | 3,441 (51.4%) |
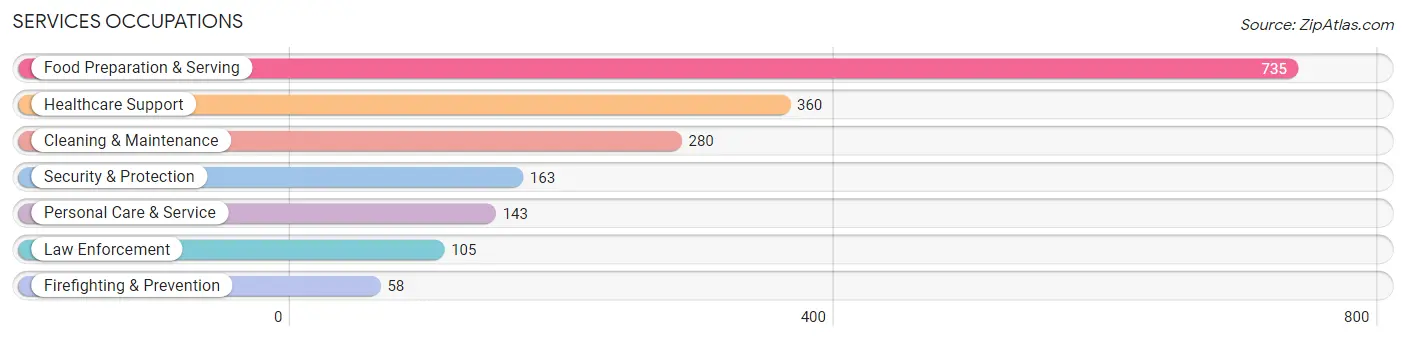
Services Occupations
The most common Services occupations in Robertson County are Food Preparation & Serving (735 | 11.0%), Healthcare Support (360 | 5.4%), Cleaning & Maintenance (280 | 4.2%), Security & Protection (163 | 2.4%), and Personal Care & Service (143 | 2.1%).
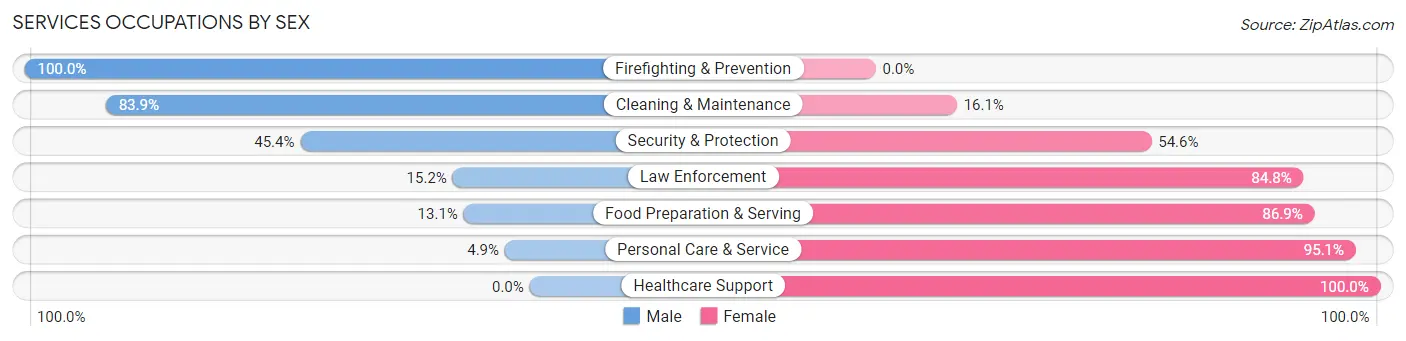
Services Occupations by Sex
Within the Services occupations in Robertson County, the most male-oriented occupations are Firefighting & Prevention (100.0%), Cleaning & Maintenance (83.9%), and Security & Protection (45.4%), while the most female-oriented occupations are Healthcare Support (100.0%), Personal Care & Service (95.1%), and Food Preparation & Serving (86.9%).
| Occupation | Male | Female |
| Healthcare Support | 0 (0.0%) | 360 (100.0%) |
| Security & Protection | 74 (45.4%) | 89 (54.6%) |
| Firefighting & Prevention | 58 (100.0%) | 0 (0.0%) |
| Law Enforcement | 16 (15.2%) | 89 (84.8%) |
| Food Preparation & Serving | 96 (13.1%) | 639 (86.9%) |
| Cleaning & Maintenance | 235 (83.9%) | 45 (16.1%) |
| Personal Care & Service | 7 (4.9%) | 136 (95.1%) |
| Total (Category) | 412 (24.5%) | 1,269 (75.5%) |
| Total (Overall) | 3,249 (48.6%) | 3,441 (51.4%) |
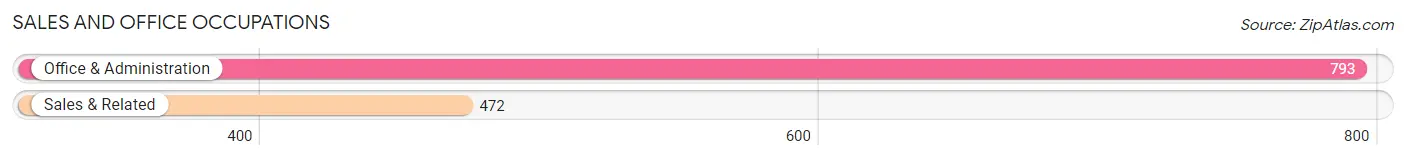
Sales and Office Occupations
The most common Sales and Office occupations in Robertson County are Office & Administration (793 | 11.8%), and Sales & Related (472 | 7.1%).
Sales and Office Occupations by Sex
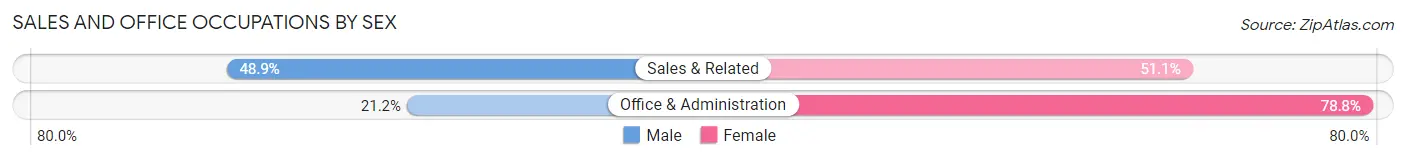
| Occupation | Male | Female |
| Sales & Related | 231 (48.9%) | 241 (51.1%) |
| Office & Administration | 168 (21.2%) | 625 (78.8%) |
| Total (Category) | 399 (31.5%) | 866 (68.5%) |
| Total (Overall) | 3,249 (48.6%) | 3,441 (51.4%) |
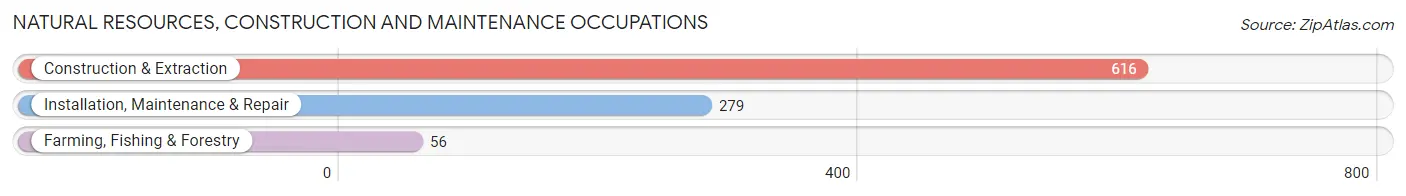
Natural Resources, Construction and Maintenance Occupations
The most common Natural Resources, Construction and Maintenance occupations in Robertson County are Construction & Extraction (616 | 9.2%), Installation, Maintenance & Repair (279 | 4.2%), and Farming, Fishing & Forestry (56 | 0.8%).
Natural Resources, Construction and Maintenance Occupations by Sex
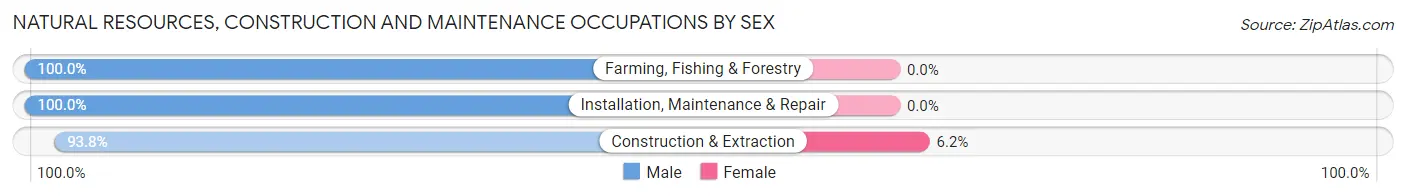
| Occupation | Male | Female |
| Farming, Fishing & Forestry | 56 (100.0%) | 0 (0.0%) |
| Construction & Extraction | 578 (93.8%) | 38 (6.2%) |
| Installation, Maintenance & Repair | 279 (100.0%) | 0 (0.0%) |
| Total (Category) | 913 (96.0%) | 38 (4.0%) |
| Total (Overall) | 3,249 (48.6%) | 3,441 (51.4%) |
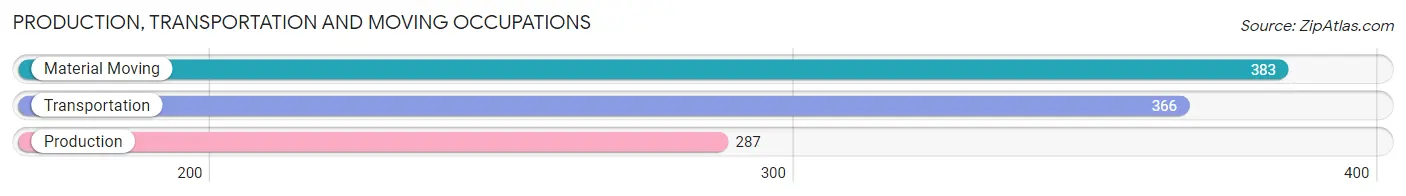
Production, Transportation and Moving Occupations
The most common Production, Transportation and Moving occupations in Robertson County are Material Moving (383 | 5.7%), Transportation (366 | 5.5%), and Production (287 | 4.3%).
Production, Transportation and Moving Occupations by Sex
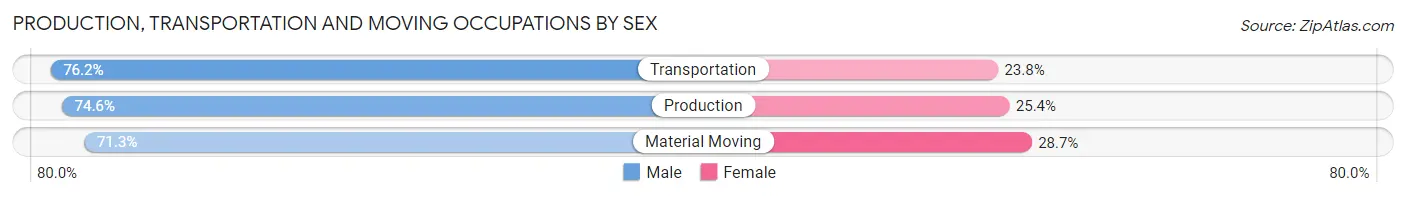
| Occupation | Male | Female |
| Production | 214 (74.6%) | 73 (25.4%) |
| Transportation | 279 (76.2%) | 87 (23.8%) |
| Material Moving | 273 (71.3%) | 110 (28.7%) |
| Total (Category) | 766 (73.9%) | 270 (26.1%) |
| Total (Overall) | 3,249 (48.6%) | 3,441 (51.4%) |
Employment Industries by Sex in Robertson County
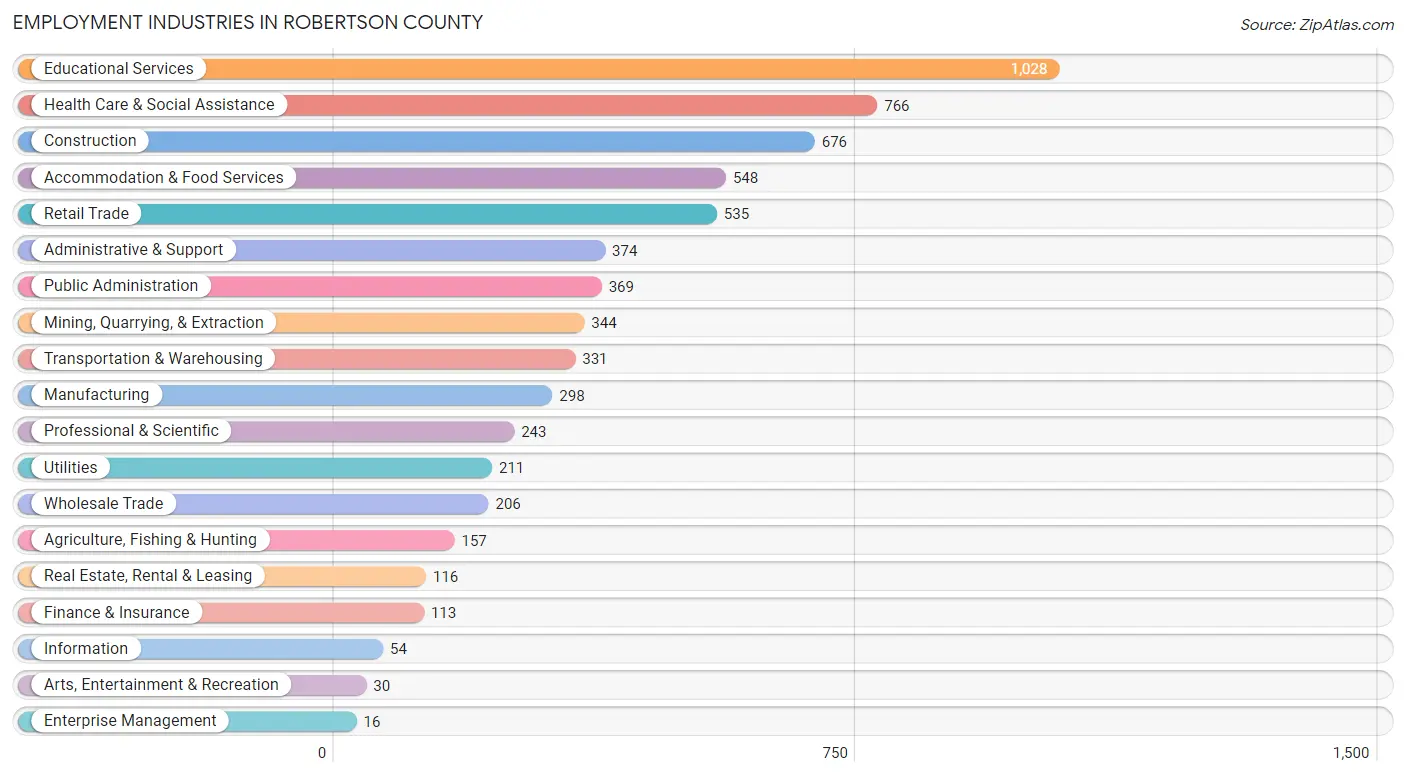
Employment Industries in Robertson County
The major employment industries in Robertson County include Educational Services (1,028 | 15.4%), Health Care & Social Assistance (766 | 11.5%), Construction (676 | 10.1%), Accommodation & Food Services (548 | 8.2%), and Retail Trade (535 | 8.0%).
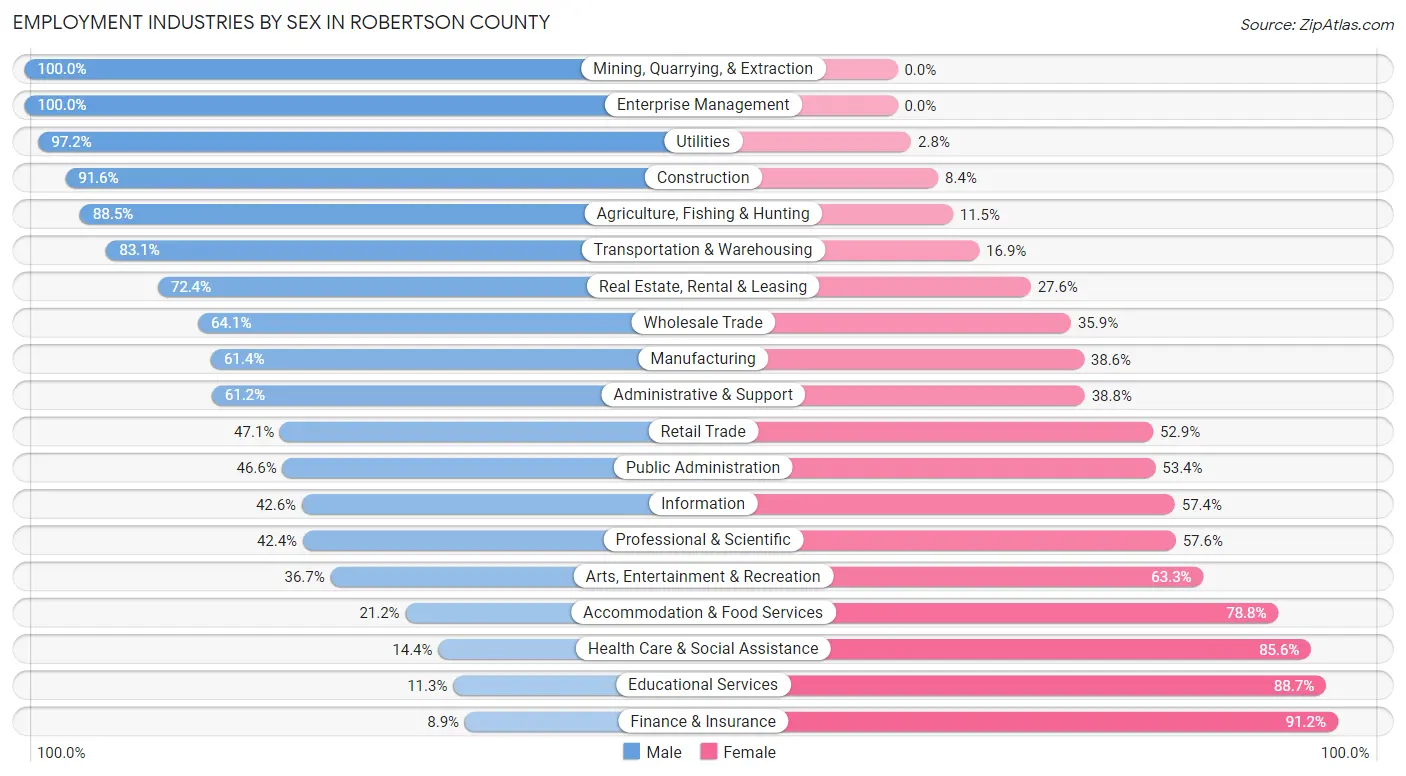
Employment Industries by Sex in Robertson County
The Robertson County industries that see more men than women are Mining, Quarrying, & Extraction (100.0%), Enterprise Management (100.0%), and Utilities (97.2%), whereas the industries that tend to have a higher number of women are Finance & Insurance (91.1%), Educational Services (88.7%), and Health Care & Social Assistance (85.6%).
| Industry | Male | Female |
| Agriculture, Fishing & Hunting | 139 (88.5%) | 18 (11.5%) |
| Mining, Quarrying, & Extraction | 344 (100.0%) | 0 (0.0%) |
| Construction | 619 (91.6%) | 57 (8.4%) |
| Manufacturing | 183 (61.4%) | 115 (38.6%) |
| Wholesale Trade | 132 (64.1%) | 74 (35.9%) |
| Retail Trade | 252 (47.1%) | 283 (52.9%) |
| Transportation & Warehousing | 275 (83.1%) | 56 (16.9%) |
| Utilities | 205 (97.2%) | 6 (2.8%) |
| Information | 23 (42.6%) | 31 (57.4%) |
| Finance & Insurance | 10 (8.8%) | 103 (91.1%) |
| Real Estate, Rental & Leasing | 84 (72.4%) | 32 (27.6%) |
| Professional & Scientific | 103 (42.4%) | 140 (57.6%) |
| Enterprise Management | 16 (100.0%) | 0 (0.0%) |
| Administrative & Support | 229 (61.2%) | 145 (38.8%) |
| Educational Services | 116 (11.3%) | 912 (88.7%) |
| Health Care & Social Assistance | 110 (14.4%) | 656 (85.6%) |
| Arts, Entertainment & Recreation | 11 (36.7%) | 19 (63.3%) |
| Accommodation & Food Services | 116 (21.2%) | 432 (78.8%) |
| Public Administration | 172 (46.6%) | 197 (53.4%) |
| Total | 3,249 (48.6%) | 3,441 (51.4%) |
Education in Robertson County
School Enrollment in Robertson County
The most common levels of schooling among the 3,808 students in Robertson County are middle school (1,126 | 29.6%), elementary school (895 | 23.5%), and high school (852 | 22.4%).
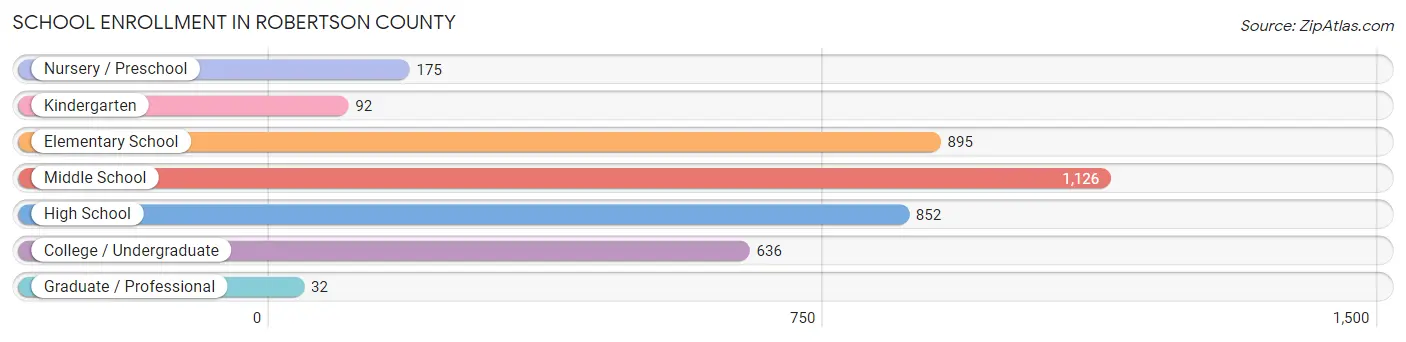
| School Level | # Students | % Students |
| Nursery / Preschool | 175 | 4.6% |
| Kindergarten | 92 | 2.4% |
| Elementary School | 895 | 23.5% |
| Middle School | 1,126 | 29.6% |
| High School | 852 | 22.4% |
| College / Undergraduate | 636 | 16.7% |
| Graduate / Professional | 32 | 0.8% |
| Total | 3,808 | 100.0% |
School Enrollment by Age by Funding Source in Robertson County
Out of a total of 3,808 students who are enrolled in schools in Robertson County, 621 (16.3%) attend a private institution, while the remaining 3,187 (83.7%) are enrolled in public schools. The age group of 35 years and over has the highest likelihood of being enrolled in private schools, with 31 (31.3% in the age bracket) enrolled. Conversely, the age group of 18 to 19 year olds has the lowest likelihood of being enrolled in a private school, with 285 (97.3% in the age bracket) attending a public institution.
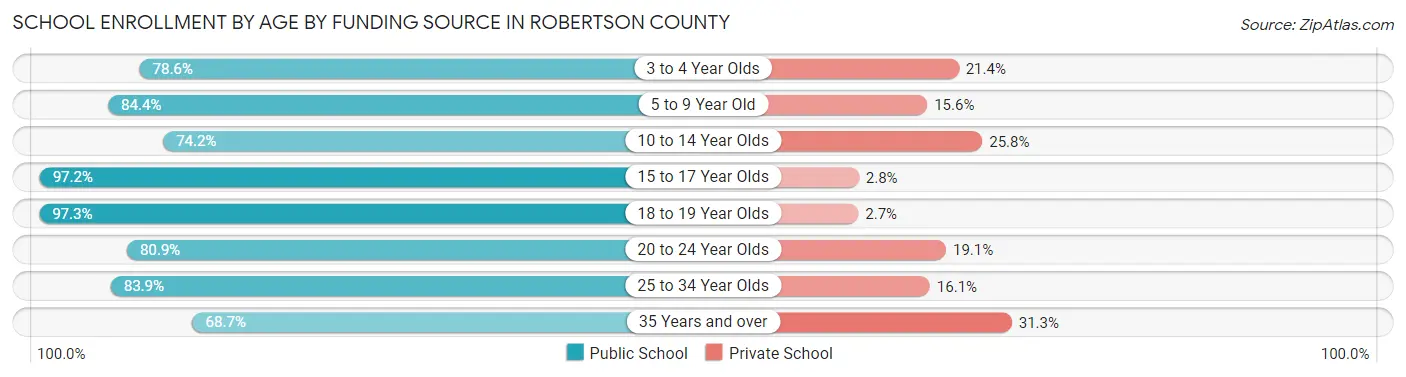
| Age Bracket | Public School | Private School |
| 3 to 4 Year Olds | 77 (78.6%) | 21 (21.4%) |
| 5 to 9 Year Old | 819 (84.4%) | 151 (15.6%) |
| 10 to 14 Year Olds | 928 (74.2%) | 323 (25.8%) |
| 15 to 17 Year Olds | 690 (97.2%) | 20 (2.8%) |
| 18 to 19 Year Olds | 285 (97.3%) | 8 (2.7%) |
| 20 to 24 Year Olds | 157 (80.9%) | 37 (19.1%) |
| 25 to 34 Year Olds | 162 (83.9%) | 31 (16.1%) |
| 35 Years and over | 68 (68.7%) | 31 (31.3%) |
| Total | 3,187 (83.7%) | 621 (16.3%) |
Educational Attainment by Field of Study in Robertson County
Bio, nature & agricultural (362 | 16.3%), business (362 | 16.3%), education (294 | 13.2%), arts & humanities (256 | 11.5%), and science & technology (248 | 11.2%) are the most common fields of study among 2,222 individuals in Robertson County who have obtained a bachelor's degree or higher.
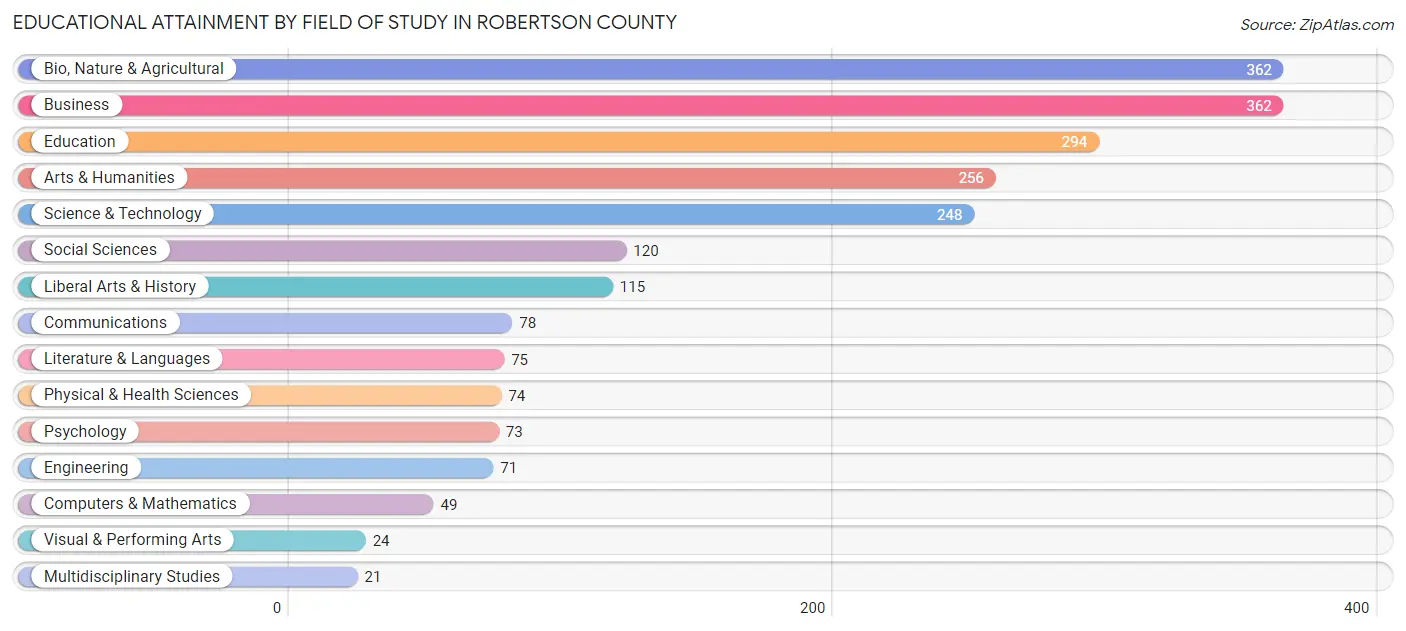
| Field of Study | # Graduates | % Graduates |
| Computers & Mathematics | 49 | 2.2% |
| Bio, Nature & Agricultural | 362 | 16.3% |
| Physical & Health Sciences | 74 | 3.3% |
| Psychology | 73 | 3.3% |
| Social Sciences | 120 | 5.4% |
| Engineering | 71 | 3.2% |
| Multidisciplinary Studies | 21 | 0.9% |
| Science & Technology | 248 | 11.2% |
| Business | 362 | 16.3% |
| Education | 294 | 13.2% |
| Literature & Languages | 75 | 3.4% |
| Liberal Arts & History | 115 | 5.2% |
| Visual & Performing Arts | 24 | 1.1% |
| Communications | 78 | 3.5% |
| Arts & Humanities | 256 | 11.5% |
| Total | 2,222 | 100.0% |
Transportation & Commute in Robertson County
Vehicle Availability by Sex in Robertson County
The most prevalent vehicle ownership categories in Robertson County are males with 2 vehicles (1,228, accounting for 38.0%) and females with 2 vehicles (1,426, making up 36.3%).
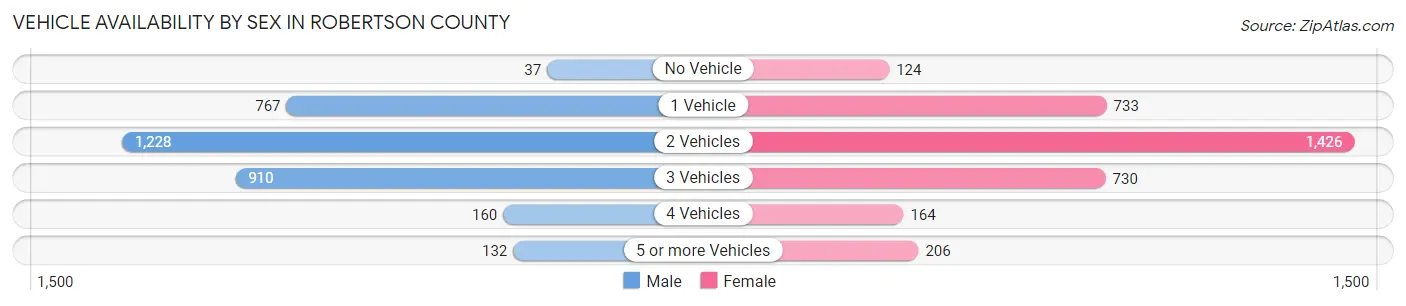
| Vehicles Available | Male | Female |
| No Vehicle | 37 (1.1%) | 124 (3.7%) |
| 1 Vehicle | 767 (23.7%) | 733 (21.7%) |
| 2 Vehicles | 1,228 (38.0%) | 1,426 (42.1%) |
| 3 Vehicles | 910 (28.1%) | 730 (21.6%) |
| 4 Vehicles | 160 (5.0%) | 164 (4.9%) |
| 5 or more Vehicles | 132 (4.1%) | 206 (6.1%) |
| Total | 3,234 (100.0%) | 3,383 (100.0%) |
Commute Time in Robertson County
The most frequently occuring commute durations in Robertson County are 30 to 34 minutes (1,041 commuters, 16.3%), 20 to 24 minutes (785 commuters, 12.3%), and 5 to 9 minutes (717 commuters, 11.3%).
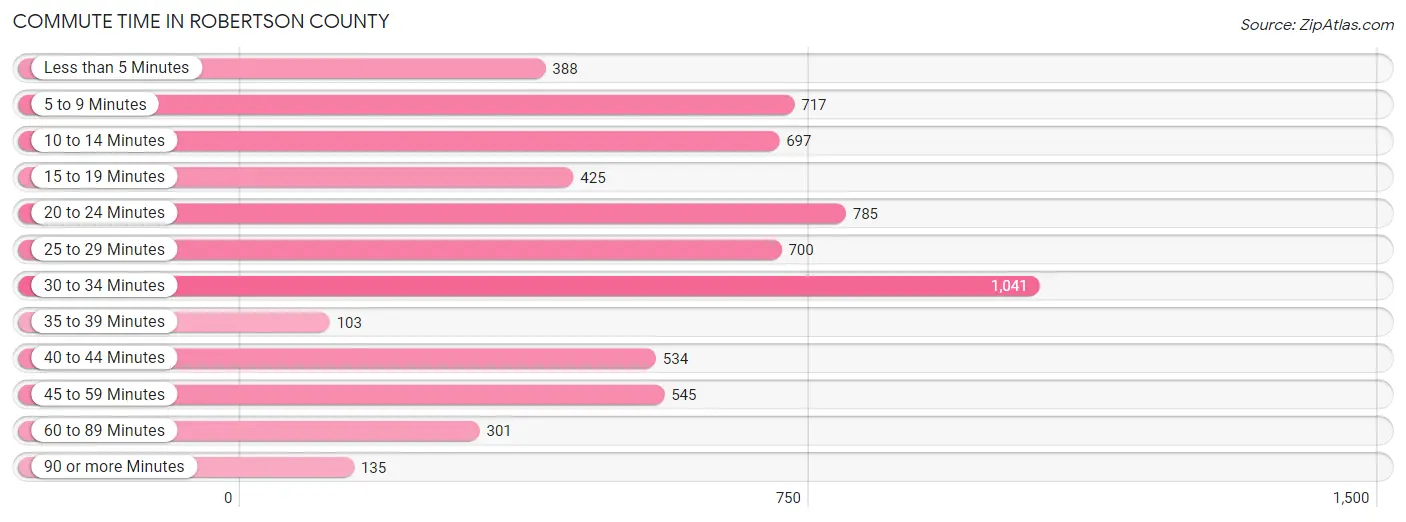
| Commute Time | # Commuters | % Commuters |
| Less than 5 Minutes | 388 | 6.1% |
| 5 to 9 Minutes | 717 | 11.3% |
| 10 to 14 Minutes | 697 | 10.9% |
| 15 to 19 Minutes | 425 | 6.7% |
| 20 to 24 Minutes | 785 | 12.3% |
| 25 to 29 Minutes | 700 | 11.0% |
| 30 to 34 Minutes | 1,041 | 16.3% |
| 35 to 39 Minutes | 103 | 1.6% |
| 40 to 44 Minutes | 534 | 8.4% |
| 45 to 59 Minutes | 545 | 8.6% |
| 60 to 89 Minutes | 301 | 4.7% |
| 90 or more Minutes | 135 | 2.1% |
Commute Time by Sex in Robertson County
The most common commute times in Robertson County are 30 to 34 minutes (637 commuters, 20.3%) for males and 10 to 14 minutes (460 commuters, 14.2%) for females.
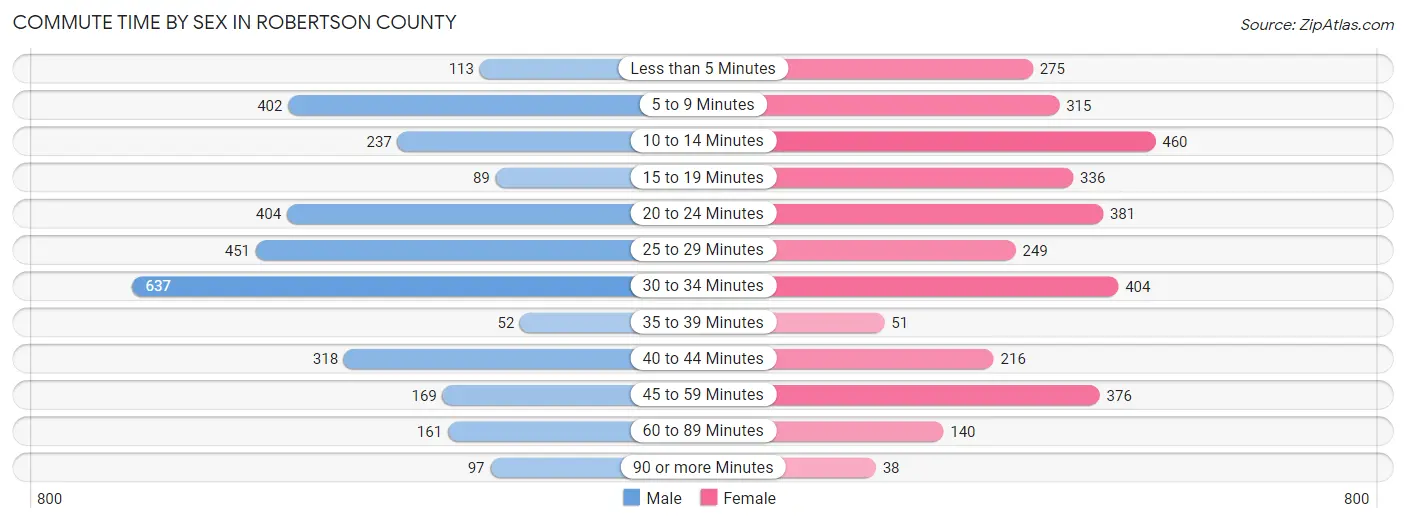
| Commute Time | Male | Female |
| Less than 5 Minutes | 113 (3.6%) | 275 (8.5%) |
| 5 to 9 Minutes | 402 (12.8%) | 315 (9.7%) |
| 10 to 14 Minutes | 237 (7.6%) | 460 (14.2%) |
| 15 to 19 Minutes | 89 (2.8%) | 336 (10.4%) |
| 20 to 24 Minutes | 404 (12.9%) | 381 (11.8%) |
| 25 to 29 Minutes | 451 (14.4%) | 249 (7.7%) |
| 30 to 34 Minutes | 637 (20.3%) | 404 (12.5%) |
| 35 to 39 Minutes | 52 (1.7%) | 51 (1.6%) |
| 40 to 44 Minutes | 318 (10.2%) | 216 (6.7%) |
| 45 to 59 Minutes | 169 (5.4%) | 376 (11.6%) |
| 60 to 89 Minutes | 161 (5.1%) | 140 (4.3%) |
| 90 or more Minutes | 97 (3.1%) | 38 (1.2%) |
Time of Departure to Work by Sex in Robertson County
The most frequent times of departure to work in Robertson County are 6:00 AM to 6:29 AM (577, 18.4%) for males and 7:00 AM to 7:29 AM (808, 24.9%) for females.
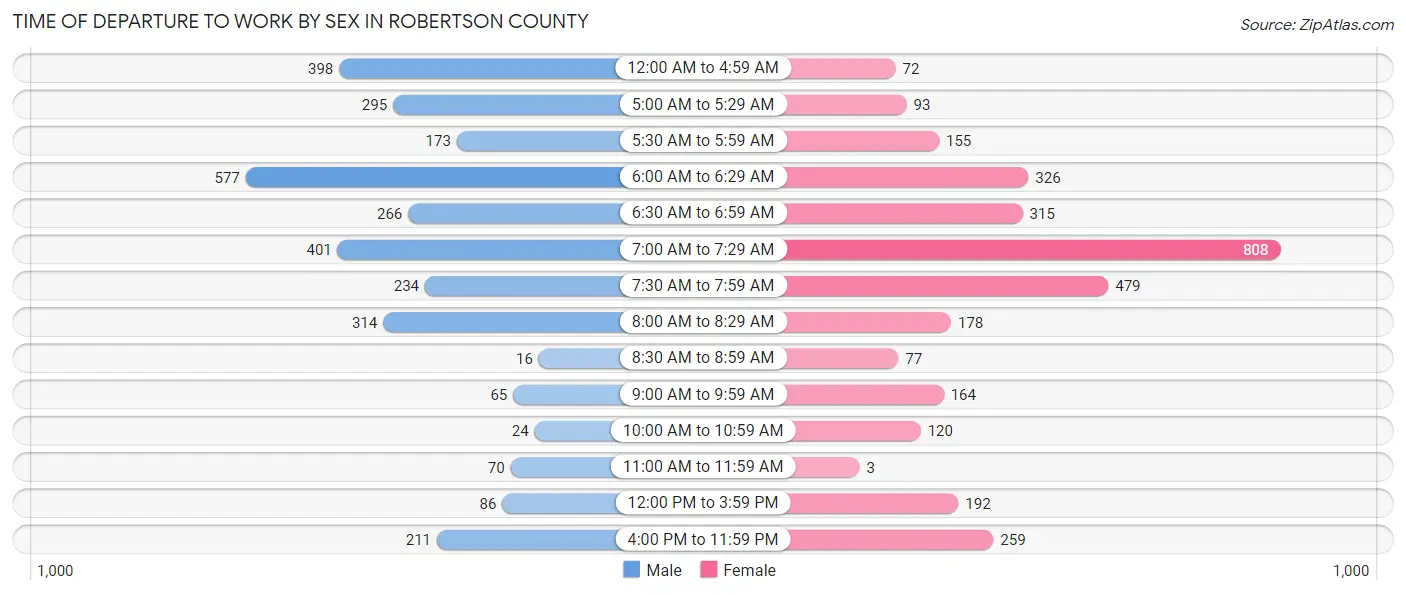
| Time of Departure | Male | Female |
| 12:00 AM to 4:59 AM | 398 (12.7%) | 72 (2.2%) |
| 5:00 AM to 5:29 AM | 295 (9.4%) | 93 (2.9%) |
| 5:30 AM to 5:59 AM | 173 (5.5%) | 155 (4.8%) |
| 6:00 AM to 6:29 AM | 577 (18.4%) | 326 (10.1%) |
| 6:30 AM to 6:59 AM | 266 (8.5%) | 315 (9.7%) |
| 7:00 AM to 7:29 AM | 401 (12.8%) | 808 (24.9%) |
| 7:30 AM to 7:59 AM | 234 (7.5%) | 479 (14.8%) |
| 8:00 AM to 8:29 AM | 314 (10.0%) | 178 (5.5%) |
| 8:30 AM to 8:59 AM | 16 (0.5%) | 77 (2.4%) |
| 9:00 AM to 9:59 AM | 65 (2.1%) | 164 (5.1%) |
| 10:00 AM to 10:59 AM | 24 (0.8%) | 120 (3.7%) |
| 11:00 AM to 11:59 AM | 70 (2.2%) | 3 (0.1%) |
| 12:00 PM to 3:59 PM | 86 (2.8%) | 192 (5.9%) |
| 4:00 PM to 11:59 PM | 211 (6.7%) | 259 (8.0%) |
| Total | 3,130 (100.0%) | 3,241 (100.0%) |
Housing Occupancy in Robertson County
Occupancy by Ownership in Robertson County
Of the total 6,309 dwellings in Robertson County, owner-occupied units account for 4,746 (75.2%), while renter-occupied units make up 1,563 (24.8%).
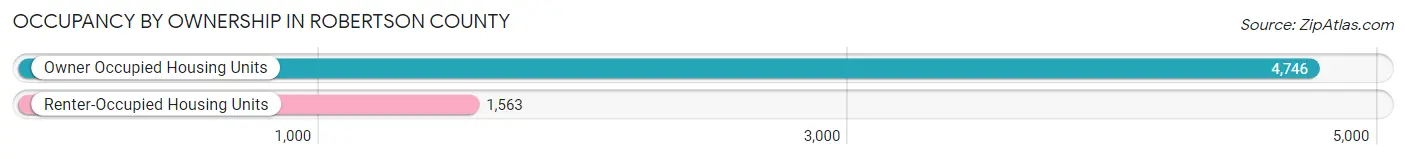
| Occupancy | # Housing Units | % Housing Units |
| Owner Occupied Housing Units | 4,746 | 75.2% |
| Renter-Occupied Housing Units | 1,563 | 24.8% |
| Total Occupied Housing Units | 6,309 | 100.0% |
Occupancy by Household Size in Robertson County
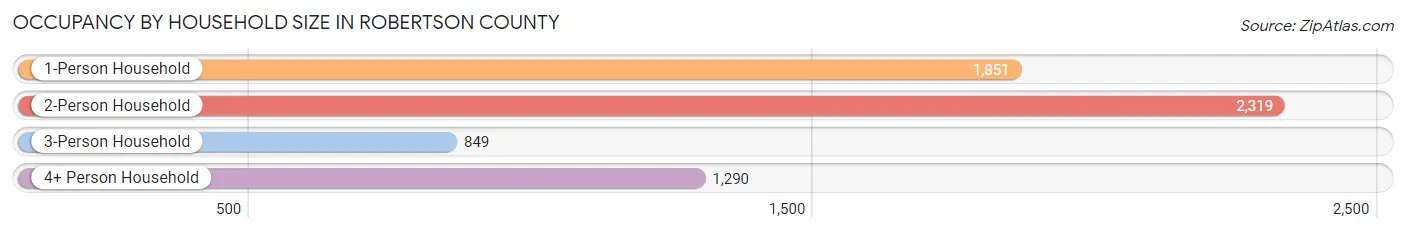
| Household Size | # Housing Units | % Housing Units |
| 1-Person Household | 1,851 | 29.3% |
| 2-Person Household | 2,319 | 36.8% |
| 3-Person Household | 849 | 13.5% |
| 4+ Person Household | 1,290 | 20.4% |
| Total Housing Units | 6,309 | 100.0% |
Occupancy by Ownership by Household Size in Robertson County
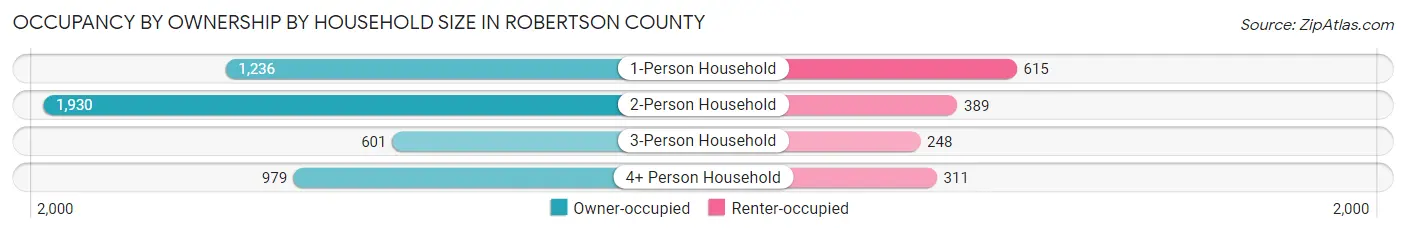
| Household Size | Owner-occupied | Renter-occupied |
| 1-Person Household | 1,236 (66.8%) | 615 (33.2%) |
| 2-Person Household | 1,930 (83.2%) | 389 (16.8%) |
| 3-Person Household | 601 (70.8%) | 248 (29.2%) |
| 4+ Person Household | 979 (75.9%) | 311 (24.1%) |
| Total Housing Units | 4,746 (75.2%) | 1,563 (24.8%) |
Occupancy by Educational Attainment in Robertson County
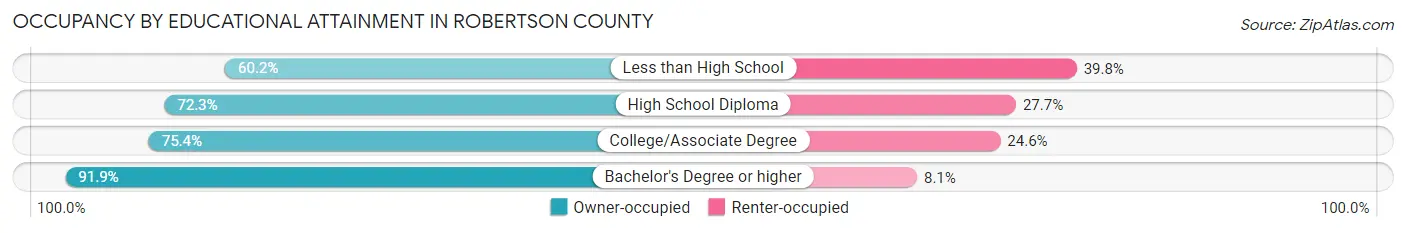
| Household Size | Owner-occupied | Renter-occupied |
| Less than High School | 609 (60.2%) | 402 (39.8%) |
| High School Diploma | 1,507 (72.3%) | 578 (27.7%) |
| College/Associate Degree | 1,472 (75.4%) | 481 (24.6%) |
| Bachelor's Degree or higher | 1,158 (91.9%) | 102 (8.1%) |
Occupancy by Age of Householder in Robertson County
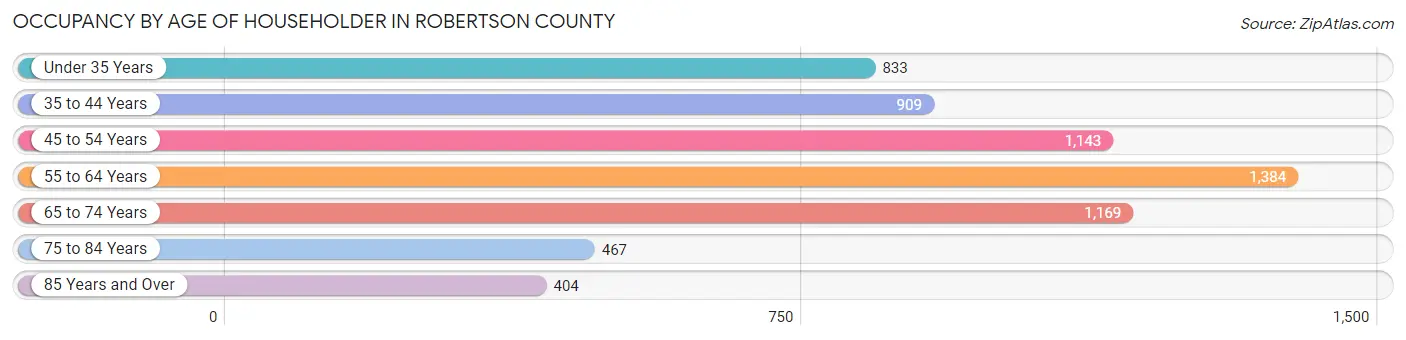
| Age Bracket | # Households | % Households |
| Under 35 Years | 833 | 13.2% |
| 35 to 44 Years | 909 | 14.4% |
| 45 to 54 Years | 1,143 | 18.1% |
| 55 to 64 Years | 1,384 | 21.9% |
| 65 to 74 Years | 1,169 | 18.5% |
| 75 to 84 Years | 467 | 7.4% |
| 85 Years and Over | 404 | 6.4% |
| Total | 6,309 | 100.0% |
Housing Finances in Robertson County
Median Income by Occupancy in Robertson County
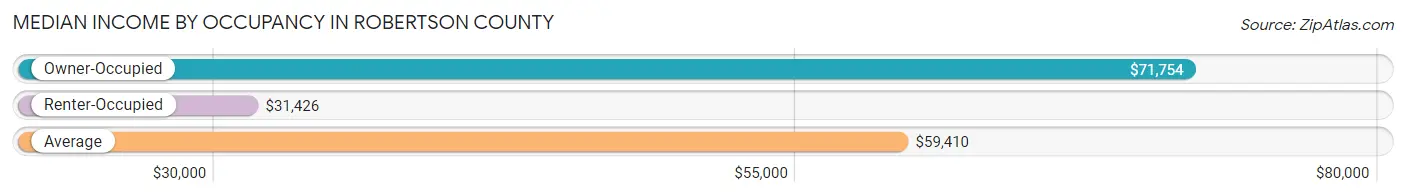
| Occupancy Type | # Households | Median Income |
| Owner-Occupied | 4,746 (75.2%) | $71,754 |
| Renter-Occupied | 1,563 (24.8%) | $31,426 |
| Average | 6,309 (100.0%) | $59,410 |
Occupancy by Householder Income Bracket in Robertson County
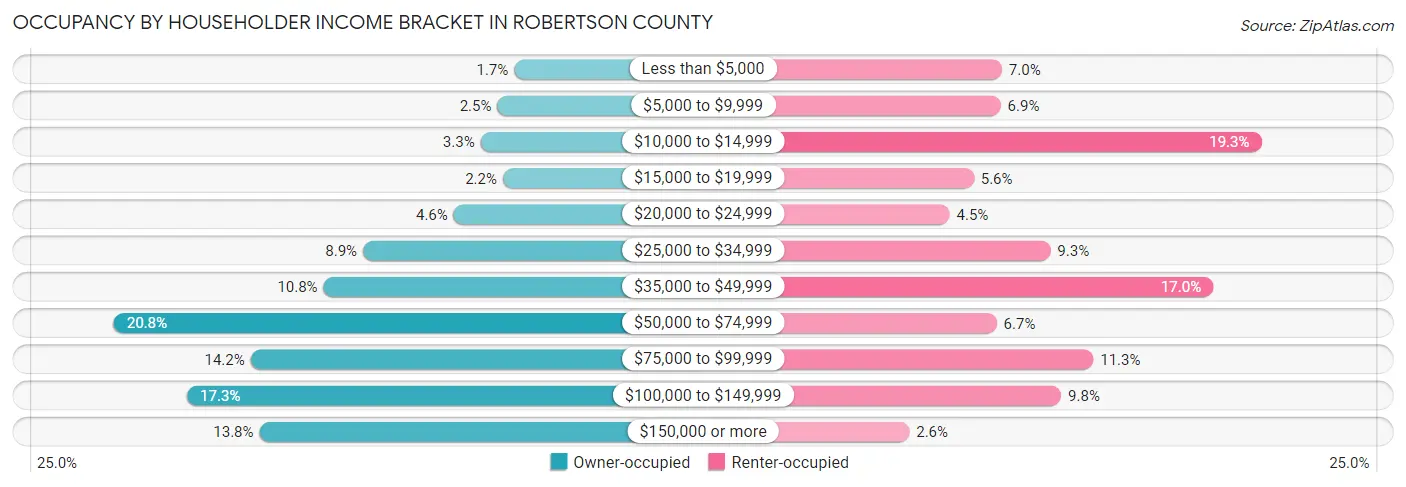
| Income Bracket | Owner-occupied | Renter-occupied |
| Less than $5,000 | 80 (1.7%) | 109 (7.0%) |
| $5,000 to $9,999 | 118 (2.5%) | 108 (6.9%) |
| $10,000 to $14,999 | 156 (3.3%) | 302 (19.3%) |
| $15,000 to $19,999 | 106 (2.2%) | 88 (5.6%) |
| $20,000 to $24,999 | 217 (4.6%) | 70 (4.5%) |
| $25,000 to $34,999 | 422 (8.9%) | 145 (9.3%) |
| $35,000 to $49,999 | 511 (10.8%) | 266 (17.0%) |
| $50,000 to $74,999 | 985 (20.7%) | 105 (6.7%) |
| $75,000 to $99,999 | 676 (14.2%) | 177 (11.3%) |
| $100,000 to $149,999 | 819 (17.3%) | 153 (9.8%) |
| $150,000 or more | 656 (13.8%) | 40 (2.6%) |
| Total | 4,746 (100.0%) | 1,563 (100.0%) |
Monthly Housing Cost Tiers in Robertson County
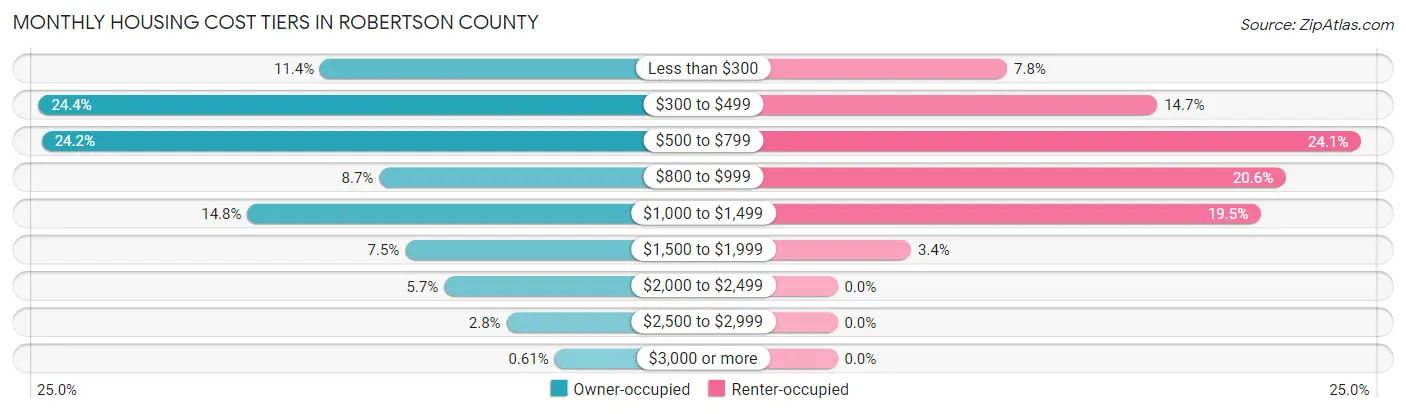
| Monthly Cost | Owner-occupied | Renter-occupied |
| Less than $300 | 541 (11.4%) | 122 (7.8%) |
| $300 to $499 | 1,156 (24.4%) | 230 (14.7%) |
| $500 to $799 | 1,149 (24.2%) | 376 (24.1%) |
| $800 to $999 | 412 (8.7%) | 322 (20.6%) |
| $1,000 to $1,499 | 700 (14.7%) | 304 (19.5%) |
| $1,500 to $1,999 | 355 (7.5%) | 53 (3.4%) |
| $2,000 to $2,499 | 270 (5.7%) | 0 (0.0%) |
| $2,500 to $2,999 | 134 (2.8%) | 0 (0.0%) |
| $3,000 or more | 29 (0.6%) | 0 (0.0%) |
| Total | 4,746 (100.0%) | 1,563 (100.0%) |
Physical Housing Characteristics in Robertson County
Housing Structures in Robertson County
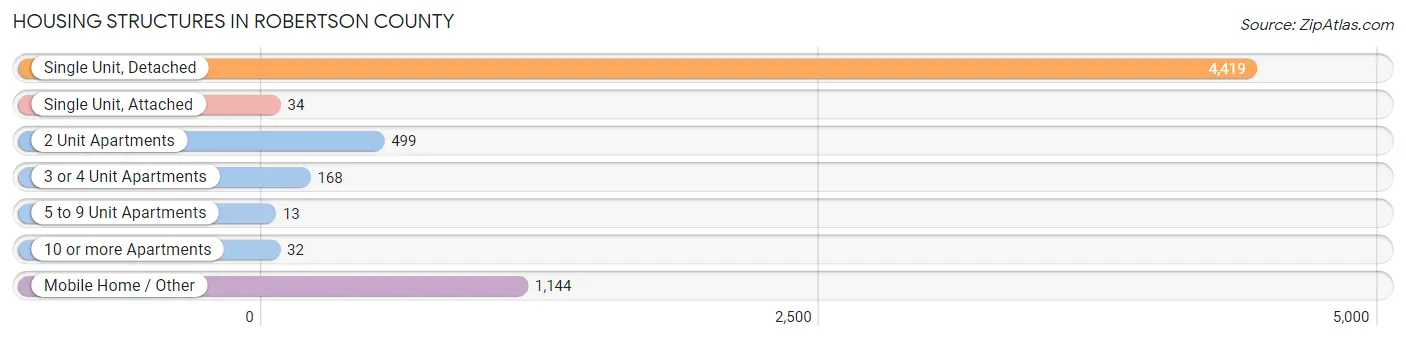
| Structure Type | # Housing Units | % Housing Units |
| Single Unit, Detached | 4,419 | 70.0% |
| Single Unit, Attached | 34 | 0.5% |
| 2 Unit Apartments | 499 | 7.9% |
| 3 or 4 Unit Apartments | 168 | 2.7% |
| 5 to 9 Unit Apartments | 13 | 0.2% |
| 10 or more Apartments | 32 | 0.5% |
| Mobile Home / Other | 1,144 | 18.1% |
| Total | 6,309 | 100.0% |
Housing Structures by Occupancy in Robertson County
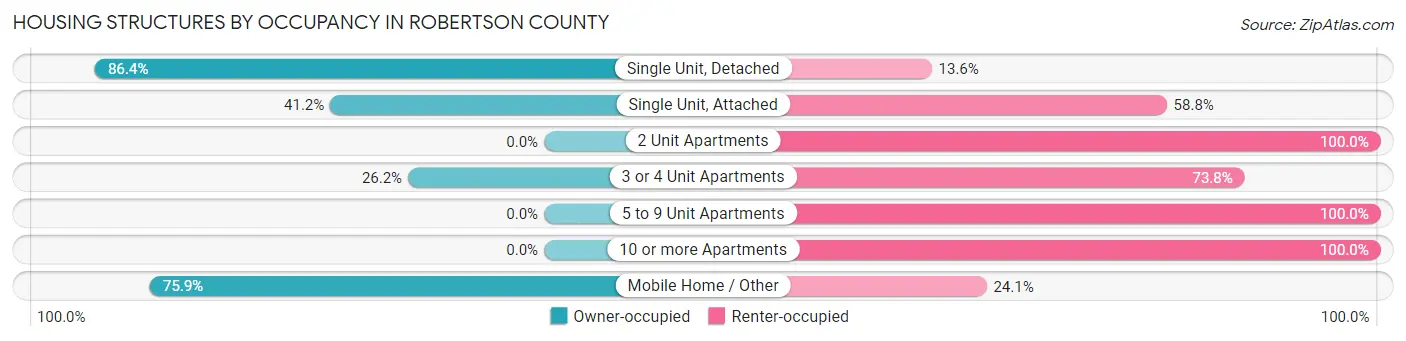
| Structure Type | Owner-occupied | Renter-occupied |
| Single Unit, Detached | 3,820 (86.4%) | 599 (13.6%) |
| Single Unit, Attached | 14 (41.2%) | 20 (58.8%) |
| 2 Unit Apartments | 0 (0.0%) | 499 (100.0%) |
| 3 or 4 Unit Apartments | 44 (26.2%) | 124 (73.8%) |
| 5 to 9 Unit Apartments | 0 (0.0%) | 13 (100.0%) |
| 10 or more Apartments | 0 (0.0%) | 32 (100.0%) |
| Mobile Home / Other | 868 (75.9%) | 276 (24.1%) |
| Total | 4,746 (75.2%) | 1,563 (24.8%) |
Housing Structures by Number of Rooms in Robertson County
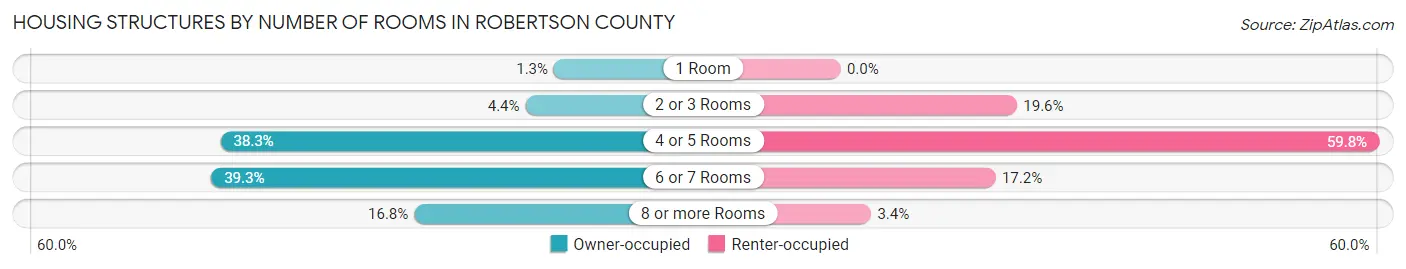
| Number of Rooms | Owner-occupied | Renter-occupied |
| 1 Room | 60 (1.3%) | 0 (0.0%) |
| 2 or 3 Rooms | 210 (4.4%) | 306 (19.6%) |
| 4 or 5 Rooms | 1,816 (38.3%) | 935 (59.8%) |
| 6 or 7 Rooms | 1,864 (39.3%) | 269 (17.2%) |
| 8 or more Rooms | 796 (16.8%) | 53 (3.4%) |
| Total | 4,746 (100.0%) | 1,563 (100.0%) |
Housing Structure by Heating Type in Robertson County
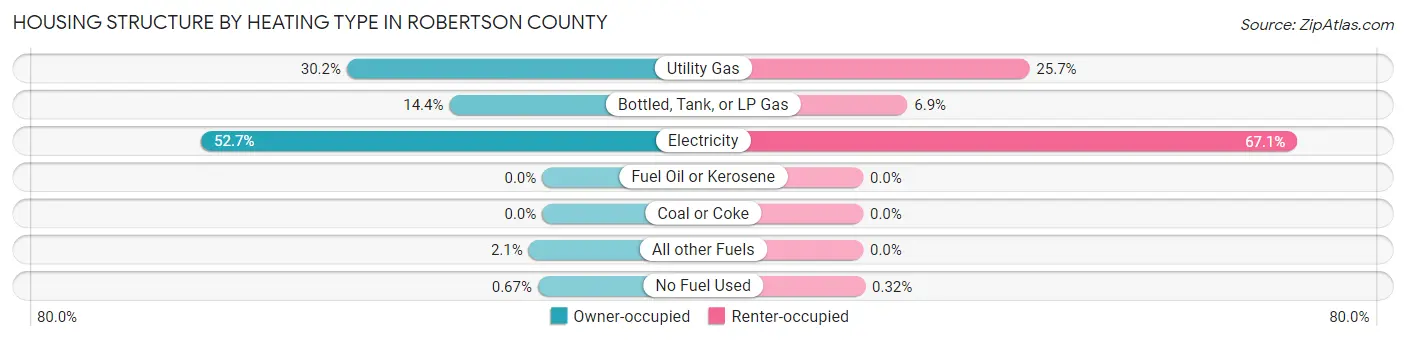
| Heating Type | Owner-occupied | Renter-occupied |
| Utility Gas | 1,433 (30.2%) | 402 (25.7%) |
| Bottled, Tank, or LP Gas | 681 (14.3%) | 107 (6.9%) |
| Electricity | 2,501 (52.7%) | 1,049 (67.1%) |
| Fuel Oil or Kerosene | 0 (0.0%) | 0 (0.0%) |
| Coal or Coke | 0 (0.0%) | 0 (0.0%) |
| All other Fuels | 99 (2.1%) | 0 (0.0%) |
| No Fuel Used | 32 (0.7%) | 5 (0.3%) |
| Total | 4,746 (100.0%) | 1,563 (100.0%) |
Household Vehicle Usage in Robertson County
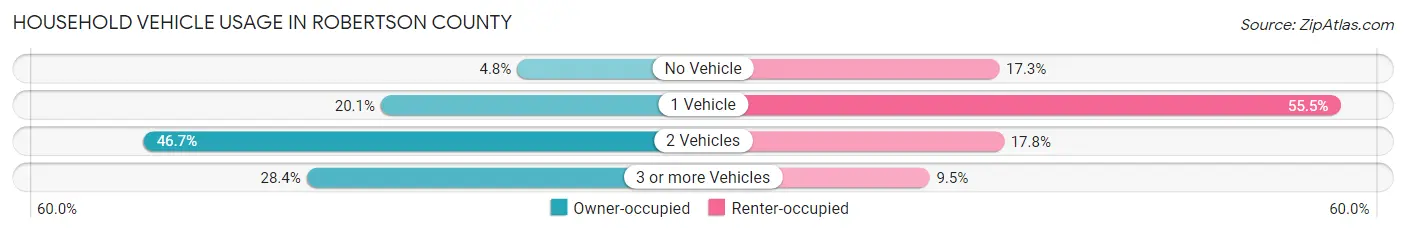
| Vehicles per Household | Owner-occupied | Renter-occupied |
| No Vehicle | 229 (4.8%) | 270 (17.3%) |
| 1 Vehicle | 954 (20.1%) | 867 (55.5%) |
| 2 Vehicles | 2,214 (46.7%) | 278 (17.8%) |
| 3 or more Vehicles | 1,349 (28.4%) | 148 (9.5%) |
| Total | 4,746 (100.0%) | 1,563 (100.0%) |
Real Estate & Mortgages in Robertson County
Real Estate and Mortgage Overview in Robertson County
| Characteristic | Without Mortgage | With Mortgage |
| Housing Units | 3,144 | 1,602 |
| Median Property Value | $136,900 | $211,000 |
| Median Household Income | $56,213 | $448 |
| Monthly Housing Costs | $479 | $29 |
| Real Estate Taxes | $1,210 | $75 |
Property Value by Mortgage Status in Robertson County
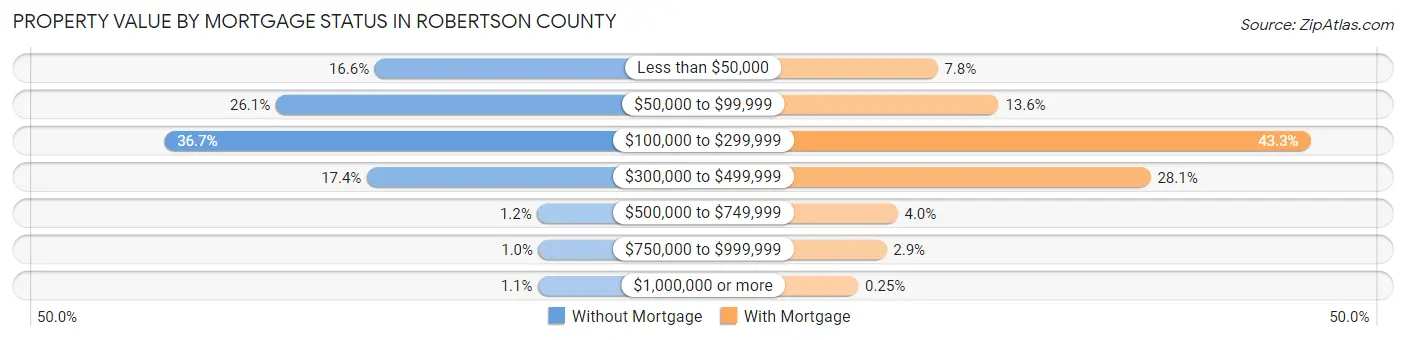
| Property Value | Without Mortgage | With Mortgage |
| Less than $50,000 | 523 (16.6%) | 125 (7.8%) |
| $50,000 to $99,999 | 819 (26.1%) | 218 (13.6%) |
| $100,000 to $299,999 | 1,154 (36.7%) | 694 (43.3%) |
| $300,000 to $499,999 | 546 (17.4%) | 450 (28.1%) |
| $500,000 to $749,999 | 36 (1.1%) | 64 (4.0%) |
| $750,000 to $999,999 | 32 (1.0%) | 47 (2.9%) |
| $1,000,000 or more | 34 (1.1%) | 4 (0.3%) |
| Total | 3,144 (100.0%) | 1,602 (100.0%) |
Household Income by Mortgage Status in Robertson County
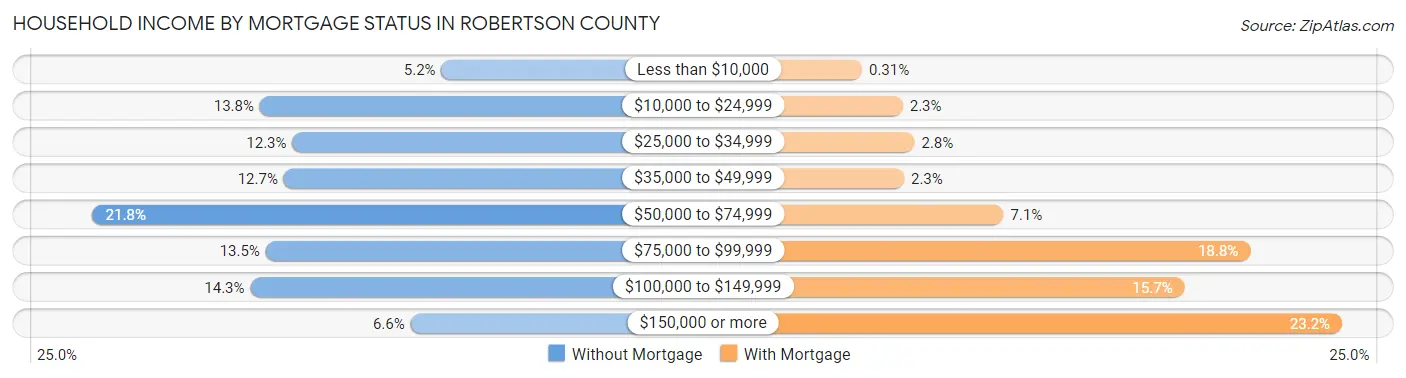
| Household Income | Without Mortgage | With Mortgage |
| Less than $10,000 | 162 (5.1%) | 5 (0.3%) |
| $10,000 to $24,999 | 434 (13.8%) | 36 (2.2%) |
| $25,000 to $34,999 | 385 (12.2%) | 45 (2.8%) |
| $35,000 to $49,999 | 398 (12.7%) | 37 (2.3%) |
| $50,000 to $74,999 | 684 (21.8%) | 113 (7.0%) |
| $75,000 to $99,999 | 425 (13.5%) | 301 (18.8%) |
| $100,000 to $149,999 | 448 (14.2%) | 251 (15.7%) |
| $150,000 or more | 208 (6.6%) | 371 (23.2%) |
| Total | 3,144 (100.0%) | 1,602 (100.0%) |
Property Value to Household Income Ratio in Robertson County
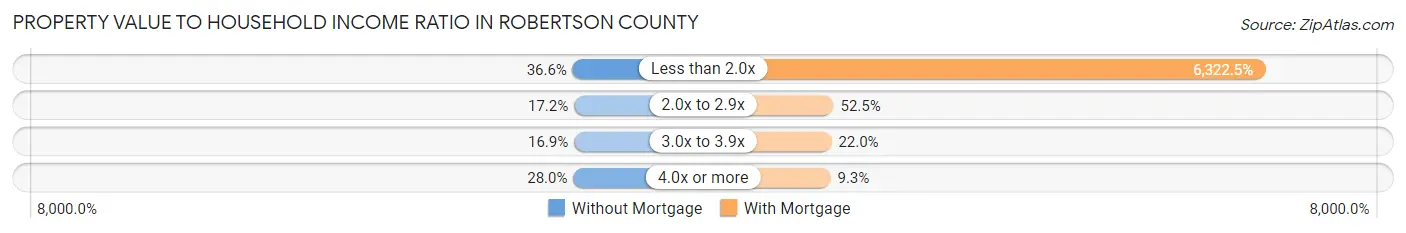
| Value-to-Income Ratio | Without Mortgage | With Mortgage |
| Less than 2.0x | 1,152 (36.6%) | 101,286 (6,322.5%) |
| 2.0x to 2.9x | 541 (17.2%) | 841 (52.5%) |
| 3.0x to 3.9x | 530 (16.9%) | 353 (22.0%) |
| 4.0x or more | 879 (28.0%) | 149 (9.3%) |
| Total | 3,144 (100.0%) | 1,602 (100.0%) |
Real Estate Taxes by Mortgage Status in Robertson County
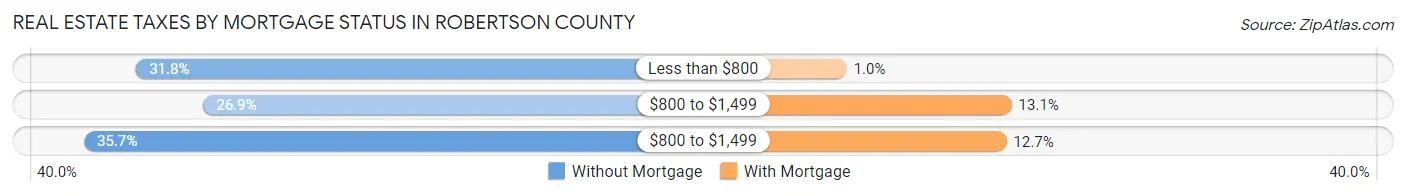
| Property Taxes | Without Mortgage | With Mortgage |
| Less than $800 | 1,001 (31.8%) | 16 (1.0%) |
| $800 to $1,499 | 847 (26.9%) | 209 (13.1%) |
| $800 to $1,499 | 1,121 (35.7%) | 203 (12.7%) |
| Total | 3,144 (100.0%) | 1,602 (100.0%) |
Health & Disability in Robertson County
Health Insurance Coverage by Age in Robertson County
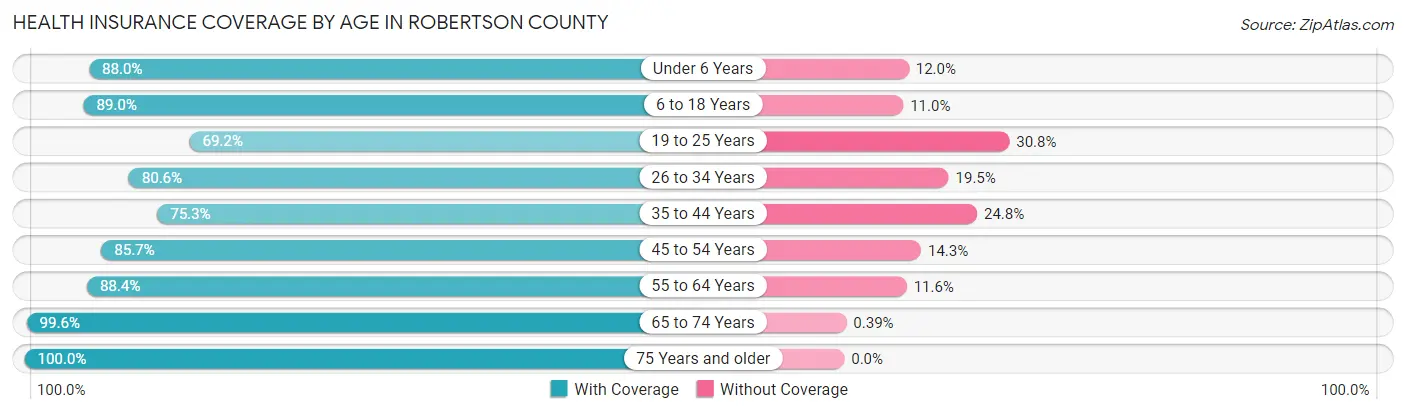
| Age Bracket | With Coverage | Without Coverage |
| Under 6 Years | 1,032 (88.0%) | 141 (12.0%) |
| 6 to 18 Years | 2,746 (89.0%) | 339 (11.0%) |
| 19 to 25 Years | 846 (69.2%) | 376 (30.8%) |
| 26 to 34 Years | 1,408 (80.5%) | 340 (19.5%) |
| 35 to 44 Years | 1,532 (75.2%) | 504 (24.7%) |
| 45 to 54 Years | 1,634 (85.7%) | 273 (14.3%) |
| 55 to 64 Years | 1,988 (88.4%) | 262 (11.6%) |
| 65 to 74 Years | 2,058 (99.6%) | 8 (0.4%) |
| 75 Years and older | 1,237 (100.0%) | 0 (0.0%) |
| Total | 14,481 (86.6%) | 2,243 (13.4%) |
Health Insurance Coverage by Citizenship Status in Robertson County
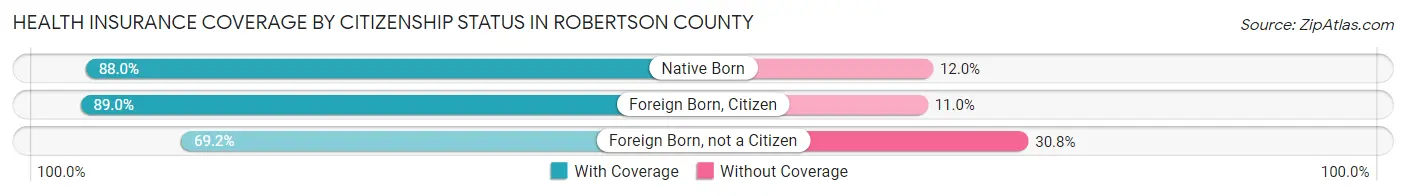
| Citizenship Status | With Coverage | Without Coverage |
| Native Born | 1,032 (88.0%) | 141 (12.0%) |
| Foreign Born, Citizen | 2,746 (89.0%) | 339 (11.0%) |
| Foreign Born, not a Citizen | 846 (69.2%) | 376 (30.8%) |
Health Insurance Coverage by Household Income in Robertson County
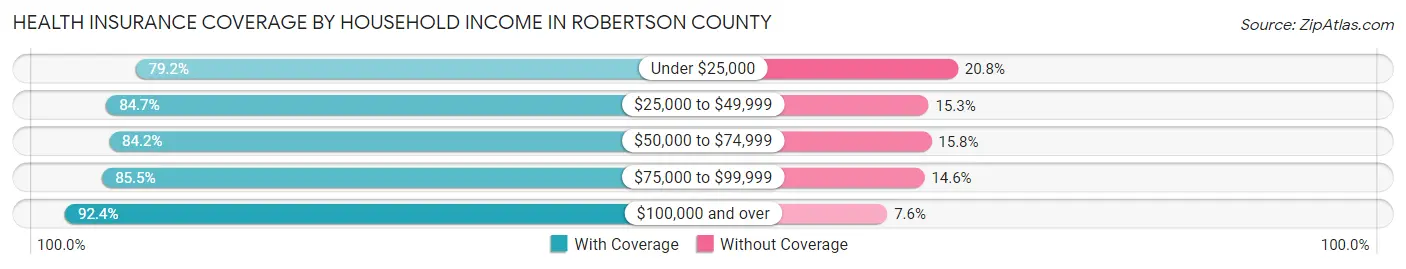
| Household Income | With Coverage | Without Coverage |
| Under $25,000 | 1,825 (79.2%) | 479 (20.8%) |
| $25,000 to $49,999 | 2,548 (84.7%) | 461 (15.3%) |
| $50,000 to $74,999 | 2,412 (84.2%) | 454 (15.8%) |
| $75,000 to $99,999 | 2,473 (85.5%) | 421 (14.5%) |
| $100,000 and over | 5,215 (92.4%) | 428 (7.6%) |
Public vs Private Health Insurance Coverage by Age in Robertson County
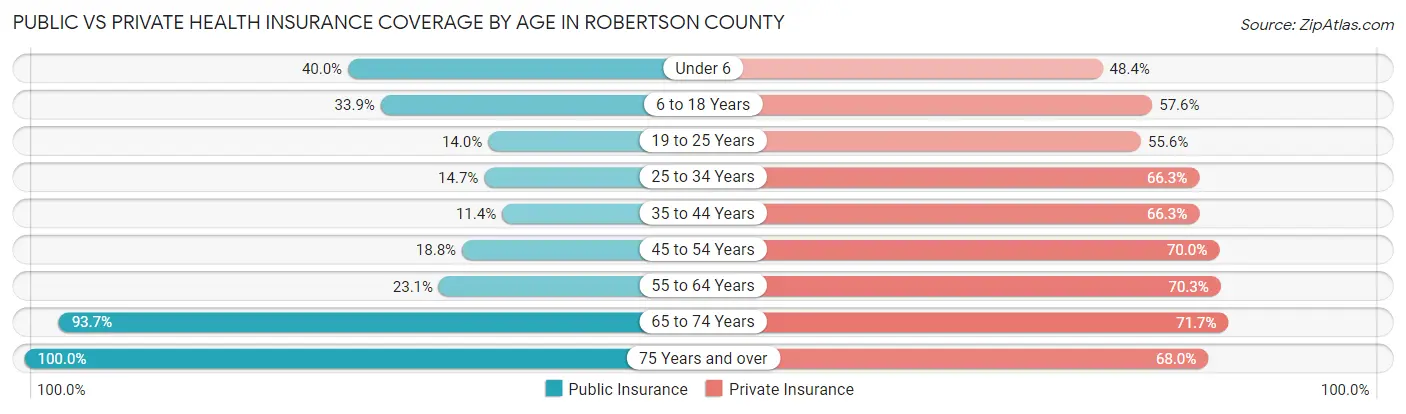
| Age Bracket | Public Insurance | Private Insurance |
| Under 6 | 469 (40.0%) | 568 (48.4%) |
| 6 to 18 Years | 1,046 (33.9%) | 1,778 (57.6%) |
| 19 to 25 Years | 171 (14.0%) | 679 (55.6%) |
| 25 to 34 Years | 257 (14.7%) | 1,159 (66.3%) |
| 35 to 44 Years | 232 (11.4%) | 1,350 (66.3%) |
| 45 to 54 Years | 359 (18.8%) | 1,335 (70.0%) |
| 55 to 64 Years | 520 (23.1%) | 1,582 (70.3%) |
| 65 to 74 Years | 1,935 (93.7%) | 1,482 (71.7%) |
| 75 Years and over | 1,237 (100.0%) | 841 (68.0%) |
| Total | 6,226 (37.2%) | 10,774 (64.4%) |
Disability Status by Sex by Age in Robertson County
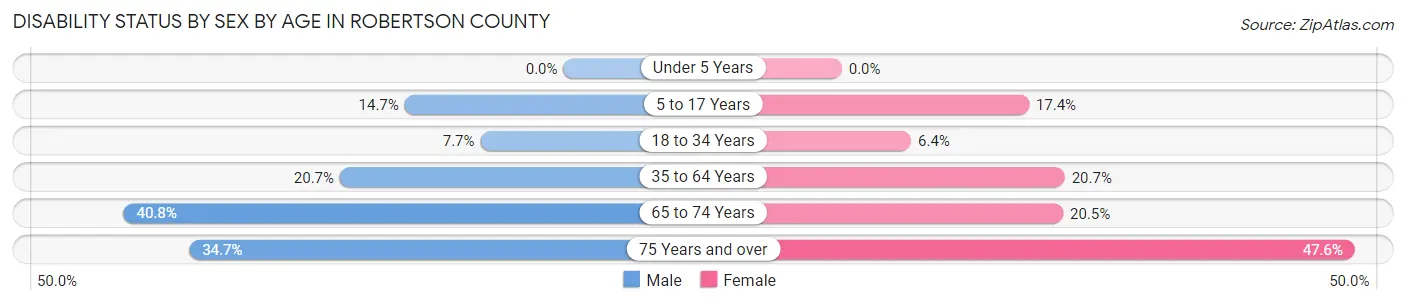
| Age Bracket | Male | Female |
| Under 5 Years | 0 (0.0%) | 0 (0.0%) |
| 5 to 17 Years | 242 (14.7%) | 229 (17.4%) |
| 18 to 34 Years | 121 (7.7%) | 105 (6.4%) |
| 35 to 64 Years | 637 (20.7%) | 646 (20.7%) |
| 65 to 74 Years | 404 (40.8%) | 221 (20.5%) |
| 75 Years and over | 183 (34.7%) | 338 (47.6%) |
Disability Class by Sex by Age in Robertson County
Disability Class: Hearing Difficulty
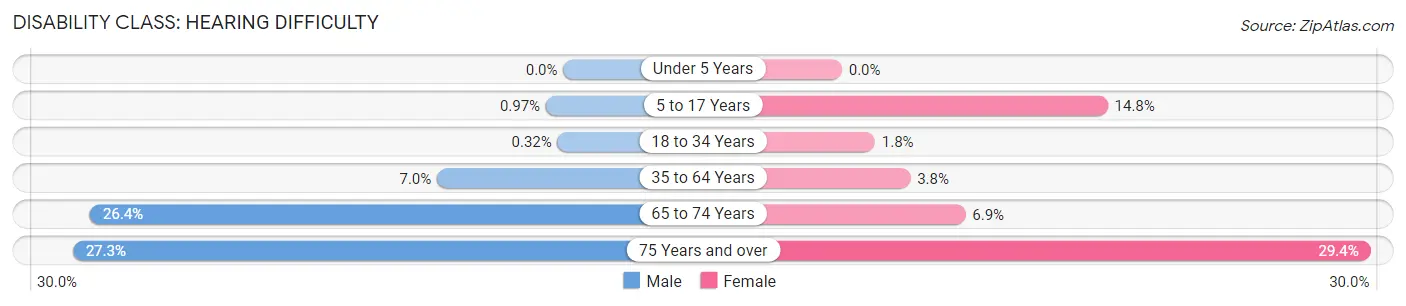
| Age Bracket | Male | Female |
| Under 5 Years | 0 (0.0%) | 0 (0.0%) |
| 5 to 17 Years | 16 (1.0%) | 195 (14.8%) |
| 18 to 34 Years | 5 (0.3%) | 30 (1.8%) |
| 35 to 64 Years | 216 (7.0%) | 119 (3.8%) |
| 65 to 74 Years | 261 (26.4%) | 74 (6.9%) |
| 75 Years and over | 144 (27.3%) | 209 (29.4%) |
Disability Class: Vision Difficulty
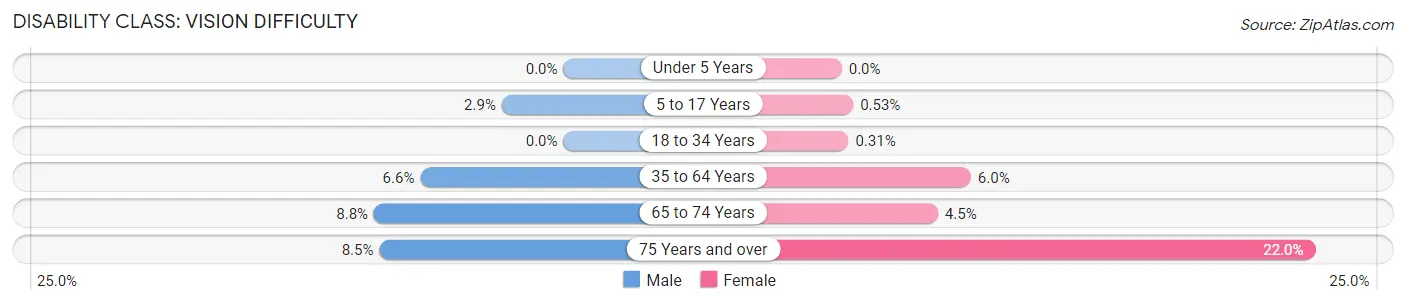
| Age Bracket | Male | Female |
| Under 5 Years | 0 (0.0%) | 0 (0.0%) |
| 5 to 17 Years | 47 (2.9%) | 7 (0.5%) |
| 18 to 34 Years | 0 (0.0%) | 5 (0.3%) |
| 35 to 64 Years | 204 (6.6%) | 187 (6.0%) |
| 65 to 74 Years | 87 (8.8%) | 48 (4.5%) |
| 75 Years and over | 45 (8.5%) | 156 (22.0%) |
Disability Class: Cognitive Difficulty
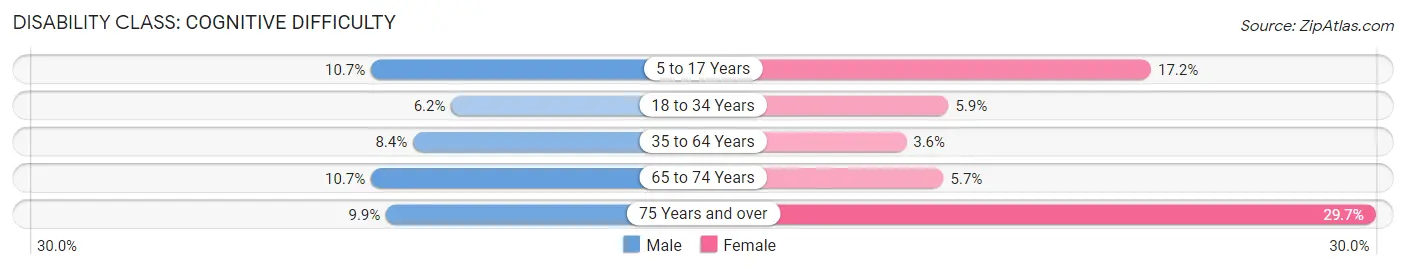
| Age Bracket | Male | Female |
| 5 to 17 Years | 176 (10.7%) | 227 (17.2%) |
| 18 to 34 Years | 98 (6.2%) | 97 (5.9%) |
| 35 to 64 Years | 257 (8.4%) | 112 (3.6%) |
| 65 to 74 Years | 106 (10.7%) | 61 (5.7%) |
| 75 Years and over | 52 (9.9%) | 211 (29.7%) |
Disability Class: Ambulatory Difficulty
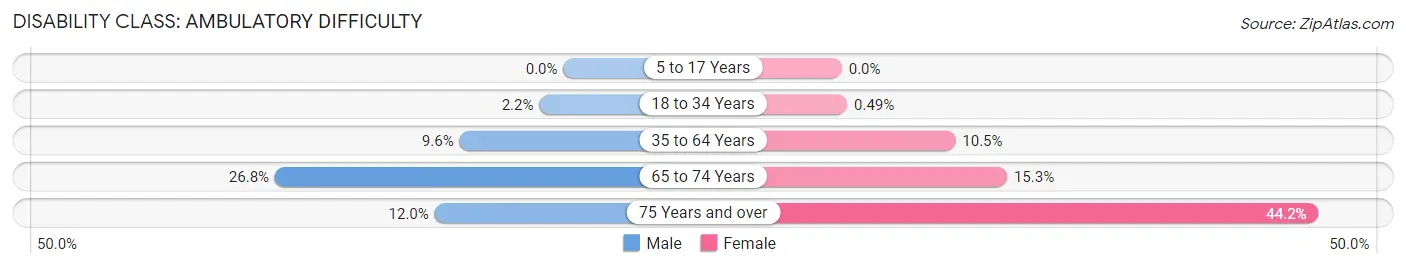
| Age Bracket | Male | Female |
| 5 to 17 Years | 0 (0.0%) | 0 (0.0%) |
| 18 to 34 Years | 35 (2.2%) | 8 (0.5%) |
| 35 to 64 Years | 296 (9.6%) | 329 (10.5%) |
| 65 to 74 Years | 265 (26.8%) | 165 (15.3%) |
| 75 Years and over | 63 (11.9%) | 314 (44.2%) |
Disability Class: Self-Care Difficulty
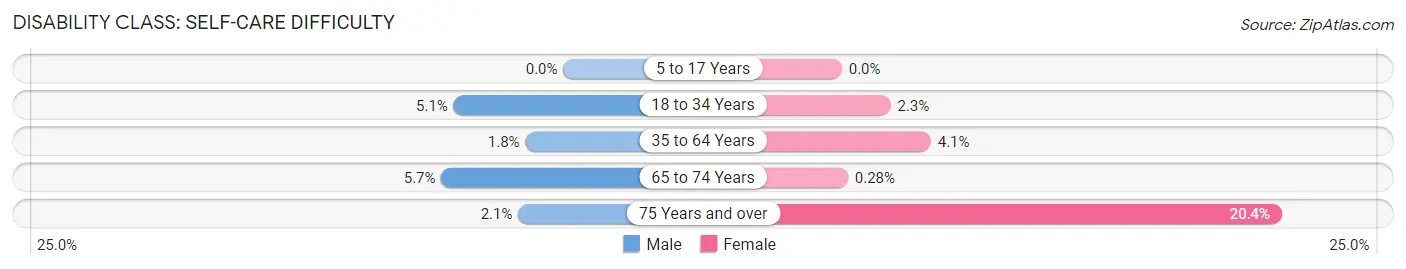
| Age Bracket | Male | Female |
| 5 to 17 Years | 0 (0.0%) | 0 (0.0%) |
| 18 to 34 Years | 80 (5.1%) | 37 (2.3%) |
| 35 to 64 Years | 54 (1.8%) | 129 (4.1%) |
| 65 to 74 Years | 56 (5.7%) | 3 (0.3%) |
| 75 Years and over | 11 (2.1%) | 145 (20.4%) |
Technology Access in Robertson County
Computing Device Access in Robertson County
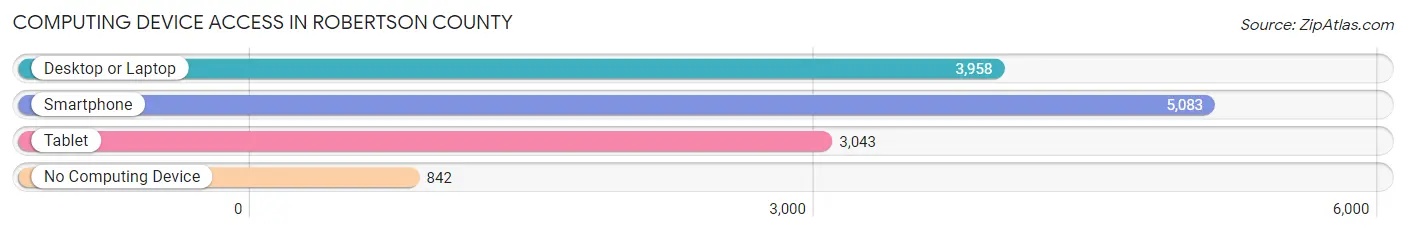
| Device Type | # Households | % Households |
| Desktop or Laptop | 3,958 | 62.7% |
| Smartphone | 5,083 | 80.6% |
| Tablet | 3,043 | 48.2% |
| No Computing Device | 842 | 13.4% |
| Total | 6,309 | 100.0% |
Internet Access in Robertson County
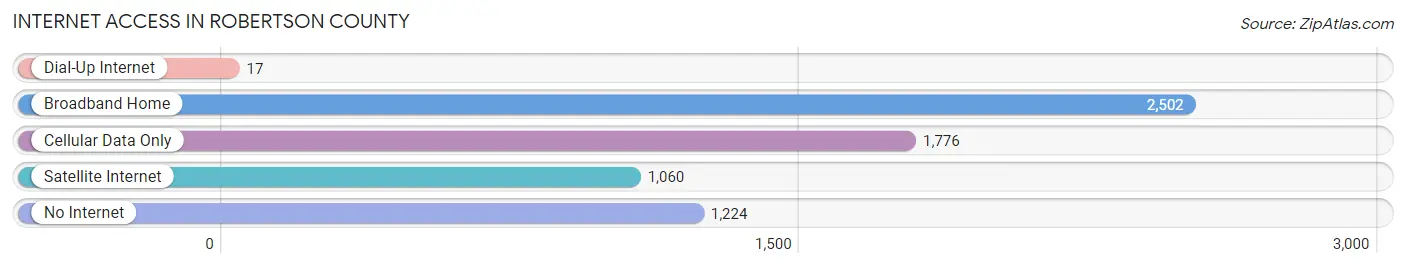
| Internet Type | # Households | % Households |
| Dial-Up Internet | 17 | 0.3% |
| Broadband Home | 2,502 | 39.7% |
| Cellular Data Only | 1,776 | 28.1% |
| Satellite Internet | 1,060 | 16.8% |
| No Internet | 1,224 | 19.4% |
| Total | 6,309 | 100.0% |
Robertson County Summary
Robertson County is located in Central Texas, approximately halfway between Austin and Waco. It is bordered by Brazos, Burleson, Leon, Madison, and Milam counties. The county seat is Franklin, and the largest city is Hearne. The county was named for Sterling C. Robertson, a signer of the Texas Declaration of Independence.
Geography
Robertson County covers an area of 890 square miles, with a population of 17,846 as of the 2010 census. The terrain is mostly flat, with some rolling hills in the western part of the county. The county is drained by the Navasota River, which flows through the center of the county. The county is home to several small lakes, including Lake Limestone, Lake Franklin, and Lake Hearne.
Climate
Robertson County has a humid subtropical climate, with hot summers and mild winters. The average annual temperature is 68°F, and the average annual precipitation is 33 inches.
Demographics
As of the 2010 census, the population of Robertson County was 17,846, with a population density of 20 people per square mile. The racial makeup of the county was 73.3% White, 19.2% Hispanic or Latino, 15.2% African American, 0.7% Native American, 0.3% Asian, and 0.2% Pacific Islander.
Economy
Agriculture is the main economic activity in Robertson County. The county is home to several large farms, and the main crops are cotton, corn, and hay. The county also has a thriving livestock industry, with cattle, sheep, and goats being the main livestock.
The county also has a growing manufacturing sector, with several companies located in Hearne and Franklin. The largest employers in the county are the Hearne Independent School District, the Robertson County Sheriff's Office, and the Hearne Municipal Airport.
History
The area that is now Robertson County was first settled by Anglo-Americans in the early 1830s. The county was officially established in 1837, and was named for Sterling C. Robertson, a signer of the Texas Declaration of Independence.
The county was largely agricultural in the 19th century, with cotton and corn being the main crops. The county also had a thriving livestock industry, with cattle, sheep, and goats being the main livestock.
In the early 20th century, the county began to diversify its economy, with the establishment of several manufacturing companies in Hearne and Franklin. The county also saw an influx of African-American residents, who were attracted by the promise of better economic opportunities.
Today, Robertson County is a largely rural county, with agriculture and manufacturing being the main economic activities. The county is also home to several small towns, including Franklin, Hearne, and Calvert.
Common Questions
What is Per Capita Income in Robertson County?
Per Capita income in Robertson County is $30,568.
What is the Median Family Income in Robertson County?
Median Family Income in Robertson County is $76,750.
What is the Median Household income in Robertson County?
Median Household Income in Robertson County is $59,410.
What is Income or Wage Gap in Robertson County?
Income or Wage Gap in Robertson County is 48.2%.
Women in Robertson County earn 51.8 cents for every dollar earned by a man.
What is Family Income Deficit in Robertson County?
Family Income Deficit in Robertson County is $9,668.
Families that are below poverty line in Robertson County earn $9,668 less on average than the poverty threshold level.
What is Inequality or Gini Index in Robertson County?
Inequality or Gini Index in Robertson County is 0.46.
What is the Total Population of Robertson County?
Total Population of Robertson County is 16,912.
What is the Total Male Population of Robertson County?
Total Male Population of Robertson County is 8,398.
What is the Total Female Population of Robertson County?
Total Female Population of Robertson County is 8,514.
What is the Ratio of Males per 100 Females in Robertson County?
There are 98.64 Males per 100 Females in Robertson County.
What is the Ratio of Females per 100 Males in Robertson County?
There are 101.38 Females per 100 Males in Robertson County.
What is the Median Population Age in Robertson County?
Median Population Age in Robertson County is 40.6 Years.
What is the Average Family Size in Robertson County
Average Family Size in Robertson County is 3.3 People.
What is the Average Household Size in Robertson County
Average Household Size in Robertson County is 2.6 People.
How Large is the Labor Force in Robertson County?
There are 7,328 People in the Labor Forcein in Robertson County.
What is the Percentage of People in the Labor Force in Robertson County?
54.7% of People are in the Labor Force in Robertson County.
What is the Unemployment Rate in Robertson County?
Unemployment Rate in Robertson County is 8.7%.