Roberts County, TX Map & Demographics
Roberts County Map
Roberts County Overview
$32,250
PER CAPITA INCOME
$67,361
AVG FAMILY INCOME
$62,667
AVG HOUSEHOLD INCOME
28.0%
WAGE / INCOME GAP [ % ]
72.0¢/ $1
WAGE / INCOME GAP [ $ ]
0.38
INEQUALITY / GINI INDEX
764
TOTAL POPULATION
422
MALE POPULATION
342
FEMALE POPULATION
123.39
MALES / 100 FEMALES
81.04
FEMALES / 100 MALES
42.5
MEDIAN AGE
3.0
AVG FAMILY SIZE
2.4
AVG HOUSEHOLD SIZE
400
LABOR FORCE [ PEOPLE ]
66.2%
PERCENT IN LABOR FORCE
0.5%
UNEMPLOYMENT RATE
Roberts County Area Codes
Income in Roberts County
Income Overview in Roberts County
Per Capita Income in Roberts County is $32,250, while median incomes of families and households are $67,361 and $62,667 respectively.
| Characteristic | Number | Measure |
| Per Capita Income | 764 | $32,250 |
| Median Family Income | 213 | $67,361 |
| Mean Family Income | 213 | $84,180 |
| Median Household Income | 320 | $62,667 |
| Mean Household Income | 320 | $77,618 |
| Income Deficit | 213 | $0 |
| Wage / Income Gap (%) | 764 | 28.03% |
| Wage / Income Gap ($) | 764 | 71.97¢ per $1 |
| Gini / Inequality Index | 764 | 0.38 |
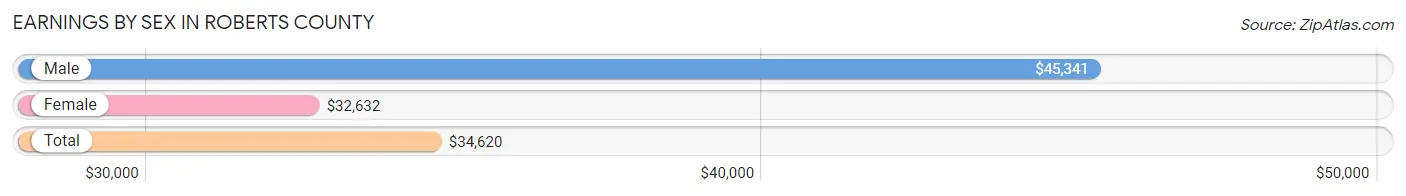
Earnings by Sex in Roberts County
Average Earnings in Roberts County are $34,620, $45,341 for men and $32,632 for women, a difference of 28.0%.
| Sex | Number | Average Earnings |
| Male | 247 (58.4%) | $45,341 |
| Female | 176 (41.6%) | $32,632 |
| Total | 423 (100.0%) | $34,620 |
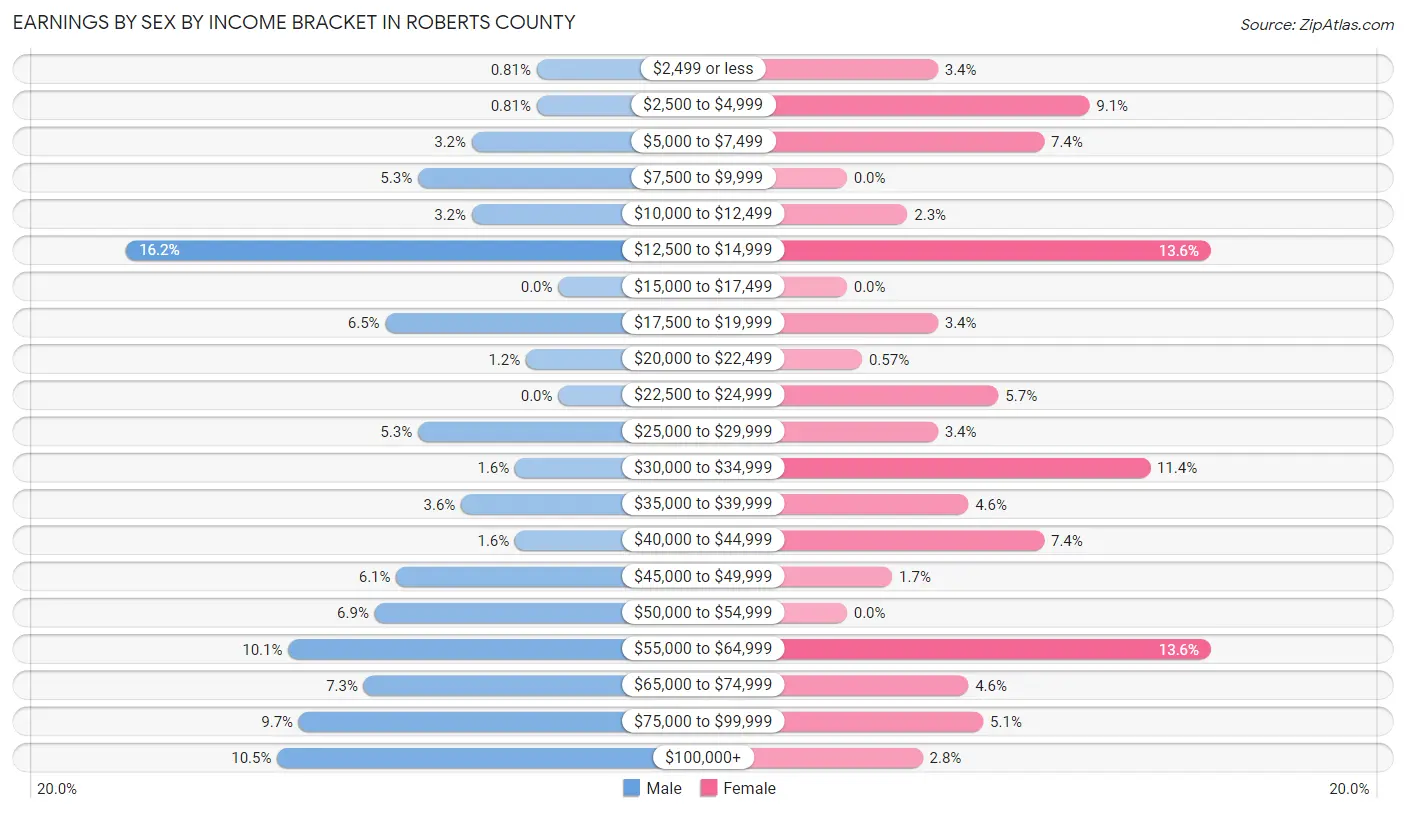
Earnings by Sex by Income Bracket in Roberts County
The most common earnings brackets in Roberts County are $12,500 to $14,999 for men (40 | 16.2%) and $12,500 to $14,999 for women (24 | 13.6%).
| Income | Male | Female |
| $2,499 or less | 2 (0.8%) | 6 (3.4%) |
| $2,500 to $4,999 | 2 (0.8%) | 16 (9.1%) |
| $5,000 to $7,499 | 8 (3.2%) | 13 (7.4%) |
| $7,500 to $9,999 | 13 (5.3%) | 0 (0.0%) |
| $10,000 to $12,499 | 8 (3.2%) | 4 (2.3%) |
| $12,500 to $14,999 | 40 (16.2%) | 24 (13.6%) |
| $15,000 to $17,499 | 0 (0.0%) | 0 (0.0%) |
| $17,500 to $19,999 | 16 (6.5%) | 6 (3.4%) |
| $20,000 to $22,499 | 3 (1.2%) | 1 (0.6%) |
| $22,500 to $24,999 | 0 (0.0%) | 10 (5.7%) |
| $25,000 to $29,999 | 13 (5.3%) | 6 (3.4%) |
| $30,000 to $34,999 | 4 (1.6%) | 20 (11.4%) |
| $35,000 to $39,999 | 9 (3.6%) | 8 (4.5%) |
| $40,000 to $44,999 | 4 (1.6%) | 13 (7.4%) |
| $45,000 to $49,999 | 15 (6.1%) | 3 (1.7%) |
| $50,000 to $54,999 | 17 (6.9%) | 0 (0.0%) |
| $55,000 to $64,999 | 25 (10.1%) | 24 (13.6%) |
| $65,000 to $74,999 | 18 (7.3%) | 8 (4.5%) |
| $75,000 to $99,999 | 24 (9.7%) | 9 (5.1%) |
| $100,000+ | 26 (10.5%) | 5 (2.8%) |
| Total | 247 (100.0%) | 176 (100.0%) |
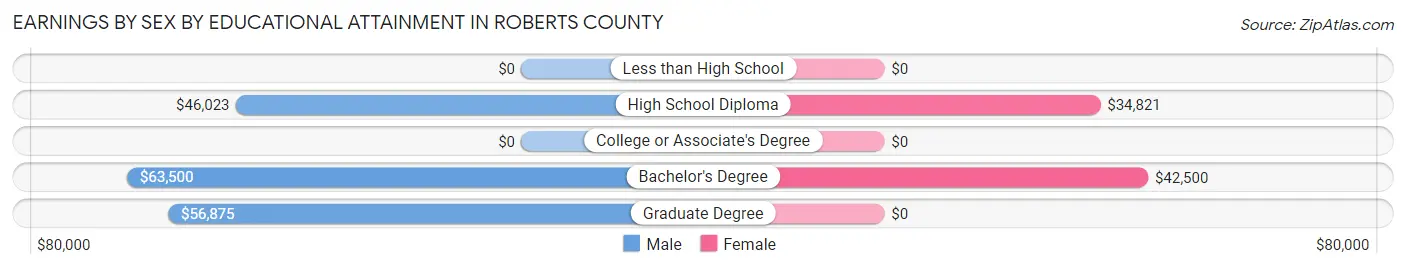
Earnings by Sex by Educational Attainment in Roberts County
Average earnings in Roberts County are $46,818 for men and $34,145 for women, a difference of 27.1%. Men with an educational attainment of bachelor's degree enjoy the highest average annual earnings of $63,500, while those with high school diploma education earn the least with $46,023. Women with an educational attainment of bachelor's degree earn the most with the average annual earnings of $42,500, while those with high school diploma education have the smallest earnings of $34,821.
| Educational Attainment | Male Income | Female Income |
| Less than High School | - | - |
| High School Diploma | $46,023 | $34,821 |
| College or Associate's Degree | - | - |
| Bachelor's Degree | $63,500 | $42,500 |
| Graduate Degree | $56,875 | $0 |
| Total | $46,818 | $34,145 |
Family Income in Roberts County
Family Income Brackets in Roberts County
According to the Roberts County family income data, there are 46 families falling into the $50,000 to $74,999 income range, which is the most common income bracket and makes up 21.6% of all families.
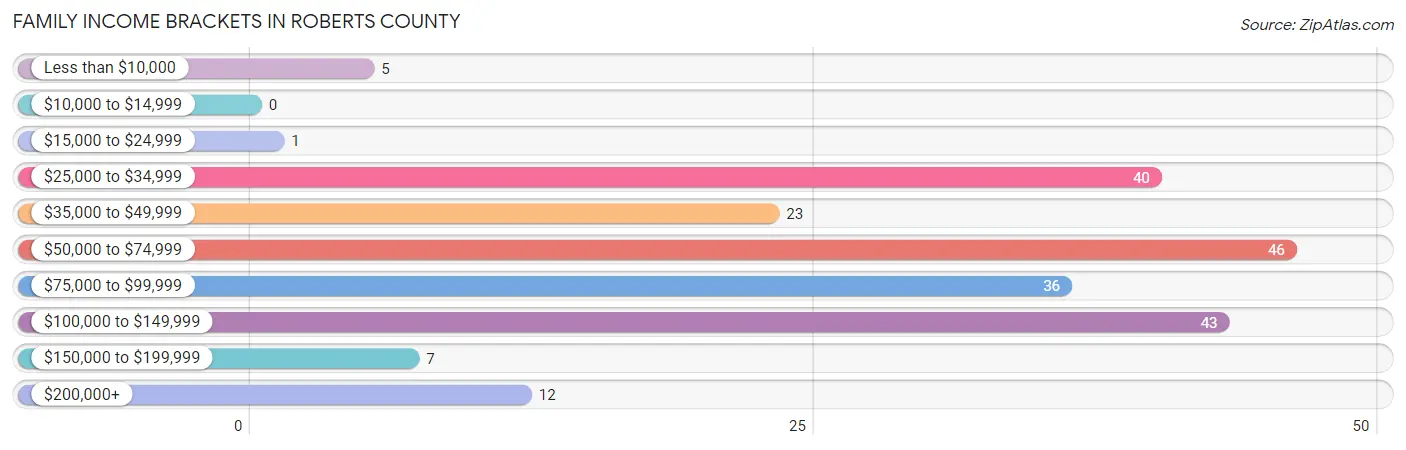
| Income Bracket | # Families | % Families |
| Less than $10,000 | 5 | 2.3% |
| $10,000 to $14,999 | 0 | 0.0% |
| $15,000 to $24,999 | 1 | 0.5% |
| $25,000 to $34,999 | 40 | 18.8% |
| $35,000 to $49,999 | 23 | 10.8% |
| $50,000 to $74,999 | 46 | 21.6% |
| $75,000 to $99,999 | 36 | 16.9% |
| $100,000 to $149,999 | 43 | 20.2% |
| $150,000 to $199,999 | 7 | 3.3% |
| $200,000+ | 12 | 5.6% |
Family Income by Famaliy Size in Roberts County
4-person families (49 | 23.0%) account for the highest median family income in Roberts County with $88,304 per family, while 2-person families (122 | 57.3%) have the highest median income of $28,750 per family member.
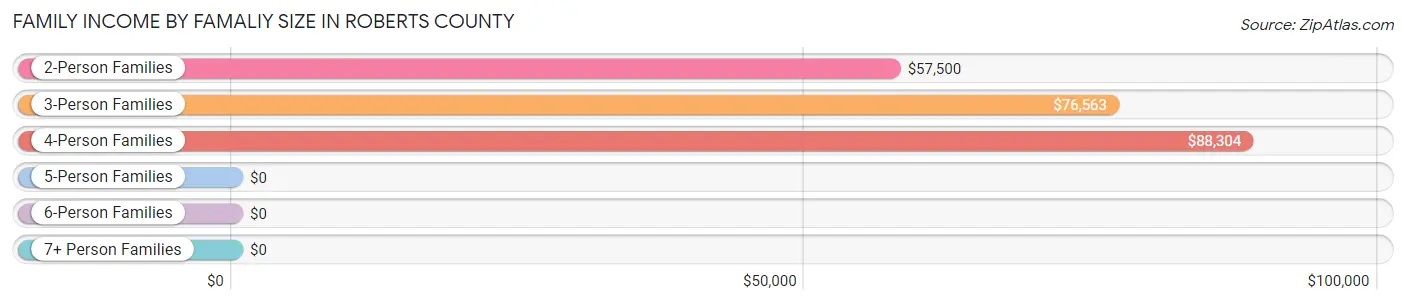
| Income Bracket | # Families | Median Income |
| 2-Person Families | 122 (57.3%) | $57,500 |
| 3-Person Families | 19 (8.9%) | $76,563 |
| 4-Person Families | 49 (23.0%) | $88,304 |
| 5-Person Families | 11 (5.2%) | $0 |
| 6-Person Families | 12 (5.6%) | $0 |
| 7+ Person Families | 0 (0.0%) | $0 |
| Total | 213 (100.0%) | $67,361 |
Family Income by Number of Earners in Roberts County
The median family income in Roberts County is $67,361, with families comprising 3+ earners (13) having the highest median family income of $98,750, while families with 1 earner (67) have the lowest median family income of $32,337, accounting for 6.1% and 31.5% of families, respectively.
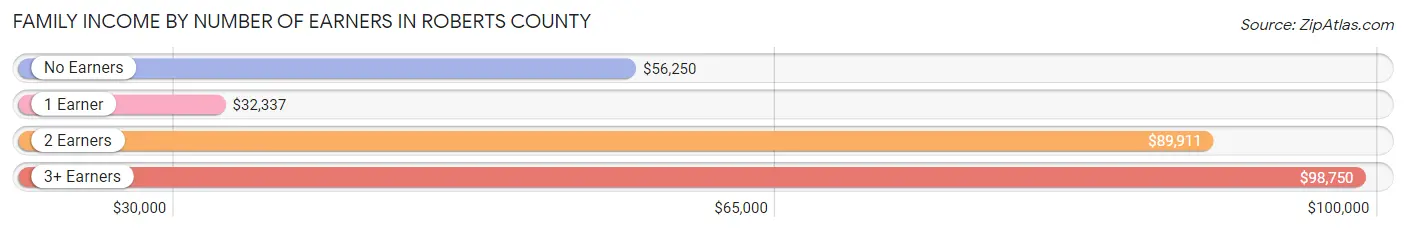
| Number of Earners | # Families | Median Income |
| No Earners | 14 (6.6%) | $56,250 |
| 1 Earner | 67 (31.5%) | $32,337 |
| 2 Earners | 119 (55.9%) | $89,911 |
| 3+ Earners | 13 (6.1%) | $98,750 |
| Total | 213 (100.0%) | $67,361 |
Household Income in Roberts County
Household Income Brackets in Roberts County
With 70 households falling in the category, the $25,000 to $34,999 income range is the most frequent in Roberts County, accounting for 21.9% of all households. In contrast, only 5 households (1.6%) fall into the less than $10,000 income bracket, making it the least populous group.
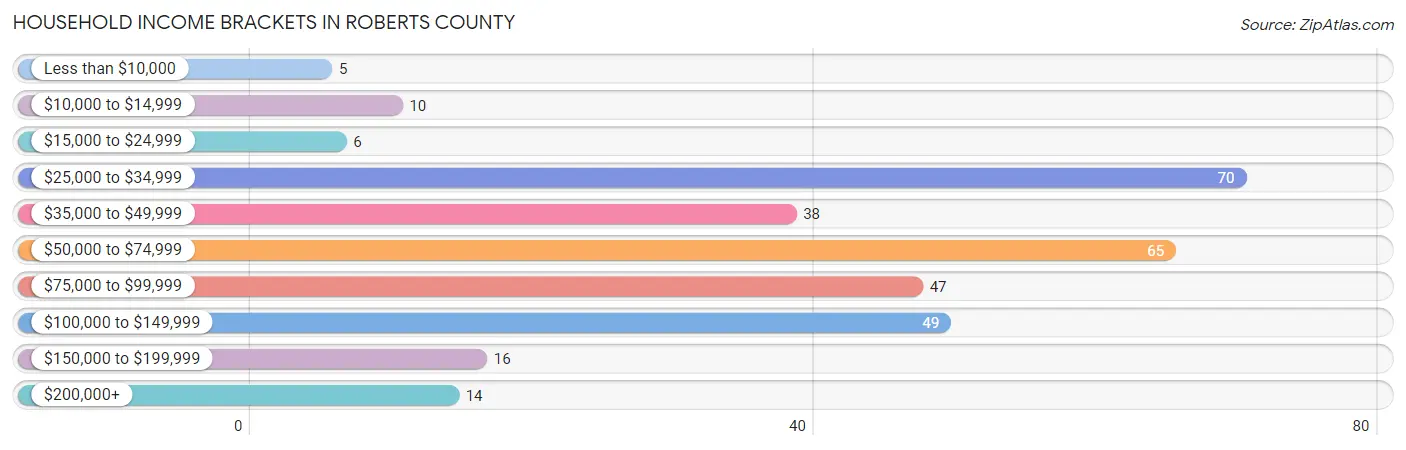
| Income Bracket | # Households | % Households |
| Less than $10,000 | 5 | 1.6% |
| $10,000 to $14,999 | 10 | 3.1% |
| $15,000 to $24,999 | 6 | 1.9% |
| $25,000 to $34,999 | 70 | 21.9% |
| $35,000 to $49,999 | 38 | 11.9% |
| $50,000 to $74,999 | 65 | 20.3% |
| $75,000 to $99,999 | 47 | 14.7% |
| $100,000 to $149,999 | 49 | 15.3% |
| $150,000 to $199,999 | 16 | 5.0% |
| $200,000+ | 14 | 4.4% |
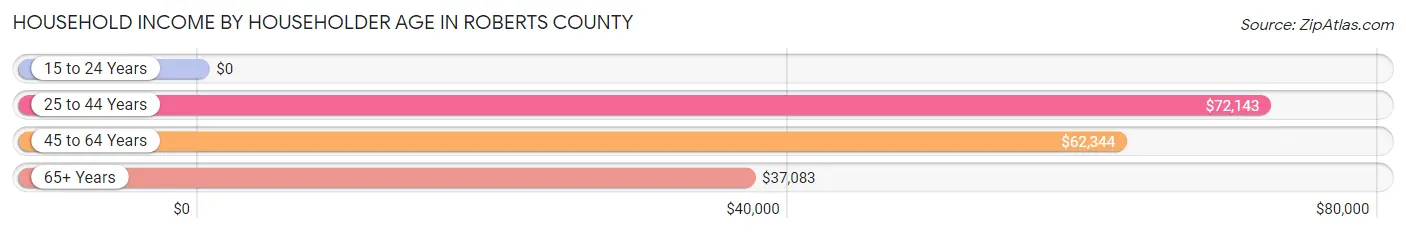
Household Income by Householder Age in Roberts County
The median household income in Roberts County is $62,667, with the highest median household income of $72,143 found in the 25 to 44 years age bracket for the primary householder. A total of 92 households (28.7%) fall into this category. Meanwhile, the 15 to 24 years age bracket for the primary householder has the lowest median household income of $0, with 7 households (2.2%) in this group.
| Income Bracket | # Households | Median Income |
| 15 to 24 Years | 7 (2.2%) | $0 |
| 25 to 44 Years | 92 (28.7%) | $72,143 |
| 45 to 64 Years | 159 (49.7%) | $62,344 |
| 65+ Years | 62 (19.4%) | $37,083 |
| Total | 320 (100.0%) | $62,667 |
Poverty in Roberts County
Income Below Poverty by Sex and Age in Roberts County
With 14.1% poverty level for males and 15.5% for females among the residents of Roberts County, 12 to 14 year old males and 16 and 17 year old females are the most vulnerable to poverty, with 16 males (33.3%) and 16 females (88.9%) in their respective age groups living below the poverty level.
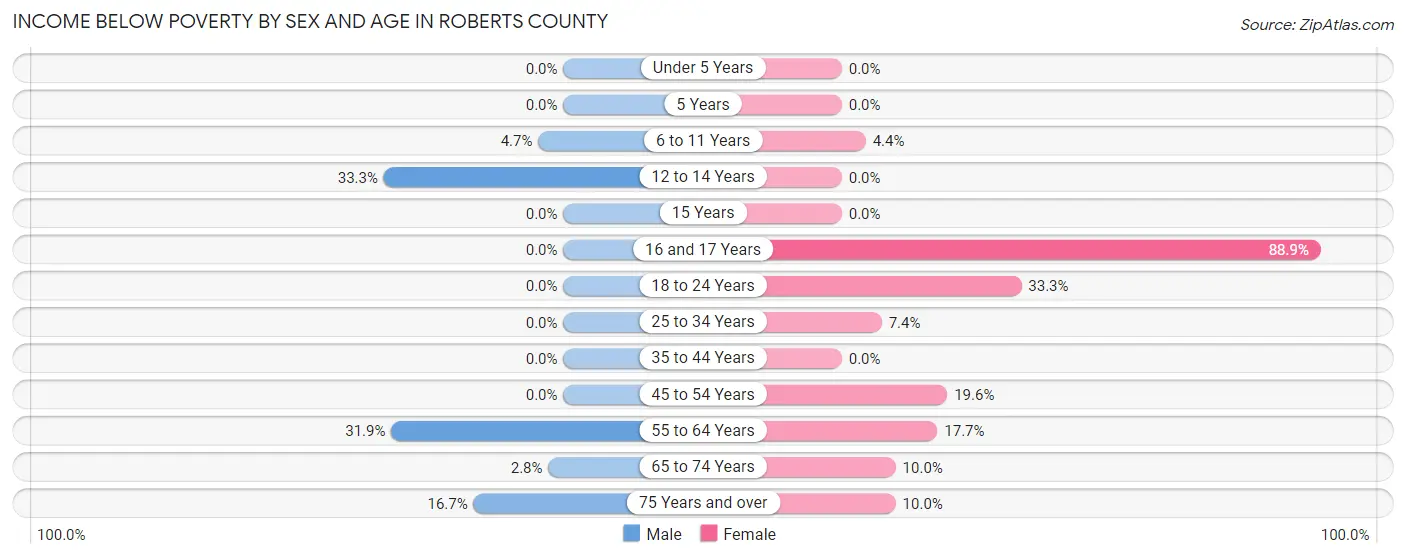
| Age Bracket | Male | Female |
| Under 5 Years | 0 (0.0%) | 0 (0.0%) |
| 5 Years | 0 (0.0%) | 0 (0.0%) |
| 6 to 11 Years | 2 (4.6%) | 2 (4.4%) |
| 12 to 14 Years | 16 (33.3%) | 0 (0.0%) |
| 15 Years | 0 (0.0%) | 0 (0.0%) |
| 16 and 17 Years | 0 (0.0%) | 16 (88.9%) |
| 18 to 24 Years | 0 (0.0%) | 7 (33.3%) |
| 25 to 34 Years | 0 (0.0%) | 2 (7.4%) |
| 35 to 44 Years | 0 (0.0%) | 0 (0.0%) |
| 45 to 54 Years | 0 (0.0%) | 9 (19.6%) |
| 55 to 64 Years | 38 (31.9%) | 11 (17.7%) |
| 65 to 74 Years | 1 (2.8%) | 4 (10.0%) |
| 75 Years and over | 2 (16.7%) | 2 (10.0%) |
| Total | 59 (14.1%) | 53 (15.5%) |
Income Above Poverty by Sex and Age in Roberts County
According to the poverty statistics in Roberts County, males aged 18 to 24 years and females aged under 5 years are the age groups that are most secure financially, with 100.0% of males and 100.0% of females in these age groups living above the poverty line.
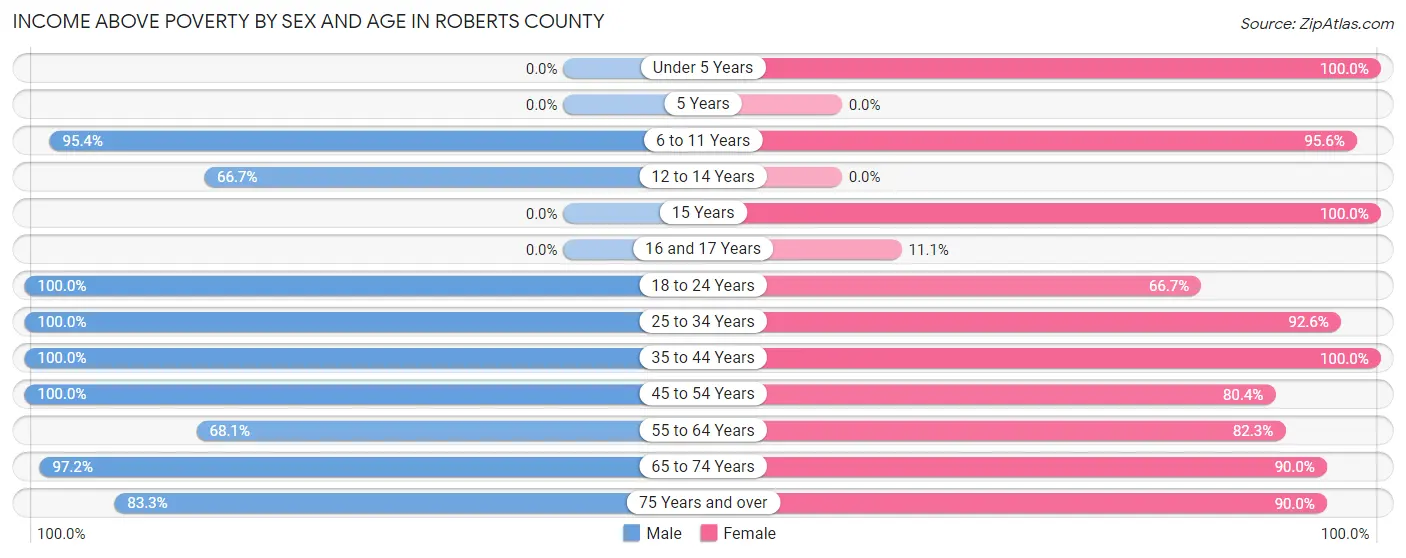
| Age Bracket | Male | Female |
| Under 5 Years | 0 (0.0%) | 19 (100.0%) |
| 5 Years | 0 (0.0%) | 0 (0.0%) |
| 6 to 11 Years | 41 (95.4%) | 43 (95.6%) |
| 12 to 14 Years | 32 (66.7%) | 0 (0.0%) |
| 15 Years | 0 (0.0%) | 1 (100.0%) |
| 16 and 17 Years | 0 (0.0%) | 2 (11.1%) |
| 18 to 24 Years | 29 (100.0%) | 14 (66.7%) |
| 25 to 34 Years | 22 (100.0%) | 25 (92.6%) |
| 35 to 44 Years | 70 (100.0%) | 43 (100.0%) |
| 45 to 54 Years | 39 (100.0%) | 37 (80.4%) |
| 55 to 64 Years | 81 (68.1%) | 51 (82.3%) |
| 65 to 74 Years | 35 (97.2%) | 36 (90.0%) |
| 75 Years and over | 10 (83.3%) | 18 (90.0%) |
| Total | 359 (85.9%) | 289 (84.5%) |
Income Below Poverty Among Married-Couple Families in Roberts County
The poverty statistics for married-couple families in Roberts County show that 7.1% or 14 of the total 197 families live below the poverty line. Families with 1 or 2 children have the highest poverty rate of 22.9%, comprising of 11 families. On the other hand, families with 3 or 4 children have the lowest poverty rate of 0.0%, which includes 0 families.
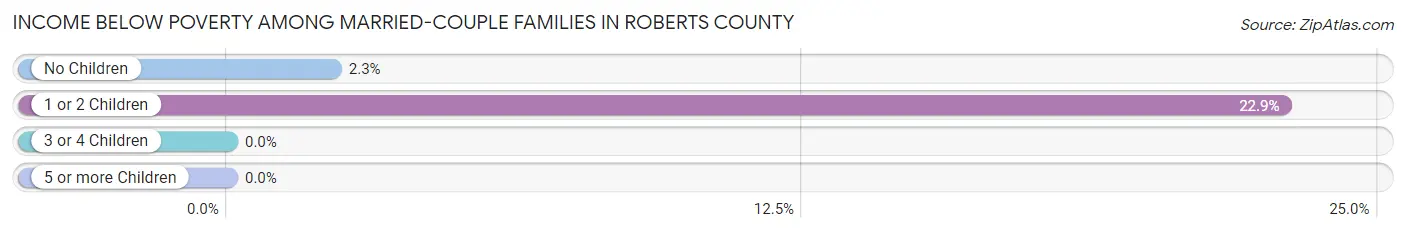
| Children | Above Poverty | Below Poverty |
| No Children | 130 (97.7%) | 3 (2.3%) |
| 1 or 2 Children | 37 (77.1%) | 11 (22.9%) |
| 3 or 4 Children | 16 (100.0%) | 0 (0.0%) |
| 5 or more Children | 0 (0.0%) | 0 (0.0%) |
| Total | 183 (92.9%) | 14 (7.1%) |
Income Below Poverty Among Single-Parent Households in Roberts County
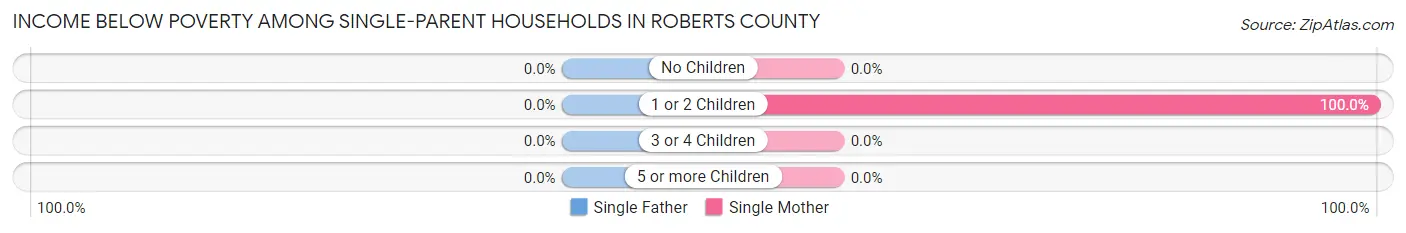
| Children | Single Father | Single Mother |
| No Children | 0 (0.0%) | 0 (0.0%) |
| 1 or 2 Children | 0 (0.0%) | 2 (100.0%) |
| 3 or 4 Children | 0 (0.0%) | 0 (0.0%) |
| 5 or more Children | 0 (0.0%) | 0 (0.0%) |
| Total | 0 (0.0%) | 2 (40.0%) |
Income Below Poverty Among Married-Couple vs Single-Parent Households in Roberts County
The poverty data for Roberts County shows that 14 of the married-couple family households (7.1%) and 2 of the single-parent households (12.5%) are living below the poverty level. Within the married-couple family households, those with 1 or 2 children have the highest poverty rate, with 11 households (22.9%) falling below the poverty line. Among the single-parent households, those with 1 or 2 children have the highest poverty rate, with 2 household (100.0%) living below poverty.
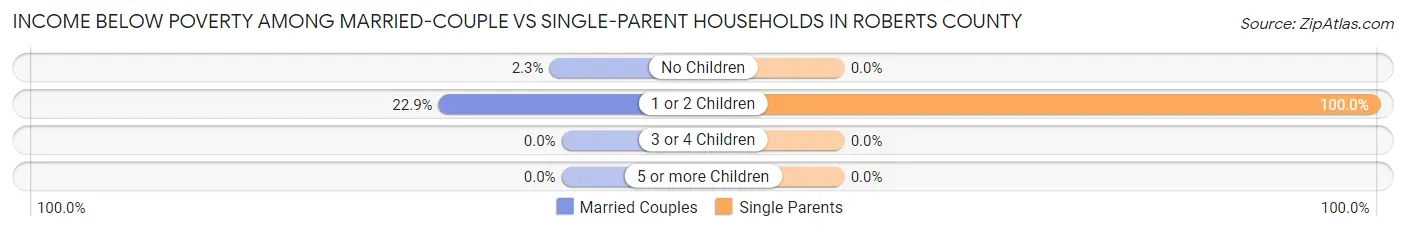
| Children | Married-Couple Families | Single-Parent Households |
| No Children | 3 (2.3%) | 0 (0.0%) |
| 1 or 2 Children | 11 (22.9%) | 2 (100.0%) |
| 3 or 4 Children | 0 (0.0%) | 0 (0.0%) |
| 5 or more Children | 0 (0.0%) | 0 (0.0%) |
| Total | 14 (7.1%) | 2 (12.5%) |
Race in Roberts County
The most populous races in Roberts County are White / Caucasian (736 | 96.3%), Hispanic or Latino (106 | 13.9%), and Two or more Races (22 | 2.9%).
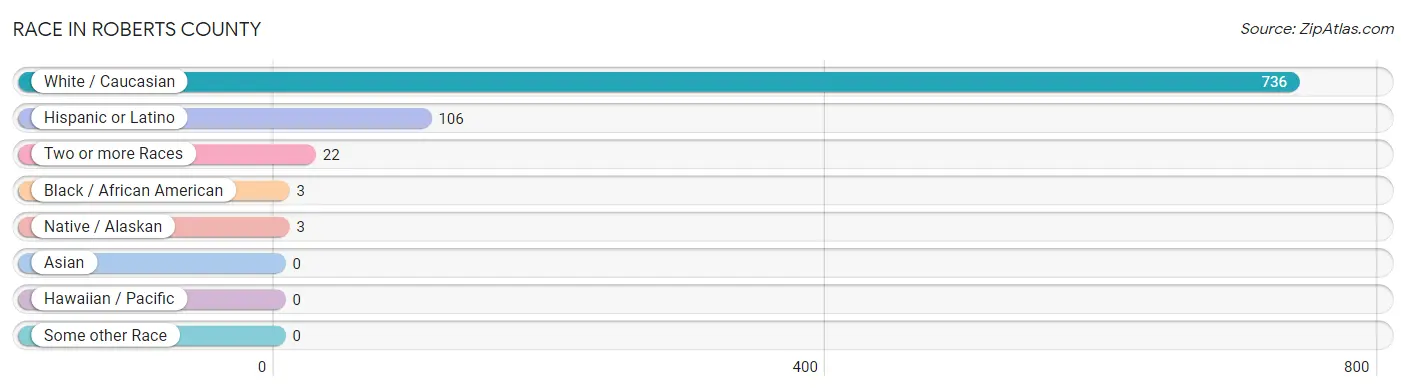
| Race | # Population | % Population |
| Asian | 0 | 0.0% |
| Black / African American | 3 | 0.4% |
| Hawaiian / Pacific | 0 | 0.0% |
| Hispanic or Latino | 106 | 13.9% |
| Native / Alaskan | 3 | 0.4% |
| White / Caucasian | 736 | 96.3% |
| Two or more Races | 22 | 2.9% |
| Some other Race | 0 | 0.0% |
| Total | 764 | 100.0% |
Ancestry in Roberts County
The most populous ancestries reported in Roberts County are Irish (164 | 21.5%), German (94 | 12.3%), Spaniard (73 | 9.6%), American (43 | 5.6%), and French (35 | 4.6%), together accounting for 53.5% of all Roberts County residents.
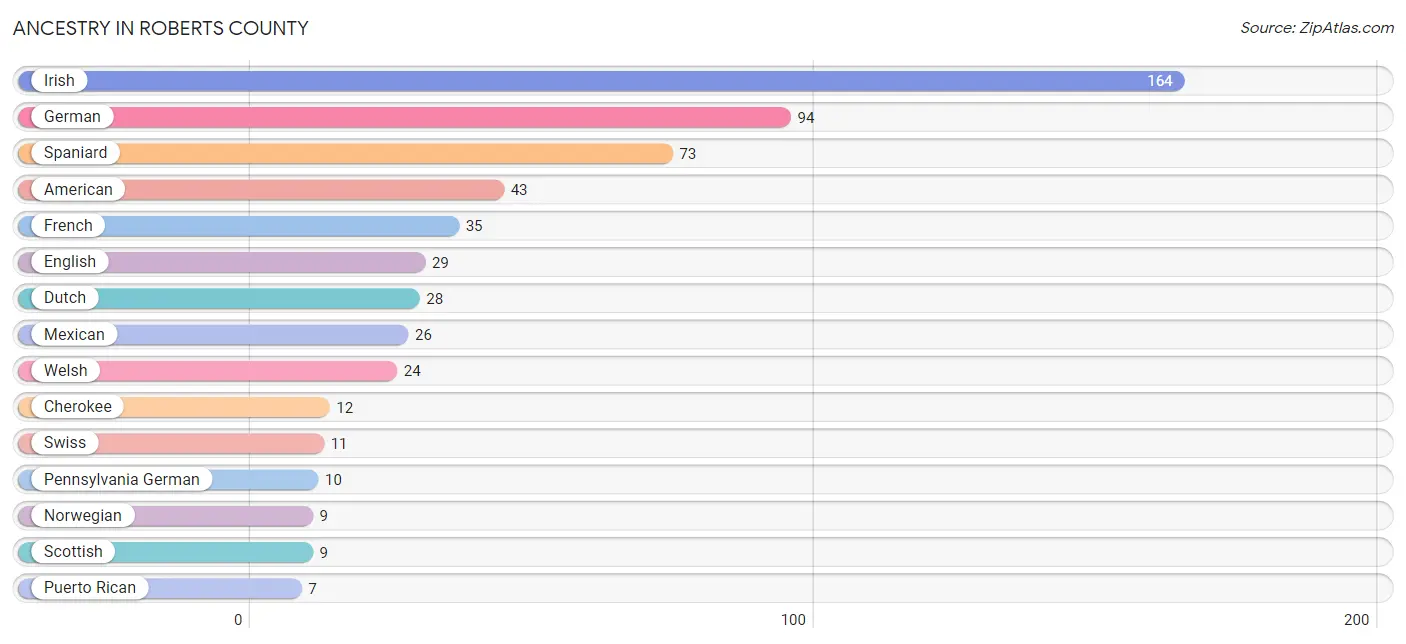
| Ancestry | # Population | % Population |
| American | 43 | 5.6% |
| Burmese | 4 | 0.5% |
| Cherokee | 12 | 1.6% |
| Czechoslovakian | 4 | 0.5% |
| Dutch | 28 | 3.7% |
| English | 29 | 3.8% |
| European | 2 | 0.3% |
| French | 35 | 4.6% |
| German | 94 | 12.3% |
| Indian (Asian) | 4 | 0.5% |
| Irish | 164 | 21.5% |
| Italian | 2 | 0.3% |
| Korean | 4 | 0.5% |
| Mexican | 26 | 3.4% |
| Navajo | 5 | 0.6% |
| Norwegian | 9 | 1.2% |
| Pennsylvania German | 10 | 1.3% |
| Puerto Rican | 7 | 0.9% |
| Scandinavian | 1 | 0.1% |
| Scotch-Irish | 5 | 0.6% |
| Scottish | 9 | 1.2% |
| Spaniard | 73 | 9.6% |
| Swiss | 11 | 1.4% |
| Welsh | 24 | 3.1% | View All 24 Rows |
Immigrants in Roberts County

| Immigration Origin | # Population | % Population | View All 0 Rows |
Sex and Age in Roberts County
Sex and Age in Roberts County
The most populous age groups in Roberts County are 55 to 59 Years (73 | 17.3%) for men and 55 to 59 Years (32 | 9.4%) for women.
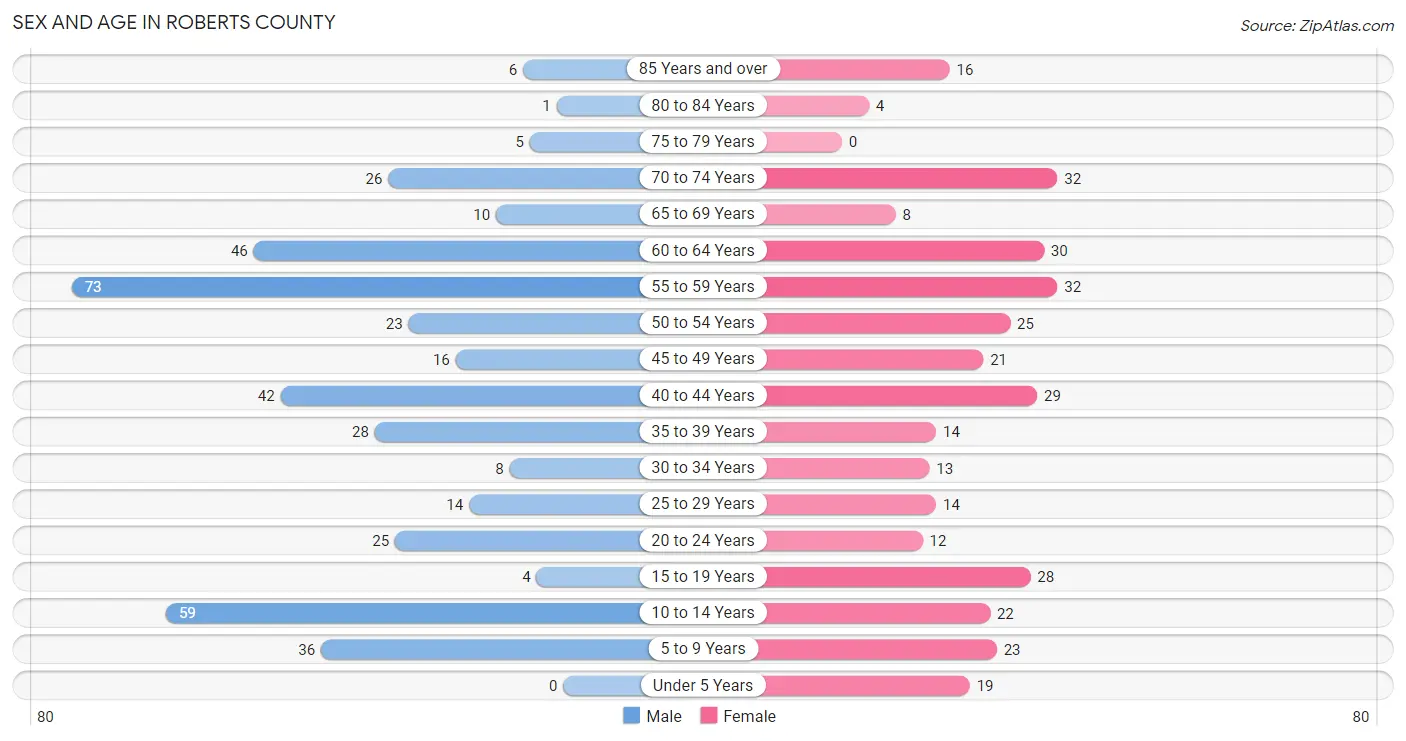
| Age Bracket | Male | Female |
| Under 5 Years | 0 (0.0%) | 19 (5.6%) |
| 5 to 9 Years | 36 (8.5%) | 23 (6.7%) |
| 10 to 14 Years | 59 (14.0%) | 22 (6.4%) |
| 15 to 19 Years | 4 (0.9%) | 28 (8.2%) |
| 20 to 24 Years | 25 (5.9%) | 12 (3.5%) |
| 25 to 29 Years | 14 (3.3%) | 14 (4.1%) |
| 30 to 34 Years | 8 (1.9%) | 13 (3.8%) |
| 35 to 39 Years | 28 (6.6%) | 14 (4.1%) |
| 40 to 44 Years | 42 (10.0%) | 29 (8.5%) |
| 45 to 49 Years | 16 (3.8%) | 21 (6.1%) |
| 50 to 54 Years | 23 (5.4%) | 25 (7.3%) |
| 55 to 59 Years | 73 (17.3%) | 32 (9.4%) |
| 60 to 64 Years | 46 (10.9%) | 30 (8.8%) |
| 65 to 69 Years | 10 (2.4%) | 8 (2.3%) |
| 70 to 74 Years | 26 (6.2%) | 32 (9.4%) |
| 75 to 79 Years | 5 (1.2%) | 0 (0.0%) |
| 80 to 84 Years | 1 (0.2%) | 4 (1.2%) |
| 85 Years and over | 6 (1.4%) | 16 (4.7%) |
| Total | 422 (100.0%) | 342 (100.0%) |
Families and Households in Roberts County
Median Family Size in Roberts County
The median family size in Roberts County is 3.01 persons per family, with married-couple families (197 | 92.5%) accounting for the largest median family size of 3.06 persons per family. On the other hand, single female/mother families (5 | 2.4%) represent the smallest median family size with 2.20 persons per family.
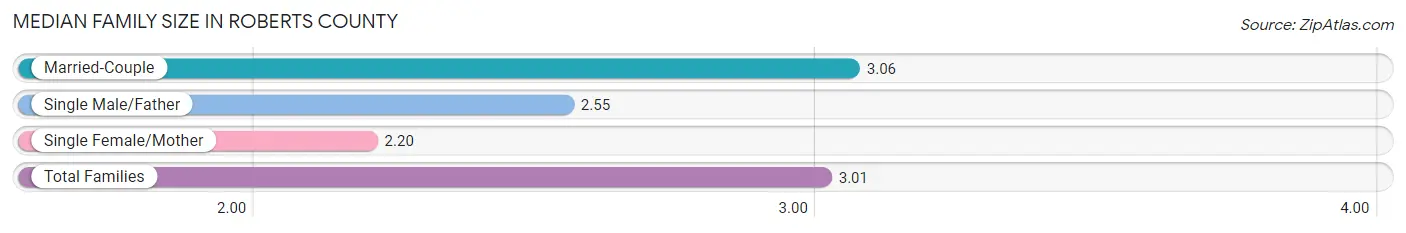
| Family Type | # Families | Family Size |
| Married-Couple | 197 (92.5%) | 3.06 |
| Single Male/Father | 11 (5.2%) | 2.55 |
| Single Female/Mother | 5 (2.4%) | 2.20 |
| Total Families | 213 (100.0%) | 3.01 |
Median Household Size in Roberts County
The median household size in Roberts County is 2.39 persons per household, with single male/father households (11 | 3.4%) accounting for the largest median household size of 3.55 persons per household. non-family households (107 | 33.4%) represent the smallest median household size with 1.05 persons per household.
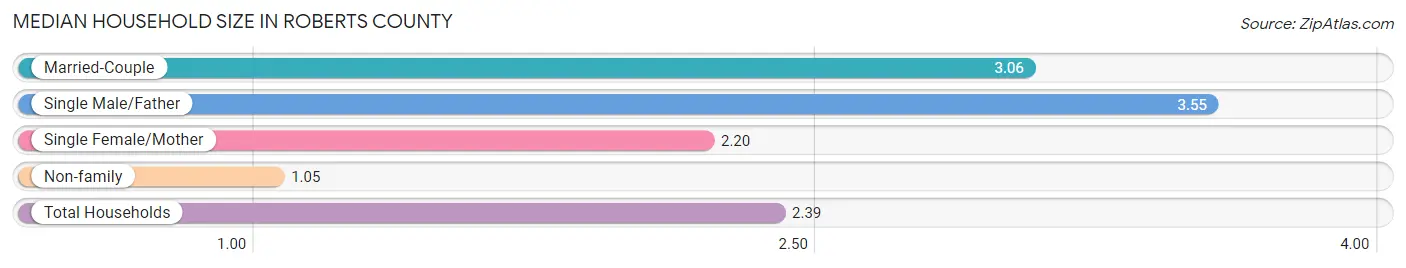
| Household Type | # Households | Household Size |
| Married-Couple | 197 (61.6%) | 3.06 |
| Single Male/Father | 11 (3.4%) | 3.55 |
| Single Female/Mother | 5 (1.6%) | 2.20 |
| Non-family | 107 (33.4%) | 1.05 |
| Total Households | 320 (100.0%) | 2.39 |
Household Size by Marriage Status in Roberts County
Out of a total of 320 households in Roberts County, 213 (66.6%) are family households, while 107 (33.4%) are nonfamily households. The most numerous type of family households are 2-person households, comprising 122, and the most common type of nonfamily households are 1-person households, comprising 102.
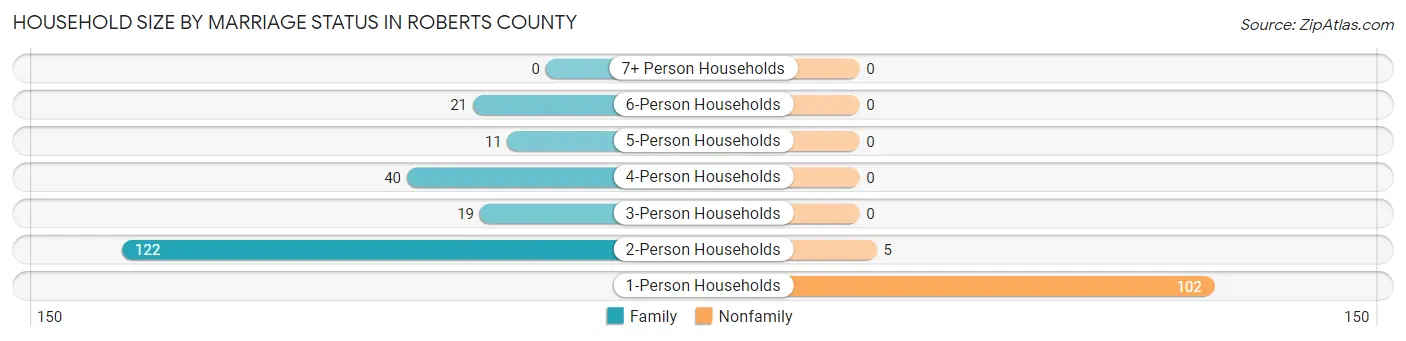
| Household Size | Family Households | Nonfamily Households |
| 1-Person Households | - | 102 (31.9%) |
| 2-Person Households | 122 (38.1%) | 5 (1.6%) |
| 3-Person Households | 19 (5.9%) | 0 (0.0%) |
| 4-Person Households | 40 (12.5%) | 0 (0.0%) |
| 5-Person Households | 11 (3.4%) | 0 (0.0%) |
| 6-Person Households | 21 (6.6%) | 0 (0.0%) |
| 7+ Person Households | 0 (0.0%) | 0 (0.0%) |
| Total | 213 (66.6%) | 107 (33.4%) |
Female Fertility in Roberts County
Fertility by Age in Roberts County
| Age Bracket | Women with Births | Births / 1,000 Women |
| 15 to 19 years | 0 (0.0%) | 0.0 |
| 20 to 34 years | 0 (0.0%) | 0.0 |
| 35 to 50 years | 0 (0.0%) | 0.0 |
| Total | 0 (0.0%) | 0.0 |
Fertility by Age by Marriage Status in Roberts County
| Age Bracket | Married | Unmarried |
| 15 to 19 years | 0 (0.0%) | 0 (0.0%) |
| 20 to 34 years | 0 (0.0%) | 0 (0.0%) |
| 35 to 50 years | 0 (0.0%) | 0 (0.0%) |
| Total | 0 (0.0%) | 0 (0.0%) |
Fertility by Education in Roberts County
| Educational Attainment | Women with Births | Births / 1,000 Women |
| Less than High School | 0 (0.0%) | 0.0 |
| High School Diploma | 0 (0.0%) | 0.0 |
| College or Associate's Degree | 0 (0.0%) | 0.0 |
| Bachelor's Degree | 0 (0.0%) | 0.0 |
| Graduate Degree | 0 (0.0%) | 0.0 |
| Total | 0 (0.0%) | 0.0 |
Fertility by Education by Marriage Status in Roberts County
| Educational Attainment | Married | Unmarried |
| Less than High School | 0 (0.0%) | 0 (0.0%) |
| High School Diploma | 0 (0.0%) | 0 (0.0%) |
| College or Associate's Degree | 0 (0.0%) | 0 (0.0%) |
| Bachelor's Degree | 0 (0.0%) | 0 (0.0%) |
| Graduate Degree | 0 (0.0%) | 0 (0.0%) |
| Total | 0 (0.0%) | 0 (0.0%) |
Employment Characteristics in Roberts County
Employment by Class of Employer in Roberts County
Among the 398 employed individuals in Roberts County, private company employees (247 | 62.1%), local government employees (77 | 19.4%), and self-employed (not incorporated) (44 | 11.1%) make up the most common classes of employment.
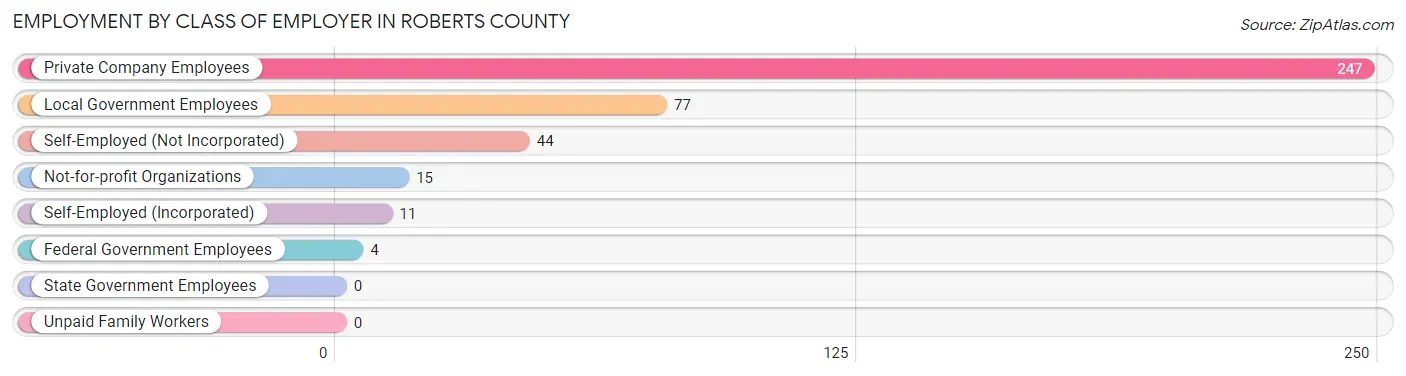
| Employer Class | # Employees | % Employees |
| Private Company Employees | 247 | 62.1% |
| Self-Employed (Incorporated) | 11 | 2.8% |
| Self-Employed (Not Incorporated) | 44 | 11.1% |
| Not-for-profit Organizations | 15 | 3.8% |
| Local Government Employees | 77 | 19.4% |
| State Government Employees | 0 | 0.0% |
| Federal Government Employees | 4 | 1.0% |
| Unpaid Family Workers | 0 | 0.0% |
| Total | 398 | 100.0% |
Employment Status by Age in Roberts County
According to the labor force statistics for Roberts County, out of the total population over 16 years of age (604), 66.2% or 400 individuals are in the labor force, with 0.5% or 2 of them unemployed. The age group with the highest labor force participation rate is 30 to 34 years, with 100.0% or 21 individuals in the labor force. Within the labor force, the 30 to 34 years age range has the highest percentage of unemployed individuals, with 9.5% or 2 of them being unemployed.
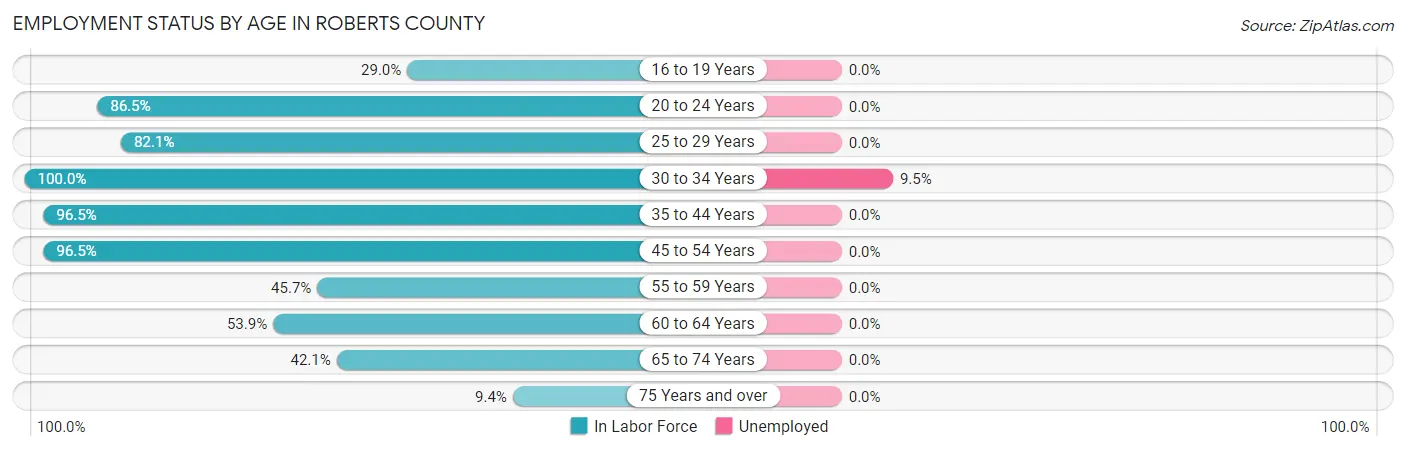
| Age Bracket | In Labor Force | Unemployed |
| 16 to 19 Years | 9 (29.0%) | 0 (0.0%) |
| 20 to 24 Years | 32 (86.5%) | 0 (0.0%) |
| 25 to 29 Years | 23 (82.1%) | 0 (0.0%) |
| 30 to 34 Years | 21 (100.0%) | 2 (9.5%) |
| 35 to 44 Years | 109 (96.5%) | 0 (0.0%) |
| 45 to 54 Years | 82 (96.5%) | 0 (0.0%) |
| 55 to 59 Years | 48 (45.7%) | 0 (0.0%) |
| 60 to 64 Years | 41 (53.9%) | 0 (0.0%) |
| 65 to 74 Years | 32 (42.1%) | 0 (0.0%) |
| 75 Years and over | 3 (9.4%) | 0 (0.0%) |
| Total | 400 (66.2%) | 2 (0.5%) |
Employment Status by Educational Attainment in Roberts County
According to labor force statistics for Roberts County, 75.7% of individuals (324) out of the total population between 25 and 64 years of age (428) are in the labor force, with 0.6% or 2 of them being unemployed. The group with the highest labor force participation rate are those with the educational attainment of bachelor's degree or higher, with 89.9% or 71 individuals in the labor force. Within the labor force, individuals with college / associate degree education have the highest percentage of unemployment, with 1.5% or 2 of them being unemployed.
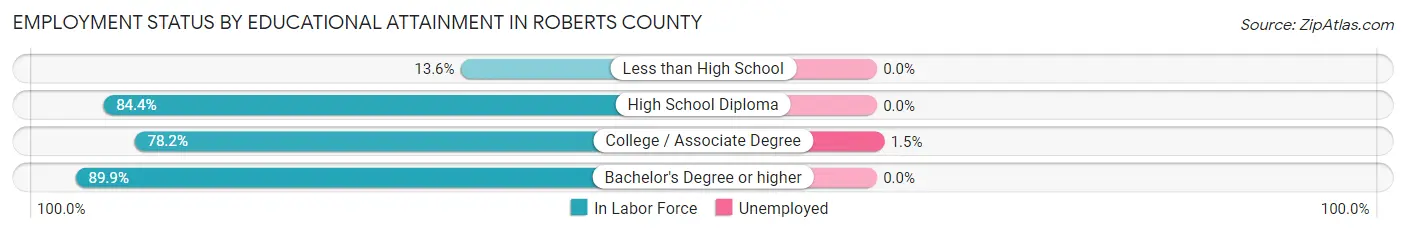
| Educational Attainment | In Labor Force | Unemployed |
| Less than High School | 6 (13.6%) | 0 (0.0%) |
| High School Diploma | 114 (84.4%) | 0 (0.0%) |
| College / Associate Degree | 133 (78.2%) | 3 (1.5%) |
| Bachelor's Degree or higher | 71 (89.9%) | 0 (0.0%) |
| Total | 324 (75.7%) | 3 (0.6%) |
Employment Occupations by Sex in Roberts County
Management, Business, Science and Arts Occupations
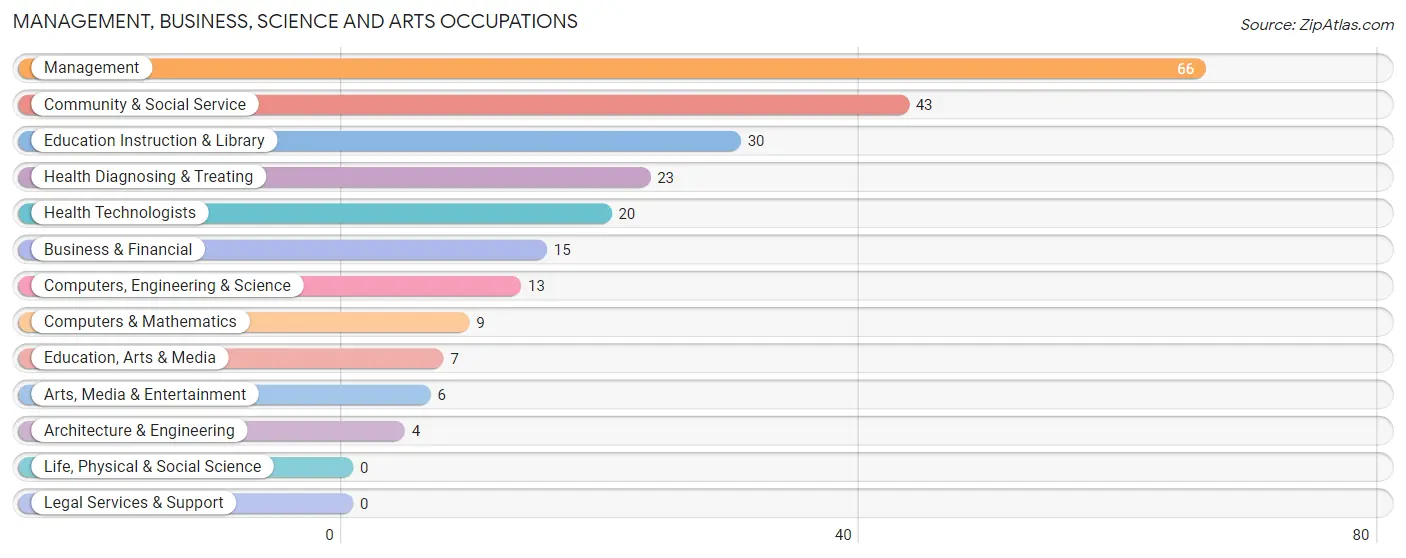
The most common Management, Business, Science and Arts occupations in Roberts County are Management (66 | 16.6%), Community & Social Service (43 | 10.8%), Education Instruction & Library (30 | 7.5%), Health Diagnosing & Treating (23 | 5.8%), and Health Technologists (20 | 5.0%).
Management, Business, Science and Arts Occupations by Sex
Within the Management, Business, Science and Arts occupations in Roberts County, the most male-oriented occupations are Computers, Engineering & Science (100.0%), Computers & Mathematics (100.0%), and Architecture & Engineering (100.0%), while the most female-oriented occupations are Education, Arts & Media (100.0%), Education Instruction & Library (96.7%), and Community & Social Service (83.7%).
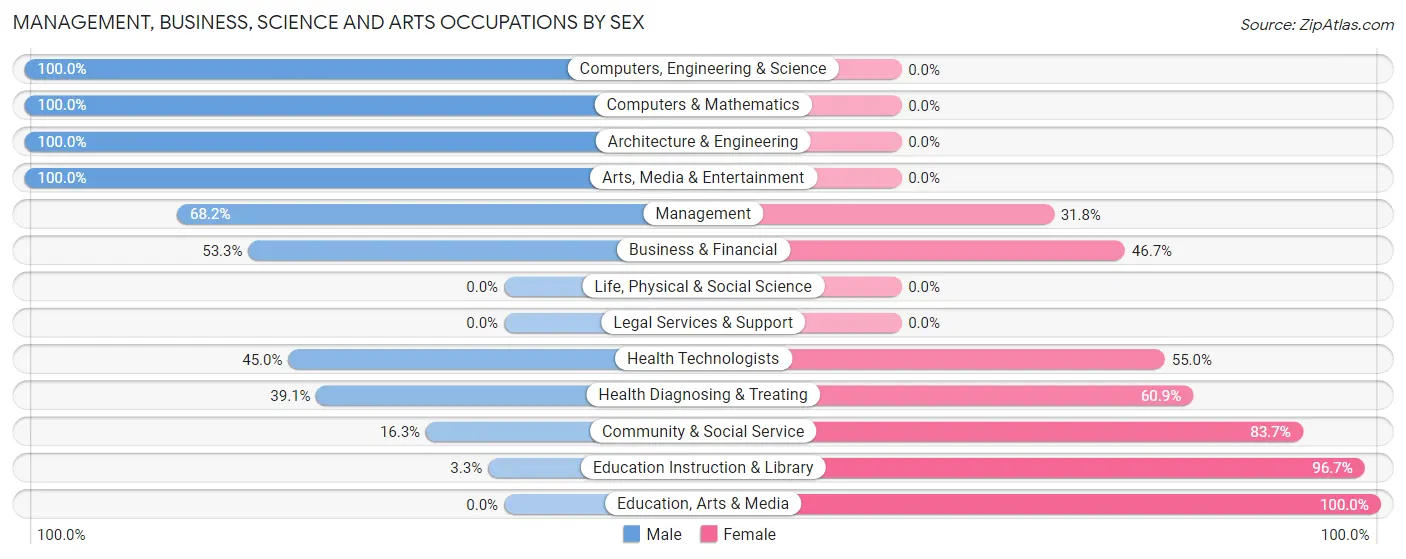
| Occupation | Male | Female |
| Management | 45 (68.2%) | 21 (31.8%) |
| Business & Financial | 8 (53.3%) | 7 (46.7%) |
| Computers, Engineering & Science | 13 (100.0%) | 0 (0.0%) |
| Computers & Mathematics | 9 (100.0%) | 0 (0.0%) |
| Architecture & Engineering | 4 (100.0%) | 0 (0.0%) |
| Life, Physical & Social Science | 0 (0.0%) | 0 (0.0%) |
| Community & Social Service | 7 (16.3%) | 36 (83.7%) |
| Education, Arts & Media | 0 (0.0%) | 7 (100.0%) |
| Legal Services & Support | 0 (0.0%) | 0 (0.0%) |
| Education Instruction & Library | 1 (3.3%) | 29 (96.7%) |
| Arts, Media & Entertainment | 6 (100.0%) | 0 (0.0%) |
| Health Diagnosing & Treating | 9 (39.1%) | 14 (60.9%) |
| Health Technologists | 9 (45.0%) | 11 (55.0%) |
| Total (Category) | 82 (51.2%) | 78 (48.7%) |
| Total (Overall) | 238 (59.8%) | 160 (40.2%) |
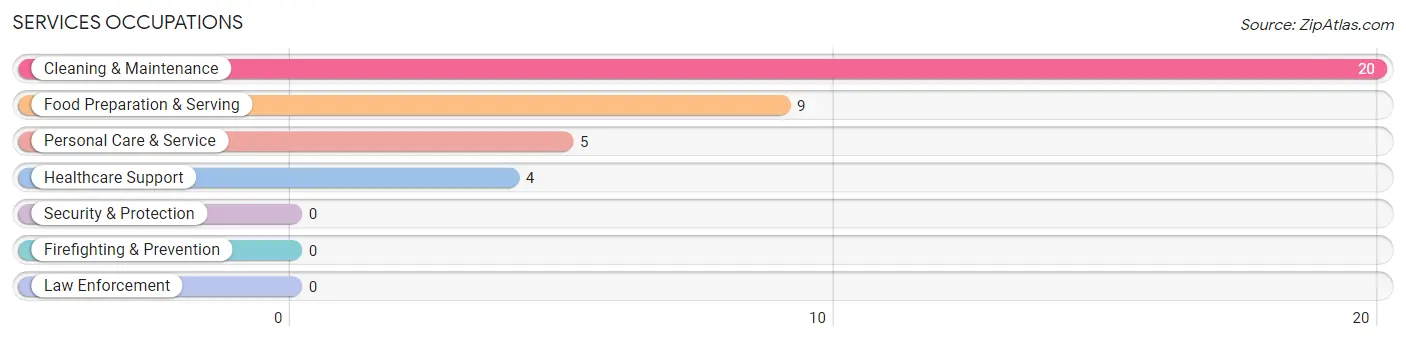
Services Occupations
The most common Services occupations in Roberts County are Cleaning & Maintenance (20 | 5.0%), Food Preparation & Serving (9 | 2.3%), Personal Care & Service (5 | 1.3%), and Healthcare Support (4 | 1.0%).
Services Occupations by Sex
Within the Services occupations in Roberts County, the most male-oriented occupations are Cleaning & Maintenance (65.0%), and Food Preparation & Serving (22.2%), while the most female-oriented occupations are Healthcare Support (100.0%), Personal Care & Service (100.0%), and Food Preparation & Serving (77.8%).
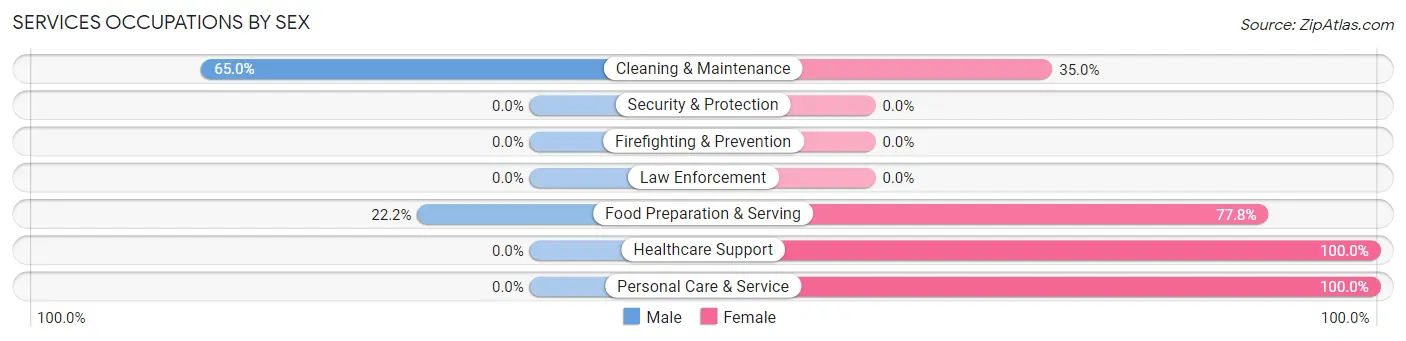
| Occupation | Male | Female |
| Healthcare Support | 0 (0.0%) | 4 (100.0%) |
| Security & Protection | 0 (0.0%) | 0 (0.0%) |
| Firefighting & Prevention | 0 (0.0%) | 0 (0.0%) |
| Law Enforcement | 0 (0.0%) | 0 (0.0%) |
| Food Preparation & Serving | 2 (22.2%) | 7 (77.8%) |
| Cleaning & Maintenance | 13 (65.0%) | 7 (35.0%) |
| Personal Care & Service | 0 (0.0%) | 5 (100.0%) |
| Total (Category) | 15 (39.5%) | 23 (60.5%) |
| Total (Overall) | 238 (59.8%) | 160 (40.2%) |
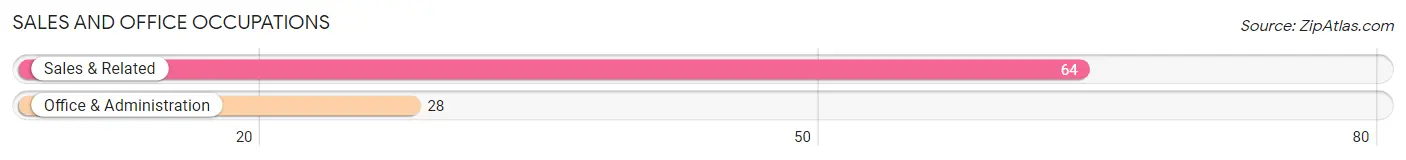
Sales and Office Occupations
The most common Sales and Office occupations in Roberts County are Sales & Related (64 | 16.1%), and Office & Administration (28 | 7.0%).
Sales and Office Occupations by Sex
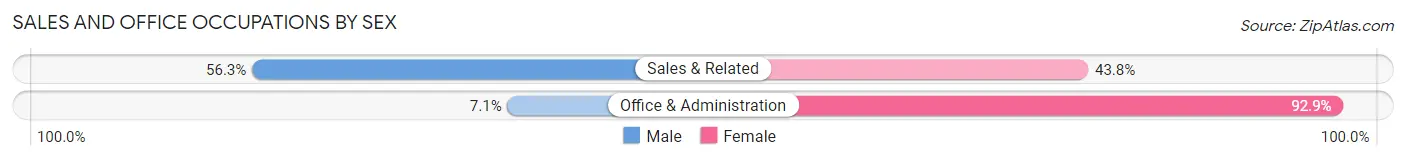
| Occupation | Male | Female |
| Sales & Related | 36 (56.2%) | 28 (43.8%) |
| Office & Administration | 2 (7.1%) | 26 (92.9%) |
| Total (Category) | 38 (41.3%) | 54 (58.7%) |
| Total (Overall) | 238 (59.8%) | 160 (40.2%) |
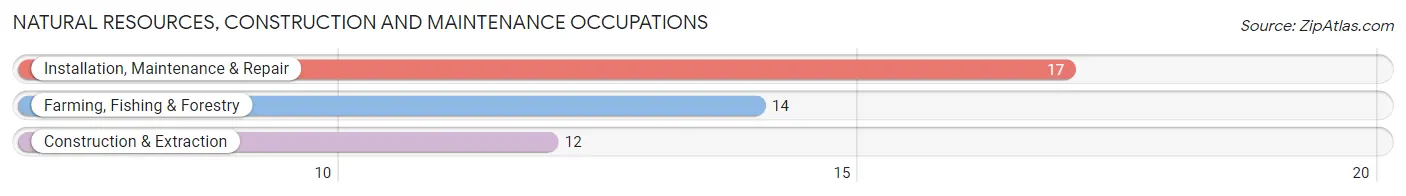
Natural Resources, Construction and Maintenance Occupations
The most common Natural Resources, Construction and Maintenance occupations in Roberts County are Installation, Maintenance & Repair (17 | 4.3%), Farming, Fishing & Forestry (14 | 3.5%), and Construction & Extraction (12 | 3.0%).
Natural Resources, Construction and Maintenance Occupations by Sex
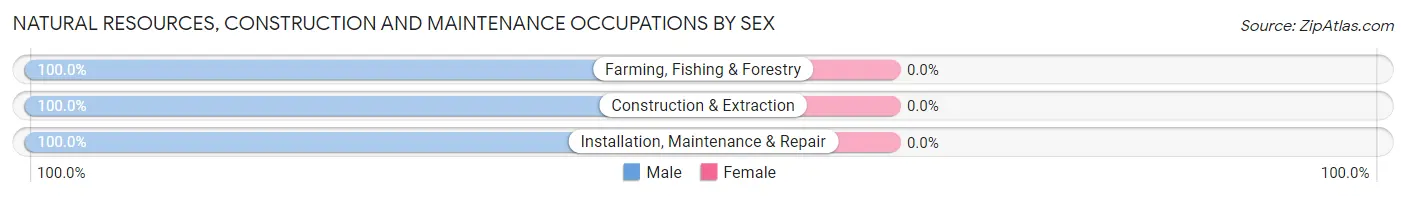
| Occupation | Male | Female |
| Farming, Fishing & Forestry | 14 (100.0%) | 0 (0.0%) |
| Construction & Extraction | 12 (100.0%) | 0 (0.0%) |
| Installation, Maintenance & Repair | 17 (100.0%) | 0 (0.0%) |
| Total (Category) | 43 (100.0%) | 0 (0.0%) |
| Total (Overall) | 238 (59.8%) | 160 (40.2%) |
Production, Transportation and Moving Occupations
The most common Production, Transportation and Moving occupations in Roberts County are Material Moving (34 | 8.5%), Production (24 | 6.0%), and Transportation (7 | 1.8%).
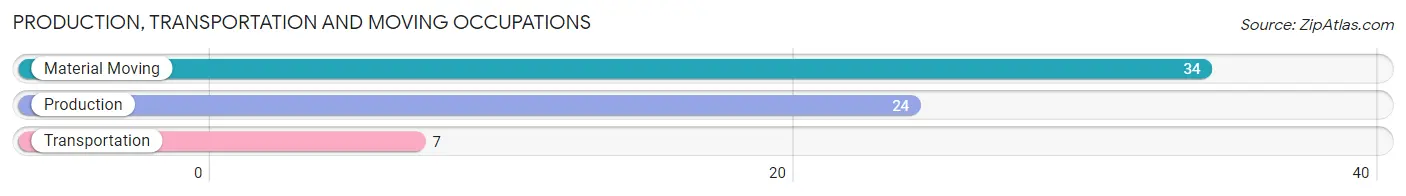
Production, Transportation and Moving Occupations by Sex
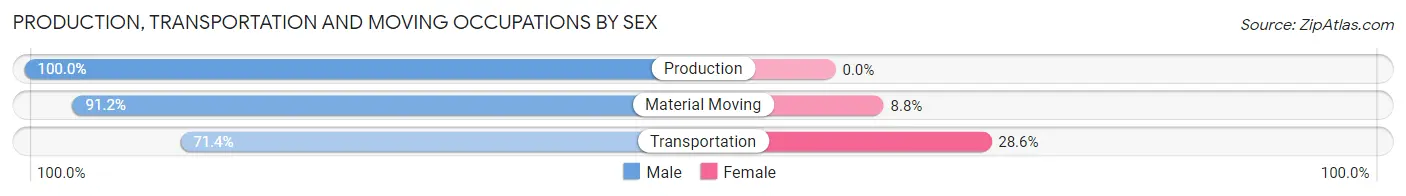
| Occupation | Male | Female |
| Production | 24 (100.0%) | 0 (0.0%) |
| Transportation | 5 (71.4%) | 2 (28.6%) |
| Material Moving | 31 (91.2%) | 3 (8.8%) |
| Total (Category) | 60 (92.3%) | 5 (7.7%) |
| Total (Overall) | 238 (59.8%) | 160 (40.2%) |
Employment Industries by Sex in Roberts County
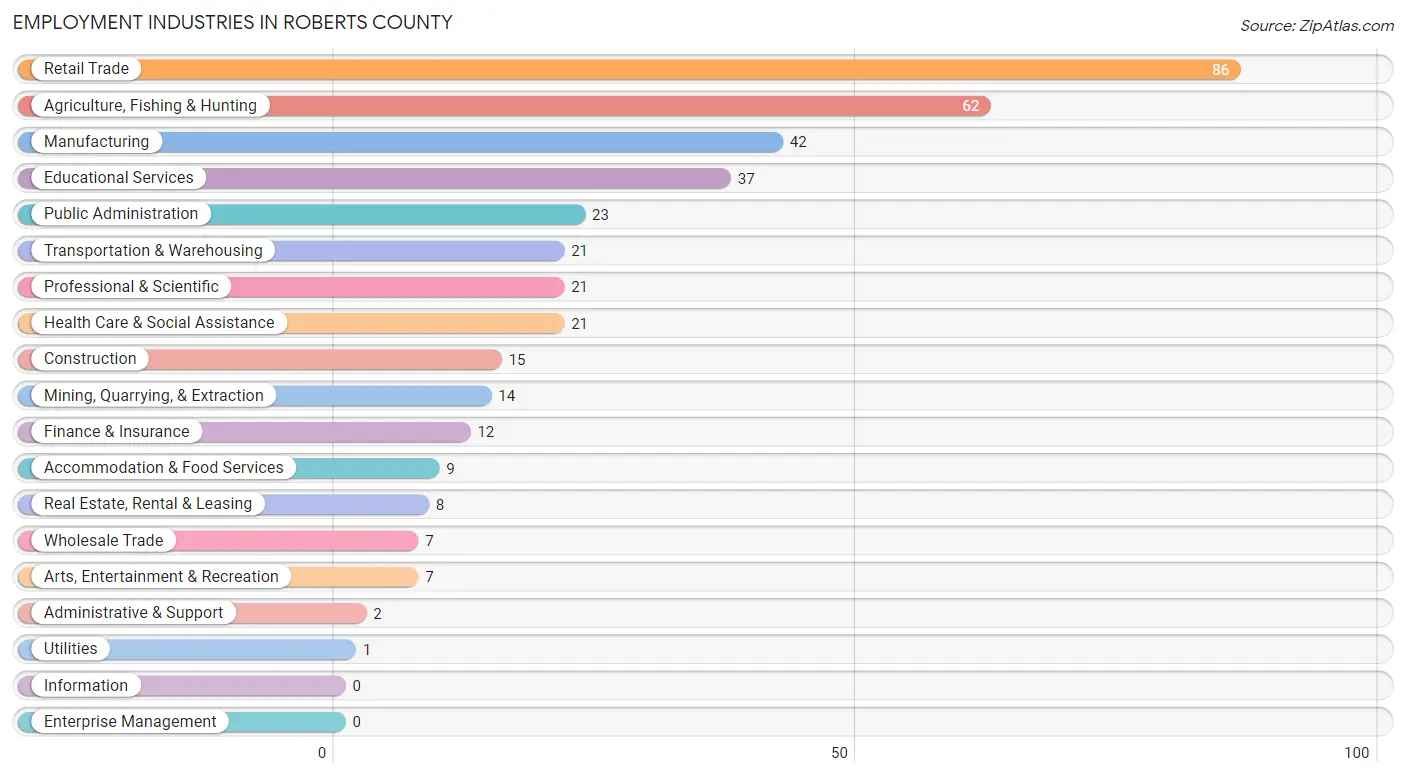
Employment Industries in Roberts County
The major employment industries in Roberts County include Retail Trade (86 | 21.6%), Agriculture, Fishing & Hunting (62 | 15.6%), Manufacturing (42 | 10.5%), Educational Services (37 | 9.3%), and Public Administration (23 | 5.8%).
Employment Industries by Sex in Roberts County
The Roberts County industries that see more men than women are Construction (100.0%), Wholesale Trade (100.0%), and Utilities (100.0%), whereas the industries that tend to have a higher number of women are Finance & Insurance (100.0%), Real Estate, Rental & Leasing (100.0%), and Administrative & Support (100.0%).
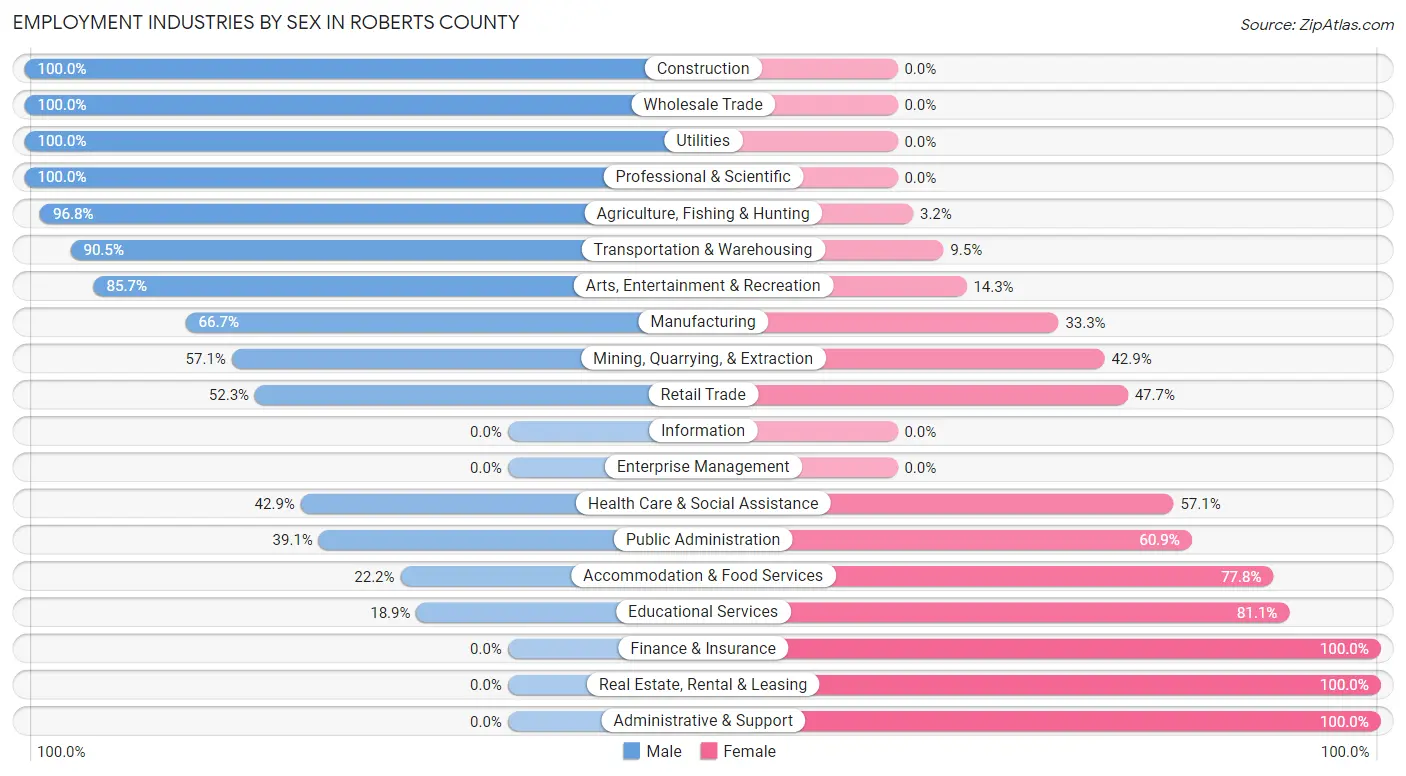
| Industry | Male | Female |
| Agriculture, Fishing & Hunting | 60 (96.8%) | 2 (3.2%) |
| Mining, Quarrying, & Extraction | 8 (57.1%) | 6 (42.9%) |
| Construction | 15 (100.0%) | 0 (0.0%) |
| Manufacturing | 28 (66.7%) | 14 (33.3%) |
| Wholesale Trade | 7 (100.0%) | 0 (0.0%) |
| Retail Trade | 45 (52.3%) | 41 (47.7%) |
| Transportation & Warehousing | 19 (90.5%) | 2 (9.5%) |
| Utilities | 1 (100.0%) | 0 (0.0%) |
| Information | 0 (0.0%) | 0 (0.0%) |
| Finance & Insurance | 0 (0.0%) | 12 (100.0%) |
| Real Estate, Rental & Leasing | 0 (0.0%) | 8 (100.0%) |
| Professional & Scientific | 21 (100.0%) | 0 (0.0%) |
| Enterprise Management | 0 (0.0%) | 0 (0.0%) |
| Administrative & Support | 0 (0.0%) | 2 (100.0%) |
| Educational Services | 7 (18.9%) | 30 (81.1%) |
| Health Care & Social Assistance | 9 (42.9%) | 12 (57.1%) |
| Arts, Entertainment & Recreation | 6 (85.7%) | 1 (14.3%) |
| Accommodation & Food Services | 2 (22.2%) | 7 (77.8%) |
| Public Administration | 9 (39.1%) | 14 (60.9%) |
| Total | 238 (59.8%) | 160 (40.2%) |
Education in Roberts County
School Enrollment in Roberts County
The most common levels of schooling among the 172 students in Roberts County are middle school (62 | 36.0%), high school (51 | 29.6%), and elementary school (41 | 23.8%).

| School Level | # Students | % Students |
| Nursery / Preschool | 0 | 0.0% |
| Kindergarten | 18 | 10.5% |
| Elementary School | 41 | 23.8% |
| Middle School | 62 | 36.0% |
| High School | 51 | 29.6% |
| College / Undergraduate | 0 | 0.0% |
| Graduate / Professional | 0 | 0.0% |
| Total | 172 | 100.0% |
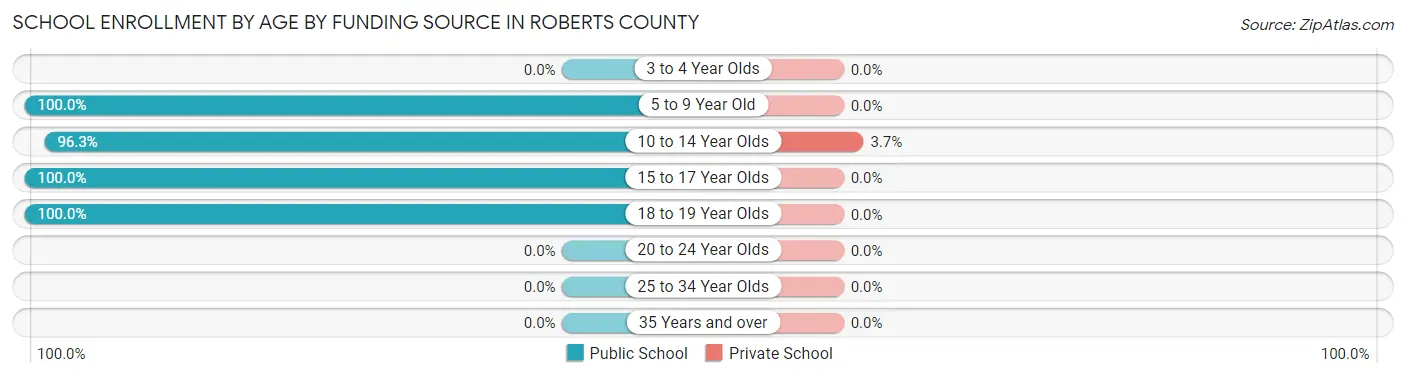
School Enrollment by Age by Funding Source in Roberts County
Out of a total of 172 students who are enrolled in schools in Roberts County, 3 (1.7%) attend a private institution, while the remaining 169 (98.3%) are enrolled in public schools. The age group of 10 to 14 year olds has the highest likelihood of being enrolled in private schools, with 3 (3.7% in the age bracket) enrolled. Conversely, the age group of 5 to 9 year old has the lowest likelihood of being enrolled in a private school, with 59 (100.0% in the age bracket) attending a public institution.
| Age Bracket | Public School | Private School |
| 3 to 4 Year Olds | 0 (0.0%) | 0 (0.0%) |
| 5 to 9 Year Old | 59 (100.0%) | 0 (0.0%) |
| 10 to 14 Year Olds | 78 (96.3%) | 3 (3.7%) |
| 15 to 17 Year Olds | 19 (100.0%) | 0 (0.0%) |
| 18 to 19 Year Olds | 13 (100.0%) | 0 (0.0%) |
| 20 to 24 Year Olds | 0 (0.0%) | 0 (0.0%) |
| 25 to 34 Year Olds | 0 (0.0%) | 0 (0.0%) |
| 35 Years and over | 0 (0.0%) | 0 (0.0%) |
| Total | 169 (98.3%) | 3 (1.7%) |
Educational Attainment by Field of Study in Roberts County
Business (31 | 27.7%), education (20 | 17.9%), psychology (16 | 14.3%), bio, nature & agricultural (15 | 13.4%), and social sciences (12 | 10.7%) are the most common fields of study among 112 individuals in Roberts County who have obtained a bachelor's degree or higher.
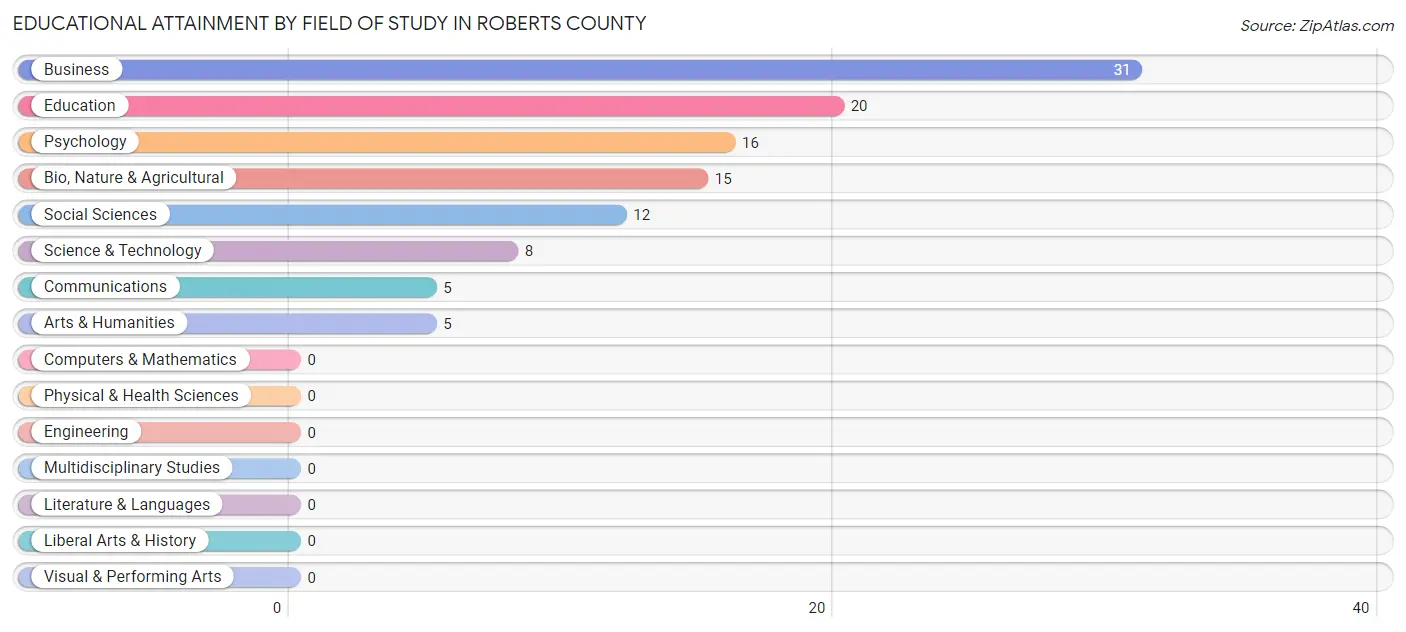
| Field of Study | # Graduates | % Graduates |
| Computers & Mathematics | 0 | 0.0% |
| Bio, Nature & Agricultural | 15 | 13.4% |
| Physical & Health Sciences | 0 | 0.0% |
| Psychology | 16 | 14.3% |
| Social Sciences | 12 | 10.7% |
| Engineering | 0 | 0.0% |
| Multidisciplinary Studies | 0 | 0.0% |
| Science & Technology | 8 | 7.1% |
| Business | 31 | 27.7% |
| Education | 20 | 17.9% |
| Literature & Languages | 0 | 0.0% |
| Liberal Arts & History | 0 | 0.0% |
| Visual & Performing Arts | 0 | 0.0% |
| Communications | 5 | 4.5% |
| Arts & Humanities | 5 | 4.5% |
| Total | 112 | 100.0% |
Transportation & Commute in Roberts County
Vehicle Availability by Sex in Roberts County
The most prevalent vehicle ownership categories in Roberts County are males with 2 vehicles (112, accounting for 47.1%) and females with 2 vehicles (57, making up 70.0%).
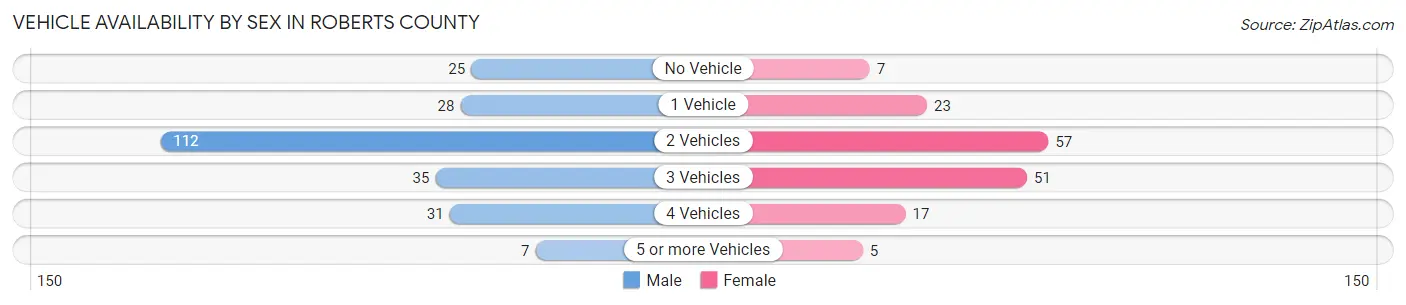
| Vehicles Available | Male | Female |
| No Vehicle | 25 (10.5%) | 7 (4.4%) |
| 1 Vehicle | 28 (11.8%) | 23 (14.4%) |
| 2 Vehicles | 112 (47.1%) | 57 (35.6%) |
| 3 Vehicles | 35 (14.7%) | 51 (31.9%) |
| 4 Vehicles | 31 (13.0%) | 17 (10.6%) |
| 5 or more Vehicles | 7 (2.9%) | 5 (3.1%) |
| Total | 238 (100.0%) | 160 (100.0%) |
Commute Time in Roberts County
The most frequently occuring commute durations in Roberts County are less than 5 minutes (104 commuters, 26.9%), 5 to 9 minutes (73 commuters, 18.9%), and 20 to 24 minutes (63 commuters, 16.3%).
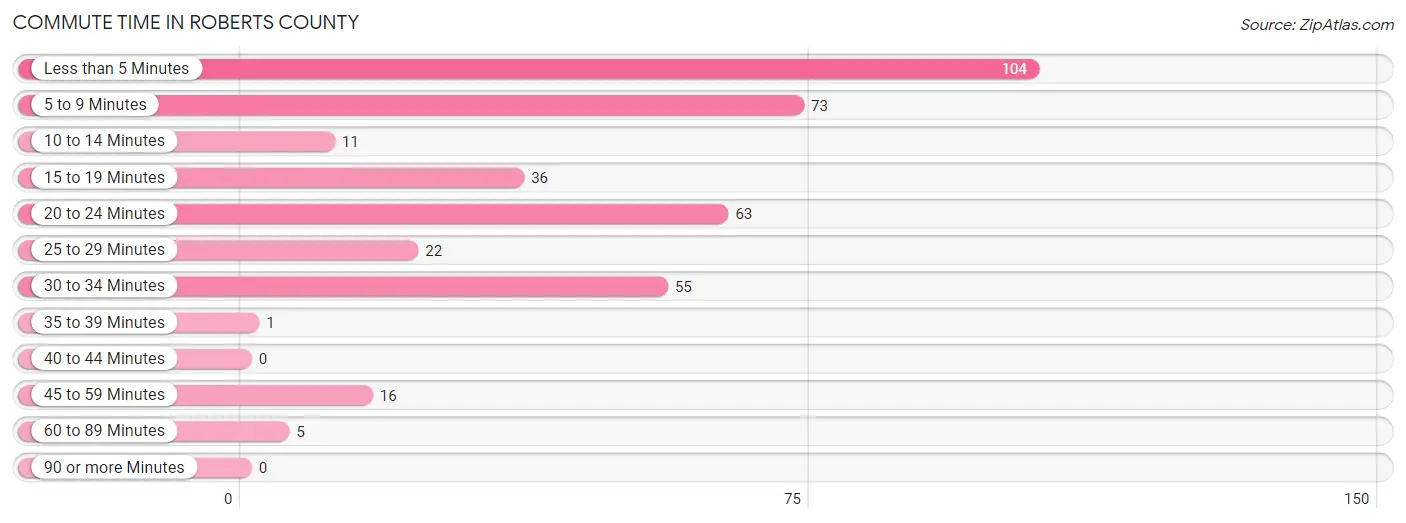
| Commute Time | # Commuters | % Commuters |
| Less than 5 Minutes | 104 | 26.9% |
| 5 to 9 Minutes | 73 | 18.9% |
| 10 to 14 Minutes | 11 | 2.9% |
| 15 to 19 Minutes | 36 | 9.3% |
| 20 to 24 Minutes | 63 | 16.3% |
| 25 to 29 Minutes | 22 | 5.7% |
| 30 to 34 Minutes | 55 | 14.2% |
| 35 to 39 Minutes | 1 | 0.3% |
| 40 to 44 Minutes | 0 | 0.0% |
| 45 to 59 Minutes | 16 | 4.2% |
| 60 to 89 Minutes | 5 | 1.3% |
| 90 or more Minutes | 0 | 0.0% |
Commute Time by Sex in Roberts County
The most common commute times in Roberts County are less than 5 minutes (56 commuters, 24.6%) for males and less than 5 minutes (48 commuters, 30.4%) for females.
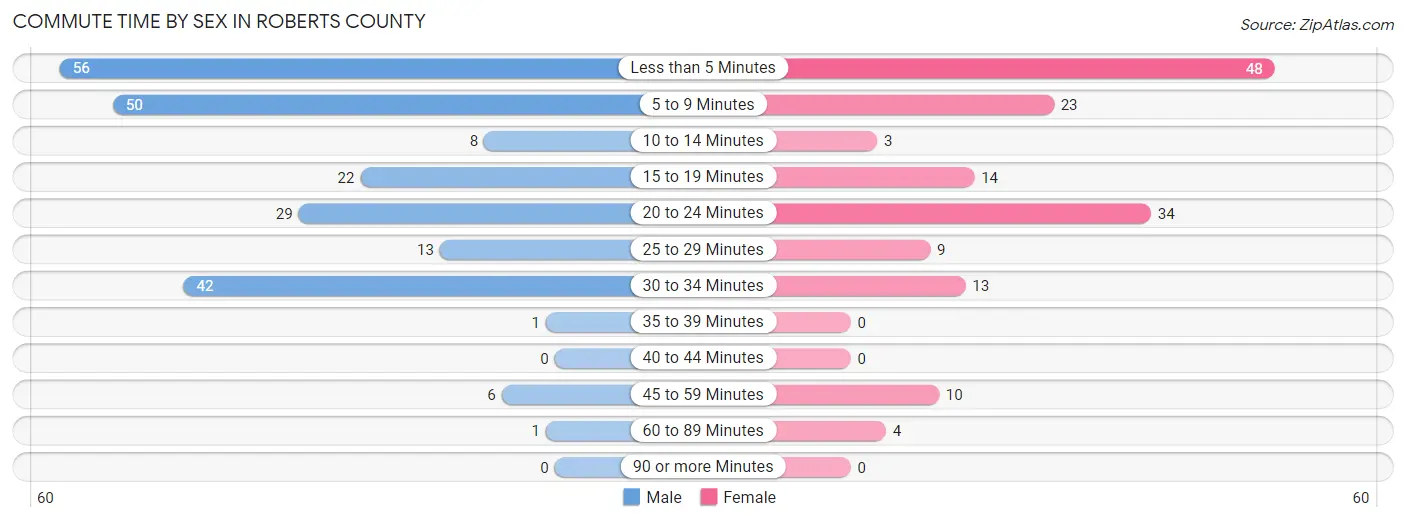
| Commute Time | Male | Female |
| Less than 5 Minutes | 56 (24.6%) | 48 (30.4%) |
| 5 to 9 Minutes | 50 (21.9%) | 23 (14.6%) |
| 10 to 14 Minutes | 8 (3.5%) | 3 (1.9%) |
| 15 to 19 Minutes | 22 (9.7%) | 14 (8.9%) |
| 20 to 24 Minutes | 29 (12.7%) | 34 (21.5%) |
| 25 to 29 Minutes | 13 (5.7%) | 9 (5.7%) |
| 30 to 34 Minutes | 42 (18.4%) | 13 (8.2%) |
| 35 to 39 Minutes | 1 (0.4%) | 0 (0.0%) |
| 40 to 44 Minutes | 0 (0.0%) | 0 (0.0%) |
| 45 to 59 Minutes | 6 (2.6%) | 10 (6.3%) |
| 60 to 89 Minutes | 1 (0.4%) | 4 (2.5%) |
| 90 or more Minutes | 0 (0.0%) | 0 (0.0%) |
Time of Departure to Work by Sex in Roberts County
The most frequent times of departure to work in Roberts County are 7:00 AM to 7:29 AM (79, 34.6%) for males and 7:00 AM to 7:29 AM (49, 31.0%) for females.
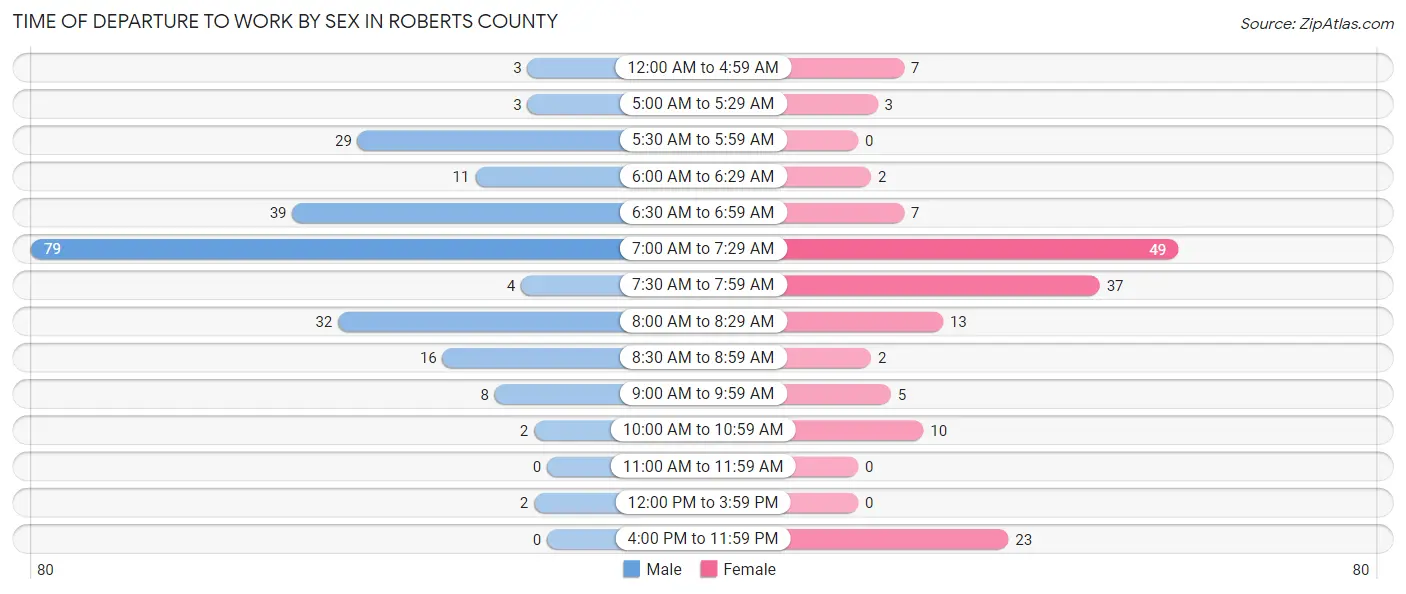
| Time of Departure | Male | Female |
| 12:00 AM to 4:59 AM | 3 (1.3%) | 7 (4.4%) |
| 5:00 AM to 5:29 AM | 3 (1.3%) | 3 (1.9%) |
| 5:30 AM to 5:59 AM | 29 (12.7%) | 0 (0.0%) |
| 6:00 AM to 6:29 AM | 11 (4.8%) | 2 (1.3%) |
| 6:30 AM to 6:59 AM | 39 (17.1%) | 7 (4.4%) |
| 7:00 AM to 7:29 AM | 79 (34.6%) | 49 (31.0%) |
| 7:30 AM to 7:59 AM | 4 (1.8%) | 37 (23.4%) |
| 8:00 AM to 8:29 AM | 32 (14.0%) | 13 (8.2%) |
| 8:30 AM to 8:59 AM | 16 (7.0%) | 2 (1.3%) |
| 9:00 AM to 9:59 AM | 8 (3.5%) | 5 (3.2%) |
| 10:00 AM to 10:59 AM | 2 (0.9%) | 10 (6.3%) |
| 11:00 AM to 11:59 AM | 0 (0.0%) | 0 (0.0%) |
| 12:00 PM to 3:59 PM | 2 (0.9%) | 0 (0.0%) |
| 4:00 PM to 11:59 PM | 0 (0.0%) | 23 (14.6%) |
| Total | 228 (100.0%) | 158 (100.0%) |
Housing Occupancy in Roberts County
Occupancy by Ownership in Roberts County
Of the total 320 dwellings in Roberts County, owner-occupied units account for 277 (86.6%), while renter-occupied units make up 43 (13.4%).
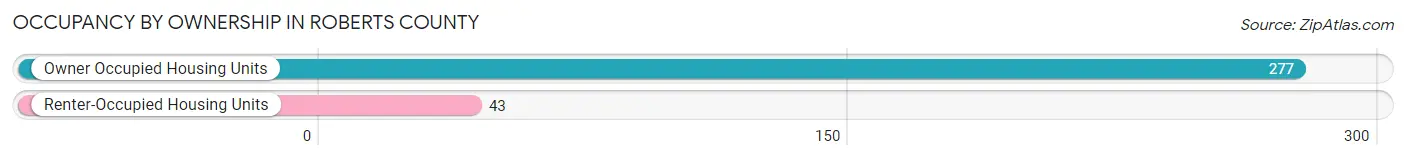
| Occupancy | # Housing Units | % Housing Units |
| Owner Occupied Housing Units | 277 | 86.6% |
| Renter-Occupied Housing Units | 43 | 13.4% |
| Total Occupied Housing Units | 320 | 100.0% |
Occupancy by Household Size in Roberts County
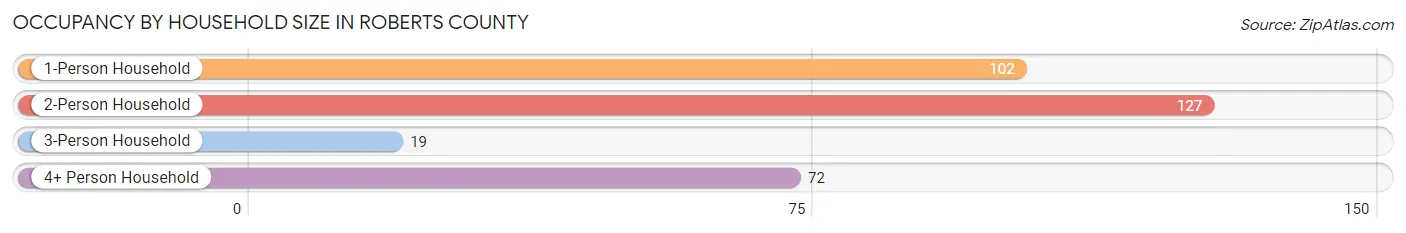
| Household Size | # Housing Units | % Housing Units |
| 1-Person Household | 102 | 31.9% |
| 2-Person Household | 127 | 39.7% |
| 3-Person Household | 19 | 5.9% |
| 4+ Person Household | 72 | 22.5% |
| Total Housing Units | 320 | 100.0% |
Occupancy by Ownership by Household Size in Roberts County
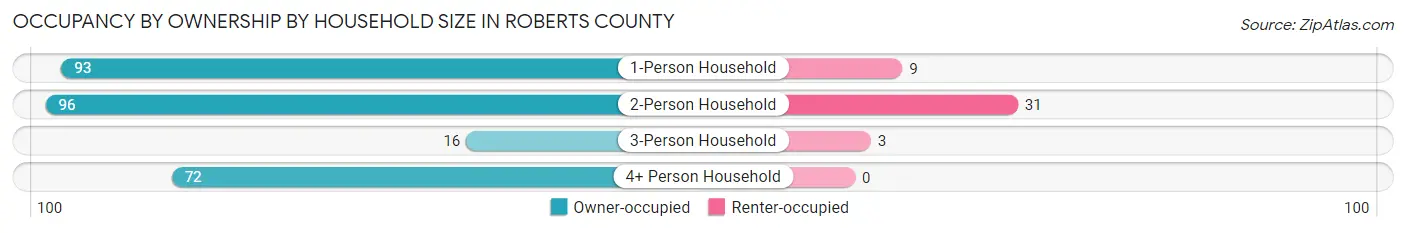
| Household Size | Owner-occupied | Renter-occupied |
| 1-Person Household | 93 (91.2%) | 9 (8.8%) |
| 2-Person Household | 96 (75.6%) | 31 (24.4%) |
| 3-Person Household | 16 (84.2%) | 3 (15.8%) |
| 4+ Person Household | 72 (100.0%) | 0 (0.0%) |
| Total Housing Units | 277 (86.6%) | 43 (13.4%) |
Occupancy by Educational Attainment in Roberts County
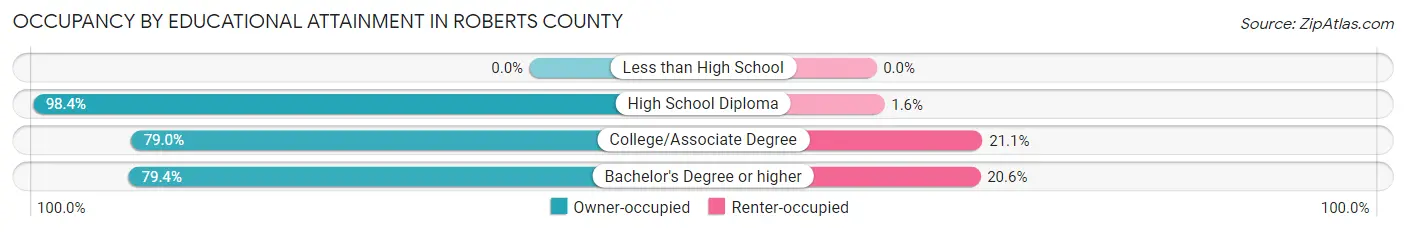
| Household Size | Owner-occupied | Renter-occupied |
| Less than High School | 0 (0.0%) | 0 (0.0%) |
| High School Diploma | 122 (98.4%) | 2 (1.6%) |
| College/Associate Degree | 105 (78.9%) | 28 (21.0%) |
| Bachelor's Degree or higher | 50 (79.4%) | 13 (20.6%) |
Occupancy by Age of Householder in Roberts County
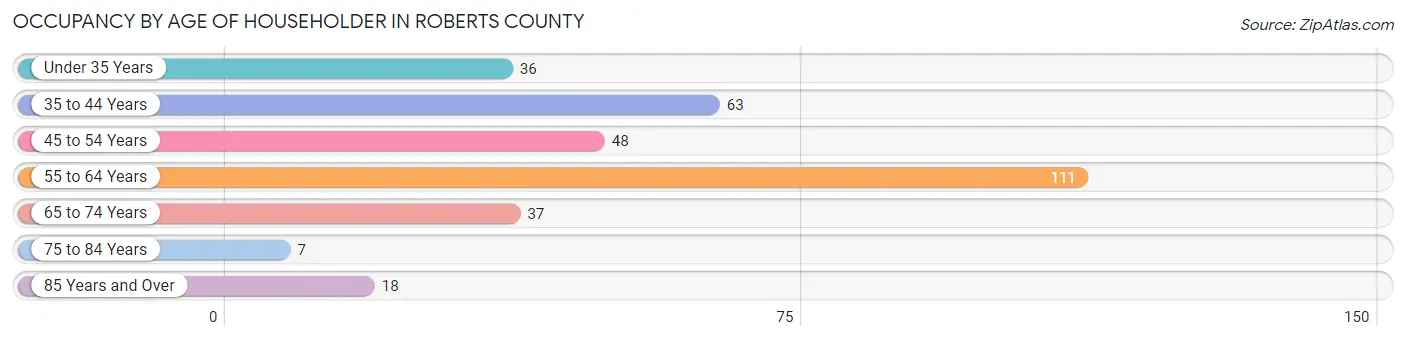
| Age Bracket | # Households | % Households |
| Under 35 Years | 36 | 11.3% |
| 35 to 44 Years | 63 | 19.7% |
| 45 to 54 Years | 48 | 15.0% |
| 55 to 64 Years | 111 | 34.7% |
| 65 to 74 Years | 37 | 11.6% |
| 75 to 84 Years | 7 | 2.2% |
| 85 Years and Over | 18 | 5.6% |
| Total | 320 | 100.0% |
Housing Finances in Roberts County
Median Income by Occupancy in Roberts County
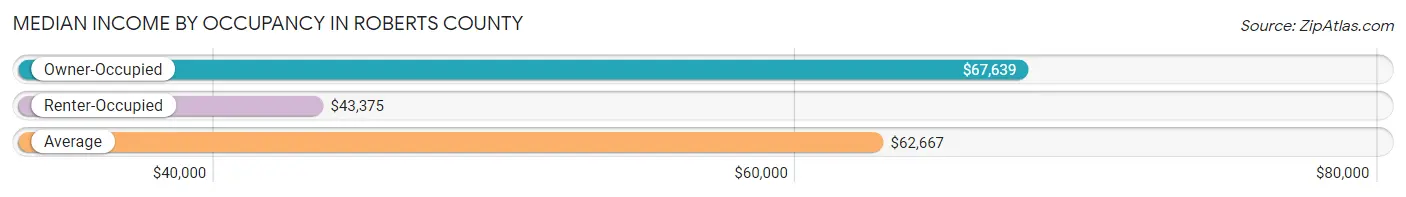
| Occupancy Type | # Households | Median Income |
| Owner-Occupied | 277 (86.6%) | $67,639 |
| Renter-Occupied | 43 (13.4%) | $43,375 |
| Average | 320 (100.0%) | $62,667 |
Occupancy by Householder Income Bracket in Roberts County
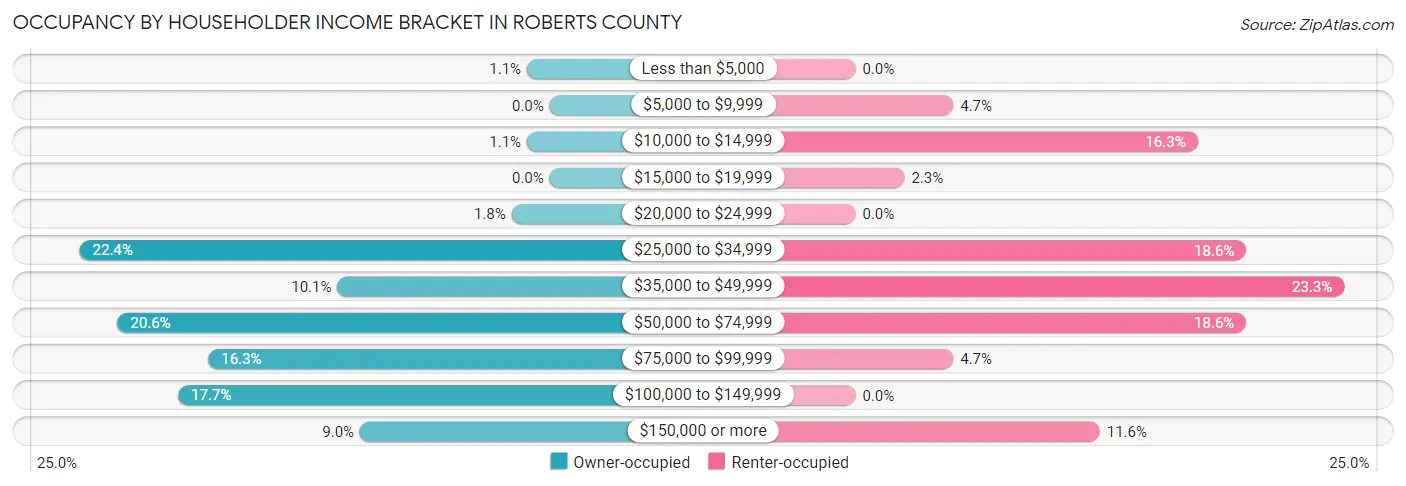
| Income Bracket | Owner-occupied | Renter-occupied |
| Less than $5,000 | 3 (1.1%) | 0 (0.0%) |
| $5,000 to $9,999 | 0 (0.0%) | 2 (4.6%) |
| $10,000 to $14,999 | 3 (1.1%) | 7 (16.3%) |
| $15,000 to $19,999 | 0 (0.0%) | 1 (2.3%) |
| $20,000 to $24,999 | 5 (1.8%) | 0 (0.0%) |
| $25,000 to $34,999 | 62 (22.4%) | 8 (18.6%) |
| $35,000 to $49,999 | 28 (10.1%) | 10 (23.3%) |
| $50,000 to $74,999 | 57 (20.6%) | 8 (18.6%) |
| $75,000 to $99,999 | 45 (16.3%) | 2 (4.6%) |
| $100,000 to $149,999 | 49 (17.7%) | 0 (0.0%) |
| $150,000 or more | 25 (9.0%) | 5 (11.6%) |
| Total | 277 (100.0%) | 43 (100.0%) |
Monthly Housing Cost Tiers in Roberts County
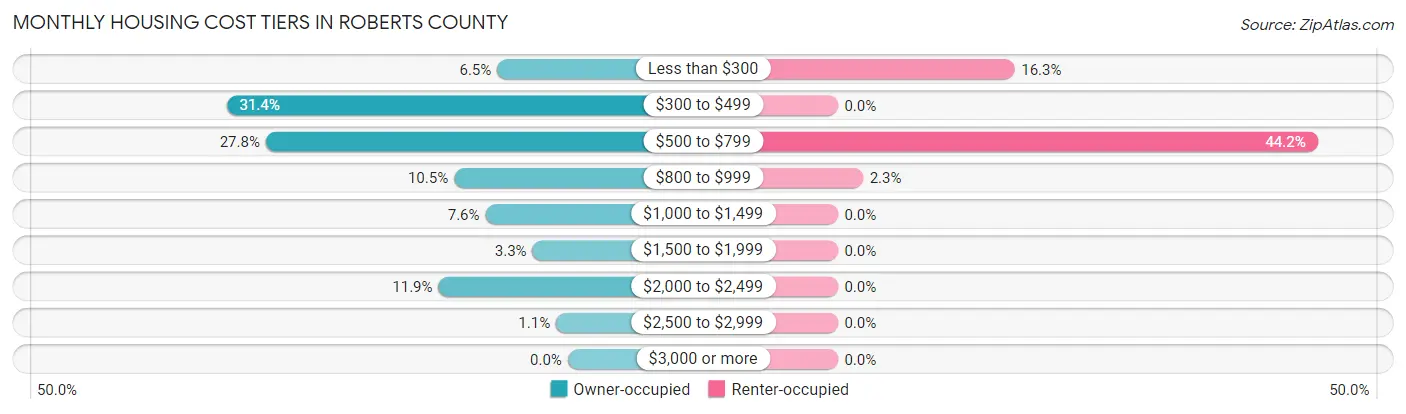
| Monthly Cost | Owner-occupied | Renter-occupied |
| Less than $300 | 18 (6.5%) | 7 (16.3%) |
| $300 to $499 | 87 (31.4%) | 0 (0.0%) |
| $500 to $799 | 77 (27.8%) | 19 (44.2%) |
| $800 to $999 | 29 (10.5%) | 1 (2.3%) |
| $1,000 to $1,499 | 21 (7.6%) | 0 (0.0%) |
| $1,500 to $1,999 | 9 (3.3%) | 0 (0.0%) |
| $2,000 to $2,499 | 33 (11.9%) | 0 (0.0%) |
| $2,500 to $2,999 | 3 (1.1%) | 0 (0.0%) |
| $3,000 or more | 0 (0.0%) | 0 (0.0%) |
| Total | 277 (100.0%) | 43 (100.0%) |
Physical Housing Characteristics in Roberts County
Housing Structures in Roberts County
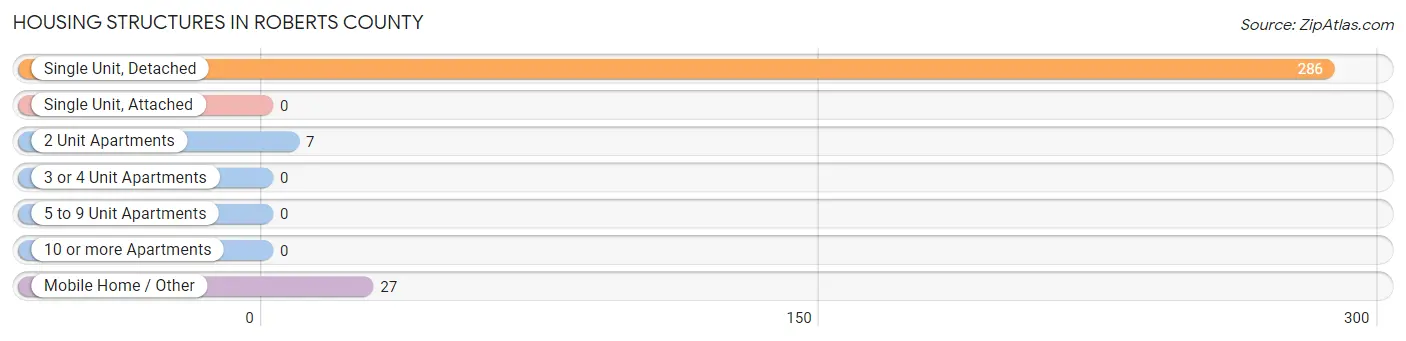
| Structure Type | # Housing Units | % Housing Units |
| Single Unit, Detached | 286 | 89.4% |
| Single Unit, Attached | 0 | 0.0% |
| 2 Unit Apartments | 7 | 2.2% |
| 3 or 4 Unit Apartments | 0 | 0.0% |
| 5 to 9 Unit Apartments | 0 | 0.0% |
| 10 or more Apartments | 0 | 0.0% |
| Mobile Home / Other | 27 | 8.4% |
| Total | 320 | 100.0% |
Housing Structures by Occupancy in Roberts County
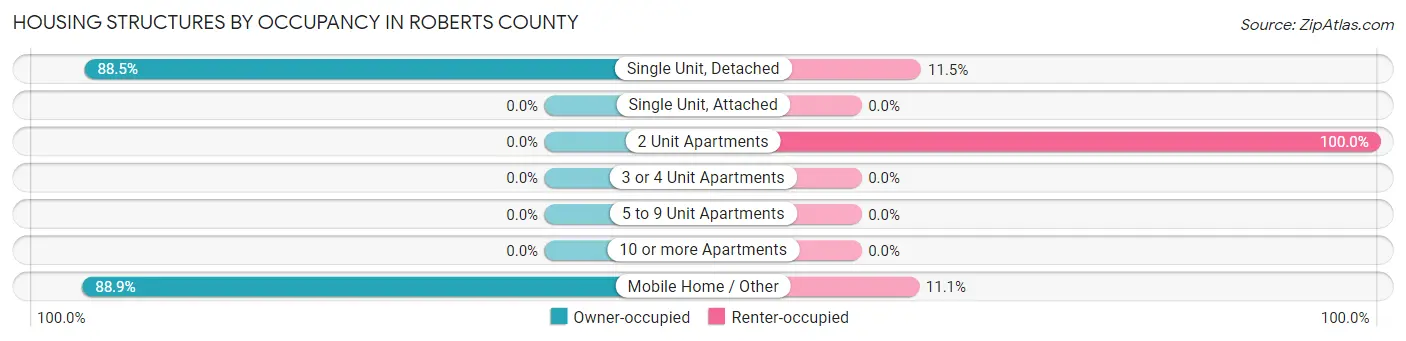
| Structure Type | Owner-occupied | Renter-occupied |
| Single Unit, Detached | 253 (88.5%) | 33 (11.5%) |
| Single Unit, Attached | 0 (0.0%) | 0 (0.0%) |
| 2 Unit Apartments | 0 (0.0%) | 7 (100.0%) |
| 3 or 4 Unit Apartments | 0 (0.0%) | 0 (0.0%) |
| 5 to 9 Unit Apartments | 0 (0.0%) | 0 (0.0%) |
| 10 or more Apartments | 0 (0.0%) | 0 (0.0%) |
| Mobile Home / Other | 24 (88.9%) | 3 (11.1%) |
| Total | 277 (86.6%) | 43 (13.4%) |
Housing Structures by Number of Rooms in Roberts County
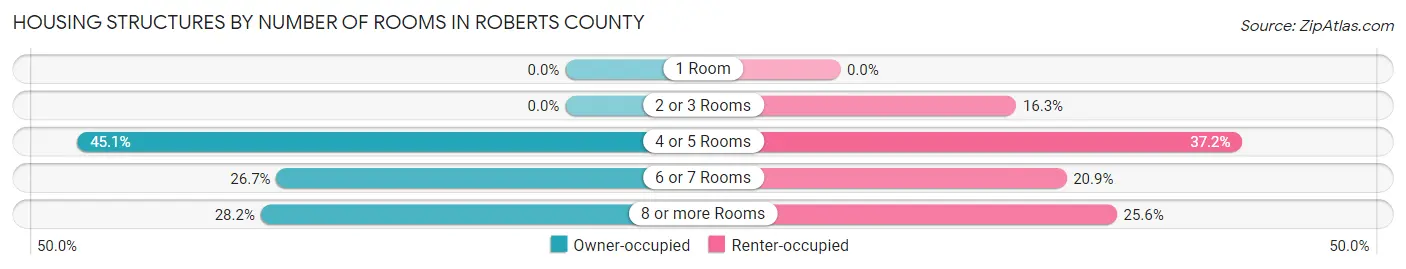
| Number of Rooms | Owner-occupied | Renter-occupied |
| 1 Room | 0 (0.0%) | 0 (0.0%) |
| 2 or 3 Rooms | 0 (0.0%) | 7 (16.3%) |
| 4 or 5 Rooms | 125 (45.1%) | 16 (37.2%) |
| 6 or 7 Rooms | 74 (26.7%) | 9 (20.9%) |
| 8 or more Rooms | 78 (28.2%) | 11 (25.6%) |
| Total | 277 (100.0%) | 43 (100.0%) |
Housing Structure by Heating Type in Roberts County
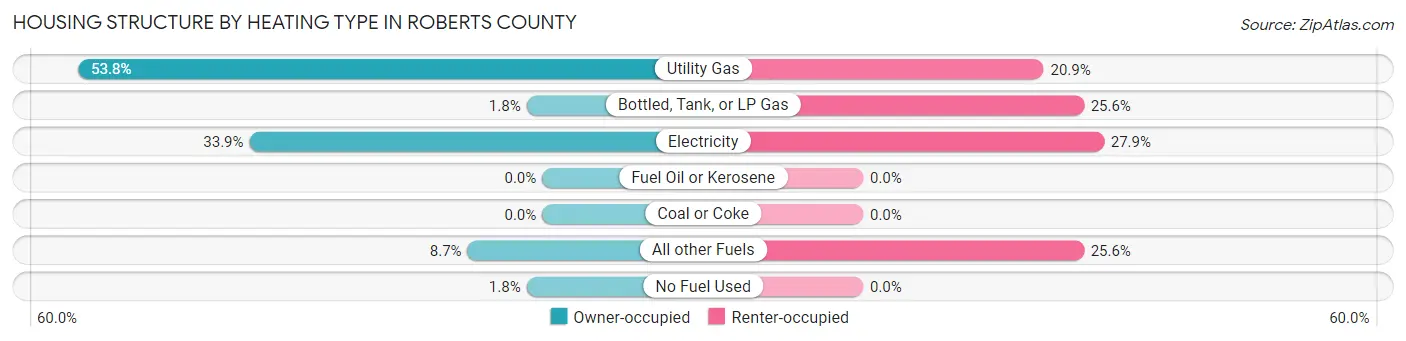
| Heating Type | Owner-occupied | Renter-occupied |
| Utility Gas | 149 (53.8%) | 9 (20.9%) |
| Bottled, Tank, or LP Gas | 5 (1.8%) | 11 (25.6%) |
| Electricity | 94 (33.9%) | 12 (27.9%) |
| Fuel Oil or Kerosene | 0 (0.0%) | 0 (0.0%) |
| Coal or Coke | 0 (0.0%) | 0 (0.0%) |
| All other Fuels | 24 (8.7%) | 11 (25.6%) |
| No Fuel Used | 5 (1.8%) | 0 (0.0%) |
| Total | 277 (100.0%) | 43 (100.0%) |
Household Vehicle Usage in Roberts County
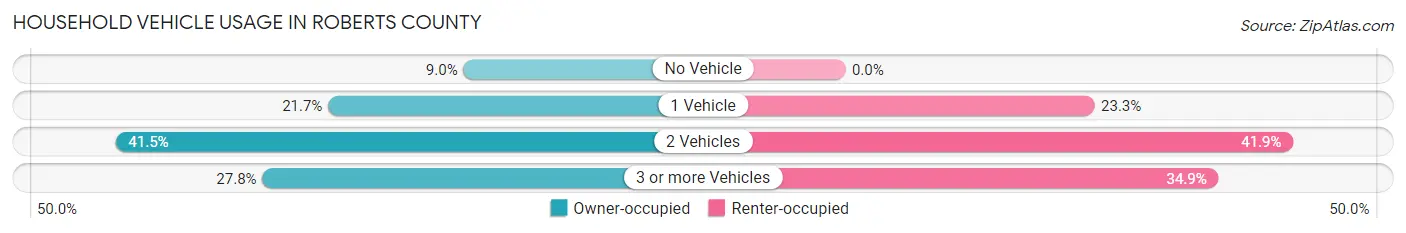
| Vehicles per Household | Owner-occupied | Renter-occupied |
| No Vehicle | 25 (9.0%) | 0 (0.0%) |
| 1 Vehicle | 60 (21.7%) | 10 (23.3%) |
| 2 Vehicles | 115 (41.5%) | 18 (41.9%) |
| 3 or more Vehicles | 77 (27.8%) | 15 (34.9%) |
| Total | 277 (100.0%) | 43 (100.0%) |
Real Estate & Mortgages in Roberts County
Real Estate and Mortgage Overview in Roberts County
| Characteristic | Without Mortgage | With Mortgage |
| Housing Units | 202 | 75 |
| Median Property Value | $126,800 | $255,000 |
| Median Household Income | $60,313 | $7 |
| Monthly Housing Costs | $490 | $0 |
| Real Estate Taxes | $1,359 | $0 |
Property Value by Mortgage Status in Roberts County
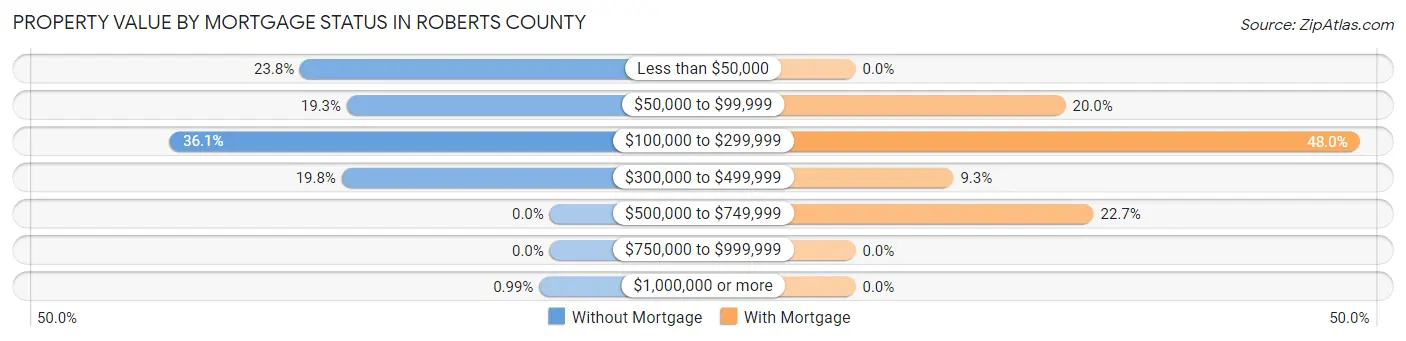
| Property Value | Without Mortgage | With Mortgage |
| Less than $50,000 | 48 (23.8%) | 0 (0.0%) |
| $50,000 to $99,999 | 39 (19.3%) | 15 (20.0%) |
| $100,000 to $299,999 | 73 (36.1%) | 36 (48.0%) |
| $300,000 to $499,999 | 40 (19.8%) | 7 (9.3%) |
| $500,000 to $749,999 | 0 (0.0%) | 17 (22.7%) |
| $750,000 to $999,999 | 0 (0.0%) | 0 (0.0%) |
| $1,000,000 or more | 2 (1.0%) | 0 (0.0%) |
| Total | 202 (100.0%) | 75 (100.0%) |
Household Income by Mortgage Status in Roberts County
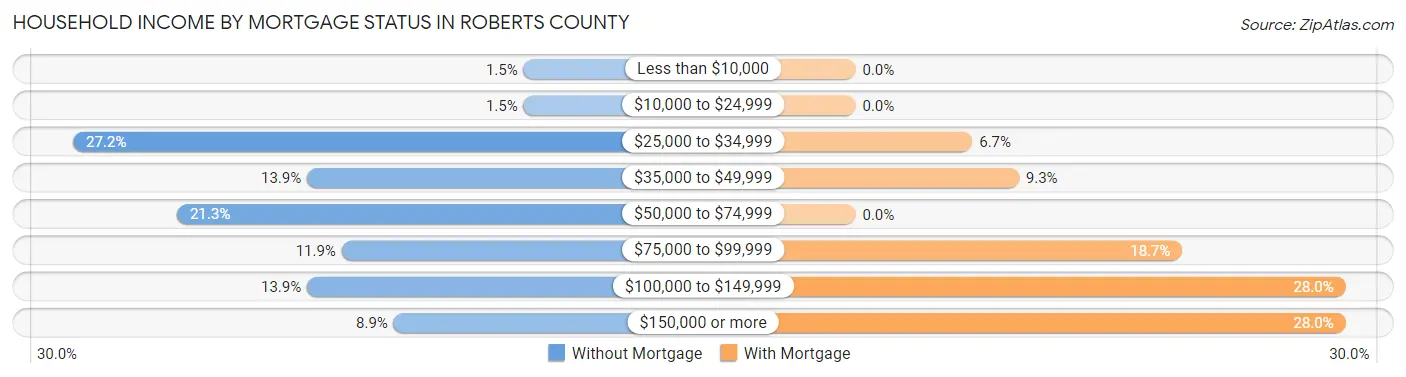
| Household Income | Without Mortgage | With Mortgage |
| Less than $10,000 | 3 (1.5%) | 0 (0.0%) |
| $10,000 to $24,999 | 3 (1.5%) | 0 (0.0%) |
| $25,000 to $34,999 | 55 (27.2%) | 5 (6.7%) |
| $35,000 to $49,999 | 28 (13.9%) | 7 (9.3%) |
| $50,000 to $74,999 | 43 (21.3%) | 0 (0.0%) |
| $75,000 to $99,999 | 24 (11.9%) | 14 (18.7%) |
| $100,000 to $149,999 | 28 (13.9%) | 21 (28.0%) |
| $150,000 or more | 18 (8.9%) | 21 (28.0%) |
| Total | 202 (100.0%) | 75 (100.0%) |
Property Value to Household Income Ratio in Roberts County
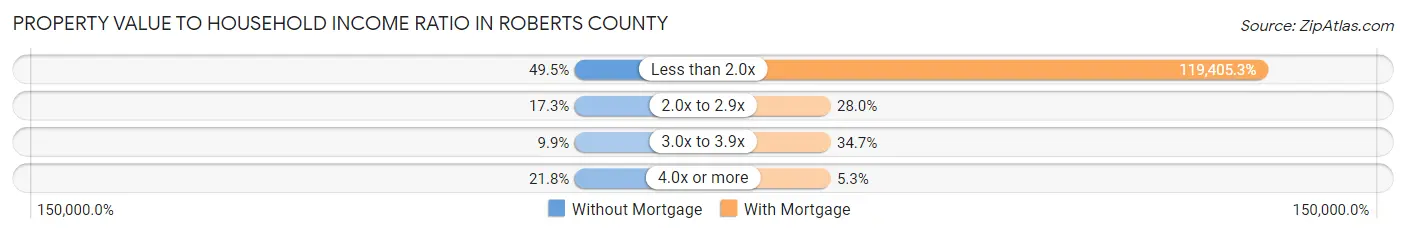
| Value-to-Income Ratio | Without Mortgage | With Mortgage |
| Less than 2.0x | 100 (49.5%) | 89,554 (119,405.3%) |
| 2.0x to 2.9x | 35 (17.3%) | 21 (28.0%) |
| 3.0x to 3.9x | 20 (9.9%) | 26 (34.7%) |
| 4.0x or more | 44 (21.8%) | 4 (5.3%) |
| Total | 202 (100.0%) | 75 (100.0%) |
Real Estate Taxes by Mortgage Status in Roberts County
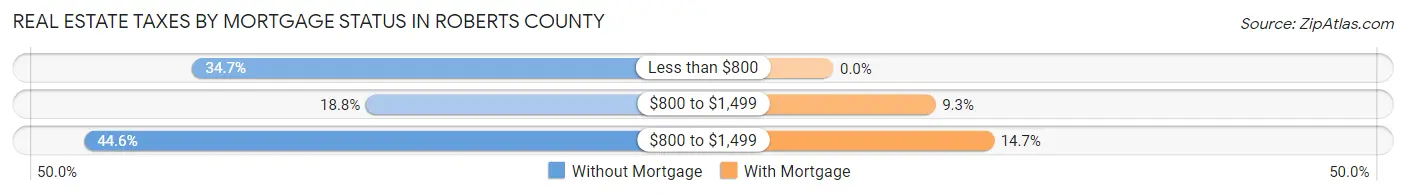
| Property Taxes | Without Mortgage | With Mortgage |
| Less than $800 | 70 (34.6%) | 0 (0.0%) |
| $800 to $1,499 | 38 (18.8%) | 7 (9.3%) |
| $800 to $1,499 | 90 (44.6%) | 11 (14.7%) |
| Total | 202 (100.0%) | 75 (100.0%) |
Health & Disability in Roberts County
Health Insurance Coverage by Age in Roberts County
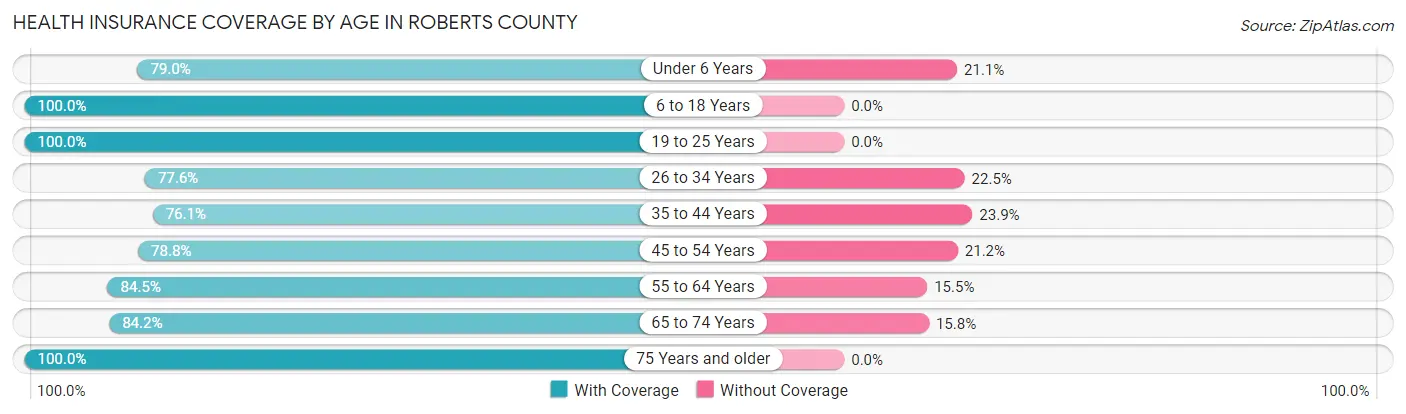
| Age Bracket | With Coverage | Without Coverage |
| Under 6 Years | 15 (78.9%) | 4 (21.0%) |
| 6 to 18 Years | 172 (100.0%) | 0 (0.0%) |
| 19 to 25 Years | 37 (100.0%) | 0 (0.0%) |
| 26 to 34 Years | 38 (77.5%) | 11 (22.5%) |
| 35 to 44 Years | 86 (76.1%) | 27 (23.9%) |
| 45 to 54 Years | 67 (78.8%) | 18 (21.2%) |
| 55 to 64 Years | 153 (84.5%) | 28 (15.5%) |
| 65 to 74 Years | 64 (84.2%) | 12 (15.8%) |
| 75 Years and older | 32 (100.0%) | 0 (0.0%) |
| Total | 664 (86.9%) | 100 (13.1%) |
Health Insurance Coverage by Citizenship Status in Roberts County
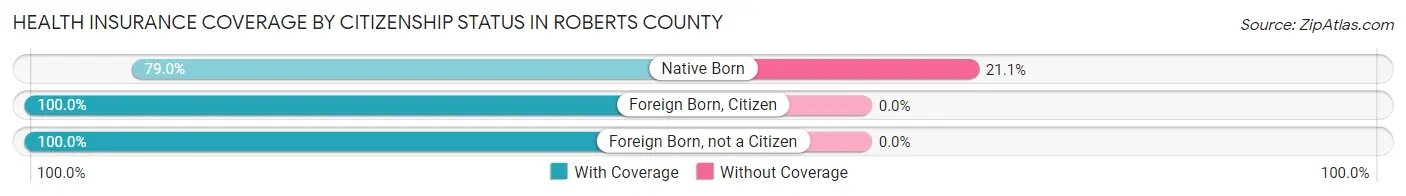
| Citizenship Status | With Coverage | Without Coverage |
| Native Born | 15 (78.9%) | 4 (21.0%) |
| Foreign Born, Citizen | 172 (100.0%) | 0 (0.0%) |
| Foreign Born, not a Citizen | 37 (100.0%) | 0 (0.0%) |
Health Insurance Coverage by Household Income in Roberts County
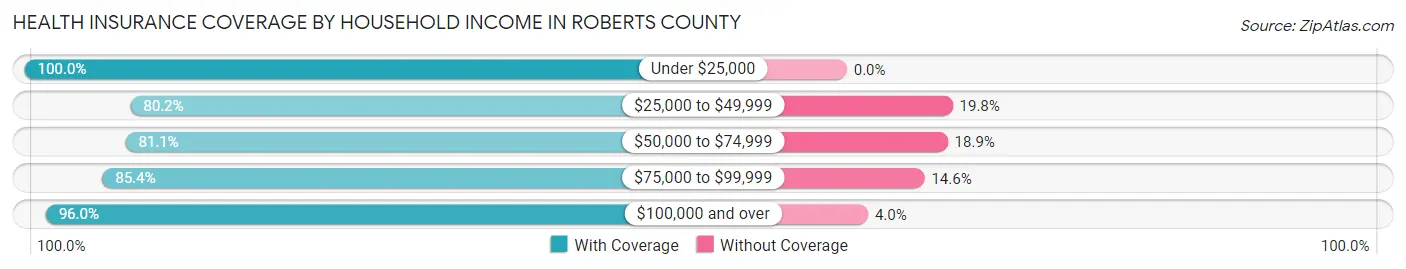
| Household Income | With Coverage | Without Coverage |
| Under $25,000 | 30 (100.0%) | 0 (0.0%) |
| $25,000 to $49,999 | 178 (80.2%) | 44 (19.8%) |
| $50,000 to $74,999 | 103 (81.1%) | 24 (18.9%) |
| $75,000 to $99,999 | 135 (85.4%) | 23 (14.6%) |
| $100,000 and over | 218 (96.0%) | 9 (4.0%) |
Public vs Private Health Insurance Coverage by Age in Roberts County
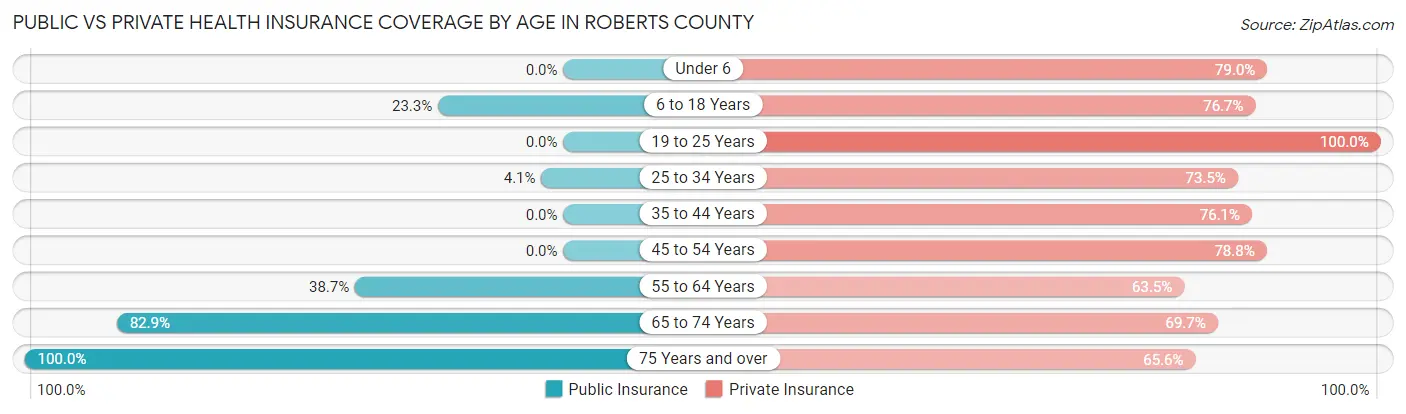
| Age Bracket | Public Insurance | Private Insurance |
| Under 6 | 0 (0.0%) | 15 (78.9%) |
| 6 to 18 Years | 40 (23.3%) | 132 (76.7%) |
| 19 to 25 Years | 0 (0.0%) | 37 (100.0%) |
| 25 to 34 Years | 2 (4.1%) | 36 (73.5%) |
| 35 to 44 Years | 0 (0.0%) | 86 (76.1%) |
| 45 to 54 Years | 0 (0.0%) | 67 (78.8%) |
| 55 to 64 Years | 70 (38.7%) | 115 (63.5%) |
| 65 to 74 Years | 63 (82.9%) | 53 (69.7%) |
| 75 Years and over | 32 (100.0%) | 21 (65.6%) |
| Total | 207 (27.1%) | 562 (73.6%) |
Disability Status by Sex by Age in Roberts County
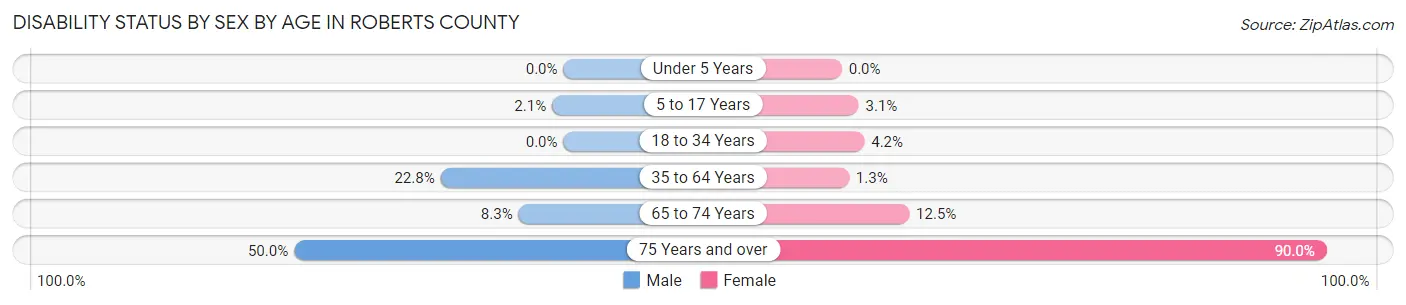
| Age Bracket | Male | Female |
| Under 5 Years | 0 (0.0%) | 0 (0.0%) |
| 5 to 17 Years | 2 (2.1%) | 2 (3.1%) |
| 18 to 34 Years | 0 (0.0%) | 2 (4.2%) |
| 35 to 64 Years | 52 (22.8%) | 2 (1.3%) |
| 65 to 74 Years | 3 (8.3%) | 5 (12.5%) |
| 75 Years and over | 6 (50.0%) | 18 (90.0%) |
Disability Class by Sex by Age in Roberts County
Disability Class: Hearing Difficulty
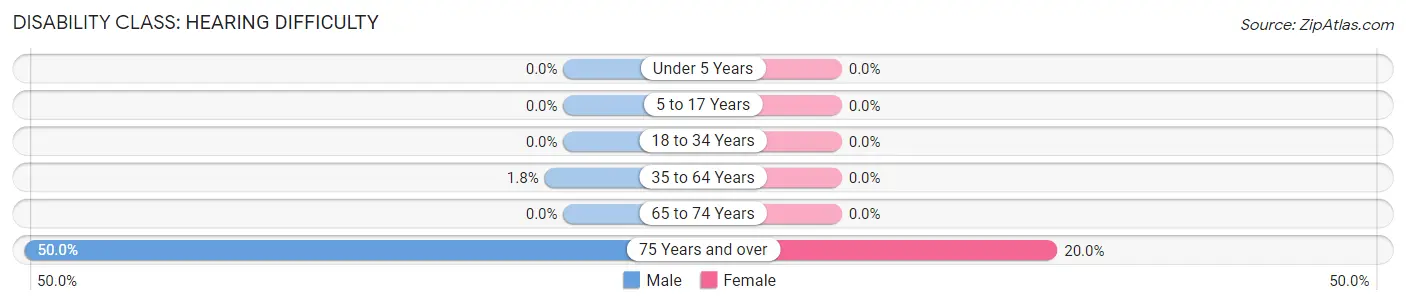
| Age Bracket | Male | Female |
| Under 5 Years | 0 (0.0%) | 0 (0.0%) |
| 5 to 17 Years | 0 (0.0%) | 0 (0.0%) |
| 18 to 34 Years | 0 (0.0%) | 0 (0.0%) |
| 35 to 64 Years | 4 (1.8%) | 0 (0.0%) |
| 65 to 74 Years | 0 (0.0%) | 0 (0.0%) |
| 75 Years and over | 6 (50.0%) | 4 (20.0%) |
Disability Class: Vision Difficulty
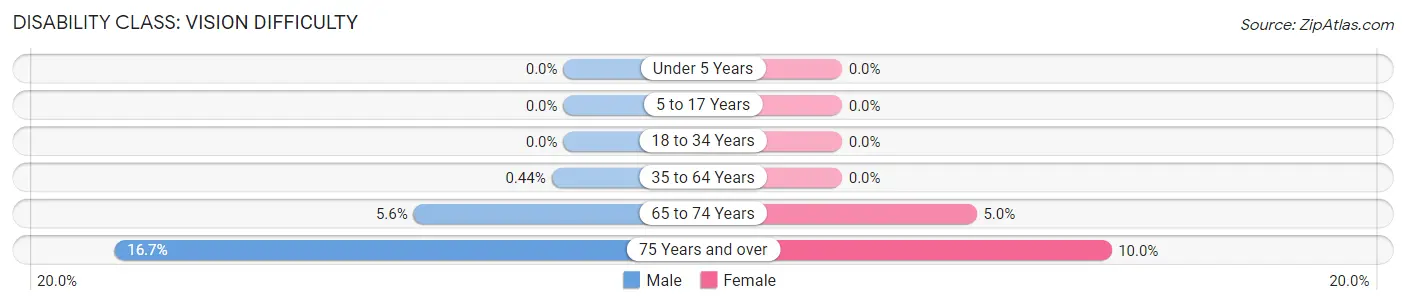
| Age Bracket | Male | Female |
| Under 5 Years | 0 (0.0%) | 0 (0.0%) |
| 5 to 17 Years | 0 (0.0%) | 0 (0.0%) |
| 18 to 34 Years | 0 (0.0%) | 0 (0.0%) |
| 35 to 64 Years | 1 (0.4%) | 0 (0.0%) |
| 65 to 74 Years | 2 (5.6%) | 2 (5.0%) |
| 75 Years and over | 2 (16.7%) | 2 (10.0%) |
Disability Class: Cognitive Difficulty
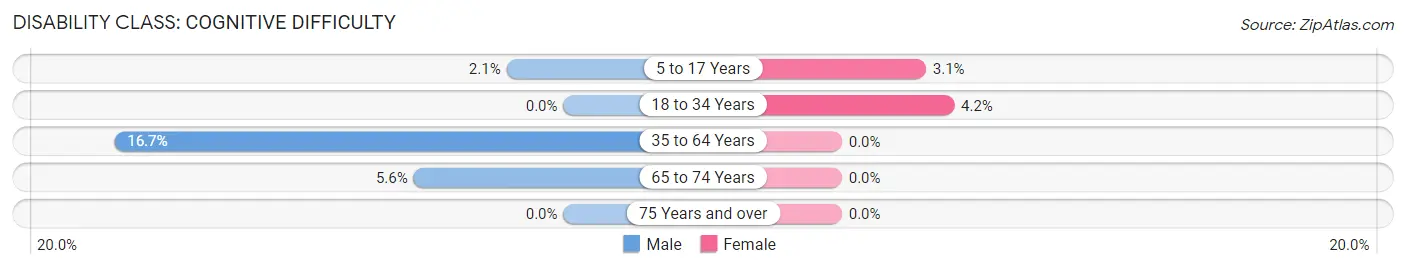
| Age Bracket | Male | Female |
| 5 to 17 Years | 2 (2.1%) | 2 (3.1%) |
| 18 to 34 Years | 0 (0.0%) | 2 (4.2%) |
| 35 to 64 Years | 38 (16.7%) | 0 (0.0%) |
| 65 to 74 Years | 2 (5.6%) | 0 (0.0%) |
| 75 Years and over | 0 (0.0%) | 0 (0.0%) |
Disability Class: Ambulatory Difficulty
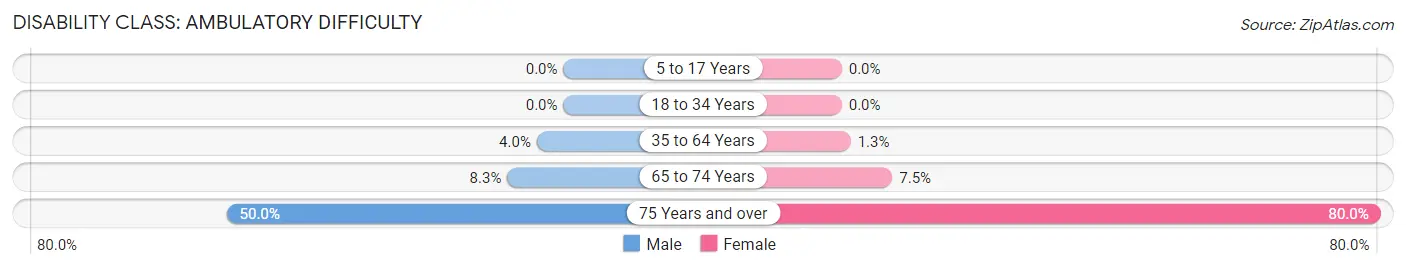
| Age Bracket | Male | Female |
| 5 to 17 Years | 0 (0.0%) | 0 (0.0%) |
| 18 to 34 Years | 0 (0.0%) | 0 (0.0%) |
| 35 to 64 Years | 9 (4.0%) | 2 (1.3%) |
| 65 to 74 Years | 3 (8.3%) | 3 (7.5%) |
| 75 Years and over | 6 (50.0%) | 16 (80.0%) |
Disability Class: Self-Care Difficulty
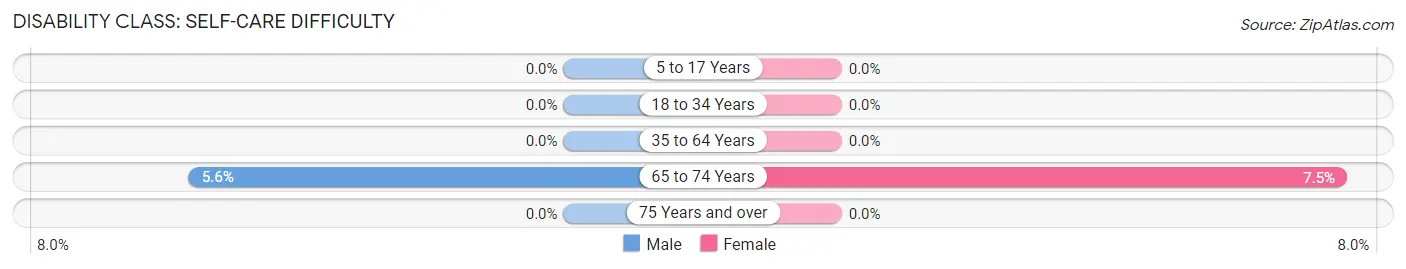
| Age Bracket | Male | Female |
| 5 to 17 Years | 0 (0.0%) | 0 (0.0%) |
| 18 to 34 Years | 0 (0.0%) | 0 (0.0%) |
| 35 to 64 Years | 0 (0.0%) | 0 (0.0%) |
| 65 to 74 Years | 2 (5.6%) | 3 (7.5%) |
| 75 Years and over | 0 (0.0%) | 0 (0.0%) |
Technology Access in Roberts County
Computing Device Access in Roberts County
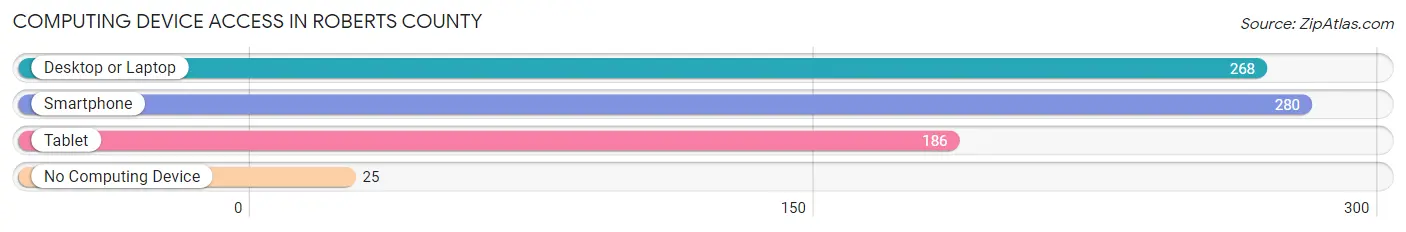
| Device Type | # Households | % Households |
| Desktop or Laptop | 268 | 83.8% |
| Smartphone | 280 | 87.5% |
| Tablet | 186 | 58.1% |
| No Computing Device | 25 | 7.8% |
| Total | 320 | 100.0% |
Internet Access in Roberts County
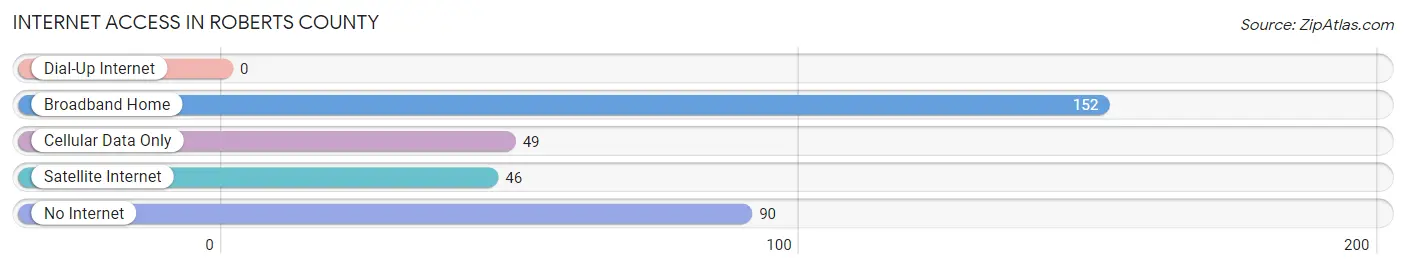
| Internet Type | # Households | % Households |
| Dial-Up Internet | 0 | 0.0% |
| Broadband Home | 152 | 47.5% |
| Cellular Data Only | 49 | 15.3% |
| Satellite Internet | 46 | 14.4% |
| No Internet | 90 | 28.1% |
| Total | 320 | 100.0% |
Roberts County Summary
Roberts County is located in the northern part of the Texas Panhandle, in the United States. It is bordered by Ochiltree County to the north, Lipscomb County to the east, Hemphill County to the south, and Hutchinson County to the west. The county seat is Miami, and the largest city is Pampa. The county was created in 1876 and organized in 1889. It is named for Oran Milo Roberts, a former governor of Texas.
Geography
Roberts County covers an area of 902 square miles, of which 899 square miles is land and 3 square miles is water. The terrain is mostly flat, with some rolling hills in the western part of the county. The Canadian River forms the northern boundary of the county. The county is part of the High Plains region of Texas, and is mostly covered in grasslands.
Demographics
As of the 2010 census, the population of Roberts County was 829, making it the second-least populous county in Texas. The population density was 0.9 people per square mile. The racial makeup of the county was 81.3% White, 0.2% African American, 0.7% Native American, 0.2% Asian, 0.1% Pacific Islander, 15.7% from other races, and 1.8% from two or more races. Hispanic or Latino of any race were 33.2% of the population.
The median income for a household in the county was $31,250, and the median income for a family was $35,000. The per capita income for the county was $15,845. About 17.2% of families and 20.2% of the population were below the poverty line, including 25.2% of those under age 18 and 16.2% of those age 65 or over.
Economy
Agriculture is the main economic activity in Roberts County. The county is home to a large number of cattle ranches, and the main crops grown are wheat, sorghum, and hay. Oil and gas production is also an important part of the economy.
The county is served by two airports, the Pampa Municipal Airport and the Miami Municipal Airport. The county is also served by two railroads, the Burlington Northern Santa Fe Railway and the Union Pacific Railroad.
History
The area that is now Roberts County was first inhabited by Native American tribes, including the Comanche, Kiowa, and Apache. The first European settlers arrived in the area in the late 19th century, and the county was officially organized in 1889.
The county was named for Oran Milo Roberts, a former governor of Texas. The county seat was originally located in the town of Old Miami, but was moved to the town of Miami in 1891.
In the early 20th century, the county was a major producer of cotton, and the town of Pampa became a major center of the oil and gas industry. The county also became a major producer of wheat and other grains.
Today, Roberts County is a rural county with a population of just over 800 people. The county is still largely agricultural, and the main crops are wheat, sorghum, and hay. Oil and gas production is also an important part of the economy.
Common Questions
What is Per Capita Income in Roberts County?
Per Capita income in Roberts County is $32,250.
What is the Median Family Income in Roberts County?
Median Family Income in Roberts County is $67,361.
What is the Median Household income in Roberts County?
Median Household Income in Roberts County is $62,667.
What is Income or Wage Gap in Roberts County?
Income or Wage Gap in Roberts County is 28.0%.
Women in Roberts County earn 72.0 cents for every dollar earned by a man.
What is Inequality or Gini Index in Roberts County?
Inequality or Gini Index in Roberts County is 0.38.
What is the Total Population of Roberts County?
Total Population of Roberts County is 764.
What is the Total Male Population of Roberts County?
Total Male Population of Roberts County is 422.
What is the Total Female Population of Roberts County?
Total Female Population of Roberts County is 342.
What is the Ratio of Males per 100 Females in Roberts County?
There are 123.39 Males per 100 Females in Roberts County.
What is the Ratio of Females per 100 Males in Roberts County?
There are 81.04 Females per 100 Males in Roberts County.
What is the Median Population Age in Roberts County?
Median Population Age in Roberts County is 42.5 Years.
What is the Average Family Size in Roberts County
Average Family Size in Roberts County is 3.0 People.
What is the Average Household Size in Roberts County
Average Household Size in Roberts County is 2.4 People.
How Large is the Labor Force in Roberts County?
There are 400 People in the Labor Forcein in Roberts County.
What is the Percentage of People in the Labor Force in Roberts County?
66.2% of People are in the Labor Force in Roberts County.
What is the Unemployment Rate in Roberts County?
Unemployment Rate in Roberts County is 0.5%.