Refugio County, TX Map & Demographics
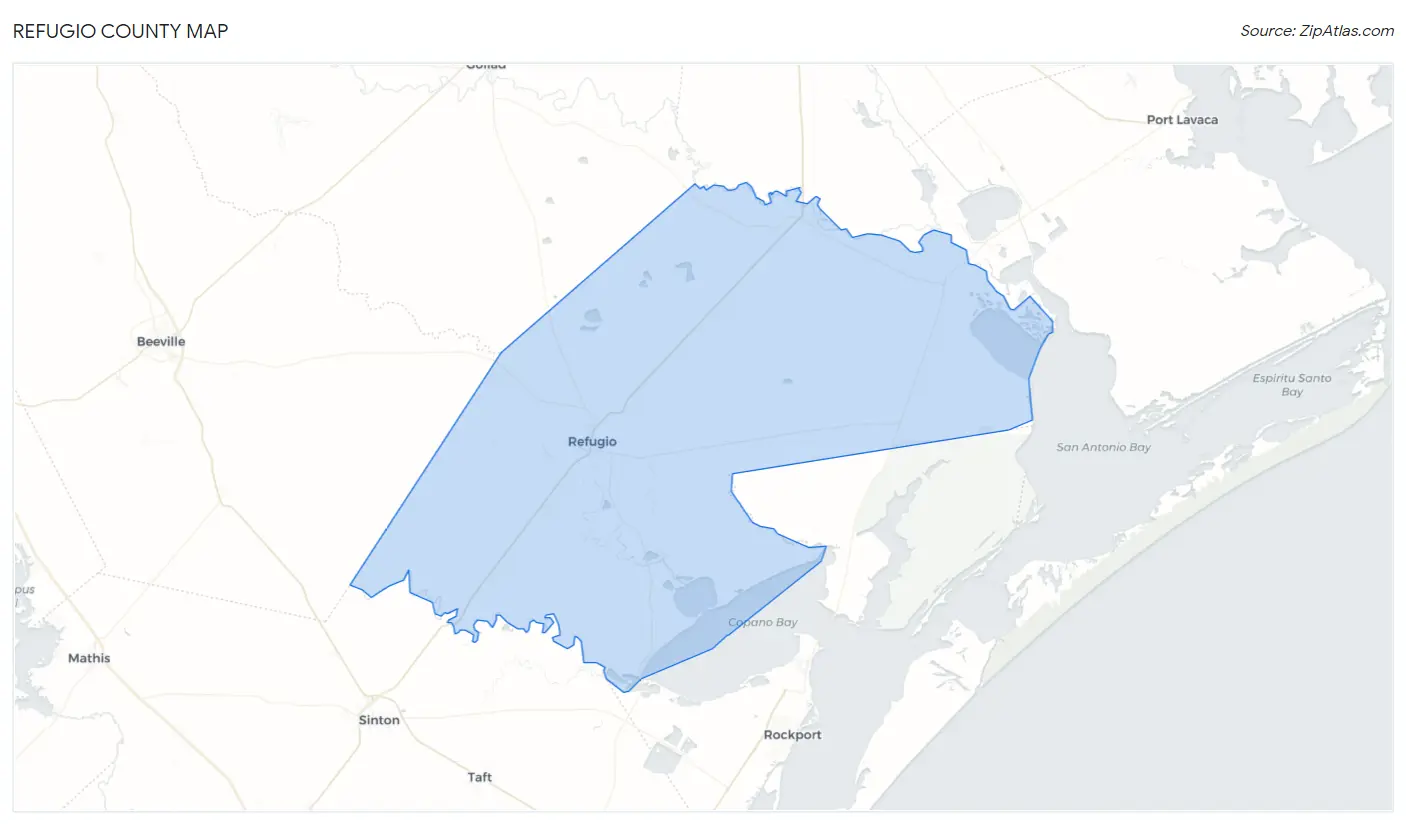
Refugio County Map
Refugio County Overview
$27,103
PER CAPITA INCOME
$58,807
AVG FAMILY INCOME
$54,304
AVG HOUSEHOLD INCOME
17.5%
WAGE / INCOME GAP [ % ]
82.5¢/ $1
WAGE / INCOME GAP [ $ ]
0.46
INEQUALITY / GINI INDEX
6,718
TOTAL POPULATION
3,179
MALE POPULATION
3,539
FEMALE POPULATION
89.83
MALES / 100 FEMALES
111.32
FEMALES / 100 MALES
42.9
MEDIAN AGE
3.9
AVG FAMILY SIZE
2.9
AVG HOUSEHOLD SIZE
2,768
LABOR FORCE [ PEOPLE ]
51.2%
PERCENT IN LABOR FORCE
5.6%
UNEMPLOYMENT RATE
Refugio County Area Codes
Income in Refugio County
Income Overview in Refugio County
Per Capita Income in Refugio County is $27,103, while median incomes of families and households are $58,807 and $54,304 respectively.
| Characteristic | Number | Measure |
| Per Capita Income | 6,718 | $27,103 |
| Median Family Income | 1,432 | $58,807 |
| Mean Family Income | 1,432 | $71,906 |
| Median Household Income | 2,235 | $54,304 |
| Mean Household Income | 2,235 | $67,596 |
| Income Deficit | 1,432 | $0 |
| Wage / Income Gap (%) | 6,718 | 17.51% |
| Wage / Income Gap ($) | 6,718 | 82.49¢ per $1 |
| Gini / Inequality Index | 6,718 | 0.46 |
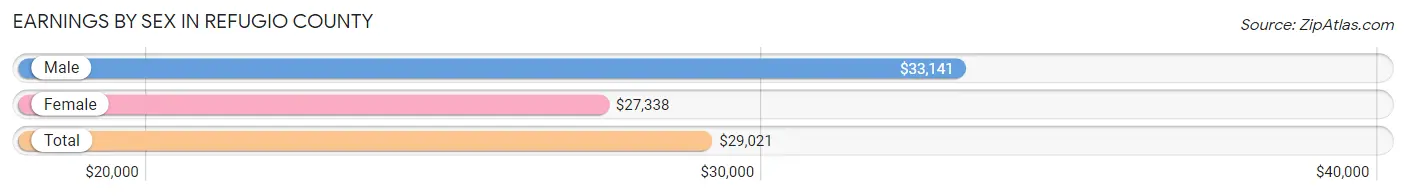
Earnings by Sex in Refugio County
Average Earnings in Refugio County are $29,021, $33,141 for men and $27,338 for women, a difference of 17.5%.
| Sex | Number | Average Earnings |
| Male | 1,566 (54.2%) | $33,141 |
| Female | 1,323 (45.8%) | $27,338 |
| Total | 2,889 (100.0%) | $29,021 |
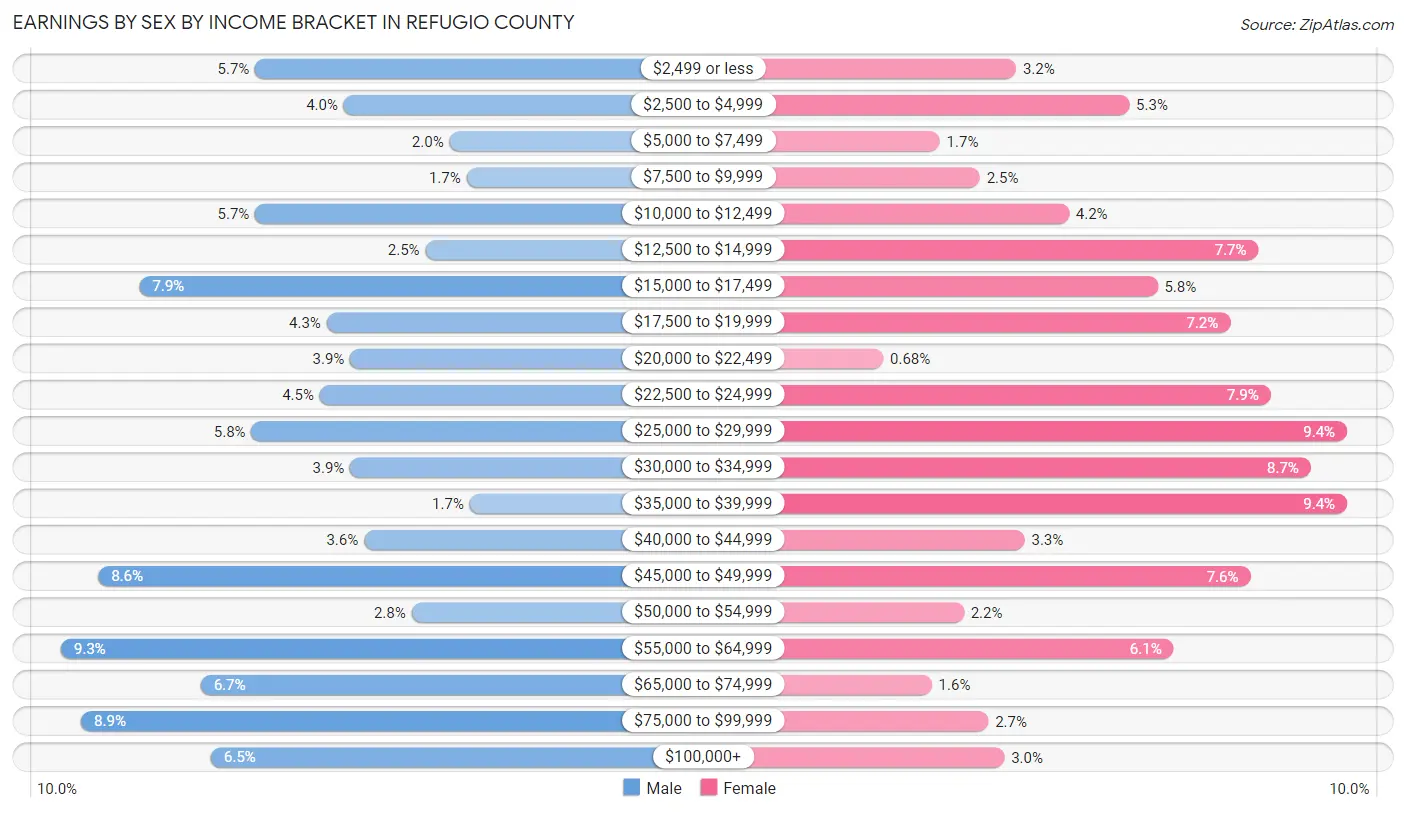
Earnings by Sex by Income Bracket in Refugio County
The most common earnings brackets in Refugio County are $55,000 to $64,999 for men (146 | 9.3%) and $25,000 to $29,999 for women (124 | 9.4%).
| Income | Male | Female |
| $2,499 or less | 89 (5.7%) | 42 (3.2%) |
| $2,500 to $4,999 | 63 (4.0%) | 70 (5.3%) |
| $5,000 to $7,499 | 32 (2.0%) | 23 (1.7%) |
| $7,500 to $9,999 | 27 (1.7%) | 33 (2.5%) |
| $10,000 to $12,499 | 89 (5.7%) | 55 (4.2%) |
| $12,500 to $14,999 | 39 (2.5%) | 102 (7.7%) |
| $15,000 to $17,499 | 123 (7.9%) | 77 (5.8%) |
| $17,500 to $19,999 | 68 (4.3%) | 95 (7.2%) |
| $20,000 to $22,499 | 61 (3.9%) | 9 (0.7%) |
| $22,500 to $24,999 | 70 (4.5%) | 105 (7.9%) |
| $25,000 to $29,999 | 90 (5.8%) | 124 (9.4%) |
| $30,000 to $34,999 | 61 (3.9%) | 115 (8.7%) |
| $35,000 to $39,999 | 26 (1.7%) | 124 (9.4%) |
| $40,000 to $44,999 | 57 (3.6%) | 44 (3.3%) |
| $45,000 to $49,999 | 135 (8.6%) | 100 (7.6%) |
| $50,000 to $54,999 | 43 (2.8%) | 29 (2.2%) |
| $55,000 to $64,999 | 146 (9.3%) | 81 (6.1%) |
| $65,000 to $74,999 | 105 (6.7%) | 21 (1.6%) |
| $75,000 to $99,999 | 140 (8.9%) | 35 (2.6%) |
| $100,000+ | 102 (6.5%) | 39 (2.9%) |
| Total | 1,566 (100.0%) | 1,323 (100.0%) |
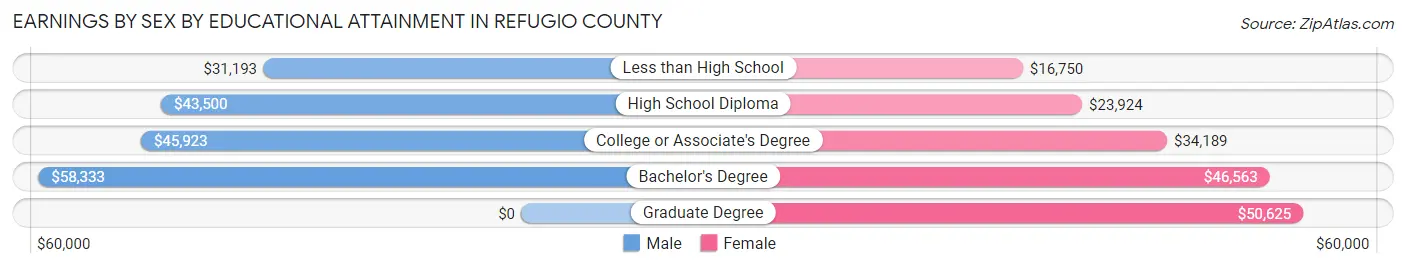
Earnings by Sex by Educational Attainment in Refugio County
Average earnings in Refugio County are $45,400 for men and $29,625 for women, a difference of 34.7%. Men with an educational attainment of bachelor's degree enjoy the highest average annual earnings of $58,333, while those with less than high school education earn the least with $31,193. Women with an educational attainment of graduate degree earn the most with the average annual earnings of $50,625, while those with less than high school education have the smallest earnings of $16,750.
| Educational Attainment | Male Income | Female Income |
| Less than High School | $31,193 | $16,750 |
| High School Diploma | $43,500 | $23,924 |
| College or Associate's Degree | $45,923 | $34,189 |
| Bachelor's Degree | $58,333 | $46,563 |
| Graduate Degree | - | - |
| Total | $45,400 | $29,625 |
Family Income in Refugio County
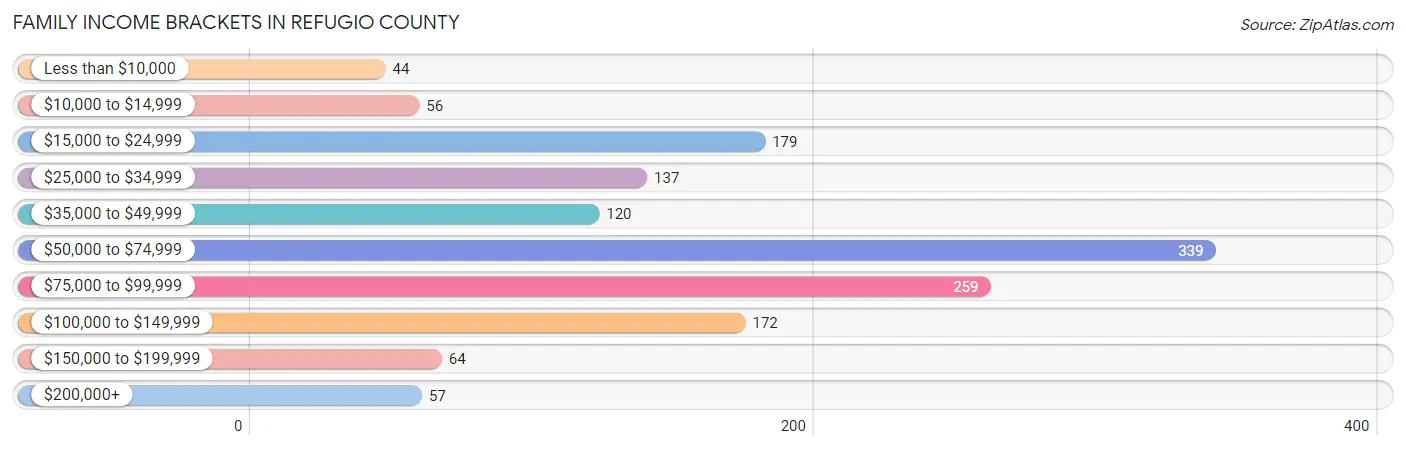
Family Income Brackets in Refugio County
According to the Refugio County family income data, there are 339 families falling into the $50,000 to $74,999 income range, which is the most common income bracket and makes up 23.7% of all families. Conversely, the less than $10,000 income bracket is the least frequent group with only 44 families (3.1%) belonging to this category.
| Income Bracket | # Families | % Families |
| Less than $10,000 | 44 | 3.1% |
| $10,000 to $14,999 | 56 | 3.9% |
| $15,000 to $24,999 | 179 | 12.5% |
| $25,000 to $34,999 | 137 | 9.6% |
| $35,000 to $49,999 | 120 | 8.4% |
| $50,000 to $74,999 | 339 | 23.7% |
| $75,000 to $99,999 | 259 | 18.1% |
| $100,000 to $149,999 | 172 | 12.0% |
| $150,000 to $199,999 | 64 | 4.5% |
| $200,000+ | 57 | 4.0% |
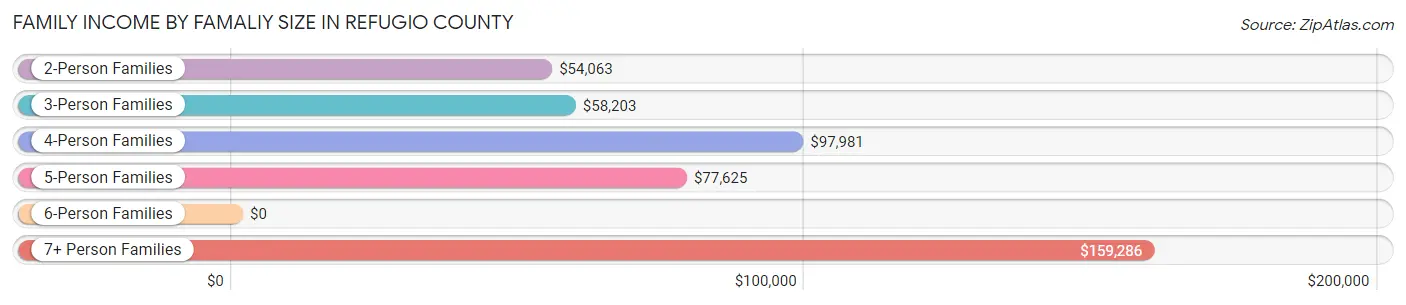
Family Income by Famaliy Size in Refugio County
7+ person families (26 | 1.8%) account for the highest median family income in Refugio County with $159,286 per family, while 2-person families (702 | 49.0%) have the highest median income of $27,032 per family member.
| Income Bracket | # Families | Median Income |
| 2-Person Families | 702 (49.0%) | $54,063 |
| 3-Person Families | 412 (28.8%) | $58,203 |
| 4-Person Families | 139 (9.7%) | $97,981 |
| 5-Person Families | 107 (7.5%) | $77,625 |
| 6-Person Families | 46 (3.2%) | $0 |
| 7+ Person Families | 26 (1.8%) | $159,286 |
| Total | 1,432 (100.0%) | $58,807 |
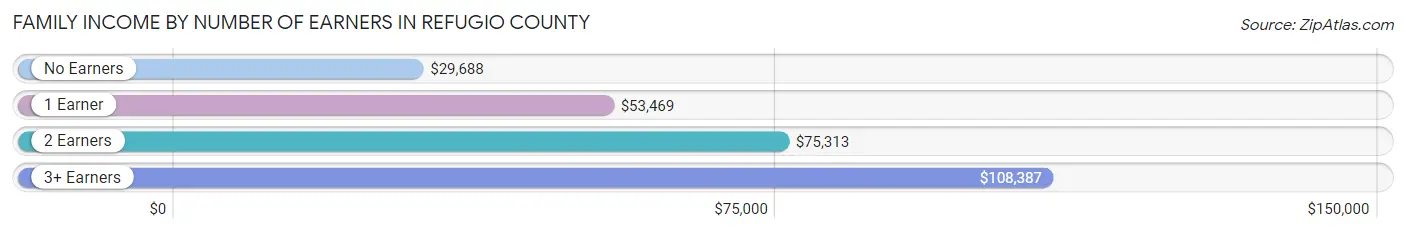
Family Income by Number of Earners in Refugio County
The median family income in Refugio County is $58,807, with families comprising 3+ earners (168) having the highest median family income of $108,387, while families with no earners (342) have the lowest median family income of $29,688, accounting for 11.7% and 23.9% of families, respectively.
| Number of Earners | # Families | Median Income |
| No Earners | 342 (23.9%) | $29,688 |
| 1 Earner | 460 (32.1%) | $53,469 |
| 2 Earners | 462 (32.3%) | $75,313 |
| 3+ Earners | 168 (11.7%) | $108,387 |
| Total | 1,432 (100.0%) | $58,807 |
Household Income in Refugio County
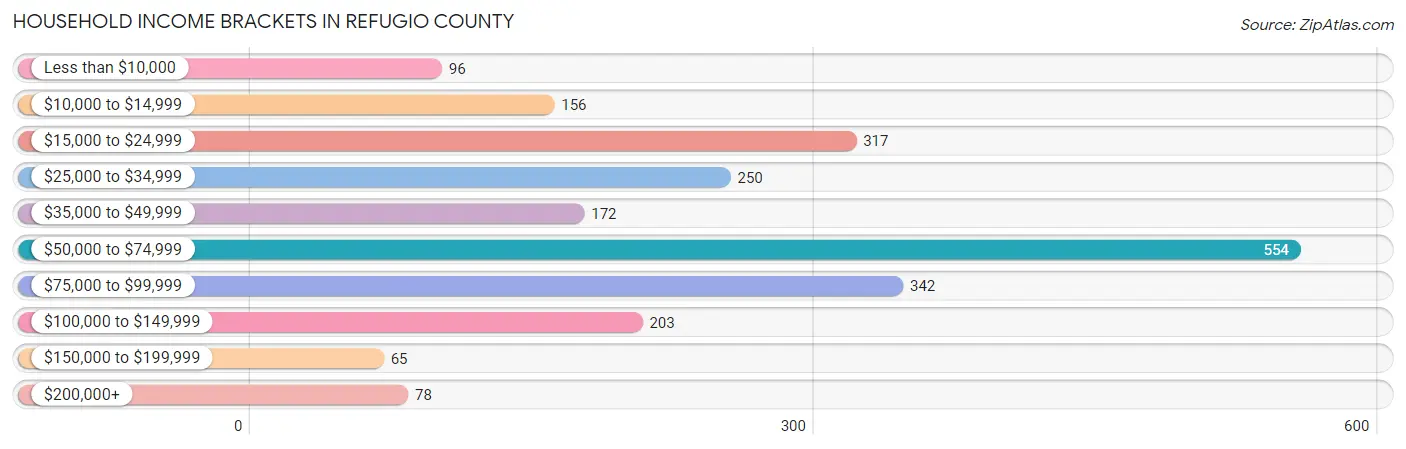
Household Income Brackets in Refugio County
With 554 households falling in the category, the $50,000 to $74,999 income range is the most frequent in Refugio County, accounting for 24.8% of all households. In contrast, only 65 households (2.9%) fall into the $150,000 to $199,999 income bracket, making it the least populous group.
| Income Bracket | # Households | % Households |
| Less than $10,000 | 96 | 4.3% |
| $10,000 to $14,999 | 156 | 7.0% |
| $15,000 to $24,999 | 317 | 14.2% |
| $25,000 to $34,999 | 250 | 11.2% |
| $35,000 to $49,999 | 172 | 7.7% |
| $50,000 to $74,999 | 554 | 24.8% |
| $75,000 to $99,999 | 342 | 15.3% |
| $100,000 to $149,999 | 203 | 9.1% |
| $150,000 to $199,999 | 65 | 2.9% |
| $200,000+ | 78 | 3.5% |
Household Income by Householder Age in Refugio County
The median household income in Refugio County is $54,304, with the highest median household income of $55,515 found in the 45 to 64 years age bracket for the primary householder. A total of 801 households (35.8%) fall into this category. Meanwhile, the 15 to 24 years age bracket for the primary householder has the lowest median household income of $0, with 18 households (0.8%) in this group.
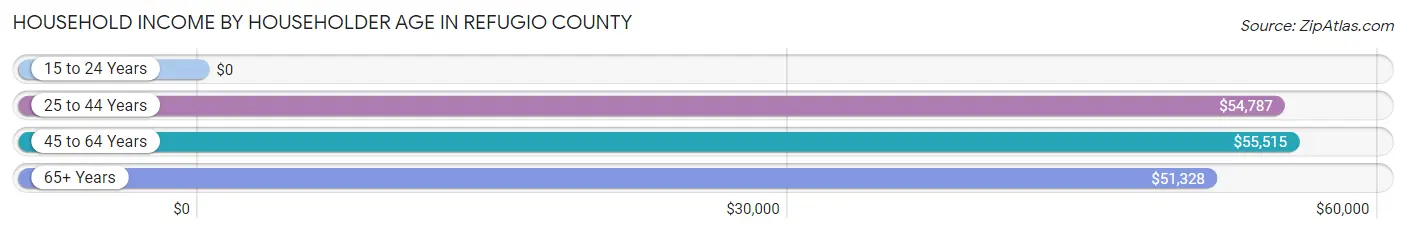
| Income Bracket | # Households | Median Income |
| 15 to 24 Years | 18 (0.8%) | $0 |
| 25 to 44 Years | 506 (22.6%) | $54,787 |
| 45 to 64 Years | 801 (35.8%) | $55,515 |
| 65+ Years | 910 (40.7%) | $51,328 |
| Total | 2,235 (100.0%) | $54,304 |
Poverty in Refugio County
Income Below Poverty by Sex and Age in Refugio County
With 9.3% poverty level for males and 22.5% for females among the residents of Refugio County, under 5 year old males and 5 year old females are the most vulnerable to poverty, with 56 males (32.9%) and 28 females (68.3%) in their respective age groups living below the poverty level.
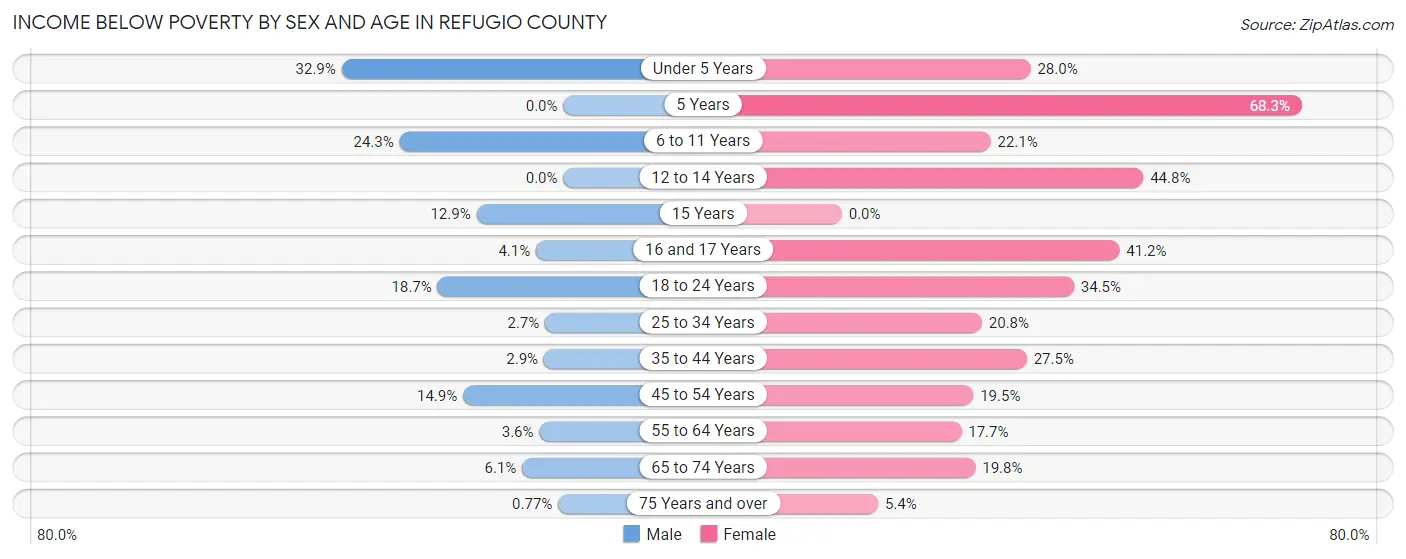
| Age Bracket | Male | Female |
| Under 5 Years | 56 (32.9%) | 58 (28.0%) |
| 5 Years | 0 (0.0%) | 28 (68.3%) |
| 6 to 11 Years | 45 (24.3%) | 72 (22.1%) |
| 12 to 14 Years | 0 (0.0%) | 64 (44.8%) |
| 15 Years | 4 (12.9%) | 0 (0.0%) |
| 16 and 17 Years | 3 (4.1%) | 54 (41.2%) |
| 18 to 24 Years | 63 (18.7%) | 51 (34.5%) |
| 25 to 34 Years | 9 (2.7%) | 109 (20.8%) |
| 35 to 44 Years | 9 (2.9%) | 81 (27.5%) |
| 45 to 54 Years | 52 (14.9%) | 82 (19.5%) |
| 55 to 64 Years | 16 (3.6%) | 80 (17.7%) |
| 65 to 74 Years | 25 (6.1%) | 88 (19.8%) |
| 75 Years and over | 2 (0.8%) | 17 (5.4%) |
| Total | 284 (9.3%) | 784 (22.5%) |
Income Above Poverty by Sex and Age in Refugio County
According to the poverty statistics in Refugio County, males aged 5 years and females aged 15 years are the age groups that are most secure financially, with 100.0% of males and 100.0% of females in these age groups living above the poverty line.
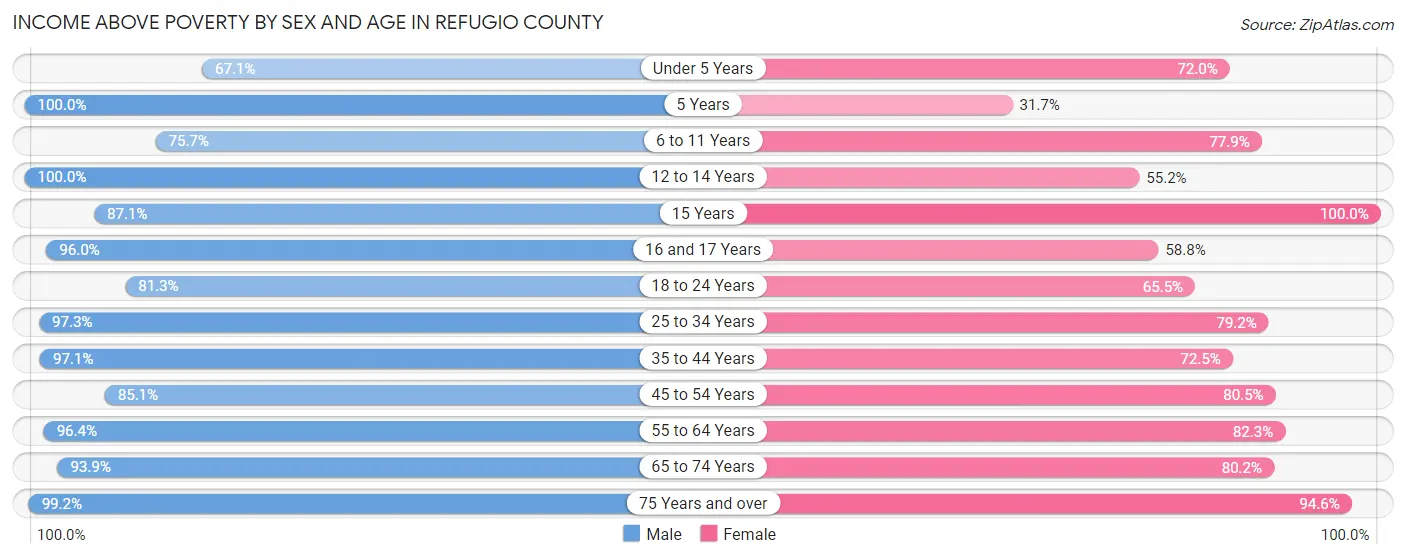
| Age Bracket | Male | Female |
| Under 5 Years | 114 (67.1%) | 149 (72.0%) |
| 5 Years | 12 (100.0%) | 13 (31.7%) |
| 6 to 11 Years | 140 (75.7%) | 254 (77.9%) |
| 12 to 14 Years | 148 (100.0%) | 79 (55.2%) |
| 15 Years | 27 (87.1%) | 40 (100.0%) |
| 16 and 17 Years | 71 (96.0%) | 77 (58.8%) |
| 18 to 24 Years | 274 (81.3%) | 97 (65.5%) |
| 25 to 34 Years | 323 (97.3%) | 415 (79.2%) |
| 35 to 44 Years | 303 (97.1%) | 214 (72.5%) |
| 45 to 54 Years | 297 (85.1%) | 338 (80.5%) |
| 55 to 64 Years | 433 (96.4%) | 371 (82.3%) |
| 65 to 74 Years | 384 (93.9%) | 356 (80.2%) |
| 75 Years and over | 257 (99.2%) | 299 (94.6%) |
| Total | 2,783 (90.7%) | 2,702 (77.5%) |
Income Below Poverty Among Married-Couple Families in Refugio County
The poverty statistics for married-couple families in Refugio County show that 3.5% or 31 of the total 894 families live below the poverty line. Families with no children have the highest poverty rate of 4.0%, comprising of 27 families. On the other hand, families with 3 or 4 children have the lowest poverty rate of 0.0%, which includes 0 families.
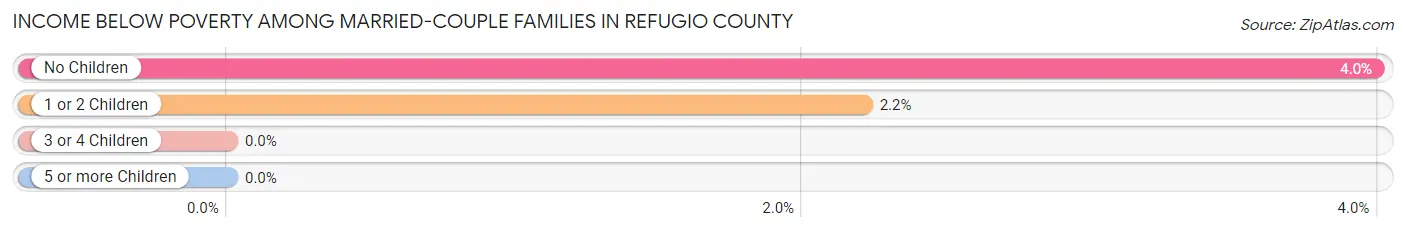
| Children | Above Poverty | Below Poverty |
| No Children | 649 (96.0%) | 27 (4.0%) |
| 1 or 2 Children | 177 (97.8%) | 4 (2.2%) |
| 3 or 4 Children | 37 (100.0%) | 0 (0.0%) |
| 5 or more Children | 0 (0.0%) | 0 (0.0%) |
| Total | 863 (96.5%) | 31 (3.5%) |
Income Below Poverty Among Single-Parent Households in Refugio County
According to the poverty data in Refugio County, 4.0% or 5 single-father households and 44.2% or 183 single-mother households are living below the poverty line. Among single-father households, those with 3 or 4 children have the highest poverty rate, with 4 households (66.7%) experiencing poverty. Likewise, among single-mother households, those with 5 or more children have the highest poverty rate, with 31 households (100.0%) falling below the poverty line.
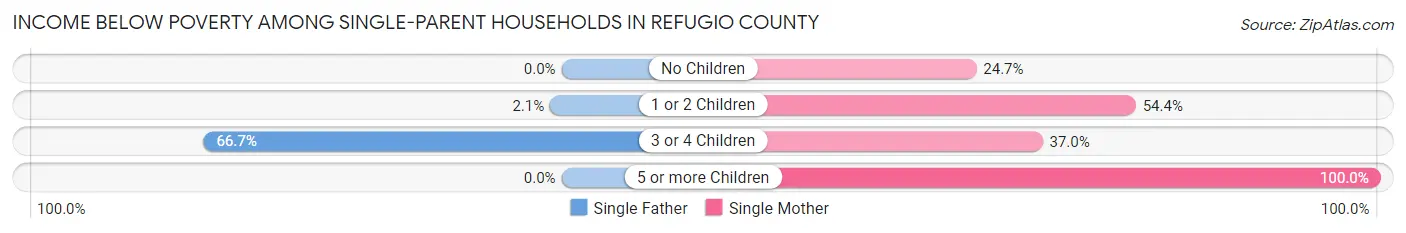
| Children | Single Father | Single Mother |
| No Children | 0 (0.0%) | 43 (24.7%) |
| 1 or 2 Children | 1 (2.1%) | 99 (54.4%) |
| 3 or 4 Children | 4 (66.7%) | 10 (37.0%) |
| 5 or more Children | 0 (0.0%) | 31 (100.0%) |
| Total | 5 (4.0%) | 183 (44.2%) |
Income Below Poverty Among Married-Couple vs Single-Parent Households in Refugio County
The poverty data for Refugio County shows that 31 of the married-couple family households (3.5%) and 188 of the single-parent households (34.9%) are living below the poverty level. Within the married-couple family households, those with no children have the highest poverty rate, with 27 households (4.0%) falling below the poverty line. Among the single-parent households, those with 5 or more children have the highest poverty rate, with 31 household (100.0%) living below poverty.
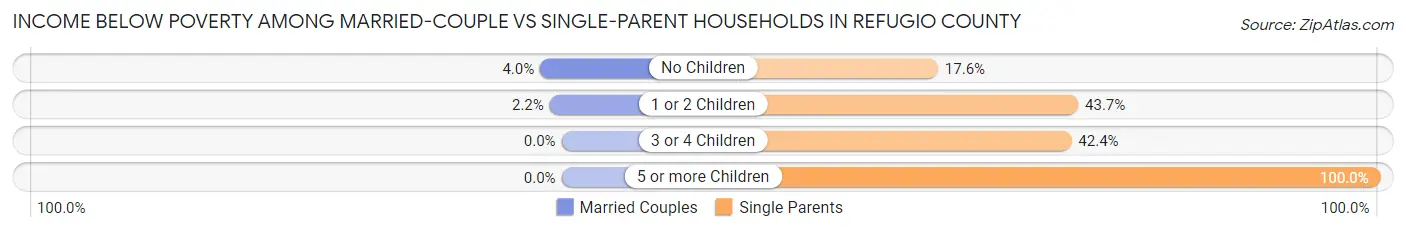
| Children | Married-Couple Families | Single-Parent Households |
| No Children | 27 (4.0%) | 43 (17.5%) |
| 1 or 2 Children | 4 (2.2%) | 100 (43.7%) |
| 3 or 4 Children | 0 (0.0%) | 14 (42.4%) |
| 5 or more Children | 0 (0.0%) | 31 (100.0%) |
| Total | 31 (3.5%) | 188 (34.9%) |
Race in Refugio County
The most populous races in Refugio County are White / Caucasian (4,735 | 70.5%), Hispanic or Latino (3,473 | 51.7%), and Two or more Races (1,337 | 19.9%).
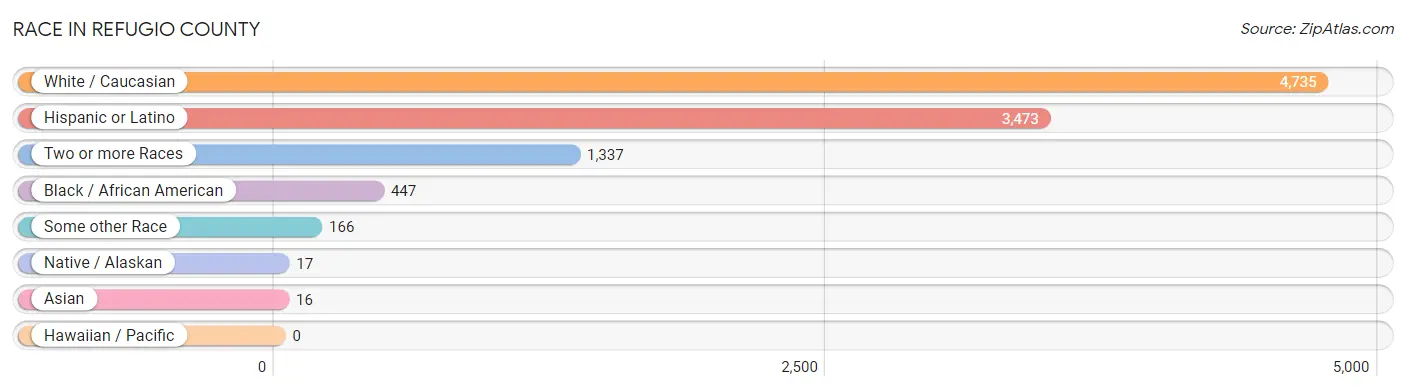
| Race | # Population | % Population |
| Asian | 16 | 0.2% |
| Black / African American | 447 | 6.7% |
| Hawaiian / Pacific | 0 | 0.0% |
| Hispanic or Latino | 3,473 | 51.7% |
| Native / Alaskan | 17 | 0.3% |
| White / Caucasian | 4,735 | 70.5% |
| Two or more Races | 1,337 | 19.9% |
| Some other Race | 166 | 2.5% |
| Total | 6,718 | 100.0% |
Ancestry in Refugio County
The most populous ancestries reported in Refugio County are Mexican (3,351 | 49.9%), German (828 | 12.3%), Irish (662 | 9.9%), English (288 | 4.3%), and American (158 | 2.4%), together accounting for 78.7% of all Refugio County residents.
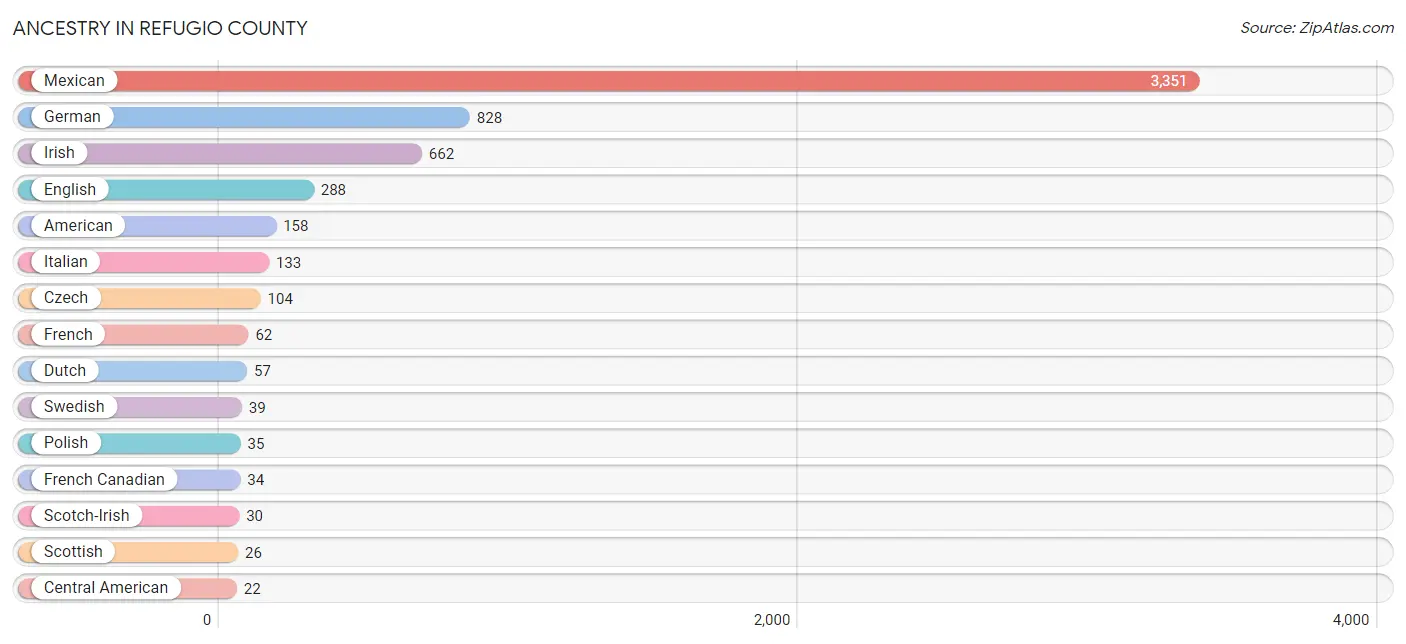
| Ancestry | # Population | % Population |
| American | 158 | 2.4% |
| Arab | 8 | 0.1% |
| Belgian | 10 | 0.2% |
| Blackfeet | 4 | 0.1% |
| British | 14 | 0.2% |
| Central American | 22 | 0.3% |
| Costa Rican | 22 | 0.3% |
| Czech | 104 | 1.5% |
| Dutch | 57 | 0.9% |
| English | 288 | 4.3% |
| European | 7 | 0.1% |
| French | 62 | 0.9% |
| French Canadian | 34 | 0.5% |
| German | 828 | 12.3% |
| Hungarian | 8 | 0.1% |
| Indian (Asian) | 3 | 0.0% |
| Iranian | 11 | 0.2% |
| Irish | 662 | 9.9% |
| Israeli | 2 | 0.0% |
| Italian | 133 | 2.0% |
| Korean | 4 | 0.1% |
| Mexican | 3,351 | 49.9% |
| Norwegian | 12 | 0.2% |
| Polish | 35 | 0.5% |
| Russian | 8 | 0.1% |
| Scandinavian | 11 | 0.2% |
| Scotch-Irish | 30 | 0.4% |
| Scottish | 26 | 0.4% |
| Spanish | 1 | 0.0% |
| Swedish | 39 | 0.6% |
| Thai | 15 | 0.2% |
| Welsh | 22 | 0.3% | View All 32 Rows |
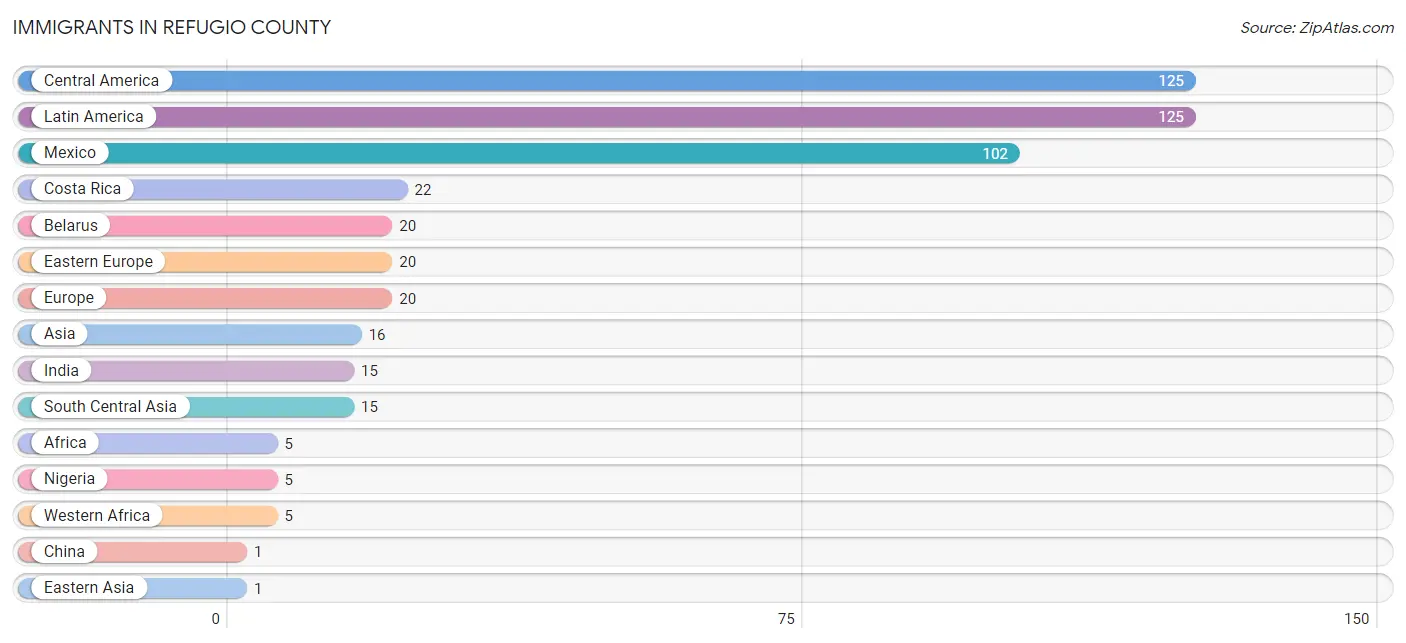
Immigrants in Refugio County
The most numerous immigrant groups reported in Refugio County came from Central America (125 | 1.9%), Latin America (125 | 1.9%), Mexico (102 | 1.5%), Costa Rica (22 | 0.3%), and Belarus (20 | 0.3%), together accounting for 5.9% of all Refugio County residents.
| Immigration Origin | # Population | % Population |
| Africa | 5 | 0.1% |
| Asia | 16 | 0.2% |
| Belarus | 20 | 0.3% |
| Central America | 125 | 1.9% |
| China | 1 | 0.0% |
| Costa Rica | 22 | 0.3% |
| Eastern Asia | 1 | 0.0% |
| Eastern Europe | 20 | 0.3% |
| Europe | 20 | 0.3% |
| India | 15 | 0.2% |
| Latin America | 125 | 1.9% |
| Mexico | 102 | 1.5% |
| Nicaragua | 1 | 0.0% |
| Nigeria | 5 | 0.1% |
| South Central Asia | 15 | 0.2% |
| Western Africa | 5 | 0.1% | View All 16 Rows |
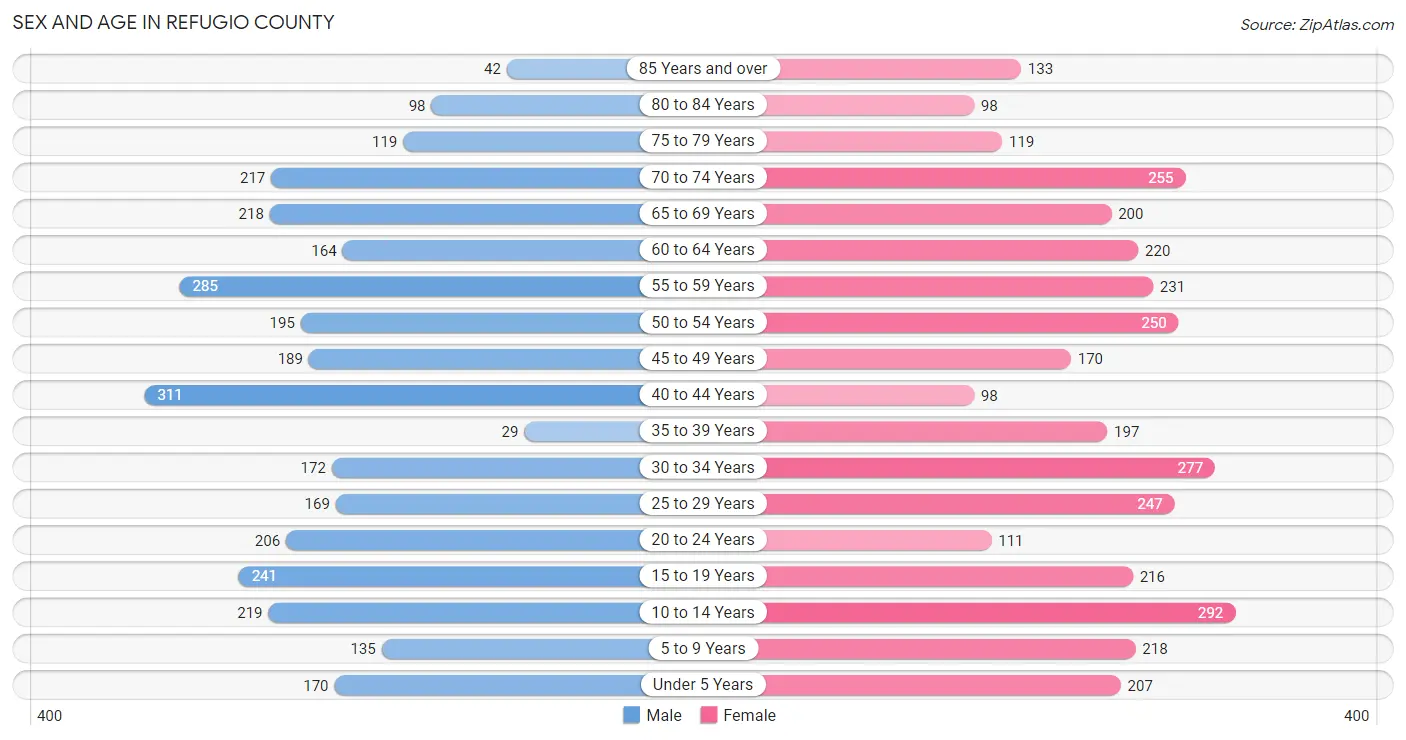
Sex and Age in Refugio County
Sex and Age in Refugio County
The most populous age groups in Refugio County are 40 to 44 Years (311 | 9.8%) for men and 10 to 14 Years (292 | 8.3%) for women.
| Age Bracket | Male | Female |
| Under 5 Years | 170 (5.3%) | 207 (5.9%) |
| 5 to 9 Years | 135 (4.3%) | 218 (6.2%) |
| 10 to 14 Years | 219 (6.9%) | 292 (8.3%) |
| 15 to 19 Years | 241 (7.6%) | 216 (6.1%) |
| 20 to 24 Years | 206 (6.5%) | 111 (3.1%) |
| 25 to 29 Years | 169 (5.3%) | 247 (7.0%) |
| 30 to 34 Years | 172 (5.4%) | 277 (7.8%) |
| 35 to 39 Years | 29 (0.9%) | 197 (5.6%) |
| 40 to 44 Years | 311 (9.8%) | 98 (2.8%) |
| 45 to 49 Years | 189 (5.9%) | 170 (4.8%) |
| 50 to 54 Years | 195 (6.1%) | 250 (7.1%) |
| 55 to 59 Years | 285 (9.0%) | 231 (6.5%) |
| 60 to 64 Years | 164 (5.2%) | 220 (6.2%) |
| 65 to 69 Years | 218 (6.9%) | 200 (5.7%) |
| 70 to 74 Years | 217 (6.8%) | 255 (7.2%) |
| 75 to 79 Years | 119 (3.7%) | 119 (3.4%) |
| 80 to 84 Years | 98 (3.1%) | 98 (2.8%) |
| 85 Years and over | 42 (1.3%) | 133 (3.8%) |
| Total | 3,179 (100.0%) | 3,539 (100.0%) |
Families and Households in Refugio County
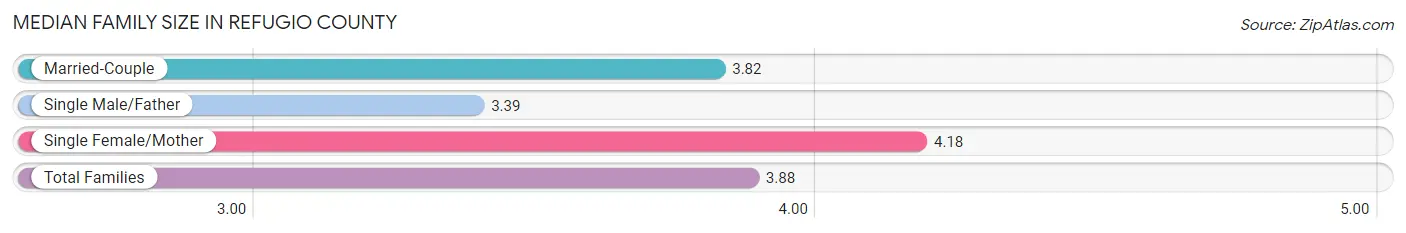
Median Family Size in Refugio County
The median family size in Refugio County is 3.88 persons per family, with single female/mother families (414 | 28.9%) accounting for the largest median family size of 4.18 persons per family. On the other hand, single male/father families (124 | 8.7%) represent the smallest median family size with 3.39 persons per family.
| Family Type | # Families | Family Size |
| Married-Couple | 894 (62.4%) | 3.82 |
| Single Male/Father | 124 (8.7%) | 3.39 |
| Single Female/Mother | 414 (28.9%) | 4.18 |
| Total Families | 1,432 (100.0%) | 3.88 |
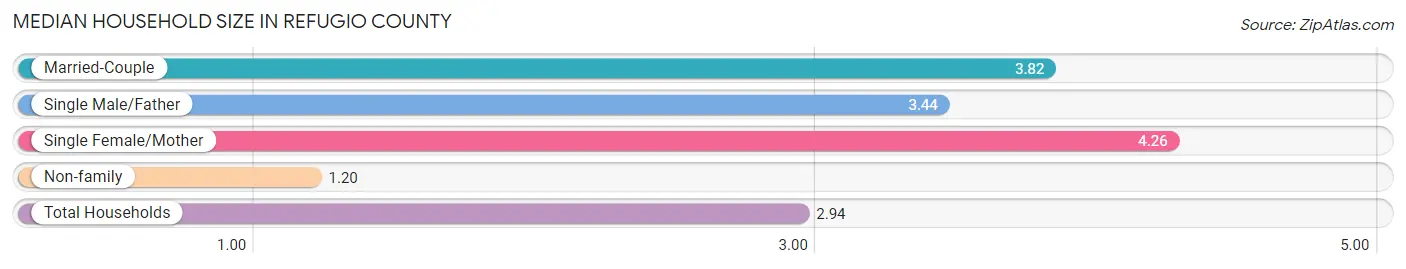
Median Household Size in Refugio County
The median household size in Refugio County is 2.94 persons per household, with single female/mother households (414 | 18.5%) accounting for the largest median household size of 4.26 persons per household. non-family households (803 | 35.9%) represent the smallest median household size with 1.20 persons per household.
| Household Type | # Households | Household Size |
| Married-Couple | 894 (40.0%) | 3.82 |
| Single Male/Father | 124 (5.6%) | 3.44 |
| Single Female/Mother | 414 (18.5%) | 4.26 |
| Non-family | 803 (35.9%) | 1.20 |
| Total Households | 2,235 (100.0%) | 2.94 |
Household Size by Marriage Status in Refugio County
Out of a total of 2,235 households in Refugio County, 1,432 (64.1%) are family households, while 803 (35.9%) are nonfamily households. The most numerous type of family households are 2-person households, comprising 700, and the most common type of nonfamily households are 1-person households, comprising 678.
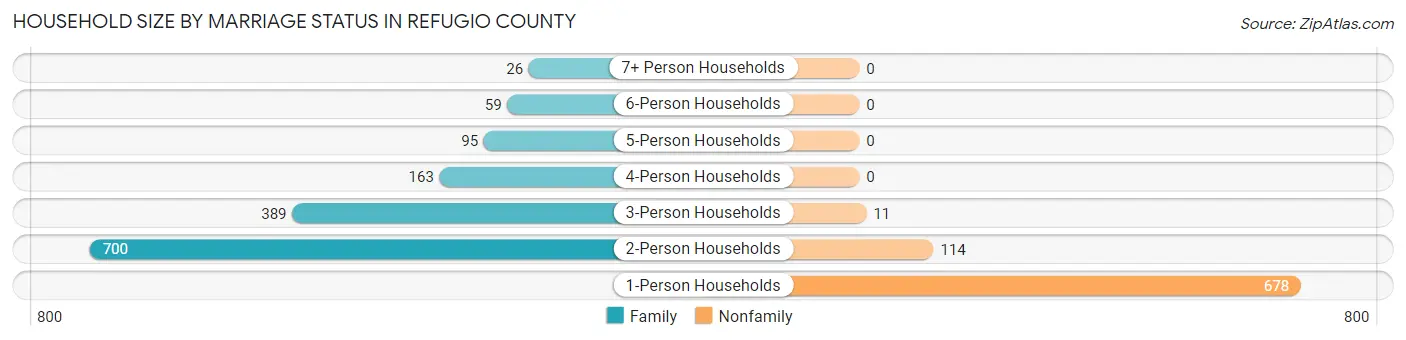
| Household Size | Family Households | Nonfamily Households |
| 1-Person Households | - | 678 (30.3%) |
| 2-Person Households | 700 (31.3%) | 114 (5.1%) |
| 3-Person Households | 389 (17.4%) | 11 (0.5%) |
| 4-Person Households | 163 (7.3%) | 0 (0.0%) |
| 5-Person Households | 95 (4.3%) | 0 (0.0%) |
| 6-Person Households | 59 (2.6%) | 0 (0.0%) |
| 7+ Person Households | 26 (1.2%) | 0 (0.0%) |
| Total | 1,432 (64.1%) | 803 (35.9%) |
Female Fertility in Refugio County
Fertility by Age in Refugio County
Average fertility rate in Refugio County is 49.0 births per 1,000 women. Women in the age bracket of 20 to 34 years have the highest fertility rate with 107.0 births per 1,000 women. Women in the age bracket of 20 to 34 years acount for 100.0% of all women with births.
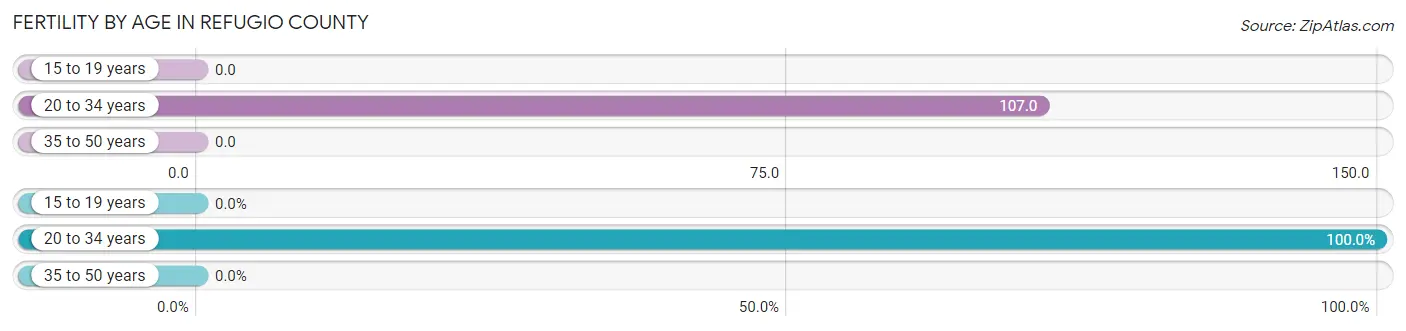
| Age Bracket | Women with Births | Births / 1,000 Women |
| 15 to 19 years | 0 (0.0%) | 0.0 |
| 20 to 34 years | 68 (100.0%) | 107.0 |
| 35 to 50 years | 0 (0.0%) | 0.0 |
| Total | 68 (100.0%) | 49.0 |
Fertility by Age by Marriage Status in Refugio County
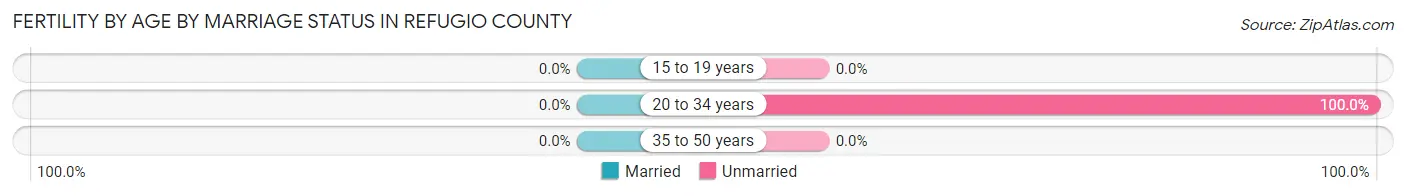
| Age Bracket | Married | Unmarried |
| 15 to 19 years | 0 (0.0%) | 0 (0.0%) |
| 20 to 34 years | 0 (0.0%) | 68 (100.0%) |
| 35 to 50 years | 0 (0.0%) | 0 (0.0%) |
| Total | 0 (0.0%) | 68 (100.0%) |
Fertility by Education in Refugio County
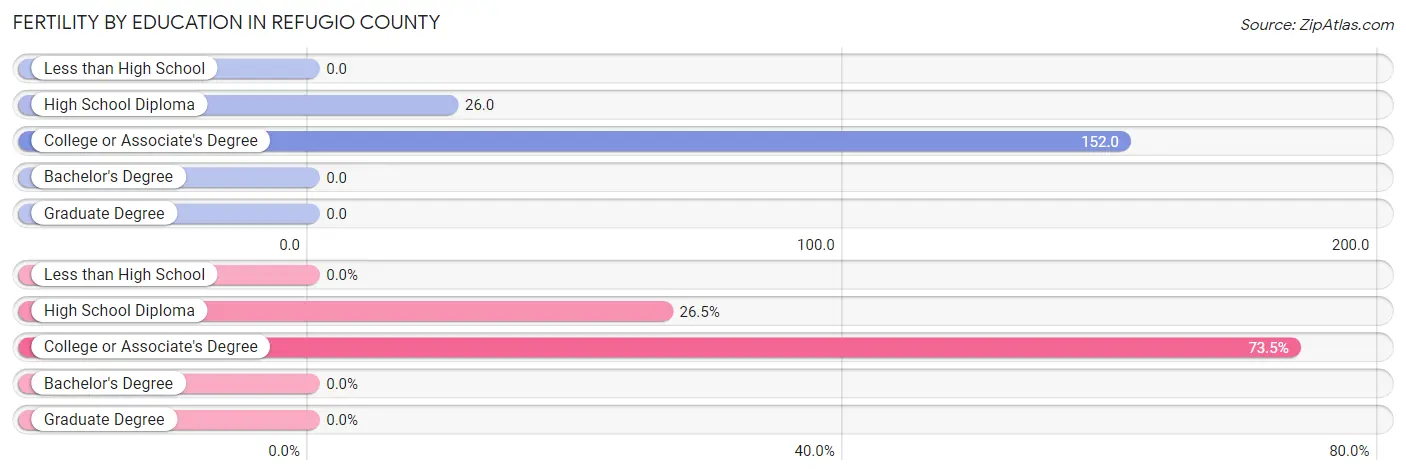
| Educational Attainment | Women with Births | Births / 1,000 Women |
| Less than High School | 0 (0.0%) | 0.0 |
| High School Diploma | 18 (26.5%) | 26.0 |
| College or Associate's Degree | 50 (73.5%) | 152.0 |
| Bachelor's Degree | 0 (0.0%) | 0.0 |
| Graduate Degree | 0 (0.0%) | 0.0 |
| Total | 68 (100.0%) | 49.0 |
Fertility by Education by Marriage Status in Refugio County
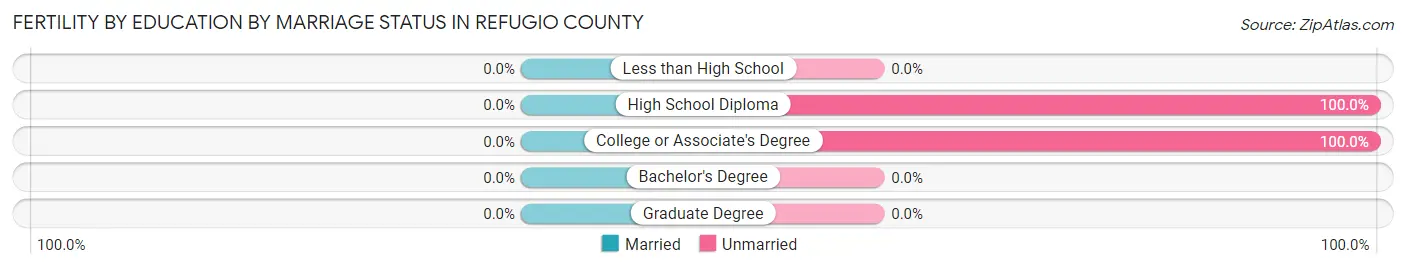
| Educational Attainment | Married | Unmarried |
| Less than High School | 0 (0.0%) | 0 (0.0%) |
| High School Diploma | 0 (0.0%) | 18 (100.0%) |
| College or Associate's Degree | 0 (0.0%) | 50 (100.0%) |
| Bachelor's Degree | 0 (0.0%) | 0 (0.0%) |
| Graduate Degree | 0 (0.0%) | 0 (0.0%) |
| Total | 0 (0.0%) | 68 (100.0%) |
Employment Characteristics in Refugio County
Employment by Class of Employer in Refugio County
Among the 2,557 employed individuals in Refugio County, private company employees (1,793 | 70.1%), local government employees (475 | 18.6%), and not-for-profit organizations (101 | 4.0%) make up the most common classes of employment.
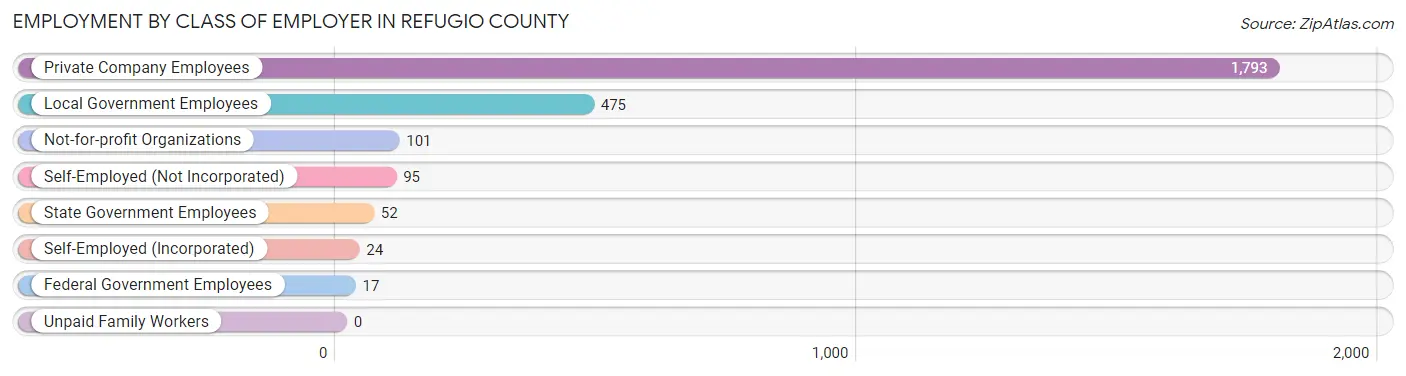
| Employer Class | # Employees | % Employees |
| Private Company Employees | 1,793 | 70.1% |
| Self-Employed (Incorporated) | 24 | 0.9% |
| Self-Employed (Not Incorporated) | 95 | 3.7% |
| Not-for-profit Organizations | 101 | 4.0% |
| Local Government Employees | 475 | 18.6% |
| State Government Employees | 52 | 2.0% |
| Federal Government Employees | 17 | 0.7% |
| Unpaid Family Workers | 0 | 0.0% |
| Total | 2,557 | 100.0% |
Employment Status by Age in Refugio County
According to the labor force statistics for Refugio County, out of the total population over 16 years of age (5,406), 51.2% or 2,768 individuals are in the labor force, with 5.6% or 155 of them unemployed. The age group with the highest labor force participation rate is 55 to 59 years, with 76.6% or 395 individuals in the labor force. Within the labor force, the 35 to 44 years age range has the highest percentage of unemployed individuals, with 15.8% or 75 of them being unemployed.
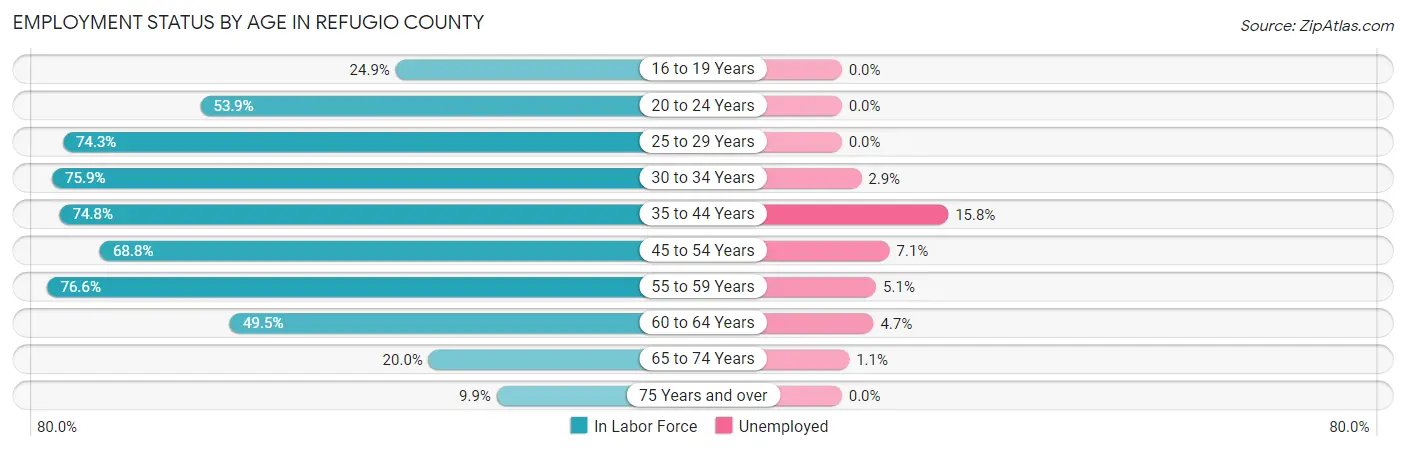
| Age Bracket | In Labor Force | Unemployed |
| 16 to 19 Years | 96 (24.9%) | 0 (0.0%) |
| 20 to 24 Years | 171 (53.9%) | 0 (0.0%) |
| 25 to 29 Years | 309 (74.3%) | 0 (0.0%) |
| 30 to 34 Years | 341 (75.9%) | 10 (2.9%) |
| 35 to 44 Years | 475 (74.8%) | 75 (15.8%) |
| 45 to 54 Years | 553 (68.8%) | 39 (7.1%) |
| 55 to 59 Years | 395 (76.6%) | 20 (5.1%) |
| 60 to 64 Years | 190 (49.5%) | 9 (4.7%) |
| 65 to 74 Years | 178 (20.0%) | 2 (1.1%) |
| 75 Years and over | 60 (9.9%) | 0 (0.0%) |
| Total | 2,768 (51.2%) | 155 (5.6%) |
Employment Status by Educational Attainment in Refugio County
According to labor force statistics for Refugio County, 70.6% of individuals (2,262) out of the total population between 25 and 64 years of age (3,204) are in the labor force, with 6.8% or 154 of them being unemployed. The group with the highest labor force participation rate are those with the educational attainment of college / associate degree, with 83.8% or 731 individuals in the labor force. Within the labor force, individuals with less than high school education have the highest percentage of unemployment, with 23.5% or 43 of them being unemployed.
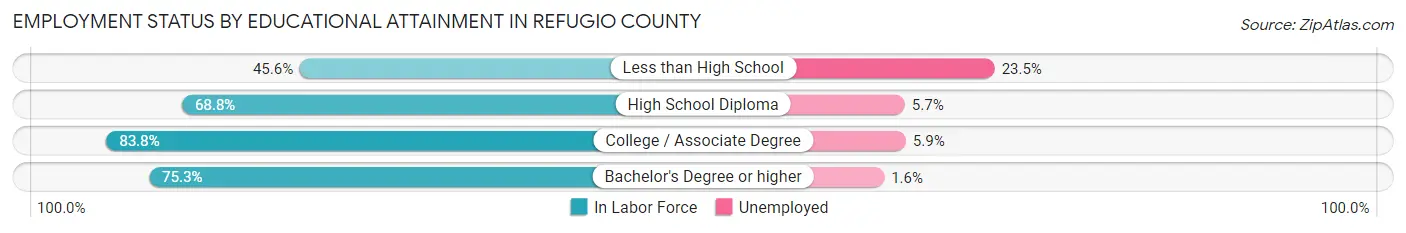
| Educational Attainment | In Labor Force | Unemployed |
| Less than High School | 183 (45.6%) | 94 (23.5%) |
| High School Diploma | 1,106 (68.8%) | 92 (5.7%) |
| College / Associate Degree | 731 (83.8%) | 51 (5.9%) |
| Bachelor's Degree or higher | 244 (75.3%) | 5 (1.6%) |
| Total | 2,262 (70.6%) | 218 (6.8%) |
Employment Occupations by Sex in Refugio County
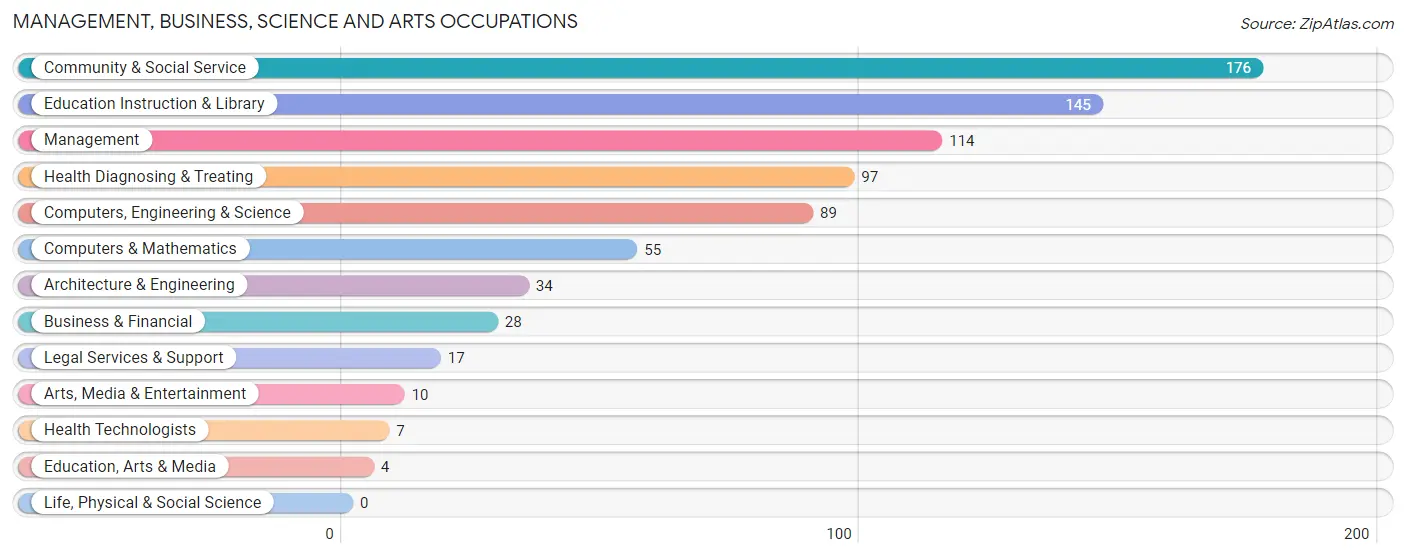
Management, Business, Science and Arts Occupations
The most common Management, Business, Science and Arts occupations in Refugio County are Community & Social Service (176 | 6.7%), Education Instruction & Library (145 | 5.6%), Management (114 | 4.4%), Health Diagnosing & Treating (97 | 3.7%), and Computers, Engineering & Science (89 | 3.4%).
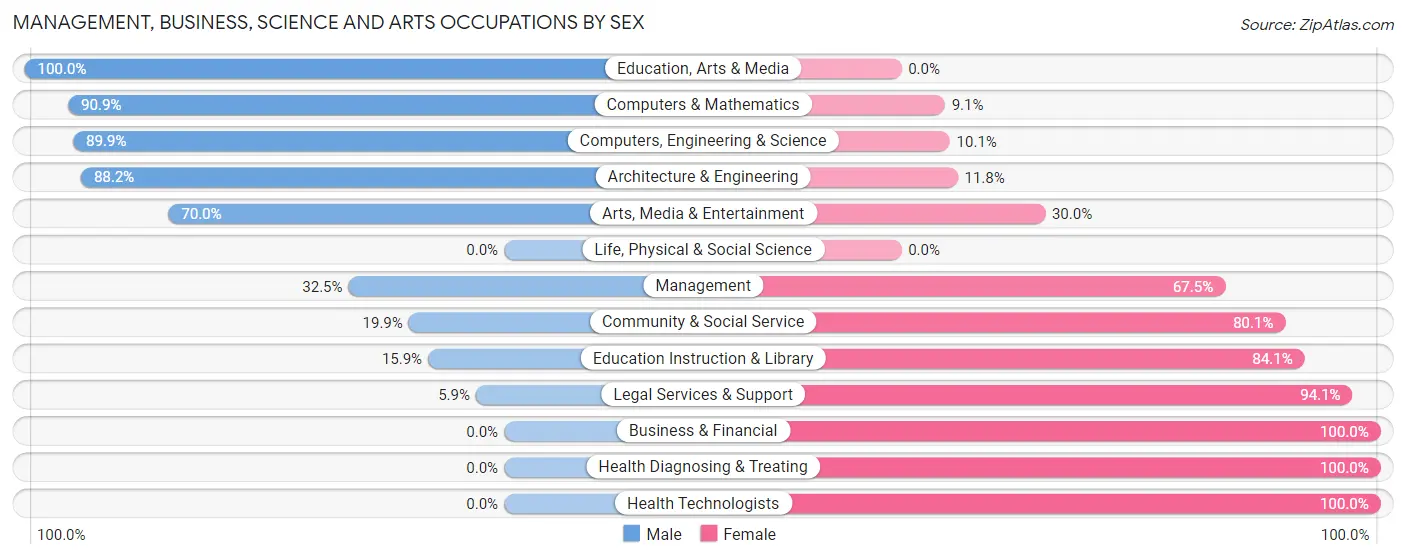
Management, Business, Science and Arts Occupations by Sex
Within the Management, Business, Science and Arts occupations in Refugio County, the most male-oriented occupations are Education, Arts & Media (100.0%), Computers & Mathematics (90.9%), and Computers, Engineering & Science (89.9%), while the most female-oriented occupations are Business & Financial (100.0%), Health Diagnosing & Treating (100.0%), and Health Technologists (100.0%).
| Occupation | Male | Female |
| Management | 37 (32.5%) | 77 (67.5%) |
| Business & Financial | 0 (0.0%) | 28 (100.0%) |
| Computers, Engineering & Science | 80 (89.9%) | 9 (10.1%) |
| Computers & Mathematics | 50 (90.9%) | 5 (9.1%) |
| Architecture & Engineering | 30 (88.2%) | 4 (11.8%) |
| Life, Physical & Social Science | 0 (0.0%) | 0 (0.0%) |
| Community & Social Service | 35 (19.9%) | 141 (80.1%) |
| Education, Arts & Media | 4 (100.0%) | 0 (0.0%) |
| Legal Services & Support | 1 (5.9%) | 16 (94.1%) |
| Education Instruction & Library | 23 (15.9%) | 122 (84.1%) |
| Arts, Media & Entertainment | 7 (70.0%) | 3 (30.0%) |
| Health Diagnosing & Treating | 0 (0.0%) | 97 (100.0%) |
| Health Technologists | 0 (0.0%) | 7 (100.0%) |
| Total (Category) | 152 (30.2%) | 352 (69.8%) |
| Total (Overall) | 1,382 (52.9%) | 1,231 (47.1%) |
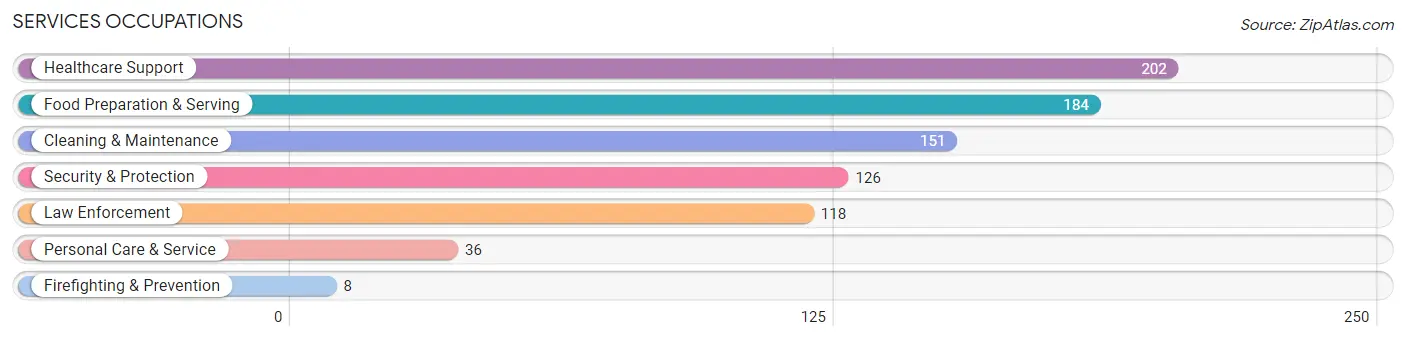
Services Occupations
The most common Services occupations in Refugio County are Healthcare Support (202 | 7.7%), Food Preparation & Serving (184 | 7.0%), Cleaning & Maintenance (151 | 5.8%), Security & Protection (126 | 4.8%), and Law Enforcement (118 | 4.5%).
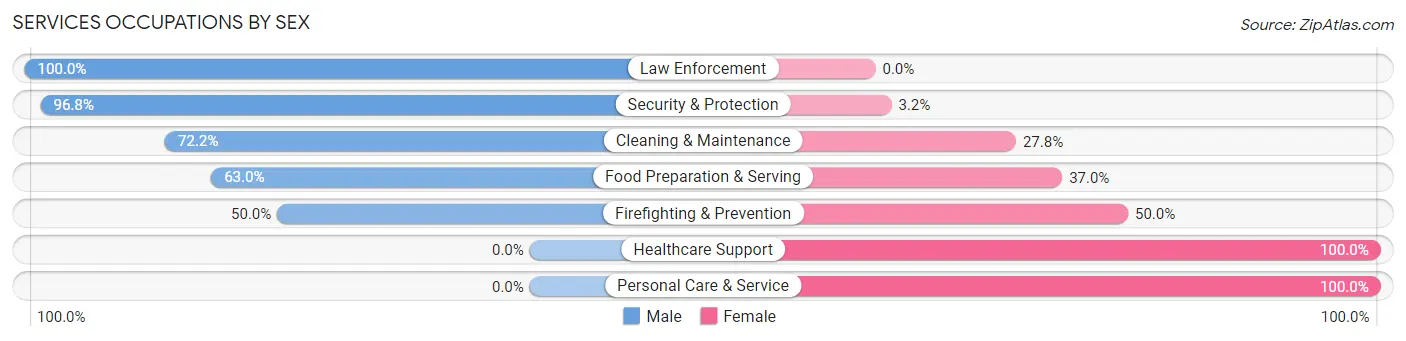
Services Occupations by Sex
Within the Services occupations in Refugio County, the most male-oriented occupations are Law Enforcement (100.0%), Security & Protection (96.8%), and Cleaning & Maintenance (72.2%), while the most female-oriented occupations are Healthcare Support (100.0%), Personal Care & Service (100.0%), and Firefighting & Prevention (50.0%).
| Occupation | Male | Female |
| Healthcare Support | 0 (0.0%) | 202 (100.0%) |
| Security & Protection | 122 (96.8%) | 4 (3.2%) |
| Firefighting & Prevention | 4 (50.0%) | 4 (50.0%) |
| Law Enforcement | 118 (100.0%) | 0 (0.0%) |
| Food Preparation & Serving | 116 (63.0%) | 68 (37.0%) |
| Cleaning & Maintenance | 109 (72.2%) | 42 (27.8%) |
| Personal Care & Service | 0 (0.0%) | 36 (100.0%) |
| Total (Category) | 347 (49.6%) | 352 (50.4%) |
| Total (Overall) | 1,382 (52.9%) | 1,231 (47.1%) |
Sales and Office Occupations
The most common Sales and Office occupations in Refugio County are Office & Administration (358 | 13.7%), and Sales & Related (294 | 11.3%).
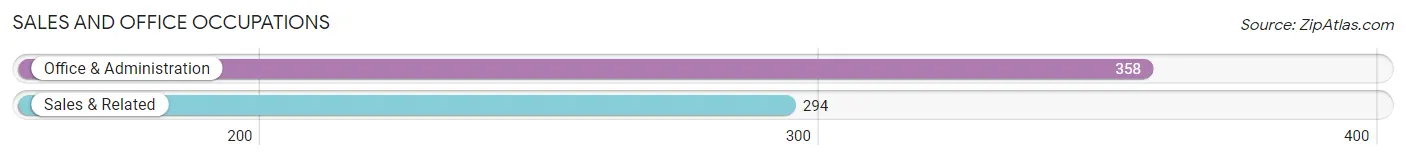
Sales and Office Occupations by Sex
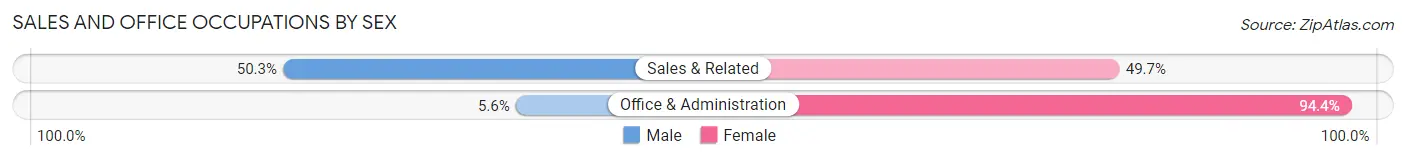
| Occupation | Male | Female |
| Sales & Related | 148 (50.3%) | 146 (49.7%) |
| Office & Administration | 20 (5.6%) | 338 (94.4%) |
| Total (Category) | 168 (25.8%) | 484 (74.2%) |
| Total (Overall) | 1,382 (52.9%) | 1,231 (47.1%) |
Natural Resources, Construction and Maintenance Occupations
The most common Natural Resources, Construction and Maintenance occupations in Refugio County are Construction & Extraction (265 | 10.1%), Installation, Maintenance & Repair (71 | 2.7%), and Farming, Fishing & Forestry (39 | 1.5%).
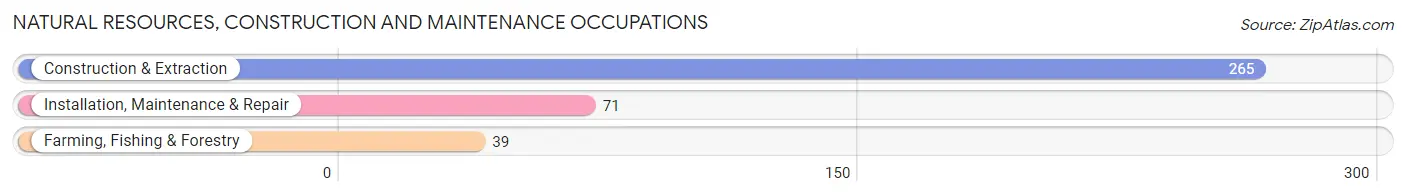
Natural Resources, Construction and Maintenance Occupations by Sex
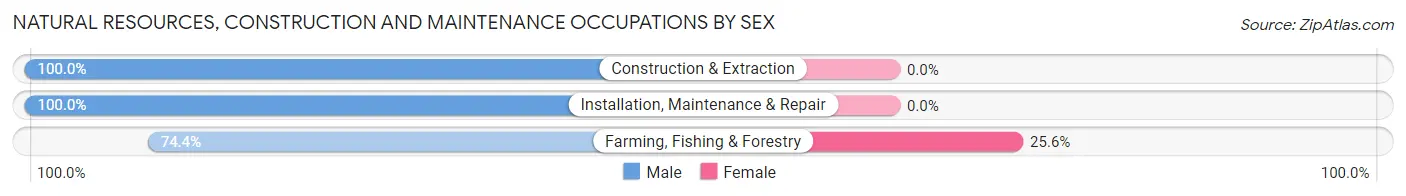
| Occupation | Male | Female |
| Farming, Fishing & Forestry | 29 (74.4%) | 10 (25.6%) |
| Construction & Extraction | 265 (100.0%) | 0 (0.0%) |
| Installation, Maintenance & Repair | 71 (100.0%) | 0 (0.0%) |
| Total (Category) | 365 (97.3%) | 10 (2.7%) |
| Total (Overall) | 1,382 (52.9%) | 1,231 (47.1%) |
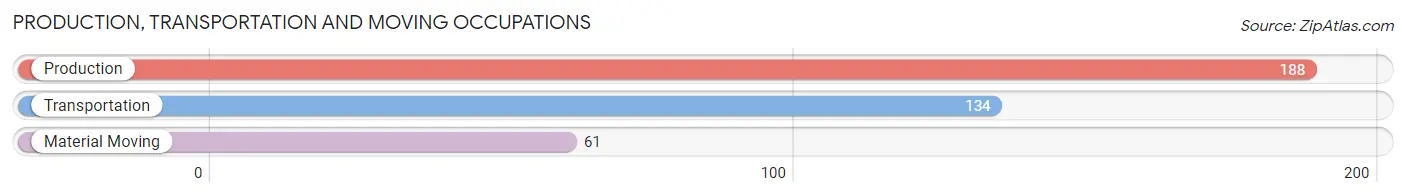
Production, Transportation and Moving Occupations
The most common Production, Transportation and Moving occupations in Refugio County are Production (188 | 7.2%), Transportation (134 | 5.1%), and Material Moving (61 | 2.3%).
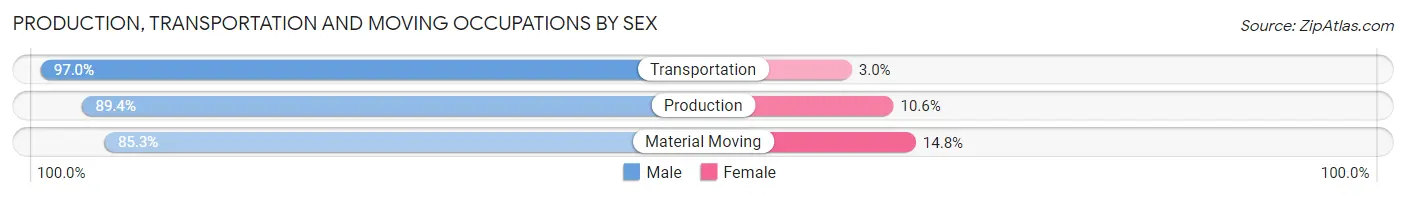
Production, Transportation and Moving Occupations by Sex
| Occupation | Male | Female |
| Production | 168 (89.4%) | 20 (10.6%) |
| Transportation | 130 (97.0%) | 4 (3.0%) |
| Material Moving | 52 (85.3%) | 9 (14.7%) |
| Total (Category) | 350 (91.4%) | 33 (8.6%) |
| Total (Overall) | 1,382 (52.9%) | 1,231 (47.1%) |
Employment Industries by Sex in Refugio County
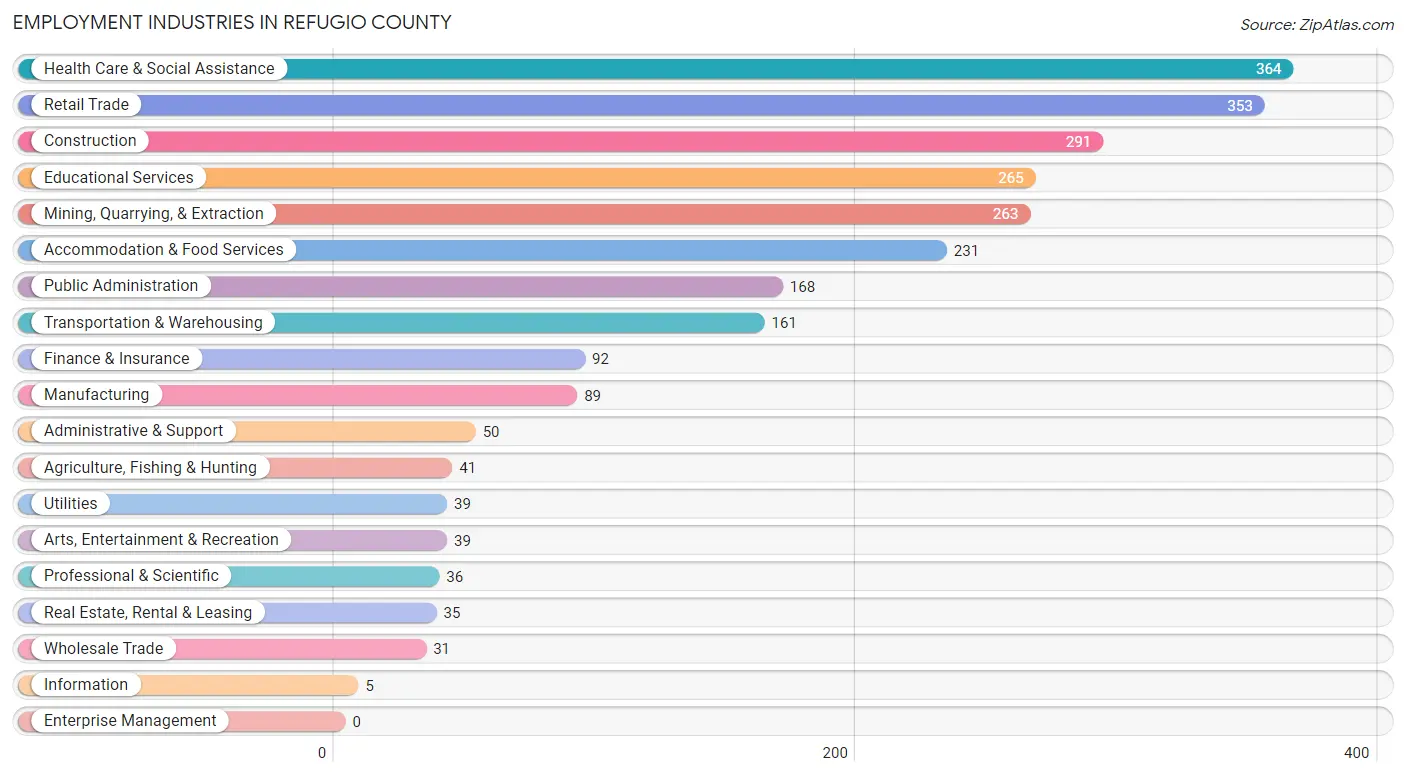
Employment Industries in Refugio County
The major employment industries in Refugio County include Health Care & Social Assistance (364 | 13.9%), Retail Trade (353 | 13.5%), Construction (291 | 11.1%), Educational Services (265 | 10.1%), and Mining, Quarrying, & Extraction (263 | 10.1%).
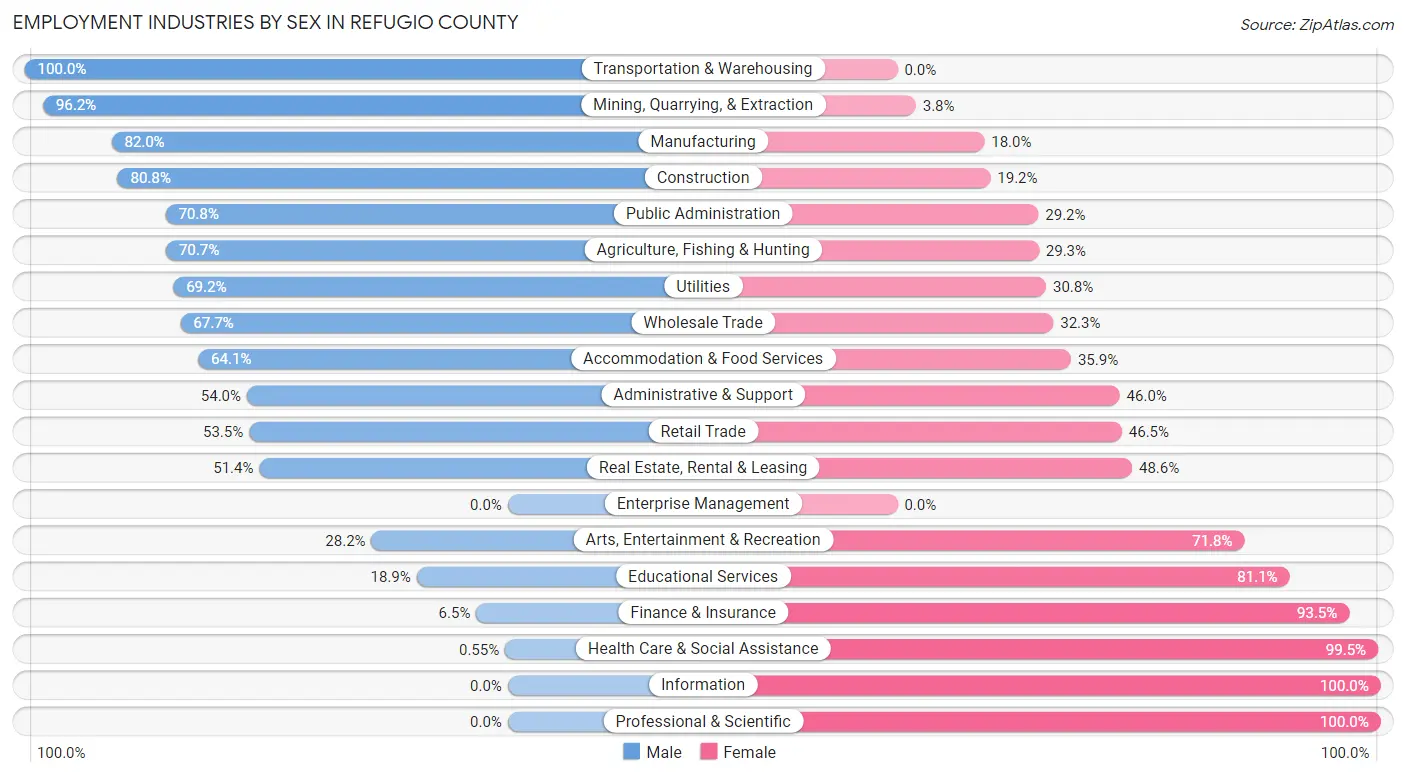
Employment Industries by Sex in Refugio County
The Refugio County industries that see more men than women are Transportation & Warehousing (100.0%), Mining, Quarrying, & Extraction (96.2%), and Manufacturing (82.0%), whereas the industries that tend to have a higher number of women are Information (100.0%), Professional & Scientific (100.0%), and Health Care & Social Assistance (99.5%).
| Industry | Male | Female |
| Agriculture, Fishing & Hunting | 29 (70.7%) | 12 (29.3%) |
| Mining, Quarrying, & Extraction | 253 (96.2%) | 10 (3.8%) |
| Construction | 235 (80.8%) | 56 (19.2%) |
| Manufacturing | 73 (82.0%) | 16 (18.0%) |
| Wholesale Trade | 21 (67.7%) | 10 (32.3%) |
| Retail Trade | 189 (53.5%) | 164 (46.5%) |
| Transportation & Warehousing | 161 (100.0%) | 0 (0.0%) |
| Utilities | 27 (69.2%) | 12 (30.8%) |
| Information | 0 (0.0%) | 5 (100.0%) |
| Finance & Insurance | 6 (6.5%) | 86 (93.5%) |
| Real Estate, Rental & Leasing | 18 (51.4%) | 17 (48.6%) |
| Professional & Scientific | 0 (0.0%) | 36 (100.0%) |
| Enterprise Management | 0 (0.0%) | 0 (0.0%) |
| Administrative & Support | 27 (54.0%) | 23 (46.0%) |
| Educational Services | 50 (18.9%) | 215 (81.1%) |
| Health Care & Social Assistance | 2 (0.5%) | 362 (99.5%) |
| Arts, Entertainment & Recreation | 11 (28.2%) | 28 (71.8%) |
| Accommodation & Food Services | 148 (64.1%) | 83 (35.9%) |
| Public Administration | 119 (70.8%) | 49 (29.2%) |
| Total | 1,382 (52.9%) | 1,231 (47.1%) |
Education in Refugio County
School Enrollment in Refugio County
The most common levels of schooling among the 1,455 students in Refugio County are high school (524 | 36.0%), elementary school (320 | 22.0%), and middle school (309 | 21.2%).
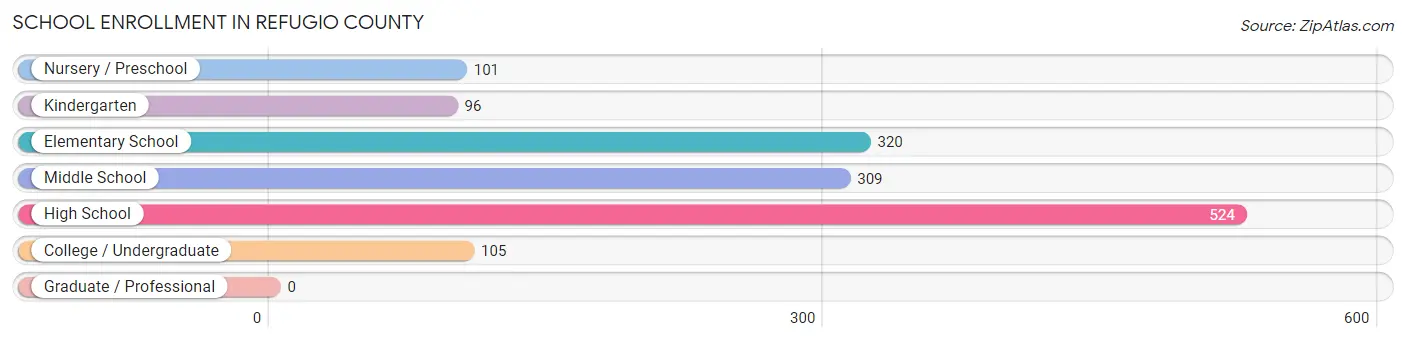
| School Level | # Students | % Students |
| Nursery / Preschool | 101 | 6.9% |
| Kindergarten | 96 | 6.6% |
| Elementary School | 320 | 22.0% |
| Middle School | 309 | 21.2% |
| High School | 524 | 36.0% |
| College / Undergraduate | 105 | 7.2% |
| Graduate / Professional | 0 | 0.0% |
| Total | 1,455 | 100.0% |
School Enrollment by Age by Funding Source in Refugio County
Out of a total of 1,455 students who are enrolled in schools in Refugio County, 76 (5.2%) attend a private institution, while the remaining 1,379 (94.8%) are enrolled in public schools. The age group of 25 to 34 year olds has the highest likelihood of being enrolled in private schools, with 1 (20.0% in the age bracket) enrolled. Conversely, the age group of 20 to 24 year olds has the lowest likelihood of being enrolled in a private school, with 28 (100.0% in the age bracket) attending a public institution.
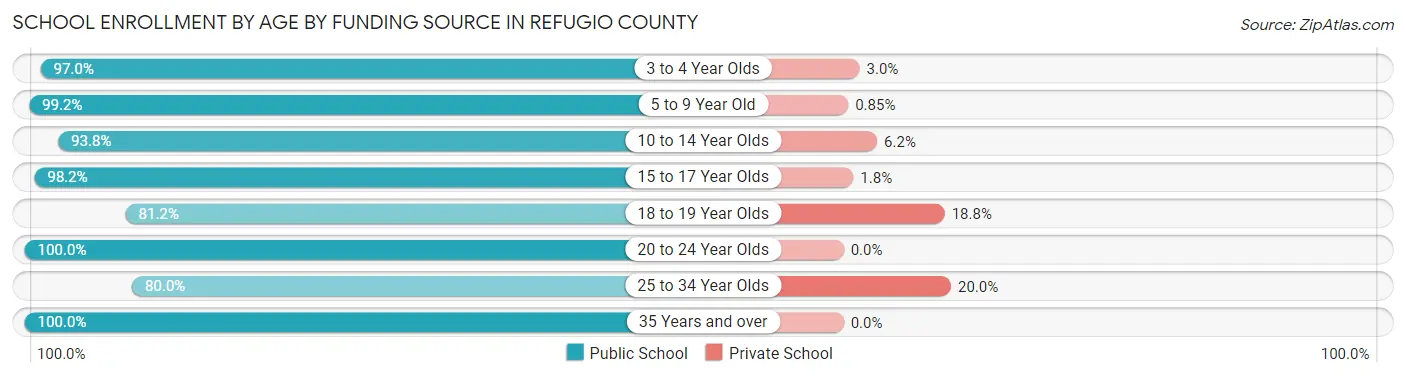
| Age Bracket | Public School | Private School |
| 3 to 4 Year Olds | 98 (97.0%) | 3 (3.0%) |
| 5 to 9 Year Old | 350 (99.2%) | 3 (0.9%) |
| 10 to 14 Year Olds | 466 (93.8%) | 31 (6.2%) |
| 15 to 17 Year Olds | 271 (98.2%) | 5 (1.8%) |
| 18 to 19 Year Olds | 138 (81.2%) | 32 (18.8%) |
| 20 to 24 Year Olds | 28 (100.0%) | 0 (0.0%) |
| 25 to 34 Year Olds | 4 (80.0%) | 1 (20.0%) |
| 35 Years and over | 25 (100.0%) | 0 (0.0%) |
| Total | 1,379 (94.8%) | 76 (5.2%) |
Educational Attainment by Field of Study in Refugio County
Education (154 | 29.0%), business (78 | 14.7%), science & technology (45 | 8.5%), arts & humanities (44 | 8.3%), and communications (38 | 7.2%) are the most common fields of study among 531 individuals in Refugio County who have obtained a bachelor's degree or higher.
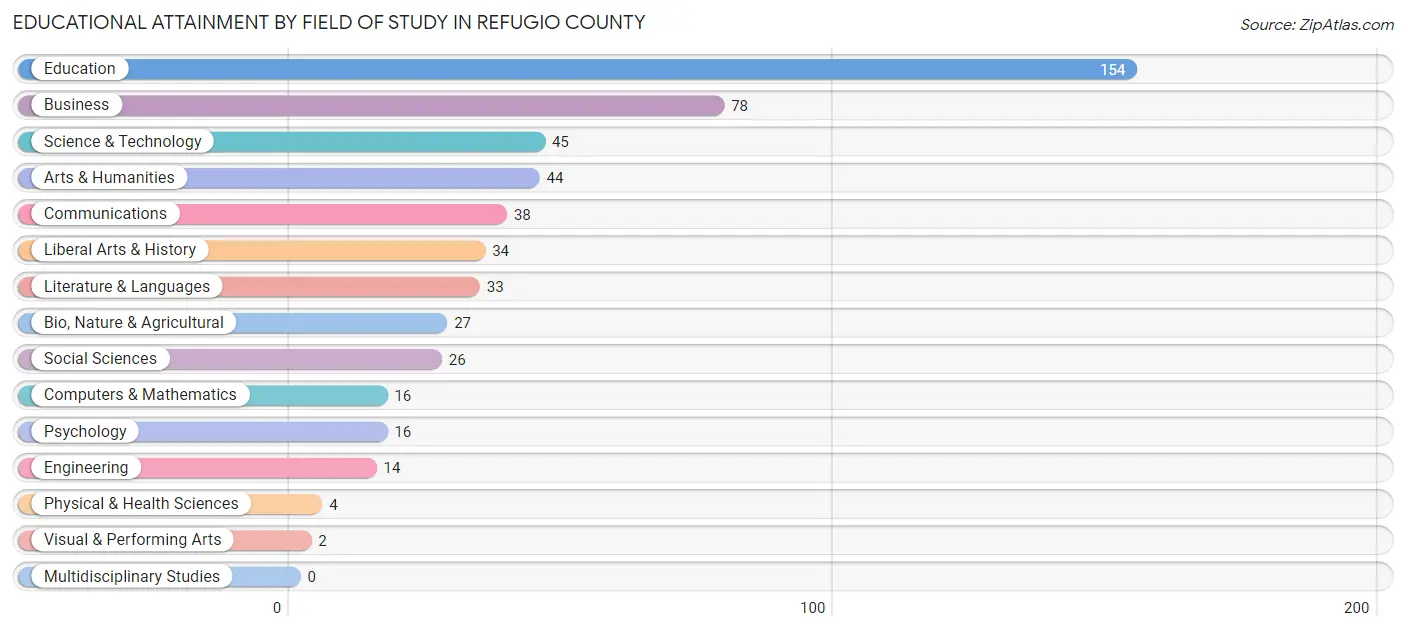
| Field of Study | # Graduates | % Graduates |
| Computers & Mathematics | 16 | 3.0% |
| Bio, Nature & Agricultural | 27 | 5.1% |
| Physical & Health Sciences | 4 | 0.7% |
| Psychology | 16 | 3.0% |
| Social Sciences | 26 | 4.9% |
| Engineering | 14 | 2.6% |
| Multidisciplinary Studies | 0 | 0.0% |
| Science & Technology | 45 | 8.5% |
| Business | 78 | 14.7% |
| Education | 154 | 29.0% |
| Literature & Languages | 33 | 6.2% |
| Liberal Arts & History | 34 | 6.4% |
| Visual & Performing Arts | 2 | 0.4% |
| Communications | 38 | 7.2% |
| Arts & Humanities | 44 | 8.3% |
| Total | 531 | 100.0% |
Transportation & Commute in Refugio County
Vehicle Availability by Sex in Refugio County
The most prevalent vehicle ownership categories in Refugio County are males with 2 vehicles (637, accounting for 47.5%) and females with 2 vehicles (581, making up 52.4%).
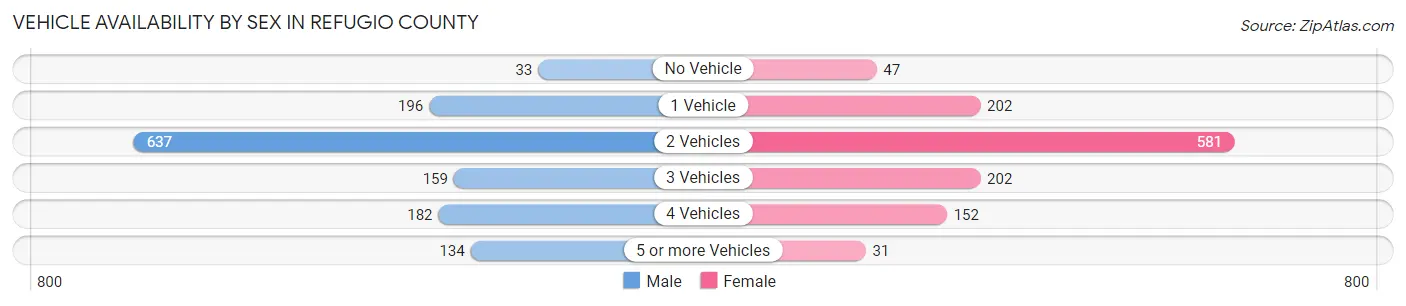
| Vehicles Available | Male | Female |
| No Vehicle | 33 (2.5%) | 47 (3.9%) |
| 1 Vehicle | 196 (14.6%) | 202 (16.6%) |
| 2 Vehicles | 637 (47.5%) | 581 (47.8%) |
| 3 Vehicles | 159 (11.9%) | 202 (16.6%) |
| 4 Vehicles | 182 (13.6%) | 152 (12.5%) |
| 5 or more Vehicles | 134 (10.0%) | 31 (2.5%) |
| Total | 1,341 (100.0%) | 1,215 (100.0%) |
Commute Time in Refugio County
The most frequently occuring commute durations in Refugio County are 10 to 14 minutes (587 commuters, 23.4%), 5 to 9 minutes (367 commuters, 14.6%), and 45 to 59 minutes (328 commuters, 13.1%).
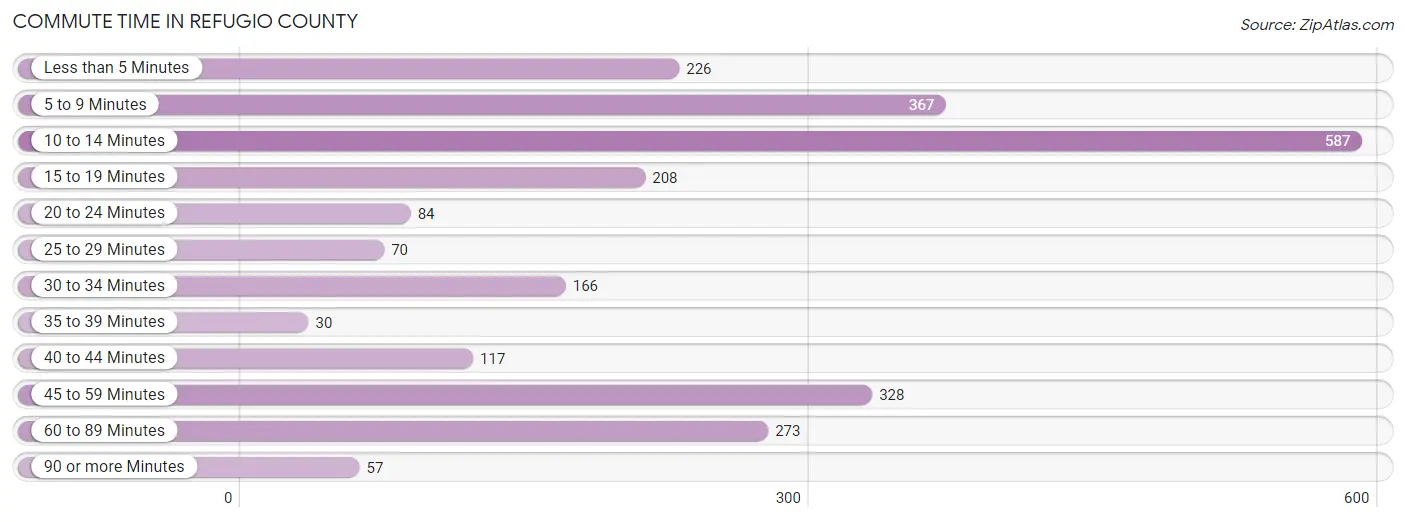
| Commute Time | # Commuters | % Commuters |
| Less than 5 Minutes | 226 | 9.0% |
| 5 to 9 Minutes | 367 | 14.6% |
| 10 to 14 Minutes | 587 | 23.4% |
| 15 to 19 Minutes | 208 | 8.3% |
| 20 to 24 Minutes | 84 | 3.3% |
| 25 to 29 Minutes | 70 | 2.8% |
| 30 to 34 Minutes | 166 | 6.6% |
| 35 to 39 Minutes | 30 | 1.2% |
| 40 to 44 Minutes | 117 | 4.7% |
| 45 to 59 Minutes | 328 | 13.1% |
| 60 to 89 Minutes | 273 | 10.9% |
| 90 or more Minutes | 57 | 2.3% |
Commute Time by Sex in Refugio County
The most common commute times in Refugio County are 10 to 14 minutes (290 commuters, 21.8%) for males and 10 to 14 minutes (297 commuters, 25.0%) for females.
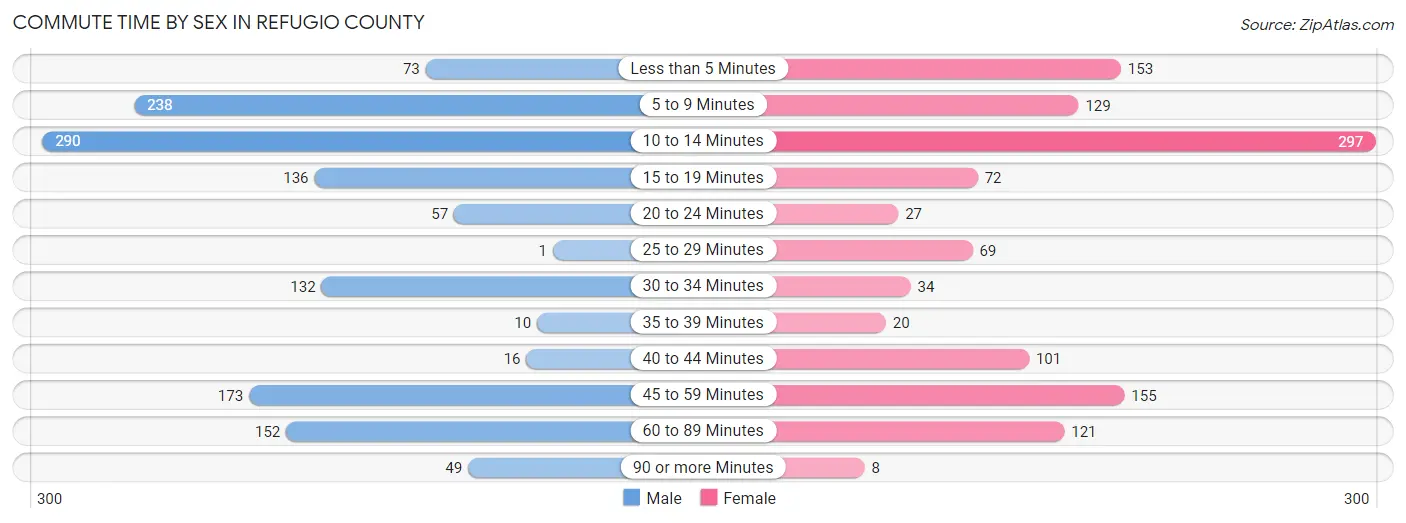
| Commute Time | Male | Female |
| Less than 5 Minutes | 73 (5.5%) | 153 (12.9%) |
| 5 to 9 Minutes | 238 (17.9%) | 129 (10.9%) |
| 10 to 14 Minutes | 290 (21.8%) | 297 (25.0%) |
| 15 to 19 Minutes | 136 (10.2%) | 72 (6.1%) |
| 20 to 24 Minutes | 57 (4.3%) | 27 (2.3%) |
| 25 to 29 Minutes | 1 (0.1%) | 69 (5.8%) |
| 30 to 34 Minutes | 132 (10.0%) | 34 (2.9%) |
| 35 to 39 Minutes | 10 (0.7%) | 20 (1.7%) |
| 40 to 44 Minutes | 16 (1.2%) | 101 (8.5%) |
| 45 to 59 Minutes | 173 (13.0%) | 155 (13.1%) |
| 60 to 89 Minutes | 152 (11.5%) | 121 (10.2%) |
| 90 or more Minutes | 49 (3.7%) | 8 (0.7%) |
Time of Departure to Work by Sex in Refugio County
The most frequent times of departure to work in Refugio County are 6:30 AM to 6:59 AM (173, 13.0%) for males and 7:30 AM to 7:59 AM (326, 27.5%) for females.
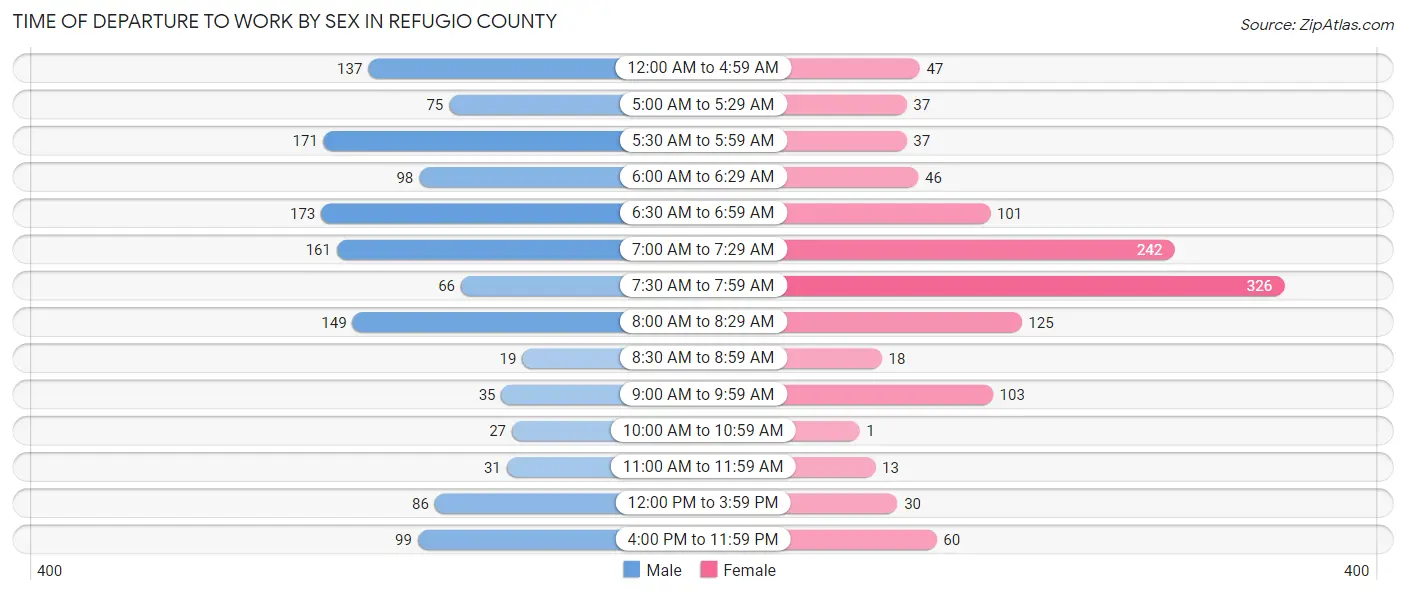
| Time of Departure | Male | Female |
| 12:00 AM to 4:59 AM | 137 (10.3%) | 47 (4.0%) |
| 5:00 AM to 5:29 AM | 75 (5.7%) | 37 (3.1%) |
| 5:30 AM to 5:59 AM | 171 (12.9%) | 37 (3.1%) |
| 6:00 AM to 6:29 AM | 98 (7.4%) | 46 (3.9%) |
| 6:30 AM to 6:59 AM | 173 (13.0%) | 101 (8.5%) |
| 7:00 AM to 7:29 AM | 161 (12.1%) | 242 (20.4%) |
| 7:30 AM to 7:59 AM | 66 (5.0%) | 326 (27.5%) |
| 8:00 AM to 8:29 AM | 149 (11.2%) | 125 (10.5%) |
| 8:30 AM to 8:59 AM | 19 (1.4%) | 18 (1.5%) |
| 9:00 AM to 9:59 AM | 35 (2.6%) | 103 (8.7%) |
| 10:00 AM to 10:59 AM | 27 (2.0%) | 1 (0.1%) |
| 11:00 AM to 11:59 AM | 31 (2.3%) | 13 (1.1%) |
| 12:00 PM to 3:59 PM | 86 (6.5%) | 30 (2.5%) |
| 4:00 PM to 11:59 PM | 99 (7.5%) | 60 (5.1%) |
| Total | 1,327 (100.0%) | 1,186 (100.0%) |
Housing Occupancy in Refugio County
Occupancy by Ownership in Refugio County
Of the total 2,235 dwellings in Refugio County, owner-occupied units account for 1,694 (75.8%), while renter-occupied units make up 541 (24.2%).
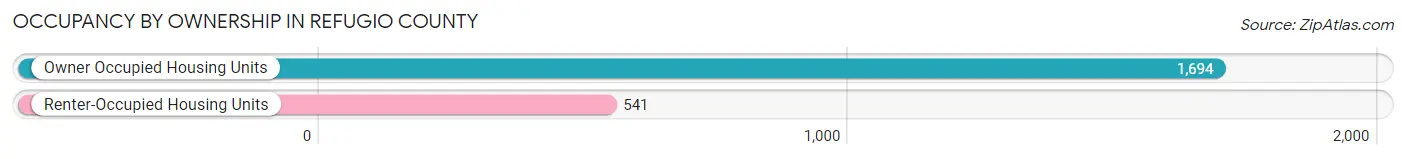
| Occupancy | # Housing Units | % Housing Units |
| Owner Occupied Housing Units | 1,694 | 75.8% |
| Renter-Occupied Housing Units | 541 | 24.2% |
| Total Occupied Housing Units | 2,235 | 100.0% |
Occupancy by Household Size in Refugio County
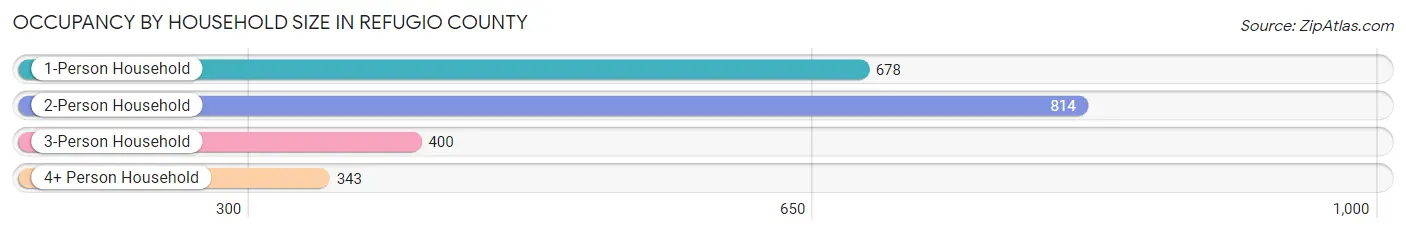
| Household Size | # Housing Units | % Housing Units |
| 1-Person Household | 678 | 30.3% |
| 2-Person Household | 814 | 36.4% |
| 3-Person Household | 400 | 17.9% |
| 4+ Person Household | 343 | 15.3% |
| Total Housing Units | 2,235 | 100.0% |
Occupancy by Ownership by Household Size in Refugio County
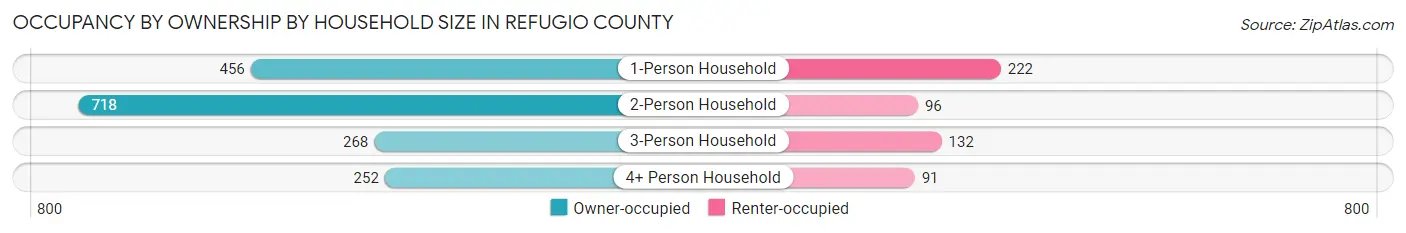
| Household Size | Owner-occupied | Renter-occupied |
| 1-Person Household | 456 (67.3%) | 222 (32.7%) |
| 2-Person Household | 718 (88.2%) | 96 (11.8%) |
| 3-Person Household | 268 (67.0%) | 132 (33.0%) |
| 4+ Person Household | 252 (73.5%) | 91 (26.5%) |
| Total Housing Units | 1,694 (75.8%) | 541 (24.2%) |
Occupancy by Educational Attainment in Refugio County
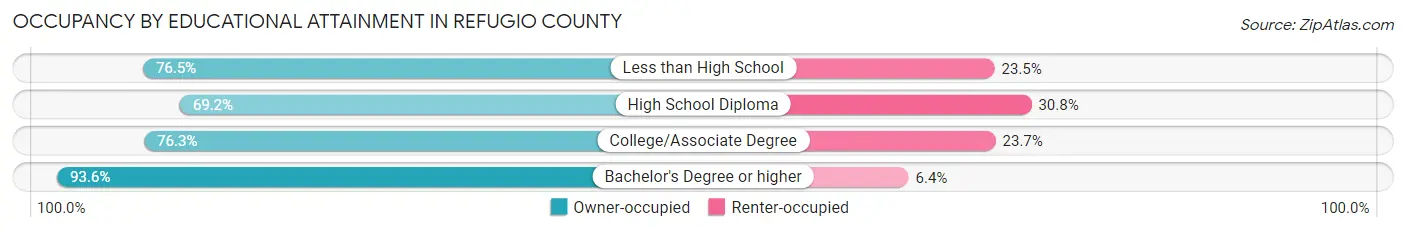
| Household Size | Owner-occupied | Renter-occupied |
| Less than High School | 238 (76.5%) | 73 (23.5%) |
| High School Diploma | 643 (69.2%) | 286 (30.8%) |
| College/Associate Degree | 522 (76.3%) | 162 (23.7%) |
| Bachelor's Degree or higher | 291 (93.6%) | 20 (6.4%) |
Occupancy by Age of Householder in Refugio County
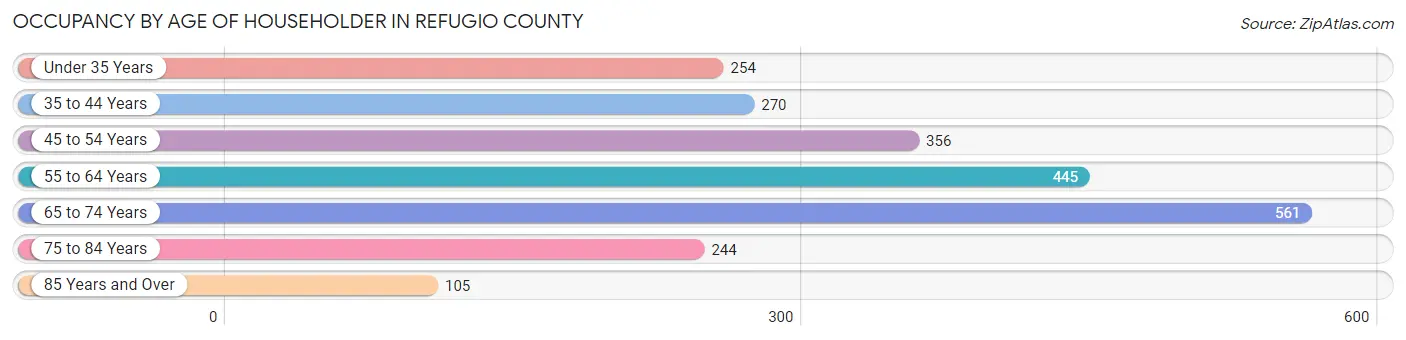
| Age Bracket | # Households | % Households |
| Under 35 Years | 254 | 11.4% |
| 35 to 44 Years | 270 | 12.1% |
| 45 to 54 Years | 356 | 15.9% |
| 55 to 64 Years | 445 | 19.9% |
| 65 to 74 Years | 561 | 25.1% |
| 75 to 84 Years | 244 | 10.9% |
| 85 Years and Over | 105 | 4.7% |
| Total | 2,235 | 100.0% |
Housing Finances in Refugio County
Median Income by Occupancy in Refugio County
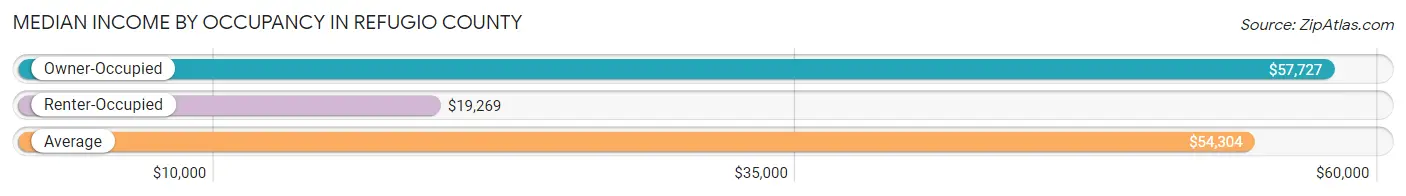
| Occupancy Type | # Households | Median Income |
| Owner-Occupied | 1,694 (75.8%) | $57,727 |
| Renter-Occupied | 541 (24.2%) | $19,269 |
| Average | 2,235 (100.0%) | $54,304 |
Occupancy by Householder Income Bracket in Refugio County
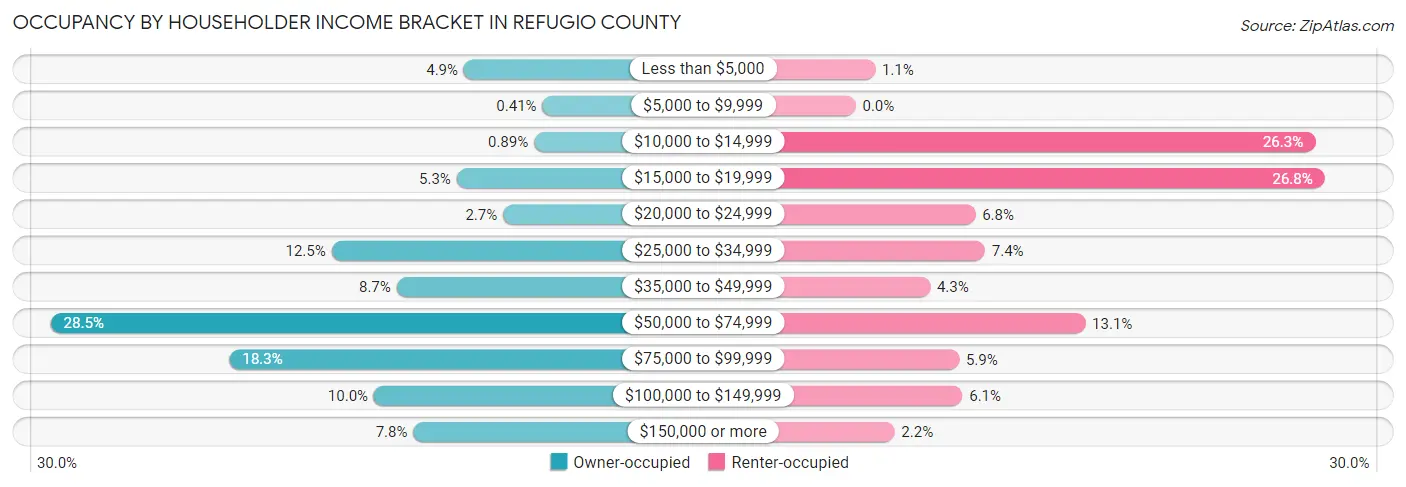
| Income Bracket | Owner-occupied | Renter-occupied |
| Less than $5,000 | 83 (4.9%) | 6 (1.1%) |
| $5,000 to $9,999 | 7 (0.4%) | 0 (0.0%) |
| $10,000 to $14,999 | 15 (0.9%) | 142 (26.3%) |
| $15,000 to $19,999 | 90 (5.3%) | 145 (26.8%) |
| $20,000 to $24,999 | 45 (2.7%) | 37 (6.8%) |
| $25,000 to $34,999 | 211 (12.5%) | 40 (7.4%) |
| $35,000 to $49,999 | 148 (8.7%) | 23 (4.3%) |
| $50,000 to $74,999 | 483 (28.5%) | 71 (13.1%) |
| $75,000 to $99,999 | 310 (18.3%) | 32 (5.9%) |
| $100,000 to $149,999 | 170 (10.0%) | 33 (6.1%) |
| $150,000 or more | 132 (7.8%) | 12 (2.2%) |
| Total | 1,694 (100.0%) | 541 (100.0%) |
Monthly Housing Cost Tiers in Refugio County
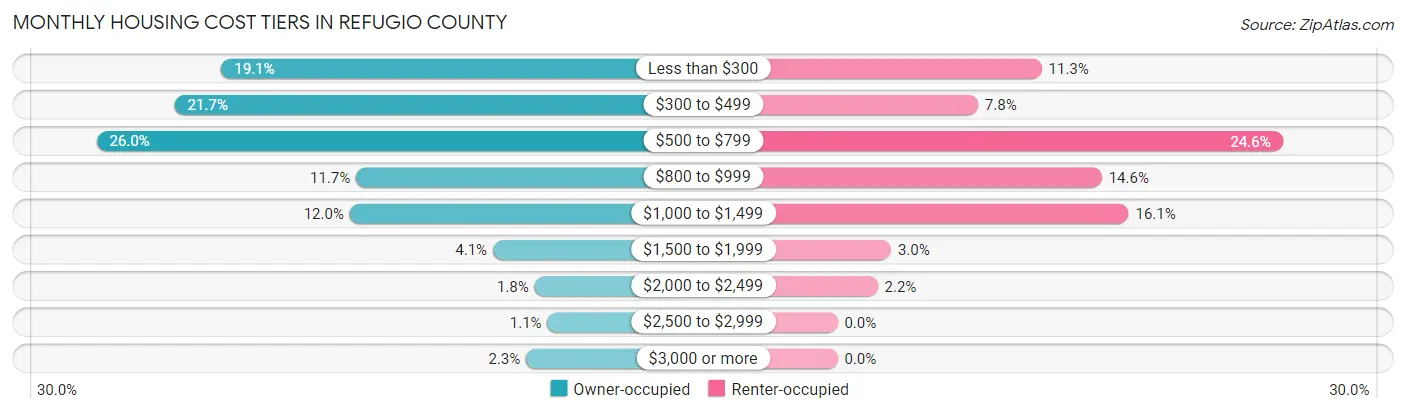
| Monthly Cost | Owner-occupied | Renter-occupied |
| Less than $300 | 324 (19.1%) | 61 (11.3%) |
| $300 to $499 | 368 (21.7%) | 42 (7.8%) |
| $500 to $799 | 441 (26.0%) | 133 (24.6%) |
| $800 to $999 | 198 (11.7%) | 79 (14.6%) |
| $1,000 to $1,499 | 204 (12.0%) | 87 (16.1%) |
| $1,500 to $1,999 | 70 (4.1%) | 16 (3.0%) |
| $2,000 to $2,499 | 31 (1.8%) | 12 (2.2%) |
| $2,500 to $2,999 | 19 (1.1%) | 0 (0.0%) |
| $3,000 or more | 39 (2.3%) | 0 (0.0%) |
| Total | 1,694 (100.0%) | 541 (100.0%) |
Physical Housing Characteristics in Refugio County
Housing Structures in Refugio County
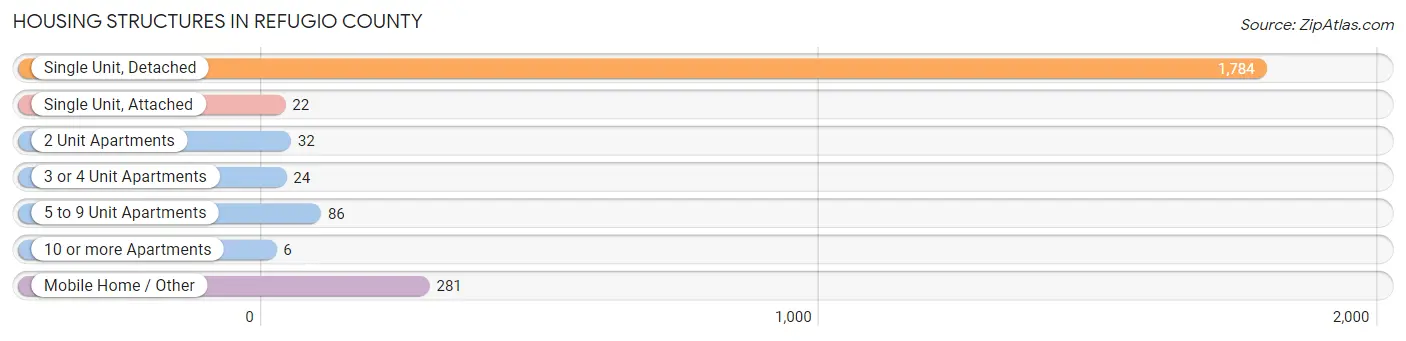
| Structure Type | # Housing Units | % Housing Units |
| Single Unit, Detached | 1,784 | 79.8% |
| Single Unit, Attached | 22 | 1.0% |
| 2 Unit Apartments | 32 | 1.4% |
| 3 or 4 Unit Apartments | 24 | 1.1% |
| 5 to 9 Unit Apartments | 86 | 3.8% |
| 10 or more Apartments | 6 | 0.3% |
| Mobile Home / Other | 281 | 12.6% |
| Total | 2,235 | 100.0% |
Housing Structures by Occupancy in Refugio County
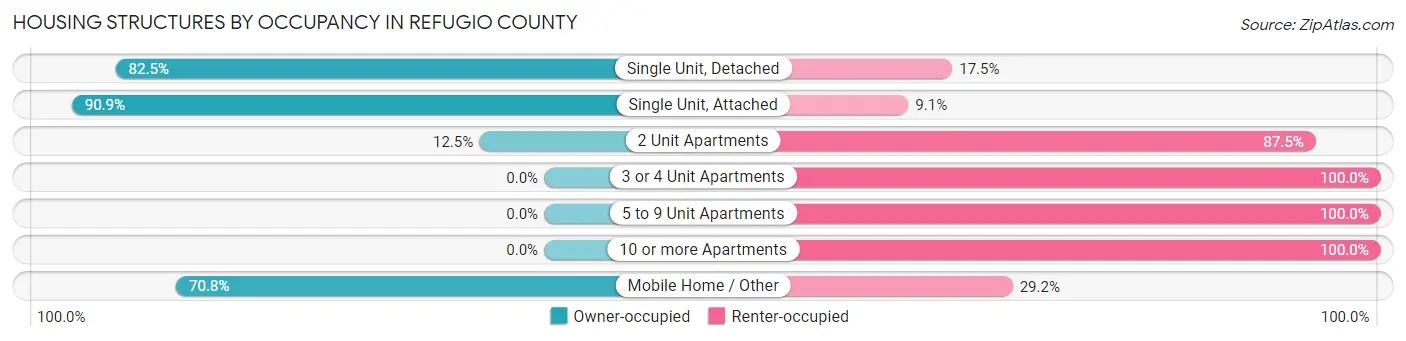
| Structure Type | Owner-occupied | Renter-occupied |
| Single Unit, Detached | 1,471 (82.5%) | 313 (17.5%) |
| Single Unit, Attached | 20 (90.9%) | 2 (9.1%) |
| 2 Unit Apartments | 4 (12.5%) | 28 (87.5%) |
| 3 or 4 Unit Apartments | 0 (0.0%) | 24 (100.0%) |
| 5 to 9 Unit Apartments | 0 (0.0%) | 86 (100.0%) |
| 10 or more Apartments | 0 (0.0%) | 6 (100.0%) |
| Mobile Home / Other | 199 (70.8%) | 82 (29.2%) |
| Total | 1,694 (75.8%) | 541 (24.2%) |
Housing Structures by Number of Rooms in Refugio County
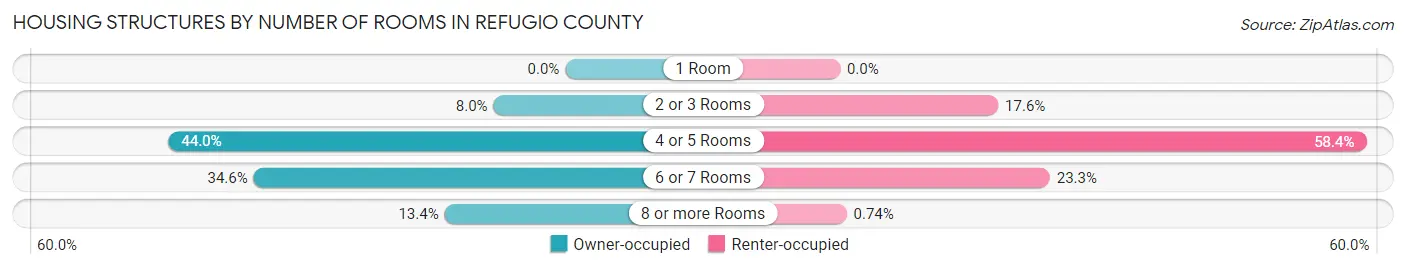
| Number of Rooms | Owner-occupied | Renter-occupied |
| 1 Room | 0 (0.0%) | 0 (0.0%) |
| 2 or 3 Rooms | 135 (8.0%) | 95 (17.6%) |
| 4 or 5 Rooms | 746 (44.0%) | 316 (58.4%) |
| 6 or 7 Rooms | 586 (34.6%) | 126 (23.3%) |
| 8 or more Rooms | 227 (13.4%) | 4 (0.7%) |
| Total | 1,694 (100.0%) | 541 (100.0%) |
Housing Structure by Heating Type in Refugio County
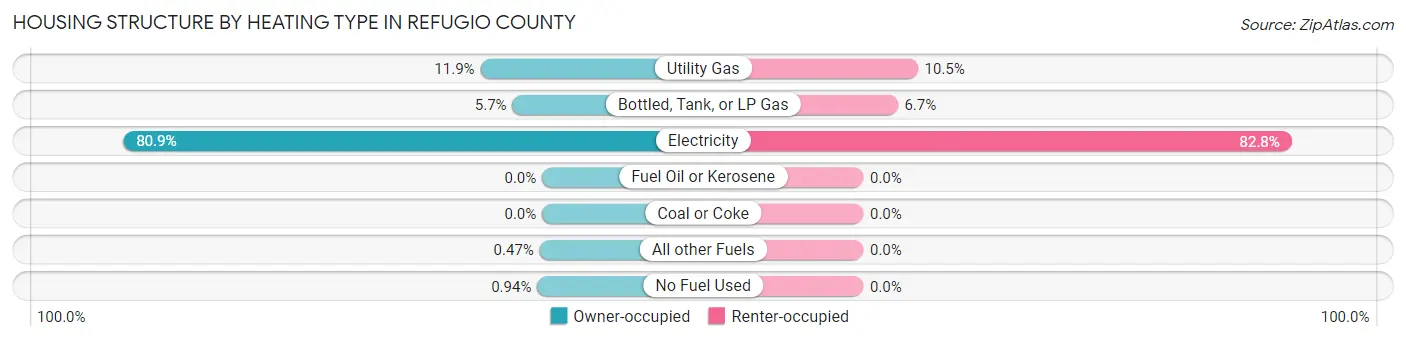
| Heating Type | Owner-occupied | Renter-occupied |
| Utility Gas | 202 (11.9%) | 57 (10.5%) |
| Bottled, Tank, or LP Gas | 97 (5.7%) | 36 (6.7%) |
| Electricity | 1,371 (80.9%) | 448 (82.8%) |
| Fuel Oil or Kerosene | 0 (0.0%) | 0 (0.0%) |
| Coal or Coke | 0 (0.0%) | 0 (0.0%) |
| All other Fuels | 8 (0.5%) | 0 (0.0%) |
| No Fuel Used | 16 (0.9%) | 0 (0.0%) |
| Total | 1,694 (100.0%) | 541 (100.0%) |
Household Vehicle Usage in Refugio County
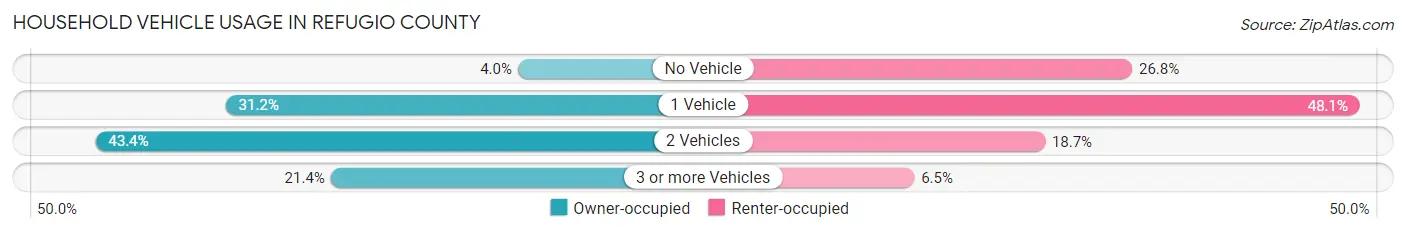
| Vehicles per Household | Owner-occupied | Renter-occupied |
| No Vehicle | 67 (4.0%) | 145 (26.8%) |
| 1 Vehicle | 529 (31.2%) | 260 (48.1%) |
| 2 Vehicles | 735 (43.4%) | 101 (18.7%) |
| 3 or more Vehicles | 363 (21.4%) | 35 (6.5%) |
| Total | 1,694 (100.0%) | 541 (100.0%) |
Real Estate & Mortgages in Refugio County
Real Estate and Mortgage Overview in Refugio County
| Characteristic | Without Mortgage | With Mortgage |
| Housing Units | 1,156 | 538 |
| Median Property Value | $87,500 | $96,600 |
| Median Household Income | $55,033 | $35 |
| Monthly Housing Costs | $438 | $39 |
| Real Estate Taxes | $1,227 | $26 |
Property Value by Mortgage Status in Refugio County
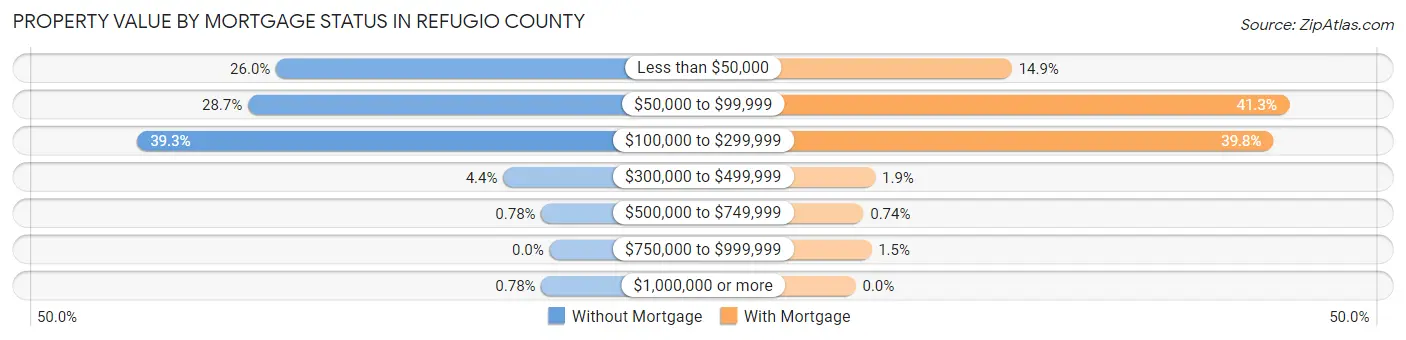
| Property Value | Without Mortgage | With Mortgage |
| Less than $50,000 | 301 (26.0%) | 80 (14.9%) |
| $50,000 to $99,999 | 332 (28.7%) | 222 (41.3%) |
| $100,000 to $299,999 | 454 (39.3%) | 214 (39.8%) |
| $300,000 to $499,999 | 51 (4.4%) | 10 (1.9%) |
| $500,000 to $749,999 | 9 (0.8%) | 4 (0.7%) |
| $750,000 to $999,999 | 0 (0.0%) | 8 (1.5%) |
| $1,000,000 or more | 9 (0.8%) | 0 (0.0%) |
| Total | 1,156 (100.0%) | 538 (100.0%) |
Household Income by Mortgage Status in Refugio County
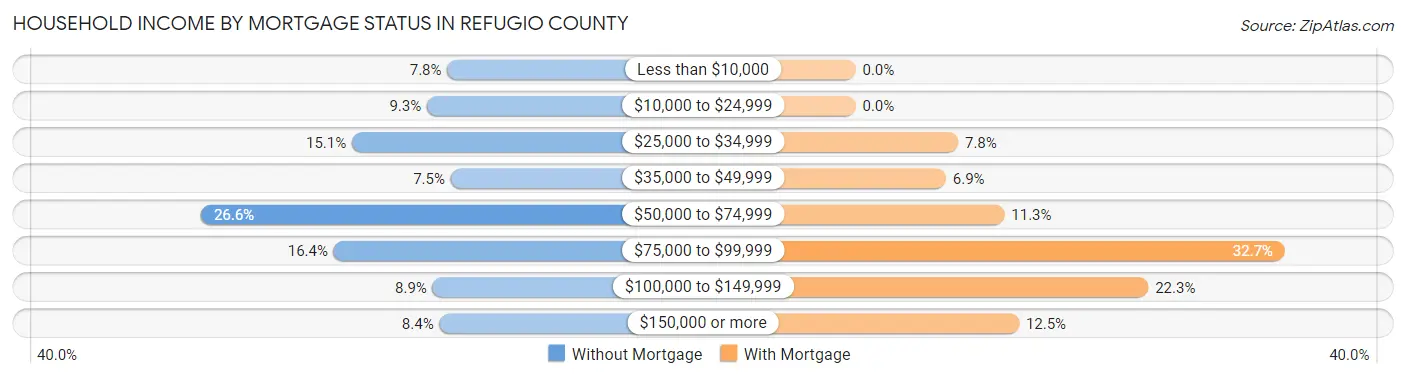
| Household Income | Without Mortgage | With Mortgage |
| Less than $10,000 | 90 (7.8%) | 0 (0.0%) |
| $10,000 to $24,999 | 108 (9.3%) | 0 (0.0%) |
| $25,000 to $34,999 | 174 (15.0%) | 42 (7.8%) |
| $35,000 to $49,999 | 87 (7.5%) | 37 (6.9%) |
| $50,000 to $74,999 | 307 (26.6%) | 61 (11.3%) |
| $75,000 to $99,999 | 190 (16.4%) | 176 (32.7%) |
| $100,000 to $149,999 | 103 (8.9%) | 120 (22.3%) |
| $150,000 or more | 97 (8.4%) | 67 (12.4%) |
| Total | 1,156 (100.0%) | 538 (100.0%) |
Property Value to Household Income Ratio in Refugio County
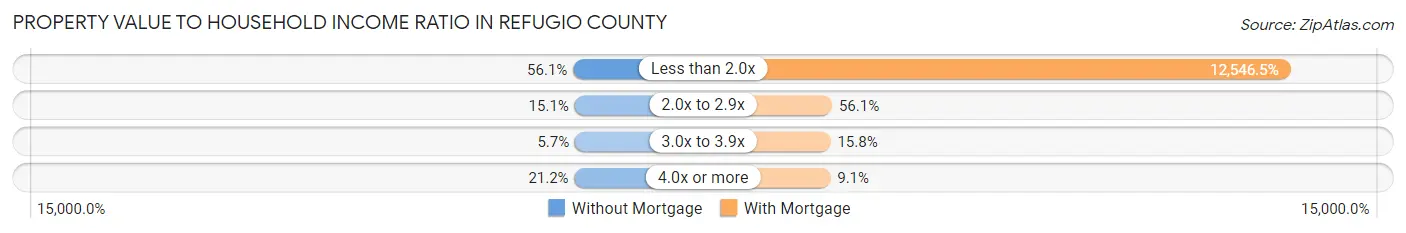
| Value-to-Income Ratio | Without Mortgage | With Mortgage |
| Less than 2.0x | 649 (56.1%) | 67,500 (12,546.5%) |
| 2.0x to 2.9x | 174 (15.0%) | 302 (56.1%) |
| 3.0x to 3.9x | 66 (5.7%) | 85 (15.8%) |
| 4.0x or more | 245 (21.2%) | 49 (9.1%) |
| Total | 1,156 (100.0%) | 538 (100.0%) |
Real Estate Taxes by Mortgage Status in Refugio County
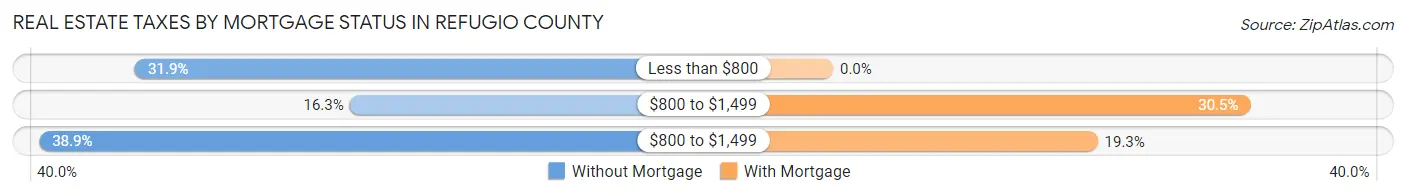
| Property Taxes | Without Mortgage | With Mortgage |
| Less than $800 | 369 (31.9%) | 0 (0.0%) |
| $800 to $1,499 | 188 (16.3%) | 164 (30.5%) |
| $800 to $1,499 | 450 (38.9%) | 104 (19.3%) |
| Total | 1,156 (100.0%) | 538 (100.0%) |
Health & Disability in Refugio County
Health Insurance Coverage by Age in Refugio County
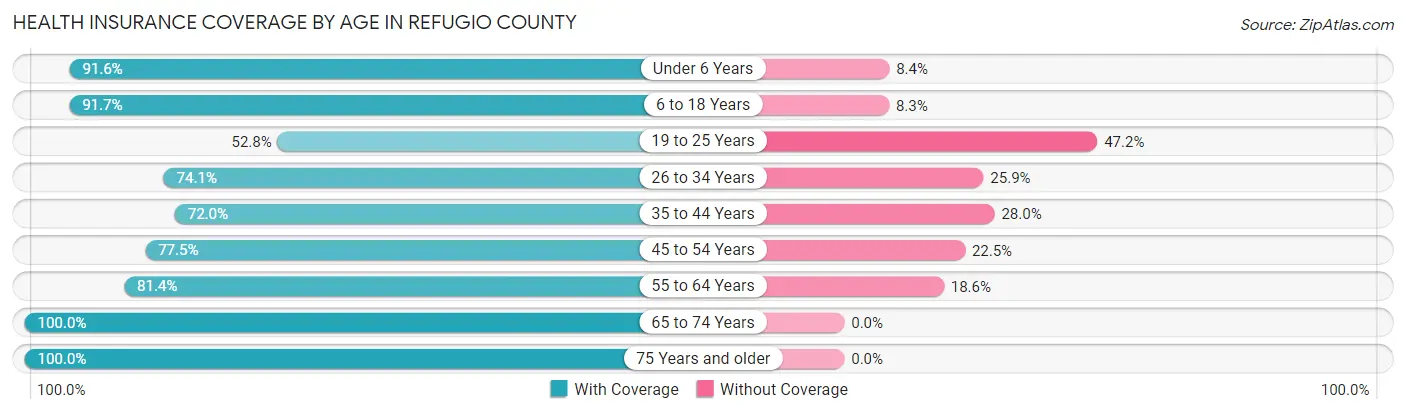
| Age Bracket | With Coverage | Without Coverage |
| Under 6 Years | 394 (91.6%) | 36 (8.4%) |
| 6 to 18 Years | 1,133 (91.7%) | 103 (8.3%) |
| 19 to 25 Years | 196 (52.8%) | 175 (47.2%) |
| 26 to 34 Years | 608 (74.1%) | 213 (25.9%) |
| 35 to 44 Years | 437 (72.0%) | 170 (28.0%) |
| 45 to 54 Years | 596 (77.5%) | 173 (22.5%) |
| 55 to 64 Years | 733 (81.4%) | 167 (18.6%) |
| 65 to 74 Years | 853 (100.0%) | 0 (0.0%) |
| 75 Years and older | 575 (100.0%) | 0 (0.0%) |
| Total | 5,525 (84.2%) | 1,037 (15.8%) |
Health Insurance Coverage by Citizenship Status in Refugio County
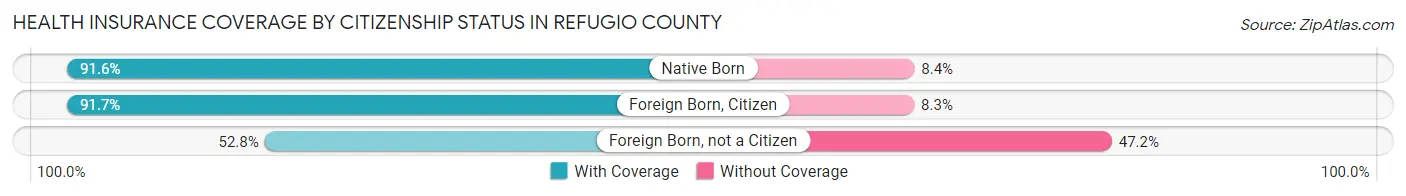
| Citizenship Status | With Coverage | Without Coverage |
| Native Born | 394 (91.6%) | 36 (8.4%) |
| Foreign Born, Citizen | 1,133 (91.7%) | 103 (8.3%) |
| Foreign Born, not a Citizen | 196 (52.8%) | 175 (47.2%) |
Health Insurance Coverage by Household Income in Refugio County
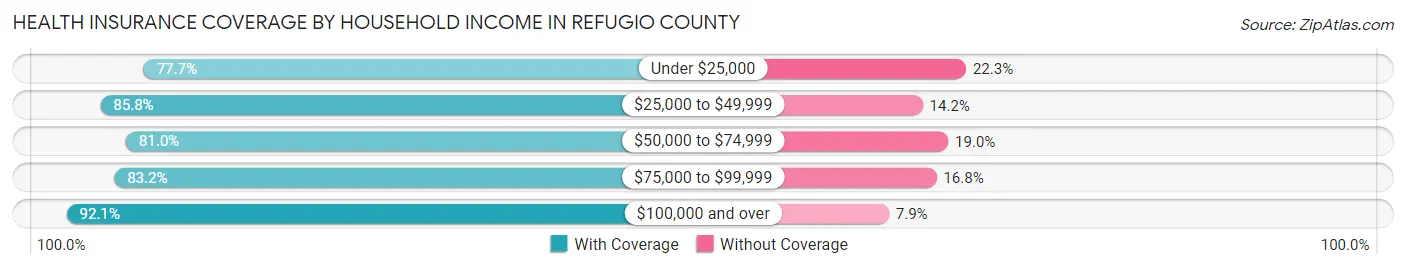
| Household Income | With Coverage | Without Coverage |
| Under $25,000 | 967 (77.7%) | 278 (22.3%) |
| $25,000 to $49,999 | 851 (85.8%) | 141 (14.2%) |
| $50,000 to $74,999 | 1,267 (81.0%) | 297 (19.0%) |
| $75,000 to $99,999 | 966 (83.2%) | 195 (16.8%) |
| $100,000 and over | 1,473 (92.1%) | 126 (7.9%) |
Public vs Private Health Insurance Coverage by Age in Refugio County
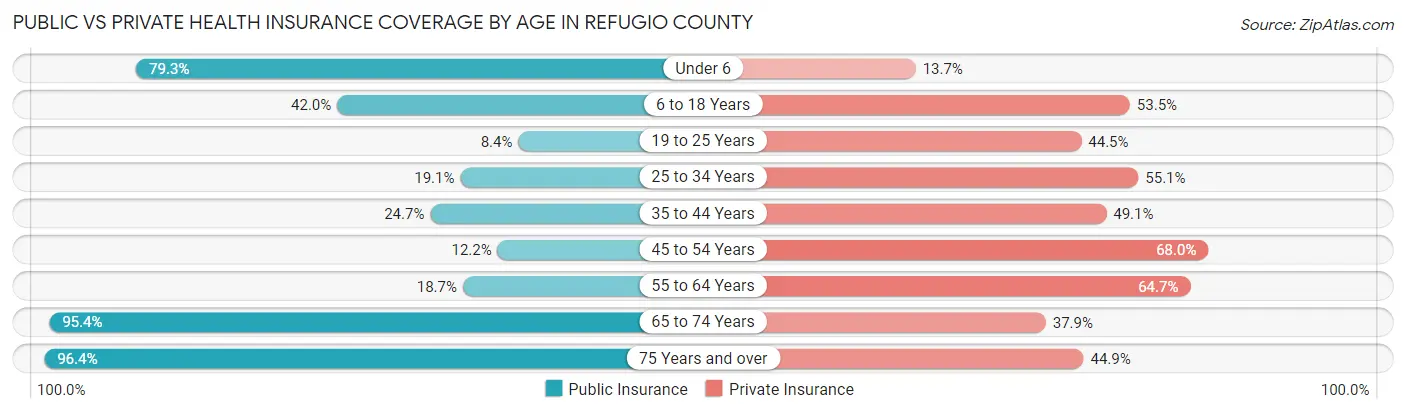
| Age Bracket | Public Insurance | Private Insurance |
| Under 6 | 341 (79.3%) | 59 (13.7%) |
| 6 to 18 Years | 519 (42.0%) | 661 (53.5%) |
| 19 to 25 Years | 31 (8.4%) | 165 (44.5%) |
| 25 to 34 Years | 157 (19.1%) | 452 (55.0%) |
| 35 to 44 Years | 150 (24.7%) | 298 (49.1%) |
| 45 to 54 Years | 94 (12.2%) | 523 (68.0%) |
| 55 to 64 Years | 168 (18.7%) | 582 (64.7%) |
| 65 to 74 Years | 814 (95.4%) | 323 (37.9%) |
| 75 Years and over | 554 (96.4%) | 258 (44.9%) |
| Total | 2,828 (43.1%) | 3,321 (50.6%) |
Disability Status by Sex by Age in Refugio County
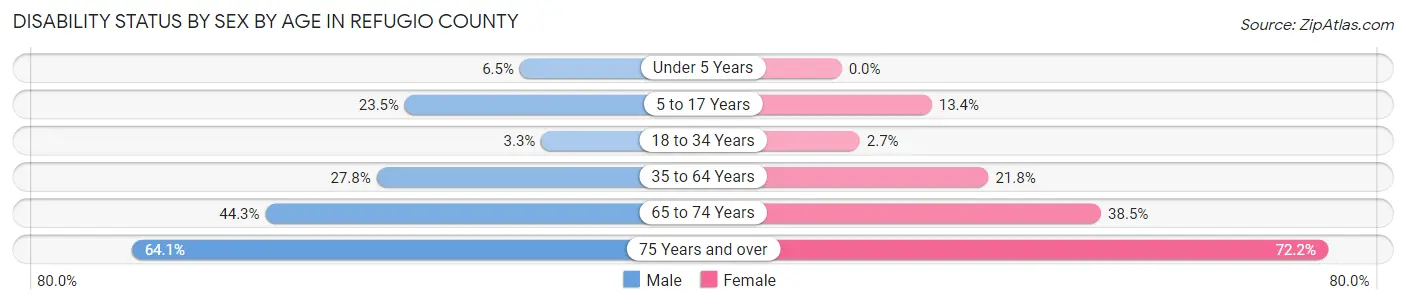
| Age Bracket | Male | Female |
| Under 5 Years | 11 (6.5%) | 0 (0.0%) |
| 5 to 17 Years | 108 (23.5%) | 91 (13.4%) |
| 18 to 34 Years | 22 (3.3%) | 18 (2.7%) |
| 35 to 64 Years | 308 (27.8%) | 254 (21.8%) |
| 65 to 74 Years | 181 (44.3%) | 171 (38.5%) |
| 75 Years and over | 166 (64.1%) | 228 (72.2%) |
Disability Class by Sex by Age in Refugio County
Disability Class: Hearing Difficulty
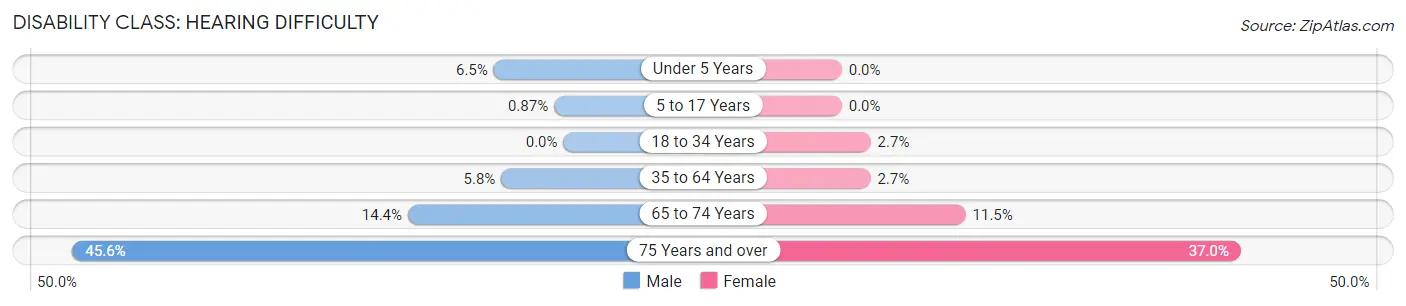
| Age Bracket | Male | Female |
| Under 5 Years | 11 (6.5%) | 0 (0.0%) |
| 5 to 17 Years | 4 (0.9%) | 0 (0.0%) |
| 18 to 34 Years | 0 (0.0%) | 18 (2.7%) |
| 35 to 64 Years | 64 (5.8%) | 31 (2.7%) |
| 65 to 74 Years | 59 (14.4%) | 51 (11.5%) |
| 75 Years and over | 118 (45.6%) | 117 (37.0%) |
Disability Class: Vision Difficulty
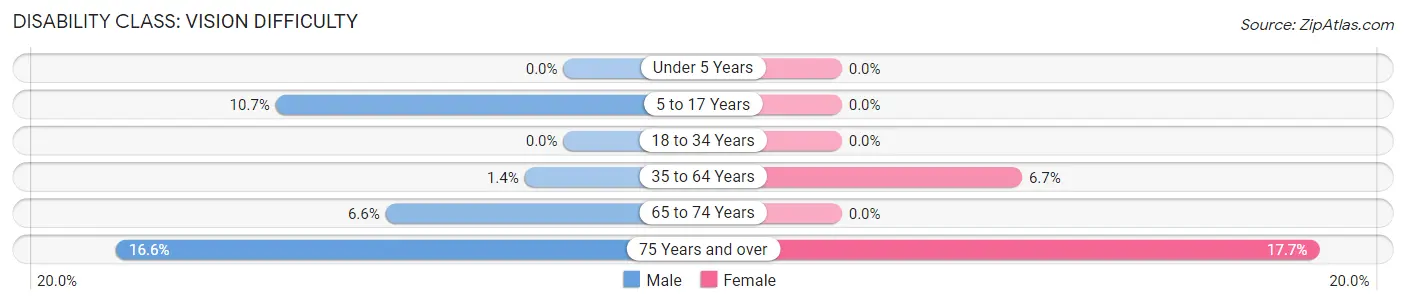
| Age Bracket | Male | Female |
| Under 5 Years | 0 (0.0%) | 0 (0.0%) |
| 5 to 17 Years | 49 (10.7%) | 0 (0.0%) |
| 18 to 34 Years | 0 (0.0%) | 0 (0.0%) |
| 35 to 64 Years | 16 (1.4%) | 78 (6.7%) |
| 65 to 74 Years | 27 (6.6%) | 0 (0.0%) |
| 75 Years and over | 43 (16.6%) | 56 (17.7%) |
Disability Class: Cognitive Difficulty
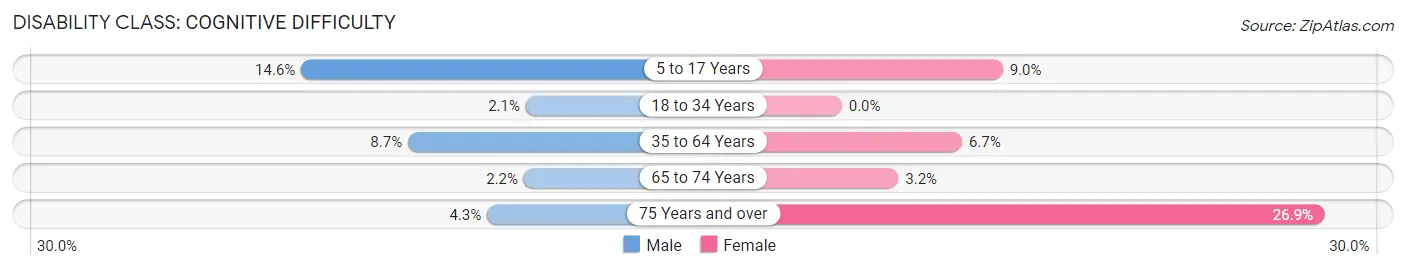
| Age Bracket | Male | Female |
| 5 to 17 Years | 67 (14.6%) | 61 (9.0%) |
| 18 to 34 Years | 14 (2.1%) | 0 (0.0%) |
| 35 to 64 Years | 96 (8.6%) | 78 (6.7%) |
| 65 to 74 Years | 9 (2.2%) | 14 (3.2%) |
| 75 Years and over | 11 (4.3%) | 85 (26.9%) |
Disability Class: Ambulatory Difficulty
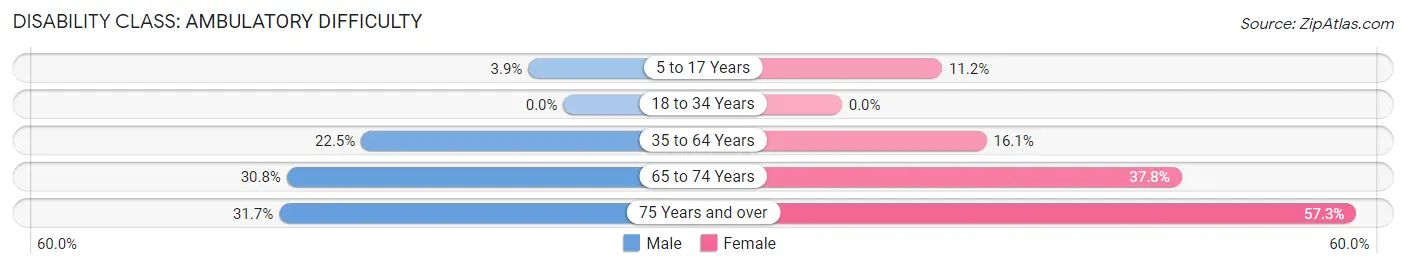
| Age Bracket | Male | Female |
| 5 to 17 Years | 18 (3.9%) | 76 (11.2%) |
| 18 to 34 Years | 0 (0.0%) | 0 (0.0%) |
| 35 to 64 Years | 250 (22.5%) | 188 (16.1%) |
| 65 to 74 Years | 126 (30.8%) | 168 (37.8%) |
| 75 Years and over | 82 (31.7%) | 181 (57.3%) |
Disability Class: Self-Care Difficulty
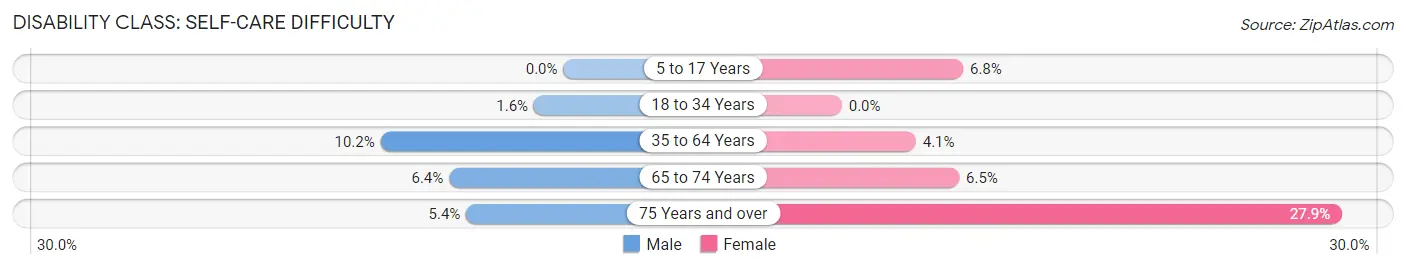
| Age Bracket | Male | Female |
| 5 to 17 Years | 0 (0.0%) | 46 (6.8%) |
| 18 to 34 Years | 11 (1.6%) | 0 (0.0%) |
| 35 to 64 Years | 113 (10.2%) | 48 (4.1%) |
| 65 to 74 Years | 26 (6.4%) | 29 (6.5%) |
| 75 Years and over | 14 (5.4%) | 88 (27.9%) |
Technology Access in Refugio County
Computing Device Access in Refugio County
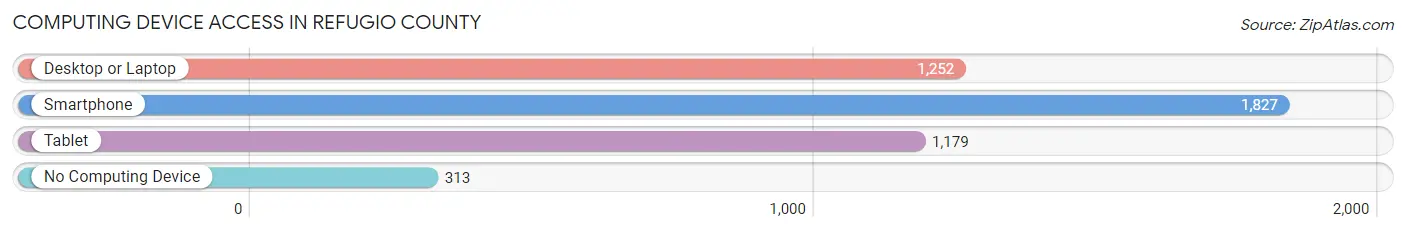
| Device Type | # Households | % Households |
| Desktop or Laptop | 1,252 | 56.0% |
| Smartphone | 1,827 | 81.7% |
| Tablet | 1,179 | 52.7% |
| No Computing Device | 313 | 14.0% |
| Total | 2,235 | 100.0% |
Internet Access in Refugio County
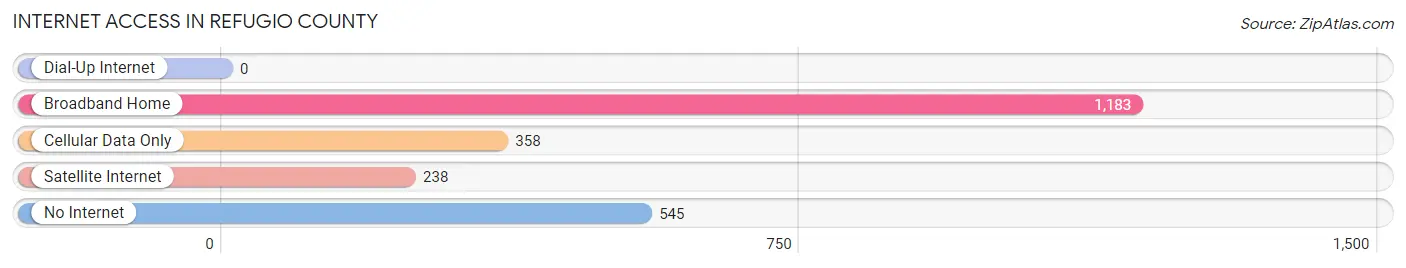
| Internet Type | # Households | % Households |
| Dial-Up Internet | 0 | 0.0% |
| Broadband Home | 1,183 | 52.9% |
| Cellular Data Only | 358 | 16.0% |
| Satellite Internet | 238 | 10.6% |
| No Internet | 545 | 24.4% |
| Total | 2,235 | 100.0% |
Refugio County Summary
Refugio County is located in the south-central region of Texas, along the Gulf Coast. It is bordered by San Patricio County to the north, Aransas County to the east, Calhoun County to the south, and Victoria County to the west. The county seat is Refugio, and the largest city is Woodsboro. The county has a total area of 890 square miles, of which 886 square miles is land and 4 square miles is water.
History
Refugio County was established in 1836 and named after the Spanish word for refuge. The county was originally part of San Patricio County, but was later divided into its own county. The county was originally populated by Native Americans, including the Karankawa, Coahuiltecan, and Tonkawa tribes. The first European settlers arrived in the area in the early 1800s, and the county was officially organized in 1836.
The county was home to several battles during the Texas Revolution, including the Battle of Refugio and the Battle of Coleto. After the war, the county experienced a period of growth and development, with the establishment of several towns and cities, including Refugio, Woodsboro, and Austwell.
Geography
Refugio County is located in the south-central region of Texas, along the Gulf Coast. It is bordered by San Patricio County to the north, Aransas County to the east, Calhoun County to the south, and Victoria County to the west. The county has a total area of 890 square miles, of which 886 square miles is land and 4 square miles is water.
The terrain of Refugio County is mostly flat, with some rolling hills in the northern part of the county. The county is home to several rivers, including the San Antonio River, the Aransas River, and the Nueces River. The county is also home to several lakes, including Lake Refugio, Lake Woodsboro, and Lake Austwell.
Economy
The economy of Refugio County is largely based on agriculture and oil and gas production. The county is home to several large farms, which produce a variety of crops, including cotton, corn, sorghum, and wheat. The county is also home to several oil and gas fields, which produce both crude oil and natural gas.
In addition to agriculture and oil and gas production, the county is also home to several manufacturing companies, including a paper mill, a plastics plant, and a metal fabrication plant. The county is also home to several tourism attractions, including the Refugio County Historical Museum and the Refugio County Fairgrounds.
Demographics
As of the 2010 census, Refugio County had a population of 7,383. The racial makeup of the county was 79.2% White, 0.7% African American, 0.5% Native American, 0.3% Asian, 0.1% Pacific Islander, 17.3% from other races, and 2.0% from two or more races. Hispanic or Latino of any race were 37.2% of the population.
The median income for a household in the county was $35,938, and the median income for a family was $41,944. The per capita income for the county was $17,845. About 17.2% of families and 21.3% of the population were below the poverty line, including 28.2% of those under age 18 and 16.2% of those age 65 or over.
Common Questions
What is Per Capita Income in Refugio County?
Per Capita income in Refugio County is $27,103.
What is the Median Family Income in Refugio County?
Median Family Income in Refugio County is $58,807.
What is the Median Household income in Refugio County?
Median Household Income in Refugio County is $54,304.
What is Income or Wage Gap in Refugio County?
Income or Wage Gap in Refugio County is 17.5%.
Women in Refugio County earn 82.5 cents for every dollar earned by a man.
What is Inequality or Gini Index in Refugio County?
Inequality or Gini Index in Refugio County is 0.46.
What is the Total Population of Refugio County?
Total Population of Refugio County is 6,718.
What is the Total Male Population of Refugio County?
Total Male Population of Refugio County is 3,179.
What is the Total Female Population of Refugio County?
Total Female Population of Refugio County is 3,539.
What is the Ratio of Males per 100 Females in Refugio County?
There are 89.83 Males per 100 Females in Refugio County.
What is the Ratio of Females per 100 Males in Refugio County?
There are 111.32 Females per 100 Males in Refugio County.
What is the Median Population Age in Refugio County?
Median Population Age in Refugio County is 42.9 Years.
What is the Average Family Size in Refugio County
Average Family Size in Refugio County is 3.9 People.
What is the Average Household Size in Refugio County
Average Household Size in Refugio County is 2.9 People.
How Large is the Labor Force in Refugio County?
There are 2,768 People in the Labor Forcein in Refugio County.
What is the Percentage of People in the Labor Force in Refugio County?
51.2% of People are in the Labor Force in Refugio County.
What is the Unemployment Rate in Refugio County?
Unemployment Rate in Refugio County is 5.6%.