Red River County, TX Map & Demographics
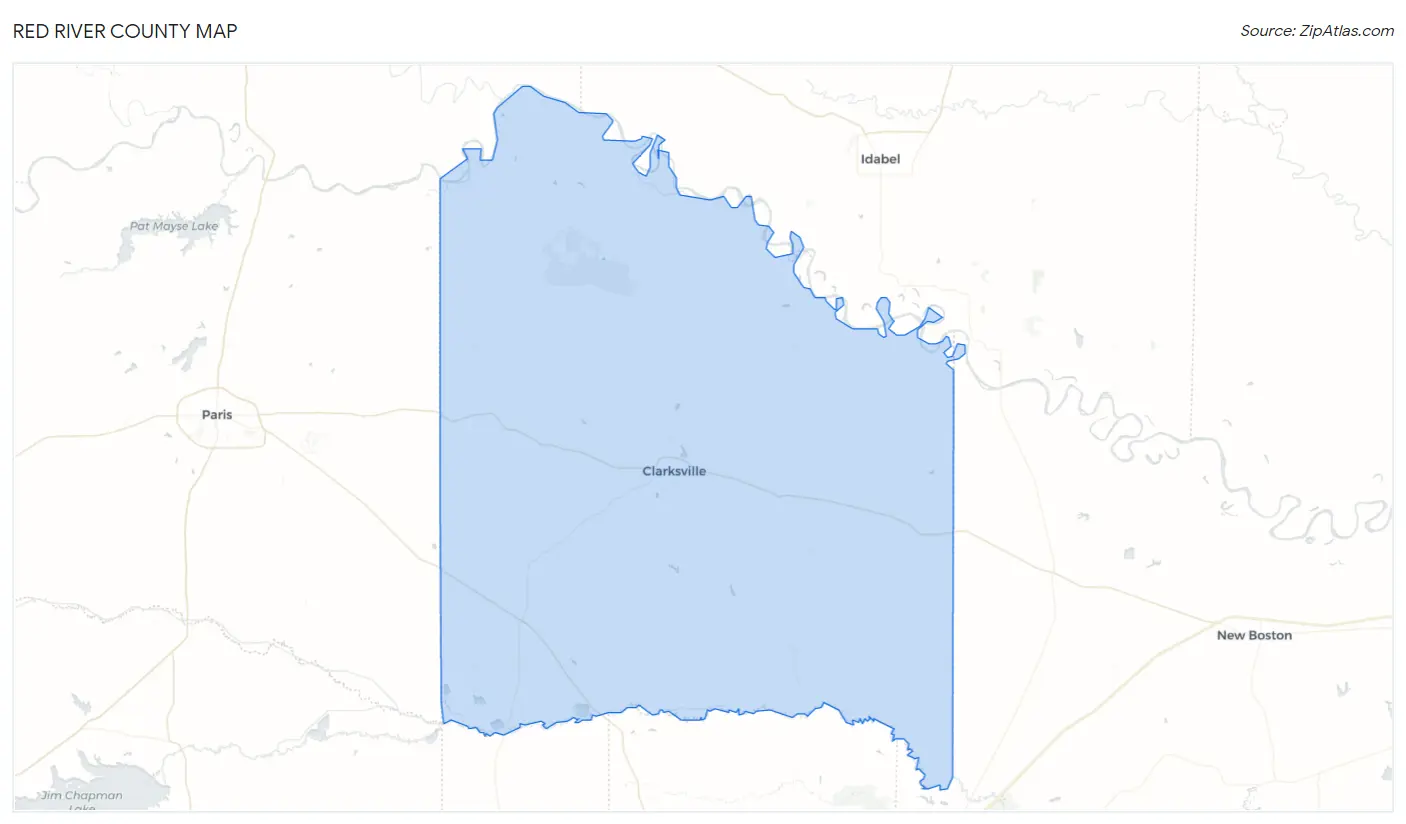
Red River County Map
Red River County Overview
$25,057
PER CAPITA INCOME
$58,968
AVG FAMILY INCOME
$44,583
AVG HOUSEHOLD INCOME
42.6%
WAGE / INCOME GAP [ % ]
57.4¢/ $1
WAGE / INCOME GAP [ $ ]
$9,990
FAMILY INCOME DEFICIT
0.45
INEQUALITY / GINI INDEX
11,627
TOTAL POPULATION
5,656
MALE POPULATION
5,971
FEMALE POPULATION
94.72
MALES / 100 FEMALES
105.57
FEMALES / 100 MALES
48.9
MEDIAN AGE
3.1
AVG FAMILY SIZE
2.5
AVG HOUSEHOLD SIZE
4,524
LABOR FORCE [ PEOPLE ]
47.2%
PERCENT IN LABOR FORCE
3.8%
UNEMPLOYMENT RATE
Red River County Area Codes
Income in Red River County
Income Overview in Red River County
Per Capita Income in Red River County is $25,057, while median incomes of families and households are $58,968 and $44,583 respectively.
| Characteristic | Number | Measure |
| Per Capita Income | 11,627 | $25,057 |
| Median Family Income | 3,096 | $58,968 |
| Mean Family Income | 3,096 | $72,282 |
| Median Household Income | 4,662 | $44,583 |
| Mean Household Income | 4,662 | $58,759 |
| Income Deficit | 3,096 | $9,990 |
| Wage / Income Gap (%) | 11,627 | 42.57% |
| Wage / Income Gap ($) | 11,627 | 57.43¢ per $1 |
| Gini / Inequality Index | 11,627 | 0.45 |
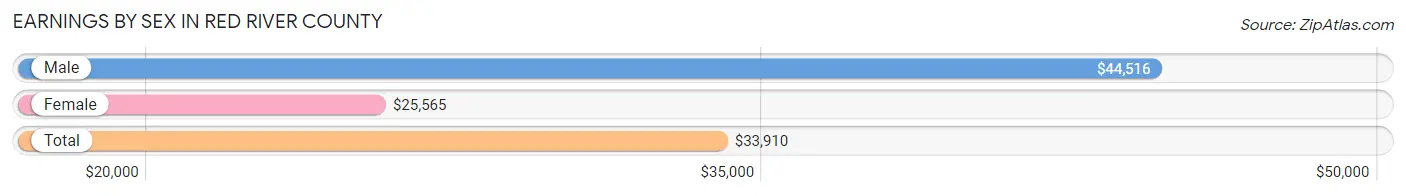
Earnings by Sex in Red River County
Average Earnings in Red River County are $33,910, $44,516 for men and $25,565 for women, a difference of 42.6%.
| Sex | Number | Average Earnings |
| Male | 2,643 (55.1%) | $44,516 |
| Female | 2,156 (44.9%) | $25,565 |
| Total | 4,799 (100.0%) | $33,910 |
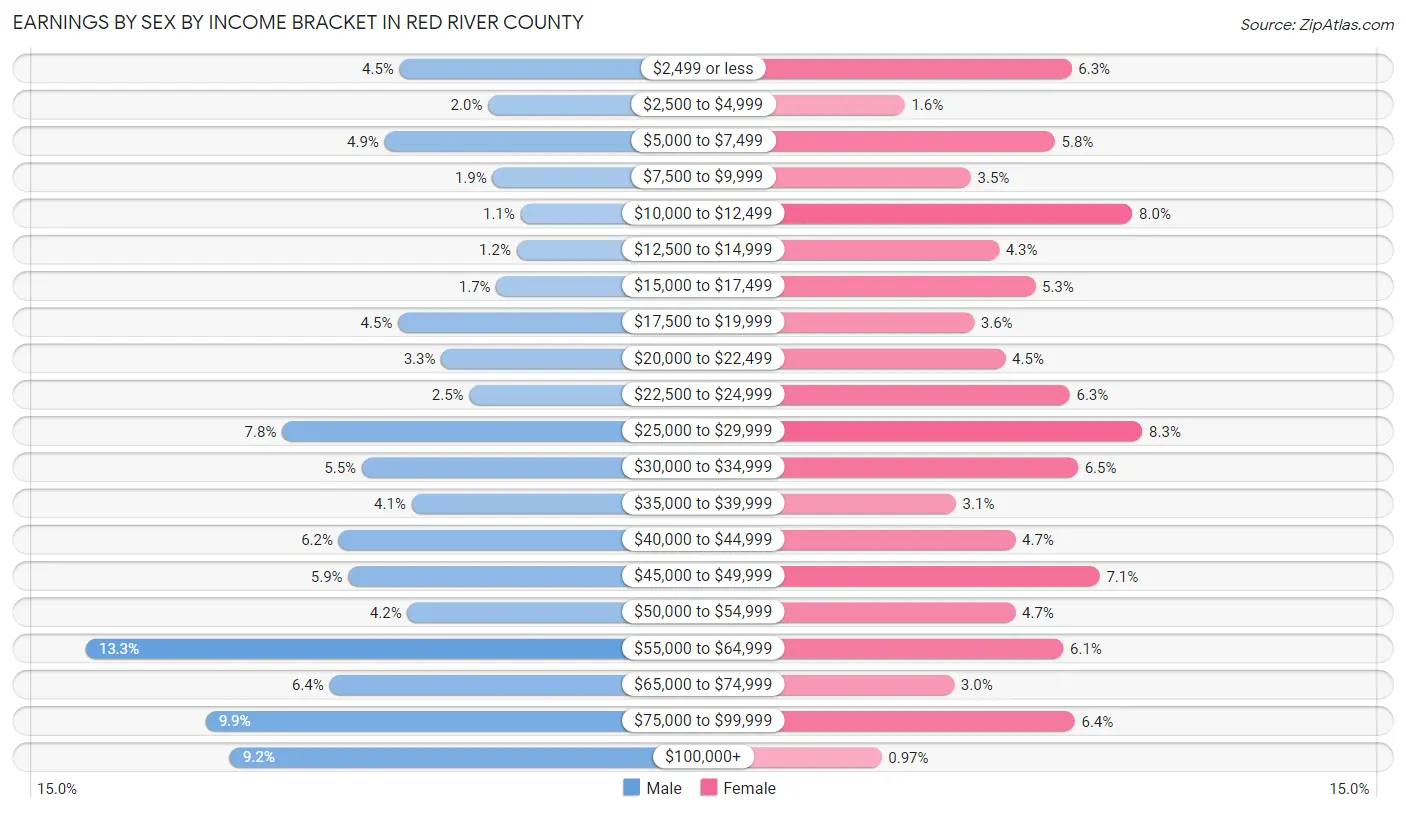
Earnings by Sex by Income Bracket in Red River County
The most common earnings brackets in Red River County are $55,000 to $64,999 for men (351 | 13.3%) and $25,000 to $29,999 for women (179 | 8.3%).
| Income | Male | Female |
| $2,499 or less | 118 (4.5%) | 136 (6.3%) |
| $2,500 to $4,999 | 52 (2.0%) | 35 (1.6%) |
| $5,000 to $7,499 | 129 (4.9%) | 126 (5.8%) |
| $7,500 to $9,999 | 49 (1.8%) | 75 (3.5%) |
| $10,000 to $12,499 | 28 (1.1%) | 173 (8.0%) |
| $12,500 to $14,999 | 31 (1.2%) | 92 (4.3%) |
| $15,000 to $17,499 | 46 (1.7%) | 114 (5.3%) |
| $17,500 to $19,999 | 119 (4.5%) | 77 (3.6%) |
| $20,000 to $22,499 | 87 (3.3%) | 96 (4.4%) |
| $22,500 to $24,999 | 66 (2.5%) | 135 (6.3%) |
| $25,000 to $29,999 | 205 (7.8%) | 179 (8.3%) |
| $30,000 to $34,999 | 146 (5.5%) | 140 (6.5%) |
| $35,000 to $39,999 | 109 (4.1%) | 66 (3.1%) |
| $40,000 to $44,999 | 163 (6.2%) | 102 (4.7%) |
| $45,000 to $49,999 | 156 (5.9%) | 153 (7.1%) |
| $50,000 to $54,999 | 112 (4.2%) | 102 (4.7%) |
| $55,000 to $64,999 | 351 (13.3%) | 131 (6.1%) |
| $65,000 to $74,999 | 170 (6.4%) | 65 (3.0%) |
| $75,000 to $99,999 | 262 (9.9%) | 138 (6.4%) |
| $100,000+ | 244 (9.2%) | 21 (1.0%) |
| Total | 2,643 (100.0%) | 2,156 (100.0%) |
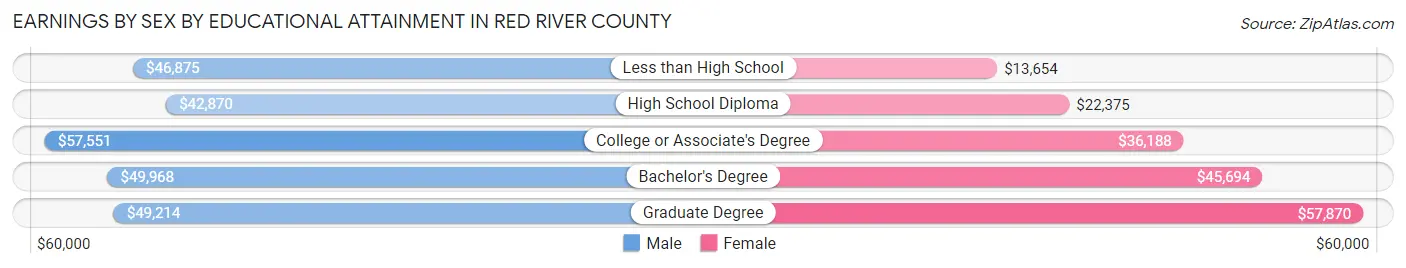
Earnings by Sex by Educational Attainment in Red River County
Average earnings in Red River County are $49,085 for men and $28,438 for women, a difference of 42.1%. Men with an educational attainment of college or associate's degree enjoy the highest average annual earnings of $57,551, while those with high school diploma education earn the least with $42,870. Women with an educational attainment of graduate degree earn the most with the average annual earnings of $57,870, while those with less than high school education have the smallest earnings of $13,654.
| Educational Attainment | Male Income | Female Income |
| Less than High School | $46,875 | $13,654 |
| High School Diploma | $42,870 | $22,375 |
| College or Associate's Degree | $57,551 | $36,188 |
| Bachelor's Degree | $49,968 | $45,694 |
| Graduate Degree | $49,214 | $57,870 |
| Total | $49,085 | $28,438 |
Family Income in Red River County
Family Income Brackets in Red River County
According to the Red River County family income data, there are 724 families falling into the $50,000 to $74,999 income range, which is the most common income bracket and makes up 23.4% of all families. Conversely, the $200,000+ income bracket is the least frequent group with only 50 families (1.6%) belonging to this category.
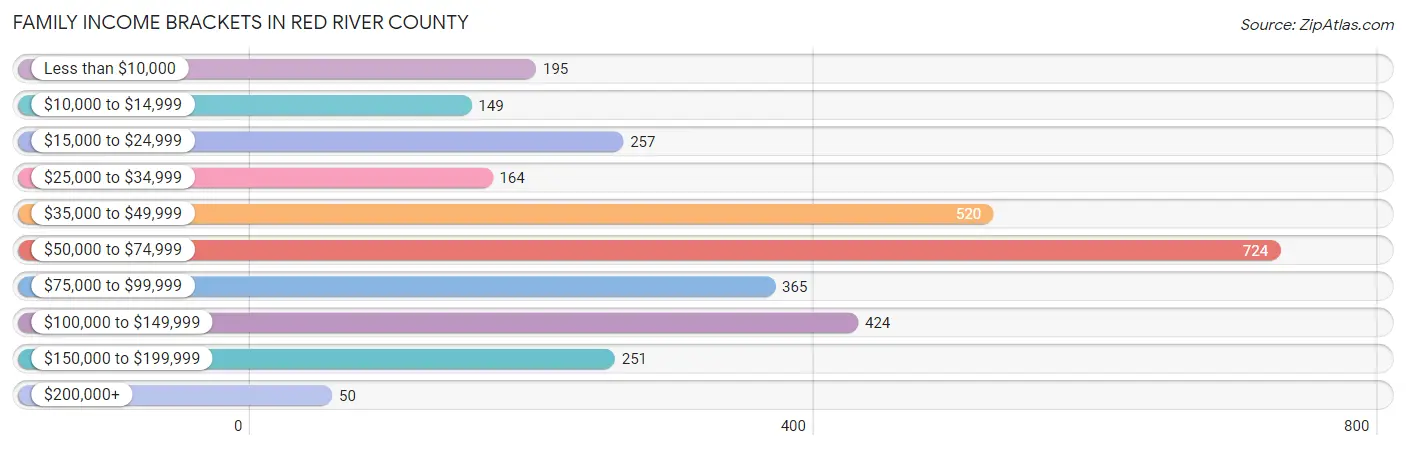
| Income Bracket | # Families | % Families |
| Less than $10,000 | 195 | 6.3% |
| $10,000 to $14,999 | 149 | 4.8% |
| $15,000 to $24,999 | 257 | 8.3% |
| $25,000 to $34,999 | 164 | 5.3% |
| $35,000 to $49,999 | 520 | 16.8% |
| $50,000 to $74,999 | 724 | 23.4% |
| $75,000 to $99,999 | 365 | 11.8% |
| $100,000 to $149,999 | 424 | 13.7% |
| $150,000 to $199,999 | 251 | 8.1% |
| $200,000+ | 50 | 1.6% |
Family Income by Famaliy Size in Red River County
4-person families (412 | 13.3%) account for the highest median family income in Red River County with $85,139 per family, while 3-person families (490 | 15.8%) have the highest median income of $24,074 per family member.
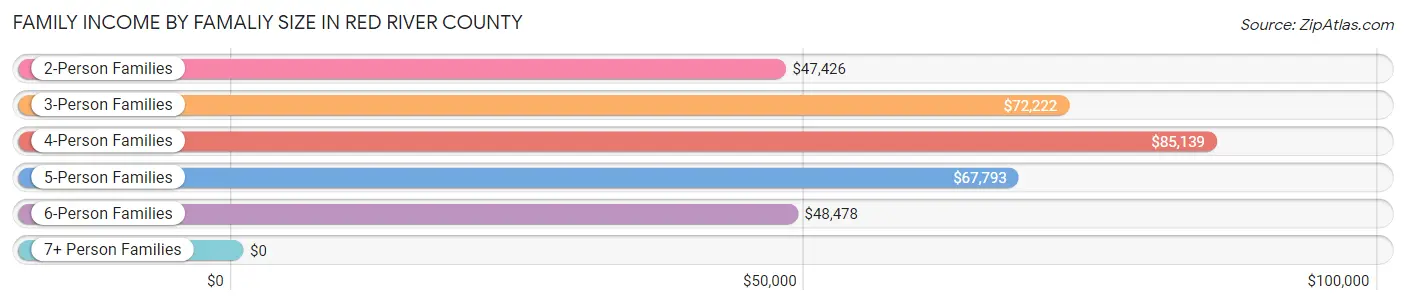
| Income Bracket | # Families | Median Income |
| 2-Person Families | 1,792 (57.9%) | $47,426 |
| 3-Person Families | 490 (15.8%) | $72,222 |
| 4-Person Families | 412 (13.3%) | $85,139 |
| 5-Person Families | 301 (9.7%) | $67,793 |
| 6-Person Families | 92 (3.0%) | $48,478 |
| 7+ Person Families | 9 (0.3%) | $0 |
| Total | 3,096 (100.0%) | $58,968 |
Family Income by Number of Earners in Red River County
The median family income in Red River County is $58,968, with families comprising 3+ earners (131) having the highest median family income of $130,104, while families with no earners (810) have the lowest median family income of $25,109, accounting for 4.2% and 26.2% of families, respectively.
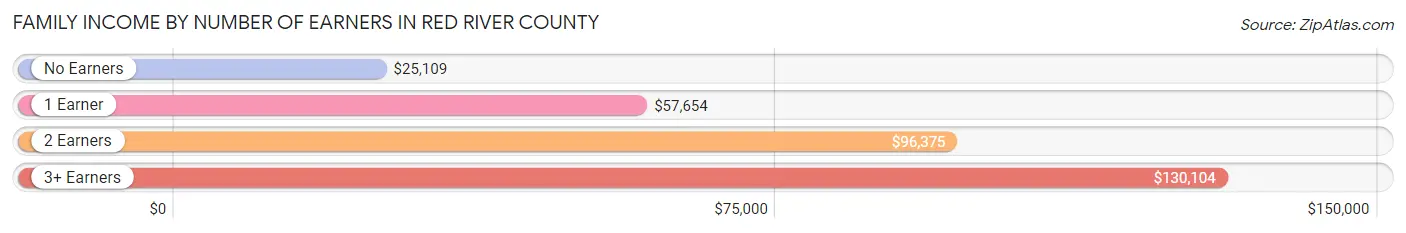
| Number of Earners | # Families | Median Income |
| No Earners | 810 (26.2%) | $25,109 |
| 1 Earner | 1,127 (36.4%) | $57,654 |
| 2 Earners | 1,028 (33.2%) | $96,375 |
| 3+ Earners | 131 (4.2%) | $130,104 |
| Total | 3,096 (100.0%) | $58,968 |
Household Income in Red River County
Household Income Brackets in Red River County
With 974 households falling in the category, the $50,000 to $74,999 income range is the most frequent in Red River County, accounting for 20.9% of all households. In contrast, only 61 households (1.3%) fall into the $200,000+ income bracket, making it the least populous group.
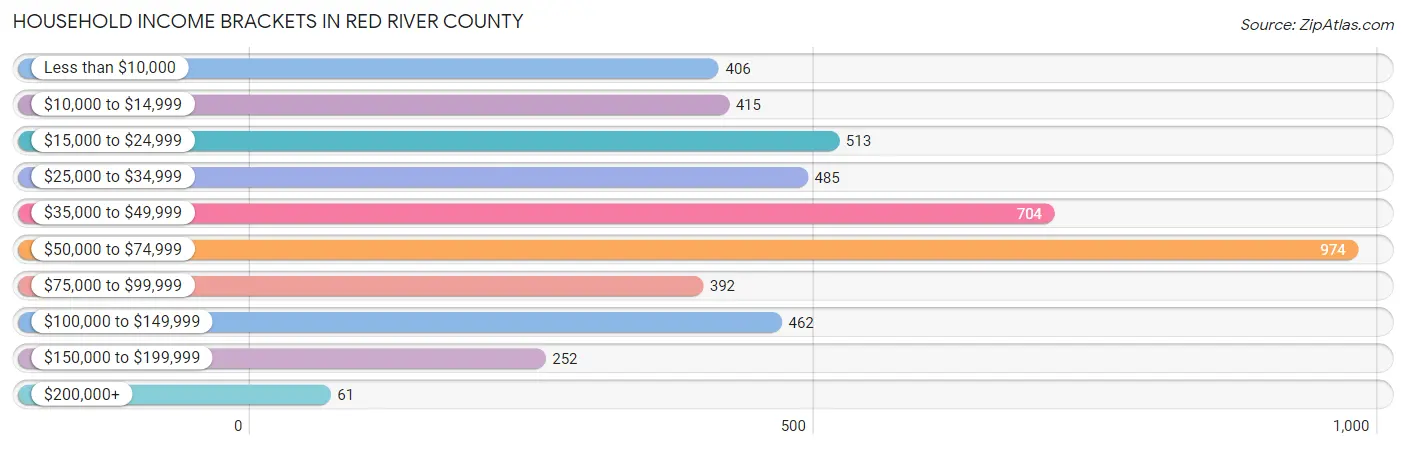
| Income Bracket | # Households | % Households |
| Less than $10,000 | 406 | 8.7% |
| $10,000 to $14,999 | 415 | 8.9% |
| $15,000 to $24,999 | 513 | 11.0% |
| $25,000 to $34,999 | 485 | 10.4% |
| $35,000 to $49,999 | 704 | 15.1% |
| $50,000 to $74,999 | 974 | 20.9% |
| $75,000 to $99,999 | 392 | 8.4% |
| $100,000 to $149,999 | 462 | 9.9% |
| $150,000 to $199,999 | 252 | 5.4% |
| $200,000+ | 61 | 1.3% |
Household Income by Householder Age in Red River County
The median household income in Red River County is $44,583, with the highest median household income of $57,500 found in the 25 to 44 years age bracket for the primary householder. A total of 972 households (20.8%) fall into this category. Meanwhile, the 65+ years age bracket for the primary householder has the lowest median household income of $33,257, with 1,876 households (40.2%) in this group.
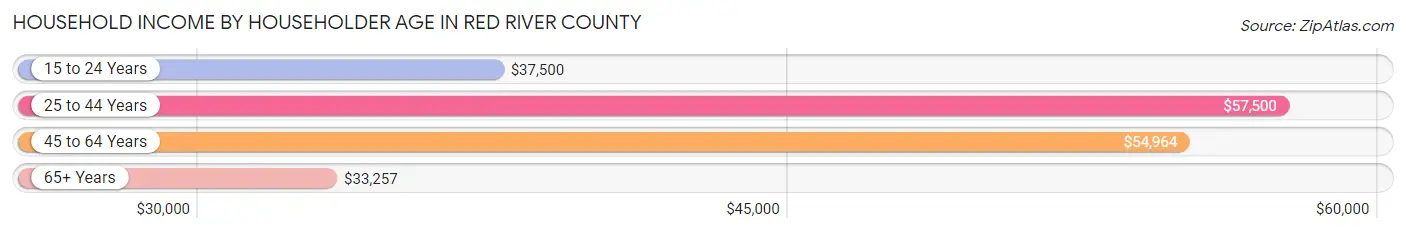
| Income Bracket | # Households | Median Income |
| 15 to 24 Years | 60 (1.3%) | $37,500 |
| 25 to 44 Years | 972 (20.8%) | $57,500 |
| 45 to 64 Years | 1,754 (37.6%) | $54,964 |
| 65+ Years | 1,876 (40.2%) | $33,257 |
| Total | 4,662 (100.0%) | $44,583 |
Poverty in Red River County
Income Below Poverty by Sex and Age in Red River County
With 17.5% poverty level for males and 22.8% for females among the residents of Red River County, 5 year old males and 12 to 14 year old females are the most vulnerable to poverty, with 11 males (47.8%) and 118 females (52.7%) in their respective age groups living below the poverty level.
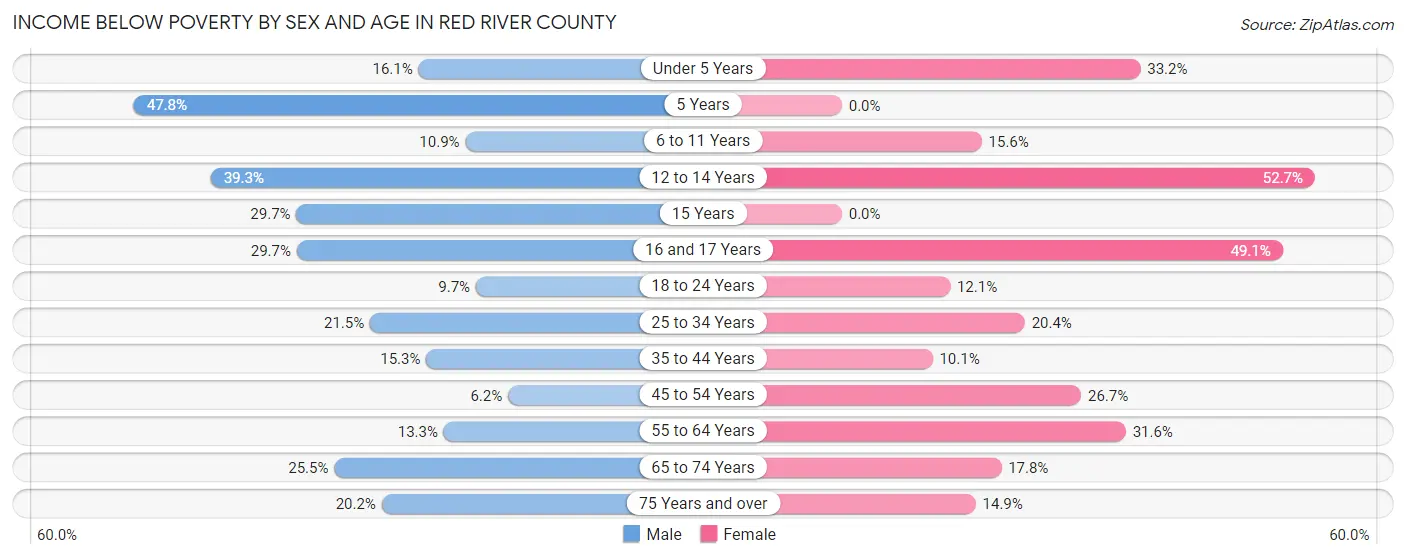
| Age Bracket | Male | Female |
| Under 5 Years | 55 (16.1%) | 119 (33.2%) |
| 5 Years | 11 (47.8%) | 0 (0.0%) |
| 6 to 11 Years | 37 (10.9%) | 59 (15.6%) |
| 12 to 14 Years | 108 (39.3%) | 118 (52.7%) |
| 15 Years | 11 (29.7%) | 0 (0.0%) |
| 16 and 17 Years | 38 (29.7%) | 82 (49.1%) |
| 18 to 24 Years | 41 (9.7%) | 47 (12.0%) |
| 25 to 34 Years | 104 (21.5%) | 99 (20.4%) |
| 35 to 44 Years | 101 (15.3%) | 52 (10.1%) |
| 45 to 54 Years | 43 (6.2%) | 234 (26.7%) |
| 55 to 64 Years | 107 (13.3%) | 271 (31.6%) |
| 65 to 74 Years | 212 (25.5%) | 153 (17.7%) |
| 75 Years and over | 104 (20.2%) | 104 (14.9%) |
| Total | 972 (17.5%) | 1,338 (22.8%) |
Income Above Poverty by Sex and Age in Red River County
According to the poverty statistics in Red River County, males aged 45 to 54 years and females aged 5 years are the age groups that are most secure financially, with 93.8% of males and 100.0% of females in these age groups living above the poverty line.
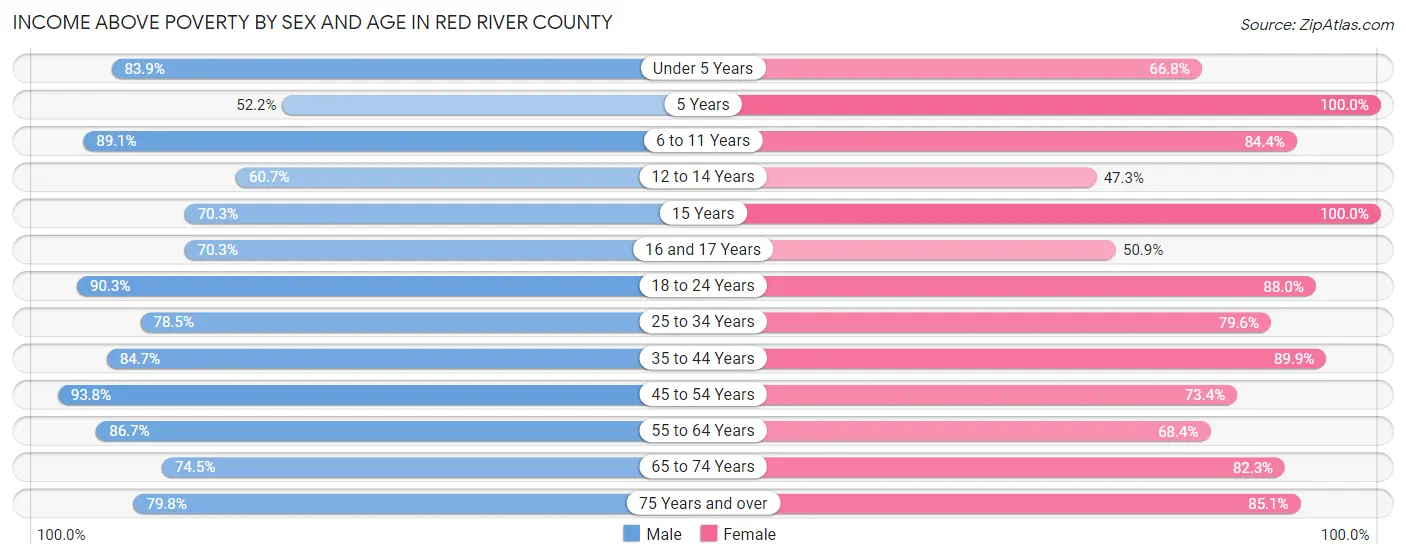
| Age Bracket | Male | Female |
| Under 5 Years | 286 (83.9%) | 239 (66.8%) |
| 5 Years | 12 (52.2%) | 6 (100.0%) |
| 6 to 11 Years | 302 (89.1%) | 320 (84.4%) |
| 12 to 14 Years | 167 (60.7%) | 106 (47.3%) |
| 15 Years | 26 (70.3%) | 53 (100.0%) |
| 16 and 17 Years | 90 (70.3%) | 85 (50.9%) |
| 18 to 24 Years | 380 (90.3%) | 343 (87.9%) |
| 25 to 34 Years | 379 (78.5%) | 387 (79.6%) |
| 35 to 44 Years | 561 (84.7%) | 463 (89.9%) |
| 45 to 54 Years | 655 (93.8%) | 644 (73.4%) |
| 55 to 64 Years | 697 (86.7%) | 586 (68.4%) |
| 65 to 74 Years | 619 (74.5%) | 709 (82.3%) |
| 75 Years and over | 410 (79.8%) | 594 (85.1%) |
| Total | 4,584 (82.5%) | 4,535 (77.2%) |
Income Below Poverty Among Married-Couple Families in Red River County
The poverty statistics for married-couple families in Red River County show that 9.9% or 251 of the total 2,534 families live below the poverty line. Families with 3 or 4 children have the highest poverty rate of 16.4%, comprising of 51 families. On the other hand, families with 5 or more children have the lowest poverty rate of 0.0%, which includes 0 families.
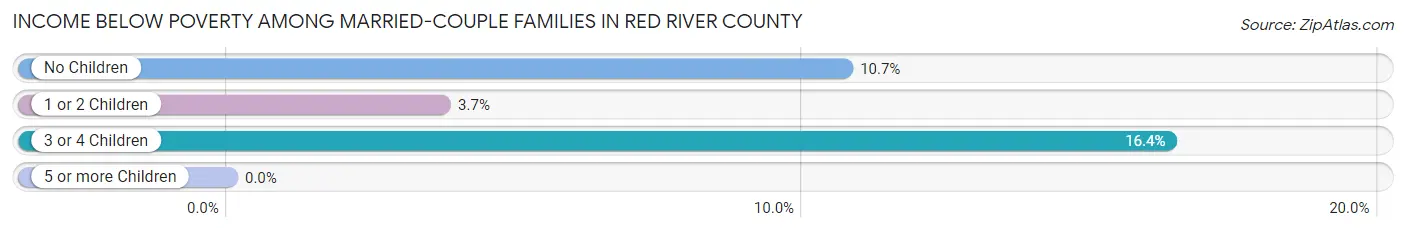
| Children | Above Poverty | Below Poverty |
| No Children | 1,500 (89.3%) | 180 (10.7%) |
| 1 or 2 Children | 519 (96.3%) | 20 (3.7%) |
| 3 or 4 Children | 261 (83.7%) | 51 (16.4%) |
| 5 or more Children | 3 (100.0%) | 0 (0.0%) |
| Total | 2,283 (90.1%) | 251 (9.9%) |
Income Below Poverty Among Single-Parent Households in Red River County
According to the poverty data in Red River County, 35.3% or 42 single-father households and 47.2% or 209 single-mother households are living below the poverty line. Among single-father households, those with no children have the highest poverty rate, with 24 households (39.3%) experiencing poverty. Likewise, among single-mother households, those with 5 or more children have the highest poverty rate, with 1 households (100.0%) falling below the poverty line.
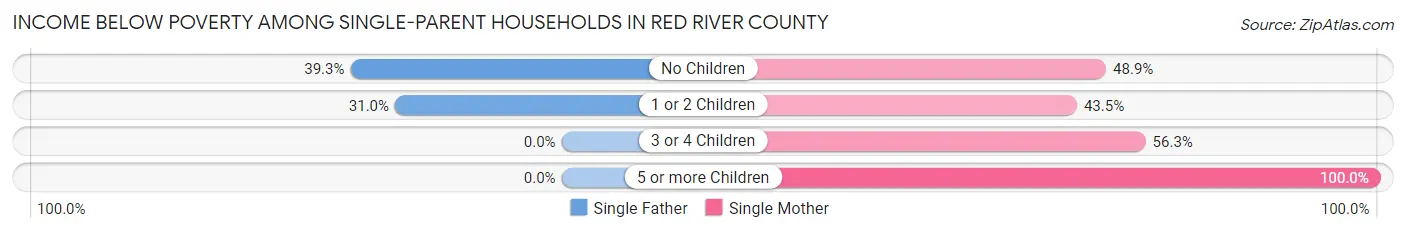
| Children | Single Father | Single Mother |
| No Children | 24 (39.3%) | 88 (48.9%) |
| 1 or 2 Children | 18 (31.0%) | 93 (43.5%) |
| 3 or 4 Children | 0 (0.0%) | 27 (56.2%) |
| 5 or more Children | 0 (0.0%) | 1 (100.0%) |
| Total | 42 (35.3%) | 209 (47.2%) |
Income Below Poverty Among Married-Couple vs Single-Parent Households in Red River County
The poverty data for Red River County shows that 251 of the married-couple family households (9.9%) and 251 of the single-parent households (44.7%) are living below the poverty level. Within the married-couple family households, those with 3 or 4 children have the highest poverty rate, with 51 households (16.4%) falling below the poverty line. Among the single-parent households, those with 5 or more children have the highest poverty rate, with 1 household (100.0%) living below poverty.
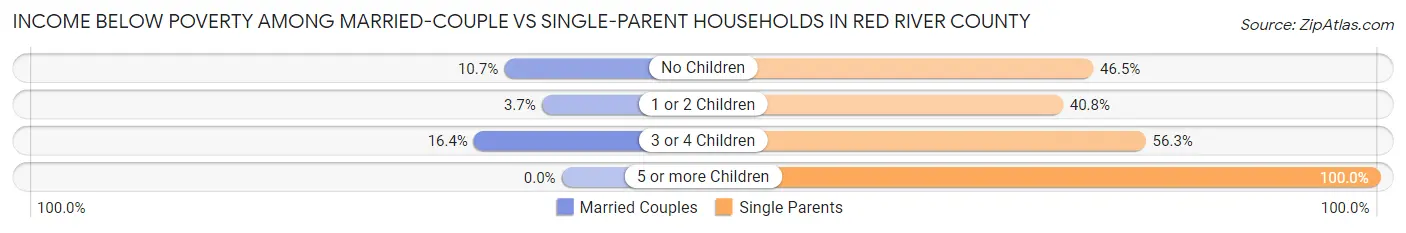
| Children | Married-Couple Families | Single-Parent Households |
| No Children | 180 (10.7%) | 112 (46.5%) |
| 1 or 2 Children | 20 (3.7%) | 111 (40.8%) |
| 3 or 4 Children | 51 (16.4%) | 27 (56.2%) |
| 5 or more Children | 0 (0.0%) | 1 (100.0%) |
| Total | 251 (9.9%) | 251 (44.7%) |
Race in Red River County
The most populous races in Red River County are White / Caucasian (8,995 | 77.4%), Black / African American (1,816 | 15.6%), and Hispanic or Latino (902 | 7.8%).
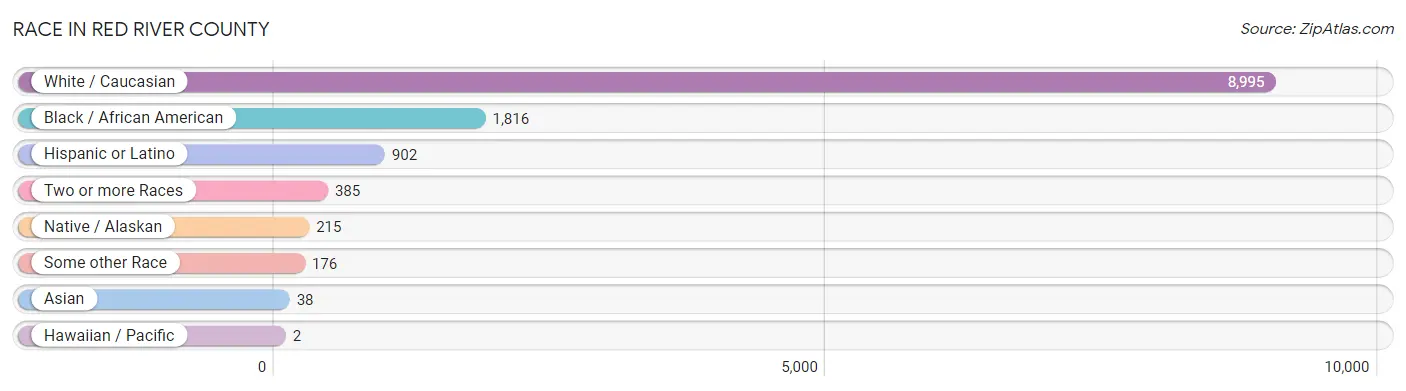
| Race | # Population | % Population |
| Asian | 38 | 0.3% |
| Black / African American | 1,816 | 15.6% |
| Hawaiian / Pacific | 2 | 0.0% |
| Hispanic or Latino | 902 | 7.8% |
| Native / Alaskan | 215 | 1.8% |
| White / Caucasian | 8,995 | 77.4% |
| Two or more Races | 385 | 3.3% |
| Some other Race | 176 | 1.5% |
| Total | 11,627 | 100.0% |
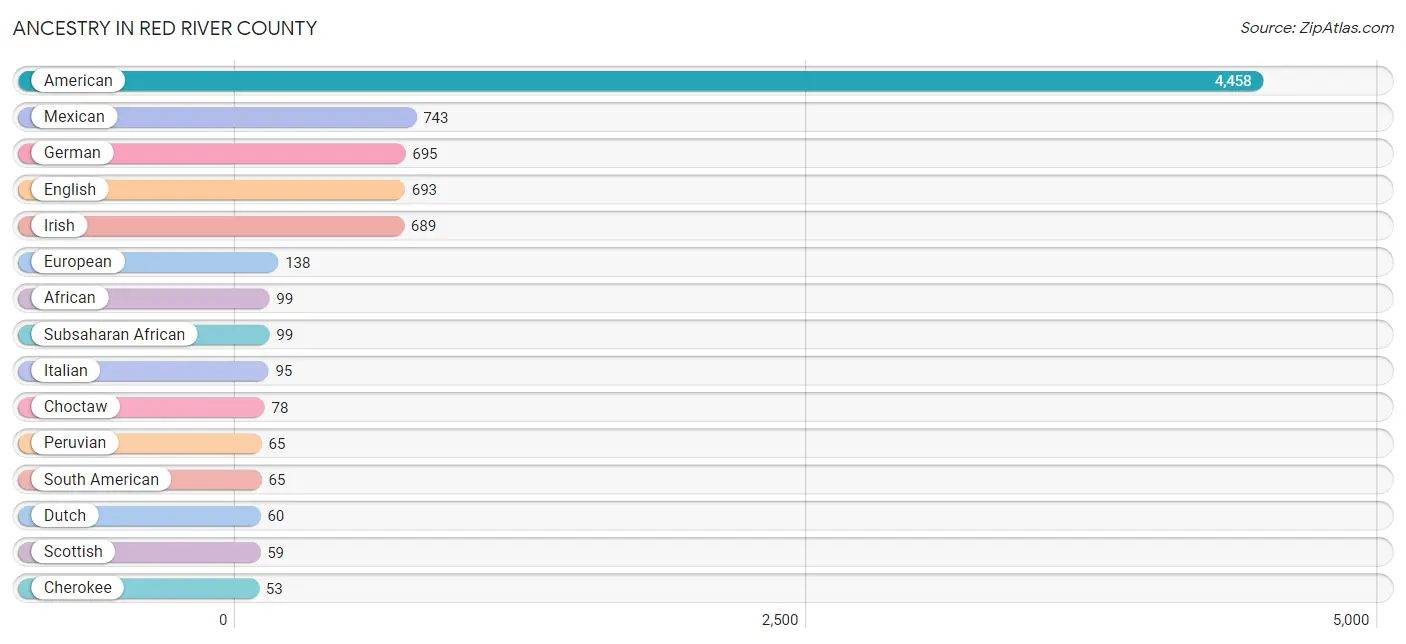
Ancestry in Red River County
The most populous ancestries reported in Red River County are American (4,458 | 38.3%), Mexican (743 | 6.4%), German (695 | 6.0%), English (693 | 6.0%), and Irish (689 | 5.9%), together accounting for 62.6% of all Red River County residents.
| Ancestry | # Population | % Population |
| African | 99 | 0.9% |
| American | 4,458 | 38.3% |
| Arab | 10 | 0.1% |
| Belgian | 14 | 0.1% |
| Bhutanese | 8 | 0.1% |
| British | 19 | 0.2% |
| Burmese | 51 | 0.4% |
| Canadian | 29 | 0.3% |
| Central American | 21 | 0.2% |
| Cherokee | 53 | 0.5% |
| Cheyenne | 2 | 0.0% |
| Chickasaw | 2 | 0.0% |
| Choctaw | 78 | 0.7% |
| Cuban | 13 | 0.1% |
| Czech | 30 | 0.3% |
| Danish | 3 | 0.0% |
| Dutch | 60 | 0.5% |
| Dutch West Indian | 19 | 0.2% |
| Eastern European | 9 | 0.1% |
| English | 693 | 6.0% |
| European | 138 | 1.2% |
| French | 36 | 0.3% |
| French Canadian | 6 | 0.1% |
| German | 695 | 6.0% |
| Indian (Asian) | 7 | 0.1% |
| Irish | 689 | 5.9% |
| Italian | 95 | 0.8% |
| Mexican | 743 | 6.4% |
| Norwegian | 25 | 0.2% |
| Ottawa | 4 | 0.0% |
| Peruvian | 65 | 0.6% |
| Polish | 12 | 0.1% |
| Russian | 12 | 0.1% |
| Salvadoran | 21 | 0.2% |
| Samoan | 7 | 0.1% |
| Scotch-Irish | 24 | 0.2% |
| Scottish | 59 | 0.5% |
| Sioux | 12 | 0.1% |
| South American | 65 | 0.6% |
| Spaniard | 42 | 0.4% |
| Subsaharan African | 99 | 0.9% |
| Swedish | 36 | 0.3% |
| Swiss | 35 | 0.3% |
| Thai | 28 | 0.2% |
| Welsh | 12 | 0.1% | View All 45 Rows |
Immigrants in Red River County
The most numerous immigrant groups reported in Red River County came from Latin America (313 | 2.7%), Central America (224 | 1.9%), Mexico (224 | 1.9%), Peru (89 | 0.8%), and South America (89 | 0.8%), together accounting for 8.1% of all Red River County residents.
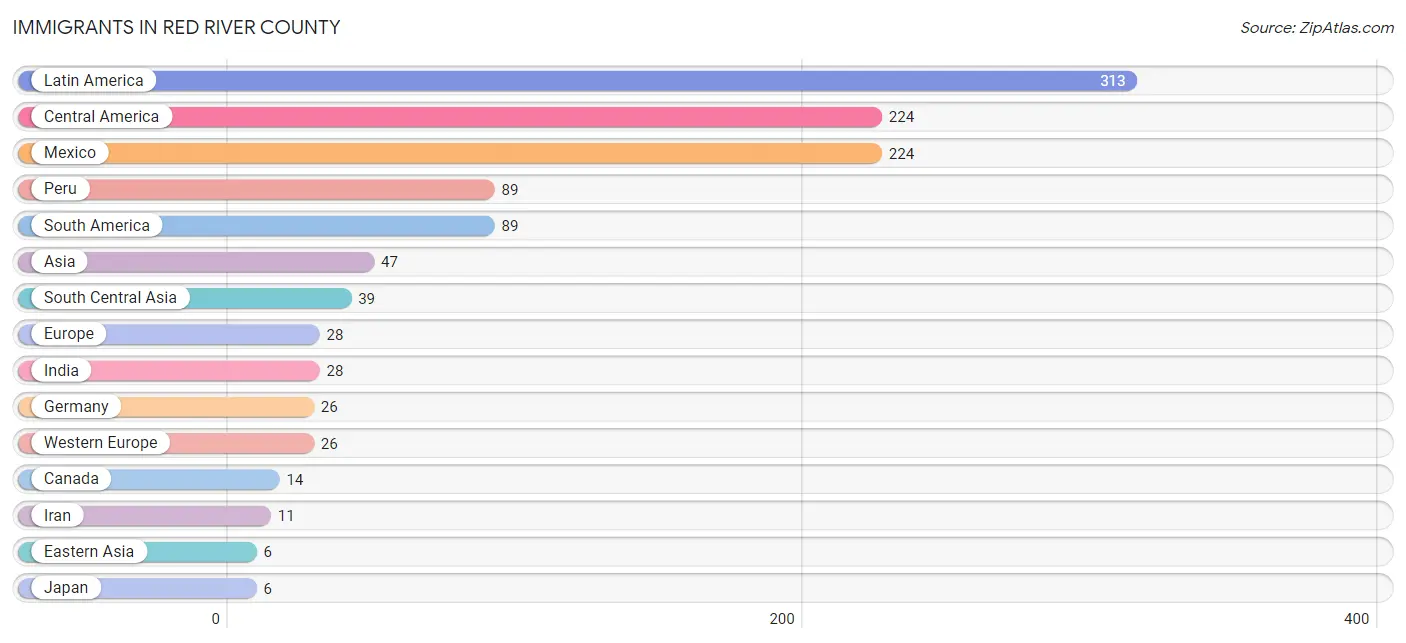
| Immigration Origin | # Population | % Population |
| Asia | 47 | 0.4% |
| Canada | 14 | 0.1% |
| Central America | 224 | 1.9% |
| Eastern Asia | 6 | 0.1% |
| Europe | 28 | 0.2% |
| Germany | 26 | 0.2% |
| India | 28 | 0.2% |
| Iran | 11 | 0.1% |
| Japan | 6 | 0.1% |
| Latin America | 313 | 2.7% |
| Malaysia | 2 | 0.0% |
| Mexico | 224 | 1.9% |
| Peru | 89 | 0.8% |
| South America | 89 | 0.8% |
| South Central Asia | 39 | 0.3% |
| South Eastern Asia | 2 | 0.0% |
| Western Europe | 26 | 0.2% | View All 17 Rows |
Sex and Age in Red River County
Sex and Age in Red River County
The most populous age groups in Red River County are 60 to 64 Years (488 | 8.6%) for men and 55 to 59 Years (558 | 9.3%) for women.
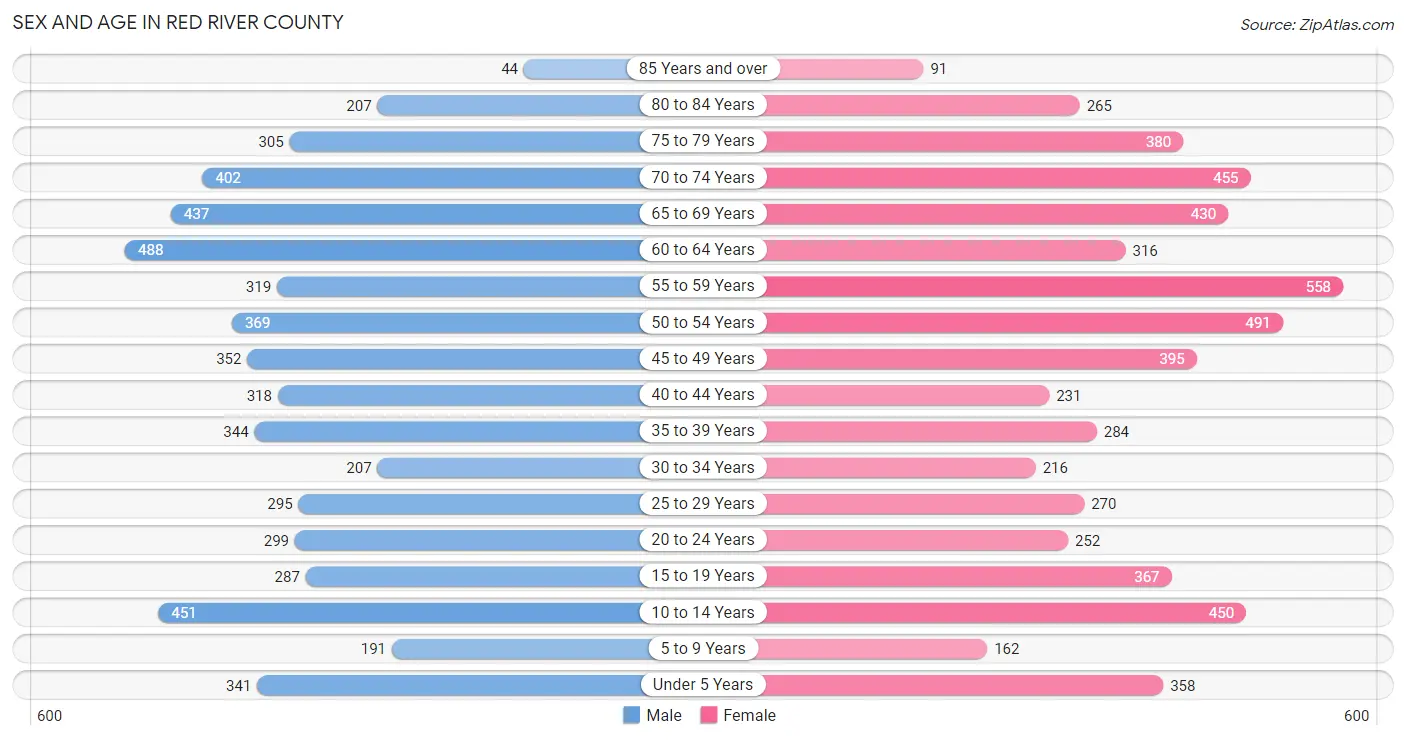
| Age Bracket | Male | Female |
| Under 5 Years | 341 (6.0%) | 358 (6.0%) |
| 5 to 9 Years | 191 (3.4%) | 162 (2.7%) |
| 10 to 14 Years | 451 (8.0%) | 450 (7.5%) |
| 15 to 19 Years | 287 (5.1%) | 367 (6.1%) |
| 20 to 24 Years | 299 (5.3%) | 252 (4.2%) |
| 25 to 29 Years | 295 (5.2%) | 270 (4.5%) |
| 30 to 34 Years | 207 (3.7%) | 216 (3.6%) |
| 35 to 39 Years | 344 (6.1%) | 284 (4.8%) |
| 40 to 44 Years | 318 (5.6%) | 231 (3.9%) |
| 45 to 49 Years | 352 (6.2%) | 395 (6.6%) |
| 50 to 54 Years | 369 (6.5%) | 491 (8.2%) |
| 55 to 59 Years | 319 (5.6%) | 558 (9.3%) |
| 60 to 64 Years | 488 (8.6%) | 316 (5.3%) |
| 65 to 69 Years | 437 (7.7%) | 430 (7.2%) |
| 70 to 74 Years | 402 (7.1%) | 455 (7.6%) |
| 75 to 79 Years | 305 (5.4%) | 380 (6.4%) |
| 80 to 84 Years | 207 (3.7%) | 265 (4.4%) |
| 85 Years and over | 44 (0.8%) | 91 (1.5%) |
| Total | 5,656 (100.0%) | 5,971 (100.0%) |
Families and Households in Red River County
Median Family Size in Red River County
The median family size in Red River County is 3.09 persons per family, with single female/mother families (443 | 14.3%) accounting for the largest median family size of 3.15 persons per family. On the other hand, single male/father families (119 | 3.8%) represent the smallest median family size with 2.90 persons per family.
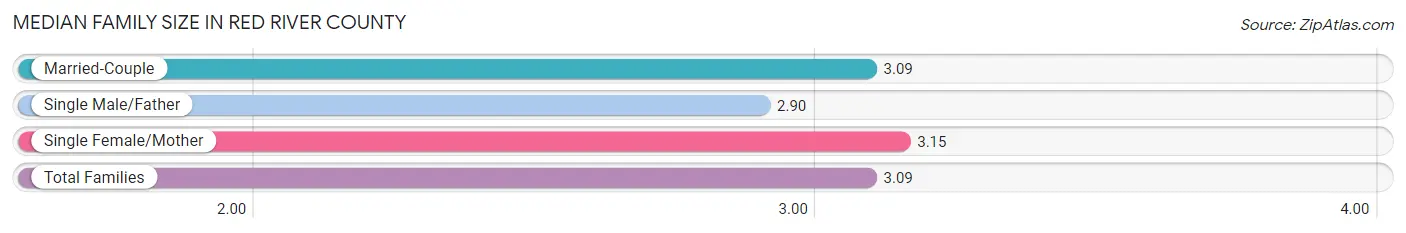
| Family Type | # Families | Family Size |
| Married-Couple | 2,534 (81.9%) | 3.09 |
| Single Male/Father | 119 (3.8%) | 2.90 |
| Single Female/Mother | 443 (14.3%) | 3.15 |
| Total Families | 3,096 (100.0%) | 3.09 |
Median Household Size in Red River County
The median household size in Red River County is 2.45 persons per household, with single male/father households (119 | 2.5%) accounting for the largest median household size of 3.43 persons per household. non-family households (1,566 | 33.6%) represent the smallest median household size with 1.08 persons per household.
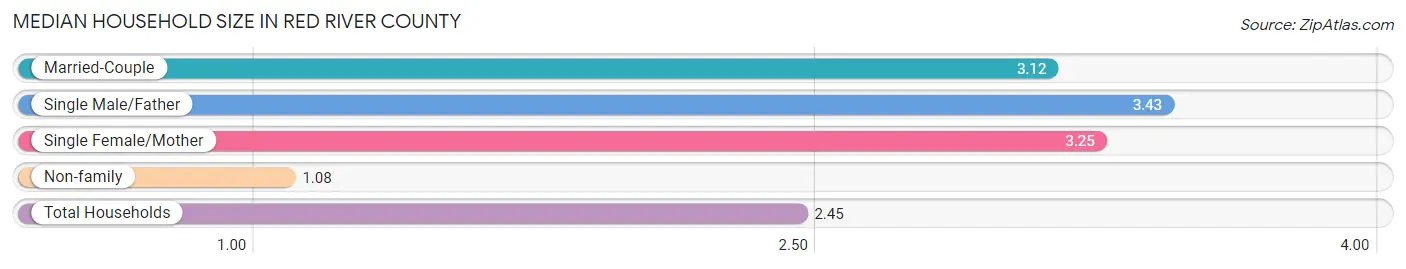
| Household Type | # Households | Household Size |
| Married-Couple | 2,534 (54.3%) | 3.12 |
| Single Male/Father | 119 (2.5%) | 3.43 |
| Single Female/Mother | 443 (9.5%) | 3.25 |
| Non-family | 1,566 (33.6%) | 1.08 |
| Total Households | 4,662 (100.0%) | 2.45 |
Household Size by Marriage Status in Red River County
Out of a total of 4,662 households in Red River County, 3,096 (66.4%) are family households, while 1,566 (33.6%) are nonfamily households. The most numerous type of family households are 2-person households, comprising 1,744, and the most common type of nonfamily households are 1-person households, comprising 1,469.
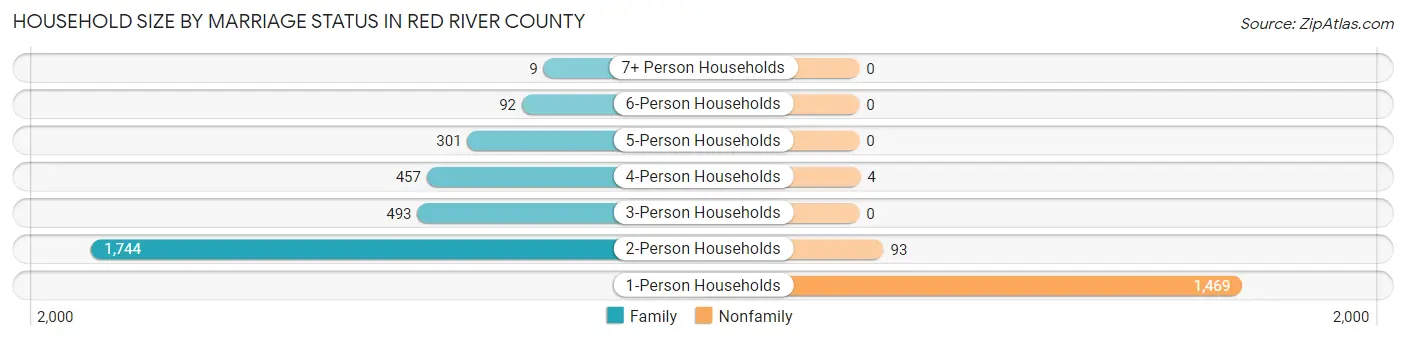
| Household Size | Family Households | Nonfamily Households |
| 1-Person Households | - | 1,469 (31.5%) |
| 2-Person Households | 1,744 (37.4%) | 93 (2.0%) |
| 3-Person Households | 493 (10.6%) | 0 (0.0%) |
| 4-Person Households | 457 (9.8%) | 4 (0.1%) |
| 5-Person Households | 301 (6.5%) | 0 (0.0%) |
| 6-Person Households | 92 (2.0%) | 0 (0.0%) |
| 7+ Person Households | 9 (0.2%) | 0 (0.0%) |
| Total | 3,096 (66.4%) | 1,566 (33.6%) |
Female Fertility in Red River County
Fertility by Age in Red River County
Average fertility rate in Red River County is 66.0 births per 1,000 women. Women in the age bracket of 20 to 34 years have the highest fertility rate with 141.0 births per 1,000 women. Women in the age bracket of 20 to 34 years acount for 77.0% of all women with births.
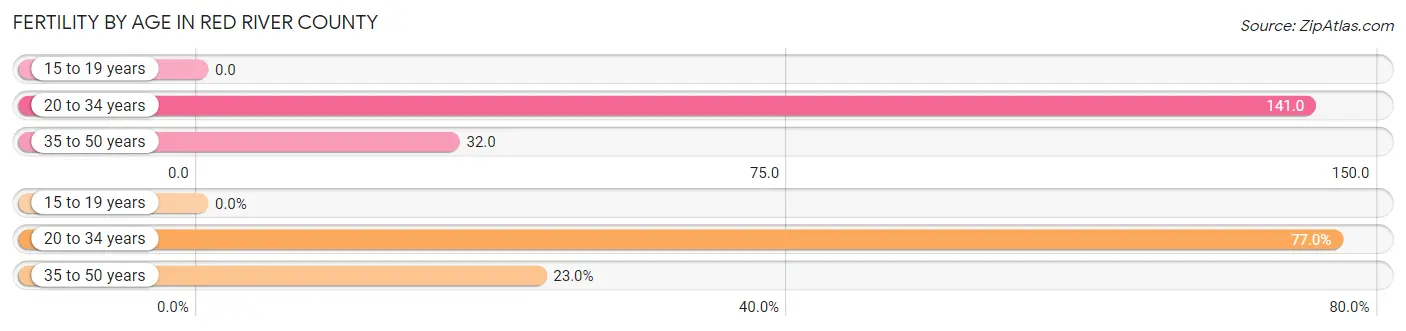
| Age Bracket | Women with Births | Births / 1,000 Women |
| 15 to 19 years | 0 (0.0%) | 0.0 |
| 20 to 34 years | 104 (77.0%) | 141.0 |
| 35 to 50 years | 31 (23.0%) | 32.0 |
| Total | 135 (100.0%) | 66.0 |
Fertility by Age by Marriage Status in Red River County
79.3% of women with births (135) in Red River County are married. The highest percentage of unmarried women with births falls into 20 to 34 years age bracket with 26.9% of them unmarried at the time of birth, while the lowest percentage of unmarried women with births belong to 35 to 50 years age bracket with 0.0% of them unmarried.
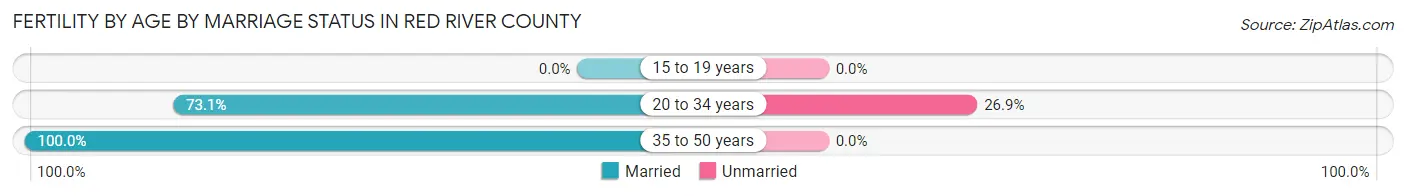
| Age Bracket | Married | Unmarried |
| 15 to 19 years | 0 (0.0%) | 0 (0.0%) |
| 20 to 34 years | 76 (73.1%) | 28 (26.9%) |
| 35 to 50 years | 31 (100.0%) | 0 (0.0%) |
| Total | 107 (79.3%) | 28 (20.7%) |
Fertility by Education in Red River County
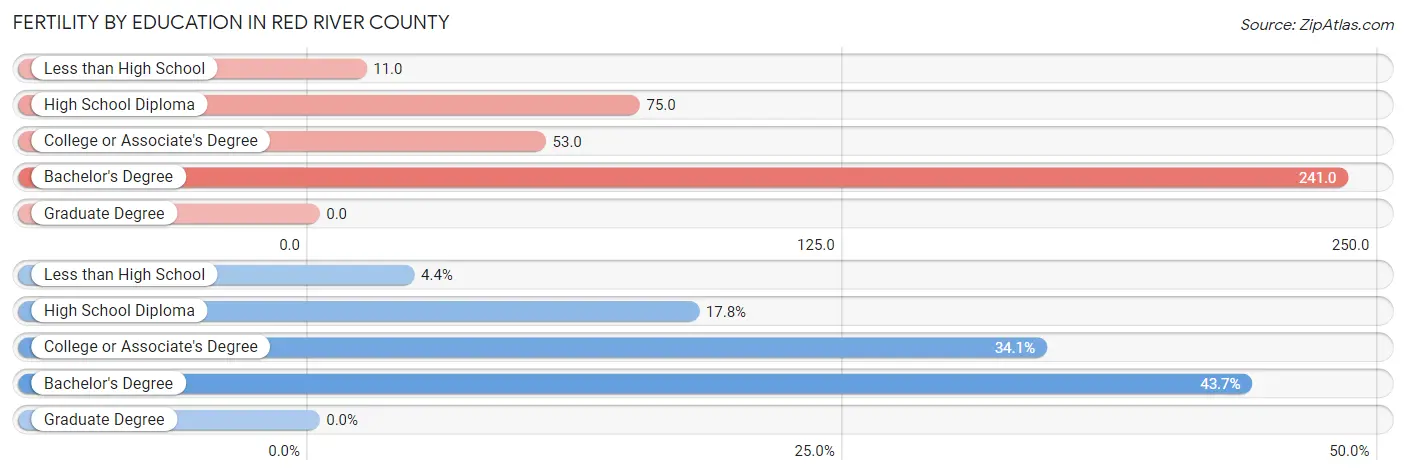
| Educational Attainment | Women with Births | Births / 1,000 Women |
| Less than High School | 6 (4.4%) | 11.0 |
| High School Diploma | 24 (17.8%) | 75.0 |
| College or Associate's Degree | 46 (34.1%) | 53.0 |
| Bachelor's Degree | 59 (43.7%) | 241.0 |
| Graduate Degree | 0 (0.0%) | 0.0 |
| Total | 135 (100.0%) | 66.0 |
Fertility by Education by Marriage Status in Red River County
20.7% of women with births in Red River County are unmarried. Women with the educational attainment of less than high school are most likely to be married with 100.0% of them married at childbirth, while women with the educational attainment of high school diploma are least likely to be married with 25.0% of them unmarried at childbirth.
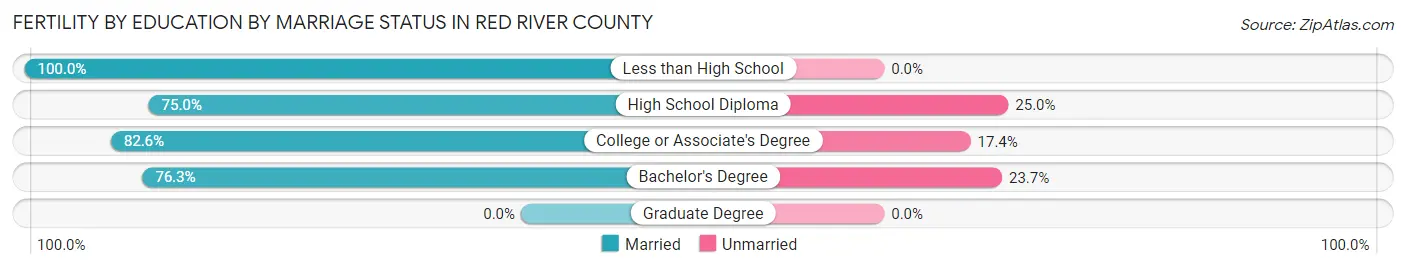
| Educational Attainment | Married | Unmarried |
| Less than High School | 6 (100.0%) | 0 (0.0%) |
| High School Diploma | 18 (75.0%) | 6 (25.0%) |
| College or Associate's Degree | 38 (82.6%) | 8 (17.4%) |
| Bachelor's Degree | 45 (76.3%) | 14 (23.7%) |
| Graduate Degree | 0 (0.0%) | 0 (0.0%) |
| Total | 107 (79.3%) | 28 (20.7%) |
Employment Characteristics in Red River County
Employment by Class of Employer in Red River County
Among the 4,303 employed individuals in Red River County, private company employees (3,072 | 71.4%), local government employees (270 | 6.3%), and state government employees (257 | 6.0%) make up the most common classes of employment.
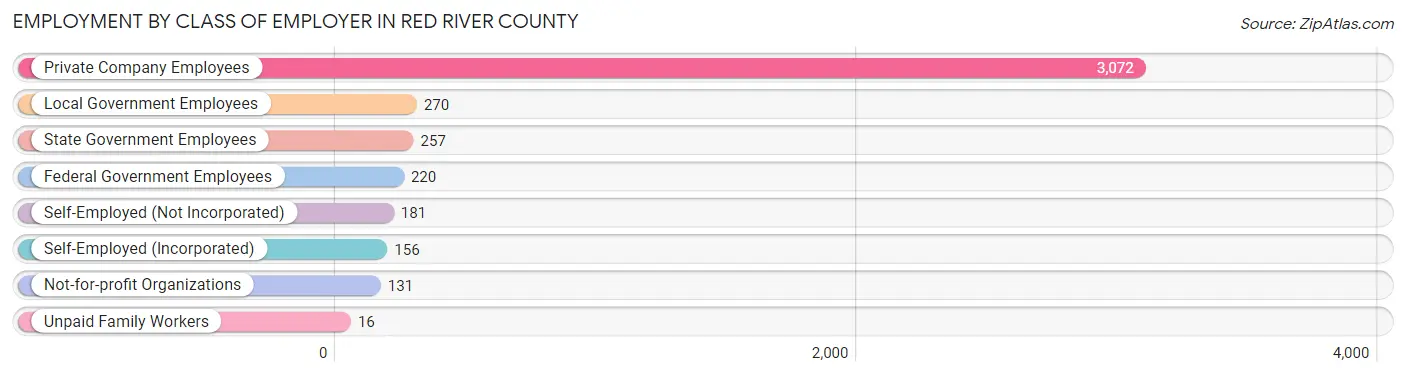
| Employer Class | # Employees | % Employees |
| Private Company Employees | 3,072 | 71.4% |
| Self-Employed (Incorporated) | 156 | 3.6% |
| Self-Employed (Not Incorporated) | 181 | 4.2% |
| Not-for-profit Organizations | 131 | 3.0% |
| Local Government Employees | 270 | 6.3% |
| State Government Employees | 257 | 6.0% |
| Federal Government Employees | 220 | 5.1% |
| Unpaid Family Workers | 16 | 0.4% |
| Total | 4,303 | 100.0% |
Employment Status by Age in Red River County
According to the labor force statistics for Red River County, out of the total population over 16 years of age (9,584), 47.2% or 4,524 individuals are in the labor force, with 3.8% or 172 of them unemployed. The age group with the highest labor force participation rate is 20 to 24 years, with 80.4% or 443 individuals in the labor force. Within the labor force, the 20 to 24 years age range has the highest percentage of unemployed individuals, with 24.6% or 109 of them being unemployed.
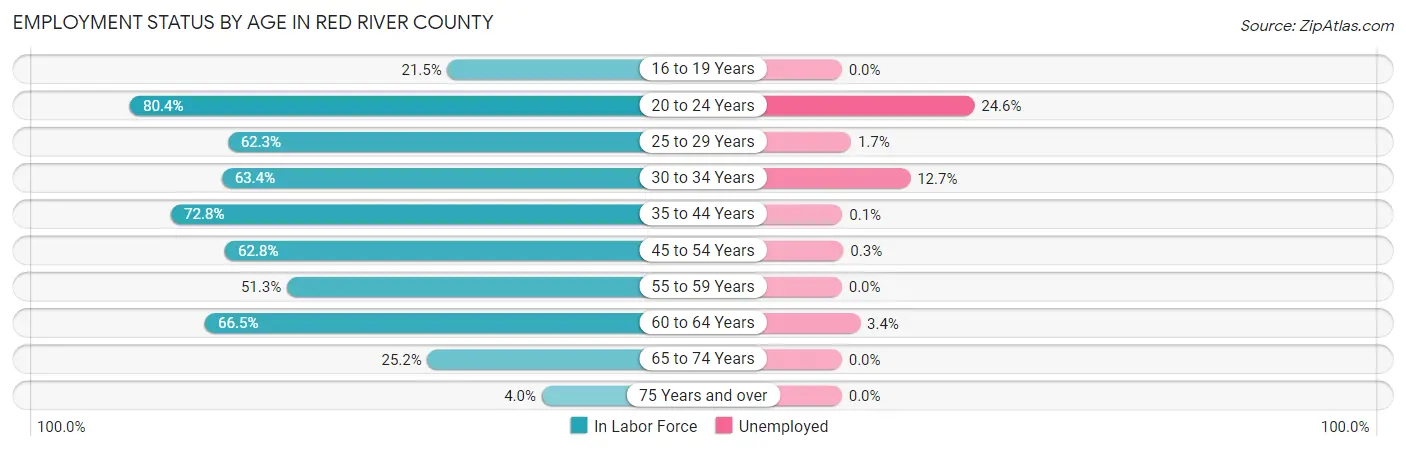
| Age Bracket | In Labor Force | Unemployed |
| 16 to 19 Years | 121 (21.5%) | 0 (0.0%) |
| 20 to 24 Years | 443 (80.4%) | 109 (24.6%) |
| 25 to 29 Years | 352 (62.3%) | 6 (1.7%) |
| 30 to 34 Years | 268 (63.4%) | 34 (12.7%) |
| 35 to 44 Years | 857 (72.8%) | 1 (0.1%) |
| 45 to 54 Years | 1,009 (62.8%) | 3 (0.3%) |
| 55 to 59 Years | 450 (51.3%) | 0 (0.0%) |
| 60 to 64 Years | 535 (66.5%) | 18 (3.4%) |
| 65 to 74 Years | 434 (25.2%) | 0 (0.0%) |
| 75 Years and over | 52 (4.0%) | 0 (0.0%) |
| Total | 4,524 (47.2%) | 172 (3.8%) |
Employment Status by Educational Attainment in Red River County
According to labor force statistics for Red River County, 63.7% of individuals (3,474) out of the total population between 25 and 64 years of age (5,453) are in the labor force, with 1.8% or 63 of them being unemployed. The group with the highest labor force participation rate are those with the educational attainment of bachelor's degree or higher, with 77.2% or 508 individuals in the labor force. Within the labor force, individuals with high school diploma education have the highest percentage of unemployment, with 3.2% or 42 of them being unemployed.
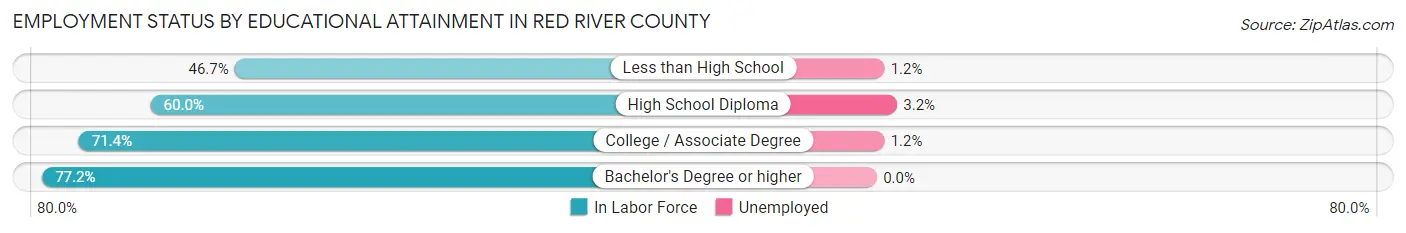
| Educational Attainment | In Labor Force | Unemployed |
| Less than High School | 402 (46.7%) | 10 (1.2%) |
| High School Diploma | 1,304 (60.0%) | 70 (3.2%) |
| College / Associate Degree | 1,257 (71.4%) | 21 (1.2%) |
| Bachelor's Degree or higher | 508 (77.2%) | 0 (0.0%) |
| Total | 3,474 (63.7%) | 98 (1.8%) |
Employment Occupations by Sex in Red River County
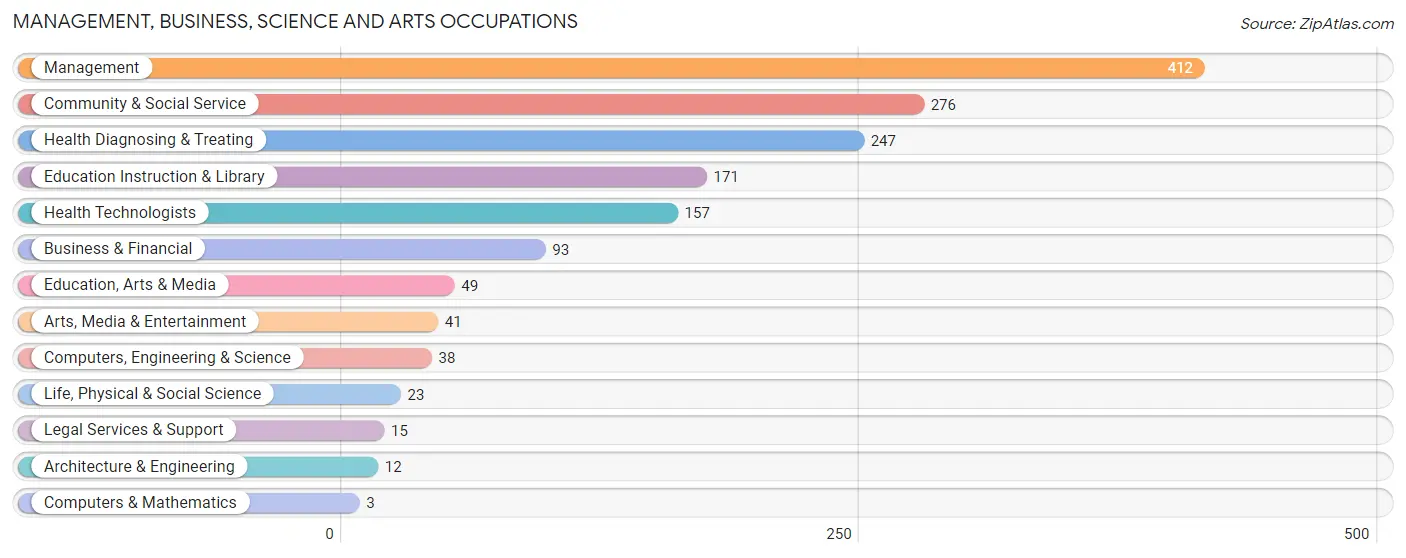
Management, Business, Science and Arts Occupations
The most common Management, Business, Science and Arts occupations in Red River County are Management (412 | 9.5%), Community & Social Service (276 | 6.3%), Health Diagnosing & Treating (247 | 5.7%), Education Instruction & Library (171 | 3.9%), and Health Technologists (157 | 3.6%).
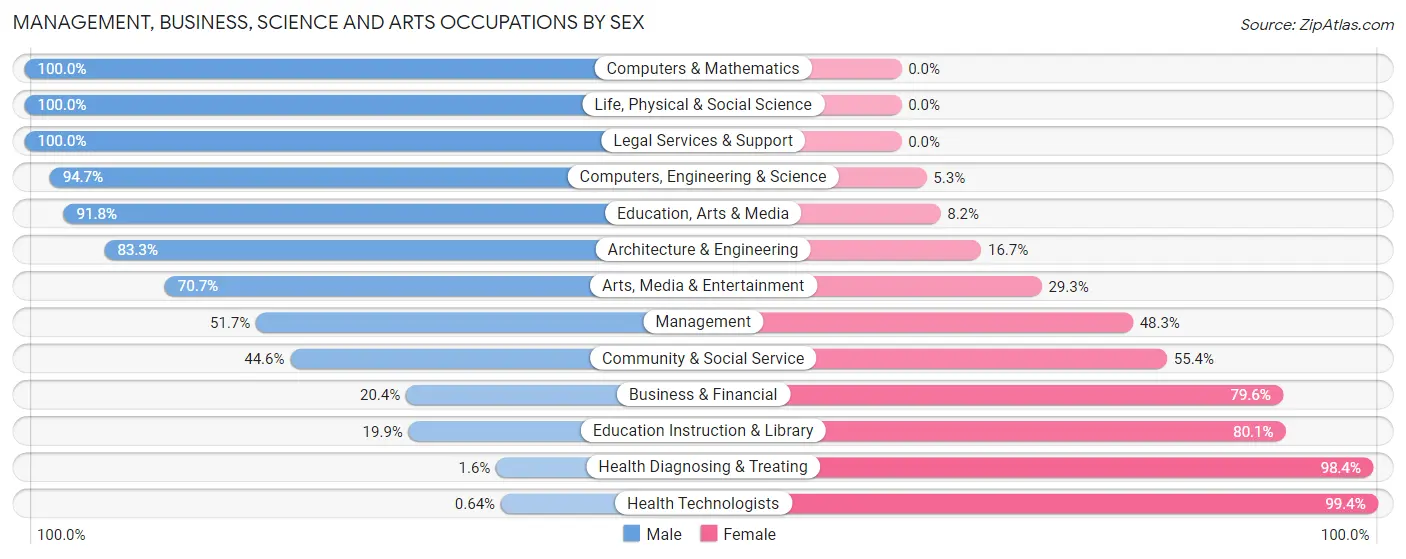
Management, Business, Science and Arts Occupations by Sex
Within the Management, Business, Science and Arts occupations in Red River County, the most male-oriented occupations are Computers & Mathematics (100.0%), Life, Physical & Social Science (100.0%), and Legal Services & Support (100.0%), while the most female-oriented occupations are Health Technologists (99.4%), Health Diagnosing & Treating (98.4%), and Education Instruction & Library (80.1%).
| Occupation | Male | Female |
| Management | 213 (51.7%) | 199 (48.3%) |
| Business & Financial | 19 (20.4%) | 74 (79.6%) |
| Computers, Engineering & Science | 36 (94.7%) | 2 (5.3%) |
| Computers & Mathematics | 3 (100.0%) | 0 (0.0%) |
| Architecture & Engineering | 10 (83.3%) | 2 (16.7%) |
| Life, Physical & Social Science | 23 (100.0%) | 0 (0.0%) |
| Community & Social Service | 123 (44.6%) | 153 (55.4%) |
| Education, Arts & Media | 45 (91.8%) | 4 (8.2%) |
| Legal Services & Support | 15 (100.0%) | 0 (0.0%) |
| Education Instruction & Library | 34 (19.9%) | 137 (80.1%) |
| Arts, Media & Entertainment | 29 (70.7%) | 12 (29.3%) |
| Health Diagnosing & Treating | 4 (1.6%) | 243 (98.4%) |
| Health Technologists | 1 (0.6%) | 156 (99.4%) |
| Total (Category) | 395 (37.0%) | 671 (62.9%) |
| Total (Overall) | 2,360 (54.2%) | 1,990 (45.8%) |
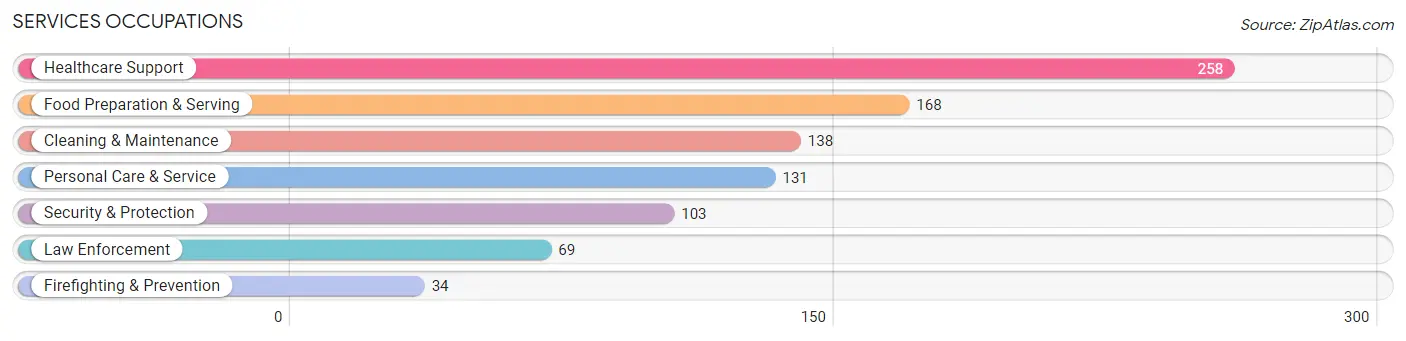
Services Occupations
The most common Services occupations in Red River County are Healthcare Support (258 | 5.9%), Food Preparation & Serving (168 | 3.9%), Cleaning & Maintenance (138 | 3.2%), Personal Care & Service (131 | 3.0%), and Security & Protection (103 | 2.4%).
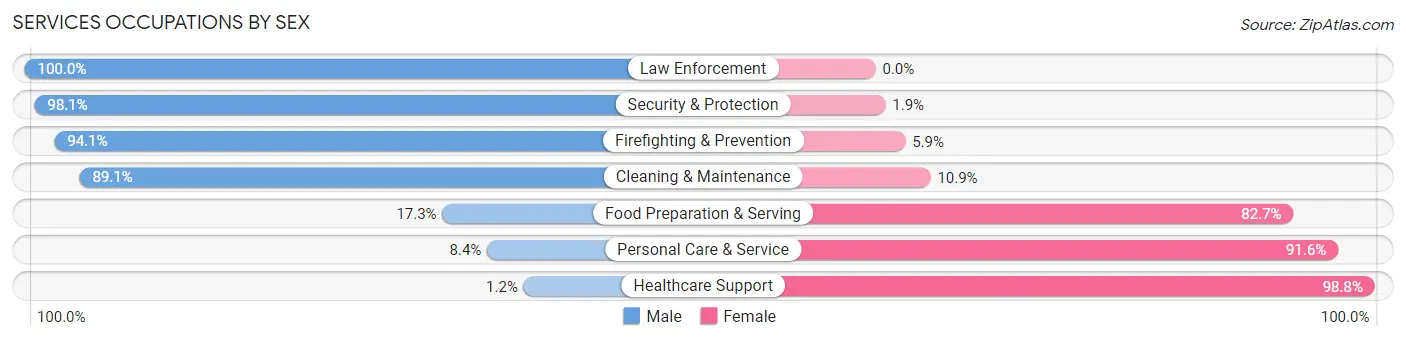
Services Occupations by Sex
Within the Services occupations in Red River County, the most male-oriented occupations are Law Enforcement (100.0%), Security & Protection (98.1%), and Firefighting & Prevention (94.1%), while the most female-oriented occupations are Healthcare Support (98.8%), Personal Care & Service (91.6%), and Food Preparation & Serving (82.7%).
| Occupation | Male | Female |
| Healthcare Support | 3 (1.2%) | 255 (98.8%) |
| Security & Protection | 101 (98.1%) | 2 (1.9%) |
| Firefighting & Prevention | 32 (94.1%) | 2 (5.9%) |
| Law Enforcement | 69 (100.0%) | 0 (0.0%) |
| Food Preparation & Serving | 29 (17.3%) | 139 (82.7%) |
| Cleaning & Maintenance | 123 (89.1%) | 15 (10.9%) |
| Personal Care & Service | 11 (8.4%) | 120 (91.6%) |
| Total (Category) | 267 (33.5%) | 531 (66.5%) |
| Total (Overall) | 2,360 (54.2%) | 1,990 (45.8%) |
Sales and Office Occupations
The most common Sales and Office occupations in Red River County are Office & Administration (466 | 10.7%), and Sales & Related (390 | 9.0%).
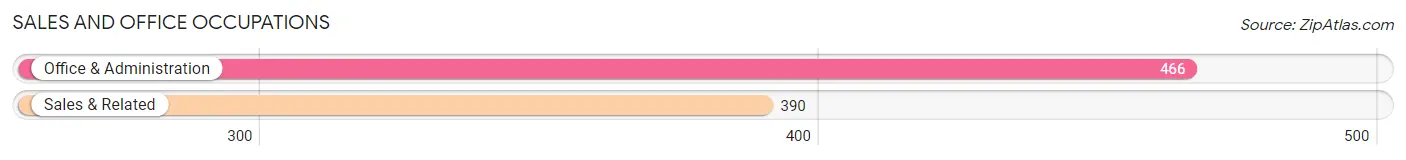
Sales and Office Occupations by Sex

| Occupation | Male | Female |
| Sales & Related | 231 (59.2%) | 159 (40.8%) |
| Office & Administration | 72 (15.4%) | 394 (84.6%) |
| Total (Category) | 303 (35.4%) | 553 (64.6%) |
| Total (Overall) | 2,360 (54.2%) | 1,990 (45.8%) |
Natural Resources, Construction and Maintenance Occupations
The most common Natural Resources, Construction and Maintenance occupations in Red River County are Construction & Extraction (422 | 9.7%), Installation, Maintenance & Repair (269 | 6.2%), and Farming, Fishing & Forestry (121 | 2.8%).
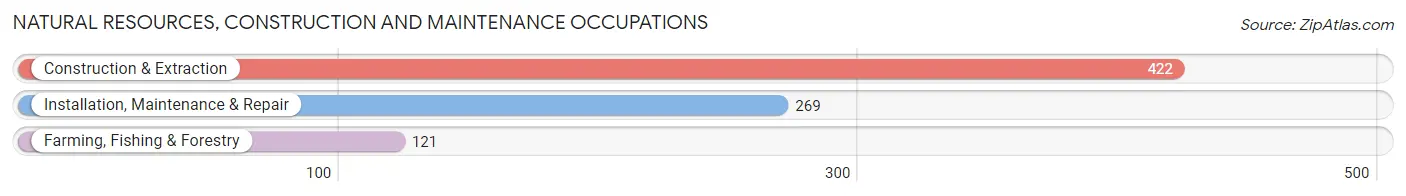
Natural Resources, Construction and Maintenance Occupations by Sex
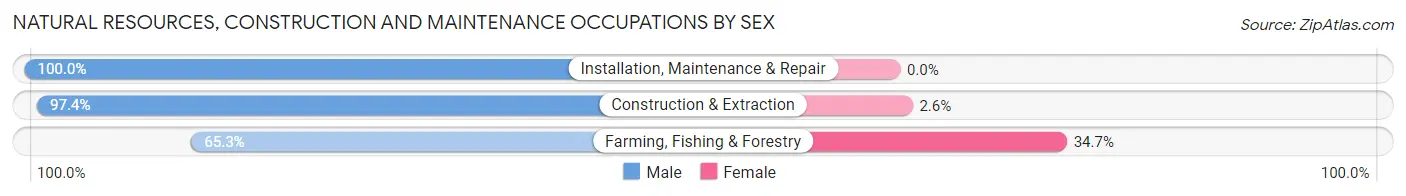
| Occupation | Male | Female |
| Farming, Fishing & Forestry | 79 (65.3%) | 42 (34.7%) |
| Construction & Extraction | 411 (97.4%) | 11 (2.6%) |
| Installation, Maintenance & Repair | 269 (100.0%) | 0 (0.0%) |
| Total (Category) | 759 (93.5%) | 53 (6.5%) |
| Total (Overall) | 2,360 (54.2%) | 1,990 (45.8%) |
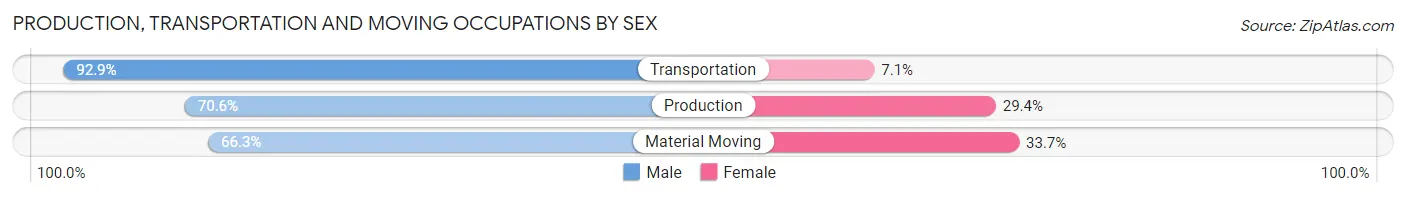
Production, Transportation and Moving Occupations
The most common Production, Transportation and Moving occupations in Red River County are Production (442 | 10.2%), Transportation (281 | 6.5%), and Material Moving (95 | 2.2%).
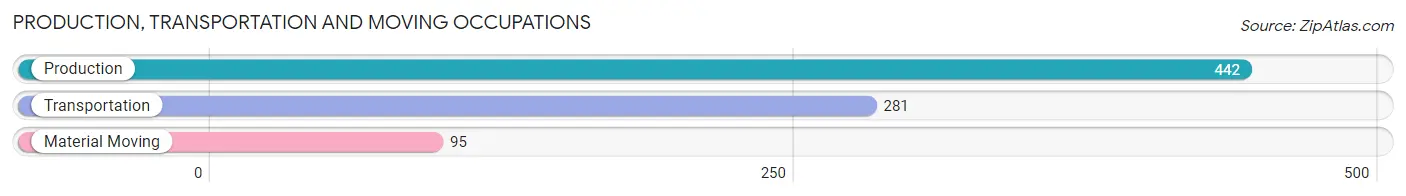
Production, Transportation and Moving Occupations by Sex
| Occupation | Male | Female |
| Production | 312 (70.6%) | 130 (29.4%) |
| Transportation | 261 (92.9%) | 20 (7.1%) |
| Material Moving | 63 (66.3%) | 32 (33.7%) |
| Total (Category) | 636 (77.7%) | 182 (22.3%) |
| Total (Overall) | 2,360 (54.2%) | 1,990 (45.8%) |
Employment Industries by Sex in Red River County
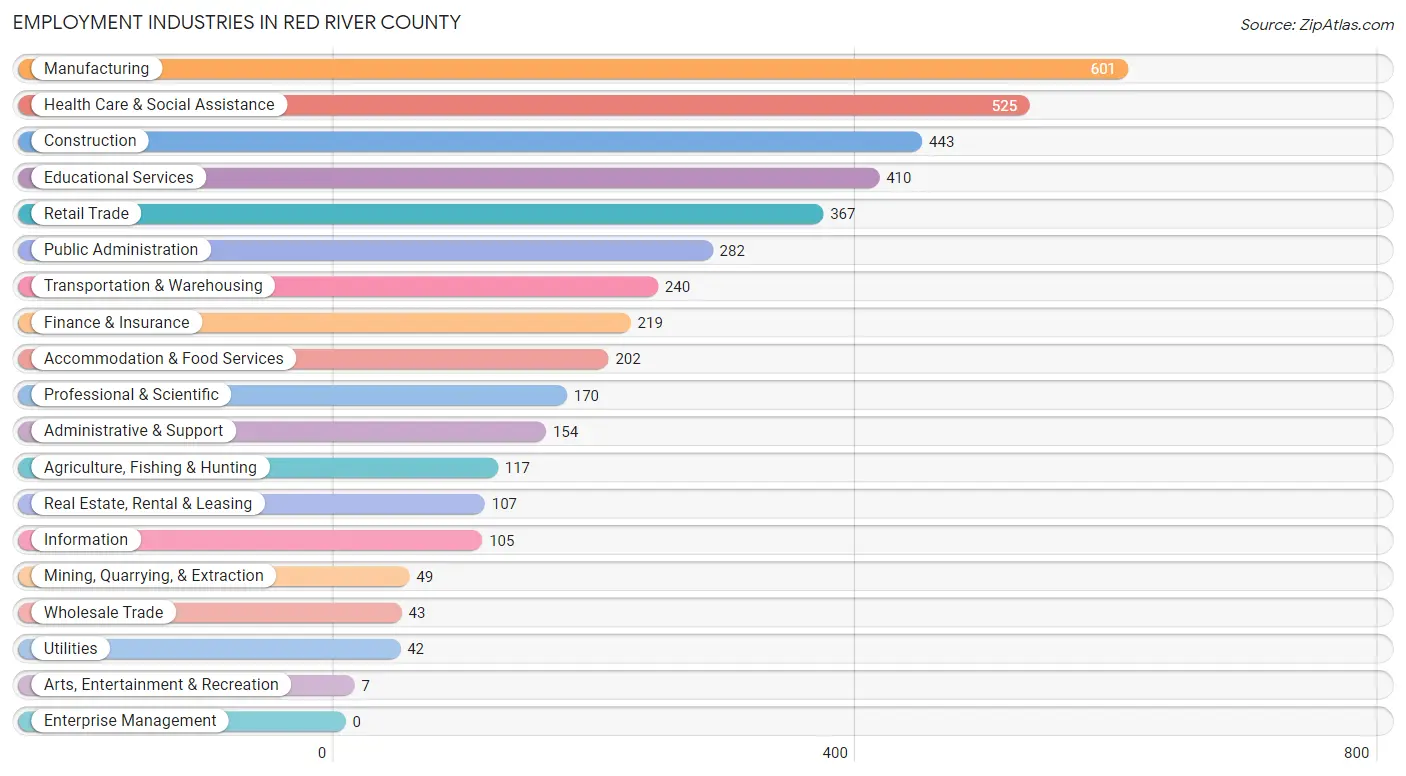
Employment Industries in Red River County
The major employment industries in Red River County include Manufacturing (601 | 13.8%), Health Care & Social Assistance (525 | 12.1%), Construction (443 | 10.2%), Educational Services (410 | 9.4%), and Retail Trade (367 | 8.4%).
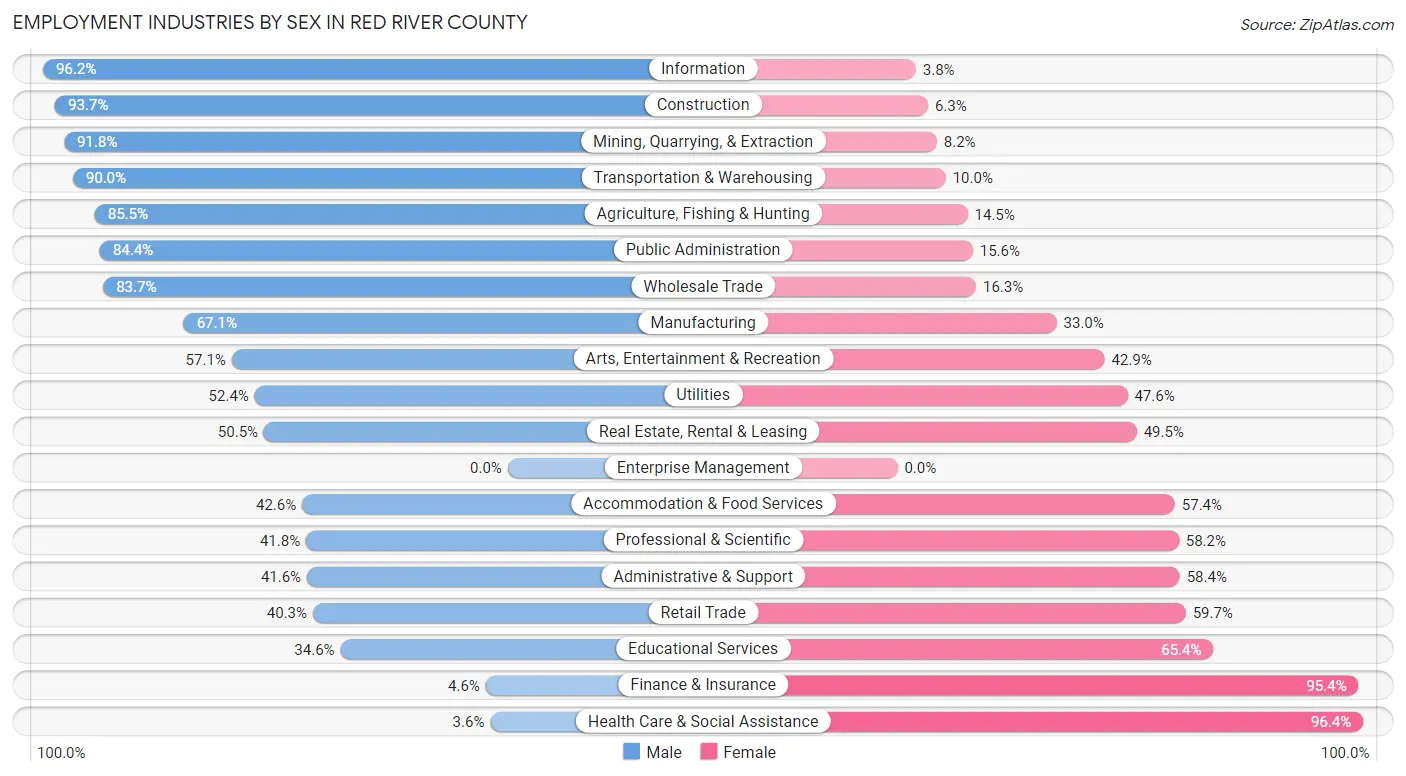
Employment Industries by Sex in Red River County
The Red River County industries that see more men than women are Information (96.2%), Construction (93.7%), and Mining, Quarrying, & Extraction (91.8%), whereas the industries that tend to have a higher number of women are Health Care & Social Assistance (96.4%), Finance & Insurance (95.4%), and Educational Services (65.4%).
| Industry | Male | Female |
| Agriculture, Fishing & Hunting | 100 (85.5%) | 17 (14.5%) |
| Mining, Quarrying, & Extraction | 45 (91.8%) | 4 (8.2%) |
| Construction | 415 (93.7%) | 28 (6.3%) |
| Manufacturing | 403 (67.0%) | 198 (33.0%) |
| Wholesale Trade | 36 (83.7%) | 7 (16.3%) |
| Retail Trade | 148 (40.3%) | 219 (59.7%) |
| Transportation & Warehousing | 216 (90.0%) | 24 (10.0%) |
| Utilities | 22 (52.4%) | 20 (47.6%) |
| Information | 101 (96.2%) | 4 (3.8%) |
| Finance & Insurance | 10 (4.6%) | 209 (95.4%) |
| Real Estate, Rental & Leasing | 54 (50.5%) | 53 (49.5%) |
| Professional & Scientific | 71 (41.8%) | 99 (58.2%) |
| Enterprise Management | 0 (0.0%) | 0 (0.0%) |
| Administrative & Support | 64 (41.6%) | 90 (58.4%) |
| Educational Services | 142 (34.6%) | 268 (65.4%) |
| Health Care & Social Assistance | 19 (3.6%) | 506 (96.4%) |
| Arts, Entertainment & Recreation | 4 (57.1%) | 3 (42.9%) |
| Accommodation & Food Services | 86 (42.6%) | 116 (57.4%) |
| Public Administration | 238 (84.4%) | 44 (15.6%) |
| Total | 2,360 (54.2%) | 1,990 (45.8%) |
Education in Red River County
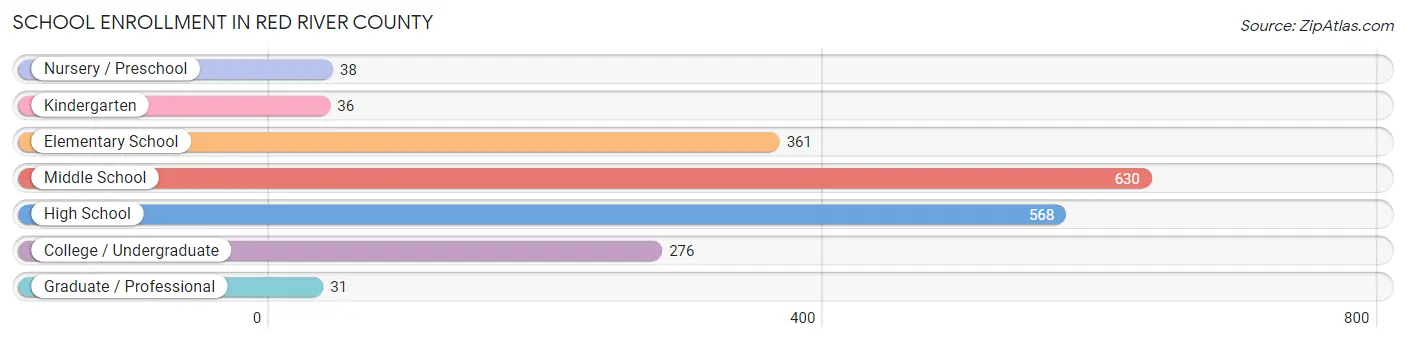
School Enrollment in Red River County
The most common levels of schooling among the 1,940 students in Red River County are middle school (630 | 32.5%), high school (568 | 29.3%), and elementary school (361 | 18.6%).
| School Level | # Students | % Students |
| Nursery / Preschool | 38 | 2.0% |
| Kindergarten | 36 | 1.9% |
| Elementary School | 361 | 18.6% |
| Middle School | 630 | 32.5% |
| High School | 568 | 29.3% |
| College / Undergraduate | 276 | 14.2% |
| Graduate / Professional | 31 | 1.6% |
| Total | 1,940 | 100.0% |
School Enrollment by Age by Funding Source in Red River County
Out of a total of 1,940 students who are enrolled in schools in Red River County, 76 (3.9%) attend a private institution, while the remaining 1,864 (96.1%) are enrolled in public schools. The age group of 20 to 24 year olds has the highest likelihood of being enrolled in private schools, with 26 (21.7% in the age bracket) enrolled. Conversely, the age group of 3 to 4 year olds has the lowest likelihood of being enrolled in a private school, with 33 (100.0% in the age bracket) attending a public institution.
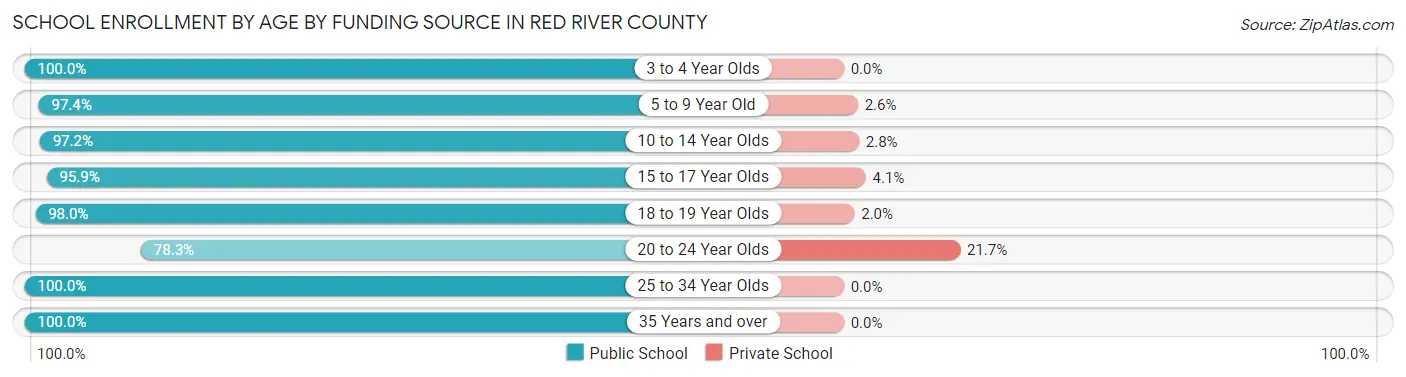
| Age Bracket | Public School | Private School |
| 3 to 4 Year Olds | 33 (100.0%) | 0 (0.0%) |
| 5 to 9 Year Old | 298 (97.4%) | 8 (2.6%) |
| 10 to 14 Year Olds | 755 (97.2%) | 22 (2.8%) |
| 15 to 17 Year Olds | 353 (95.9%) | 15 (4.1%) |
| 18 to 19 Year Olds | 198 (98.0%) | 4 (2.0%) |
| 20 to 24 Year Olds | 94 (78.3%) | 26 (21.7%) |
| 25 to 34 Year Olds | 38 (100.0%) | 0 (0.0%) |
| 35 Years and over | 96 (100.0%) | 0 (0.0%) |
| Total | 1,864 (96.1%) | 76 (3.9%) |
Educational Attainment by Field of Study in Red River County
Education (314 | 25.4%), business (251 | 20.3%), bio, nature & agricultural (182 | 14.7%), arts & humanities (127 | 10.3%), and visual & performing arts (92 | 7.4%) are the most common fields of study among 1,236 individuals in Red River County who have obtained a bachelor's degree or higher.
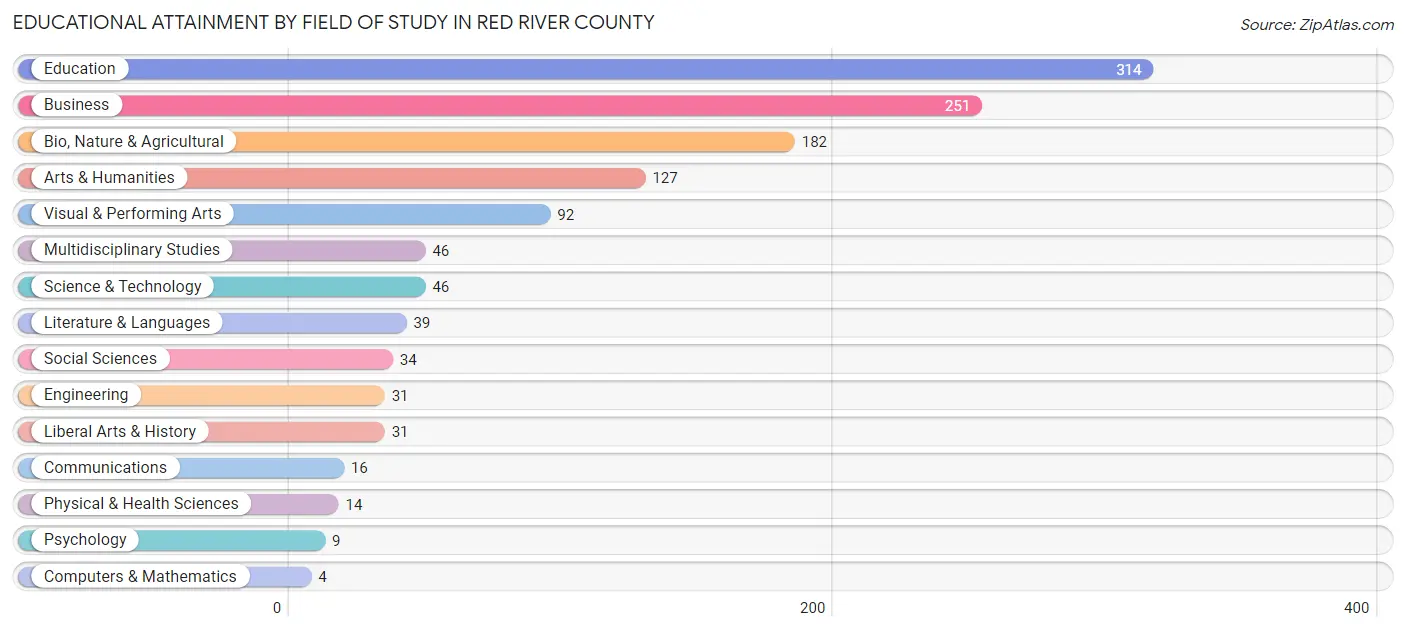
| Field of Study | # Graduates | % Graduates |
| Computers & Mathematics | 4 | 0.3% |
| Bio, Nature & Agricultural | 182 | 14.7% |
| Physical & Health Sciences | 14 | 1.1% |
| Psychology | 9 | 0.7% |
| Social Sciences | 34 | 2.8% |
| Engineering | 31 | 2.5% |
| Multidisciplinary Studies | 46 | 3.7% |
| Science & Technology | 46 | 3.7% |
| Business | 251 | 20.3% |
| Education | 314 | 25.4% |
| Literature & Languages | 39 | 3.2% |
| Liberal Arts & History | 31 | 2.5% |
| Visual & Performing Arts | 92 | 7.4% |
| Communications | 16 | 1.3% |
| Arts & Humanities | 127 | 10.3% |
| Total | 1,236 | 100.0% |
Transportation & Commute in Red River County
Vehicle Availability by Sex in Red River County
The most prevalent vehicle ownership categories in Red River County are males with 2 vehicles (887, accounting for 38.0%) and females with 2 vehicles (646, making up 45.0%).
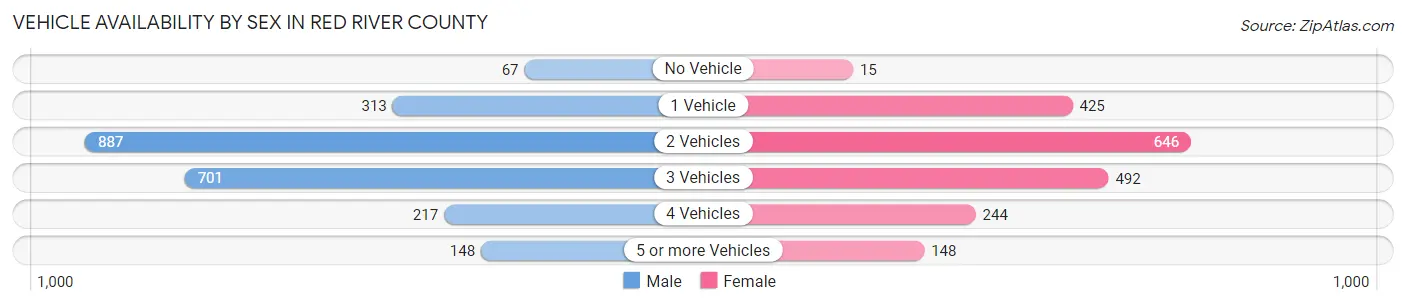
| Vehicles Available | Male | Female |
| No Vehicle | 67 (2.9%) | 15 (0.8%) |
| 1 Vehicle | 313 (13.4%) | 425 (21.6%) |
| 2 Vehicles | 887 (38.0%) | 646 (32.8%) |
| 3 Vehicles | 701 (30.0%) | 492 (25.0%) |
| 4 Vehicles | 217 (9.3%) | 244 (12.4%) |
| 5 or more Vehicles | 148 (6.3%) | 148 (7.5%) |
| Total | 2,333 (100.0%) | 1,970 (100.0%) |
Commute Time in Red River County
The most frequently occuring commute durations in Red River County are 30 to 34 minutes (741 commuters, 18.5%), 20 to 24 minutes (611 commuters, 15.3%), and 45 to 59 minutes (536 commuters, 13.4%).
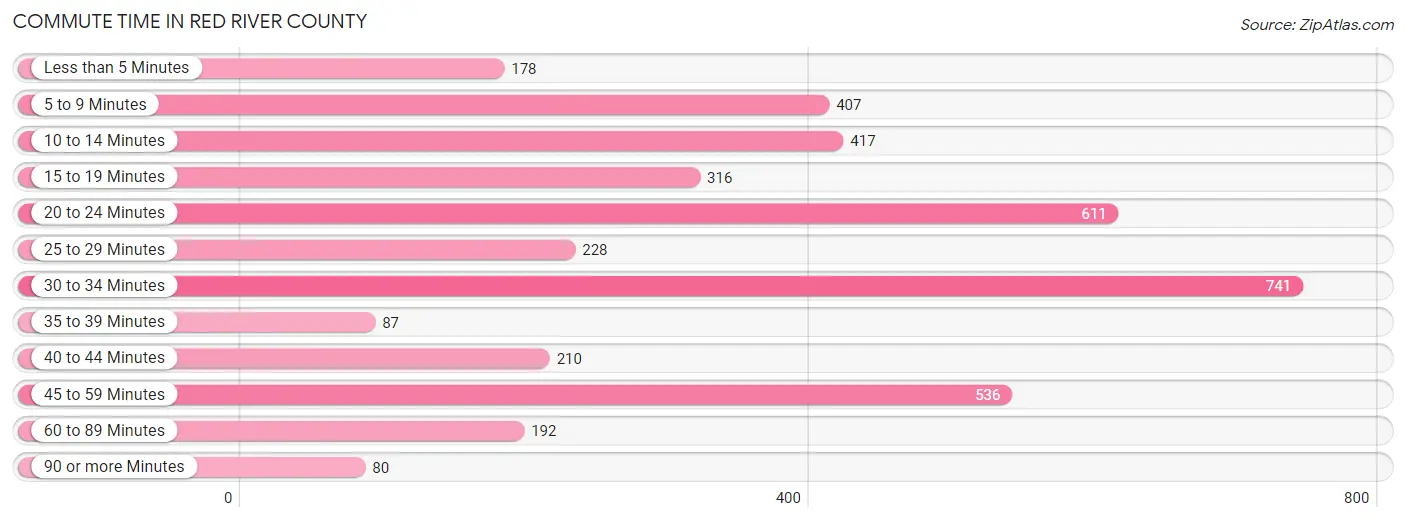
| Commute Time | # Commuters | % Commuters |
| Less than 5 Minutes | 178 | 4.4% |
| 5 to 9 Minutes | 407 | 10.2% |
| 10 to 14 Minutes | 417 | 10.4% |
| 15 to 19 Minutes | 316 | 7.9% |
| 20 to 24 Minutes | 611 | 15.3% |
| 25 to 29 Minutes | 228 | 5.7% |
| 30 to 34 Minutes | 741 | 18.5% |
| 35 to 39 Minutes | 87 | 2.2% |
| 40 to 44 Minutes | 210 | 5.2% |
| 45 to 59 Minutes | 536 | 13.4% |
| 60 to 89 Minutes | 192 | 4.8% |
| 90 or more Minutes | 80 | 2.0% |
Commute Time by Sex in Red River County
The most common commute times in Red River County are 45 to 59 minutes (406 commuters, 18.9%) for males and 30 to 34 minutes (358 commuters, 19.3%) for females.
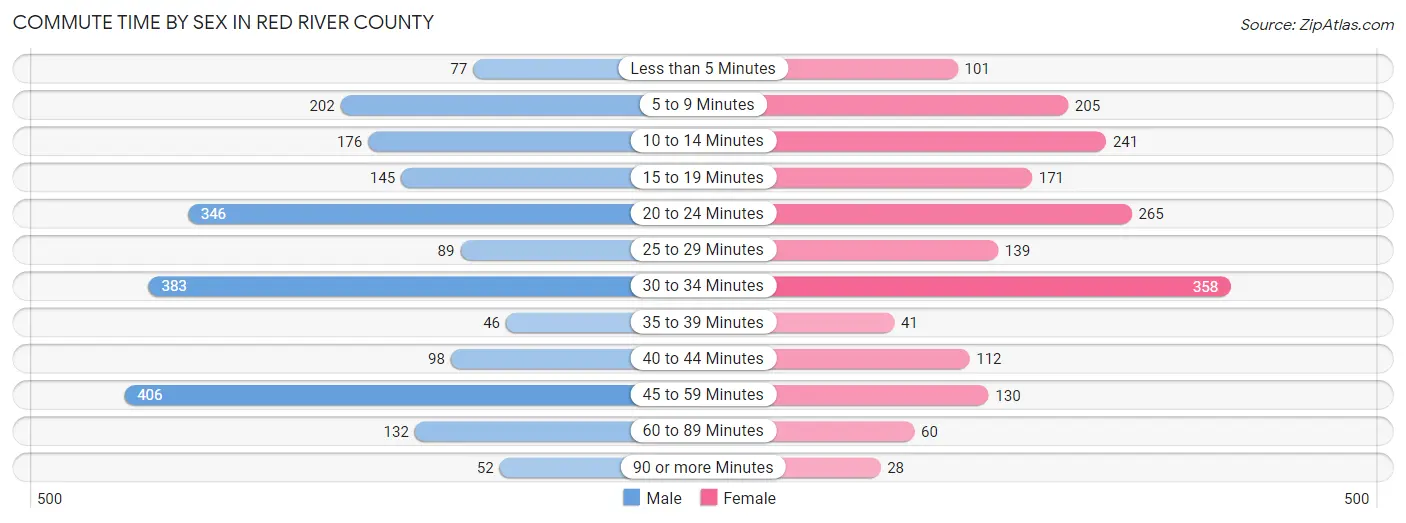
| Commute Time | Male | Female |
| Less than 5 Minutes | 77 (3.6%) | 101 (5.5%) |
| 5 to 9 Minutes | 202 (9.4%) | 205 (11.1%) |
| 10 to 14 Minutes | 176 (8.2%) | 241 (13.0%) |
| 15 to 19 Minutes | 145 (6.7%) | 171 (9.2%) |
| 20 to 24 Minutes | 346 (16.1%) | 265 (14.3%) |
| 25 to 29 Minutes | 89 (4.1%) | 139 (7.5%) |
| 30 to 34 Minutes | 383 (17.8%) | 358 (19.3%) |
| 35 to 39 Minutes | 46 (2.1%) | 41 (2.2%) |
| 40 to 44 Minutes | 98 (4.5%) | 112 (6.0%) |
| 45 to 59 Minutes | 406 (18.9%) | 130 (7.0%) |
| 60 to 89 Minutes | 132 (6.1%) | 60 (3.2%) |
| 90 or more Minutes | 52 (2.4%) | 28 (1.5%) |
Time of Departure to Work by Sex in Red River County
The most frequent times of departure to work in Red River County are 7:00 AM to 7:29 AM (382, 17.7%) for males and 7:00 AM to 7:29 AM (434, 23.4%) for females.
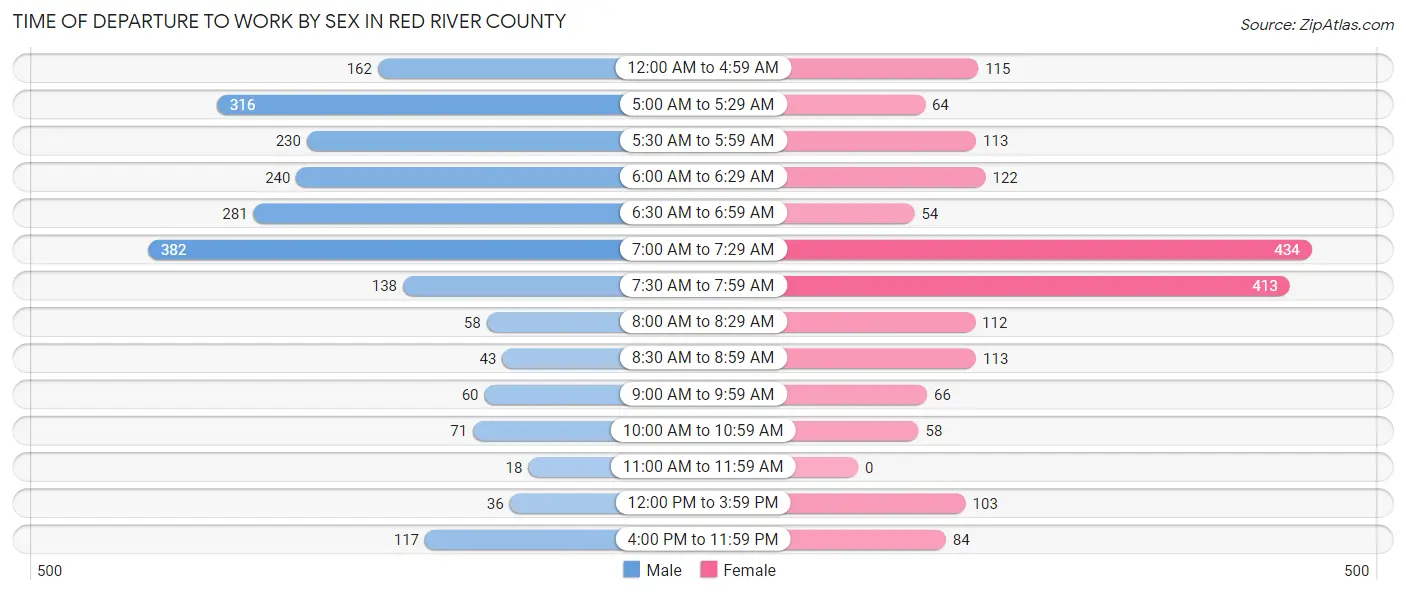
| Time of Departure | Male | Female |
| 12:00 AM to 4:59 AM | 162 (7.5%) | 115 (6.2%) |
| 5:00 AM to 5:29 AM | 316 (14.7%) | 64 (3.5%) |
| 5:30 AM to 5:59 AM | 230 (10.7%) | 113 (6.1%) |
| 6:00 AM to 6:29 AM | 240 (11.2%) | 122 (6.6%) |
| 6:30 AM to 6:59 AM | 281 (13.1%) | 54 (2.9%) |
| 7:00 AM to 7:29 AM | 382 (17.7%) | 434 (23.4%) |
| 7:30 AM to 7:59 AM | 138 (6.4%) | 413 (22.3%) |
| 8:00 AM to 8:29 AM | 58 (2.7%) | 112 (6.0%) |
| 8:30 AM to 8:59 AM | 43 (2.0%) | 113 (6.1%) |
| 9:00 AM to 9:59 AM | 60 (2.8%) | 66 (3.6%) |
| 10:00 AM to 10:59 AM | 71 (3.3%) | 58 (3.1%) |
| 11:00 AM to 11:59 AM | 18 (0.8%) | 0 (0.0%) |
| 12:00 PM to 3:59 PM | 36 (1.7%) | 103 (5.6%) |
| 4:00 PM to 11:59 PM | 117 (5.4%) | 84 (4.5%) |
| Total | 2,152 (100.0%) | 1,851 (100.0%) |
Housing Occupancy in Red River County
Occupancy by Ownership in Red River County
Of the total 4,662 dwellings in Red River County, owner-occupied units account for 3,497 (75.0%), while renter-occupied units make up 1,165 (25.0%).
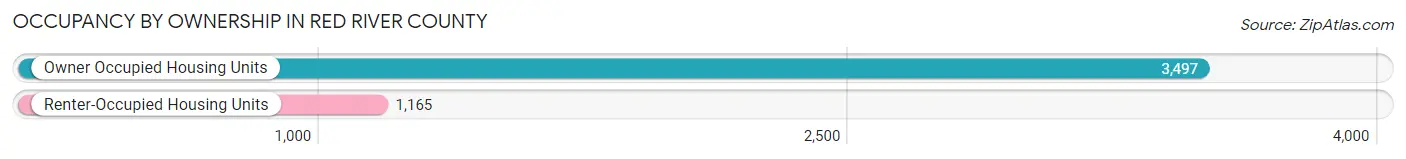
| Occupancy | # Housing Units | % Housing Units |
| Owner Occupied Housing Units | 3,497 | 75.0% |
| Renter-Occupied Housing Units | 1,165 | 25.0% |
| Total Occupied Housing Units | 4,662 | 100.0% |
Occupancy by Household Size in Red River County
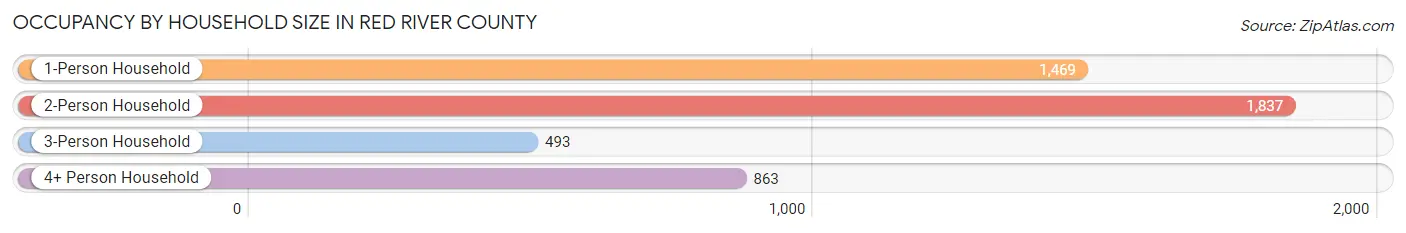
| Household Size | # Housing Units | % Housing Units |
| 1-Person Household | 1,469 | 31.5% |
| 2-Person Household | 1,837 | 39.4% |
| 3-Person Household | 493 | 10.6% |
| 4+ Person Household | 863 | 18.5% |
| Total Housing Units | 4,662 | 100.0% |
Occupancy by Ownership by Household Size in Red River County
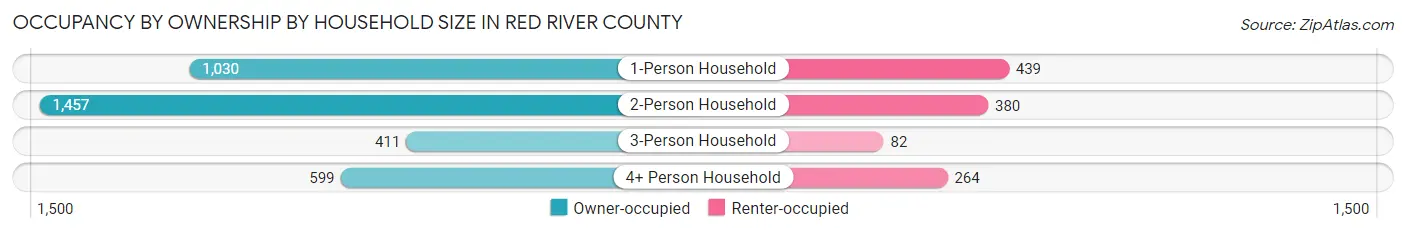
| Household Size | Owner-occupied | Renter-occupied |
| 1-Person Household | 1,030 (70.1%) | 439 (29.9%) |
| 2-Person Household | 1,457 (79.3%) | 380 (20.7%) |
| 3-Person Household | 411 (83.4%) | 82 (16.6%) |
| 4+ Person Household | 599 (69.4%) | 264 (30.6%) |
| Total Housing Units | 3,497 (75.0%) | 1,165 (25.0%) |
Occupancy by Educational Attainment in Red River County
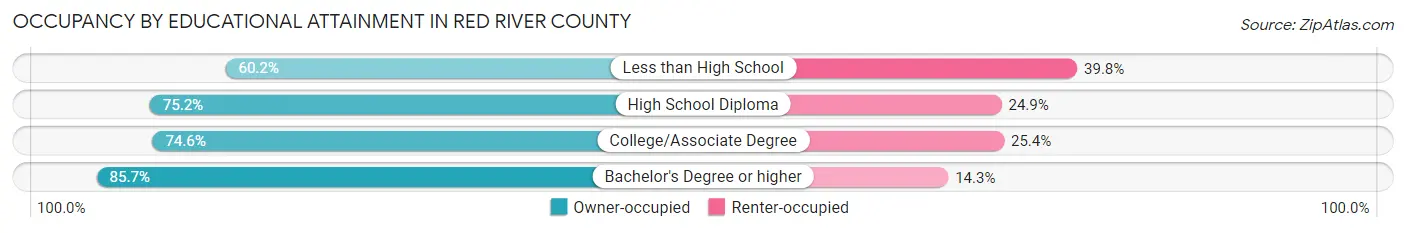
| Household Size | Owner-occupied | Renter-occupied |
| Less than High School | 305 (60.2%) | 202 (39.8%) |
| High School Diploma | 1,364 (75.1%) | 451 (24.8%) |
| College/Associate Degree | 1,198 (74.6%) | 407 (25.4%) |
| Bachelor's Degree or higher | 630 (85.7%) | 105 (14.3%) |
Occupancy by Age of Householder in Red River County
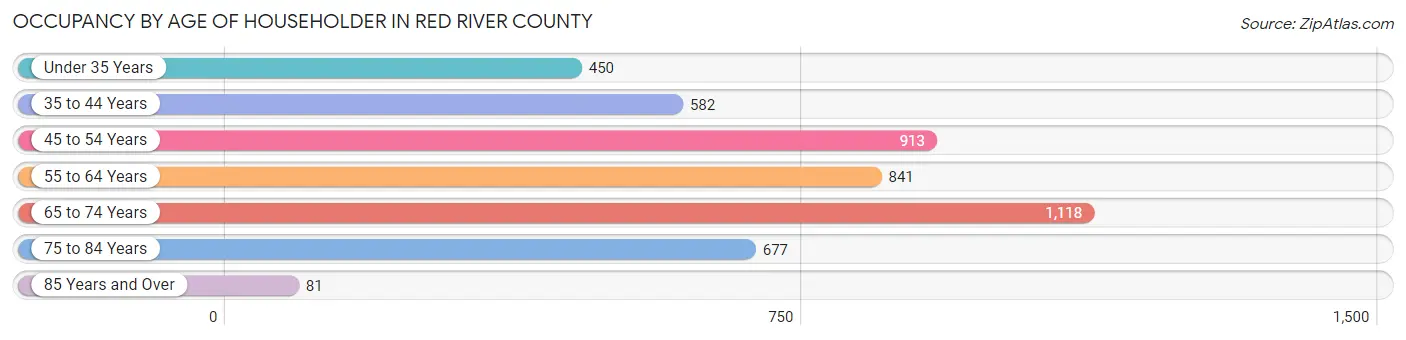
| Age Bracket | # Households | % Households |
| Under 35 Years | 450 | 9.7% |
| 35 to 44 Years | 582 | 12.5% |
| 45 to 54 Years | 913 | 19.6% |
| 55 to 64 Years | 841 | 18.0% |
| 65 to 74 Years | 1,118 | 24.0% |
| 75 to 84 Years | 677 | 14.5% |
| 85 Years and Over | 81 | 1.7% |
| Total | 4,662 | 100.0% |
Housing Finances in Red River County
Median Income by Occupancy in Red River County
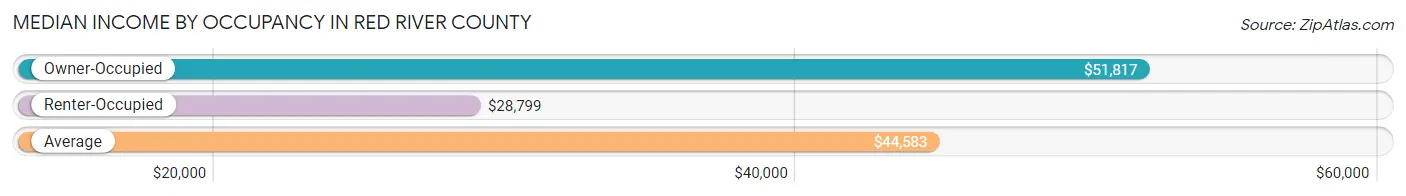
| Occupancy Type | # Households | Median Income |
| Owner-Occupied | 3,497 (75.0%) | $51,817 |
| Renter-Occupied | 1,165 (25.0%) | $28,799 |
| Average | 4,662 (100.0%) | $44,583 |
Occupancy by Householder Income Bracket in Red River County
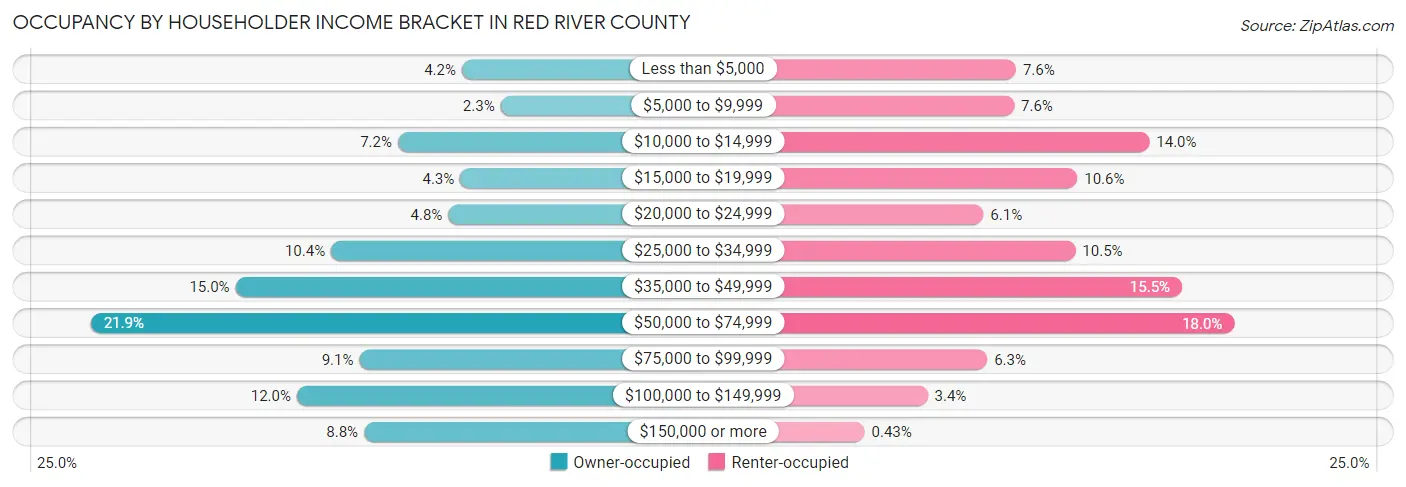
| Income Bracket | Owner-occupied | Renter-occupied |
| Less than $5,000 | 146 (4.2%) | 89 (7.6%) |
| $5,000 to $9,999 | 82 (2.3%) | 88 (7.5%) |
| $10,000 to $14,999 | 253 (7.2%) | 163 (14.0%) |
| $15,000 to $19,999 | 149 (4.3%) | 123 (10.6%) |
| $20,000 to $24,999 | 169 (4.8%) | 71 (6.1%) |
| $25,000 to $34,999 | 364 (10.4%) | 122 (10.5%) |
| $35,000 to $49,999 | 523 (15.0%) | 181 (15.5%) |
| $50,000 to $74,999 | 764 (21.8%) | 210 (18.0%) |
| $75,000 to $99,999 | 317 (9.1%) | 73 (6.3%) |
| $100,000 to $149,999 | 421 (12.0%) | 40 (3.4%) |
| $150,000 or more | 309 (8.8%) | 5 (0.4%) |
| Total | 3,497 (100.0%) | 1,165 (100.0%) |
Monthly Housing Cost Tiers in Red River County
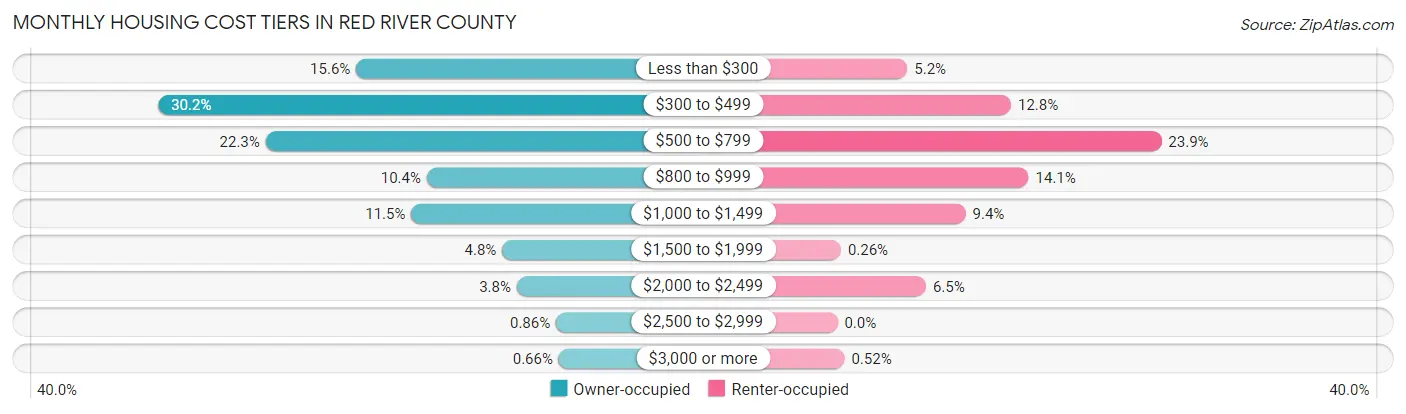
| Monthly Cost | Owner-occupied | Renter-occupied |
| Less than $300 | 545 (15.6%) | 60 (5.1%) |
| $300 to $499 | 1,055 (30.2%) | 149 (12.8%) |
| $500 to $799 | 778 (22.3%) | 278 (23.9%) |
| $800 to $999 | 363 (10.4%) | 164 (14.1%) |
| $1,000 to $1,499 | 403 (11.5%) | 110 (9.4%) |
| $1,500 to $1,999 | 169 (4.8%) | 3 (0.3%) |
| $2,000 to $2,499 | 131 (3.7%) | 76 (6.5%) |
| $2,500 to $2,999 | 30 (0.9%) | 0 (0.0%) |
| $3,000 or more | 23 (0.7%) | 6 (0.5%) |
| Total | 3,497 (100.0%) | 1,165 (100.0%) |
Physical Housing Characteristics in Red River County
Housing Structures in Red River County
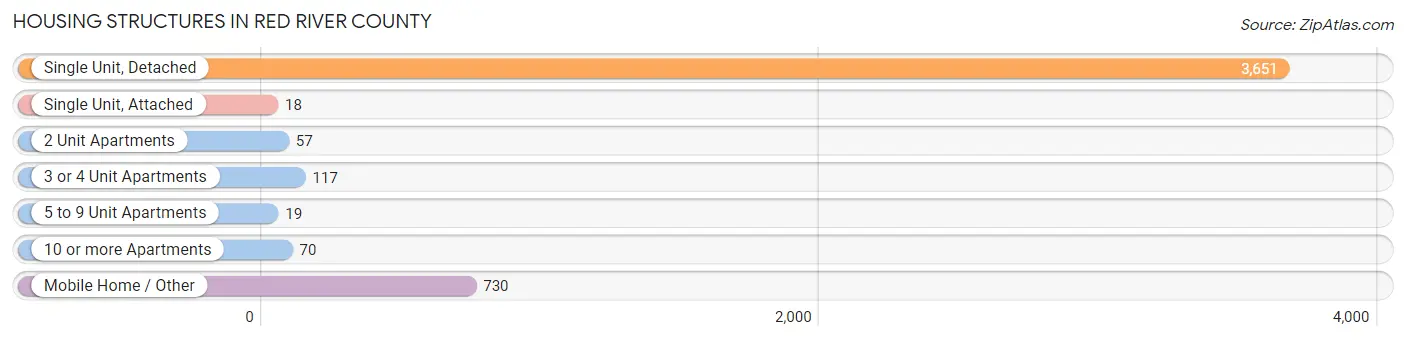
| Structure Type | # Housing Units | % Housing Units |
| Single Unit, Detached | 3,651 | 78.3% |
| Single Unit, Attached | 18 | 0.4% |
| 2 Unit Apartments | 57 | 1.2% |
| 3 or 4 Unit Apartments | 117 | 2.5% |
| 5 to 9 Unit Apartments | 19 | 0.4% |
| 10 or more Apartments | 70 | 1.5% |
| Mobile Home / Other | 730 | 15.7% |
| Total | 4,662 | 100.0% |
Housing Structures by Occupancy in Red River County
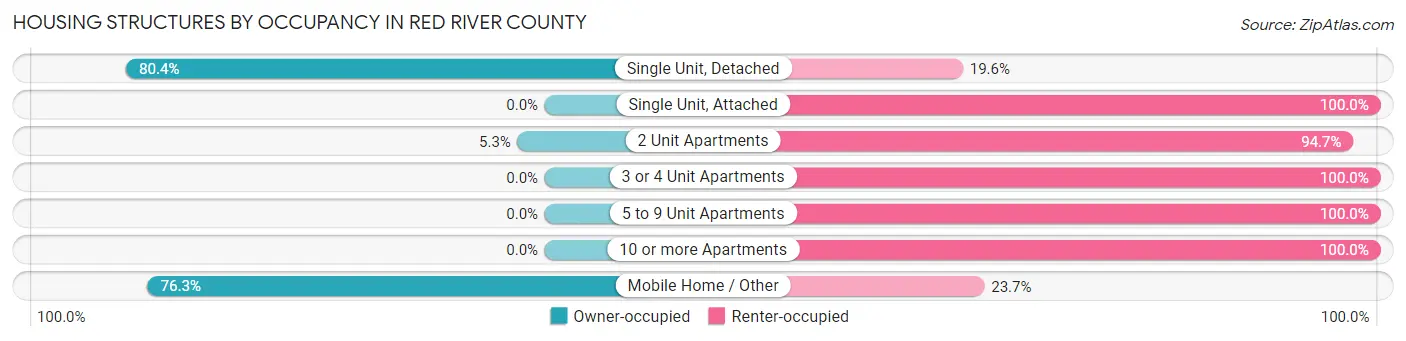
| Structure Type | Owner-occupied | Renter-occupied |
| Single Unit, Detached | 2,937 (80.4%) | 714 (19.6%) |
| Single Unit, Attached | 0 (0.0%) | 18 (100.0%) |
| 2 Unit Apartments | 3 (5.3%) | 54 (94.7%) |
| 3 or 4 Unit Apartments | 0 (0.0%) | 117 (100.0%) |
| 5 to 9 Unit Apartments | 0 (0.0%) | 19 (100.0%) |
| 10 or more Apartments | 0 (0.0%) | 70 (100.0%) |
| Mobile Home / Other | 557 (76.3%) | 173 (23.7%) |
| Total | 3,497 (75.0%) | 1,165 (25.0%) |
Housing Structures by Number of Rooms in Red River County
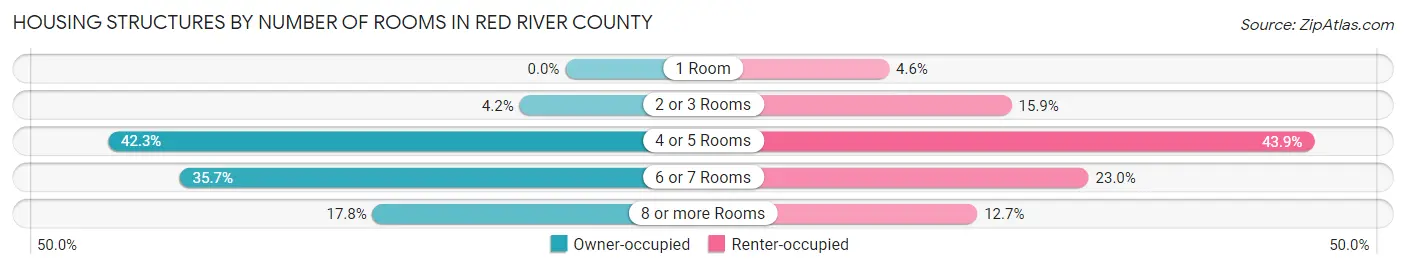
| Number of Rooms | Owner-occupied | Renter-occupied |
| 1 Room | 0 (0.0%) | 53 (4.5%) |
| 2 or 3 Rooms | 148 (4.2%) | 185 (15.9%) |
| 4 or 5 Rooms | 1,479 (42.3%) | 511 (43.9%) |
| 6 or 7 Rooms | 1,247 (35.7%) | 268 (23.0%) |
| 8 or more Rooms | 623 (17.8%) | 148 (12.7%) |
| Total | 3,497 (100.0%) | 1,165 (100.0%) |
Housing Structure by Heating Type in Red River County
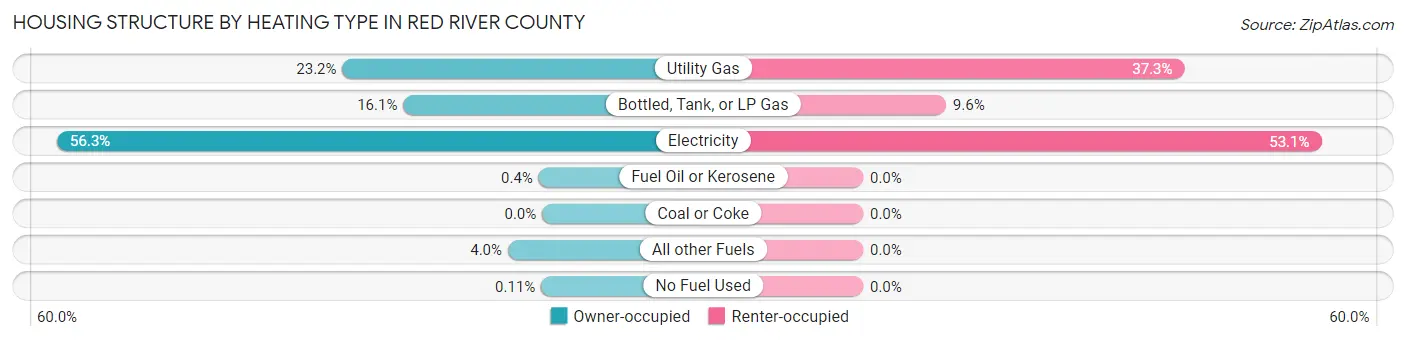
| Heating Type | Owner-occupied | Renter-occupied |
| Utility Gas | 810 (23.2%) | 434 (37.2%) |
| Bottled, Tank, or LP Gas | 563 (16.1%) | 112 (9.6%) |
| Electricity | 1,967 (56.2%) | 619 (53.1%) |
| Fuel Oil or Kerosene | 14 (0.4%) | 0 (0.0%) |
| Coal or Coke | 0 (0.0%) | 0 (0.0%) |
| All other Fuels | 139 (4.0%) | 0 (0.0%) |
| No Fuel Used | 4 (0.1%) | 0 (0.0%) |
| Total | 3,497 (100.0%) | 1,165 (100.0%) |
Household Vehicle Usage in Red River County
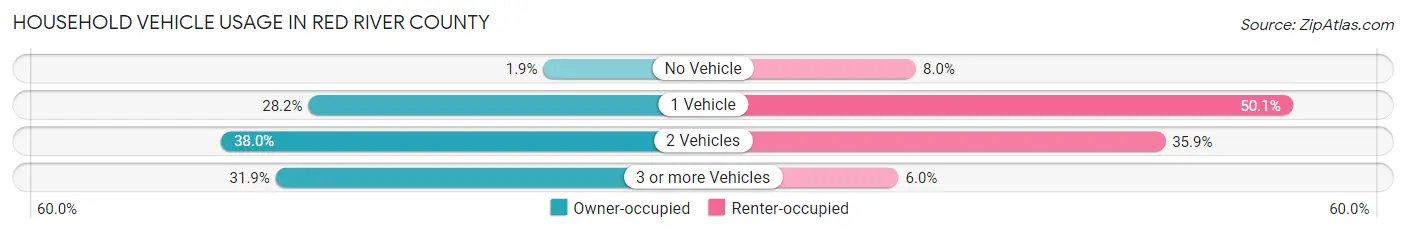
| Vehicles per Household | Owner-occupied | Renter-occupied |
| No Vehicle | 66 (1.9%) | 93 (8.0%) |
| 1 Vehicle | 987 (28.2%) | 584 (50.1%) |
| 2 Vehicles | 1,329 (38.0%) | 418 (35.9%) |
| 3 or more Vehicles | 1,115 (31.9%) | 70 (6.0%) |
| Total | 3,497 (100.0%) | 1,165 (100.0%) |
Real Estate & Mortgages in Red River County
Real Estate and Mortgage Overview in Red River County
| Characteristic | Without Mortgage | With Mortgage |
| Housing Units | 2,440 | 1,057 |
| Median Property Value | $94,500 | $156,800 |
| Median Household Income | $44,732 | $104 |
| Monthly Housing Costs | $439 | $23 |
| Real Estate Taxes | $1,023 | $70 |
Property Value by Mortgage Status in Red River County
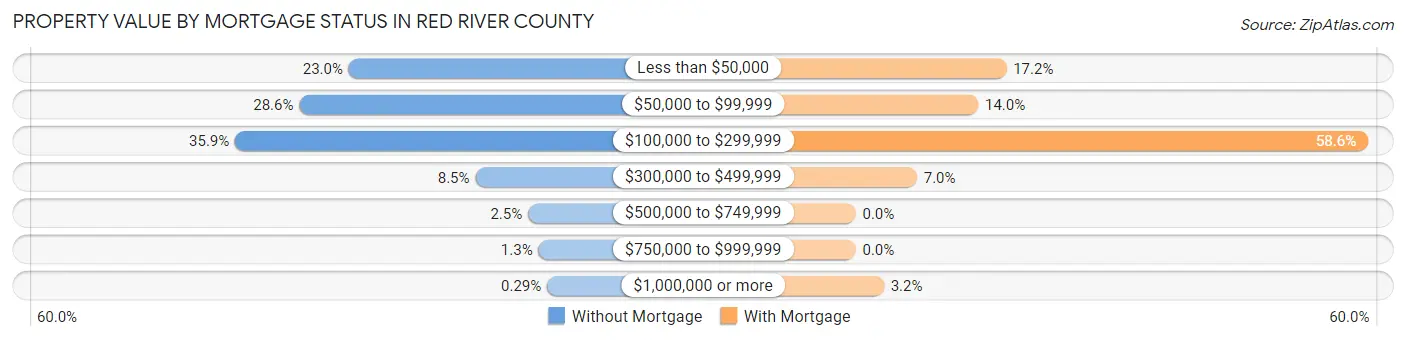
| Property Value | Without Mortgage | With Mortgage |
| Less than $50,000 | 560 (23.0%) | 182 (17.2%) |
| $50,000 to $99,999 | 698 (28.6%) | 148 (14.0%) |
| $100,000 to $299,999 | 877 (35.9%) | 619 (58.6%) |
| $300,000 to $499,999 | 207 (8.5%) | 74 (7.0%) |
| $500,000 to $749,999 | 60 (2.5%) | 0 (0.0%) |
| $750,000 to $999,999 | 31 (1.3%) | 0 (0.0%) |
| $1,000,000 or more | 7 (0.3%) | 34 (3.2%) |
| Total | 2,440 (100.0%) | 1,057 (100.0%) |
Household Income by Mortgage Status in Red River County
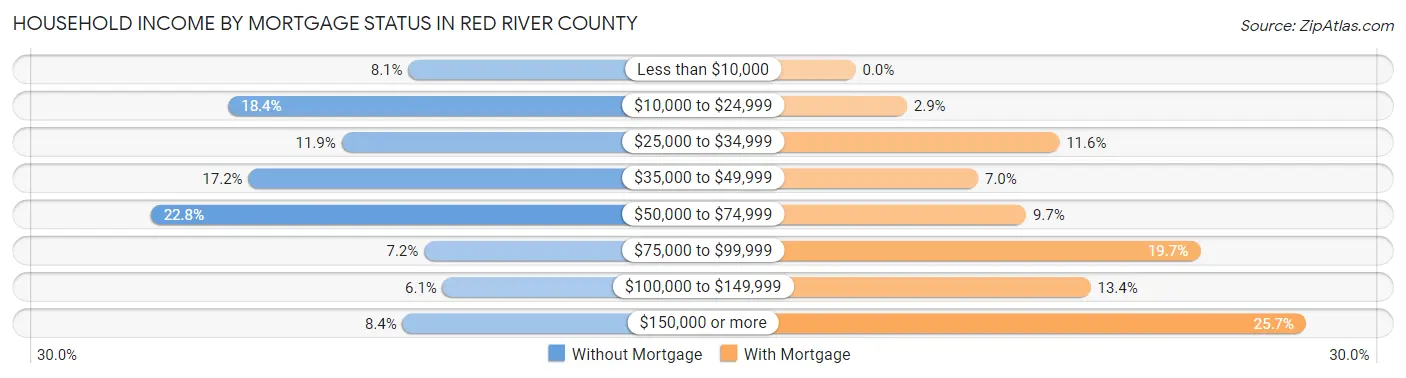
| Household Income | Without Mortgage | With Mortgage |
| Less than $10,000 | 197 (8.1%) | 0 (0.0%) |
| $10,000 to $24,999 | 448 (18.4%) | 31 (2.9%) |
| $25,000 to $34,999 | 290 (11.9%) | 123 (11.6%) |
| $35,000 to $49,999 | 420 (17.2%) | 74 (7.0%) |
| $50,000 to $74,999 | 556 (22.8%) | 103 (9.7%) |
| $75,000 to $99,999 | 175 (7.2%) | 208 (19.7%) |
| $100,000 to $149,999 | 149 (6.1%) | 142 (13.4%) |
| $150,000 or more | 205 (8.4%) | 272 (25.7%) |
| Total | 2,440 (100.0%) | 1,057 (100.0%) |
Property Value to Household Income Ratio in Red River County
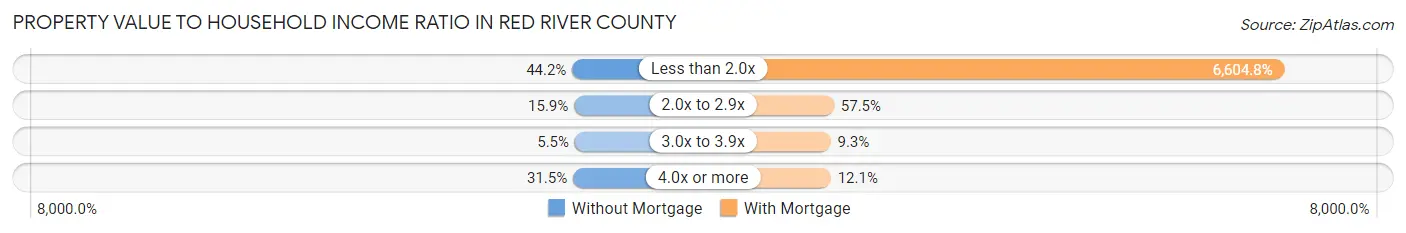
| Value-to-Income Ratio | Without Mortgage | With Mortgage |
| Less than 2.0x | 1,079 (44.2%) | 69,813 (6,604.8%) |
| 2.0x to 2.9x | 388 (15.9%) | 608 (57.5%) |
| 3.0x to 3.9x | 134 (5.5%) | 98 (9.3%) |
| 4.0x or more | 768 (31.5%) | 128 (12.1%) |
| Total | 2,440 (100.0%) | 1,057 (100.0%) |
Real Estate Taxes by Mortgage Status in Red River County
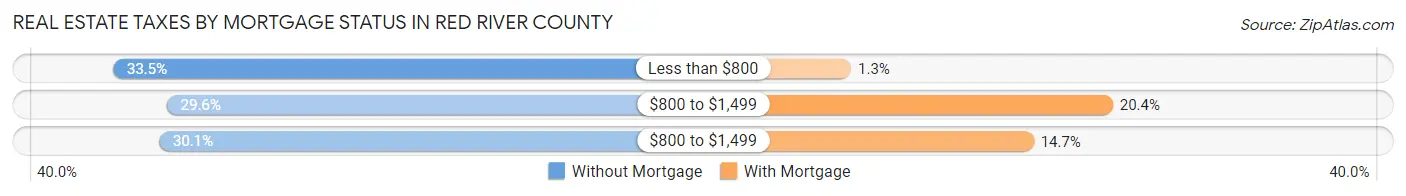
| Property Taxes | Without Mortgage | With Mortgage |
| Less than $800 | 817 (33.5%) | 14 (1.3%) |
| $800 to $1,499 | 721 (29.5%) | 216 (20.4%) |
| $800 to $1,499 | 735 (30.1%) | 155 (14.7%) |
| Total | 2,440 (100.0%) | 1,057 (100.0%) |
Health & Disability in Red River County
Health Insurance Coverage by Age in Red River County
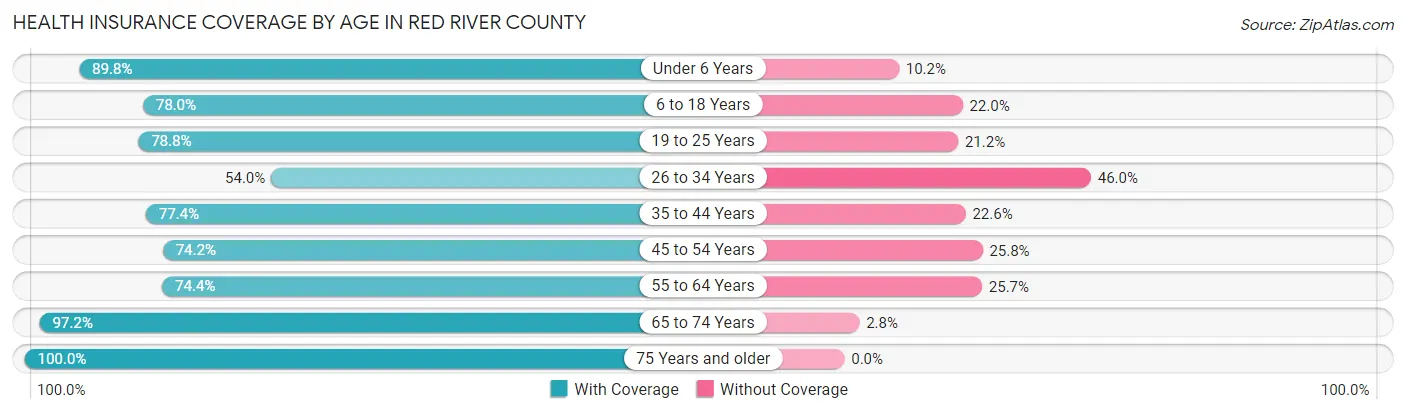
| Age Bracket | With Coverage | Without Coverage |
| Under 6 Years | 654 (89.8%) | 74 (10.2%) |
| 6 to 18 Years | 1,390 (78.0%) | 393 (22.0%) |
| 19 to 25 Years | 591 (78.8%) | 159 (21.2%) |
| 26 to 34 Years | 463 (54.0%) | 394 (46.0%) |
| 35 to 44 Years | 911 (77.4%) | 266 (22.6%) |
| 45 to 54 Years | 1,170 (74.2%) | 406 (25.8%) |
| 55 to 64 Years | 1,235 (74.4%) | 426 (25.7%) |
| 65 to 74 Years | 1,646 (97.2%) | 47 (2.8%) |
| 75 Years and older | 1,212 (100.0%) | 0 (0.0%) |
| Total | 9,272 (81.1%) | 2,165 (18.9%) |
Health Insurance Coverage by Citizenship Status in Red River County
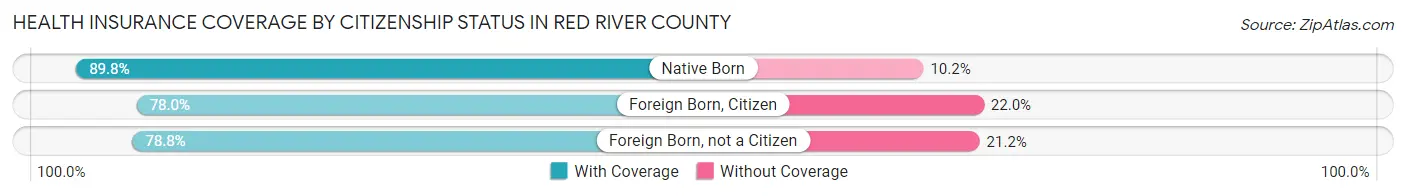
| Citizenship Status | With Coverage | Without Coverage |
| Native Born | 654 (89.8%) | 74 (10.2%) |
| Foreign Born, Citizen | 1,390 (78.0%) | 393 (22.0%) |
| Foreign Born, not a Citizen | 591 (78.8%) | 159 (21.2%) |
Health Insurance Coverage by Household Income in Red River County
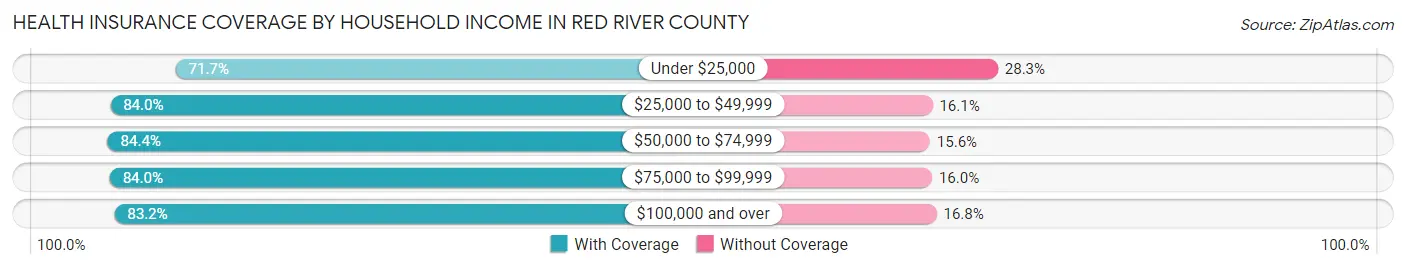
| Household Income | With Coverage | Without Coverage |
| Under $25,000 | 1,890 (71.7%) | 746 (28.3%) |
| $25,000 to $49,999 | 2,056 (84.0%) | 393 (16.1%) |
| $50,000 to $74,999 | 2,142 (84.4%) | 395 (15.6%) |
| $75,000 to $99,999 | 1,037 (84.0%) | 197 (16.0%) |
| $100,000 and over | 2,147 (83.2%) | 434 (16.8%) |
Public vs Private Health Insurance Coverage by Age in Red River County
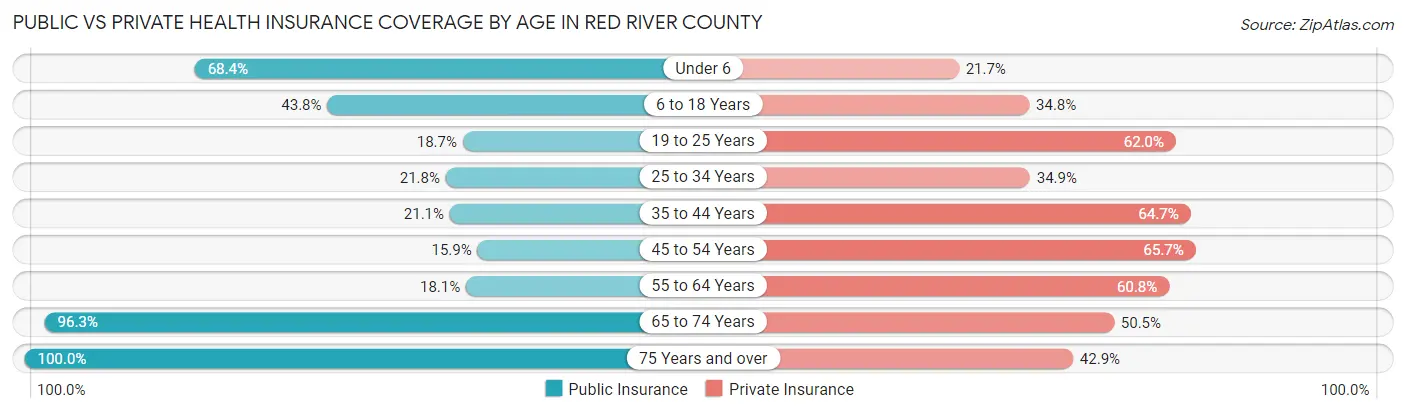
| Age Bracket | Public Insurance | Private Insurance |
| Under 6 | 498 (68.4%) | 158 (21.7%) |
| 6 to 18 Years | 781 (43.8%) | 620 (34.8%) |
| 19 to 25 Years | 140 (18.7%) | 465 (62.0%) |
| 25 to 34 Years | 187 (21.8%) | 299 (34.9%) |
| 35 to 44 Years | 248 (21.1%) | 762 (64.7%) |
| 45 to 54 Years | 251 (15.9%) | 1,035 (65.7%) |
| 55 to 64 Years | 300 (18.1%) | 1,009 (60.8%) |
| 65 to 74 Years | 1,630 (96.3%) | 855 (50.5%) |
| 75 Years and over | 1,212 (100.0%) | 520 (42.9%) |
| Total | 5,247 (45.9%) | 5,723 (50.0%) |
Disability Status by Sex by Age in Red River County
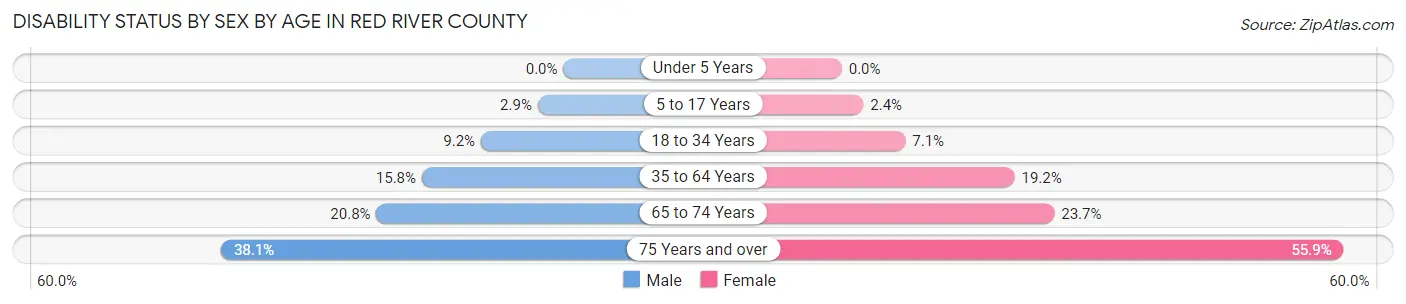
| Age Bracket | Male | Female |
| Under 5 Years | 0 (0.0%) | 0 (0.0%) |
| 5 to 17 Years | 23 (2.9%) | 20 (2.4%) |
| 18 to 34 Years | 83 (9.2%) | 62 (7.1%) |
| 35 to 64 Years | 341 (15.8%) | 433 (19.2%) |
| 65 to 74 Years | 173 (20.8%) | 204 (23.7%) |
| 75 Years and over | 196 (38.1%) | 390 (55.9%) |
Disability Class by Sex by Age in Red River County
Disability Class: Hearing Difficulty
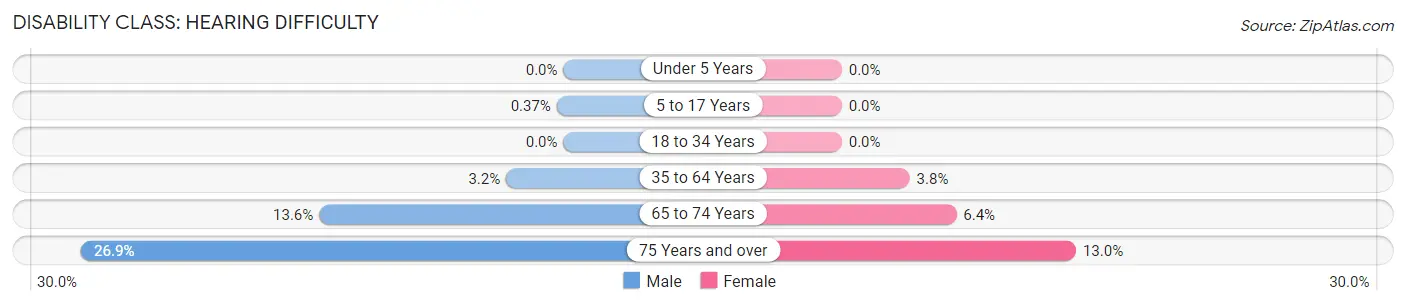
| Age Bracket | Male | Female |
| Under 5 Years | 0 (0.0%) | 0 (0.0%) |
| 5 to 17 Years | 3 (0.4%) | 0 (0.0%) |
| 18 to 34 Years | 0 (0.0%) | 0 (0.0%) |
| 35 to 64 Years | 69 (3.2%) | 85 (3.8%) |
| 65 to 74 Years | 113 (13.6%) | 55 (6.4%) |
| 75 Years and over | 138 (26.9%) | 91 (13.0%) |
Disability Class: Vision Difficulty
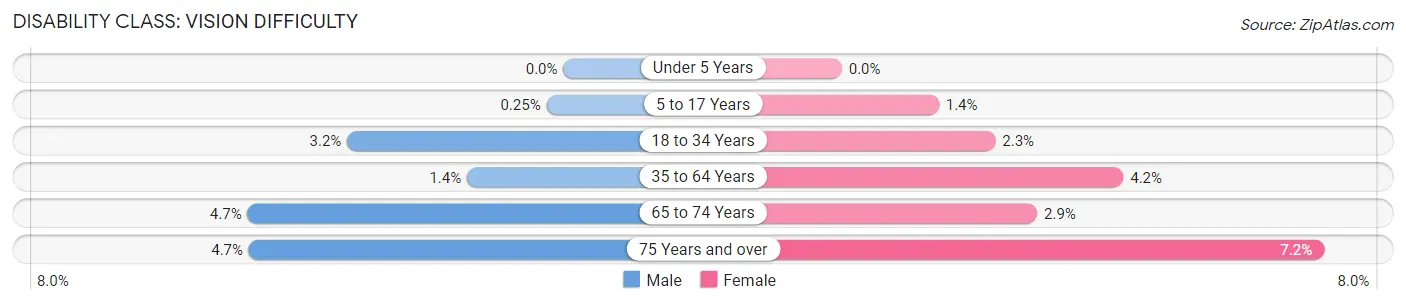
| Age Bracket | Male | Female |
| Under 5 Years | 0 (0.0%) | 0 (0.0%) |
| 5 to 17 Years | 2 (0.3%) | 12 (1.4%) |
| 18 to 34 Years | 29 (3.2%) | 20 (2.3%) |
| 35 to 64 Years | 31 (1.4%) | 94 (4.2%) |
| 65 to 74 Years | 39 (4.7%) | 25 (2.9%) |
| 75 Years and over | 24 (4.7%) | 50 (7.2%) |
Disability Class: Cognitive Difficulty
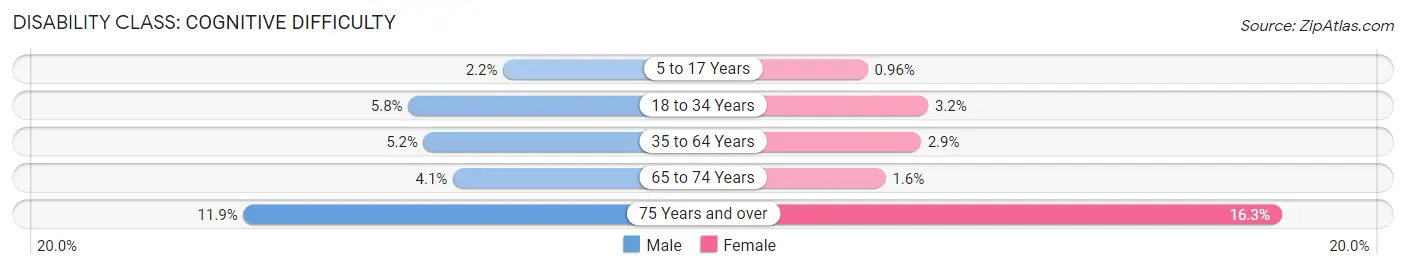
| Age Bracket | Male | Female |
| 5 to 17 Years | 18 (2.2%) | 8 (1.0%) |
| 18 to 34 Years | 52 (5.8%) | 28 (3.2%) |
| 35 to 64 Years | 112 (5.2%) | 66 (2.9%) |
| 65 to 74 Years | 34 (4.1%) | 14 (1.6%) |
| 75 Years and over | 61 (11.9%) | 114 (16.3%) |
Disability Class: Ambulatory Difficulty
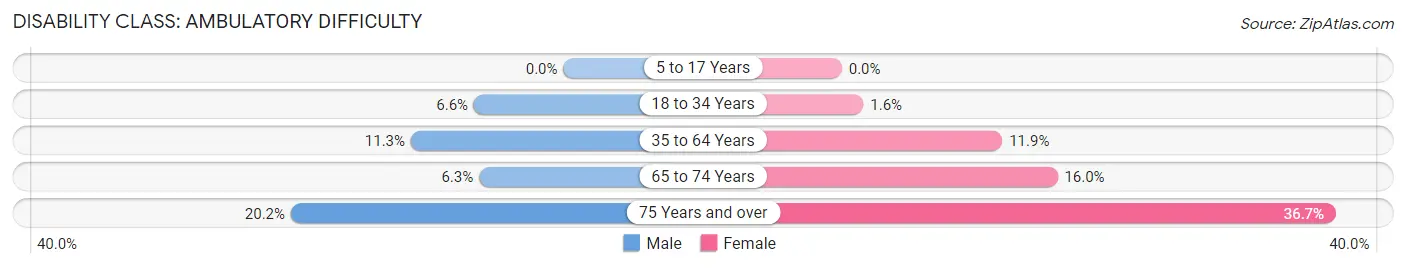
| Age Bracket | Male | Female |
| 5 to 17 Years | 0 (0.0%) | 0 (0.0%) |
| 18 to 34 Years | 60 (6.6%) | 14 (1.6%) |
| 35 to 64 Years | 245 (11.3%) | 268 (11.9%) |
| 65 to 74 Years | 52 (6.3%) | 138 (16.0%) |
| 75 Years and over | 104 (20.2%) | 256 (36.7%) |
Disability Class: Self-Care Difficulty
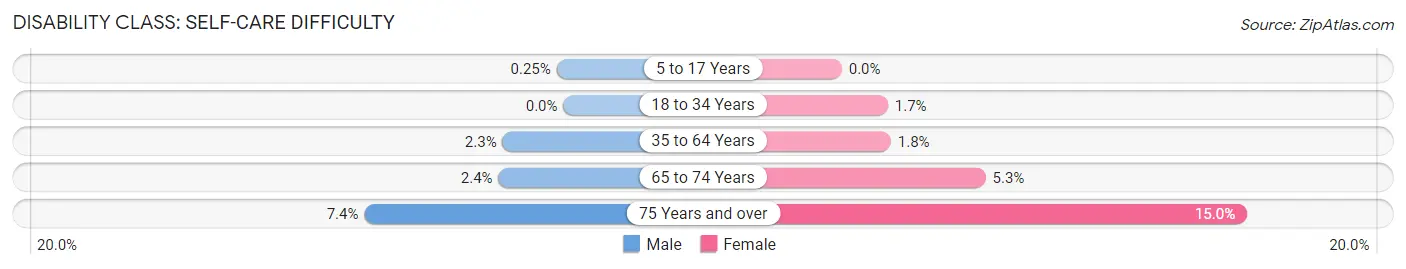
| Age Bracket | Male | Female |
| 5 to 17 Years | 2 (0.3%) | 0 (0.0%) |
| 18 to 34 Years | 0 (0.0%) | 15 (1.7%) |
| 35 to 64 Years | 49 (2.3%) | 41 (1.8%) |
| 65 to 74 Years | 20 (2.4%) | 46 (5.3%) |
| 75 Years and over | 38 (7.4%) | 105 (15.0%) |
Technology Access in Red River County
Computing Device Access in Red River County
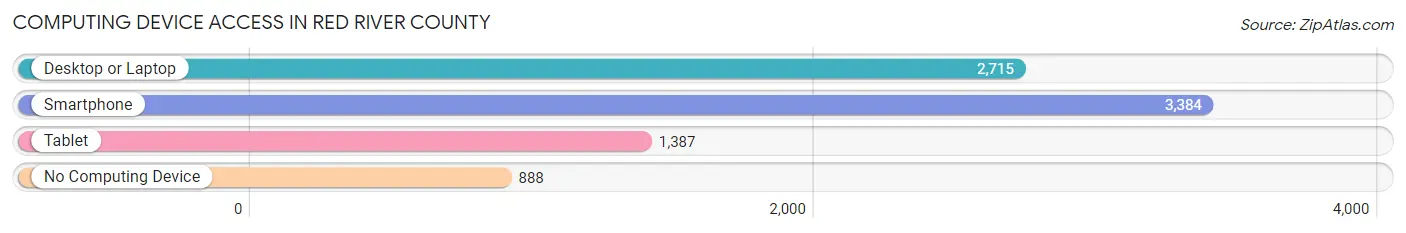
| Device Type | # Households | % Households |
| Desktop or Laptop | 2,715 | 58.2% |
| Smartphone | 3,384 | 72.6% |
| Tablet | 1,387 | 29.7% |
| No Computing Device | 888 | 19.1% |
| Total | 4,662 | 100.0% |
Internet Access in Red River County
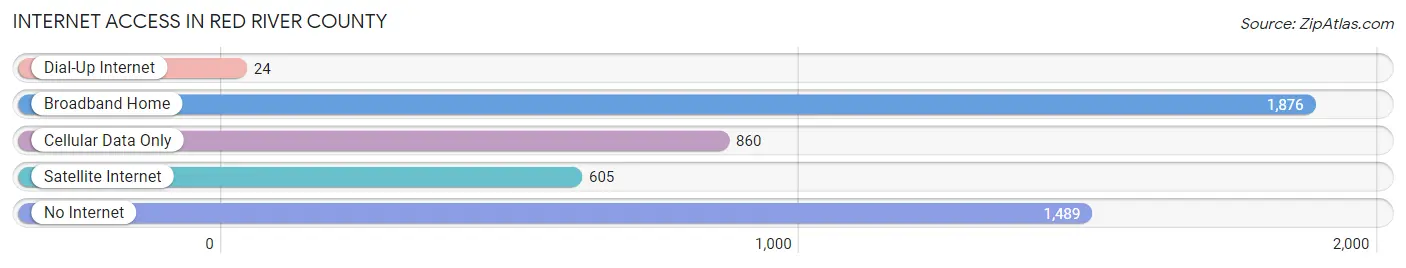
| Internet Type | # Households | % Households |
| Dial-Up Internet | 24 | 0.5% |
| Broadband Home | 1,876 | 40.2% |
| Cellular Data Only | 860 | 18.4% |
| Satellite Internet | 605 | 13.0% |
| No Internet | 1,489 | 31.9% |
| Total | 4,662 | 100.0% |
Red River County Summary
Red River County is located in the northeastern corner of Texas, and is bordered by Oklahoma to the north, Arkansas to the east, and Bowie and Lamar Counties to the south and west, respectively. The county seat is Clarksville, and the county is named for the Red River, which forms its northern boundary. The county has a total area of 890 square miles, of which 887 square miles is land and 3 square miles is water.
Geography
Red River County is located in the northeast corner of Texas, and is bordered by Oklahoma to the north, Arkansas to the east, and Bowie and Lamar Counties to the south and west, respectively. The county is located in the Red River Valley, which is a flat, fertile plain that is part of the Great Plains region. The Red River forms the northern boundary of the county, and the Sulphur River forms the eastern boundary. The terrain is mostly flat, with some rolling hills in the western part of the county. The county is drained by the Red River and its tributaries, including the Sulphur River, the Little River, and the Cypress River.
The climate of Red River County is humid subtropical, with hot, humid summers and mild winters. The average annual temperature is 68°F, and the average annual precipitation is 40 inches.
Economy
The economy of Red River County is largely based on agriculture. The county is home to a variety of crops, including cotton, corn, soybeans, wheat, and hay. Livestock production is also important, with cattle, hogs, and poultry being the main animals raised.
The county is also home to several manufacturing companies, including a paper mill, a furniture factory, and a plastics plant. The county is also home to a number of oil and gas wells, and there is some timber production in the county.
Demographics
As of the 2010 census, Red River County had a population of 12,860. The population was 57.2% White, 37.2% Black or African American, 0.7% Native American, 0.3% Asian, 0.1% Pacific Islander, and 4.5% from two or more races. Hispanic or Latino of any race were 4.3% of the population.
The median household income was $35,945, and the median family income was $43,906. The per capita income was $17,845. About 20.2% of the population was below the poverty line.
Conclusion
Red River County is located in the northeastern corner of Texas, and is bordered by Oklahoma to the north, Arkansas to the east, and Bowie and Lamar Counties to the south and west, respectively. The county is located in the Red River Valley, and is home to a variety of crops, livestock, and manufacturing companies. The population of the county is largely White, with a significant Black or African American population. The economy of the county is largely based on agriculture, and the median household income is slightly below the state average.
Common Questions
What is Per Capita Income in Red River County?
Per Capita income in Red River County is $25,057.
What is the Median Family Income in Red River County?
Median Family Income in Red River County is $58,968.
What is the Median Household income in Red River County?
Median Household Income in Red River County is $44,583.
What is Income or Wage Gap in Red River County?
Income or Wage Gap in Red River County is 42.6%.
Women in Red River County earn 57.4 cents for every dollar earned by a man.
What is Family Income Deficit in Red River County?
Family Income Deficit in Red River County is $9,990.
Families that are below poverty line in Red River County earn $9,990 less on average than the poverty threshold level.
What is Inequality or Gini Index in Red River County?
Inequality or Gini Index in Red River County is 0.45.
What is the Total Population of Red River County?
Total Population of Red River County is 11,627.
What is the Total Male Population of Red River County?
Total Male Population of Red River County is 5,656.
What is the Total Female Population of Red River County?
Total Female Population of Red River County is 5,971.
What is the Ratio of Males per 100 Females in Red River County?
There are 94.72 Males per 100 Females in Red River County.
What is the Ratio of Females per 100 Males in Red River County?
There are 105.57 Females per 100 Males in Red River County.
What is the Median Population Age in Red River County?
Median Population Age in Red River County is 48.9 Years.
What is the Average Family Size in Red River County
Average Family Size in Red River County is 3.1 People.
What is the Average Household Size in Red River County
Average Household Size in Red River County is 2.5 People.
How Large is the Labor Force in Red River County?
There are 4,524 People in the Labor Forcein in Red River County.
What is the Percentage of People in the Labor Force in Red River County?
47.2% of People are in the Labor Force in Red River County.
What is the Unemployment Rate in Red River County?
Unemployment Rate in Red River County is 3.8%.