Real County, TX Map & Demographics
Real County Map
Real County Overview
$22,725
PER CAPITA INCOME
$59,583
AVG FAMILY INCOME
$46,842
AVG HOUSEHOLD INCOME
32.5%
WAGE / INCOME GAP [ % ]
67.5¢/ $1
WAGE / INCOME GAP [ $ ]
0.48
INEQUALITY / GINI INDEX
2,830
TOTAL POPULATION
1,324
MALE POPULATION
1,506
FEMALE POPULATION
87.92
MALES / 100 FEMALES
113.75
FEMALES / 100 MALES
52.3
MEDIAN AGE
3.0
AVG FAMILY SIZE
2.7
AVG HOUSEHOLD SIZE
770
LABOR FORCE [ PEOPLE ]
34.0%
PERCENT IN LABOR FORCE
1.6%
UNEMPLOYMENT RATE
Real County Area Codes
Income in Real County
Income Overview in Real County
Per Capita Income in Real County is $22,725, while median incomes of families and households are $59,583 and $46,842 respectively.
| Characteristic | Number | Measure |
| Per Capita Income | 2,830 | $22,725 |
| Median Family Income | 716 | $59,583 |
| Mean Family Income | 716 | $84,606 |
| Median Household Income | 992 | $46,842 |
| Mean Household Income | 992 | $72,231 |
| Income Deficit | 716 | $0 |
| Wage / Income Gap (%) | 2,830 | 32.50% |
| Wage / Income Gap ($) | 2,830 | 67.50¢ per $1 |
| Gini / Inequality Index | 2,830 | 0.48 |
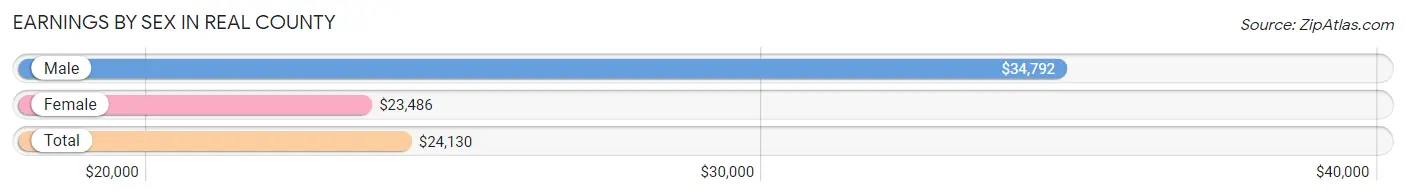
Earnings by Sex in Real County
Average Earnings in Real County are $24,130, $34,792 for men and $23,486 for women, a difference of 32.5%.
| Sex | Number | Average Earnings |
| Male | 373 (39.9%) | $34,792 |
| Female | 563 (60.2%) | $23,486 |
| Total | 936 (100.0%) | $24,130 |
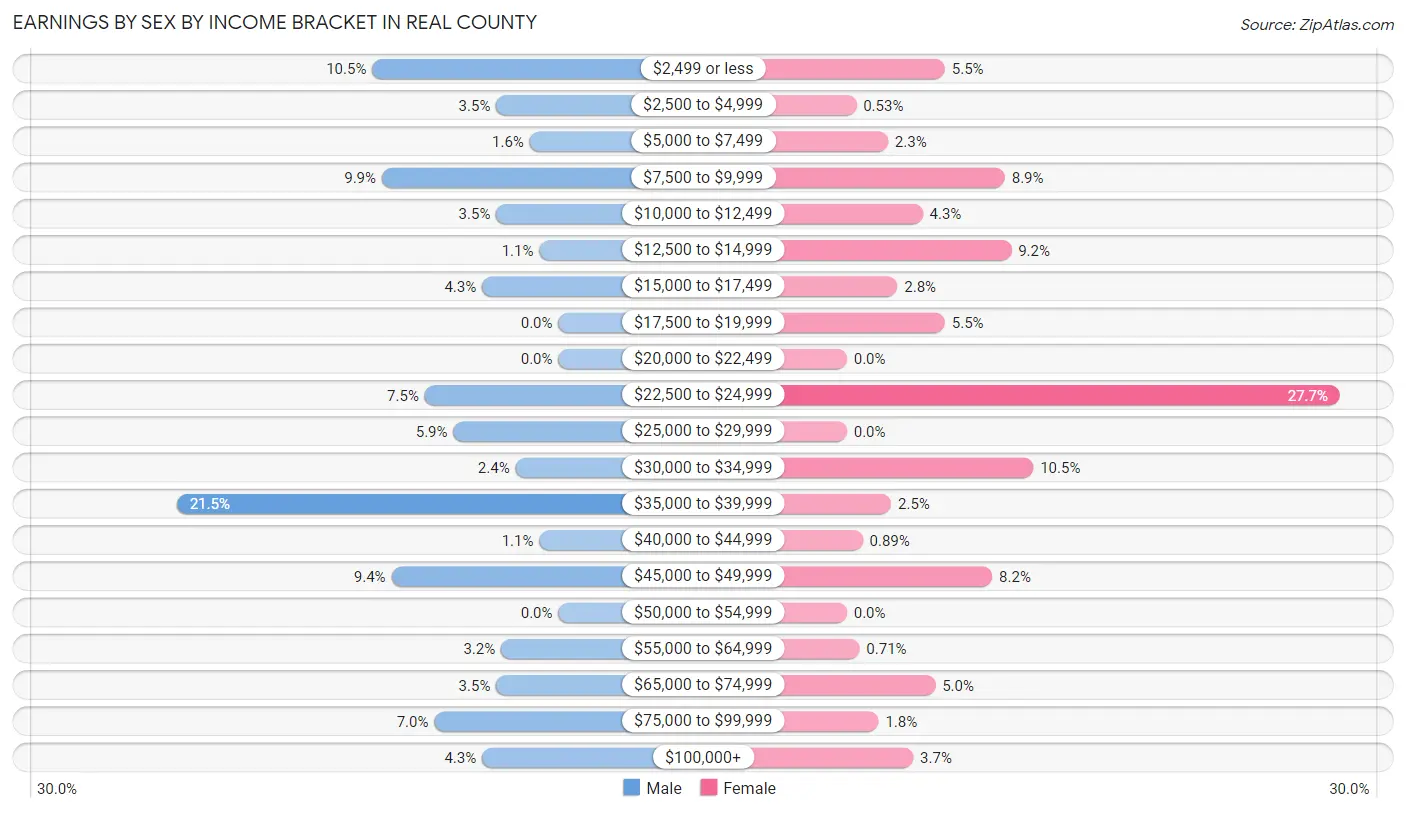
Earnings by Sex by Income Bracket in Real County
The most common earnings brackets in Real County are $35,000 to $39,999 for men (80 | 21.4%) and $22,500 to $24,999 for women (156 | 27.7%).
| Income | Male | Female |
| $2,499 or less | 39 (10.5%) | 31 (5.5%) |
| $2,500 to $4,999 | 13 (3.5%) | 3 (0.5%) |
| $5,000 to $7,499 | 6 (1.6%) | 13 (2.3%) |
| $7,500 to $9,999 | 37 (9.9%) | 50 (8.9%) |
| $10,000 to $12,499 | 13 (3.5%) | 24 (4.3%) |
| $12,500 to $14,999 | 4 (1.1%) | 52 (9.2%) |
| $15,000 to $17,499 | 16 (4.3%) | 16 (2.8%) |
| $17,500 to $19,999 | 0 (0.0%) | 31 (5.5%) |
| $20,000 to $22,499 | 0 (0.0%) | 0 (0.0%) |
| $22,500 to $24,999 | 28 (7.5%) | 156 (27.7%) |
| $25,000 to $29,999 | 22 (5.9%) | 0 (0.0%) |
| $30,000 to $34,999 | 9 (2.4%) | 59 (10.5%) |
| $35,000 to $39,999 | 80 (21.4%) | 14 (2.5%) |
| $40,000 to $44,999 | 4 (1.1%) | 5 (0.9%) |
| $45,000 to $49,999 | 35 (9.4%) | 46 (8.2%) |
| $50,000 to $54,999 | 0 (0.0%) | 0 (0.0%) |
| $55,000 to $64,999 | 12 (3.2%) | 4 (0.7%) |
| $65,000 to $74,999 | 13 (3.5%) | 28 (5.0%) |
| $75,000 to $99,999 | 26 (7.0%) | 10 (1.8%) |
| $100,000+ | 16 (4.3%) | 21 (3.7%) |
| Total | 373 (100.0%) | 563 (100.0%) |
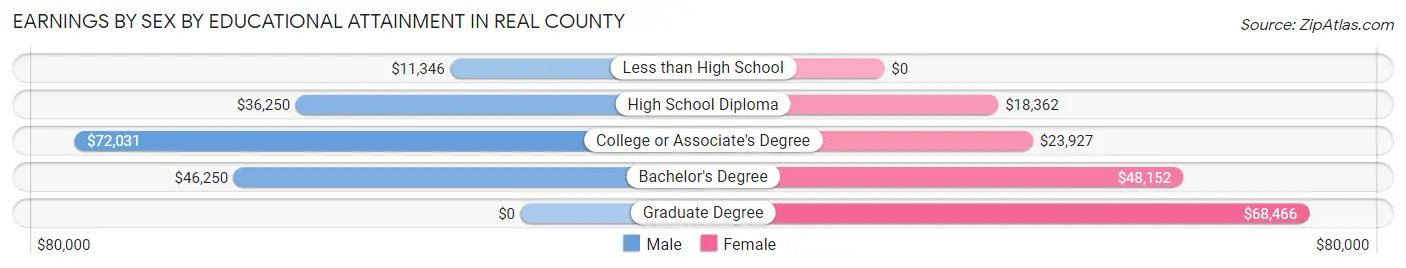
Earnings by Sex by Educational Attainment in Real County
Average earnings in Real County are $37,984 for men and $24,343 for women, a difference of 35.9%. Men with an educational attainment of college or associate's degree enjoy the highest average annual earnings of $72,031, while those with less than high school education earn the least with $11,346. Women with an educational attainment of graduate degree earn the most with the average annual earnings of $68,466, while those with high school diploma education have the smallest earnings of $18,362.
| Educational Attainment | Male Income | Female Income |
| Less than High School | $11,346 | $0 |
| High School Diploma | $36,250 | $18,362 |
| College or Associate's Degree | $72,031 | $23,927 |
| Bachelor's Degree | $46,250 | $48,152 |
| Graduate Degree | - | - |
| Total | $37,984 | $24,343 |
Family Income in Real County
Family Income Brackets in Real County
According to the Real County family income data, there are 150 families falling into the $50,000 to $74,999 income range, which is the most common income bracket and makes up 20.9% of all families. Conversely, the less than $10,000 income bracket is the least frequent group with only 6 families (0.8%) belonging to this category.
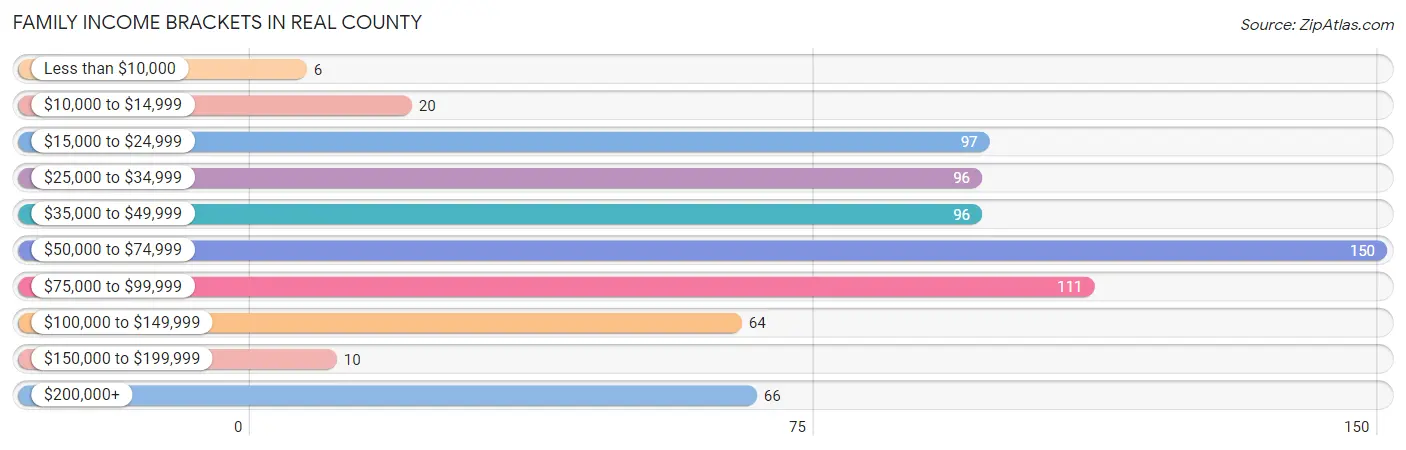
| Income Bracket | # Families | % Families |
| Less than $10,000 | 6 | 0.8% |
| $10,000 to $14,999 | 20 | 2.8% |
| $15,000 to $24,999 | 97 | 13.5% |
| $25,000 to $34,999 | 96 | 13.4% |
| $35,000 to $49,999 | 96 | 13.4% |
| $50,000 to $74,999 | 150 | 20.9% |
| $75,000 to $99,999 | 111 | 15.5% |
| $100,000 to $149,999 | 64 | 8.9% |
| $150,000 to $199,999 | 10 | 1.4% |
| $200,000+ | 66 | 9.2% |
Family Income by Famaliy Size in Real County
5-person families (24 | 3.4%) account for the highest median family income in Real County with $123,333 per family, while 2-person families (537 | 75.0%) have the highest median income of $28,414 per family member.
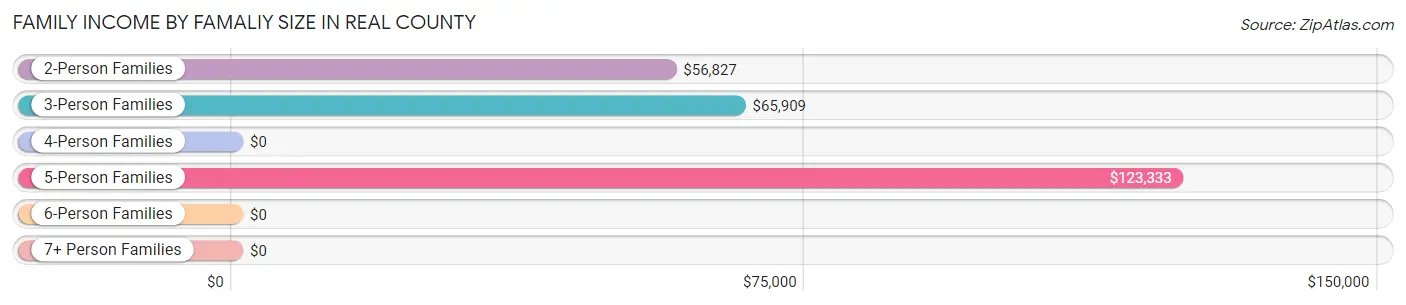
| Income Bracket | # Families | Median Income |
| 2-Person Families | 537 (75.0%) | $56,827 |
| 3-Person Families | 114 (15.9%) | $65,909 |
| 4-Person Families | 22 (3.1%) | $0 |
| 5-Person Families | 24 (3.4%) | $123,333 |
| 6-Person Families | 9 (1.3%) | $0 |
| 7+ Person Families | 10 (1.4%) | $0 |
| Total | 716 (100.0%) | $59,583 |
Family Income by Number of Earners in Real County
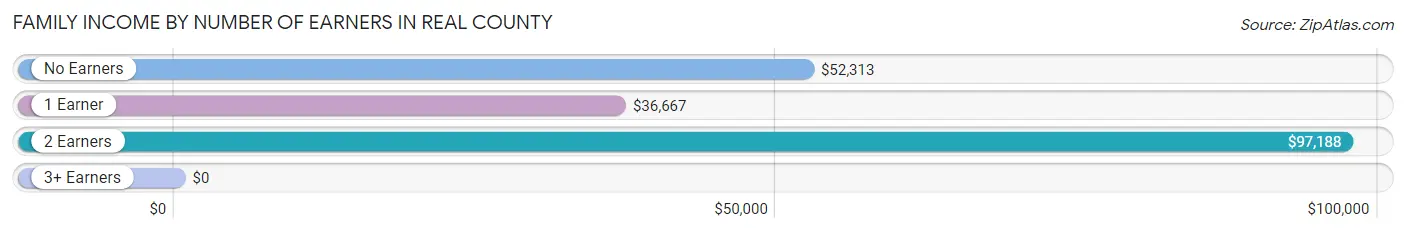
| Number of Earners | # Families | Median Income |
| No Earners | 275 (38.4%) | $52,313 |
| 1 Earner | 216 (30.2%) | $36,667 |
| 2 Earners | 210 (29.3%) | $97,188 |
| 3+ Earners | 15 (2.1%) | $0 |
| Total | 716 (100.0%) | $59,583 |
Household Income in Real County
Household Income Brackets in Real County
With 196 households falling in the category, the $50,000 to $74,999 income range is the most frequent in Real County, accounting for 19.8% of all households. In contrast, only 4 households (0.4%) fall into the less than $10,000 income bracket, making it the least populous group.
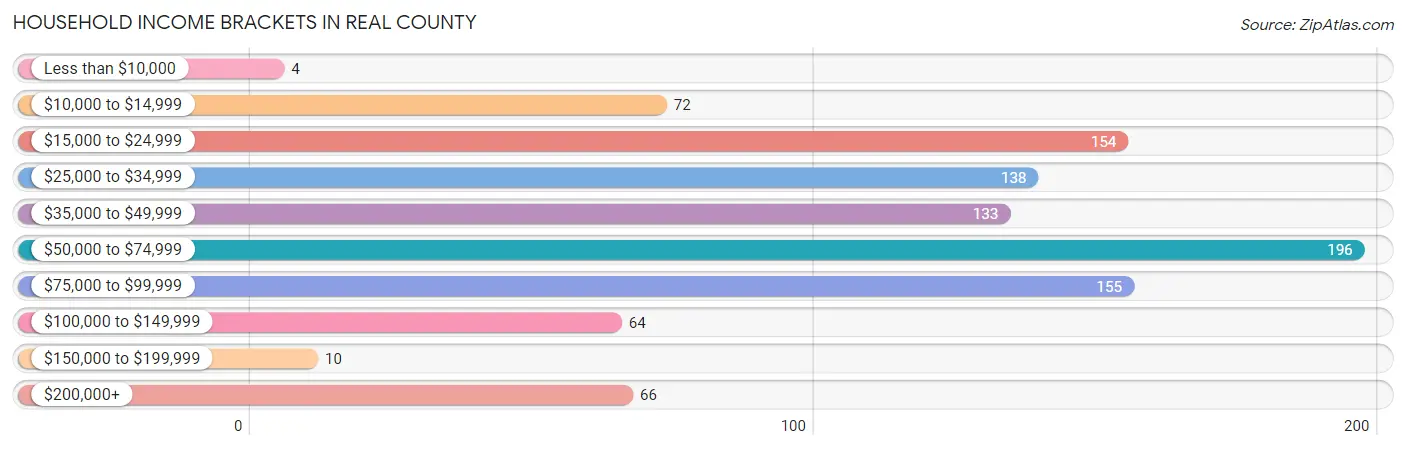
| Income Bracket | # Households | % Households |
| Less than $10,000 | 4 | 0.4% |
| $10,000 to $14,999 | 72 | 7.3% |
| $15,000 to $24,999 | 154 | 15.5% |
| $25,000 to $34,999 | 138 | 13.9% |
| $35,000 to $49,999 | 133 | 13.4% |
| $50,000 to $74,999 | 196 | 19.8% |
| $75,000 to $99,999 | 155 | 15.6% |
| $100,000 to $149,999 | 64 | 6.5% |
| $150,000 to $199,999 | 10 | 1.0% |
| $200,000+ | 66 | 6.7% |
Household Income by Householder Age in Real County
The median household income in Real County is $46,842, with the highest median household income of $51,895 found in the 65+ years age bracket for the primary householder. A total of 545 households (54.9%) fall into this category. Meanwhile, the 15 to 24 years age bracket for the primary householder has the lowest median household income of $0, with 14 households (1.4%) in this group.
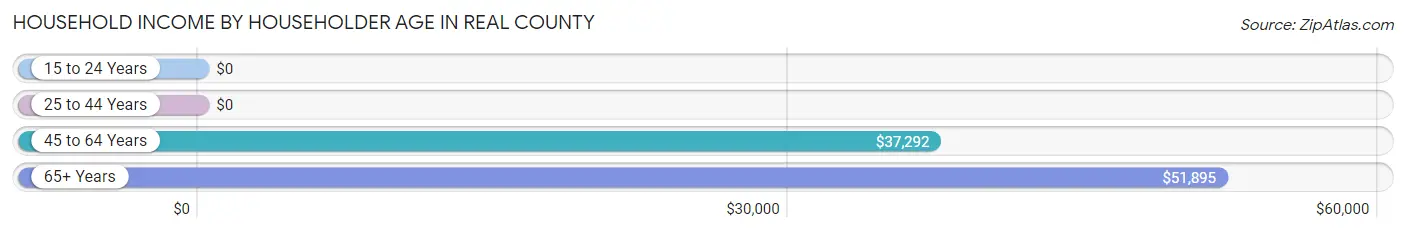
| Income Bracket | # Households | Median Income |
| 15 to 24 Years | 14 (1.4%) | $0 |
| 25 to 44 Years | 86 (8.7%) | $0 |
| 45 to 64 Years | 347 (35.0%) | $37,292 |
| 65+ Years | 545 (54.9%) | $51,895 |
| Total | 992 (100.0%) | $46,842 |
Poverty in Real County
Income Below Poverty by Sex and Age in Real County
With 25.5% poverty level for males and 23.6% for females among the residents of Real County, 16 and 17 year old males and 15 year old females are the most vulnerable to poverty, with 45 males (75.0%) and 15 females (100.0%) in their respective age groups living below the poverty level.
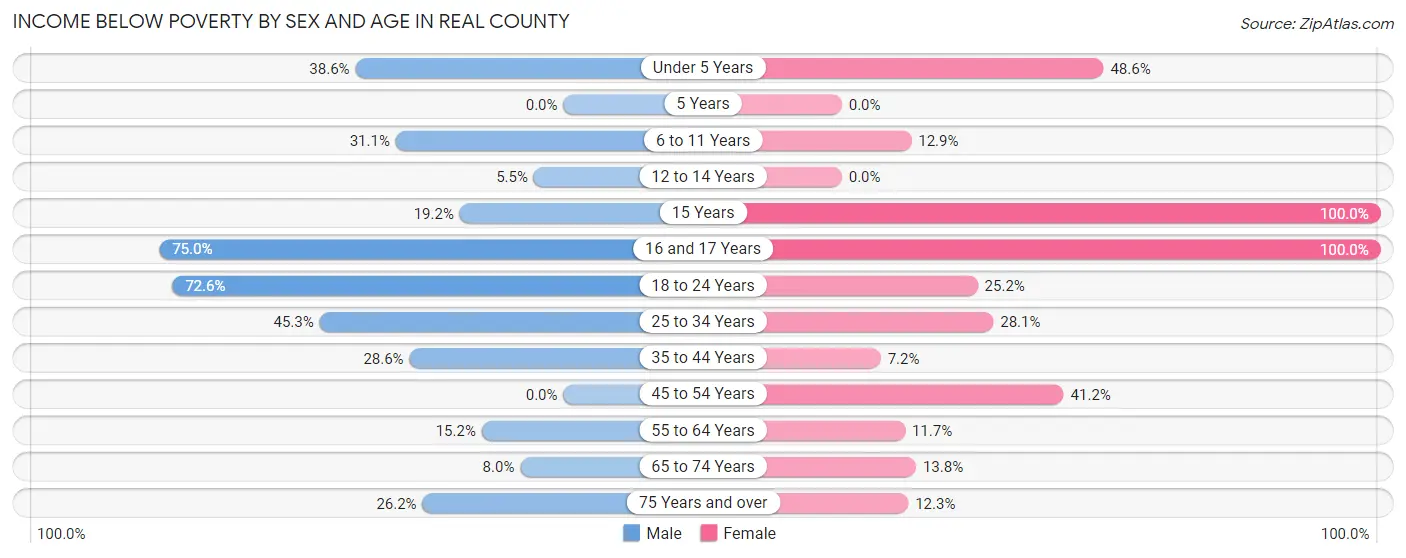
| Age Bracket | Male | Female |
| Under 5 Years | 44 (38.6%) | 17 (48.6%) |
| 5 Years | 0 (0.0%) | 0 (0.0%) |
| 6 to 11 Years | 14 (31.1%) | 12 (12.9%) |
| 12 to 14 Years | 5 (5.5%) | 0 (0.0%) |
| 15 Years | 5 (19.2%) | 15 (100.0%) |
| 16 and 17 Years | 45 (75.0%) | 44 (100.0%) |
| 18 to 24 Years | 53 (72.6%) | 29 (25.2%) |
| 25 to 34 Years | 43 (45.3%) | 36 (28.1%) |
| 35 to 44 Years | 10 (28.6%) | 6 (7.2%) |
| 45 to 54 Years | 0 (0.0%) | 84 (41.2%) |
| 55 to 64 Years | 30 (15.1%) | 21 (11.7%) |
| 65 to 74 Years | 24 (8.0%) | 38 (13.8%) |
| 75 Years and over | 34 (26.2%) | 27 (12.3%) |
| Total | 307 (25.5%) | 329 (23.6%) |
Income Above Poverty by Sex and Age in Real County
According to the poverty statistics in Real County, males aged 45 to 54 years and females aged 35 to 44 years are the age groups that are most secure financially, with 100.0% of males and 92.8% of females in these age groups living above the poverty line.
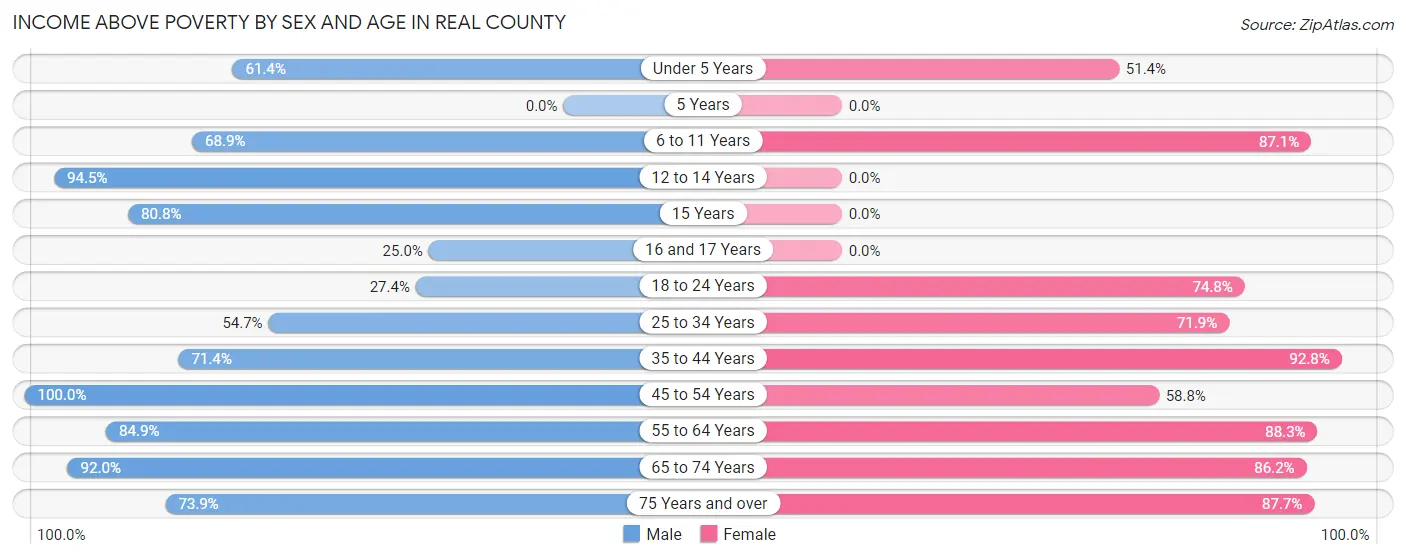
| Age Bracket | Male | Female |
| Under 5 Years | 70 (61.4%) | 18 (51.4%) |
| 5 Years | 0 (0.0%) | 0 (0.0%) |
| 6 to 11 Years | 31 (68.9%) | 81 (87.1%) |
| 12 to 14 Years | 86 (94.5%) | 0 (0.0%) |
| 15 Years | 21 (80.8%) | 0 (0.0%) |
| 16 and 17 Years | 15 (25.0%) | 0 (0.0%) |
| 18 to 24 Years | 20 (27.4%) | 86 (74.8%) |
| 25 to 34 Years | 52 (54.7%) | 92 (71.9%) |
| 35 to 44 Years | 25 (71.4%) | 77 (92.8%) |
| 45 to 54 Years | 35 (100.0%) | 120 (58.8%) |
| 55 to 64 Years | 168 (84.9%) | 158 (88.3%) |
| 65 to 74 Years | 276 (92.0%) | 238 (86.2%) |
| 75 Years and over | 96 (73.9%) | 192 (87.7%) |
| Total | 895 (74.5%) | 1,062 (76.3%) |
Income Below Poverty Among Married-Couple Families in Real County
The poverty statistics for married-couple families in Real County show that 7.0% or 38 of the total 547 families live below the poverty line. Families with 1 or 2 children have the highest poverty rate of 11.1%, comprising of 5 families. On the other hand, families with 3 or 4 children have the lowest poverty rate of 0.0%, which includes 0 families.
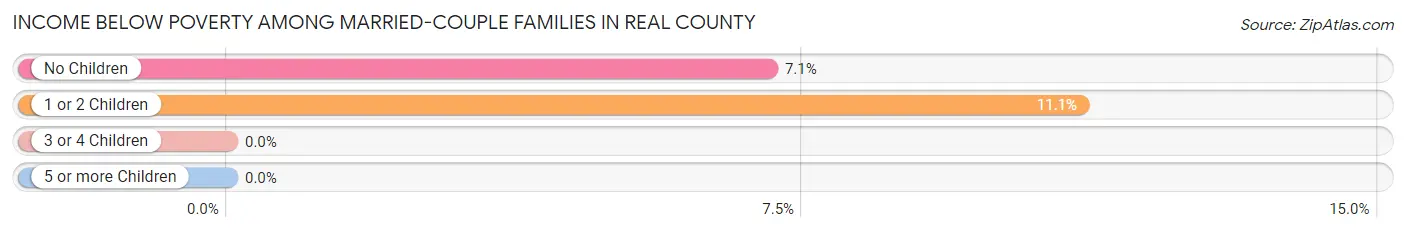
| Children | Above Poverty | Below Poverty |
| No Children | 435 (92.9%) | 33 (7.0%) |
| 1 or 2 Children | 40 (88.9%) | 5 (11.1%) |
| 3 or 4 Children | 24 (100.0%) | 0 (0.0%) |
| 5 or more Children | 10 (100.0%) | 0 (0.0%) |
| Total | 509 (93.0%) | 38 (7.0%) |
Income Below Poverty Among Single-Parent Households in Real County
According to the poverty data in Real County, 13.0% or 3 single-father households and 26.0% or 38 single-mother households are living below the poverty line. Among single-father households, those with 1 or 2 children have the highest poverty rate, with 3 households (100.0%) experiencing poverty. Likewise, among single-mother households, those with 3 or 4 children have the highest poverty rate, with 5 households (100.0%) falling below the poverty line.
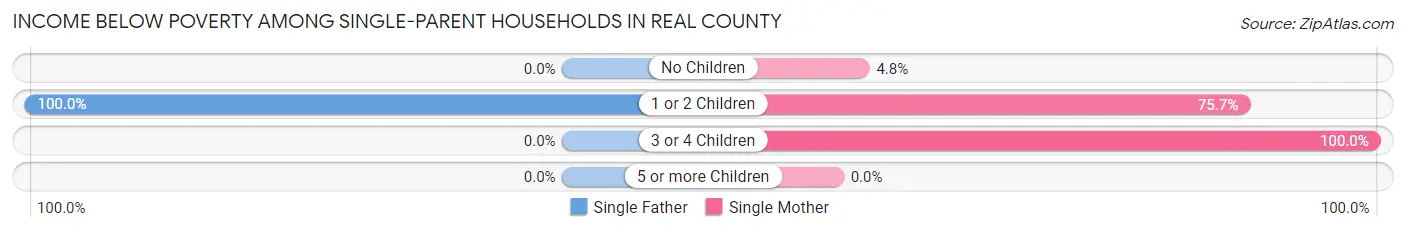
| Children | Single Father | Single Mother |
| No Children | 0 (0.0%) | 5 (4.8%) |
| 1 or 2 Children | 3 (100.0%) | 28 (75.7%) |
| 3 or 4 Children | 0 (0.0%) | 5 (100.0%) |
| 5 or more Children | 0 (0.0%) | 0 (0.0%) |
| Total | 3 (13.0%) | 38 (26.0%) |
Income Below Poverty Among Married-Couple vs Single-Parent Households in Real County
The poverty data for Real County shows that 38 of the married-couple family households (7.0%) and 41 of the single-parent households (24.3%) are living below the poverty level. Within the married-couple family households, those with 1 or 2 children have the highest poverty rate, with 5 households (11.1%) falling below the poverty line. Among the single-parent households, those with 3 or 4 children have the highest poverty rate, with 5 household (100.0%) living below poverty.
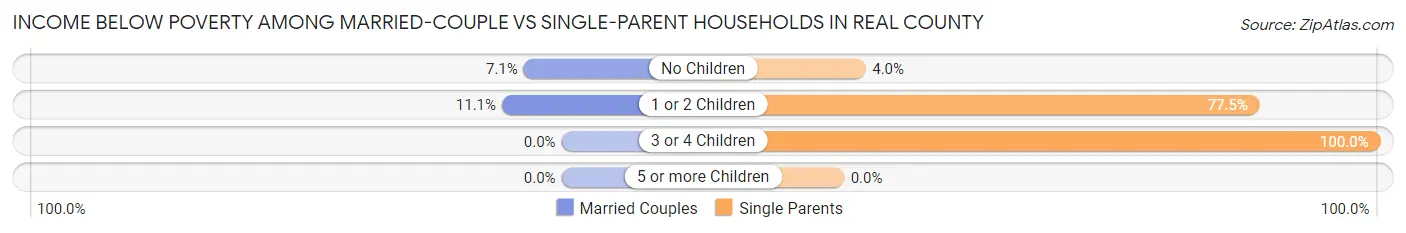
| Children | Married-Couple Families | Single-Parent Households |
| No Children | 33 (7.0%) | 5 (4.0%) |
| 1 or 2 Children | 5 (11.1%) | 31 (77.5%) |
| 3 or 4 Children | 0 (0.0%) | 5 (100.0%) |
| 5 or more Children | 0 (0.0%) | 0 (0.0%) |
| Total | 38 (7.0%) | 41 (24.3%) |
Race in Real County
The most populous races in Real County are White / Caucasian (2,681 | 94.7%), Hispanic or Latino (724 | 25.6%), and Some other Race (86 | 3.0%).
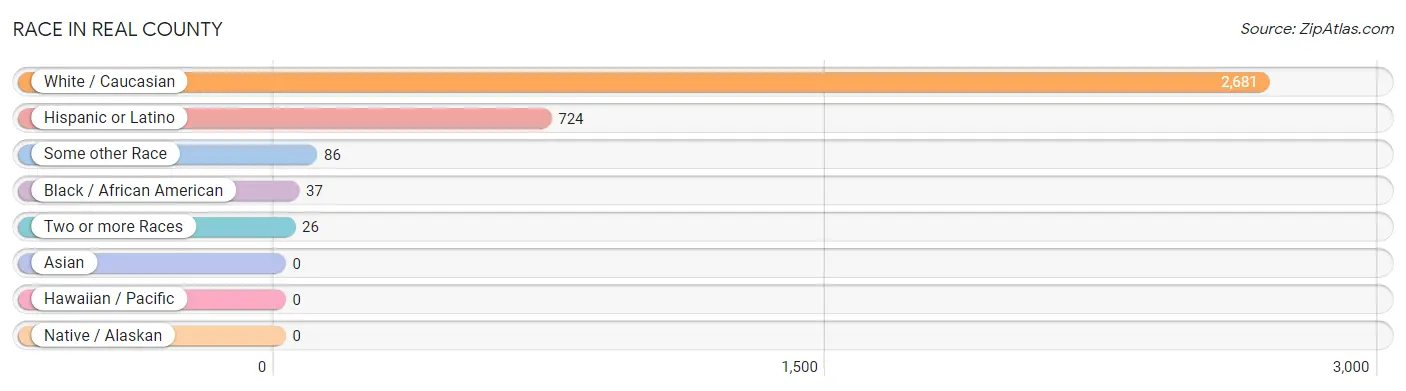
| Race | # Population | % Population |
| Asian | 0 | 0.0% |
| Black / African American | 37 | 1.3% |
| Hawaiian / Pacific | 0 | 0.0% |
| Hispanic or Latino | 724 | 25.6% |
| Native / Alaskan | 0 | 0.0% |
| White / Caucasian | 2,681 | 94.7% |
| Two or more Races | 26 | 0.9% |
| Some other Race | 86 | 3.0% |
| Total | 2,830 | 100.0% |
Ancestry in Real County
The most populous ancestries reported in Real County are Mexican (703 | 24.8%), German (663 | 23.4%), Irish (280 | 9.9%), English (147 | 5.2%), and Greek (124 | 4.4%), together accounting for 67.7% of all Real County residents.
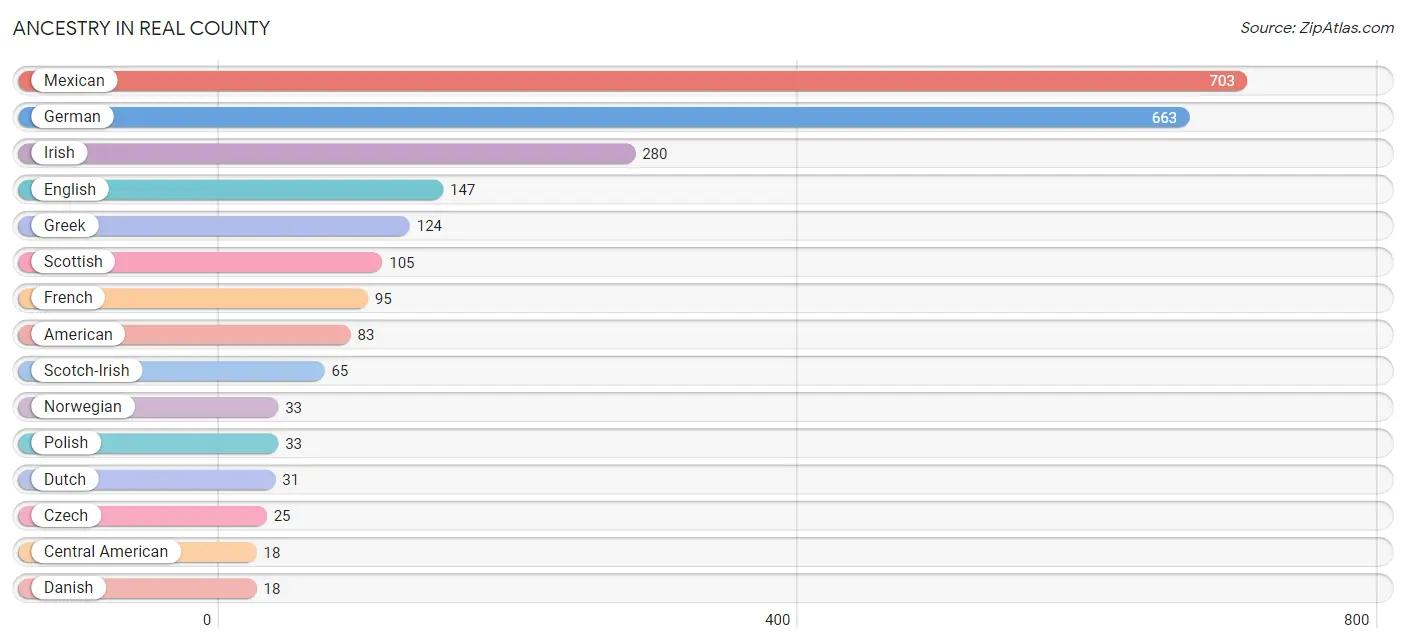
| Ancestry | # Population | % Population |
| American | 83 | 2.9% |
| British | 7 | 0.3% |
| Cajun | 12 | 0.4% |
| Central American | 18 | 0.6% |
| Choctaw | 1 | 0.0% |
| Czech | 25 | 0.9% |
| Danish | 18 | 0.6% |
| Dutch | 31 | 1.1% |
| English | 147 | 5.2% |
| French | 95 | 3.4% |
| French Canadian | 14 | 0.5% |
| German | 663 | 23.4% |
| Greek | 124 | 4.4% |
| Guatemalan | 12 | 0.4% |
| Honduran | 4 | 0.1% |
| Irish | 280 | 9.9% |
| Italian | 2 | 0.1% |
| Mexican | 703 | 24.8% |
| Norwegian | 33 | 1.2% |
| Polish | 33 | 1.2% |
| Salvadoran | 2 | 0.1% |
| Scotch-Irish | 65 | 2.3% |
| Scottish | 105 | 3.7% |
| South American | 3 | 0.1% |
| Swedish | 11 | 0.4% |
| Venezuelan | 3 | 0.1% |
| Welsh | 12 | 0.4% | View All 27 Rows |
Immigrants in Real County
The most numerous immigrant groups reported in Real County came from Latin America (62 | 2.2%), Central America (59 | 2.1%), Mexico (41 | 1.5%), Guatemala (9 | 0.3%), and El Salvador (5 | 0.2%), together accounting for 6.2% of all Real County residents.
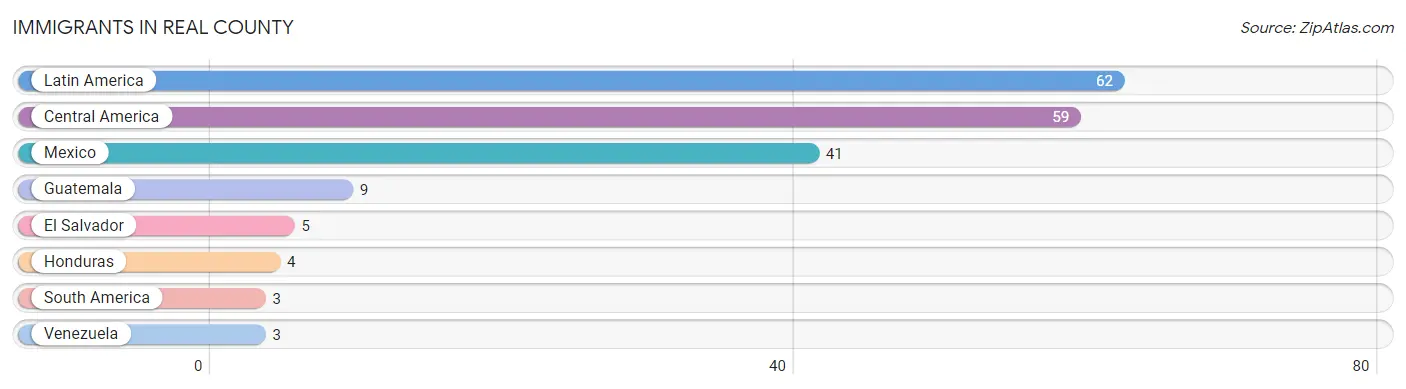
| Immigration Origin | # Population | % Population |
| Central America | 59 | 2.1% |
| El Salvador | 5 | 0.2% |
| Guatemala | 9 | 0.3% |
| Honduras | 4 | 0.1% |
| Latin America | 62 | 2.2% |
| Mexico | 41 | 1.5% |
| South America | 3 | 0.1% |
| Venezuela | 3 | 0.1% | View All 8 Rows |
Sex and Age in Real County
Sex and Age in Real County
The most populous age groups in Real County are 65 to 69 Years (195 | 14.7%) for men and 45 to 49 Years (159 | 10.6%) for women.
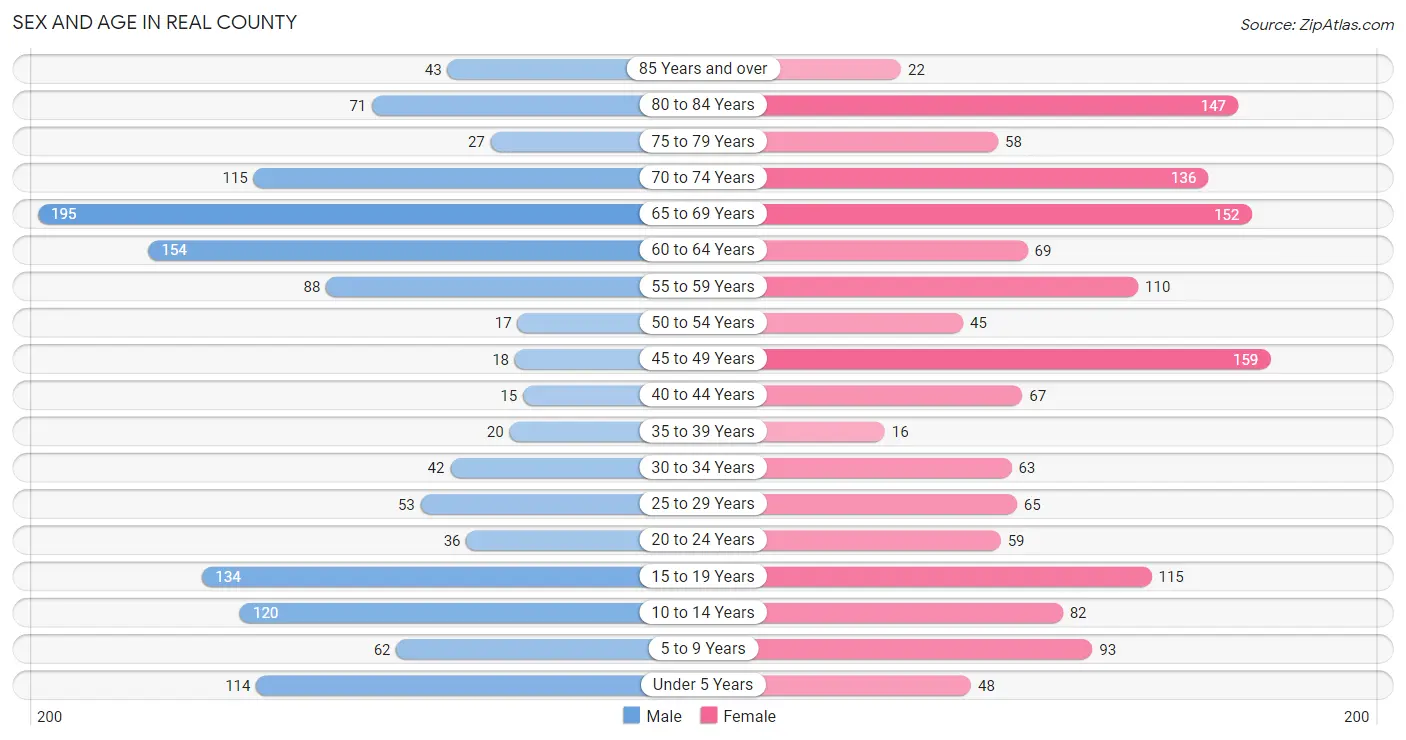
| Age Bracket | Male | Female |
| Under 5 Years | 114 (8.6%) | 48 (3.2%) |
| 5 to 9 Years | 62 (4.7%) | 93 (6.2%) |
| 10 to 14 Years | 120 (9.1%) | 82 (5.4%) |
| 15 to 19 Years | 134 (10.1%) | 115 (7.6%) |
| 20 to 24 Years | 36 (2.7%) | 59 (3.9%) |
| 25 to 29 Years | 53 (4.0%) | 65 (4.3%) |
| 30 to 34 Years | 42 (3.2%) | 63 (4.2%) |
| 35 to 39 Years | 20 (1.5%) | 16 (1.1%) |
| 40 to 44 Years | 15 (1.1%) | 67 (4.4%) |
| 45 to 49 Years | 18 (1.4%) | 159 (10.6%) |
| 50 to 54 Years | 17 (1.3%) | 45 (3.0%) |
| 55 to 59 Years | 88 (6.7%) | 110 (7.3%) |
| 60 to 64 Years | 154 (11.6%) | 69 (4.6%) |
| 65 to 69 Years | 195 (14.7%) | 152 (10.1%) |
| 70 to 74 Years | 115 (8.7%) | 136 (9.0%) |
| 75 to 79 Years | 27 (2.0%) | 58 (3.8%) |
| 80 to 84 Years | 71 (5.4%) | 147 (9.8%) |
| 85 Years and over | 43 (3.3%) | 22 (1.5%) |
| Total | 1,324 (100.0%) | 1,506 (100.0%) |
Families and Households in Real County
Median Family Size in Real County
The median family size in Real County is 3.01 persons per family, with single female/mother families (146 | 20.4%) accounting for the largest median family size of 4.64 persons per family. On the other hand, married-couple families (547 | 76.4%) represent the smallest median family size with 2.55 persons per family.
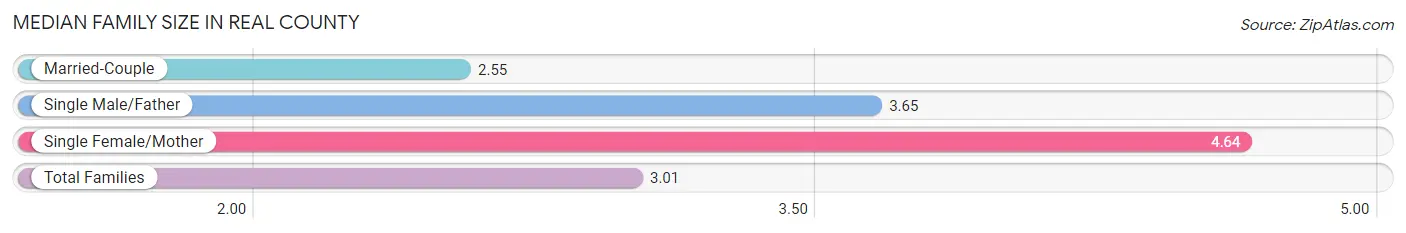
| Family Type | # Families | Family Size |
| Married-Couple | 547 (76.4%) | 2.55 |
| Single Male/Father | 23 (3.2%) | 3.65 |
| Single Female/Mother | 146 (20.4%) | 4.64 |
| Total Families | 716 (100.0%) | 3.01 |
Median Household Size in Real County
The median household size in Real County is 2.73 persons per household, with single male/father households (23 | 2.3%) accounting for the largest median household size of 11.87 persons per household. non-family households (276 | 27.8%) represent the smallest median household size with 1.21 persons per household.
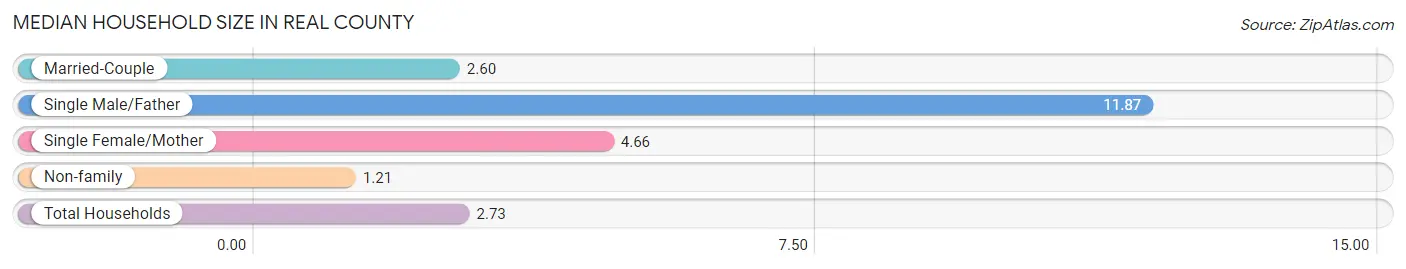
| Household Type | # Households | Household Size |
| Married-Couple | 547 (55.1%) | 2.60 |
| Single Male/Father | 23 (2.3%) | 11.87 |
| Single Female/Mother | 146 (14.7%) | 4.66 |
| Non-family | 276 (27.8%) | 1.21 |
| Total Households | 992 (100.0%) | 2.73 |
Household Size by Marriage Status in Real County
Out of a total of 992 households in Real County, 716 (72.2%) are family households, while 276 (27.8%) are nonfamily households. The most numerous type of family households are 2-person households, comprising 531, and the most common type of nonfamily households are 1-person households, comprising 262.
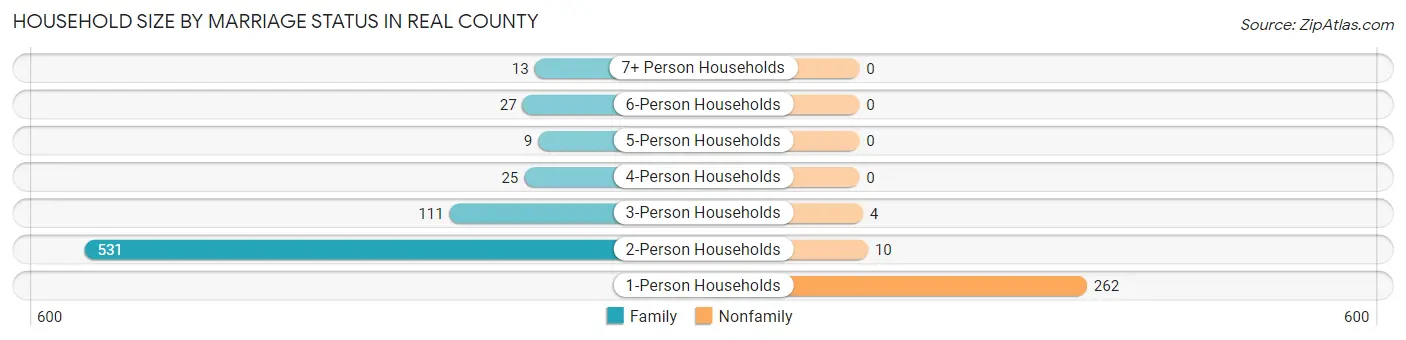
| Household Size | Family Households | Nonfamily Households |
| 1-Person Households | - | 262 (26.4%) |
| 2-Person Households | 531 (53.5%) | 10 (1.0%) |
| 3-Person Households | 111 (11.2%) | 4 (0.4%) |
| 4-Person Households | 25 (2.5%) | 0 (0.0%) |
| 5-Person Households | 9 (0.9%) | 0 (0.0%) |
| 6-Person Households | 27 (2.7%) | 0 (0.0%) |
| 7+ Person Households | 13 (1.3%) | 0 (0.0%) |
| Total | 716 (72.2%) | 276 (27.8%) |
Female Fertility in Real County
Fertility by Age in Real County
Average fertility rate in Real County is 31.0 births per 1,000 women. Women in the age bracket of 20 to 34 years have the highest fertility rate with 91.0 births per 1,000 women. Women in the age bracket of 20 to 34 years acount for 100.0% of all women with births.
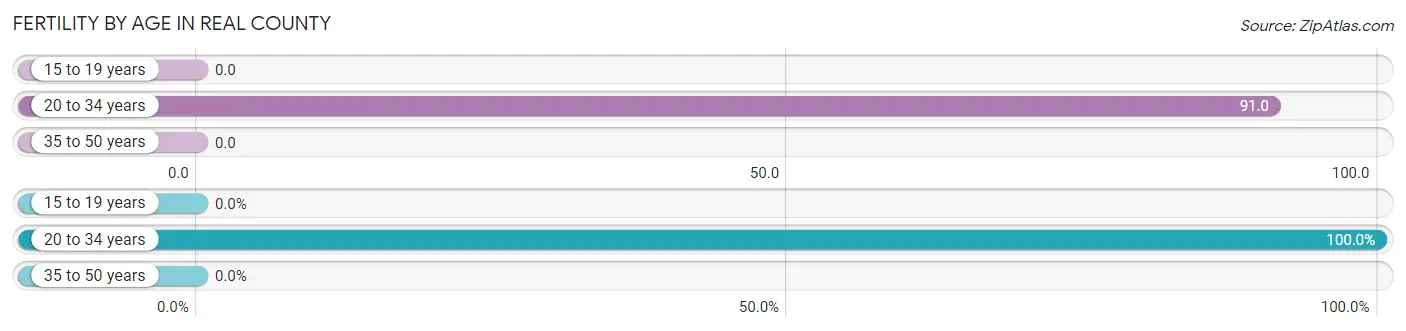
| Age Bracket | Women with Births | Births / 1,000 Women |
| 15 to 19 years | 0 (0.0%) | 0.0 |
| 20 to 34 years | 17 (100.0%) | 91.0 |
| 35 to 50 years | 0 (0.0%) | 0.0 |
| Total | 17 (100.0%) | 31.0 |
Fertility by Age by Marriage Status in Real County
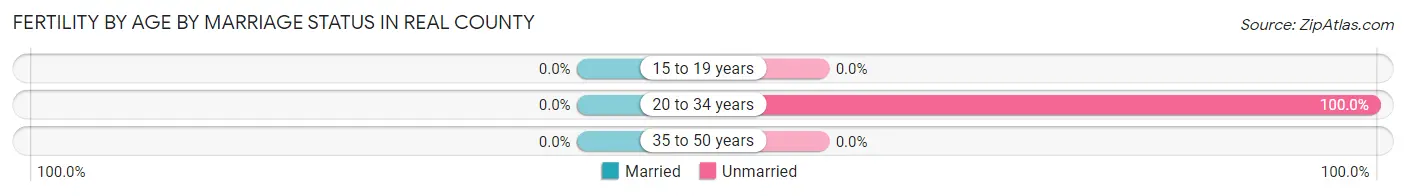
| Age Bracket | Married | Unmarried |
| 15 to 19 years | 0 (0.0%) | 0 (0.0%) |
| 20 to 34 years | 0 (0.0%) | 17 (100.0%) |
| 35 to 50 years | 0 (0.0%) | 0 (0.0%) |
| Total | 0 (0.0%) | 17 (100.0%) |
Fertility by Education in Real County
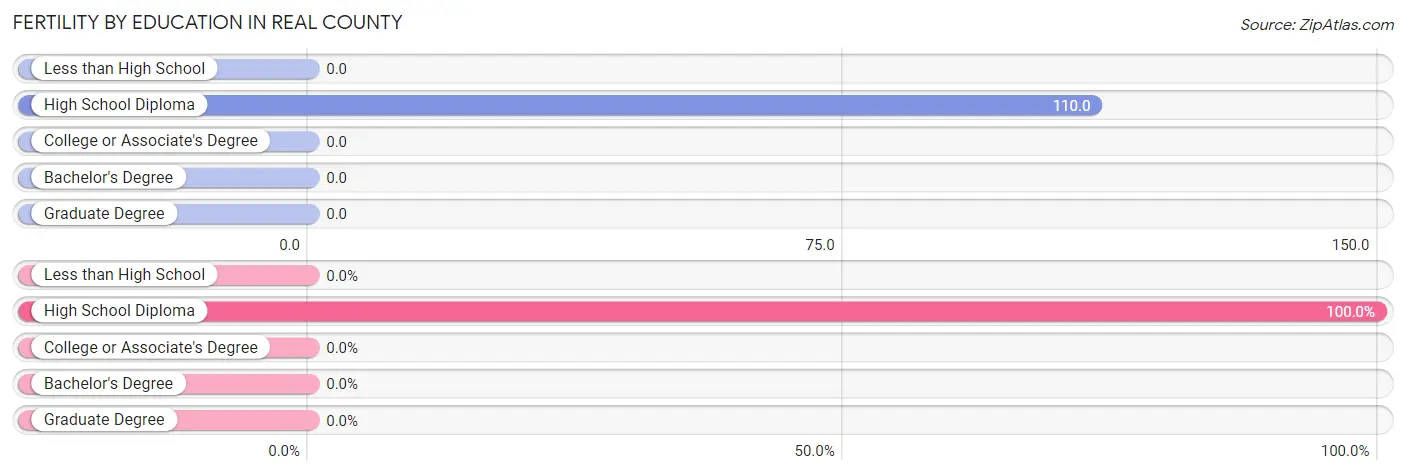
| Educational Attainment | Women with Births | Births / 1,000 Women |
| Less than High School | 0 (0.0%) | 0.0 |
| High School Diploma | 17 (100.0%) | 110.0 |
| College or Associate's Degree | 0 (0.0%) | 0.0 |
| Bachelor's Degree | 0 (0.0%) | 0.0 |
| Graduate Degree | 0 (0.0%) | 0.0 |
| Total | 17 (100.0%) | 31.0 |
Fertility by Education by Marriage Status in Real County
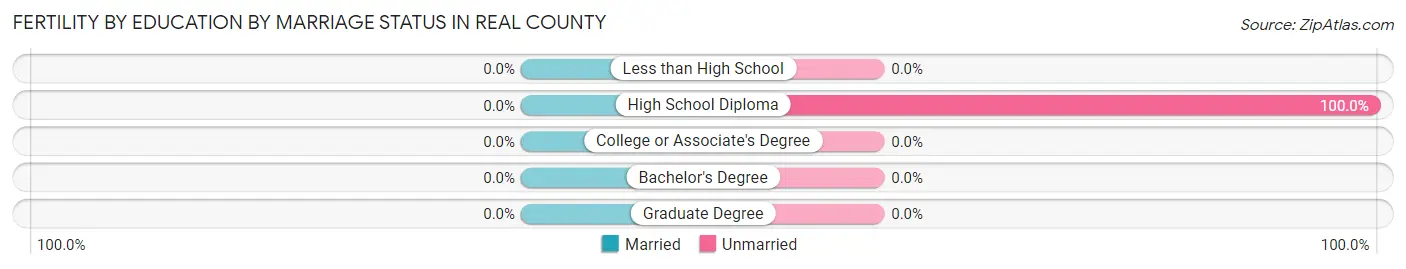
| Educational Attainment | Married | Unmarried |
| Less than High School | 0 (0.0%) | 0 (0.0%) |
| High School Diploma | 0 (0.0%) | 17 (100.0%) |
| College or Associate's Degree | 0 (0.0%) | 0 (0.0%) |
| Bachelor's Degree | 0 (0.0%) | 0 (0.0%) |
| Graduate Degree | 0 (0.0%) | 0 (0.0%) |
| Total | 0 (0.0%) | 17 (100.0%) |
Employment Characteristics in Real County
Employment by Class of Employer in Real County
Among the 744 employed individuals in Real County, private company employees (461 | 62.0%), self-employed (not incorporated) (122 | 16.4%), and state government employees (53 | 7.1%) make up the most common classes of employment.
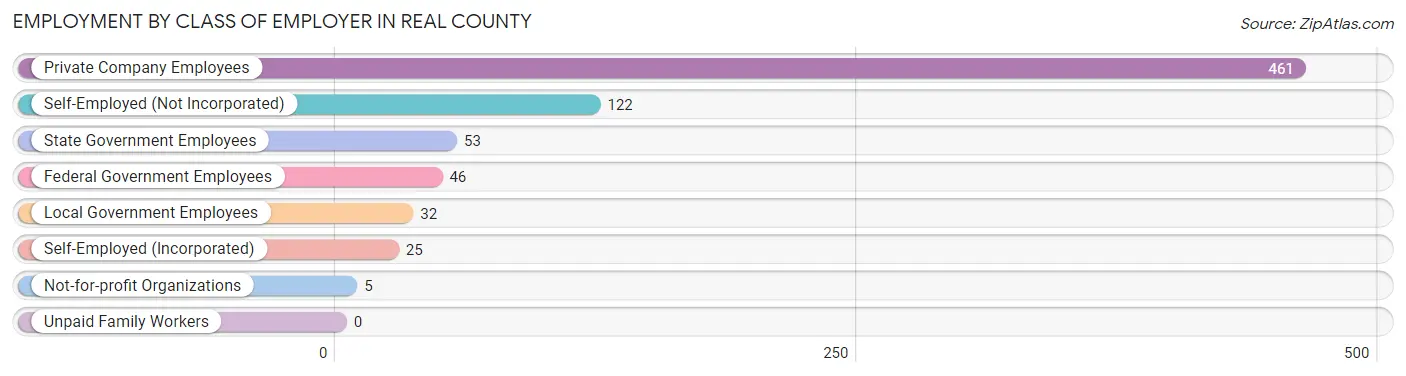
| Employer Class | # Employees | % Employees |
| Private Company Employees | 461 | 62.0% |
| Self-Employed (Incorporated) | 25 | 3.4% |
| Self-Employed (Not Incorporated) | 122 | 16.4% |
| Not-for-profit Organizations | 5 | 0.7% |
| Local Government Employees | 32 | 4.3% |
| State Government Employees | 53 | 7.1% |
| Federal Government Employees | 46 | 6.2% |
| Unpaid Family Workers | 0 | 0.0% |
| Total | 744 | 100.0% |
Employment Status by Age in Real County
According to the labor force statistics for Real County, out of the total population over 16 years of age (2,265), 34.0% or 770 individuals are in the labor force, with 1.6% or 12 of them unemployed. The age group with the highest labor force participation rate is 25 to 29 years, with 82.2% or 97 individuals in the labor force. Within the labor force, the 25 to 29 years age range has the highest percentage of unemployed individuals, with 12.4% or 12 of them being unemployed.
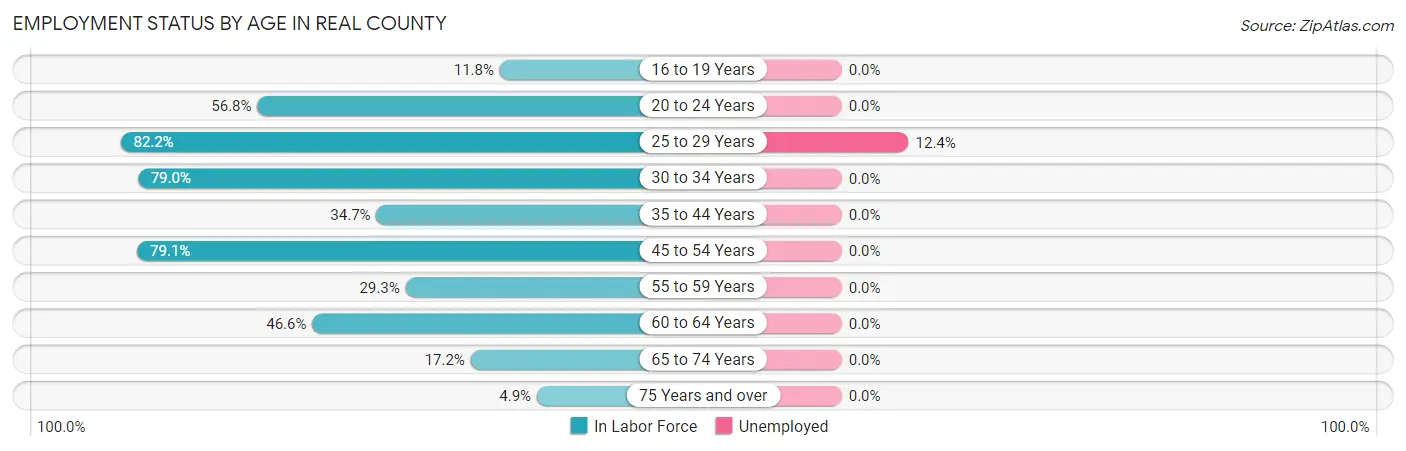
| Age Bracket | In Labor Force | Unemployed |
| 16 to 19 Years | 24 (11.8%) | 0 (0.0%) |
| 20 to 24 Years | 54 (56.8%) | 0 (0.0%) |
| 25 to 29 Years | 97 (82.2%) | 12 (12.4%) |
| 30 to 34 Years | 83 (79.0%) | 0 (0.0%) |
| 35 to 44 Years | 41 (34.7%) | 0 (0.0%) |
| 45 to 54 Years | 189 (79.1%) | 0 (0.0%) |
| 55 to 59 Years | 58 (29.3%) | 0 (0.0%) |
| 60 to 64 Years | 104 (46.6%) | 0 (0.0%) |
| 65 to 74 Years | 103 (17.2%) | 0 (0.0%) |
| 75 Years and over | 18 (4.9%) | 0 (0.0%) |
| Total | 770 (34.0%) | 12 (1.6%) |
Employment Status by Educational Attainment in Real County
According to labor force statistics for Real County, 57.1% of individuals (572) out of the total population between 25 and 64 years of age (1,001) are in the labor force, with 2.1% or 12 of them being unemployed. The group with the highest labor force participation rate are those with the educational attainment of less than high school, with 79.3% or 96 individuals in the labor force. Within the labor force, individuals with high school diploma education have the highest percentage of unemployment, with 8.1% or 12 of them being unemployed.
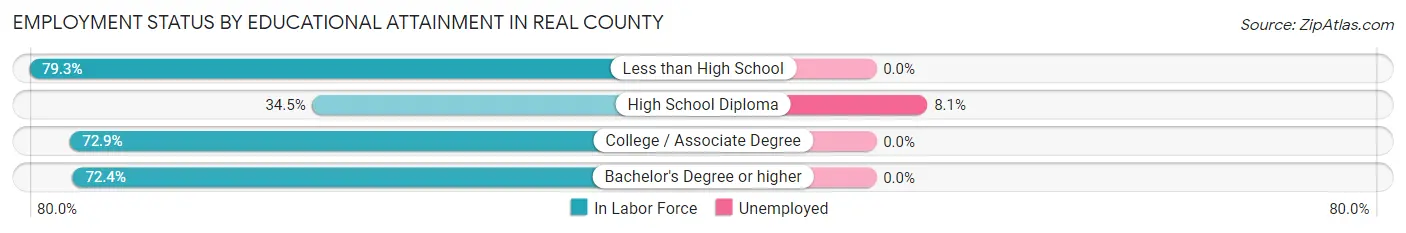
| Educational Attainment | In Labor Force | Unemployed |
| Less than High School | 96 (79.3%) | 0 (0.0%) |
| High School Diploma | 148 (34.5%) | 35 (8.1%) |
| College / Associate Degree | 186 (72.9%) | 0 (0.0%) |
| Bachelor's Degree or higher | 142 (72.4%) | 0 (0.0%) |
| Total | 572 (57.1%) | 21 (2.1%) |
Employment Occupations by Sex in Real County
Management, Business, Science and Arts Occupations
The most common Management, Business, Science and Arts occupations in Real County are Management (110 | 14.5%), Business & Financial (42 | 5.5%), Community & Social Service (35 | 4.6%), Education Instruction & Library (32 | 4.2%), and Health Diagnosing & Treating (9 | 1.2%).
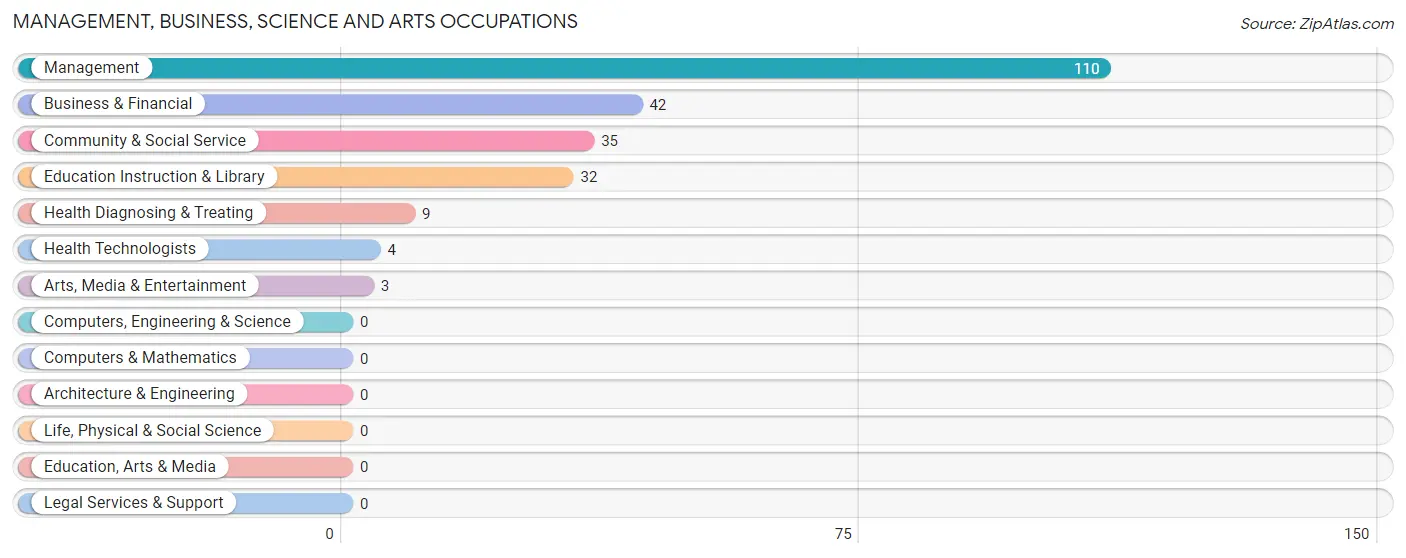
Management, Business, Science and Arts Occupations by Sex
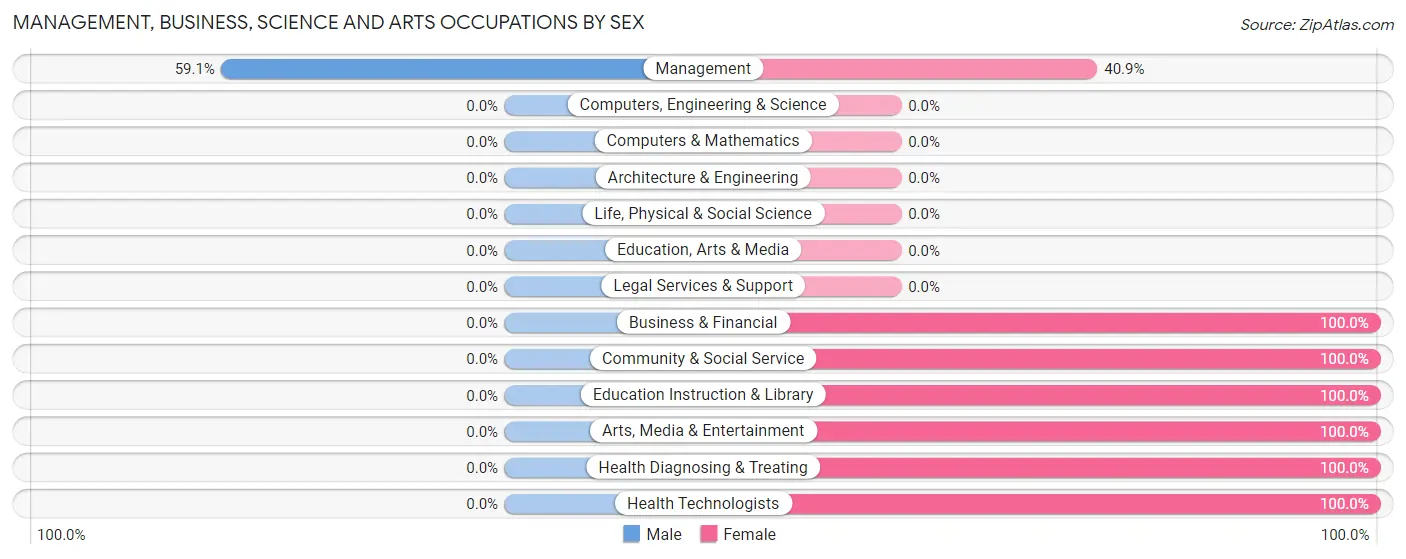
| Occupation | Male | Female |
| Management | 65 (59.1%) | 45 (40.9%) |
| Business & Financial | 0 (0.0%) | 42 (100.0%) |
| Computers, Engineering & Science | 0 (0.0%) | 0 (0.0%) |
| Computers & Mathematics | 0 (0.0%) | 0 (0.0%) |
| Architecture & Engineering | 0 (0.0%) | 0 (0.0%) |
| Life, Physical & Social Science | 0 (0.0%) | 0 (0.0%) |
| Community & Social Service | 0 (0.0%) | 35 (100.0%) |
| Education, Arts & Media | 0 (0.0%) | 0 (0.0%) |
| Legal Services & Support | 0 (0.0%) | 0 (0.0%) |
| Education Instruction & Library | 0 (0.0%) | 32 (100.0%) |
| Arts, Media & Entertainment | 0 (0.0%) | 3 (100.0%) |
| Health Diagnosing & Treating | 0 (0.0%) | 9 (100.0%) |
| Health Technologists | 0 (0.0%) | 4 (100.0%) |
| Total (Category) | 65 (33.2%) | 131 (66.8%) |
| Total (Overall) | 309 (40.7%) | 450 (59.3%) |
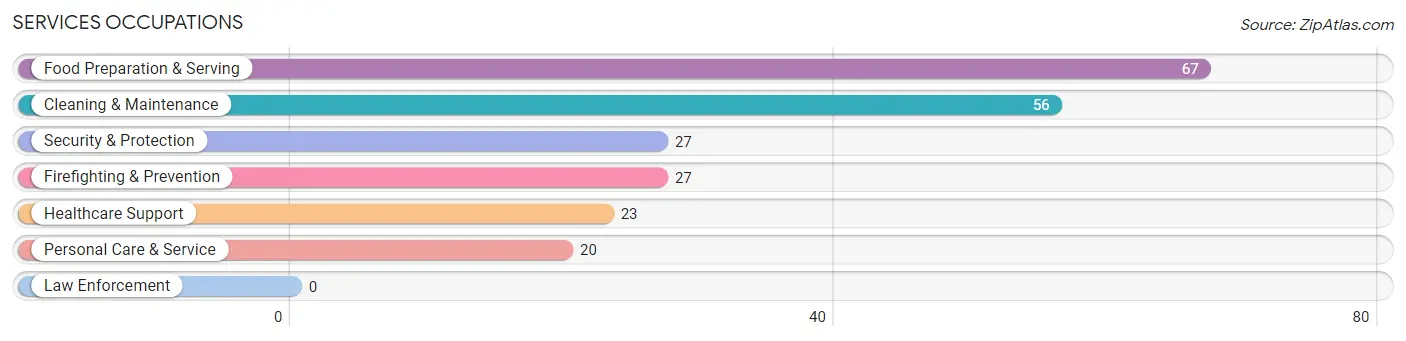
Services Occupations
The most common Services occupations in Real County are Food Preparation & Serving (67 | 8.8%), Cleaning & Maintenance (56 | 7.4%), Security & Protection (27 | 3.6%), Firefighting & Prevention (27 | 3.6%), and Healthcare Support (23 | 3.0%).
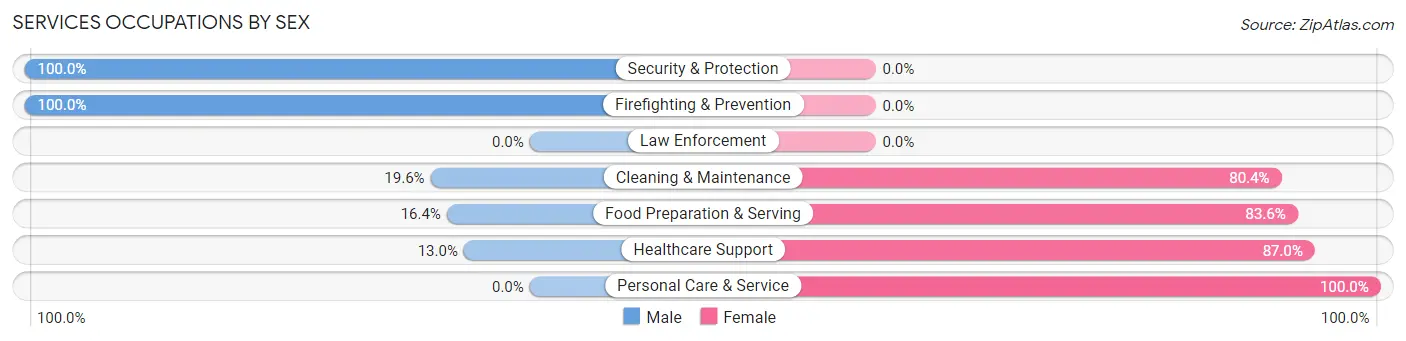
Services Occupations by Sex
Within the Services occupations in Real County, the most male-oriented occupations are Security & Protection (100.0%), Firefighting & Prevention (100.0%), and Cleaning & Maintenance (19.6%), while the most female-oriented occupations are Personal Care & Service (100.0%), Healthcare Support (87.0%), and Food Preparation & Serving (83.6%).
| Occupation | Male | Female |
| Healthcare Support | 3 (13.0%) | 20 (87.0%) |
| Security & Protection | 27 (100.0%) | 0 (0.0%) |
| Firefighting & Prevention | 27 (100.0%) | 0 (0.0%) |
| Law Enforcement | 0 (0.0%) | 0 (0.0%) |
| Food Preparation & Serving | 11 (16.4%) | 56 (83.6%) |
| Cleaning & Maintenance | 11 (19.6%) | 45 (80.4%) |
| Personal Care & Service | 0 (0.0%) | 20 (100.0%) |
| Total (Category) | 52 (26.9%) | 141 (73.1%) |
| Total (Overall) | 309 (40.7%) | 450 (59.3%) |
Sales and Office Occupations
The most common Sales and Office occupations in Real County are Sales & Related (146 | 19.2%), and Office & Administration (60 | 7.9%).
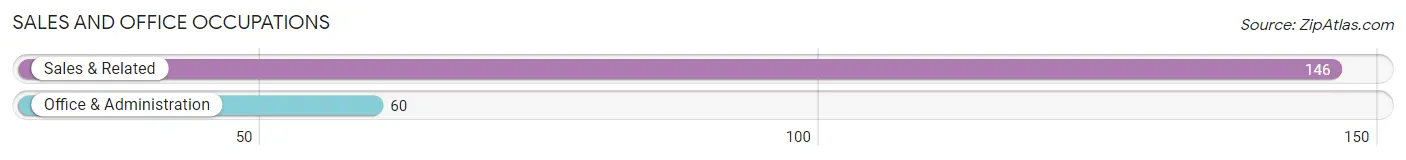
Sales and Office Occupations by Sex

| Occupation | Male | Female |
| Sales & Related | 14 (9.6%) | 132 (90.4%) |
| Office & Administration | 24 (40.0%) | 36 (60.0%) |
| Total (Category) | 38 (18.4%) | 168 (81.6%) |
| Total (Overall) | 309 (40.7%) | 450 (59.3%) |
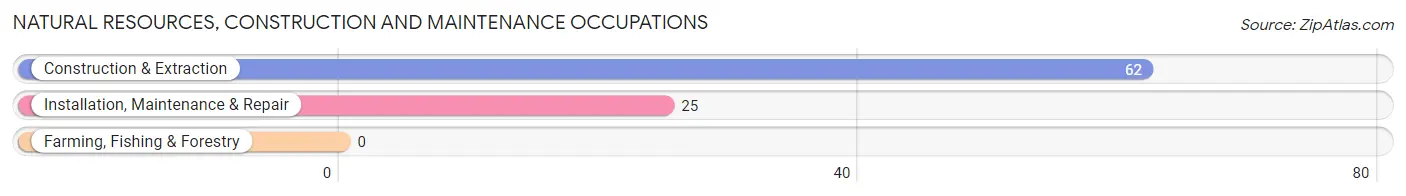
Natural Resources, Construction and Maintenance Occupations
The most common Natural Resources, Construction and Maintenance occupations in Real County are Construction & Extraction (62 | 8.2%), and Installation, Maintenance & Repair (25 | 3.3%).
Natural Resources, Construction and Maintenance Occupations by Sex
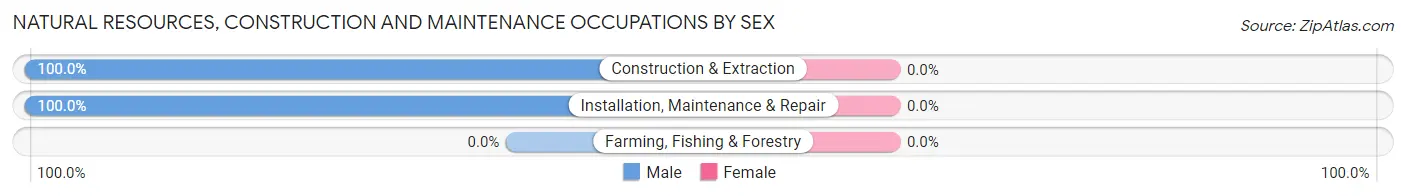
| Occupation | Male | Female |
| Farming, Fishing & Forestry | 0 (0.0%) | 0 (0.0%) |
| Construction & Extraction | 62 (100.0%) | 0 (0.0%) |
| Installation, Maintenance & Repair | 25 (100.0%) | 0 (0.0%) |
| Total (Category) | 87 (100.0%) | 0 (0.0%) |
| Total (Overall) | 309 (40.7%) | 450 (59.3%) |
Production, Transportation and Moving Occupations
The most common Production, Transportation and Moving occupations in Real County are Production (50 | 6.6%), Transportation (16 | 2.1%), and Material Moving (11 | 1.5%).
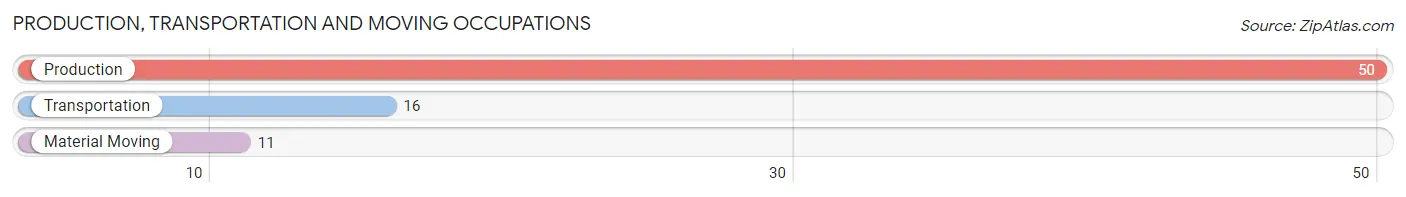
Production, Transportation and Moving Occupations by Sex
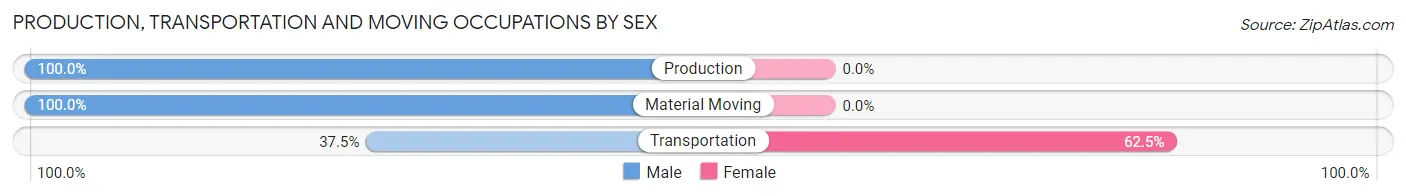
| Occupation | Male | Female |
| Production | 50 (100.0%) | 0 (0.0%) |
| Transportation | 6 (37.5%) | 10 (62.5%) |
| Material Moving | 11 (100.0%) | 0 (0.0%) |
| Total (Category) | 67 (87.0%) | 10 (13.0%) |
| Total (Overall) | 309 (40.7%) | 450 (59.3%) |
Employment Industries by Sex in Real County
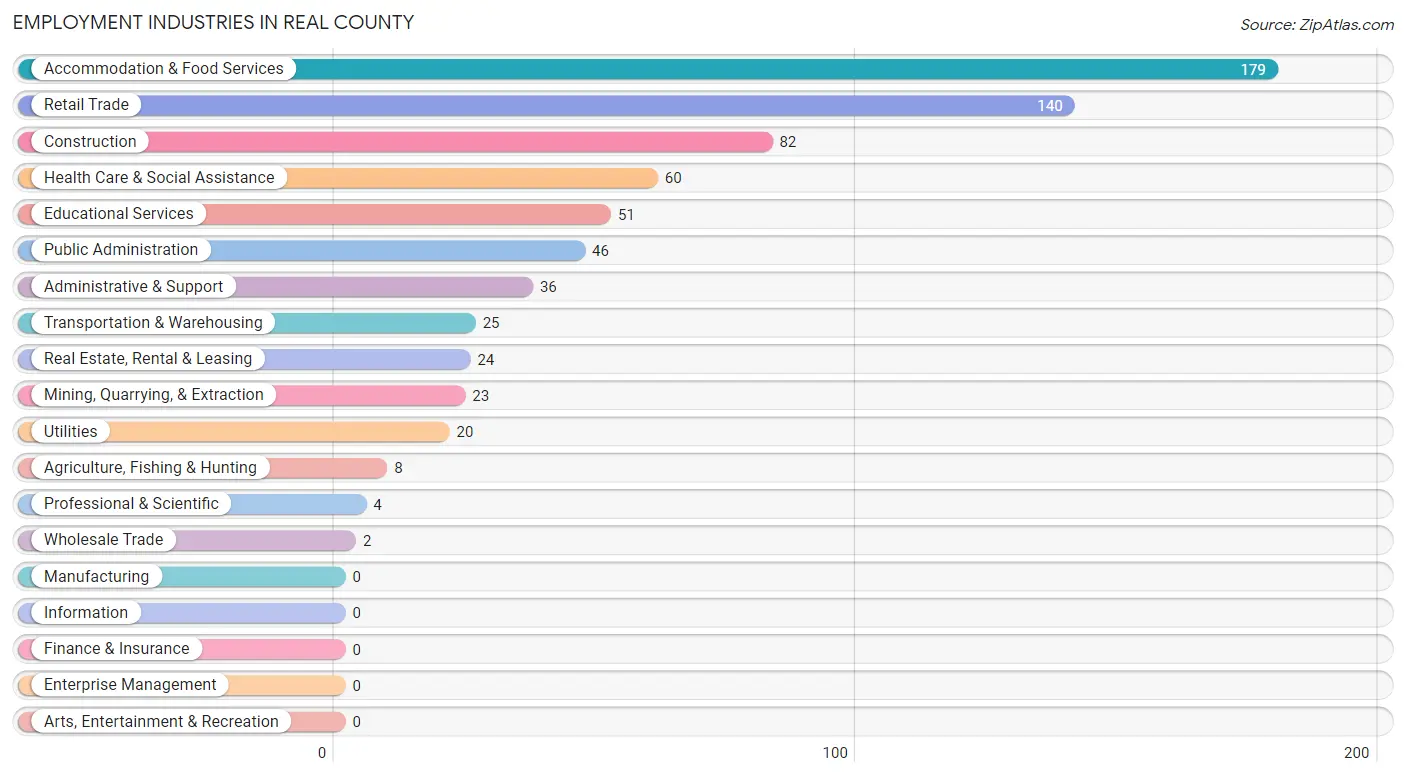
Employment Industries in Real County
The major employment industries in Real County include Accommodation & Food Services (179 | 23.6%), Retail Trade (140 | 18.4%), Construction (82 | 10.8%), Health Care & Social Assistance (60 | 7.9%), and Educational Services (51 | 6.7%).
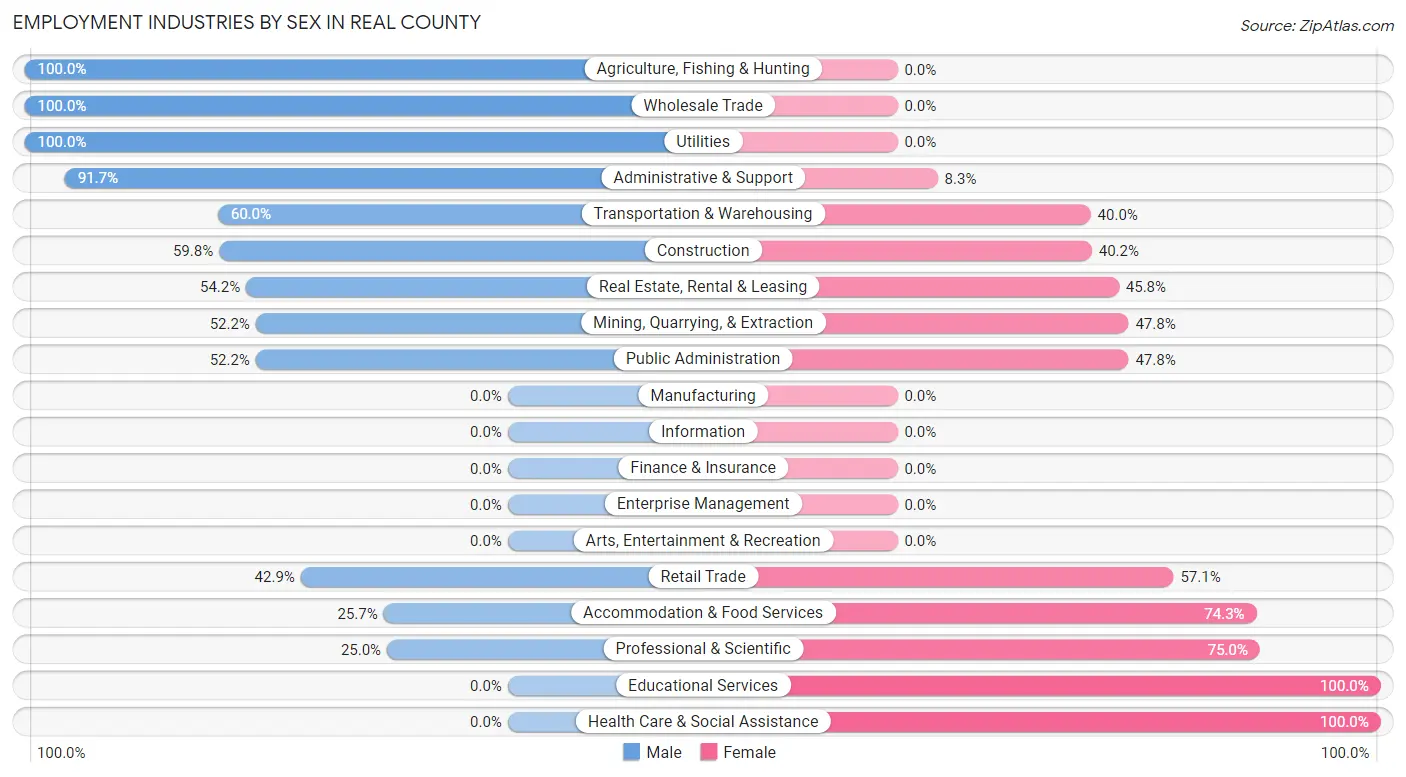
Employment Industries by Sex in Real County
The Real County industries that see more men than women are Agriculture, Fishing & Hunting (100.0%), Wholesale Trade (100.0%), and Utilities (100.0%), whereas the industries that tend to have a higher number of women are Educational Services (100.0%), Health Care & Social Assistance (100.0%), and Professional & Scientific (75.0%).
| Industry | Male | Female |
| Agriculture, Fishing & Hunting | 8 (100.0%) | 0 (0.0%) |
| Mining, Quarrying, & Extraction | 12 (52.2%) | 11 (47.8%) |
| Construction | 49 (59.8%) | 33 (40.2%) |
| Manufacturing | 0 (0.0%) | 0 (0.0%) |
| Wholesale Trade | 2 (100.0%) | 0 (0.0%) |
| Retail Trade | 60 (42.9%) | 80 (57.1%) |
| Transportation & Warehousing | 15 (60.0%) | 10 (40.0%) |
| Utilities | 20 (100.0%) | 0 (0.0%) |
| Information | 0 (0.0%) | 0 (0.0%) |
| Finance & Insurance | 0 (0.0%) | 0 (0.0%) |
| Real Estate, Rental & Leasing | 13 (54.2%) | 11 (45.8%) |
| Professional & Scientific | 1 (25.0%) | 3 (75.0%) |
| Enterprise Management | 0 (0.0%) | 0 (0.0%) |
| Administrative & Support | 33 (91.7%) | 3 (8.3%) |
| Educational Services | 0 (0.0%) | 51 (100.0%) |
| Health Care & Social Assistance | 0 (0.0%) | 60 (100.0%) |
| Arts, Entertainment & Recreation | 0 (0.0%) | 0 (0.0%) |
| Accommodation & Food Services | 46 (25.7%) | 133 (74.3%) |
| Public Administration | 24 (52.2%) | 22 (47.8%) |
| Total | 309 (40.7%) | 450 (59.3%) |
Education in Real County
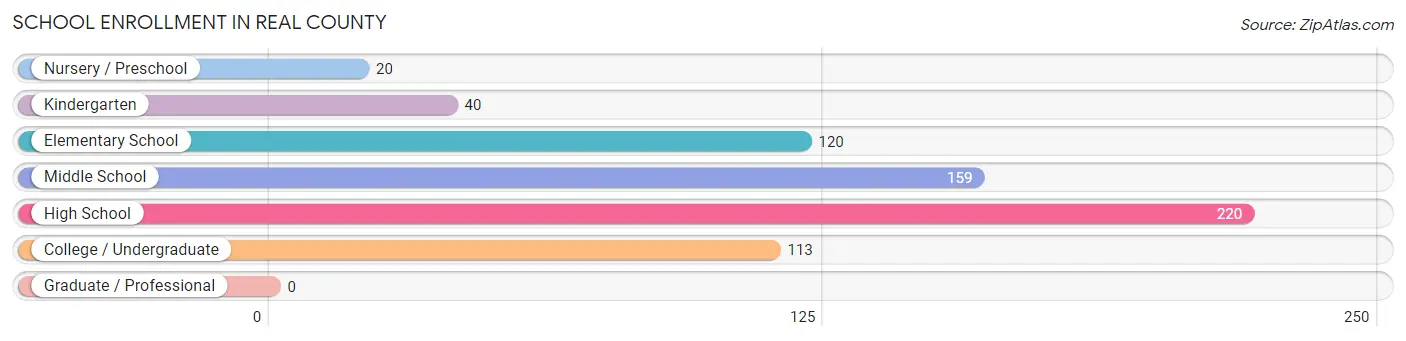
School Enrollment in Real County
The most common levels of schooling among the 672 students in Real County are high school (220 | 32.7%), middle school (159 | 23.7%), and elementary school (120 | 17.9%).
| School Level | # Students | % Students |
| Nursery / Preschool | 20 | 3.0% |
| Kindergarten | 40 | 5.9% |
| Elementary School | 120 | 17.9% |
| Middle School | 159 | 23.7% |
| High School | 220 | 32.7% |
| College / Undergraduate | 113 | 16.8% |
| Graduate / Professional | 0 | 0.0% |
| Total | 672 | 100.0% |
School Enrollment by Age by Funding Source in Real County
Out of a total of 672 students who are enrolled in schools in Real County, 30 (4.5%) attend a private institution, while the remaining 642 (95.5%) are enrolled in public schools. The age group of 5 to 9 year old has the highest likelihood of being enrolled in private schools, with 16 (10.3% in the age bracket) enrolled. Conversely, the age group of 3 to 4 year olds has the lowest likelihood of being enrolled in a private school, with 20 (100.0% in the age bracket) attending a public institution.
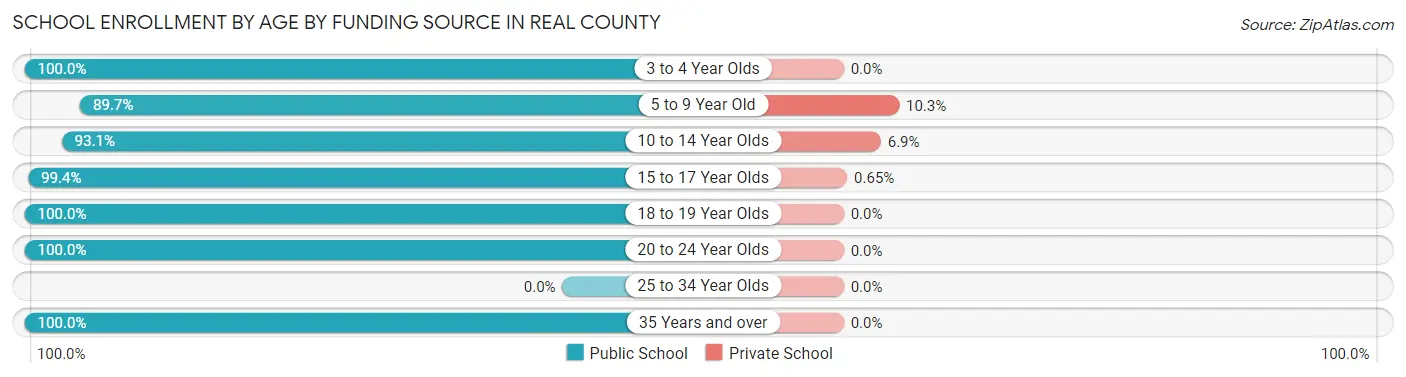
| Age Bracket | Public School | Private School |
| 3 to 4 Year Olds | 20 (100.0%) | 0 (0.0%) |
| 5 to 9 Year Old | 139 (89.7%) | 16 (10.3%) |
| 10 to 14 Year Olds | 175 (93.1%) | 13 (6.9%) |
| 15 to 17 Year Olds | 154 (99.4%) | 1 (0.6%) |
| 18 to 19 Year Olds | 59 (100.0%) | 0 (0.0%) |
| 20 to 24 Year Olds | 85 (100.0%) | 0 (0.0%) |
| 25 to 34 Year Olds | 0 (0.0%) | 0 (0.0%) |
| 35 Years and over | 10 (100.0%) | 0 (0.0%) |
| Total | 642 (95.5%) | 30 (4.5%) |
Educational Attainment by Field of Study in Real County
Business (165 | 39.7%), science & technology (70 | 16.8%), engineering (61 | 14.7%), education (60 | 14.4%), and arts & humanities (22 | 5.3%) are the most common fields of study among 416 individuals in Real County who have obtained a bachelor's degree or higher.
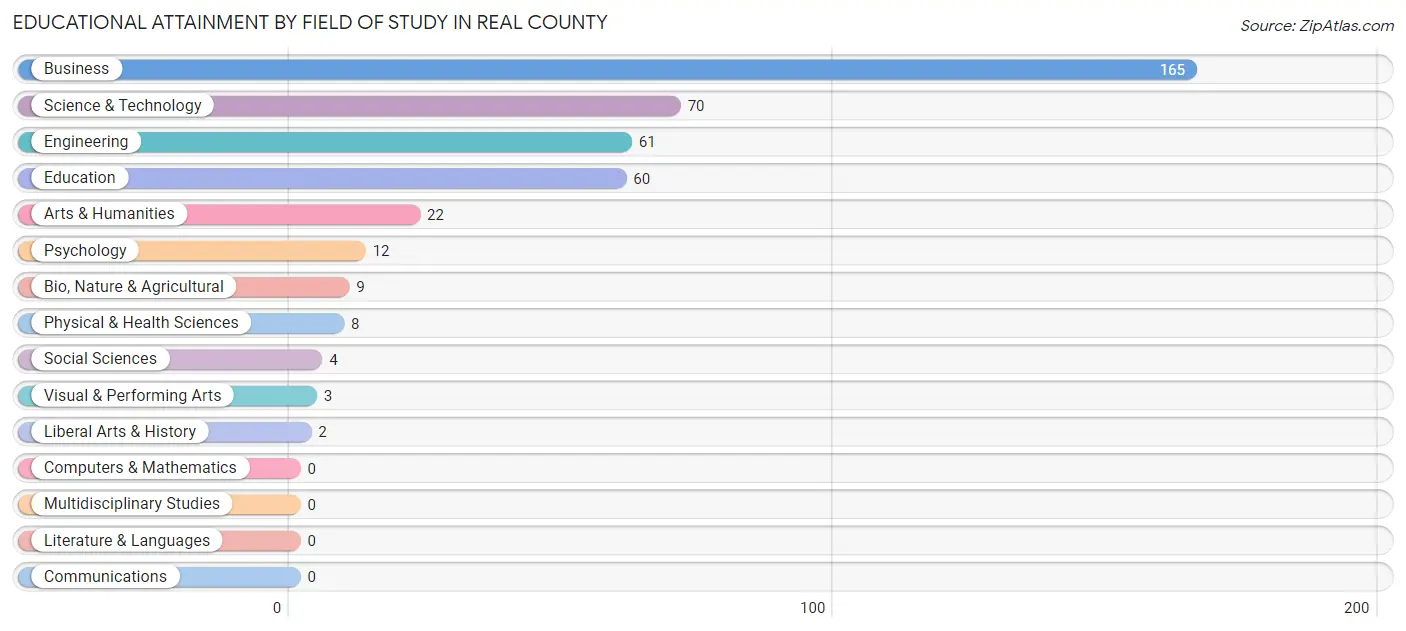
| Field of Study | # Graduates | % Graduates |
| Computers & Mathematics | 0 | 0.0% |
| Bio, Nature & Agricultural | 9 | 2.2% |
| Physical & Health Sciences | 8 | 1.9% |
| Psychology | 12 | 2.9% |
| Social Sciences | 4 | 1.0% |
| Engineering | 61 | 14.7% |
| Multidisciplinary Studies | 0 | 0.0% |
| Science & Technology | 70 | 16.8% |
| Business | 165 | 39.7% |
| Education | 60 | 14.4% |
| Literature & Languages | 0 | 0.0% |
| Liberal Arts & History | 2 | 0.5% |
| Visual & Performing Arts | 3 | 0.7% |
| Communications | 0 | 0.0% |
| Arts & Humanities | 22 | 5.3% |
| Total | 416 | 100.0% |
Transportation & Commute in Real County
Vehicle Availability by Sex in Real County
The most prevalent vehicle ownership categories in Real County are males with 2 vehicles (109, accounting for 36.0%) and females with 2 vehicles (253, making up 25.2%).
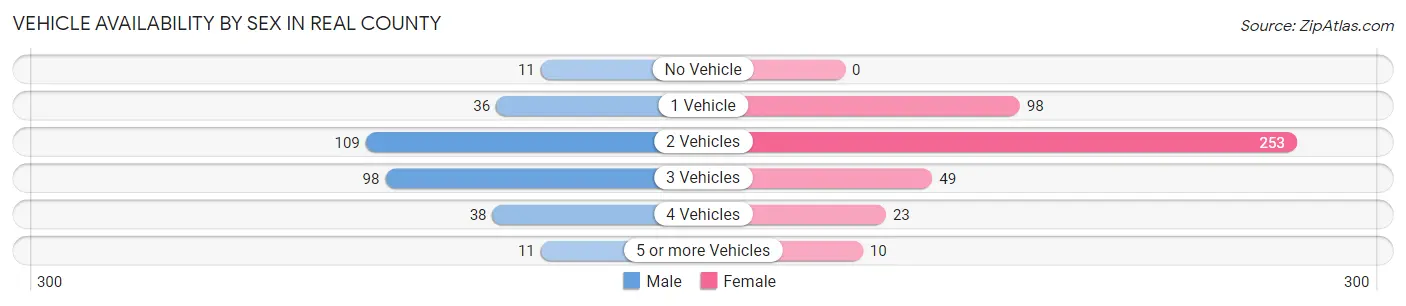
| Vehicles Available | Male | Female |
| No Vehicle | 11 (3.6%) | 0 (0.0%) |
| 1 Vehicle | 36 (11.9%) | 98 (22.6%) |
| 2 Vehicles | 109 (36.0%) | 253 (58.4%) |
| 3 Vehicles | 98 (32.3%) | 49 (11.3%) |
| 4 Vehicles | 38 (12.5%) | 23 (5.3%) |
| 5 or more Vehicles | 11 (3.6%) | 10 (2.3%) |
| Total | 303 (100.0%) | 433 (100.0%) |
Commute Time in Real County
The most frequently occuring commute durations in Real County are 5 to 9 minutes (214 commuters, 34.4%), 15 to 19 minutes (124 commuters, 19.9%), and 20 to 24 minutes (83 commuters, 13.3%).
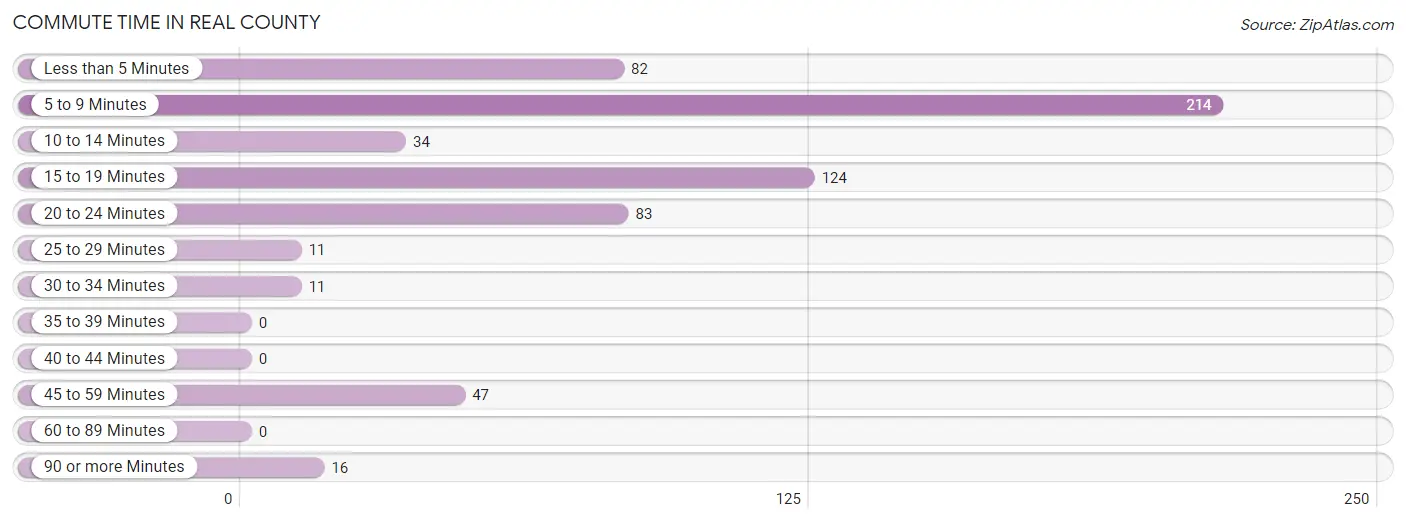
| Commute Time | # Commuters | % Commuters |
| Less than 5 Minutes | 82 | 13.2% |
| 5 to 9 Minutes | 214 | 34.4% |
| 10 to 14 Minutes | 34 | 5.5% |
| 15 to 19 Minutes | 124 | 19.9% |
| 20 to 24 Minutes | 83 | 13.3% |
| 25 to 29 Minutes | 11 | 1.8% |
| 30 to 34 Minutes | 11 | 1.8% |
| 35 to 39 Minutes | 0 | 0.0% |
| 40 to 44 Minutes | 0 | 0.0% |
| 45 to 59 Minutes | 47 | 7.6% |
| 60 to 89 Minutes | 0 | 0.0% |
| 90 or more Minutes | 16 | 2.6% |
Commute Time by Sex in Real County
The most common commute times in Real County are 5 to 9 minutes (64 commuters, 26.1%) for males and 5 to 9 minutes (150 commuters, 39.8%) for females.
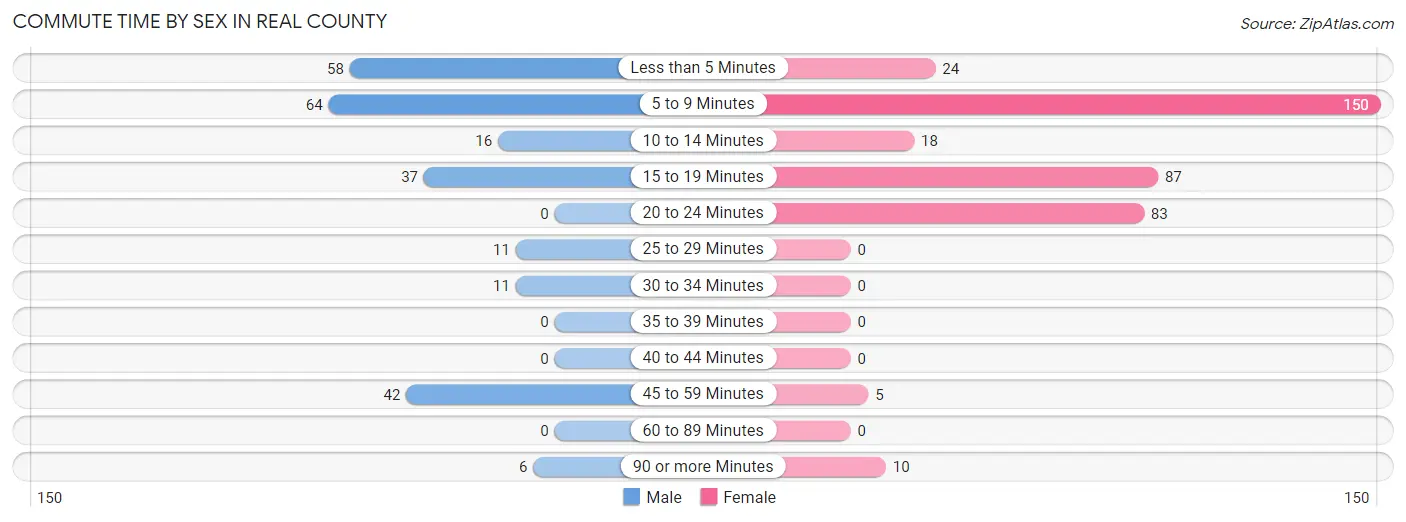
| Commute Time | Male | Female |
| Less than 5 Minutes | 58 (23.7%) | 24 (6.4%) |
| 5 to 9 Minutes | 64 (26.1%) | 150 (39.8%) |
| 10 to 14 Minutes | 16 (6.5%) | 18 (4.8%) |
| 15 to 19 Minutes | 37 (15.1%) | 87 (23.1%) |
| 20 to 24 Minutes | 0 (0.0%) | 83 (22.0%) |
| 25 to 29 Minutes | 11 (4.5%) | 0 (0.0%) |
| 30 to 34 Minutes | 11 (4.5%) | 0 (0.0%) |
| 35 to 39 Minutes | 0 (0.0%) | 0 (0.0%) |
| 40 to 44 Minutes | 0 (0.0%) | 0 (0.0%) |
| 45 to 59 Minutes | 42 (17.1%) | 5 (1.3%) |
| 60 to 89 Minutes | 0 (0.0%) | 0 (0.0%) |
| 90 or more Minutes | 6 (2.5%) | 10 (2.6%) |
Time of Departure to Work by Sex in Real County
The most frequent times of departure to work in Real County are 12:00 PM to 3:59 PM (62, 25.3%) for males and 7:30 AM to 7:59 AM (67, 17.8%) for females.
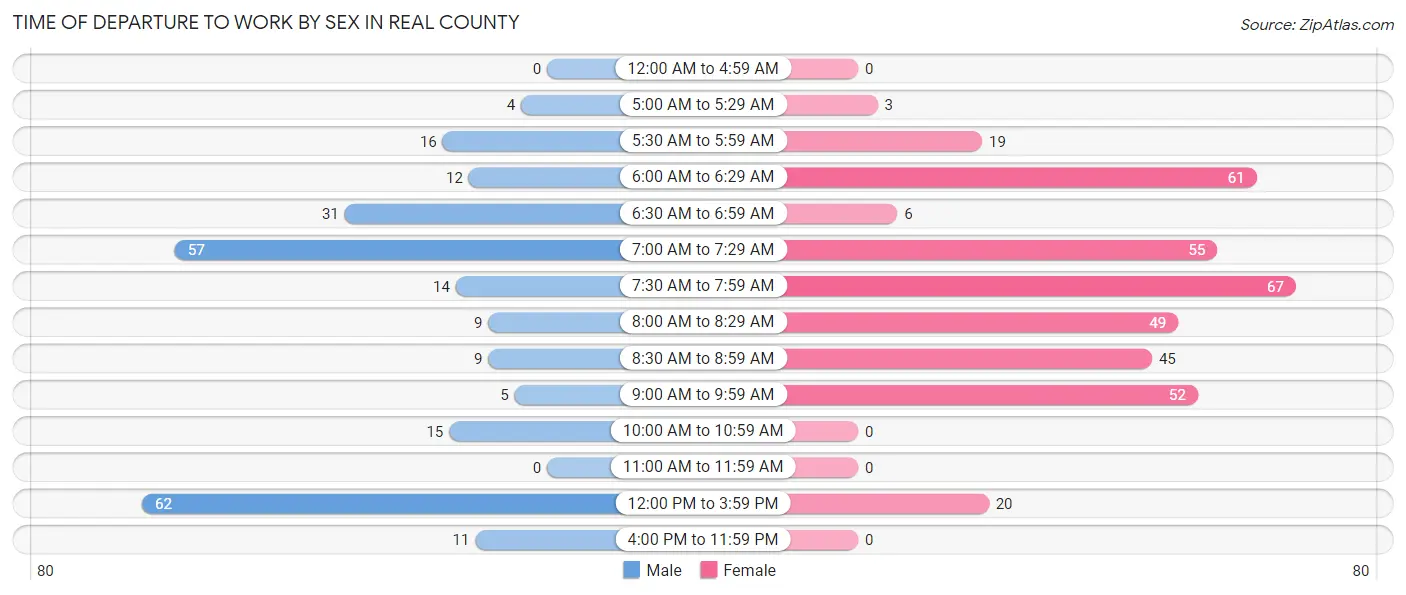
| Time of Departure | Male | Female |
| 12:00 AM to 4:59 AM | 0 (0.0%) | 0 (0.0%) |
| 5:00 AM to 5:29 AM | 4 (1.6%) | 3 (0.8%) |
| 5:30 AM to 5:59 AM | 16 (6.5%) | 19 (5.0%) |
| 6:00 AM to 6:29 AM | 12 (4.9%) | 61 (16.2%) |
| 6:30 AM to 6:59 AM | 31 (12.7%) | 6 (1.6%) |
| 7:00 AM to 7:29 AM | 57 (23.3%) | 55 (14.6%) |
| 7:30 AM to 7:59 AM | 14 (5.7%) | 67 (17.8%) |
| 8:00 AM to 8:29 AM | 9 (3.7%) | 49 (13.0%) |
| 8:30 AM to 8:59 AM | 9 (3.7%) | 45 (11.9%) |
| 9:00 AM to 9:59 AM | 5 (2.0%) | 52 (13.8%) |
| 10:00 AM to 10:59 AM | 15 (6.1%) | 0 (0.0%) |
| 11:00 AM to 11:59 AM | 0 (0.0%) | 0 (0.0%) |
| 12:00 PM to 3:59 PM | 62 (25.3%) | 20 (5.3%) |
| 4:00 PM to 11:59 PM | 11 (4.5%) | 0 (0.0%) |
| Total | 245 (100.0%) | 377 (100.0%) |
Housing Occupancy in Real County
Occupancy by Ownership in Real County
Of the total 992 dwellings in Real County, owner-occupied units account for 736 (74.2%), while renter-occupied units make up 256 (25.8%).
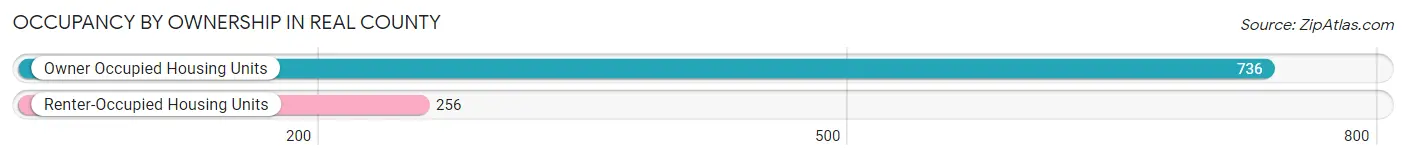
| Occupancy | # Housing Units | % Housing Units |
| Owner Occupied Housing Units | 736 | 74.2% |
| Renter-Occupied Housing Units | 256 | 25.8% |
| Total Occupied Housing Units | 992 | 100.0% |
Occupancy by Household Size in Real County
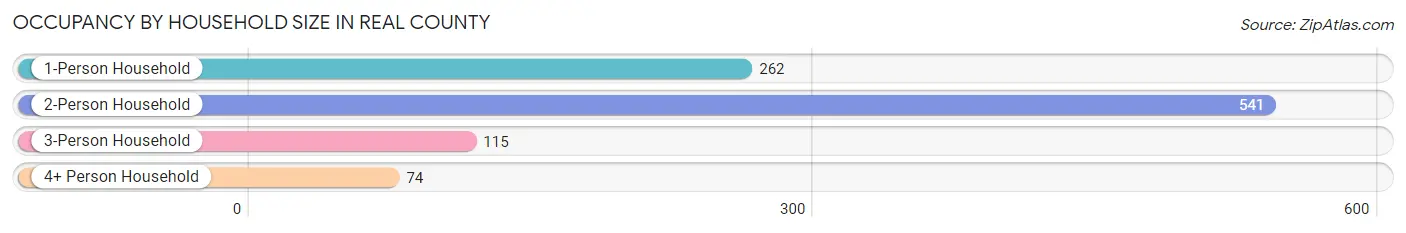
| Household Size | # Housing Units | % Housing Units |
| 1-Person Household | 262 | 26.4% |
| 2-Person Household | 541 | 54.5% |
| 3-Person Household | 115 | 11.6% |
| 4+ Person Household | 74 | 7.5% |
| Total Housing Units | 992 | 100.0% |
Occupancy by Ownership by Household Size in Real County
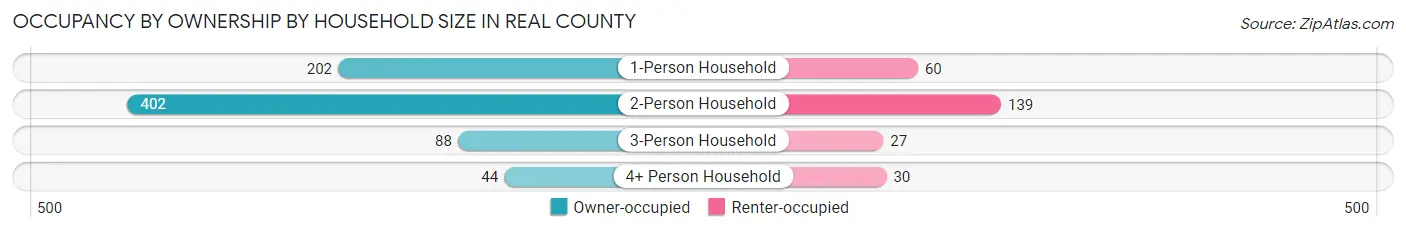
| Household Size | Owner-occupied | Renter-occupied |
| 1-Person Household | 202 (77.1%) | 60 (22.9%) |
| 2-Person Household | 402 (74.3%) | 139 (25.7%) |
| 3-Person Household | 88 (76.5%) | 27 (23.5%) |
| 4+ Person Household | 44 (59.5%) | 30 (40.5%) |
| Total Housing Units | 736 (74.2%) | 256 (25.8%) |
Occupancy by Educational Attainment in Real County
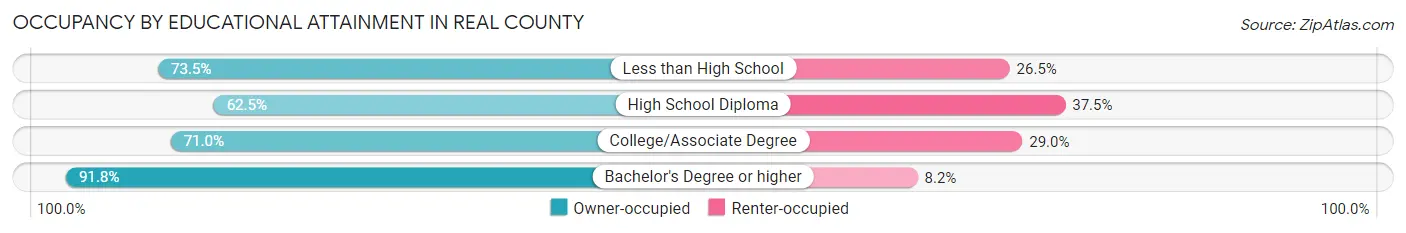
| Household Size | Owner-occupied | Renter-occupied |
| Less than High School | 50 (73.5%) | 18 (26.5%) |
| High School Diploma | 190 (62.5%) | 114 (37.5%) |
| College/Associate Degree | 250 (71.0%) | 102 (29.0%) |
| Bachelor's Degree or higher | 246 (91.8%) | 22 (8.2%) |
Occupancy by Age of Householder in Real County
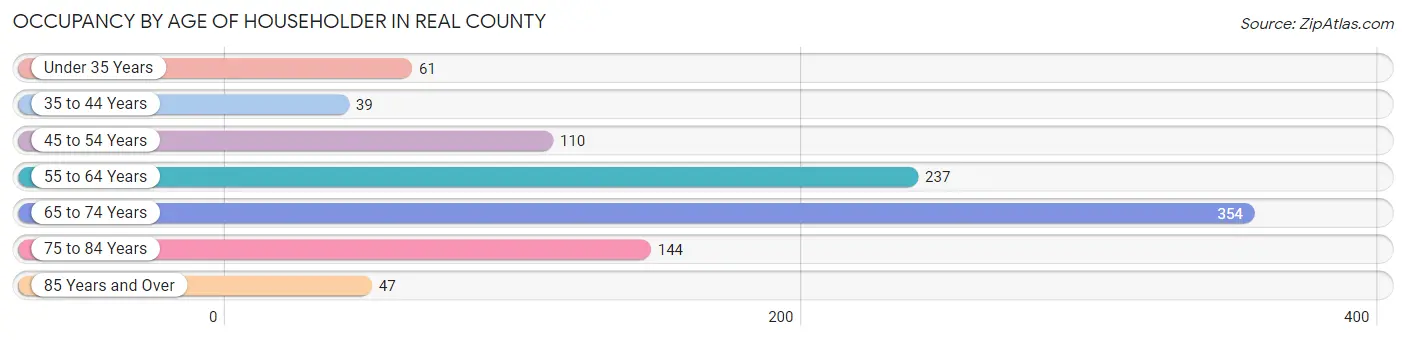
| Age Bracket | # Households | % Households |
| Under 35 Years | 61 | 6.1% |
| 35 to 44 Years | 39 | 3.9% |
| 45 to 54 Years | 110 | 11.1% |
| 55 to 64 Years | 237 | 23.9% |
| 65 to 74 Years | 354 | 35.7% |
| 75 to 84 Years | 144 | 14.5% |
| 85 Years and Over | 47 | 4.7% |
| Total | 992 | 100.0% |
Housing Finances in Real County
Median Income by Occupancy in Real County
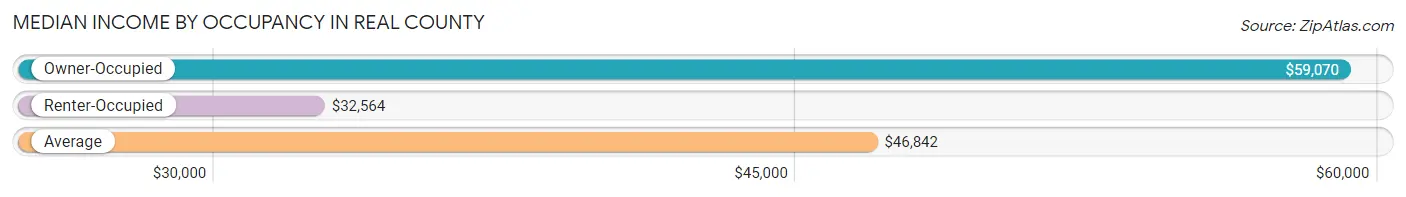
| Occupancy Type | # Households | Median Income |
| Owner-Occupied | 736 (74.2%) | $59,070 |
| Renter-Occupied | 256 (25.8%) | $32,564 |
| Average | 992 (100.0%) | $46,842 |
Occupancy by Householder Income Bracket in Real County
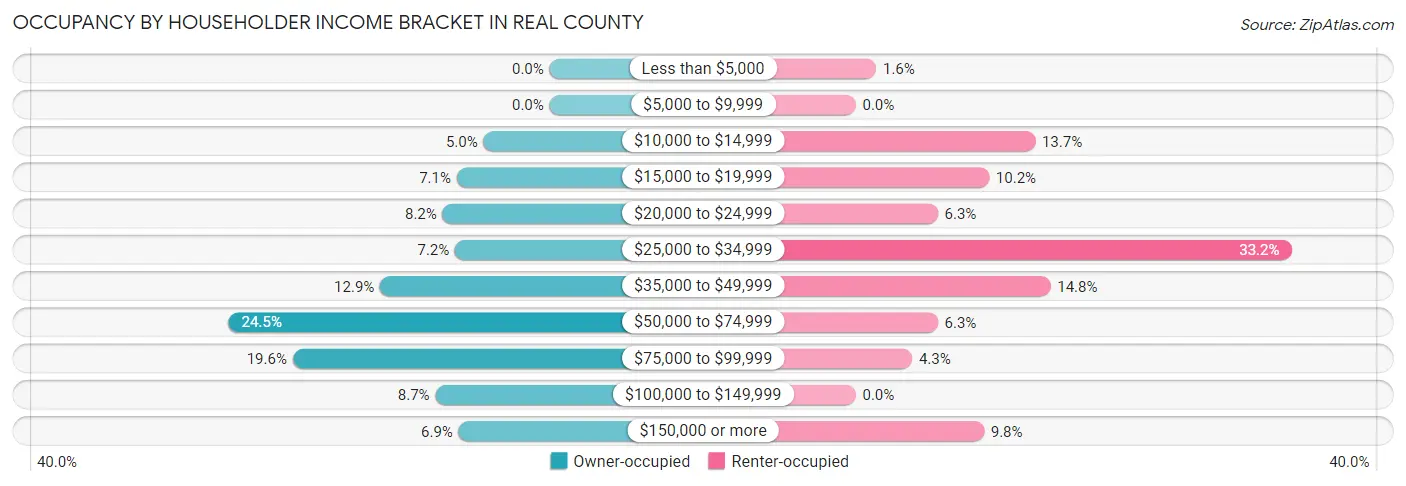
| Income Bracket | Owner-occupied | Renter-occupied |
| Less than $5,000 | 0 (0.0%) | 4 (1.6%) |
| $5,000 to $9,999 | 0 (0.0%) | 0 (0.0%) |
| $10,000 to $14,999 | 37 (5.0%) | 35 (13.7%) |
| $15,000 to $19,999 | 52 (7.1%) | 26 (10.2%) |
| $20,000 to $24,999 | 60 (8.2%) | 16 (6.2%) |
| $25,000 to $34,999 | 53 (7.2%) | 85 (33.2%) |
| $35,000 to $49,999 | 95 (12.9%) | 38 (14.8%) |
| $50,000 to $74,999 | 180 (24.5%) | 16 (6.2%) |
| $75,000 to $99,999 | 144 (19.6%) | 11 (4.3%) |
| $100,000 to $149,999 | 64 (8.7%) | 0 (0.0%) |
| $150,000 or more | 51 (6.9%) | 25 (9.8%) |
| Total | 736 (100.0%) | 256 (100.0%) |
Monthly Housing Cost Tiers in Real County
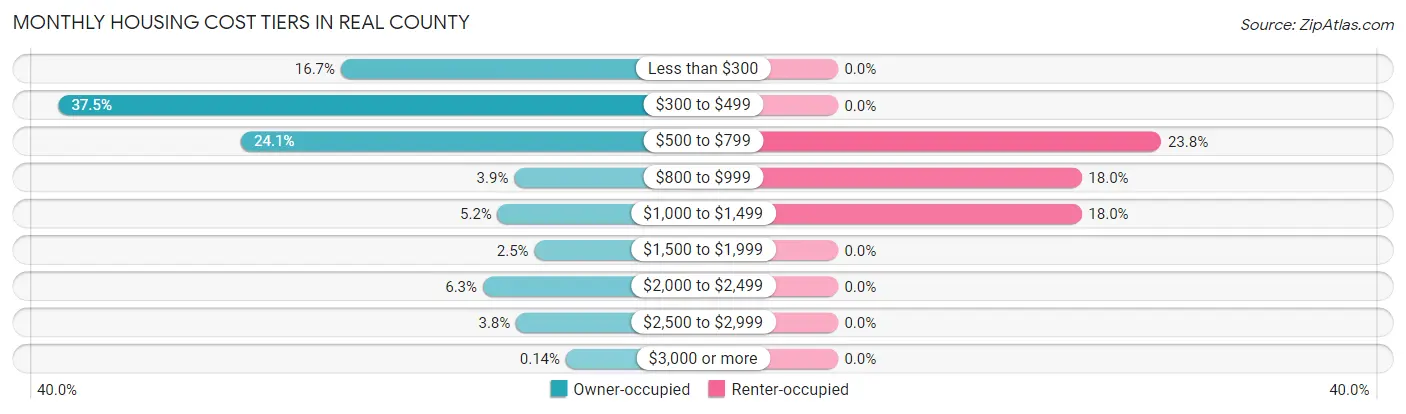
| Monthly Cost | Owner-occupied | Renter-occupied |
| Less than $300 | 123 (16.7%) | 0 (0.0%) |
| $300 to $499 | 276 (37.5%) | 0 (0.0%) |
| $500 to $799 | 177 (24.0%) | 61 (23.8%) |
| $800 to $999 | 29 (3.9%) | 46 (18.0%) |
| $1,000 to $1,499 | 38 (5.2%) | 46 (18.0%) |
| $1,500 to $1,999 | 18 (2.5%) | 0 (0.0%) |
| $2,000 to $2,499 | 46 (6.2%) | 0 (0.0%) |
| $2,500 to $2,999 | 28 (3.8%) | 0 (0.0%) |
| $3,000 or more | 1 (0.1%) | 0 (0.0%) |
| Total | 736 (100.0%) | 256 (100.0%) |
Physical Housing Characteristics in Real County
Housing Structures in Real County
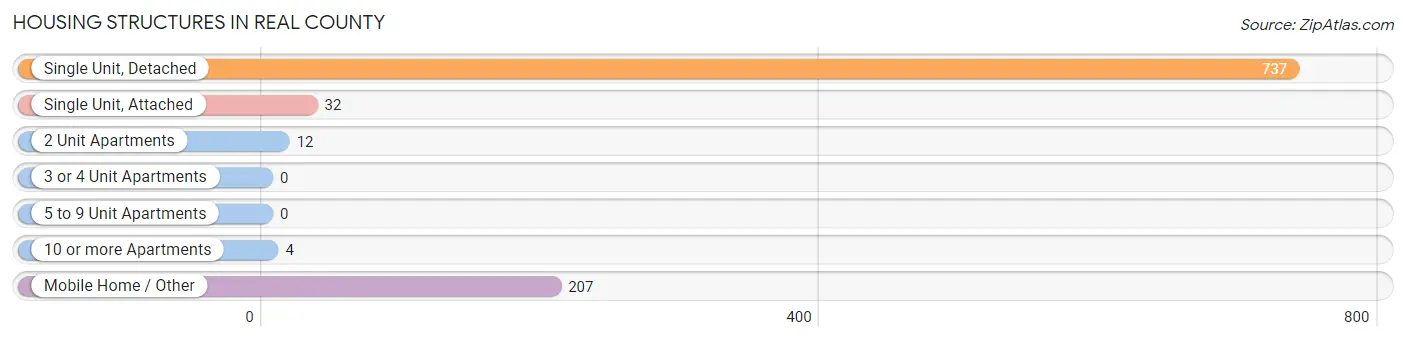
| Structure Type | # Housing Units | % Housing Units |
| Single Unit, Detached | 737 | 74.3% |
| Single Unit, Attached | 32 | 3.2% |
| 2 Unit Apartments | 12 | 1.2% |
| 3 or 4 Unit Apartments | 0 | 0.0% |
| 5 to 9 Unit Apartments | 0 | 0.0% |
| 10 or more Apartments | 4 | 0.4% |
| Mobile Home / Other | 207 | 20.9% |
| Total | 992 | 100.0% |
Housing Structures by Occupancy in Real County
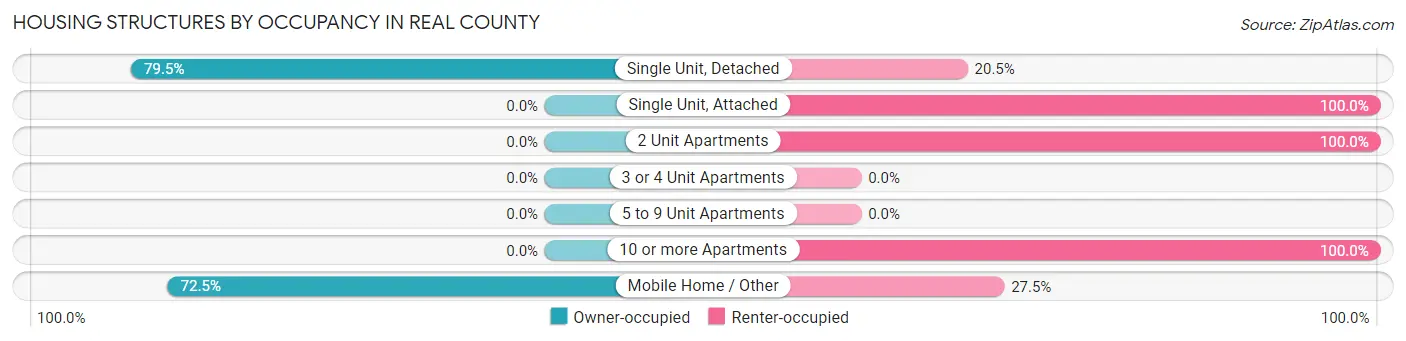
| Structure Type | Owner-occupied | Renter-occupied |
| Single Unit, Detached | 586 (79.5%) | 151 (20.5%) |
| Single Unit, Attached | 0 (0.0%) | 32 (100.0%) |
| 2 Unit Apartments | 0 (0.0%) | 12 (100.0%) |
| 3 or 4 Unit Apartments | 0 (0.0%) | 0 (0.0%) |
| 5 to 9 Unit Apartments | 0 (0.0%) | 0 (0.0%) |
| 10 or more Apartments | 0 (0.0%) | 4 (100.0%) |
| Mobile Home / Other | 150 (72.5%) | 57 (27.5%) |
| Total | 736 (74.2%) | 256 (25.8%) |
Housing Structures by Number of Rooms in Real County
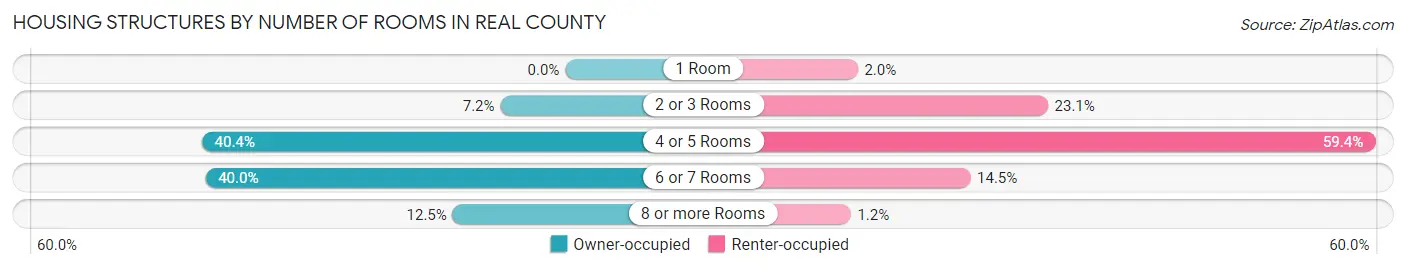
| Number of Rooms | Owner-occupied | Renter-occupied |
| 1 Room | 0 (0.0%) | 5 (1.9%) |
| 2 or 3 Rooms | 53 (7.2%) | 59 (23.1%) |
| 4 or 5 Rooms | 297 (40.4%) | 152 (59.4%) |
| 6 or 7 Rooms | 294 (40.0%) | 37 (14.4%) |
| 8 or more Rooms | 92 (12.5%) | 3 (1.2%) |
| Total | 736 (100.0%) | 256 (100.0%) |
Housing Structure by Heating Type in Real County
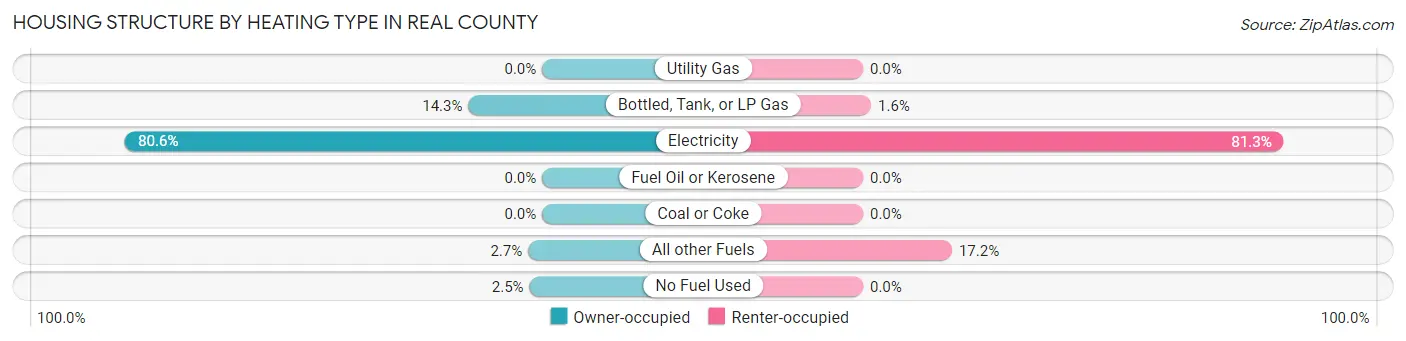
| Heating Type | Owner-occupied | Renter-occupied |
| Utility Gas | 0 (0.0%) | 0 (0.0%) |
| Bottled, Tank, or LP Gas | 105 (14.3%) | 4 (1.6%) |
| Electricity | 593 (80.6%) | 208 (81.2%) |
| Fuel Oil or Kerosene | 0 (0.0%) | 0 (0.0%) |
| Coal or Coke | 0 (0.0%) | 0 (0.0%) |
| All other Fuels | 20 (2.7%) | 44 (17.2%) |
| No Fuel Used | 18 (2.5%) | 0 (0.0%) |
| Total | 736 (100.0%) | 256 (100.0%) |
Household Vehicle Usage in Real County
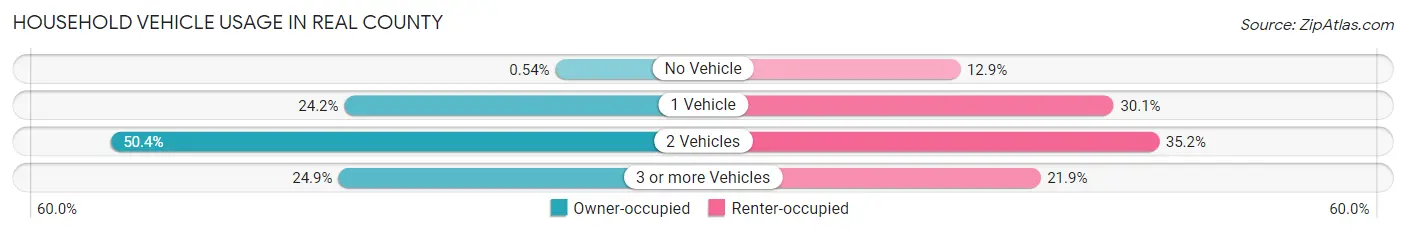
| Vehicles per Household | Owner-occupied | Renter-occupied |
| No Vehicle | 4 (0.5%) | 33 (12.9%) |
| 1 Vehicle | 178 (24.2%) | 77 (30.1%) |
| 2 Vehicles | 371 (50.4%) | 90 (35.2%) |
| 3 or more Vehicles | 183 (24.9%) | 56 (21.9%) |
| Total | 736 (100.0%) | 256 (100.0%) |
Real Estate & Mortgages in Real County
Real Estate and Mortgage Overview in Real County
| Characteristic | Without Mortgage | With Mortgage |
| Housing Units | 612 | 124 |
| Median Property Value | $183,300 | $416,700 |
| Median Household Income | $56,154 | $1 |
| Monthly Housing Costs | $415 | $1 |
| Real Estate Taxes | $1,490 | $0 |
Property Value by Mortgage Status in Real County
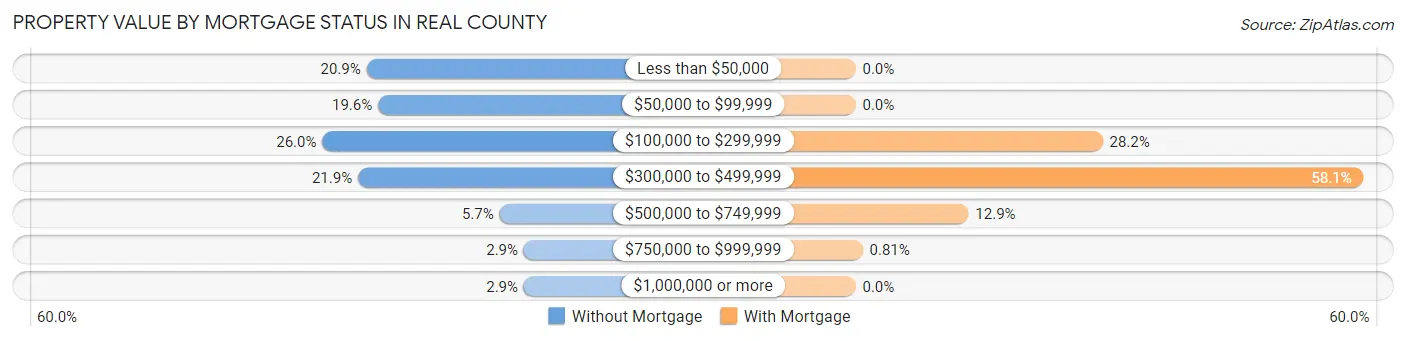
| Property Value | Without Mortgage | With Mortgage |
| Less than $50,000 | 128 (20.9%) | 0 (0.0%) |
| $50,000 to $99,999 | 120 (19.6%) | 0 (0.0%) |
| $100,000 to $299,999 | 159 (26.0%) | 35 (28.2%) |
| $300,000 to $499,999 | 134 (21.9%) | 72 (58.1%) |
| $500,000 to $749,999 | 35 (5.7%) | 16 (12.9%) |
| $750,000 to $999,999 | 18 (2.9%) | 1 (0.8%) |
| $1,000,000 or more | 18 (2.9%) | 0 (0.0%) |
| Total | 612 (100.0%) | 124 (100.0%) |
Household Income by Mortgage Status in Real County
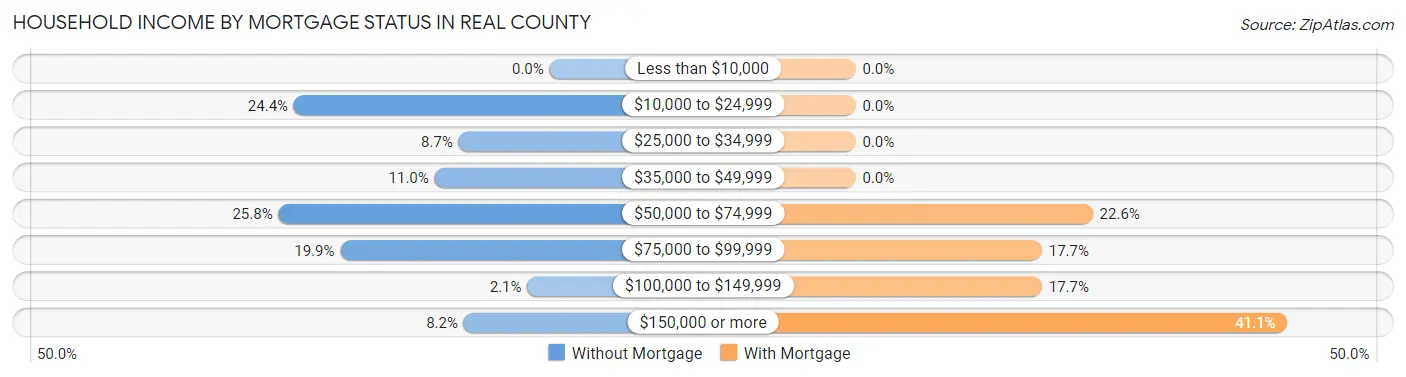
| Household Income | Without Mortgage | With Mortgage |
| Less than $10,000 | 0 (0.0%) | 0 (0.0%) |
| $10,000 to $24,999 | 149 (24.3%) | 0 (0.0%) |
| $25,000 to $34,999 | 53 (8.7%) | 0 (0.0%) |
| $35,000 to $49,999 | 67 (11.0%) | 0 (0.0%) |
| $50,000 to $74,999 | 158 (25.8%) | 28 (22.6%) |
| $75,000 to $99,999 | 122 (19.9%) | 22 (17.7%) |
| $100,000 to $149,999 | 13 (2.1%) | 22 (17.7%) |
| $150,000 or more | 50 (8.2%) | 51 (41.1%) |
| Total | 612 (100.0%) | 124 (100.0%) |
Property Value to Household Income Ratio in Real County
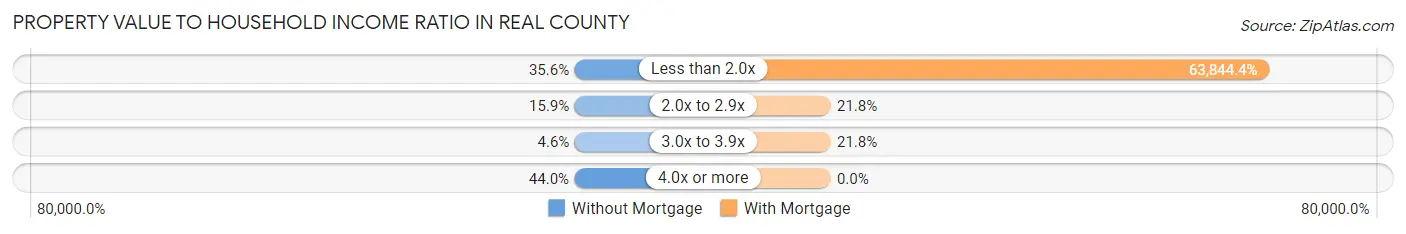
| Value-to-Income Ratio | Without Mortgage | With Mortgage |
| Less than 2.0x | 218 (35.6%) | 79,167 (63,844.3%) |
| 2.0x to 2.9x | 97 (15.9%) | 27 (21.8%) |
| 3.0x to 3.9x | 28 (4.6%) | 27 (21.8%) |
| 4.0x or more | 269 (44.0%) | 0 (0.0%) |
| Total | 612 (100.0%) | 124 (100.0%) |
Real Estate Taxes by Mortgage Status in Real County
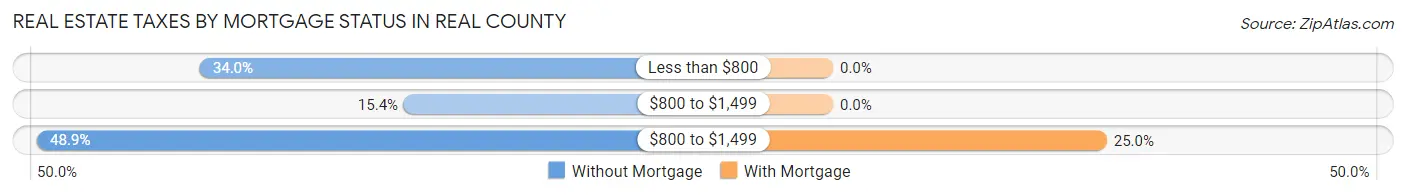
| Property Taxes | Without Mortgage | With Mortgage |
| Less than $800 | 208 (34.0%) | 0 (0.0%) |
| $800 to $1,499 | 94 (15.4%) | 0 (0.0%) |
| $800 to $1,499 | 299 (48.9%) | 31 (25.0%) |
| Total | 612 (100.0%) | 124 (100.0%) |
Health & Disability in Real County
Health Insurance Coverage by Age in Real County
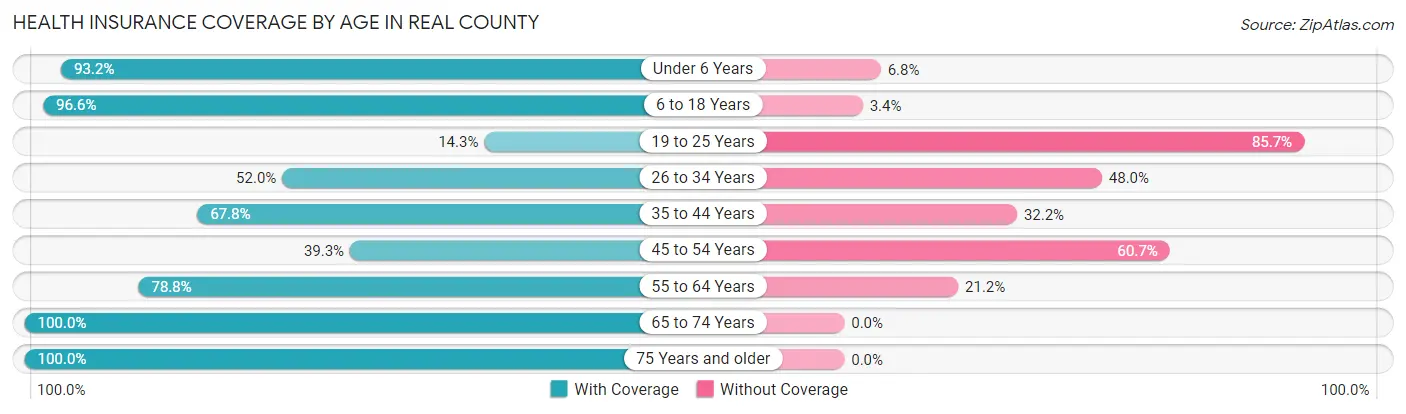
| Age Bracket | With Coverage | Without Coverage |
| Under 6 Years | 151 (93.2%) | 11 (6.8%) |
| 6 to 18 Years | 533 (96.6%) | 19 (3.4%) |
| 19 to 25 Years | 29 (14.3%) | 174 (85.7%) |
| 26 to 34 Years | 79 (52.0%) | 73 (48.0%) |
| 35 to 44 Years | 80 (67.8%) | 38 (32.2%) |
| 45 to 54 Years | 94 (39.3%) | 145 (60.7%) |
| 55 to 64 Years | 297 (78.8%) | 80 (21.2%) |
| 65 to 74 Years | 576 (100.0%) | 0 (0.0%) |
| 75 Years and older | 349 (100.0%) | 0 (0.0%) |
| Total | 2,188 (80.2%) | 540 (19.8%) |
Health Insurance Coverage by Citizenship Status in Real County
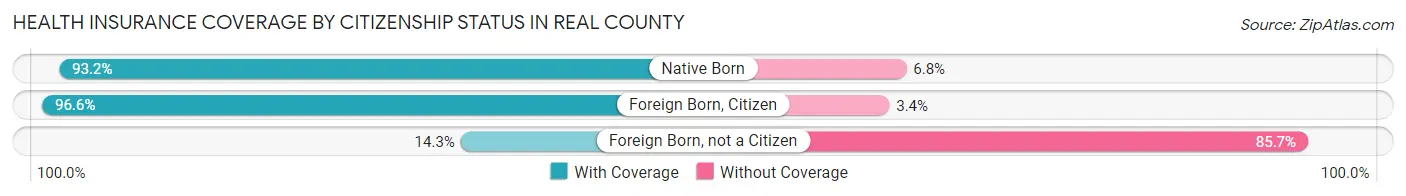
| Citizenship Status | With Coverage | Without Coverage |
| Native Born | 151 (93.2%) | 11 (6.8%) |
| Foreign Born, Citizen | 533 (96.6%) | 19 (3.4%) |
| Foreign Born, not a Citizen | 29 (14.3%) | 174 (85.7%) |
Health Insurance Coverage by Household Income in Real County
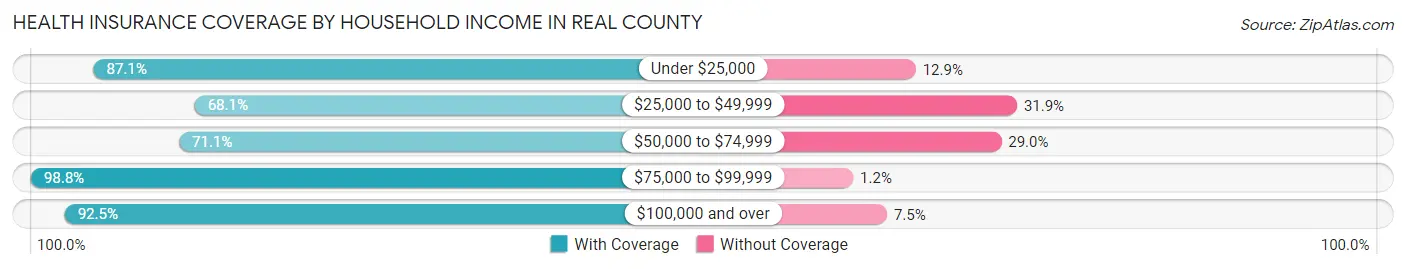
| Household Income | With Coverage | Without Coverage |
| Under $25,000 | 600 (87.1%) | 89 (12.9%) |
| $25,000 to $49,999 | 609 (68.1%) | 285 (31.9%) |
| $50,000 to $74,999 | 292 (71.1%) | 119 (28.9%) |
| $75,000 to $99,999 | 249 (98.8%) | 3 (1.2%) |
| $100,000 and over | 430 (92.5%) | 35 (7.5%) |
Public vs Private Health Insurance Coverage by Age in Real County
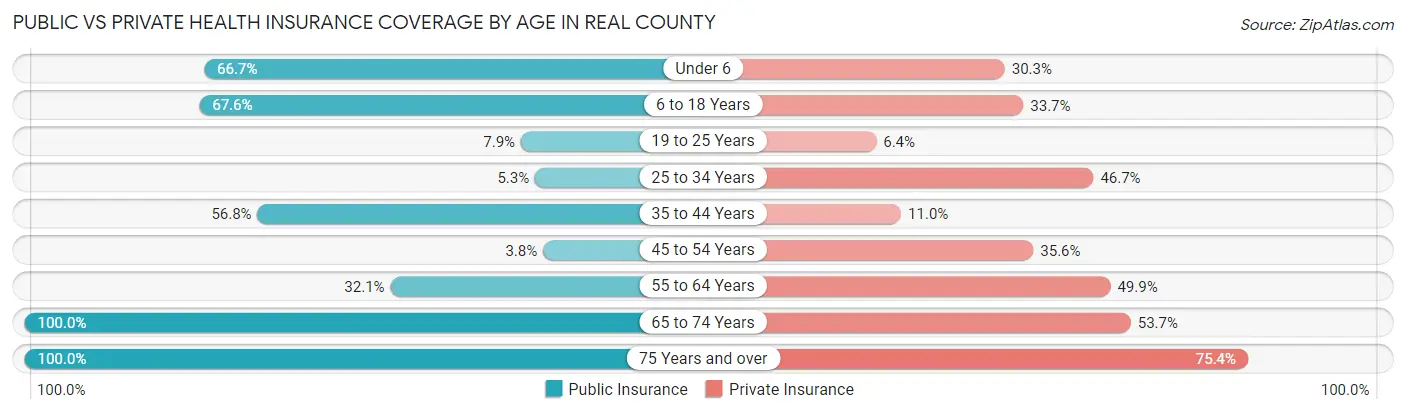
| Age Bracket | Public Insurance | Private Insurance |
| Under 6 | 108 (66.7%) | 49 (30.2%) |
| 6 to 18 Years | 373 (67.6%) | 186 (33.7%) |
| 19 to 25 Years | 16 (7.9%) | 13 (6.4%) |
| 25 to 34 Years | 8 (5.3%) | 71 (46.7%) |
| 35 to 44 Years | 67 (56.8%) | 13 (11.0%) |
| 45 to 54 Years | 9 (3.8%) | 85 (35.6%) |
| 55 to 64 Years | 121 (32.1%) | 188 (49.9%) |
| 65 to 74 Years | 576 (100.0%) | 309 (53.6%) |
| 75 Years and over | 349 (100.0%) | 263 (75.4%) |
| Total | 1,627 (59.6%) | 1,177 (43.1%) |
Disability Status by Sex by Age in Real County
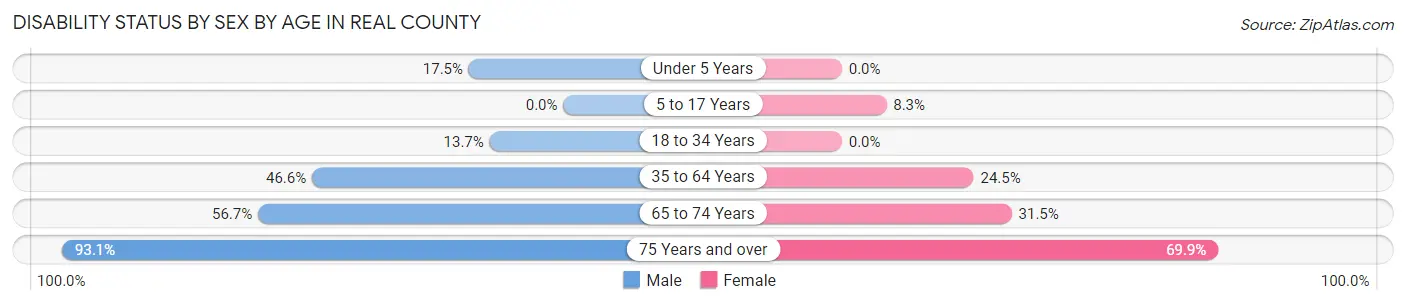
| Age Bracket | Male | Female |
| Under 5 Years | 20 (17.5%) | 0 (0.0%) |
| 5 to 17 Years | 0 (0.0%) | 19 (8.3%) |
| 18 to 34 Years | 23 (13.7%) | 0 (0.0%) |
| 35 to 64 Years | 125 (46.6%) | 114 (24.5%) |
| 65 to 74 Years | 170 (56.7%) | 87 (31.5%) |
| 75 Years and over | 121 (93.1%) | 153 (69.9%) |
Disability Class by Sex by Age in Real County
Disability Class: Hearing Difficulty
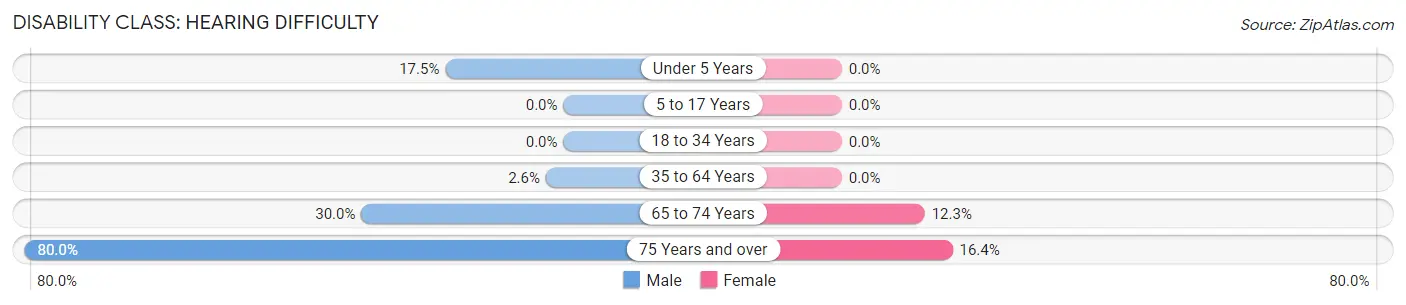
| Age Bracket | Male | Female |
| Under 5 Years | 20 (17.5%) | 0 (0.0%) |
| 5 to 17 Years | 0 (0.0%) | 0 (0.0%) |
| 18 to 34 Years | 0 (0.0%) | 0 (0.0%) |
| 35 to 64 Years | 7 (2.6%) | 0 (0.0%) |
| 65 to 74 Years | 90 (30.0%) | 34 (12.3%) |
| 75 Years and over | 104 (80.0%) | 36 (16.4%) |
Disability Class: Vision Difficulty
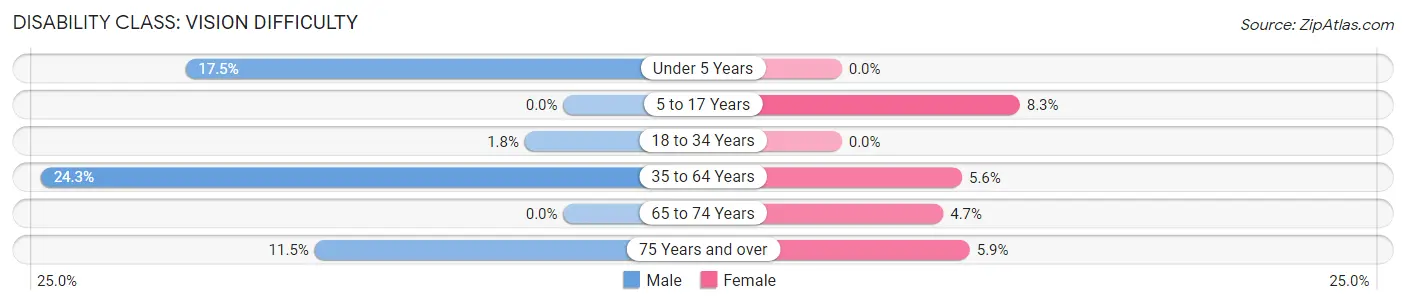
| Age Bracket | Male | Female |
| Under 5 Years | 20 (17.5%) | 0 (0.0%) |
| 5 to 17 Years | 0 (0.0%) | 19 (8.3%) |
| 18 to 34 Years | 3 (1.8%) | 0 (0.0%) |
| 35 to 64 Years | 65 (24.2%) | 26 (5.6%) |
| 65 to 74 Years | 0 (0.0%) | 13 (4.7%) |
| 75 Years and over | 15 (11.5%) | 13 (5.9%) |
Disability Class: Cognitive Difficulty
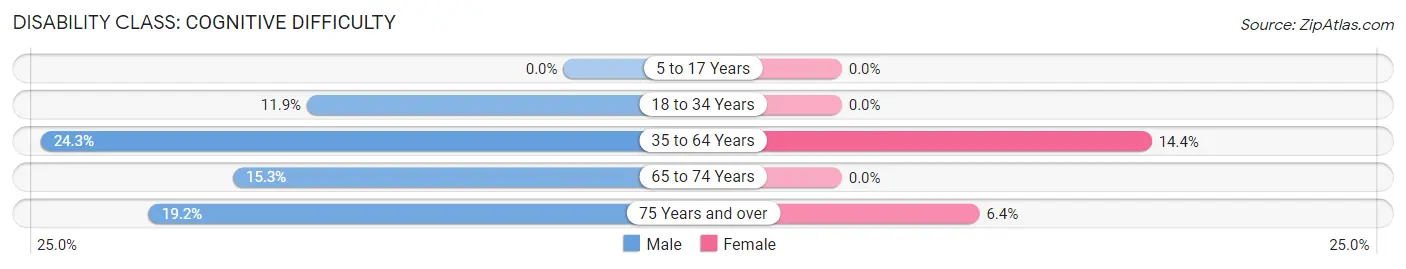
| Age Bracket | Male | Female |
| 5 to 17 Years | 0 (0.0%) | 0 (0.0%) |
| 18 to 34 Years | 20 (11.9%) | 0 (0.0%) |
| 35 to 64 Years | 65 (24.2%) | 67 (14.4%) |
| 65 to 74 Years | 46 (15.3%) | 0 (0.0%) |
| 75 Years and over | 25 (19.2%) | 14 (6.4%) |
Disability Class: Ambulatory Difficulty
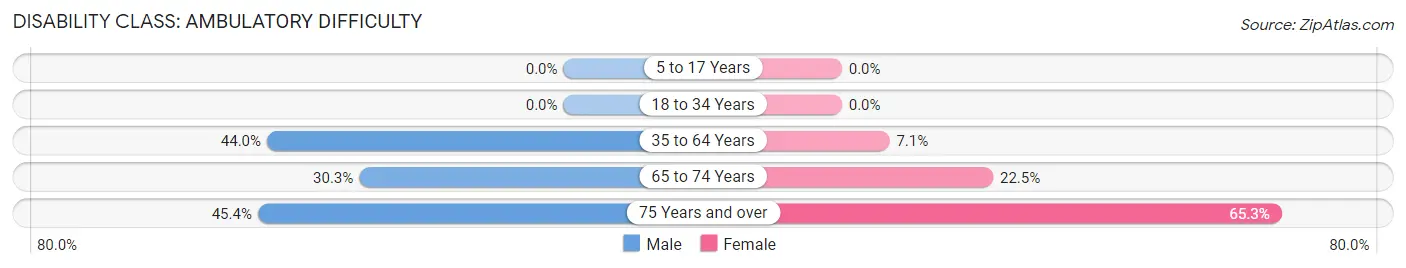
| Age Bracket | Male | Female |
| 5 to 17 Years | 0 (0.0%) | 0 (0.0%) |
| 18 to 34 Years | 0 (0.0%) | 0 (0.0%) |
| 35 to 64 Years | 118 (44.0%) | 33 (7.1%) |
| 65 to 74 Years | 91 (30.3%) | 62 (22.5%) |
| 75 Years and over | 59 (45.4%) | 143 (65.3%) |
Disability Class: Self-Care Difficulty
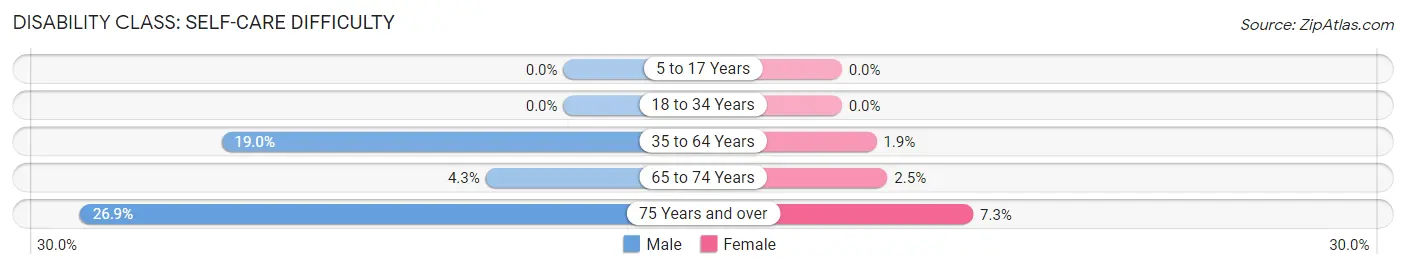
| Age Bracket | Male | Female |
| 5 to 17 Years | 0 (0.0%) | 0 (0.0%) |
| 18 to 34 Years | 0 (0.0%) | 0 (0.0%) |
| 35 to 64 Years | 51 (19.0%) | 9 (1.9%) |
| 65 to 74 Years | 13 (4.3%) | 7 (2.5%) |
| 75 Years and over | 35 (26.9%) | 16 (7.3%) |
Technology Access in Real County
Computing Device Access in Real County
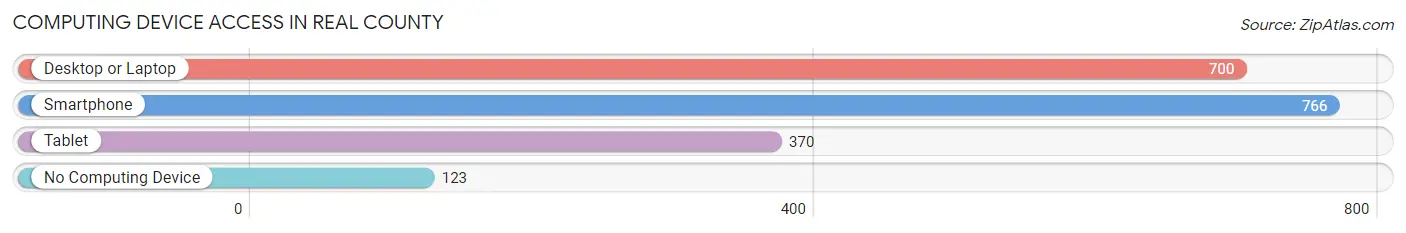
| Device Type | # Households | % Households |
| Desktop or Laptop | 700 | 70.6% |
| Smartphone | 766 | 77.2% |
| Tablet | 370 | 37.3% |
| No Computing Device | 123 | 12.4% |
| Total | 992 | 100.0% |
Internet Access in Real County
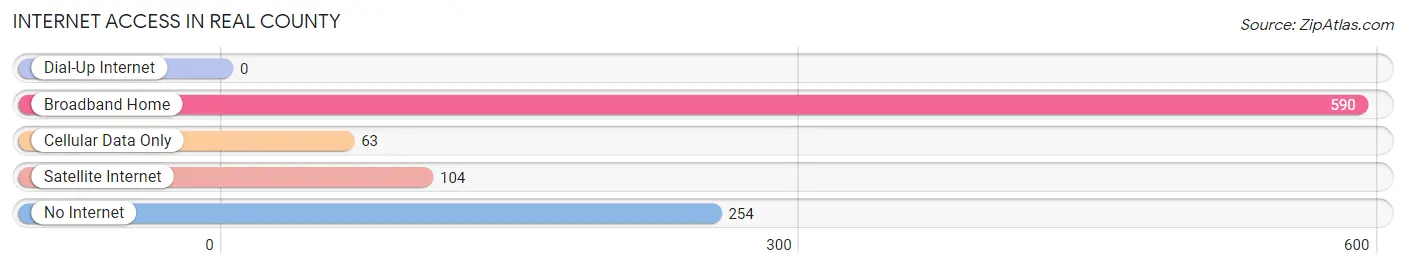
| Internet Type | # Households | % Households |
| Dial-Up Internet | 0 | 0.0% |
| Broadband Home | 590 | 59.5% |
| Cellular Data Only | 63 | 6.4% |
| Satellite Internet | 104 | 10.5% |
| No Internet | 254 | 25.6% |
| Total | 992 | 100.0% |
Real County Summary
Real County is located in the Edwards Plateau region of Texas, and is part of the Hill Country. It is bordered by Edwards, Kerr, Bandera, and Uvalde Counties. The county seat is Leakey, and the county was named after an early settler, John Realy.
Geography
Real County is located in the Edwards Plateau region of Texas, and is part of the Hill Country. It is bordered by Edwards, Kerr, Bandera, and Uvalde Counties. The county covers an area of 1,077 square miles, and is mostly hilly and rugged terrain. The Frio River runs through the county, and is a popular destination for recreational activities such as fishing, swimming, and tubing. The county is also home to Garner State Park, which is a popular destination for camping, hiking, and other outdoor activities.
Economy
Real County’s economy is largely based on agriculture and tourism. The county is home to several large ranches, and the main agricultural products are cattle, sheep, goats, and hay. Tourism is also a major industry in the county, as it is home to Garner State Park, which attracts thousands of visitors each year. Other popular tourist attractions in the county include the Frio River, Lost Maples State Natural Area, and the Hill Country State Natural Area.
Demographics
As of the 2010 census, Real County had a population of 3,309. The population was spread out with 28.2% under the age of 18, 8.2% from 18 to 24, 24.2% from 25 to 44, 28.2% from 45 to 64, and 11.2% who were 65 years of age or older. The median age was 38.4 years. The median income for a household in the county was $37,917, and the median income for a family was $45,000.
Real County is a predominantly rural area, and the population is largely white. The racial makeup of the county was 95.2% White, 0.3% African American, 0.7% Native American, 0.2% Asian, 0.1% Pacific Islander, 2.3% from other races, and 1.3% from two or more races. Hispanic or Latino of any race were 8.2% of the population.
Conclusion
Real County is a rural county located in the Edwards Plateau region of Texas. It is bordered by Edwards, Kerr, Bandera, and Uvalde Counties, and is home to Garner State Park. The county’s economy is largely based on agriculture and tourism, and the population is largely white. The median income for a household in the county was $37,917, and the median income for a family was $45,000. Real County is a popular destination for outdoor activities, and is a great place to live and work.
Common Questions
What is Per Capita Income in Real County?
Per Capita income in Real County is $22,725.
What is the Median Family Income in Real County?
Median Family Income in Real County is $59,583.
What is the Median Household income in Real County?
Median Household Income in Real County is $46,842.
What is Income or Wage Gap in Real County?
Income or Wage Gap in Real County is 32.5%.
Women in Real County earn 67.5 cents for every dollar earned by a man.
What is Inequality or Gini Index in Real County?
Inequality or Gini Index in Real County is 0.48.
What is the Total Population of Real County?
Total Population of Real County is 2,830.
What is the Total Male Population of Real County?
Total Male Population of Real County is 1,324.
What is the Total Female Population of Real County?
Total Female Population of Real County is 1,506.
What is the Ratio of Males per 100 Females in Real County?
There are 87.92 Males per 100 Females in Real County.
What is the Ratio of Females per 100 Males in Real County?
There are 113.75 Females per 100 Males in Real County.
What is the Median Population Age in Real County?
Median Population Age in Real County is 52.3 Years.
What is the Average Family Size in Real County
Average Family Size in Real County is 3.0 People.
What is the Average Household Size in Real County
Average Household Size in Real County is 2.7 People.
How Large is the Labor Force in Real County?
There are 770 People in the Labor Forcein in Real County.
What is the Percentage of People in the Labor Force in Real County?
34.0% of People are in the Labor Force in Real County.
What is the Unemployment Rate in Real County?
Unemployment Rate in Real County is 1.6%.