Reagan County, TX Map & Demographics
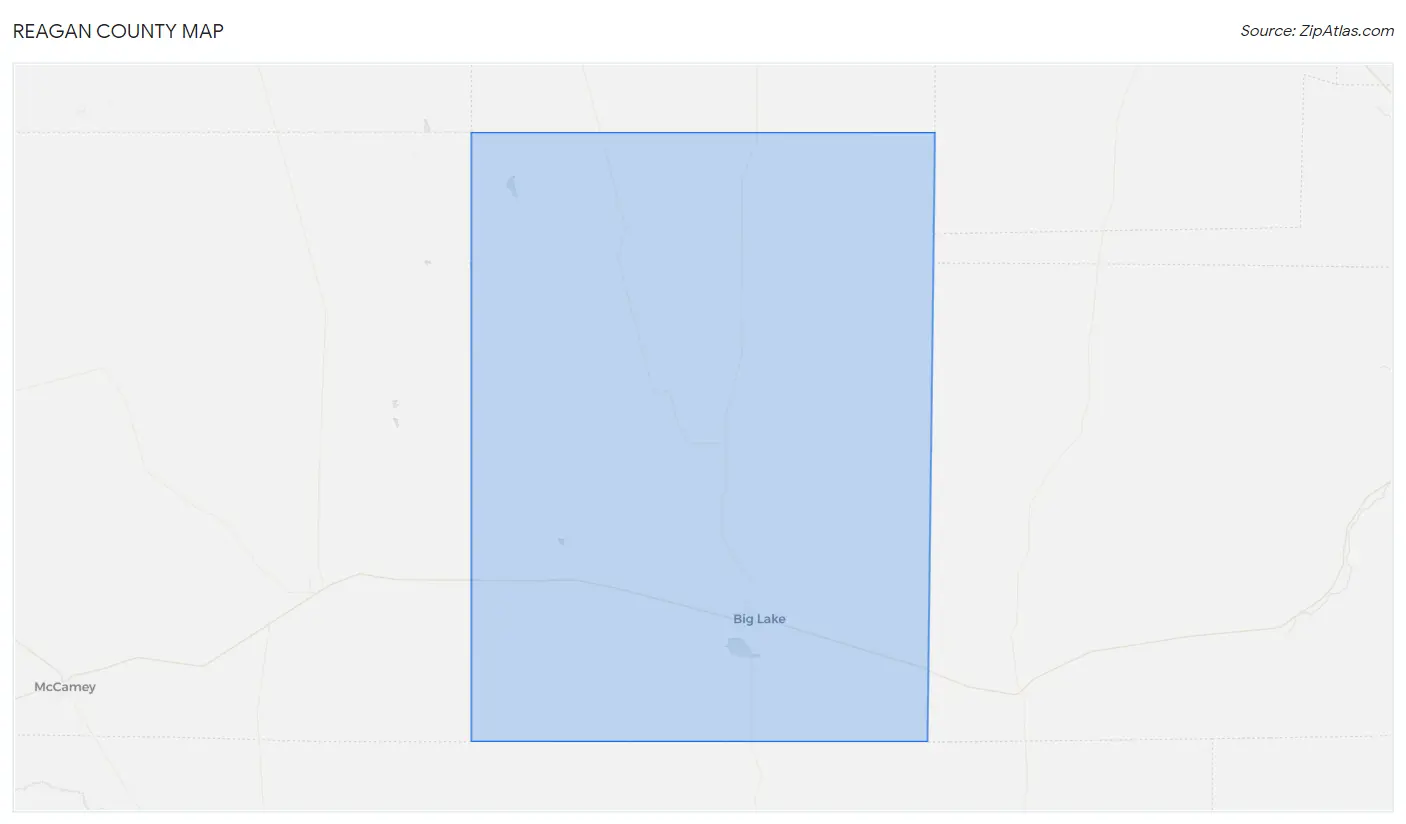
Reagan County Map
Reagan County Overview
$28,765
PER CAPITA INCOME
$79,000
AVG FAMILY INCOME
$70,319
AVG HOUSEHOLD INCOME
32.7%
WAGE / INCOME GAP [ % ]
67.3¢/ $1
WAGE / INCOME GAP [ $ ]
$5,960
FAMILY INCOME DEFICIT
0.36
INEQUALITY / GINI INDEX
3,308
TOTAL POPULATION
1,697
MALE POPULATION
1,611
FEMALE POPULATION
105.34
MALES / 100 FEMALES
94.93
FEMALES / 100 MALES
33.0
MEDIAN AGE
3.4
AVG FAMILY SIZE
3.0
AVG HOUSEHOLD SIZE
1,719
LABOR FORCE [ PEOPLE ]
72.6%
PERCENT IN LABOR FORCE
8.7%
UNEMPLOYMENT RATE
Reagan County Area Codes
Income in Reagan County
Income Overview in Reagan County
Per Capita Income in Reagan County is $28,765, while median incomes of families and households are $79,000 and $70,319 respectively.
| Characteristic | Number | Measure |
| Per Capita Income | 3,308 | $28,765 |
| Median Family Income | 898 | $79,000 |
| Mean Family Income | 898 | $90,881 |
| Median Household Income | 1,090 | $70,319 |
| Mean Household Income | 1,090 | $83,863 |
| Income Deficit | 898 | $5,960 |
| Wage / Income Gap (%) | 3,308 | 32.70% |
| Wage / Income Gap ($) | 3,308 | 67.30¢ per $1 |
| Gini / Inequality Index | 3,308 | 0.36 |
Earnings by Sex in Reagan County
Average Earnings in Reagan County are $43,986, $49,384 for men and $33,234 for women, a difference of 32.7%.
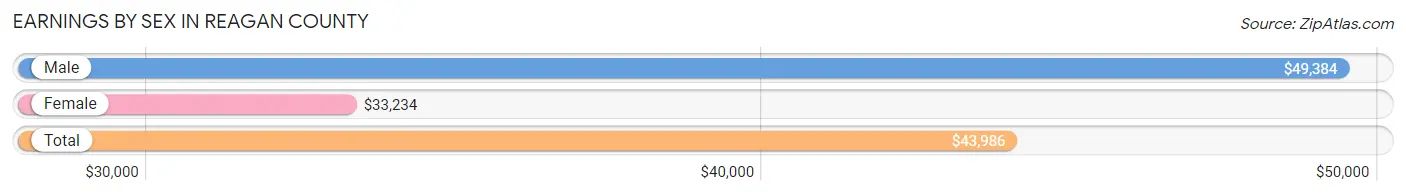
| Sex | Number | Average Earnings |
| Male | 1,035 (60.5%) | $49,384 |
| Female | 675 (39.5%) | $33,234 |
| Total | 1,710 (100.0%) | $43,986 |
Earnings by Sex by Income Bracket in Reagan County
The most common earnings brackets in Reagan County are $100,000+ for men (155 | 15.0%) and $55,000 to $64,999 for women (99 | 14.7%).
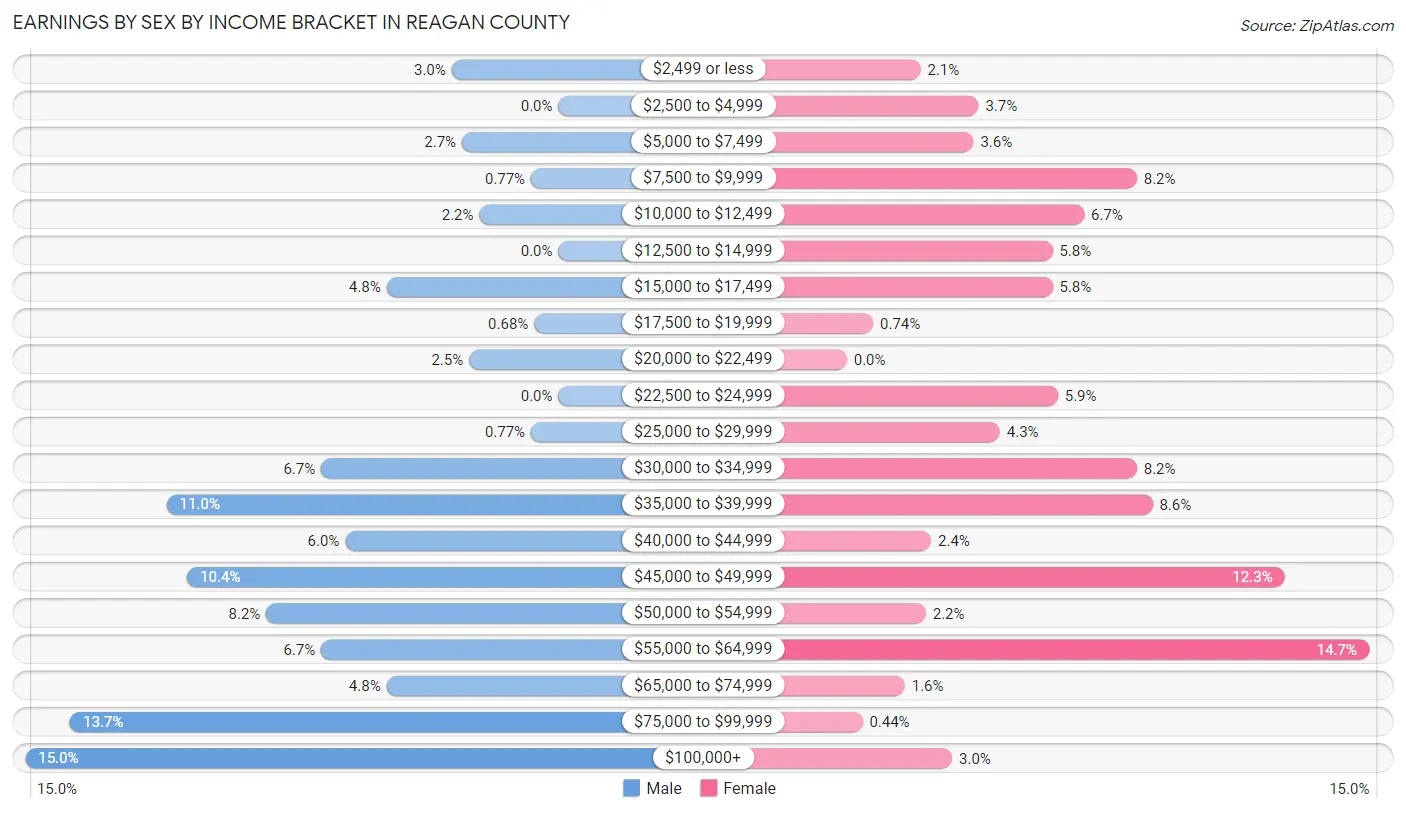
| Income | Male | Female |
| $2,499 or less | 31 (3.0%) | 14 (2.1%) |
| $2,500 to $4,999 | 0 (0.0%) | 25 (3.7%) |
| $5,000 to $7,499 | 28 (2.7%) | 24 (3.6%) |
| $7,500 to $9,999 | 8 (0.8%) | 55 (8.2%) |
| $10,000 to $12,499 | 23 (2.2%) | 45 (6.7%) |
| $12,500 to $14,999 | 0 (0.0%) | 39 (5.8%) |
| $15,000 to $17,499 | 50 (4.8%) | 39 (5.8%) |
| $17,500 to $19,999 | 7 (0.7%) | 5 (0.7%) |
| $20,000 to $22,499 | 26 (2.5%) | 0 (0.0%) |
| $22,500 to $24,999 | 0 (0.0%) | 40 (5.9%) |
| $25,000 to $29,999 | 8 (0.8%) | 29 (4.3%) |
| $30,000 to $34,999 | 69 (6.7%) | 55 (8.2%) |
| $35,000 to $39,999 | 114 (11.0%) | 58 (8.6%) |
| $40,000 to $44,999 | 62 (6.0%) | 16 (2.4%) |
| $45,000 to $49,999 | 108 (10.4%) | 83 (12.3%) |
| $50,000 to $54,999 | 85 (8.2%) | 15 (2.2%) |
| $55,000 to $64,999 | 69 (6.7%) | 99 (14.7%) |
| $65,000 to $74,999 | 50 (4.8%) | 11 (1.6%) |
| $75,000 to $99,999 | 142 (13.7%) | 3 (0.4%) |
| $100,000+ | 155 (15.0%) | 20 (3.0%) |
| Total | 1,035 (100.0%) | 675 (100.0%) |
Earnings by Sex by Educational Attainment in Reagan County
Average earnings in Reagan County are $50,500 for men and $37,737 for women, a difference of 25.3%. Men with an educational attainment of bachelor's degree enjoy the highest average annual earnings of $120,385, while those with college or associate's degree education earn the least with $40,556. Women with an educational attainment of bachelor's degree earn the most with the average annual earnings of $63,409, while those with high school diploma education have the smallest earnings of $24,943.
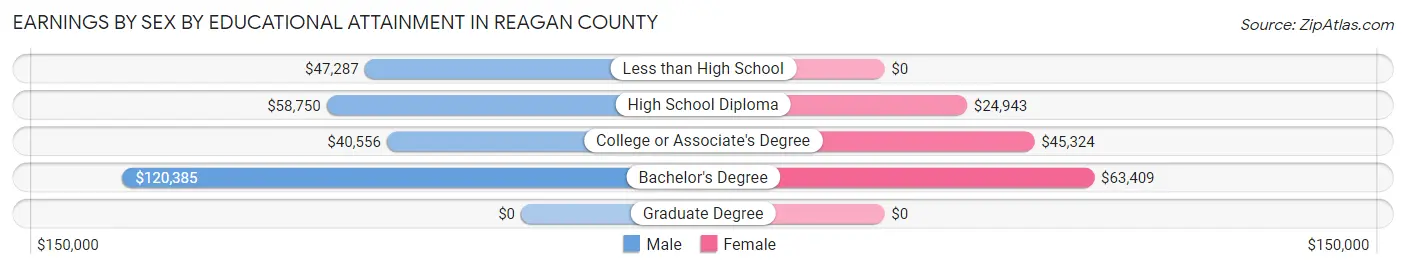
| Educational Attainment | Male Income | Female Income |
| Less than High School | $47,287 | $0 |
| High School Diploma | $58,750 | $24,943 |
| College or Associate's Degree | $40,556 | $45,324 |
| Bachelor's Degree | $120,385 | $63,409 |
| Graduate Degree | - | - |
| Total | $50,500 | $37,737 |
Family Income in Reagan County
Family Income Brackets in Reagan County
According to the Reagan County family income data, there are 231 families falling into the $75,000 to $99,999 income range, which is the most common income bracket and makes up 25.7% of all families.
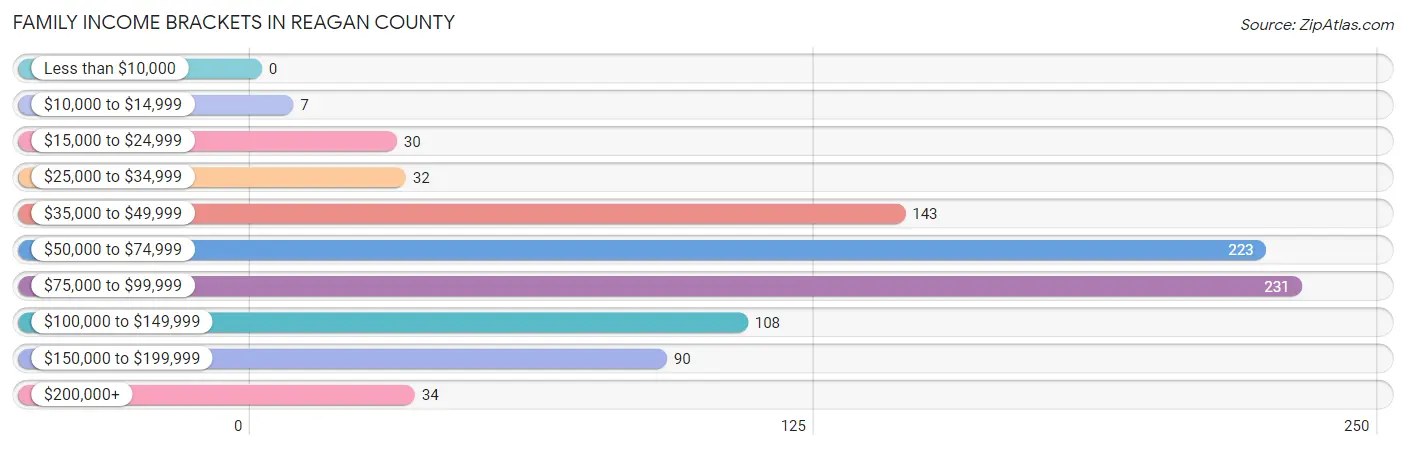
| Income Bracket | # Families | % Families |
| Less than $10,000 | 0 | 0.0% |
| $10,000 to $14,999 | 7 | 0.8% |
| $15,000 to $24,999 | 30 | 3.3% |
| $25,000 to $34,999 | 32 | 3.6% |
| $35,000 to $49,999 | 143 | 15.9% |
| $50,000 to $74,999 | 223 | 24.8% |
| $75,000 to $99,999 | 231 | 25.7% |
| $100,000 to $149,999 | 108 | 12.0% |
| $150,000 to $199,999 | 90 | 10.0% |
| $200,000+ | 34 | 3.8% |
Family Income by Famaliy Size in Reagan County
2-person families (291 | 32.4%) account for the highest median family income in Reagan County with $95,341 per family, while 2-person families (291 | 32.4%) have the highest median income of $47,670 per family member.
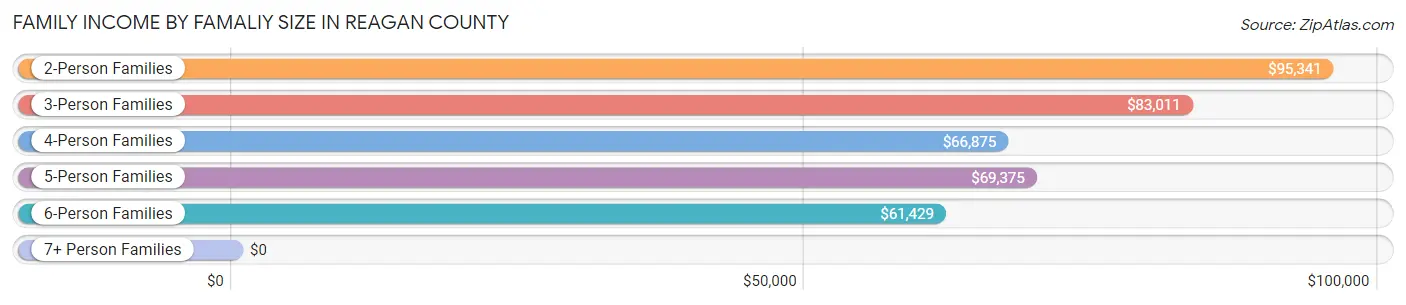
| Income Bracket | # Families | Median Income |
| 2-Person Families | 291 (32.4%) | $95,341 |
| 3-Person Families | 221 (24.6%) | $83,011 |
| 4-Person Families | 263 (29.3%) | $66,875 |
| 5-Person Families | 61 (6.8%) | $69,375 |
| 6-Person Families | 60 (6.7%) | $61,429 |
| 7+ Person Families | 2 (0.2%) | $0 |
| Total | 898 (100.0%) | $79,000 |
Family Income by Number of Earners in Reagan County
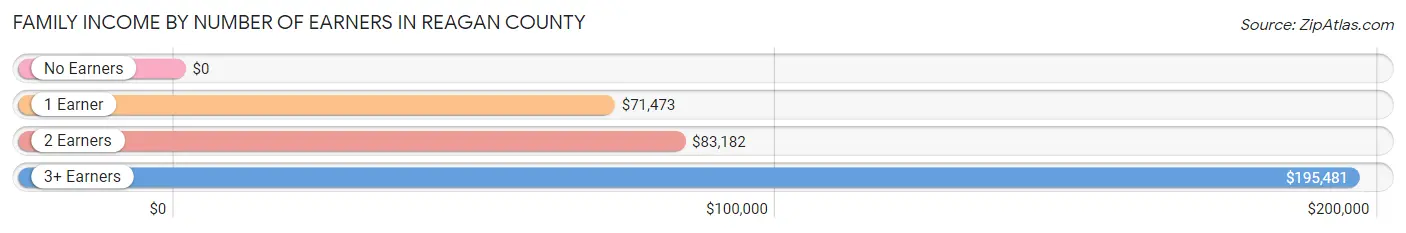
| Number of Earners | # Families | Median Income |
| No Earners | 42 (4.7%) | $0 |
| 1 Earner | 311 (34.6%) | $71,473 |
| 2 Earners | 470 (52.3%) | $83,182 |
| 3+ Earners | 75 (8.4%) | $195,481 |
| Total | 898 (100.0%) | $79,000 |
Household Income in Reagan County
Household Income Brackets in Reagan County
With 235 households falling in the category, the $50,000 to $74,999 income range is the most frequent in Reagan County, accounting for 21.6% of all households. In contrast, only 7 households (0.6%) fall into the $10,000 to $14,999 income bracket, making it the least populous group.
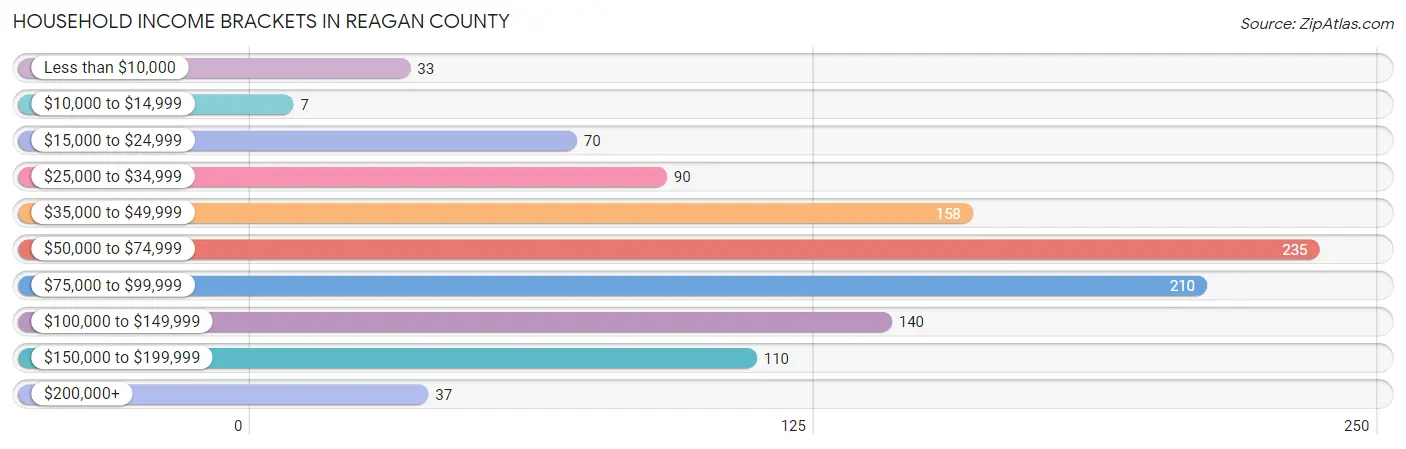
| Income Bracket | # Households | % Households |
| Less than $10,000 | 33 | 3.0% |
| $10,000 to $14,999 | 7 | 0.6% |
| $15,000 to $24,999 | 70 | 6.4% |
| $25,000 to $34,999 | 90 | 8.3% |
| $35,000 to $49,999 | 158 | 14.5% |
| $50,000 to $74,999 | 235 | 21.6% |
| $75,000 to $99,999 | 210 | 19.3% |
| $100,000 to $149,999 | 140 | 12.8% |
| $150,000 to $199,999 | 110 | 10.1% |
| $200,000+ | 37 | 3.4% |
Household Income by Householder Age in Reagan County
The median household income in Reagan County is $70,319, with the highest median household income of $93,882 found in the 45 to 64 years age bracket for the primary householder. A total of 319 households (29.3%) fall into this category. Meanwhile, the 15 to 24 years age bracket for the primary householder has the lowest median household income of $42,727, with 48 households (4.4%) in this group.
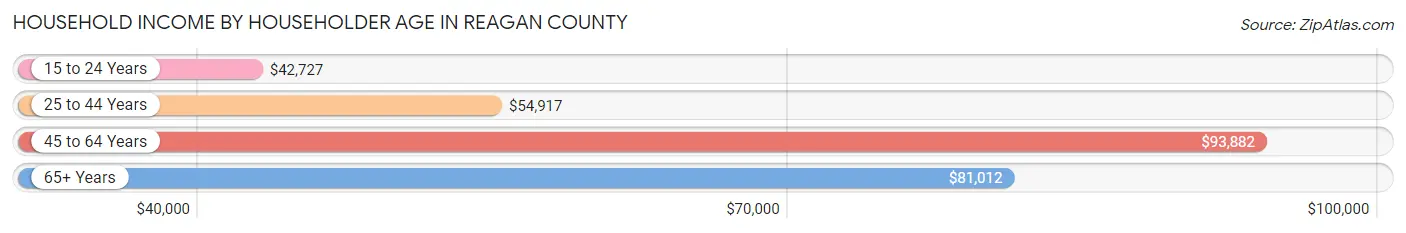
| Income Bracket | # Households | Median Income |
| 15 to 24 Years | 48 (4.4%) | $42,727 |
| 25 to 44 Years | 546 (50.1%) | $54,917 |
| 45 to 64 Years | 319 (29.3%) | $93,882 |
| 65+ Years | 177 (16.2%) | $81,012 |
| Total | 1,090 (100.0%) | $70,319 |
Poverty in Reagan County
Income Below Poverty by Sex and Age in Reagan County
With 7.2% poverty level for males and 7.2% for females among the residents of Reagan County, under 5 year old males and 65 to 74 year old females are the most vulnerable to poverty, with 19 males (16.8%) and 17 females (37.0%) in their respective age groups living below the poverty level.
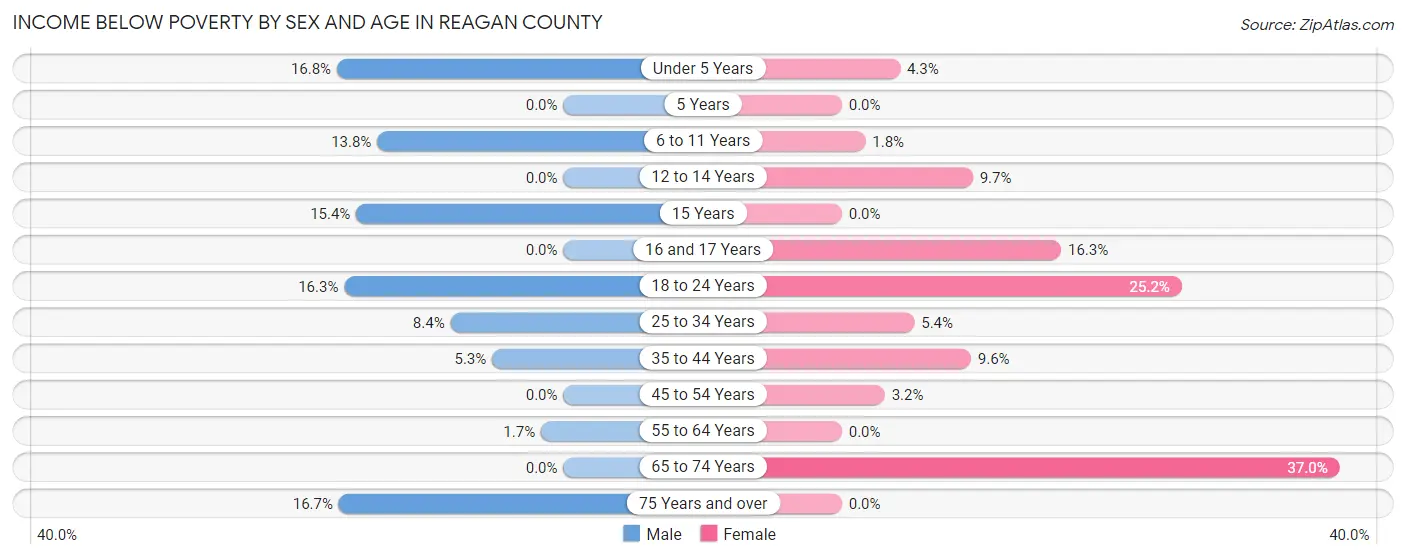
| Age Bracket | Male | Female |
| Under 5 Years | 19 (16.8%) | 8 (4.3%) |
| 5 Years | 0 (0.0%) | 0 (0.0%) |
| 6 to 11 Years | 21 (13.8%) | 4 (1.8%) |
| 12 to 14 Years | 0 (0.0%) | 7 (9.7%) |
| 15 Years | 4 (15.4%) | 0 (0.0%) |
| 16 and 17 Years | 0 (0.0%) | 7 (16.3%) |
| 18 to 24 Years | 34 (16.3%) | 28 (25.2%) |
| 25 to 34 Years | 14 (8.4%) | 15 (5.4%) |
| 35 to 44 Years | 18 (5.3%) | 23 (9.6%) |
| 45 to 54 Years | 0 (0.0%) | 6 (3.2%) |
| 55 to 64 Years | 3 (1.7%) | 0 (0.0%) |
| 65 to 74 Years | 0 (0.0%) | 17 (37.0%) |
| 75 Years and over | 8 (16.7%) | 0 (0.0%) |
| Total | 121 (7.2%) | 115 (7.2%) |
Income Above Poverty by Sex and Age in Reagan County
According to the poverty statistics in Reagan County, males aged 5 years and females aged 5 years are the age groups that are most secure financially, with 100.0% of males and 100.0% of females in these age groups living above the poverty line.
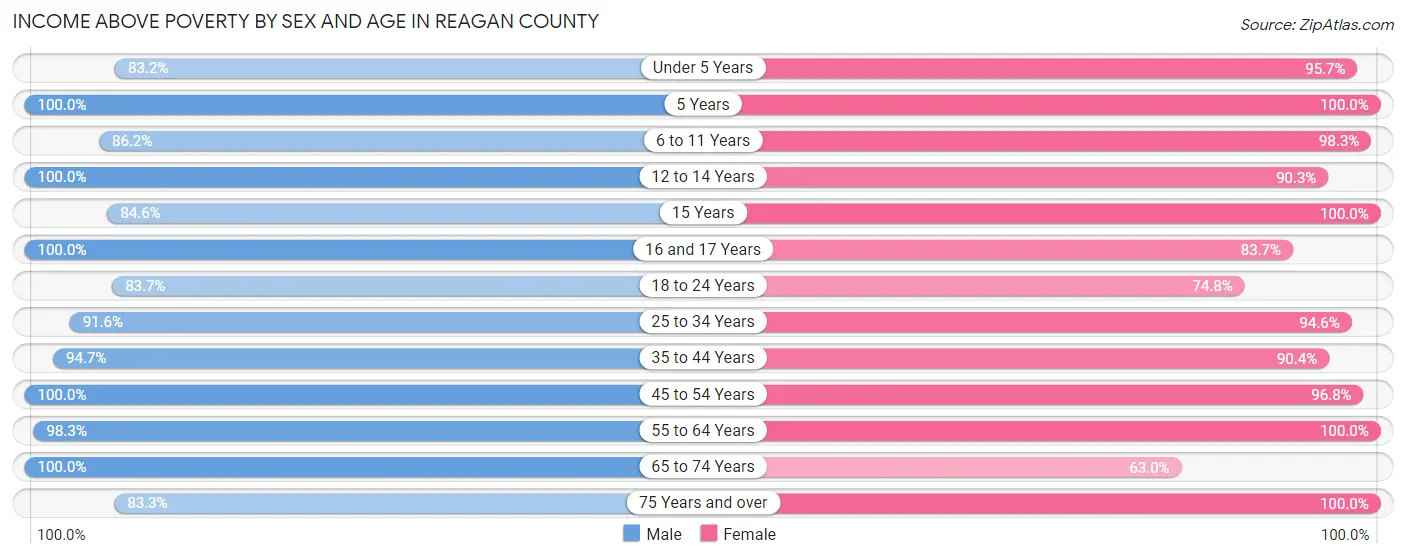
| Age Bracket | Male | Female |
| Under 5 Years | 94 (83.2%) | 177 (95.7%) |
| 5 Years | 10 (100.0%) | 4 (100.0%) |
| 6 to 11 Years | 131 (86.2%) | 224 (98.3%) |
| 12 to 14 Years | 135 (100.0%) | 65 (90.3%) |
| 15 Years | 22 (84.6%) | 15 (100.0%) |
| 16 and 17 Years | 19 (100.0%) | 36 (83.7%) |
| 18 to 24 Years | 175 (83.7%) | 83 (74.8%) |
| 25 to 34 Years | 153 (91.6%) | 264 (94.6%) |
| 35 to 44 Years | 322 (94.7%) | 217 (90.4%) |
| 45 to 54 Years | 155 (100.0%) | 182 (96.8%) |
| 55 to 64 Years | 178 (98.3%) | 159 (100.0%) |
| 65 to 74 Years | 134 (100.0%) | 29 (63.0%) |
| 75 Years and over | 40 (83.3%) | 25 (100.0%) |
| Total | 1,568 (92.8%) | 1,480 (92.8%) |
Income Below Poverty Among Married-Couple Families in Reagan County
The poverty statistics for married-couple families in Reagan County show that 3.9% or 27 of the total 688 families live below the poverty line. Families with 3 or 4 children have the highest poverty rate of 14.5%, comprising of 10 families. On the other hand, families with 5 or more children have the lowest poverty rate of 0.0%, which includes 0 families.
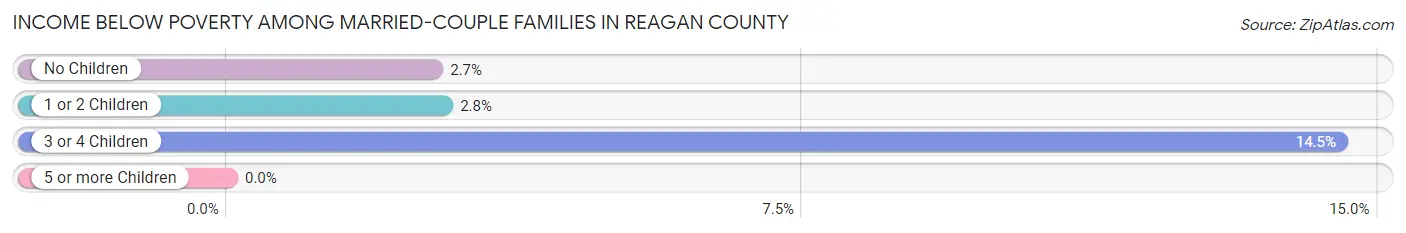
| Children | Above Poverty | Below Poverty |
| No Children | 254 (97.3%) | 7 (2.7%) |
| 1 or 2 Children | 346 (97.2%) | 10 (2.8%) |
| 3 or 4 Children | 59 (85.5%) | 10 (14.5%) |
| 5 or more Children | 2 (100.0%) | 0 (0.0%) |
| Total | 661 (96.1%) | 27 (3.9%) |
Income Below Poverty Among Single-Parent Households in Reagan County
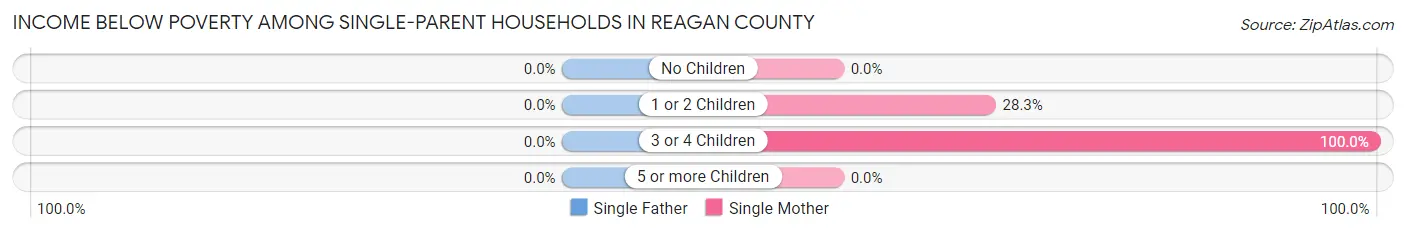
| Children | Single Father | Single Mother |
| No Children | 0 (0.0%) | 0 (0.0%) |
| 1 or 2 Children | 0 (0.0%) | 15 (28.3%) |
| 3 or 4 Children | 0 (0.0%) | 5 (100.0%) |
| 5 or more Children | 0 (0.0%) | 0 (0.0%) |
| Total | 0 (0.0%) | 20 (25.0%) |
Income Below Poverty Among Married-Couple vs Single-Parent Households in Reagan County
The poverty data for Reagan County shows that 27 of the married-couple family households (3.9%) and 20 of the single-parent households (9.5%) are living below the poverty level. Within the married-couple family households, those with 3 or 4 children have the highest poverty rate, with 10 households (14.5%) falling below the poverty line. Among the single-parent households, those with 3 or 4 children have the highest poverty rate, with 5 household (100.0%) living below poverty.
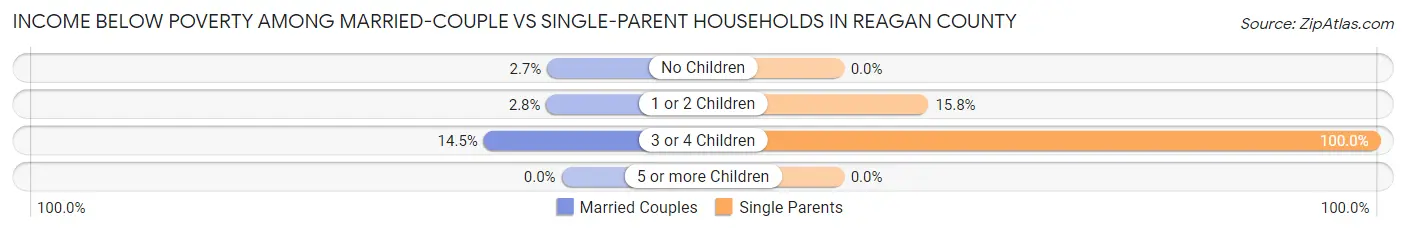
| Children | Married-Couple Families | Single-Parent Households |
| No Children | 7 (2.7%) | 0 (0.0%) |
| 1 or 2 Children | 10 (2.8%) | 15 (15.8%) |
| 3 or 4 Children | 10 (14.5%) | 5 (100.0%) |
| 5 or more Children | 0 (0.0%) | 0 (0.0%) |
| Total | 27 (3.9%) | 20 (9.5%) |
Race in Reagan County
The most populous races in Reagan County are Hispanic or Latino (2,340 | 70.7%), White / Caucasian (1,572 | 47.5%), and Some other Race (1,072 | 32.4%).
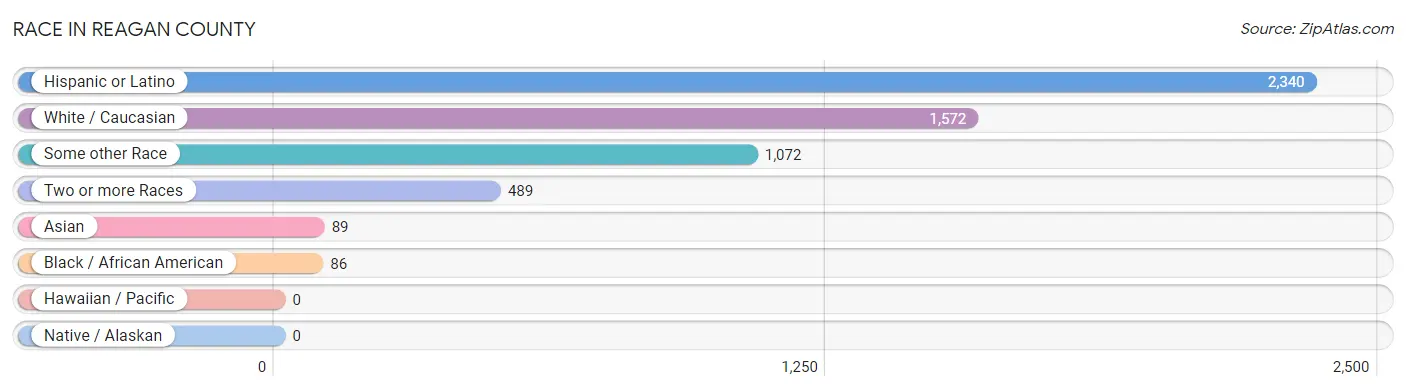
| Race | # Population | % Population |
| Asian | 89 | 2.7% |
| Black / African American | 86 | 2.6% |
| Hawaiian / Pacific | 0 | 0.0% |
| Hispanic or Latino | 2,340 | 70.7% |
| Native / Alaskan | 0 | 0.0% |
| White / Caucasian | 1,572 | 47.5% |
| Two or more Races | 489 | 14.8% |
| Some other Race | 1,072 | 32.4% |
| Total | 3,308 | 100.0% |
Ancestry in Reagan County
The most populous ancestries reported in Reagan County are Mexican (2,225 | 67.3%), English (160 | 4.8%), American (62 | 1.9%), German (40 | 1.2%), and Irish (40 | 1.2%), together accounting for 76.4% of all Reagan County residents.
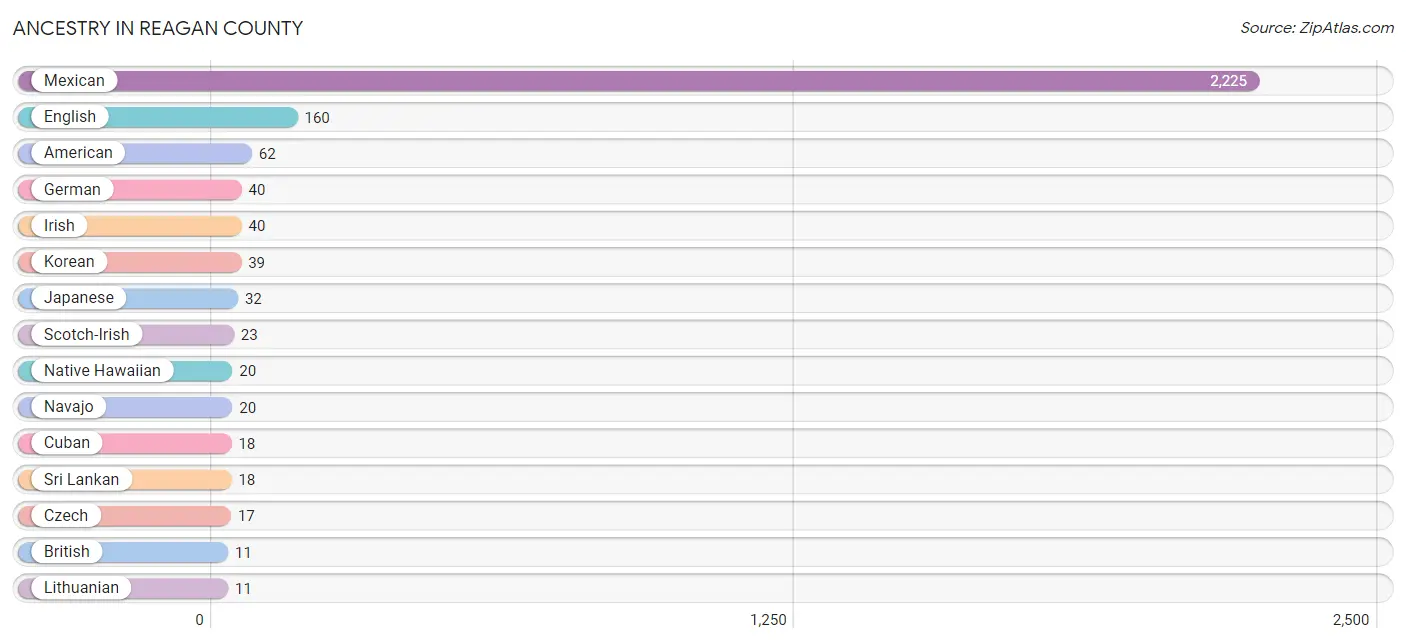
| Ancestry | # Population | % Population |
| American | 62 | 1.9% |
| British | 11 | 0.3% |
| Cuban | 18 | 0.5% |
| Czech | 17 | 0.5% |
| Dutch | 8 | 0.2% |
| English | 160 | 4.8% |
| European | 5 | 0.2% |
| Finnish | 4 | 0.1% |
| German | 40 | 1.2% |
| Irish | 40 | 1.2% |
| Japanese | 32 | 1.0% |
| Korean | 39 | 1.2% |
| Lithuanian | 11 | 0.3% |
| Mexican | 2,225 | 67.3% |
| Native Hawaiian | 20 | 0.6% |
| Navajo | 20 | 0.6% |
| Scotch-Irish | 23 | 0.7% |
| Scottish | 3 | 0.1% |
| Sri Lankan | 18 | 0.5% | View All 19 Rows |
Immigrants in Reagan County
The most numerous immigrant groups reported in Reagan County came from Latin America (340 | 10.3%), Central America (320 | 9.7%), Mexico (299 | 9.0%), Asia (71 | 2.1%), and South Eastern Asia (71 | 2.1%), together accounting for 33.3% of all Reagan County residents.
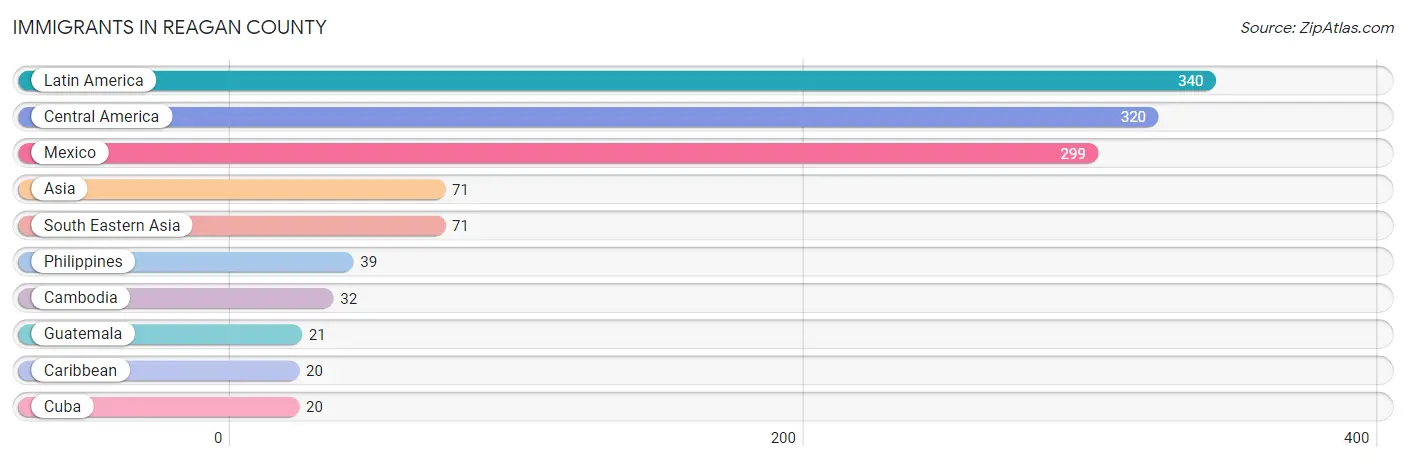
| Immigration Origin | # Population | % Population |
| Asia | 71 | 2.1% |
| Cambodia | 32 | 1.0% |
| Caribbean | 20 | 0.6% |
| Central America | 320 | 9.7% |
| Cuba | 20 | 0.6% |
| Guatemala | 21 | 0.6% |
| Latin America | 340 | 10.3% |
| Mexico | 299 | 9.0% |
| Philippines | 39 | 1.2% |
| South Eastern Asia | 71 | 2.1% | View All 10 Rows |
Sex and Age in Reagan County
Sex and Age in Reagan County
The most populous age groups in Reagan County are 40 to 44 Years (288 | 17.0%) for men and Under 5 Years (185 | 11.5%) for women.
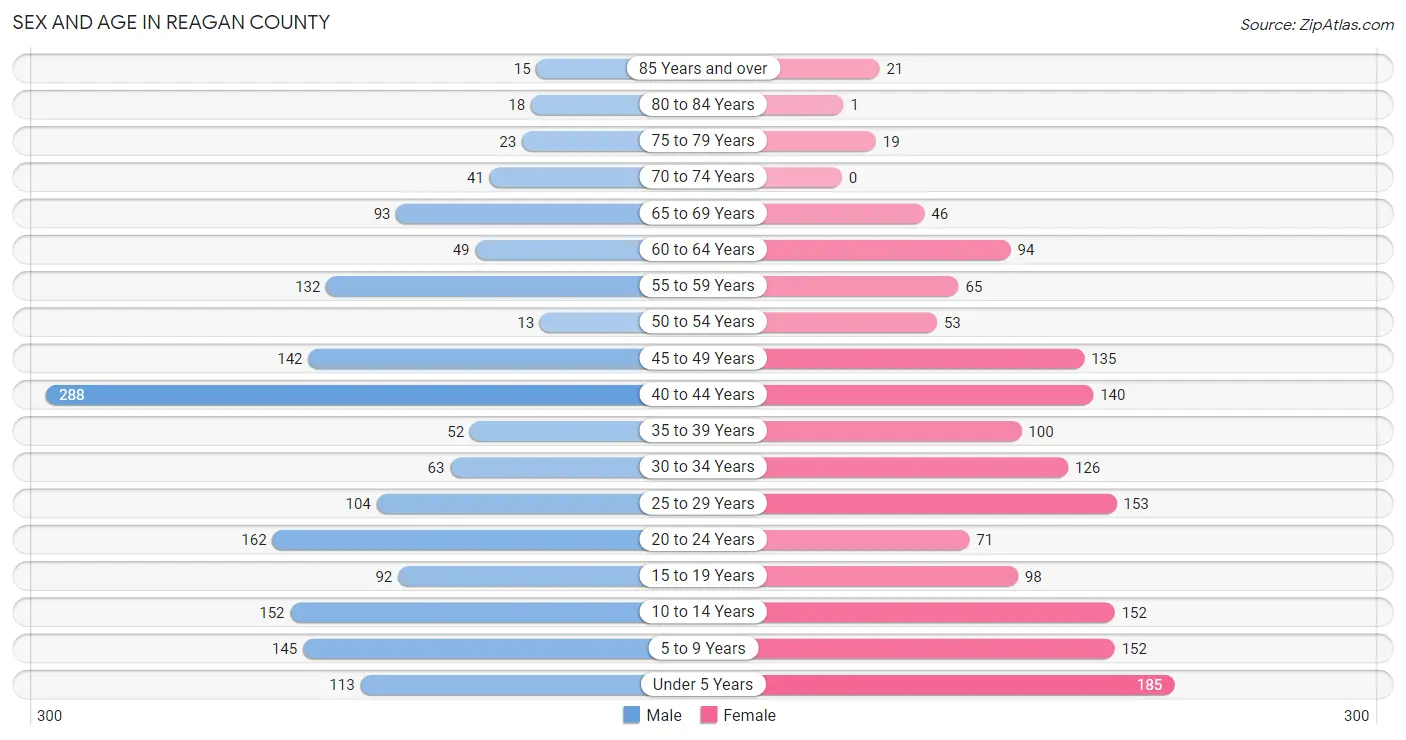
| Age Bracket | Male | Female |
| Under 5 Years | 113 (6.7%) | 185 (11.5%) |
| 5 to 9 Years | 145 (8.5%) | 152 (9.4%) |
| 10 to 14 Years | 152 (9.0%) | 152 (9.4%) |
| 15 to 19 Years | 92 (5.4%) | 98 (6.1%) |
| 20 to 24 Years | 162 (9.6%) | 71 (4.4%) |
| 25 to 29 Years | 104 (6.1%) | 153 (9.5%) |
| 30 to 34 Years | 63 (3.7%) | 126 (7.8%) |
| 35 to 39 Years | 52 (3.1%) | 100 (6.2%) |
| 40 to 44 Years | 288 (17.0%) | 140 (8.7%) |
| 45 to 49 Years | 142 (8.4%) | 135 (8.4%) |
| 50 to 54 Years | 13 (0.8%) | 53 (3.3%) |
| 55 to 59 Years | 132 (7.8%) | 65 (4.0%) |
| 60 to 64 Years | 49 (2.9%) | 94 (5.8%) |
| 65 to 69 Years | 93 (5.5%) | 46 (2.9%) |
| 70 to 74 Years | 41 (2.4%) | 0 (0.0%) |
| 75 to 79 Years | 23 (1.4%) | 19 (1.2%) |
| 80 to 84 Years | 18 (1.1%) | 1 (0.1%) |
| 85 Years and over | 15 (0.9%) | 21 (1.3%) |
| Total | 1,697 (100.0%) | 1,611 (100.0%) |
Families and Households in Reagan County
Median Family Size in Reagan County
The median family size in Reagan County is 3.41 persons per family, with married-couple families (688 | 76.6%) accounting for the largest median family size of 3.63 persons per family. On the other hand, single male/father families (130 | 14.5%) represent the smallest median family size with 2.66 persons per family.
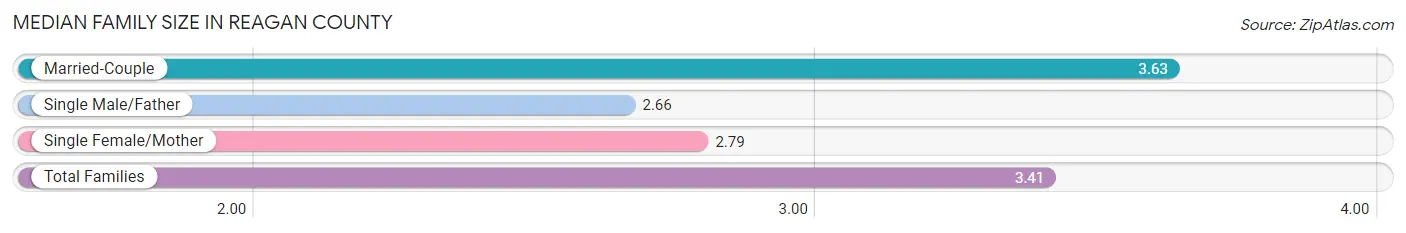
| Family Type | # Families | Family Size |
| Married-Couple | 688 (76.6%) | 3.63 |
| Single Male/Father | 130 (14.5%) | 2.66 |
| Single Female/Mother | 80 (8.9%) | 2.79 |
| Total Families | 898 (100.0%) | 3.41 |
Median Household Size in Reagan County
The median household size in Reagan County is 3.01 persons per household, with married-couple households (688 | 63.1%) accounting for the largest median household size of 3.63 persons per household. non-family households (192 | 17.6%) represent the smallest median household size with 1.02 persons per household.
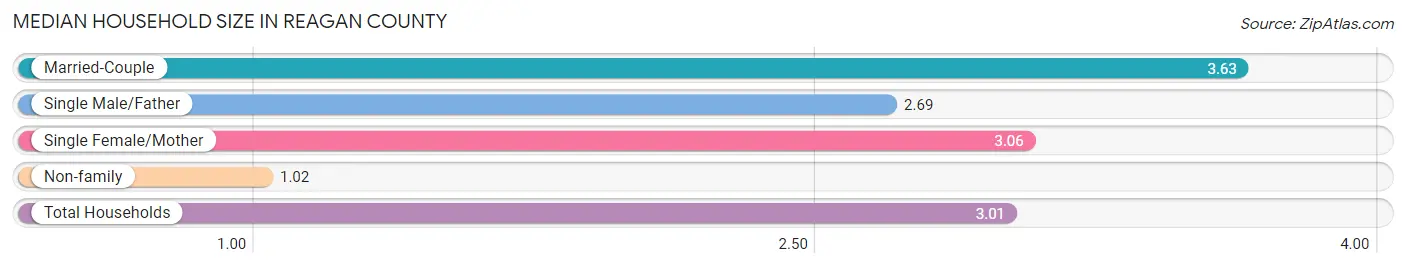
| Household Type | # Households | Household Size |
| Married-Couple | 688 (63.1%) | 3.63 |
| Single Male/Father | 130 (11.9%) | 2.69 |
| Single Female/Mother | 80 (7.3%) | 3.06 |
| Non-family | 192 (17.6%) | 1.02 |
| Total Households | 1,090 (100.0%) | 3.01 |
Household Size by Marriage Status in Reagan County
Out of a total of 1,090 households in Reagan County, 898 (82.4%) are family households, while 192 (17.6%) are nonfamily households. The most numerous type of family households are 2-person households, comprising 262, and the most common type of nonfamily households are 1-person households, comprising 189.
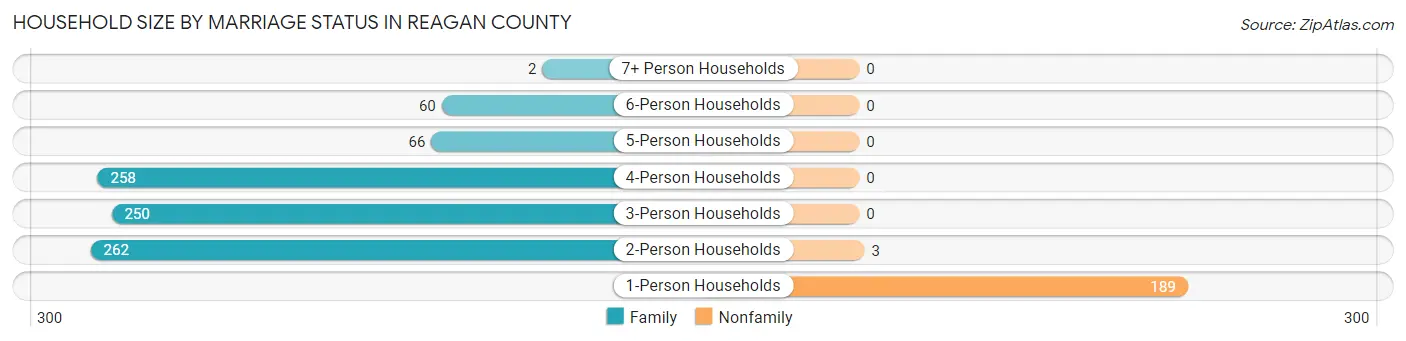
| Household Size | Family Households | Nonfamily Households |
| 1-Person Households | - | 189 (17.3%) |
| 2-Person Households | 262 (24.0%) | 3 (0.3%) |
| 3-Person Households | 250 (22.9%) | 0 (0.0%) |
| 4-Person Households | 258 (23.7%) | 0 (0.0%) |
| 5-Person Households | 66 (6.1%) | 0 (0.0%) |
| 6-Person Households | 60 (5.5%) | 0 (0.0%) |
| 7+ Person Households | 2 (0.2%) | 0 (0.0%) |
| Total | 898 (82.4%) | 192 (17.6%) |
Female Fertility in Reagan County
Fertility by Age in Reagan County
Average fertility rate in Reagan County is 73.0 births per 1,000 women. Women in the age bracket of 15 to 19 years have the highest fertility rate with 133.0 births per 1,000 women. Women in the age bracket of 20 to 34 years acount for 52.5% of all women with births.
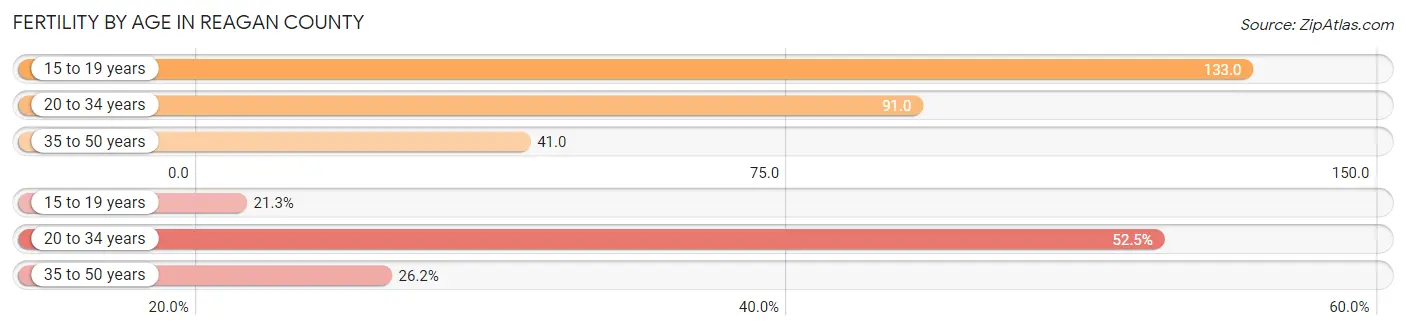
| Age Bracket | Women with Births | Births / 1,000 Women |
| 15 to 19 years | 13 (21.3%) | 133.0 |
| 20 to 34 years | 32 (52.5%) | 91.0 |
| 35 to 50 years | 16 (26.2%) | 41.0 |
| Total | 61 (100.0%) | 73.0 |
Fertility by Age by Marriage Status in Reagan County
78.7% of women with births (61) in Reagan County are married. The highest percentage of unmarried women with births falls into 15 to 19 years age bracket with 100.0% of them unmarried at the time of birth, while the lowest percentage of unmarried women with births belong to 20 to 34 years age bracket with 0.0% of them unmarried.
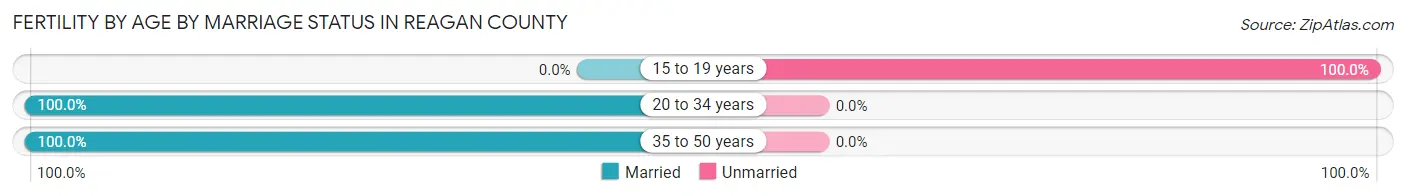
| Age Bracket | Married | Unmarried |
| 15 to 19 years | 0 (0.0%) | 13 (100.0%) |
| 20 to 34 years | 32 (100.0%) | 0 (0.0%) |
| 35 to 50 years | 16 (100.0%) | 0 (0.0%) |
| Total | 48 (78.7%) | 13 (21.3%) |
Fertility by Education in Reagan County
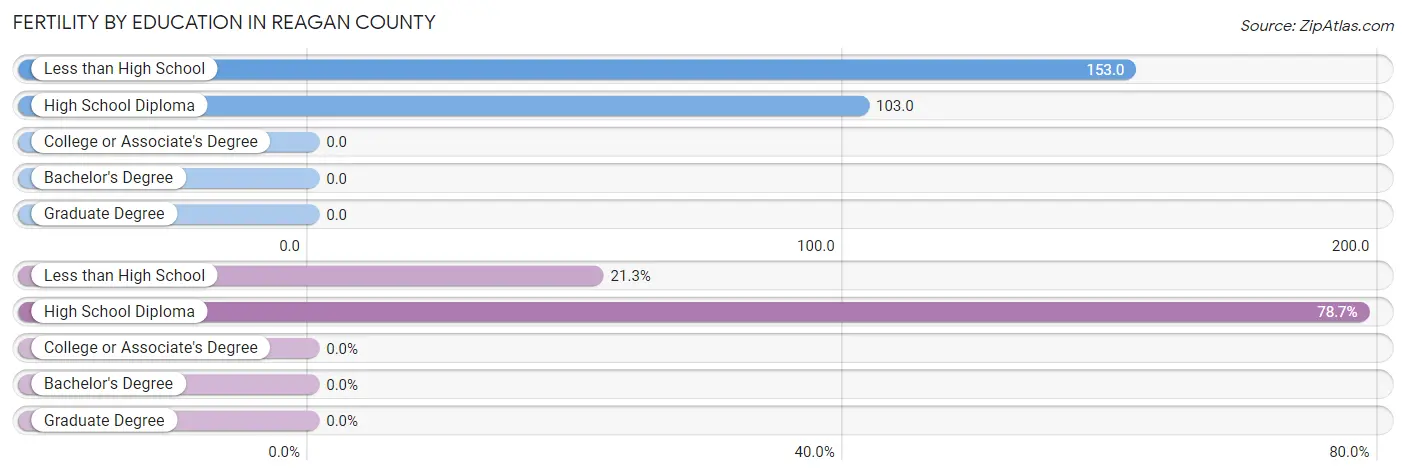
| Educational Attainment | Women with Births | Births / 1,000 Women |
| Less than High School | 13 (21.3%) | 153.0 |
| High School Diploma | 48 (78.7%) | 103.0 |
| College or Associate's Degree | 0 (0.0%) | 0.0 |
| Bachelor's Degree | 0 (0.0%) | 0.0 |
| Graduate Degree | 0 (0.0%) | 0.0 |
| Total | 61 (100.0%) | 73.0 |
Fertility by Education by Marriage Status in Reagan County
21.3% of women with births in Reagan County are unmarried. Women with the educational attainment of high school diploma are most likely to be married with 100.0% of them married at childbirth, while women with the educational attainment of less than high school are least likely to be married with 100.0% of them unmarried at childbirth.
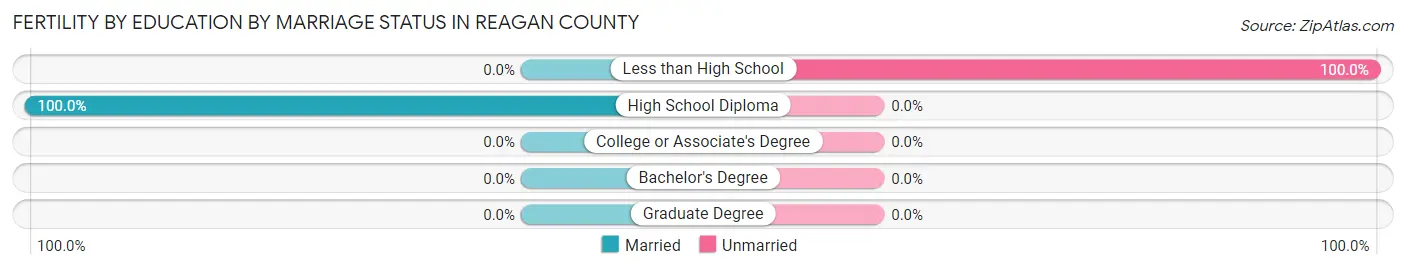
| Educational Attainment | Married | Unmarried |
| Less than High School | 0 (0.0%) | 13 (100.0%) |
| High School Diploma | 48 (100.0%) | 0 (0.0%) |
| College or Associate's Degree | 0 (0.0%) | 0 (0.0%) |
| Bachelor's Degree | 0 (0.0%) | 0 (0.0%) |
| Graduate Degree | 0 (0.0%) | 0 (0.0%) |
| Total | 48 (78.7%) | 13 (21.3%) |
Employment Characteristics in Reagan County
Employment by Class of Employer in Reagan County
Among the 1,566 employed individuals in Reagan County, private company employees (910 | 58.1%), local government employees (221 | 14.1%), and self-employed (incorporated) (162 | 10.3%) make up the most common classes of employment.
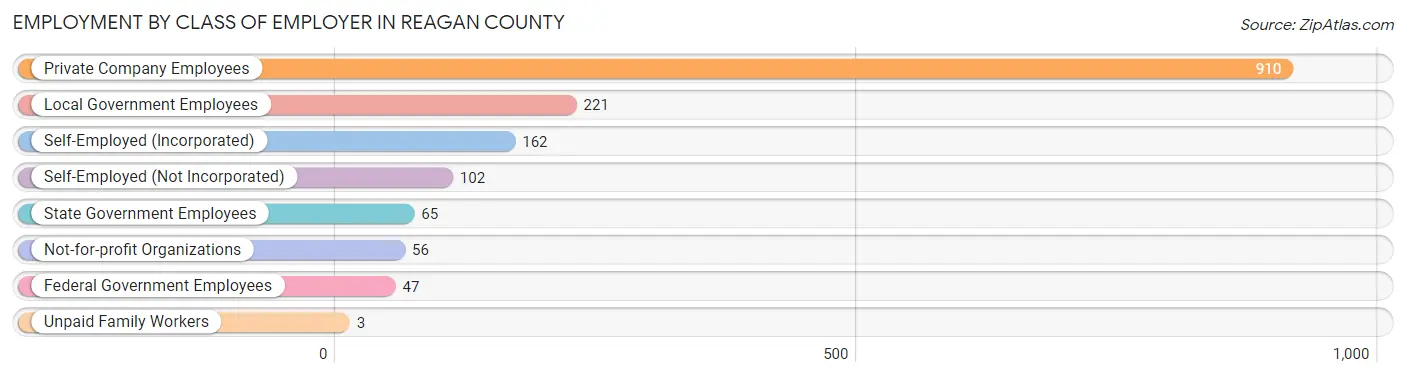
| Employer Class | # Employees | % Employees |
| Private Company Employees | 910 | 58.1% |
| Self-Employed (Incorporated) | 162 | 10.3% |
| Self-Employed (Not Incorporated) | 102 | 6.5% |
| Not-for-profit Organizations | 56 | 3.6% |
| Local Government Employees | 221 | 14.1% |
| State Government Employees | 65 | 4.2% |
| Federal Government Employees | 47 | 3.0% |
| Unpaid Family Workers | 3 | 0.2% |
| Total | 1,566 | 100.0% |
Employment Status by Age in Reagan County
According to the labor force statistics for Reagan County, out of the total population over 16 years of age (2,368), 72.6% or 1,719 individuals are in the labor force, with 8.7% or 150 of them unemployed. The age group with the highest labor force participation rate is 55 to 59 years, with 94.4% or 186 individuals in the labor force. Within the labor force, the 60 to 64 years age range has the highest percentage of unemployed individuals, with 26.5% or 27 of them being unemployed.
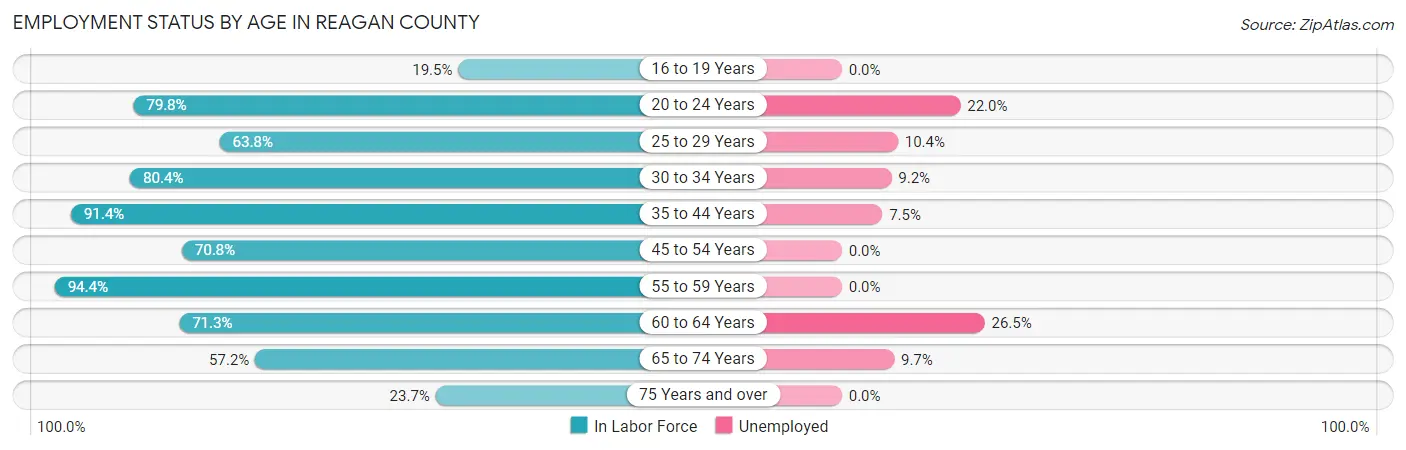
| Age Bracket | In Labor Force | Unemployed |
| 16 to 19 Years | 29 (19.5%) | 0 (0.0%) |
| 20 to 24 Years | 186 (79.8%) | 41 (22.0%) |
| 25 to 29 Years | 164 (63.8%) | 17 (10.4%) |
| 30 to 34 Years | 152 (80.4%) | 14 (9.2%) |
| 35 to 44 Years | 530 (91.4%) | 40 (7.5%) |
| 45 to 54 Years | 243 (70.8%) | 0 (0.0%) |
| 55 to 59 Years | 186 (94.4%) | 0 (0.0%) |
| 60 to 64 Years | 102 (71.3%) | 27 (26.5%) |
| 65 to 74 Years | 103 (57.2%) | 10 (9.7%) |
| 75 Years and over | 23 (23.7%) | 0 (0.0%) |
| Total | 1,719 (72.6%) | 150 (8.7%) |
Employment Status by Educational Attainment in Reagan County
According to labor force statistics for Reagan County, 80.6% of individuals (1,377) out of the total population between 25 and 64 years of age (1,709) are in the labor force, with 7.1% or 98 of them being unemployed. The group with the highest labor force participation rate are those with the educational attainment of less than high school, with 89.7% or 140 individuals in the labor force. Within the labor force, individuals with college / associate degree education have the highest percentage of unemployment, with 21.1% or 67 of them being unemployed.
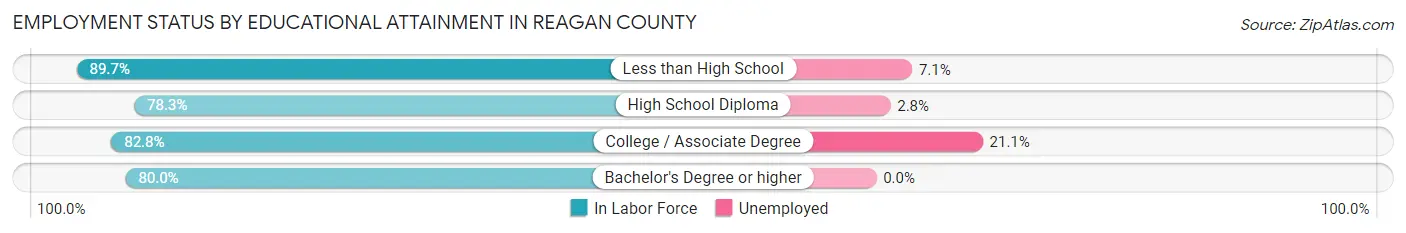
| Educational Attainment | In Labor Force | Unemployed |
| Less than High School | 140 (89.7%) | 11 (7.1%) |
| High School Diploma | 763 (78.3%) | 27 (2.8%) |
| College / Associate Degree | 318 (82.8%) | 81 (21.1%) |
| Bachelor's Degree or higher | 156 (80.0%) | 0 (0.0%) |
| Total | 1,377 (80.6%) | 121 (7.1%) |
Employment Occupations by Sex in Reagan County
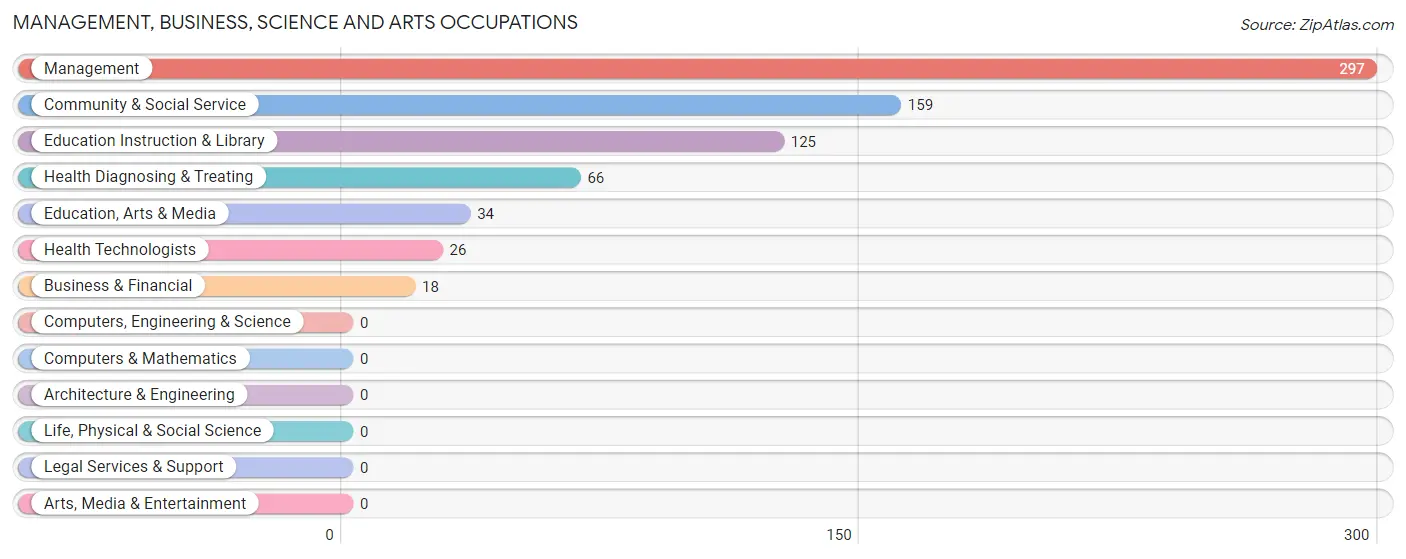
Management, Business, Science and Arts Occupations
The most common Management, Business, Science and Arts occupations in Reagan County are Management (297 | 18.9%), Community & Social Service (159 | 10.1%), Education Instruction & Library (125 | 8.0%), Health Diagnosing & Treating (66 | 4.2%), and Education, Arts & Media (34 | 2.2%).
Management, Business, Science and Arts Occupations by Sex
Within the Management, Business, Science and Arts occupations in Reagan County, the most male-oriented occupations are Health Technologists (69.2%), Management (68.0%), and Education, Arts & Media (67.6%), while the most female-oriented occupations are Education Instruction & Library (99.2%), Community & Social Service (84.9%), and Health Diagnosing & Treating (72.7%).
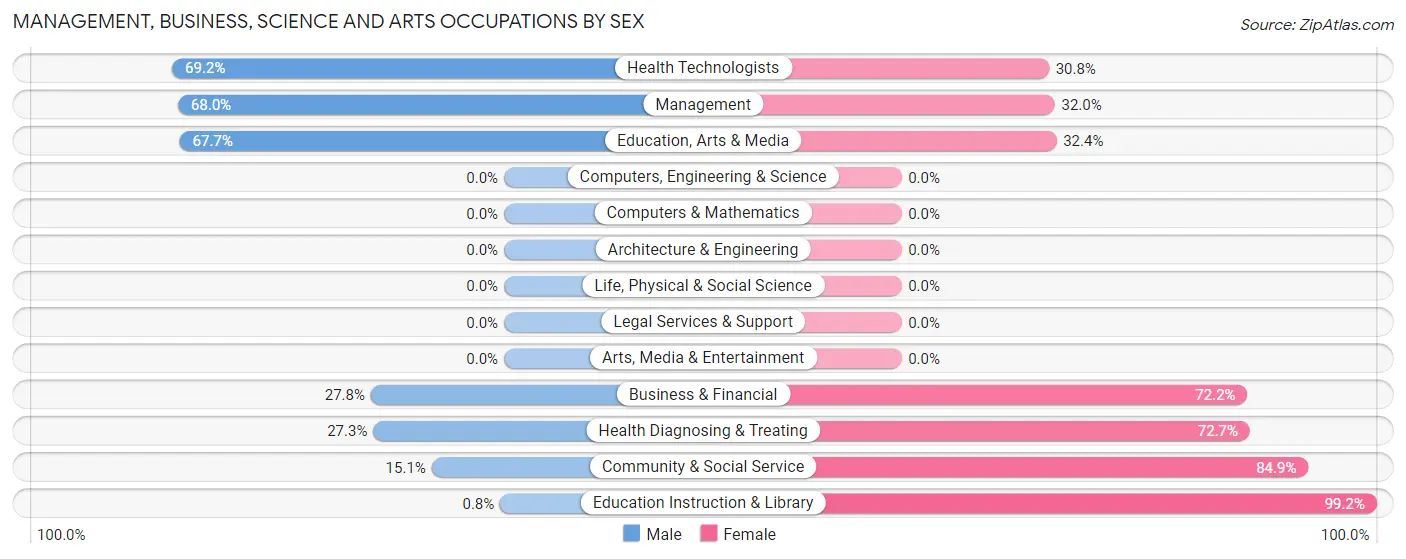
| Occupation | Male | Female |
| Management | 202 (68.0%) | 95 (32.0%) |
| Business & Financial | 5 (27.8%) | 13 (72.2%) |
| Computers, Engineering & Science | 0 (0.0%) | 0 (0.0%) |
| Computers & Mathematics | 0 (0.0%) | 0 (0.0%) |
| Architecture & Engineering | 0 (0.0%) | 0 (0.0%) |
| Life, Physical & Social Science | 0 (0.0%) | 0 (0.0%) |
| Community & Social Service | 24 (15.1%) | 135 (84.9%) |
| Education, Arts & Media | 23 (67.6%) | 11 (32.4%) |
| Legal Services & Support | 0 (0.0%) | 0 (0.0%) |
| Education Instruction & Library | 1 (0.8%) | 124 (99.2%) |
| Arts, Media & Entertainment | 0 (0.0%) | 0 (0.0%) |
| Health Diagnosing & Treating | 18 (27.3%) | 48 (72.7%) |
| Health Technologists | 18 (69.2%) | 8 (30.8%) |
| Total (Category) | 249 (46.1%) | 291 (53.9%) |
| Total (Overall) | 970 (61.8%) | 599 (38.2%) |
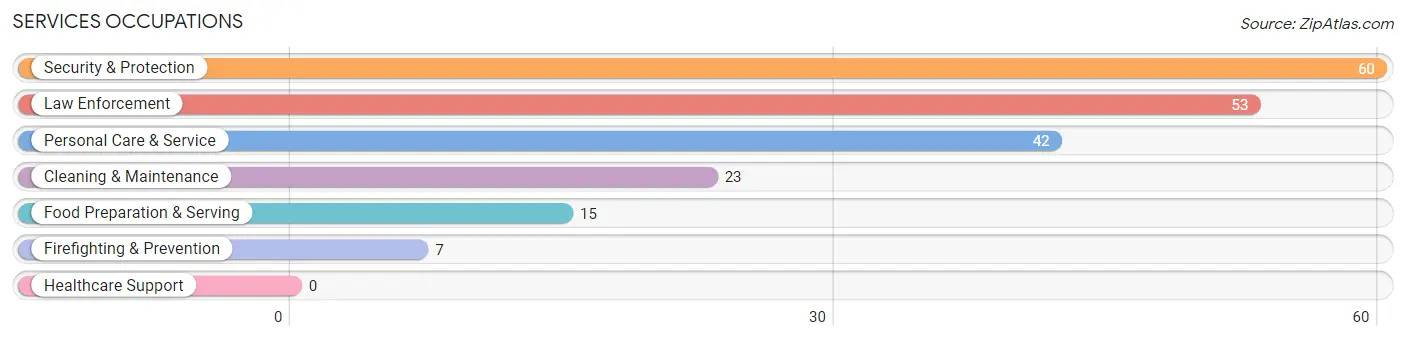
Services Occupations
The most common Services occupations in Reagan County are Security & Protection (60 | 3.8%), Law Enforcement (53 | 3.4%), Personal Care & Service (42 | 2.7%), Cleaning & Maintenance (23 | 1.5%), and Food Preparation & Serving (15 | 1.0%).
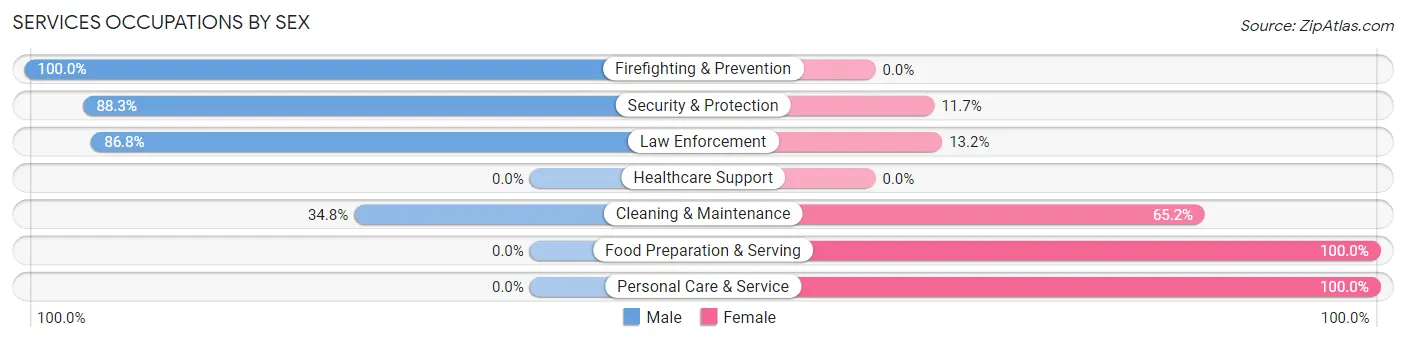
Services Occupations by Sex
Within the Services occupations in Reagan County, the most male-oriented occupations are Firefighting & Prevention (100.0%), Security & Protection (88.3%), and Law Enforcement (86.8%), while the most female-oriented occupations are Food Preparation & Serving (100.0%), Personal Care & Service (100.0%), and Cleaning & Maintenance (65.2%).
| Occupation | Male | Female |
| Healthcare Support | 0 (0.0%) | 0 (0.0%) |
| Security & Protection | 53 (88.3%) | 7 (11.7%) |
| Firefighting & Prevention | 7 (100.0%) | 0 (0.0%) |
| Law Enforcement | 46 (86.8%) | 7 (13.2%) |
| Food Preparation & Serving | 0 (0.0%) | 15 (100.0%) |
| Cleaning & Maintenance | 8 (34.8%) | 15 (65.2%) |
| Personal Care & Service | 0 (0.0%) | 42 (100.0%) |
| Total (Category) | 61 (43.6%) | 79 (56.4%) |
| Total (Overall) | 970 (61.8%) | 599 (38.2%) |
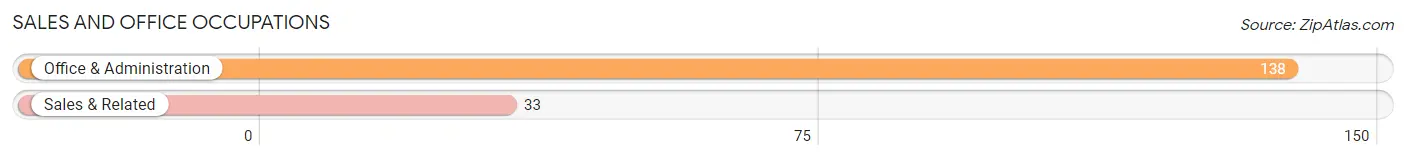
Sales and Office Occupations
The most common Sales and Office occupations in Reagan County are Office & Administration (138 | 8.8%), and Sales & Related (33 | 2.1%).
Sales and Office Occupations by Sex
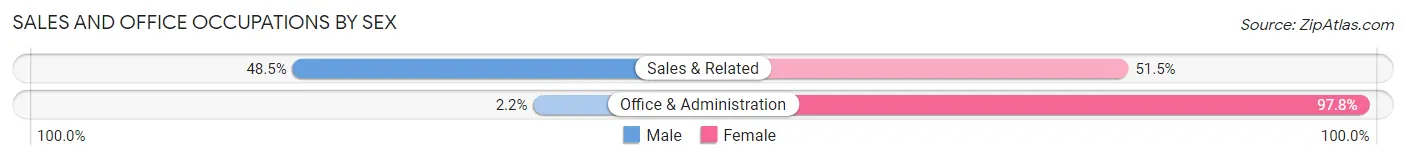
| Occupation | Male | Female |
| Sales & Related | 16 (48.5%) | 17 (51.5%) |
| Office & Administration | 3 (2.2%) | 135 (97.8%) |
| Total (Category) | 19 (11.1%) | 152 (88.9%) |
| Total (Overall) | 970 (61.8%) | 599 (38.2%) |
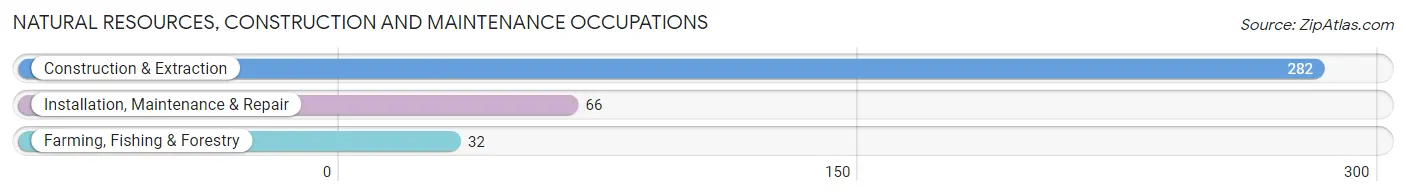
Natural Resources, Construction and Maintenance Occupations
The most common Natural Resources, Construction and Maintenance occupations in Reagan County are Construction & Extraction (282 | 18.0%), Installation, Maintenance & Repair (66 | 4.2%), and Farming, Fishing & Forestry (32 | 2.0%).
Natural Resources, Construction and Maintenance Occupations by Sex
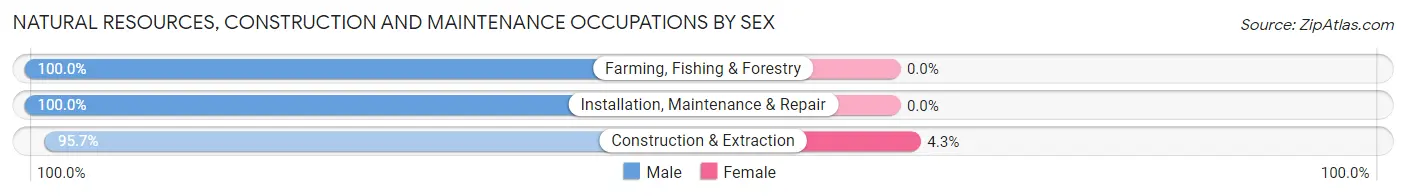
| Occupation | Male | Female |
| Farming, Fishing & Forestry | 32 (100.0%) | 0 (0.0%) |
| Construction & Extraction | 270 (95.7%) | 12 (4.3%) |
| Installation, Maintenance & Repair | 66 (100.0%) | 0 (0.0%) |
| Total (Category) | 368 (96.8%) | 12 (3.2%) |
| Total (Overall) | 970 (61.8%) | 599 (38.2%) |
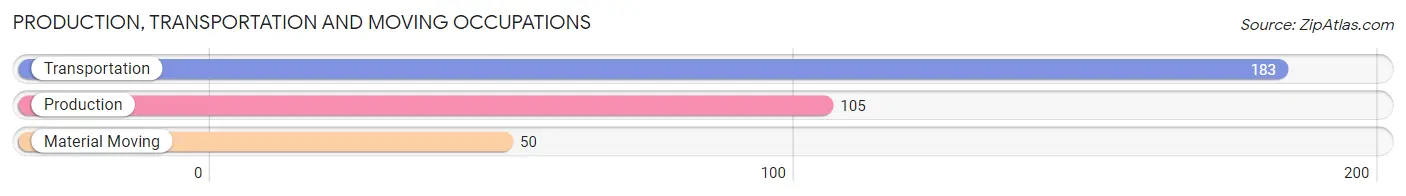
Production, Transportation and Moving Occupations
The most common Production, Transportation and Moving occupations in Reagan County are Transportation (183 | 11.7%), Production (105 | 6.7%), and Material Moving (50 | 3.2%).
Production, Transportation and Moving Occupations by Sex
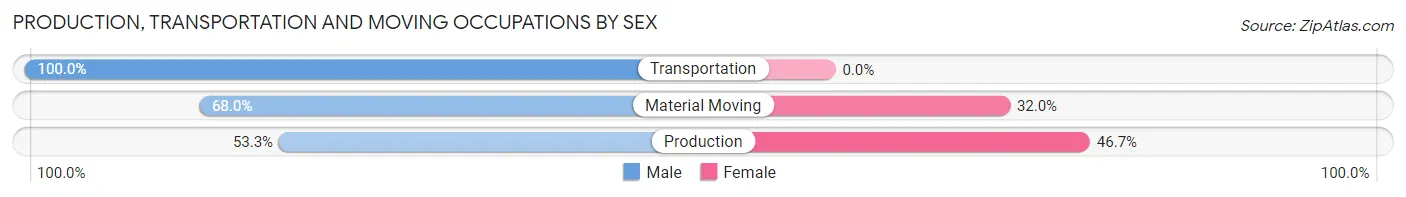
| Occupation | Male | Female |
| Production | 56 (53.3%) | 49 (46.7%) |
| Transportation | 183 (100.0%) | 0 (0.0%) |
| Material Moving | 34 (68.0%) | 16 (32.0%) |
| Total (Category) | 273 (80.8%) | 65 (19.2%) |
| Total (Overall) | 970 (61.8%) | 599 (38.2%) |
Employment Industries by Sex in Reagan County
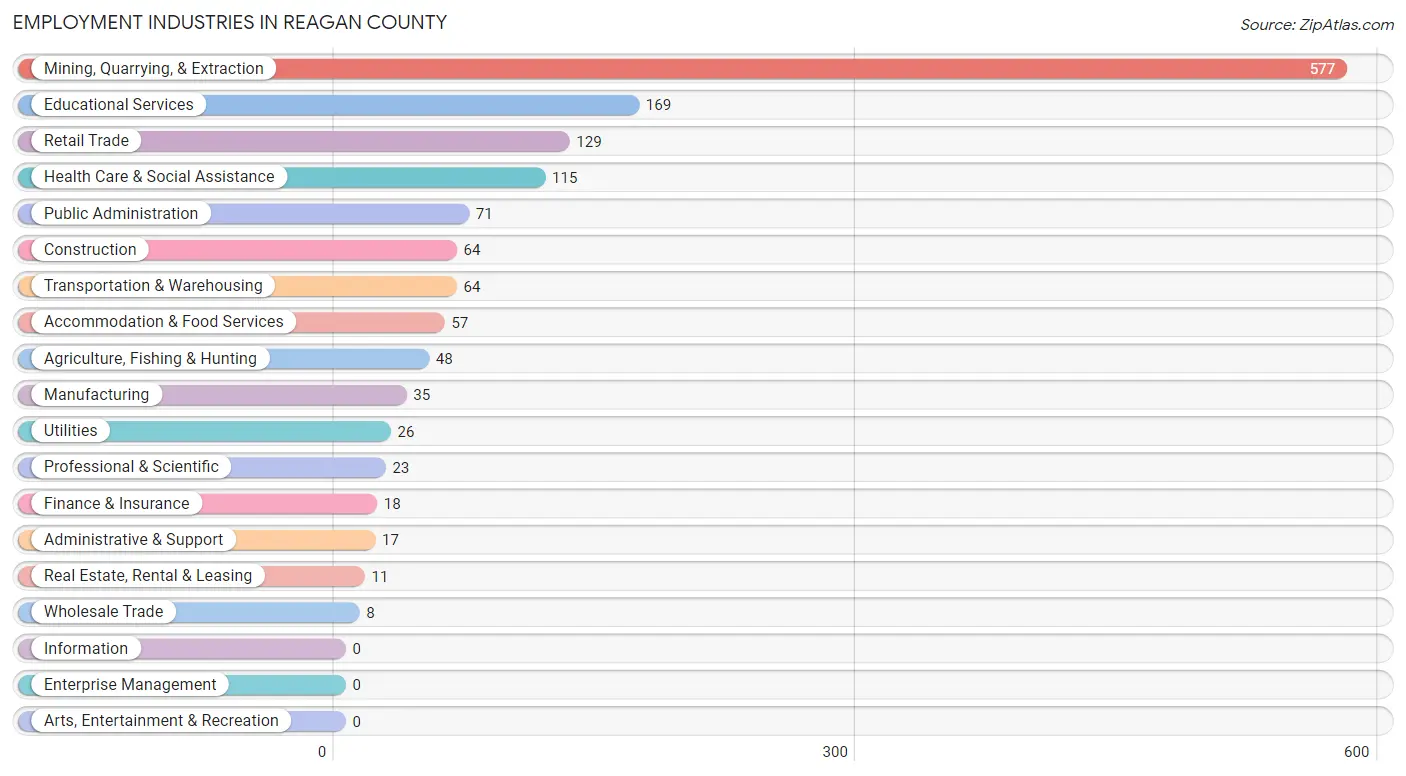
Employment Industries in Reagan County
The major employment industries in Reagan County include Mining, Quarrying, & Extraction (577 | 36.8%), Educational Services (169 | 10.8%), Retail Trade (129 | 8.2%), Health Care & Social Assistance (115 | 7.3%), and Public Administration (71 | 4.5%).
Employment Industries by Sex in Reagan County
The Reagan County industries that see more men than women are Agriculture, Fishing & Hunting (100.0%), Construction (100.0%), and Wholesale Trade (100.0%), whereas the industries that tend to have a higher number of women are Finance & Insurance (100.0%), Health Care & Social Assistance (95.7%), and Manufacturing (85.7%).
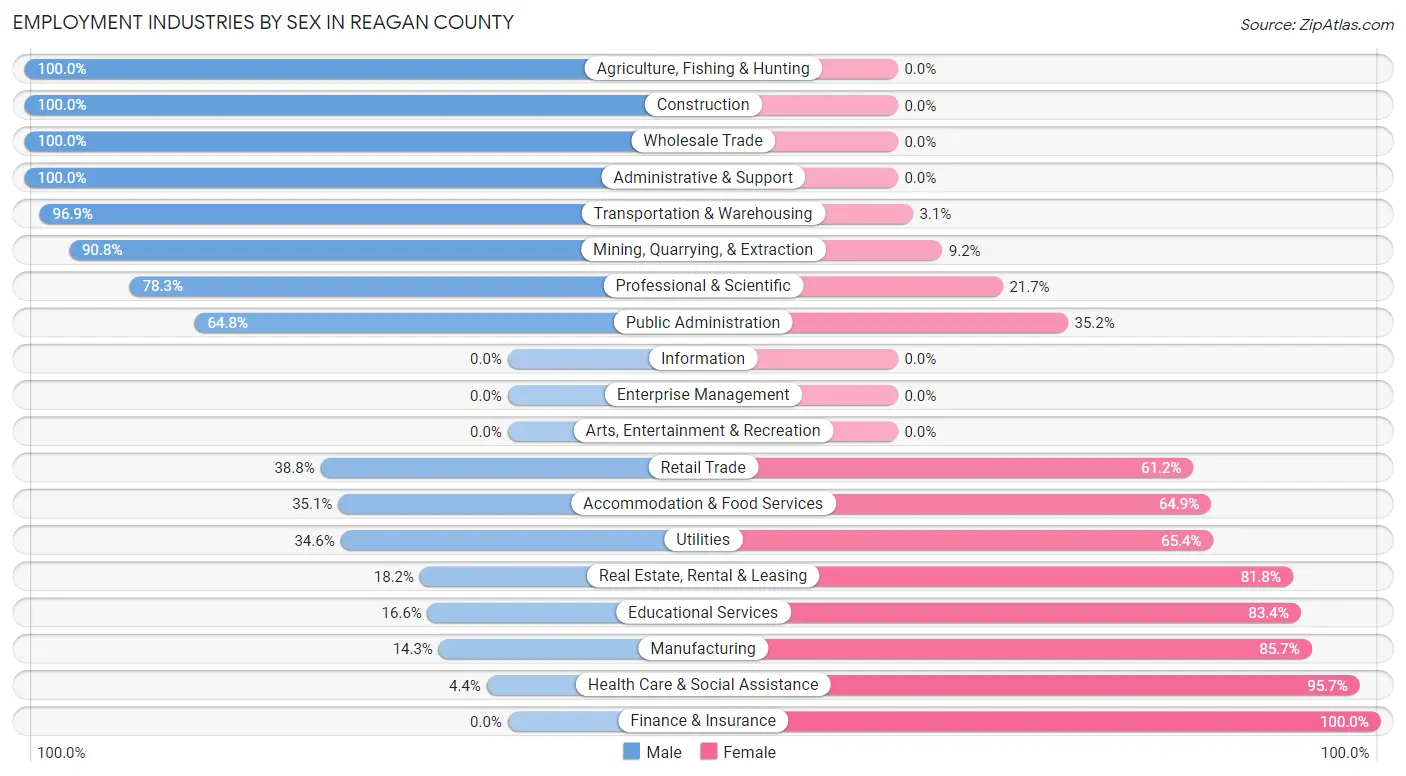
| Industry | Male | Female |
| Agriculture, Fishing & Hunting | 48 (100.0%) | 0 (0.0%) |
| Mining, Quarrying, & Extraction | 524 (90.8%) | 53 (9.2%) |
| Construction | 64 (100.0%) | 0 (0.0%) |
| Manufacturing | 5 (14.3%) | 30 (85.7%) |
| Wholesale Trade | 8 (100.0%) | 0 (0.0%) |
| Retail Trade | 50 (38.8%) | 79 (61.2%) |
| Transportation & Warehousing | 62 (96.9%) | 2 (3.1%) |
| Utilities | 9 (34.6%) | 17 (65.4%) |
| Information | 0 (0.0%) | 0 (0.0%) |
| Finance & Insurance | 0 (0.0%) | 18 (100.0%) |
| Real Estate, Rental & Leasing | 2 (18.2%) | 9 (81.8%) |
| Professional & Scientific | 18 (78.3%) | 5 (21.7%) |
| Enterprise Management | 0 (0.0%) | 0 (0.0%) |
| Administrative & Support | 17 (100.0%) | 0 (0.0%) |
| Educational Services | 28 (16.6%) | 141 (83.4%) |
| Health Care & Social Assistance | 5 (4.3%) | 110 (95.7%) |
| Arts, Entertainment & Recreation | 0 (0.0%) | 0 (0.0%) |
| Accommodation & Food Services | 20 (35.1%) | 37 (64.9%) |
| Public Administration | 46 (64.8%) | 25 (35.2%) |
| Total | 970 (61.8%) | 599 (38.2%) |
Education in Reagan County
School Enrollment in Reagan County
The most common levels of schooling among the 824 students in Reagan County are middle school (239 | 29.0%), elementary school (231 | 28.0%), and high school (170 | 20.6%).
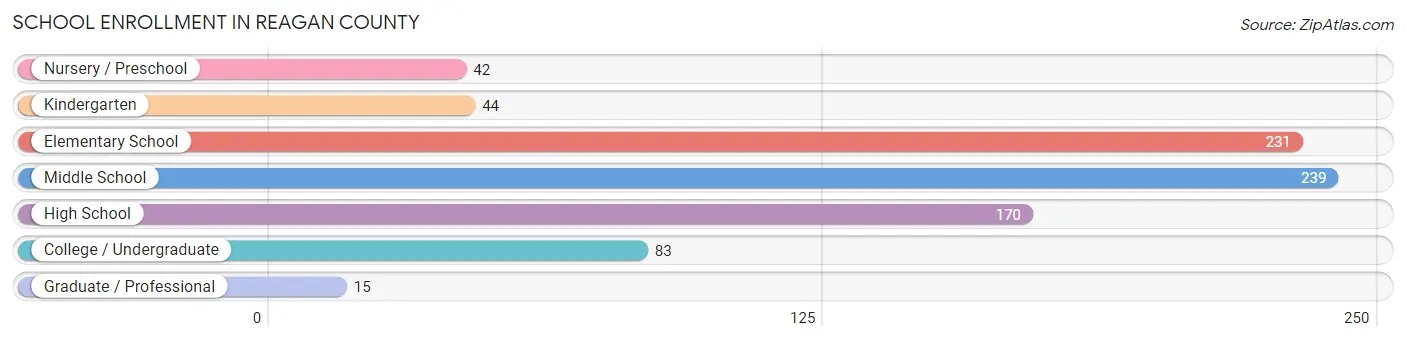
| School Level | # Students | % Students |
| Nursery / Preschool | 42 | 5.1% |
| Kindergarten | 44 | 5.3% |
| Elementary School | 231 | 28.0% |
| Middle School | 239 | 29.0% |
| High School | 170 | 20.6% |
| College / Undergraduate | 83 | 10.1% |
| Graduate / Professional | 15 | 1.8% |
| Total | 824 | 100.0% |
School Enrollment by Age by Funding Source in Reagan County
Out of a total of 824 students who are enrolled in schools in Reagan County, 36 (4.4%) attend a private institution, while the remaining 788 (95.6%) are enrolled in public schools. The age group of 3 to 4 year olds has the highest likelihood of being enrolled in private schools, with 13 (34.2% in the age bracket) enrolled. Conversely, the age group of 18 to 19 year olds has the lowest likelihood of being enrolled in a private school, with 35 (100.0% in the age bracket) attending a public institution.
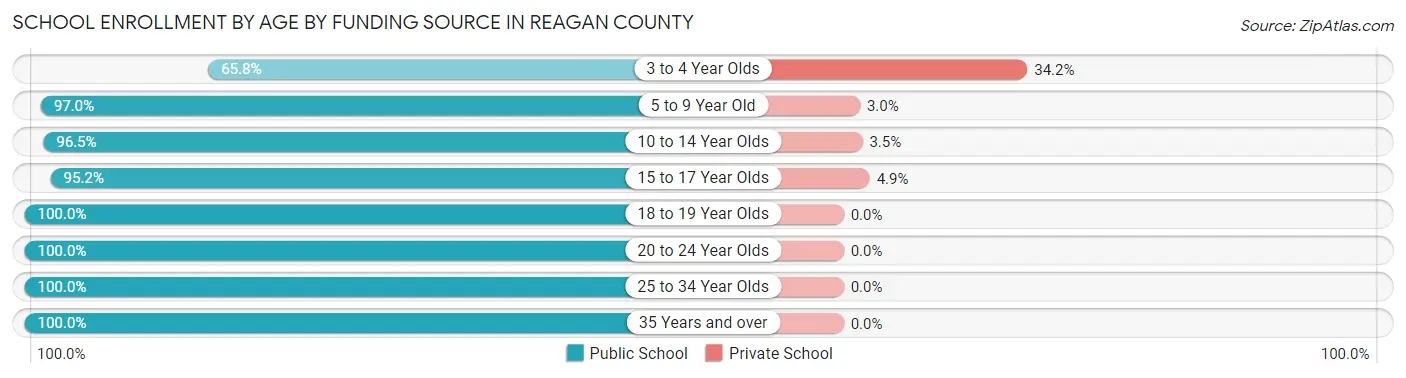
| Age Bracket | Public School | Private School |
| 3 to 4 Year Olds | 25 (65.8%) | 13 (34.2%) |
| 5 to 9 Year Old | 256 (97.0%) | 8 (3.0%) |
| 10 to 14 Year Olds | 276 (96.5%) | 10 (3.5%) |
| 15 to 17 Year Olds | 98 (95.2%) | 5 (4.9%) |
| 18 to 19 Year Olds | 35 (100.0%) | 0 (0.0%) |
| 20 to 24 Year Olds | 54 (100.0%) | 0 (0.0%) |
| 25 to 34 Year Olds | 29 (100.0%) | 0 (0.0%) |
| 35 Years and over | 15 (100.0%) | 0 (0.0%) |
| Total | 788 (95.6%) | 36 (4.4%) |
Educational Attainment by Field of Study in Reagan County
Education (65 | 27.3%), liberal arts & history (33 | 13.9%), bio, nature & agricultural (29 | 12.2%), business (29 | 12.2%), and computers & mathematics (26 | 10.9%) are the most common fields of study among 238 individuals in Reagan County who have obtained a bachelor's degree or higher.
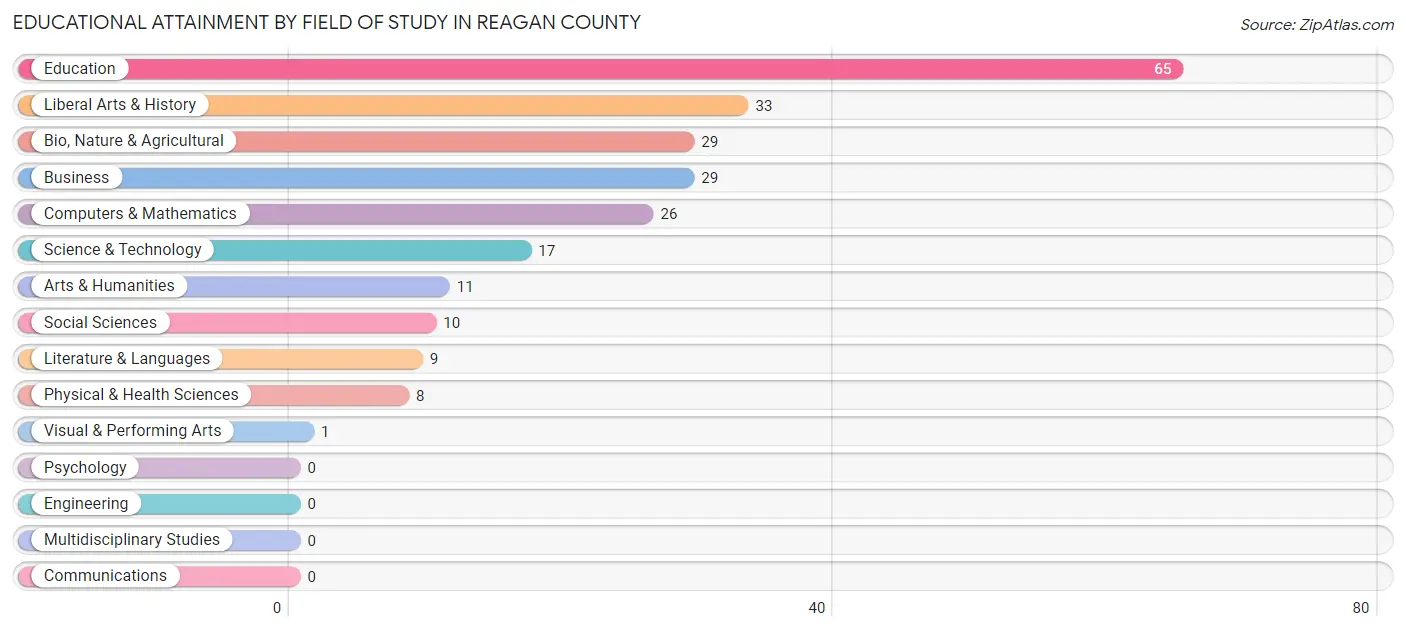
| Field of Study | # Graduates | % Graduates |
| Computers & Mathematics | 26 | 10.9% |
| Bio, Nature & Agricultural | 29 | 12.2% |
| Physical & Health Sciences | 8 | 3.4% |
| Psychology | 0 | 0.0% |
| Social Sciences | 10 | 4.2% |
| Engineering | 0 | 0.0% |
| Multidisciplinary Studies | 0 | 0.0% |
| Science & Technology | 17 | 7.1% |
| Business | 29 | 12.2% |
| Education | 65 | 27.3% |
| Literature & Languages | 9 | 3.8% |
| Liberal Arts & History | 33 | 13.9% |
| Visual & Performing Arts | 1 | 0.4% |
| Communications | 0 | 0.0% |
| Arts & Humanities | 11 | 4.6% |
| Total | 238 | 100.0% |
Transportation & Commute in Reagan County
Vehicle Availability by Sex in Reagan County
The most prevalent vehicle ownership categories in Reagan County are males with 2 vehicles (311, accounting for 32.2%) and females with 2 vehicles (187, making up 51.9%).
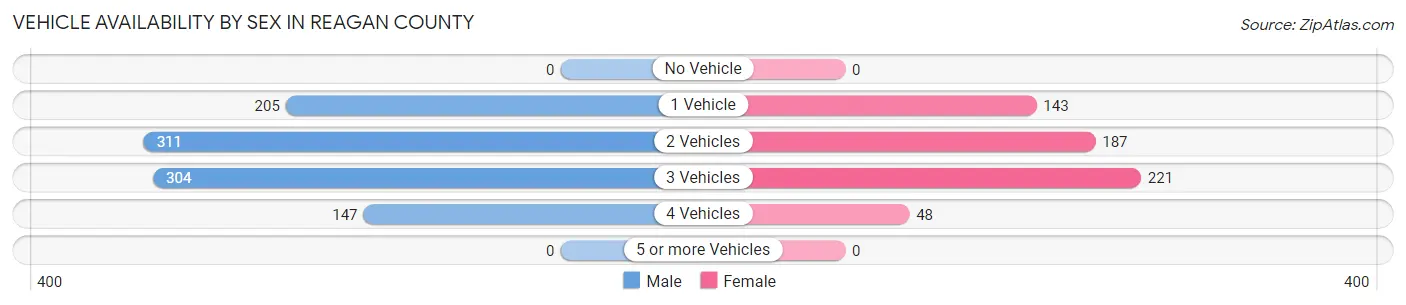
| Vehicles Available | Male | Female |
| No Vehicle | 0 (0.0%) | 0 (0.0%) |
| 1 Vehicle | 205 (21.2%) | 143 (23.9%) |
| 2 Vehicles | 311 (32.2%) | 187 (31.2%) |
| 3 Vehicles | 304 (31.4%) | 221 (36.9%) |
| 4 Vehicles | 147 (15.2%) | 48 (8.0%) |
| 5 or more Vehicles | 0 (0.0%) | 0 (0.0%) |
| Total | 967 (100.0%) | 599 (100.0%) |
Commute Time in Reagan County
The most frequently occuring commute durations in Reagan County are 5 to 9 minutes (400 commuters, 26.8%), less than 5 minutes (292 commuters, 19.6%), and 10 to 14 minutes (178 commuters, 11.9%).
| Commute Time | # Commuters | % Commuters |
| Less than 5 Minutes | 292 | 19.6% |
| 5 to 9 Minutes | 400 | 26.8% |
| 10 to 14 Minutes | 178 | 11.9% |
| 15 to 19 Minutes | 153 | 10.2% |
| 20 to 24 Minutes | 11 | 0.7% |
| 25 to 29 Minutes | 14 | 0.9% |
| 30 to 34 Minutes | 95 | 6.4% |
| 35 to 39 Minutes | 55 | 3.7% |
| 40 to 44 Minutes | 17 | 1.1% |
| 45 to 59 Minutes | 70 | 4.7% |
| 60 to 89 Minutes | 116 | 7.8% |
| 90 or more Minutes | 92 | 6.2% |
Commute Time by Sex in Reagan County
The most common commute times in Reagan County are 5 to 9 minutes (201 commuters, 21.3%) for males and 5 to 9 minutes (199 commuters, 36.2%) for females.
| Commute Time | Male | Female |
| Less than 5 Minutes | 114 (12.1%) | 178 (32.4%) |
| 5 to 9 Minutes | 201 (21.3%) | 199 (36.2%) |
| 10 to 14 Minutes | 100 (10.6%) | 78 (14.2%) |
| 15 to 19 Minutes | 133 (14.1%) | 20 (3.6%) |
| 20 to 24 Minutes | 2 (0.2%) | 9 (1.6%) |
| 25 to 29 Minutes | 14 (1.5%) | 0 (0.0%) |
| 30 to 34 Minutes | 86 (9.1%) | 9 (1.6%) |
| 35 to 39 Minutes | 55 (5.8%) | 0 (0.0%) |
| 40 to 44 Minutes | 17 (1.8%) | 0 (0.0%) |
| 45 to 59 Minutes | 43 (4.6%) | 27 (4.9%) |
| 60 to 89 Minutes | 104 (11.0%) | 12 (2.2%) |
| 90 or more Minutes | 75 (7.9%) | 17 (3.1%) |
Time of Departure to Work by Sex in Reagan County
The most frequent times of departure to work in Reagan County are 6:00 AM to 6:29 AM (266, 28.2%) for males and 7:30 AM to 7:59 AM (110, 20.0%) for females.
| Time of Departure | Male | Female |
| 12:00 AM to 4:59 AM | 110 (11.7%) | 49 (8.9%) |
| 5:00 AM to 5:29 AM | 57 (6.0%) | 4 (0.7%) |
| 5:30 AM to 5:59 AM | 74 (7.8%) | 3 (0.5%) |
| 6:00 AM to 6:29 AM | 266 (28.2%) | 88 (16.0%) |
| 6:30 AM to 6:59 AM | 82 (8.7%) | 7 (1.3%) |
| 7:00 AM to 7:29 AM | 135 (14.3%) | 40 (7.3%) |
| 7:30 AM to 7:59 AM | 37 (3.9%) | 110 (20.0%) |
| 8:00 AM to 8:29 AM | 104 (11.0%) | 92 (16.8%) |
| 8:30 AM to 8:59 AM | 0 (0.0%) | 43 (7.8%) |
| 9:00 AM to 9:59 AM | 3 (0.3%) | 49 (8.9%) |
| 10:00 AM to 10:59 AM | 21 (2.2%) | 23 (4.2%) |
| 11:00 AM to 11:59 AM | 0 (0.0%) | 0 (0.0%) |
| 12:00 PM to 3:59 PM | 55 (5.8%) | 28 (5.1%) |
| 4:00 PM to 11:59 PM | 0 (0.0%) | 13 (2.4%) |
| Total | 944 (100.0%) | 549 (100.0%) |
Housing Occupancy in Reagan County
Occupancy by Ownership in Reagan County
Of the total 1,090 dwellings in Reagan County, owner-occupied units account for 735 (67.4%), while renter-occupied units make up 355 (32.6%).
| Occupancy | # Housing Units | % Housing Units |
| Owner Occupied Housing Units | 735 | 67.4% |
| Renter-Occupied Housing Units | 355 | 32.6% |
| Total Occupied Housing Units | 1,090 | 100.0% |
Occupancy by Household Size in Reagan County
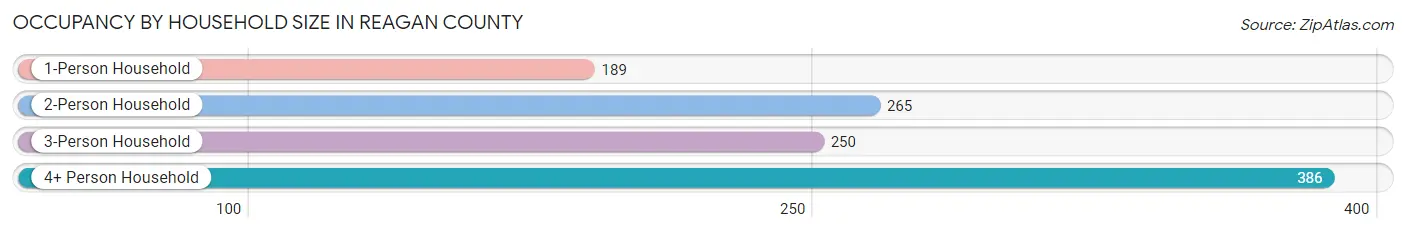
| Household Size | # Housing Units | % Housing Units |
| 1-Person Household | 189 | 17.3% |
| 2-Person Household | 265 | 24.3% |
| 3-Person Household | 250 | 22.9% |
| 4+ Person Household | 386 | 35.4% |
| Total Housing Units | 1,090 | 100.0% |
Occupancy by Ownership by Household Size in Reagan County
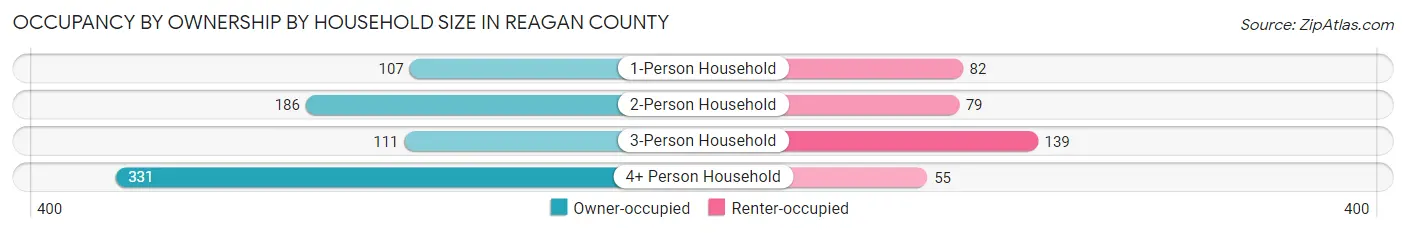
| Household Size | Owner-occupied | Renter-occupied |
| 1-Person Household | 107 (56.6%) | 82 (43.4%) |
| 2-Person Household | 186 (70.2%) | 79 (29.8%) |
| 3-Person Household | 111 (44.4%) | 139 (55.6%) |
| 4+ Person Household | 331 (85.8%) | 55 (14.2%) |
| Total Housing Units | 735 (67.4%) | 355 (32.6%) |
Occupancy by Educational Attainment in Reagan County
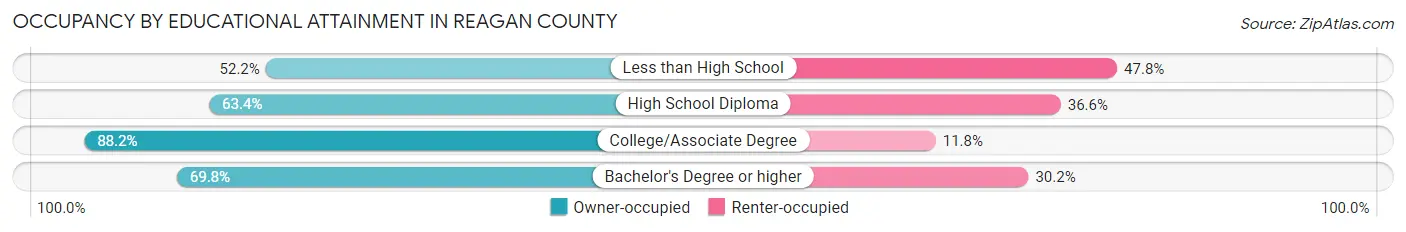
| Household Size | Owner-occupied | Renter-occupied |
| Less than High School | 94 (52.2%) | 86 (47.8%) |
| High School Diploma | 343 (63.4%) | 198 (36.6%) |
| College/Associate Degree | 194 (88.2%) | 26 (11.8%) |
| Bachelor's Degree or higher | 104 (69.8%) | 45 (30.2%) |
Occupancy by Age of Householder in Reagan County
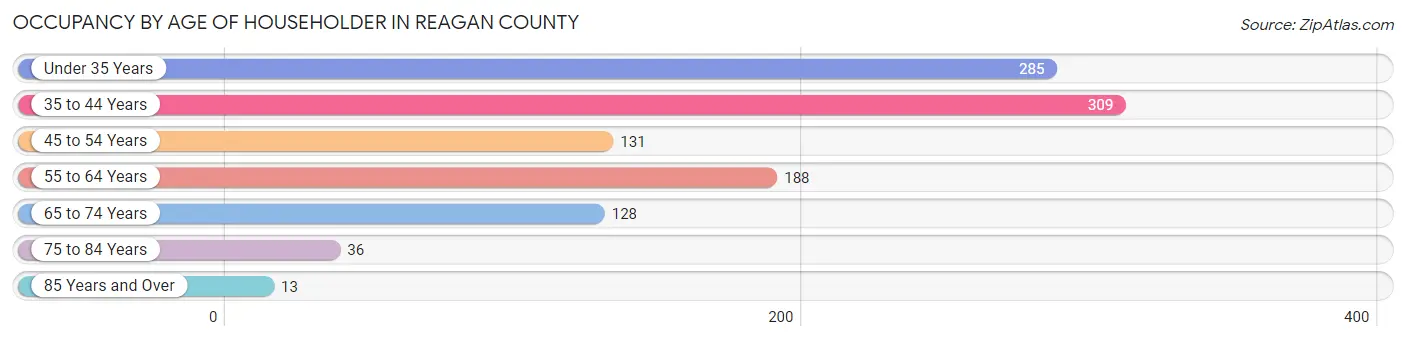
| Age Bracket | # Households | % Households |
| Under 35 Years | 285 | 26.2% |
| 35 to 44 Years | 309 | 28.3% |
| 45 to 54 Years | 131 | 12.0% |
| 55 to 64 Years | 188 | 17.2% |
| 65 to 74 Years | 128 | 11.7% |
| 75 to 84 Years | 36 | 3.3% |
| 85 Years and Over | 13 | 1.2% |
| Total | 1,090 | 100.0% |
Housing Finances in Reagan County
Median Income by Occupancy in Reagan County
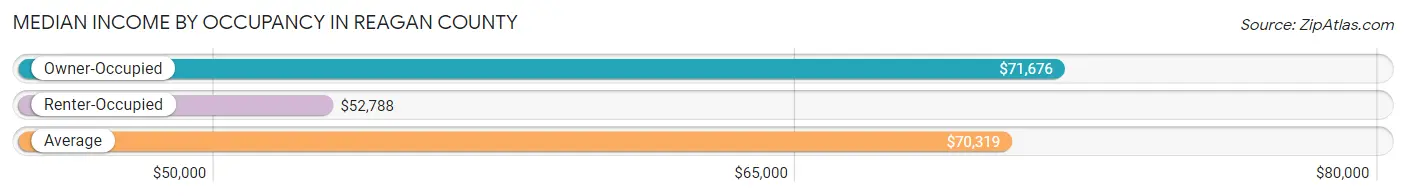
| Occupancy Type | # Households | Median Income |
| Owner-Occupied | 735 (67.4%) | $71,676 |
| Renter-Occupied | 355 (32.6%) | $52,788 |
| Average | 1,090 (100.0%) | $70,319 |
Occupancy by Householder Income Bracket in Reagan County
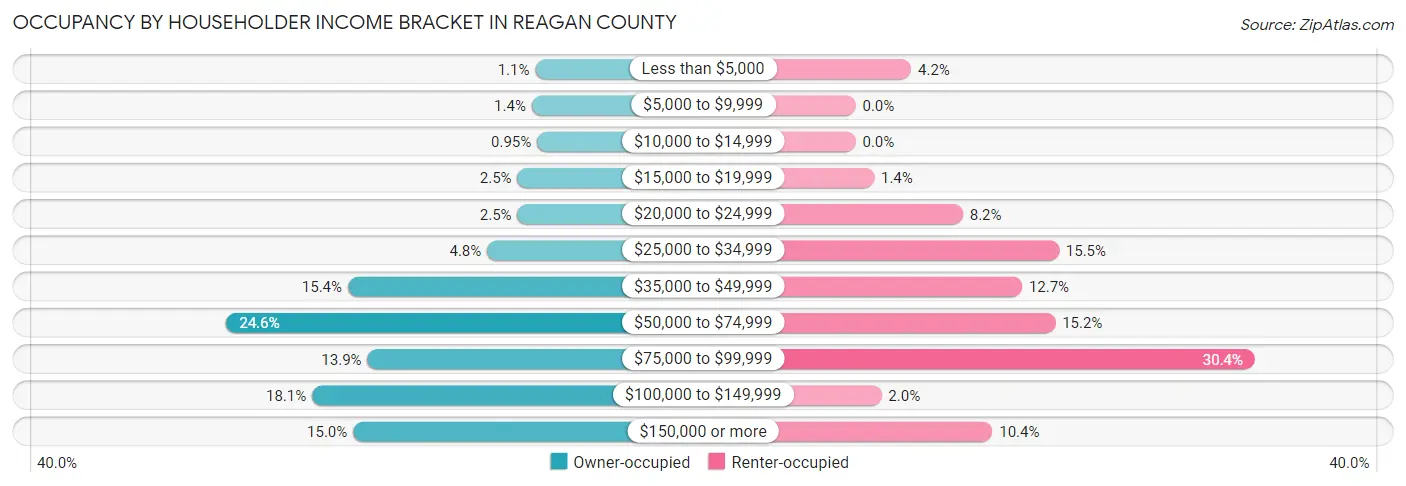
| Income Bracket | Owner-occupied | Renter-occupied |
| Less than $5,000 | 8 (1.1%) | 15 (4.2%) |
| $5,000 to $9,999 | 10 (1.4%) | 0 (0.0%) |
| $10,000 to $14,999 | 7 (0.9%) | 0 (0.0%) |
| $15,000 to $19,999 | 18 (2.5%) | 5 (1.4%) |
| $20,000 to $24,999 | 18 (2.5%) | 29 (8.2%) |
| $25,000 to $34,999 | 35 (4.8%) | 55 (15.5%) |
| $35,000 to $49,999 | 113 (15.4%) | 45 (12.7%) |
| $50,000 to $74,999 | 181 (24.6%) | 54 (15.2%) |
| $75,000 to $99,999 | 102 (13.9%) | 108 (30.4%) |
| $100,000 to $149,999 | 133 (18.1%) | 7 (2.0%) |
| $150,000 or more | 110 (15.0%) | 37 (10.4%) |
| Total | 735 (100.0%) | 355 (100.0%) |
Monthly Housing Cost Tiers in Reagan County
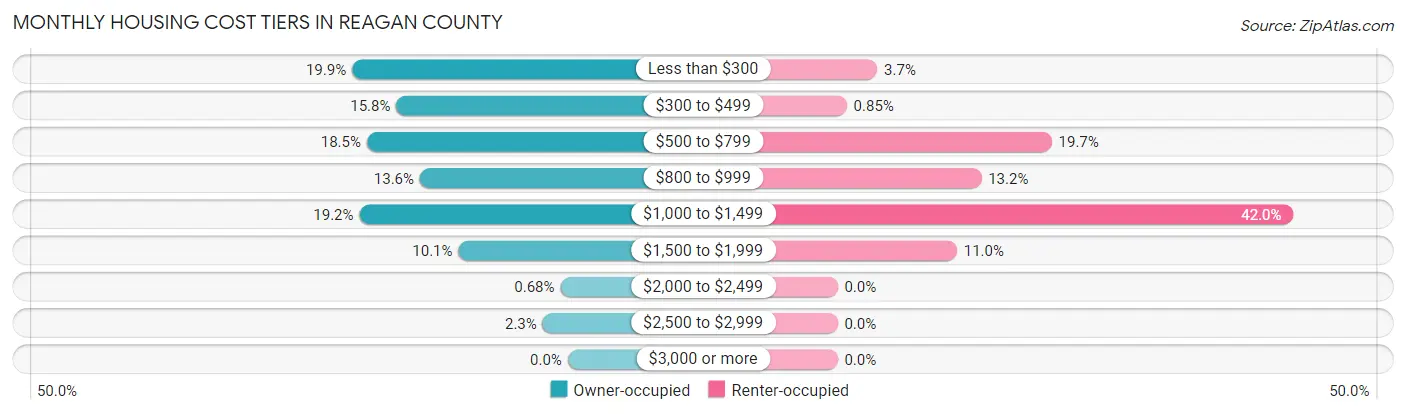
| Monthly Cost | Owner-occupied | Renter-occupied |
| Less than $300 | 146 (19.9%) | 13 (3.7%) |
| $300 to $499 | 116 (15.8%) | 3 (0.9%) |
| $500 to $799 | 136 (18.5%) | 70 (19.7%) |
| $800 to $999 | 100 (13.6%) | 47 (13.2%) |
| $1,000 to $1,499 | 141 (19.2%) | 149 (42.0%) |
| $1,500 to $1,999 | 74 (10.1%) | 39 (11.0%) |
| $2,000 to $2,499 | 5 (0.7%) | 0 (0.0%) |
| $2,500 to $2,999 | 17 (2.3%) | 0 (0.0%) |
| $3,000 or more | 0 (0.0%) | 0 (0.0%) |
| Total | 735 (100.0%) | 355 (100.0%) |
Physical Housing Characteristics in Reagan County
Housing Structures in Reagan County
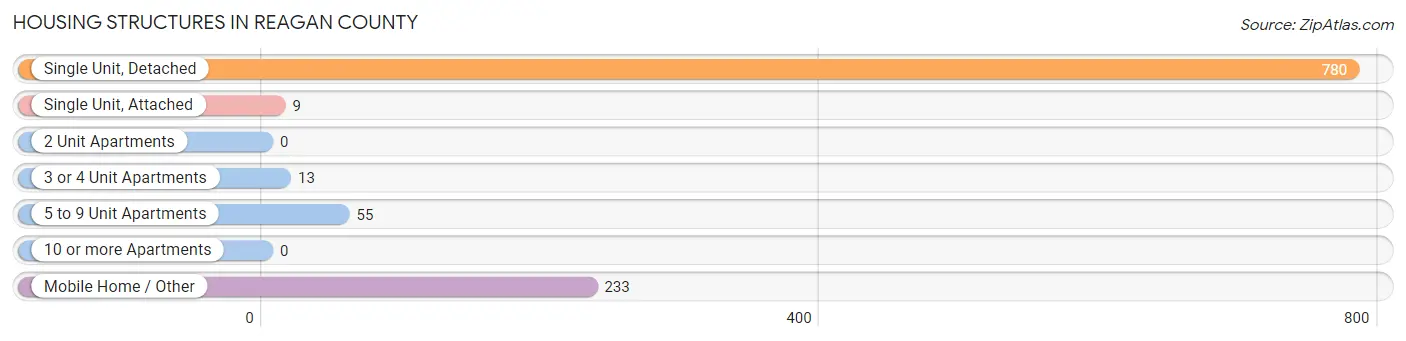
| Structure Type | # Housing Units | % Housing Units |
| Single Unit, Detached | 780 | 71.6% |
| Single Unit, Attached | 9 | 0.8% |
| 2 Unit Apartments | 0 | 0.0% |
| 3 or 4 Unit Apartments | 13 | 1.2% |
| 5 to 9 Unit Apartments | 55 | 5.1% |
| 10 or more Apartments | 0 | 0.0% |
| Mobile Home / Other | 233 | 21.4% |
| Total | 1,090 | 100.0% |
Housing Structures by Occupancy in Reagan County
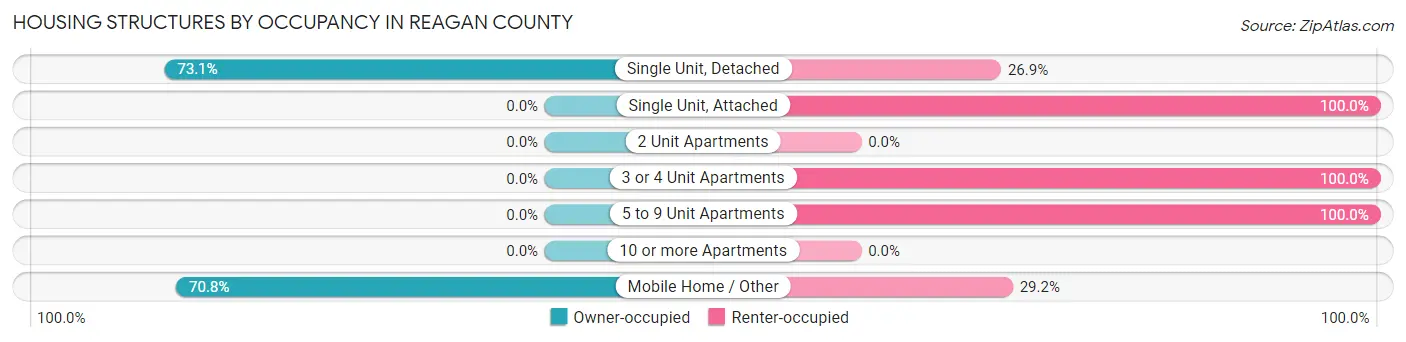
| Structure Type | Owner-occupied | Renter-occupied |
| Single Unit, Detached | 570 (73.1%) | 210 (26.9%) |
| Single Unit, Attached | 0 (0.0%) | 9 (100.0%) |
| 2 Unit Apartments | 0 (0.0%) | 0 (0.0%) |
| 3 or 4 Unit Apartments | 0 (0.0%) | 13 (100.0%) |
| 5 to 9 Unit Apartments | 0 (0.0%) | 55 (100.0%) |
| 10 or more Apartments | 0 (0.0%) | 0 (0.0%) |
| Mobile Home / Other | 165 (70.8%) | 68 (29.2%) |
| Total | 735 (67.4%) | 355 (32.6%) |
Housing Structures by Number of Rooms in Reagan County
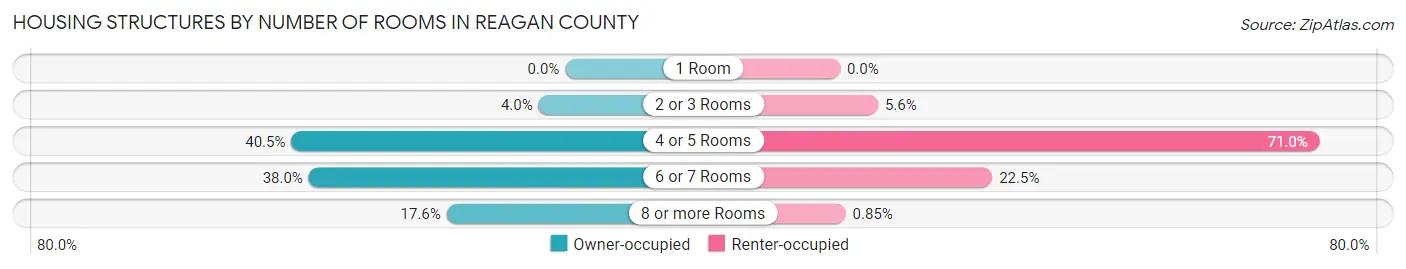
| Number of Rooms | Owner-occupied | Renter-occupied |
| 1 Room | 0 (0.0%) | 0 (0.0%) |
| 2 or 3 Rooms | 29 (4.0%) | 20 (5.6%) |
| 4 or 5 Rooms | 298 (40.5%) | 252 (71.0%) |
| 6 or 7 Rooms | 279 (38.0%) | 80 (22.5%) |
| 8 or more Rooms | 129 (17.5%) | 3 (0.9%) |
| Total | 735 (100.0%) | 355 (100.0%) |
Housing Structure by Heating Type in Reagan County
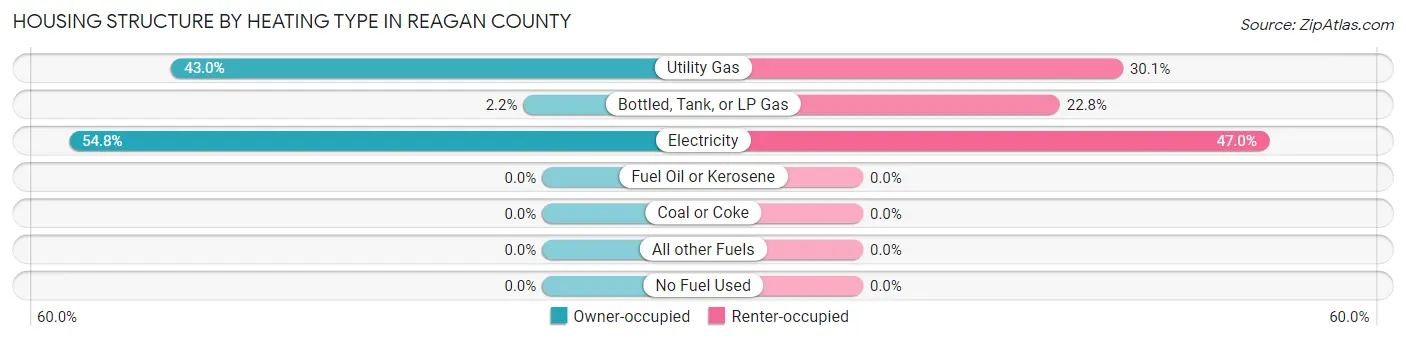
| Heating Type | Owner-occupied | Renter-occupied |
| Utility Gas | 316 (43.0%) | 107 (30.1%) |
| Bottled, Tank, or LP Gas | 16 (2.2%) | 81 (22.8%) |
| Electricity | 403 (54.8%) | 167 (47.0%) |
| Fuel Oil or Kerosene | 0 (0.0%) | 0 (0.0%) |
| Coal or Coke | 0 (0.0%) | 0 (0.0%) |
| All other Fuels | 0 (0.0%) | 0 (0.0%) |
| No Fuel Used | 0 (0.0%) | 0 (0.0%) |
| Total | 735 (100.0%) | 355 (100.0%) |
Household Vehicle Usage in Reagan County
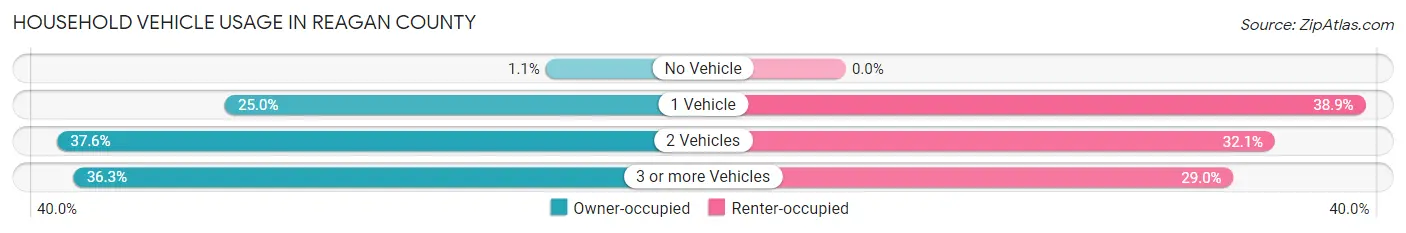
| Vehicles per Household | Owner-occupied | Renter-occupied |
| No Vehicle | 8 (1.1%) | 0 (0.0%) |
| 1 Vehicle | 184 (25.0%) | 138 (38.9%) |
| 2 Vehicles | 276 (37.6%) | 114 (32.1%) |
| 3 or more Vehicles | 267 (36.3%) | 103 (29.0%) |
| Total | 735 (100.0%) | 355 (100.0%) |
Real Estate & Mortgages in Reagan County
Real Estate and Mortgage Overview in Reagan County
| Characteristic | Without Mortgage | With Mortgage |
| Housing Units | 528 | 207 |
| Median Property Value | $121,400 | $129,400 |
| Median Household Income | $68,571 | $25 |
| Monthly Housing Costs | $505 | $0 |
| Real Estate Taxes | $1,381 | $0 |
Property Value by Mortgage Status in Reagan County
| Property Value | Without Mortgage | With Mortgage |
| Less than $50,000 | 110 (20.8%) | 0 (0.0%) |
| $50,000 to $99,999 | 106 (20.1%) | 50 (24.1%) |
| $100,000 to $299,999 | 262 (49.6%) | 140 (67.6%) |
| $300,000 to $499,999 | 21 (4.0%) | 17 (8.2%) |
| $500,000 to $749,999 | 0 (0.0%) | 0 (0.0%) |
| $750,000 to $999,999 | 0 (0.0%) | 0 (0.0%) |
| $1,000,000 or more | 29 (5.5%) | 0 (0.0%) |
| Total | 528 (100.0%) | 207 (100.0%) |
Household Income by Mortgage Status in Reagan County
| Household Income | Without Mortgage | With Mortgage |
| Less than $10,000 | 18 (3.4%) | 0 (0.0%) |
| $10,000 to $24,999 | 31 (5.9%) | 0 (0.0%) |
| $25,000 to $34,999 | 30 (5.7%) | 12 (5.8%) |
| $35,000 to $49,999 | 96 (18.2%) | 5 (2.4%) |
| $50,000 to $74,999 | 151 (28.6%) | 17 (8.2%) |
| $75,000 to $99,999 | 77 (14.6%) | 30 (14.5%) |
| $100,000 to $149,999 | 40 (7.6%) | 25 (12.1%) |
| $150,000 or more | 85 (16.1%) | 93 (44.9%) |
| Total | 528 (100.0%) | 207 (100.0%) |
Property Value to Household Income Ratio in Reagan County
| Value-to-Income Ratio | Without Mortgage | With Mortgage |
| Less than 2.0x | 286 (54.2%) | 115,625 (55,857.5%) |
| 2.0x to 2.9x | 107 (20.3%) | 148 (71.5%) |
| 3.0x to 3.9x | 30 (5.7%) | 25 (12.1%) |
| 4.0x or more | 105 (19.9%) | 0 (0.0%) |
| Total | 528 (100.0%) | 207 (100.0%) |
Real Estate Taxes by Mortgage Status in Reagan County
| Property Taxes | Without Mortgage | With Mortgage |
| Less than $800 | 117 (22.2%) | 0 (0.0%) |
| $800 to $1,499 | 155 (29.4%) | 12 (5.8%) |
| $800 to $1,499 | 233 (44.1%) | 52 (25.1%) |
| Total | 528 (100.0%) | 207 (100.0%) |
Health & Disability in Reagan County
Health Insurance Coverage by Age in Reagan County
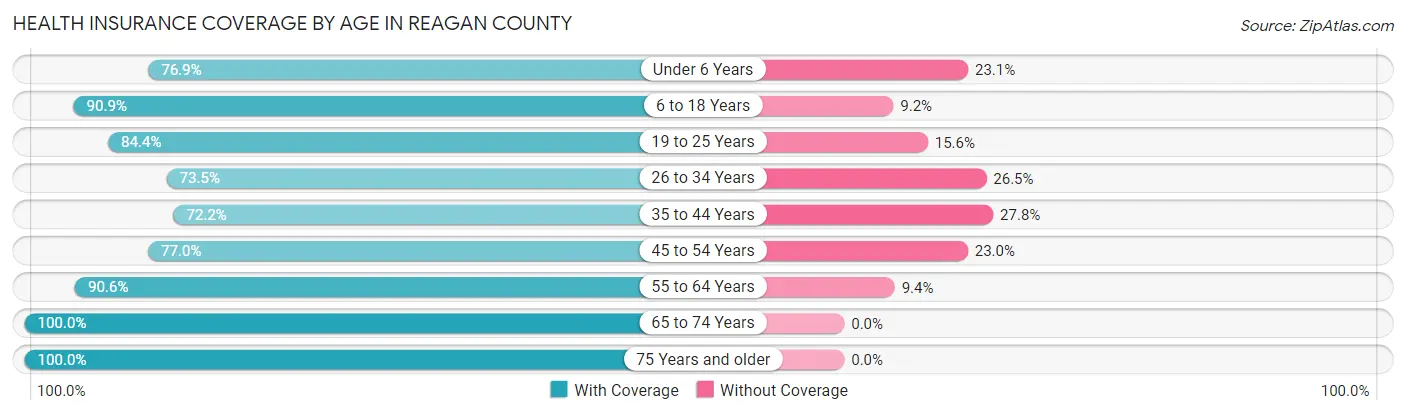
| Age Bracket | With Coverage | Without Coverage |
| Under 6 Years | 240 (76.9%) | 72 (23.1%) |
| 6 to 18 Years | 685 (90.8%) | 69 (9.1%) |
| 19 to 25 Years | 309 (84.4%) | 57 (15.6%) |
| 26 to 34 Years | 247 (73.5%) | 89 (26.5%) |
| 35 to 44 Years | 419 (72.2%) | 161 (27.8%) |
| 45 to 54 Years | 264 (77.0%) | 79 (23.0%) |
| 55 to 64 Years | 308 (90.6%) | 32 (9.4%) |
| 65 to 74 Years | 180 (100.0%) | 0 (0.0%) |
| 75 Years and older | 73 (100.0%) | 0 (0.0%) |
| Total | 2,725 (83.0%) | 559 (17.0%) |
Health Insurance Coverage by Citizenship Status in Reagan County
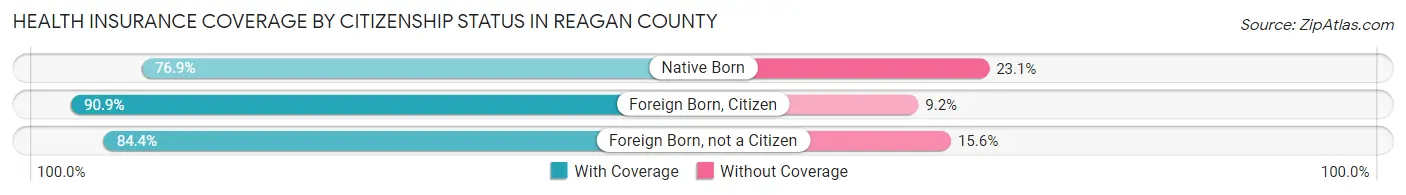
| Citizenship Status | With Coverage | Without Coverage |
| Native Born | 240 (76.9%) | 72 (23.1%) |
| Foreign Born, Citizen | 685 (90.8%) | 69 (9.1%) |
| Foreign Born, not a Citizen | 309 (84.4%) | 57 (15.6%) |
Health Insurance Coverage by Household Income in Reagan County
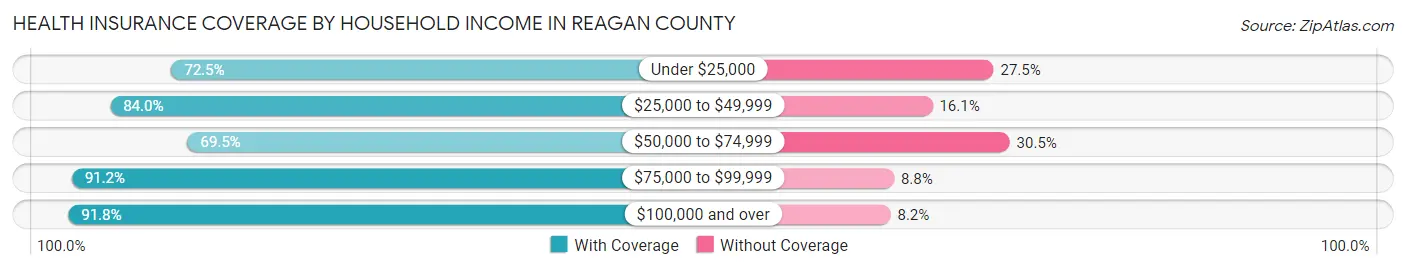
| Household Income | With Coverage | Without Coverage |
| Under $25,000 | 153 (72.5%) | 58 (27.5%) |
| $25,000 to $49,999 | 565 (84.0%) | 108 (16.1%) |
| $50,000 to $74,999 | 599 (69.5%) | 263 (30.5%) |
| $75,000 to $99,999 | 568 (91.2%) | 55 (8.8%) |
| $100,000 and over | 840 (91.8%) | 75 (8.2%) |
Public vs Private Health Insurance Coverage by Age in Reagan County
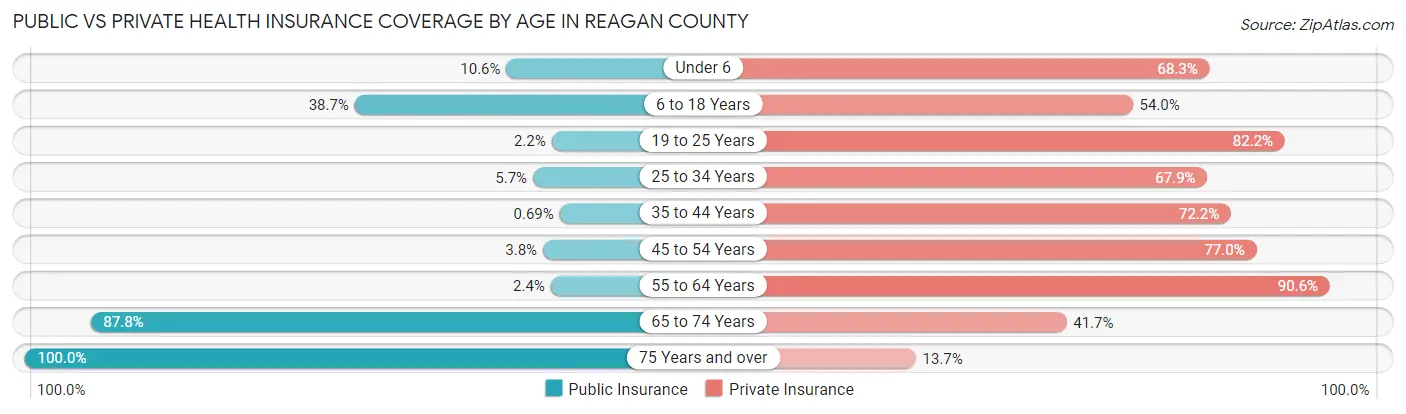
| Age Bracket | Public Insurance | Private Insurance |
| Under 6 | 33 (10.6%) | 213 (68.3%) |
| 6 to 18 Years | 292 (38.7%) | 407 (54.0%) |
| 19 to 25 Years | 8 (2.2%) | 301 (82.2%) |
| 25 to 34 Years | 19 (5.7%) | 228 (67.9%) |
| 35 to 44 Years | 4 (0.7%) | 419 (72.2%) |
| 45 to 54 Years | 13 (3.8%) | 264 (77.0%) |
| 55 to 64 Years | 8 (2.4%) | 308 (90.6%) |
| 65 to 74 Years | 158 (87.8%) | 75 (41.7%) |
| 75 Years and over | 73 (100.0%) | 10 (13.7%) |
| Total | 608 (18.5%) | 2,225 (67.7%) |
Disability Status by Sex by Age in Reagan County
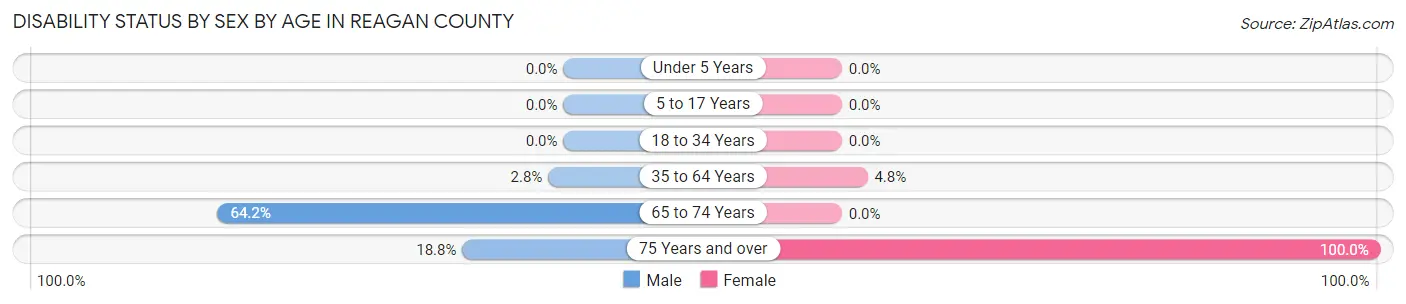
| Age Bracket | Male | Female |
| Under 5 Years | 0 (0.0%) | 0 (0.0%) |
| 5 to 17 Years | 0 (0.0%) | 0 (0.0%) |
| 18 to 34 Years | 0 (0.0%) | 0 (0.0%) |
| 35 to 64 Years | 19 (2.8%) | 28 (4.8%) |
| 65 to 74 Years | 86 (64.2%) | 0 (0.0%) |
| 75 Years and over | 9 (18.8%) | 25 (100.0%) |
Disability Class by Sex by Age in Reagan County
Disability Class: Hearing Difficulty
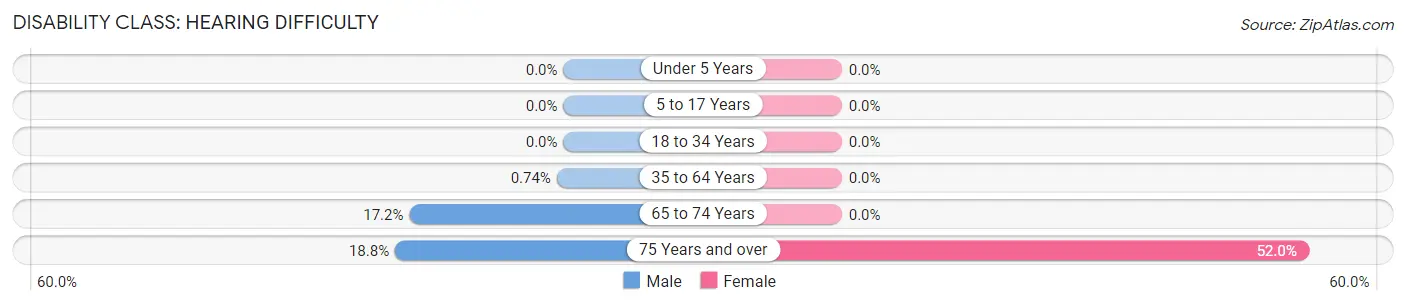
| Age Bracket | Male | Female |
| Under 5 Years | 0 (0.0%) | 0 (0.0%) |
| 5 to 17 Years | 0 (0.0%) | 0 (0.0%) |
| 18 to 34 Years | 0 (0.0%) | 0 (0.0%) |
| 35 to 64 Years | 5 (0.7%) | 0 (0.0%) |
| 65 to 74 Years | 23 (17.2%) | 0 (0.0%) |
| 75 Years and over | 9 (18.8%) | 13 (52.0%) |
Disability Class: Vision Difficulty
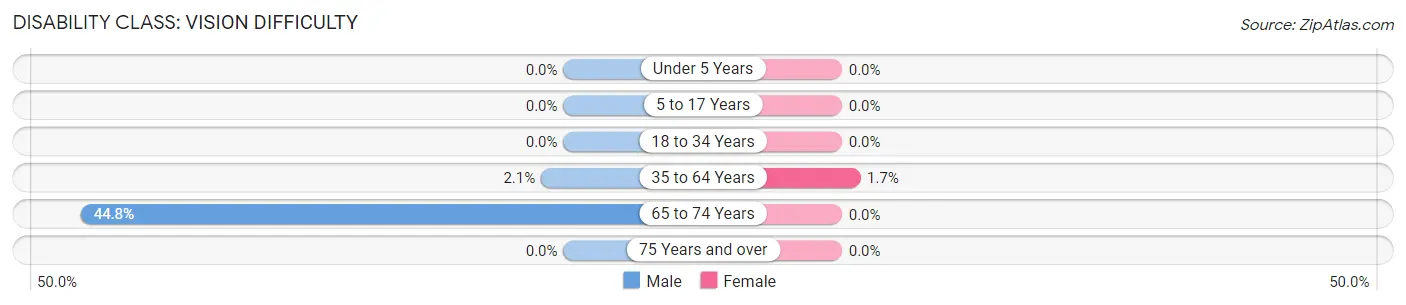
| Age Bracket | Male | Female |
| Under 5 Years | 0 (0.0%) | 0 (0.0%) |
| 5 to 17 Years | 0 (0.0%) | 0 (0.0%) |
| 18 to 34 Years | 0 (0.0%) | 0 (0.0%) |
| 35 to 64 Years | 14 (2.1%) | 10 (1.7%) |
| 65 to 74 Years | 60 (44.8%) | 0 (0.0%) |
| 75 Years and over | 0 (0.0%) | 0 (0.0%) |
Disability Class: Cognitive Difficulty
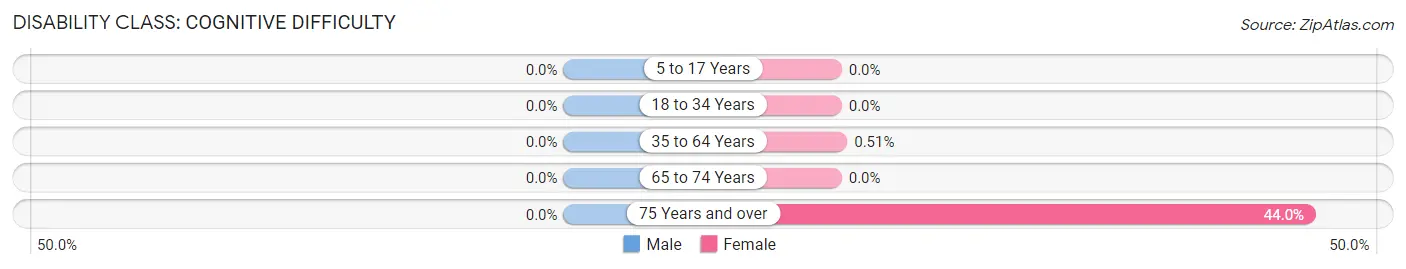
| Age Bracket | Male | Female |
| 5 to 17 Years | 0 (0.0%) | 0 (0.0%) |
| 18 to 34 Years | 0 (0.0%) | 0 (0.0%) |
| 35 to 64 Years | 0 (0.0%) | 3 (0.5%) |
| 65 to 74 Years | 0 (0.0%) | 0 (0.0%) |
| 75 Years and over | 0 (0.0%) | 11 (44.0%) |
Disability Class: Ambulatory Difficulty
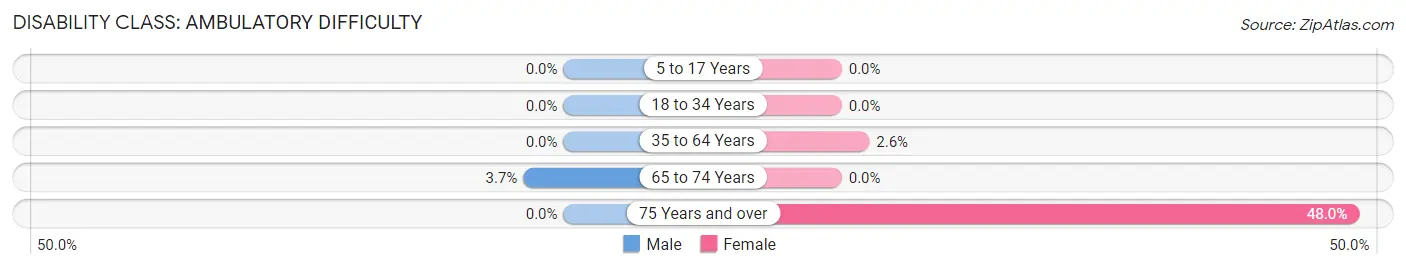
| Age Bracket | Male | Female |
| 5 to 17 Years | 0 (0.0%) | 0 (0.0%) |
| 18 to 34 Years | 0 (0.0%) | 0 (0.0%) |
| 35 to 64 Years | 0 (0.0%) | 15 (2.6%) |
| 65 to 74 Years | 5 (3.7%) | 0 (0.0%) |
| 75 Years and over | 0 (0.0%) | 12 (48.0%) |
Disability Class: Self-Care Difficulty
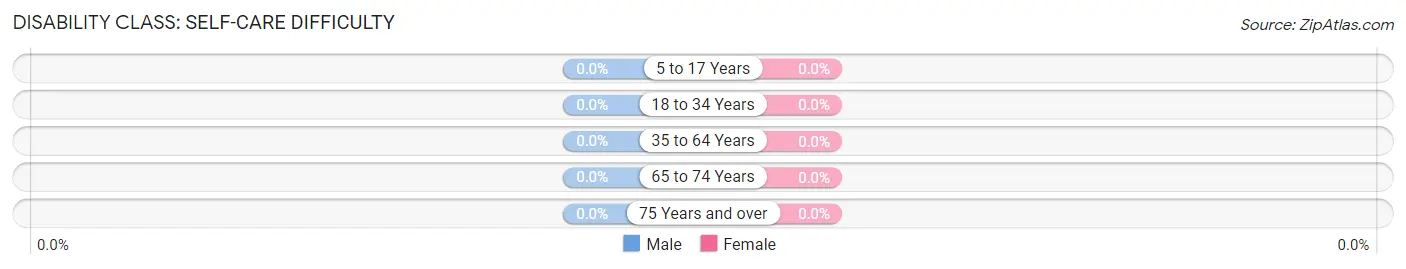
| Age Bracket | Male | Female |
| 5 to 17 Years | 0 (0.0%) | 0 (0.0%) |
| 18 to 34 Years | 0 (0.0%) | 0 (0.0%) |
| 35 to 64 Years | 0 (0.0%) | 0 (0.0%) |
| 65 to 74 Years | 0 (0.0%) | 0 (0.0%) |
| 75 Years and over | 0 (0.0%) | 0 (0.0%) |
Technology Access in Reagan County
Computing Device Access in Reagan County
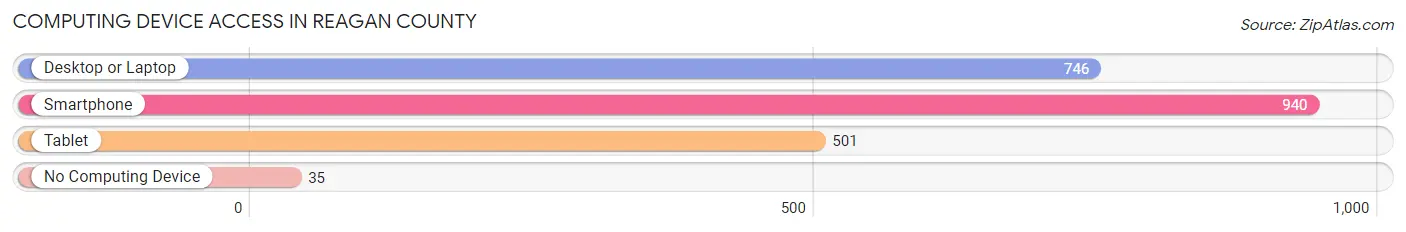
| Device Type | # Households | % Households |
| Desktop or Laptop | 746 | 68.4% |
| Smartphone | 940 | 86.2% |
| Tablet | 501 | 46.0% |
| No Computing Device | 35 | 3.2% |
| Total | 1,090 | 100.0% |
Internet Access in Reagan County
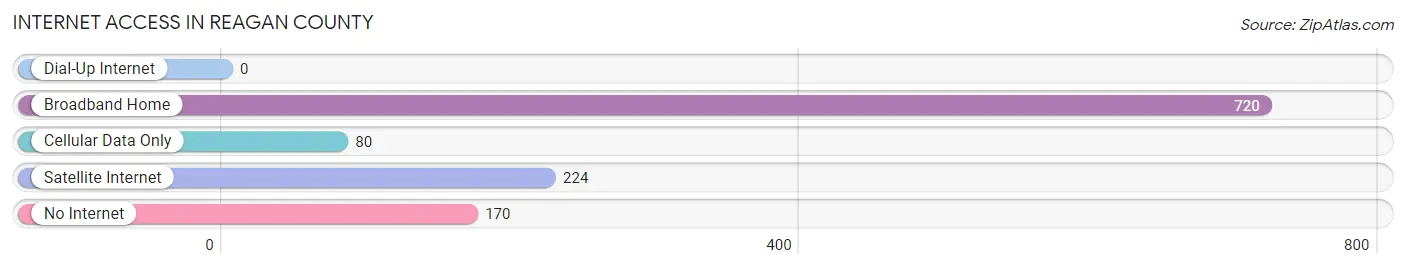
| Internet Type | # Households | % Households |
| Dial-Up Internet | 0 | 0.0% |
| Broadband Home | 720 | 66.1% |
| Cellular Data Only | 80 | 7.3% |
| Satellite Internet | 224 | 20.5% |
| No Internet | 170 | 15.6% |
| Total | 1,090 | 100.0% |
Reagan County Summary
Reagan County is a county located in the state of Texas, in the United States. It is part of the Big Bend region of West Texas and is bordered by Crockett County to the north, Upton County to the east, Irion County to the south, and Pecos County to the west. The county seat is Big Lake, and the largest city is Big Lake. As of the 2010 census, the population was 3,367, making it the second-least populous county in Texas.
History
Reagan County was created in 1903 from Tom Green County. It was named for John Henninger Reagan, a Confederate postmaster general and U.S. senator from Texas. The county was originally part of the Edwards Plateau, but was later divided into two parts by the Pecos River.
Geography
Reagan County is located in the Big Bend region of West Texas. It is bordered by Crockett County to the north, Upton County to the east, Irion County to the south, and Pecos County to the west. The county has a total area of 902 square miles, of which 899 square miles is land and 3 square miles (0.3%) is water.
The terrain of Reagan County is mostly flat to rolling plains, with some rugged hills in the western part of the county. The Pecos River forms the western boundary of the county, and the Concho River forms the eastern boundary. The county is part of the Edwards Plateau, and is home to several species of wildlife, including white-tailed deer, javelina, and wild turkey.
Economy
The economy of Reagan County is largely based on agriculture and oil and gas production. The county is home to several large ranches, and the main crops grown in the area are cotton, sorghum, and wheat. Oil and gas production is also a major industry in the county, and there are several active oil and gas wells in the area.
Demographics
As of the 2010 census, there were 3,367 people, 1,093 households, and 817 families living in the county. The population density was 4 people per square mile. There were 1,521 housing units at an average density of 2 per square mile. The racial makeup of the county was 81.3% White, 0.3% Black or African American, 0.7% Native American, 0.1% Asian, 15.2% from other races, and 2.4% from two or more races. 37.2% of the population were Hispanic or Latino of any race.
There were 1,093 households, out of which 33.2% had children under the age of 18 living with them, 59.2% were married couples living together, 9.7% had a female householder with no husband present, and 26.2% were non-families. 22.7% of all households were made up of individuals, and 10.2% had someone living alone who was 65 years of age or older. The average household size was 2.76 and the average family size was 3.25.
In the county, the population was spread out, with 28.2% under the age of 18, 8.2% from 18 to 24, 25.2% from 25 to 44, 24.2% from 45 to 64, and 14.2% who were 65 years of age or older. The median age was 37 years. For every 100 females there were 103.2 males. For every 100 females age 18 and over, there were 103.2 males.
The median income for a household in the county was $31,250, and the median income for a family was $36,250. Males had a median income of $30,000 versus $20,000 for females. The per capita income for the county was $14,845. About 16.2% of families and 19.2% of the population were below the poverty line, including 25.2% of those under age 18 and 15.2% of those age 65 or over.
Common Questions
What is Per Capita Income in Reagan County?
Per Capita income in Reagan County is $28,765.
What is the Median Family Income in Reagan County?
Median Family Income in Reagan County is $79,000.
What is the Median Household income in Reagan County?
Median Household Income in Reagan County is $70,319.
What is Income or Wage Gap in Reagan County?
Income or Wage Gap in Reagan County is 32.7%.
Women in Reagan County earn 67.3 cents for every dollar earned by a man.
What is Family Income Deficit in Reagan County?
Family Income Deficit in Reagan County is $5,960.
Families that are below poverty line in Reagan County earn $5,960 less on average than the poverty threshold level.
What is Inequality or Gini Index in Reagan County?
Inequality or Gini Index in Reagan County is 0.36.
What is the Total Population of Reagan County?
Total Population of Reagan County is 3,308.
What is the Total Male Population of Reagan County?
Total Male Population of Reagan County is 1,697.
What is the Total Female Population of Reagan County?
Total Female Population of Reagan County is 1,611.
What is the Ratio of Males per 100 Females in Reagan County?
There are 105.34 Males per 100 Females in Reagan County.
What is the Ratio of Females per 100 Males in Reagan County?
There are 94.93 Females per 100 Males in Reagan County.
What is the Median Population Age in Reagan County?
Median Population Age in Reagan County is 33.0 Years.
What is the Average Family Size in Reagan County
Average Family Size in Reagan County is 3.4 People.
What is the Average Household Size in Reagan County
Average Household Size in Reagan County is 3.0 People.
How Large is the Labor Force in Reagan County?
There are 1,719 People in the Labor Forcein in Reagan County.
What is the Percentage of People in the Labor Force in Reagan County?
72.6% of People are in the Labor Force in Reagan County.
What is the Unemployment Rate in Reagan County?
Unemployment Rate in Reagan County is 8.7%.