Randall County, TX Map & Demographics
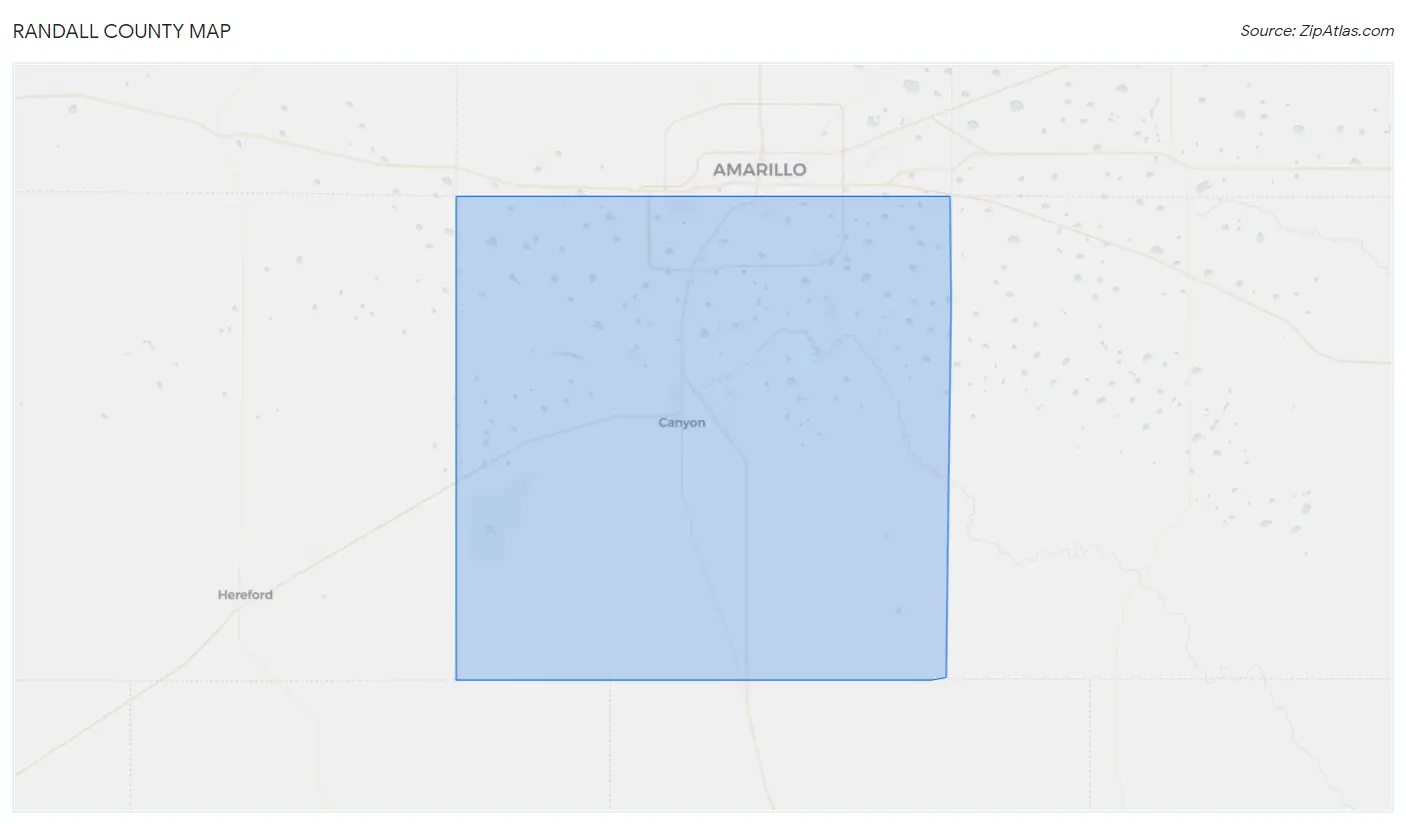
Randall County Map
Randall County Overview
$40,047
PER CAPITA INCOME
$97,611
AVG FAMILY INCOME
$78,038
AVG HOUSEHOLD INCOME
36.6%
WAGE / INCOME GAP [ % ]
63.4¢/ $1
WAGE / INCOME GAP [ $ ]
$9,583
FAMILY INCOME DEFICIT
0.43
INEQUALITY / GINI INDEX
141,489
TOTAL POPULATION
70,037
MALE POPULATION
71,452
FEMALE POPULATION
98.02
MALES / 100 FEMALES
102.02
FEMALES / 100 MALES
36.4
MEDIAN AGE
3.1
AVG FAMILY SIZE
2.5
AVG HOUSEHOLD SIZE
75,354
LABOR FORCE [ PEOPLE ]
67.6%
PERCENT IN LABOR FORCE
2.8%
UNEMPLOYMENT RATE
Randall County Area Codes
Income in Randall County
Income Overview in Randall County
Per Capita Income in Randall County is $40,047, while median incomes of families and households are $97,611 and $78,038 respectively.
| Characteristic | Number | Measure |
| Per Capita Income | 141,489 | $40,047 |
| Median Family Income | 36,863 | $97,611 |
| Mean Family Income | 36,863 | $119,588 |
| Median Household Income | 54,984 | $78,038 |
| Mean Household Income | 54,984 | $99,601 |
| Income Deficit | 36,863 | $9,583 |
| Wage / Income Gap (%) | 141,489 | 36.60% |
| Wage / Income Gap ($) | 141,489 | 63.40¢ per $1 |
| Gini / Inequality Index | 141,489 | 0.43 |
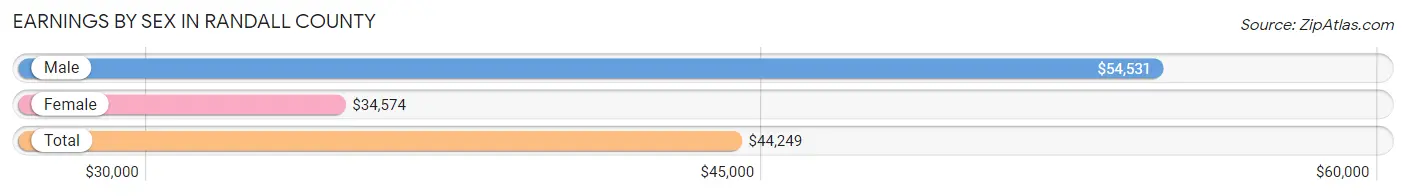
Earnings by Sex in Randall County
Average Earnings in Randall County are $44,249, $54,531 for men and $34,574 for women, a difference of 36.6%.
| Sex | Number | Average Earnings |
| Male | 41,632 (53.1%) | $54,531 |
| Female | 36,724 (46.9%) | $34,574 |
| Total | 78,356 (100.0%) | $44,249 |
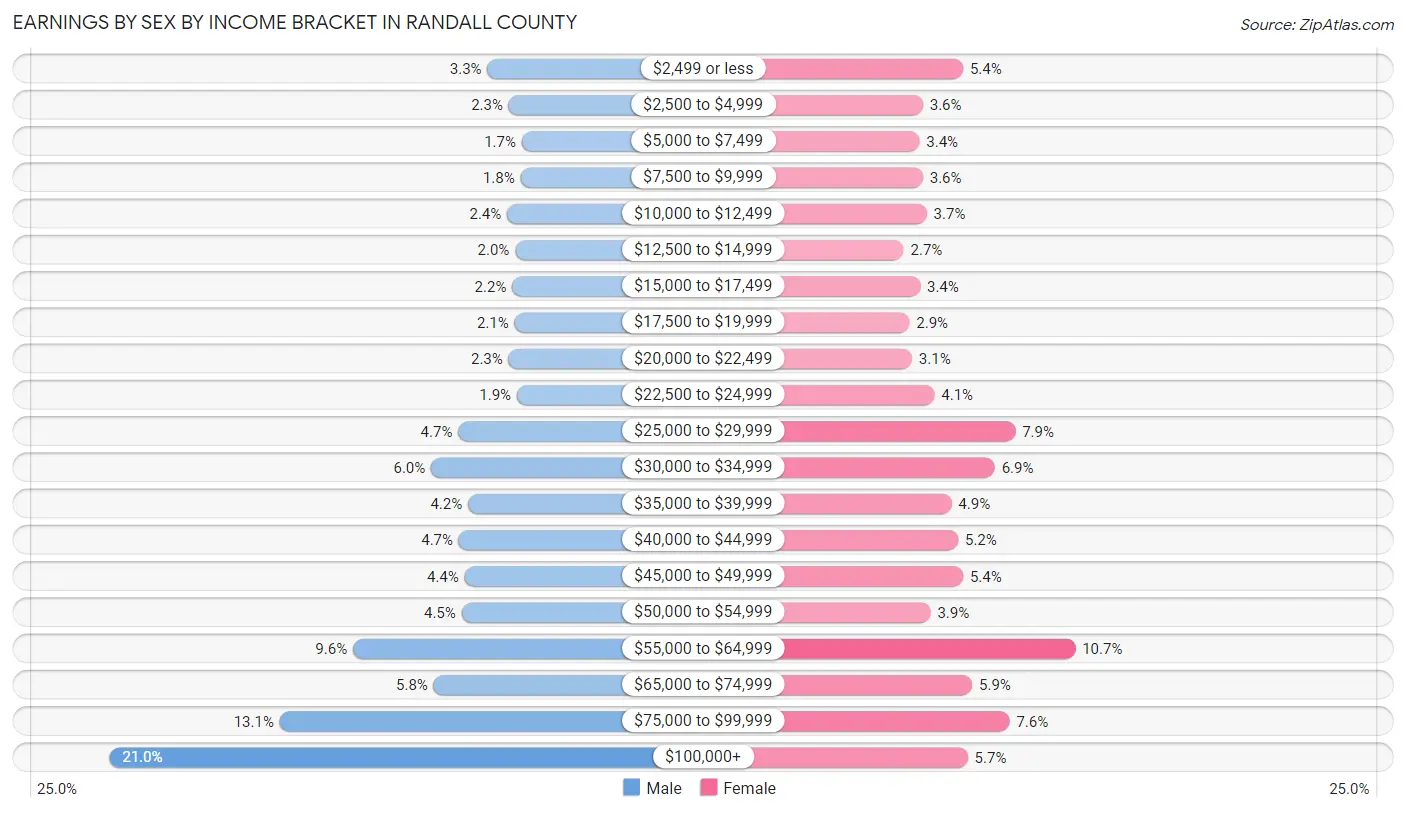
Earnings by Sex by Income Bracket in Randall County
The most common earnings brackets in Randall County are $100,000+ for men (8,755 | 21.0%) and $55,000 to $64,999 for women (3,928 | 10.7%).
| Income | Male | Female |
| $2,499 or less | 1,381 (3.3%) | 1,998 (5.4%) |
| $2,500 to $4,999 | 964 (2.3%) | 1,306 (3.6%) |
| $5,000 to $7,499 | 713 (1.7%) | 1,250 (3.4%) |
| $7,500 to $9,999 | 737 (1.8%) | 1,308 (3.6%) |
| $10,000 to $12,499 | 999 (2.4%) | 1,372 (3.7%) |
| $12,500 to $14,999 | 839 (2.0%) | 977 (2.7%) |
| $15,000 to $17,499 | 898 (2.2%) | 1,259 (3.4%) |
| $17,500 to $19,999 | 853 (2.1%) | 1,076 (2.9%) |
| $20,000 to $22,499 | 968 (2.3%) | 1,119 (3.0%) |
| $22,500 to $24,999 | 809 (1.9%) | 1,505 (4.1%) |
| $25,000 to $29,999 | 1,953 (4.7%) | 2,897 (7.9%) |
| $30,000 to $34,999 | 2,483 (6.0%) | 2,545 (6.9%) |
| $35,000 to $39,999 | 1,760 (4.2%) | 1,801 (4.9%) |
| $40,000 to $44,999 | 1,939 (4.7%) | 1,913 (5.2%) |
| $45,000 to $49,999 | 1,826 (4.4%) | 1,998 (5.4%) |
| $50,000 to $54,999 | 1,886 (4.5%) | 1,440 (3.9%) |
| $55,000 to $64,999 | 4,004 (9.6%) | 3,928 (10.7%) |
| $65,000 to $74,999 | 2,432 (5.8%) | 2,156 (5.9%) |
| $75,000 to $99,999 | 5,433 (13.1%) | 2,797 (7.6%) |
| $100,000+ | 8,755 (21.0%) | 2,079 (5.7%) |
| Total | 41,632 (100.0%) | 36,724 (100.0%) |
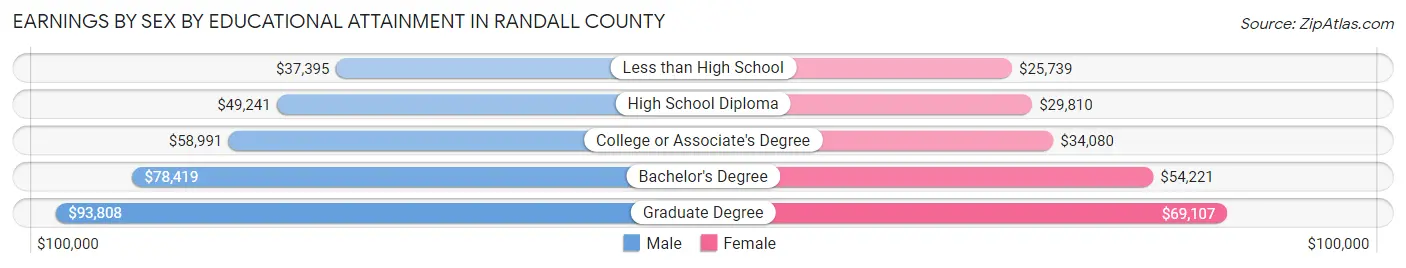
Earnings by Sex by Educational Attainment in Randall County
Average earnings in Randall County are $62,091 for men and $41,182 for women, a difference of 33.7%. Men with an educational attainment of graduate degree enjoy the highest average annual earnings of $93,808, while those with less than high school education earn the least with $37,395. Women with an educational attainment of graduate degree earn the most with the average annual earnings of $69,107, while those with less than high school education have the smallest earnings of $25,739.
| Educational Attainment | Male Income | Female Income |
| Less than High School | $37,395 | $25,739 |
| High School Diploma | $49,241 | $29,810 |
| College or Associate's Degree | $58,991 | $34,080 |
| Bachelor's Degree | $78,419 | $54,221 |
| Graduate Degree | $93,808 | $69,107 |
| Total | $62,091 | $41,182 |
Family Income in Randall County
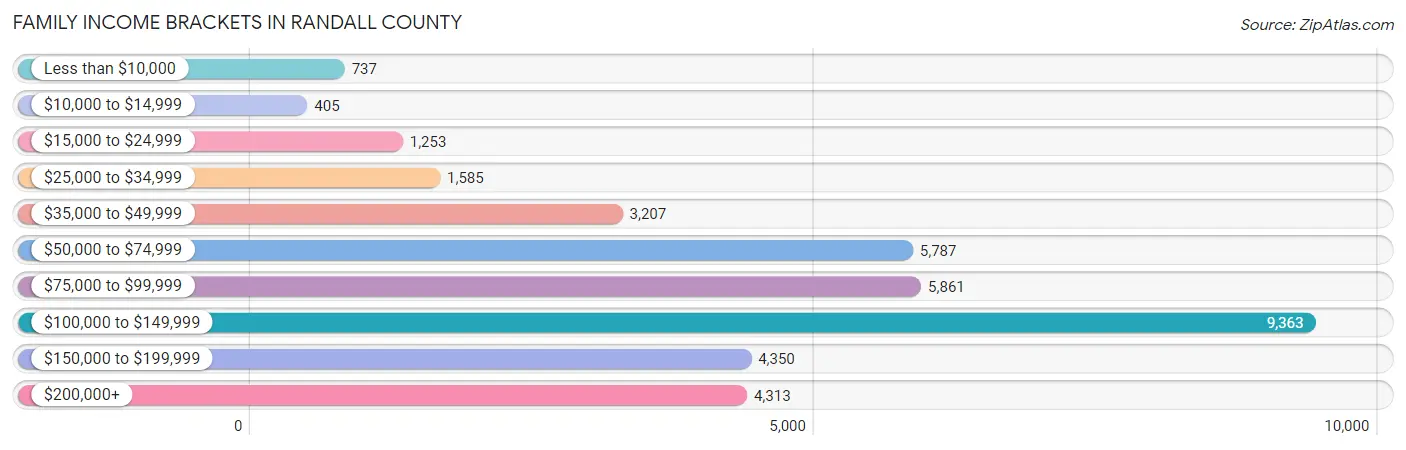
Family Income Brackets in Randall County
According to the Randall County family income data, there are 9,363 families falling into the $100,000 to $149,999 income range, which is the most common income bracket and makes up 25.4% of all families. Conversely, the $10,000 to $14,999 income bracket is the least frequent group with only 405 families (1.1%) belonging to this category.
| Income Bracket | # Families | % Families |
| Less than $10,000 | 737 | 2.0% |
| $10,000 to $14,999 | 405 | 1.1% |
| $15,000 to $24,999 | 1,253 | 3.4% |
| $25,000 to $34,999 | 1,585 | 4.3% |
| $35,000 to $49,999 | 3,207 | 8.7% |
| $50,000 to $74,999 | 5,787 | 15.7% |
| $75,000 to $99,999 | 5,861 | 15.9% |
| $100,000 to $149,999 | 9,363 | 25.4% |
| $150,000 to $199,999 | 4,350 | 11.8% |
| $200,000+ | 4,313 | 11.7% |
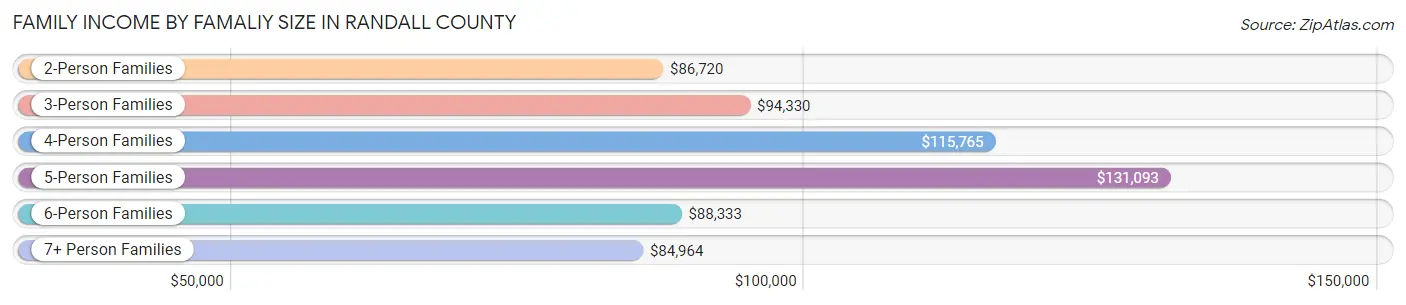
Family Income by Famaliy Size in Randall County
5-person families (3,222 | 8.7%) account for the highest median family income in Randall County with $131,093 per family, while 2-person families (17,597 | 47.7%) have the highest median income of $43,360 per family member.
| Income Bracket | # Families | Median Income |
| 2-Person Families | 17,597 (47.7%) | $86,720 |
| 3-Person Families | 7,840 (21.3%) | $94,330 |
| 4-Person Families | 6,888 (18.7%) | $115,765 |
| 5-Person Families | 3,222 (8.7%) | $131,093 |
| 6-Person Families | 768 (2.1%) | $88,333 |
| 7+ Person Families | 548 (1.5%) | $84,964 |
| Total | 36,863 (100.0%) | $97,611 |
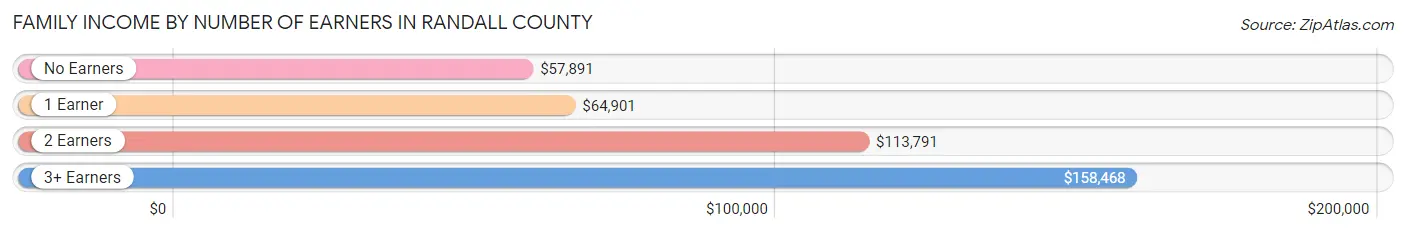
Family Income by Number of Earners in Randall County
The median family income in Randall County is $97,611, with families comprising 3+ earners (3,914) having the highest median family income of $158,468, while families with no earners (4,460) have the lowest median family income of $57,891, accounting for 10.6% and 12.1% of families, respectively.
| Number of Earners | # Families | Median Income |
| No Earners | 4,460 (12.1%) | $57,891 |
| 1 Earner | 11,127 (30.2%) | $64,901 |
| 2 Earners | 17,362 (47.1%) | $113,791 |
| 3+ Earners | 3,914 (10.6%) | $158,468 |
| Total | 36,863 (100.0%) | $97,611 |
Household Income in Randall County
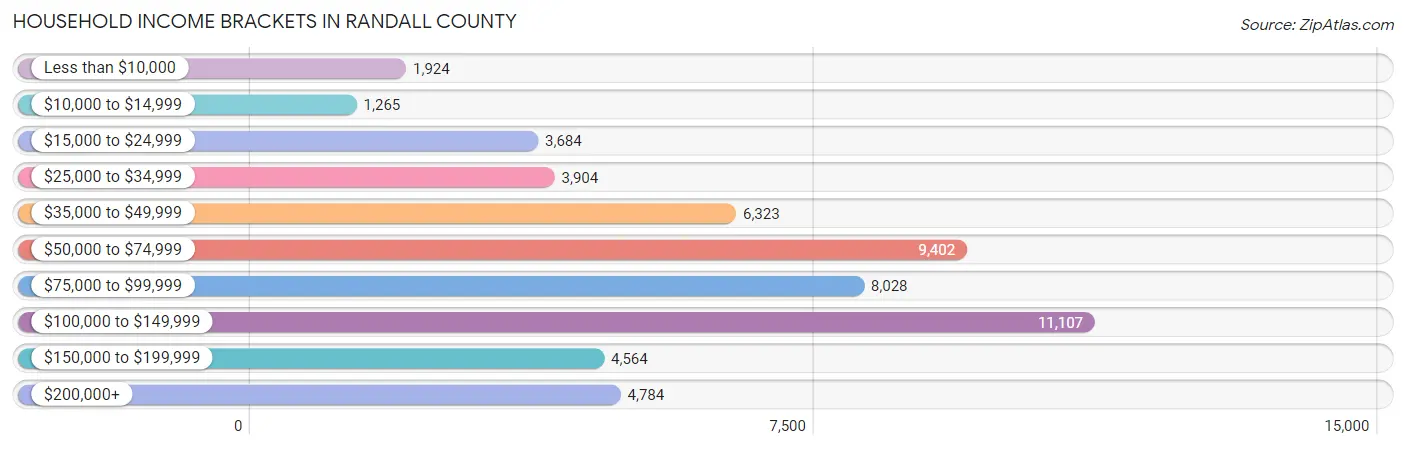
Household Income Brackets in Randall County
With 11,107 households falling in the category, the $100,000 to $149,999 income range is the most frequent in Randall County, accounting for 20.2% of all households. In contrast, only 1,265 households (2.3%) fall into the $10,000 to $14,999 income bracket, making it the least populous group.
| Income Bracket | # Households | % Households |
| Less than $10,000 | 1,924 | 3.5% |
| $10,000 to $14,999 | 1,265 | 2.3% |
| $15,000 to $24,999 | 3,684 | 6.7% |
| $25,000 to $34,999 | 3,904 | 7.1% |
| $35,000 to $49,999 | 6,323 | 11.5% |
| $50,000 to $74,999 | 9,402 | 17.1% |
| $75,000 to $99,999 | 8,028 | 14.6% |
| $100,000 to $149,999 | 11,107 | 20.2% |
| $150,000 to $199,999 | 4,564 | 8.3% |
| $200,000+ | 4,784 | 8.7% |
Household Income by Householder Age in Randall County
The median household income in Randall County is $78,038, with the highest median household income of $100,763 found in the 45 to 64 years age bracket for the primary householder. A total of 17,719 households (32.2%) fall into this category. Meanwhile, the 15 to 24 years age bracket for the primary householder has the lowest median household income of $34,666, with 2,972 households (5.4%) in this group.
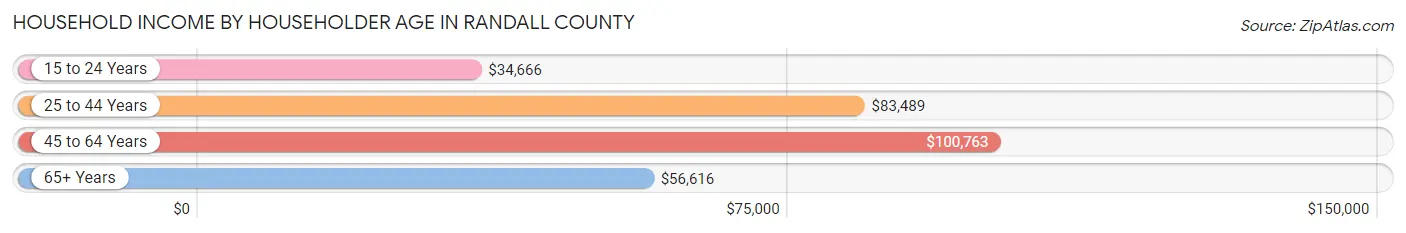
| Income Bracket | # Households | Median Income |
| 15 to 24 Years | 2,972 (5.4%) | $34,666 |
| 25 to 44 Years | 20,584 (37.4%) | $83,489 |
| 45 to 64 Years | 17,719 (32.2%) | $100,763 |
| 65+ Years | 13,709 (24.9%) | $56,616 |
| Total | 54,984 (100.0%) | $78,038 |
Poverty in Randall County
Income Below Poverty by Sex and Age in Randall County
With 7.4% poverty level for males and 11.4% for females among the residents of Randall County, 18 to 24 year old males and 18 to 24 year old females are the most vulnerable to poverty, with 918 males (14.2%) and 1,378 females (22.0%) in their respective age groups living below the poverty level.
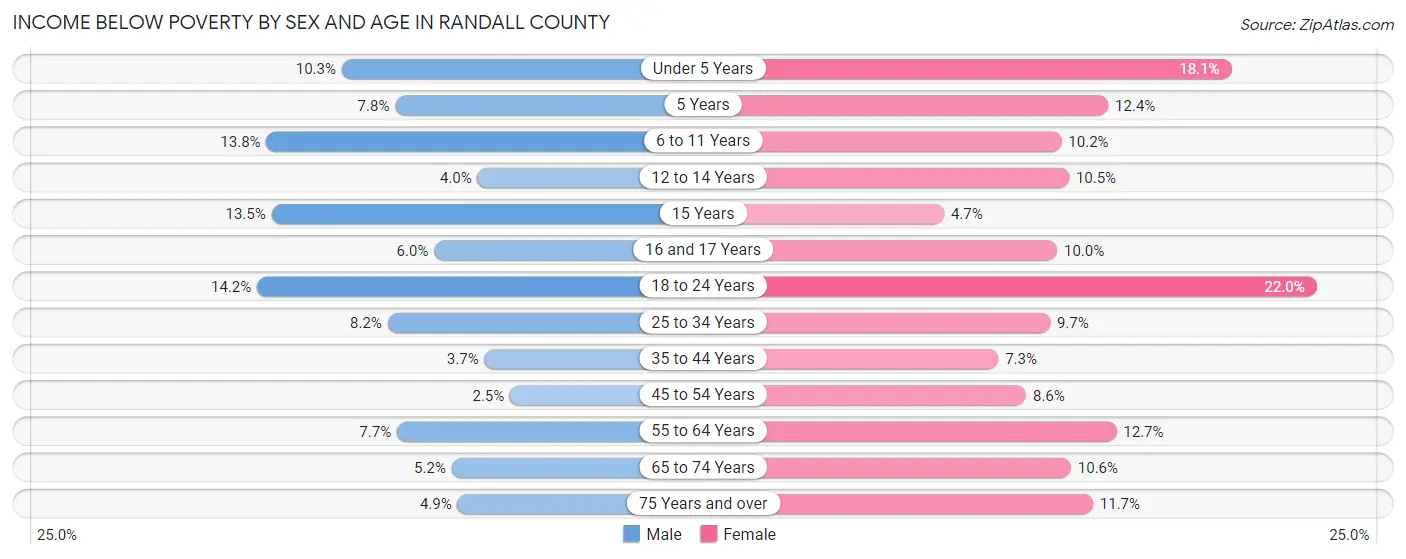
| Age Bracket | Male | Female |
| Under 5 Years | 438 (10.3%) | 709 (18.1%) |
| 5 Years | 65 (7.8%) | 89 (12.4%) |
| 6 to 11 Years | 836 (13.8%) | 599 (10.2%) |
| 12 to 14 Years | 110 (4.0%) | 309 (10.5%) |
| 15 Years | 125 (13.5%) | 55 (4.7%) |
| 16 and 17 Years | 125 (6.0%) | 165 (10.0%) |
| 18 to 24 Years | 918 (14.2%) | 1,378 (22.0%) |
| 25 to 34 Years | 796 (8.2%) | 939 (9.7%) |
| 35 to 44 Years | 366 (3.7%) | 697 (7.3%) |
| 45 to 54 Years | 194 (2.5%) | 677 (8.6%) |
| 55 to 64 Years | 602 (7.7%) | 1,062 (12.7%) |
| 65 to 74 Years | 319 (5.2%) | 745 (10.6%) |
| 75 Years and over | 174 (4.9%) | 580 (11.7%) |
| Total | 5,068 (7.4%) | 8,004 (11.4%) |
Income Above Poverty by Sex and Age in Randall County
According to the poverty statistics in Randall County, males aged 45 to 54 years and females aged 15 years are the age groups that are most secure financially, with 97.5% of males and 95.3% of females in these age groups living above the poverty line.
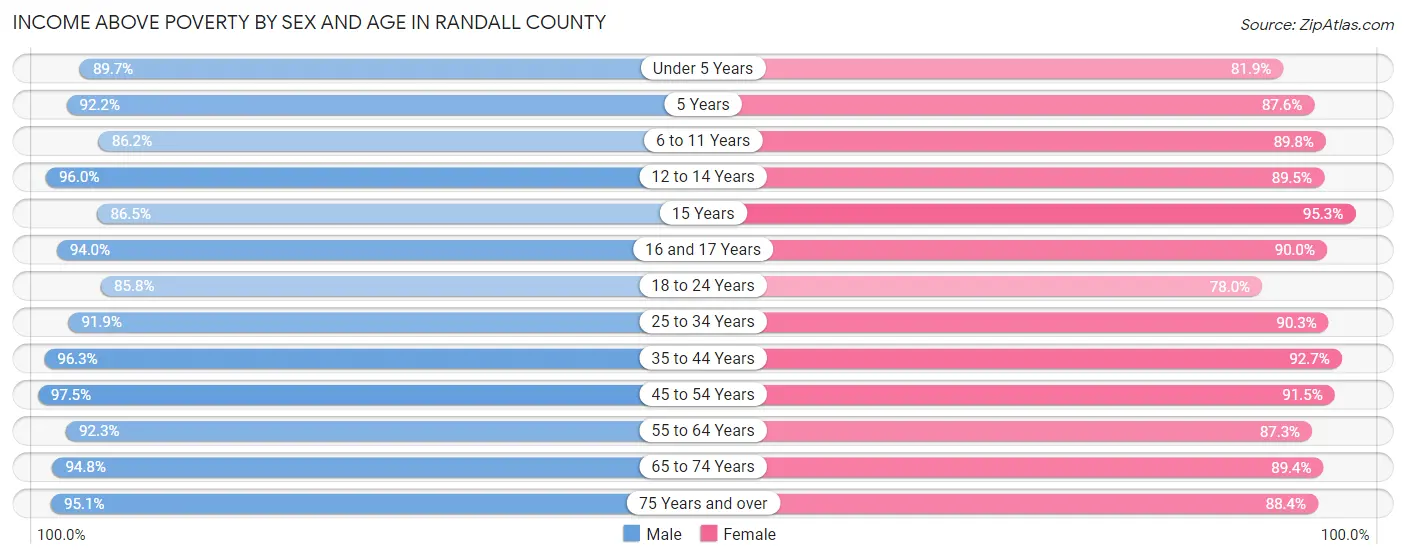
| Age Bracket | Male | Female |
| Under 5 Years | 3,821 (89.7%) | 3,213 (81.9%) |
| 5 Years | 768 (92.2%) | 631 (87.6%) |
| 6 to 11 Years | 5,230 (86.2%) | 5,282 (89.8%) |
| 12 to 14 Years | 2,651 (96.0%) | 2,623 (89.5%) |
| 15 Years | 798 (86.5%) | 1,105 (95.3%) |
| 16 and 17 Years | 1,963 (94.0%) | 1,487 (90.0%) |
| 18 to 24 Years | 5,542 (85.8%) | 4,876 (78.0%) |
| 25 to 34 Years | 8,968 (91.8%) | 8,783 (90.3%) |
| 35 to 44 Years | 9,626 (96.3%) | 8,904 (92.7%) |
| 45 to 54 Years | 7,647 (97.5%) | 7,244 (91.4%) |
| 55 to 64 Years | 7,194 (92.3%) | 7,277 (87.3%) |
| 65 to 74 Years | 5,840 (94.8%) | 6,263 (89.4%) |
| 75 Years and over | 3,368 (95.1%) | 4,397 (88.3%) |
| Total | 63,416 (92.6%) | 62,085 (88.6%) |
Income Below Poverty Among Married-Couple Families in Randall County
The poverty statistics for married-couple families in Randall County show that 4.0% or 1,162 of the total 29,374 families live below the poverty line. Families with 5 or more children have the highest poverty rate of 9.0%, comprising of 22 families. On the other hand, families with 3 or 4 children have the lowest poverty rate of 2.7%, which includes 78 families.
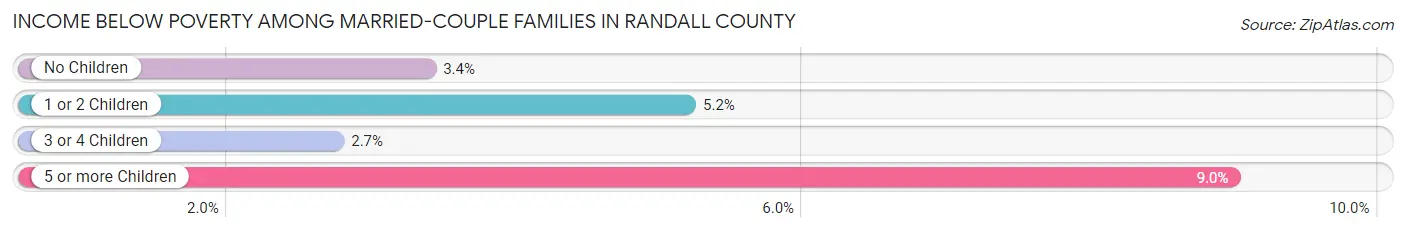
| Children | Above Poverty | Below Poverty |
| No Children | 16,124 (96.6%) | 564 (3.4%) |
| 1 or 2 Children | 9,100 (94.8%) | 498 (5.2%) |
| 3 or 4 Children | 2,765 (97.3%) | 78 (2.7%) |
| 5 or more Children | 223 (91.0%) | 22 (9.0%) |
| Total | 28,212 (96.0%) | 1,162 (4.0%) |
Income Below Poverty Among Single-Parent Households in Randall County
According to the poverty data in Randall County, 9.0% or 209 single-father households and 22.0% or 1,138 single-mother households are living below the poverty line. Among single-father households, those with 3 or 4 children have the highest poverty rate, with 84 households (24.8%) experiencing poverty. Likewise, among single-mother households, those with 5 or more children have the highest poverty rate, with 59 households (95.2%) falling below the poverty line.
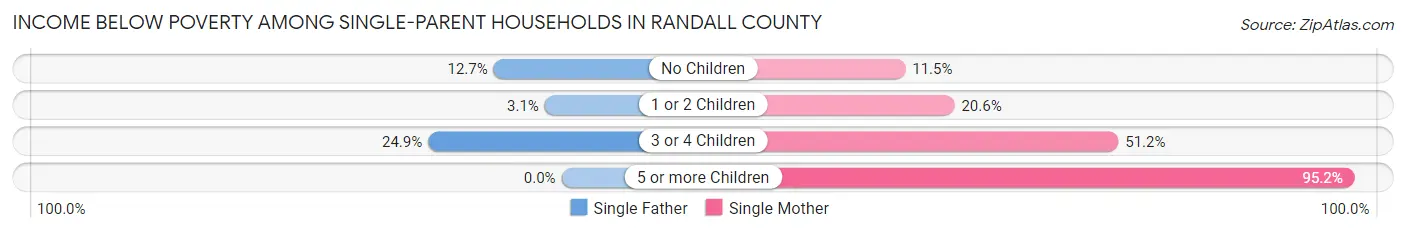
| Children | Single Father | Single Mother |
| No Children | 84 (12.7%) | 186 (11.5%) |
| 1 or 2 Children | 41 (3.1%) | 606 (20.6%) |
| 3 or 4 Children | 84 (24.8%) | 287 (51.2%) |
| 5 or more Children | 0 (0.0%) | 59 (95.2%) |
| Total | 209 (9.0%) | 1,138 (22.0%) |
Income Below Poverty Among Married-Couple vs Single-Parent Households in Randall County
The poverty data for Randall County shows that 1,162 of the married-couple family households (4.0%) and 1,347 of the single-parent households (18.0%) are living below the poverty level. Within the married-couple family households, those with 5 or more children have the highest poverty rate, with 22 households (9.0%) falling below the poverty line. Among the single-parent households, those with 5 or more children have the highest poverty rate, with 59 household (95.2%) living below poverty.
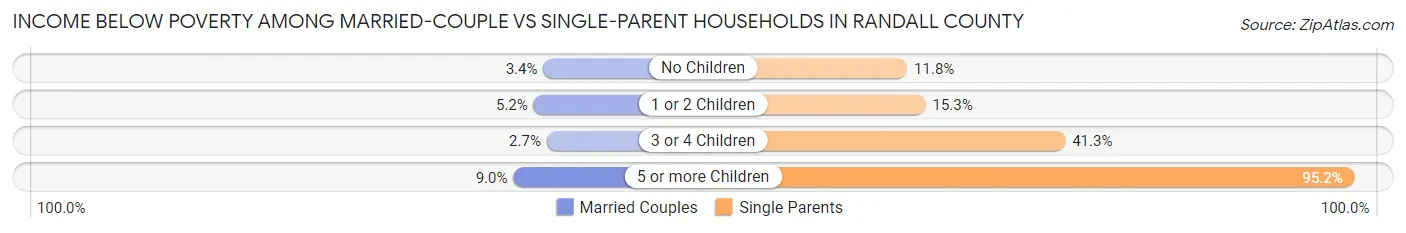
| Children | Married-Couple Families | Single-Parent Households |
| No Children | 564 (3.4%) | 270 (11.8%) |
| 1 or 2 Children | 498 (5.2%) | 647 (15.2%) |
| 3 or 4 Children | 78 (2.7%) | 371 (41.3%) |
| 5 or more Children | 22 (9.0%) | 59 (95.2%) |
| Total | 1,162 (4.0%) | 1,347 (18.0%) |
Race in Randall County
The most populous races in Randall County are White / Caucasian (113,385 | 80.1%), Hispanic or Latino (33,883 | 23.9%), and Two or more Races (14,774 | 10.4%).
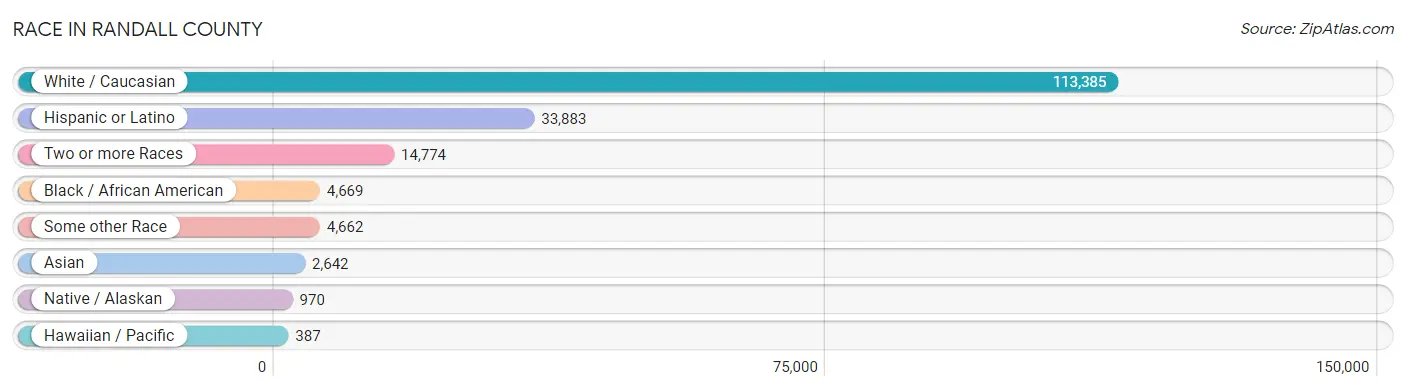
| Race | # Population | % Population |
| Asian | 2,642 | 1.9% |
| Black / African American | 4,669 | 3.3% |
| Hawaiian / Pacific | 387 | 0.3% |
| Hispanic or Latino | 33,883 | 23.9% |
| Native / Alaskan | 970 | 0.7% |
| White / Caucasian | 113,385 | 80.1% |
| Two or more Races | 14,774 | 10.4% |
| Some other Race | 4,662 | 3.3% |
| Total | 141,489 | 100.0% |
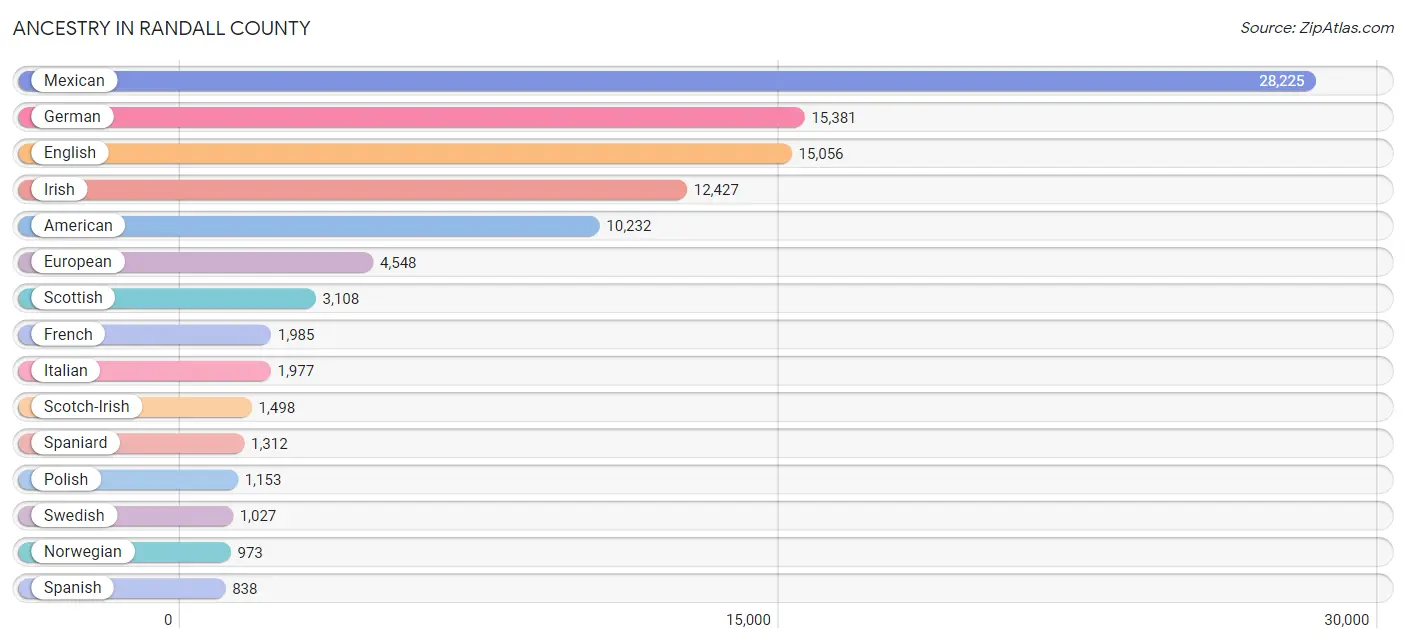
Ancestry in Randall County
The most populous ancestries reported in Randall County are Mexican (28,225 | 20.0%), German (15,381 | 10.9%), English (15,056 | 10.6%), Irish (12,427 | 8.8%), and American (10,232 | 7.2%), together accounting for 57.5% of all Randall County residents.
| Ancestry | # Population | % Population |
| Afghan | 36 | 0.0% |
| African | 437 | 0.3% |
| Albanian | 84 | 0.1% |
| Aleut | 29 | 0.0% |
| American | 10,232 | 7.2% |
| Apache | 418 | 0.3% |
| Arab | 274 | 0.2% |
| Argentinean | 127 | 0.1% |
| Australian | 68 | 0.1% |
| Austrian | 81 | 0.1% |
| Bahamian | 5 | 0.0% |
| Bangladeshi | 82 | 0.1% |
| Basque | 69 | 0.1% |
| Belgian | 6 | 0.0% |
| Bhutanese | 106 | 0.1% |
| Blackfeet | 27 | 0.0% |
| Bolivian | 27 | 0.0% |
| Brazilian | 23 | 0.0% |
| British | 751 | 0.5% |
| Bulgarian | 30 | 0.0% |
| Burmese | 223 | 0.2% |
| Cajun | 1 | 0.0% |
| Canadian | 130 | 0.1% |
| Celtic | 41 | 0.0% |
| Central American | 145 | 0.1% |
| Central American Indian | 30 | 0.0% |
| Cherokee | 483 | 0.3% |
| Chickasaw | 72 | 0.1% |
| Chippewa | 9 | 0.0% |
| Choctaw | 243 | 0.2% |
| Colombian | 69 | 0.1% |
| Comanche | 35 | 0.0% |
| Creek | 122 | 0.1% |
| Croatian | 100 | 0.1% |
| Cuban | 187 | 0.1% |
| Czech | 234 | 0.2% |
| Czechoslovakian | 80 | 0.1% |
| Danish | 190 | 0.1% |
| Dominican | 34 | 0.0% |
| Dutch | 790 | 0.6% |
| Dutch West Indian | 30 | 0.0% |
| Eastern European | 117 | 0.1% |
| Ecuadorian | 187 | 0.1% |
| English | 15,056 | 10.6% |
| Ethiopian | 7 | 0.0% |
| European | 4,548 | 3.2% |
| Finnish | 8 | 0.0% |
| French | 1,985 | 1.4% |
| French American Indian | 2 | 0.0% |
| French Canadian | 207 | 0.2% |
| German | 15,381 | 10.9% |
| Ghanaian | 147 | 0.1% |
| Greek | 284 | 0.2% |
| Guamanian / Chamorro | 85 | 0.1% |
| Guatemalan | 8 | 0.0% |
| Honduran | 82 | 0.1% |
| Hopi | 10 | 0.0% |
| Hungarian | 38 | 0.0% |
| Indian (Asian) | 223 | 0.2% |
| Iranian | 423 | 0.3% |
| Iraqi | 119 | 0.1% |
| Irish | 12,427 | 8.8% |
| Iroquois | 25 | 0.0% |
| Italian | 1,977 | 1.4% |
| Jamaican | 26 | 0.0% |
| Korean | 756 | 0.5% |
| Laotian | 133 | 0.1% |
| Latvian | 3 | 0.0% |
| Lebanese | 27 | 0.0% |
| Lithuanian | 51 | 0.0% |
| Malaysian | 581 | 0.4% |
| Mexican | 28,225 | 20.0% |
| Mexican American Indian | 102 | 0.1% |
| Native Hawaiian | 540 | 0.4% |
| Navajo | 77 | 0.1% |
| Nigerian | 65 | 0.1% |
| Northern European | 99 | 0.1% |
| Norwegian | 973 | 0.7% |
| Pakistani | 39 | 0.0% |
| Panamanian | 29 | 0.0% |
| Peruvian | 63 | 0.0% |
| Polish | 1,153 | 0.8% |
| Portuguese | 80 | 0.1% |
| Pueblo | 10 | 0.0% |
| Puerto Rican | 320 | 0.2% |
| Romanian | 87 | 0.1% |
| Russian | 218 | 0.2% |
| Salvadoran | 26 | 0.0% |
| Samoan | 17 | 0.0% |
| Scandinavian | 331 | 0.2% |
| Scotch-Irish | 1,498 | 1.1% |
| Scottish | 3,108 | 2.2% |
| Serbian | 152 | 0.1% |
| Sierra Leonean | 8 | 0.0% |
| Sioux | 13 | 0.0% |
| Slavic | 75 | 0.1% |
| Slovak | 59 | 0.0% |
| South American | 497 | 0.4% |
| South American Indian | 11 | 0.0% |
| Spaniard | 1,312 | 0.9% |
| Spanish | 838 | 0.6% |
| Spanish American | 88 | 0.1% |
| Sri Lankan | 771 | 0.5% |
| Subsaharan African | 751 | 0.5% |
| Sudanese | 17 | 0.0% |
| Swedish | 1,027 | 0.7% |
| Swiss | 232 | 0.2% |
| Syrian | 89 | 0.1% |
| Thai | 366 | 0.3% |
| Trinidadian and Tobagonian | 30 | 0.0% |
| Turkish | 17 | 0.0% |
| Ukrainian | 37 | 0.0% |
| Venezuelan | 24 | 0.0% |
| Vietnamese | 52 | 0.0% |
| Welsh | 809 | 0.6% |
| West Indian | 40 | 0.0% |
| Yugoslavian | 60 | 0.0% | View All 117 Rows |
Immigrants in Randall County
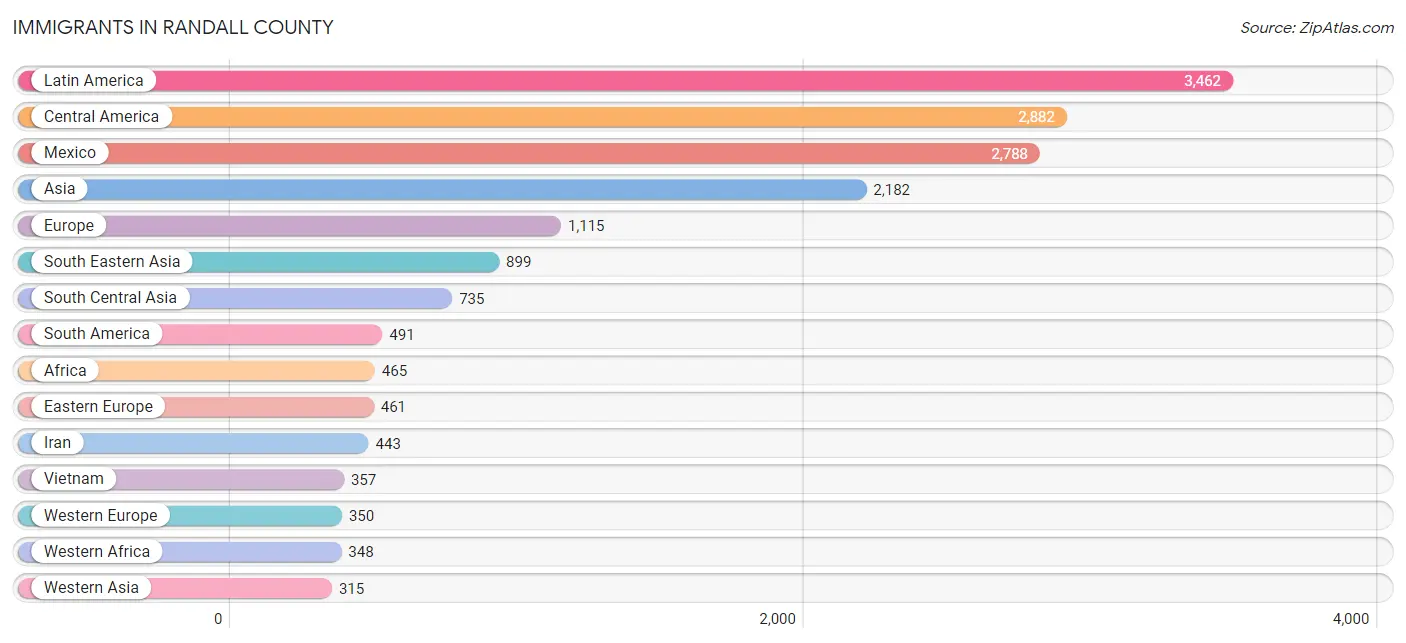
The most numerous immigrant groups reported in Randall County came from Latin America (3,462 | 2.5%), Central America (2,882 | 2.0%), Mexico (2,788 | 2.0%), Asia (2,182 | 1.5%), and Europe (1,115 | 0.8%), together accounting for 8.8% of all Randall County residents.
| Immigration Origin | # Population | % Population |
| Afghanistan | 36 | 0.0% |
| Africa | 465 | 0.3% |
| Argentina | 68 | 0.1% |
| Asia | 2,182 | 1.5% |
| Australia | 29 | 0.0% |
| Austria | 14 | 0.0% |
| Bahamas | 5 | 0.0% |
| Bangladesh | 37 | 0.0% |
| Belgium | 12 | 0.0% |
| Bosnia and Herzegovina | 45 | 0.0% |
| Brazil | 103 | 0.1% |
| Cambodia | 14 | 0.0% |
| Canada | 134 | 0.1% |
| Caribbean | 89 | 0.1% |
| Central America | 2,882 | 2.0% |
| China | 75 | 0.1% |
| Colombia | 58 | 0.0% |
| Congo | 58 | 0.0% |
| Cuba | 8 | 0.0% |
| Dominica | 30 | 0.0% |
| Dominican Republic | 34 | 0.0% |
| Eastern Africa | 34 | 0.0% |
| Eastern Asia | 233 | 0.2% |
| Eastern Europe | 461 | 0.3% |
| Ecuador | 175 | 0.1% |
| El Salvador | 17 | 0.0% |
| England | 82 | 0.1% |
| Europe | 1,115 | 0.8% |
| France | 152 | 0.1% |
| Germany | 134 | 0.1% |
| Ghana | 131 | 0.1% |
| Greece | 73 | 0.1% |
| Guatemala | 9 | 0.0% |
| Honduras | 68 | 0.1% |
| India | 203 | 0.1% |
| Iran | 443 | 0.3% |
| Iraq | 147 | 0.1% |
| Ireland | 13 | 0.0% |
| Italy | 8 | 0.0% |
| Korea | 158 | 0.1% |
| Laos | 234 | 0.2% |
| Latin America | 3,462 | 2.5% |
| Lebanon | 18 | 0.0% |
| Liberia | 115 | 0.1% |
| Malaysia | 19 | 0.0% |
| Mexico | 2,788 | 2.0% |
| Middle Africa | 58 | 0.0% |
| Netherlands | 38 | 0.0% |
| Nigeria | 94 | 0.1% |
| Northern Africa | 25 | 0.0% |
| Northern Europe | 139 | 0.1% |
| Oceania | 74 | 0.1% |
| Pakistan | 16 | 0.0% |
| Peru | 63 | 0.0% |
| Philippines | 259 | 0.2% |
| Poland | 49 | 0.0% |
| Russia | 228 | 0.2% |
| Serbia | 116 | 0.1% |
| Sierra Leone | 8 | 0.0% |
| South America | 491 | 0.4% |
| South Central Asia | 735 | 0.5% |
| South Eastern Asia | 899 | 0.6% |
| Southern Europe | 165 | 0.1% |
| Spain | 84 | 0.1% |
| Sudan | 25 | 0.0% |
| Syria | 89 | 0.1% |
| Thailand | 16 | 0.0% |
| Uganda | 10 | 0.0% |
| Venezuela | 24 | 0.0% |
| Vietnam | 357 | 0.3% |
| Western Africa | 348 | 0.3% |
| Western Asia | 315 | 0.2% |
| Western Europe | 350 | 0.3% |
| Yemen | 39 | 0.0% | View All 74 Rows |
Sex and Age in Randall County
Sex and Age in Randall County
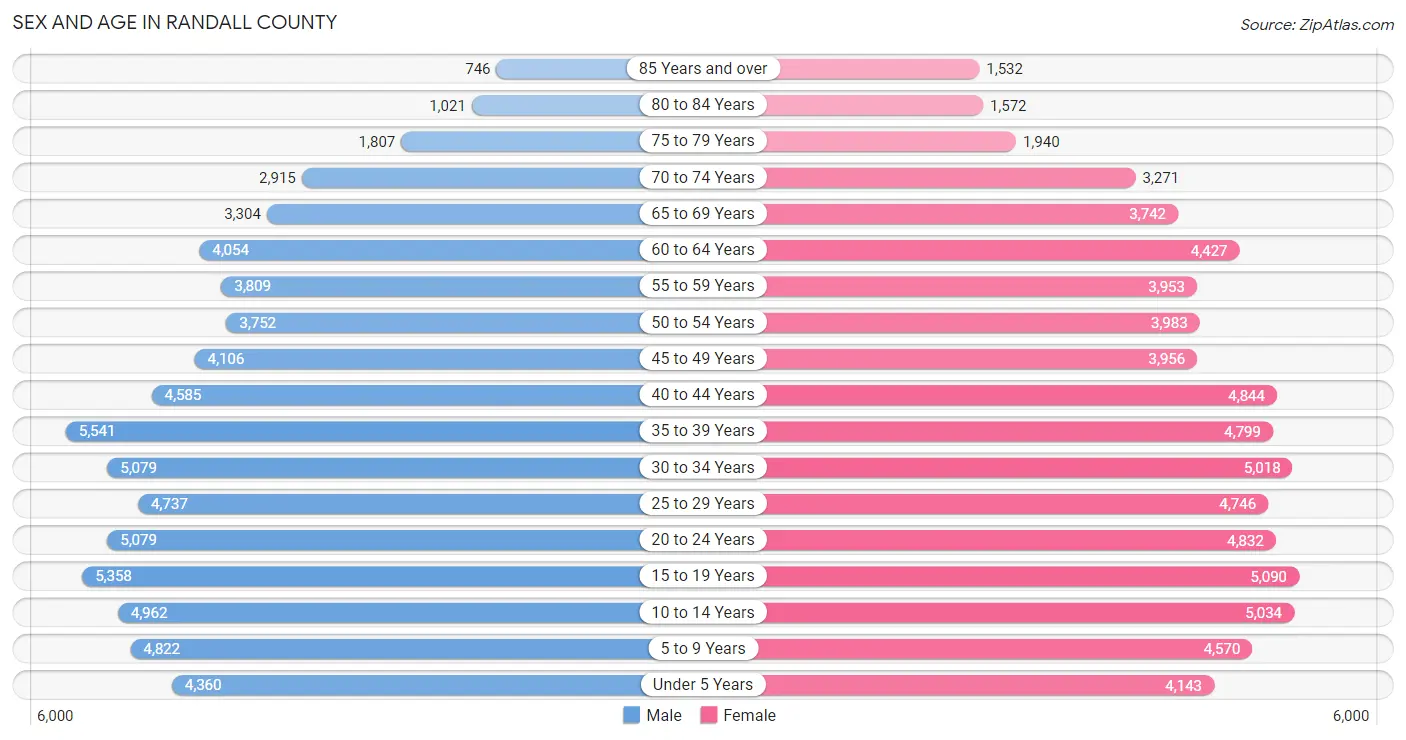
The most populous age groups in Randall County are 35 to 39 Years (5,541 | 7.9%) for men and 15 to 19 Years (5,090 | 7.1%) for women.
| Age Bracket | Male | Female |
| Under 5 Years | 4,360 (6.2%) | 4,143 (5.8%) |
| 5 to 9 Years | 4,822 (6.9%) | 4,570 (6.4%) |
| 10 to 14 Years | 4,962 (7.1%) | 5,034 (7.0%) |
| 15 to 19 Years | 5,358 (7.6%) | 5,090 (7.1%) |
| 20 to 24 Years | 5,079 (7.2%) | 4,832 (6.8%) |
| 25 to 29 Years | 4,737 (6.8%) | 4,746 (6.6%) |
| 30 to 34 Years | 5,079 (7.2%) | 5,018 (7.0%) |
| 35 to 39 Years | 5,541 (7.9%) | 4,799 (6.7%) |
| 40 to 44 Years | 4,585 (6.6%) | 4,844 (6.8%) |
| 45 to 49 Years | 4,106 (5.9%) | 3,956 (5.5%) |
| 50 to 54 Years | 3,752 (5.4%) | 3,983 (5.6%) |
| 55 to 59 Years | 3,809 (5.4%) | 3,953 (5.5%) |
| 60 to 64 Years | 4,054 (5.8%) | 4,427 (6.2%) |
| 65 to 69 Years | 3,304 (4.7%) | 3,742 (5.2%) |
| 70 to 74 Years | 2,915 (4.2%) | 3,271 (4.6%) |
| 75 to 79 Years | 1,807 (2.6%) | 1,940 (2.7%) |
| 80 to 84 Years | 1,021 (1.5%) | 1,572 (2.2%) |
| 85 Years and over | 746 (1.1%) | 1,532 (2.1%) |
| Total | 70,037 (100.0%) | 71,452 (100.0%) |
Families and Households in Randall County
Median Family Size in Randall County
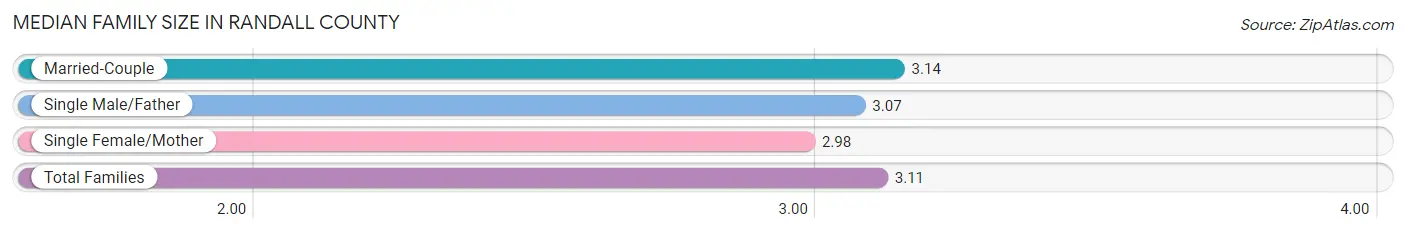
The median family size in Randall County is 3.11 persons per family, with married-couple families (29,374 | 79.7%) accounting for the largest median family size of 3.14 persons per family. On the other hand, single female/mother families (5,179 | 14.1%) represent the smallest median family size with 2.98 persons per family.
| Family Type | # Families | Family Size |
| Married-Couple | 29,374 (79.7%) | 3.14 |
| Single Male/Father | 2,310 (6.3%) | 3.07 |
| Single Female/Mother | 5,179 (14.1%) | 2.98 |
| Total Families | 36,863 (100.0%) | 3.11 |
Median Household Size in Randall County
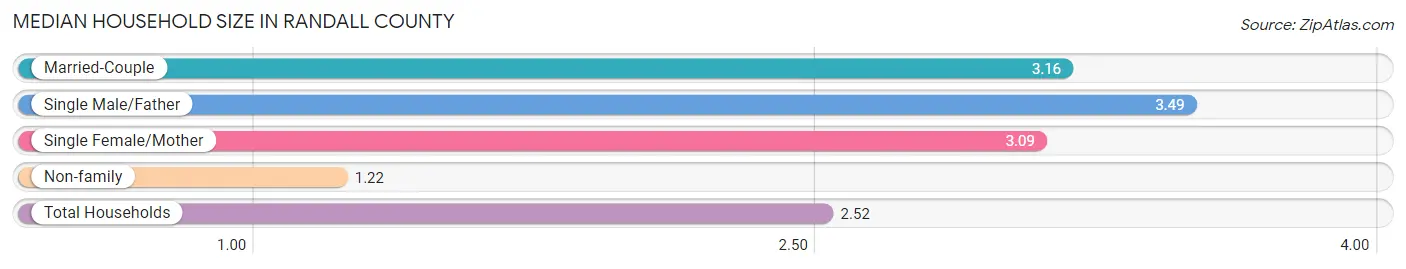
The median household size in Randall County is 2.52 persons per household, with single male/father households (2,310 | 4.2%) accounting for the largest median household size of 3.49 persons per household. non-family households (18,121 | 33.0%) represent the smallest median household size with 1.22 persons per household.
| Household Type | # Households | Household Size |
| Married-Couple | 29,374 (53.4%) | 3.16 |
| Single Male/Father | 2,310 (4.2%) | 3.49 |
| Single Female/Mother | 5,179 (9.4%) | 3.09 |
| Non-family | 18,121 (33.0%) | 1.22 |
| Total Households | 54,984 (100.0%) | 2.52 |
Household Size by Marriage Status in Randall County
Out of a total of 54,984 households in Randall County, 36,863 (67.0%) are family households, while 18,121 (33.0%) are nonfamily households. The most numerous type of family households are 2-person households, comprising 16,921, and the most common type of nonfamily households are 1-person households, comprising 15,635.
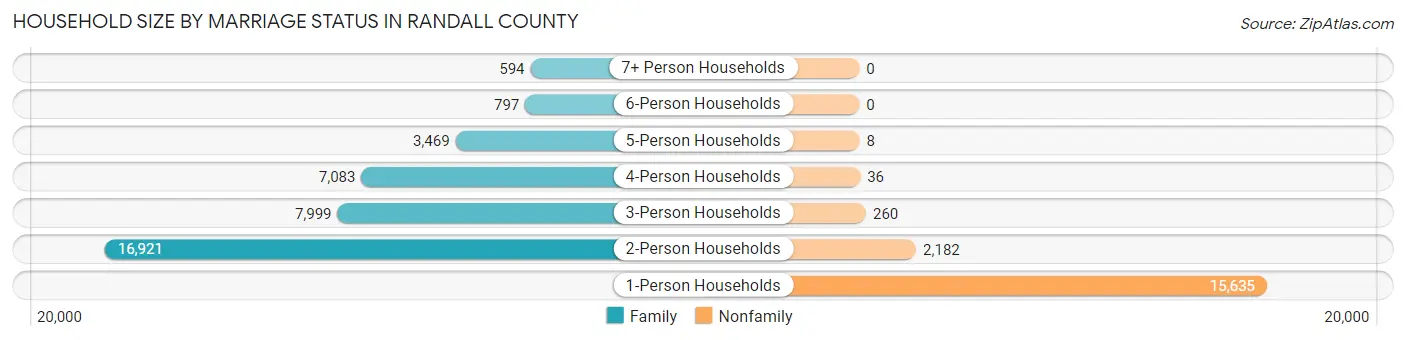
| Household Size | Family Households | Nonfamily Households |
| 1-Person Households | - | 15,635 (28.4%) |
| 2-Person Households | 16,921 (30.8%) | 2,182 (4.0%) |
| 3-Person Households | 7,999 (14.5%) | 260 (0.5%) |
| 4-Person Households | 7,083 (12.9%) | 36 (0.1%) |
| 5-Person Households | 3,469 (6.3%) | 8 (0.0%) |
| 6-Person Households | 797 (1.5%) | 0 (0.0%) |
| 7+ Person Households | 594 (1.1%) | 0 (0.0%) |
| Total | 36,863 (67.0%) | 18,121 (33.0%) |
Female Fertility in Randall County
Fertility by Age in Randall County
Average fertility rate in Randall County is 46.0 births per 1,000 women. Women in the age bracket of 20 to 34 years have the highest fertility rate with 89.0 births per 1,000 women. Women in the age bracket of 20 to 34 years acount for 82.6% of all women with births.
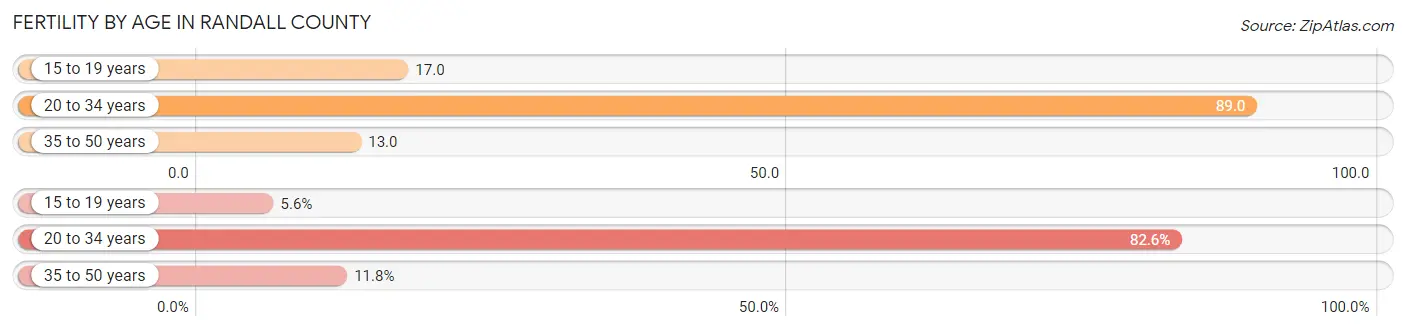
| Age Bracket | Women with Births | Births / 1,000 Women |
| 15 to 19 years | 87 (5.6%) | 17.0 |
| 20 to 34 years | 1,294 (82.6%) | 89.0 |
| 35 to 50 years | 185 (11.8%) | 13.0 |
| Total | 1,566 (100.0%) | 46.0 |
Fertility by Age by Marriage Status in Randall County
86.1% of women with births (1,566) in Randall County are married. The highest percentage of unmarried women with births falls into 15 to 19 years age bracket with 100.0% of them unmarried at the time of birth, while the lowest percentage of unmarried women with births belong to 35 to 50 years age bracket with 7.6% of them unmarried.
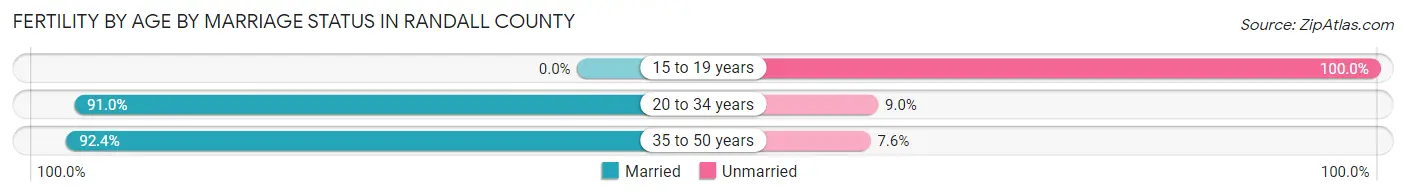
| Age Bracket | Married | Unmarried |
| 15 to 19 years | 0 (0.0%) | 87 (100.0%) |
| 20 to 34 years | 1,178 (91.0%) | 116 (9.0%) |
| 35 to 50 years | 171 (92.4%) | 14 (7.6%) |
| Total | 1,348 (86.1%) | 218 (13.9%) |
Fertility by Education in Randall County
Average fertility rate in Randall County is 46.0 births per 1,000 women. Women with the education attainment of graduate degree have the highest fertility rate of 93.0 births per 1,000 women, while women with the education attainment of less than high school have the lowest fertility at 6.0 births per 1,000 women. Women with the education attainment of college or associate's degree represent 48.3% of all women with births.
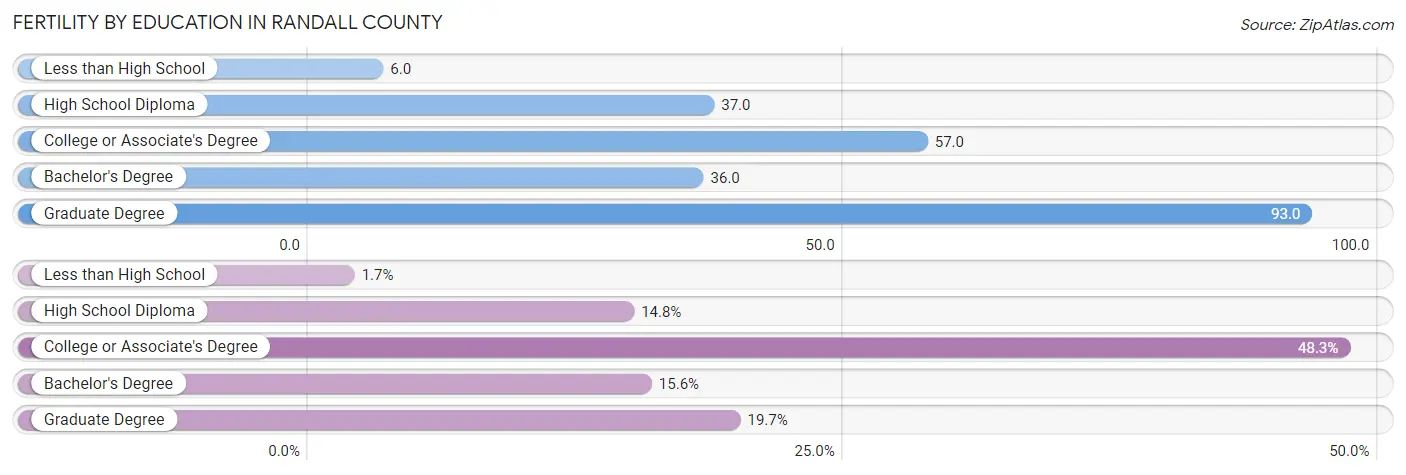
| Educational Attainment | Women with Births | Births / 1,000 Women |
| Less than High School | 26 (1.7%) | 6.0 |
| High School Diploma | 231 (14.7%) | 37.0 |
| College or Associate's Degree | 756 (48.3%) | 57.0 |
| Bachelor's Degree | 244 (15.6%) | 36.0 |
| Graduate Degree | 309 (19.7%) | 93.0 |
| Total | 1,566 (100.0%) | 46.0 |
Fertility by Education by Marriage Status in Randall County
13.9% of women with births in Randall County are unmarried. Women with the educational attainment of graduate degree are most likely to be married with 100.0% of them married at childbirth, while women with the educational attainment of high school diploma are least likely to be married with 38.5% of them unmarried at childbirth.
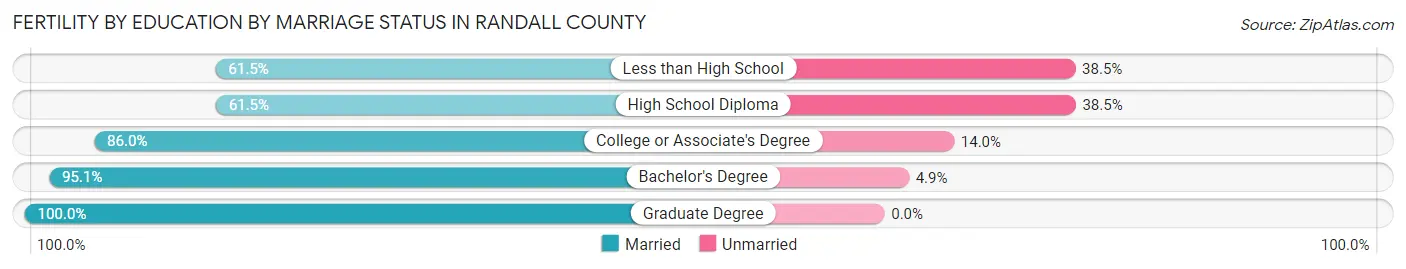
| Educational Attainment | Married | Unmarried |
| Less than High School | 16 (61.5%) | 10 (38.5%) |
| High School Diploma | 142 (61.5%) | 89 (38.5%) |
| College or Associate's Degree | 650 (86.0%) | 106 (14.0%) |
| Bachelor's Degree | 232 (95.1%) | 12 (4.9%) |
| Graduate Degree | 309 (100.0%) | 0 (0.0%) |
| Total | 1,348 (86.1%) | 218 (13.9%) |
Employment Characteristics in Randall County
Employment by Class of Employer in Randall County
Among the 72,342 employed individuals in Randall County, private company employees (47,192 | 65.2%), local government employees (6,933 | 9.6%), and state government employees (4,621 | 6.4%) make up the most common classes of employment.
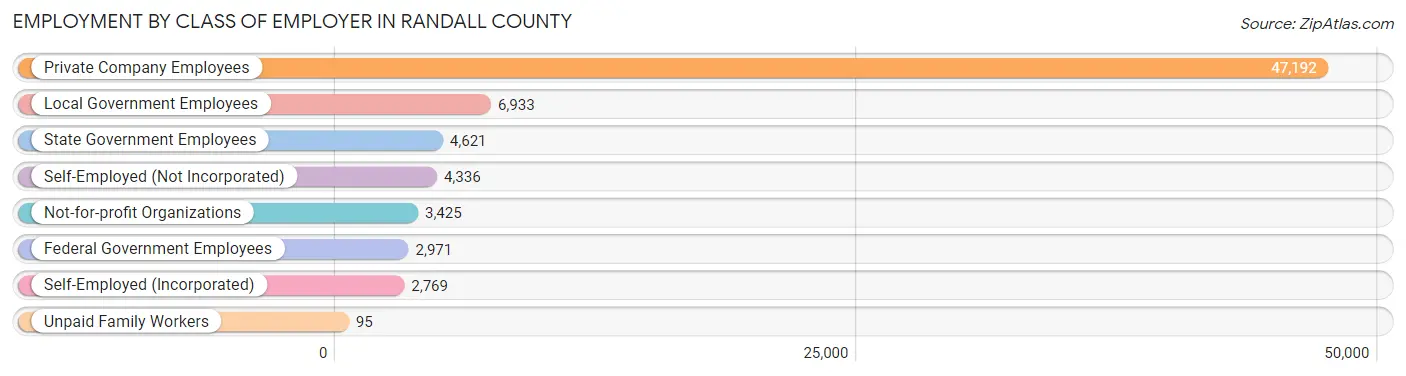
| Employer Class | # Employees | % Employees |
| Private Company Employees | 47,192 | 65.2% |
| Self-Employed (Incorporated) | 2,769 | 3.8% |
| Self-Employed (Not Incorporated) | 4,336 | 6.0% |
| Not-for-profit Organizations | 3,425 | 4.7% |
| Local Government Employees | 6,933 | 9.6% |
| State Government Employees | 4,621 | 6.4% |
| Federal Government Employees | 2,971 | 4.1% |
| Unpaid Family Workers | 95 | 0.1% |
| Total | 72,342 | 100.0% |
Employment Status by Age in Randall County
According to the labor force statistics for Randall County, out of the total population over 16 years of age (111,471), 67.6% or 75,354 individuals are in the labor force, with 2.8% or 2,110 of them unemployed. The age group with the highest labor force participation rate is 35 to 44 years, with 88.9% or 17,575 individuals in the labor force. Within the labor force, the 16 to 19 years age range has the highest percentage of unemployed individuals, with 7.7% or 288 of them being unemployed.
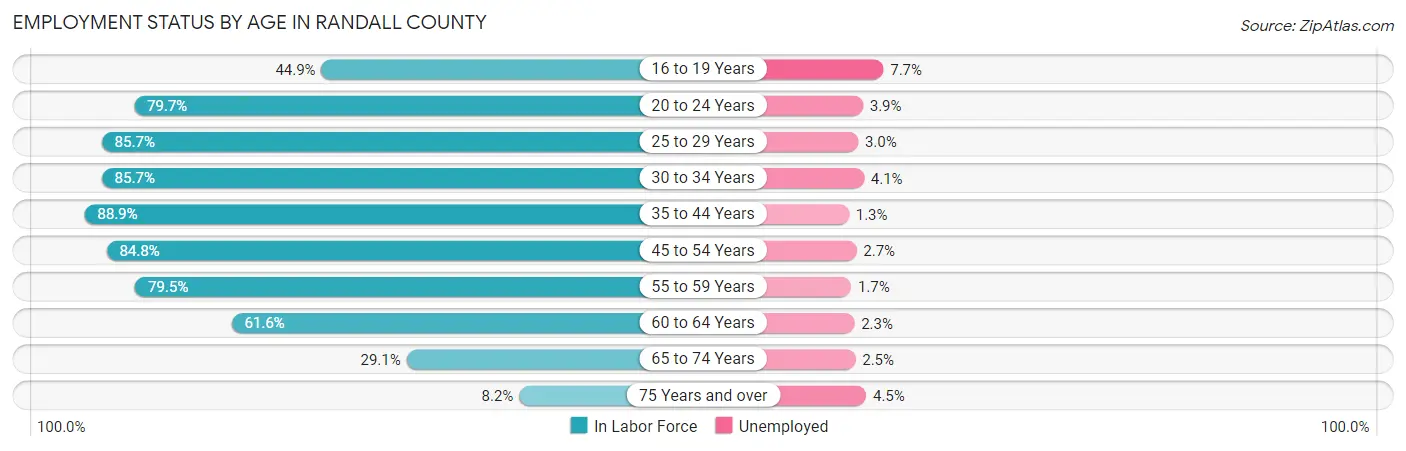
| Age Bracket | In Labor Force | Unemployed |
| 16 to 19 Years | 3,736 (44.9%) | 288 (7.7%) |
| 20 to 24 Years | 7,899 (79.7%) | 308 (3.9%) |
| 25 to 29 Years | 8,127 (85.7%) | 244 (3.0%) |
| 30 to 34 Years | 8,653 (85.7%) | 355 (4.1%) |
| 35 to 44 Years | 17,575 (88.9%) | 228 (1.3%) |
| 45 to 54 Years | 13,396 (84.8%) | 362 (2.7%) |
| 55 to 59 Years | 6,171 (79.5%) | 105 (1.7%) |
| 60 to 64 Years | 5,224 (61.6%) | 120 (2.3%) |
| 65 to 74 Years | 3,851 (29.1%) | 96 (2.5%) |
| 75 Years and over | 707 (8.2%) | 32 (4.5%) |
| Total | 75,354 (67.6%) | 2,110 (2.8%) |
Employment Status by Educational Attainment in Randall County
According to labor force statistics for Randall County, 82.8% of individuals (59,110) out of the total population between 25 and 64 years of age (71,389) are in the labor force, with 2.4% or 1,419 of them being unemployed. The group with the highest labor force participation rate are those with the educational attainment of bachelor's degree or higher, with 89.3% or 20,874 individuals in the labor force. Within the labor force, individuals with high school diploma education have the highest percentage of unemployment, with 3.7% or 471 of them being unemployed.
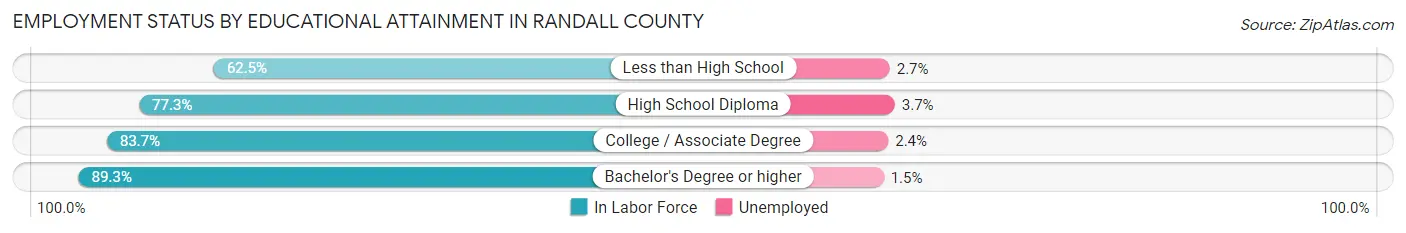
| Educational Attainment | In Labor Force | Unemployed |
| Less than High School | 2,513 (62.5%) | 109 (2.7%) |
| High School Diploma | 12,742 (77.3%) | 610 (3.7%) |
| College / Associate Degree | 23,025 (83.7%) | 660 (2.4%) |
| Bachelor's Degree or higher | 20,874 (89.3%) | 351 (1.5%) |
| Total | 59,110 (82.8%) | 1,713 (2.4%) |
Employment Occupations by Sex in Randall County
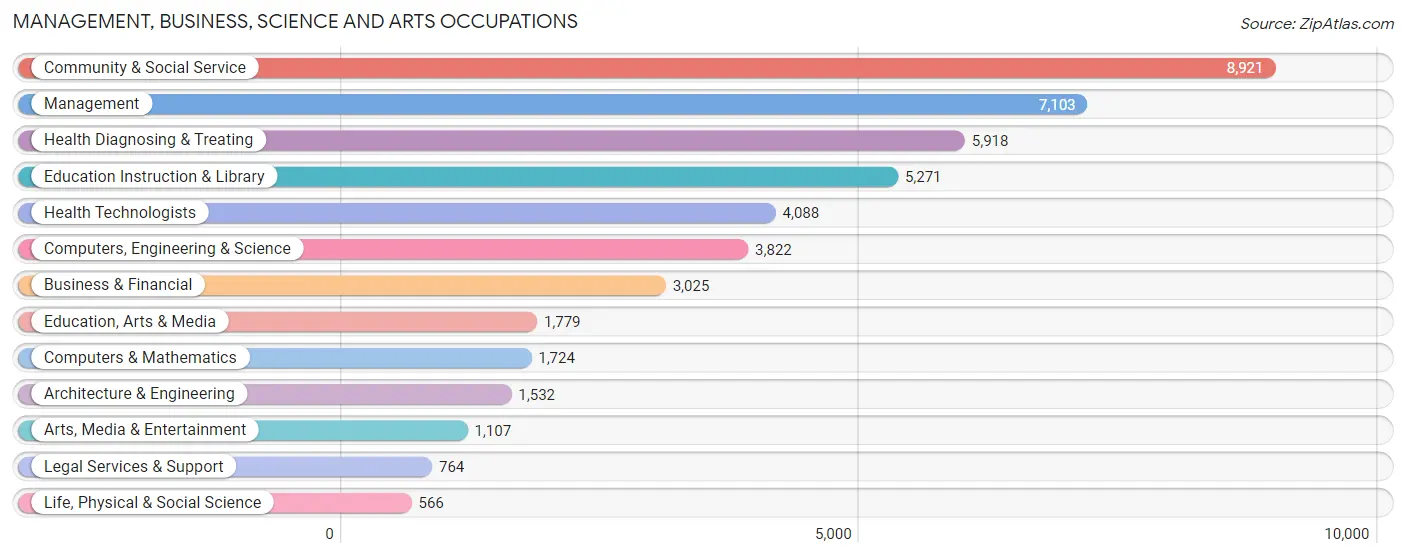
Management, Business, Science and Arts Occupations
The most common Management, Business, Science and Arts occupations in Randall County are Community & Social Service (8,921 | 12.2%), Management (7,103 | 9.7%), Health Diagnosing & Treating (5,918 | 8.1%), Education Instruction & Library (5,271 | 7.2%), and Health Technologists (4,088 | 5.6%).
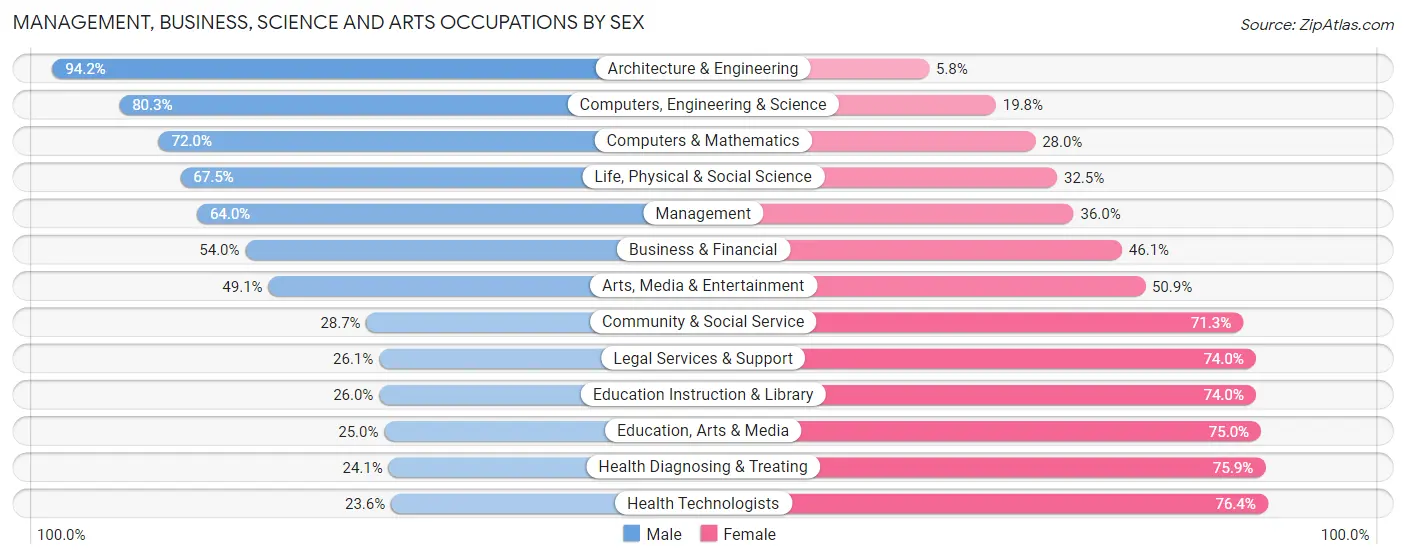
Management, Business, Science and Arts Occupations by Sex
Within the Management, Business, Science and Arts occupations in Randall County, the most male-oriented occupations are Architecture & Engineering (94.2%), Computers, Engineering & Science (80.2%), and Computers & Mathematics (72.0%), while the most female-oriented occupations are Health Technologists (76.4%), Health Diagnosing & Treating (75.9%), and Education, Arts & Media (75.0%).
| Occupation | Male | Female |
| Management | 4,549 (64.0%) | 2,554 (36.0%) |
| Business & Financial | 1,632 (53.9%) | 1,393 (46.1%) |
| Computers, Engineering & Science | 3,067 (80.2%) | 755 (19.8%) |
| Computers & Mathematics | 1,242 (72.0%) | 482 (28.0%) |
| Architecture & Engineering | 1,443 (94.2%) | 89 (5.8%) |
| Life, Physical & Social Science | 382 (67.5%) | 184 (32.5%) |
| Community & Social Service | 2,559 (28.7%) | 6,362 (71.3%) |
| Education, Arts & Media | 444 (25.0%) | 1,335 (75.0%) |
| Legal Services & Support | 199 (26.1%) | 565 (74.0%) |
| Education Instruction & Library | 1,372 (26.0%) | 3,899 (74.0%) |
| Arts, Media & Entertainment | 544 (49.1%) | 563 (50.9%) |
| Health Diagnosing & Treating | 1,425 (24.1%) | 4,493 (75.9%) |
| Health Technologists | 963 (23.6%) | 3,125 (76.4%) |
| Total (Category) | 13,232 (46.0%) | 15,557 (54.0%) |
| Total (Overall) | 39,401 (53.9%) | 33,712 (46.1%) |
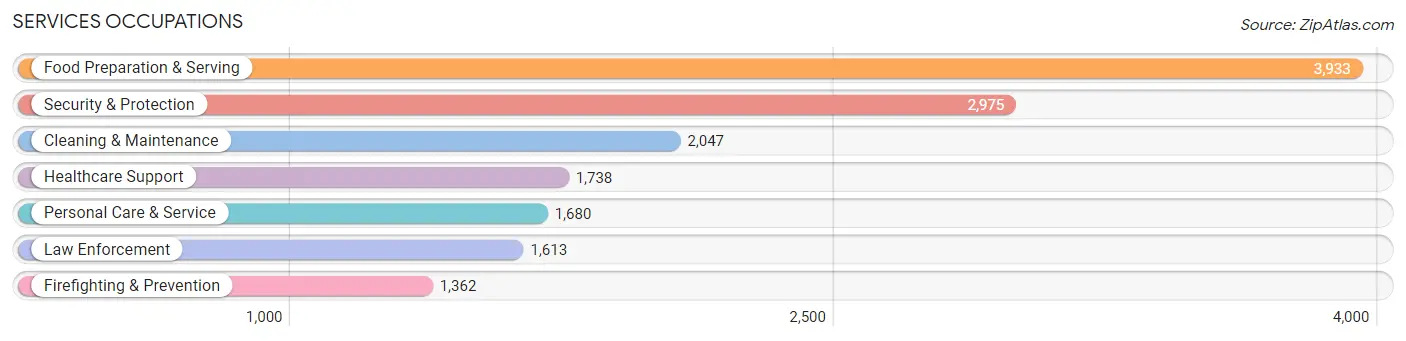
Services Occupations
The most common Services occupations in Randall County are Food Preparation & Serving (3,933 | 5.4%), Security & Protection (2,975 | 4.1%), Cleaning & Maintenance (2,047 | 2.8%), Healthcare Support (1,738 | 2.4%), and Personal Care & Service (1,680 | 2.3%).
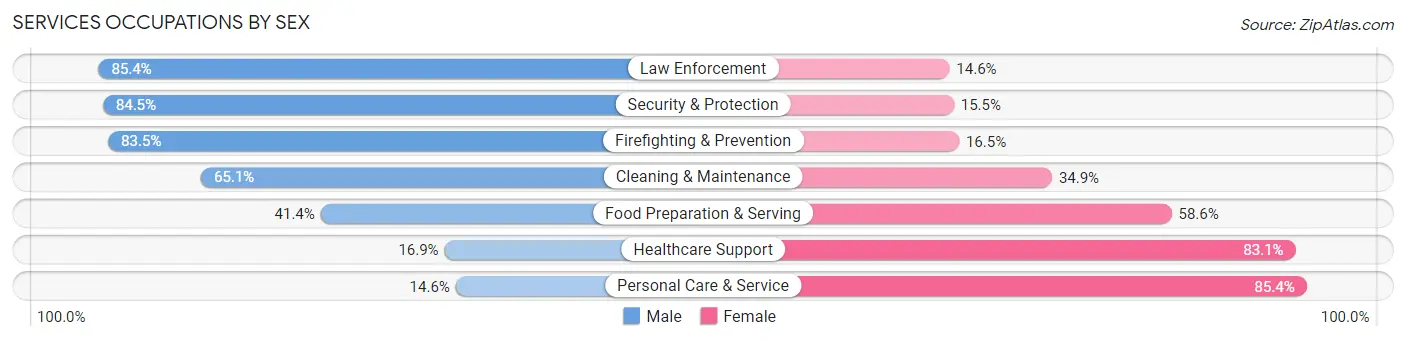
Services Occupations by Sex
Within the Services occupations in Randall County, the most male-oriented occupations are Law Enforcement (85.4%), Security & Protection (84.5%), and Firefighting & Prevention (83.5%), while the most female-oriented occupations are Personal Care & Service (85.4%), Healthcare Support (83.1%), and Food Preparation & Serving (58.6%).
| Occupation | Male | Female |
| Healthcare Support | 293 (16.9%) | 1,445 (83.1%) |
| Security & Protection | 2,514 (84.5%) | 461 (15.5%) |
| Firefighting & Prevention | 1,137 (83.5%) | 225 (16.5%) |
| Law Enforcement | 1,377 (85.4%) | 236 (14.6%) |
| Food Preparation & Serving | 1,628 (41.4%) | 2,305 (58.6%) |
| Cleaning & Maintenance | 1,332 (65.1%) | 715 (34.9%) |
| Personal Care & Service | 246 (14.6%) | 1,434 (85.4%) |
| Total (Category) | 6,013 (48.6%) | 6,360 (51.4%) |
| Total (Overall) | 39,401 (53.9%) | 33,712 (46.1%) |
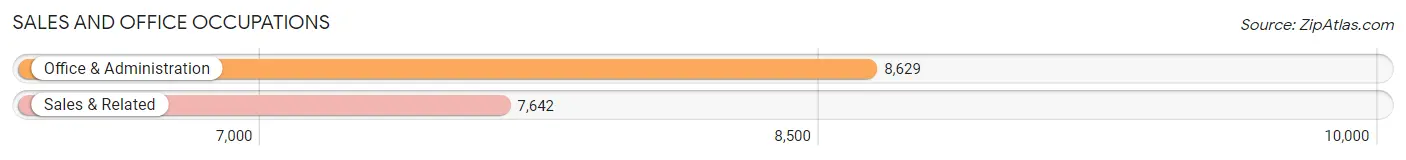
Sales and Office Occupations
The most common Sales and Office occupations in Randall County are Office & Administration (8,629 | 11.8%), and Sales & Related (7,642 | 10.4%).
Sales and Office Occupations by Sex
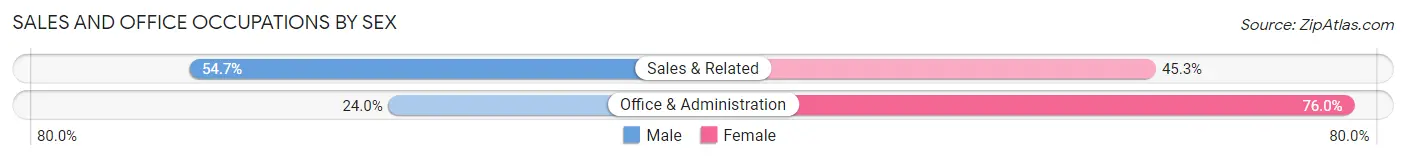
| Occupation | Male | Female |
| Sales & Related | 4,181 (54.7%) | 3,461 (45.3%) |
| Office & Administration | 2,073 (24.0%) | 6,556 (76.0%) |
| Total (Category) | 6,254 (38.4%) | 10,017 (61.6%) |
| Total (Overall) | 39,401 (53.9%) | 33,712 (46.1%) |
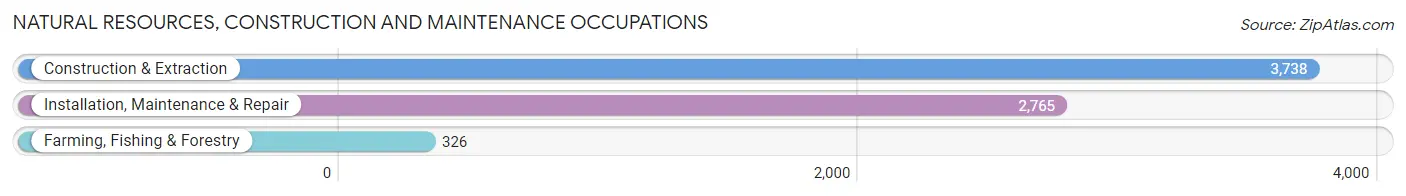
Natural Resources, Construction and Maintenance Occupations
The most common Natural Resources, Construction and Maintenance occupations in Randall County are Construction & Extraction (3,738 | 5.1%), Installation, Maintenance & Repair (2,765 | 3.8%), and Farming, Fishing & Forestry (326 | 0.4%).
Natural Resources, Construction and Maintenance Occupations by Sex
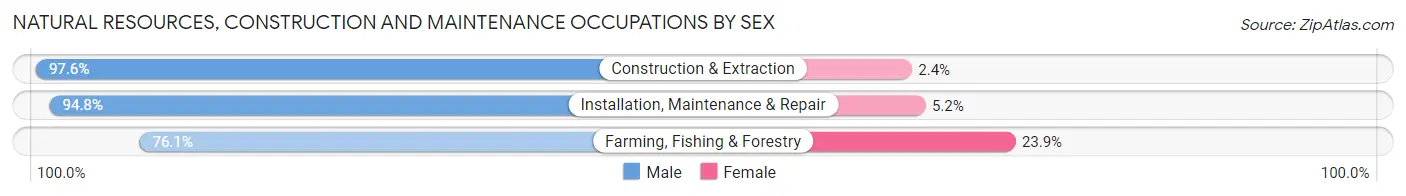
| Occupation | Male | Female |
| Farming, Fishing & Forestry | 248 (76.1%) | 78 (23.9%) |
| Construction & Extraction | 3,649 (97.6%) | 89 (2.4%) |
| Installation, Maintenance & Repair | 2,621 (94.8%) | 144 (5.2%) |
| Total (Category) | 6,518 (95.5%) | 311 (4.5%) |
| Total (Overall) | 39,401 (53.9%) | 33,712 (46.1%) |
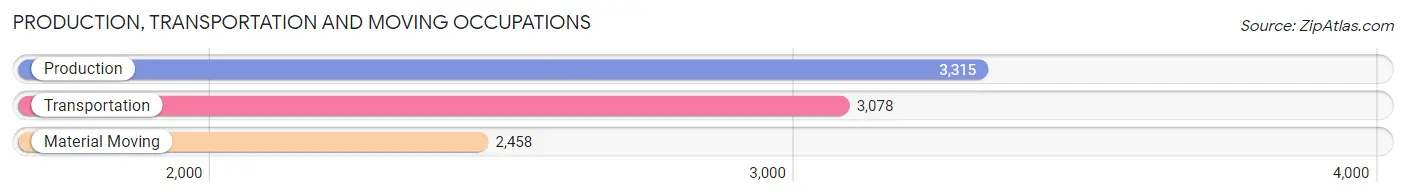
Production, Transportation and Moving Occupations
The most common Production, Transportation and Moving occupations in Randall County are Production (3,315 | 4.5%), Transportation (3,078 | 4.2%), and Material Moving (2,458 | 3.4%).
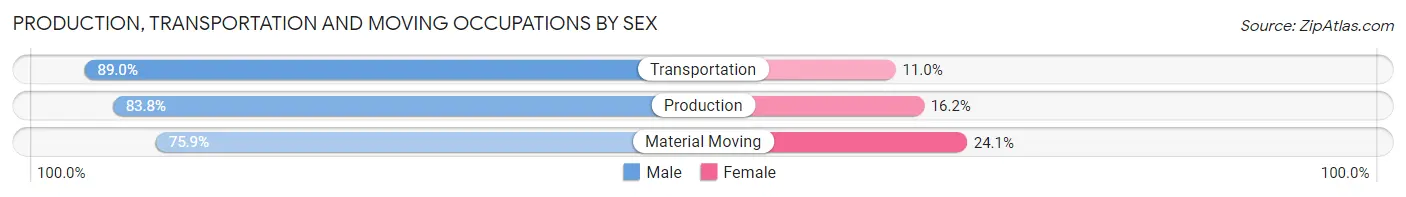
Production, Transportation and Moving Occupations by Sex
| Occupation | Male | Female |
| Production | 2,779 (83.8%) | 536 (16.2%) |
| Transportation | 2,739 (89.0%) | 339 (11.0%) |
| Material Moving | 1,866 (75.9%) | 592 (24.1%) |
| Total (Category) | 7,384 (83.4%) | 1,467 (16.6%) |
| Total (Overall) | 39,401 (53.9%) | 33,712 (46.1%) |
Employment Industries by Sex in Randall County
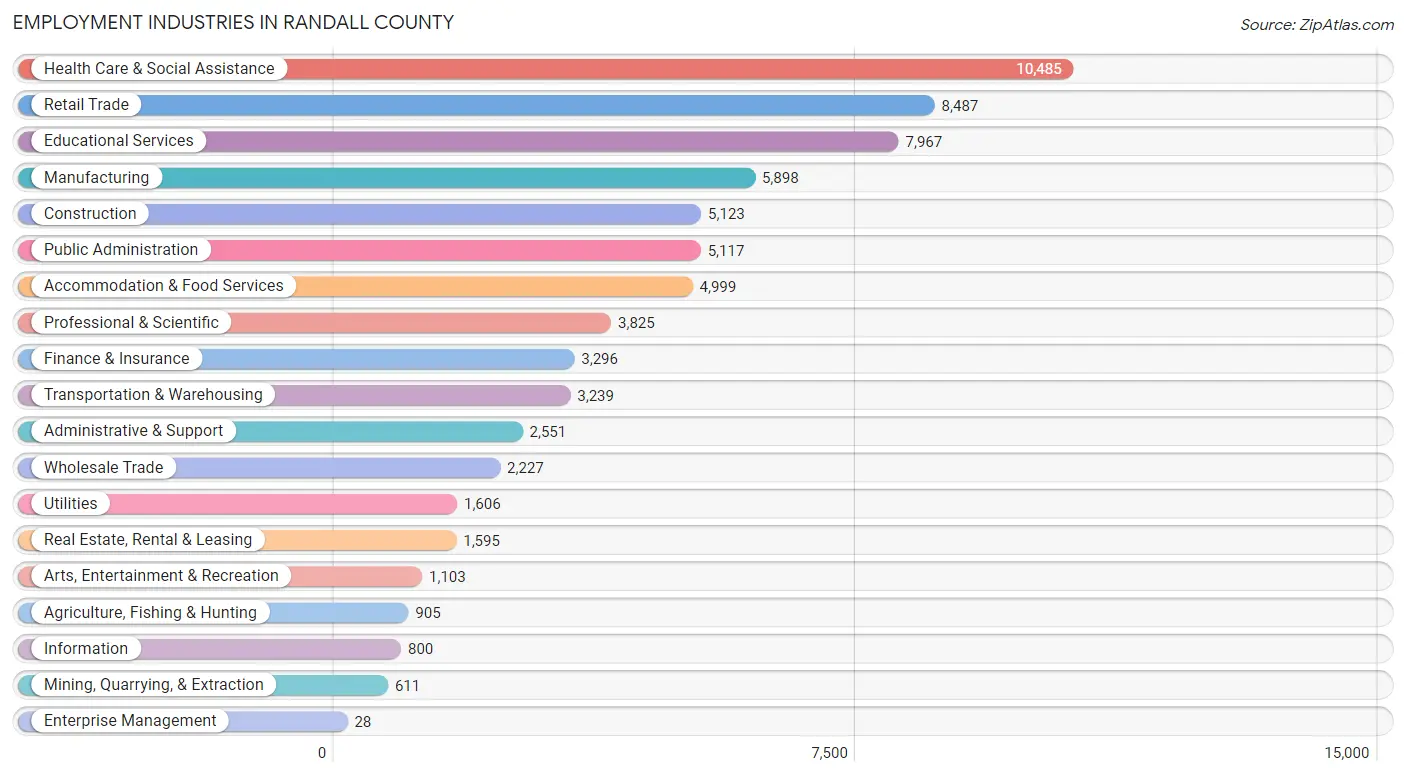
Employment Industries in Randall County
The major employment industries in Randall County include Health Care & Social Assistance (10,485 | 14.3%), Retail Trade (8,487 | 11.6%), Educational Services (7,967 | 10.9%), Manufacturing (5,898 | 8.1%), and Construction (5,123 | 7.0%).
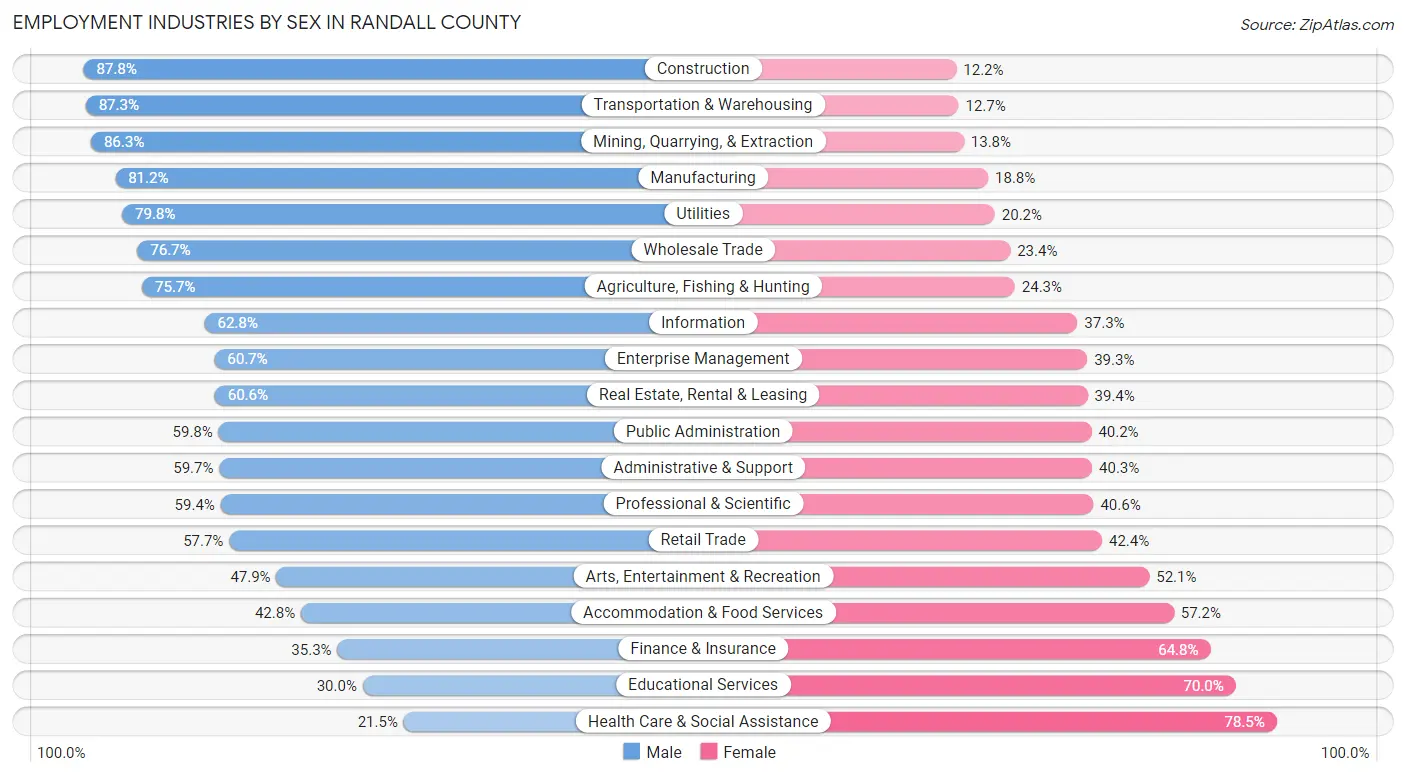
Employment Industries by Sex in Randall County
The Randall County industries that see more men than women are Construction (87.8%), Transportation & Warehousing (87.3%), and Mining, Quarrying, & Extraction (86.3%), whereas the industries that tend to have a higher number of women are Health Care & Social Assistance (78.5%), Educational Services (70.0%), and Finance & Insurance (64.7%).
| Industry | Male | Female |
| Agriculture, Fishing & Hunting | 685 (75.7%) | 220 (24.3%) |
| Mining, Quarrying, & Extraction | 527 (86.3%) | 84 (13.8%) |
| Construction | 4,498 (87.8%) | 625 (12.2%) |
| Manufacturing | 4,791 (81.2%) | 1,107 (18.8%) |
| Wholesale Trade | 1,707 (76.6%) | 520 (23.4%) |
| Retail Trade | 4,893 (57.7%) | 3,594 (42.3%) |
| Transportation & Warehousing | 2,829 (87.3%) | 410 (12.7%) |
| Utilities | 1,282 (79.8%) | 324 (20.2%) |
| Information | 502 (62.7%) | 298 (37.2%) |
| Finance & Insurance | 1,162 (35.2%) | 2,134 (64.7%) |
| Real Estate, Rental & Leasing | 967 (60.6%) | 628 (39.4%) |
| Professional & Scientific | 2,273 (59.4%) | 1,552 (40.6%) |
| Enterprise Management | 17 (60.7%) | 11 (39.3%) |
| Administrative & Support | 1,523 (59.7%) | 1,028 (40.3%) |
| Educational Services | 2,391 (30.0%) | 5,576 (70.0%) |
| Health Care & Social Assistance | 2,256 (21.5%) | 8,229 (78.5%) |
| Arts, Entertainment & Recreation | 528 (47.9%) | 575 (52.1%) |
| Accommodation & Food Services | 2,139 (42.8%) | 2,860 (57.2%) |
| Public Administration | 3,062 (59.8%) | 2,055 (40.2%) |
| Total | 39,401 (53.9%) | 33,712 (46.1%) |
Education in Randall County
School Enrollment in Randall County
The most common levels of schooling among the 36,263 students in Randall County are college / undergraduate (8,566 | 23.6%), elementary school (8,037 | 22.2%), and high school (7,721 | 21.3%).
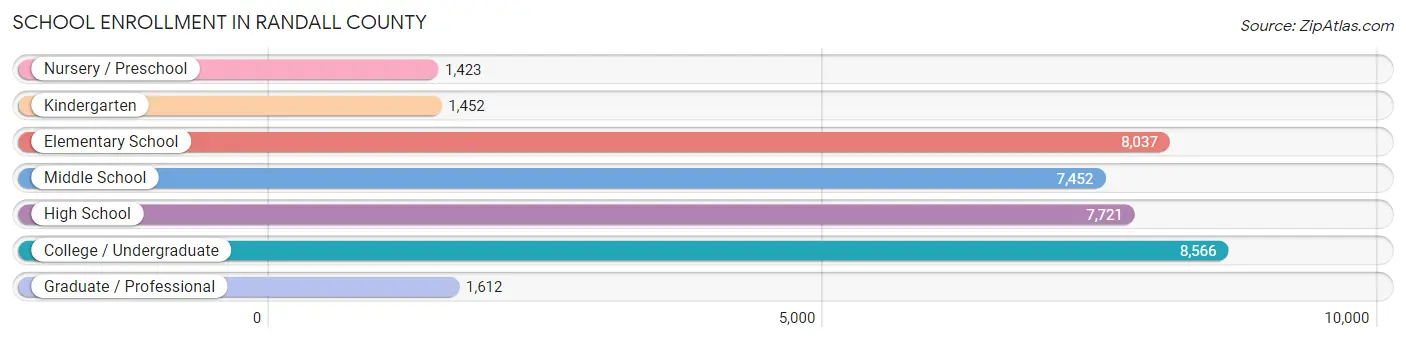
| School Level | # Students | % Students |
| Nursery / Preschool | 1,423 | 3.9% |
| Kindergarten | 1,452 | 4.0% |
| Elementary School | 8,037 | 22.2% |
| Middle School | 7,452 | 20.5% |
| High School | 7,721 | 21.3% |
| College / Undergraduate | 8,566 | 23.6% |
| Graduate / Professional | 1,612 | 4.4% |
| Total | 36,263 | 100.0% |
School Enrollment by Age by Funding Source in Randall County
Out of a total of 36,263 students who are enrolled in schools in Randall County, 3,119 (8.6%) attend a private institution, while the remaining 33,144 (91.4%) are enrolled in public schools. The age group of 3 to 4 year olds has the highest likelihood of being enrolled in private schools, with 566 (52.9% in the age bracket) enrolled. Conversely, the age group of 15 to 17 year olds has the lowest likelihood of being enrolled in a private school, with 5,338 (95.9% in the age bracket) attending a public institution.
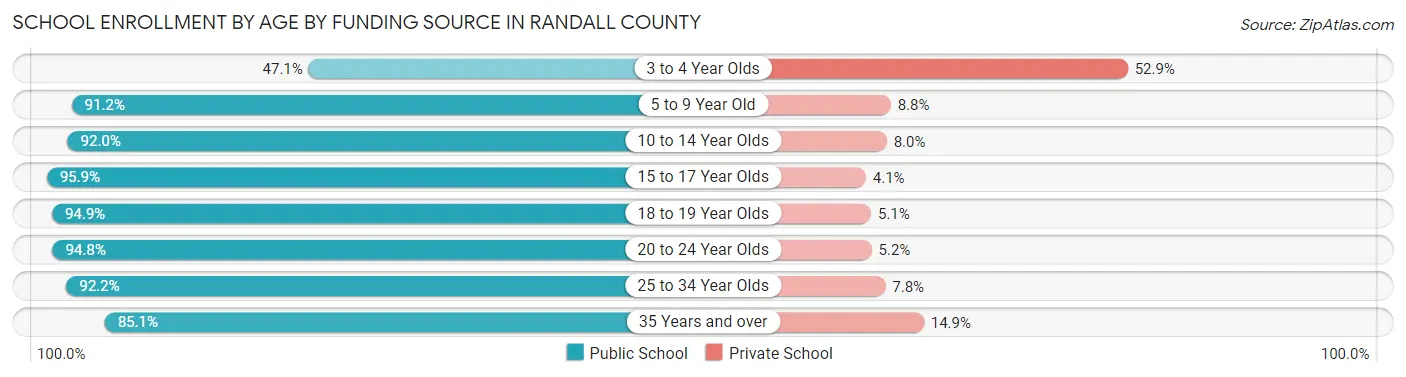
| Age Bracket | Public School | Private School |
| 3 to 4 Year Olds | 504 (47.1%) | 566 (52.9%) |
| 5 to 9 Year Old | 7,886 (91.2%) | 757 (8.8%) |
| 10 to 14 Year Olds | 8,750 (92.0%) | 763 (8.0%) |
| 15 to 17 Year Olds | 5,338 (95.9%) | 230 (4.1%) |
| 18 to 19 Year Olds | 3,295 (94.9%) | 177 (5.1%) |
| 20 to 24 Year Olds | 3,843 (94.8%) | 211 (5.2%) |
| 25 to 34 Year Olds | 2,302 (92.2%) | 194 (7.8%) |
| 35 Years and over | 1,231 (85.1%) | 216 (14.9%) |
| Total | 33,144 (91.4%) | 3,119 (8.6%) |
Educational Attainment by Field of Study in Randall County
Business (5,935 | 18.5%), education (5,395 | 16.8%), science & technology (3,956 | 12.3%), arts & humanities (3,081 | 9.6%), and bio, nature & agricultural (2,809 | 8.8%) are the most common fields of study among 32,065 individuals in Randall County who have obtained a bachelor's degree or higher.
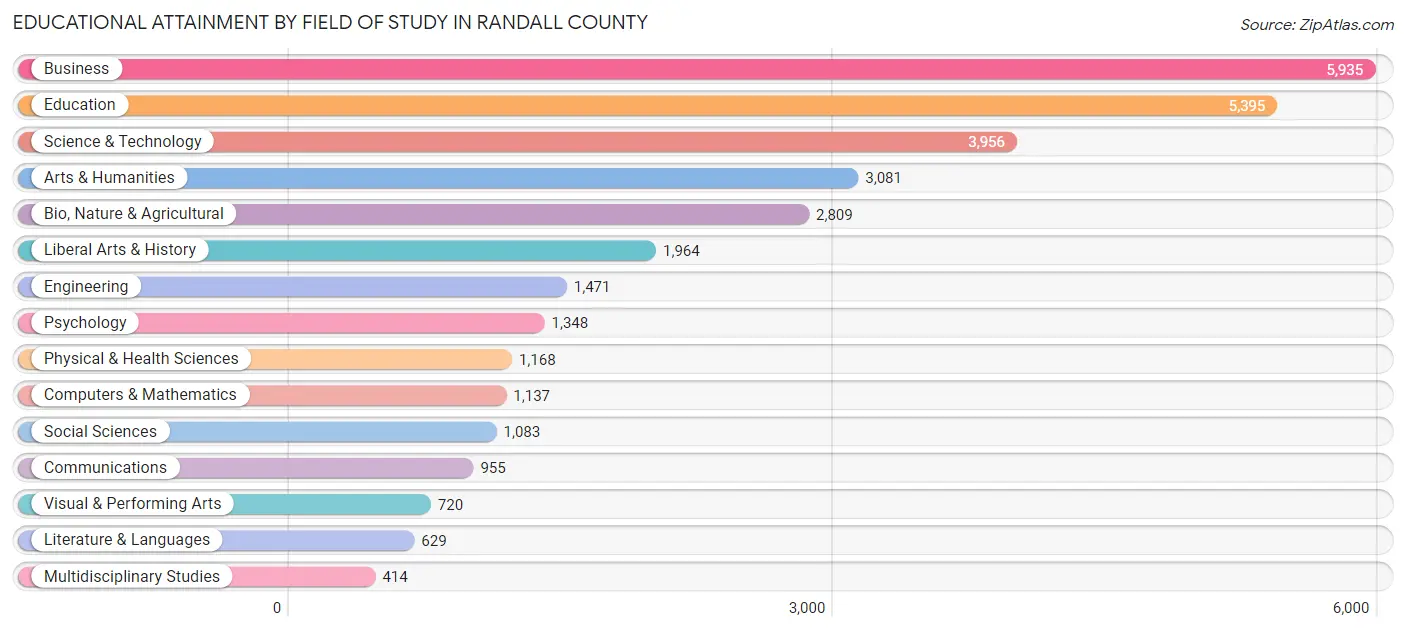
| Field of Study | # Graduates | % Graduates |
| Computers & Mathematics | 1,137 | 3.5% |
| Bio, Nature & Agricultural | 2,809 | 8.8% |
| Physical & Health Sciences | 1,168 | 3.6% |
| Psychology | 1,348 | 4.2% |
| Social Sciences | 1,083 | 3.4% |
| Engineering | 1,471 | 4.6% |
| Multidisciplinary Studies | 414 | 1.3% |
| Science & Technology | 3,956 | 12.3% |
| Business | 5,935 | 18.5% |
| Education | 5,395 | 16.8% |
| Literature & Languages | 629 | 2.0% |
| Liberal Arts & History | 1,964 | 6.1% |
| Visual & Performing Arts | 720 | 2.2% |
| Communications | 955 | 3.0% |
| Arts & Humanities | 3,081 | 9.6% |
| Total | 32,065 | 100.0% |
Transportation & Commute in Randall County
Vehicle Availability by Sex in Randall County
The most prevalent vehicle ownership categories in Randall County are males with 2 vehicles (16,904, accounting for 43.3%) and females with 2 vehicles (13,665, making up 51.7%).
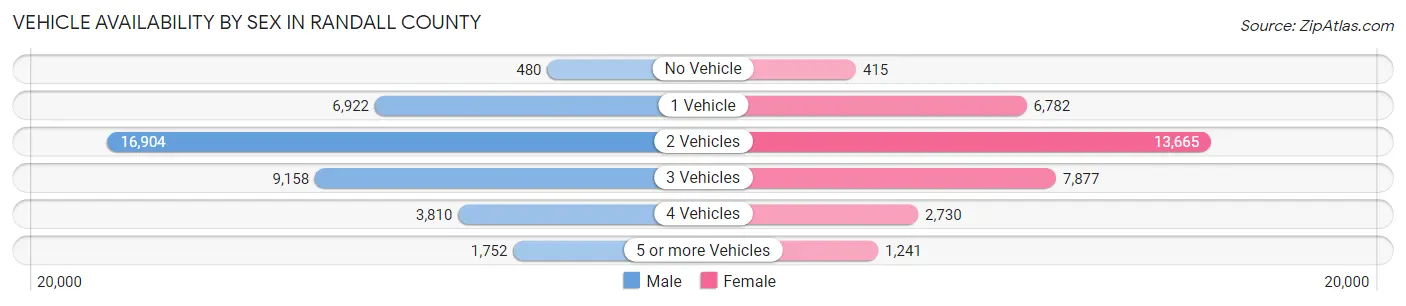
| Vehicles Available | Male | Female |
| No Vehicle | 480 (1.2%) | 415 (1.3%) |
| 1 Vehicle | 6,922 (17.7%) | 6,782 (20.7%) |
| 2 Vehicles | 16,904 (43.3%) | 13,665 (41.8%) |
| 3 Vehicles | 9,158 (23.5%) | 7,877 (24.1%) |
| 4 Vehicles | 3,810 (9.8%) | 2,730 (8.4%) |
| 5 or more Vehicles | 1,752 (4.5%) | 1,241 (3.8%) |
| Total | 39,026 (100.0%) | 32,710 (100.0%) |
Commute Time in Randall County
The most frequently occuring commute durations in Randall County are 15 to 19 minutes (18,493 commuters, 27.2%), 10 to 14 minutes (13,447 commuters, 19.8%), and 20 to 24 minutes (11,213 commuters, 16.5%).
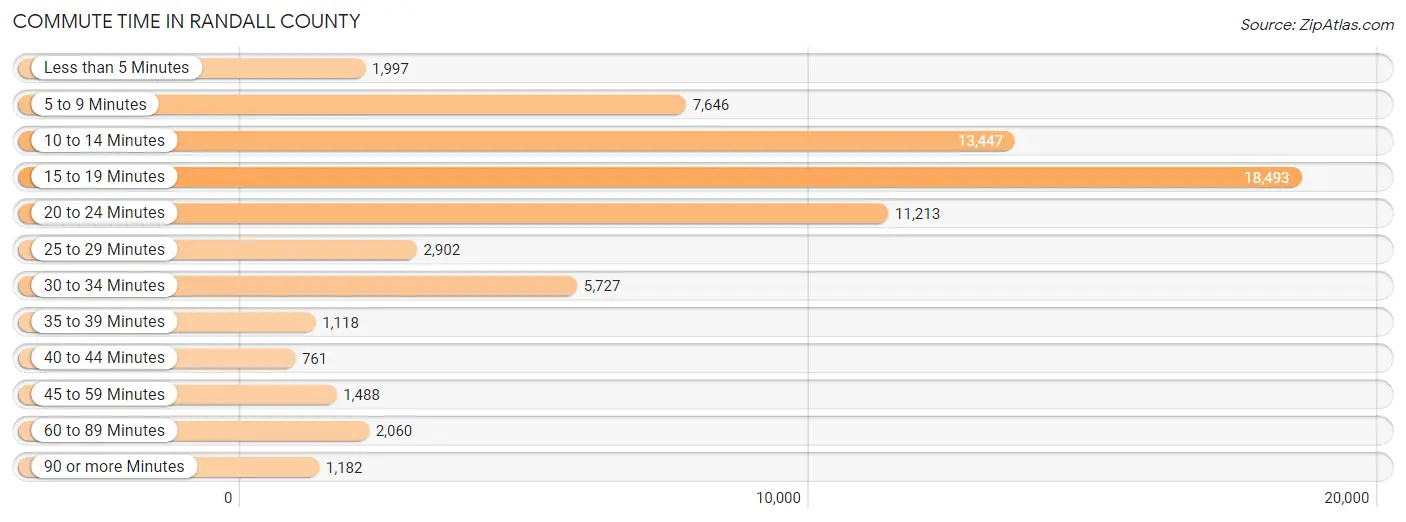
| Commute Time | # Commuters | % Commuters |
| Less than 5 Minutes | 1,997 | 2.9% |
| 5 to 9 Minutes | 7,646 | 11.2% |
| 10 to 14 Minutes | 13,447 | 19.8% |
| 15 to 19 Minutes | 18,493 | 27.2% |
| 20 to 24 Minutes | 11,213 | 16.5% |
| 25 to 29 Minutes | 2,902 | 4.3% |
| 30 to 34 Minutes | 5,727 | 8.4% |
| 35 to 39 Minutes | 1,118 | 1.6% |
| 40 to 44 Minutes | 761 | 1.1% |
| 45 to 59 Minutes | 1,488 | 2.2% |
| 60 to 89 Minutes | 2,060 | 3.0% |
| 90 or more Minutes | 1,182 | 1.7% |
Commute Time by Sex in Randall County
The most common commute times in Randall County are 15 to 19 minutes (9,260 commuters, 25.0%) for males and 15 to 19 minutes (9,233 commuters, 29.8%) for females.
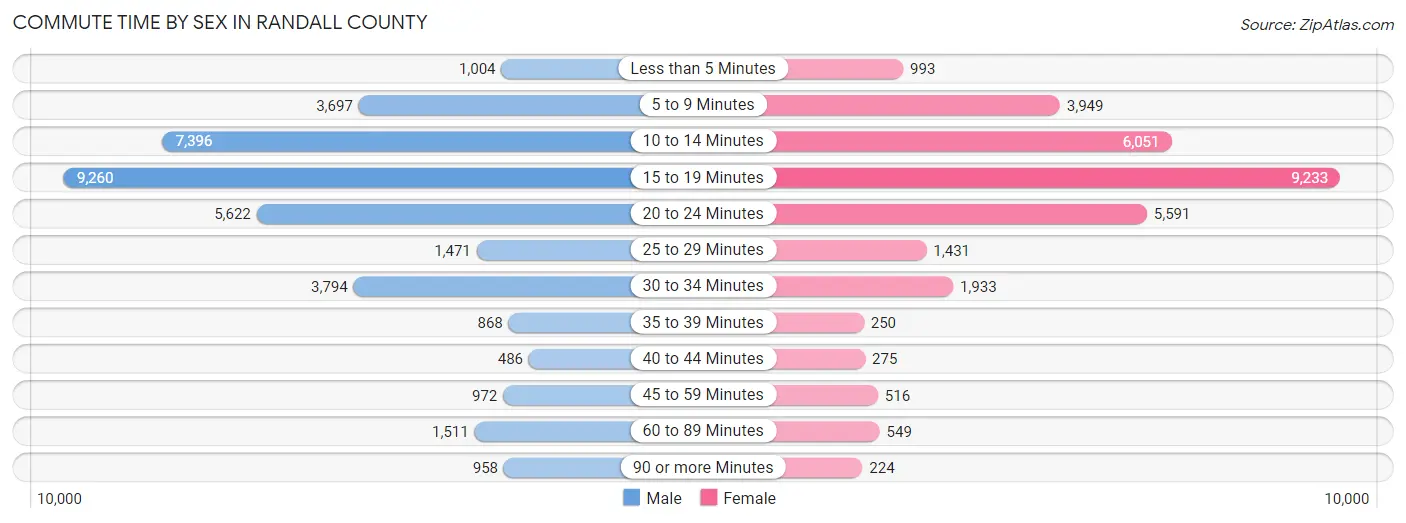
| Commute Time | Male | Female |
| Less than 5 Minutes | 1,004 (2.7%) | 993 (3.2%) |
| 5 to 9 Minutes | 3,697 (10.0%) | 3,949 (12.7%) |
| 10 to 14 Minutes | 7,396 (20.0%) | 6,051 (19.5%) |
| 15 to 19 Minutes | 9,260 (25.0%) | 9,233 (29.8%) |
| 20 to 24 Minutes | 5,622 (15.2%) | 5,591 (18.0%) |
| 25 to 29 Minutes | 1,471 (4.0%) | 1,431 (4.6%) |
| 30 to 34 Minutes | 3,794 (10.2%) | 1,933 (6.2%) |
| 35 to 39 Minutes | 868 (2.3%) | 250 (0.8%) |
| 40 to 44 Minutes | 486 (1.3%) | 275 (0.9%) |
| 45 to 59 Minutes | 972 (2.6%) | 516 (1.7%) |
| 60 to 89 Minutes | 1,511 (4.1%) | 549 (1.8%) |
| 90 or more Minutes | 958 (2.6%) | 224 (0.7%) |
Time of Departure to Work by Sex in Randall County
The most frequent times of departure to work in Randall County are 7:00 AM to 7:29 AM (6,105, 16.5%) for males and 7:30 AM to 7:59 AM (7,286, 23.5%) for females.
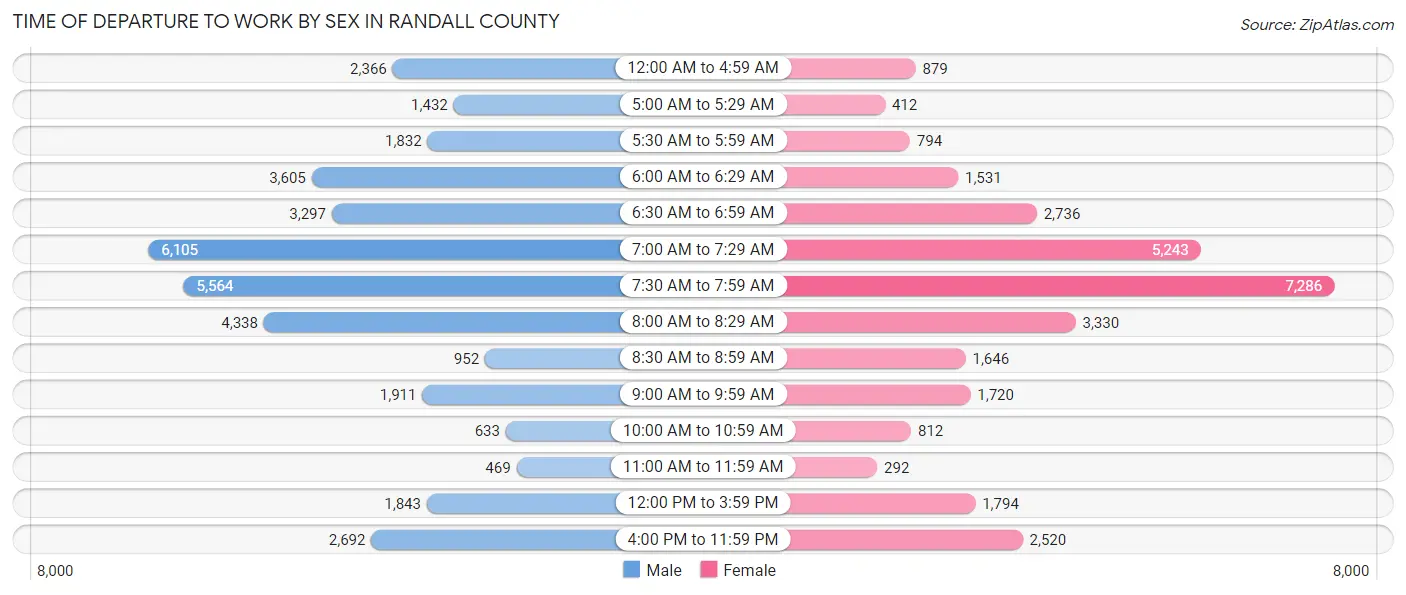
| Time of Departure | Male | Female |
| 12:00 AM to 4:59 AM | 2,366 (6.4%) | 879 (2.8%) |
| 5:00 AM to 5:29 AM | 1,432 (3.9%) | 412 (1.3%) |
| 5:30 AM to 5:59 AM | 1,832 (5.0%) | 794 (2.6%) |
| 6:00 AM to 6:29 AM | 3,605 (9.7%) | 1,531 (4.9%) |
| 6:30 AM to 6:59 AM | 3,297 (8.9%) | 2,736 (8.8%) |
| 7:00 AM to 7:29 AM | 6,105 (16.5%) | 5,243 (16.9%) |
| 7:30 AM to 7:59 AM | 5,564 (15.0%) | 7,286 (23.5%) |
| 8:00 AM to 8:29 AM | 4,338 (11.7%) | 3,330 (10.7%) |
| 8:30 AM to 8:59 AM | 952 (2.6%) | 1,646 (5.3%) |
| 9:00 AM to 9:59 AM | 1,911 (5.2%) | 1,720 (5.6%) |
| 10:00 AM to 10:59 AM | 633 (1.7%) | 812 (2.6%) |
| 11:00 AM to 11:59 AM | 469 (1.3%) | 292 (0.9%) |
| 12:00 PM to 3:59 PM | 1,843 (5.0%) | 1,794 (5.8%) |
| 4:00 PM to 11:59 PM | 2,692 (7.3%) | 2,520 (8.1%) |
| Total | 37,039 (100.0%) | 30,995 (100.0%) |
Housing Occupancy in Randall County
Occupancy by Ownership in Randall County
Of the total 54,984 dwellings in Randall County, owner-occupied units account for 38,208 (69.5%), while renter-occupied units make up 16,776 (30.5%).
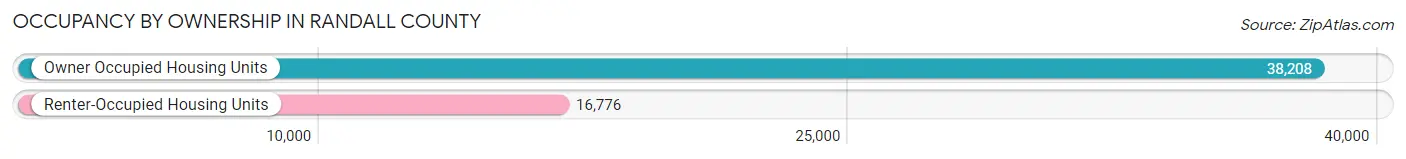
| Occupancy | # Housing Units | % Housing Units |
| Owner Occupied Housing Units | 38,208 | 69.5% |
| Renter-Occupied Housing Units | 16,776 | 30.5% |
| Total Occupied Housing Units | 54,984 | 100.0% |
Occupancy by Household Size in Randall County
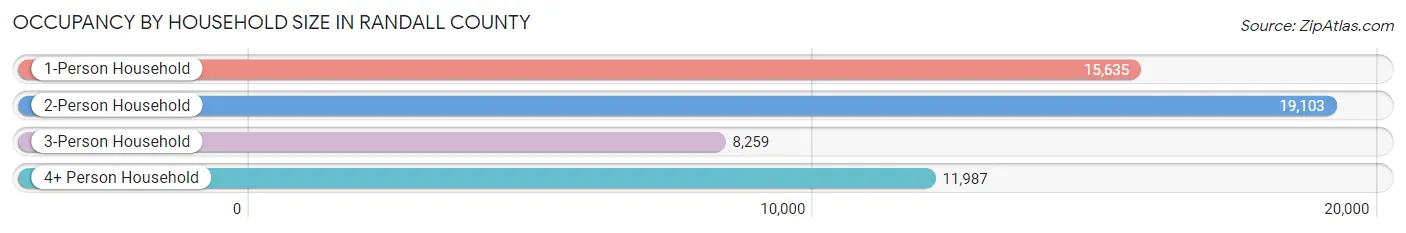
| Household Size | # Housing Units | % Housing Units |
| 1-Person Household | 15,635 | 28.4% |
| 2-Person Household | 19,103 | 34.7% |
| 3-Person Household | 8,259 | 15.0% |
| 4+ Person Household | 11,987 | 21.8% |
| Total Housing Units | 54,984 | 100.0% |
Occupancy by Ownership by Household Size in Randall County
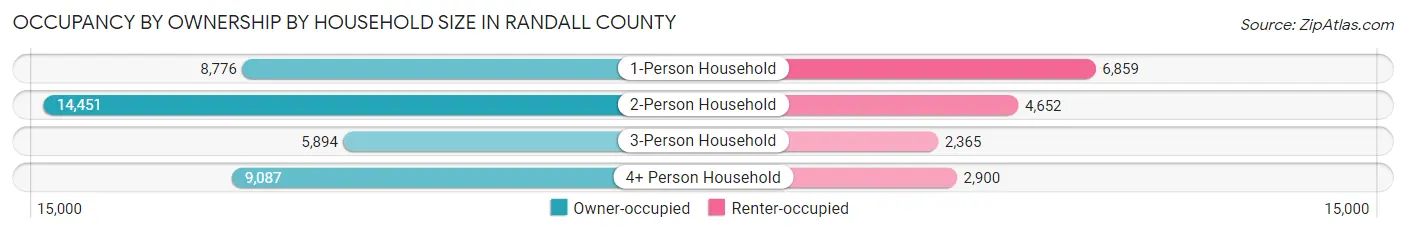
| Household Size | Owner-occupied | Renter-occupied |
| 1-Person Household | 8,776 (56.1%) | 6,859 (43.9%) |
| 2-Person Household | 14,451 (75.6%) | 4,652 (24.3%) |
| 3-Person Household | 5,894 (71.4%) | 2,365 (28.6%) |
| 4+ Person Household | 9,087 (75.8%) | 2,900 (24.2%) |
| Total Housing Units | 38,208 (69.5%) | 16,776 (30.5%) |
Occupancy by Educational Attainment in Randall County
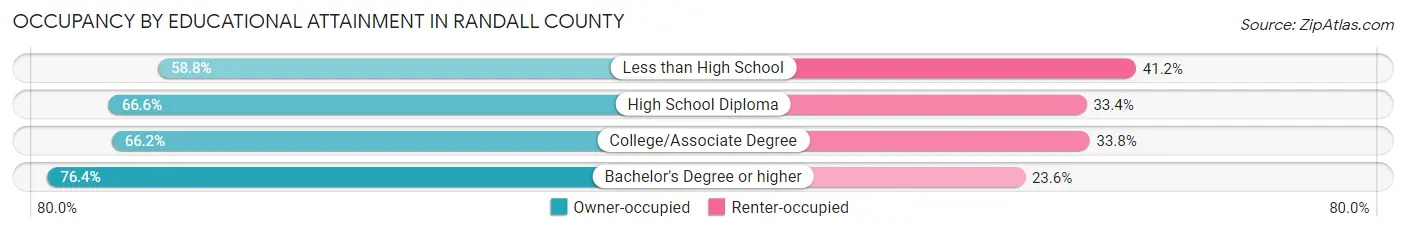
| Household Size | Owner-occupied | Renter-occupied |
| Less than High School | 1,702 (58.8%) | 1,192 (41.2%) |
| High School Diploma | 7,230 (66.6%) | 3,619 (33.4%) |
| College/Associate Degree | 14,415 (66.2%) | 7,374 (33.8%) |
| Bachelor's Degree or higher | 14,861 (76.4%) | 4,591 (23.6%) |
Occupancy by Age of Householder in Randall County
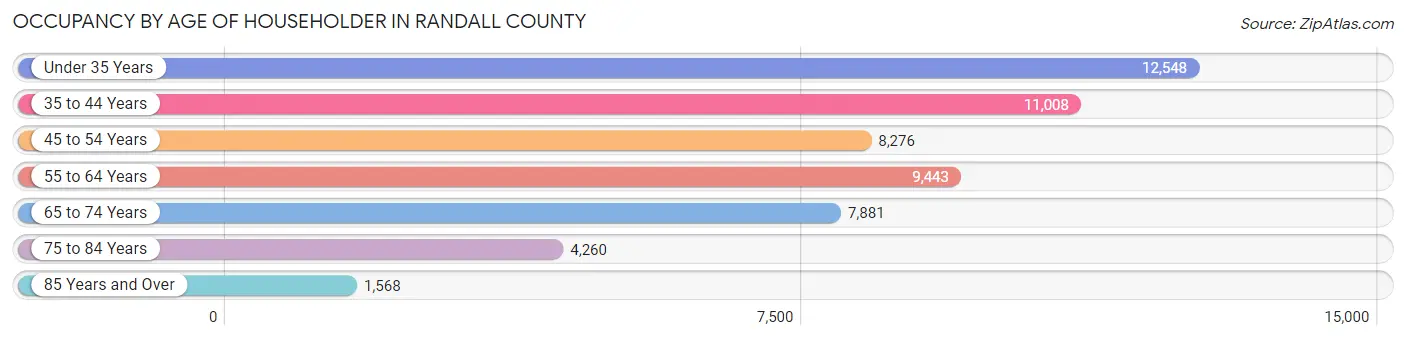
| Age Bracket | # Households | % Households |
| Under 35 Years | 12,548 | 22.8% |
| 35 to 44 Years | 11,008 | 20.0% |
| 45 to 54 Years | 8,276 | 15.0% |
| 55 to 64 Years | 9,443 | 17.2% |
| 65 to 74 Years | 7,881 | 14.3% |
| 75 to 84 Years | 4,260 | 7.7% |
| 85 Years and Over | 1,568 | 2.9% |
| Total | 54,984 | 100.0% |
Housing Finances in Randall County
Median Income by Occupancy in Randall County
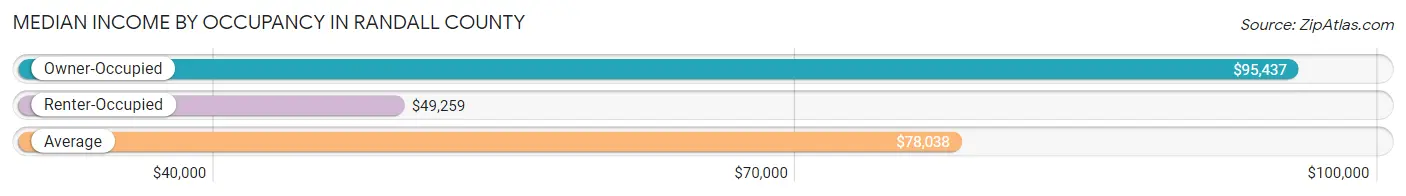
| Occupancy Type | # Households | Median Income |
| Owner-Occupied | 38,208 (69.5%) | $95,437 |
| Renter-Occupied | 16,776 (30.5%) | $49,259 |
| Average | 54,984 (100.0%) | $78,038 |
Occupancy by Householder Income Bracket in Randall County
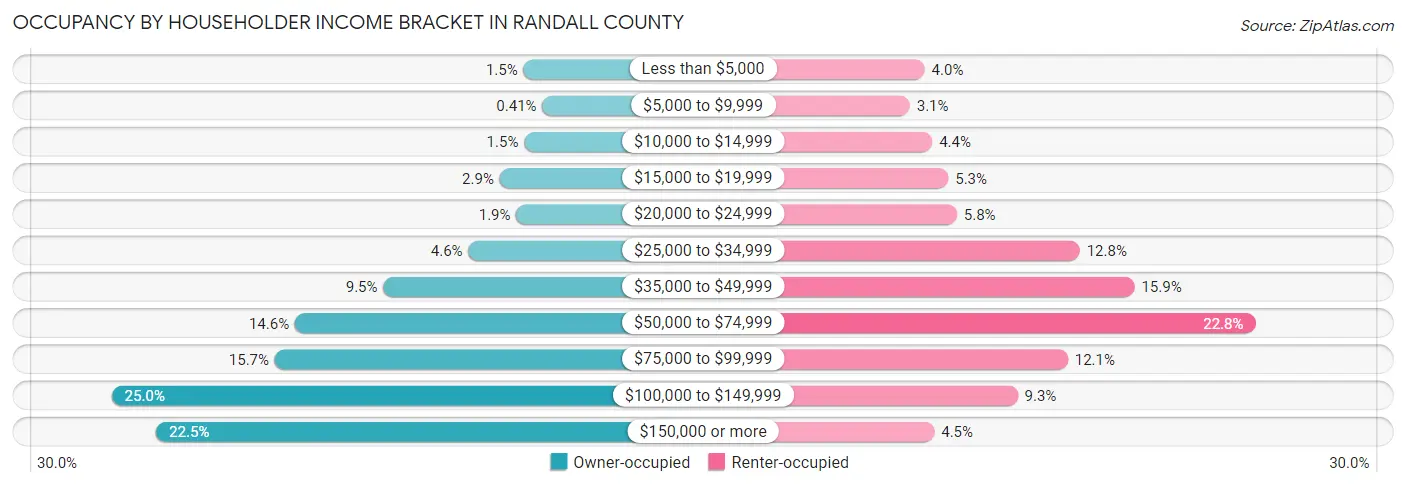
| Income Bracket | Owner-occupied | Renter-occupied |
| Less than $5,000 | 570 (1.5%) | 663 (4.0%) |
| $5,000 to $9,999 | 156 (0.4%) | 520 (3.1%) |
| $10,000 to $14,999 | 553 (1.5%) | 734 (4.4%) |
| $15,000 to $19,999 | 1,089 (2.9%) | 889 (5.3%) |
| $20,000 to $24,999 | 726 (1.9%) | 972 (5.8%) |
| $25,000 to $34,999 | 1,773 (4.6%) | 2,149 (12.8%) |
| $35,000 to $49,999 | 3,631 (9.5%) | 2,674 (15.9%) |
| $50,000 to $74,999 | 5,558 (14.5%) | 3,832 (22.8%) |
| $75,000 to $99,999 | 5,999 (15.7%) | 2,035 (12.1%) |
| $100,000 to $149,999 | 9,564 (25.0%) | 1,553 (9.3%) |
| $150,000 or more | 8,589 (22.5%) | 755 (4.5%) |
| Total | 38,208 (100.0%) | 16,776 (100.0%) |
Monthly Housing Cost Tiers in Randall County
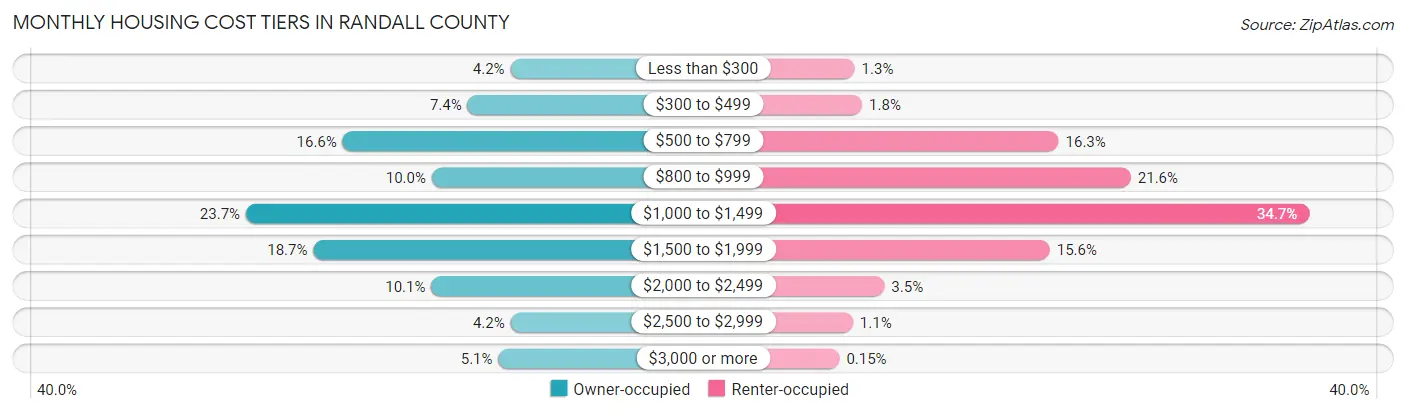
| Monthly Cost | Owner-occupied | Renter-occupied |
| Less than $300 | 1,614 (4.2%) | 213 (1.3%) |
| $300 to $499 | 2,818 (7.4%) | 306 (1.8%) |
| $500 to $799 | 6,336 (16.6%) | 2,733 (16.3%) |
| $800 to $999 | 3,826 (10.0%) | 3,626 (21.6%) |
| $1,000 to $1,499 | 9,054 (23.7%) | 5,828 (34.7%) |
| $1,500 to $1,999 | 7,160 (18.7%) | 2,623 (15.6%) |
| $2,000 to $2,499 | 3,841 (10.1%) | 581 (3.5%) |
| $2,500 to $2,999 | 1,607 (4.2%) | 192 (1.1%) |
| $3,000 or more | 1,952 (5.1%) | 26 (0.2%) |
| Total | 38,208 (100.0%) | 16,776 (100.0%) |
Physical Housing Characteristics in Randall County
Housing Structures in Randall County
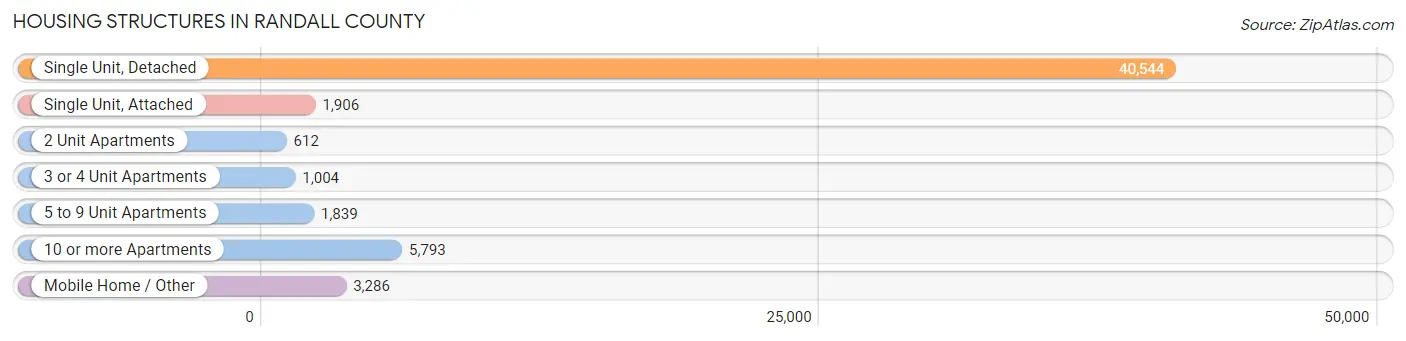
| Structure Type | # Housing Units | % Housing Units |
| Single Unit, Detached | 40,544 | 73.7% |
| Single Unit, Attached | 1,906 | 3.5% |
| 2 Unit Apartments | 612 | 1.1% |
| 3 or 4 Unit Apartments | 1,004 | 1.8% |
| 5 to 9 Unit Apartments | 1,839 | 3.3% |
| 10 or more Apartments | 5,793 | 10.5% |
| Mobile Home / Other | 3,286 | 6.0% |
| Total | 54,984 | 100.0% |
Housing Structures by Occupancy in Randall County
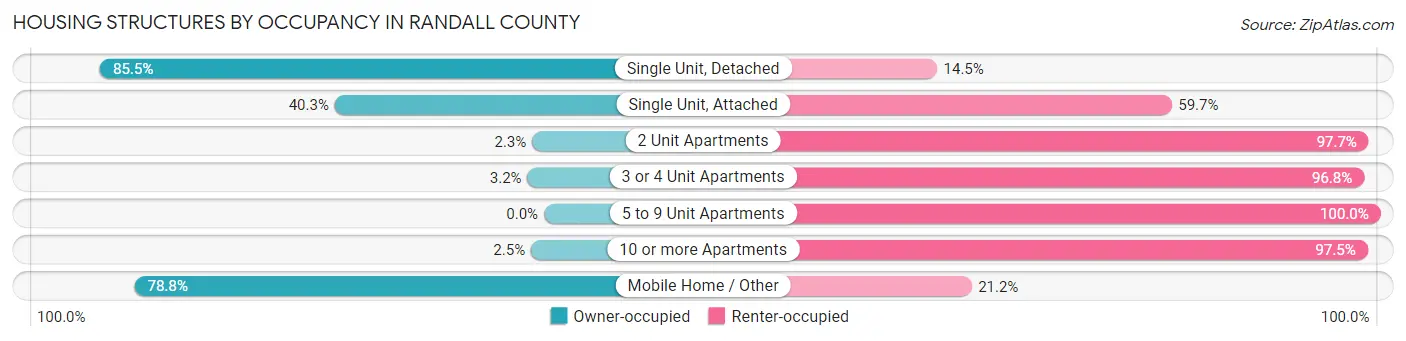
| Structure Type | Owner-occupied | Renter-occupied |
| Single Unit, Detached | 34,659 (85.5%) | 5,885 (14.5%) |
| Single Unit, Attached | 768 (40.3%) | 1,138 (59.7%) |
| 2 Unit Apartments | 14 (2.3%) | 598 (97.7%) |
| 3 or 4 Unit Apartments | 32 (3.2%) | 972 (96.8%) |
| 5 to 9 Unit Apartments | 0 (0.0%) | 1,839 (100.0%) |
| 10 or more Apartments | 145 (2.5%) | 5,648 (97.5%) |
| Mobile Home / Other | 2,590 (78.8%) | 696 (21.2%) |
| Total | 38,208 (69.5%) | 16,776 (30.5%) |
Housing Structures by Number of Rooms in Randall County
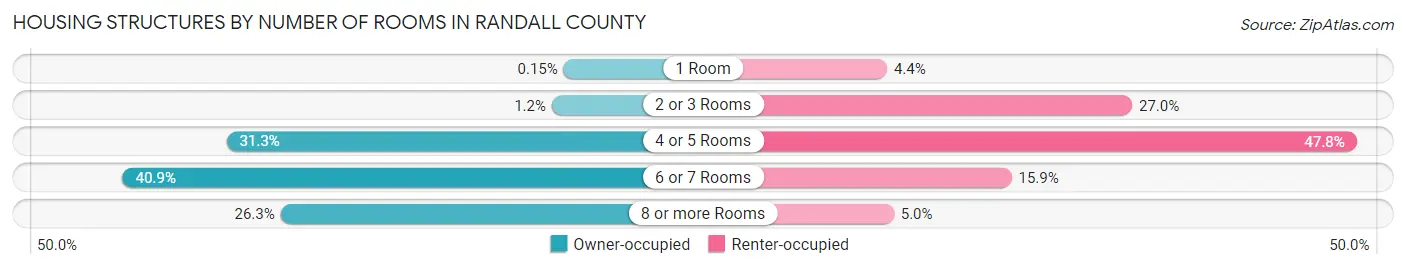
| Number of Rooms | Owner-occupied | Renter-occupied |
| 1 Room | 59 (0.2%) | 730 (4.3%) |
| 2 or 3 Rooms | 475 (1.2%) | 4,533 (27.0%) |
| 4 or 5 Rooms | 11,969 (31.3%) | 8,015 (47.8%) |
| 6 or 7 Rooms | 15,643 (40.9%) | 2,663 (15.9%) |
| 8 or more Rooms | 10,062 (26.3%) | 835 (5.0%) |
| Total | 38,208 (100.0%) | 16,776 (100.0%) |
Housing Structure by Heating Type in Randall County
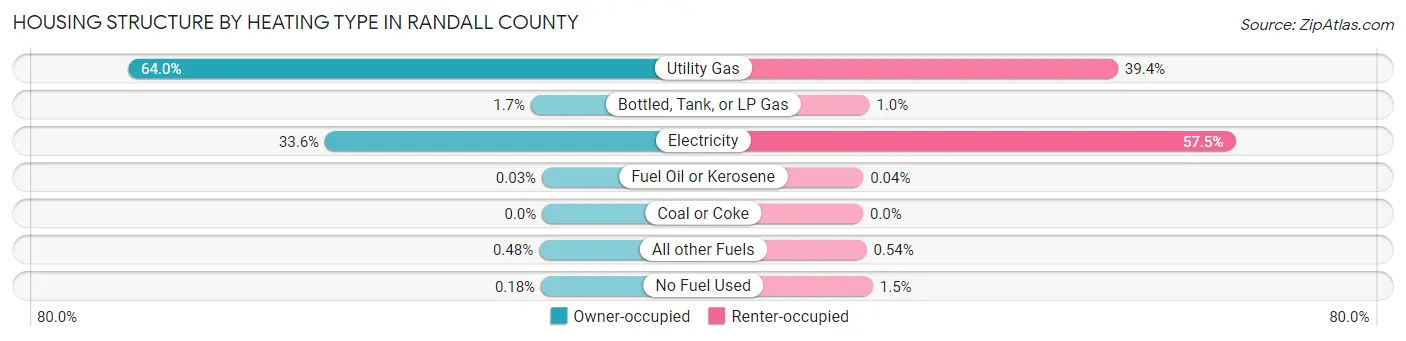
| Heating Type | Owner-occupied | Renter-occupied |
| Utility Gas | 24,455 (64.0%) | 6,609 (39.4%) |
| Bottled, Tank, or LP Gas | 666 (1.7%) | 168 (1.0%) |
| Electricity | 12,826 (33.6%) | 9,647 (57.5%) |
| Fuel Oil or Kerosene | 10 (0.0%) | 7 (0.0%) |
| Coal or Coke | 0 (0.0%) | 0 (0.0%) |
| All other Fuels | 182 (0.5%) | 90 (0.5%) |
| No Fuel Used | 69 (0.2%) | 255 (1.5%) |
| Total | 38,208 (100.0%) | 16,776 (100.0%) |
Household Vehicle Usage in Randall County
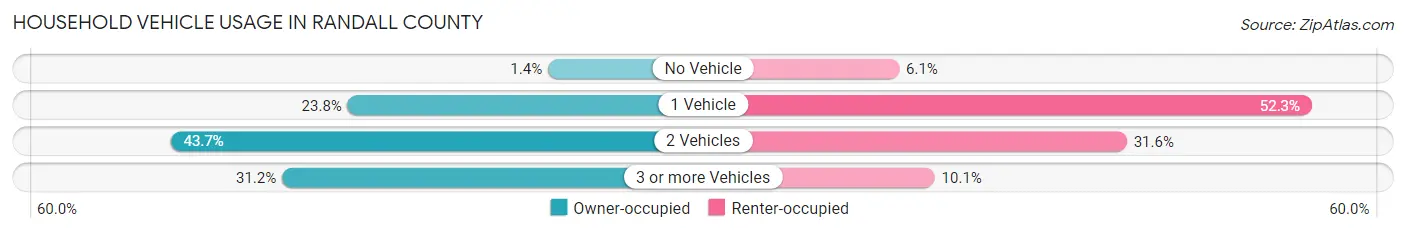
| Vehicles per Household | Owner-occupied | Renter-occupied |
| No Vehicle | 523 (1.4%) | 1,019 (6.1%) |
| 1 Vehicle | 9,099 (23.8%) | 8,774 (52.3%) |
| 2 Vehicles | 16,682 (43.7%) | 5,297 (31.6%) |
| 3 or more Vehicles | 11,904 (31.2%) | 1,686 (10.1%) |
| Total | 38,208 (100.0%) | 16,776 (100.0%) |
Real Estate & Mortgages in Randall County
Real Estate and Mortgage Overview in Randall County
| Characteristic | Without Mortgage | With Mortgage |
| Housing Units | 15,057 | 23,151 |
| Median Property Value | $199,200 | $214,500 |
| Median Household Income | $71,853 | $6,170 |
| Monthly Housing Costs | $659 | $1,882 |
| Real Estate Taxes | $3,041 | $782 |
Property Value by Mortgage Status in Randall County
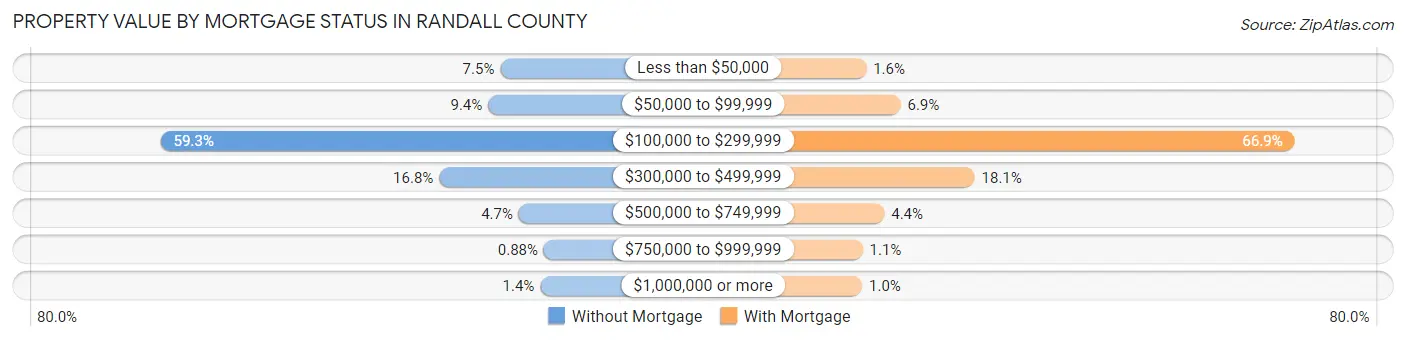
| Property Value | Without Mortgage | With Mortgage |
| Less than $50,000 | 1,133 (7.5%) | 378 (1.6%) |
| $50,000 to $99,999 | 1,411 (9.4%) | 1,589 (6.9%) |
| $100,000 to $299,999 | 8,926 (59.3%) | 15,489 (66.9%) |
| $300,000 to $499,999 | 2,534 (16.8%) | 4,200 (18.1%) |
| $500,000 to $749,999 | 706 (4.7%) | 1,015 (4.4%) |
| $750,000 to $999,999 | 132 (0.9%) | 248 (1.1%) |
| $1,000,000 or more | 215 (1.4%) | 232 (1.0%) |
| Total | 15,057 (100.0%) | 23,151 (100.0%) |
Household Income by Mortgage Status in Randall County
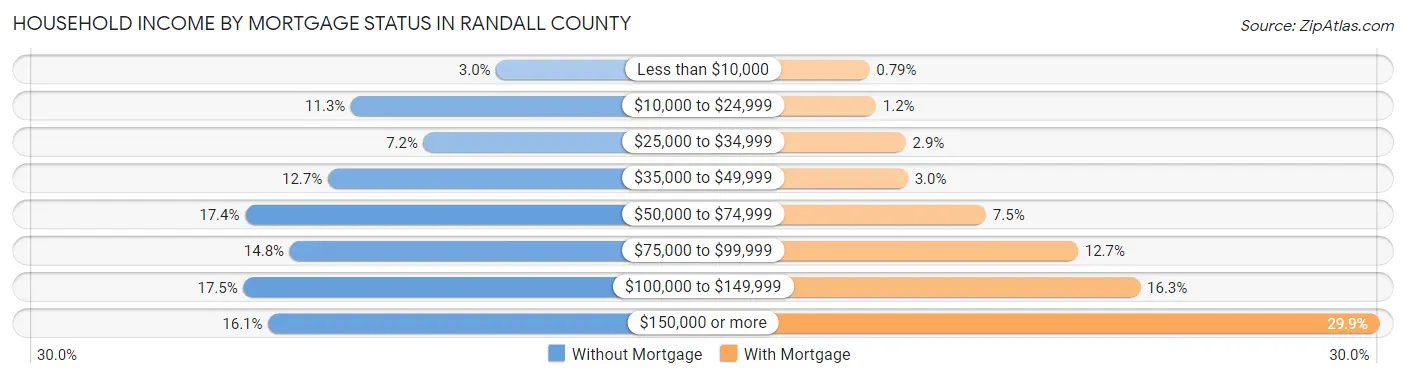
| Household Income | Without Mortgage | With Mortgage |
| Less than $10,000 | 458 (3.0%) | 184 (0.8%) |
| $10,000 to $24,999 | 1,707 (11.3%) | 268 (1.2%) |
| $25,000 to $34,999 | 1,082 (7.2%) | 661 (2.9%) |
| $35,000 to $49,999 | 1,906 (12.7%) | 691 (3.0%) |
| $50,000 to $74,999 | 2,618 (17.4%) | 1,725 (7.4%) |
| $75,000 to $99,999 | 2,234 (14.8%) | 2,940 (12.7%) |
| $100,000 to $149,999 | 2,633 (17.5%) | 3,765 (16.3%) |
| $150,000 or more | 2,419 (16.1%) | 6,931 (29.9%) |
| Total | 15,057 (100.0%) | 23,151 (100.0%) |
Property Value to Household Income Ratio in Randall County
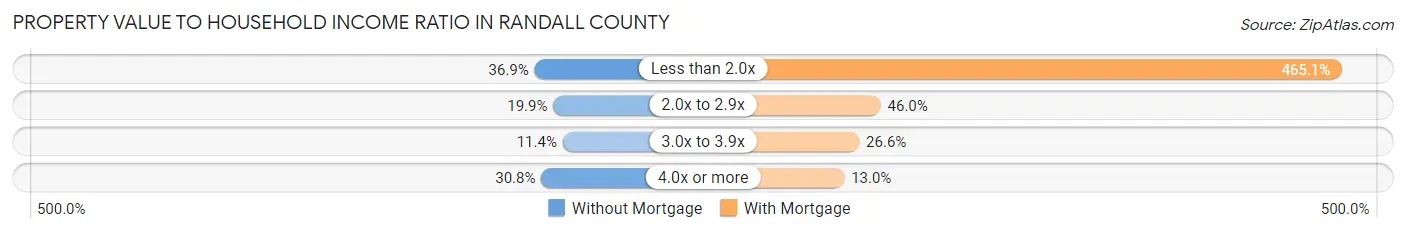
| Value-to-Income Ratio | Without Mortgage | With Mortgage |
| Less than 2.0x | 5,553 (36.9%) | 107,669 (465.1%) |
| 2.0x to 2.9x | 3,002 (19.9%) | 10,655 (46.0%) |
| 3.0x to 3.9x | 1,711 (11.4%) | 6,147 (26.6%) |
| 4.0x or more | 4,636 (30.8%) | 3,006 (13.0%) |
| Total | 15,057 (100.0%) | 23,151 (100.0%) |
Real Estate Taxes by Mortgage Status in Randall County
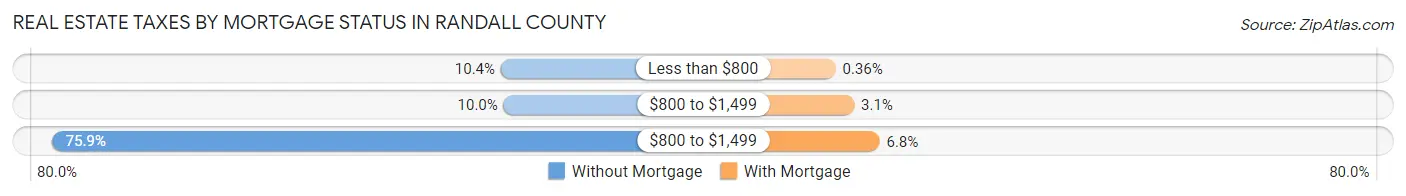
| Property Taxes | Without Mortgage | With Mortgage |
| Less than $800 | 1,568 (10.4%) | 84 (0.4%) |
| $800 to $1,499 | 1,507 (10.0%) | 713 (3.1%) |
| $800 to $1,499 | 11,428 (75.9%) | 1,572 (6.8%) |
| Total | 15,057 (100.0%) | 23,151 (100.0%) |
Health & Disability in Randall County
Health Insurance Coverage by Age in Randall County
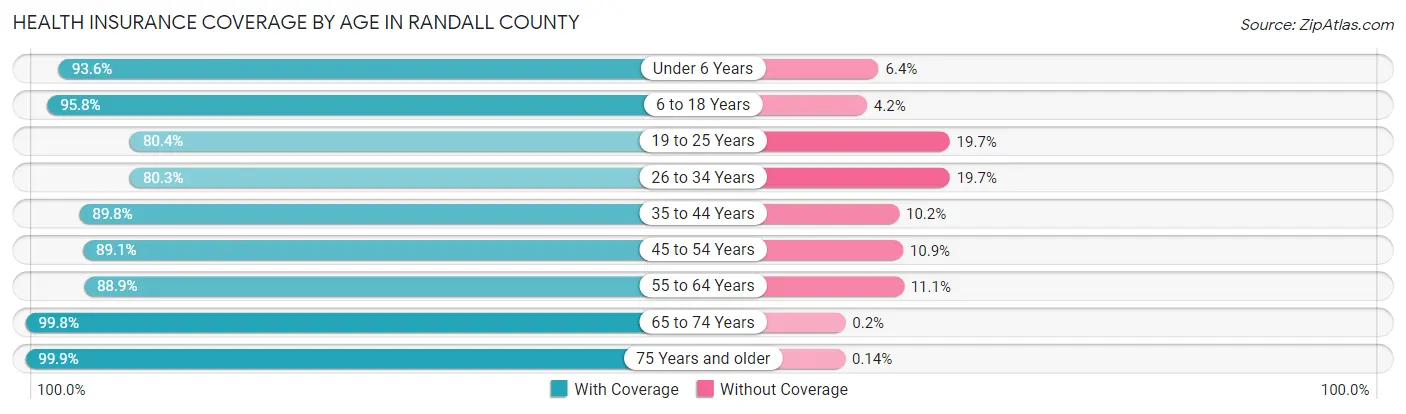
| Age Bracket | With Coverage | Without Coverage |
| Under 6 Years | 9,387 (93.6%) | 642 (6.4%) |
| 6 to 18 Years | 24,918 (95.8%) | 1,098 (4.2%) |
| 19 to 25 Years | 11,079 (80.3%) | 2,709 (19.7%) |
| 26 to 34 Years | 14,148 (80.3%) | 3,462 (19.7%) |
| 35 to 44 Years | 17,553 (89.8%) | 1,996 (10.2%) |
| 45 to 54 Years | 14,040 (89.1%) | 1,722 (10.9%) |
| 55 to 64 Years | 14,348 (88.9%) | 1,787 (11.1%) |
| 65 to 74 Years | 13,141 (99.8%) | 26 (0.2%) |
| 75 Years and older | 8,507 (99.9%) | 12 (0.1%) |
| Total | 127,121 (90.4%) | 13,454 (9.6%) |
Health Insurance Coverage by Citizenship Status in Randall County
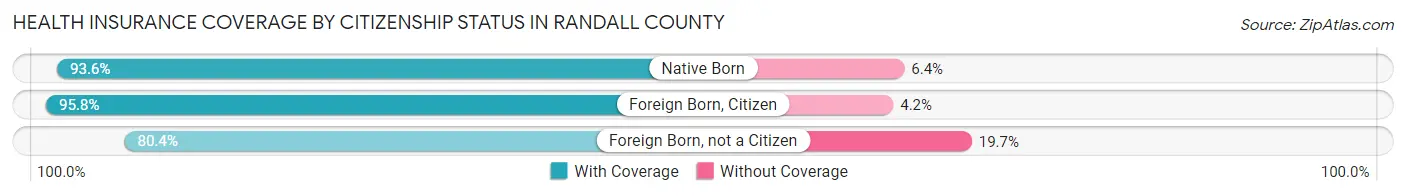
| Citizenship Status | With Coverage | Without Coverage |
| Native Born | 9,387 (93.6%) | 642 (6.4%) |
| Foreign Born, Citizen | 24,918 (95.8%) | 1,098 (4.2%) |
| Foreign Born, not a Citizen | 11,079 (80.3%) | 2,709 (19.7%) |
Health Insurance Coverage by Household Income in Randall County
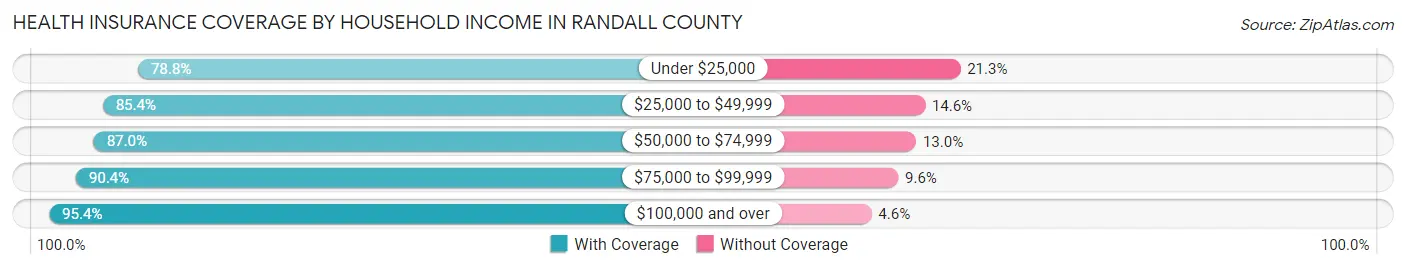
| Household Income | With Coverage | Without Coverage |
| Under $25,000 | 9,208 (78.7%) | 2,485 (21.2%) |
| $25,000 to $49,999 | 17,180 (85.4%) | 2,946 (14.6%) |
| $50,000 to $74,999 | 18,260 (87.0%) | 2,720 (13.0%) |
| $75,000 to $99,999 | 19,848 (90.4%) | 2,110 (9.6%) |
| $100,000 and over | 61,012 (95.4%) | 2,948 (4.6%) |
Public vs Private Health Insurance Coverage by Age in Randall County
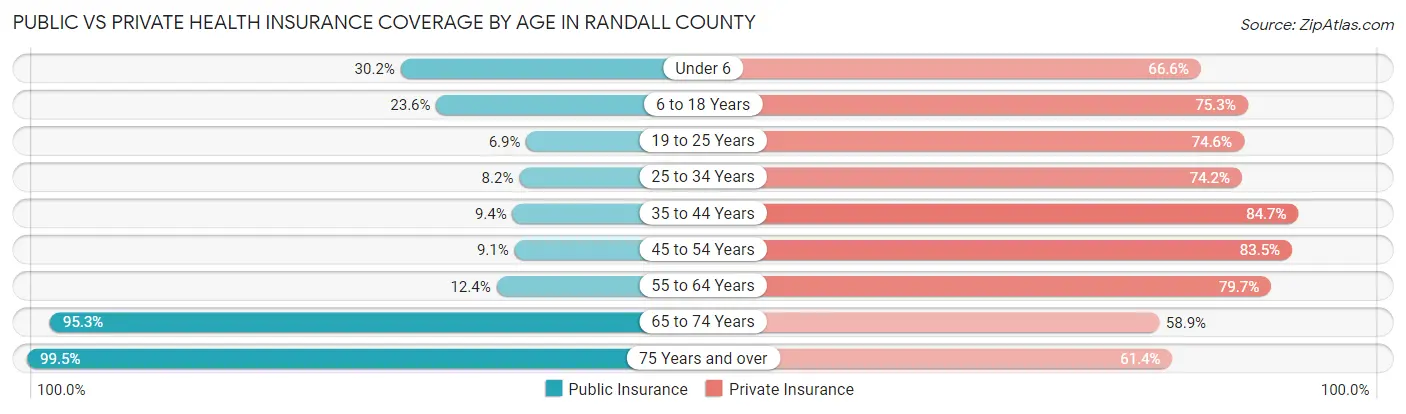
| Age Bracket | Public Insurance | Private Insurance |
| Under 6 | 3,029 (30.2%) | 6,679 (66.6%) |
| 6 to 18 Years | 6,131 (23.6%) | 19,591 (75.3%) |
| 19 to 25 Years | 947 (6.9%) | 10,288 (74.6%) |
| 25 to 34 Years | 1,443 (8.2%) | 13,074 (74.2%) |
| 35 to 44 Years | 1,843 (9.4%) | 16,564 (84.7%) |
| 45 to 54 Years | 1,428 (9.1%) | 13,167 (83.5%) |
| 55 to 64 Years | 2,003 (12.4%) | 12,854 (79.7%) |
| 65 to 74 Years | 12,548 (95.3%) | 7,750 (58.9%) |
| 75 Years and over | 8,478 (99.5%) | 5,227 (61.4%) |
| Total | 37,850 (26.9%) | 105,194 (74.8%) |
Disability Status by Sex by Age in Randall County
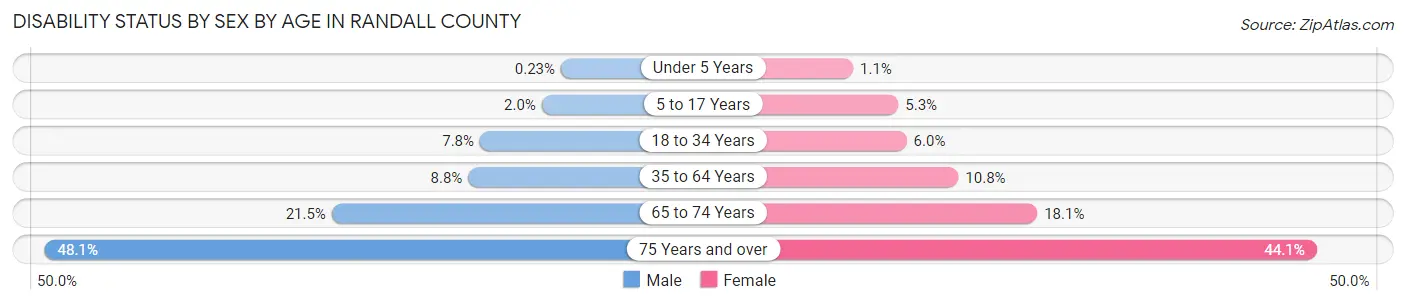
| Age Bracket | Male | Female |
| Under 5 Years | 10 (0.2%) | 43 (1.1%) |
| 5 to 17 Years | 257 (2.0%) | 652 (5.2%) |
| 18 to 34 Years | 1,317 (7.7%) | 1,011 (6.0%) |
| 35 to 64 Years | 2,260 (8.8%) | 2,797 (10.8%) |
| 65 to 74 Years | 1,324 (21.5%) | 1,271 (18.1%) |
| 75 Years and over | 1,705 (48.1%) | 2,193 (44.1%) |
Disability Class by Sex by Age in Randall County
Disability Class: Hearing Difficulty
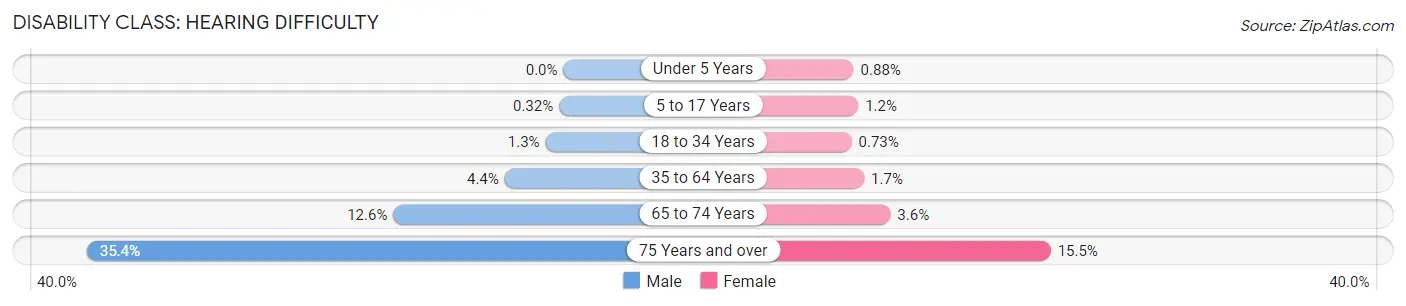
| Age Bracket | Male | Female |
| Under 5 Years | 0 (0.0%) | 36 (0.9%) |
| 5 to 17 Years | 41 (0.3%) | 151 (1.2%) |
| 18 to 34 Years | 226 (1.3%) | 122 (0.7%) |
| 35 to 64 Years | 1,115 (4.4%) | 429 (1.7%) |
| 65 to 74 Years | 778 (12.6%) | 253 (3.6%) |
| 75 Years and over | 1,253 (35.4%) | 772 (15.5%) |
Disability Class: Vision Difficulty
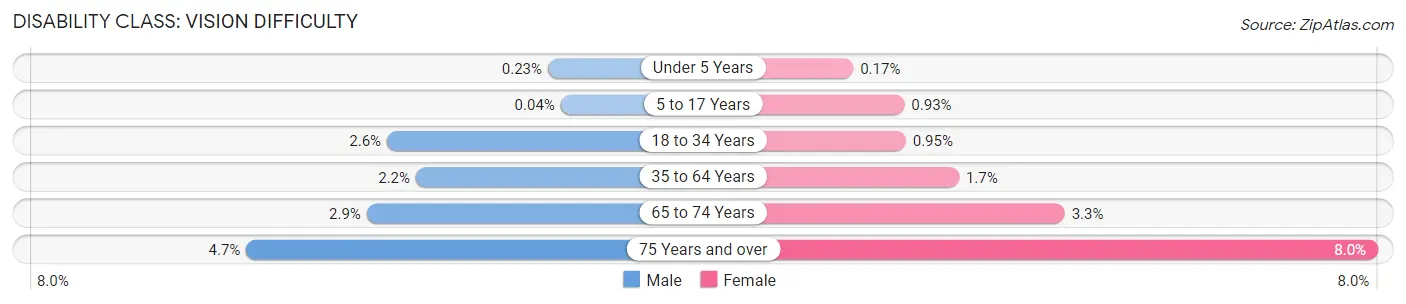
| Age Bracket | Male | Female |
| Under 5 Years | 10 (0.2%) | 7 (0.2%) |
| 5 to 17 Years | 5 (0.0%) | 116 (0.9%) |
| 18 to 34 Years | 445 (2.6%) | 160 (0.9%) |
| 35 to 64 Years | 561 (2.2%) | 451 (1.7%) |
| 65 to 74 Years | 180 (2.9%) | 232 (3.3%) |
| 75 Years and over | 167 (4.7%) | 396 (8.0%) |
Disability Class: Cognitive Difficulty
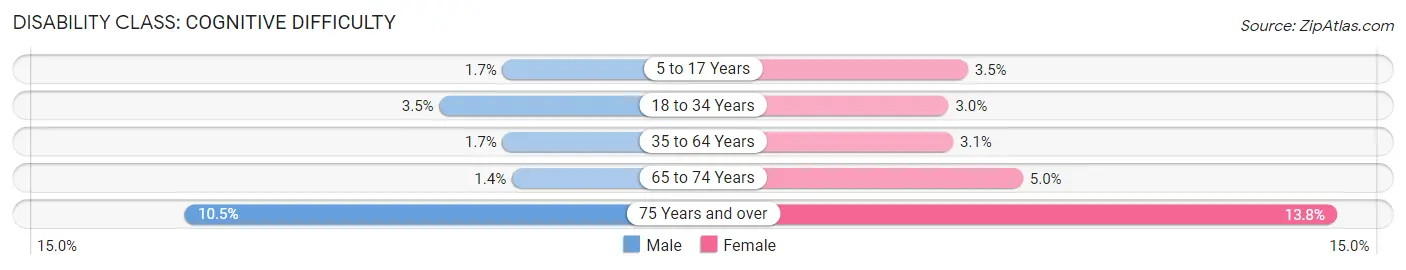
| Age Bracket | Male | Female |
| 5 to 17 Years | 216 (1.7%) | 436 (3.5%) |
| 18 to 34 Years | 586 (3.5%) | 499 (3.0%) |
| 35 to 64 Years | 433 (1.7%) | 801 (3.1%) |
| 65 to 74 Years | 88 (1.4%) | 353 (5.0%) |
| 75 Years and over | 373 (10.5%) | 686 (13.8%) |
Disability Class: Ambulatory Difficulty
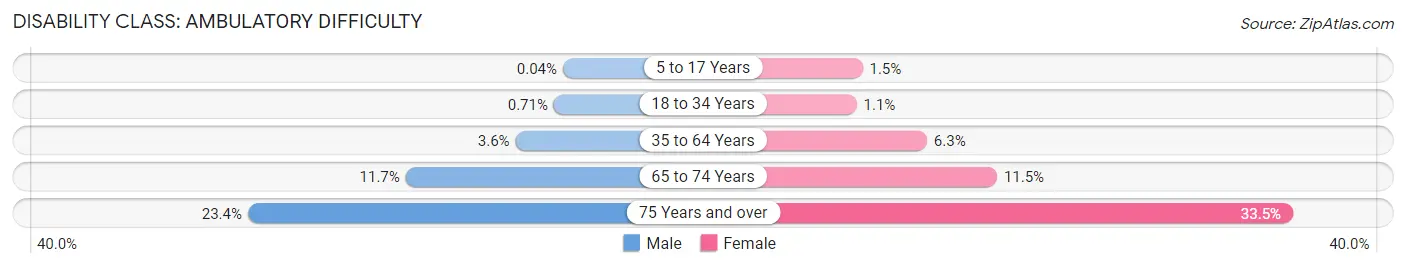
| Age Bracket | Male | Female |
| 5 to 17 Years | 5 (0.0%) | 191 (1.5%) |
| 18 to 34 Years | 121 (0.7%) | 185 (1.1%) |
| 35 to 64 Years | 912 (3.6%) | 1,634 (6.3%) |
| 65 to 74 Years | 721 (11.7%) | 807 (11.5%) |
| 75 Years and over | 830 (23.4%) | 1,667 (33.5%) |
Disability Class: Self-Care Difficulty
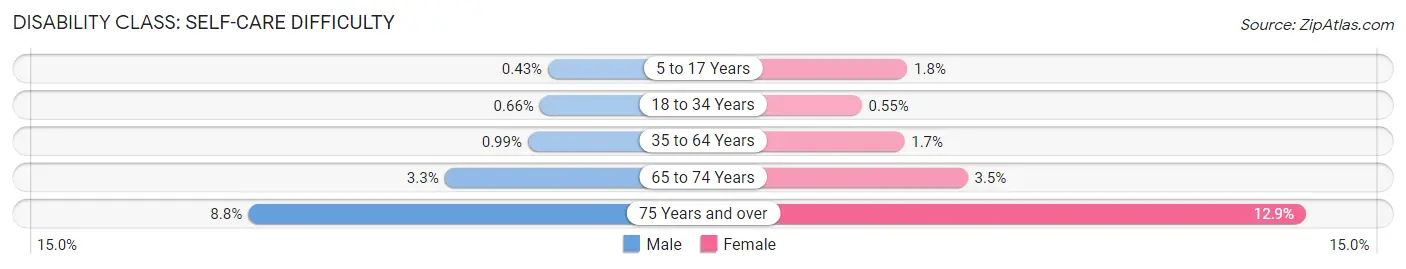
| Age Bracket | Male | Female |
| 5 to 17 Years | 55 (0.4%) | 226 (1.8%) |
| 18 to 34 Years | 112 (0.7%) | 93 (0.5%) |
| 35 to 64 Years | 253 (1.0%) | 451 (1.7%) |
| 65 to 74 Years | 204 (3.3%) | 245 (3.5%) |
| 75 Years and over | 311 (8.8%) | 643 (12.9%) |
Technology Access in Randall County
Computing Device Access in Randall County
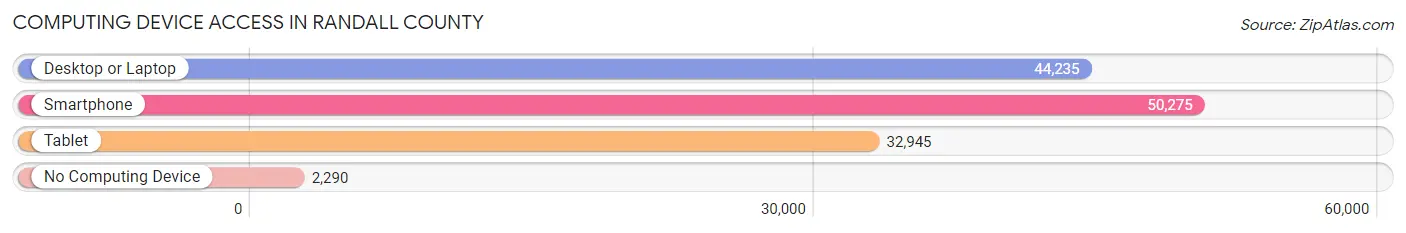
| Device Type | # Households | % Households |
| Desktop or Laptop | 44,235 | 80.4% |
| Smartphone | 50,275 | 91.4% |
| Tablet | 32,945 | 59.9% |
| No Computing Device | 2,290 | 4.2% |
| Total | 54,984 | 100.0% |
Internet Access in Randall County
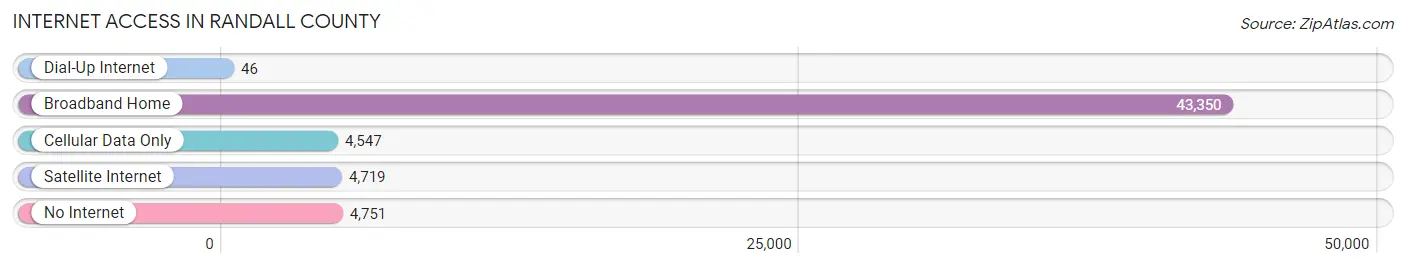
| Internet Type | # Households | % Households |
| Dial-Up Internet | 46 | 0.1% |
| Broadband Home | 43,350 | 78.8% |
| Cellular Data Only | 4,547 | 8.3% |
| Satellite Internet | 4,719 | 8.6% |
| No Internet | 4,751 | 8.6% |
| Total | 54,984 | 100.0% |
Randall County Summary
Randall County is located in the Texas Panhandle, in the northwestern corner of the state. It is bordered by Potter County to the north, Armstrong County to the east, Carson County to the south, and Deaf Smith County to the west. The county seat is Canyon, and the largest city is Amarillo.
History
Randall County was established in 1876, and was named for Horace Randal, a Confederate brigadier general who was killed in the Battle of Jenkins Ferry in Arkansas. The county was originally part of Bexar County, and was later part of Young County.
The first settlers in the area were ranchers, who began arriving in the late 1870s. The first town in the county was established in 1879, and was named Canyon City. The town was later renamed Canyon, and is now the county seat.
In the early 1900s, the county began to experience an influx of settlers, and the population began to grow. The Santa Fe Railroad was built through the county in 1908, and this helped to spur economic growth.
Geography
Randall County covers an area of 902 square miles, and is located in the Texas Panhandle. The county is mostly flat, with some rolling hills in the eastern part of the county. The county is drained by the Canadian River, which flows through the western part of the county.
The climate of Randall County is semi-arid, with hot summers and mild winters. The average annual precipitation is about 20 inches.
Economy
The economy of Randall County is largely based on agriculture and ranching. The county is home to several large cattle ranches, and is also a major producer of wheat, sorghum, and hay.
The county is also home to several manufacturing companies, including a large meatpacking plant and a large food processing plant. The county is also home to several oil and gas companies, and is a major producer of natural gas.
Demographics
As of the 2010 census, the population of Randall County was 120,725. The population is mostly white (83.3%), with a small Hispanic population (14.2%). The median household income is $50,945, and the median home value is $133,400.
The county is home to several colleges and universities, including West Texas A&M University and Amarillo College. The county is also home to several museums, including the Panhandle-Plains Historical Museum and the American Quarter Horse Hall of Fame and Museum.
Conclusion
Randall County is a rural county located in the Texas Panhandle. The county is largely agricultural, with a strong ranching and oil and gas industry. The population is mostly white, with a small Hispanic population. The county is home to several colleges and universities, and is a major producer of natural gas.
Common Questions
What is Per Capita Income in Randall County?
Per Capita income in Randall County is $40,047.
What is the Median Family Income in Randall County?
Median Family Income in Randall County is $97,611.
What is the Median Household income in Randall County?
Median Household Income in Randall County is $78,038.
What is Income or Wage Gap in Randall County?
Income or Wage Gap in Randall County is 36.6%.
Women in Randall County earn 63.4 cents for every dollar earned by a man.
What is Family Income Deficit in Randall County?
Family Income Deficit in Randall County is $9,583.
Families that are below poverty line in Randall County earn $9,583 less on average than the poverty threshold level.
What is Inequality or Gini Index in Randall County?
Inequality or Gini Index in Randall County is 0.43.
What is the Total Population of Randall County?
Total Population of Randall County is 141,489.
What is the Total Male Population of Randall County?
Total Male Population of Randall County is 70,037.
What is the Total Female Population of Randall County?
Total Female Population of Randall County is 71,452.
What is the Ratio of Males per 100 Females in Randall County?
There are 98.02 Males per 100 Females in Randall County.
What is the Ratio of Females per 100 Males in Randall County?
There are 102.02 Females per 100 Males in Randall County.
What is the Median Population Age in Randall County?
Median Population Age in Randall County is 36.4 Years.
What is the Average Family Size in Randall County
Average Family Size in Randall County is 3.1 People.
What is the Average Household Size in Randall County
Average Household Size in Randall County is 2.5 People.
How Large is the Labor Force in Randall County?
There are 75,354 People in the Labor Forcein in Randall County.
What is the Percentage of People in the Labor Force in Randall County?
67.6% of People are in the Labor Force in Randall County.
What is the Unemployment Rate in Randall County?
Unemployment Rate in Randall County is 2.8%.