Rains County, TX Map & Demographics
Rains County Map
Rains County Overview
$36,069
PER CAPITA INCOME
$80,391
AVG FAMILY INCOME
$60,291
AVG HOUSEHOLD INCOME
43.0%
WAGE / INCOME GAP [ % ]
57.0¢/ $1
WAGE / INCOME GAP [ $ ]
0.48
INEQUALITY / GINI INDEX
12,257
TOTAL POPULATION
6,127
MALE POPULATION
6,130
FEMALE POPULATION
99.95
MALES / 100 FEMALES
100.05
FEMALES / 100 MALES
47.6
MEDIAN AGE
3.1
AVG FAMILY SIZE
2.6
AVG HOUSEHOLD SIZE
5,262
LABOR FORCE [ PEOPLE ]
51.8%
PERCENT IN LABOR FORCE
2.3%
UNEMPLOYMENT RATE
Rains County Area Codes
Income in Rains County
Income Overview in Rains County
Per Capita Income in Rains County is $36,069, while median incomes of families and households are $80,391 and $60,291 respectively.
| Characteristic | Number | Measure |
| Per Capita Income | 12,257 | $36,069 |
| Median Family Income | 3,289 | $80,391 |
| Mean Family Income | 3,289 | $107,121 |
| Median Household Income | 4,710 | $60,291 |
| Mean Household Income | 4,710 | $91,470 |
| Income Deficit | 3,289 | $0 |
| Wage / Income Gap (%) | 12,257 | 43.04% |
| Wage / Income Gap ($) | 12,257 | 56.96¢ per $1 |
| Gini / Inequality Index | 12,257 | 0.48 |
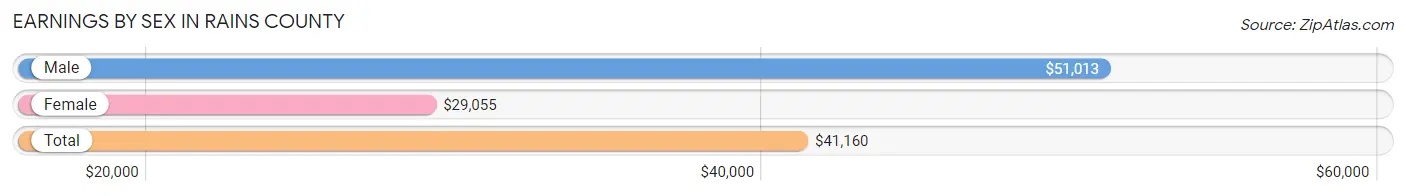
Earnings by Sex in Rains County
Average Earnings in Rains County are $41,160, $51,013 for men and $29,055 for women, a difference of 43.0%.
| Sex | Number | Average Earnings |
| Male | 2,767 (49.8%) | $51,013 |
| Female | 2,793 (50.2%) | $29,055 |
| Total | 5,560 (100.0%) | $41,160 |
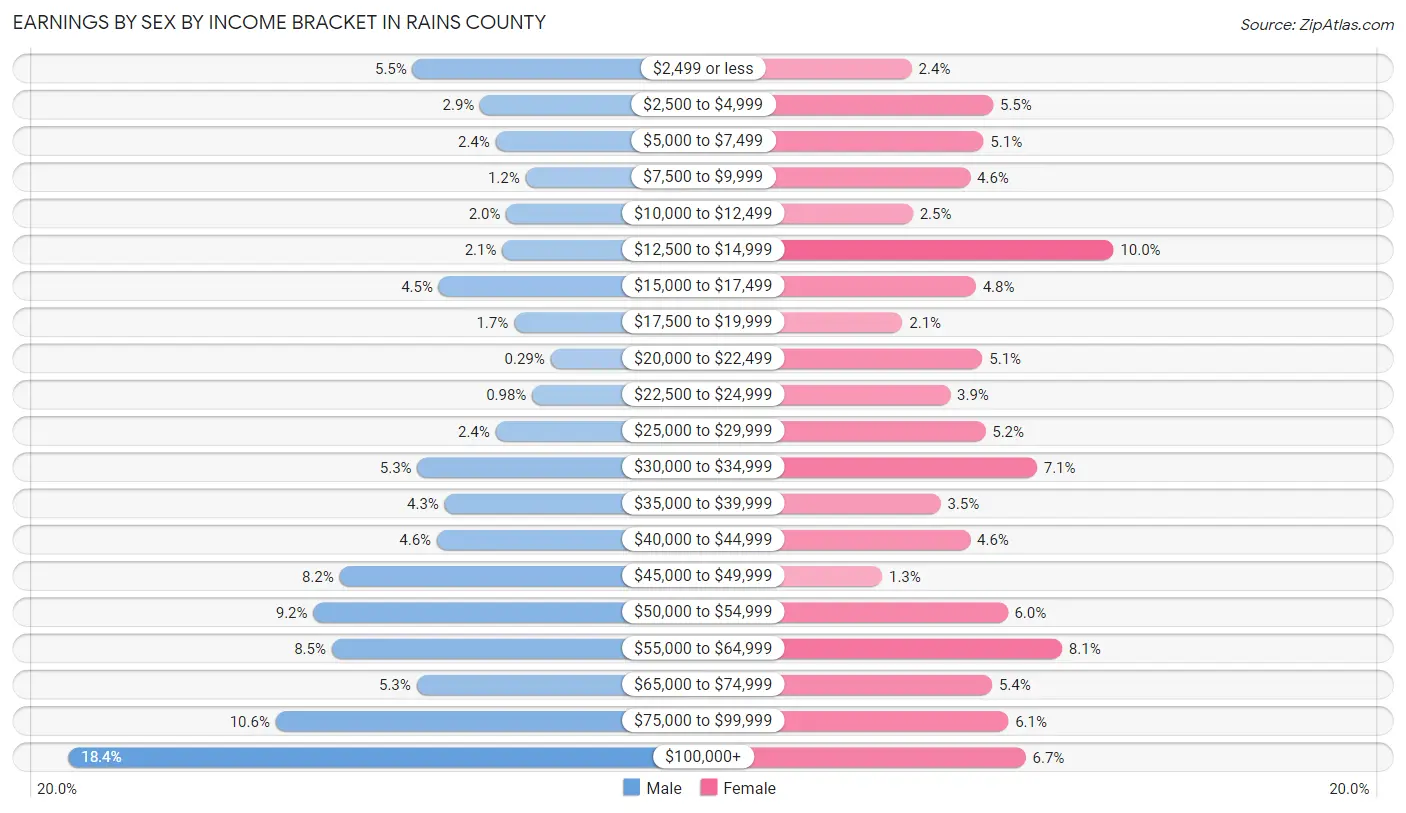
Earnings by Sex by Income Bracket in Rains County
The most common earnings brackets in Rains County are $100,000+ for men (508 | 18.4%) and $12,500 to $14,999 for women (279 | 10.0%).
| Income | Male | Female |
| $2,499 or less | 151 (5.5%) | 68 (2.4%) |
| $2,500 to $4,999 | 81 (2.9%) | 153 (5.5%) |
| $5,000 to $7,499 | 65 (2.4%) | 143 (5.1%) |
| $7,500 to $9,999 | 34 (1.2%) | 129 (4.6%) |
| $10,000 to $12,499 | 54 (1.9%) | 69 (2.5%) |
| $12,500 to $14,999 | 58 (2.1%) | 279 (10.0%) |
| $15,000 to $17,499 | 124 (4.5%) | 135 (4.8%) |
| $17,500 to $19,999 | 46 (1.7%) | 58 (2.1%) |
| $20,000 to $22,499 | 8 (0.3%) | 142 (5.1%) |
| $22,500 to $24,999 | 27 (1.0%) | 108 (3.9%) |
| $25,000 to $29,999 | 65 (2.4%) | 145 (5.2%) |
| $30,000 to $34,999 | 146 (5.3%) | 199 (7.1%) |
| $35,000 to $39,999 | 118 (4.3%) | 98 (3.5%) |
| $40,000 to $44,999 | 126 (4.5%) | 129 (4.6%) |
| $45,000 to $49,999 | 227 (8.2%) | 37 (1.3%) |
| $50,000 to $54,999 | 254 (9.2%) | 168 (6.0%) |
| $55,000 to $64,999 | 235 (8.5%) | 225 (8.1%) |
| $65,000 to $74,999 | 147 (5.3%) | 152 (5.4%) |
| $75,000 to $99,999 | 293 (10.6%) | 169 (6.0%) |
| $100,000+ | 508 (18.4%) | 187 (6.7%) |
| Total | 2,767 (100.0%) | 2,793 (100.0%) |
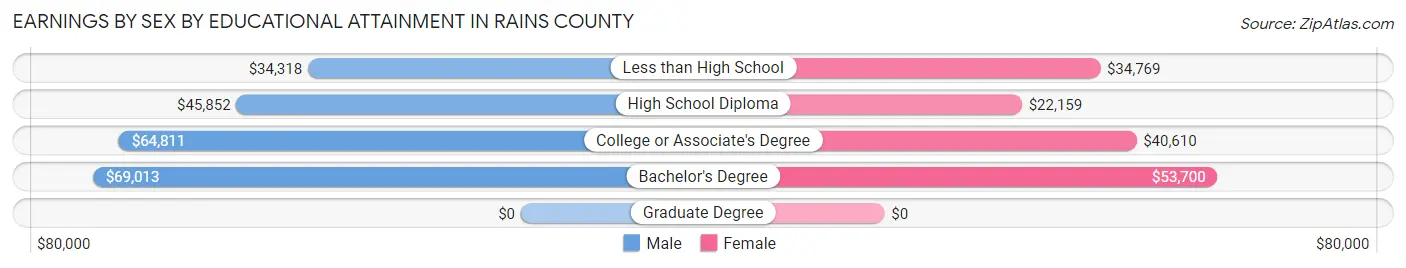
Earnings by Sex by Educational Attainment in Rains County
Average earnings in Rains County are $53,689 for men and $32,802 for women, a difference of 38.9%. Men with an educational attainment of bachelor's degree enjoy the highest average annual earnings of $69,013, while those with less than high school education earn the least with $34,318. Women with an educational attainment of bachelor's degree earn the most with the average annual earnings of $53,700, while those with high school diploma education have the smallest earnings of $22,159.
| Educational Attainment | Male Income | Female Income |
| Less than High School | $34,318 | $34,769 |
| High School Diploma | $45,852 | $22,159 |
| College or Associate's Degree | $64,811 | $40,610 |
| Bachelor's Degree | $69,013 | $53,700 |
| Graduate Degree | - | - |
| Total | $53,689 | $32,802 |
Family Income in Rains County
Family Income Brackets in Rains County
According to the Rains County family income data, there are 648 families falling into the $100,000 to $149,999 income range, which is the most common income bracket and makes up 19.7% of all families. Conversely, the less than $10,000 income bracket is the least frequent group with only 36 families (1.1%) belonging to this category.
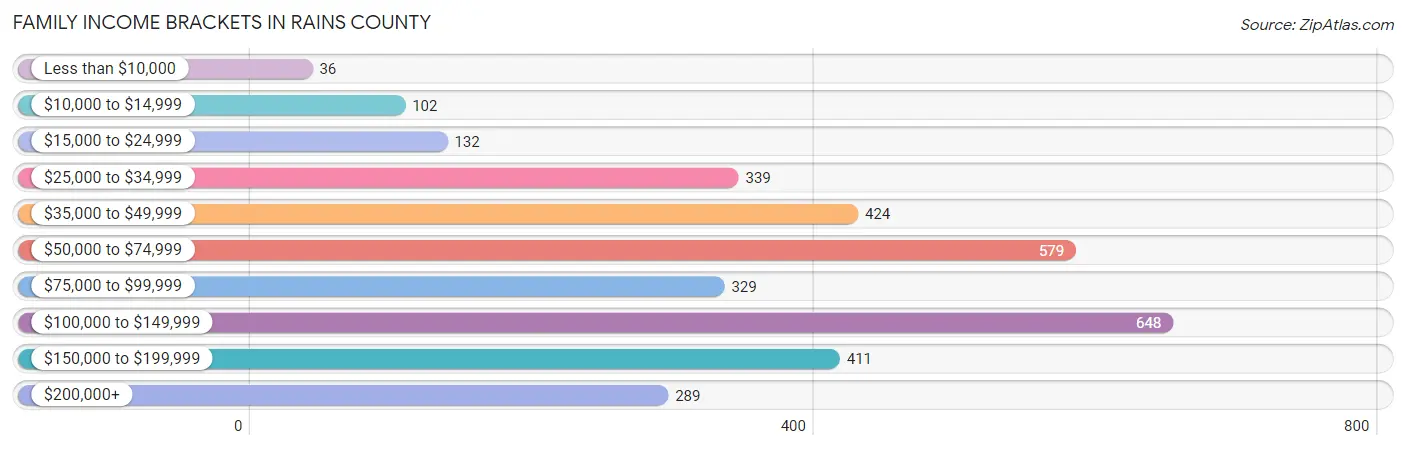
| Income Bracket | # Families | % Families |
| Less than $10,000 | 36 | 1.1% |
| $10,000 to $14,999 | 102 | 3.1% |
| $15,000 to $24,999 | 132 | 4.0% |
| $25,000 to $34,999 | 339 | 10.3% |
| $35,000 to $49,999 | 424 | 12.9% |
| $50,000 to $74,999 | 579 | 17.6% |
| $75,000 to $99,999 | 329 | 10.0% |
| $100,000 to $149,999 | 648 | 19.7% |
| $150,000 to $199,999 | 411 | 12.5% |
| $200,000+ | 289 | 8.8% |
Family Income by Famaliy Size in Rains County
6-person families (48 | 1.5%) account for the highest median family income in Rains County with $128,173 per family, while 2-person families (2,022 | 61.5%) have the highest median income of $36,544 per family member.
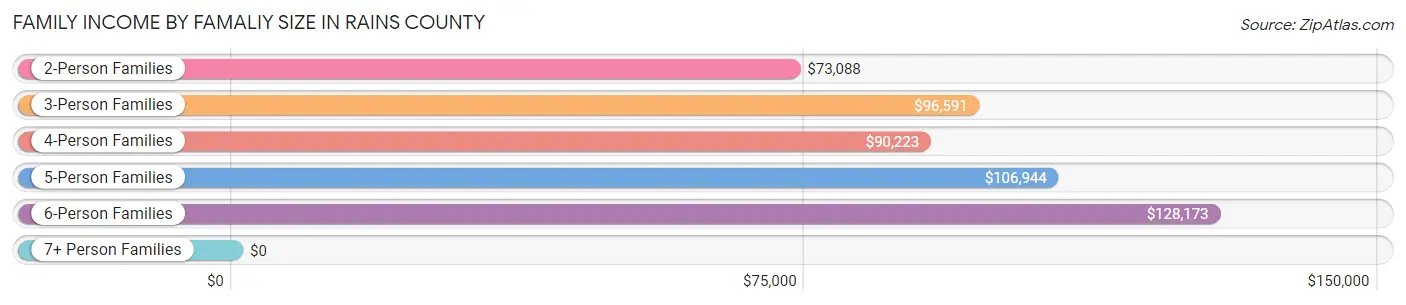
| Income Bracket | # Families | Median Income |
| 2-Person Families | 2,022 (61.5%) | $73,088 |
| 3-Person Families | 570 (17.3%) | $96,591 |
| 4-Person Families | 466 (14.2%) | $90,223 |
| 5-Person Families | 168 (5.1%) | $106,944 |
| 6-Person Families | 48 (1.5%) | $128,173 |
| 7+ Person Families | 15 (0.5%) | $0 |
| Total | 3,289 (100.0%) | $80,391 |
Family Income by Number of Earners in Rains County
The median family income in Rains County is $80,391, with families comprising 3+ earners (201) having the highest median family income of $129,952, while families with no earners (807) have the lowest median family income of $45,838, accounting for 6.1% and 24.5% of families, respectively.
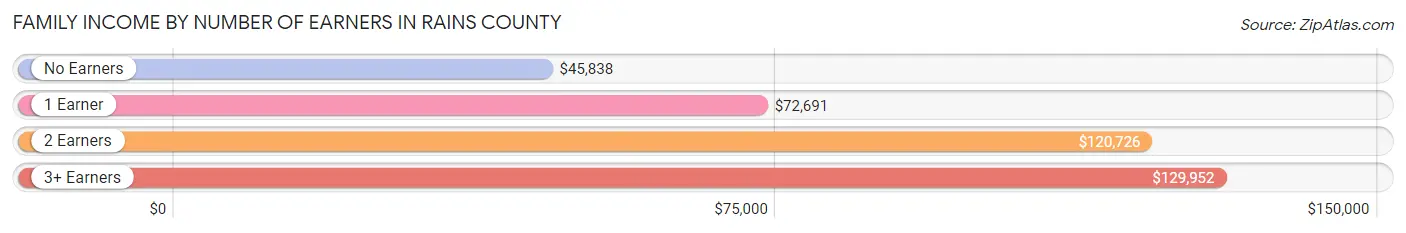
| Number of Earners | # Families | Median Income |
| No Earners | 807 (24.5%) | $45,838 |
| 1 Earner | 1,033 (31.4%) | $72,691 |
| 2 Earners | 1,248 (37.9%) | $120,726 |
| 3+ Earners | 201 (6.1%) | $129,952 |
| Total | 3,289 (100.0%) | $80,391 |
Household Income in Rains County
Household Income Brackets in Rains County
With 801 households falling in the category, the $100,000 to $149,999 income range is the most frequent in Rains County, accounting for 17.0% of all households. In contrast, only 217 households (4.6%) fall into the less than $10,000 income bracket, making it the least populous group.
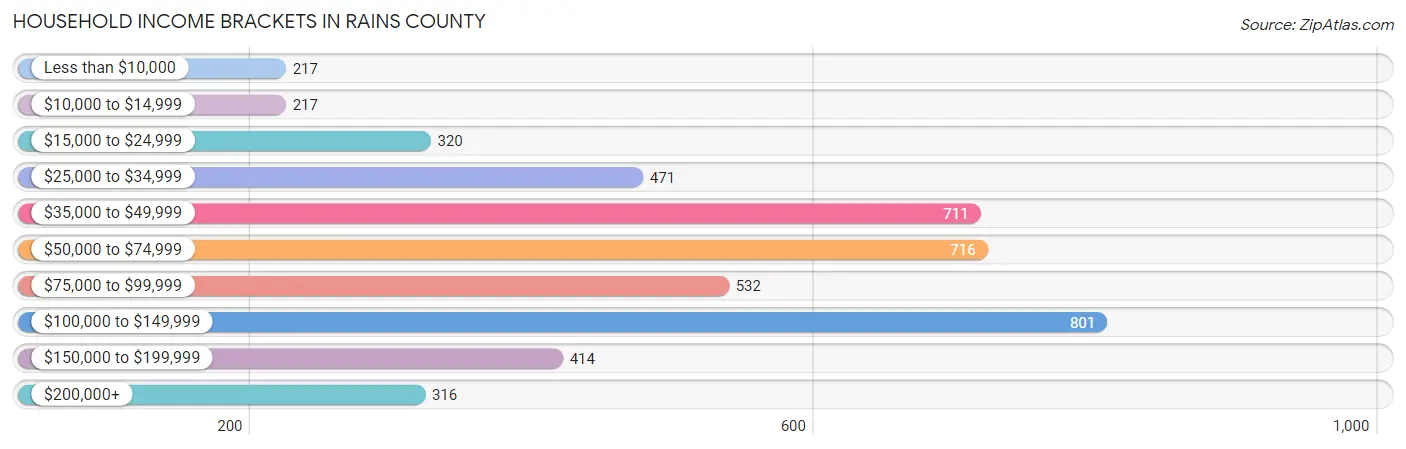
| Income Bracket | # Households | % Households |
| Less than $10,000 | 217 | 4.6% |
| $10,000 to $14,999 | 217 | 4.6% |
| $15,000 to $24,999 | 320 | 6.8% |
| $25,000 to $34,999 | 471 | 10.0% |
| $35,000 to $49,999 | 711 | 15.1% |
| $50,000 to $74,999 | 716 | 15.2% |
| $75,000 to $99,999 | 532 | 11.3% |
| $100,000 to $149,999 | 801 | 17.0% |
| $150,000 to $199,999 | 414 | 8.8% |
| $200,000+ | 316 | 6.7% |
Household Income by Householder Age in Rains County
The median household income in Rains County is $60,291, with the highest median household income of $99,292 found in the 25 to 44 years age bracket for the primary householder. A total of 987 households (21.0%) fall into this category. Meanwhile, the 15 to 24 years age bracket for the primary householder has the lowest median household income of $36,944, with 86 households (1.8%) in this group.
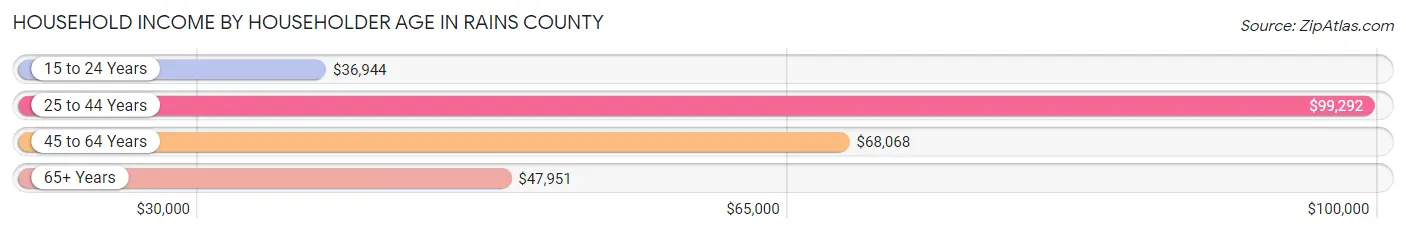
| Income Bracket | # Households | Median Income |
| 15 to 24 Years | 86 (1.8%) | $36,944 |
| 25 to 44 Years | 987 (21.0%) | $99,292 |
| 45 to 64 Years | 2,053 (43.6%) | $68,068 |
| 65+ Years | 1,584 (33.6%) | $47,951 |
| Total | 4,710 (100.0%) | $60,291 |
Poverty in Rains County
Income Below Poverty by Sex and Age in Rains County
With 7.5% poverty level for males and 14.5% for females among the residents of Rains County, 5 year old males and 15 year old females are the most vulnerable to poverty, with 13 males (33.3%) and 18 females (28.1%) in their respective age groups living below the poverty level.
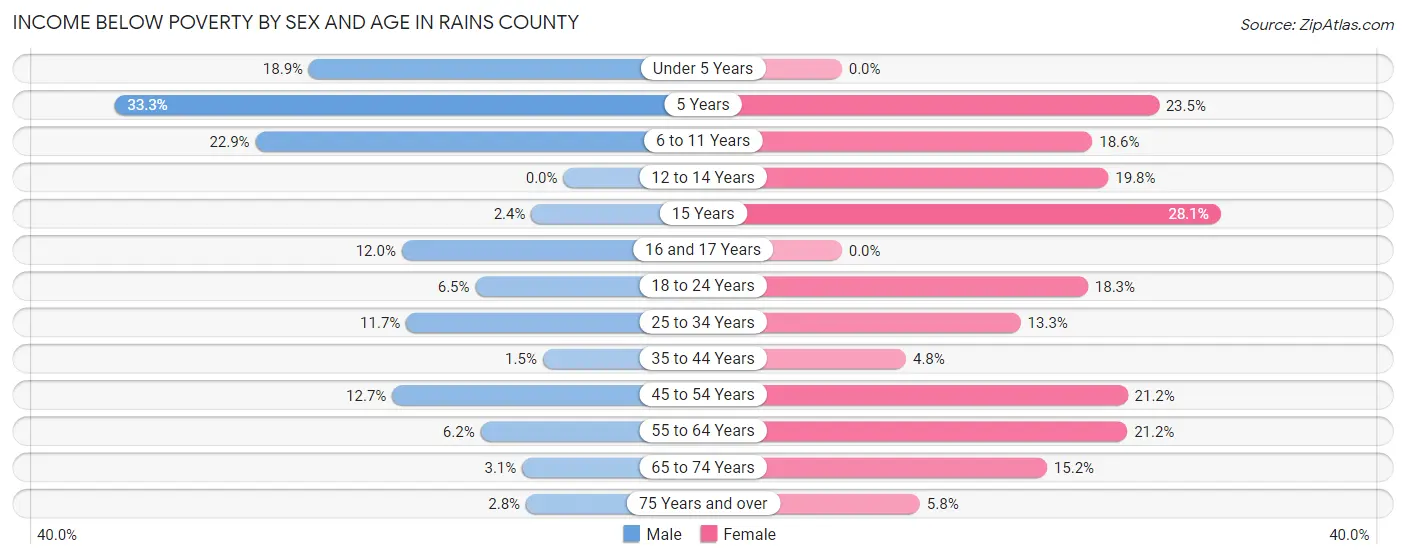
| Age Bracket | Male | Female |
| Under 5 Years | 51 (18.9%) | 0 (0.0%) |
| 5 Years | 13 (33.3%) | 20 (23.5%) |
| 6 to 11 Years | 88 (22.9%) | 45 (18.6%) |
| 12 to 14 Years | 0 (0.0%) | 38 (19.8%) |
| 15 Years | 2 (2.4%) | 18 (28.1%) |
| 16 and 17 Years | 15 (12.0%) | 0 (0.0%) |
| 18 to 24 Years | 25 (6.5%) | 59 (18.3%) |
| 25 to 34 Years | 60 (11.7%) | 79 (13.3%) |
| 35 to 44 Years | 11 (1.5%) | 35 (4.8%) |
| 45 to 54 Years | 84 (12.7%) | 163 (21.2%) |
| 55 to 64 Years | 64 (6.1%) | 249 (21.2%) |
| 65 to 74 Years | 27 (3.1%) | 145 (15.2%) |
| 75 Years and over | 15 (2.8%) | 32 (5.8%) |
| Total | 455 (7.5%) | 883 (14.5%) |
Income Above Poverty by Sex and Age in Rains County
According to the poverty statistics in Rains County, males aged 12 to 14 years and females aged under 5 years are the age groups that are most secure financially, with 100.0% of males and 100.0% of females in these age groups living above the poverty line.
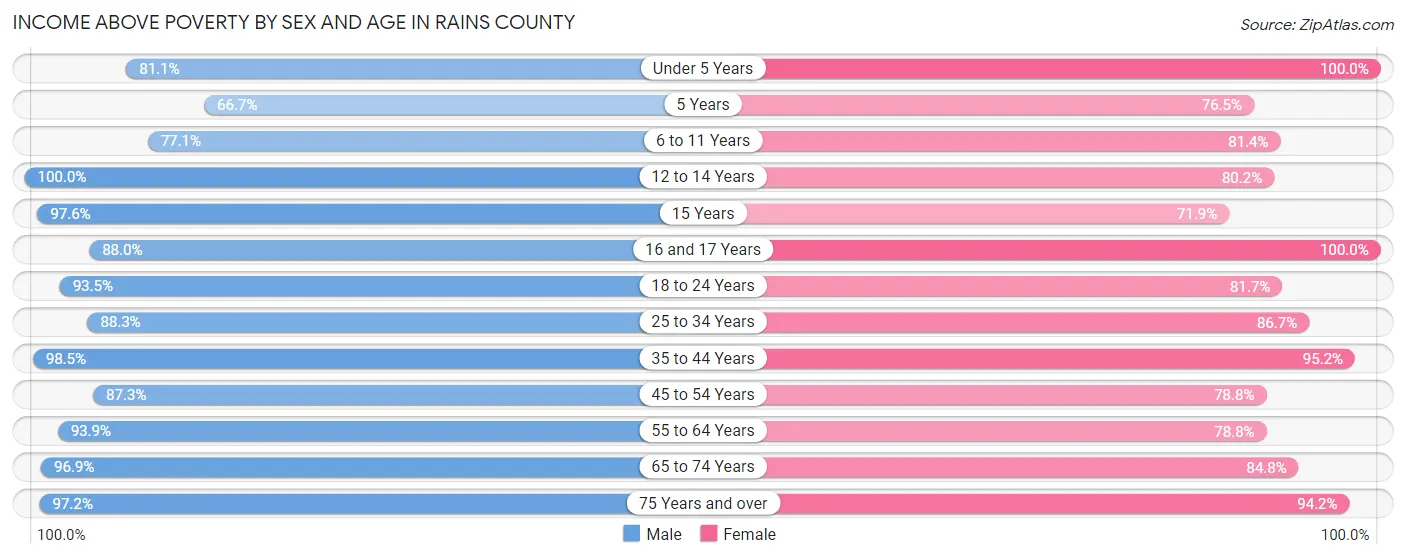
| Age Bracket | Male | Female |
| Under 5 Years | 219 (81.1%) | 258 (100.0%) |
| 5 Years | 26 (66.7%) | 65 (76.5%) |
| 6 to 11 Years | 297 (77.1%) | 197 (81.4%) |
| 12 to 14 Years | 457 (100.0%) | 154 (80.2%) |
| 15 Years | 82 (97.6%) | 46 (71.9%) |
| 16 and 17 Years | 110 (88.0%) | 132 (100.0%) |
| 18 to 24 Years | 358 (93.5%) | 264 (81.7%) |
| 25 to 34 Years | 454 (88.3%) | 516 (86.7%) |
| 35 to 44 Years | 707 (98.5%) | 699 (95.2%) |
| 45 to 54 Years | 577 (87.3%) | 605 (78.8%) |
| 55 to 64 Years | 977 (93.9%) | 926 (78.8%) |
| 65 to 74 Years | 855 (96.9%) | 807 (84.8%) |
| 75 Years and over | 525 (97.2%) | 520 (94.2%) |
| Total | 5,644 (92.5%) | 5,189 (85.5%) |
Income Below Poverty Among Married-Couple Families in Rains County
The poverty statistics for married-couple families in Rains County show that 2.8% or 74 of the total 2,603 families live below the poverty line. Families with 1 or 2 children have the highest poverty rate of 5.4%, comprising of 33 families. On the other hand, families with no children have the lowest poverty rate of 2.0%, which includes 39 families.
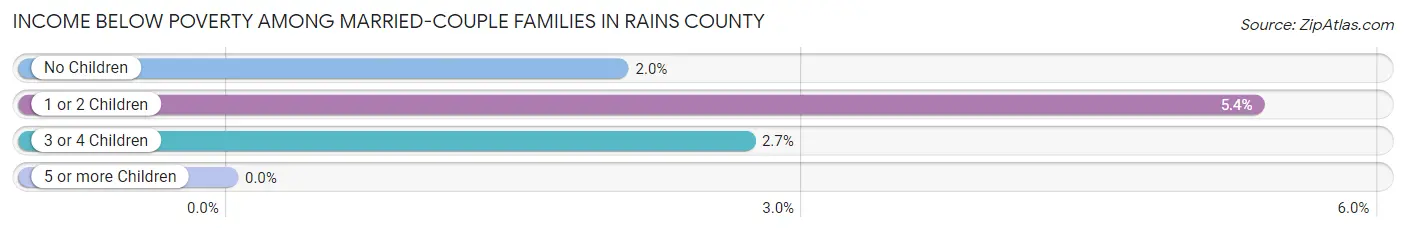
| Children | Above Poverty | Below Poverty |
| No Children | 1,874 (98.0%) | 39 (2.0%) |
| 1 or 2 Children | 583 (94.6%) | 33 (5.4%) |
| 3 or 4 Children | 72 (97.3%) | 2 (2.7%) |
| 5 or more Children | 0 (0.0%) | 0 (0.0%) |
| Total | 2,529 (97.2%) | 74 (2.8%) |
Income Below Poverty Among Single-Parent Households in Rains County
According to the poverty data in Rains County, 2.4% or 4 single-father households and 25.8% or 133 single-mother households are living below the poverty line. Among single-father households, those with no children have the highest poverty rate, with 4 households (7.1%) experiencing poverty. Likewise, among single-mother households, those with 3 or 4 children have the highest poverty rate, with 37 households (53.6%) falling below the poverty line.
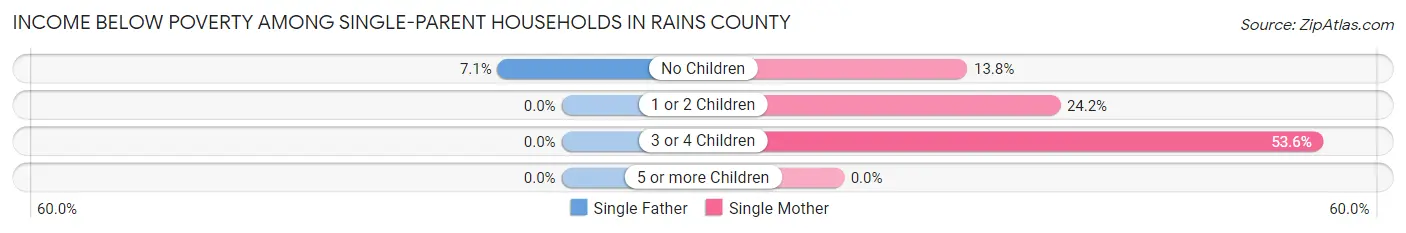
| Children | Single Father | Single Mother |
| No Children | 4 (7.1%) | 16 (13.8%) |
| 1 or 2 Children | 0 (0.0%) | 80 (24.2%) |
| 3 or 4 Children | 0 (0.0%) | 37 (53.6%) |
| 5 or more Children | 0 (0.0%) | 0 (0.0%) |
| Total | 4 (2.4%) | 133 (25.8%) |
Income Below Poverty Among Married-Couple vs Single-Parent Households in Rains County
The poverty data for Rains County shows that 74 of the married-couple family households (2.8%) and 137 of the single-parent households (20.0%) are living below the poverty level. Within the married-couple family households, those with 1 or 2 children have the highest poverty rate, with 33 households (5.4%) falling below the poverty line. Among the single-parent households, those with 3 or 4 children have the highest poverty rate, with 37 household (27.4%) living below poverty.
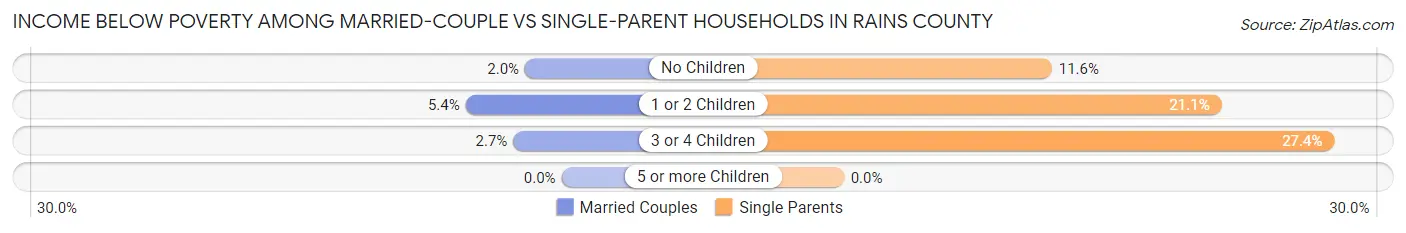
| Children | Married-Couple Families | Single-Parent Households |
| No Children | 39 (2.0%) | 20 (11.6%) |
| 1 or 2 Children | 33 (5.4%) | 80 (21.1%) |
| 3 or 4 Children | 2 (2.7%) | 37 (27.4%) |
| 5 or more Children | 0 (0.0%) | 0 (0.0%) |
| Total | 74 (2.8%) | 137 (20.0%) |
Race in Rains County
The most populous races in Rains County are White / Caucasian (11,102 | 90.6%), Hispanic or Latino (1,203 | 9.8%), and Black / African American (325 | 2.6%).
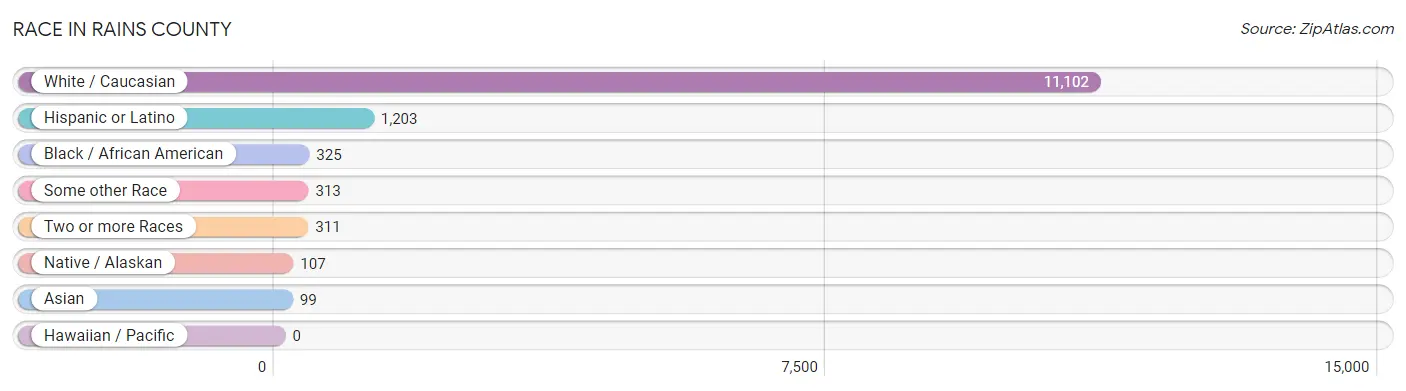
| Race | # Population | % Population |
| Asian | 99 | 0.8% |
| Black / African American | 325 | 2.6% |
| Hawaiian / Pacific | 0 | 0.0% |
| Hispanic or Latino | 1,203 | 9.8% |
| Native / Alaskan | 107 | 0.9% |
| White / Caucasian | 11,102 | 90.6% |
| Two or more Races | 311 | 2.5% |
| Some other Race | 313 | 2.5% |
| Total | 12,257 | 100.0% |
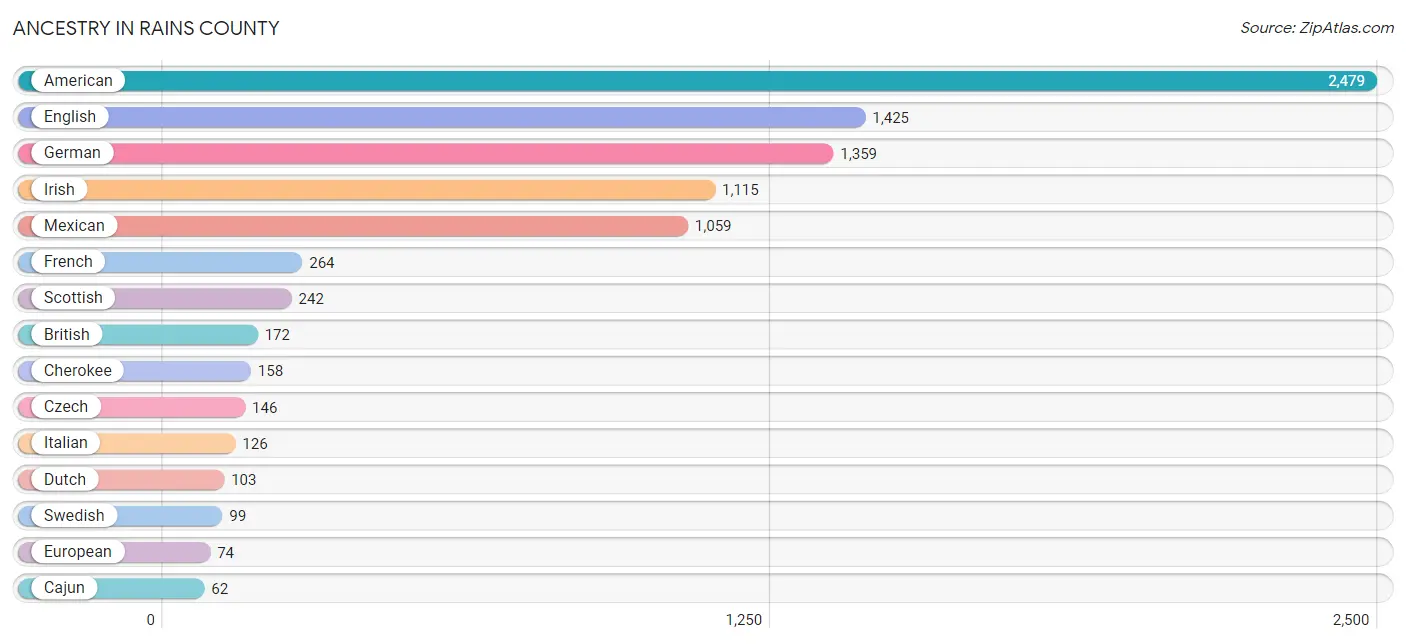
Ancestry in Rains County
The most populous ancestries reported in Rains County are American (2,479 | 20.2%), English (1,425 | 11.6%), German (1,359 | 11.1%), Irish (1,115 | 9.1%), and Mexican (1,059 | 8.6%), together accounting for 60.7% of all Rains County residents.
| Ancestry | # Population | % Population |
| African | 5 | 0.0% |
| American | 2,479 | 20.2% |
| Apache | 2 | 0.0% |
| Arab | 52 | 0.4% |
| Armenian | 47 | 0.4% |
| Austrian | 4 | 0.0% |
| Belgian | 6 | 0.1% |
| Bhutanese | 5 | 0.0% |
| Blackfeet | 32 | 0.3% |
| British | 172 | 1.4% |
| Burmese | 34 | 0.3% |
| Cajun | 62 | 0.5% |
| Cherokee | 158 | 1.3% |
| Choctaw | 5 | 0.0% |
| Creek | 4 | 0.0% |
| Czech | 146 | 1.2% |
| Czechoslovakian | 14 | 0.1% |
| Danish | 1 | 0.0% |
| Dutch | 103 | 0.8% |
| Egyptian | 13 | 0.1% |
| English | 1,425 | 11.6% |
| European | 74 | 0.6% |
| Finnish | 2 | 0.0% |
| French | 264 | 2.1% |
| French Canadian | 17 | 0.1% |
| German | 1,359 | 11.1% |
| Greek | 5 | 0.0% |
| Guamanian / Chamorro | 4 | 0.0% |
| Hungarian | 35 | 0.3% |
| Indian (Asian) | 58 | 0.5% |
| Irish | 1,115 | 9.1% |
| Italian | 126 | 1.0% |
| Japanese | 2 | 0.0% |
| Jordanian | 9 | 0.1% |
| Korean | 16 | 0.1% |
| Lithuanian | 11 | 0.1% |
| Maltese | 1 | 0.0% |
| Mexican | 1,059 | 8.6% |
| Norwegian | 42 | 0.3% |
| Pakistani | 11 | 0.1% |
| Palestinian | 13 | 0.1% |
| Polish | 16 | 0.1% |
| Puerto Rican | 62 | 0.5% |
| Scandinavian | 47 | 0.4% |
| Scotch-Irish | 44 | 0.4% |
| Scottish | 242 | 2.0% |
| Sioux | 1 | 0.0% |
| Spanish | 12 | 0.1% |
| Subsaharan African | 5 | 0.0% |
| Swedish | 99 | 0.8% |
| Thai | 29 | 0.2% |
| Turkish | 33 | 0.3% |
| Welsh | 40 | 0.3% | View All 53 Rows |
Immigrants in Rains County
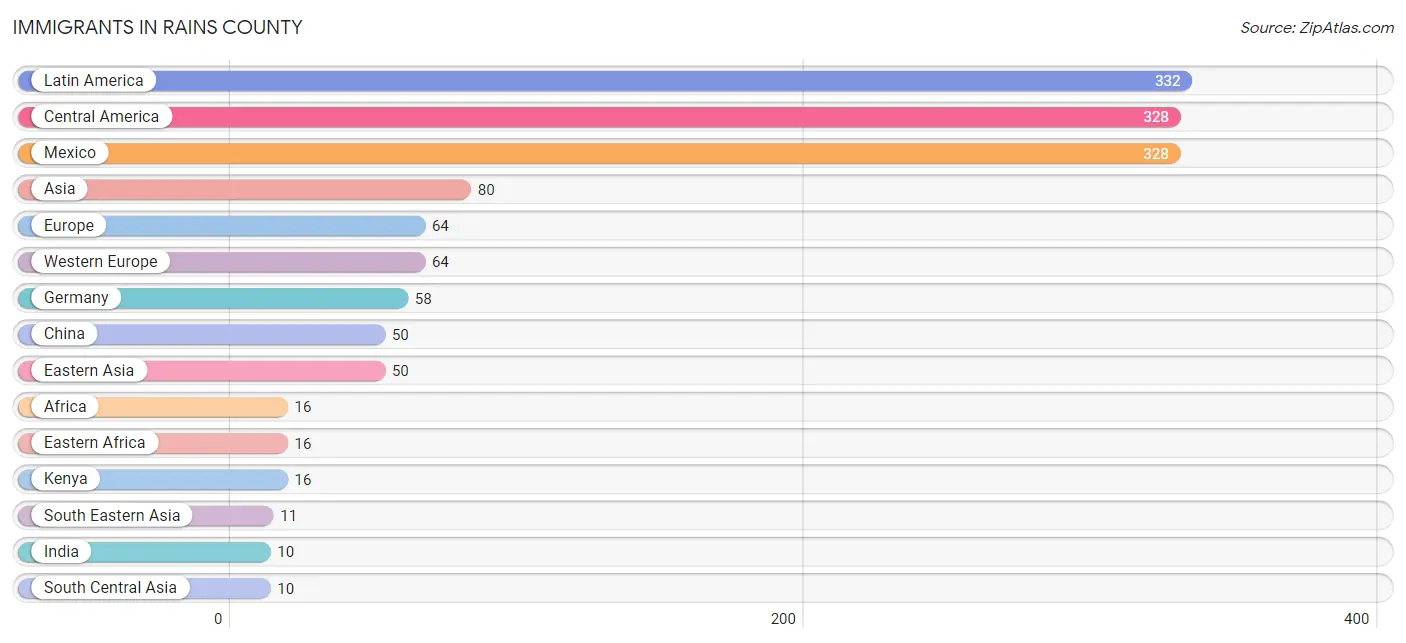
The most numerous immigrant groups reported in Rains County came from Latin America (332 | 2.7%), Central America (328 | 2.7%), Mexico (328 | 2.7%), Asia (80 | 0.6%), and Europe (64 | 0.5%), together accounting for 9.2% of all Rains County residents.
| Immigration Origin | # Population | % Population |
| Africa | 16 | 0.1% |
| Asia | 80 | 0.6% |
| Cambodia | 2 | 0.0% |
| Caribbean | 4 | 0.0% |
| Central America | 328 | 2.7% |
| China | 50 | 0.4% |
| Cuba | 4 | 0.0% |
| Eastern Africa | 16 | 0.1% |
| Eastern Asia | 50 | 0.4% |
| Europe | 64 | 0.5% |
| France | 6 | 0.1% |
| Germany | 58 | 0.5% |
| India | 10 | 0.1% |
| Jordan | 9 | 0.1% |
| Kenya | 16 | 0.1% |
| Latin America | 332 | 2.7% |
| Mexico | 328 | 2.7% |
| Philippines | 6 | 0.1% |
| South Central Asia | 10 | 0.1% |
| South Eastern Asia | 11 | 0.1% |
| Thailand | 3 | 0.0% |
| Western Asia | 9 | 0.1% |
| Western Europe | 64 | 0.5% | View All 23 Rows |
Sex and Age in Rains County
Sex and Age in Rains County
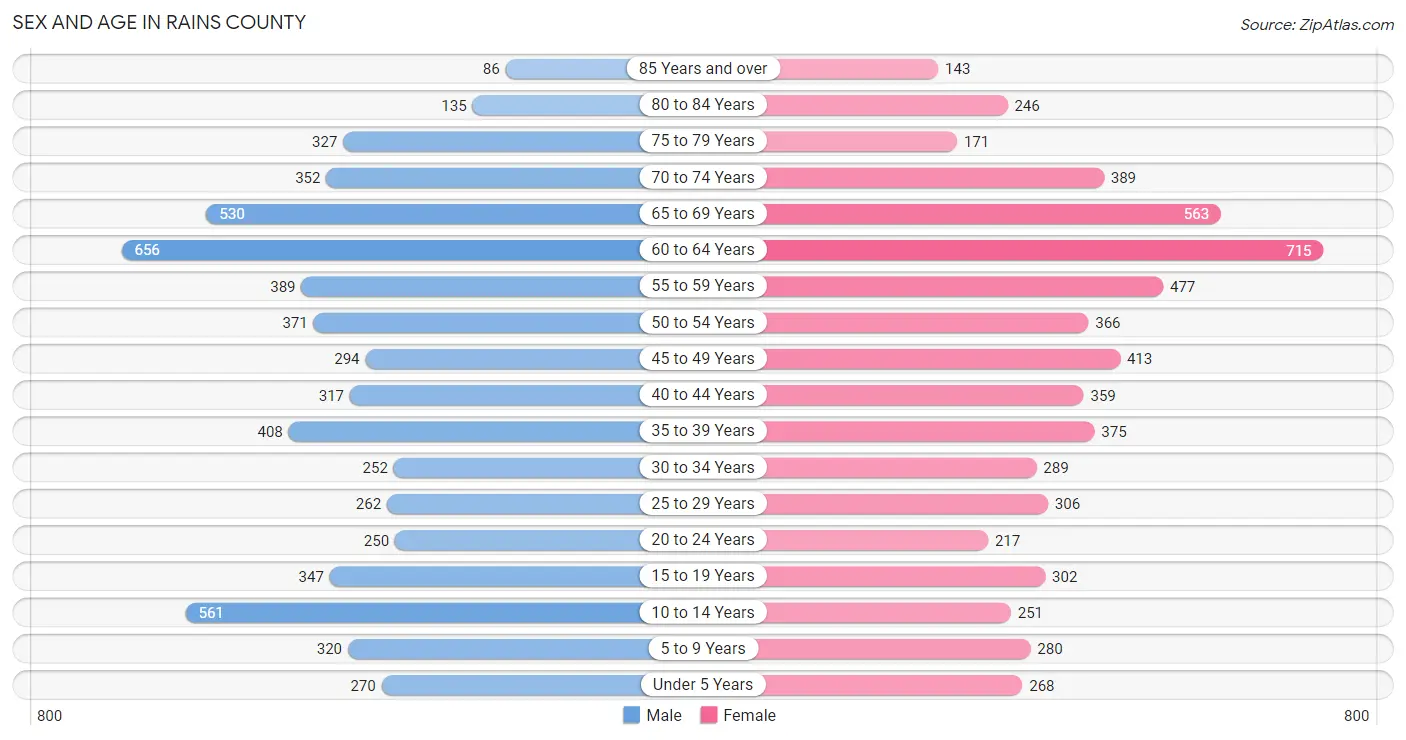
The most populous age groups in Rains County are 60 to 64 Years (656 | 10.7%) for men and 60 to 64 Years (715 | 11.7%) for women.
| Age Bracket | Male | Female |
| Under 5 Years | 270 (4.4%) | 268 (4.4%) |
| 5 to 9 Years | 320 (5.2%) | 280 (4.6%) |
| 10 to 14 Years | 561 (9.2%) | 251 (4.1%) |
| 15 to 19 Years | 347 (5.7%) | 302 (4.9%) |
| 20 to 24 Years | 250 (4.1%) | 217 (3.5%) |
| 25 to 29 Years | 262 (4.3%) | 306 (5.0%) |
| 30 to 34 Years | 252 (4.1%) | 289 (4.7%) |
| 35 to 39 Years | 408 (6.7%) | 375 (6.1%) |
| 40 to 44 Years | 317 (5.2%) | 359 (5.9%) |
| 45 to 49 Years | 294 (4.8%) | 413 (6.7%) |
| 50 to 54 Years | 371 (6.1%) | 366 (6.0%) |
| 55 to 59 Years | 389 (6.4%) | 477 (7.8%) |
| 60 to 64 Years | 656 (10.7%) | 715 (11.7%) |
| 65 to 69 Years | 530 (8.6%) | 563 (9.2%) |
| 70 to 74 Years | 352 (5.8%) | 389 (6.4%) |
| 75 to 79 Years | 327 (5.3%) | 171 (2.8%) |
| 80 to 84 Years | 135 (2.2%) | 246 (4.0%) |
| 85 Years and over | 86 (1.4%) | 143 (2.3%) |
| Total | 6,127 (100.0%) | 6,130 (100.0%) |
Families and Households in Rains County
Median Family Size in Rains County
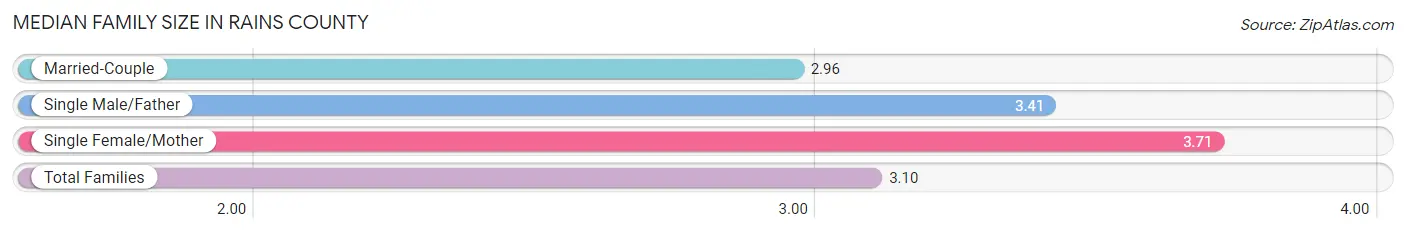
The median family size in Rains County is 3.10 persons per family, with single female/mother families (516 | 15.7%) accounting for the largest median family size of 3.71 persons per family. On the other hand, married-couple families (2,603 | 79.1%) represent the smallest median family size with 2.96 persons per family.
| Family Type | # Families | Family Size |
| Married-Couple | 2,603 (79.1%) | 2.96 |
| Single Male/Father | 170 (5.2%) | 3.41 |
| Single Female/Mother | 516 (15.7%) | 3.71 |
| Total Families | 3,289 (100.0%) | 3.10 |
Median Household Size in Rains County
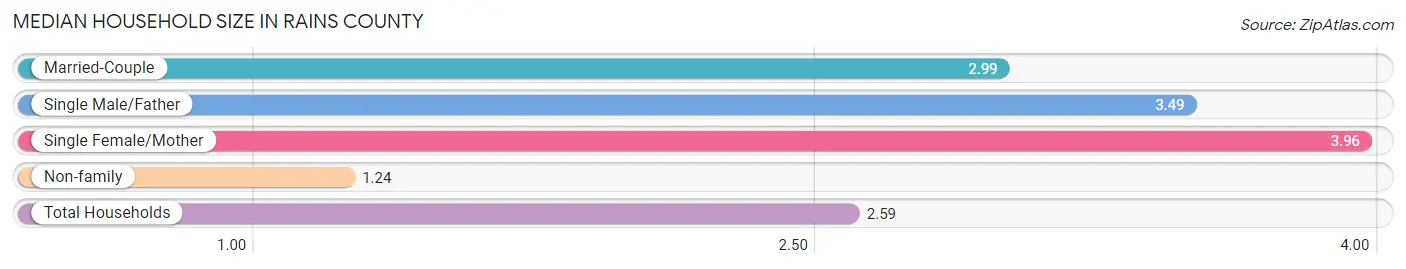
The median household size in Rains County is 2.59 persons per household, with single female/mother households (516 | 11.0%) accounting for the largest median household size of 3.96 persons per household. non-family households (1,421 | 30.2%) represent the smallest median household size with 1.24 persons per household.
| Household Type | # Households | Household Size |
| Married-Couple | 2,603 (55.3%) | 2.99 |
| Single Male/Father | 170 (3.6%) | 3.49 |
| Single Female/Mother | 516 (11.0%) | 3.96 |
| Non-family | 1,421 (30.2%) | 1.24 |
| Total Households | 4,710 (100.0%) | 2.59 |
Household Size by Marriage Status in Rains County
Out of a total of 4,710 households in Rains County, 3,289 (69.8%) are family households, while 1,421 (30.2%) are nonfamily households. The most numerous type of family households are 2-person households, comprising 1,812, and the most common type of nonfamily households are 1-person households, comprising 1,078.
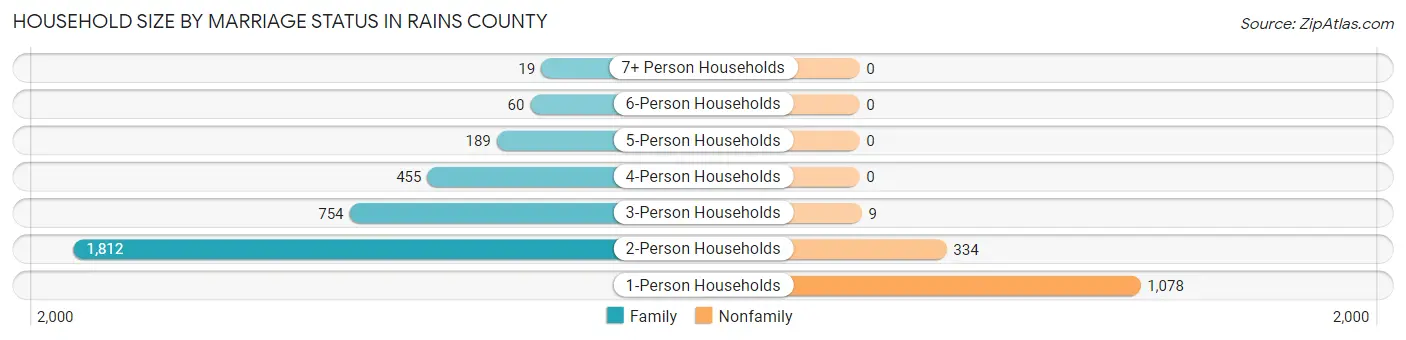
| Household Size | Family Households | Nonfamily Households |
| 1-Person Households | - | 1,078 (22.9%) |
| 2-Person Households | 1,812 (38.5%) | 334 (7.1%) |
| 3-Person Households | 754 (16.0%) | 9 (0.2%) |
| 4-Person Households | 455 (9.7%) | 0 (0.0%) |
| 5-Person Households | 189 (4.0%) | 0 (0.0%) |
| 6-Person Households | 60 (1.3%) | 0 (0.0%) |
| 7+ Person Households | 19 (0.4%) | 0 (0.0%) |
| Total | 3,289 (69.8%) | 1,421 (30.2%) |
Female Fertility in Rains County
Fertility by Age in Rains County
Average fertility rate in Rains County is 25.0 births per 1,000 women. Women in the age bracket of 20 to 34 years have the highest fertility rate with 67.0 births per 1,000 women. Women in the age bracket of 20 to 34 years acount for 91.5% of all women with births.
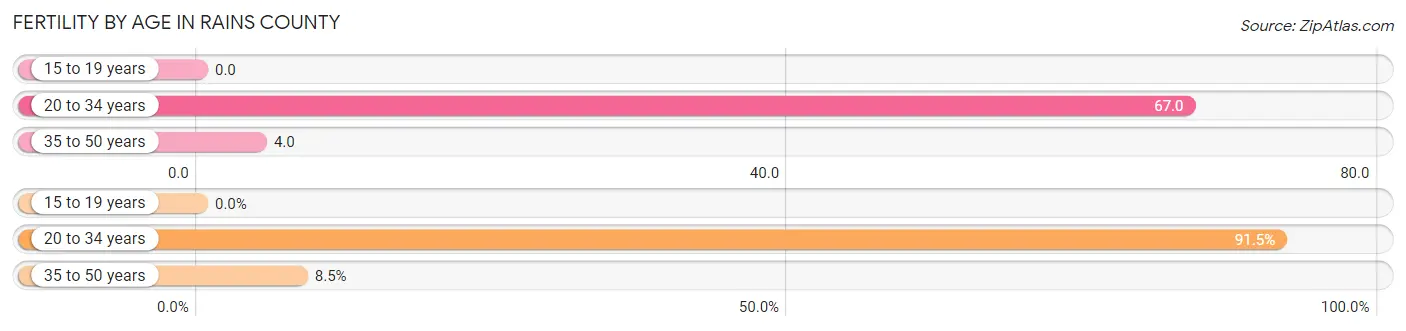
| Age Bracket | Women with Births | Births / 1,000 Women |
| 15 to 19 years | 0 (0.0%) | 0.0 |
| 20 to 34 years | 54 (91.5%) | 67.0 |
| 35 to 50 years | 5 (8.5%) | 4.0 |
| Total | 59 (100.0%) | 25.0 |
Fertility by Age by Marriage Status in Rains County
39.0% of women with births (59) in Rains County are married. The highest percentage of unmarried women with births falls into 35 to 50 years age bracket with 100.0% of them unmarried at the time of birth, while the lowest percentage of unmarried women with births belong to 20 to 34 years age bracket with 57.4% of them unmarried.
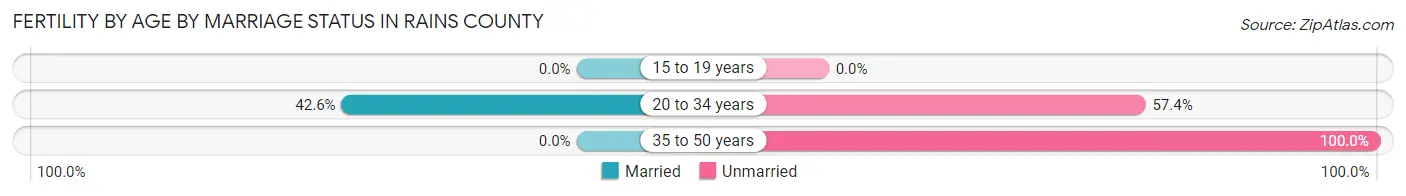
| Age Bracket | Married | Unmarried |
| 15 to 19 years | 0 (0.0%) | 0 (0.0%) |
| 20 to 34 years | 23 (42.6%) | 31 (57.4%) |
| 35 to 50 years | 0 (0.0%) | 5 (100.0%) |
| Total | 23 (39.0%) | 36 (61.0%) |
Fertility by Education in Rains County
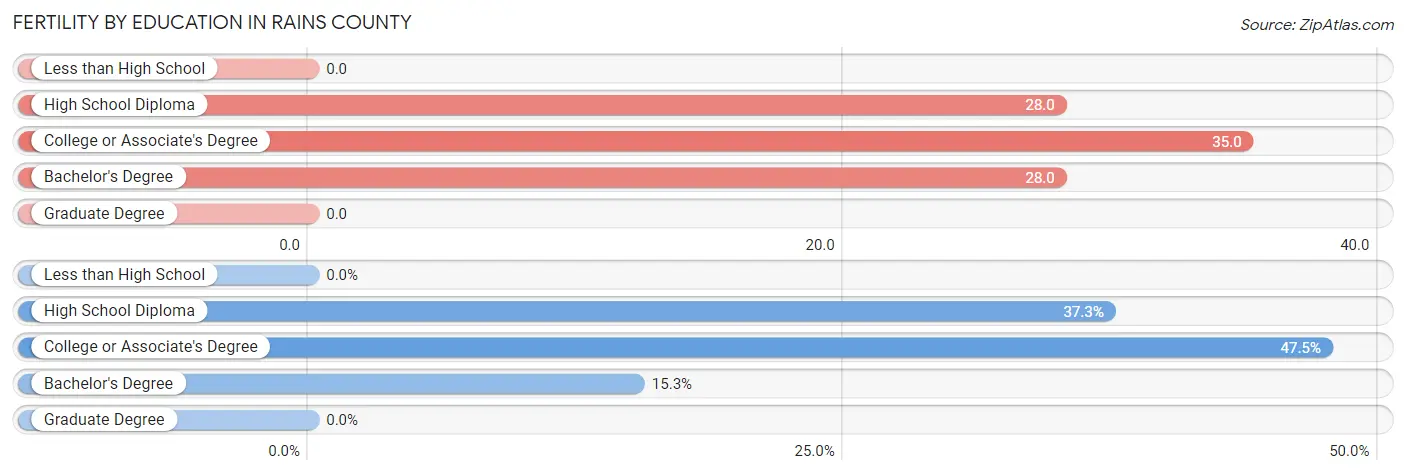
| Educational Attainment | Women with Births | Births / 1,000 Women |
| Less than High School | 0 (0.0%) | 0.0 |
| High School Diploma | 22 (37.3%) | 28.0 |
| College or Associate's Degree | 28 (47.5%) | 35.0 |
| Bachelor's Degree | 9 (15.2%) | 28.0 |
| Graduate Degree | 0 (0.0%) | 0.0 |
| Total | 59 (100.0%) | 25.0 |
Fertility by Education by Marriage Status in Rains County
61.0% of women with births in Rains County are unmarried. Women with the educational attainment of college or associate's degree are most likely to be married with 82.1% of them married at childbirth, while women with the educational attainment of high school diploma are least likely to be married with 100.0% of them unmarried at childbirth.
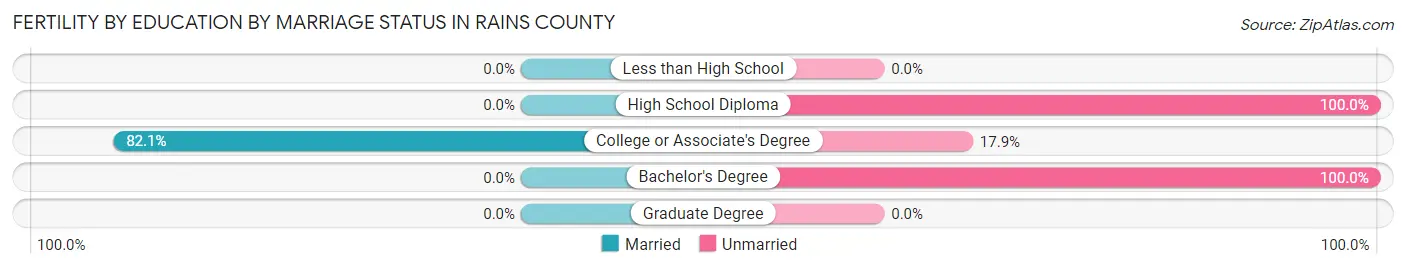
| Educational Attainment | Married | Unmarried |
| Less than High School | 0 (0.0%) | 0 (0.0%) |
| High School Diploma | 0 (0.0%) | 22 (100.0%) |
| College or Associate's Degree | 23 (82.1%) | 5 (17.9%) |
| Bachelor's Degree | 0 (0.0%) | 9 (100.0%) |
| Graduate Degree | 0 (0.0%) | 0 (0.0%) |
| Total | 23 (39.0%) | 36 (61.0%) |
Employment Characteristics in Rains County
Employment by Class of Employer in Rains County
Among the 5,019 employed individuals in Rains County, private company employees (3,390 | 67.5%), local government employees (485 | 9.7%), and self-employed (not incorporated) (410 | 8.2%) make up the most common classes of employment.
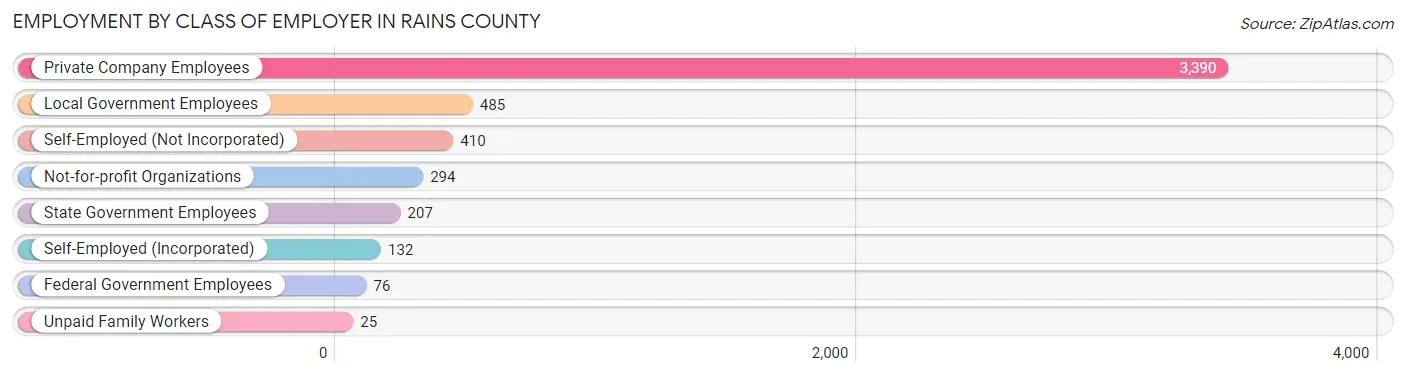
| Employer Class | # Employees | % Employees |
| Private Company Employees | 3,390 | 67.5% |
| Self-Employed (Incorporated) | 132 | 2.6% |
| Self-Employed (Not Incorporated) | 410 | 8.2% |
| Not-for-profit Organizations | 294 | 5.9% |
| Local Government Employees | 485 | 9.7% |
| State Government Employees | 207 | 4.1% |
| Federal Government Employees | 76 | 1.5% |
| Unpaid Family Workers | 25 | 0.5% |
| Total | 5,019 | 100.0% |
Employment Status by Age in Rains County
According to the labor force statistics for Rains County, out of the total population over 16 years of age (10,159), 51.8% or 5,262 individuals are in the labor force, with 2.3% or 121 of them unemployed. The age group with the highest labor force participation rate is 35 to 44 years, with 88.1% or 1,285 individuals in the labor force. Within the labor force, the 45 to 54 years age range has the highest percentage of unemployed individuals, with 4.8% or 56 of them being unemployed.
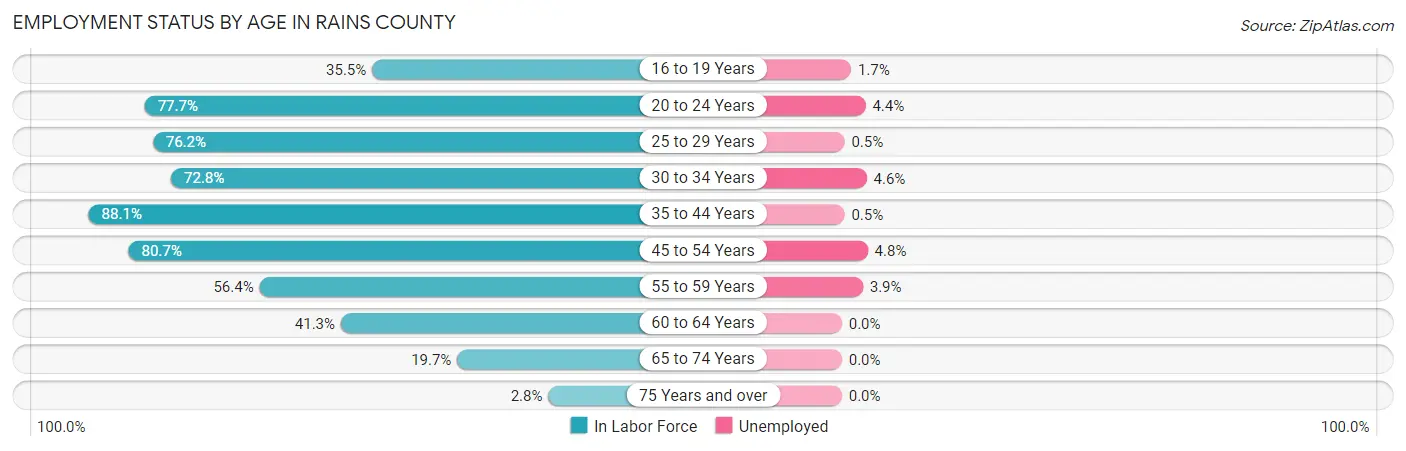
| Age Bracket | In Labor Force | Unemployed |
| 16 to 19 Years | 178 (35.5%) | 3 (1.7%) |
| 20 to 24 Years | 363 (77.7%) | 16 (4.4%) |
| 25 to 29 Years | 433 (76.2%) | 2 (0.5%) |
| 30 to 34 Years | 394 (72.8%) | 18 (4.6%) |
| 35 to 44 Years | 1,285 (88.1%) | 6 (0.5%) |
| 45 to 54 Years | 1,165 (80.7%) | 56 (4.8%) |
| 55 to 59 Years | 488 (56.4%) | 19 (3.9%) |
| 60 to 64 Years | 566 (41.3%) | 0 (0.0%) |
| 65 to 74 Years | 361 (19.7%) | 0 (0.0%) |
| 75 Years and over | 31 (2.8%) | 0 (0.0%) |
| Total | 5,262 (51.8%) | 121 (2.3%) |
Employment Status by Educational Attainment in Rains County
According to labor force statistics for Rains County, 69.3% of individuals (4,331) out of the total population between 25 and 64 years of age (6,249) are in the labor force, with 2.4% or 104 of them being unemployed. The group with the highest labor force participation rate are those with the educational attainment of bachelor's degree or higher, with 80.6% or 912 individuals in the labor force. Within the labor force, individuals with college / associate degree education have the highest percentage of unemployment, with 3.6% or 58 of them being unemployed.
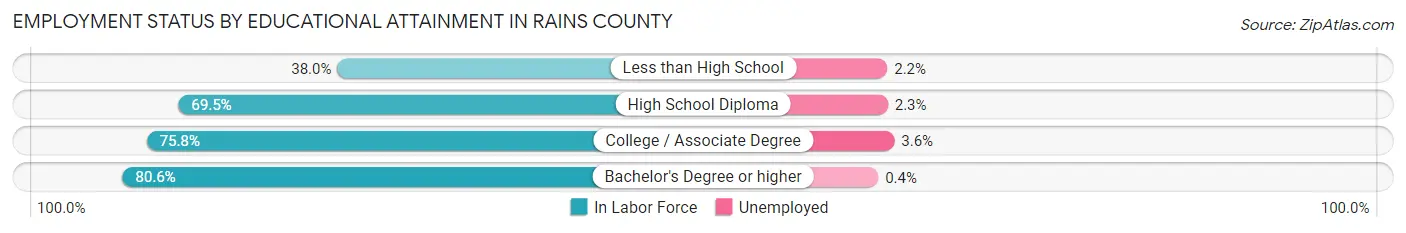
| Educational Attainment | In Labor Force | Unemployed |
| Less than High School | 325 (38.0%) | 19 (2.2%) |
| High School Diploma | 1,491 (69.5%) | 49 (2.3%) |
| College / Associate Degree | 1,605 (75.8%) | 76 (3.6%) |
| Bachelor's Degree or higher | 912 (80.6%) | 5 (0.4%) |
| Total | 4,331 (69.3%) | 150 (2.4%) |
Employment Occupations by Sex in Rains County
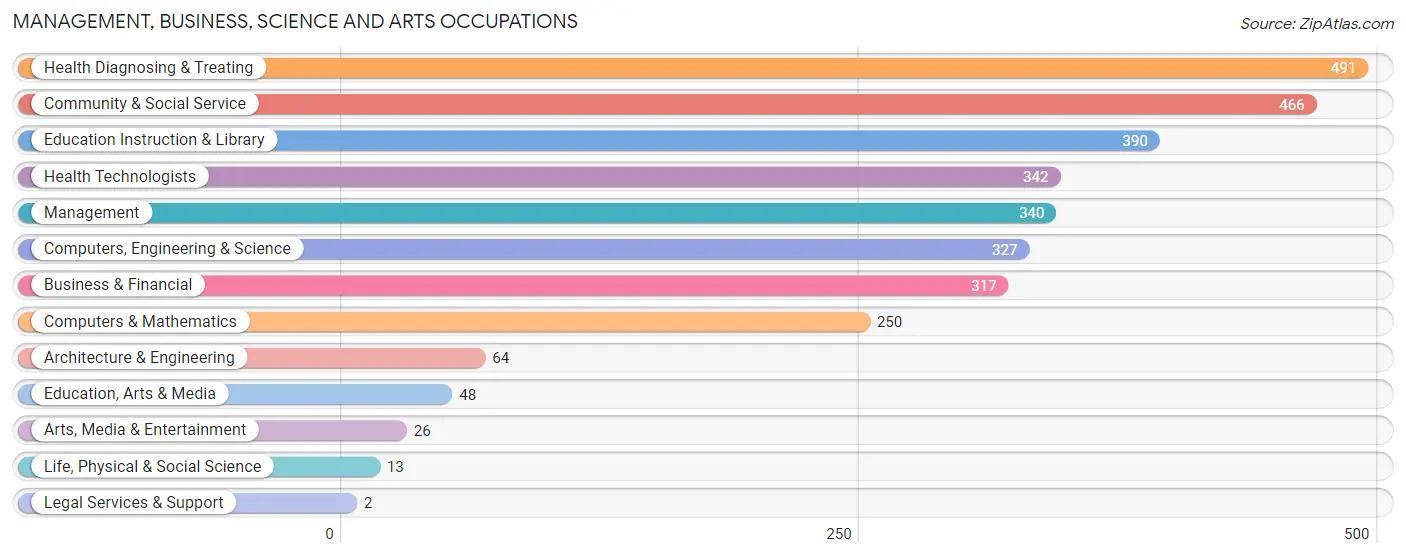
Management, Business, Science and Arts Occupations
The most common Management, Business, Science and Arts occupations in Rains County are Health Diagnosing & Treating (491 | 9.6%), Community & Social Service (466 | 9.1%), Education Instruction & Library (390 | 7.6%), Health Technologists (342 | 6.7%), and Management (340 | 6.6%).
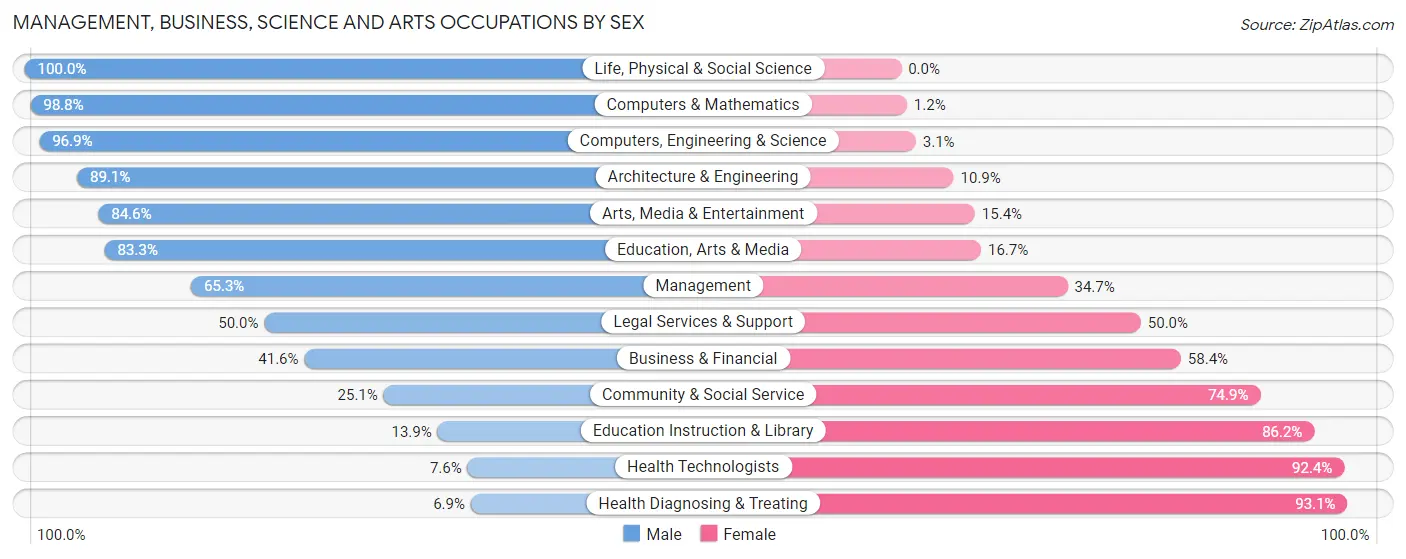
Management, Business, Science and Arts Occupations by Sex
Within the Management, Business, Science and Arts occupations in Rains County, the most male-oriented occupations are Life, Physical & Social Science (100.0%), Computers & Mathematics (98.8%), and Computers, Engineering & Science (96.9%), while the most female-oriented occupations are Health Diagnosing & Treating (93.1%), Health Technologists (92.4%), and Education Instruction & Library (86.2%).
| Occupation | Male | Female |
| Management | 222 (65.3%) | 118 (34.7%) |
| Business & Financial | 132 (41.6%) | 185 (58.4%) |
| Computers, Engineering & Science | 317 (96.9%) | 10 (3.1%) |
| Computers & Mathematics | 247 (98.8%) | 3 (1.2%) |
| Architecture & Engineering | 57 (89.1%) | 7 (10.9%) |
| Life, Physical & Social Science | 13 (100.0%) | 0 (0.0%) |
| Community & Social Service | 117 (25.1%) | 349 (74.9%) |
| Education, Arts & Media | 40 (83.3%) | 8 (16.7%) |
| Legal Services & Support | 1 (50.0%) | 1 (50.0%) |
| Education Instruction & Library | 54 (13.9%) | 336 (86.2%) |
| Arts, Media & Entertainment | 22 (84.6%) | 4 (15.4%) |
| Health Diagnosing & Treating | 34 (6.9%) | 457 (93.1%) |
| Health Technologists | 26 (7.6%) | 316 (92.4%) |
| Total (Category) | 822 (42.3%) | 1,119 (57.7%) |
| Total (Overall) | 2,586 (50.3%) | 2,558 (49.7%) |
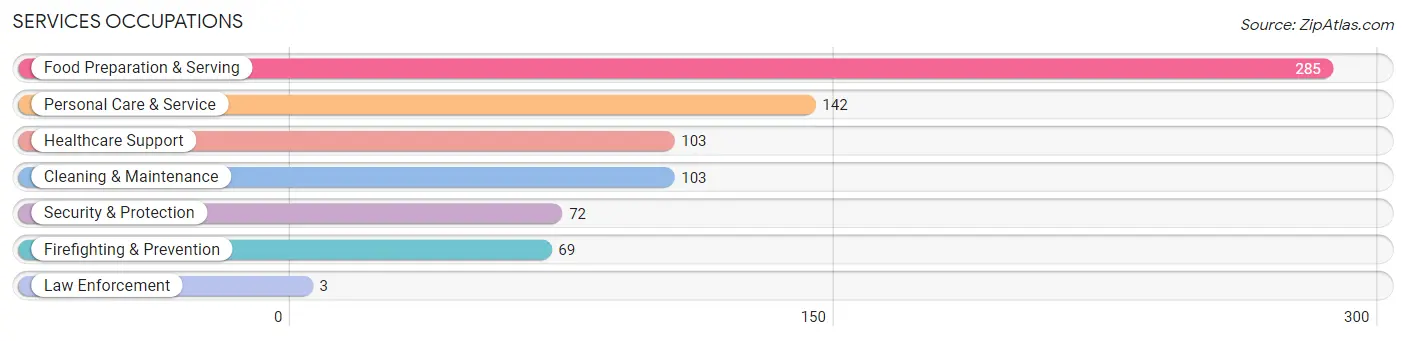
Services Occupations
The most common Services occupations in Rains County are Food Preparation & Serving (285 | 5.5%), Personal Care & Service (142 | 2.8%), Healthcare Support (103 | 2.0%), Cleaning & Maintenance (103 | 2.0%), and Security & Protection (72 | 1.4%).
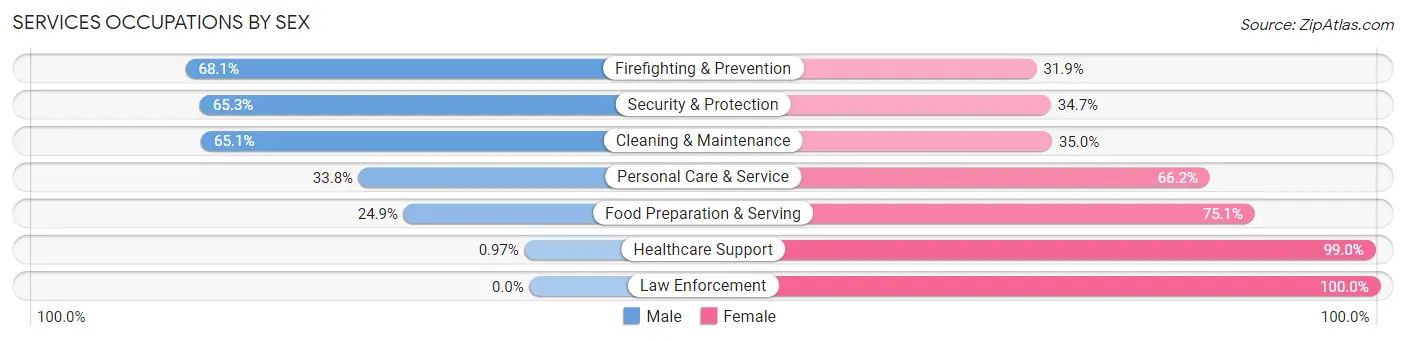
Services Occupations by Sex
Within the Services occupations in Rains County, the most male-oriented occupations are Firefighting & Prevention (68.1%), Security & Protection (65.3%), and Cleaning & Maintenance (65.0%), while the most female-oriented occupations are Law Enforcement (100.0%), Healthcare Support (99.0%), and Food Preparation & Serving (75.1%).
| Occupation | Male | Female |
| Healthcare Support | 1 (1.0%) | 102 (99.0%) |
| Security & Protection | 47 (65.3%) | 25 (34.7%) |
| Firefighting & Prevention | 47 (68.1%) | 22 (31.9%) |
| Law Enforcement | 0 (0.0%) | 3 (100.0%) |
| Food Preparation & Serving | 71 (24.9%) | 214 (75.1%) |
| Cleaning & Maintenance | 67 (65.0%) | 36 (34.9%) |
| Personal Care & Service | 48 (33.8%) | 94 (66.2%) |
| Total (Category) | 234 (33.2%) | 471 (66.8%) |
| Total (Overall) | 2,586 (50.3%) | 2,558 (49.7%) |
Sales and Office Occupations
The most common Sales and Office occupations in Rains County are Office & Administration (578 | 11.2%), and Sales & Related (491 | 9.6%).
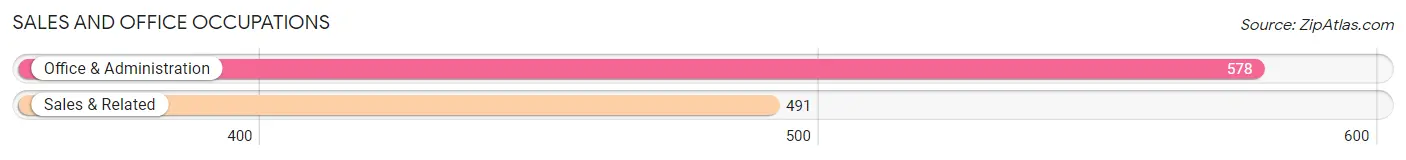
Sales and Office Occupations by Sex
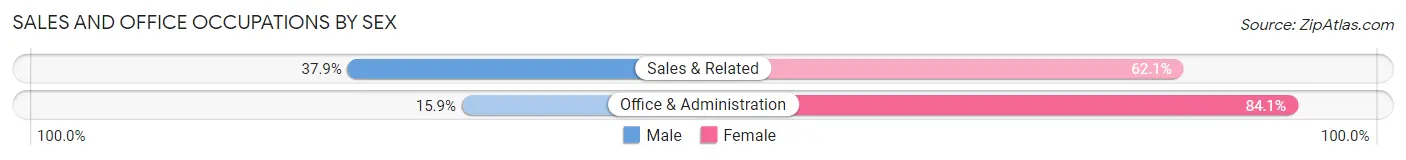
| Occupation | Male | Female |
| Sales & Related | 186 (37.9%) | 305 (62.1%) |
| Office & Administration | 92 (15.9%) | 486 (84.1%) |
| Total (Category) | 278 (26.0%) | 791 (74.0%) |
| Total (Overall) | 2,586 (50.3%) | 2,558 (49.7%) |
Natural Resources, Construction and Maintenance Occupations
The most common Natural Resources, Construction and Maintenance occupations in Rains County are Construction & Extraction (325 | 6.3%), Installation, Maintenance & Repair (283 | 5.5%), and Farming, Fishing & Forestry (37 | 0.7%).
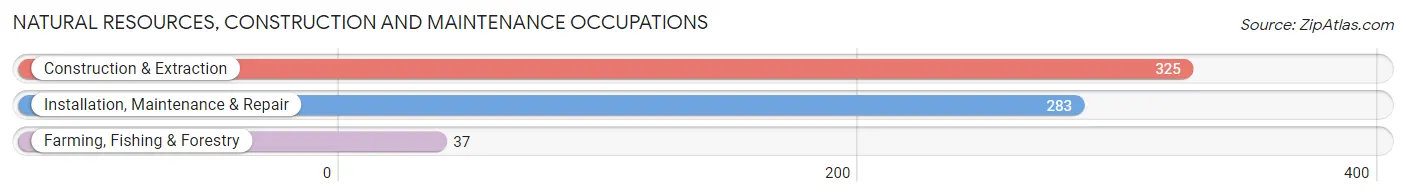
Natural Resources, Construction and Maintenance Occupations by Sex
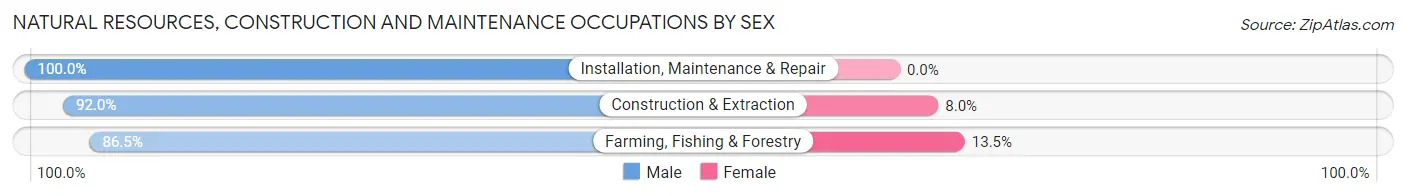
| Occupation | Male | Female |
| Farming, Fishing & Forestry | 32 (86.5%) | 5 (13.5%) |
| Construction & Extraction | 299 (92.0%) | 26 (8.0%) |
| Installation, Maintenance & Repair | 283 (100.0%) | 0 (0.0%) |
| Total (Category) | 614 (95.2%) | 31 (4.8%) |
| Total (Overall) | 2,586 (50.3%) | 2,558 (49.7%) |
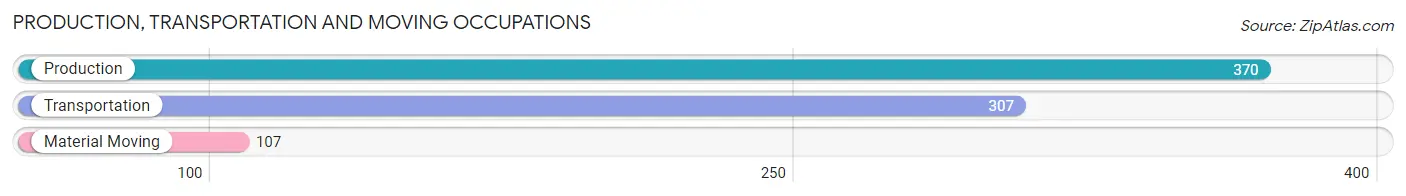
Production, Transportation and Moving Occupations
The most common Production, Transportation and Moving occupations in Rains County are Production (370 | 7.2%), Transportation (307 | 6.0%), and Material Moving (107 | 2.1%).
Production, Transportation and Moving Occupations by Sex
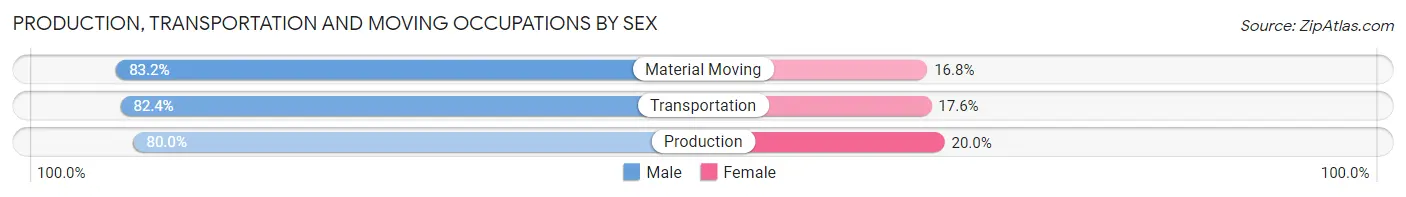
| Occupation | Male | Female |
| Production | 296 (80.0%) | 74 (20.0%) |
| Transportation | 253 (82.4%) | 54 (17.6%) |
| Material Moving | 89 (83.2%) | 18 (16.8%) |
| Total (Category) | 638 (81.4%) | 146 (18.6%) |
| Total (Overall) | 2,586 (50.3%) | 2,558 (49.7%) |
Employment Industries by Sex in Rains County
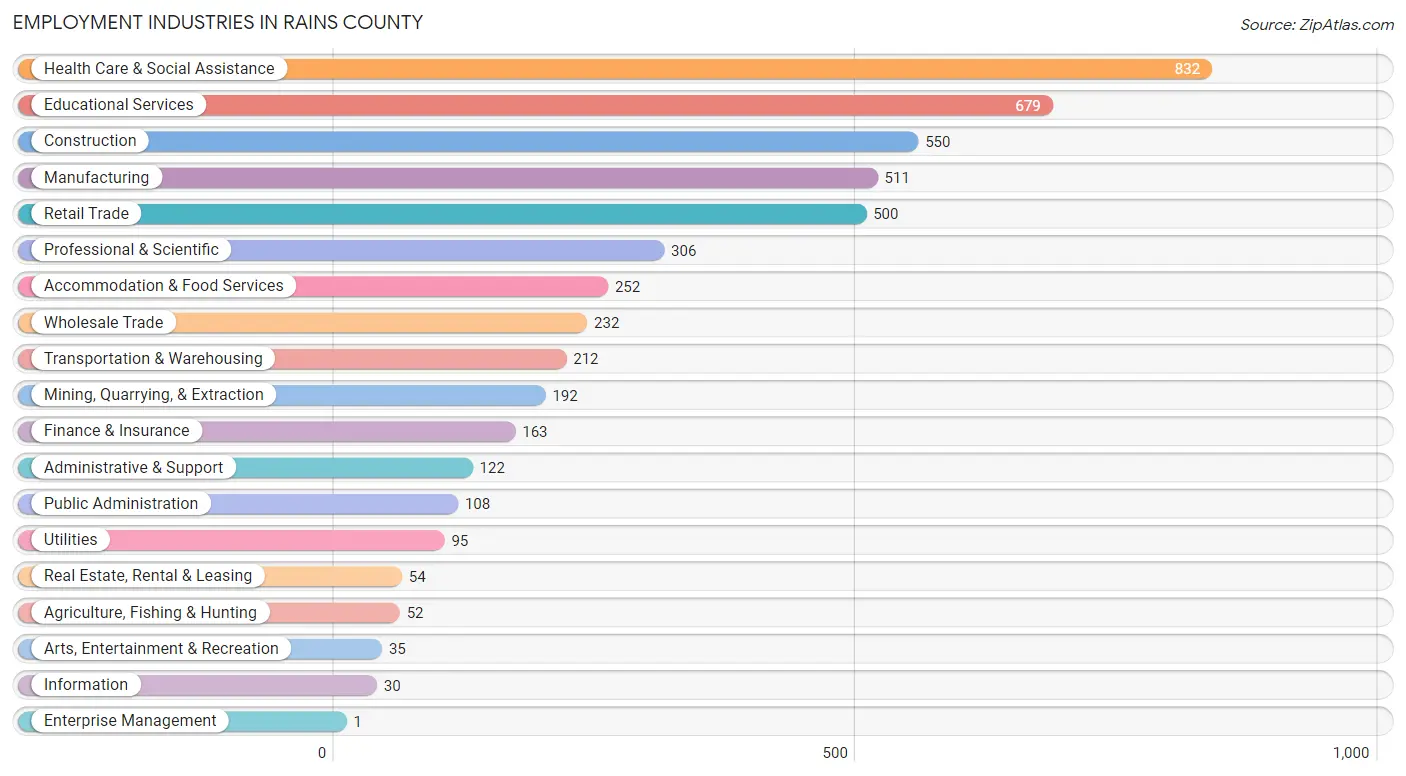
Employment Industries in Rains County
The major employment industries in Rains County include Health Care & Social Assistance (832 | 16.2%), Educational Services (679 | 13.2%), Construction (550 | 10.7%), Manufacturing (511 | 9.9%), and Retail Trade (500 | 9.7%).
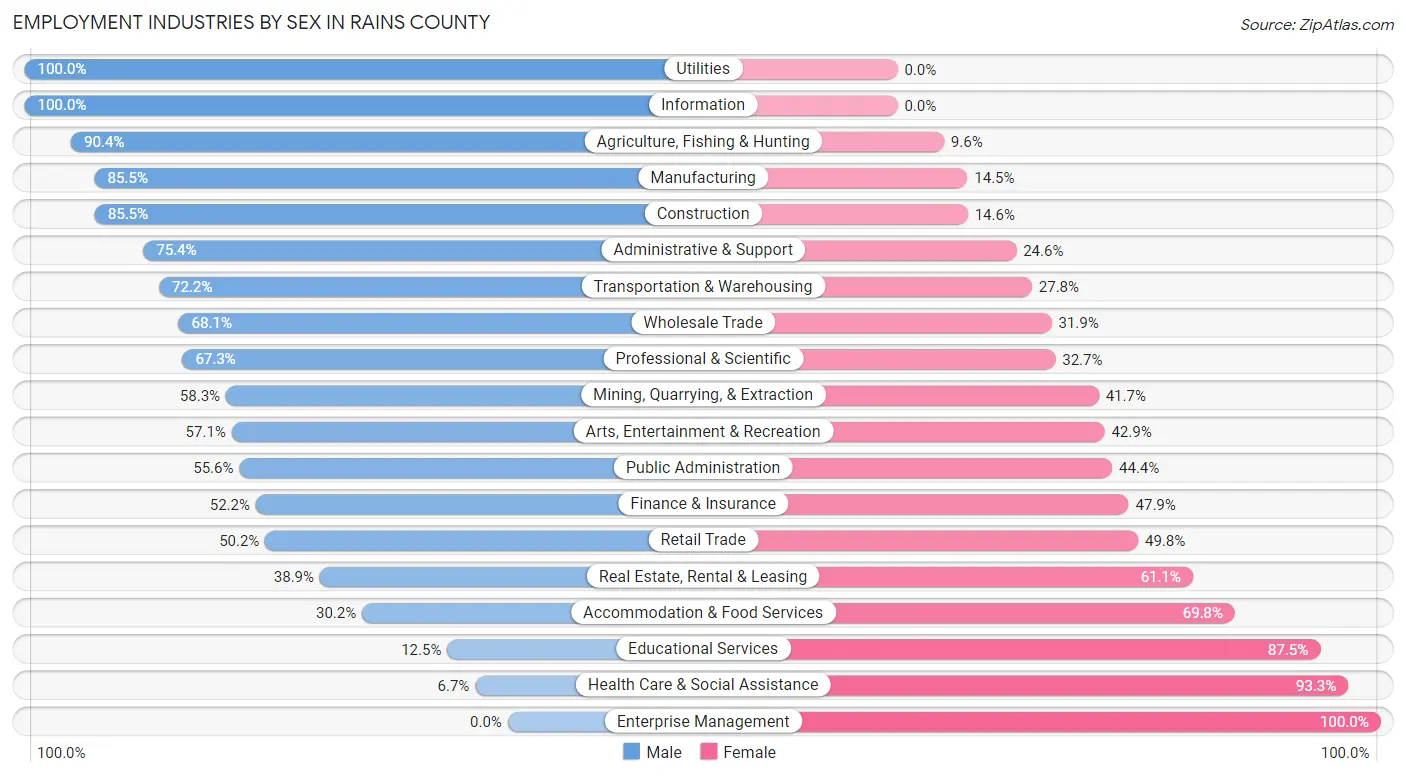
Employment Industries by Sex in Rains County
The Rains County industries that see more men than women are Utilities (100.0%), Information (100.0%), and Agriculture, Fishing & Hunting (90.4%), whereas the industries that tend to have a higher number of women are Enterprise Management (100.0%), Health Care & Social Assistance (93.3%), and Educational Services (87.5%).
| Industry | Male | Female |
| Agriculture, Fishing & Hunting | 47 (90.4%) | 5 (9.6%) |
| Mining, Quarrying, & Extraction | 112 (58.3%) | 80 (41.7%) |
| Construction | 470 (85.5%) | 80 (14.5%) |
| Manufacturing | 437 (85.5%) | 74 (14.5%) |
| Wholesale Trade | 158 (68.1%) | 74 (31.9%) |
| Retail Trade | 251 (50.2%) | 249 (49.8%) |
| Transportation & Warehousing | 153 (72.2%) | 59 (27.8%) |
| Utilities | 95 (100.0%) | 0 (0.0%) |
| Information | 30 (100.0%) | 0 (0.0%) |
| Finance & Insurance | 85 (52.1%) | 78 (47.8%) |
| Real Estate, Rental & Leasing | 21 (38.9%) | 33 (61.1%) |
| Professional & Scientific | 206 (67.3%) | 100 (32.7%) |
| Enterprise Management | 0 (0.0%) | 1 (100.0%) |
| Administrative & Support | 92 (75.4%) | 30 (24.6%) |
| Educational Services | 85 (12.5%) | 594 (87.5%) |
| Health Care & Social Assistance | 56 (6.7%) | 776 (93.3%) |
| Arts, Entertainment & Recreation | 20 (57.1%) | 15 (42.9%) |
| Accommodation & Food Services | 76 (30.2%) | 176 (69.8%) |
| Public Administration | 60 (55.6%) | 48 (44.4%) |
| Total | 2,586 (50.3%) | 2,558 (49.7%) |
Education in Rains County
School Enrollment in Rains County
The most common levels of schooling among the 2,033 students in Rains County are high school (529 | 26.0%), middle school (446 | 21.9%), and elementary school (364 | 17.9%).
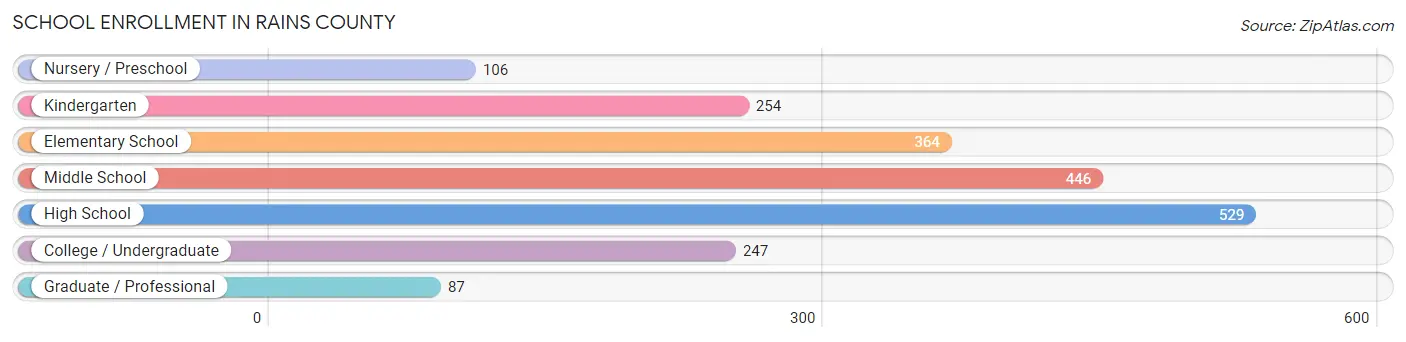
| School Level | # Students | % Students |
| Nursery / Preschool | 106 | 5.2% |
| Kindergarten | 254 | 12.5% |
| Elementary School | 364 | 17.9% |
| Middle School | 446 | 21.9% |
| High School | 529 | 26.0% |
| College / Undergraduate | 247 | 12.1% |
| Graduate / Professional | 87 | 4.3% |
| Total | 2,033 | 100.0% |
School Enrollment by Age by Funding Source in Rains County
Out of a total of 2,033 students who are enrolled in schools in Rains County, 102 (5.0%) attend a private institution, while the remaining 1,931 (95.0%) are enrolled in public schools. The age group of 18 to 19 year olds has the highest likelihood of being enrolled in private schools, with 48 (33.6% in the age bracket) enrolled. Conversely, the age group of 3 to 4 year olds has the lowest likelihood of being enrolled in a private school, with 97 (100.0% in the age bracket) attending a public institution.
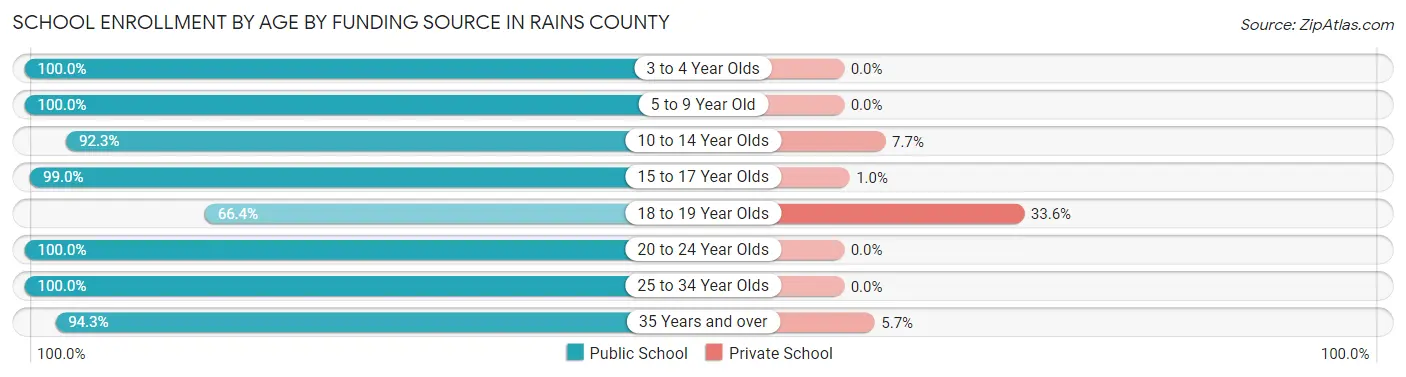
| Age Bracket | Public School | Private School |
| 3 to 4 Year Olds | 97 (100.0%) | 0 (0.0%) |
| 5 to 9 Year Old | 593 (100.0%) | 0 (0.0%) |
| 10 to 14 Year Olds | 513 (92.3%) | 43 (7.7%) |
| 15 to 17 Year Olds | 381 (99.0%) | 4 (1.0%) |
| 18 to 19 Year Olds | 95 (66.4%) | 48 (33.6%) |
| 20 to 24 Year Olds | 76 (100.0%) | 0 (0.0%) |
| 25 to 34 Year Olds | 78 (100.0%) | 0 (0.0%) |
| 35 Years and over | 99 (94.3%) | 6 (5.7%) |
| Total | 1,931 (95.0%) | 102 (5.0%) |
Educational Attainment by Field of Study in Rains County
Education (537 | 26.5%), science & technology (329 | 16.3%), business (306 | 15.1%), visual & performing arts (137 | 6.8%), and literature & languages (117 | 5.8%) are the most common fields of study among 2,025 individuals in Rains County who have obtained a bachelor's degree or higher.

| Field of Study | # Graduates | % Graduates |
| Computers & Mathematics | 62 | 3.1% |
| Bio, Nature & Agricultural | 100 | 4.9% |
| Physical & Health Sciences | 16 | 0.8% |
| Psychology | 38 | 1.9% |
| Social Sciences | 72 | 3.6% |
| Engineering | 98 | 4.8% |
| Multidisciplinary Studies | 24 | 1.2% |
| Science & Technology | 329 | 16.3% |
| Business | 306 | 15.1% |
| Education | 537 | 26.5% |
| Literature & Languages | 117 | 5.8% |
| Liberal Arts & History | 59 | 2.9% |
| Visual & Performing Arts | 137 | 6.8% |
| Communications | 26 | 1.3% |
| Arts & Humanities | 104 | 5.1% |
| Total | 2,025 | 100.0% |
Transportation & Commute in Rains County
Vehicle Availability by Sex in Rains County
The most prevalent vehicle ownership categories in Rains County are males with 2 vehicles (1,092, accounting for 43.3%) and females with 2 vehicles (1,014, making up 43.7%).
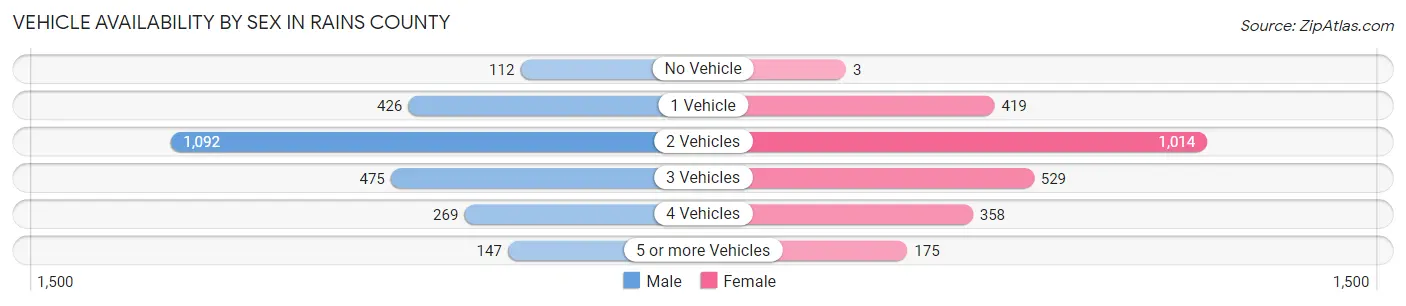
| Vehicles Available | Male | Female |
| No Vehicle | 112 (4.4%) | 3 (0.1%) |
| 1 Vehicle | 426 (16.9%) | 419 (16.8%) |
| 2 Vehicles | 1,092 (43.3%) | 1,014 (40.6%) |
| 3 Vehicles | 475 (18.8%) | 529 (21.2%) |
| 4 Vehicles | 269 (10.7%) | 358 (14.3%) |
| 5 or more Vehicles | 147 (5.8%) | 175 (7.0%) |
| Total | 2,521 (100.0%) | 2,498 (100.0%) |
Commute Time in Rains County
The most frequently occuring commute durations in Rains County are 90 or more minutes (736 commuters, 16.1%), 10 to 14 minutes (603 commuters, 13.2%), and 30 to 34 minutes (552 commuters, 12.1%).
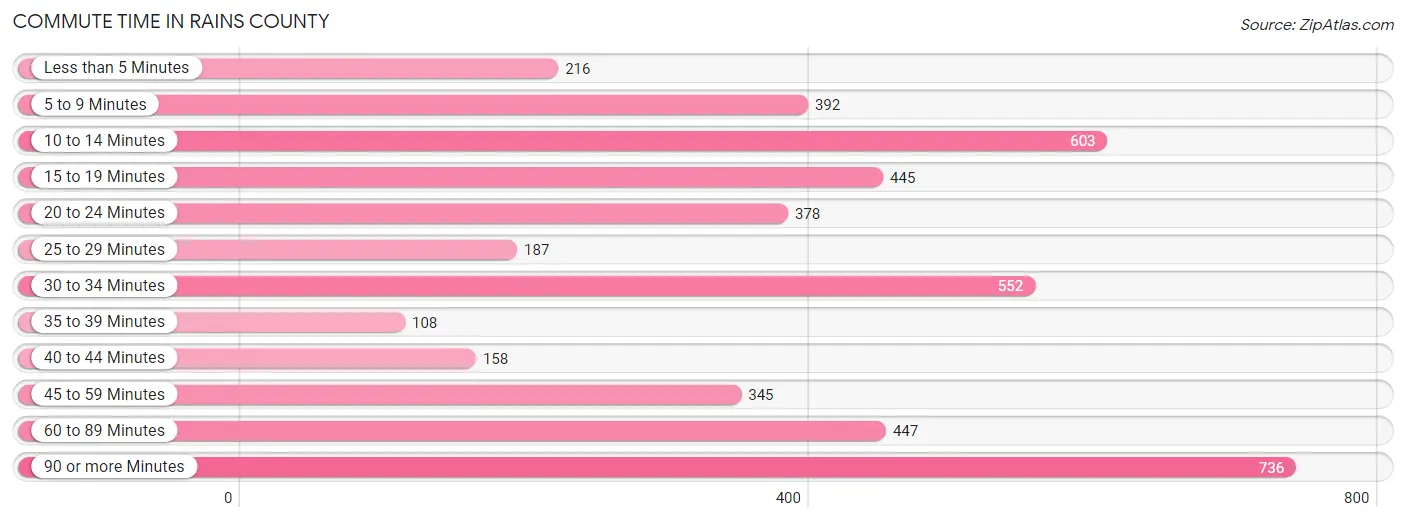
| Commute Time | # Commuters | % Commuters |
| Less than 5 Minutes | 216 | 4.7% |
| 5 to 9 Minutes | 392 | 8.6% |
| 10 to 14 Minutes | 603 | 13.2% |
| 15 to 19 Minutes | 445 | 9.7% |
| 20 to 24 Minutes | 378 | 8.3% |
| 25 to 29 Minutes | 187 | 4.1% |
| 30 to 34 Minutes | 552 | 12.1% |
| 35 to 39 Minutes | 108 | 2.4% |
| 40 to 44 Minutes | 158 | 3.5% |
| 45 to 59 Minutes | 345 | 7.5% |
| 60 to 89 Minutes | 447 | 9.8% |
| 90 or more Minutes | 736 | 16.1% |
Commute Time by Sex in Rains County
The most common commute times in Rains County are 90 or more minutes (434 commuters, 18.9%) for males and 10 to 14 minutes (339 commuters, 15.0%) for females.
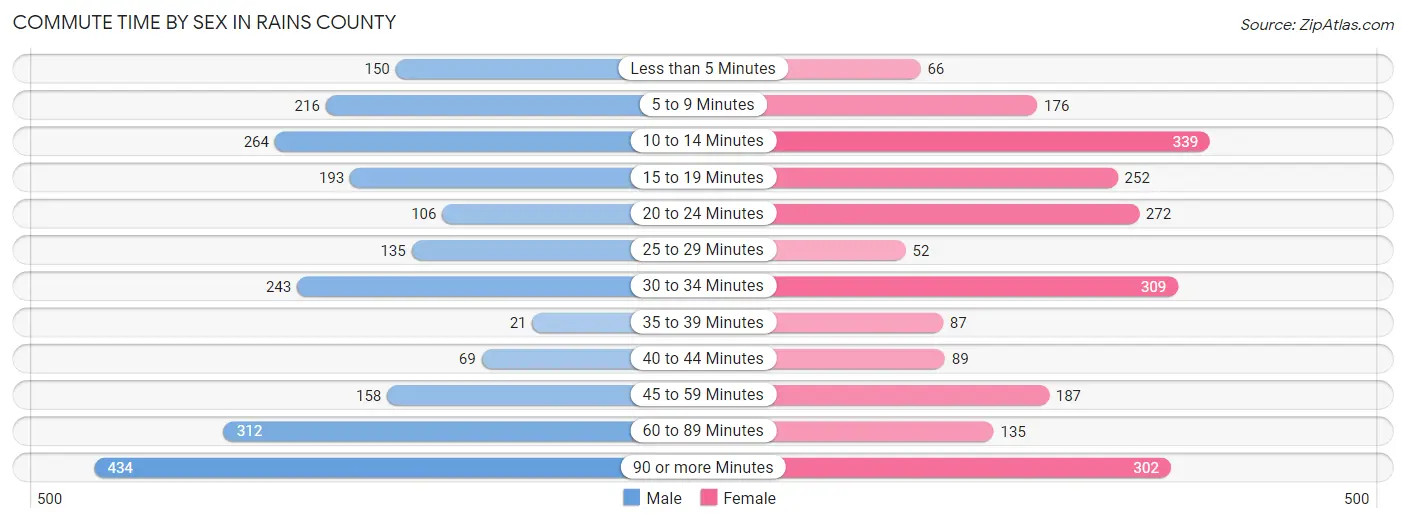
| Commute Time | Male | Female |
| Less than 5 Minutes | 150 (6.5%) | 66 (2.9%) |
| 5 to 9 Minutes | 216 (9.4%) | 176 (7.8%) |
| 10 to 14 Minutes | 264 (11.5%) | 339 (15.0%) |
| 15 to 19 Minutes | 193 (8.4%) | 252 (11.1%) |
| 20 to 24 Minutes | 106 (4.6%) | 272 (12.0%) |
| 25 to 29 Minutes | 135 (5.9%) | 52 (2.3%) |
| 30 to 34 Minutes | 243 (10.6%) | 309 (13.6%) |
| 35 to 39 Minutes | 21 (0.9%) | 87 (3.8%) |
| 40 to 44 Minutes | 69 (3.0%) | 89 (3.9%) |
| 45 to 59 Minutes | 158 (6.9%) | 187 (8.3%) |
| 60 to 89 Minutes | 312 (13.6%) | 135 (6.0%) |
| 90 or more Minutes | 434 (18.9%) | 302 (13.3%) |
Time of Departure to Work by Sex in Rains County
The most frequent times of departure to work in Rains County are 12:00 AM to 4:59 AM (422, 18.3%) for males and 7:00 AM to 7:29 AM (673, 29.7%) for females.
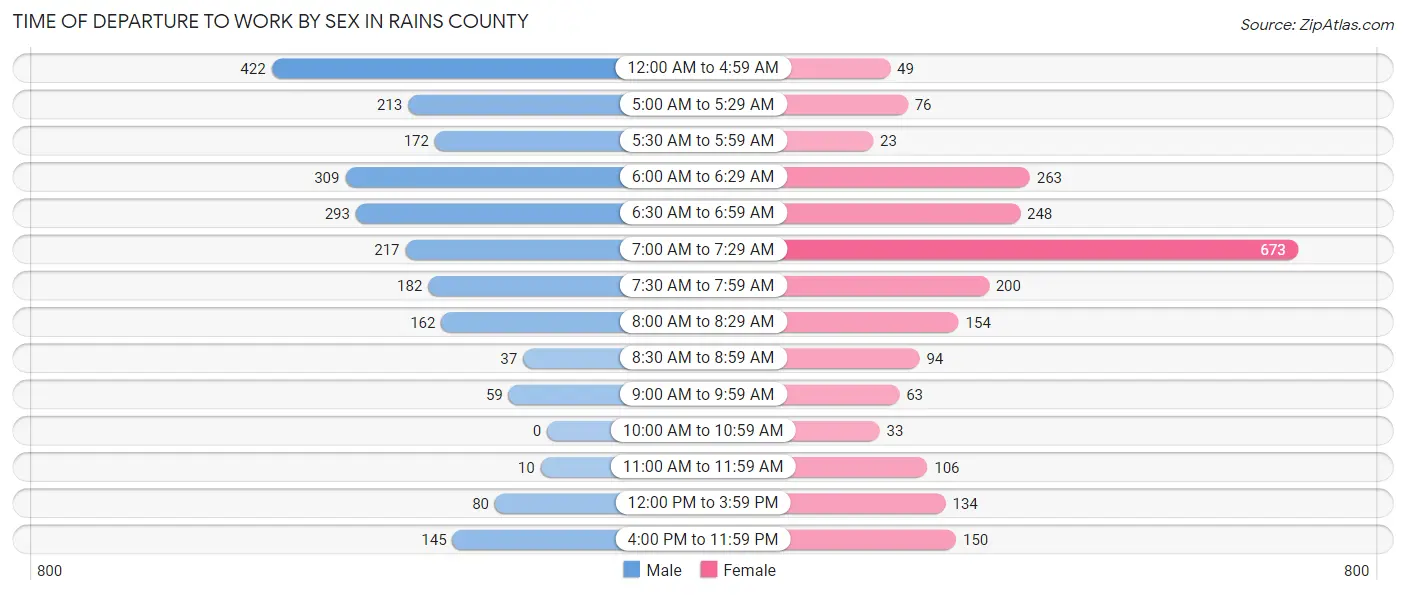
| Time of Departure | Male | Female |
| 12:00 AM to 4:59 AM | 422 (18.3%) | 49 (2.2%) |
| 5:00 AM to 5:29 AM | 213 (9.3%) | 76 (3.4%) |
| 5:30 AM to 5:59 AM | 172 (7.5%) | 23 (1.0%) |
| 6:00 AM to 6:29 AM | 309 (13.4%) | 263 (11.6%) |
| 6:30 AM to 6:59 AM | 293 (12.7%) | 248 (10.9%) |
| 7:00 AM to 7:29 AM | 217 (9.4%) | 673 (29.7%) |
| 7:30 AM to 7:59 AM | 182 (7.9%) | 200 (8.8%) |
| 8:00 AM to 8:29 AM | 162 (7.0%) | 154 (6.8%) |
| 8:30 AM to 8:59 AM | 37 (1.6%) | 94 (4.2%) |
| 9:00 AM to 9:59 AM | 59 (2.6%) | 63 (2.8%) |
| 10:00 AM to 10:59 AM | 0 (0.0%) | 33 (1.5%) |
| 11:00 AM to 11:59 AM | 10 (0.4%) | 106 (4.7%) |
| 12:00 PM to 3:59 PM | 80 (3.5%) | 134 (5.9%) |
| 4:00 PM to 11:59 PM | 145 (6.3%) | 150 (6.6%) |
| Total | 2,301 (100.0%) | 2,266 (100.0%) |
Housing Occupancy in Rains County
Occupancy by Ownership in Rains County
Of the total 4,710 dwellings in Rains County, owner-occupied units account for 3,766 (80.0%), while renter-occupied units make up 944 (20.0%).
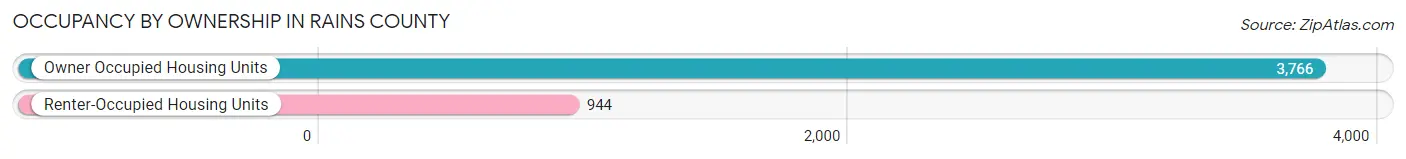
| Occupancy | # Housing Units | % Housing Units |
| Owner Occupied Housing Units | 3,766 | 80.0% |
| Renter-Occupied Housing Units | 944 | 20.0% |
| Total Occupied Housing Units | 4,710 | 100.0% |
Occupancy by Household Size in Rains County
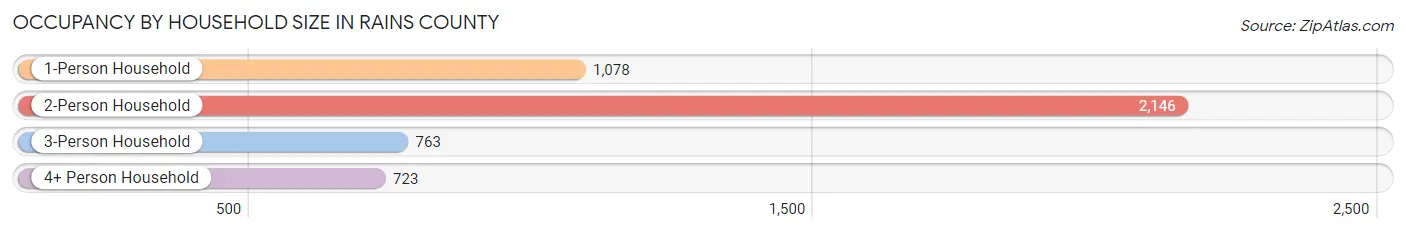
| Household Size | # Housing Units | % Housing Units |
| 1-Person Household | 1,078 | 22.9% |
| 2-Person Household | 2,146 | 45.6% |
| 3-Person Household | 763 | 16.2% |
| 4+ Person Household | 723 | 15.3% |
| Total Housing Units | 4,710 | 100.0% |
Occupancy by Ownership by Household Size in Rains County
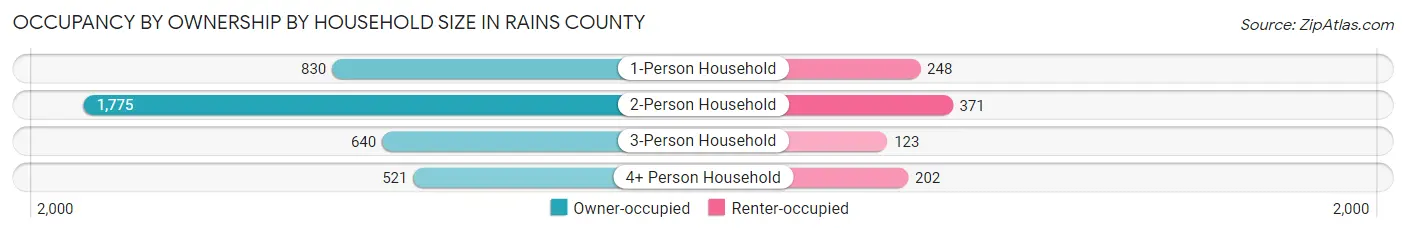
| Household Size | Owner-occupied | Renter-occupied |
| 1-Person Household | 830 (77.0%) | 248 (23.0%) |
| 2-Person Household | 1,775 (82.7%) | 371 (17.3%) |
| 3-Person Household | 640 (83.9%) | 123 (16.1%) |
| 4+ Person Household | 521 (72.1%) | 202 (27.9%) |
| Total Housing Units | 3,766 (80.0%) | 944 (20.0%) |
Occupancy by Educational Attainment in Rains County
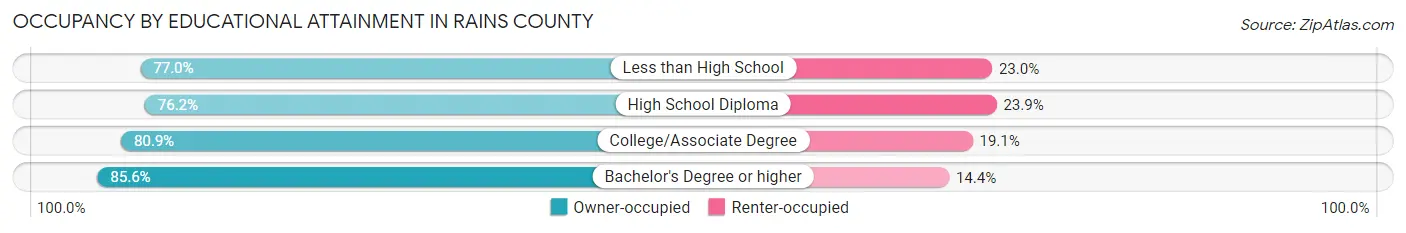
| Household Size | Owner-occupied | Renter-occupied |
| Less than High School | 510 (77.0%) | 152 (23.0%) |
| High School Diploma | 1,063 (76.1%) | 333 (23.8%) |
| College/Associate Degree | 1,316 (80.9%) | 311 (19.1%) |
| Bachelor's Degree or higher | 877 (85.6%) | 148 (14.4%) |
Occupancy by Age of Householder in Rains County
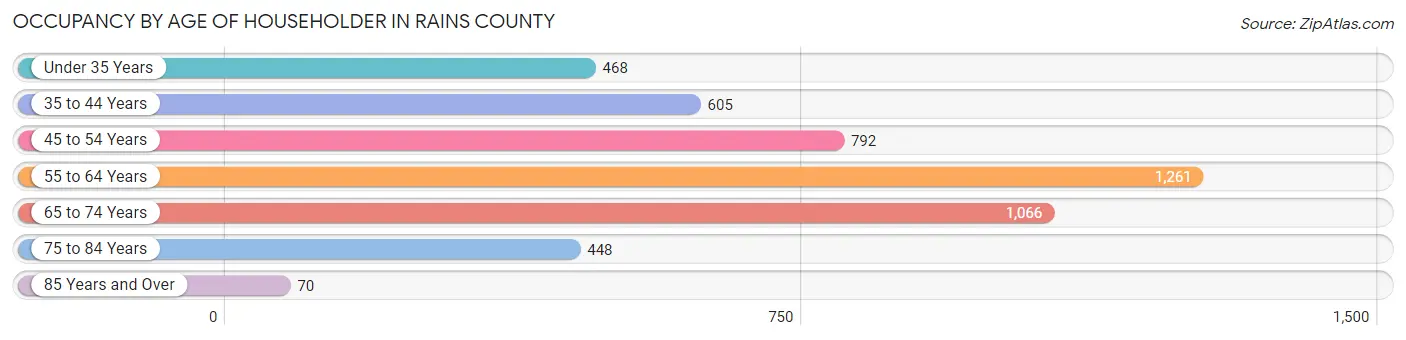
| Age Bracket | # Households | % Households |
| Under 35 Years | 468 | 9.9% |
| 35 to 44 Years | 605 | 12.9% |
| 45 to 54 Years | 792 | 16.8% |
| 55 to 64 Years | 1,261 | 26.8% |
| 65 to 74 Years | 1,066 | 22.6% |
| 75 to 84 Years | 448 | 9.5% |
| 85 Years and Over | 70 | 1.5% |
| Total | 4,710 | 100.0% |
Housing Finances in Rains County
Median Income by Occupancy in Rains County
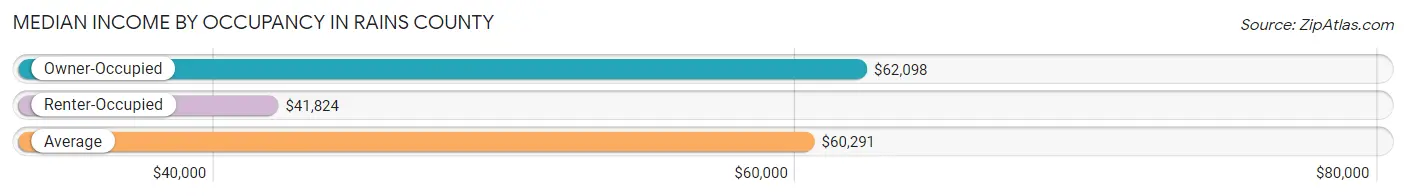
| Occupancy Type | # Households | Median Income |
| Owner-Occupied | 3,766 (80.0%) | $62,098 |
| Renter-Occupied | 944 (20.0%) | $41,824 |
| Average | 4,710 (100.0%) | $60,291 |
Occupancy by Householder Income Bracket in Rains County
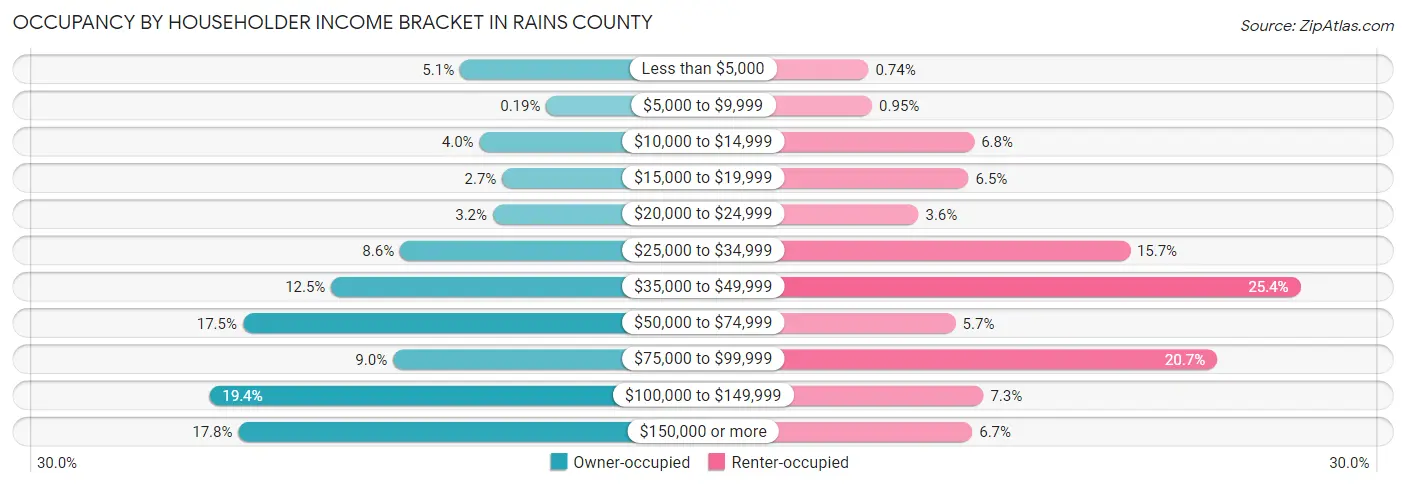
| Income Bracket | Owner-occupied | Renter-occupied |
| Less than $5,000 | 193 (5.1%) | 7 (0.7%) |
| $5,000 to $9,999 | 7 (0.2%) | 9 (0.9%) |
| $10,000 to $14,999 | 151 (4.0%) | 64 (6.8%) |
| $15,000 to $19,999 | 102 (2.7%) | 61 (6.5%) |
| $20,000 to $24,999 | 122 (3.2%) | 34 (3.6%) |
| $25,000 to $34,999 | 322 (8.6%) | 148 (15.7%) |
| $35,000 to $49,999 | 470 (12.5%) | 240 (25.4%) |
| $50,000 to $74,999 | 660 (17.5%) | 54 (5.7%) |
| $75,000 to $99,999 | 337 (8.9%) | 195 (20.7%) |
| $100,000 to $149,999 | 732 (19.4%) | 69 (7.3%) |
| $150,000 or more | 670 (17.8%) | 63 (6.7%) |
| Total | 3,766 (100.0%) | 944 (100.0%) |
Monthly Housing Cost Tiers in Rains County
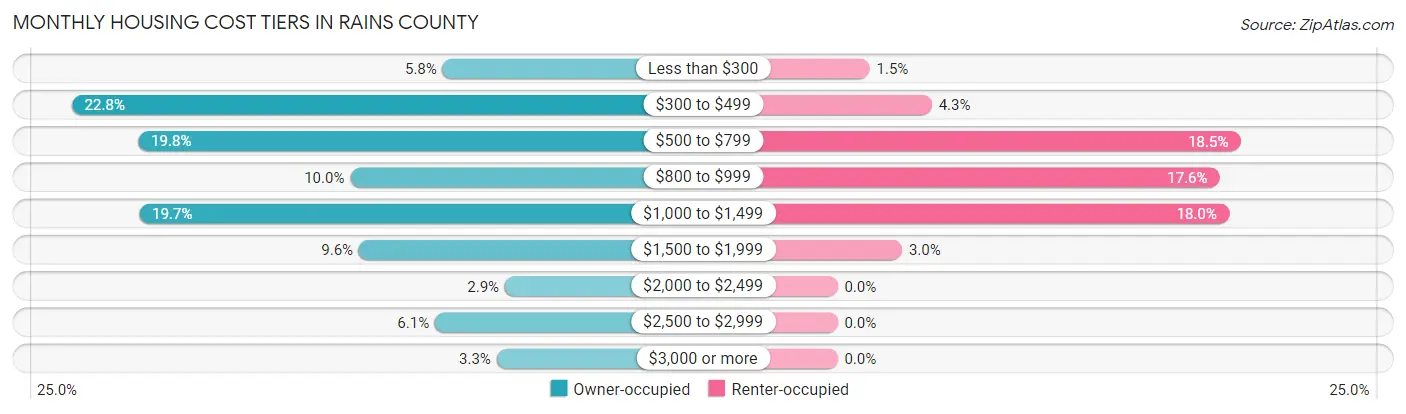
| Monthly Cost | Owner-occupied | Renter-occupied |
| Less than $300 | 217 (5.8%) | 14 (1.5%) |
| $300 to $499 | 860 (22.8%) | 41 (4.3%) |
| $500 to $799 | 745 (19.8%) | 175 (18.5%) |
| $800 to $999 | 377 (10.0%) | 166 (17.6%) |
| $1,000 to $1,499 | 743 (19.7%) | 170 (18.0%) |
| $1,500 to $1,999 | 362 (9.6%) | 28 (3.0%) |
| $2,000 to $2,499 | 109 (2.9%) | 0 (0.0%) |
| $2,500 to $2,999 | 230 (6.1%) | 0 (0.0%) |
| $3,000 or more | 123 (3.3%) | 0 (0.0%) |
| Total | 3,766 (100.0%) | 944 (100.0%) |
Physical Housing Characteristics in Rains County
Housing Structures in Rains County
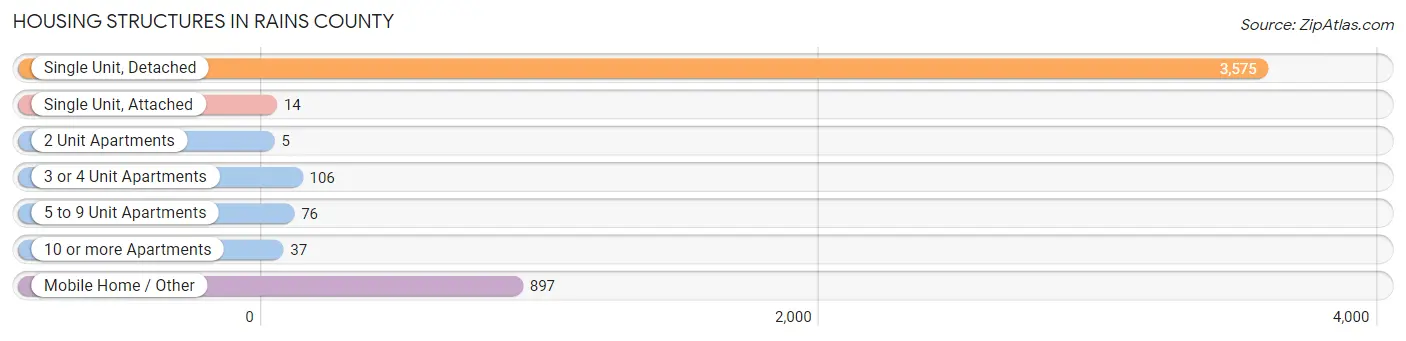
| Structure Type | # Housing Units | % Housing Units |
| Single Unit, Detached | 3,575 | 75.9% |
| Single Unit, Attached | 14 | 0.3% |
| 2 Unit Apartments | 5 | 0.1% |
| 3 or 4 Unit Apartments | 106 | 2.2% |
| 5 to 9 Unit Apartments | 76 | 1.6% |
| 10 or more Apartments | 37 | 0.8% |
| Mobile Home / Other | 897 | 19.0% |
| Total | 4,710 | 100.0% |
Housing Structures by Occupancy in Rains County
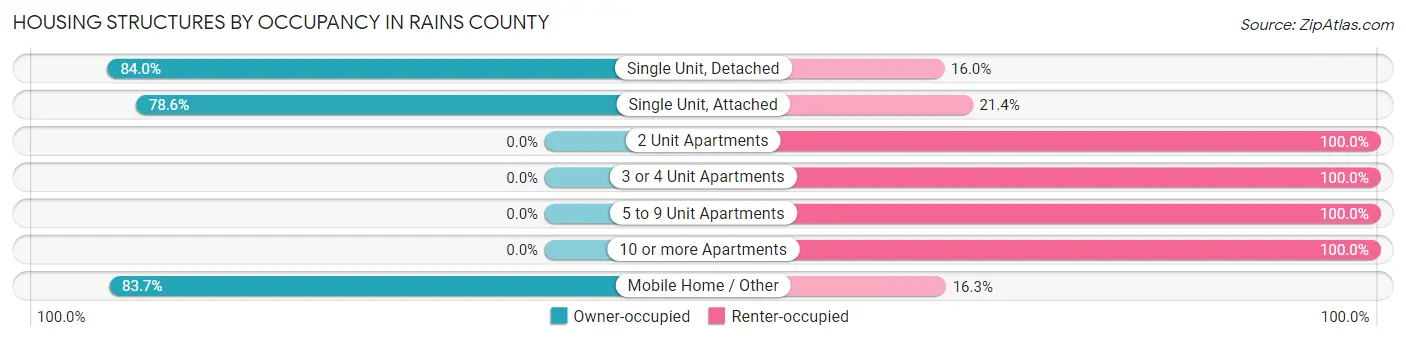
| Structure Type | Owner-occupied | Renter-occupied |
| Single Unit, Detached | 3,004 (84.0%) | 571 (16.0%) |
| Single Unit, Attached | 11 (78.6%) | 3 (21.4%) |
| 2 Unit Apartments | 0 (0.0%) | 5 (100.0%) |
| 3 or 4 Unit Apartments | 0 (0.0%) | 106 (100.0%) |
| 5 to 9 Unit Apartments | 0 (0.0%) | 76 (100.0%) |
| 10 or more Apartments | 0 (0.0%) | 37 (100.0%) |
| Mobile Home / Other | 751 (83.7%) | 146 (16.3%) |
| Total | 3,766 (80.0%) | 944 (20.0%) |
Housing Structures by Number of Rooms in Rains County
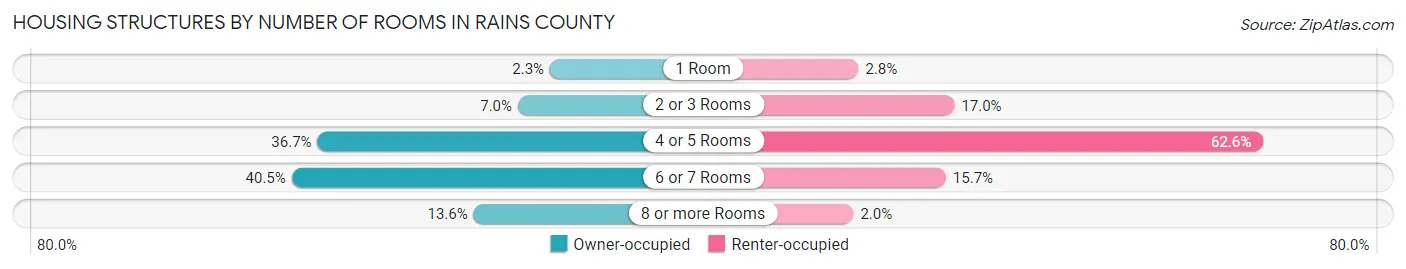
| Number of Rooms | Owner-occupied | Renter-occupied |
| 1 Room | 85 (2.3%) | 26 (2.8%) |
| 2 or 3 Rooms | 264 (7.0%) | 160 (17.0%) |
| 4 or 5 Rooms | 1,381 (36.7%) | 591 (62.6%) |
| 6 or 7 Rooms | 1,525 (40.5%) | 148 (15.7%) |
| 8 or more Rooms | 511 (13.6%) | 19 (2.0%) |
| Total | 3,766 (100.0%) | 944 (100.0%) |
Housing Structure by Heating Type in Rains County
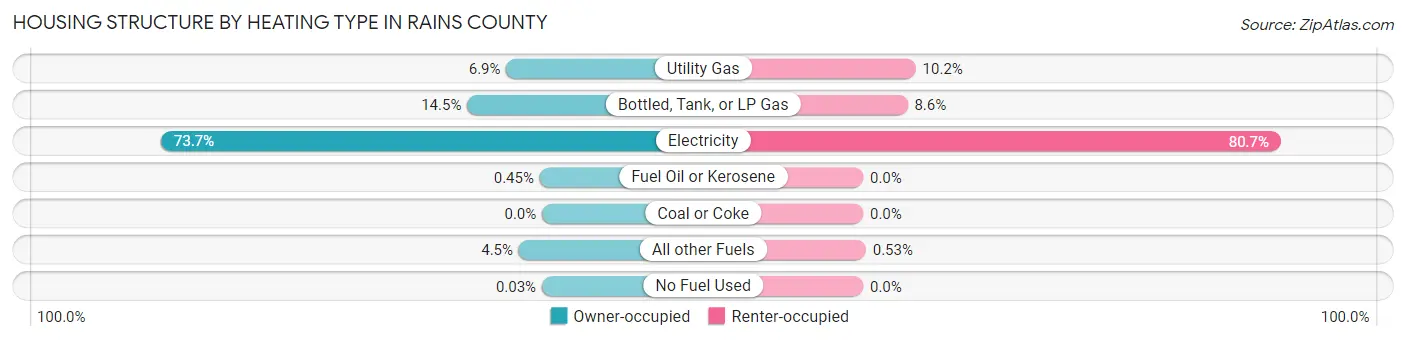
| Heating Type | Owner-occupied | Renter-occupied |
| Utility Gas | 260 (6.9%) | 96 (10.2%) |
| Bottled, Tank, or LP Gas | 545 (14.5%) | 81 (8.6%) |
| Electricity | 2,774 (73.7%) | 762 (80.7%) |
| Fuel Oil or Kerosene | 17 (0.4%) | 0 (0.0%) |
| Coal or Coke | 0 (0.0%) | 0 (0.0%) |
| All other Fuels | 169 (4.5%) | 5 (0.5%) |
| No Fuel Used | 1 (0.0%) | 0 (0.0%) |
| Total | 3,766 (100.0%) | 944 (100.0%) |
Household Vehicle Usage in Rains County
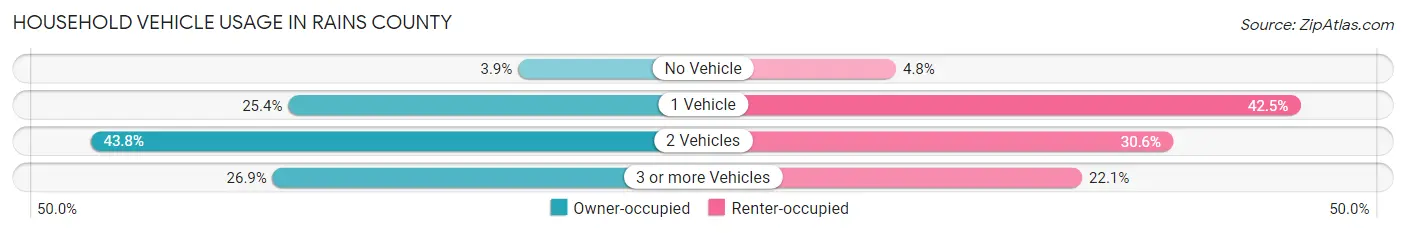
| Vehicles per Household | Owner-occupied | Renter-occupied |
| No Vehicle | 148 (3.9%) | 45 (4.8%) |
| 1 Vehicle | 956 (25.4%) | 401 (42.5%) |
| 2 Vehicles | 1,651 (43.8%) | 289 (30.6%) |
| 3 or more Vehicles | 1,011 (26.9%) | 209 (22.1%) |
| Total | 3,766 (100.0%) | 944 (100.0%) |
Real Estate & Mortgages in Rains County
Real Estate and Mortgage Overview in Rains County
| Characteristic | Without Mortgage | With Mortgage |
| Housing Units | 2,009 | 1,757 |
| Median Property Value | $119,200 | $232,900 |
| Median Household Income | $46,018 | $488 |
| Monthly Housing Costs | $484 | $123 |
| Real Estate Taxes | $1,512 | $88 |
Property Value by Mortgage Status in Rains County
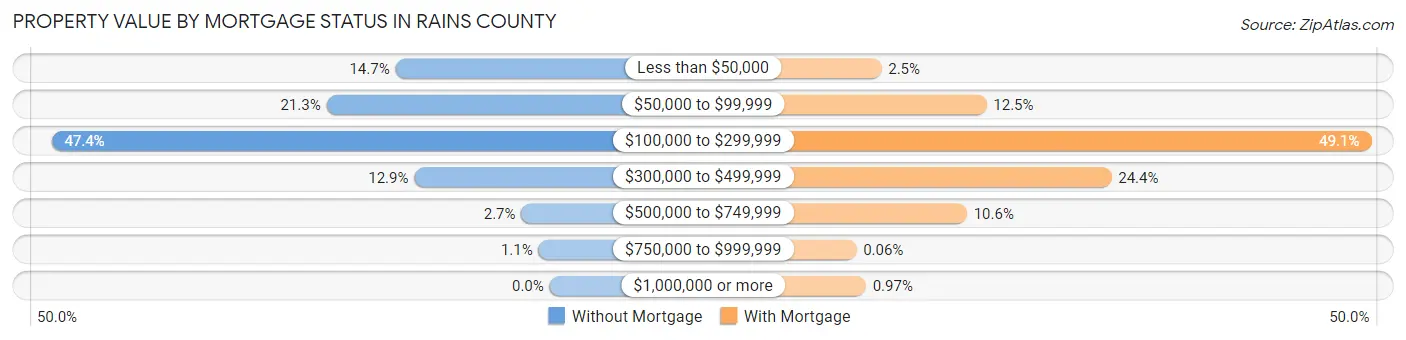
| Property Value | Without Mortgage | With Mortgage |
| Less than $50,000 | 295 (14.7%) | 43 (2.5%) |
| $50,000 to $99,999 | 427 (21.2%) | 219 (12.5%) |
| $100,000 to $299,999 | 953 (47.4%) | 863 (49.1%) |
| $300,000 to $499,999 | 259 (12.9%) | 428 (24.4%) |
| $500,000 to $749,999 | 54 (2.7%) | 186 (10.6%) |
| $750,000 to $999,999 | 21 (1.1%) | 1 (0.1%) |
| $1,000,000 or more | 0 (0.0%) | 17 (1.0%) |
| Total | 2,009 (100.0%) | 1,757 (100.0%) |
Household Income by Mortgage Status in Rains County
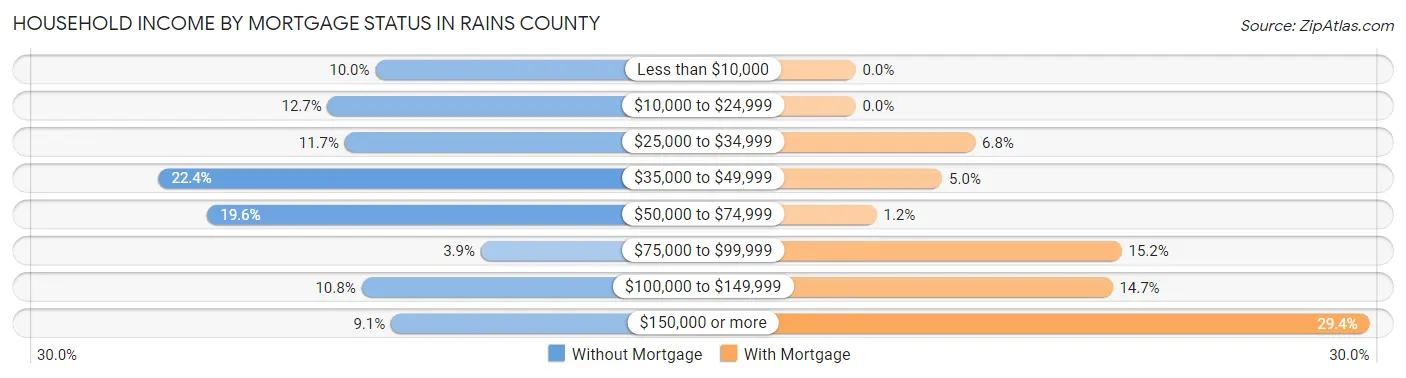
| Household Income | Without Mortgage | With Mortgage |
| Less than $10,000 | 200 (10.0%) | 0 (0.0%) |
| $10,000 to $24,999 | 255 (12.7%) | 0 (0.0%) |
| $25,000 to $34,999 | 235 (11.7%) | 120 (6.8%) |
| $35,000 to $49,999 | 449 (22.4%) | 87 (5.0%) |
| $50,000 to $74,999 | 393 (19.6%) | 21 (1.2%) |
| $75,000 to $99,999 | 79 (3.9%) | 267 (15.2%) |
| $100,000 to $149,999 | 216 (10.7%) | 258 (14.7%) |
| $150,000 or more | 182 (9.1%) | 516 (29.4%) |
| Total | 2,009 (100.0%) | 1,757 (100.0%) |
Property Value to Household Income Ratio in Rains County
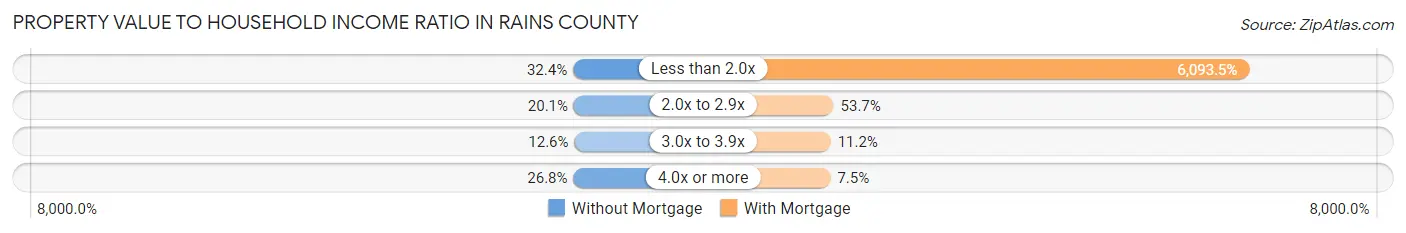
| Value-to-Income Ratio | Without Mortgage | With Mortgage |
| Less than 2.0x | 651 (32.4%) | 107,062 (6,093.4%) |
| 2.0x to 2.9x | 403 (20.1%) | 943 (53.7%) |
| 3.0x to 3.9x | 254 (12.6%) | 197 (11.2%) |
| 4.0x or more | 538 (26.8%) | 132 (7.5%) |
| Total | 2,009 (100.0%) | 1,757 (100.0%) |
Real Estate Taxes by Mortgage Status in Rains County
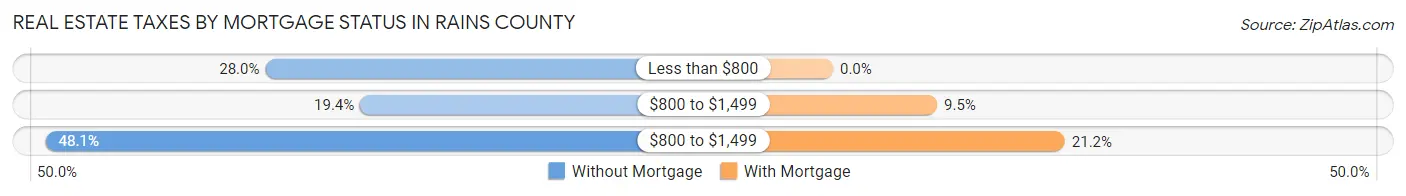
| Property Taxes | Without Mortgage | With Mortgage |
| Less than $800 | 563 (28.0%) | 0 (0.0%) |
| $800 to $1,499 | 389 (19.4%) | 167 (9.5%) |
| $800 to $1,499 | 966 (48.1%) | 372 (21.2%) |
| Total | 2,009 (100.0%) | 1,757 (100.0%) |
Health & Disability in Rains County
Health Insurance Coverage by Age in Rains County
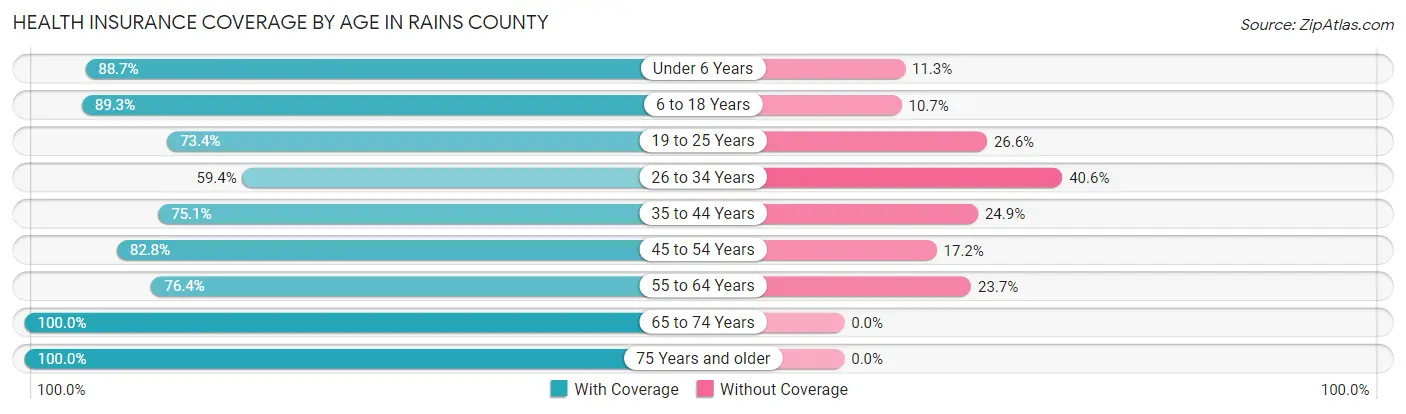
| Age Bracket | With Coverage | Without Coverage |
| Under 6 Years | 587 (88.7%) | 75 (11.3%) |
| 6 to 18 Years | 1,673 (89.3%) | 200 (10.7%) |
| 19 to 25 Years | 447 (73.4%) | 162 (26.6%) |
| 26 to 34 Years | 609 (59.4%) | 417 (40.6%) |
| 35 to 44 Years | 1,090 (75.1%) | 362 (24.9%) |
| 45 to 54 Years | 1,183 (82.8%) | 246 (17.2%) |
| 55 to 64 Years | 1,692 (76.3%) | 524 (23.6%) |
| 65 to 74 Years | 1,834 (100.0%) | 0 (0.0%) |
| 75 Years and older | 1,092 (100.0%) | 0 (0.0%) |
| Total | 10,207 (83.7%) | 1,986 (16.3%) |
Health Insurance Coverage by Citizenship Status in Rains County
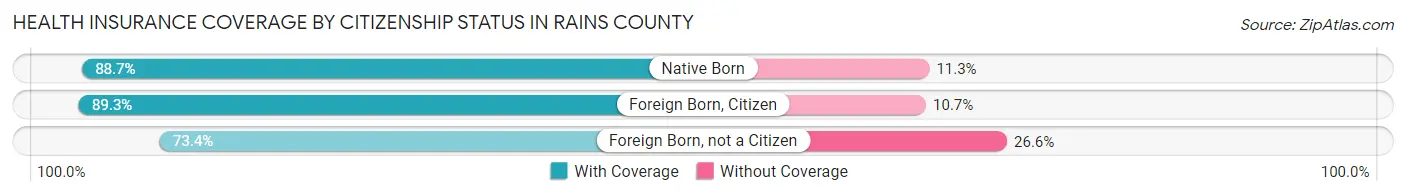
| Citizenship Status | With Coverage | Without Coverage |
| Native Born | 587 (88.7%) | 75 (11.3%) |
| Foreign Born, Citizen | 1,673 (89.3%) | 200 (10.7%) |
| Foreign Born, not a Citizen | 447 (73.4%) | 162 (26.6%) |
Health Insurance Coverage by Household Income in Rains County
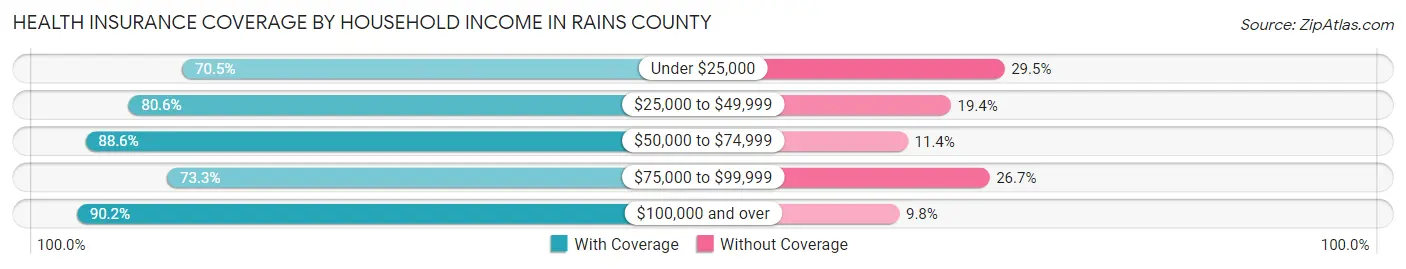
| Household Income | With Coverage | Without Coverage |
| Under $25,000 | 925 (70.5%) | 387 (29.5%) |
| $25,000 to $49,999 | 2,072 (80.6%) | 500 (19.4%) |
| $50,000 to $74,999 | 1,689 (88.6%) | 217 (11.4%) |
| $75,000 to $99,999 | 1,107 (73.3%) | 403 (26.7%) |
| $100,000 and over | 4,414 (90.2%) | 479 (9.8%) |
Public vs Private Health Insurance Coverage by Age in Rains County
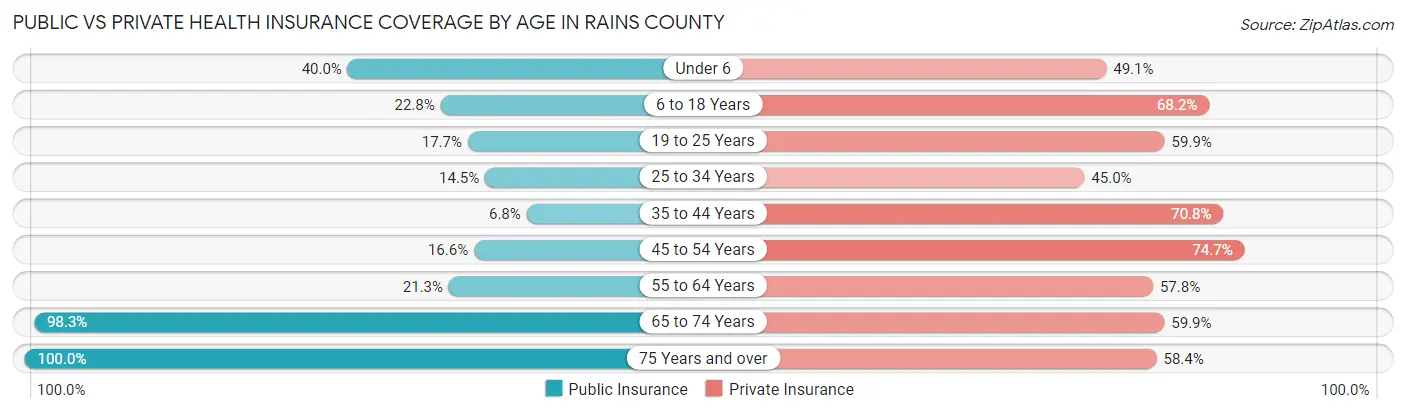
| Age Bracket | Public Insurance | Private Insurance |
| Under 6 | 265 (40.0%) | 325 (49.1%) |
| 6 to 18 Years | 427 (22.8%) | 1,277 (68.2%) |
| 19 to 25 Years | 108 (17.7%) | 365 (59.9%) |
| 25 to 34 Years | 149 (14.5%) | 462 (45.0%) |
| 35 to 44 Years | 99 (6.8%) | 1,028 (70.8%) |
| 45 to 54 Years | 237 (16.6%) | 1,068 (74.7%) |
| 55 to 64 Years | 471 (21.2%) | 1,280 (57.8%) |
| 65 to 74 Years | 1,802 (98.3%) | 1,098 (59.9%) |
| 75 Years and over | 1,092 (100.0%) | 638 (58.4%) |
| Total | 4,650 (38.1%) | 7,541 (61.9%) |
Disability Status by Sex by Age in Rains County
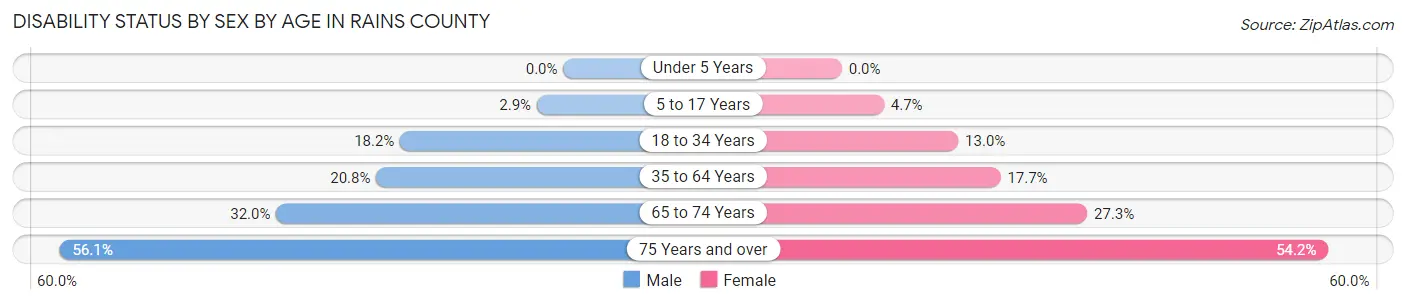
| Age Bracket | Male | Female |
| Under 5 Years | 0 (0.0%) | 0 (0.0%) |
| 5 to 17 Years | 32 (2.9%) | 34 (4.7%) |
| 18 to 34 Years | 163 (18.2%) | 119 (13.0%) |
| 35 to 64 Years | 504 (20.8%) | 473 (17.7%) |
| 65 to 74 Years | 282 (32.0%) | 260 (27.3%) |
| 75 Years and over | 303 (56.1%) | 299 (54.2%) |
Disability Class by Sex by Age in Rains County
Disability Class: Hearing Difficulty
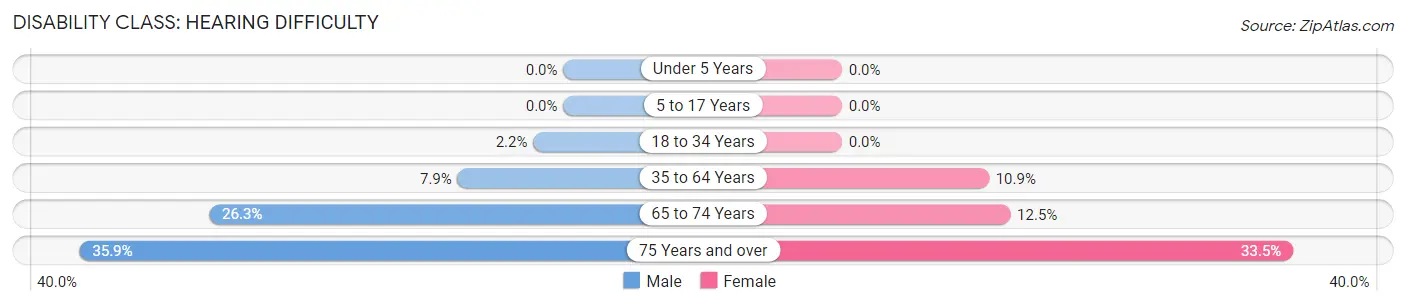
| Age Bracket | Male | Female |
| Under 5 Years | 0 (0.0%) | 0 (0.0%) |
| 5 to 17 Years | 0 (0.0%) | 0 (0.0%) |
| 18 to 34 Years | 20 (2.2%) | 0 (0.0%) |
| 35 to 64 Years | 190 (7.9%) | 292 (10.9%) |
| 65 to 74 Years | 232 (26.3%) | 119 (12.5%) |
| 75 Years and over | 194 (35.9%) | 185 (33.5%) |
Disability Class: Vision Difficulty
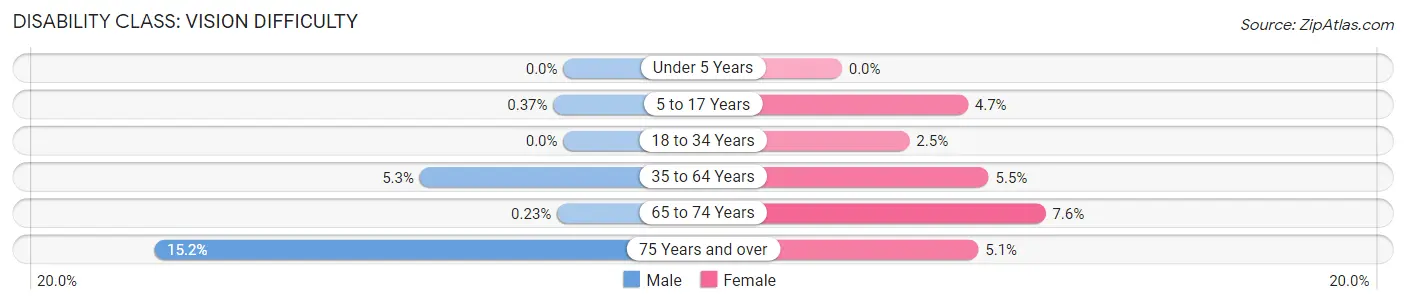
| Age Bracket | Male | Female |
| Under 5 Years | 0 (0.0%) | 0 (0.0%) |
| 5 to 17 Years | 4 (0.4%) | 34 (4.7%) |
| 18 to 34 Years | 0 (0.0%) | 23 (2.5%) |
| 35 to 64 Years | 129 (5.3%) | 146 (5.4%) |
| 65 to 74 Years | 2 (0.2%) | 72 (7.6%) |
| 75 Years and over | 82 (15.2%) | 28 (5.1%) |
Disability Class: Cognitive Difficulty
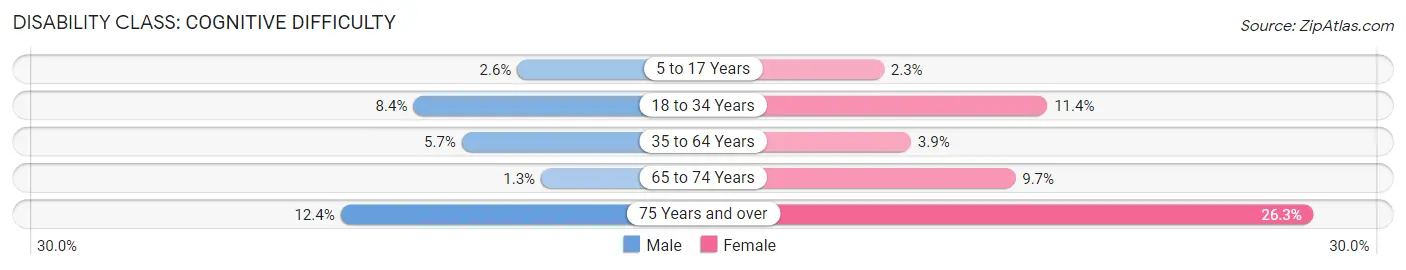
| Age Bracket | Male | Female |
| 5 to 17 Years | 28 (2.6%) | 17 (2.3%) |
| 18 to 34 Years | 75 (8.4%) | 105 (11.4%) |
| 35 to 64 Years | 137 (5.7%) | 103 (3.8%) |
| 65 to 74 Years | 11 (1.3%) | 92 (9.7%) |
| 75 Years and over | 67 (12.4%) | 145 (26.3%) |
Disability Class: Ambulatory Difficulty
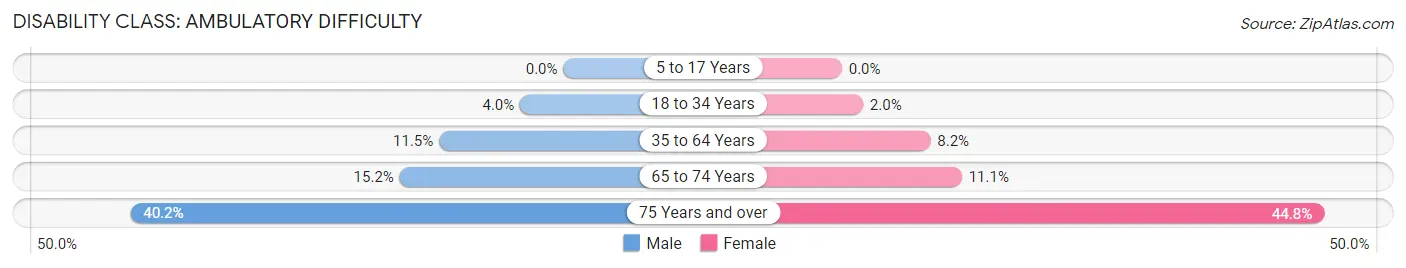
| Age Bracket | Male | Female |
| 5 to 17 Years | 0 (0.0%) | 0 (0.0%) |
| 18 to 34 Years | 36 (4.0%) | 18 (2.0%) |
| 35 to 64 Years | 279 (11.5%) | 220 (8.2%) |
| 65 to 74 Years | 134 (15.2%) | 106 (11.1%) |
| 75 Years and over | 217 (40.2%) | 247 (44.8%) |
Disability Class: Self-Care Difficulty
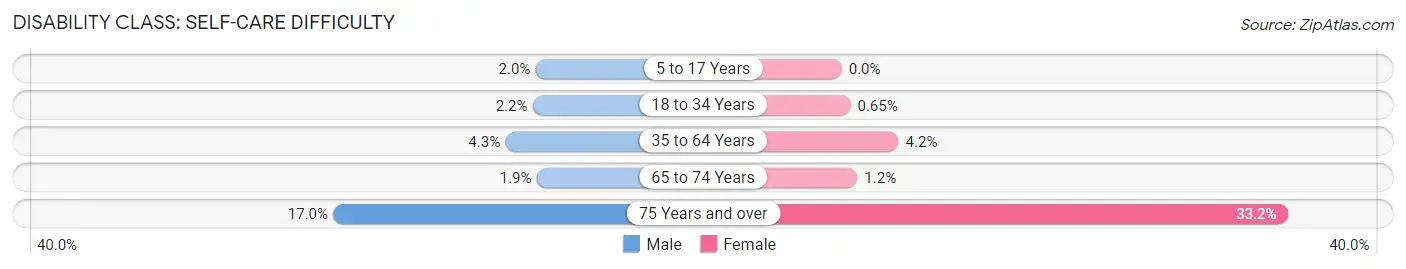
| Age Bracket | Male | Female |
| 5 to 17 Years | 22 (2.0%) | 0 (0.0%) |
| 18 to 34 Years | 20 (2.2%) | 6 (0.6%) |
| 35 to 64 Years | 103 (4.3%) | 113 (4.2%) |
| 65 to 74 Years | 17 (1.9%) | 11 (1.2%) |
| 75 Years and over | 92 (17.0%) | 183 (33.2%) |
Technology Access in Rains County
Computing Device Access in Rains County
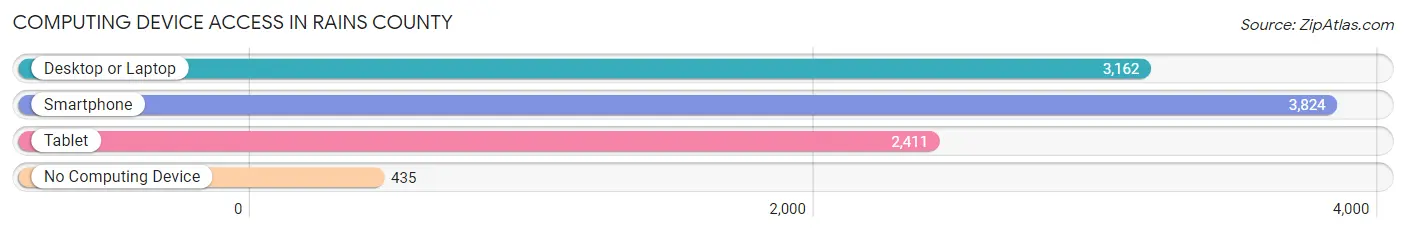
| Device Type | # Households | % Households |
| Desktop or Laptop | 3,162 | 67.1% |
| Smartphone | 3,824 | 81.2% |
| Tablet | 2,411 | 51.2% |
| No Computing Device | 435 | 9.2% |
| Total | 4,710 | 100.0% |
Internet Access in Rains County
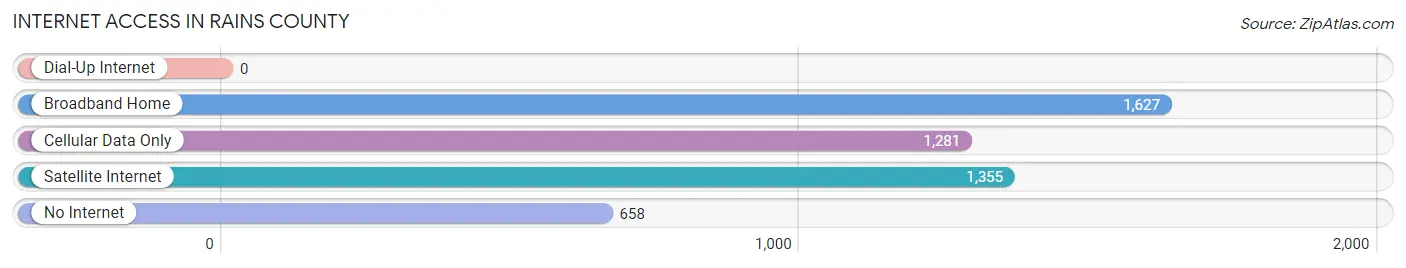
| Internet Type | # Households | % Households |
| Dial-Up Internet | 0 | 0.0% |
| Broadband Home | 1,627 | 34.5% |
| Cellular Data Only | 1,281 | 27.2% |
| Satellite Internet | 1,355 | 28.8% |
| No Internet | 658 | 14.0% |
| Total | 4,710 | 100.0% |
Rains County Summary
Rains County is located in the northeastern part of Texas, and is part of the Texoma region. It is bordered by Hunt County to the north, Van Zandt County to the east, Wood County to the south, and Hopkins County to the west. The county seat is Emory, and the largest city is Point. The county was named for Emory Rains, a state legislator and Confederate soldier.
Geography
Rains County covers an area of 545 square miles, of which 543 square miles is land and 2 square miles is water. The terrain is mostly flat, with some rolling hills in the western part of the county. The county is drained by the Sabine River, which forms the northern and eastern boundaries. The county is part of the Blackland Prairie region, and is mostly covered in grasslands and woodlands.
The climate is humid subtropical, with hot summers and mild winters. The average annual temperature is 68°F, and the average annual precipitation is 39 inches.
Demographics
As of the 2010 census, the population of Rains County was 10,914. The racial makeup of the county was 90.3% White, 4.3% Black or African American, 0.7% Native American, 0.3% Asian, 2.7% from other races, and 1.1% from two or more races. Hispanic or Latino of any race were 5.3% of the population.
The median household income was $41,945, and the median family income was $48,945. The per capita income was $20,845. About 11.3% of the population was below the poverty line.
Economy
The economy of Rains County is largely based on agriculture and timber. The county is home to several large farms, and the timber industry is a major employer. Other industries include manufacturing, retail, and tourism.
The county is home to several large employers, including the Rains County Electric Cooperative, the Rains County Independent School District, and the Rains County Memorial Hospital.
History
Rains County was established in 1870, and was named for Emory Rains, a state legislator and Confederate soldier. The county seat was originally located in the town of Emory, which was named for Emory Rains.
The county was largely rural until the early 20th century, when the timber industry began to grow. The timber industry was a major employer in the county until the late 20th century, when it began to decline.
In the late 20th century, the county began to diversify its economy, and the population began to grow. The county is now home to several large employers, and the population has grown steadily since the 2000 census.
Common Questions
What is Per Capita Income in Rains County?
Per Capita income in Rains County is $36,069.
What is the Median Family Income in Rains County?
Median Family Income in Rains County is $80,391.
What is the Median Household income in Rains County?
Median Household Income in Rains County is $60,291.
What is Income or Wage Gap in Rains County?
Income or Wage Gap in Rains County is 43.0%.
Women in Rains County earn 57.0 cents for every dollar earned by a man.
What is Inequality or Gini Index in Rains County?
Inequality or Gini Index in Rains County is 0.48.
What is the Total Population of Rains County?
Total Population of Rains County is 12,257.
What is the Total Male Population of Rains County?
Total Male Population of Rains County is 6,127.
What is the Total Female Population of Rains County?
Total Female Population of Rains County is 6,130.
What is the Ratio of Males per 100 Females in Rains County?
There are 99.95 Males per 100 Females in Rains County.
What is the Ratio of Females per 100 Males in Rains County?
There are 100.05 Females per 100 Males in Rains County.
What is the Median Population Age in Rains County?
Median Population Age in Rains County is 47.6 Years.
What is the Average Family Size in Rains County
Average Family Size in Rains County is 3.1 People.
What is the Average Household Size in Rains County
Average Household Size in Rains County is 2.6 People.
How Large is the Labor Force in Rains County?
There are 5,262 People in the Labor Forcein in Rains County.
What is the Percentage of People in the Labor Force in Rains County?
51.8% of People are in the Labor Force in Rains County.
What is the Unemployment Rate in Rains County?
Unemployment Rate in Rains County is 2.3%.