Potter County, TX Map & Demographics
Potter County Map
Potter County Overview
$26,406
PER CAPITA INCOME
$60,157
AVG FAMILY INCOME
$47,974
AVG HOUSEHOLD INCOME
24.7%
WAGE / INCOME GAP [ % ]
75.3¢/ $1
WAGE / INCOME GAP [ $ ]
$10,774
FAMILY INCOME DEFICIT
0.49
INEQUALITY / GINI INDEX
117,905
TOTAL POPULATION
60,843
MALE POPULATION
57,062
FEMALE POPULATION
106.63
MALES / 100 FEMALES
93.79
FEMALES / 100 MALES
34.5
MEDIAN AGE
3.4
AVG FAMILY SIZE
2.6
AVG HOUSEHOLD SIZE
52,044
LABOR FORCE [ PEOPLE ]
58.0%
PERCENT IN LABOR FORCE
3.7%
UNEMPLOYMENT RATE
Potter County Area Codes
Income in Potter County
Income Overview in Potter County
Per Capita Income in Potter County is $26,406, while median incomes of families and households are $60,157 and $47,974 respectively.
| Characteristic | Number | Measure |
| Per Capita Income | 117,905 | $26,406 |
| Median Family Income | 26,778 | $60,157 |
| Mean Family Income | 26,778 | $83,297 |
| Median Household Income | 42,824 | $47,974 |
| Mean Household Income | 42,824 | $70,497 |
| Income Deficit | 26,778 | $10,774 |
| Wage / Income Gap (%) | 117,905 | 24.73% |
| Wage / Income Gap ($) | 117,905 | 75.27¢ per $1 |
| Gini / Inequality Index | 117,905 | 0.49 |
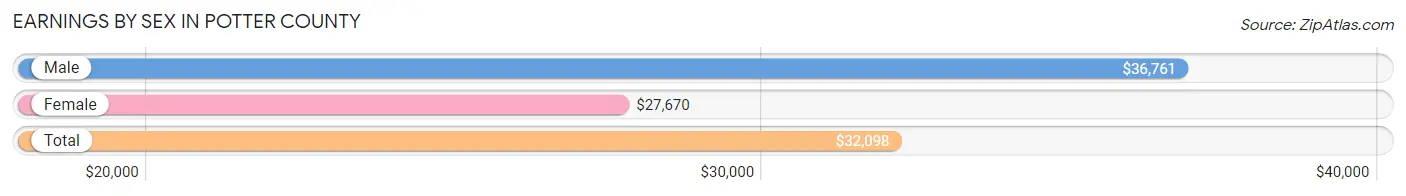
Earnings by Sex in Potter County
Average Earnings in Potter County are $32,098, $36,761 for men and $27,670 for women, a difference of 24.7%.
| Sex | Number | Average Earnings |
| Male | 28,917 (53.7%) | $36,761 |
| Female | 24,940 (46.3%) | $27,670 |
| Total | 53,857 (100.0%) | $32,098 |
Earnings by Sex by Income Bracket in Potter County
The most common earnings brackets in Potter County are $100,000+ for men (3,195 | 11.1%) and $25,000 to $29,999 for women (2,573 | 10.3%).
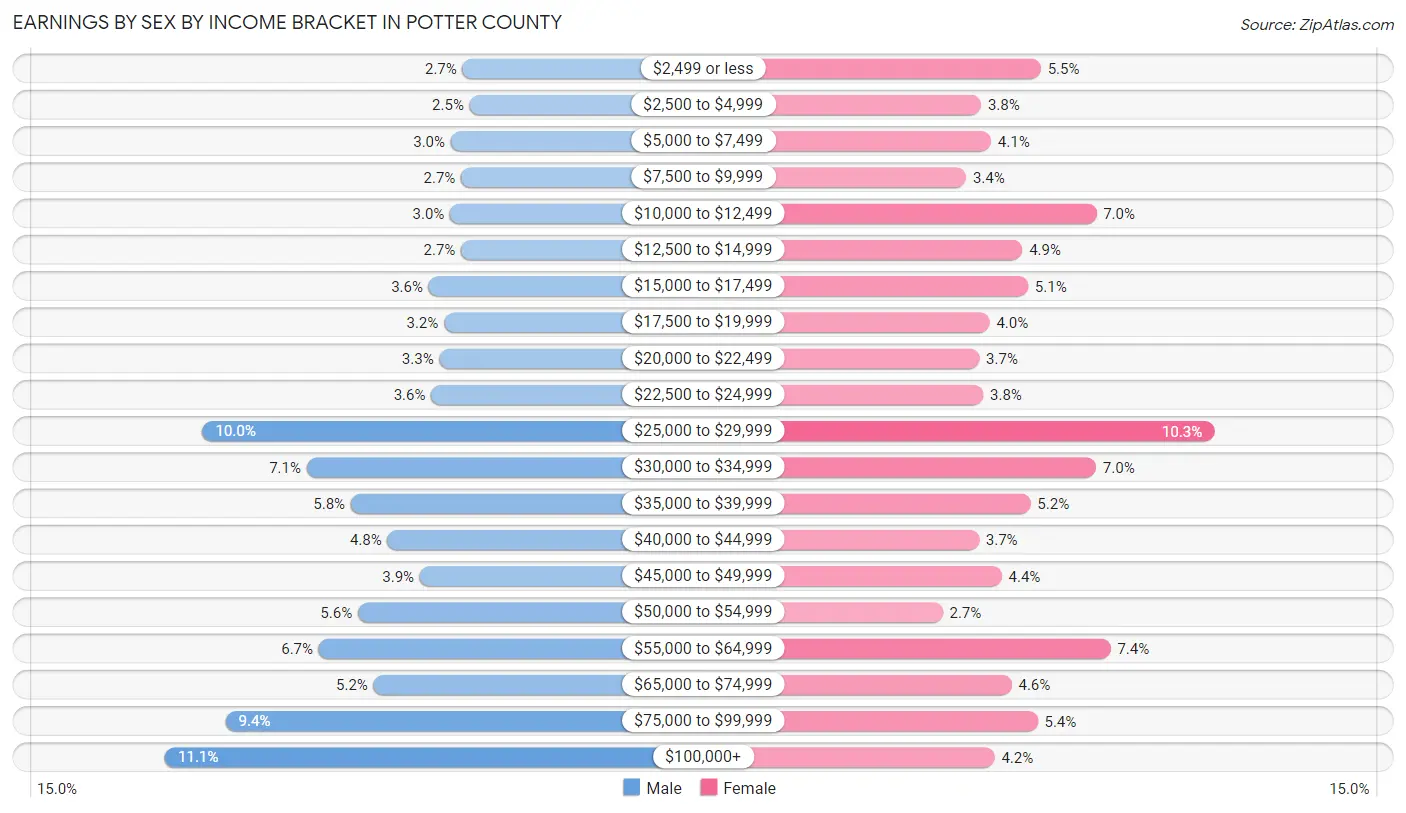
| Income | Male | Female |
| $2,499 or less | 778 (2.7%) | 1,360 (5.4%) |
| $2,500 to $4,999 | 721 (2.5%) | 941 (3.8%) |
| $5,000 to $7,499 | 873 (3.0%) | 1,010 (4.1%) |
| $7,500 to $9,999 | 789 (2.7%) | 835 (3.4%) |
| $10,000 to $12,499 | 880 (3.0%) | 1,748 (7.0%) |
| $12,500 to $14,999 | 789 (2.7%) | 1,230 (4.9%) |
| $15,000 to $17,499 | 1,054 (3.6%) | 1,269 (5.1%) |
| $17,500 to $19,999 | 928 (3.2%) | 1,001 (4.0%) |
| $20,000 to $22,499 | 966 (3.3%) | 929 (3.7%) |
| $22,500 to $24,999 | 1,032 (3.6%) | 955 (3.8%) |
| $25,000 to $29,999 | 2,893 (10.0%) | 2,573 (10.3%) |
| $30,000 to $34,999 | 2,044 (7.1%) | 1,747 (7.0%) |
| $35,000 to $39,999 | 1,685 (5.8%) | 1,287 (5.2%) |
| $40,000 to $44,999 | 1,388 (4.8%) | 925 (3.7%) |
| $45,000 to $49,999 | 1,126 (3.9%) | 1,086 (4.3%) |
| $50,000 to $54,999 | 1,627 (5.6%) | 670 (2.7%) |
| $55,000 to $64,999 | 1,945 (6.7%) | 1,847 (7.4%) |
| $65,000 to $74,999 | 1,501 (5.2%) | 1,155 (4.6%) |
| $75,000 to $99,999 | 2,703 (9.3%) | 1,337 (5.4%) |
| $100,000+ | 3,195 (11.1%) | 1,035 (4.2%) |
| Total | 28,917 (100.0%) | 24,940 (100.0%) |
Earnings by Sex by Educational Attainment in Potter County
Average earnings in Potter County are $43,112 for men and $30,228 for women, a difference of 29.9%. Men with an educational attainment of graduate degree enjoy the highest average annual earnings of $101,563, while those with less than high school education earn the least with $33,642. Women with an educational attainment of graduate degree earn the most with the average annual earnings of $68,069, while those with less than high school education have the smallest earnings of $22,603.
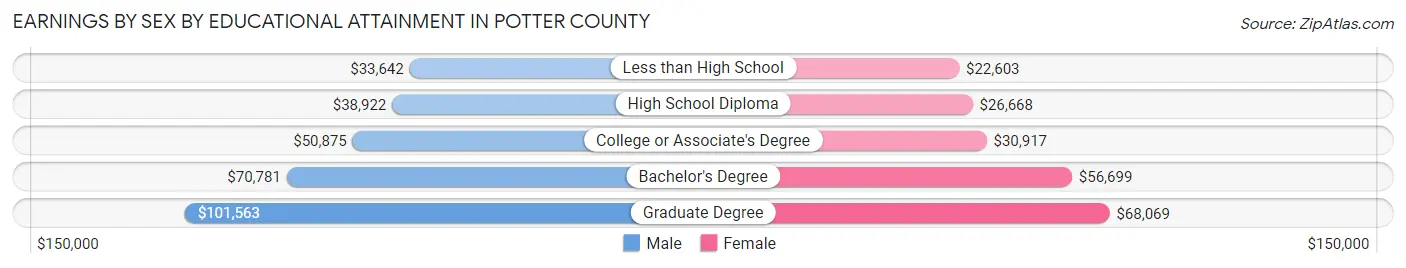
| Educational Attainment | Male Income | Female Income |
| Less than High School | $33,642 | $22,603 |
| High School Diploma | $38,922 | $26,668 |
| College or Associate's Degree | $50,875 | $30,917 |
| Bachelor's Degree | $70,781 | $56,699 |
| Graduate Degree | $101,563 | $68,069 |
| Total | $43,112 | $30,228 |
Family Income in Potter County
Family Income Brackets in Potter County
According to the Potter County family income data, there are 4,633 families falling into the $50,000 to $74,999 income range, which is the most common income bracket and makes up 17.3% of all families. Conversely, the $10,000 to $14,999 income bracket is the least frequent group with only 777 families (2.9%) belonging to this category.
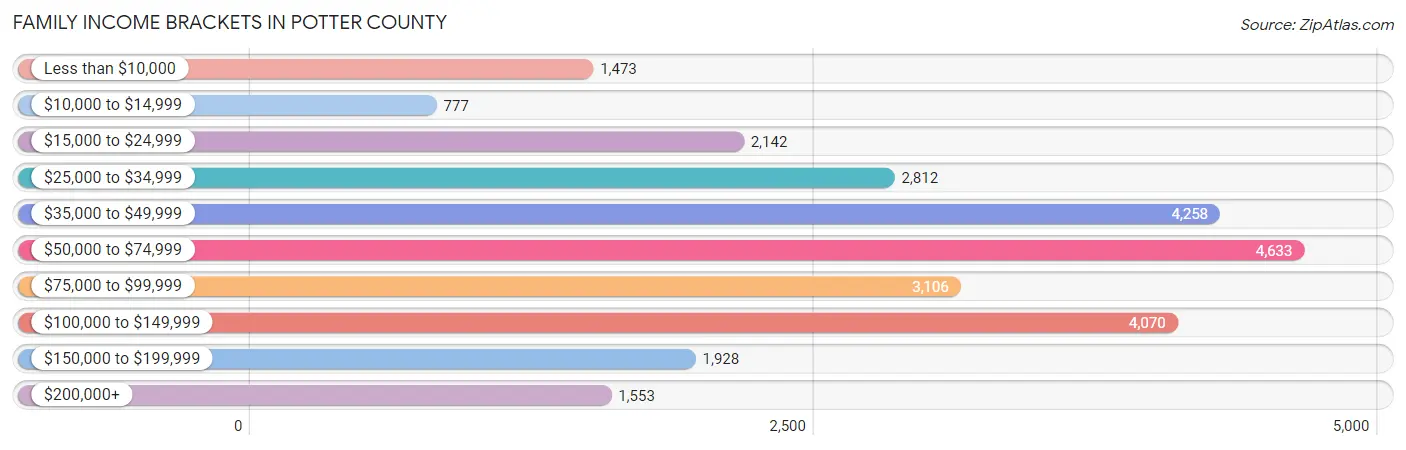
| Income Bracket | # Families | % Families |
| Less than $10,000 | 1,473 | 5.5% |
| $10,000 to $14,999 | 777 | 2.9% |
| $15,000 to $24,999 | 2,142 | 8.0% |
| $25,000 to $34,999 | 2,812 | 10.5% |
| $35,000 to $49,999 | 4,258 | 15.9% |
| $50,000 to $74,999 | 4,633 | 17.3% |
| $75,000 to $99,999 | 3,106 | 11.6% |
| $100,000 to $149,999 | 4,070 | 15.2% |
| $150,000 to $199,999 | 1,928 | 7.2% |
| $200,000+ | 1,553 | 5.8% |
Family Income by Famaliy Size in Potter County
6-person families (1,096 | 4.1%) account for the highest median family income in Potter County with $72,121 per family, while 2-person families (11,539 | 43.1%) have the highest median income of $26,958 per family member.
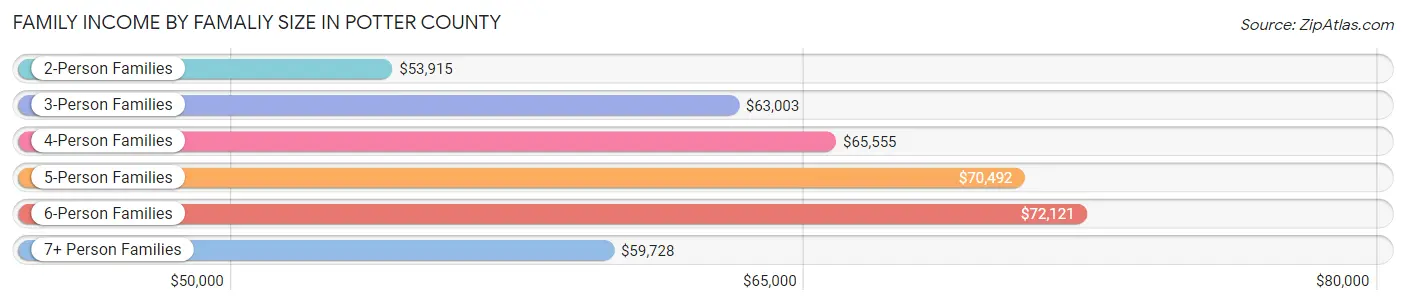
| Income Bracket | # Families | Median Income |
| 2-Person Families | 11,539 (43.1%) | $53,915 |
| 3-Person Families | 5,947 (22.2%) | $63,003 |
| 4-Person Families | 4,823 (18.0%) | $65,555 |
| 5-Person Families | 2,758 (10.3%) | $70,492 |
| 6-Person Families | 1,096 (4.1%) | $72,121 |
| 7+ Person Families | 615 (2.3%) | $59,728 |
| Total | 26,778 (100.0%) | $60,157 |
Family Income by Number of Earners in Potter County
The median family income in Potter County is $60,157, with families comprising 3+ earners (2,623) having the highest median family income of $110,756, while families with no earners (3,502) have the lowest median family income of $25,229, accounting for 9.8% and 13.1% of families, respectively.
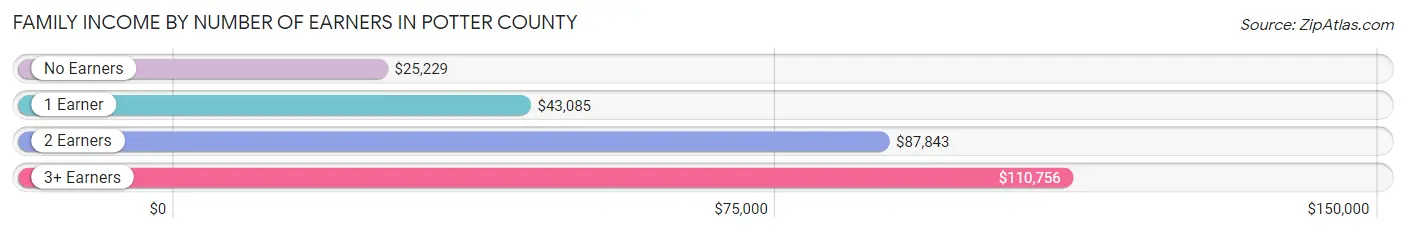
| Number of Earners | # Families | Median Income |
| No Earners | 3,502 (13.1%) | $25,229 |
| 1 Earner | 10,878 (40.6%) | $43,085 |
| 2 Earners | 9,775 (36.5%) | $87,843 |
| 3+ Earners | 2,623 (9.8%) | $110,756 |
| Total | 26,778 (100.0%) | $60,157 |
Household Income in Potter County
Household Income Brackets in Potter County
With 6,937 households falling in the category, the $50,000 to $74,999 income range is the most frequent in Potter County, accounting for 16.2% of all households. In contrast, only 1,756 households (4.1%) fall into the $200,000+ income bracket, making it the least populous group.
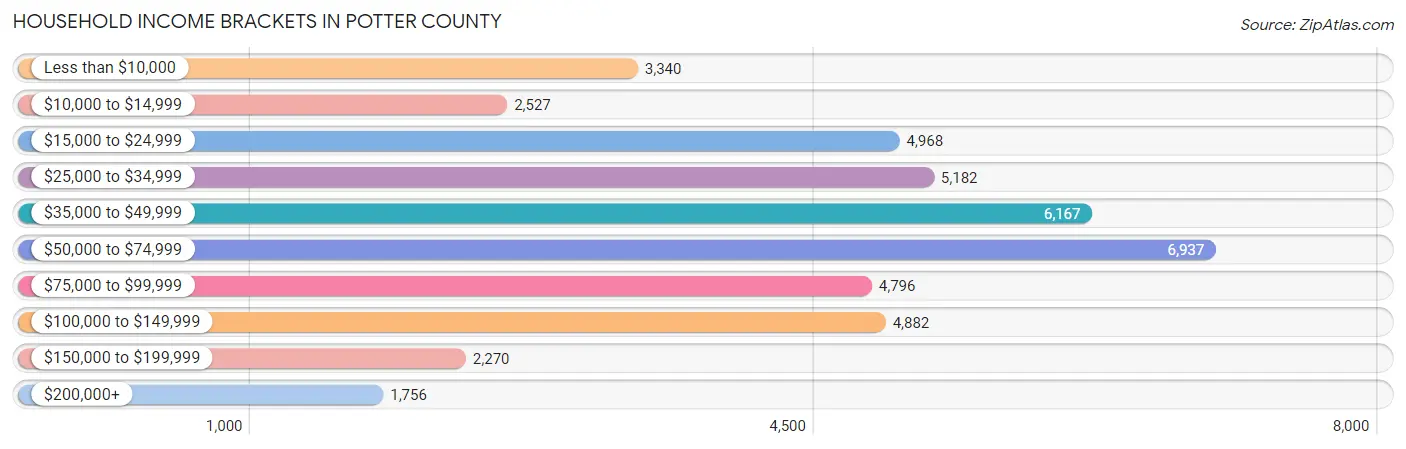
| Income Bracket | # Households | % Households |
| Less than $10,000 | 3,340 | 7.8% |
| $10,000 to $14,999 | 2,527 | 5.9% |
| $15,000 to $24,999 | 4,968 | 11.6% |
| $25,000 to $34,999 | 5,182 | 12.1% |
| $35,000 to $49,999 | 6,167 | 14.4% |
| $50,000 to $74,999 | 6,937 | 16.2% |
| $75,000 to $99,999 | 4,796 | 11.2% |
| $100,000 to $149,999 | 4,882 | 11.4% |
| $150,000 to $199,999 | 2,270 | 5.3% |
| $200,000+ | 1,756 | 4.1% |
Household Income by Householder Age in Potter County
The median household income in Potter County is $47,974, with the highest median household income of $58,329 found in the 25 to 44 years age bracket for the primary householder. A total of 14,771 households (34.5%) fall into this category. Meanwhile, the 15 to 24 years age bracket for the primary householder has the lowest median household income of $35,152, with 3,638 households (8.5%) in this group.
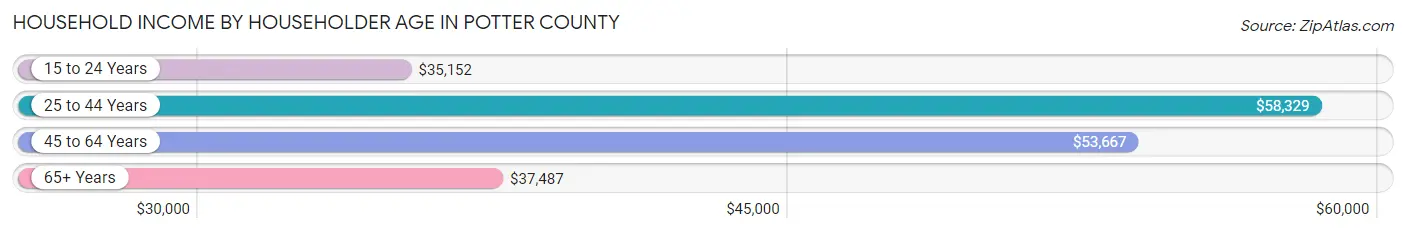
| Income Bracket | # Households | Median Income |
| 15 to 24 Years | 3,638 (8.5%) | $35,152 |
| 25 to 44 Years | 14,771 (34.5%) | $58,329 |
| 45 to 64 Years | 14,222 (33.2%) | $53,667 |
| 65+ Years | 10,193 (23.8%) | $37,487 |
| Total | 42,824 (100.0%) | $47,974 |
Poverty in Potter County
Income Below Poverty by Sex and Age in Potter County
With 19.6% poverty level for males and 21.8% for females among the residents of Potter County, 12 to 14 year old males and under 5 year old females are the most vulnerable to poverty, with 1,112 males (37.1%) and 1,133 females (29.0%) in their respective age groups living below the poverty level.
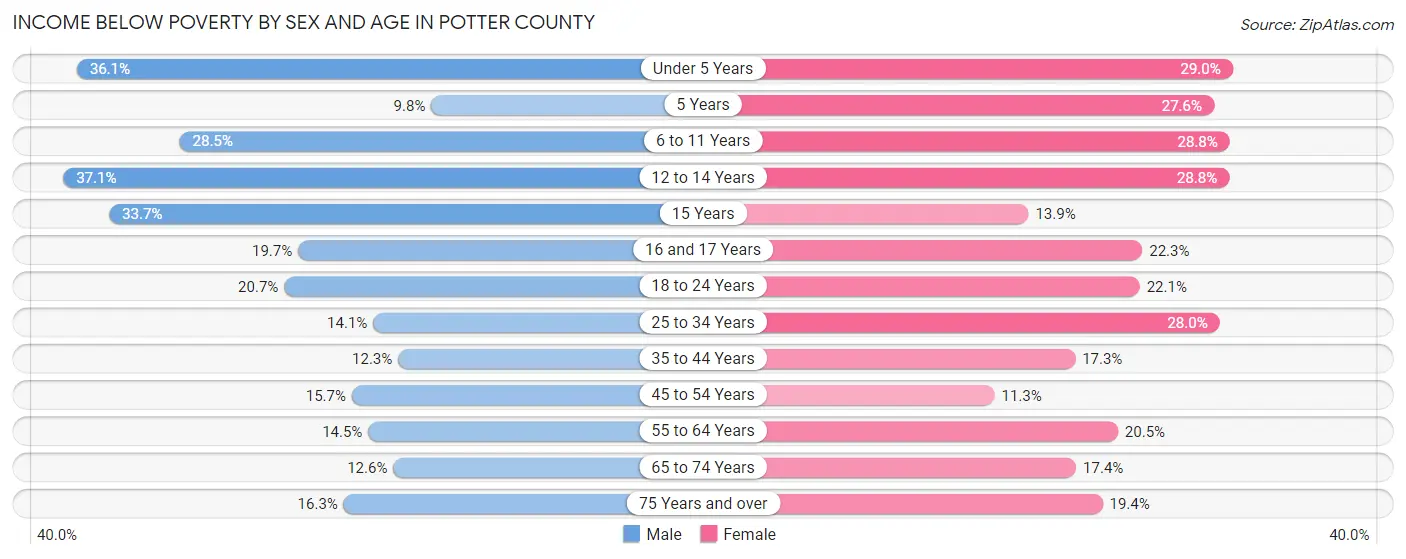
| Age Bracket | Male | Female |
| Under 5 Years | 1,518 (36.1%) | 1,133 (29.0%) |
| 5 Years | 61 (9.8%) | 287 (27.6%) |
| 6 to 11 Years | 1,616 (28.5%) | 1,435 (28.8%) |
| 12 to 14 Years | 1,112 (37.1%) | 825 (28.7%) |
| 15 Years | 265 (33.7%) | 122 (13.9%) |
| 16 and 17 Years | 359 (19.7%) | 386 (22.3%) |
| 18 to 24 Years | 1,149 (20.7%) | 1,179 (22.1%) |
| 25 to 34 Years | 1,123 (14.1%) | 2,191 (28.0%) |
| 35 to 44 Years | 878 (12.3%) | 1,212 (17.3%) |
| 45 to 54 Years | 934 (15.7%) | 695 (11.3%) |
| 55 to 64 Years | 822 (14.5%) | 1,298 (20.5%) |
| 65 to 74 Years | 518 (12.6%) | 821 (17.4%) |
| 75 Years and over | 393 (16.3%) | 697 (19.4%) |
| Total | 10,748 (19.6%) | 12,281 (21.8%) |
Income Above Poverty by Sex and Age in Potter County
According to the poverty statistics in Potter County, males aged 5 years and females aged 45 to 54 years are the age groups that are most secure financially, with 90.2% of males and 88.7% of females in these age groups living above the poverty line.
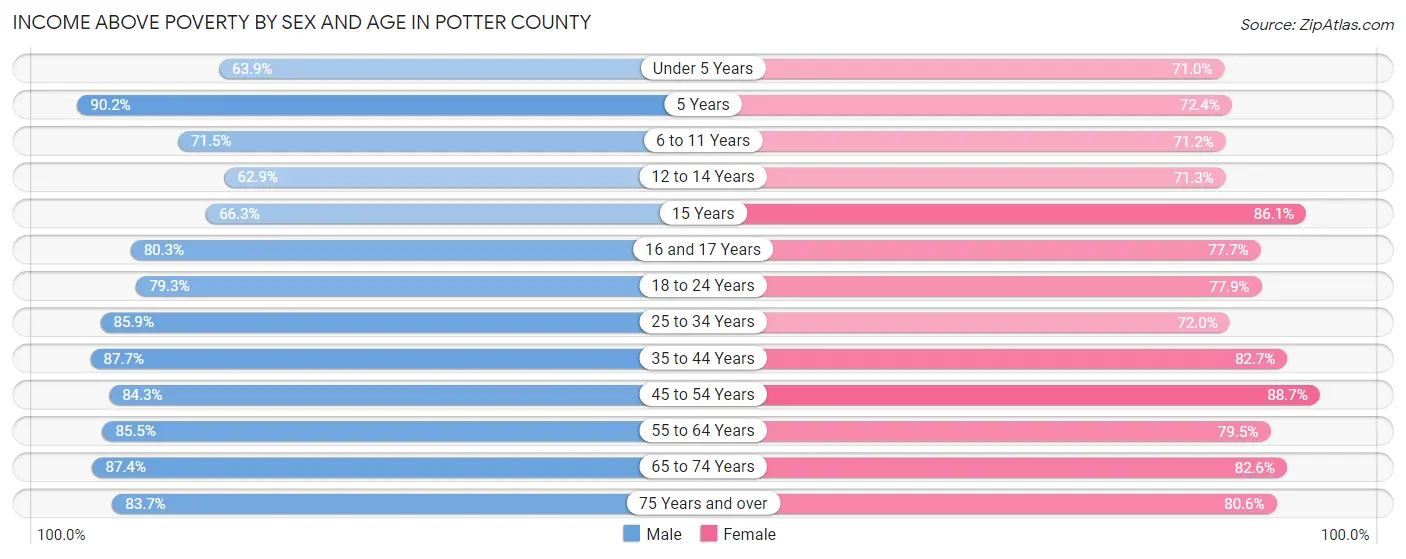
| Age Bracket | Male | Female |
| Under 5 Years | 2,685 (63.9%) | 2,772 (71.0%) |
| 5 Years | 561 (90.2%) | 752 (72.4%) |
| 6 to 11 Years | 4,057 (71.5%) | 3,550 (71.2%) |
| 12 to 14 Years | 1,883 (62.9%) | 2,045 (71.3%) |
| 15 Years | 521 (66.3%) | 758 (86.1%) |
| 16 and 17 Years | 1,463 (80.3%) | 1,344 (77.7%) |
| 18 to 24 Years | 4,394 (79.3%) | 4,151 (77.9%) |
| 25 to 34 Years | 6,830 (85.9%) | 5,623 (72.0%) |
| 35 to 44 Years | 6,280 (87.7%) | 5,783 (82.7%) |
| 45 to 54 Years | 5,011 (84.3%) | 5,432 (88.7%) |
| 55 to 64 Years | 4,852 (85.5%) | 5,033 (79.5%) |
| 65 to 74 Years | 3,582 (87.4%) | 3,897 (82.6%) |
| 75 Years and over | 2,016 (83.7%) | 2,904 (80.6%) |
| Total | 44,135 (80.4%) | 44,044 (78.2%) |
Income Below Poverty Among Married-Couple Families in Potter County
The poverty statistics for married-couple families in Potter County show that 8.8% or 1,514 of the total 17,284 families live below the poverty line. Families with 5 or more children have the highest poverty rate of 64.9%, comprising of 113 families. On the other hand, families with no children have the lowest poverty rate of 5.9%, which includes 519 families.
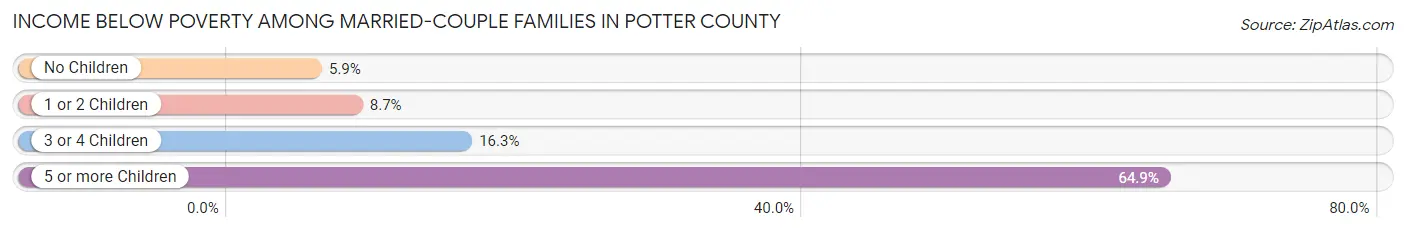
| Children | Above Poverty | Below Poverty |
| No Children | 8,347 (94.2%) | 519 (5.9%) |
| 1 or 2 Children | 5,546 (91.3%) | 528 (8.7%) |
| 3 or 4 Children | 1,816 (83.7%) | 354 (16.3%) |
| 5 or more Children | 61 (35.1%) | 113 (64.9%) |
| Total | 15,770 (91.2%) | 1,514 (8.8%) |
Income Below Poverty Among Single-Parent Households in Potter County
According to the poverty data in Potter County, 21.0% or 625 single-father households and 35.5% or 2,313 single-mother households are living below the poverty line. Among single-father households, those with 5 or more children have the highest poverty rate, with 12 households (75.0%) experiencing poverty. Likewise, among single-mother households, those with 5 or more children have the highest poverty rate, with 175 households (100.0%) falling below the poverty line.
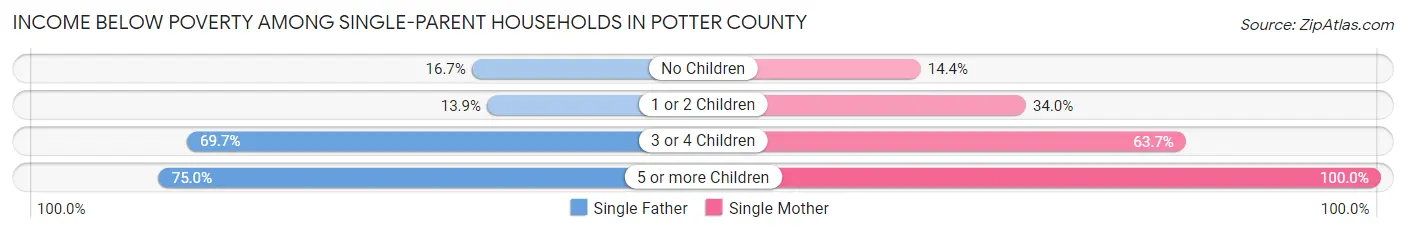
| Children | Single Father | Single Mother |
| No Children | 188 (16.7%) | 294 (14.4%) |
| 1 or 2 Children | 213 (13.9%) | 1,023 (34.0%) |
| 3 or 4 Children | 212 (69.7%) | 821 (63.7%) |
| 5 or more Children | 12 (75.0%) | 175 (100.0%) |
| Total | 625 (21.0%) | 2,313 (35.5%) |
Income Below Poverty Among Married-Couple vs Single-Parent Households in Potter County
The poverty data for Potter County shows that 1,514 of the married-couple family households (8.8%) and 2,938 of the single-parent households (30.9%) are living below the poverty level. Within the married-couple family households, those with 5 or more children have the highest poverty rate, with 113 households (64.9%) falling below the poverty line. Among the single-parent households, those with 5 or more children have the highest poverty rate, with 187 household (97.9%) living below poverty.
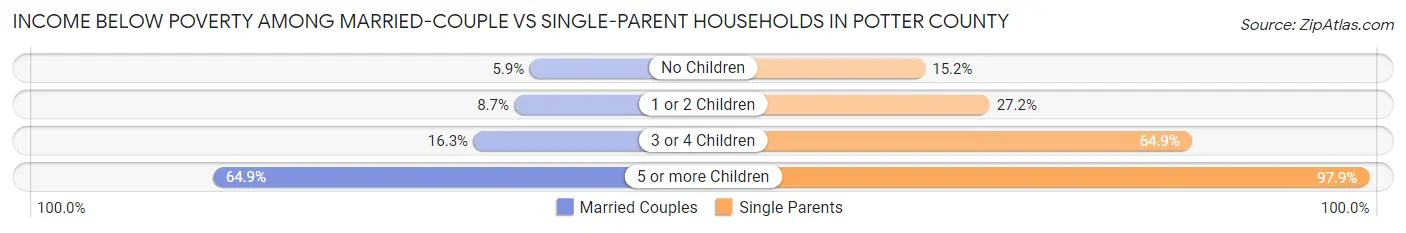
| Children | Married-Couple Families | Single-Parent Households |
| No Children | 519 (5.9%) | 482 (15.2%) |
| 1 or 2 Children | 528 (8.7%) | 1,236 (27.2%) |
| 3 or 4 Children | 354 (16.3%) | 1,033 (64.8%) |
| 5 or more Children | 113 (64.9%) | 187 (97.9%) |
| Total | 1,514 (8.8%) | 2,938 (30.9%) |
Race in Potter County
The most populous races in Potter County are White / Caucasian (79,258 | 67.2%), Hispanic or Latino (46,658 | 39.6%), and Two or more Races (14,383 | 12.2%).
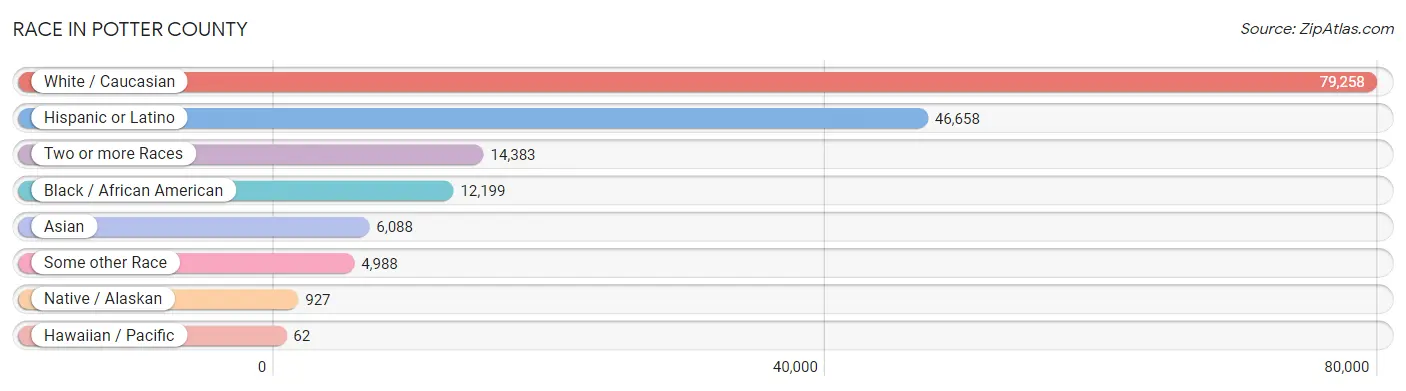
| Race | # Population | % Population |
| Asian | 6,088 | 5.2% |
| Black / African American | 12,199 | 10.3% |
| Hawaiian / Pacific | 62 | 0.1% |
| Hispanic or Latino | 46,658 | 39.6% |
| Native / Alaskan | 927 | 0.8% |
| White / Caucasian | 79,258 | 67.2% |
| Two or more Races | 14,383 | 12.2% |
| Some other Race | 4,988 | 4.2% |
| Total | 117,905 | 100.0% |
Ancestry in Potter County
The most populous ancestries reported in Potter County are Mexican (41,877 | 35.5%), German (8,673 | 7.4%), English (8,116 | 6.9%), Irish (7,621 | 6.5%), and American (5,574 | 4.7%), together accounting for 61.0% of all Potter County residents.
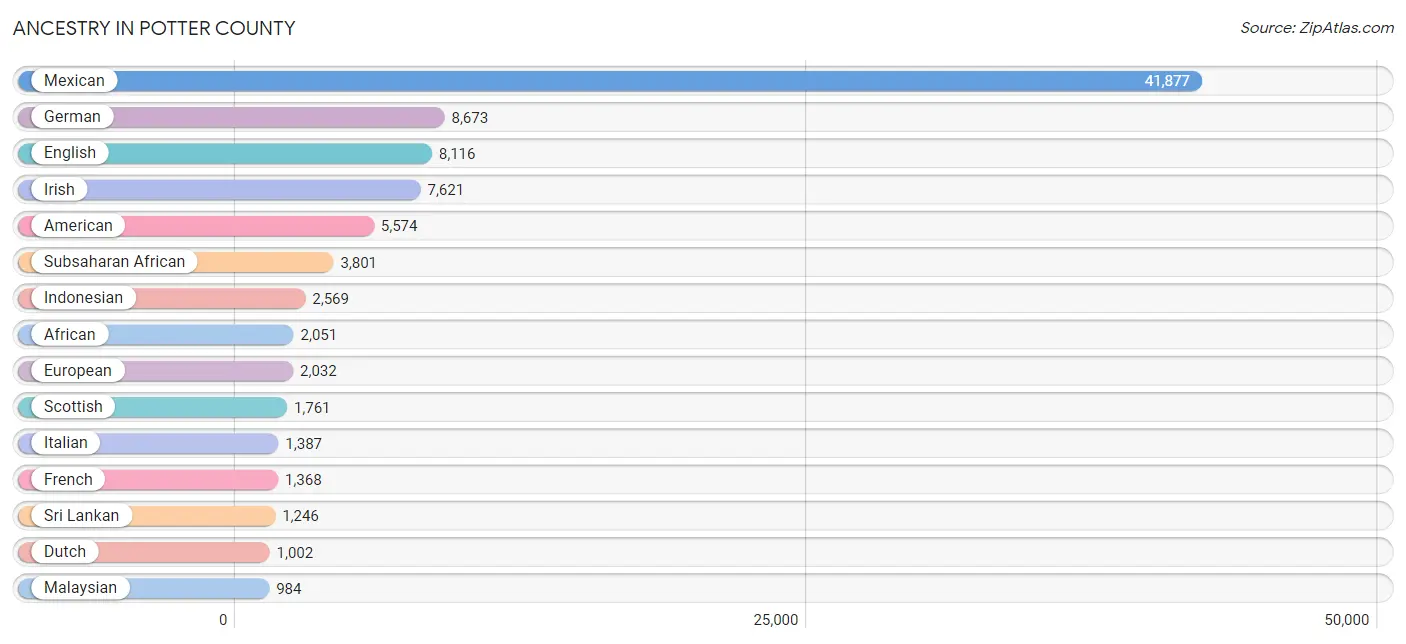
| Ancestry | # Population | % Population |
| African | 2,051 | 1.7% |
| American | 5,574 | 4.7% |
| Apache | 88 | 0.1% |
| Arab | 151 | 0.1% |
| Argentinean | 13 | 0.0% |
| Armenian | 64 | 0.1% |
| Austrian | 162 | 0.1% |
| Belgian | 6 | 0.0% |
| Bermudan | 7 | 0.0% |
| Bhutanese | 62 | 0.1% |
| Blackfeet | 59 | 0.1% |
| Brazilian | 1 | 0.0% |
| British | 398 | 0.3% |
| British West Indian | 26 | 0.0% |
| Bulgarian | 21 | 0.0% |
| Burmese | 71 | 0.1% |
| Cajun | 20 | 0.0% |
| Canadian | 29 | 0.0% |
| Celtic | 40 | 0.0% |
| Central American | 768 | 0.6% |
| Central American Indian | 10 | 0.0% |
| Cherokee | 546 | 0.5% |
| Chickasaw | 41 | 0.0% |
| Choctaw | 210 | 0.2% |
| Colombian | 91 | 0.1% |
| Comanche | 10 | 0.0% |
| Cree | 13 | 0.0% |
| Creek | 14 | 0.0% |
| Croatian | 52 | 0.0% |
| Crow | 23 | 0.0% |
| Cuban | 289 | 0.3% |
| Czech | 142 | 0.1% |
| Danish | 17 | 0.0% |
| Delaware | 4 | 0.0% |
| Dominican | 52 | 0.0% |
| Dutch | 1,002 | 0.9% |
| Dutch West Indian | 95 | 0.1% |
| Eastern European | 147 | 0.1% |
| Ecuadorian | 30 | 0.0% |
| Egyptian | 12 | 0.0% |
| English | 8,116 | 6.9% |
| Ethiopian | 101 | 0.1% |
| European | 2,032 | 1.7% |
| Finnish | 7 | 0.0% |
| French | 1,368 | 1.2% |
| French American Indian | 5 | 0.0% |
| French Canadian | 183 | 0.2% |
| German | 8,673 | 7.4% |
| Ghanaian | 35 | 0.0% |
| Greek | 48 | 0.0% |
| Guamanian / Chamorro | 17 | 0.0% |
| Guatemalan | 205 | 0.2% |
| Haitian | 35 | 0.0% |
| Honduran | 219 | 0.2% |
| Hungarian | 112 | 0.1% |
| Indian (Asian) | 132 | 0.1% |
| Indonesian | 2,569 | 2.2% |
| Iranian | 19 | 0.0% |
| Iraqi | 19 | 0.0% |
| Irish | 7,621 | 6.5% |
| Iroquois | 21 | 0.0% |
| Italian | 1,387 | 1.2% |
| Jamaican | 101 | 0.1% |
| Japanese | 20 | 0.0% |
| Korean | 169 | 0.1% |
| Lebanese | 72 | 0.1% |
| Lithuanian | 13 | 0.0% |
| Malaysian | 984 | 0.8% |
| Mexican | 41,877 | 35.5% |
| Mexican American Indian | 150 | 0.1% |
| Native Hawaiian | 42 | 0.0% |
| Navajo | 358 | 0.3% |
| Nicaraguan | 30 | 0.0% |
| Nigerian | 22 | 0.0% |
| Northern European | 43 | 0.0% |
| Norwegian | 702 | 0.6% |
| Pakistani | 412 | 0.4% |
| Panamanian | 12 | 0.0% |
| Pennsylvania German | 39 | 0.0% |
| Peruvian | 53 | 0.0% |
| Polish | 750 | 0.6% |
| Portuguese | 14 | 0.0% |
| Puerto Rican | 273 | 0.2% |
| Romanian | 10 | 0.0% |
| Russian | 98 | 0.1% |
| Salvadoran | 302 | 0.3% |
| Samoan | 7 | 0.0% |
| Scandinavian | 176 | 0.2% |
| Scotch-Irish | 811 | 0.7% |
| Scottish | 1,761 | 1.5% |
| Seminole | 3 | 0.0% |
| Sioux | 16 | 0.0% |
| Slavic | 7 | 0.0% |
| Somali | 319 | 0.3% |
| South American | 212 | 0.2% |
| Spaniard | 585 | 0.5% |
| Spanish | 730 | 0.6% |
| Spanish American | 23 | 0.0% |
| Sri Lankan | 1,246 | 1.1% |
| Subsaharan African | 3,801 | 3.2% |
| Sudanese | 418 | 0.4% |
| Swedish | 354 | 0.3% |
| Swiss | 175 | 0.2% |
| Thai | 432 | 0.4% |
| Tlingit-Haida | 16 | 0.0% |
| Tongan | 25 | 0.0% |
| Turkish | 69 | 0.1% |
| Ugandan | 21 | 0.0% |
| Ukrainian | 13 | 0.0% |
| Venezuelan | 25 | 0.0% |
| Welsh | 247 | 0.2% |
| West Indian | 13 | 0.0% |
| Yugoslavian | 17 | 0.0% |
| Yup'ik | 3 | 0.0% | View All 114 Rows |
Immigrants in Potter County
The most numerous immigrant groups reported in Potter County came from Latin America (11,307 | 9.6%), Central America (10,949 | 9.3%), Mexico (10,162 | 8.6%), Asia (3,968 | 3.4%), and South Eastern Asia (3,454 | 2.9%), together accounting for 33.8% of all Potter County residents.
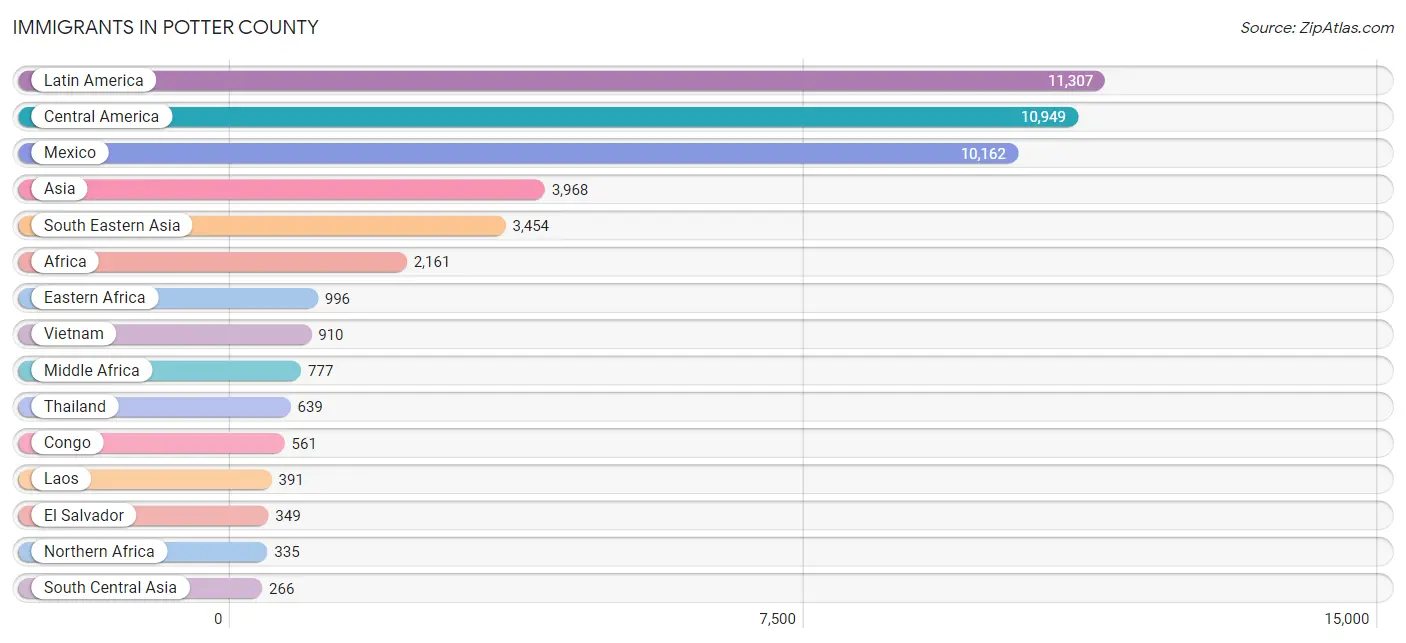
| Immigration Origin | # Population | % Population |
| Africa | 2,161 | 1.8% |
| Asia | 3,968 | 3.4% |
| Belgium | 2 | 0.0% |
| Bosnia and Herzegovina | 39 | 0.0% |
| Brazil | 1 | 0.0% |
| Canada | 24 | 0.0% |
| Caribbean | 203 | 0.2% |
| Central America | 10,949 | 9.3% |
| China | 80 | 0.1% |
| Colombia | 66 | 0.1% |
| Congo | 561 | 0.5% |
| Cuba | 167 | 0.1% |
| Dominica | 26 | 0.0% |
| Eastern Africa | 996 | 0.8% |
| Eastern Asia | 150 | 0.1% |
| Eastern Europe | 90 | 0.1% |
| Ecuador | 1 | 0.0% |
| Egypt | 211 | 0.2% |
| El Salvador | 349 | 0.3% |
| England | 36 | 0.0% |
| Ethiopia | 142 | 0.1% |
| Europe | 244 | 0.2% |
| France | 11 | 0.0% |
| Germany | 25 | 0.0% |
| Guatemala | 195 | 0.2% |
| Honduras | 231 | 0.2% |
| Hong Kong | 61 | 0.1% |
| Hungary | 16 | 0.0% |
| India | 229 | 0.2% |
| Iran | 5 | 0.0% |
| Iraq | 55 | 0.1% |
| Jamaica | 10 | 0.0% |
| Japan | 9 | 0.0% |
| Jordan | 23 | 0.0% |
| Kenya | 196 | 0.2% |
| Korea | 61 | 0.1% |
| Laos | 391 | 0.3% |
| Latin America | 11,307 | 9.6% |
| Malaysia | 12 | 0.0% |
| Mexico | 10,162 | 8.6% |
| Middle Africa | 777 | 0.7% |
| Nicaragua | 2 | 0.0% |
| Nigeria | 7 | 0.0% |
| Northern Africa | 335 | 0.3% |
| Northern Europe | 116 | 0.1% |
| Pakistan | 32 | 0.0% |
| Panama | 10 | 0.0% |
| Peru | 53 | 0.0% |
| Philippines | 235 | 0.2% |
| Poland | 5 | 0.0% |
| Romania | 10 | 0.0% |
| Somalia | 226 | 0.2% |
| South Africa | 27 | 0.0% |
| South America | 155 | 0.1% |
| South Central Asia | 266 | 0.2% |
| South Eastern Asia | 3,454 | 2.9% |
| Sudan | 124 | 0.1% |
| Thailand | 639 | 0.5% |
| Turkey | 20 | 0.0% |
| Uganda | 21 | 0.0% |
| Ukraine | 13 | 0.0% |
| Venezuela | 16 | 0.0% |
| Vietnam | 910 | 0.8% |
| Western Africa | 7 | 0.0% |
| Western Asia | 98 | 0.1% |
| Western Europe | 38 | 0.0% |
| Zaire | 216 | 0.2% | View All 67 Rows |
Sex and Age in Potter County
Sex and Age in Potter County
The most populous age groups in Potter County are 10 to 14 Years (4,840 | 8.0%) for men and 5 to 9 Years (4,543 | 8.0%) for women.
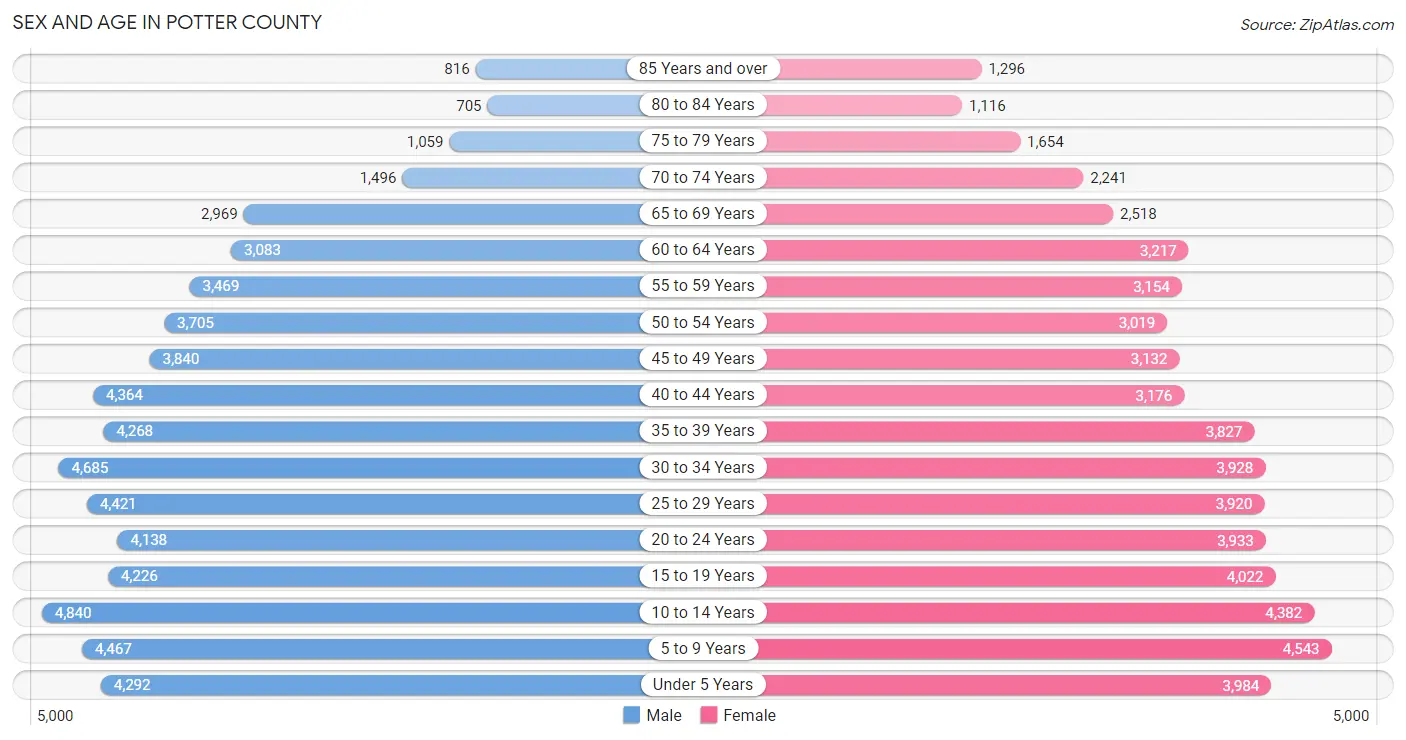
| Age Bracket | Male | Female |
| Under 5 Years | 4,292 (7.0%) | 3,984 (7.0%) |
| 5 to 9 Years | 4,467 (7.3%) | 4,543 (8.0%) |
| 10 to 14 Years | 4,840 (8.0%) | 4,382 (7.7%) |
| 15 to 19 Years | 4,226 (7.0%) | 4,022 (7.0%) |
| 20 to 24 Years | 4,138 (6.8%) | 3,933 (6.9%) |
| 25 to 29 Years | 4,421 (7.3%) | 3,920 (6.9%) |
| 30 to 34 Years | 4,685 (7.7%) | 3,928 (6.9%) |
| 35 to 39 Years | 4,268 (7.0%) | 3,827 (6.7%) |
| 40 to 44 Years | 4,364 (7.2%) | 3,176 (5.6%) |
| 45 to 49 Years | 3,840 (6.3%) | 3,132 (5.5%) |
| 50 to 54 Years | 3,705 (6.1%) | 3,019 (5.3%) |
| 55 to 59 Years | 3,469 (5.7%) | 3,154 (5.5%) |
| 60 to 64 Years | 3,083 (5.1%) | 3,217 (5.6%) |
| 65 to 69 Years | 2,969 (4.9%) | 2,518 (4.4%) |
| 70 to 74 Years | 1,496 (2.5%) | 2,241 (3.9%) |
| 75 to 79 Years | 1,059 (1.7%) | 1,654 (2.9%) |
| 80 to 84 Years | 705 (1.2%) | 1,116 (2.0%) |
| 85 Years and over | 816 (1.3%) | 1,296 (2.3%) |
| Total | 60,843 (100.0%) | 57,062 (100.0%) |
Families and Households in Potter County
Median Family Size in Potter County
The median family size in Potter County is 3.37 persons per family, with married-couple families (17,284 | 64.5%) accounting for the largest median family size of 3.46 persons per family. On the other hand, single male/father families (2,974 | 11.1%) represent the smallest median family size with 2.84 persons per family.
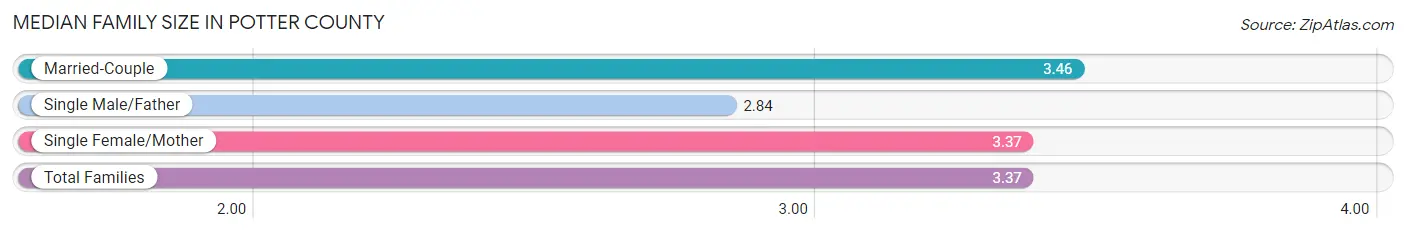
| Family Type | # Families | Family Size |
| Married-Couple | 17,284 (64.5%) | 3.46 |
| Single Male/Father | 2,974 (11.1%) | 2.84 |
| Single Female/Mother | 6,520 (24.3%) | 3.37 |
| Total Families | 26,778 (100.0%) | 3.37 |
Median Household Size in Potter County
The median household size in Potter County is 2.59 persons per household, with single female/mother households (6,520 | 15.2%) accounting for the largest median household size of 3.53 persons per household. non-family households (16,046 | 37.5%) represent the smallest median household size with 1.15 persons per household.
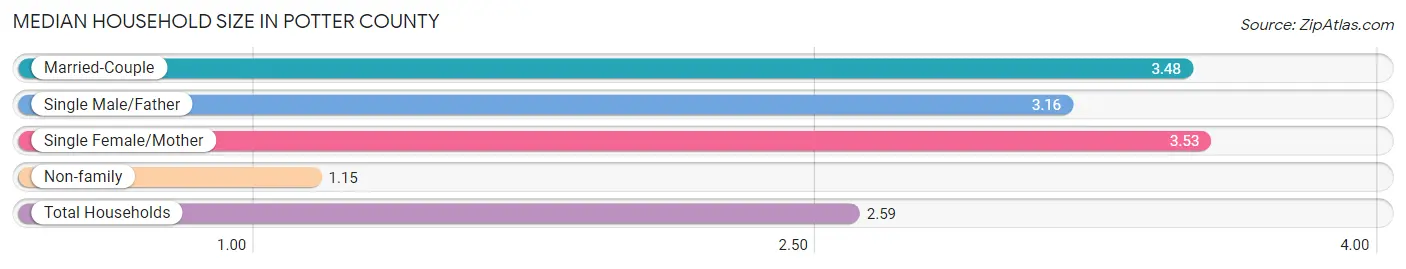
| Household Type | # Households | Household Size |
| Married-Couple | 17,284 (40.4%) | 3.48 |
| Single Male/Father | 2,974 (6.9%) | 3.16 |
| Single Female/Mother | 6,520 (15.2%) | 3.53 |
| Non-family | 16,046 (37.5%) | 1.15 |
| Total Households | 42,824 (100.0%) | 2.59 |
Household Size by Marriage Status in Potter County
Out of a total of 42,824 households in Potter County, 26,778 (62.5%) are family households, while 16,046 (37.5%) are nonfamily households. The most numerous type of family households are 2-person households, comprising 10,588, and the most common type of nonfamily households are 1-person households, comprising 13,978.
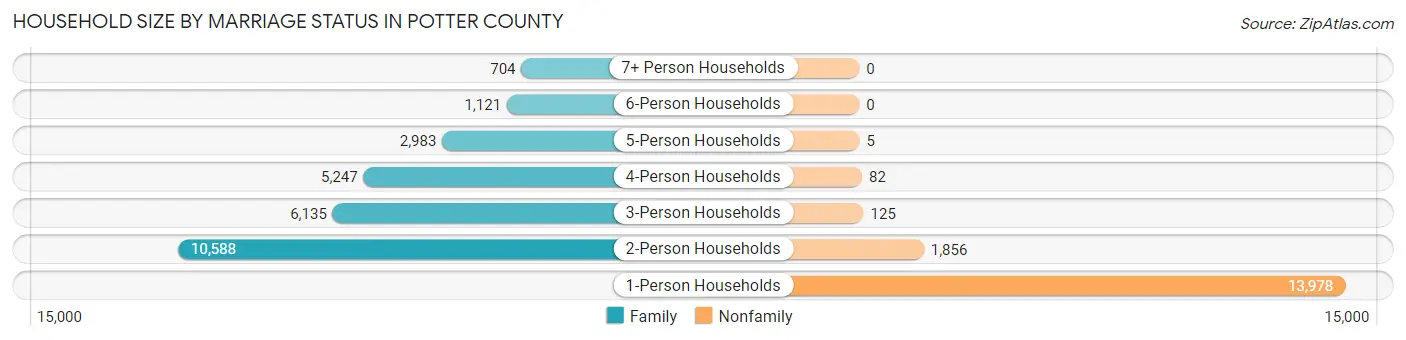
| Household Size | Family Households | Nonfamily Households |
| 1-Person Households | - | 13,978 (32.6%) |
| 2-Person Households | 10,588 (24.7%) | 1,856 (4.3%) |
| 3-Person Households | 6,135 (14.3%) | 125 (0.3%) |
| 4-Person Households | 5,247 (12.2%) | 82 (0.2%) |
| 5-Person Households | 2,983 (7.0%) | 5 (0.0%) |
| 6-Person Households | 1,121 (2.6%) | 0 (0.0%) |
| 7+ Person Households | 704 (1.6%) | 0 (0.0%) |
| Total | 26,778 (62.5%) | 16,046 (37.5%) |
Female Fertility in Potter County
Fertility by Age in Potter County
Average fertility rate in Potter County is 58.0 births per 1,000 women. Women in the age bracket of 20 to 34 years have the highest fertility rate with 107.0 births per 1,000 women. Women in the age bracket of 20 to 34 years acount for 81.2% of all women with births.
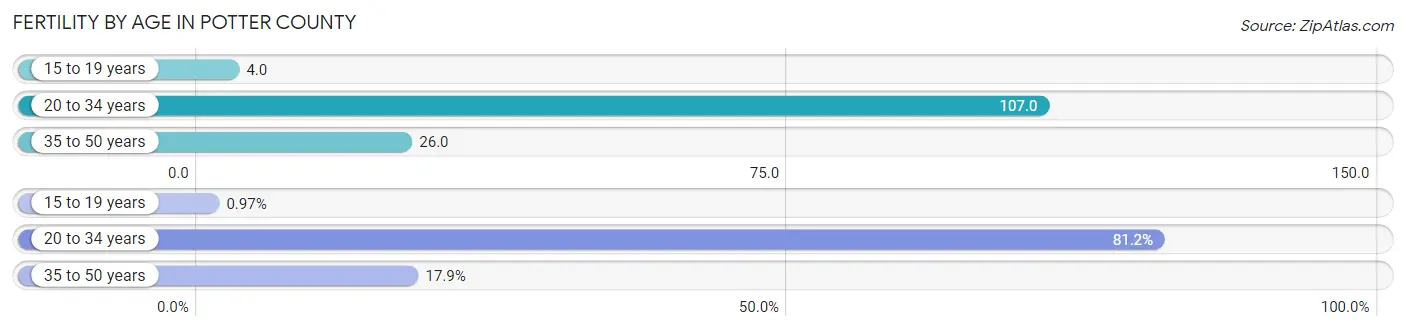
| Age Bracket | Women with Births | Births / 1,000 Women |
| 15 to 19 years | 15 (1.0%) | 4.0 |
| 20 to 34 years | 1,259 (81.2%) | 107.0 |
| 35 to 50 years | 277 (17.9%) | 26.0 |
| Total | 1,551 (100.0%) | 58.0 |
Fertility by Age by Marriage Status in Potter County
58.4% of women with births (1,551) in Potter County are married. The highest percentage of unmarried women with births falls into 15 to 19 years age bracket with 100.0% of them unmarried at the time of birth, while the lowest percentage of unmarried women with births belong to 35 to 50 years age bracket with 16.6% of them unmarried.
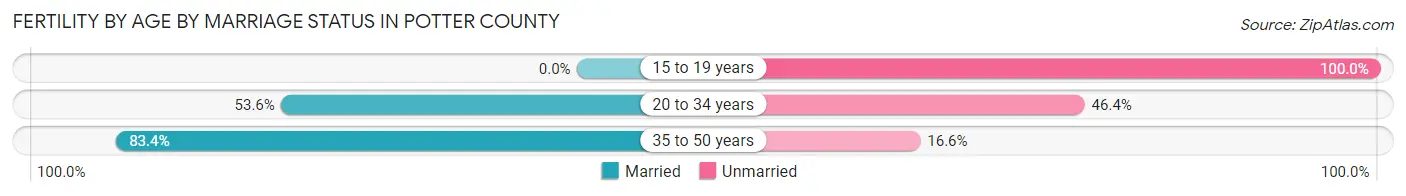
| Age Bracket | Married | Unmarried |
| 15 to 19 years | 0 (0.0%) | 15 (100.0%) |
| 20 to 34 years | 675 (53.6%) | 584 (46.4%) |
| 35 to 50 years | 231 (83.4%) | 46 (16.6%) |
| Total | 906 (58.4%) | 645 (41.6%) |
Fertility by Education in Potter County
Average fertility rate in Potter County is 58.0 births per 1,000 women. Women with the education attainment of high school diploma have the highest fertility rate of 94.0 births per 1,000 women, while women with the education attainment of graduate degree have the lowest fertility at 16.0 births per 1,000 women. Women with the education attainment of high school diploma represent 44.2% of all women with births.
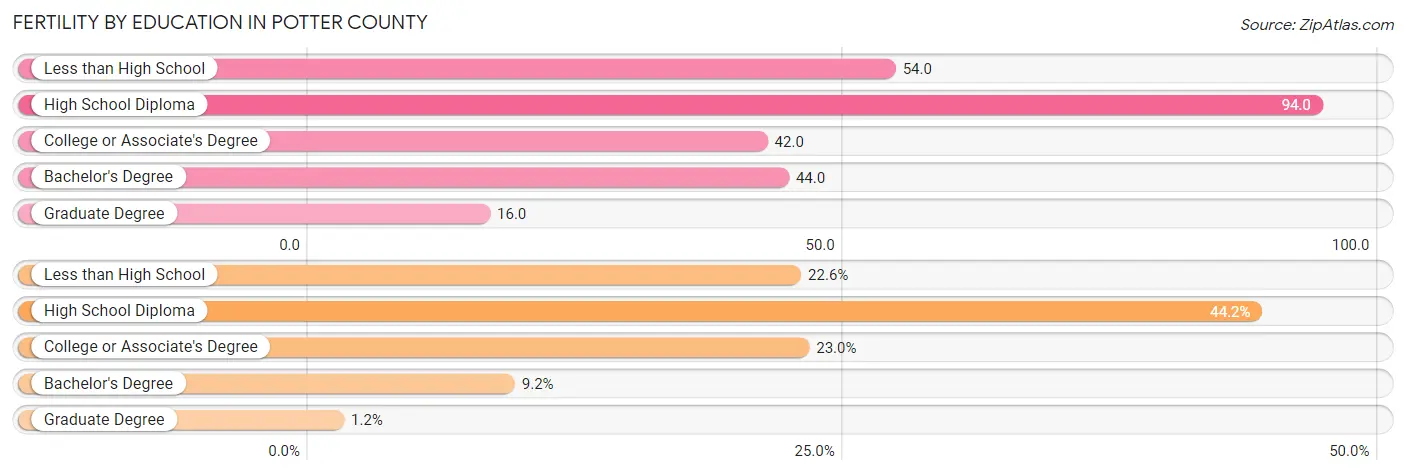
| Educational Attainment | Women with Births | Births / 1,000 Women |
| Less than High School | 350 (22.6%) | 54.0 |
| High School Diploma | 685 (44.2%) | 94.0 |
| College or Associate's Degree | 356 (23.0%) | 42.0 |
| Bachelor's Degree | 142 (9.2%) | 44.0 |
| Graduate Degree | 18 (1.2%) | 16.0 |
| Total | 1,551 (100.0%) | 58.0 |
Fertility by Education by Marriage Status in Potter County
41.6% of women with births in Potter County are unmarried. Women with the educational attainment of graduate degree are most likely to be married with 100.0% of them married at childbirth, while women with the educational attainment of college or associate's degree are least likely to be married with 55.1% of them unmarried at childbirth.
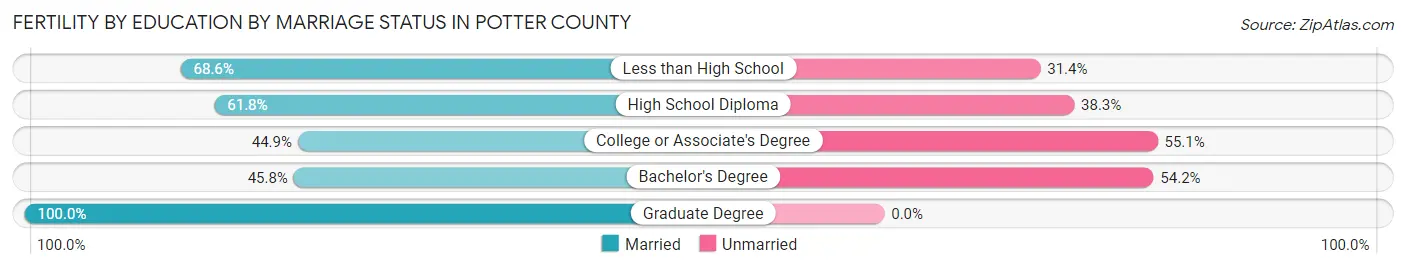
| Educational Attainment | Married | Unmarried |
| Less than High School | 240 (68.6%) | 110 (31.4%) |
| High School Diploma | 423 (61.8%) | 262 (38.3%) |
| College or Associate's Degree | 160 (44.9%) | 196 (55.1%) |
| Bachelor's Degree | 65 (45.8%) | 77 (54.2%) |
| Graduate Degree | 18 (100.0%) | 0 (0.0%) |
| Total | 906 (58.4%) | 645 (41.6%) |
Employment Characteristics in Potter County
Employment by Class of Employer in Potter County
Among the 49,483 employed individuals in Potter County, private company employees (36,166 | 73.1%), self-employed (not incorporated) (3,265 | 6.6%), and local government employees (3,055 | 6.2%) make up the most common classes of employment.
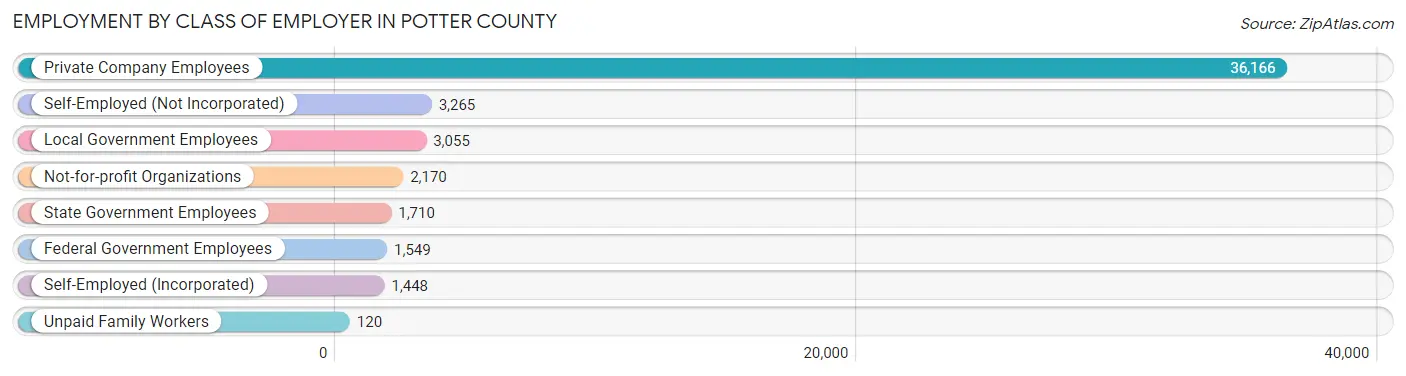
| Employer Class | # Employees | % Employees |
| Private Company Employees | 36,166 | 73.1% |
| Self-Employed (Incorporated) | 1,448 | 2.9% |
| Self-Employed (Not Incorporated) | 3,265 | 6.6% |
| Not-for-profit Organizations | 2,170 | 4.4% |
| Local Government Employees | 3,055 | 6.2% |
| State Government Employees | 1,710 | 3.5% |
| Federal Government Employees | 1,549 | 3.1% |
| Unpaid Family Workers | 120 | 0.2% |
| Total | 49,483 | 100.0% |
Employment Status by Age in Potter County
According to the labor force statistics for Potter County, out of the total population over 16 years of age (89,731), 58.0% or 52,044 individuals are in the labor force, with 3.7% or 1,926 of them unemployed. The age group with the highest labor force participation rate is 30 to 34 years, with 76.2% or 6,563 individuals in the labor force. Within the labor force, the 20 to 24 years age range has the highest percentage of unemployed individuals, with 6.5% or 399 of them being unemployed.
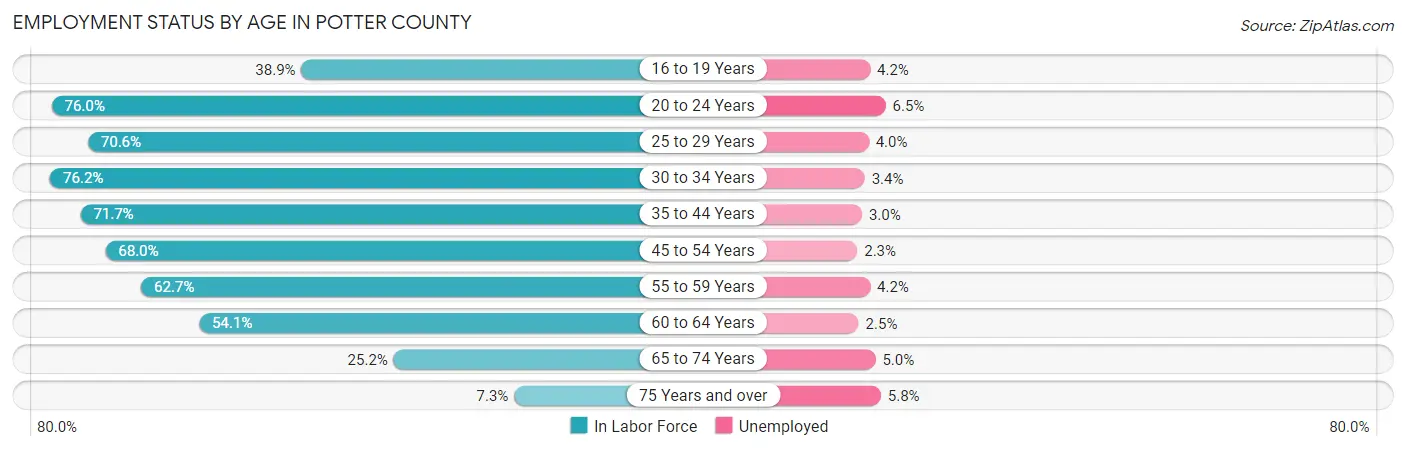
| Age Bracket | In Labor Force | Unemployed |
| 16 to 19 Years | 2,560 (38.9%) | 108 (4.2%) |
| 20 to 24 Years | 6,134 (76.0%) | 399 (6.5%) |
| 25 to 29 Years | 5,889 (70.6%) | 236 (4.0%) |
| 30 to 34 Years | 6,563 (76.2%) | 223 (3.4%) |
| 35 to 44 Years | 11,210 (71.7%) | 336 (3.0%) |
| 45 to 54 Years | 9,313 (68.0%) | 214 (2.3%) |
| 55 to 59 Years | 4,153 (62.7%) | 174 (4.2%) |
| 60 to 64 Years | 3,408 (54.1%) | 85 (2.5%) |
| 65 to 74 Years | 2,324 (25.2%) | 116 (5.0%) |
| 75 Years and over | 485 (7.3%) | 28 (5.8%) |
| Total | 52,044 (58.0%) | 1,926 (3.7%) |
Employment Status by Educational Attainment in Potter County
According to labor force statistics for Potter County, 68.5% of individuals (40,557) out of the total population between 25 and 64 years of age (59,208) are in the labor force, with 3.1% or 1,257 of them being unemployed. The group with the highest labor force participation rate are those with the educational attainment of bachelor's degree or higher, with 82.5% or 8,171 individuals in the labor force. Within the labor force, individuals with less than high school education have the highest percentage of unemployment, with 4.0% or 287 of them being unemployed.
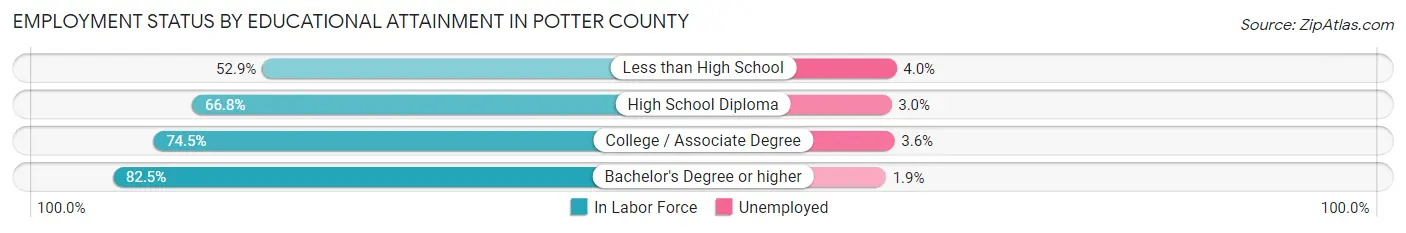
| Educational Attainment | In Labor Force | Unemployed |
| Less than High School | 7,179 (52.9%) | 543 (4.0%) |
| High School Diploma | 12,329 (66.8%) | 554 (3.0%) |
| College / Associate Degree | 12,871 (74.5%) | 622 (3.6%) |
| Bachelor's Degree or higher | 8,171 (82.5%) | 188 (1.9%) |
| Total | 40,557 (68.5%) | 1,835 (3.1%) |
Employment Occupations by Sex in Potter County
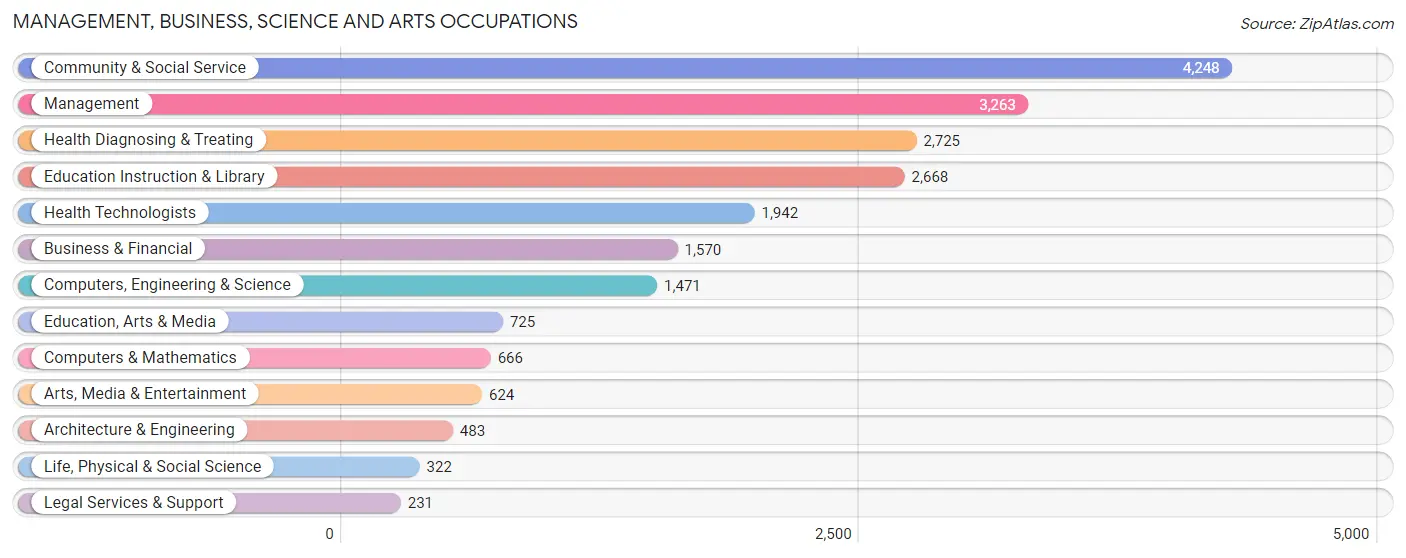
Management, Business, Science and Arts Occupations
The most common Management, Business, Science and Arts occupations in Potter County are Community & Social Service (4,248 | 8.5%), Management (3,263 | 6.5%), Health Diagnosing & Treating (2,725 | 5.5%), Education Instruction & Library (2,668 | 5.3%), and Health Technologists (1,942 | 3.9%).
Management, Business, Science and Arts Occupations by Sex
Within the Management, Business, Science and Arts occupations in Potter County, the most male-oriented occupations are Computers & Mathematics (87.7%), Architecture & Engineering (86.1%), and Computers, Engineering & Science (81.2%), while the most female-oriented occupations are Education Instruction & Library (78.7%), Legal Services & Support (74.5%), and Community & Social Service (67.5%).
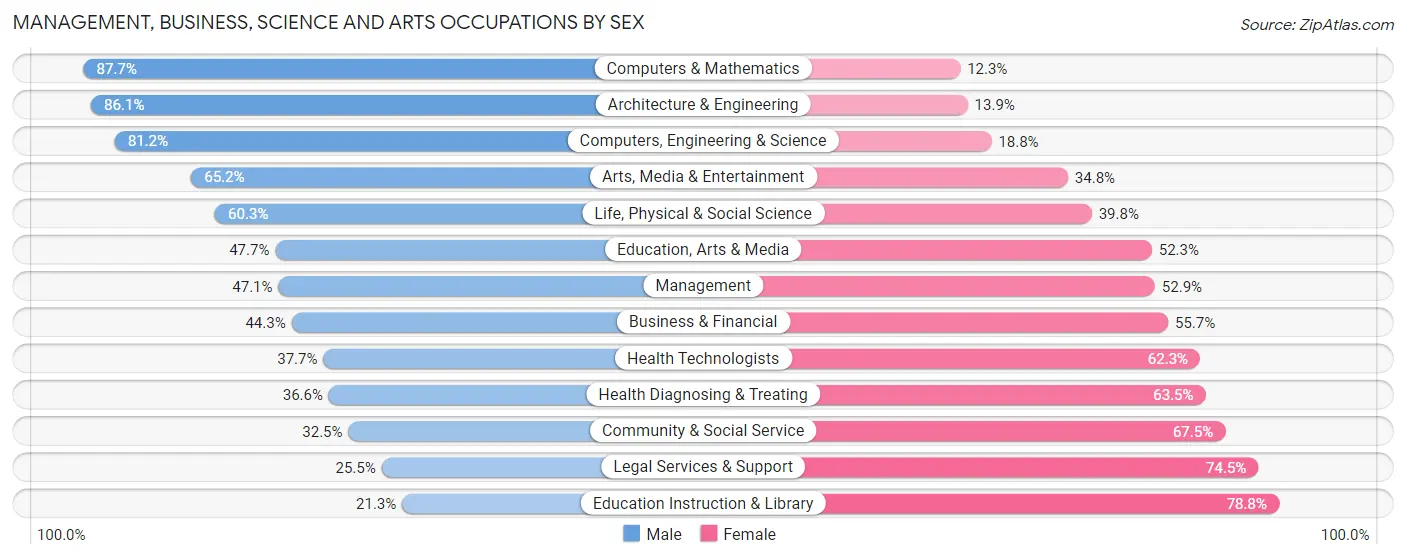
| Occupation | Male | Female |
| Management | 1,536 (47.1%) | 1,727 (52.9%) |
| Business & Financial | 696 (44.3%) | 874 (55.7%) |
| Computers, Engineering & Science | 1,194 (81.2%) | 277 (18.8%) |
| Computers & Mathematics | 584 (87.7%) | 82 (12.3%) |
| Architecture & Engineering | 416 (86.1%) | 67 (13.9%) |
| Life, Physical & Social Science | 194 (60.3%) | 128 (39.8%) |
| Community & Social Service | 1,379 (32.5%) | 2,869 (67.5%) |
| Education, Arts & Media | 346 (47.7%) | 379 (52.3%) |
| Legal Services & Support | 59 (25.5%) | 172 (74.5%) |
| Education Instruction & Library | 567 (21.2%) | 2,101 (78.7%) |
| Arts, Media & Entertainment | 407 (65.2%) | 217 (34.8%) |
| Health Diagnosing & Treating | 996 (36.5%) | 1,729 (63.4%) |
| Health Technologists | 732 (37.7%) | 1,210 (62.3%) |
| Total (Category) | 5,801 (43.7%) | 7,476 (56.3%) |
| Total (Overall) | 27,176 (54.4%) | 22,777 (45.6%) |
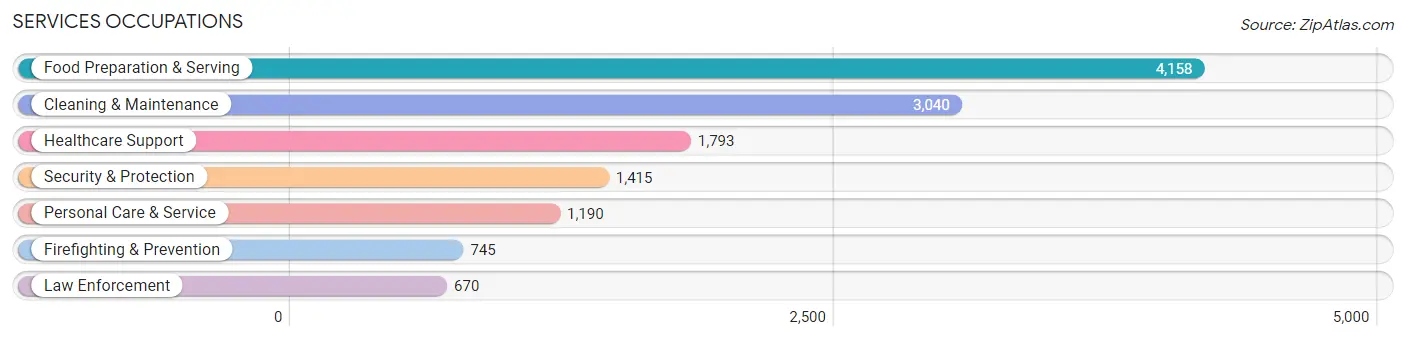
Services Occupations
The most common Services occupations in Potter County are Food Preparation & Serving (4,158 | 8.3%), Cleaning & Maintenance (3,040 | 6.1%), Healthcare Support (1,793 | 3.6%), Security & Protection (1,415 | 2.8%), and Personal Care & Service (1,190 | 2.4%).
Services Occupations by Sex
Within the Services occupations in Potter County, the most male-oriented occupations are Law Enforcement (86.6%), Security & Protection (78.6%), and Firefighting & Prevention (71.4%), while the most female-oriented occupations are Healthcare Support (88.3%), Personal Care & Service (83.5%), and Food Preparation & Serving (53.5%).
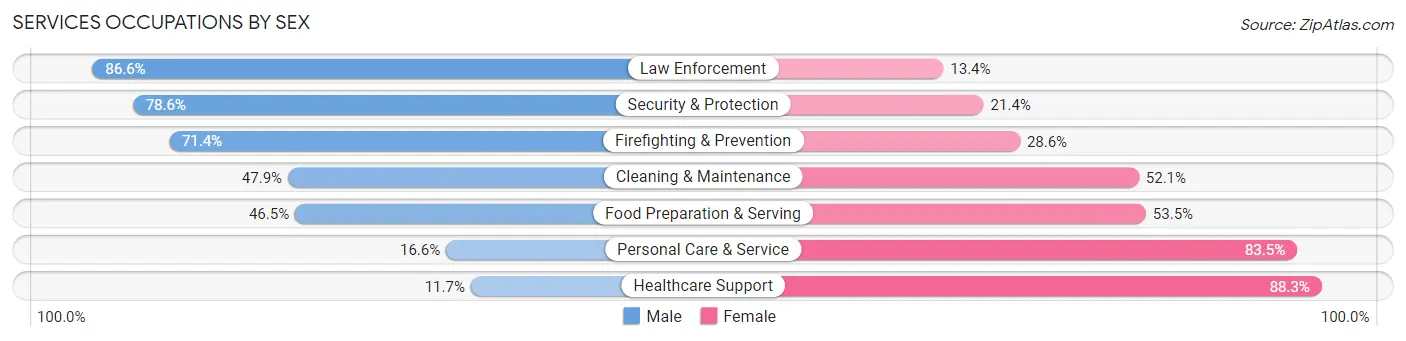
| Occupation | Male | Female |
| Healthcare Support | 209 (11.7%) | 1,584 (88.3%) |
| Security & Protection | 1,112 (78.6%) | 303 (21.4%) |
| Firefighting & Prevention | 532 (71.4%) | 213 (28.6%) |
| Law Enforcement | 580 (86.6%) | 90 (13.4%) |
| Food Preparation & Serving | 1,932 (46.5%) | 2,226 (53.5%) |
| Cleaning & Maintenance | 1,455 (47.9%) | 1,585 (52.1%) |
| Personal Care & Service | 197 (16.6%) | 993 (83.5%) |
| Total (Category) | 4,905 (42.3%) | 6,691 (57.7%) |
| Total (Overall) | 27,176 (54.4%) | 22,777 (45.6%) |
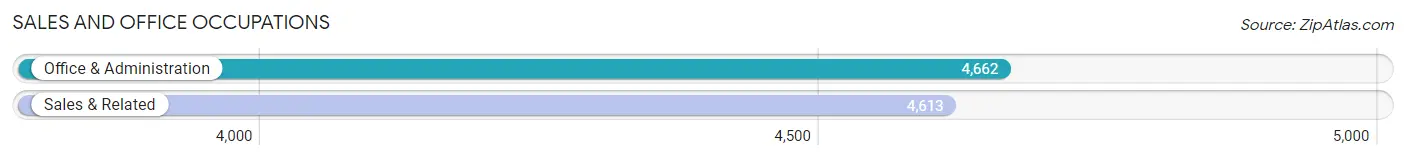
Sales and Office Occupations
The most common Sales and Office occupations in Potter County are Office & Administration (4,662 | 9.3%), and Sales & Related (4,613 | 9.2%).
Sales and Office Occupations by Sex
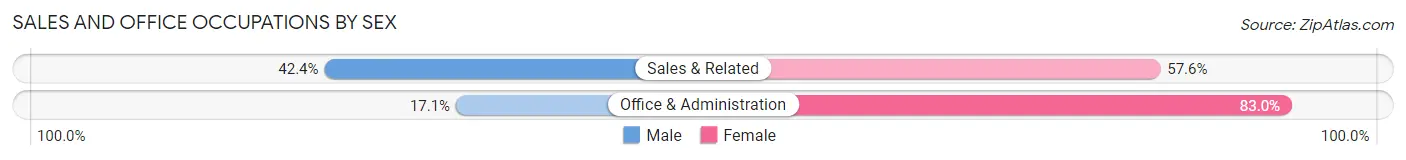
| Occupation | Male | Female |
| Sales & Related | 1,954 (42.4%) | 2,659 (57.6%) |
| Office & Administration | 795 (17.1%) | 3,867 (83.0%) |
| Total (Category) | 2,749 (29.6%) | 6,526 (70.4%) |
| Total (Overall) | 27,176 (54.4%) | 22,777 (45.6%) |
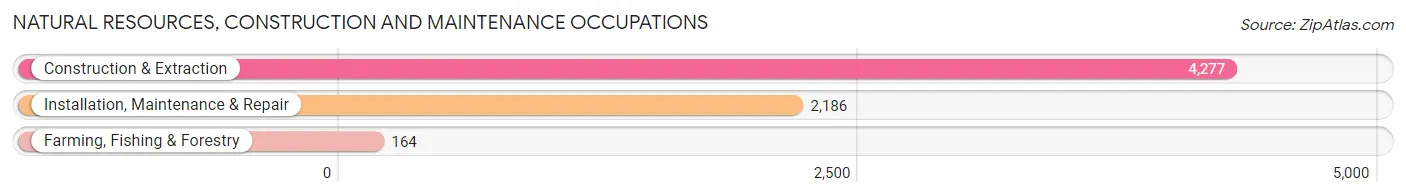
Natural Resources, Construction and Maintenance Occupations
The most common Natural Resources, Construction and Maintenance occupations in Potter County are Construction & Extraction (4,277 | 8.6%), Installation, Maintenance & Repair (2,186 | 4.4%), and Farming, Fishing & Forestry (164 | 0.3%).
Natural Resources, Construction and Maintenance Occupations by Sex
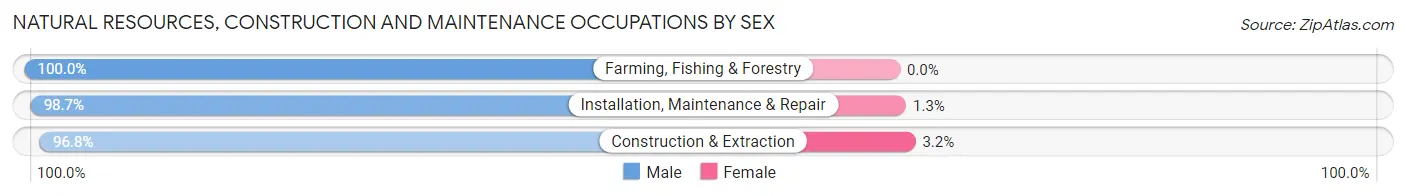
| Occupation | Male | Female |
| Farming, Fishing & Forestry | 164 (100.0%) | 0 (0.0%) |
| Construction & Extraction | 4,139 (96.8%) | 138 (3.2%) |
| Installation, Maintenance & Repair | 2,158 (98.7%) | 28 (1.3%) |
| Total (Category) | 6,461 (97.5%) | 166 (2.5%) |
| Total (Overall) | 27,176 (54.4%) | 22,777 (45.6%) |
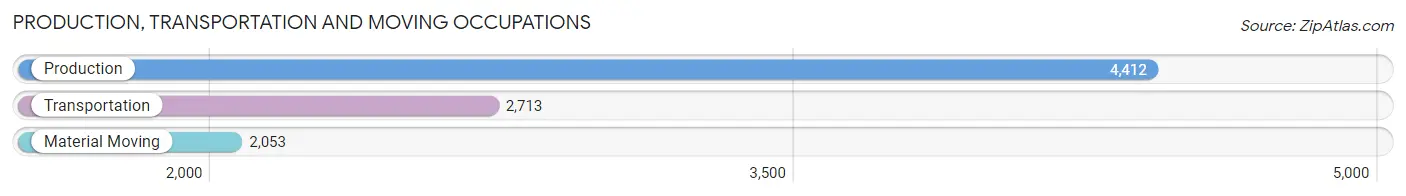
Production, Transportation and Moving Occupations
The most common Production, Transportation and Moving occupations in Potter County are Production (4,412 | 8.8%), Transportation (2,713 | 5.4%), and Material Moving (2,053 | 4.1%).
Production, Transportation and Moving Occupations by Sex
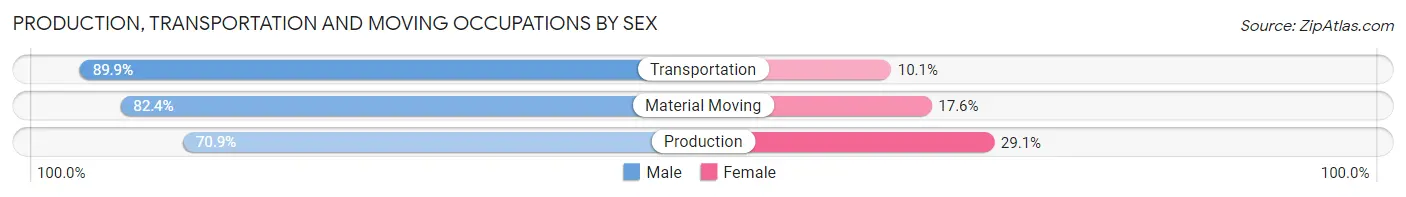
| Occupation | Male | Female |
| Production | 3,130 (70.9%) | 1,282 (29.1%) |
| Transportation | 2,438 (89.9%) | 275 (10.1%) |
| Material Moving | 1,692 (82.4%) | 361 (17.6%) |
| Total (Category) | 7,260 (79.1%) | 1,918 (20.9%) |
| Total (Overall) | 27,176 (54.4%) | 22,777 (45.6%) |
Employment Industries by Sex in Potter County
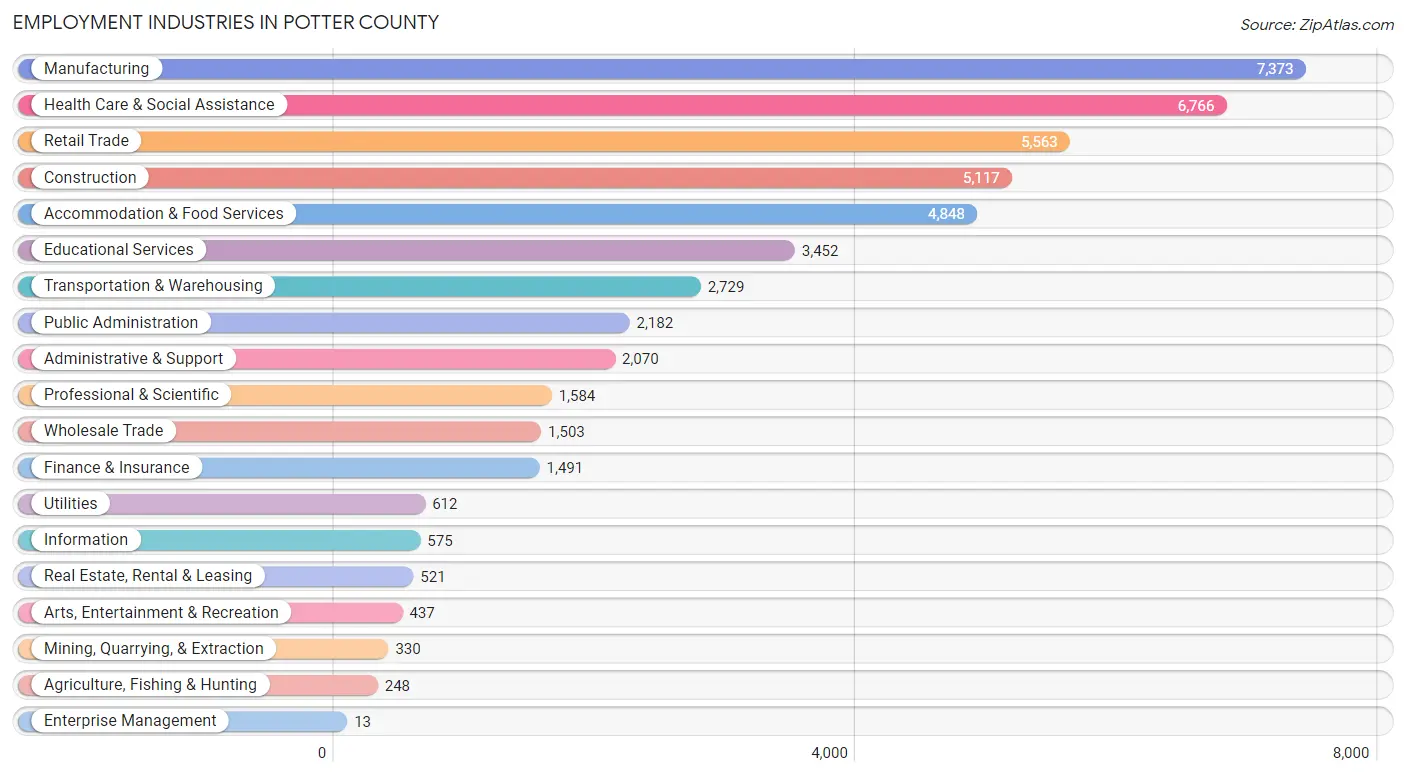
Employment Industries in Potter County
The major employment industries in Potter County include Manufacturing (7,373 | 14.8%), Health Care & Social Assistance (6,766 | 13.5%), Retail Trade (5,563 | 11.1%), Construction (5,117 | 10.2%), and Accommodation & Food Services (4,848 | 9.7%).
Employment Industries by Sex in Potter County
The Potter County industries that see more men than women are Construction (93.7%), Mining, Quarrying, & Extraction (89.7%), and Agriculture, Fishing & Hunting (85.1%), whereas the industries that tend to have a higher number of women are Enterprise Management (100.0%), Health Care & Social Assistance (78.3%), and Educational Services (75.9%).
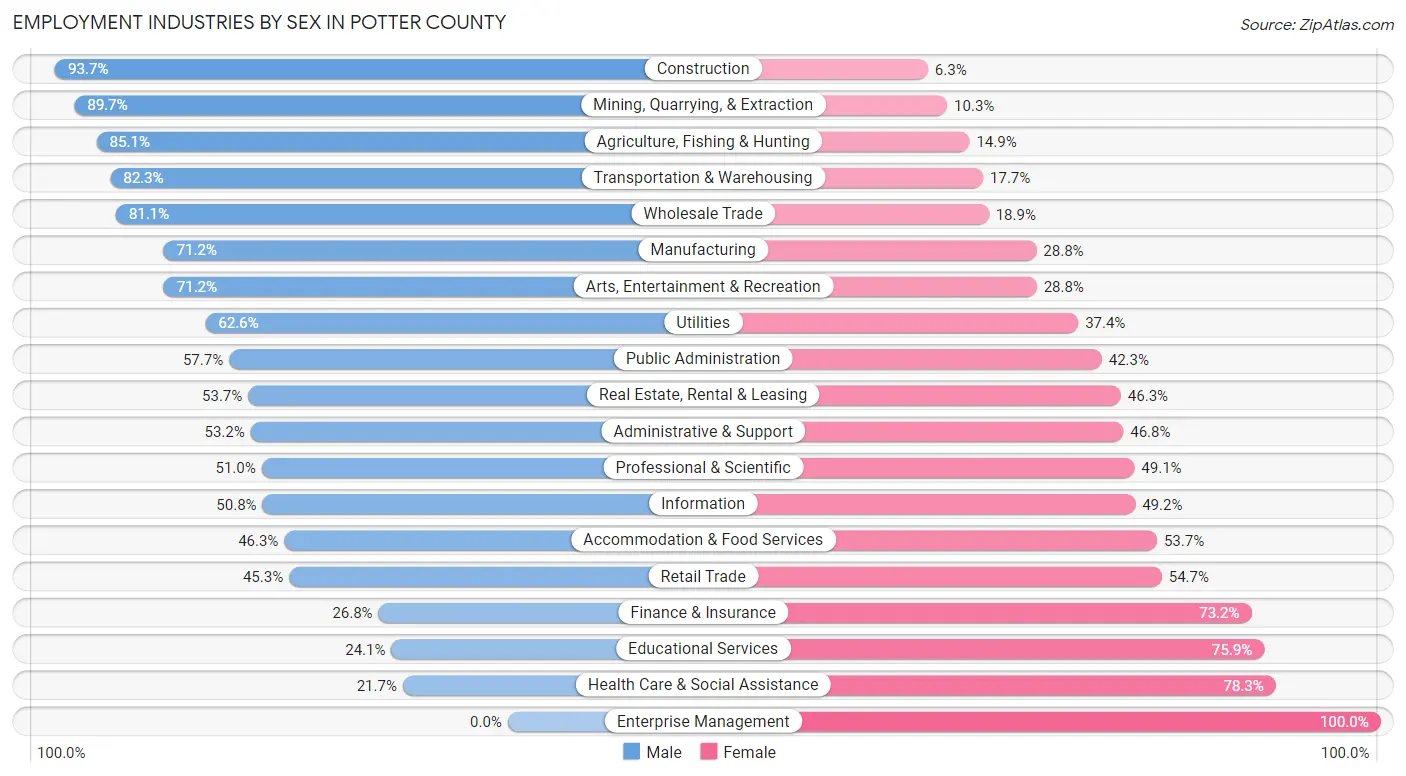
| Industry | Male | Female |
| Agriculture, Fishing & Hunting | 211 (85.1%) | 37 (14.9%) |
| Mining, Quarrying, & Extraction | 296 (89.7%) | 34 (10.3%) |
| Construction | 4,794 (93.7%) | 323 (6.3%) |
| Manufacturing | 5,252 (71.2%) | 2,121 (28.8%) |
| Wholesale Trade | 1,219 (81.1%) | 284 (18.9%) |
| Retail Trade | 2,519 (45.3%) | 3,044 (54.7%) |
| Transportation & Warehousing | 2,245 (82.3%) | 484 (17.7%) |
| Utilities | 383 (62.6%) | 229 (37.4%) |
| Information | 292 (50.8%) | 283 (49.2%) |
| Finance & Insurance | 399 (26.8%) | 1,092 (73.2%) |
| Real Estate, Rental & Leasing | 280 (53.7%) | 241 (46.3%) |
| Professional & Scientific | 807 (50.9%) | 777 (49.0%) |
| Enterprise Management | 0 (0.0%) | 13 (100.0%) |
| Administrative & Support | 1,102 (53.2%) | 968 (46.8%) |
| Educational Services | 832 (24.1%) | 2,620 (75.9%) |
| Health Care & Social Assistance | 1,470 (21.7%) | 5,296 (78.3%) |
| Arts, Entertainment & Recreation | 311 (71.2%) | 126 (28.8%) |
| Accommodation & Food Services | 2,243 (46.3%) | 2,605 (53.7%) |
| Public Administration | 1,259 (57.7%) | 923 (42.3%) |
| Total | 27,176 (54.4%) | 22,777 (45.6%) |
Education in Potter County
School Enrollment in Potter County
The most common levels of schooling among the 30,666 students in Potter County are elementary school (7,176 | 23.4%), middle school (7,053 | 23.0%), and high school (6,682 | 21.8%).
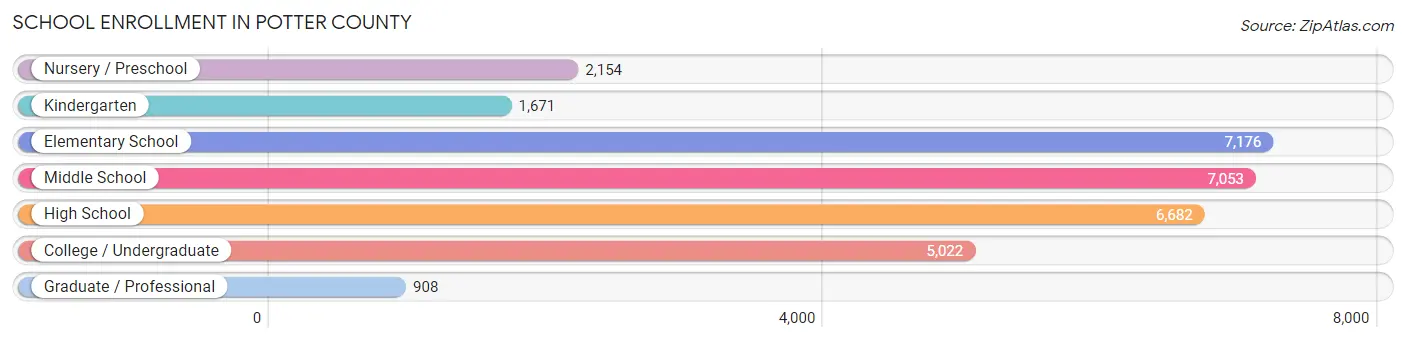
| School Level | # Students | % Students |
| Nursery / Preschool | 2,154 | 7.0% |
| Kindergarten | 1,671 | 5.4% |
| Elementary School | 7,176 | 23.4% |
| Middle School | 7,053 | 23.0% |
| High School | 6,682 | 21.8% |
| College / Undergraduate | 5,022 | 16.4% |
| Graduate / Professional | 908 | 3.0% |
| Total | 30,666 | 100.0% |
School Enrollment by Age by Funding Source in Potter County
Out of a total of 30,666 students who are enrolled in schools in Potter County, 2,024 (6.6%) attend a private institution, while the remaining 28,642 (93.4%) are enrolled in public schools. The age group of 3 to 4 year olds has the highest likelihood of being enrolled in private schools, with 307 (17.7% in the age bracket) enrolled. Conversely, the age group of 15 to 17 year olds has the lowest likelihood of being enrolled in a private school, with 4,484 (95.8% in the age bracket) attending a public institution.
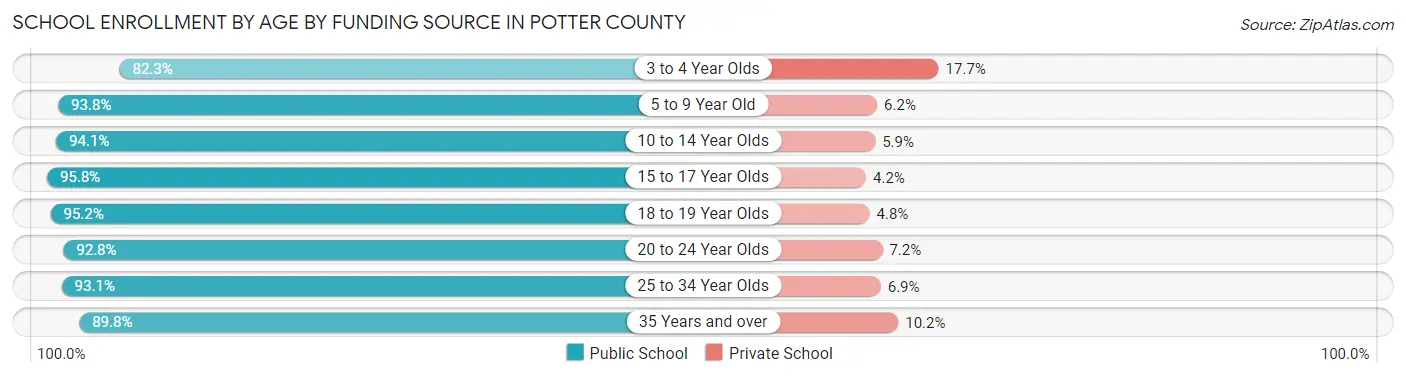
| Age Bracket | Public School | Private School |
| 3 to 4 Year Olds | 1,428 (82.3%) | 307 (17.7%) |
| 5 to 9 Year Old | 7,902 (93.8%) | 526 (6.2%) |
| 10 to 14 Year Olds | 8,276 (94.1%) | 517 (5.9%) |
| 15 to 17 Year Olds | 4,484 (95.8%) | 195 (4.2%) |
| 18 to 19 Year Olds | 1,714 (95.2%) | 87 (4.8%) |
| 20 to 24 Year Olds | 2,170 (92.8%) | 169 (7.2%) |
| 25 to 34 Year Olds | 1,804 (93.1%) | 134 (6.9%) |
| 35 Years and over | 856 (89.8%) | 97 (10.2%) |
| Total | 28,642 (93.4%) | 2,024 (6.6%) |
Educational Attainment by Field of Study in Potter County
Business (2,678 | 19.7%), education (2,591 | 19.1%), science & technology (1,525 | 11.2%), bio, nature & agricultural (1,451 | 10.7%), and liberal arts & history (1,068 | 7.9%) are the most common fields of study among 13,603 individuals in Potter County who have obtained a bachelor's degree or higher.
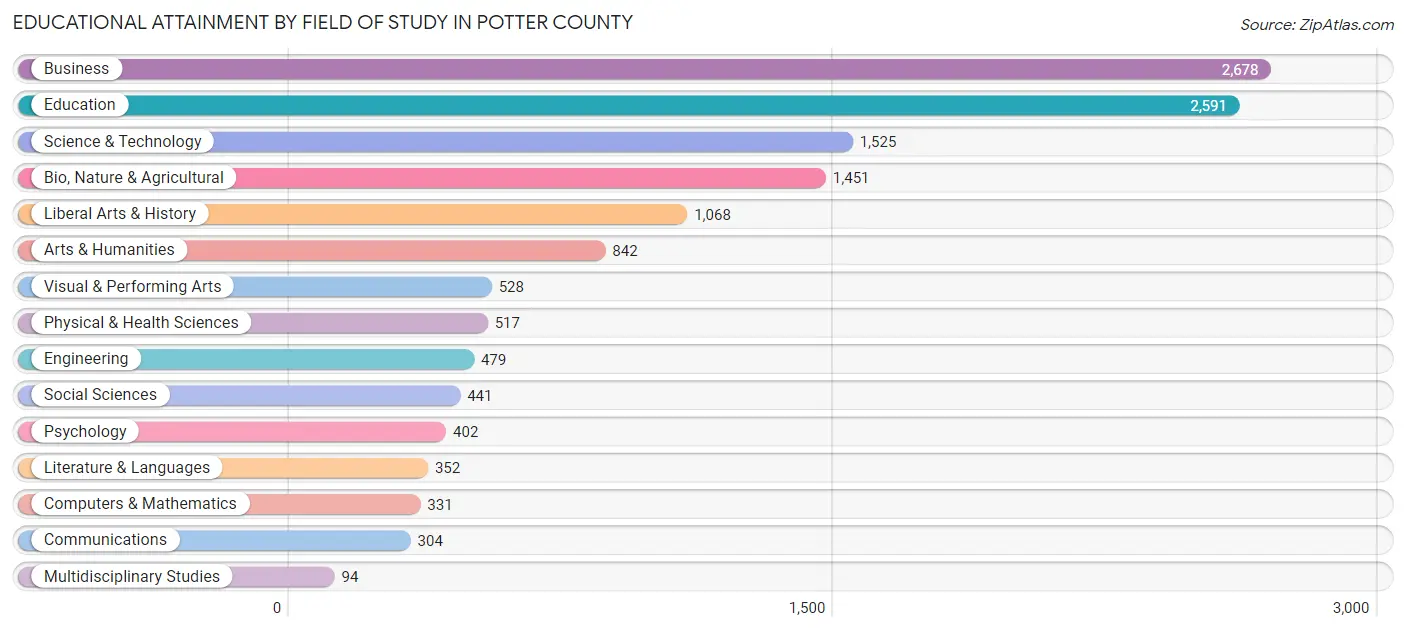
| Field of Study | # Graduates | % Graduates |
| Computers & Mathematics | 331 | 2.4% |
| Bio, Nature & Agricultural | 1,451 | 10.7% |
| Physical & Health Sciences | 517 | 3.8% |
| Psychology | 402 | 3.0% |
| Social Sciences | 441 | 3.2% |
| Engineering | 479 | 3.5% |
| Multidisciplinary Studies | 94 | 0.7% |
| Science & Technology | 1,525 | 11.2% |
| Business | 2,678 | 19.7% |
| Education | 2,591 | 19.1% |
| Literature & Languages | 352 | 2.6% |
| Liberal Arts & History | 1,068 | 7.9% |
| Visual & Performing Arts | 528 | 3.9% |
| Communications | 304 | 2.2% |
| Arts & Humanities | 842 | 6.2% |
| Total | 13,603 | 100.0% |
Transportation & Commute in Potter County
Vehicle Availability by Sex in Potter County
The most prevalent vehicle ownership categories in Potter County are males with 2 vehicles (11,322, accounting for 42.1%) and females with 2 vehicles (8,688, making up 50.4%).
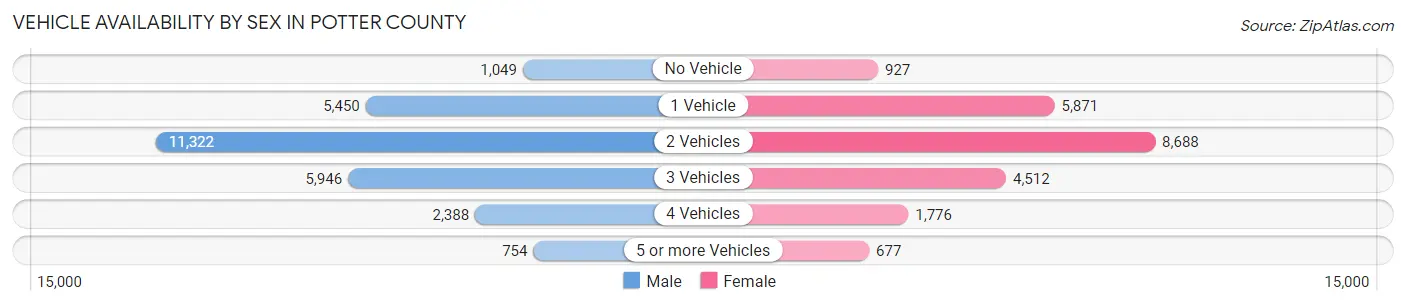
| Vehicles Available | Male | Female |
| No Vehicle | 1,049 (3.9%) | 927 (4.1%) |
| 1 Vehicle | 5,450 (20.3%) | 5,871 (26.2%) |
| 2 Vehicles | 11,322 (42.1%) | 8,688 (38.7%) |
| 3 Vehicles | 5,946 (22.1%) | 4,512 (20.1%) |
| 4 Vehicles | 2,388 (8.9%) | 1,776 (7.9%) |
| 5 or more Vehicles | 754 (2.8%) | 677 (3.0%) |
| Total | 26,909 (100.0%) | 22,451 (100.0%) |
Commute Time in Potter County
The most frequently occuring commute durations in Potter County are 15 to 19 minutes (14,300 commuters, 30.4%), 10 to 14 minutes (9,319 commuters, 19.8%), and 20 to 24 minutes (7,578 commuters, 16.1%).
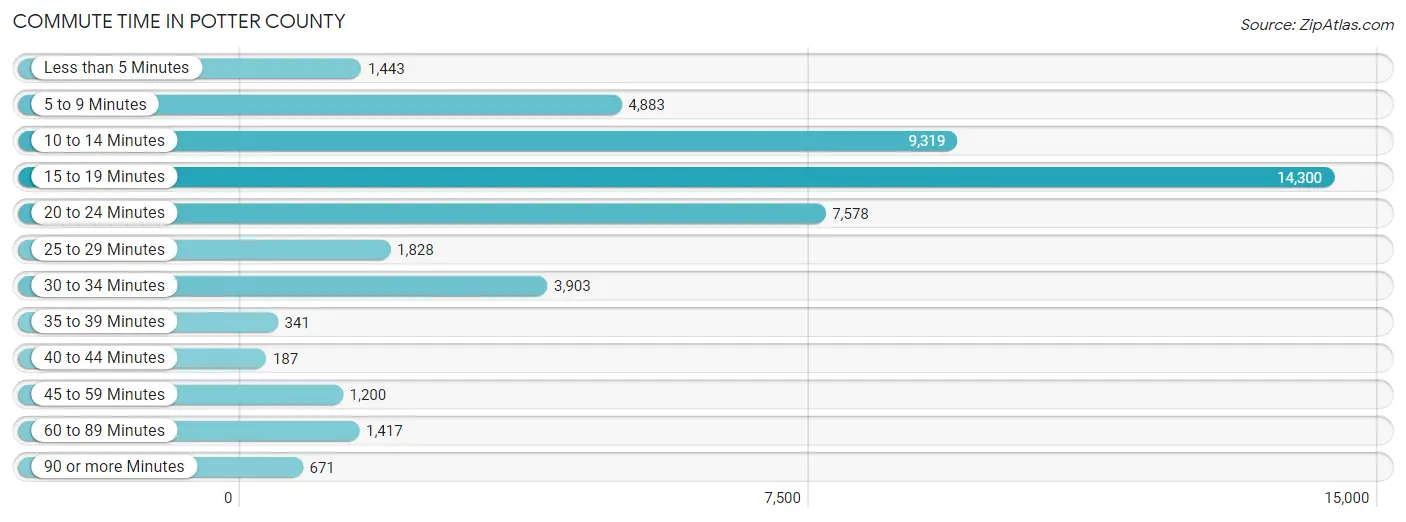
| Commute Time | # Commuters | % Commuters |
| Less than 5 Minutes | 1,443 | 3.1% |
| 5 to 9 Minutes | 4,883 | 10.4% |
| 10 to 14 Minutes | 9,319 | 19.8% |
| 15 to 19 Minutes | 14,300 | 30.4% |
| 20 to 24 Minutes | 7,578 | 16.1% |
| 25 to 29 Minutes | 1,828 | 3.9% |
| 30 to 34 Minutes | 3,903 | 8.3% |
| 35 to 39 Minutes | 341 | 0.7% |
| 40 to 44 Minutes | 187 | 0.4% |
| 45 to 59 Minutes | 1,200 | 2.5% |
| 60 to 89 Minutes | 1,417 | 3.0% |
| 90 or more Minutes | 671 | 1.4% |
Commute Time by Sex in Potter County
The most common commute times in Potter County are 15 to 19 minutes (8,222 commuters, 31.7%) for males and 15 to 19 minutes (6,078 commuters, 28.8%) for females.
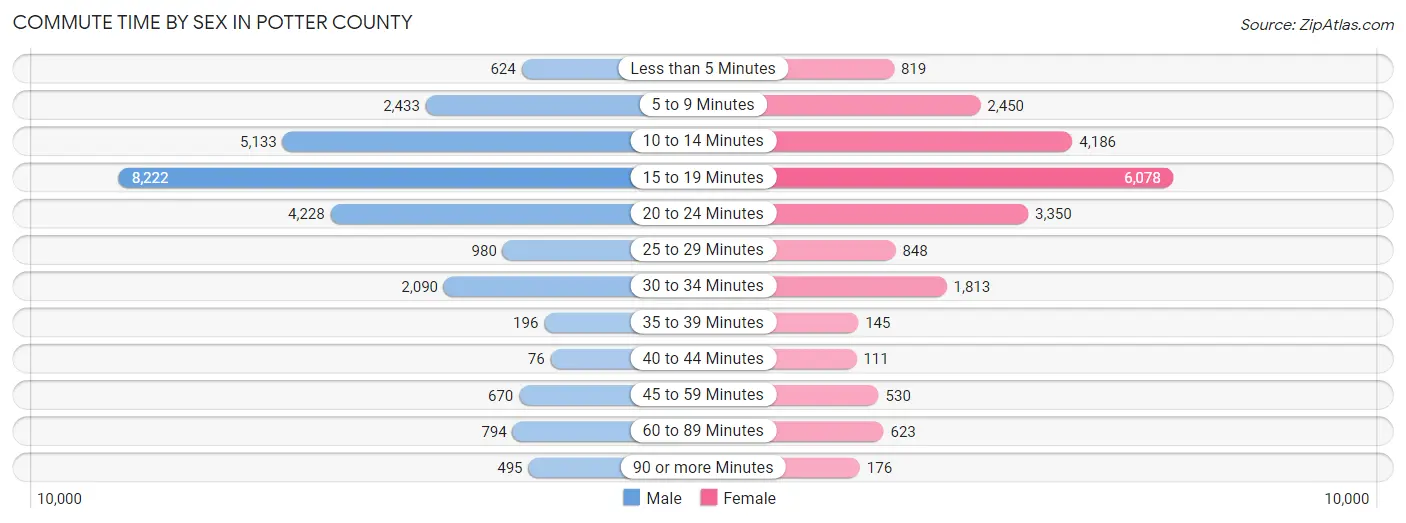
| Commute Time | Male | Female |
| Less than 5 Minutes | 624 (2.4%) | 819 (3.9%) |
| 5 to 9 Minutes | 2,433 (9.4%) | 2,450 (11.6%) |
| 10 to 14 Minutes | 5,133 (19.8%) | 4,186 (19.8%) |
| 15 to 19 Minutes | 8,222 (31.7%) | 6,078 (28.8%) |
| 20 to 24 Minutes | 4,228 (16.3%) | 3,350 (15.9%) |
| 25 to 29 Minutes | 980 (3.8%) | 848 (4.0%) |
| 30 to 34 Minutes | 2,090 (8.1%) | 1,813 (8.6%) |
| 35 to 39 Minutes | 196 (0.8%) | 145 (0.7%) |
| 40 to 44 Minutes | 76 (0.3%) | 111 (0.5%) |
| 45 to 59 Minutes | 670 (2.6%) | 530 (2.5%) |
| 60 to 89 Minutes | 794 (3.1%) | 623 (2.9%) |
| 90 or more Minutes | 495 (1.9%) | 176 (0.8%) |
Time of Departure to Work by Sex in Potter County
The most frequent times of departure to work in Potter County are 7:00 AM to 7:29 AM (5,234, 20.2%) for males and 7:00 AM to 7:29 AM (4,091, 19.4%) for females.
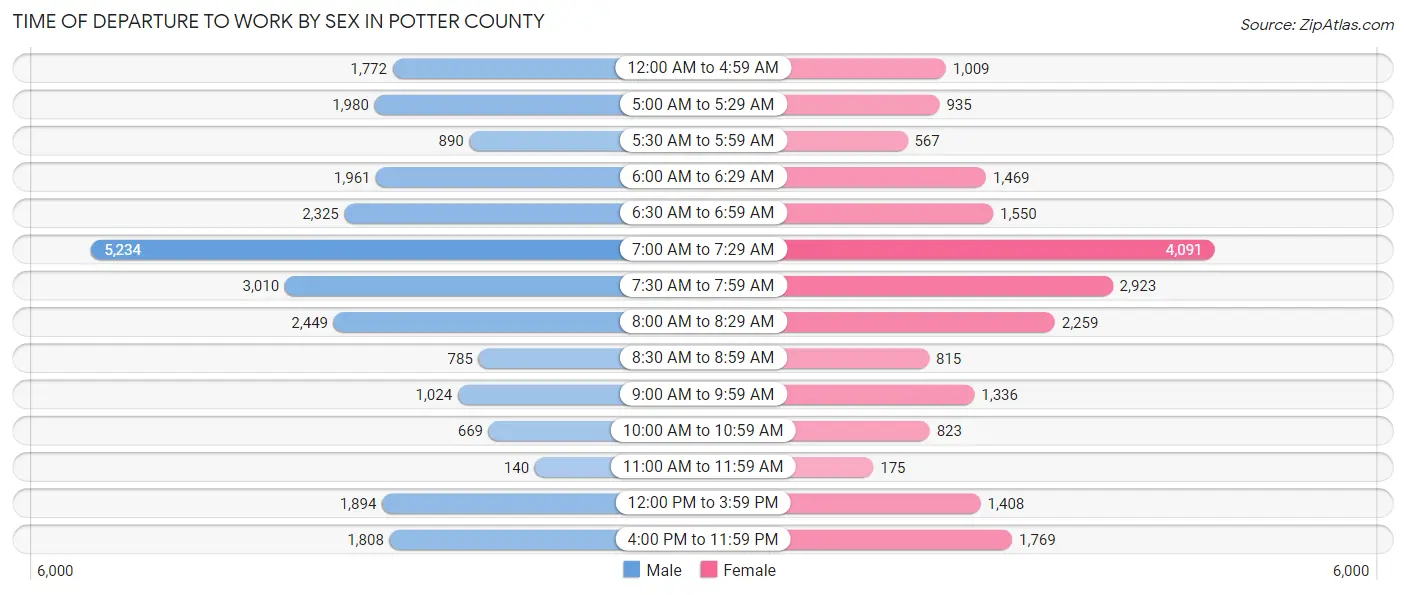
| Time of Departure | Male | Female |
| 12:00 AM to 4:59 AM | 1,772 (6.8%) | 1,009 (4.8%) |
| 5:00 AM to 5:29 AM | 1,980 (7.6%) | 935 (4.4%) |
| 5:30 AM to 5:59 AM | 890 (3.4%) | 567 (2.7%) |
| 6:00 AM to 6:29 AM | 1,961 (7.6%) | 1,469 (7.0%) |
| 6:30 AM to 6:59 AM | 2,325 (9.0%) | 1,550 (7.3%) |
| 7:00 AM to 7:29 AM | 5,234 (20.2%) | 4,091 (19.4%) |
| 7:30 AM to 7:59 AM | 3,010 (11.6%) | 2,923 (13.8%) |
| 8:00 AM to 8:29 AM | 2,449 (9.4%) | 2,259 (10.7%) |
| 8:30 AM to 8:59 AM | 785 (3.0%) | 815 (3.9%) |
| 9:00 AM to 9:59 AM | 1,024 (4.0%) | 1,336 (6.3%) |
| 10:00 AM to 10:59 AM | 669 (2.6%) | 823 (3.9%) |
| 11:00 AM to 11:59 AM | 140 (0.5%) | 175 (0.8%) |
| 12:00 PM to 3:59 PM | 1,894 (7.3%) | 1,408 (6.7%) |
| 4:00 PM to 11:59 PM | 1,808 (7.0%) | 1,769 (8.4%) |
| Total | 25,941 (100.0%) | 21,129 (100.0%) |
Housing Occupancy in Potter County
Occupancy by Ownership in Potter County
Of the total 42,824 dwellings in Potter County, owner-occupied units account for 23,904 (55.8%), while renter-occupied units make up 18,920 (44.2%).
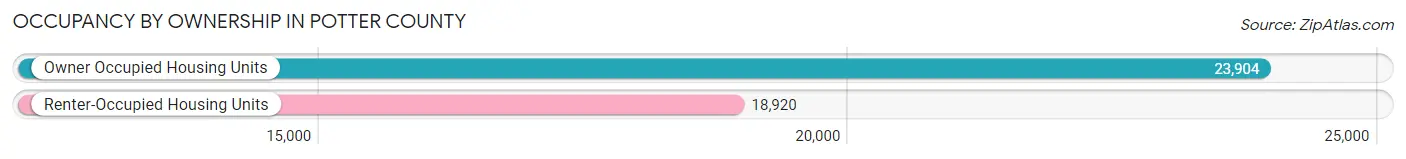
| Occupancy | # Housing Units | % Housing Units |
| Owner Occupied Housing Units | 23,904 | 55.8% |
| Renter-Occupied Housing Units | 18,920 | 44.2% |
| Total Occupied Housing Units | 42,824 | 100.0% |
Occupancy by Household Size in Potter County
| Household Size | # Housing Units | % Housing Units |
| 1-Person Household | 13,978 | 32.6% |
| 2-Person Household | 12,444 | 29.1% |
| 3-Person Household | 6,260 | 14.6% |
| 4+ Person Household | 10,142 | 23.7% |
| Total Housing Units | 42,824 | 100.0% |
Occupancy by Ownership by Household Size in Potter County
| Household Size | Owner-occupied | Renter-occupied |
| 1-Person Household | 5,870 (42.0%) | 8,108 (58.0%) |
| 2-Person Household | 8,074 (64.9%) | 4,370 (35.1%) |
| 3-Person Household | 3,670 (58.6%) | 2,590 (41.4%) |
| 4+ Person Household | 6,290 (62.0%) | 3,852 (38.0%) |
| Total Housing Units | 23,904 (55.8%) | 18,920 (44.2%) |
Occupancy by Educational Attainment in Potter County
| Household Size | Owner-occupied | Renter-occupied |
| Less than High School | 4,565 (57.9%) | 3,319 (42.1%) |
| High School Diploma | 6,138 (48.5%) | 6,509 (51.5%) |
| College/Associate Degree | 8,158 (55.6%) | 6,506 (44.4%) |
| Bachelor's Degree or higher | 5,043 (66.1%) | 2,586 (33.9%) |
Occupancy by Age of Householder in Potter County
| Age Bracket | # Households | % Households |
| Under 35 Years | 11,238 | 26.2% |
| 35 to 44 Years | 7,171 | 16.8% |
| 45 to 54 Years | 7,107 | 16.6% |
| 55 to 64 Years | 7,115 | 16.6% |
| 65 to 74 Years | 5,865 | 13.7% |
| 75 to 84 Years | 2,967 | 6.9% |
| 85 Years and Over | 1,361 | 3.2% |
| Total | 42,824 | 100.0% |
Housing Finances in Potter County
Median Income by Occupancy in Potter County
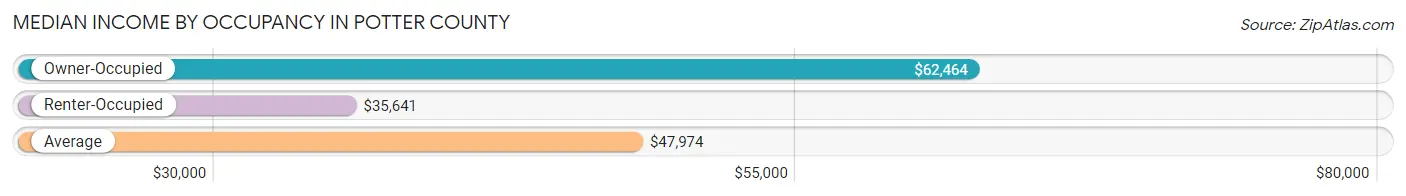
| Occupancy Type | # Households | Median Income |
| Owner-Occupied | 23,904 (55.8%) | $62,464 |
| Renter-Occupied | 18,920 (44.2%) | $35,641 |
| Average | 42,824 (100.0%) | $47,974 |
Occupancy by Householder Income Bracket in Potter County
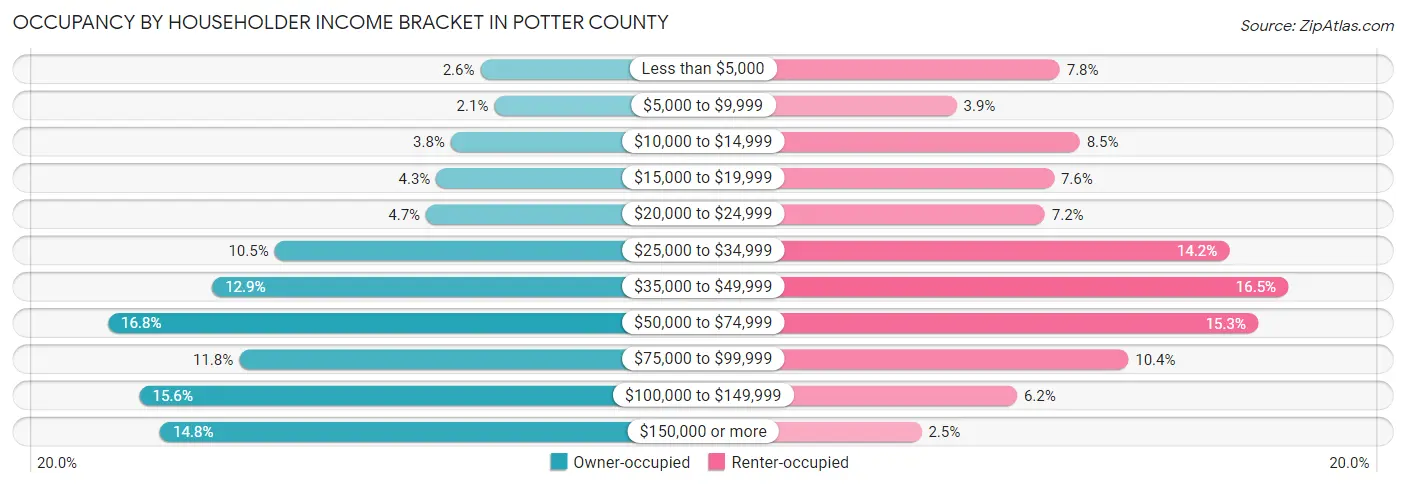
| Income Bracket | Owner-occupied | Renter-occupied |
| Less than $5,000 | 632 (2.6%) | 1,472 (7.8%) |
| $5,000 to $9,999 | 505 (2.1%) | 729 (3.8%) |
| $10,000 to $14,999 | 901 (3.8%) | 1,615 (8.5%) |
| $15,000 to $19,999 | 1,033 (4.3%) | 1,430 (7.6%) |
| $20,000 to $24,999 | 1,125 (4.7%) | 1,364 (7.2%) |
| $25,000 to $34,999 | 2,504 (10.5%) | 2,692 (14.2%) |
| $35,000 to $49,999 | 3,072 (12.9%) | 3,116 (16.5%) |
| $50,000 to $74,999 | 4,021 (16.8%) | 2,898 (15.3%) |
| $75,000 to $99,999 | 2,829 (11.8%) | 1,966 (10.4%) |
| $100,000 to $149,999 | 3,735 (15.6%) | 1,163 (6.1%) |
| $150,000 or more | 3,547 (14.8%) | 475 (2.5%) |
| Total | 23,904 (100.0%) | 18,920 (100.0%) |
Monthly Housing Cost Tiers in Potter County
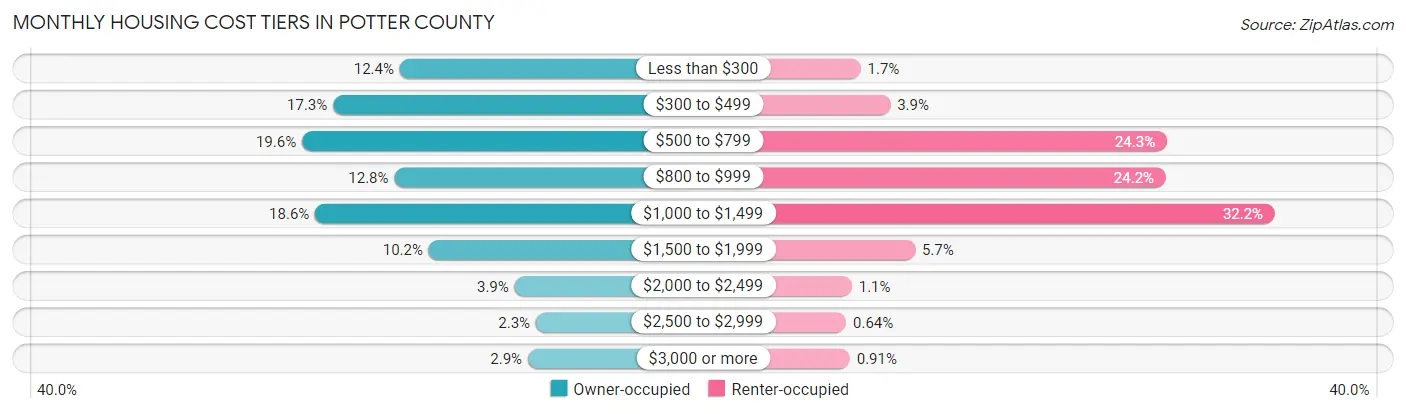
| Monthly Cost | Owner-occupied | Renter-occupied |
| Less than $300 | 2,957 (12.4%) | 324 (1.7%) |
| $300 to $499 | 4,131 (17.3%) | 736 (3.9%) |
| $500 to $799 | 4,678 (19.6%) | 4,591 (24.3%) |
| $800 to $999 | 3,052 (12.8%) | 4,577 (24.2%) |
| $1,000 to $1,499 | 4,445 (18.6%) | 6,096 (32.2%) |
| $1,500 to $1,999 | 2,445 (10.2%) | 1,081 (5.7%) |
| $2,000 to $2,499 | 935 (3.9%) | 201 (1.1%) |
| $2,500 to $2,999 | 560 (2.3%) | 122 (0.6%) |
| $3,000 or more | 701 (2.9%) | 173 (0.9%) |
| Total | 23,904 (100.0%) | 18,920 (100.0%) |
Physical Housing Characteristics in Potter County
Housing Structures in Potter County
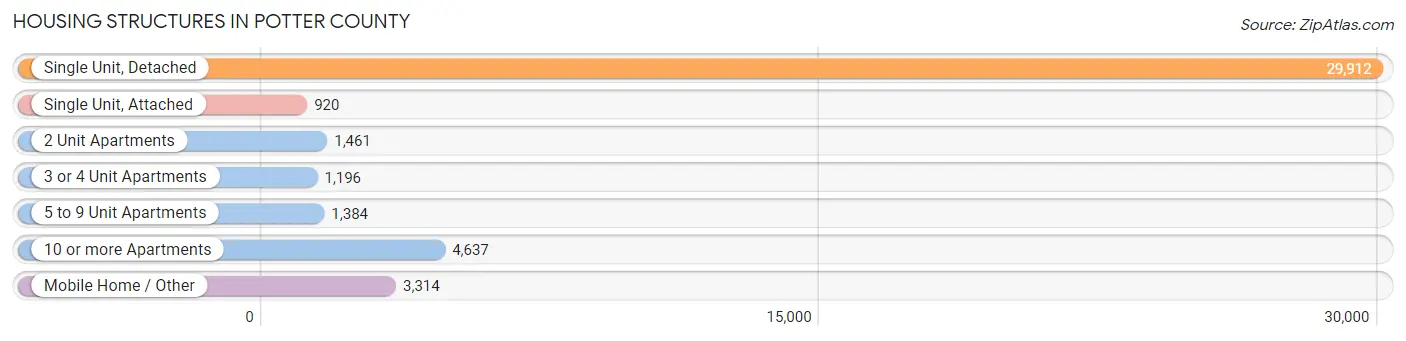
| Structure Type | # Housing Units | % Housing Units |
| Single Unit, Detached | 29,912 | 69.9% |
| Single Unit, Attached | 920 | 2.1% |
| 2 Unit Apartments | 1,461 | 3.4% |
| 3 or 4 Unit Apartments | 1,196 | 2.8% |
| 5 to 9 Unit Apartments | 1,384 | 3.2% |
| 10 or more Apartments | 4,637 | 10.8% |
| Mobile Home / Other | 3,314 | 7.7% |
| Total | 42,824 | 100.0% |
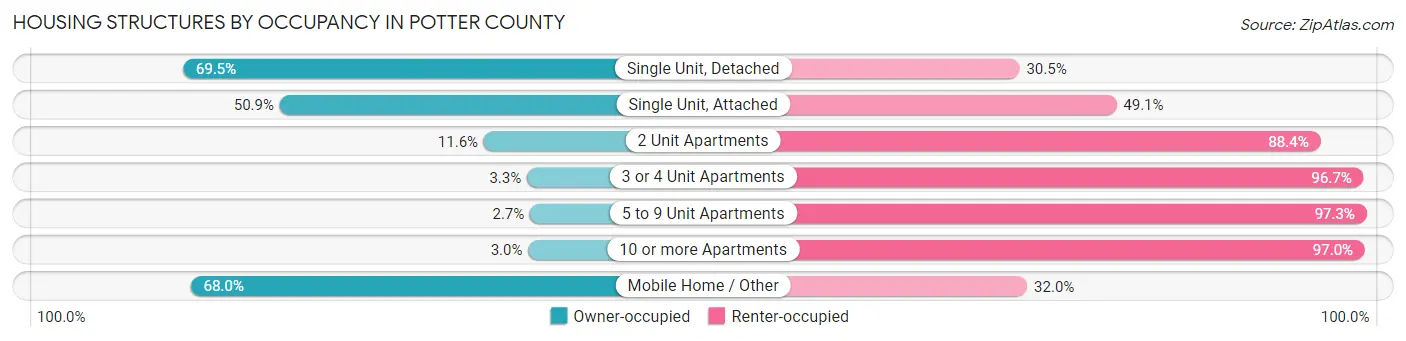
Housing Structures by Occupancy in Potter County
| Structure Type | Owner-occupied | Renter-occupied |
| Single Unit, Detached | 20,796 (69.5%) | 9,116 (30.5%) |
| Single Unit, Attached | 468 (50.9%) | 452 (49.1%) |
| 2 Unit Apartments | 169 (11.6%) | 1,292 (88.4%) |
| 3 or 4 Unit Apartments | 39 (3.3%) | 1,157 (96.7%) |
| 5 to 9 Unit Apartments | 37 (2.7%) | 1,347 (97.3%) |
| 10 or more Apartments | 140 (3.0%) | 4,497 (97.0%) |
| Mobile Home / Other | 2,255 (68.0%) | 1,059 (32.0%) |
| Total | 23,904 (55.8%) | 18,920 (44.2%) |
Housing Structures by Number of Rooms in Potter County
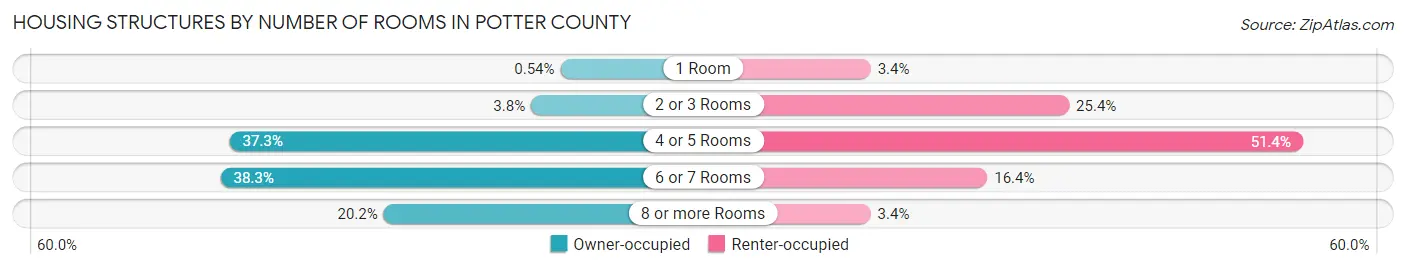
| Number of Rooms | Owner-occupied | Renter-occupied |
| 1 Room | 128 (0.5%) | 647 (3.4%) |
| 2 or 3 Rooms | 908 (3.8%) | 4,814 (25.4%) |
| 4 or 5 Rooms | 8,905 (37.2%) | 9,719 (51.4%) |
| 6 or 7 Rooms | 9,143 (38.3%) | 3,095 (16.4%) |
| 8 or more Rooms | 4,820 (20.2%) | 645 (3.4%) |
| Total | 23,904 (100.0%) | 18,920 (100.0%) |
Housing Structure by Heating Type in Potter County
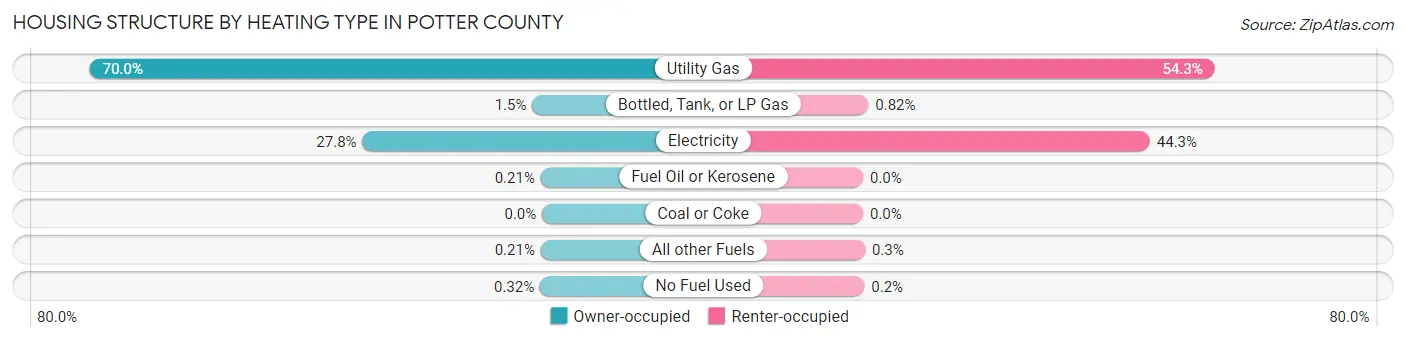
| Heating Type | Owner-occupied | Renter-occupied |
| Utility Gas | 16,724 (70.0%) | 10,282 (54.3%) |
| Bottled, Tank, or LP Gas | 363 (1.5%) | 156 (0.8%) |
| Electricity | 6,641 (27.8%) | 8,389 (44.3%) |
| Fuel Oil or Kerosene | 50 (0.2%) | 0 (0.0%) |
| Coal or Coke | 0 (0.0%) | 0 (0.0%) |
| All other Fuels | 50 (0.2%) | 56 (0.3%) |
| No Fuel Used | 76 (0.3%) | 37 (0.2%) |
| Total | 23,904 (100.0%) | 18,920 (100.0%) |
Household Vehicle Usage in Potter County
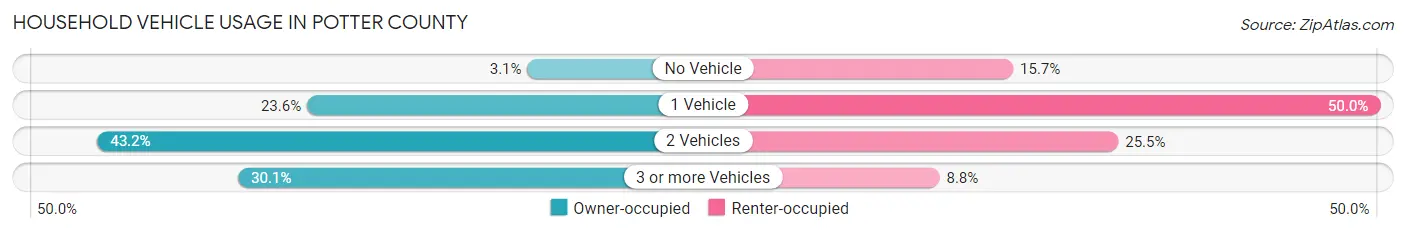
| Vehicles per Household | Owner-occupied | Renter-occupied |
| No Vehicle | 734 (3.1%) | 2,970 (15.7%) |
| 1 Vehicle | 5,651 (23.6%) | 9,452 (50.0%) |
| 2 Vehicles | 10,330 (43.2%) | 4,828 (25.5%) |
| 3 or more Vehicles | 7,189 (30.1%) | 1,670 (8.8%) |
| Total | 23,904 (100.0%) | 18,920 (100.0%) |
Real Estate & Mortgages in Potter County
Real Estate and Mortgage Overview in Potter County
| Characteristic | Without Mortgage | With Mortgage |
| Housing Units | 12,717 | 11,187 |
| Median Property Value | $99,400 | $142,500 |
| Median Household Income | $51,669 | $2,275 |
| Monthly Housing Costs | $473 | $658 |
| Real Estate Taxes | $1,500 | $340 |
Property Value by Mortgage Status in Potter County
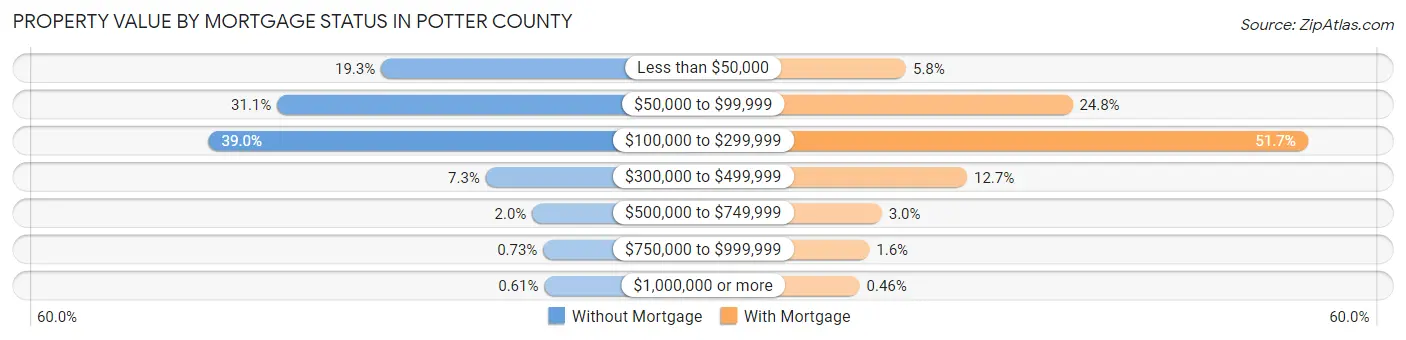
| Property Value | Without Mortgage | With Mortgage |
| Less than $50,000 | 2,449 (19.3%) | 646 (5.8%) |
| $50,000 to $99,999 | 3,960 (31.1%) | 2,773 (24.8%) |
| $100,000 to $299,999 | 4,954 (39.0%) | 5,779 (51.7%) |
| $300,000 to $499,999 | 930 (7.3%) | 1,425 (12.7%) |
| $500,000 to $749,999 | 253 (2.0%) | 336 (3.0%) |
| $750,000 to $999,999 | 93 (0.7%) | 177 (1.6%) |
| $1,000,000 or more | 78 (0.6%) | 51 (0.5%) |
| Total | 12,717 (100.0%) | 11,187 (100.0%) |
Household Income by Mortgage Status in Potter County
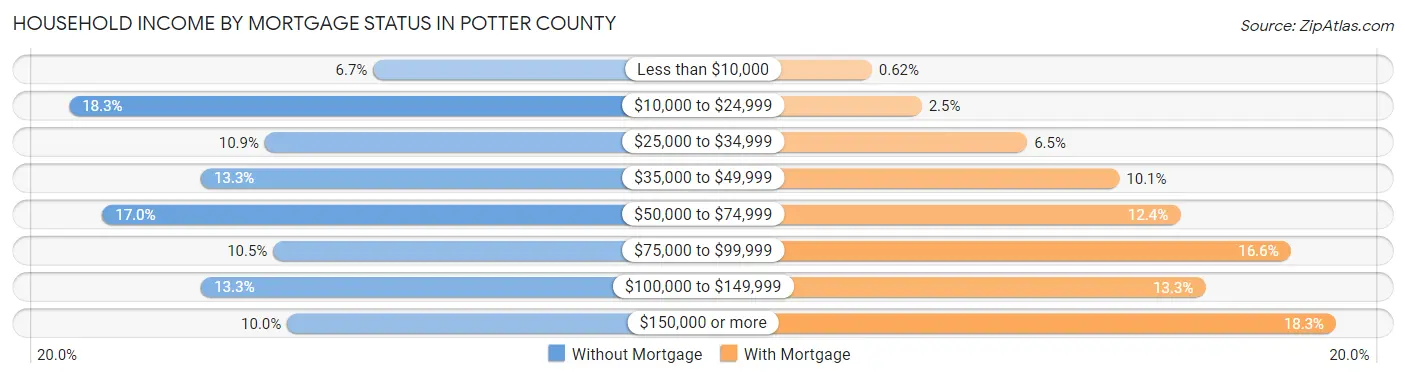
| Household Income | Without Mortgage | With Mortgage |
| Less than $10,000 | 855 (6.7%) | 69 (0.6%) |
| $10,000 to $24,999 | 2,327 (18.3%) | 282 (2.5%) |
| $25,000 to $34,999 | 1,380 (10.8%) | 732 (6.5%) |
| $35,000 to $49,999 | 1,689 (13.3%) | 1,124 (10.1%) |
| $50,000 to $74,999 | 2,167 (17.0%) | 1,383 (12.4%) |
| $75,000 to $99,999 | 1,339 (10.5%) | 1,854 (16.6%) |
| $100,000 to $149,999 | 1,688 (13.3%) | 1,490 (13.3%) |
| $150,000 or more | 1,272 (10.0%) | 2,047 (18.3%) |
| Total | 12,717 (100.0%) | 11,187 (100.0%) |
Property Value to Household Income Ratio in Potter County
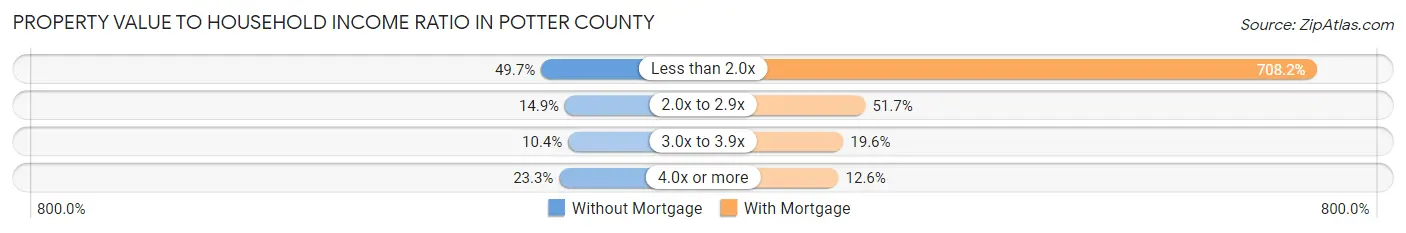
| Value-to-Income Ratio | Without Mortgage | With Mortgage |
| Less than 2.0x | 6,323 (49.7%) | 79,226 (708.2%) |
| 2.0x to 2.9x | 1,896 (14.9%) | 5,778 (51.6%) |
| 3.0x to 3.9x | 1,320 (10.4%) | 2,187 (19.6%) |
| 4.0x or more | 2,961 (23.3%) | 1,413 (12.6%) |
| Total | 12,717 (100.0%) | 11,187 (100.0%) |
Real Estate Taxes by Mortgage Status in Potter County
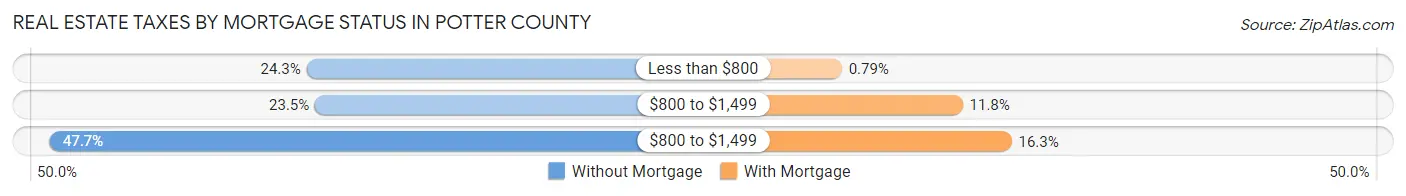
| Property Taxes | Without Mortgage | With Mortgage |
| Less than $800 | 3,084 (24.2%) | 88 (0.8%) |
| $800 to $1,499 | 2,985 (23.5%) | 1,323 (11.8%) |
| $800 to $1,499 | 6,065 (47.7%) | 1,824 (16.3%) |
| Total | 12,717 (100.0%) | 11,187 (100.0%) |
Health & Disability in Potter County
Health Insurance Coverage by Age in Potter County
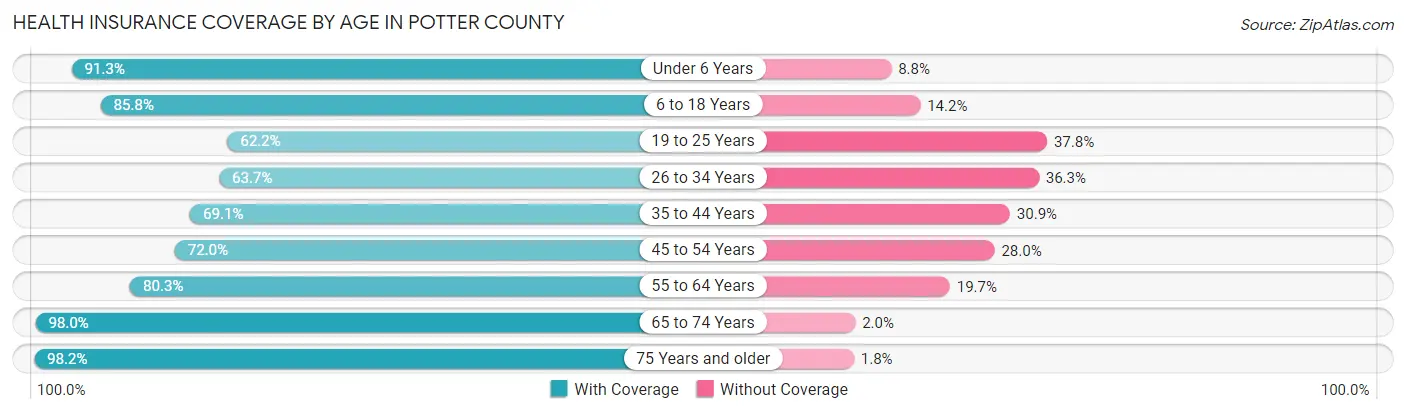
| Age Bracket | With Coverage | Without Coverage |
| Under 6 Years | 9,078 (91.2%) | 871 (8.7%) |
| 6 to 18 Years | 19,681 (85.8%) | 3,247 (14.2%) |
| 19 to 25 Years | 6,770 (62.2%) | 4,114 (37.8%) |
| 26 to 34 Years | 9,207 (63.7%) | 5,240 (36.3%) |
| 35 to 44 Years | 9,782 (69.1%) | 4,371 (30.9%) |
| 45 to 54 Years | 8,688 (72.0%) | 3,381 (28.0%) |
| 55 to 64 Years | 9,644 (80.3%) | 2,361 (19.7%) |
| 65 to 74 Years | 8,639 (98.0%) | 179 (2.0%) |
| 75 Years and older | 5,903 (98.2%) | 107 (1.8%) |
| Total | 87,392 (78.5%) | 23,871 (21.4%) |
Health Insurance Coverage by Citizenship Status in Potter County
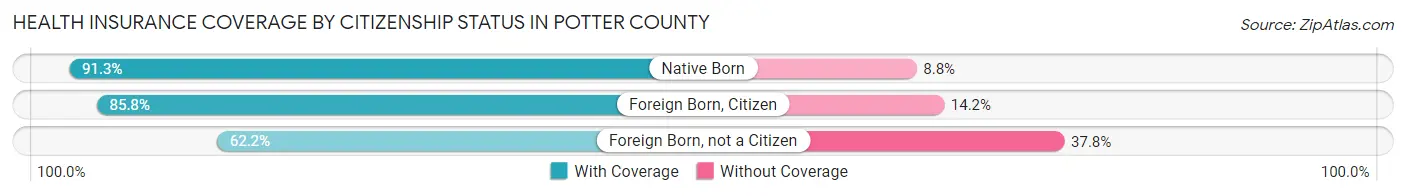
| Citizenship Status | With Coverage | Without Coverage |
| Native Born | 9,078 (91.2%) | 871 (8.7%) |
| Foreign Born, Citizen | 19,681 (85.8%) | 3,247 (14.2%) |
| Foreign Born, not a Citizen | 6,770 (62.2%) | 4,114 (37.8%) |
Health Insurance Coverage by Household Income in Potter County
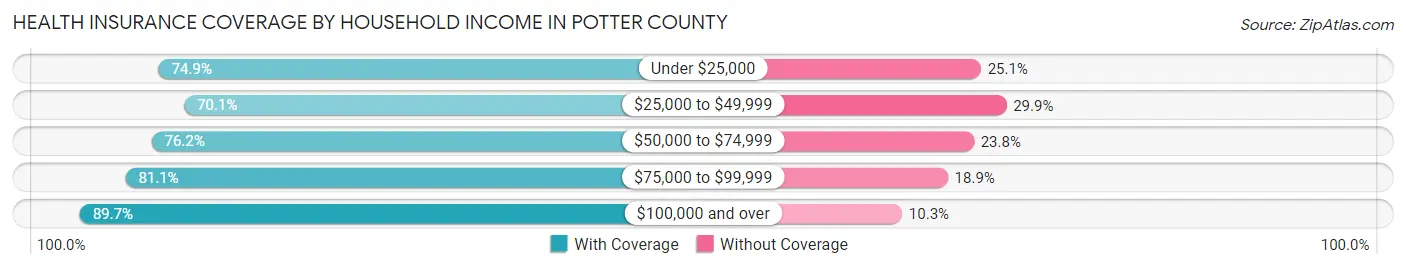
| Household Income | With Coverage | Without Coverage |
| Under $25,000 | 14,513 (74.9%) | 4,861 (25.1%) |
| $25,000 to $49,999 | 20,008 (70.1%) | 8,523 (29.9%) |
| $50,000 to $74,999 | 15,040 (76.2%) | 4,693 (23.8%) |
| $75,000 to $99,999 | 10,883 (81.1%) | 2,537 (18.9%) |
| $100,000 and over | 26,738 (89.7%) | 3,079 (10.3%) |
Public vs Private Health Insurance Coverage by Age in Potter County
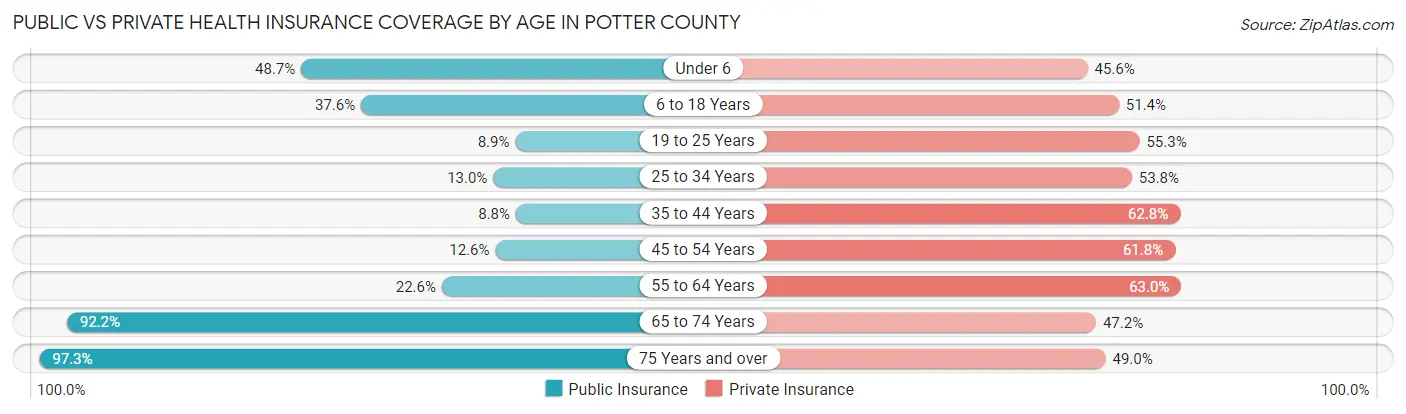
| Age Bracket | Public Insurance | Private Insurance |
| Under 6 | 4,842 (48.7%) | 4,539 (45.6%) |
| 6 to 18 Years | 8,610 (37.6%) | 11,793 (51.4%) |
| 19 to 25 Years | 971 (8.9%) | 6,015 (55.3%) |
| 25 to 34 Years | 1,881 (13.0%) | 7,778 (53.8%) |
| 35 to 44 Years | 1,249 (8.8%) | 8,887 (62.8%) |
| 45 to 54 Years | 1,524 (12.6%) | 7,464 (61.8%) |
| 55 to 64 Years | 2,708 (22.6%) | 7,562 (63.0%) |
| 65 to 74 Years | 8,127 (92.2%) | 4,160 (47.2%) |
| 75 Years and over | 5,845 (97.3%) | 2,942 (48.9%) |
| Total | 35,757 (32.1%) | 61,140 (54.9%) |
Disability Status by Sex by Age in Potter County
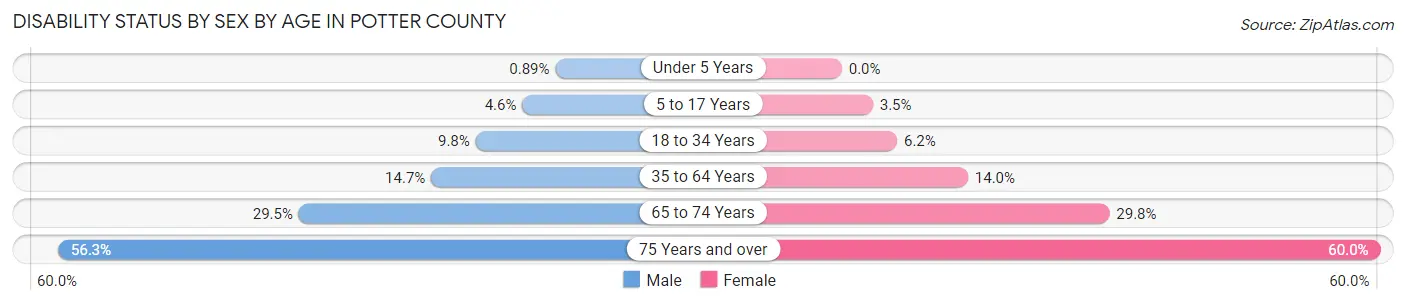
| Age Bracket | Male | Female |
| Under 5 Years | 38 (0.9%) | 0 (0.0%) |
| 5 to 17 Years | 544 (4.6%) | 398 (3.5%) |
| 18 to 34 Years | 1,306 (9.8%) | 807 (6.1%) |
| 35 to 64 Years | 2,763 (14.7%) | 2,731 (14.0%) |
| 65 to 74 Years | 1,208 (29.5%) | 1,406 (29.8%) |
| 75 Years and over | 1,356 (56.3%) | 2,160 (60.0%) |
Disability Class by Sex by Age in Potter County
Disability Class: Hearing Difficulty
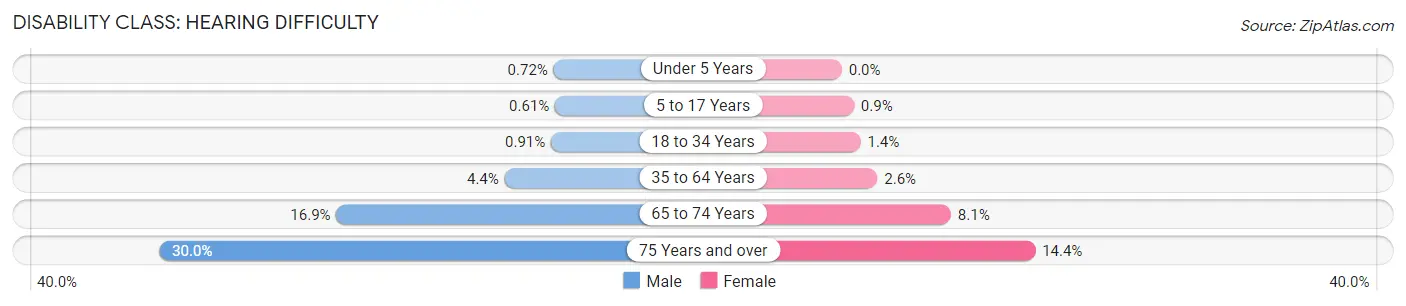
| Age Bracket | Male | Female |
| Under 5 Years | 31 (0.7%) | 0 (0.0%) |
| 5 to 17 Years | 73 (0.6%) | 104 (0.9%) |
| 18 to 34 Years | 122 (0.9%) | 182 (1.4%) |
| 35 to 64 Years | 818 (4.4%) | 514 (2.6%) |
| 65 to 74 Years | 691 (16.9%) | 382 (8.1%) |
| 75 Years and over | 723 (30.0%) | 517 (14.4%) |
Disability Class: Vision Difficulty
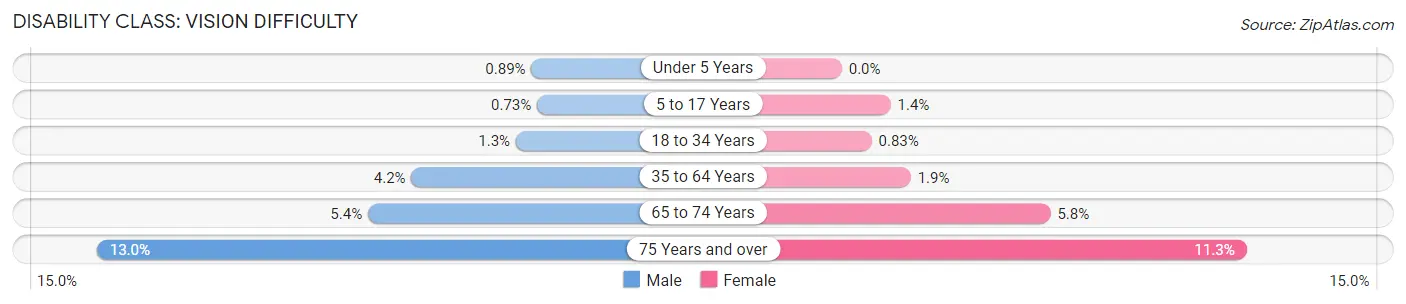
| Age Bracket | Male | Female |
| Under 5 Years | 38 (0.9%) | 0 (0.0%) |
| 5 to 17 Years | 87 (0.7%) | 157 (1.4%) |
| 18 to 34 Years | 176 (1.3%) | 109 (0.8%) |
| 35 to 64 Years | 795 (4.2%) | 374 (1.9%) |
| 65 to 74 Years | 223 (5.4%) | 274 (5.8%) |
| 75 Years and over | 313 (13.0%) | 406 (11.3%) |
Disability Class: Cognitive Difficulty
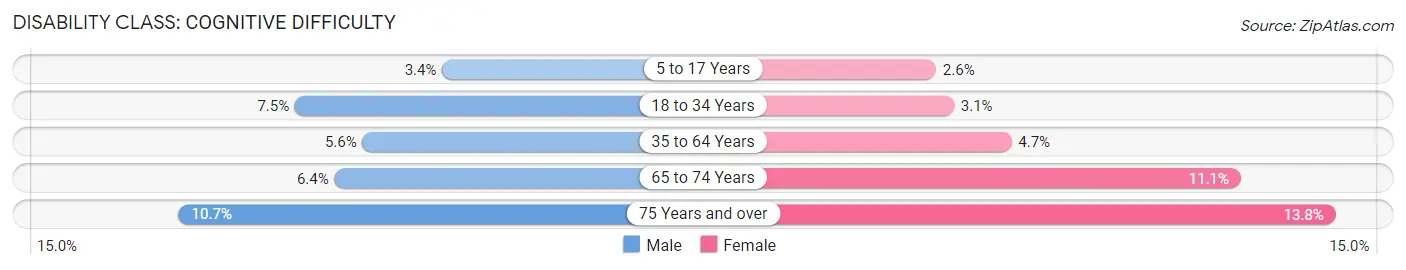
| Age Bracket | Male | Female |
| 5 to 17 Years | 402 (3.4%) | 302 (2.6%) |
| 18 to 34 Years | 998 (7.5%) | 409 (3.1%) |
| 35 to 64 Years | 1,049 (5.6%) | 919 (4.7%) |
| 65 to 74 Years | 261 (6.4%) | 524 (11.1%) |
| 75 Years and over | 258 (10.7%) | 495 (13.8%) |
Disability Class: Ambulatory Difficulty
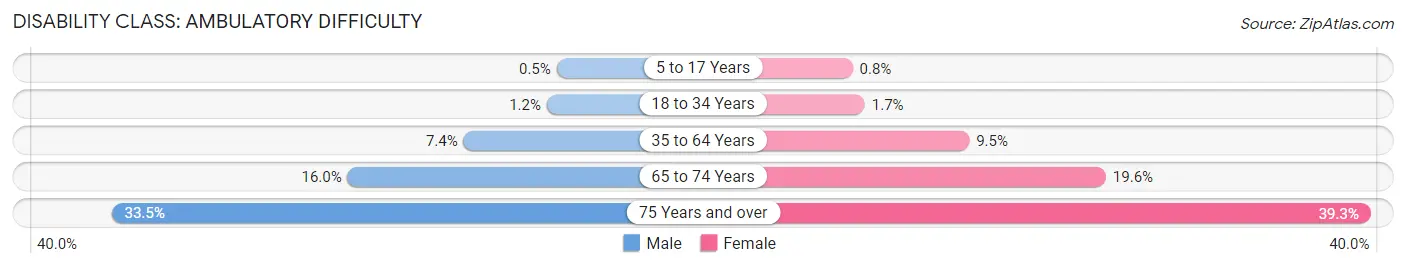
| Age Bracket | Male | Female |
| 5 to 17 Years | 59 (0.5%) | 92 (0.8%) |
| 18 to 34 Years | 164 (1.2%) | 224 (1.7%) |
| 35 to 64 Years | 1,391 (7.4%) | 1,840 (9.5%) |
| 65 to 74 Years | 657 (16.0%) | 925 (19.6%) |
| 75 Years and over | 808 (33.5%) | 1,414 (39.3%) |
Disability Class: Self-Care Difficulty
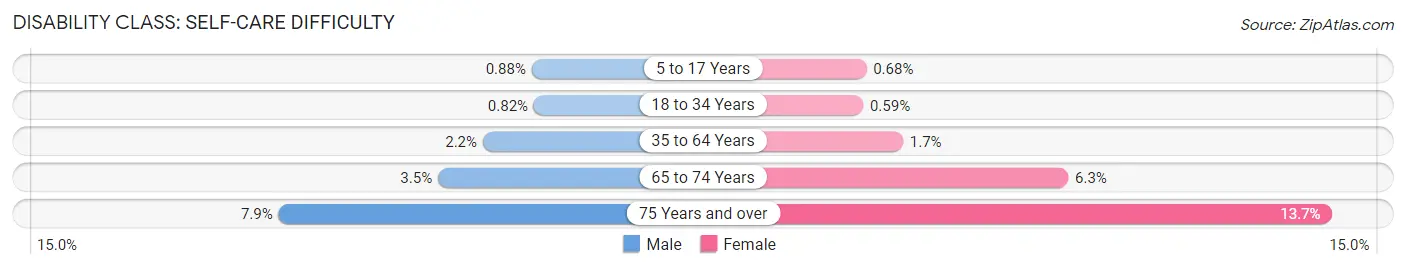
| Age Bracket | Male | Female |
| 5 to 17 Years | 105 (0.9%) | 79 (0.7%) |
| 18 to 34 Years | 109 (0.8%) | 78 (0.6%) |
| 35 to 64 Years | 420 (2.2%) | 330 (1.7%) |
| 65 to 74 Years | 143 (3.5%) | 297 (6.3%) |
| 75 Years and over | 191 (7.9%) | 492 (13.7%) |
Technology Access in Potter County
Computing Device Access in Potter County
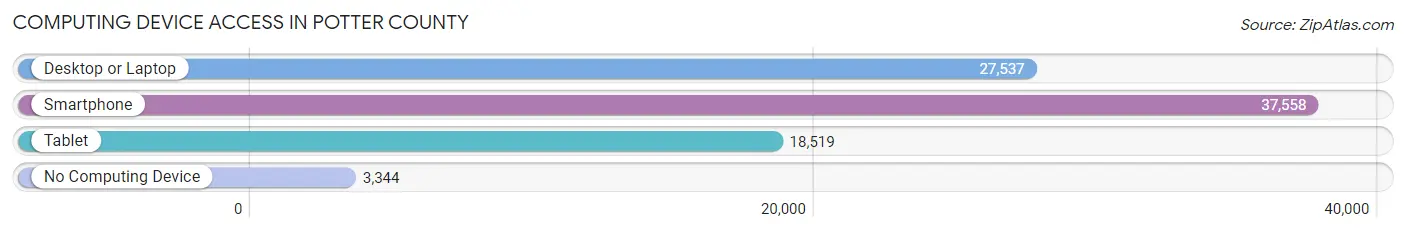
| Device Type | # Households | % Households |
| Desktop or Laptop | 27,537 | 64.3% |
| Smartphone | 37,558 | 87.7% |
| Tablet | 18,519 | 43.2% |
| No Computing Device | 3,344 | 7.8% |
| Total | 42,824 | 100.0% |
Internet Access in Potter County
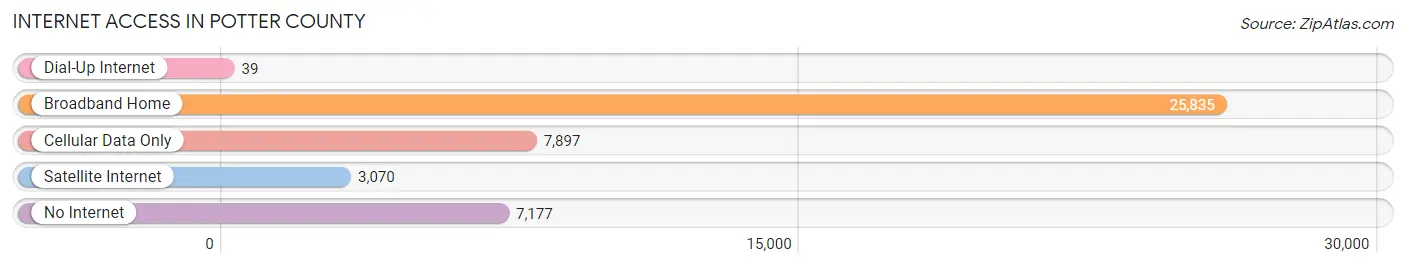
| Internet Type | # Households | % Households |
| Dial-Up Internet | 39 | 0.1% |
| Broadband Home | 25,835 | 60.3% |
| Cellular Data Only | 7,897 | 18.4% |
| Satellite Internet | 3,070 | 7.2% |
| No Internet | 7,177 | 16.8% |
| Total | 42,824 | 100.0% |
Potter County Summary
Potter County is located in the northern part of the Texas Panhandle, in the United States. It is bordered by Randall County to the north, Moore County to the east, Carson County to the south, and Oldham County to the west. The county seat is Amarillo, which is also the largest city in the county. Potter County covers an area of 902 square miles and has a population of 121,073, as of the 2020 census.
History
Potter County was established in 1876, and was named after Robert Potter, a signer of the Texas Declaration of Independence. The county was originally part of Bexar County, but was later divided into several smaller counties. The first settlers in the area were ranchers, who were attracted by the abundance of grasslands and water. The first town in the county was established in 1877, and was named Amarillo, after the Spanish word for yellow.
The county experienced rapid growth in the early 20th century, due to the discovery of oil and natural gas in the area. The discovery of oil and natural gas led to the development of the Amarillo oilfield, which is still one of the largest oilfields in the United States. The county also experienced a population boom during this time, as people moved to the area to take advantage of the economic opportunities.
Geography
Potter County is located in the northern part of the Texas Panhandle, and is bordered by Randall County to the north, Moore County to the east, Carson County to the south, and Oldham County to the west. The county covers an area of 902 square miles, and is mostly flat, with some rolling hills in the western part of the county. The county is home to several lakes, including Lake Meredith, Lake Tanglewood, and Lake Greenbelt.
The county is also home to several state parks, including Palo Duro Canyon State Park, which is the second-largest canyon in the United States. The county is also home to the Alibates Flint Quarries National Monument, which is a site of ancient flint quarries used by Native Americans.
Economy
Potter County has a diverse economy, with a mix of agriculture, manufacturing, and services. The county is home to several large employers, including Tyson Foods, Bell Helicopter, and Pantex. The county is also home to several oil and gas companies, including XTO Energy, Chevron, and ConocoPhillips.
Agriculture is an important part of the county's economy, with cattle, wheat, and cotton being the main crops. The county is also home to several wineries, and is a popular destination for wine-tasting tours.
Demographics
As of the 2020 census, Potter County had a population of 121,073. The population is predominantly white (83.3%), with a small Hispanic population (14.2%). The median household income in the county is $50,945, and the median home value is $133,400. The county has a poverty rate of 13.3%, and the unemployment rate is 3.7%.
Conclusion
Potter County is located in the northern part of the Texas Panhandle, and is home to a diverse economy and population. The county is home to several large employers, and is a popular destination for wine-tasting tours. The county has a population of 121,073, and a median household income of $50,945. Potter County is an important part of the Texas Panhandle, and is a great place to live and work.
Common Questions
What is Per Capita Income in Potter County?
Per Capita income in Potter County is $26,406.
What is the Median Family Income in Potter County?
Median Family Income in Potter County is $60,157.
What is the Median Household income in Potter County?
Median Household Income in Potter County is $47,974.
What is Income or Wage Gap in Potter County?
Income or Wage Gap in Potter County is 24.7%.
Women in Potter County earn 75.3 cents for every dollar earned by a man.
What is Family Income Deficit in Potter County?
Family Income Deficit in Potter County is $10,774.
Families that are below poverty line in Potter County earn $10,774 less on average than the poverty threshold level.
What is Inequality or Gini Index in Potter County?
Inequality or Gini Index in Potter County is 0.49.
What is the Total Population of Potter County?
Total Population of Potter County is 117,905.
What is the Total Male Population of Potter County?
Total Male Population of Potter County is 60,843.
What is the Total Female Population of Potter County?
Total Female Population of Potter County is 57,062.
What is the Ratio of Males per 100 Females in Potter County?
There are 106.63 Males per 100 Females in Potter County.
What is the Ratio of Females per 100 Males in Potter County?
There are 93.79 Females per 100 Males in Potter County.
What is the Median Population Age in Potter County?
Median Population Age in Potter County is 34.5 Years.
What is the Average Family Size in Potter County
Average Family Size in Potter County is 3.4 People.
What is the Average Household Size in Potter County
Average Household Size in Potter County is 2.6 People.
How Large is the Labor Force in Potter County?
There are 52,044 People in the Labor Forcein in Potter County.
What is the Percentage of People in the Labor Force in Potter County?
58.0% of People are in the Labor Force in Potter County.
What is the Unemployment Rate in Potter County?
Unemployment Rate in Potter County is 3.7%.