Polk County, TX Map & Demographics
Polk County Map
Polk County Overview
$27,922
PER CAPITA INCOME
$66,568
AVG FAMILY INCOME
$57,315
AVG HOUSEHOLD INCOME
41.9%
WAGE / INCOME GAP [ % ]
58.1¢/ $1
WAGE / INCOME GAP [ $ ]
$12,071
FAMILY INCOME DEFICIT
0.44
INEQUALITY / GINI INDEX
50,536
TOTAL POPULATION
27,262
MALE POPULATION
23,274
FEMALE POPULATION
117.14
MALES / 100 FEMALES
85.37
FEMALES / 100 MALES
43.8
MEDIAN AGE
3.1
AVG FAMILY SIZE
2.6
AVG HOUSEHOLD SIZE
20,200
LABOR FORCE [ PEOPLE ]
48.5%
PERCENT IN LABOR FORCE
9.3%
UNEMPLOYMENT RATE
Polk County Area Codes
Income in Polk County
Income Overview in Polk County
Per Capita Income in Polk County is $27,922, while median incomes of families and households are $66,568 and $57,315 respectively.
| Characteristic | Number | Measure |
| Per Capita Income | 50,536 | $27,922 |
| Median Family Income | 12,572 | $66,568 |
| Mean Family Income | 12,572 | $85,074 |
| Median Household Income | 18,084 | $57,315 |
| Mean Household Income | 18,084 | $74,127 |
| Income Deficit | 12,572 | $12,071 |
| Wage / Income Gap (%) | 50,536 | 41.89% |
| Wage / Income Gap ($) | 50,536 | 58.11¢ per $1 |
| Gini / Inequality Index | 50,536 | 0.44 |
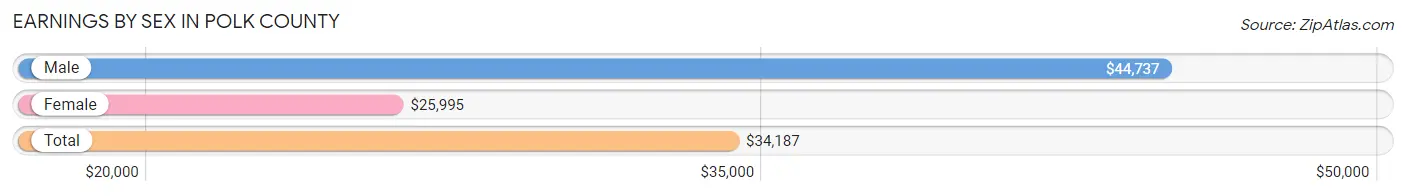
Earnings by Sex in Polk County
Average Earnings in Polk County are $34,187, $44,737 for men and $25,995 for women, a difference of 41.9%.
| Sex | Number | Average Earnings |
| Male | 11,581 (55.5%) | $44,737 |
| Female | 9,273 (44.5%) | $25,995 |
| Total | 20,854 (100.0%) | $34,187 |
Earnings by Sex by Income Bracket in Polk County
The most common earnings brackets in Polk County are $100,000+ for men (1,749 | 15.1%) and $30,000 to $34,999 for women (759 | 8.2%).
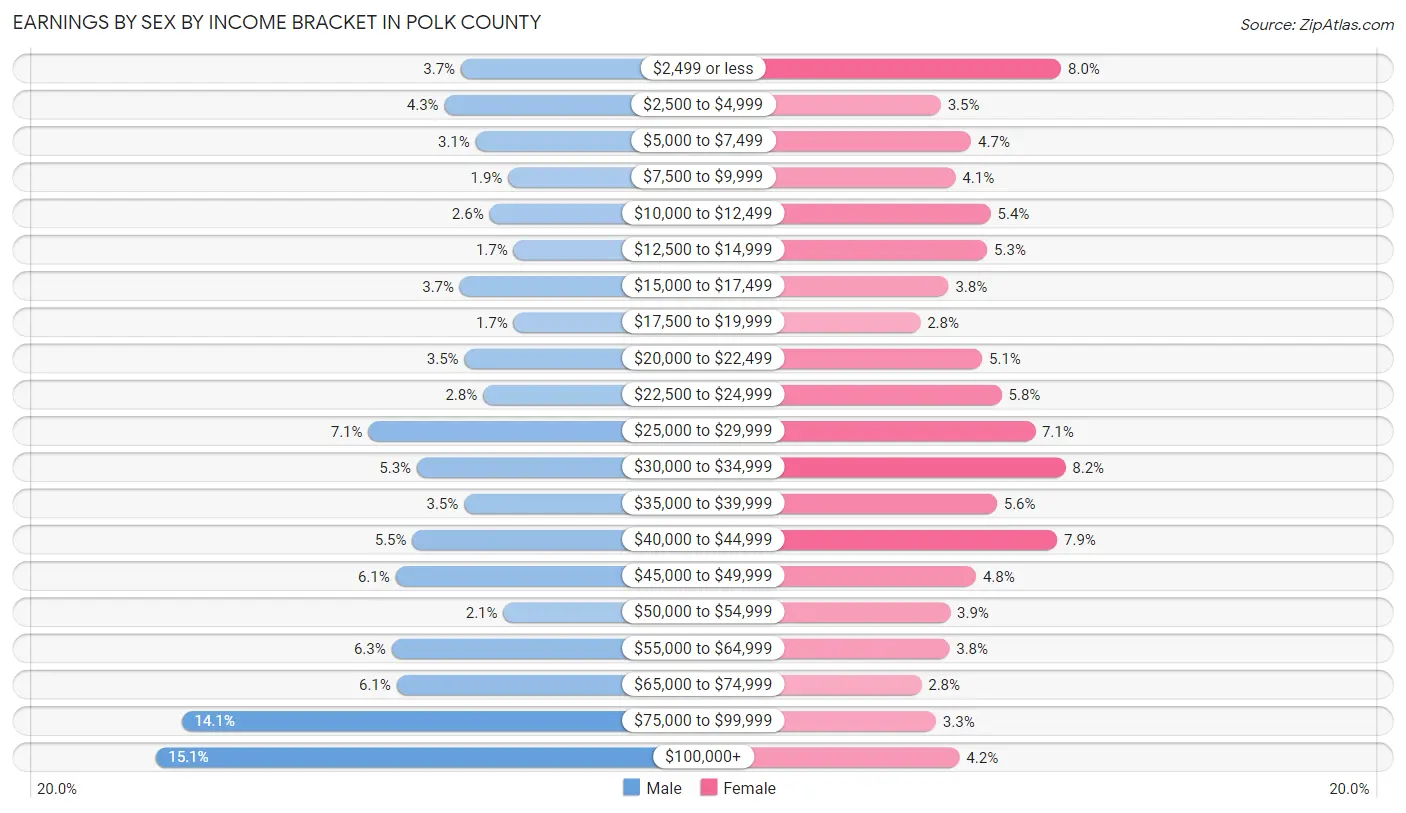
| Income | Male | Female |
| $2,499 or less | 423 (3.6%) | 745 (8.0%) |
| $2,500 to $4,999 | 494 (4.3%) | 326 (3.5%) |
| $5,000 to $7,499 | 359 (3.1%) | 432 (4.7%) |
| $7,500 to $9,999 | 218 (1.9%) | 377 (4.1%) |
| $10,000 to $12,499 | 299 (2.6%) | 500 (5.4%) |
| $12,500 to $14,999 | 195 (1.7%) | 488 (5.3%) |
| $15,000 to $17,499 | 427 (3.7%) | 353 (3.8%) |
| $17,500 to $19,999 | 194 (1.7%) | 255 (2.8%) |
| $20,000 to $22,499 | 408 (3.5%) | 470 (5.1%) |
| $22,500 to $24,999 | 327 (2.8%) | 538 (5.8%) |
| $25,000 to $29,999 | 825 (7.1%) | 654 (7.0%) |
| $30,000 to $34,999 | 614 (5.3%) | 759 (8.2%) |
| $35,000 to $39,999 | 409 (3.5%) | 521 (5.6%) |
| $40,000 to $44,999 | 634 (5.5%) | 731 (7.9%) |
| $45,000 to $49,999 | 706 (6.1%) | 449 (4.8%) |
| $50,000 to $54,999 | 239 (2.1%) | 359 (3.9%) |
| $55,000 to $64,999 | 724 (6.2%) | 356 (3.8%) |
| $65,000 to $74,999 | 702 (6.1%) | 259 (2.8%) |
| $75,000 to $99,999 | 1,635 (14.1%) | 310 (3.3%) |
| $100,000+ | 1,749 (15.1%) | 391 (4.2%) |
| Total | 11,581 (100.0%) | 9,273 (100.0%) |
Earnings by Sex by Educational Attainment in Polk County
Average earnings in Polk County are $48,499 for men and $30,386 for women, a difference of 37.3%. Men with an educational attainment of bachelor's degree enjoy the highest average annual earnings of $76,776, while those with less than high school education earn the least with $41,185. Women with an educational attainment of graduate degree earn the most with the average annual earnings of $66,953, while those with less than high school education have the smallest earnings of $19,104.
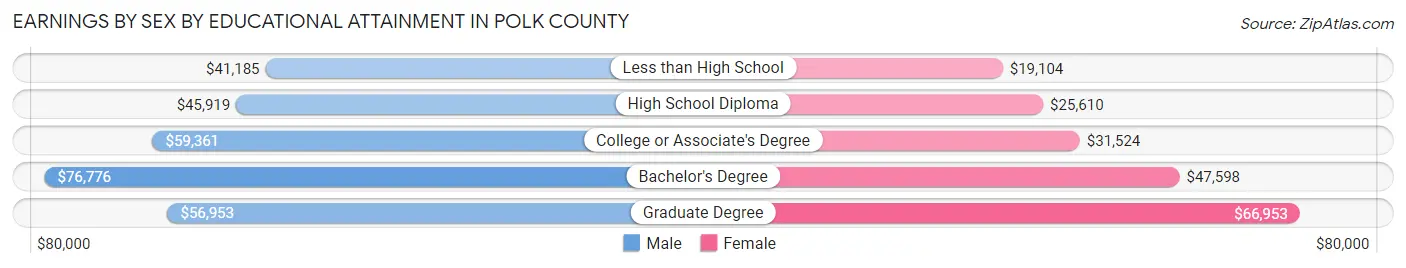
| Educational Attainment | Male Income | Female Income |
| Less than High School | $41,185 | $19,104 |
| High School Diploma | $45,919 | $25,610 |
| College or Associate's Degree | $59,361 | $31,524 |
| Bachelor's Degree | $76,776 | $47,598 |
| Graduate Degree | $56,953 | $66,953 |
| Total | $48,499 | $30,386 |
Family Income in Polk County
Family Income Brackets in Polk County
According to the Polk County family income data, there are 2,678 families falling into the $50,000 to $74,999 income range, which is the most common income bracket and makes up 21.3% of all families. Conversely, the $10,000 to $14,999 income bracket is the least frequent group with only 365 families (2.9%) belonging to this category.
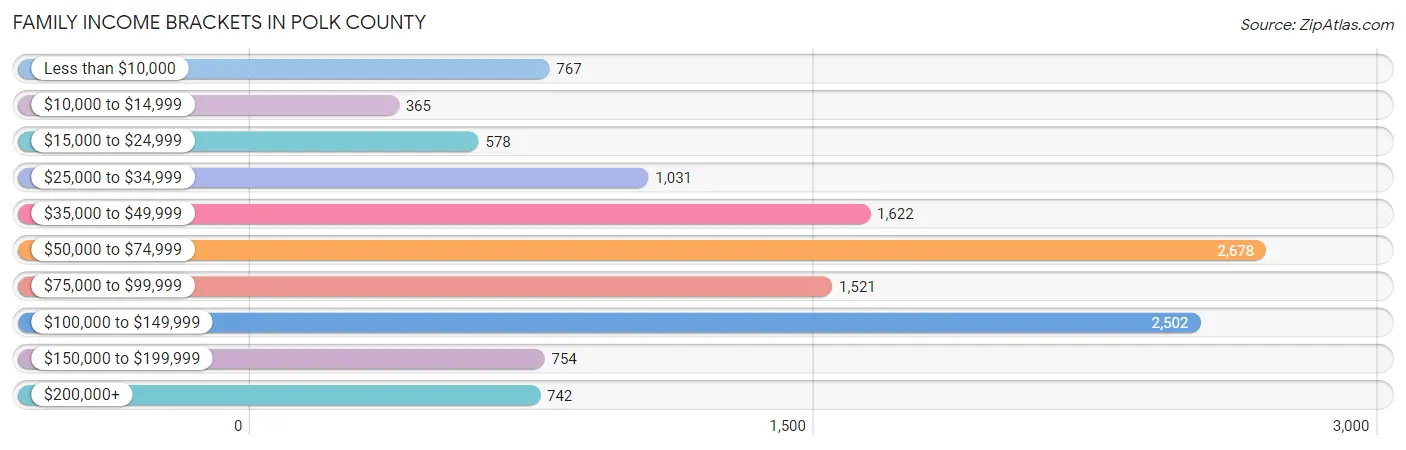
| Income Bracket | # Families | % Families |
| Less than $10,000 | 767 | 6.1% |
| $10,000 to $14,999 | 365 | 2.9% |
| $15,000 to $24,999 | 578 | 4.6% |
| $25,000 to $34,999 | 1,031 | 8.2% |
| $35,000 to $49,999 | 1,622 | 12.9% |
| $50,000 to $74,999 | 2,678 | 21.3% |
| $75,000 to $99,999 | 1,521 | 12.1% |
| $100,000 to $149,999 | 2,502 | 19.9% |
| $150,000 to $199,999 | 754 | 6.0% |
| $200,000+ | 742 | 5.9% |
Family Income by Famaliy Size in Polk County
5-person families (914 | 7.3%) account for the highest median family income in Polk County with $99,444 per family, while 2-person families (5,928 | 47.1%) have the highest median income of $31,485 per family member.
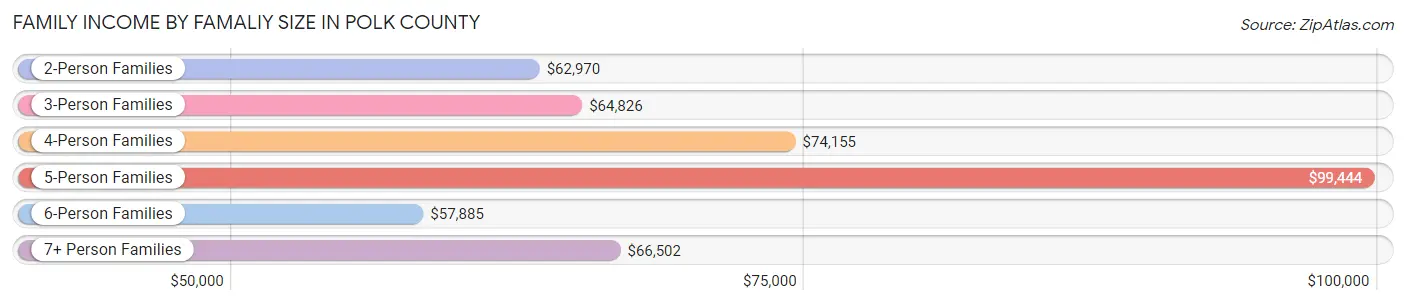
| Income Bracket | # Families | Median Income |
| 2-Person Families | 5,928 (47.1%) | $62,970 |
| 3-Person Families | 2,858 (22.7%) | $64,826 |
| 4-Person Families | 2,221 (17.7%) | $74,155 |
| 5-Person Families | 914 (7.3%) | $99,444 |
| 6-Person Families | 290 (2.3%) | $57,885 |
| 7+ Person Families | 361 (2.9%) | $66,502 |
| Total | 12,572 (100.0%) | $66,568 |
Family Income by Number of Earners in Polk County
The median family income in Polk County is $66,568, with families comprising 3+ earners (923) having the highest median family income of $136,250, while families with no earners (2,875) have the lowest median family income of $41,720, accounting for 7.3% and 22.9% of families, respectively.
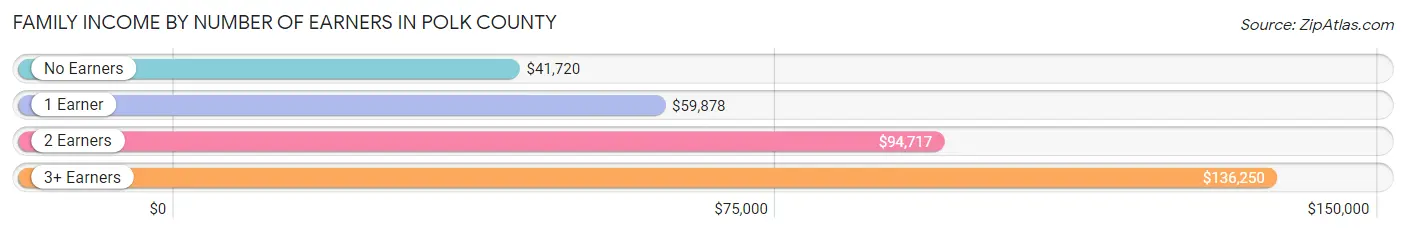
| Number of Earners | # Families | Median Income |
| No Earners | 2,875 (22.9%) | $41,720 |
| 1 Earner | 4,675 (37.2%) | $59,878 |
| 2 Earners | 4,099 (32.6%) | $94,717 |
| 3+ Earners | 923 (7.3%) | $136,250 |
| Total | 12,572 (100.0%) | $66,568 |
Household Income in Polk County
Household Income Brackets in Polk County
With 3,563 households falling in the category, the $50,000 to $74,999 income range is the most frequent in Polk County, accounting for 19.7% of all households. In contrast, only 814 households (4.5%) fall into the $200,000+ income bracket, making it the least populous group.
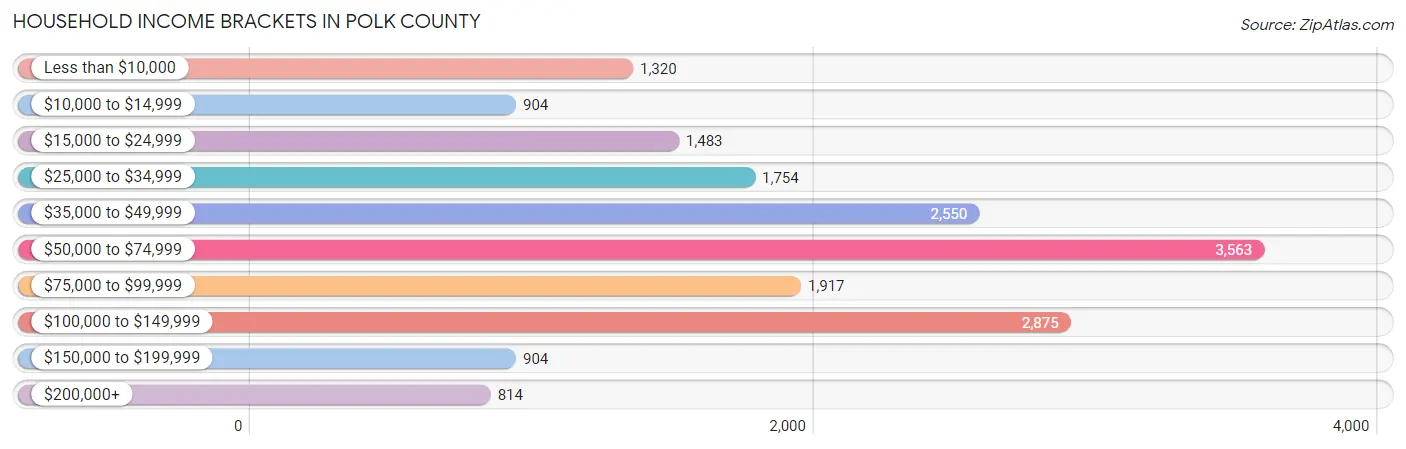
| Income Bracket | # Households | % Households |
| Less than $10,000 | 1,320 | 7.3% |
| $10,000 to $14,999 | 904 | 5.0% |
| $15,000 to $24,999 | 1,483 | 8.2% |
| $25,000 to $34,999 | 1,754 | 9.7% |
| $35,000 to $49,999 | 2,550 | 14.1% |
| $50,000 to $74,999 | 3,563 | 19.7% |
| $75,000 to $99,999 | 1,917 | 10.6% |
| $100,000 to $149,999 | 2,875 | 15.9% |
| $150,000 to $199,999 | 904 | 5.0% |
| $200,000+ | 814 | 4.5% |
Household Income by Householder Age in Polk County
The median household income in Polk County is $57,315, with the highest median household income of $72,130 found in the 25 to 44 years age bracket for the primary householder. A total of 4,246 households (23.5%) fall into this category. Meanwhile, the 15 to 24 years age bracket for the primary householder has the lowest median household income of $34,597, with 501 households (2.8%) in this group.
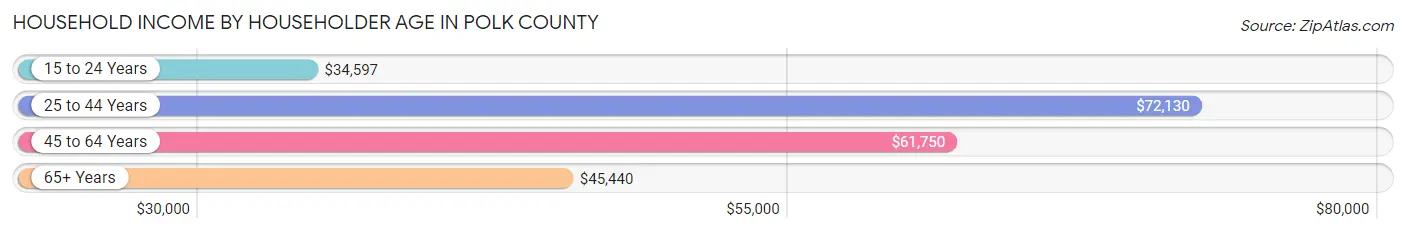
| Income Bracket | # Households | Median Income |
| 15 to 24 Years | 501 (2.8%) | $34,597 |
| 25 to 44 Years | 4,246 (23.5%) | $72,130 |
| 45 to 64 Years | 7,712 (42.6%) | $61,750 |
| 65+ Years | 5,625 (31.1%) | $45,440 |
| Total | 18,084 (100.0%) | $57,315 |
Poverty in Polk County
Income Below Poverty by Sex and Age in Polk County
With 13.4% poverty level for males and 19.4% for females among the residents of Polk County, under 5 year old males and 12 to 14 year old females are the most vulnerable to poverty, with 504 males (39.8%) and 397 females (37.3%) in their respective age groups living below the poverty level.
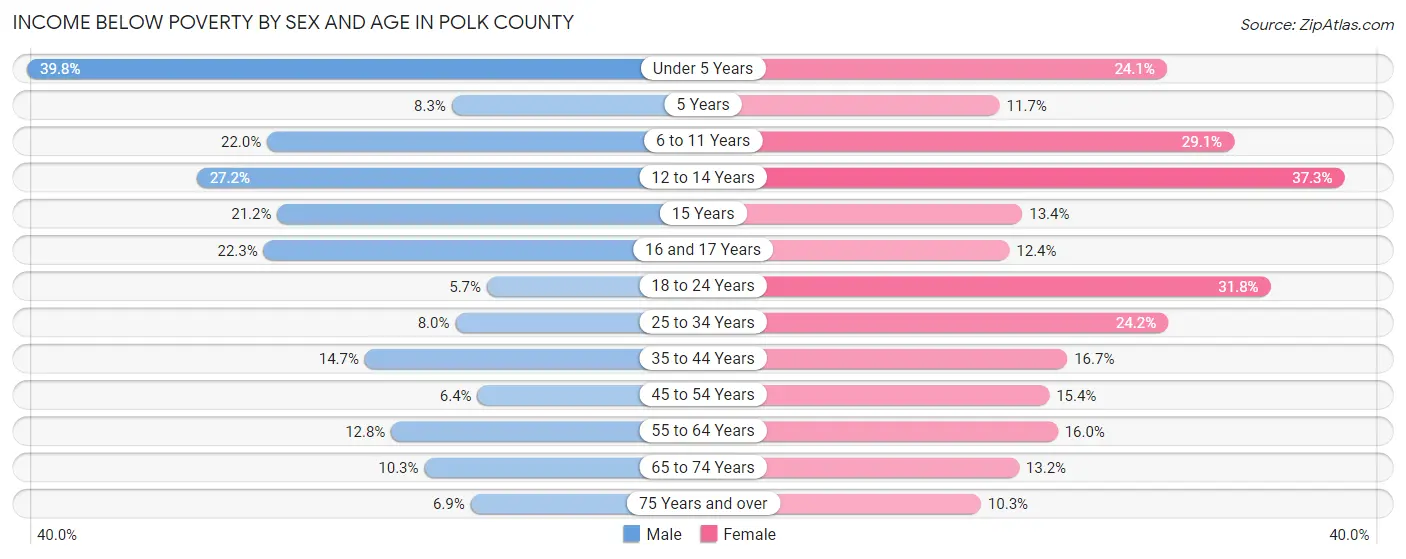
| Age Bracket | Male | Female |
| Under 5 Years | 504 (39.8%) | 301 (24.1%) |
| 5 Years | 32 (8.3%) | 15 (11.7%) |
| 6 to 11 Years | 354 (22.0%) | 448 (29.1%) |
| 12 to 14 Years | 288 (27.2%) | 397 (37.3%) |
| 15 Years | 55 (21.2%) | 26 (13.4%) |
| 16 and 17 Years | 132 (22.3%) | 84 (12.4%) |
| 18 to 24 Years | 108 (5.7%) | 533 (31.8%) |
| 25 to 34 Years | 205 (8.0%) | 548 (24.2%) |
| 35 to 44 Years | 388 (14.7%) | 430 (16.7%) |
| 45 to 54 Years | 190 (6.4%) | 442 (15.4%) |
| 55 to 64 Years | 497 (12.8%) | 697 (16.0%) |
| 65 to 74 Years | 353 (10.3%) | 412 (13.2%) |
| 75 Years and over | 87 (6.9%) | 128 (10.3%) |
| Total | 3,193 (13.4%) | 4,461 (19.4%) |
Income Above Poverty by Sex and Age in Polk County
According to the poverty statistics in Polk County, males aged 18 to 24 years and females aged 75 years and over are the age groups that are most secure financially, with 94.3% of males and 89.7% of females in these age groups living above the poverty line.
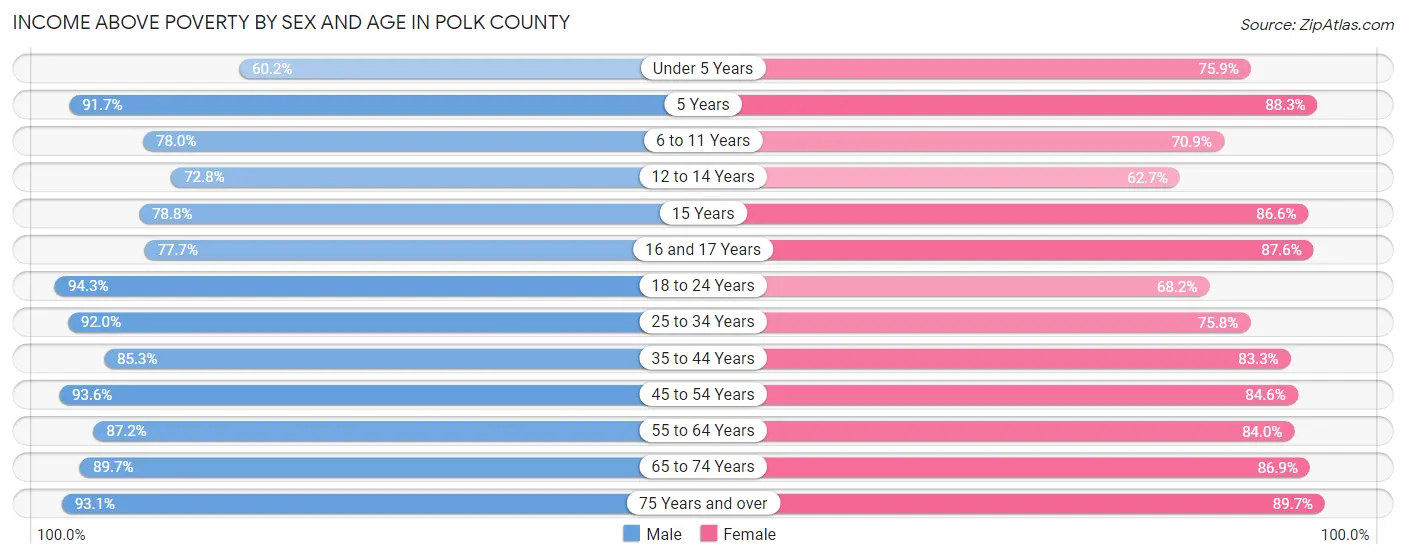
| Age Bracket | Male | Female |
| Under 5 Years | 762 (60.2%) | 947 (75.9%) |
| 5 Years | 354 (91.7%) | 113 (88.3%) |
| 6 to 11 Years | 1,255 (78.0%) | 1,091 (70.9%) |
| 12 to 14 Years | 770 (72.8%) | 667 (62.7%) |
| 15 Years | 204 (78.8%) | 168 (86.6%) |
| 16 and 17 Years | 461 (77.7%) | 591 (87.6%) |
| 18 to 24 Years | 1,794 (94.3%) | 1,142 (68.2%) |
| 25 to 34 Years | 2,352 (92.0%) | 1,715 (75.8%) |
| 35 to 44 Years | 2,244 (85.3%) | 2,138 (83.3%) |
| 45 to 54 Years | 2,789 (93.6%) | 2,429 (84.6%) |
| 55 to 64 Years | 3,391 (87.2%) | 3,651 (84.0%) |
| 65 to 74 Years | 3,067 (89.7%) | 2,722 (86.9%) |
| 75 Years and over | 1,176 (93.1%) | 1,111 (89.7%) |
| Total | 20,619 (86.6%) | 18,485 (80.6%) |
Income Below Poverty Among Married-Couple Families in Polk County
The poverty statistics for married-couple families in Polk County show that 8.0% or 723 of the total 9,039 families live below the poverty line. Families with 5 or more children have the highest poverty rate of 26.0%, comprising of 47 families. On the other hand, families with no children have the lowest poverty rate of 6.9%, which includes 405 families.
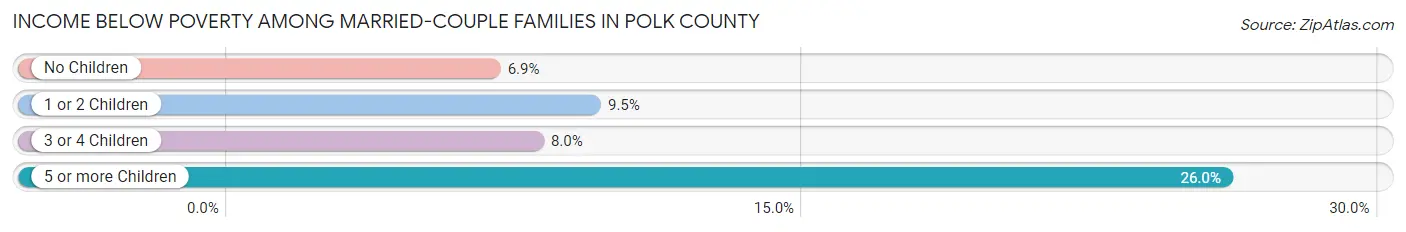
| Children | Above Poverty | Below Poverty |
| No Children | 5,499 (93.1%) | 405 (6.9%) |
| 1 or 2 Children | 2,119 (90.5%) | 222 (9.5%) |
| 3 or 4 Children | 564 (92.0%) | 49 (8.0%) |
| 5 or more Children | 134 (74.0%) | 47 (26.0%) |
| Total | 8,316 (92.0%) | 723 (8.0%) |
Income Below Poverty Among Single-Parent Households in Polk County
According to the poverty data in Polk County, 17.2% or 197 single-father households and 35.3% or 842 single-mother households are living below the poverty line. Among single-father households, those with 5 or more children have the highest poverty rate, with 1 households (100.0%) experiencing poverty. Likewise, among single-mother households, those with 5 or more children have the highest poverty rate, with 3 households (100.0%) falling below the poverty line.
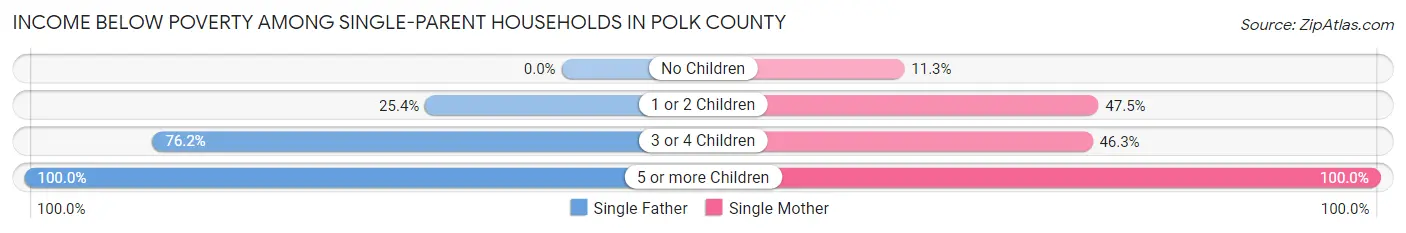
| Children | Single Father | Single Mother |
| No Children | 0 (0.0%) | 90 (11.3%) |
| 1 or 2 Children | 148 (25.4%) | 578 (47.4%) |
| 3 or 4 Children | 48 (76.2%) | 171 (46.3%) |
| 5 or more Children | 1 (100.0%) | 3 (100.0%) |
| Total | 197 (17.2%) | 842 (35.3%) |
Income Below Poverty Among Married-Couple vs Single-Parent Households in Polk County
The poverty data for Polk County shows that 723 of the married-couple family households (8.0%) and 1,039 of the single-parent households (29.4%) are living below the poverty level. Within the married-couple family households, those with 5 or more children have the highest poverty rate, with 47 households (26.0%) falling below the poverty line. Among the single-parent households, those with 5 or more children have the highest poverty rate, with 4 household (100.0%) living below poverty.
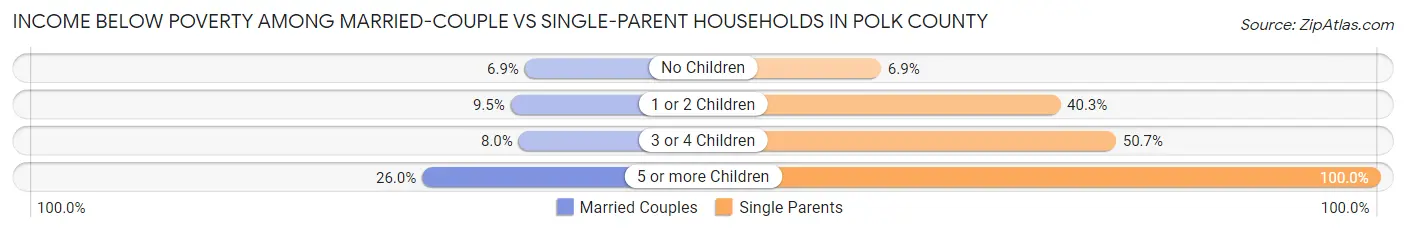
| Children | Married-Couple Families | Single-Parent Households |
| No Children | 405 (6.9%) | 90 (6.9%) |
| 1 or 2 Children | 222 (9.5%) | 726 (40.3%) |
| 3 or 4 Children | 49 (8.0%) | 219 (50.7%) |
| 5 or more Children | 47 (26.0%) | 4 (100.0%) |
| Total | 723 (8.0%) | 1,039 (29.4%) |
Race in Polk County
The most populous races in Polk County are White / Caucasian (39,621 | 78.4%), Hispanic or Latino (7,866 | 15.6%), and Two or more Races (4,687 | 9.3%).
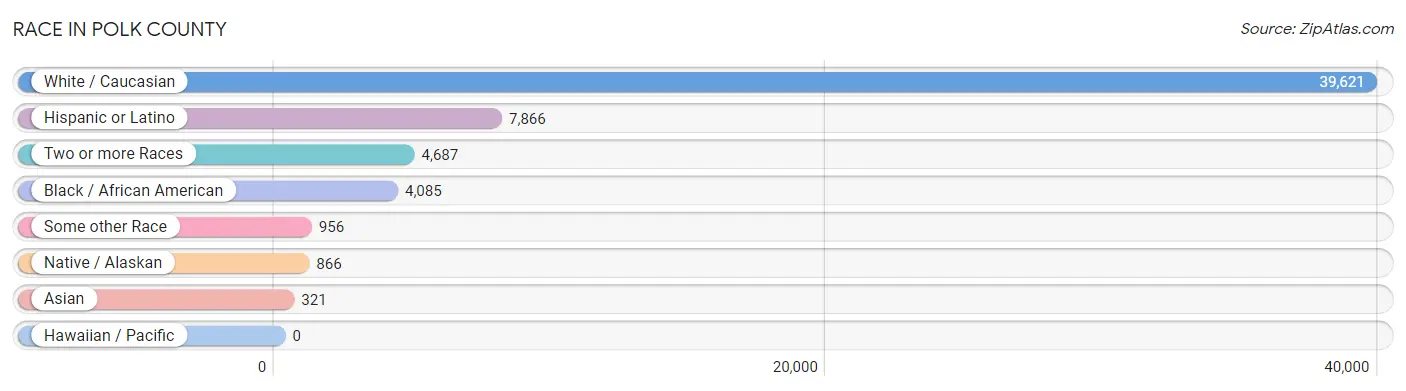
| Race | # Population | % Population |
| Asian | 321 | 0.6% |
| Black / African American | 4,085 | 8.1% |
| Hawaiian / Pacific | 0 | 0.0% |
| Hispanic or Latino | 7,866 | 15.6% |
| Native / Alaskan | 866 | 1.7% |
| White / Caucasian | 39,621 | 78.4% |
| Two or more Races | 4,687 | 9.3% |
| Some other Race | 956 | 1.9% |
| Total | 50,536 | 100.0% |
Ancestry in Polk County
The most populous ancestries reported in Polk County are Mexican (6,760 | 13.4%), American (5,959 | 11.8%), Irish (4,982 | 9.9%), German (4,934 | 9.8%), and English (4,043 | 8.0%), together accounting for 52.8% of all Polk County residents.
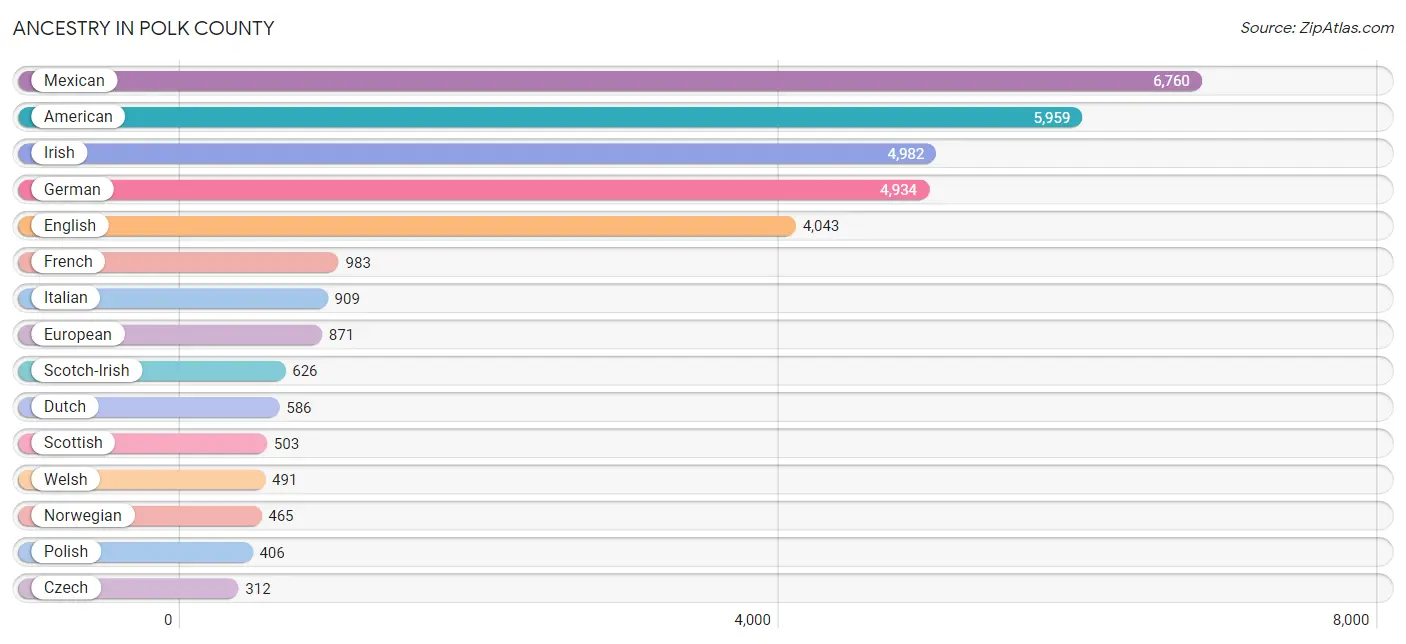
| Ancestry | # Population | % Population |
| African | 135 | 0.3% |
| American | 5,959 | 11.8% |
| Apache | 25 | 0.1% |
| Arab | 175 | 0.4% |
| Austrian | 10 | 0.0% |
| Barbadian | 17 | 0.0% |
| Bhutanese | 27 | 0.1% |
| Blackfeet | 135 | 0.3% |
| British | 45 | 0.1% |
| Burmese | 74 | 0.2% |
| Cajun | 11 | 0.0% |
| Canadian | 9 | 0.0% |
| Central American | 299 | 0.6% |
| Cherokee | 180 | 0.4% |
| Cheyenne | 1 | 0.0% |
| Chickasaw | 34 | 0.1% |
| Choctaw | 105 | 0.2% |
| Costa Rican | 7 | 0.0% |
| Creek | 1 | 0.0% |
| Cuban | 114 | 0.2% |
| Czech | 312 | 0.6% |
| Czechoslovakian | 109 | 0.2% |
| Danish | 118 | 0.2% |
| Dominican | 8 | 0.0% |
| Dutch | 586 | 1.2% |
| Egyptian | 81 | 0.2% |
| English | 4,043 | 8.0% |
| European | 871 | 1.7% |
| Finnish | 26 | 0.1% |
| French | 983 | 1.9% |
| French Canadian | 178 | 0.4% |
| German | 4,934 | 9.8% |
| Greek | 56 | 0.1% |
| Guatemalan | 15 | 0.0% |
| Guyanese | 11 | 0.0% |
| Haitian | 16 | 0.0% |
| Honduran | 17 | 0.0% |
| Hungarian | 91 | 0.2% |
| Indian (Asian) | 94 | 0.2% |
| Irish | 4,982 | 9.9% |
| Israeli | 6 | 0.0% |
| Italian | 909 | 1.8% |
| Jamaican | 6 | 0.0% |
| Japanese | 87 | 0.2% |
| Kenyan | 34 | 0.1% |
| Korean | 164 | 0.3% |
| Lebanese | 72 | 0.1% |
| Malaysian | 6 | 0.0% |
| Mexican | 6,760 | 13.4% |
| Mexican American Indian | 115 | 0.2% |
| Moroccan | 22 | 0.0% |
| Nicaraguan | 2 | 0.0% |
| Nigerian | 3 | 0.0% |
| Norwegian | 465 | 0.9% |
| Pakistani | 24 | 0.1% |
| Pennsylvania German | 97 | 0.2% |
| Polish | 406 | 0.8% |
| Portuguese | 60 | 0.1% |
| Puerto Rican | 286 | 0.6% |
| Russian | 39 | 0.1% |
| Salvadoran | 242 | 0.5% |
| Scandinavian | 197 | 0.4% |
| Scotch-Irish | 626 | 1.2% |
| Scottish | 503 | 1.0% |
| Seminole | 1 | 0.0% |
| Somali | 7 | 0.0% |
| South American | 77 | 0.2% |
| Spaniard | 69 | 0.1% |
| Spanish | 23 | 0.1% |
| Sri Lankan | 53 | 0.1% |
| Subsaharan African | 179 | 0.4% |
| Swedish | 283 | 0.6% |
| Swiss | 41 | 0.1% |
| Thai | 44 | 0.1% |
| Ukrainian | 28 | 0.1% |
| Venezuelan | 77 | 0.2% |
| Welsh | 491 | 1.0% |
| West Indian | 9 | 0.0% |
| Yugoslavian | 14 | 0.0% | View All 79 Rows |
Immigrants in Polk County
The most numerous immigrant groups reported in Polk County came from Latin America (1,934 | 3.8%), Central America (1,803 | 3.6%), Mexico (1,608 | 3.2%), Asia (165 | 0.3%), and Canada (145 | 0.3%), together accounting for 11.2% of all Polk County residents.
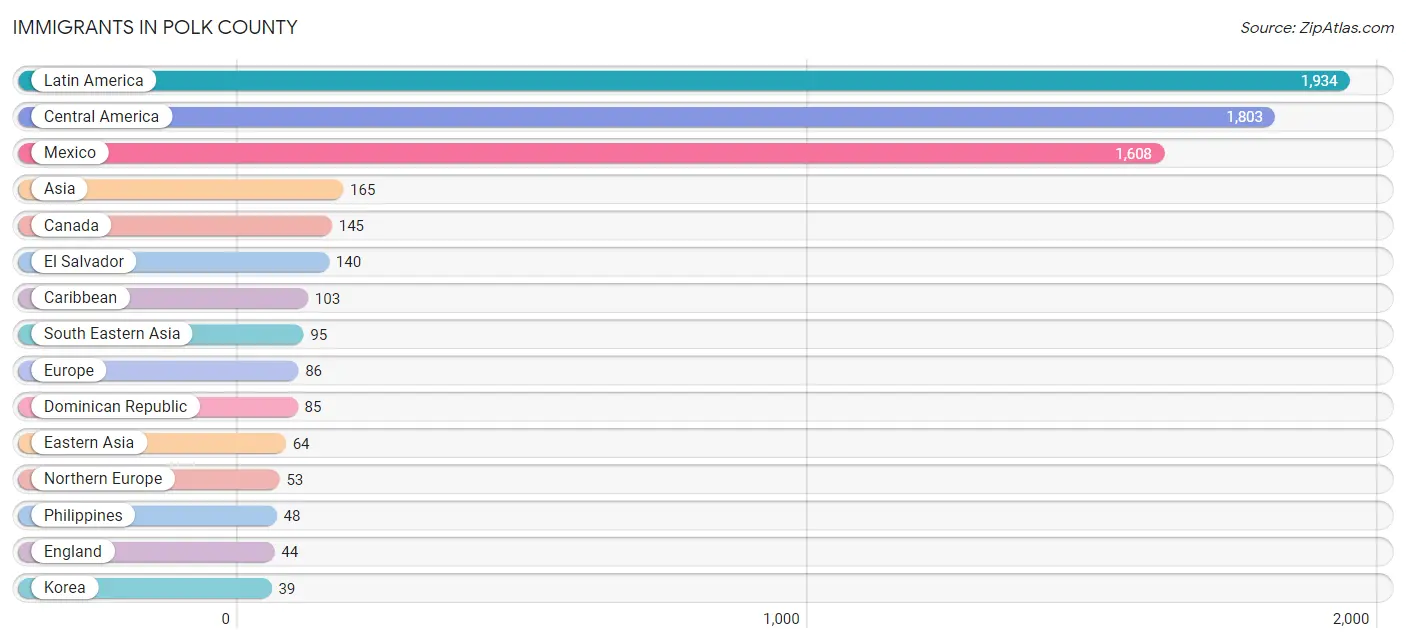
| Immigration Origin | # Population | % Population |
| Africa | 29 | 0.1% |
| Asia | 165 | 0.3% |
| Cambodia | 36 | 0.1% |
| Canada | 145 | 0.3% |
| Caribbean | 103 | 0.2% |
| Central America | 1,803 | 3.6% |
| China | 25 | 0.1% |
| Dominican Republic | 85 | 0.2% |
| Eastern Africa | 7 | 0.0% |
| Eastern Asia | 64 | 0.1% |
| El Salvador | 140 | 0.3% |
| England | 44 | 0.1% |
| Europe | 86 | 0.2% |
| Germany | 25 | 0.1% |
| Guatemala | 36 | 0.1% |
| Honduras | 17 | 0.0% |
| India | 6 | 0.0% |
| Ireland | 9 | 0.0% |
| Korea | 39 | 0.1% |
| Latin America | 1,934 | 3.8% |
| Mexico | 1,608 | 3.2% |
| Morocco | 22 | 0.0% |
| Nicaragua | 2 | 0.0% |
| Northern Africa | 22 | 0.0% |
| Northern Europe | 53 | 0.1% |
| Philippines | 48 | 0.1% |
| Somalia | 7 | 0.0% |
| South America | 28 | 0.1% |
| South Central Asia | 6 | 0.0% |
| South Eastern Asia | 95 | 0.2% |
| Southern Europe | 8 | 0.0% |
| Spain | 8 | 0.0% |
| Trinidad and Tobago | 18 | 0.0% |
| Venezuela | 28 | 0.1% |
| Vietnam | 11 | 0.0% |
| Western Europe | 25 | 0.1% | View All 36 Rows |
Sex and Age in Polk County
Sex and Age in Polk County
The most populous age groups in Polk County are 60 to 64 Years (2,324 | 8.5%) for men and 60 to 64 Years (2,487 | 10.7%) for women.
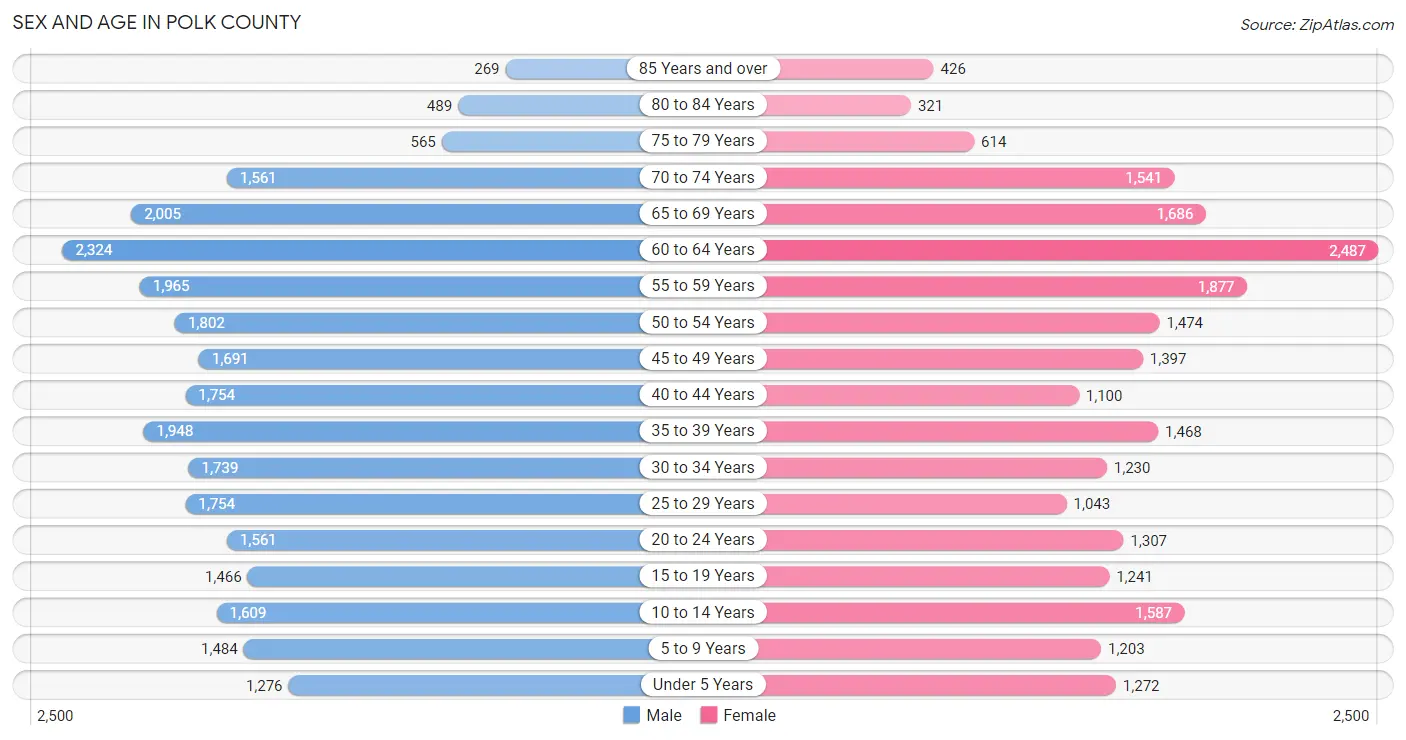
| Age Bracket | Male | Female |
| Under 5 Years | 1,276 (4.7%) | 1,272 (5.5%) |
| 5 to 9 Years | 1,484 (5.4%) | 1,203 (5.2%) |
| 10 to 14 Years | 1,609 (5.9%) | 1,587 (6.8%) |
| 15 to 19 Years | 1,466 (5.4%) | 1,241 (5.3%) |
| 20 to 24 Years | 1,561 (5.7%) | 1,307 (5.6%) |
| 25 to 29 Years | 1,754 (6.4%) | 1,043 (4.5%) |
| 30 to 34 Years | 1,739 (6.4%) | 1,230 (5.3%) |
| 35 to 39 Years | 1,948 (7.1%) | 1,468 (6.3%) |
| 40 to 44 Years | 1,754 (6.4%) | 1,100 (4.7%) |
| 45 to 49 Years | 1,691 (6.2%) | 1,397 (6.0%) |
| 50 to 54 Years | 1,802 (6.6%) | 1,474 (6.3%) |
| 55 to 59 Years | 1,965 (7.2%) | 1,877 (8.1%) |
| 60 to 64 Years | 2,324 (8.5%) | 2,487 (10.7%) |
| 65 to 69 Years | 2,005 (7.3%) | 1,686 (7.2%) |
| 70 to 74 Years | 1,561 (5.7%) | 1,541 (6.6%) |
| 75 to 79 Years | 565 (2.1%) | 614 (2.6%) |
| 80 to 84 Years | 489 (1.8%) | 321 (1.4%) |
| 85 Years and over | 269 (1.0%) | 426 (1.8%) |
| Total | 27,262 (100.0%) | 23,274 (100.0%) |
Families and Households in Polk County
Median Family Size in Polk County
The median family size in Polk County is 3.10 persons per family, with single male/father families (1,147 | 9.1%) accounting for the largest median family size of 3.12 persons per family. On the other hand, married-couple families (9,039 | 71.9%) represent the smallest median family size with 3.09 persons per family.
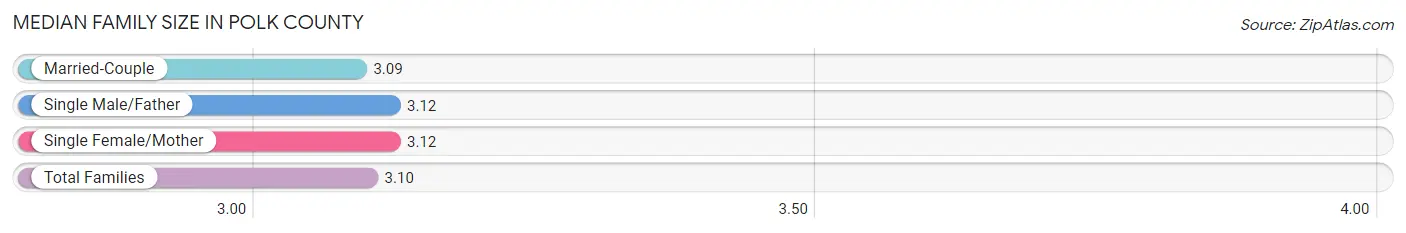
| Family Type | # Families | Family Size |
| Married-Couple | 9,039 (71.9%) | 3.09 |
| Single Male/Father | 1,147 (9.1%) | 3.12 |
| Single Female/Mother | 2,386 (19.0%) | 3.12 |
| Total Families | 12,572 (100.0%) | 3.10 |
Median Household Size in Polk County
The median household size in Polk County is 2.59 persons per household, with single male/father households (1,147 | 6.3%) accounting for the largest median household size of 3.44 persons per household. non-family households (5,512 | 30.5%) represent the smallest median household size with 1.18 persons per household.
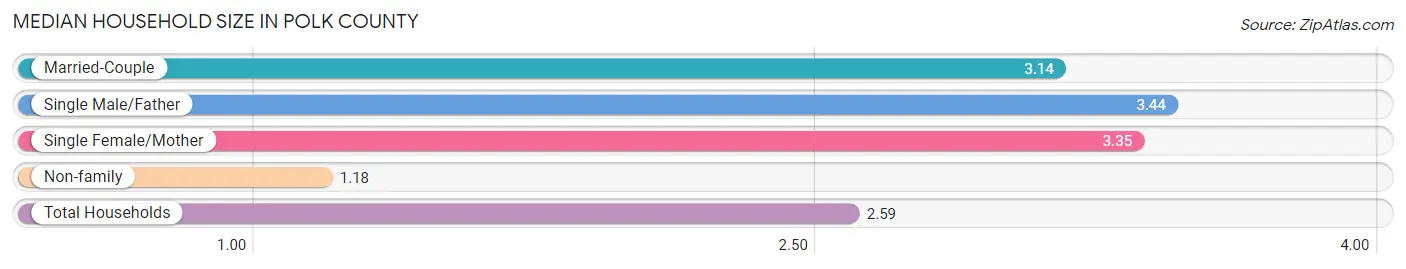
| Household Type | # Households | Household Size |
| Married-Couple | 9,039 (50.0%) | 3.14 |
| Single Male/Father | 1,147 (6.3%) | 3.44 |
| Single Female/Mother | 2,386 (13.2%) | 3.35 |
| Non-family | 5,512 (30.5%) | 1.18 |
| Total Households | 18,084 (100.0%) | 2.59 |
Household Size by Marriage Status in Polk County
Out of a total of 18,084 households in Polk County, 12,572 (69.5%) are family households, while 5,512 (30.5%) are nonfamily households. The most numerous type of family households are 2-person households, comprising 5,578, and the most common type of nonfamily households are 1-person households, comprising 4,667.
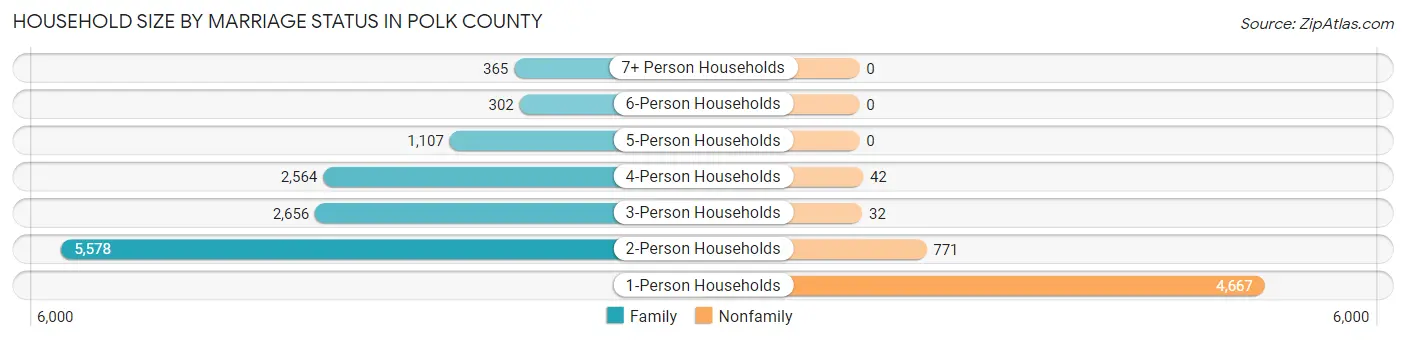
| Household Size | Family Households | Nonfamily Households |
| 1-Person Households | - | 4,667 (25.8%) |
| 2-Person Households | 5,578 (30.8%) | 771 (4.3%) |
| 3-Person Households | 2,656 (14.7%) | 32 (0.2%) |
| 4-Person Households | 2,564 (14.2%) | 42 (0.2%) |
| 5-Person Households | 1,107 (6.1%) | 0 (0.0%) |
| 6-Person Households | 302 (1.7%) | 0 (0.0%) |
| 7+ Person Households | 365 (2.0%) | 0 (0.0%) |
| Total | 12,572 (69.5%) | 5,512 (30.5%) |
Female Fertility in Polk County
Fertility by Age in Polk County
Average fertility rate in Polk County is 53.0 births per 1,000 women. Women in the age bracket of 20 to 34 years have the highest fertility rate with 130.0 births per 1,000 women. Women in the age bracket of 20 to 34 years acount for 96.5% of all women with births.
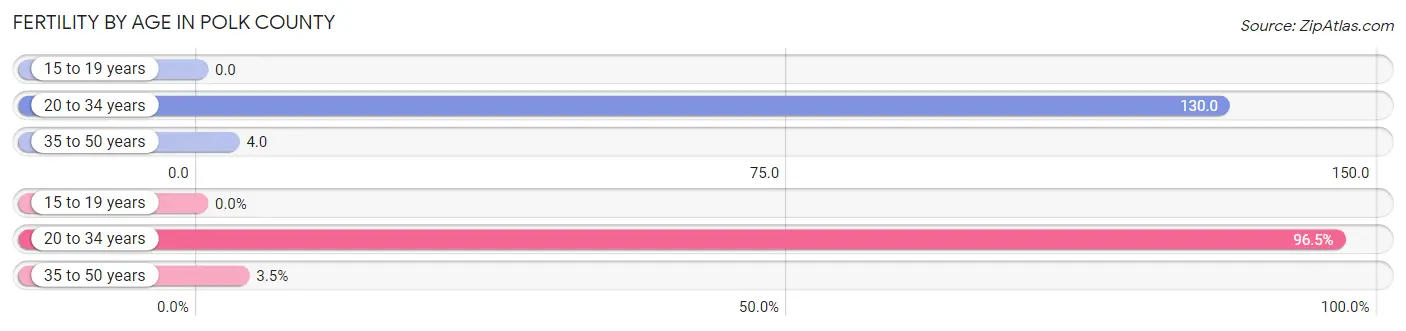
| Age Bracket | Women with Births | Births / 1,000 Women |
| 15 to 19 years | 0 (0.0%) | 0.0 |
| 20 to 34 years | 467 (96.5%) | 130.0 |
| 35 to 50 years | 17 (3.5%) | 4.0 |
| Total | 484 (100.0%) | 53.0 |
Fertility by Age by Marriage Status in Polk County
57.2% of women with births (484) in Polk County are married. The highest percentage of unmarried women with births falls into 35 to 50 years age bracket with 64.7% of them unmarried at the time of birth, while the lowest percentage of unmarried women with births belong to 20 to 34 years age bracket with 42.0% of them unmarried.
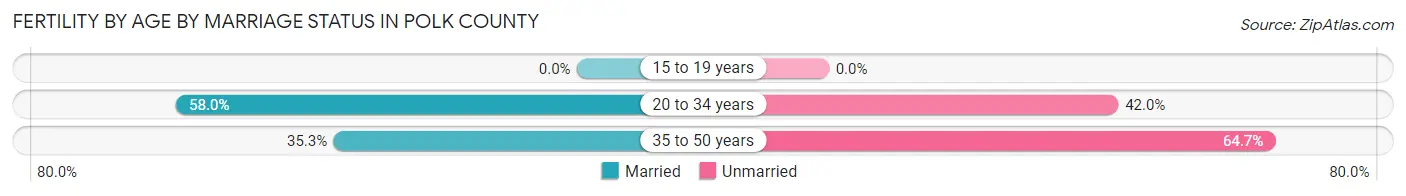
| Age Bracket | Married | Unmarried |
| 15 to 19 years | 0 (0.0%) | 0 (0.0%) |
| 20 to 34 years | 271 (58.0%) | 196 (42.0%) |
| 35 to 50 years | 6 (35.3%) | 11 (64.7%) |
| Total | 277 (57.2%) | 207 (42.8%) |
Fertility by Education in Polk County
Average fertility rate in Polk County is 53.0 births per 1,000 women. Women with the education attainment of college or associate's degree have the highest fertility rate of 77.0 births per 1,000 women, while women with the education attainment of less than high school have the lowest fertility at 4.0 births per 1,000 women. Women with the education attainment of college or associate's degree represent 47.3% of all women with births.
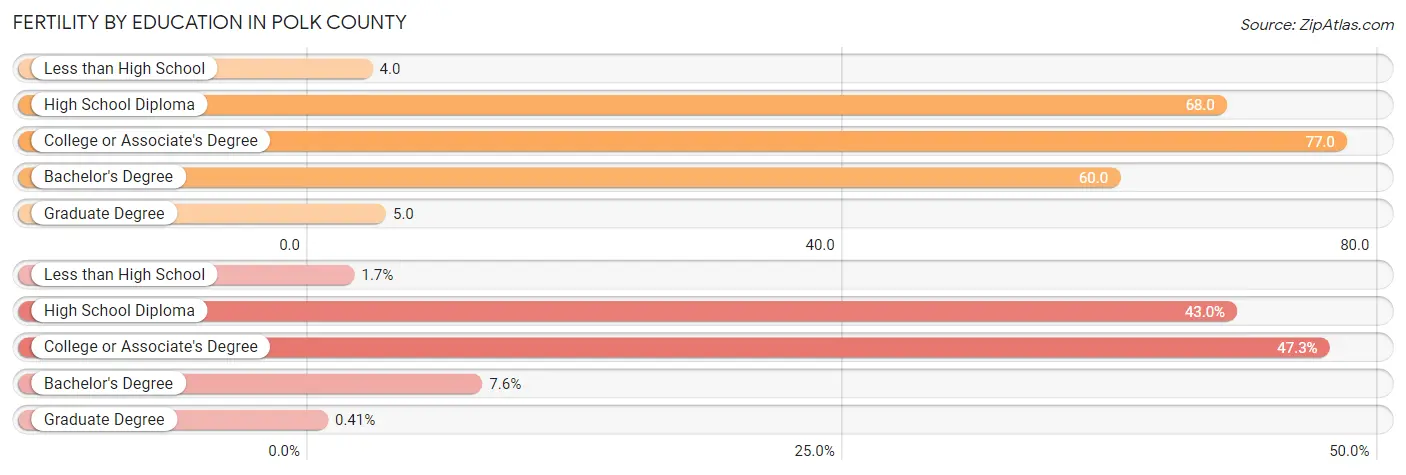
| Educational Attainment | Women with Births | Births / 1,000 Women |
| Less than High School | 8 (1.7%) | 4.0 |
| High School Diploma | 208 (43.0%) | 68.0 |
| College or Associate's Degree | 229 (47.3%) | 77.0 |
| Bachelor's Degree | 37 (7.6%) | 60.0 |
| Graduate Degree | 2 (0.4%) | 5.0 |
| Total | 484 (100.0%) | 53.0 |
Fertility by Education by Marriage Status in Polk County
42.8% of women with births in Polk County are unmarried. Women with the educational attainment of bachelor's degree are most likely to be married with 100.0% of them married at childbirth, while women with the educational attainment of high school diploma are least likely to be married with 72.1% of them unmarried at childbirth.
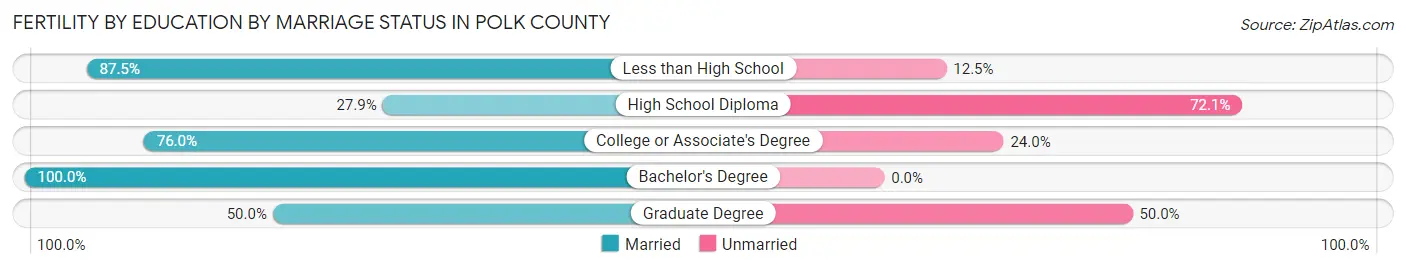
| Educational Attainment | Married | Unmarried |
| Less than High School | 7 (87.5%) | 1 (12.5%) |
| High School Diploma | 58 (27.9%) | 150 (72.1%) |
| College or Associate's Degree | 174 (76.0%) | 55 (24.0%) |
| Bachelor's Degree | 37 (100.0%) | 0 (0.0%) |
| Graduate Degree | 1 (50.0%) | 1 (50.0%) |
| Total | 277 (57.2%) | 207 (42.8%) |
Employment Characteristics in Polk County
Employment by Class of Employer in Polk County
Among the 17,662 employed individuals in Polk County, private company employees (11,606 | 65.7%), self-employed (not incorporated) (1,575 | 8.9%), and local government employees (1,484 | 8.4%) make up the most common classes of employment.
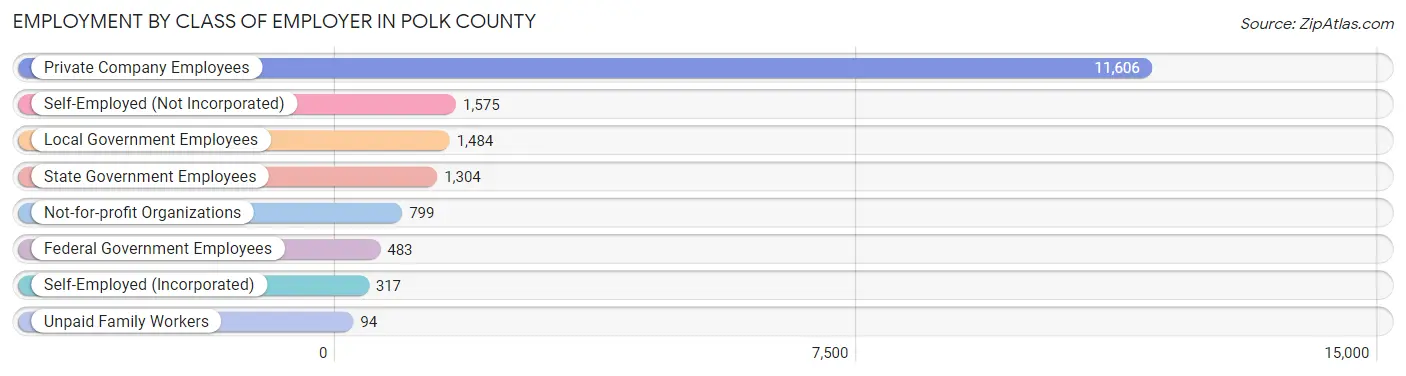
| Employer Class | # Employees | % Employees |
| Private Company Employees | 11,606 | 65.7% |
| Self-Employed (Incorporated) | 317 | 1.8% |
| Self-Employed (Not Incorporated) | 1,575 | 8.9% |
| Not-for-profit Organizations | 799 | 4.5% |
| Local Government Employees | 1,484 | 8.4% |
| State Government Employees | 1,304 | 7.4% |
| Federal Government Employees | 483 | 2.7% |
| Unpaid Family Workers | 94 | 0.5% |
| Total | 17,662 | 100.0% |
Employment Status by Age in Polk County
According to the labor force statistics for Polk County, out of the total population over 16 years of age (41,649), 48.5% or 20,200 individuals are in the labor force, with 9.3% or 1,879 of them unemployed. The age group with the highest labor force participation rate is 30 to 34 years, with 71.1% or 2,111 individuals in the labor force. Within the labor force, the 16 to 19 years age range has the highest percentage of unemployed individuals, with 32.3% or 267 of them being unemployed.
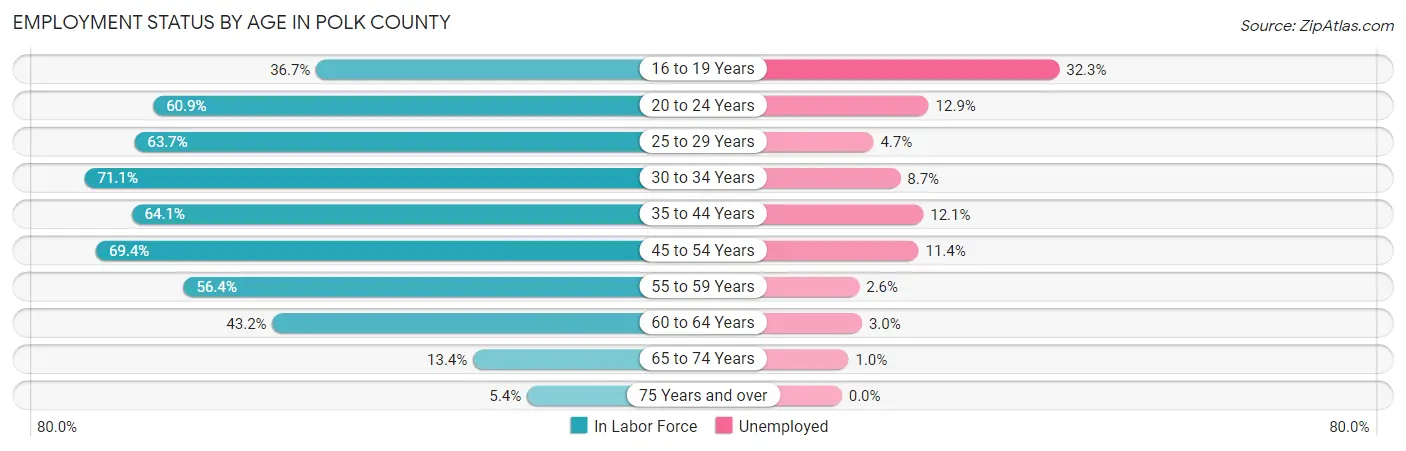
| Age Bracket | In Labor Force | Unemployed |
| 16 to 19 Years | 826 (36.7%) | 267 (32.3%) |
| 20 to 24 Years | 1,747 (60.9%) | 225 (12.9%) |
| 25 to 29 Years | 1,782 (63.7%) | 84 (4.7%) |
| 30 to 34 Years | 2,111 (71.1%) | 184 (8.7%) |
| 35 to 44 Years | 4,019 (64.1%) | 486 (12.1%) |
| 45 to 54 Years | 4,417 (69.4%) | 504 (11.4%) |
| 55 to 59 Years | 2,167 (56.4%) | 56 (2.6%) |
| 60 to 64 Years | 2,078 (43.2%) | 62 (3.0%) |
| 65 to 74 Years | 910 (13.4%) | 9 (1.0%) |
| 75 Years and over | 145 (5.4%) | 0 (0.0%) |
| Total | 20,200 (48.5%) | 1,879 (9.3%) |
Employment Status by Educational Attainment in Polk County
According to labor force statistics for Polk County, 61.3% of individuals (16,583) out of the total population between 25 and 64 years of age (27,053) are in the labor force, with 8.3% or 1,376 of them being unemployed. The group with the highest labor force participation rate are those with the educational attainment of bachelor's degree or higher, with 75.7% or 2,255 individuals in the labor force. Within the labor force, individuals with less than high school education have the highest percentage of unemployment, with 10.1% or 253 of them being unemployed.
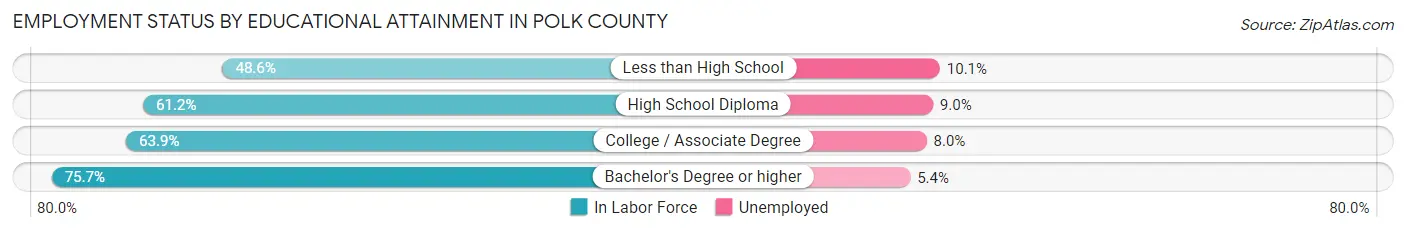
| Educational Attainment | In Labor Force | Unemployed |
| Less than High School | 2,507 (48.6%) | 521 (10.1%) |
| High School Diploma | 6,376 (61.2%) | 938 (9.0%) |
| College / Associate Degree | 5,430 (63.9%) | 680 (8.0%) |
| Bachelor's Degree or higher | 2,255 (75.7%) | 161 (5.4%) |
| Total | 16,583 (61.3%) | 2,245 (8.3%) |
Employment Occupations by Sex in Polk County
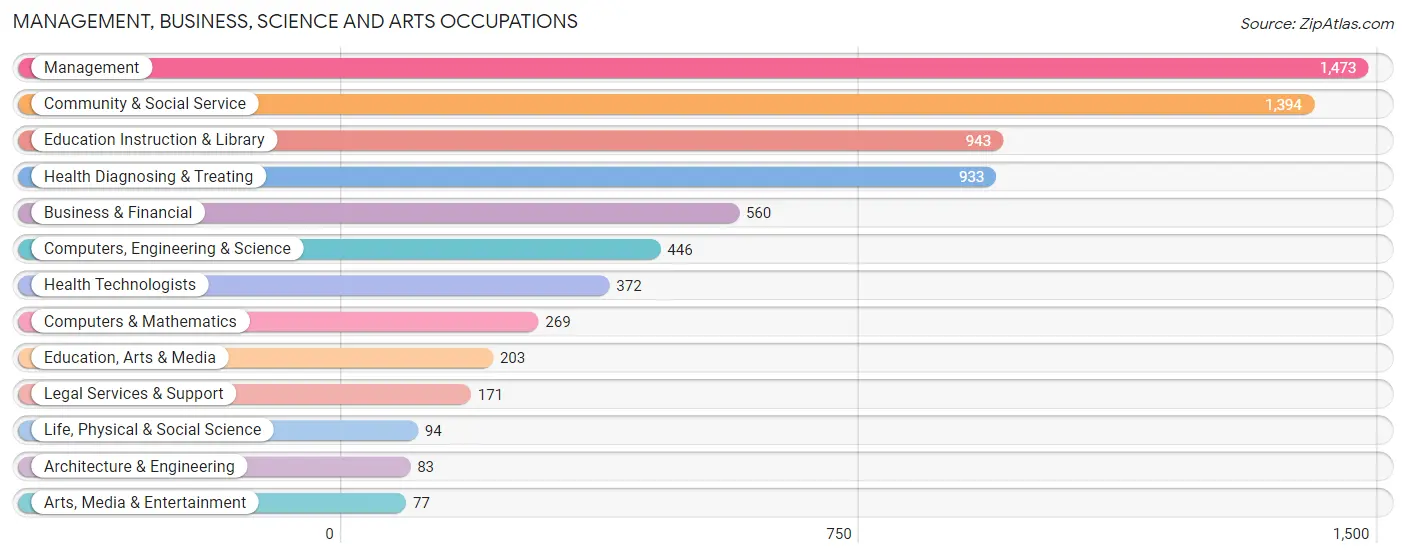
Management, Business, Science and Arts Occupations
The most common Management, Business, Science and Arts occupations in Polk County are Management (1,473 | 8.0%), Community & Social Service (1,394 | 7.6%), Education Instruction & Library (943 | 5.1%), Health Diagnosing & Treating (933 | 5.1%), and Business & Financial (560 | 3.1%).
Management, Business, Science and Arts Occupations by Sex
Within the Management, Business, Science and Arts occupations in Polk County, the most male-oriented occupations are Architecture & Engineering (92.8%), Life, Physical & Social Science (85.1%), and Arts, Media & Entertainment (77.9%), while the most female-oriented occupations are Education Instruction & Library (79.6%), Health Diagnosing & Treating (75.9%), and Legal Services & Support (73.1%).
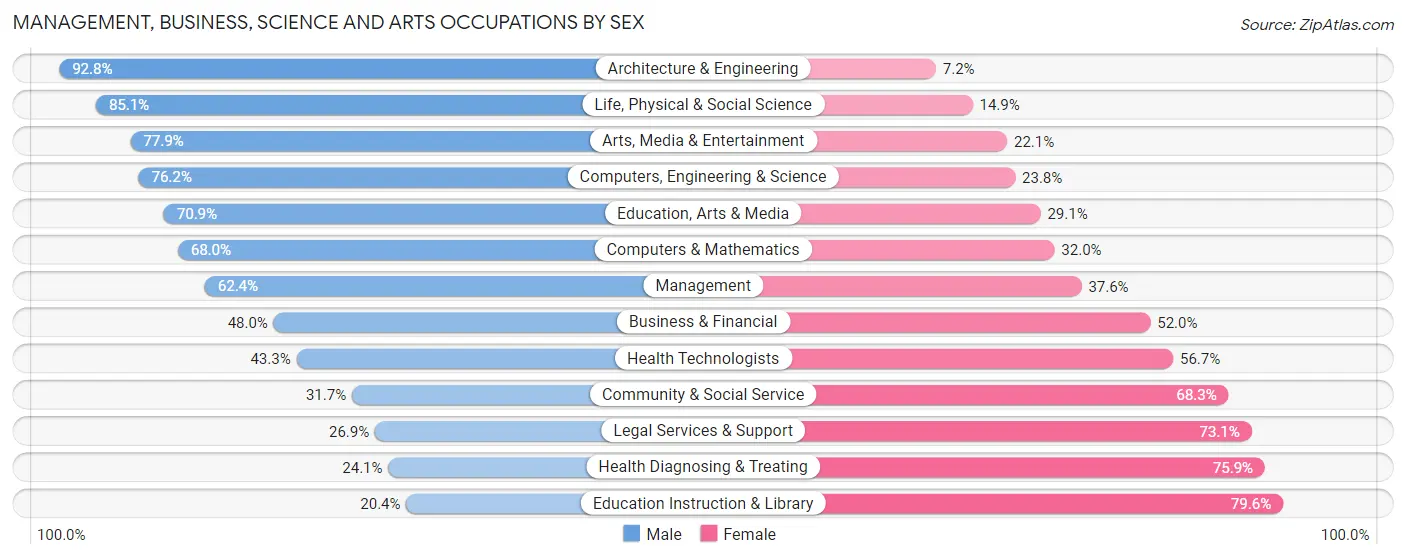
| Occupation | Male | Female |
| Management | 919 (62.4%) | 554 (37.6%) |
| Business & Financial | 269 (48.0%) | 291 (52.0%) |
| Computers, Engineering & Science | 340 (76.2%) | 106 (23.8%) |
| Computers & Mathematics | 183 (68.0%) | 86 (32.0%) |
| Architecture & Engineering | 77 (92.8%) | 6 (7.2%) |
| Life, Physical & Social Science | 80 (85.1%) | 14 (14.9%) |
| Community & Social Service | 442 (31.7%) | 952 (68.3%) |
| Education, Arts & Media | 144 (70.9%) | 59 (29.1%) |
| Legal Services & Support | 46 (26.9%) | 125 (73.1%) |
| Education Instruction & Library | 192 (20.4%) | 751 (79.6%) |
| Arts, Media & Entertainment | 60 (77.9%) | 17 (22.1%) |
| Health Diagnosing & Treating | 225 (24.1%) | 708 (75.9%) |
| Health Technologists | 161 (43.3%) | 211 (56.7%) |
| Total (Category) | 2,195 (45.7%) | 2,611 (54.3%) |
| Total (Overall) | 10,204 (55.7%) | 8,113 (44.3%) |
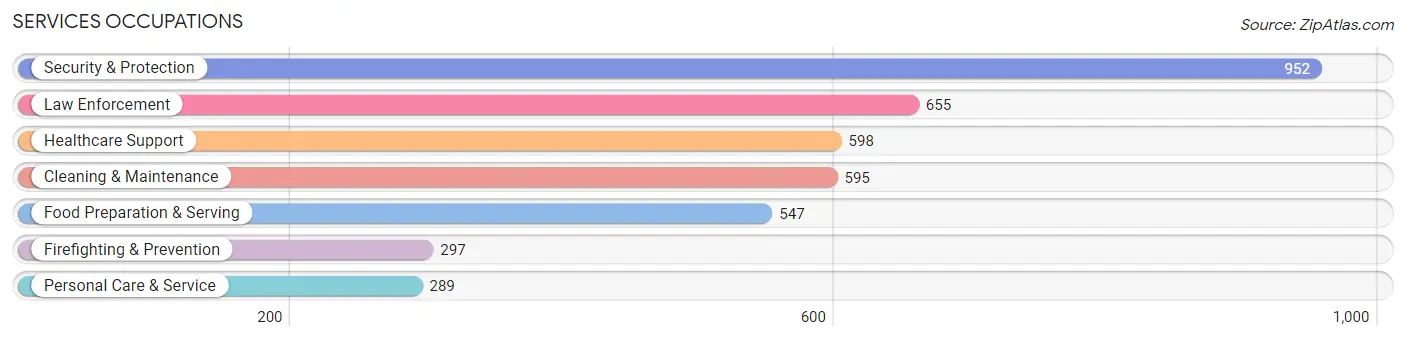
Services Occupations
The most common Services occupations in Polk County are Security & Protection (952 | 5.2%), Law Enforcement (655 | 3.6%), Healthcare Support (598 | 3.3%), Cleaning & Maintenance (595 | 3.3%), and Food Preparation & Serving (547 | 3.0%).
Services Occupations by Sex
Within the Services occupations in Polk County, the most male-oriented occupations are Firefighting & Prevention (80.8%), Security & Protection (72.7%), and Law Enforcement (69.0%), while the most female-oriented occupations are Healthcare Support (100.0%), Food Preparation & Serving (69.1%), and Personal Care & Service (50.5%).
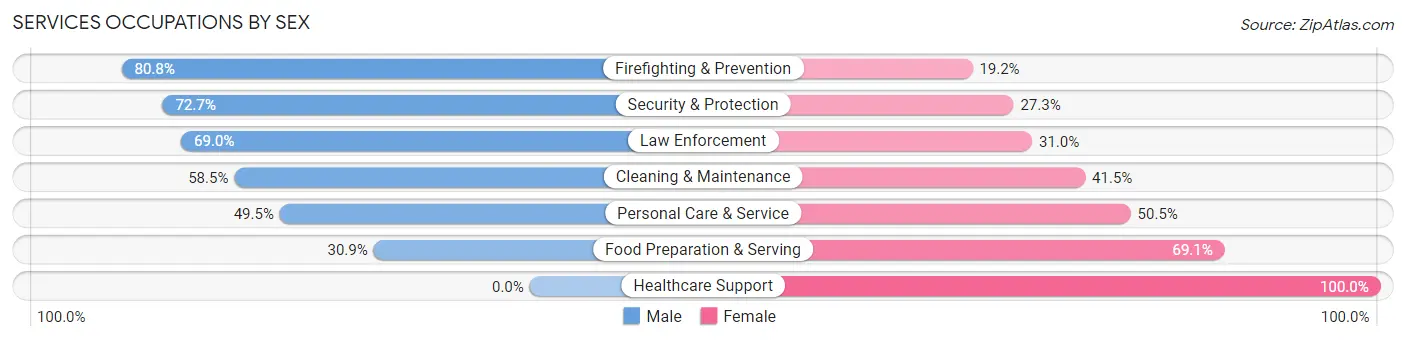
| Occupation | Male | Female |
| Healthcare Support | 0 (0.0%) | 598 (100.0%) |
| Security & Protection | 692 (72.7%) | 260 (27.3%) |
| Firefighting & Prevention | 240 (80.8%) | 57 (19.2%) |
| Law Enforcement | 452 (69.0%) | 203 (31.0%) |
| Food Preparation & Serving | 169 (30.9%) | 378 (69.1%) |
| Cleaning & Maintenance | 348 (58.5%) | 247 (41.5%) |
| Personal Care & Service | 143 (49.5%) | 146 (50.5%) |
| Total (Category) | 1,352 (45.4%) | 1,629 (54.6%) |
| Total (Overall) | 10,204 (55.7%) | 8,113 (44.3%) |
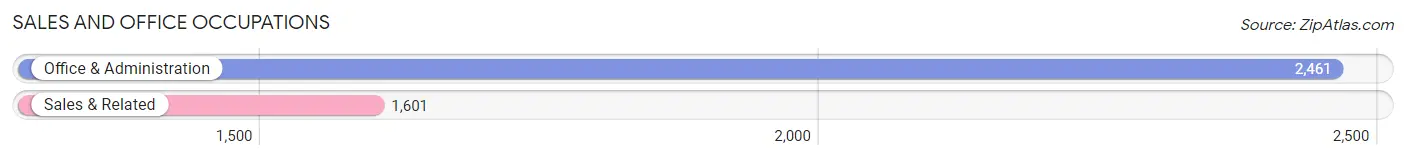
Sales and Office Occupations
The most common Sales and Office occupations in Polk County are Office & Administration (2,461 | 13.4%), and Sales & Related (1,601 | 8.7%).
Sales and Office Occupations by Sex
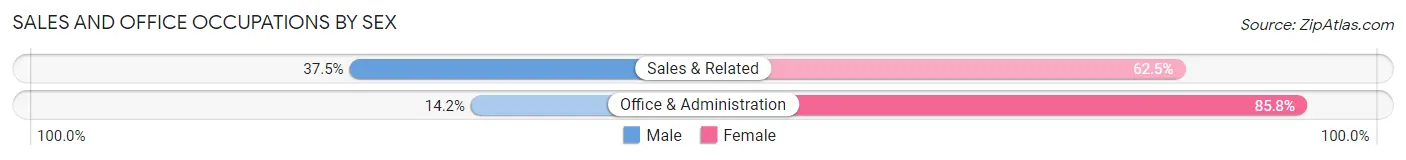
| Occupation | Male | Female |
| Sales & Related | 601 (37.5%) | 1,000 (62.5%) |
| Office & Administration | 349 (14.2%) | 2,112 (85.8%) |
| Total (Category) | 950 (23.4%) | 3,112 (76.6%) |
| Total (Overall) | 10,204 (55.7%) | 8,113 (44.3%) |
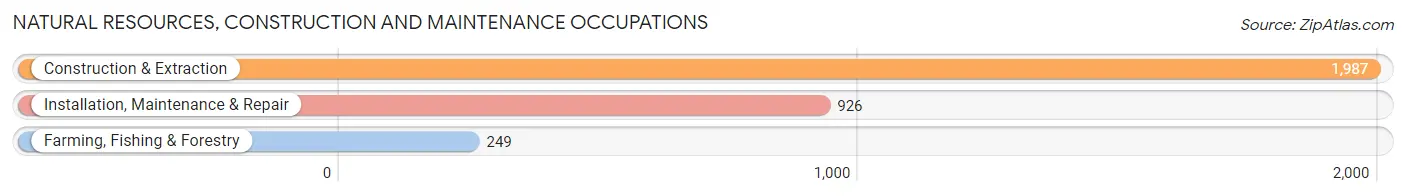
Natural Resources, Construction and Maintenance Occupations
The most common Natural Resources, Construction and Maintenance occupations in Polk County are Construction & Extraction (1,987 | 10.8%), Installation, Maintenance & Repair (926 | 5.1%), and Farming, Fishing & Forestry (249 | 1.4%).
Natural Resources, Construction and Maintenance Occupations by Sex
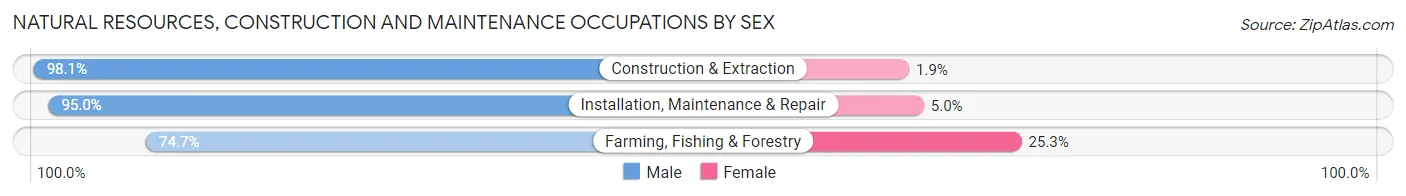
| Occupation | Male | Female |
| Farming, Fishing & Forestry | 186 (74.7%) | 63 (25.3%) |
| Construction & Extraction | 1,949 (98.1%) | 38 (1.9%) |
| Installation, Maintenance & Repair | 880 (95.0%) | 46 (5.0%) |
| Total (Category) | 3,015 (95.4%) | 147 (4.6%) |
| Total (Overall) | 10,204 (55.7%) | 8,113 (44.3%) |
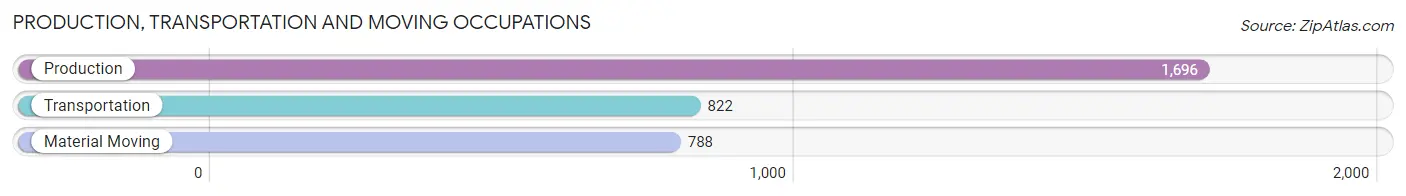
Production, Transportation and Moving Occupations
The most common Production, Transportation and Moving occupations in Polk County are Production (1,696 | 9.3%), Transportation (822 | 4.5%), and Material Moving (788 | 4.3%).
Production, Transportation and Moving Occupations by Sex
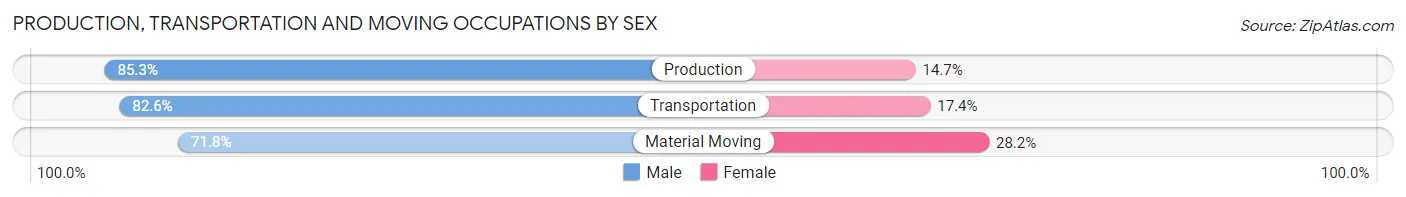
| Occupation | Male | Female |
| Production | 1,447 (85.3%) | 249 (14.7%) |
| Transportation | 679 (82.6%) | 143 (17.4%) |
| Material Moving | 566 (71.8%) | 222 (28.2%) |
| Total (Category) | 2,692 (81.4%) | 614 (18.6%) |
| Total (Overall) | 10,204 (55.7%) | 8,113 (44.3%) |
Employment Industries by Sex in Polk County
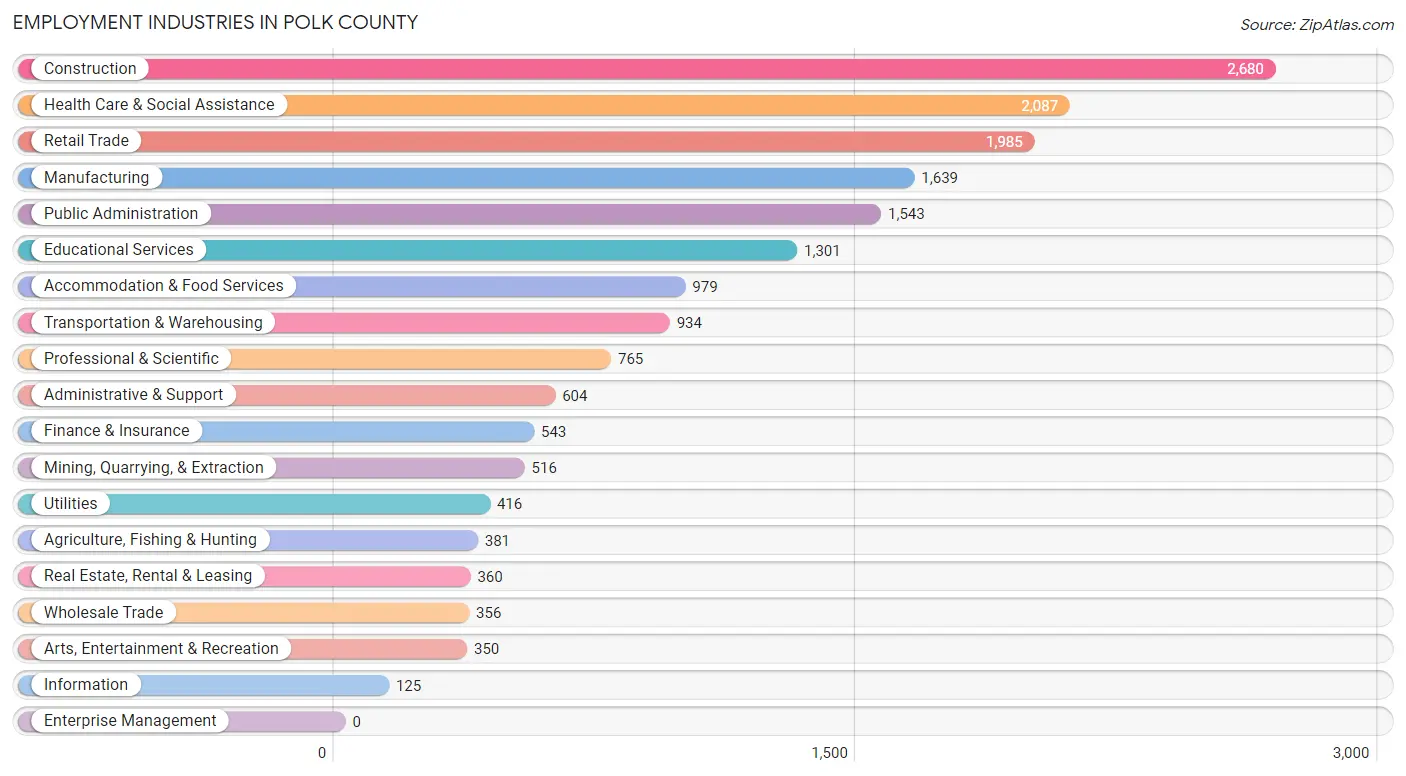
Employment Industries in Polk County
The major employment industries in Polk County include Construction (2,680 | 14.6%), Health Care & Social Assistance (2,087 | 11.4%), Retail Trade (1,985 | 10.8%), Manufacturing (1,639 | 8.9%), and Public Administration (1,543 | 8.4%).
Employment Industries by Sex in Polk County
The Polk County industries that see more men than women are Construction (87.8%), Wholesale Trade (86.5%), and Mining, Quarrying, & Extraction (84.7%), whereas the industries that tend to have a higher number of women are Health Care & Social Assistance (85.1%), Educational Services (76.9%), and Professional & Scientific (70.5%).
| Industry | Male | Female |
| Agriculture, Fishing & Hunting | 314 (82.4%) | 67 (17.6%) |
| Mining, Quarrying, & Extraction | 437 (84.7%) | 79 (15.3%) |
| Construction | 2,353 (87.8%) | 327 (12.2%) |
| Manufacturing | 1,294 (78.9%) | 345 (21.0%) |
| Wholesale Trade | 308 (86.5%) | 48 (13.5%) |
| Retail Trade | 912 (45.9%) | 1,073 (54.1%) |
| Transportation & Warehousing | 718 (76.9%) | 216 (23.1%) |
| Utilities | 299 (71.9%) | 117 (28.1%) |
| Information | 89 (71.2%) | 36 (28.8%) |
| Finance & Insurance | 211 (38.9%) | 332 (61.1%) |
| Real Estate, Rental & Leasing | 204 (56.7%) | 156 (43.3%) |
| Professional & Scientific | 226 (29.5%) | 539 (70.5%) |
| Enterprise Management | 0 (0.0%) | 0 (0.0%) |
| Administrative & Support | 441 (73.0%) | 163 (27.0%) |
| Educational Services | 300 (23.1%) | 1,001 (76.9%) |
| Health Care & Social Assistance | 311 (14.9%) | 1,776 (85.1%) |
| Arts, Entertainment & Recreation | 160 (45.7%) | 190 (54.3%) |
| Accommodation & Food Services | 385 (39.3%) | 594 (60.7%) |
| Public Administration | 789 (51.1%) | 754 (48.9%) |
| Total | 10,204 (55.7%) | 8,113 (44.3%) |
Education in Polk County
School Enrollment in Polk County
The most common levels of schooling among the 9,396 students in Polk County are middle school (2,470 | 26.3%), high school (2,201 | 23.4%), and elementary school (2,087 | 22.2%).
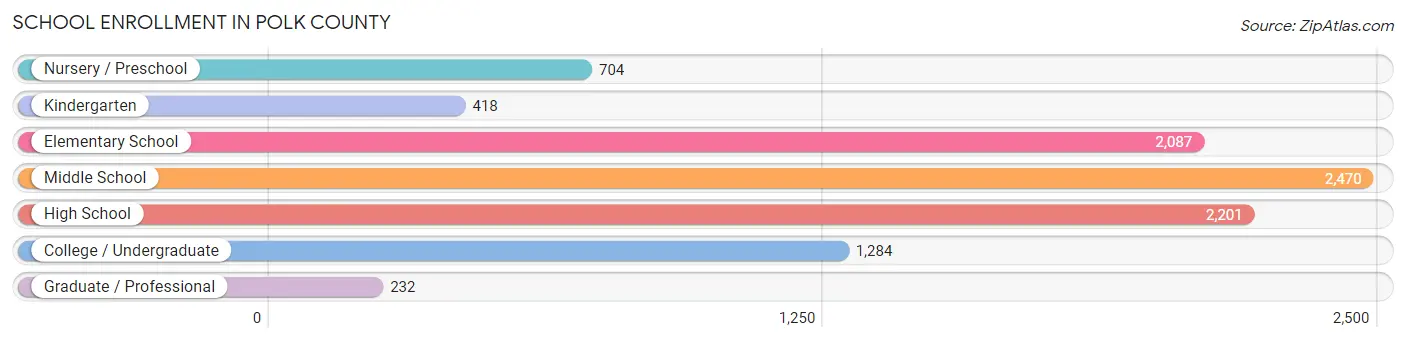
| School Level | # Students | % Students |
| Nursery / Preschool | 704 | 7.5% |
| Kindergarten | 418 | 4.4% |
| Elementary School | 2,087 | 22.2% |
| Middle School | 2,470 | 26.3% |
| High School | 2,201 | 23.4% |
| College / Undergraduate | 1,284 | 13.7% |
| Graduate / Professional | 232 | 2.5% |
| Total | 9,396 | 100.0% |
School Enrollment by Age by Funding Source in Polk County
Out of a total of 9,396 students who are enrolled in schools in Polk County, 1,381 (14.7%) attend a private institution, while the remaining 8,015 (85.3%) are enrolled in public schools. The age group of 35 years and over has the highest likelihood of being enrolled in private schools, with 128 (30.7% in the age bracket) enrolled. Conversely, the age group of 20 to 24 year olds has the lowest likelihood of being enrolled in a private school, with 599 (92.1% in the age bracket) attending a public institution.
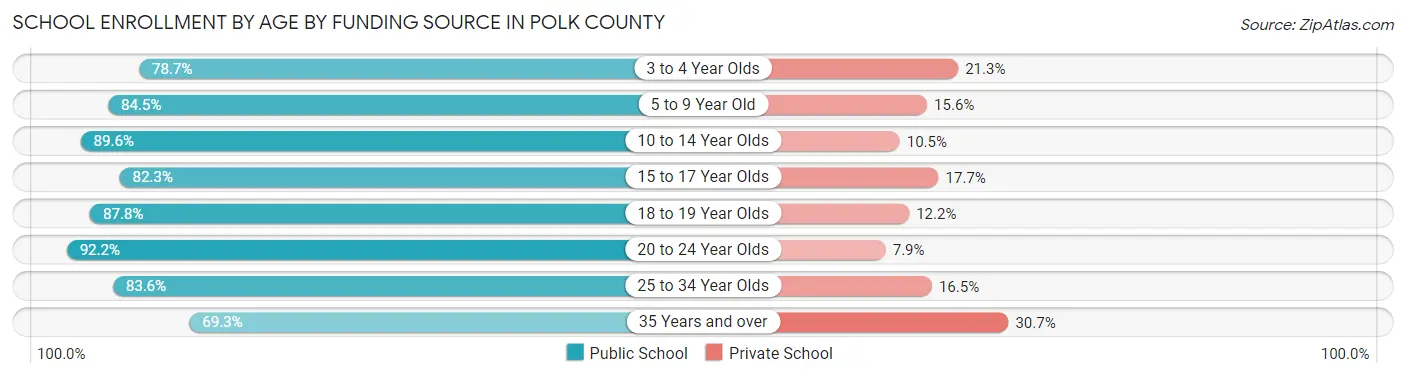
| Age Bracket | Public School | Private School |
| 3 to 4 Year Olds | 376 (78.7%) | 102 (21.3%) |
| 5 to 9 Year Old | 2,085 (84.5%) | 384 (15.5%) |
| 10 to 14 Year Olds | 2,647 (89.5%) | 309 (10.4%) |
| 15 to 17 Year Olds | 1,363 (82.3%) | 293 (17.7%) |
| 18 to 19 Year Olds | 345 (87.8%) | 48 (12.2%) |
| 20 to 24 Year Olds | 599 (92.1%) | 51 (7.9%) |
| 25 to 34 Year Olds | 315 (83.6%) | 62 (16.5%) |
| 35 Years and over | 289 (69.3%) | 128 (30.7%) |
| Total | 8,015 (85.3%) | 1,381 (14.7%) |
Educational Attainment by Field of Study in Polk County
Business (1,115 | 20.2%), education (870 | 15.8%), science & technology (473 | 8.6%), arts & humanities (442 | 8.0%), and engineering (429 | 7.8%) are the most common fields of study among 5,509 individuals in Polk County who have obtained a bachelor's degree or higher.
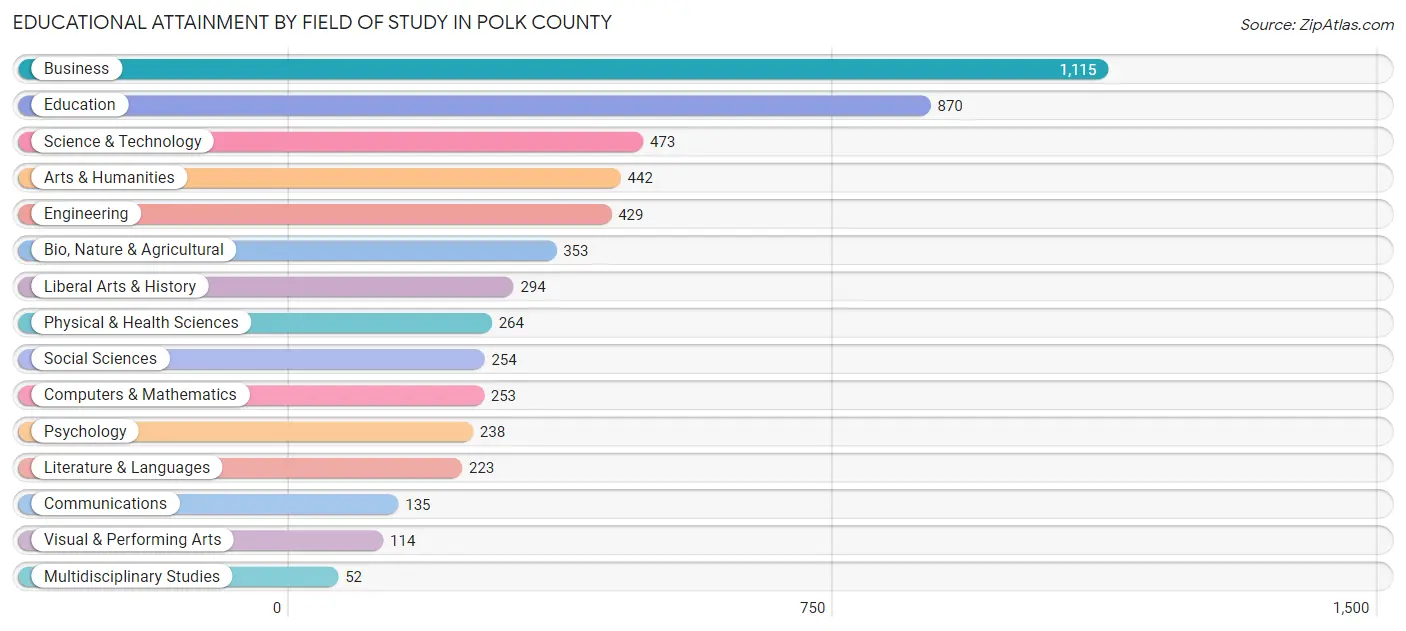
| Field of Study | # Graduates | % Graduates |
| Computers & Mathematics | 253 | 4.6% |
| Bio, Nature & Agricultural | 353 | 6.4% |
| Physical & Health Sciences | 264 | 4.8% |
| Psychology | 238 | 4.3% |
| Social Sciences | 254 | 4.6% |
| Engineering | 429 | 7.8% |
| Multidisciplinary Studies | 52 | 0.9% |
| Science & Technology | 473 | 8.6% |
| Business | 1,115 | 20.2% |
| Education | 870 | 15.8% |
| Literature & Languages | 223 | 4.1% |
| Liberal Arts & History | 294 | 5.3% |
| Visual & Performing Arts | 114 | 2.1% |
| Communications | 135 | 2.5% |
| Arts & Humanities | 442 | 8.0% |
| Total | 5,509 | 100.0% |
Transportation & Commute in Polk County
Vehicle Availability by Sex in Polk County
The most prevalent vehicle ownership categories in Polk County are males with 2 vehicles (4,532, accounting for 45.4%) and females with 2 vehicles (2,921, making up 59.0%).
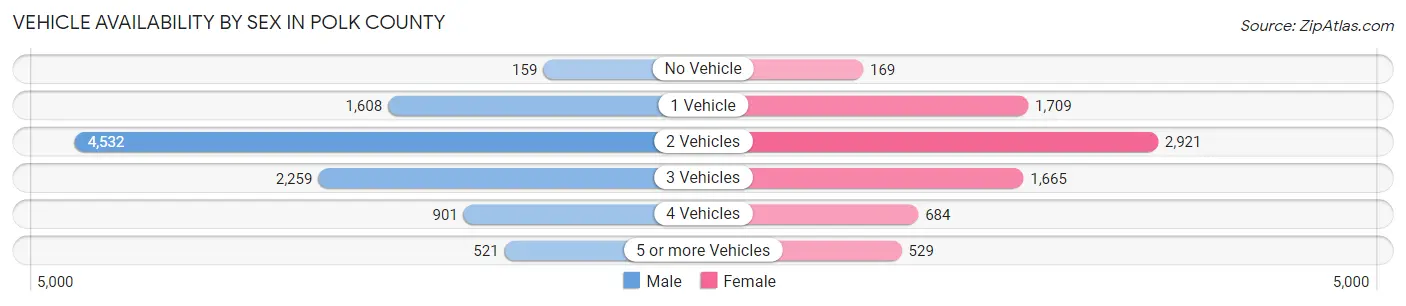
| Vehicles Available | Male | Female |
| No Vehicle | 159 (1.6%) | 169 (2.2%) |
| 1 Vehicle | 1,608 (16.1%) | 1,709 (22.3%) |
| 2 Vehicles | 4,532 (45.4%) | 2,921 (38.1%) |
| 3 Vehicles | 2,259 (22.6%) | 1,665 (21.7%) |
| 4 Vehicles | 901 (9.0%) | 684 (8.9%) |
| 5 or more Vehicles | 521 (5.2%) | 529 (6.9%) |
| Total | 9,980 (100.0%) | 7,677 (100.0%) |
Commute Time in Polk County
The most frequently occuring commute durations in Polk County are 5 to 9 minutes (2,459 commuters, 14.5%), 10 to 14 minutes (2,439 commuters, 14.4%), and 15 to 19 minutes (2,190 commuters, 13.0%).
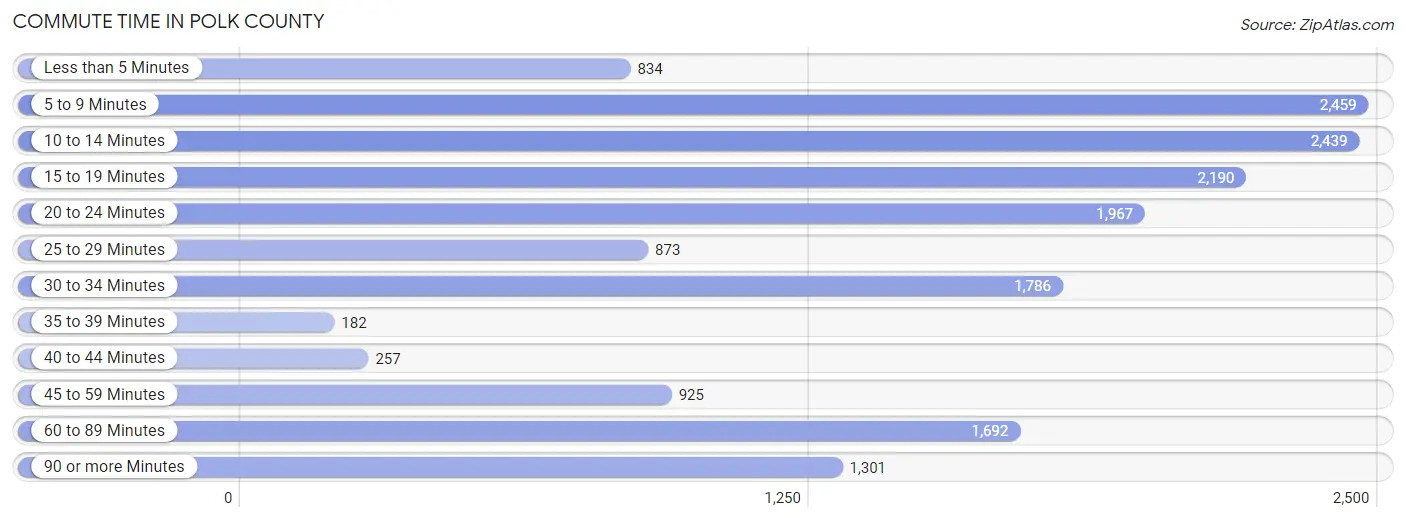
| Commute Time | # Commuters | % Commuters |
| Less than 5 Minutes | 834 | 4.9% |
| 5 to 9 Minutes | 2,459 | 14.5% |
| 10 to 14 Minutes | 2,439 | 14.4% |
| 15 to 19 Minutes | 2,190 | 13.0% |
| 20 to 24 Minutes | 1,967 | 11.6% |
| 25 to 29 Minutes | 873 | 5.2% |
| 30 to 34 Minutes | 1,786 | 10.6% |
| 35 to 39 Minutes | 182 | 1.1% |
| 40 to 44 Minutes | 257 | 1.5% |
| 45 to 59 Minutes | 925 | 5.5% |
| 60 to 89 Minutes | 1,692 | 10.0% |
| 90 or more Minutes | 1,301 | 7.7% |
Commute Time by Sex in Polk County
The most common commute times in Polk County are 10 to 14 minutes (1,381 commuters, 14.1%) for males and 15 to 19 minutes (1,370 commuters, 19.2%) for females.
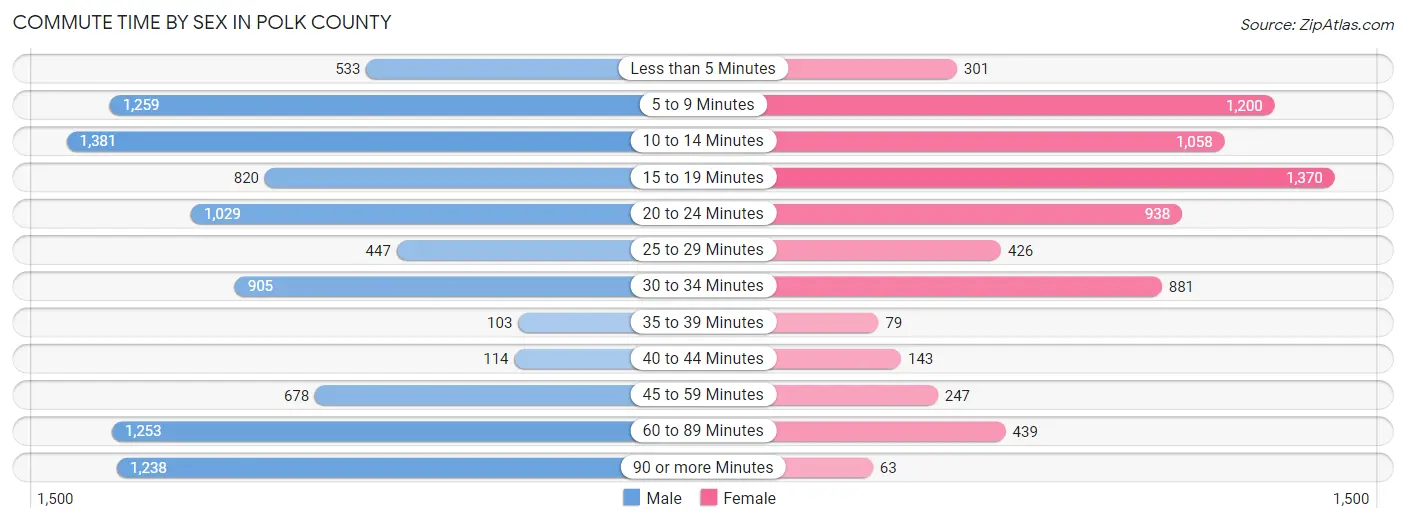
| Commute Time | Male | Female |
| Less than 5 Minutes | 533 (5.5%) | 301 (4.2%) |
| 5 to 9 Minutes | 1,259 (12.9%) | 1,200 (16.8%) |
| 10 to 14 Minutes | 1,381 (14.1%) | 1,058 (14.8%) |
| 15 to 19 Minutes | 820 (8.4%) | 1,370 (19.2%) |
| 20 to 24 Minutes | 1,029 (10.5%) | 938 (13.1%) |
| 25 to 29 Minutes | 447 (4.6%) | 426 (6.0%) |
| 30 to 34 Minutes | 905 (9.3%) | 881 (12.3%) |
| 35 to 39 Minutes | 103 (1.1%) | 79 (1.1%) |
| 40 to 44 Minutes | 114 (1.2%) | 143 (2.0%) |
| 45 to 59 Minutes | 678 (7.0%) | 247 (3.5%) |
| 60 to 89 Minutes | 1,253 (12.8%) | 439 (6.1%) |
| 90 or more Minutes | 1,238 (12.7%) | 63 (0.9%) |
Time of Departure to Work by Sex in Polk County
The most frequent times of departure to work in Polk County are 12:00 AM to 4:59 AM (1,476, 15.1%) for males and 7:00 AM to 7:29 AM (1,422, 19.9%) for females.
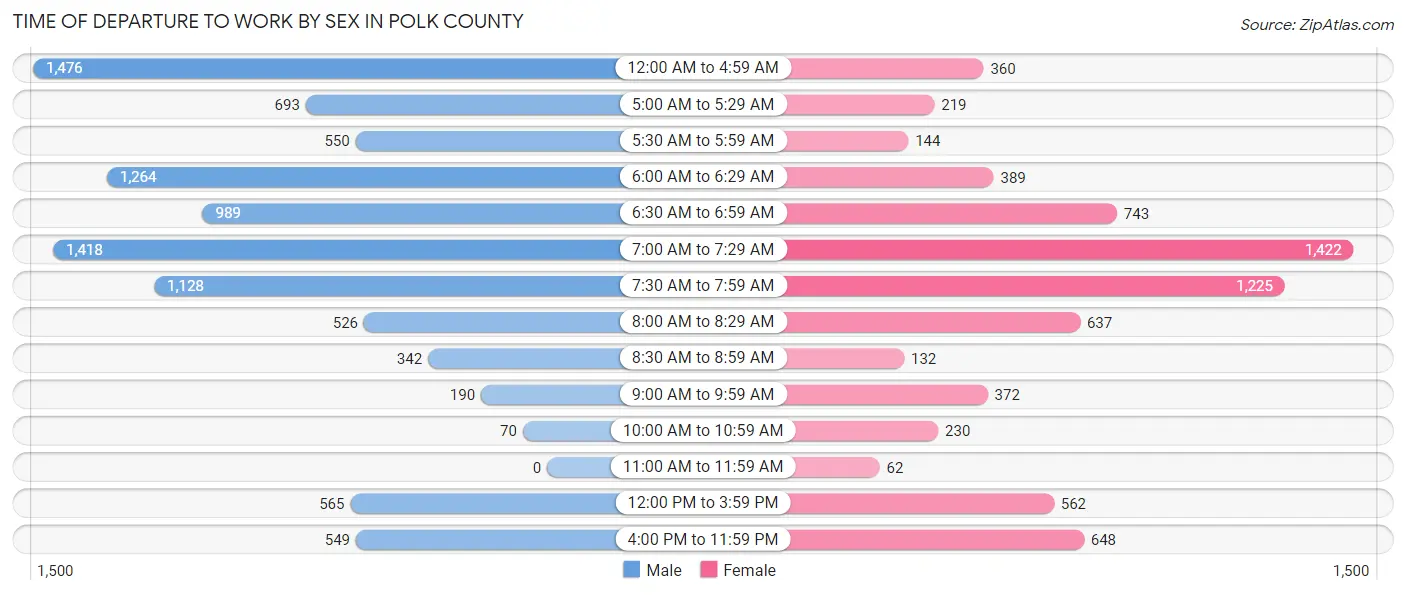
| Time of Departure | Male | Female |
| 12:00 AM to 4:59 AM | 1,476 (15.1%) | 360 (5.0%) |
| 5:00 AM to 5:29 AM | 693 (7.1%) | 219 (3.1%) |
| 5:30 AM to 5:59 AM | 550 (5.6%) | 144 (2.0%) |
| 6:00 AM to 6:29 AM | 1,264 (13.0%) | 389 (5.4%) |
| 6:30 AM to 6:59 AM | 989 (10.1%) | 743 (10.4%) |
| 7:00 AM to 7:29 AM | 1,418 (14.5%) | 1,422 (19.9%) |
| 7:30 AM to 7:59 AM | 1,128 (11.6%) | 1,225 (17.1%) |
| 8:00 AM to 8:29 AM | 526 (5.4%) | 637 (8.9%) |
| 8:30 AM to 8:59 AM | 342 (3.5%) | 132 (1.8%) |
| 9:00 AM to 9:59 AM | 190 (1.9%) | 372 (5.2%) |
| 10:00 AM to 10:59 AM | 70 (0.7%) | 230 (3.2%) |
| 11:00 AM to 11:59 AM | 0 (0.0%) | 62 (0.9%) |
| 12:00 PM to 3:59 PM | 565 (5.8%) | 562 (7.9%) |
| 4:00 PM to 11:59 PM | 549 (5.6%) | 648 (9.1%) |
| Total | 9,760 (100.0%) | 7,145 (100.0%) |
Housing Occupancy in Polk County
Occupancy by Ownership in Polk County
Of the total 18,084 dwellings in Polk County, owner-occupied units account for 14,110 (78.0%), while renter-occupied units make up 3,974 (22.0%).
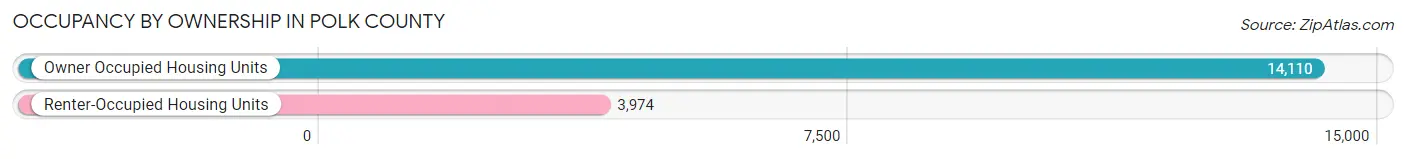
| Occupancy | # Housing Units | % Housing Units |
| Owner Occupied Housing Units | 14,110 | 78.0% |
| Renter-Occupied Housing Units | 3,974 | 22.0% |
| Total Occupied Housing Units | 18,084 | 100.0% |
Occupancy by Household Size in Polk County
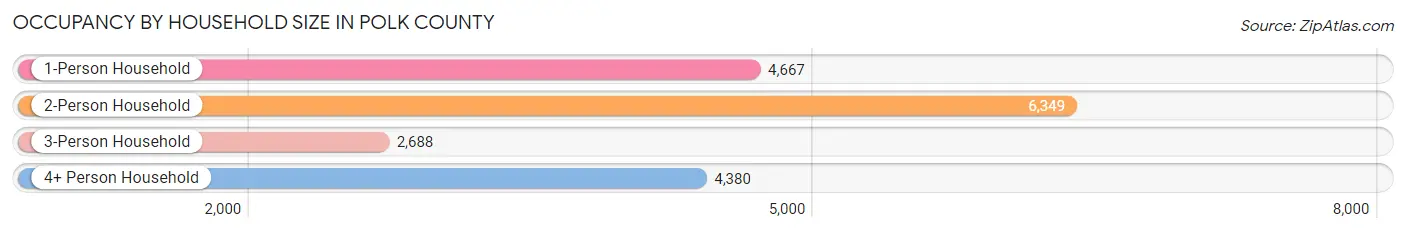
| Household Size | # Housing Units | % Housing Units |
| 1-Person Household | 4,667 | 25.8% |
| 2-Person Household | 6,349 | 35.1% |
| 3-Person Household | 2,688 | 14.9% |
| 4+ Person Household | 4,380 | 24.2% |
| Total Housing Units | 18,084 | 100.0% |
Occupancy by Ownership by Household Size in Polk County
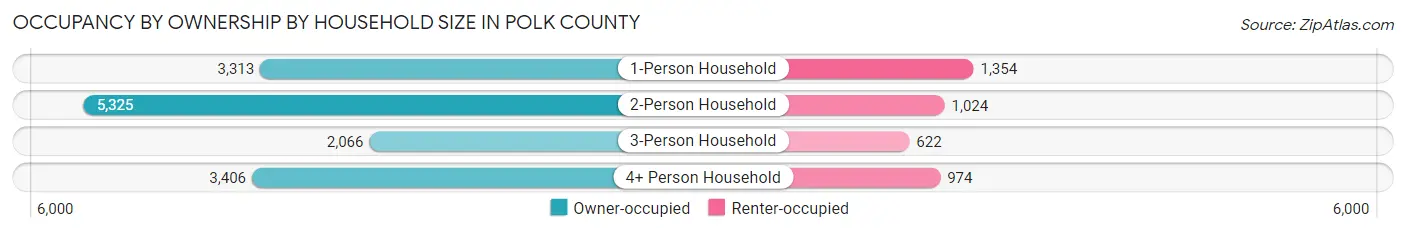
| Household Size | Owner-occupied | Renter-occupied |
| 1-Person Household | 3,313 (71.0%) | 1,354 (29.0%) |
| 2-Person Household | 5,325 (83.9%) | 1,024 (16.1%) |
| 3-Person Household | 2,066 (76.9%) | 622 (23.1%) |
| 4+ Person Household | 3,406 (77.8%) | 974 (22.2%) |
| Total Housing Units | 14,110 (78.0%) | 3,974 (22.0%) |
Occupancy by Educational Attainment in Polk County
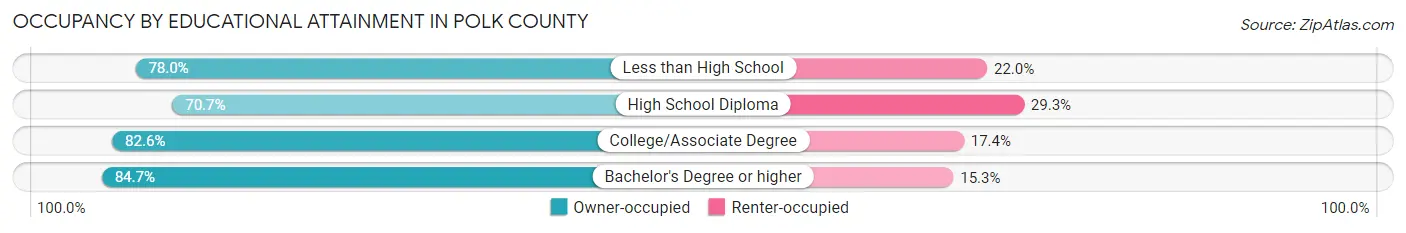
| Household Size | Owner-occupied | Renter-occupied |
| Less than High School | 2,204 (78.0%) | 621 (22.0%) |
| High School Diploma | 4,513 (70.7%) | 1,869 (29.3%) |
| College/Associate Degree | 5,032 (82.6%) | 1,058 (17.4%) |
| Bachelor's Degree or higher | 2,361 (84.7%) | 426 (15.3%) |
Occupancy by Age of Householder in Polk County
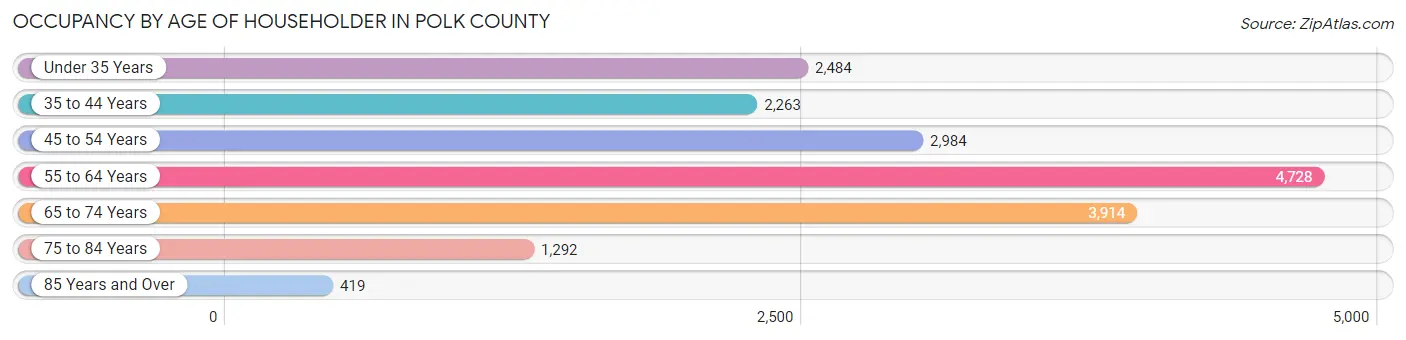
| Age Bracket | # Households | % Households |
| Under 35 Years | 2,484 | 13.7% |
| 35 to 44 Years | 2,263 | 12.5% |
| 45 to 54 Years | 2,984 | 16.5% |
| 55 to 64 Years | 4,728 | 26.1% |
| 65 to 74 Years | 3,914 | 21.6% |
| 75 to 84 Years | 1,292 | 7.1% |
| 85 Years and Over | 419 | 2.3% |
| Total | 18,084 | 100.0% |
Housing Finances in Polk County
Median Income by Occupancy in Polk County
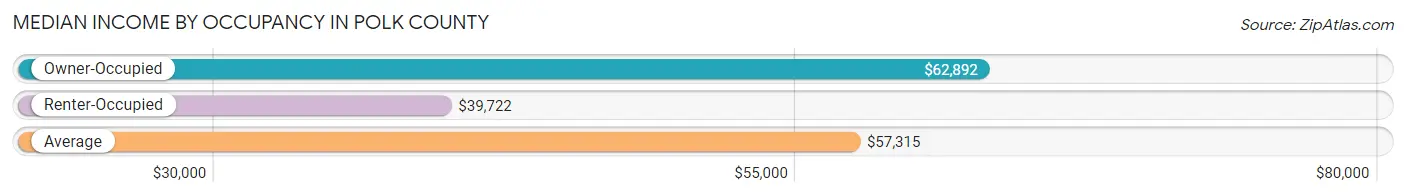
| Occupancy Type | # Households | Median Income |
| Owner-Occupied | 14,110 (78.0%) | $62,892 |
| Renter-Occupied | 3,974 (22.0%) | $39,722 |
| Average | 18,084 (100.0%) | $57,315 |
Occupancy by Householder Income Bracket in Polk County
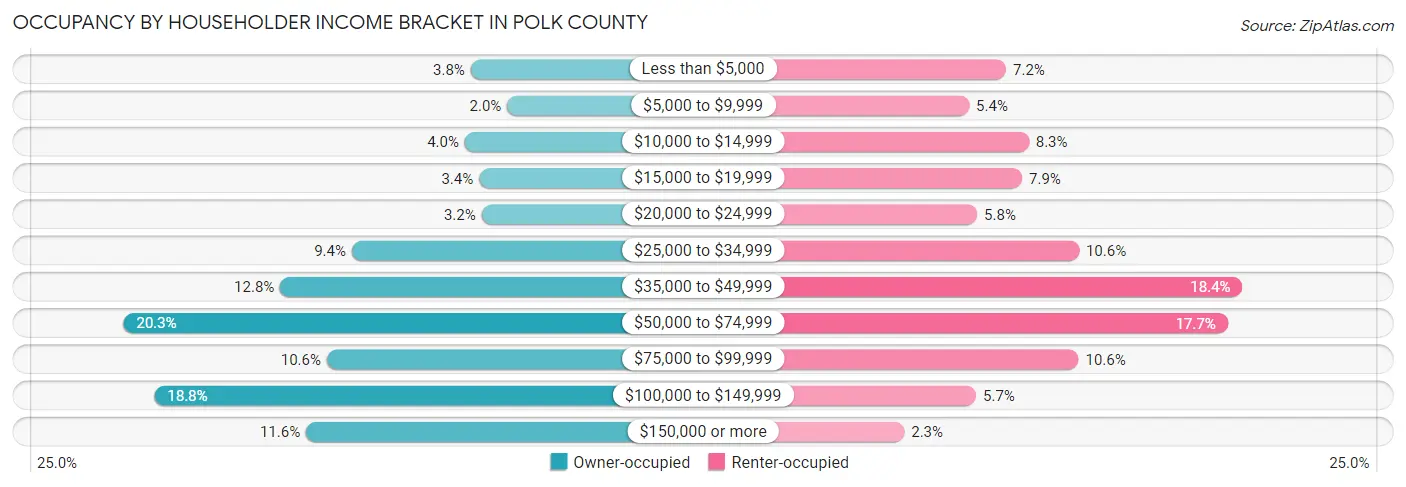
| Income Bracket | Owner-occupied | Renter-occupied |
| Less than $5,000 | 530 (3.8%) | 285 (7.2%) |
| $5,000 to $9,999 | 285 (2.0%) | 215 (5.4%) |
| $10,000 to $14,999 | 570 (4.0%) | 328 (8.3%) |
| $15,000 to $19,999 | 474 (3.4%) | 315 (7.9%) |
| $20,000 to $24,999 | 457 (3.2%) | 230 (5.8%) |
| $25,000 to $34,999 | 1,329 (9.4%) | 423 (10.6%) |
| $35,000 to $49,999 | 1,810 (12.8%) | 732 (18.4%) |
| $50,000 to $74,999 | 2,865 (20.3%) | 704 (17.7%) |
| $75,000 to $99,999 | 1,497 (10.6%) | 422 (10.6%) |
| $100,000 to $149,999 | 2,656 (18.8%) | 228 (5.7%) |
| $150,000 or more | 1,637 (11.6%) | 92 (2.3%) |
| Total | 14,110 (100.0%) | 3,974 (100.0%) |
Monthly Housing Cost Tiers in Polk County
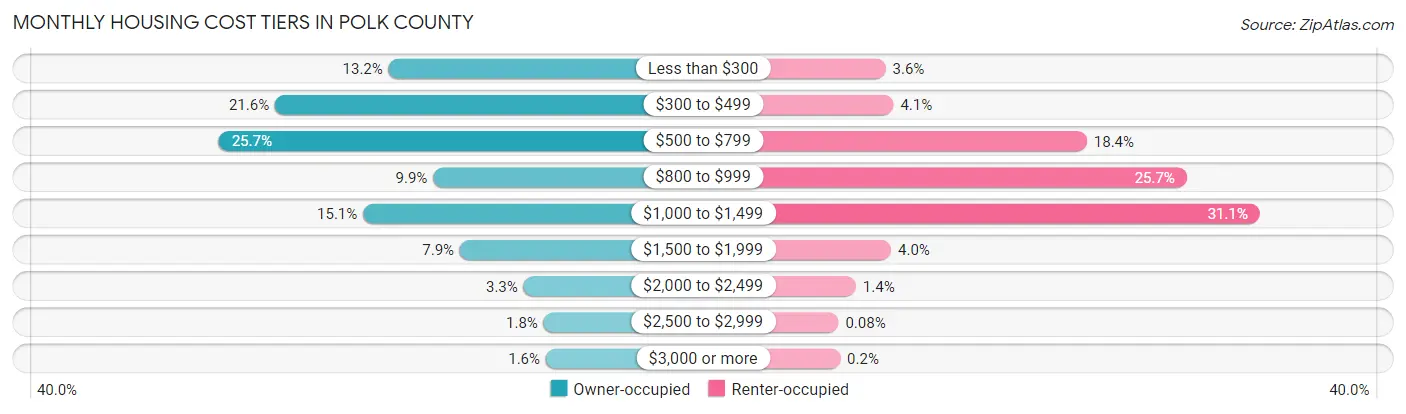
| Monthly Cost | Owner-occupied | Renter-occupied |
| Less than $300 | 1,861 (13.2%) | 141 (3.5%) |
| $300 to $499 | 3,042 (21.6%) | 164 (4.1%) |
| $500 to $799 | 3,626 (25.7%) | 730 (18.4%) |
| $800 to $999 | 1,398 (9.9%) | 1,022 (25.7%) |
| $1,000 to $1,499 | 2,126 (15.1%) | 1,236 (31.1%) |
| $1,500 to $1,999 | 1,121 (7.9%) | 157 (4.0%) |
| $2,000 to $2,499 | 459 (3.3%) | 54 (1.4%) |
| $2,500 to $2,999 | 250 (1.8%) | 3 (0.1%) |
| $3,000 or more | 227 (1.6%) | 8 (0.2%) |
| Total | 14,110 (100.0%) | 3,974 (100.0%) |
Physical Housing Characteristics in Polk County
Housing Structures in Polk County
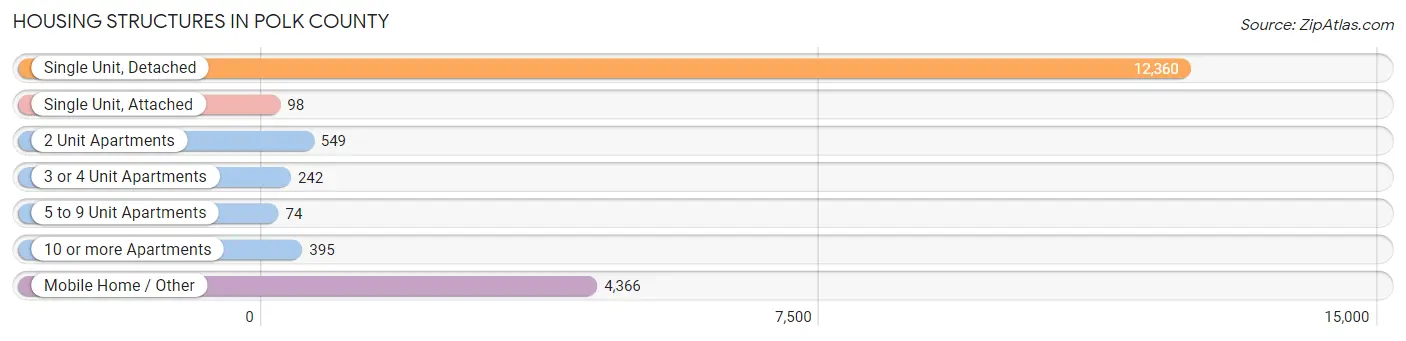
| Structure Type | # Housing Units | % Housing Units |
| Single Unit, Detached | 12,360 | 68.3% |
| Single Unit, Attached | 98 | 0.5% |
| 2 Unit Apartments | 549 | 3.0% |
| 3 or 4 Unit Apartments | 242 | 1.3% |
| 5 to 9 Unit Apartments | 74 | 0.4% |
| 10 or more Apartments | 395 | 2.2% |
| Mobile Home / Other | 4,366 | 24.1% |
| Total | 18,084 | 100.0% |
Housing Structures by Occupancy in Polk County
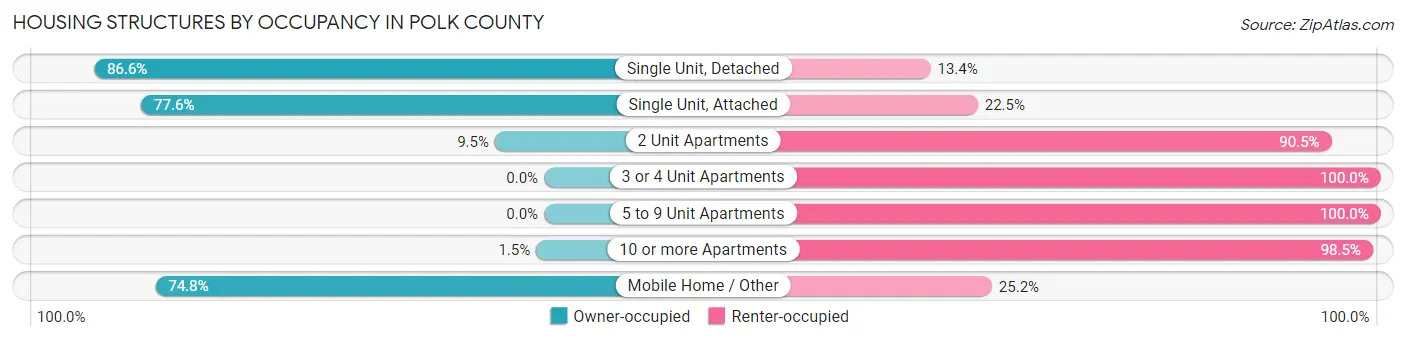
| Structure Type | Owner-occupied | Renter-occupied |
| Single Unit, Detached | 10,709 (86.6%) | 1,651 (13.4%) |
| Single Unit, Attached | 76 (77.5%) | 22 (22.5%) |
| 2 Unit Apartments | 52 (9.5%) | 497 (90.5%) |
| 3 or 4 Unit Apartments | 0 (0.0%) | 242 (100.0%) |
| 5 to 9 Unit Apartments | 0 (0.0%) | 74 (100.0%) |
| 10 or more Apartments | 6 (1.5%) | 389 (98.5%) |
| Mobile Home / Other | 3,267 (74.8%) | 1,099 (25.2%) |
| Total | 14,110 (78.0%) | 3,974 (22.0%) |
Housing Structures by Number of Rooms in Polk County
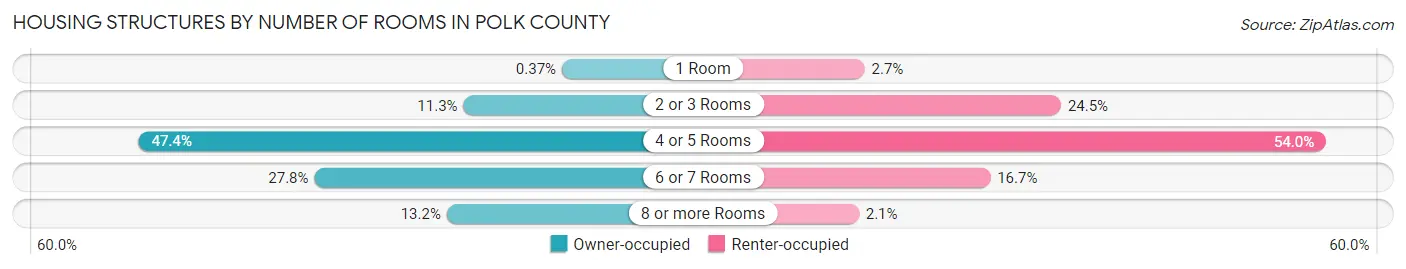
| Number of Rooms | Owner-occupied | Renter-occupied |
| 1 Room | 52 (0.4%) | 109 (2.7%) |
| 2 or 3 Rooms | 1,594 (11.3%) | 975 (24.5%) |
| 4 or 5 Rooms | 6,681 (47.3%) | 2,144 (53.9%) |
| 6 or 7 Rooms | 3,928 (27.8%) | 663 (16.7%) |
| 8 or more Rooms | 1,855 (13.2%) | 83 (2.1%) |
| Total | 14,110 (100.0%) | 3,974 (100.0%) |
Housing Structure by Heating Type in Polk County
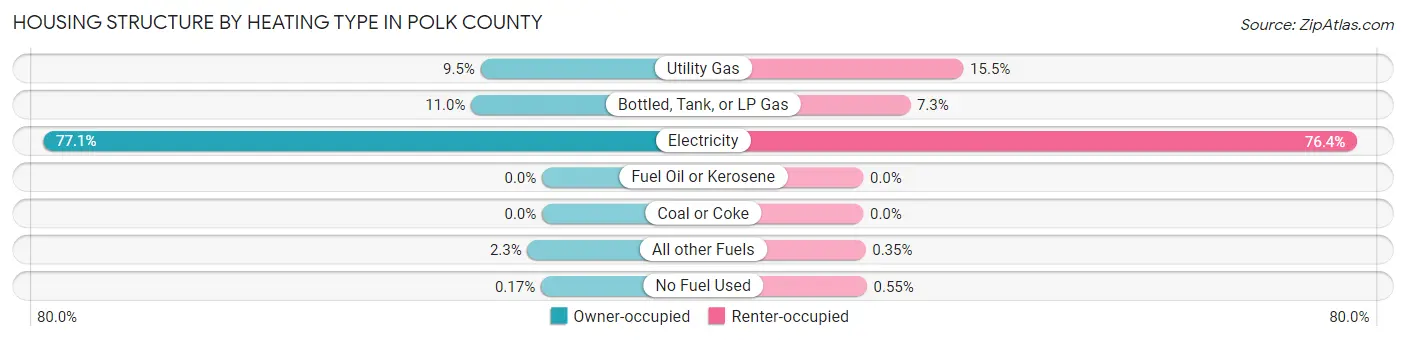
| Heating Type | Owner-occupied | Renter-occupied |
| Utility Gas | 1,339 (9.5%) | 615 (15.5%) |
| Bottled, Tank, or LP Gas | 1,545 (11.0%) | 288 (7.2%) |
| Electricity | 10,884 (77.1%) | 3,035 (76.4%) |
| Fuel Oil or Kerosene | 0 (0.0%) | 0 (0.0%) |
| Coal or Coke | 0 (0.0%) | 0 (0.0%) |
| All other Fuels | 318 (2.2%) | 14 (0.4%) |
| No Fuel Used | 24 (0.2%) | 22 (0.5%) |
| Total | 14,110 (100.0%) | 3,974 (100.0%) |
Household Vehicle Usage in Polk County
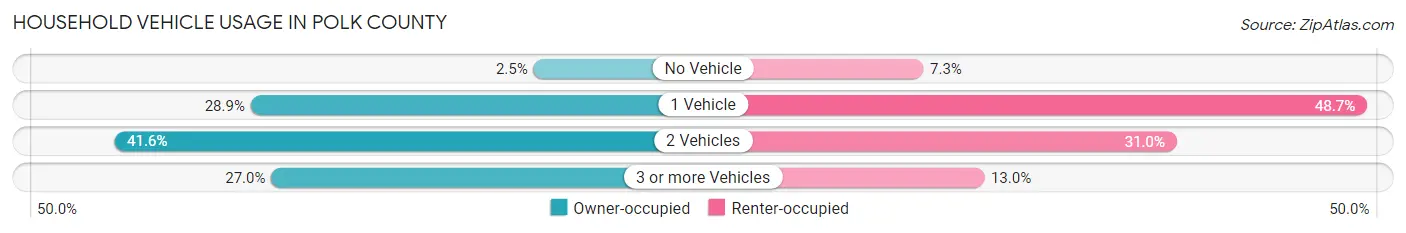
| Vehicles per Household | Owner-occupied | Renter-occupied |
| No Vehicle | 352 (2.5%) | 290 (7.3%) |
| 1 Vehicle | 4,077 (28.9%) | 1,937 (48.7%) |
| 2 Vehicles | 5,875 (41.6%) | 1,231 (31.0%) |
| 3 or more Vehicles | 3,806 (27.0%) | 516 (13.0%) |
| Total | 14,110 (100.0%) | 3,974 (100.0%) |
Real Estate & Mortgages in Polk County
Real Estate and Mortgage Overview in Polk County
| Characteristic | Without Mortgage | With Mortgage |
| Housing Units | 8,790 | 5,320 |
| Median Property Value | $131,800 | $171,700 |
| Median Household Income | $57,213 | $918 |
| Monthly Housing Costs | $469 | $227 |
| Real Estate Taxes | $1,288 | $296 |
Property Value by Mortgage Status in Polk County
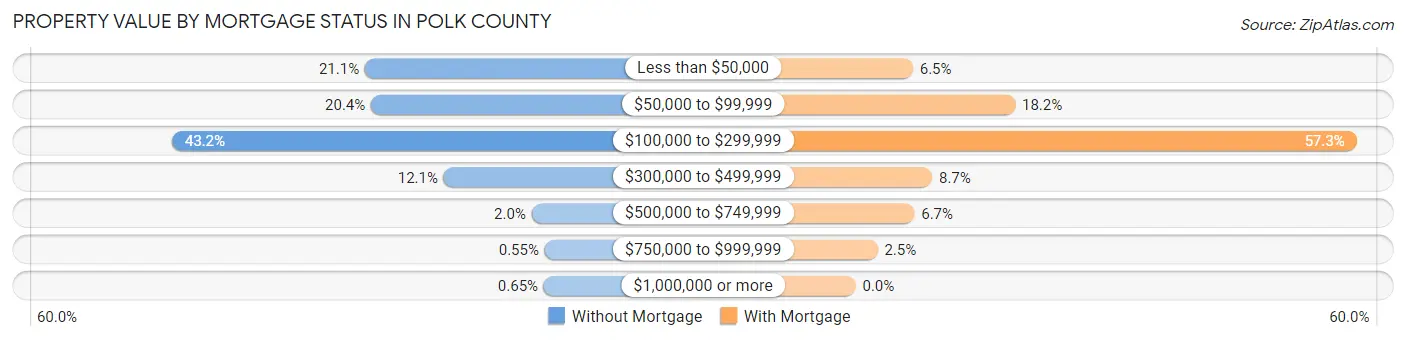
| Property Value | Without Mortgage | With Mortgage |
| Less than $50,000 | 1,855 (21.1%) | 348 (6.5%) |
| $50,000 to $99,999 | 1,793 (20.4%) | 970 (18.2%) |
| $100,000 to $299,999 | 3,795 (43.2%) | 3,047 (57.3%) |
| $300,000 to $499,999 | 1,063 (12.1%) | 465 (8.7%) |
| $500,000 to $749,999 | 179 (2.0%) | 357 (6.7%) |
| $750,000 to $999,999 | 48 (0.5%) | 133 (2.5%) |
| $1,000,000 or more | 57 (0.6%) | 0 (0.0%) |
| Total | 8,790 (100.0%) | 5,320 (100.0%) |
Household Income by Mortgage Status in Polk County
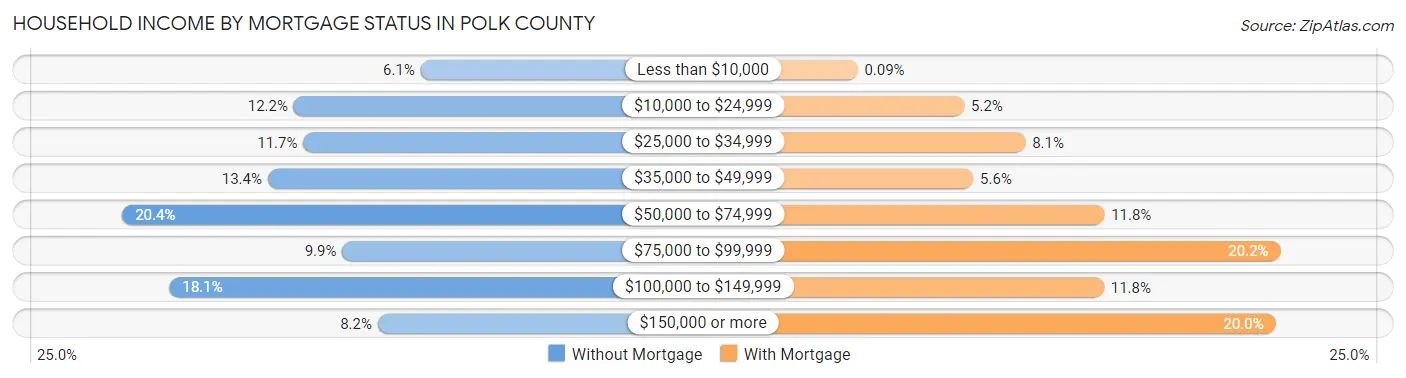
| Household Income | Without Mortgage | With Mortgage |
| Less than $10,000 | 540 (6.1%) | 5 (0.1%) |
| $10,000 to $24,999 | 1,071 (12.2%) | 275 (5.2%) |
| $25,000 to $34,999 | 1,031 (11.7%) | 430 (8.1%) |
| $35,000 to $49,999 | 1,180 (13.4%) | 298 (5.6%) |
| $50,000 to $74,999 | 1,789 (20.3%) | 630 (11.8%) |
| $75,000 to $99,999 | 868 (9.9%) | 1,076 (20.2%) |
| $100,000 to $149,999 | 1,592 (18.1%) | 629 (11.8%) |
| $150,000 or more | 719 (8.2%) | 1,064 (20.0%) |
| Total | 8,790 (100.0%) | 5,320 (100.0%) |
Property Value to Household Income Ratio in Polk County
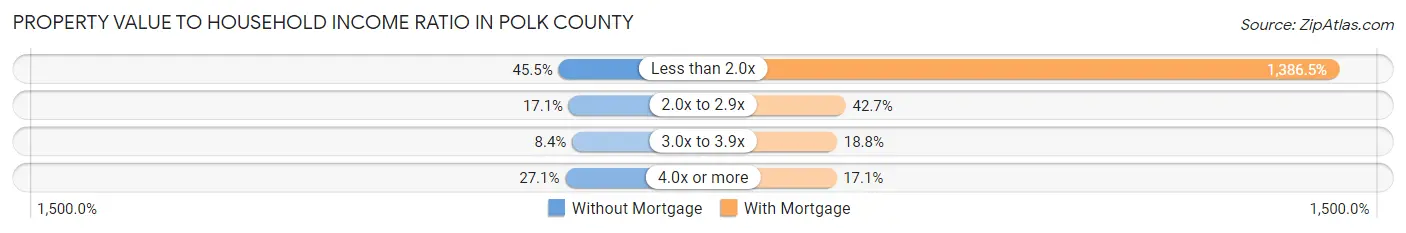
| Value-to-Income Ratio | Without Mortgage | With Mortgage |
| Less than 2.0x | 3,999 (45.5%) | 73,763 (1,386.5%) |
| 2.0x to 2.9x | 1,505 (17.1%) | 2,269 (42.6%) |
| 3.0x to 3.9x | 737 (8.4%) | 998 (18.8%) |
| 4.0x or more | 2,379 (27.1%) | 908 (17.1%) |
| Total | 8,790 (100.0%) | 5,320 (100.0%) |
Real Estate Taxes by Mortgage Status in Polk County
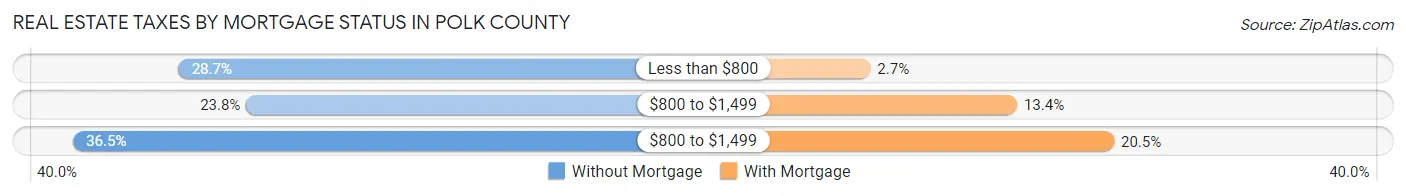
| Property Taxes | Without Mortgage | With Mortgage |
| Less than $800 | 2,526 (28.7%) | 145 (2.7%) |
| $800 to $1,499 | 2,093 (23.8%) | 715 (13.4%) |
| $800 to $1,499 | 3,204 (36.4%) | 1,092 (20.5%) |
| Total | 8,790 (100.0%) | 5,320 (100.0%) |
Health & Disability in Polk County
Health Insurance Coverage by Age in Polk County
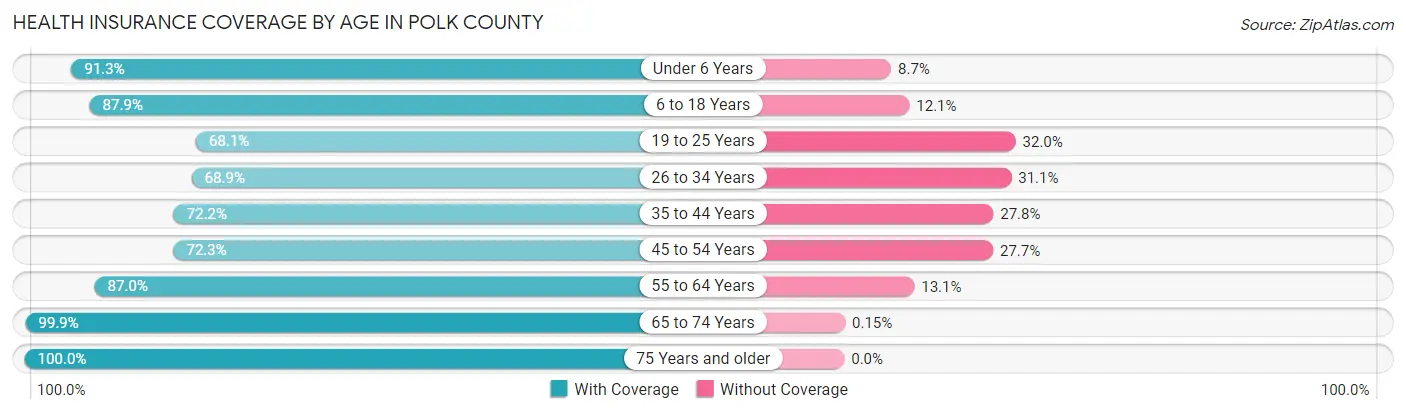
| Age Bracket | With Coverage | Without Coverage |
| Under 6 Years | 2,795 (91.3%) | 267 (8.7%) |
| 6 to 18 Years | 6,717 (87.9%) | 927 (12.1%) |
| 19 to 25 Years | 2,262 (68.0%) | 1,062 (32.0%) |
| 26 to 34 Years | 3,109 (68.9%) | 1,406 (31.1%) |
| 35 to 44 Years | 3,755 (72.2%) | 1,445 (27.8%) |
| 45 to 54 Years | 4,227 (72.3%) | 1,623 (27.7%) |
| 55 to 64 Years | 7,161 (87.0%) | 1,075 (13.1%) |
| 65 to 74 Years | 6,544 (99.9%) | 10 (0.2%) |
| 75 Years and older | 2,502 (100.0%) | 0 (0.0%) |
| Total | 39,072 (83.3%) | 7,815 (16.7%) |
Health Insurance Coverage by Citizenship Status in Polk County
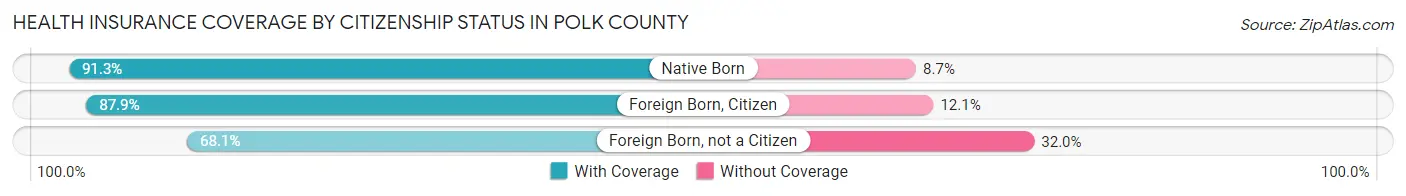
| Citizenship Status | With Coverage | Without Coverage |
| Native Born | 2,795 (91.3%) | 267 (8.7%) |
| Foreign Born, Citizen | 6,717 (87.9%) | 927 (12.1%) |
| Foreign Born, not a Citizen | 2,262 (68.0%) | 1,062 (32.0%) |
Health Insurance Coverage by Household Income in Polk County
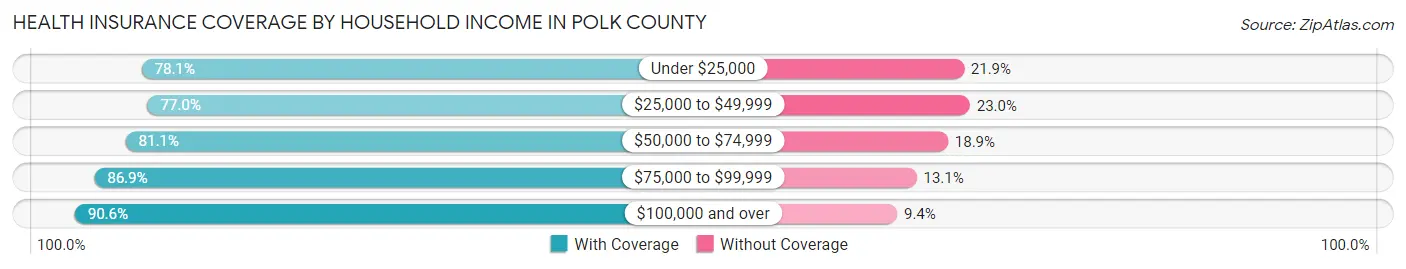
| Household Income | With Coverage | Without Coverage |
| Under $25,000 | 5,188 (78.1%) | 1,457 (21.9%) |
| $25,000 to $49,999 | 7,602 (77.0%) | 2,276 (23.0%) |
| $50,000 to $74,999 | 8,691 (81.1%) | 2,030 (18.9%) |
| $75,000 to $99,999 | 4,582 (86.9%) | 689 (13.1%) |
| $100,000 and over | 12,974 (90.6%) | 1,347 (9.4%) |
Public vs Private Health Insurance Coverage by Age in Polk County
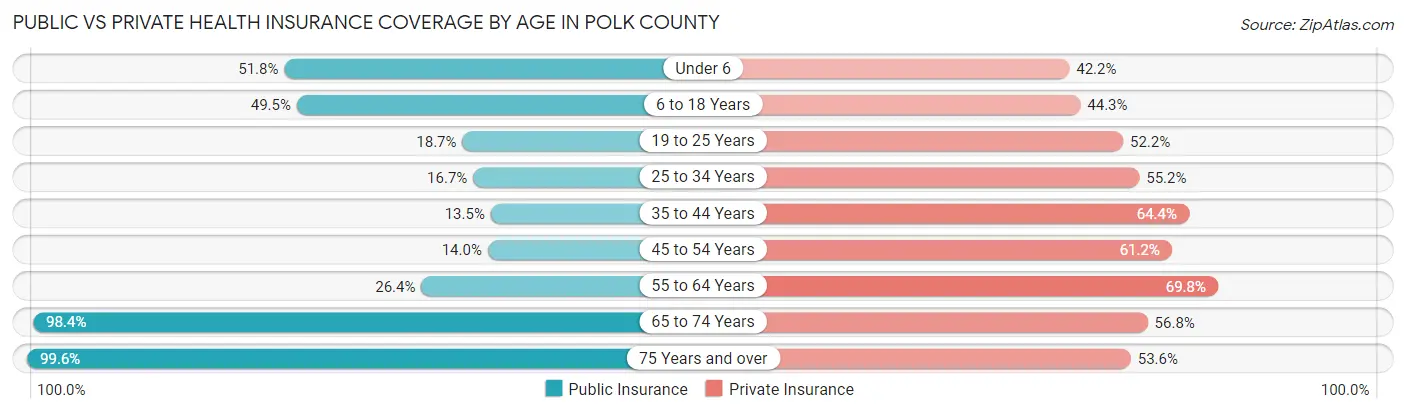
| Age Bracket | Public Insurance | Private Insurance |
| Under 6 | 1,586 (51.8%) | 1,293 (42.2%) |
| 6 to 18 Years | 3,782 (49.5%) | 3,385 (44.3%) |
| 19 to 25 Years | 623 (18.7%) | 1,735 (52.2%) |
| 25 to 34 Years | 756 (16.7%) | 2,493 (55.2%) |
| 35 to 44 Years | 701 (13.5%) | 3,349 (64.4%) |
| 45 to 54 Years | 821 (14.0%) | 3,582 (61.2%) |
| 55 to 64 Years | 2,172 (26.4%) | 5,747 (69.8%) |
| 65 to 74 Years | 6,451 (98.4%) | 3,721 (56.8%) |
| 75 Years and over | 2,491 (99.6%) | 1,342 (53.6%) |
| Total | 19,383 (41.3%) | 26,647 (56.8%) |
Disability Status by Sex by Age in Polk County
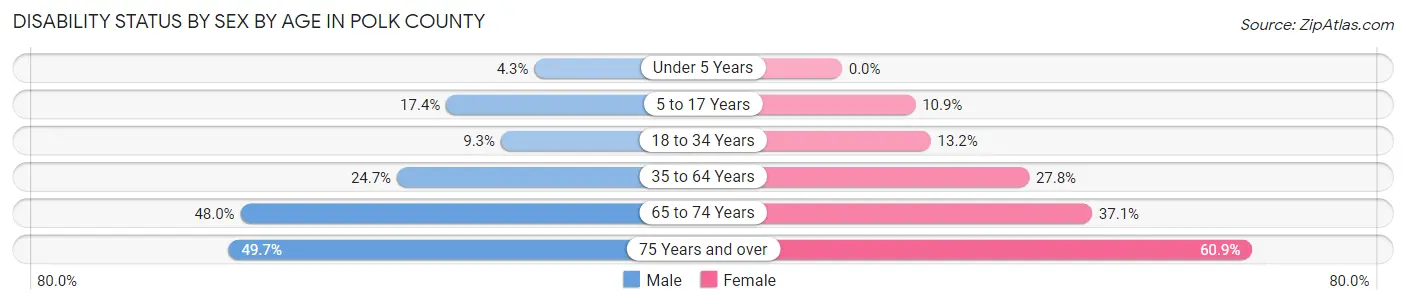
| Age Bracket | Male | Female |
| Under 5 Years | 55 (4.3%) | 0 (0.0%) |
| 5 to 17 Years | 686 (17.4%) | 399 (10.9%) |
| 18 to 34 Years | 414 (9.3%) | 519 (13.2%) |
| 35 to 64 Years | 2,347 (24.7%) | 2,720 (27.8%) |
| 65 to 74 Years | 1,640 (47.9%) | 1,164 (37.1%) |
| 75 Years and over | 628 (49.7%) | 755 (60.9%) |
Disability Class by Sex by Age in Polk County
Disability Class: Hearing Difficulty
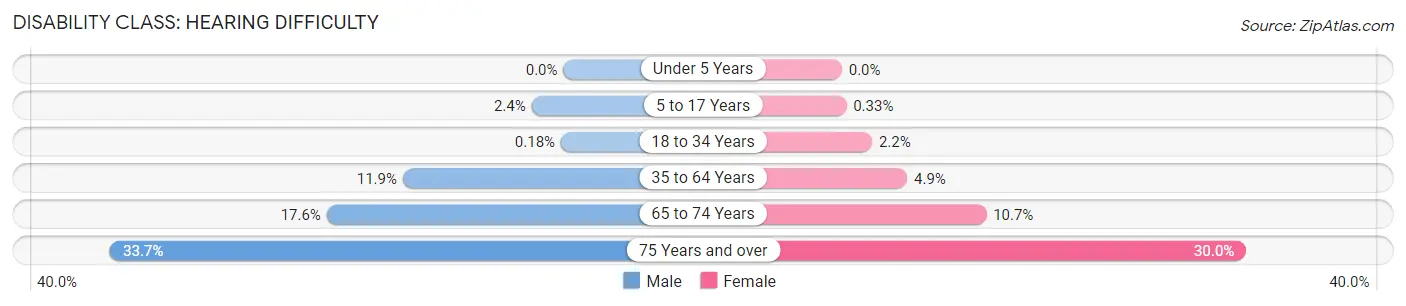
| Age Bracket | Male | Female |
| Under 5 Years | 0 (0.0%) | 0 (0.0%) |
| 5 to 17 Years | 93 (2.4%) | 12 (0.3%) |
| 18 to 34 Years | 8 (0.2%) | 88 (2.2%) |
| 35 to 64 Years | 1,132 (11.9%) | 475 (4.9%) |
| 65 to 74 Years | 601 (17.6%) | 336 (10.7%) |
| 75 Years and over | 425 (33.7%) | 372 (30.0%) |
Disability Class: Vision Difficulty
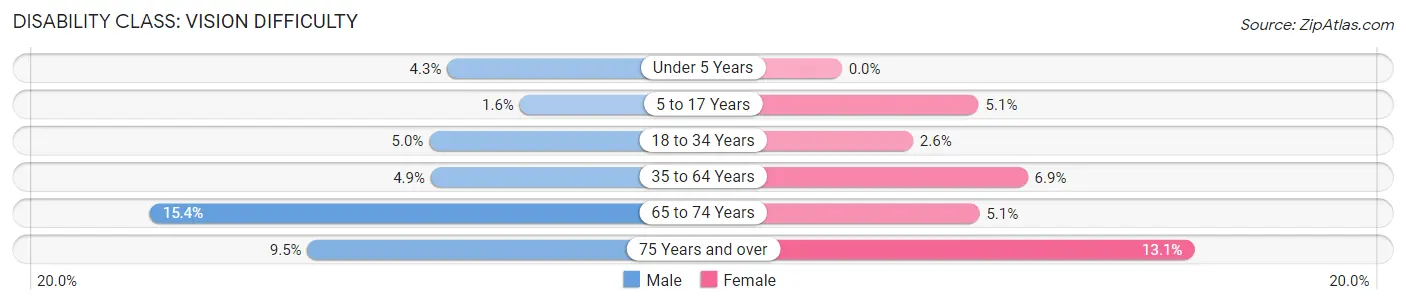
| Age Bracket | Male | Female |
| Under 5 Years | 55 (4.3%) | 0 (0.0%) |
| 5 to 17 Years | 64 (1.6%) | 186 (5.1%) |
| 18 to 34 Years | 222 (5.0%) | 104 (2.6%) |
| 35 to 64 Years | 467 (4.9%) | 675 (6.9%) |
| 65 to 74 Years | 525 (15.3%) | 160 (5.1%) |
| 75 Years and over | 120 (9.5%) | 162 (13.1%) |
Disability Class: Cognitive Difficulty
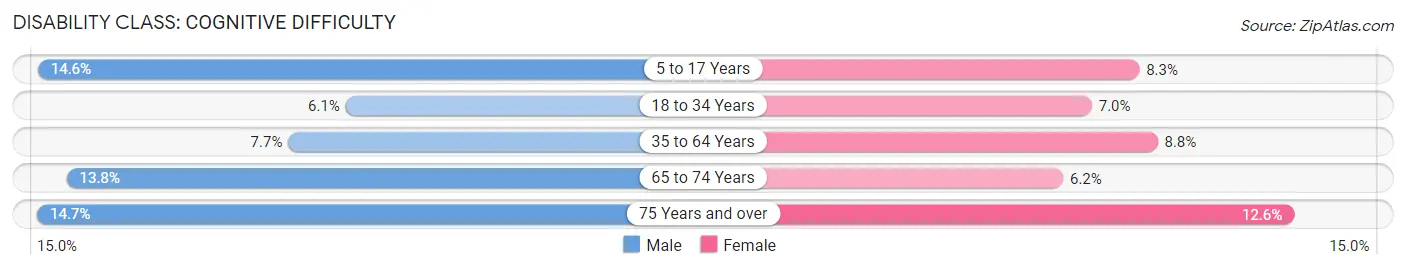
| Age Bracket | Male | Female |
| 5 to 17 Years | 577 (14.6%) | 303 (8.3%) |
| 18 to 34 Years | 270 (6.1%) | 274 (7.0%) |
| 35 to 64 Years | 728 (7.7%) | 860 (8.8%) |
| 65 to 74 Years | 473 (13.8%) | 193 (6.2%) |
| 75 Years and over | 185 (14.6%) | 156 (12.6%) |
Disability Class: Ambulatory Difficulty
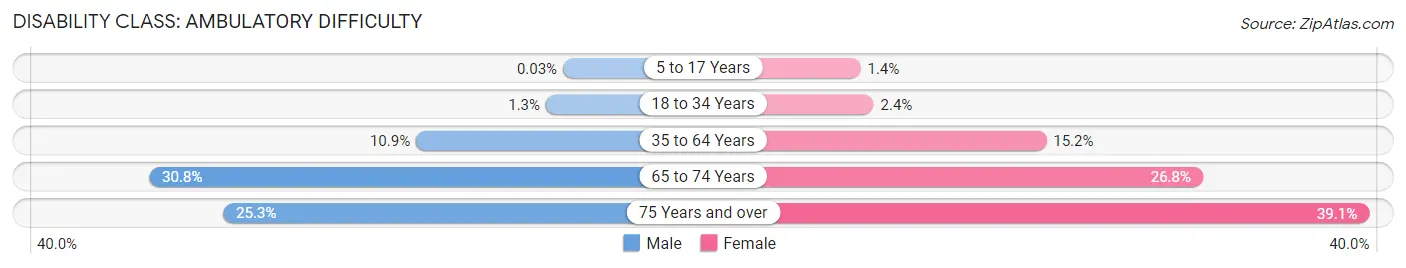
| Age Bracket | Male | Female |
| 5 to 17 Years | 1 (0.0%) | 51 (1.4%) |
| 18 to 34 Years | 58 (1.3%) | 93 (2.4%) |
| 35 to 64 Years | 1,039 (10.9%) | 1,486 (15.2%) |
| 65 to 74 Years | 1,052 (30.8%) | 840 (26.8%) |
| 75 Years and over | 319 (25.3%) | 485 (39.1%) |
Disability Class: Self-Care Difficulty
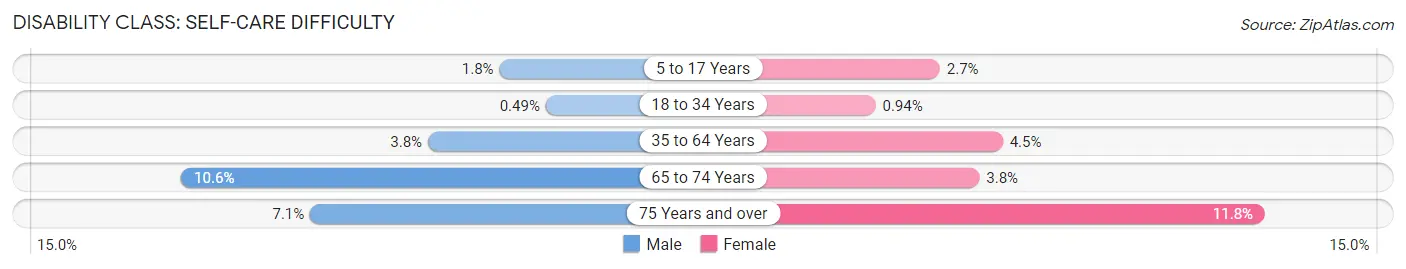
| Age Bracket | Male | Female |
| 5 to 17 Years | 70 (1.8%) | 100 (2.7%) |
| 18 to 34 Years | 22 (0.5%) | 37 (0.9%) |
| 35 to 64 Years | 358 (3.8%) | 438 (4.5%) |
| 65 to 74 Years | 364 (10.6%) | 120 (3.8%) |
| 75 Years and over | 89 (7.0%) | 146 (11.8%) |
Technology Access in Polk County
Computing Device Access in Polk County
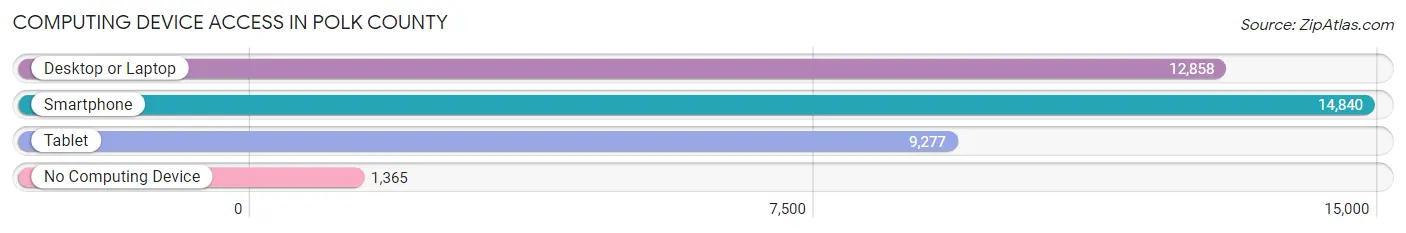
| Device Type | # Households | % Households |
| Desktop or Laptop | 12,858 | 71.1% |
| Smartphone | 14,840 | 82.1% |
| Tablet | 9,277 | 51.3% |
| No Computing Device | 1,365 | 7.5% |
| Total | 18,084 | 100.0% |
Internet Access in Polk County
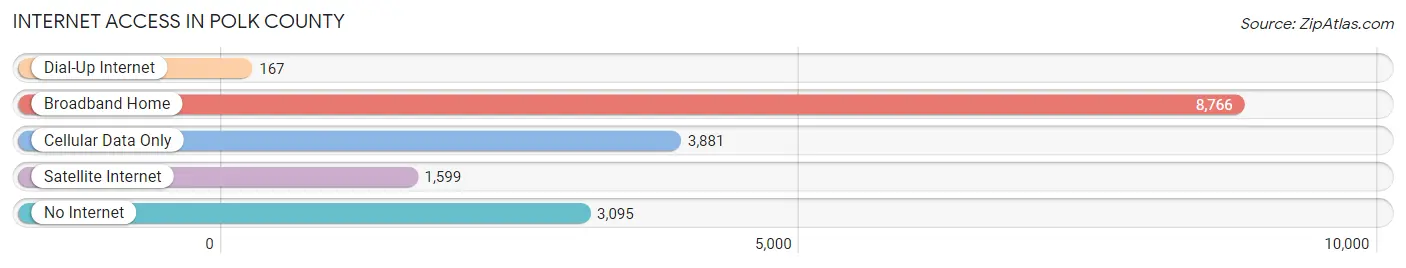
| Internet Type | # Households | % Households |
| Dial-Up Internet | 167 | 0.9% |
| Broadband Home | 8,766 | 48.5% |
| Cellular Data Only | 3,881 | 21.5% |
| Satellite Internet | 1,599 | 8.8% |
| No Internet | 3,095 | 17.1% |
| Total | 18,084 | 100.0% |
Polk County Summary
Polk County, Texas is located in the southeastern corner of the state, and is bordered by Trinity, San Jacinto, and Tyler Counties. It is part of the East Texas region, and is known for its rolling hills, pine forests, and numerous lakes and rivers. The county seat is Livingston, and the largest city is Onalaska. The population of Polk County was 45,413 in 2019, making it the 64th most populous county in Texas.
History
Polk County was established in 1846, and was named after James K. Polk, the 11th President of the United States. The county was originally part of Liberty County, and was created to provide better access to the courts. The first settlers in the area were mostly German and Irish immigrants, who were attracted to the area by the abundance of timber and fertile soil.
The county was largely rural until the early 20th century, when the lumber industry began to boom. The timber industry was the main source of employment in the county until the 1950s, when the oil and gas industry began to take off. The county has since become a major producer of oil and gas, and is home to several large oil and gas companies.
Geography
Polk County is located in the southeastern corner of Texas, and is bordered by Trinity, San Jacinto, and Tyler Counties. The county covers an area of 1,072 square miles, and is mostly forested. The terrain is mostly rolling hills, with numerous lakes and rivers. The county is part of the East Texas region, and is known for its lush pine forests.
The county is home to several state parks, including Lake Livingston State Park, Martin Dies Jr. State Park, and Big Thicket National Preserve. The county is also home to the Sam Houston National Forest, which is the largest national forest in Texas.
Economy
The economy of Polk County is largely based on the oil and gas industry, which is the largest employer in the county. The county is home to several large oil and gas companies, including Chevron, ExxonMobil, and Shell. The county is also home to several timber companies, and is a major producer of timber products.
The county is also home to several manufacturing companies, including a paper mill, a plastics plant, and a steel mill. The county is also home to several agricultural operations, including cattle ranches, poultry farms, and vegetable farms.
Demographics
As of 2019, the population of Polk County was 45,413, making it the 64th most populous county in Texas. The population is largely white (83.3%), with small percentages of African American (10.2%), Hispanic (4.3%), and Asian (1.2%) residents. The median household income in the county is $45,845, and the median home value is $133,400. The poverty rate in the county is 17.2%, and the unemployment rate is 4.2%.
Conclusion
Polk County, Texas is located in the southeastern corner of the state, and is bordered by Trinity, San Jacinto, and Tyler Counties. The county is part of the East Texas region, and is known for its rolling hills, pine forests, and numerous lakes and rivers. The economy of Polk County is largely based on the oil and gas industry, which is the largest employer in the county. The population of Polk County was 45,413 in 2019, making it the 64th most populous county in Texas. The population is largely white, with small percentages of African American, Hispanic, and Asian residents. The median household income in the county is $45,845, and the median home value is $133,400.
Common Questions
What is Per Capita Income in Polk County?
Per Capita income in Polk County is $27,922.
What is the Median Family Income in Polk County?
Median Family Income in Polk County is $66,568.
What is the Median Household income in Polk County?
Median Household Income in Polk County is $57,315.
What is Income or Wage Gap in Polk County?
Income or Wage Gap in Polk County is 41.9%.
Women in Polk County earn 58.1 cents for every dollar earned by a man.
What is Family Income Deficit in Polk County?
Family Income Deficit in Polk County is $12,071.
Families that are below poverty line in Polk County earn $12,071 less on average than the poverty threshold level.
What is Inequality or Gini Index in Polk County?
Inequality or Gini Index in Polk County is 0.44.
What is the Total Population of Polk County?
Total Population of Polk County is 50,536.
What is the Total Male Population of Polk County?
Total Male Population of Polk County is 27,262.
What is the Total Female Population of Polk County?
Total Female Population of Polk County is 23,274.
What is the Ratio of Males per 100 Females in Polk County?
There are 117.14 Males per 100 Females in Polk County.
What is the Ratio of Females per 100 Males in Polk County?
There are 85.37 Females per 100 Males in Polk County.
What is the Median Population Age in Polk County?
Median Population Age in Polk County is 43.8 Years.
What is the Average Family Size in Polk County
Average Family Size in Polk County is 3.1 People.
What is the Average Household Size in Polk County
Average Household Size in Polk County is 2.6 People.
How Large is the Labor Force in Polk County?
There are 20,200 People in the Labor Forcein in Polk County.
What is the Percentage of People in the Labor Force in Polk County?
48.5% of People are in the Labor Force in Polk County.
What is the Unemployment Rate in Polk County?
Unemployment Rate in Polk County is 9.3%.