Parmer County, TX Map & Demographics
Parmer County Map
Parmer County Overview
$28,342
PER CAPITA INCOME
$78,973
AVG FAMILY INCOME
$65,575
AVG HOUSEHOLD INCOME
12.5%
WAGE / INCOME GAP [ % ]
87.5¢/ $1
WAGE / INCOME GAP [ $ ]
$7,503
FAMILY INCOME DEFICIT
0.40
INEQUALITY / GINI INDEX
9,809
TOTAL POPULATION
5,140
MALE POPULATION
4,669
FEMALE POPULATION
110.09
MALES / 100 FEMALES
90.84
FEMALES / 100 MALES
36.3
MEDIAN AGE
3.4
AVG FAMILY SIZE
3.0
AVG HOUSEHOLD SIZE
4,829
LABOR FORCE [ PEOPLE ]
65.1%
PERCENT IN LABOR FORCE
2.1%
UNEMPLOYMENT RATE
Parmer County Area Codes
Income in Parmer County
Income Overview in Parmer County
Per Capita Income in Parmer County is $28,342, while median incomes of families and households are $78,973 and $65,575 respectively.
| Characteristic | Number | Measure |
| Per Capita Income | 9,809 | $28,342 |
| Median Family Income | 2,547 | $78,973 |
| Mean Family Income | 2,547 | $92,778 |
| Median Household Income | 3,203 | $65,575 |
| Mean Household Income | 3,203 | $83,695 |
| Income Deficit | 2,547 | $7,503 |
| Wage / Income Gap (%) | 9,809 | 12.46% |
| Wage / Income Gap ($) | 9,809 | 87.54¢ per $1 |
| Gini / Inequality Index | 9,809 | 0.40 |
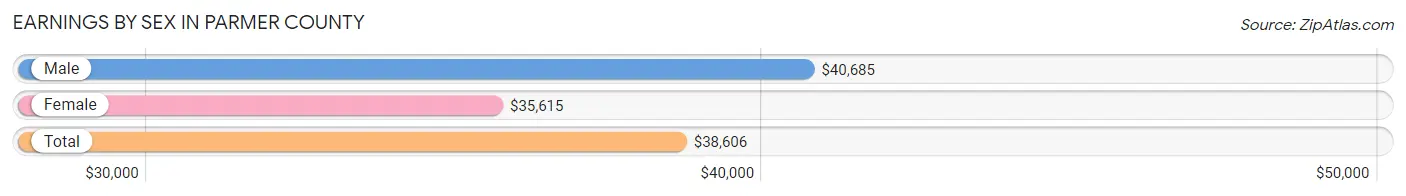
Earnings by Sex in Parmer County
Average Earnings in Parmer County are $38,606, $40,685 for men and $35,615 for women, a difference of 12.5%.
| Sex | Number | Average Earnings |
| Male | 2,992 (60.0%) | $40,685 |
| Female | 1,995 (40.0%) | $35,615 |
| Total | 4,987 (100.0%) | $38,606 |
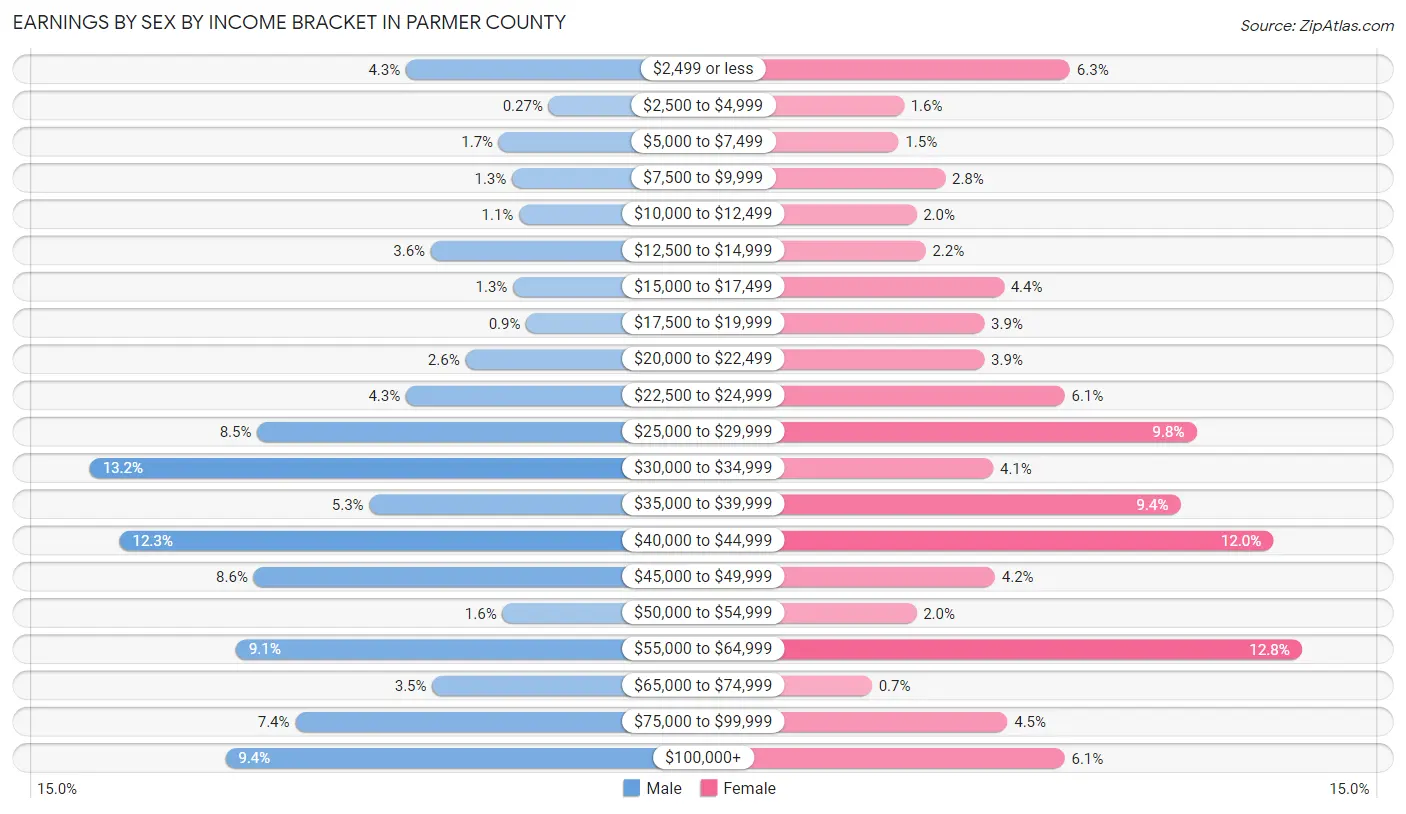
Earnings by Sex by Income Bracket in Parmer County
The most common earnings brackets in Parmer County are $30,000 to $34,999 for men (394 | 13.2%) and $55,000 to $64,999 for women (255 | 12.8%).
| Income | Male | Female |
| $2,499 or less | 128 (4.3%) | 125 (6.3%) |
| $2,500 to $4,999 | 8 (0.3%) | 32 (1.6%) |
| $5,000 to $7,499 | 50 (1.7%) | 29 (1.5%) |
| $7,500 to $9,999 | 39 (1.3%) | 55 (2.8%) |
| $10,000 to $12,499 | 33 (1.1%) | 39 (1.9%) |
| $12,500 to $14,999 | 107 (3.6%) | 44 (2.2%) |
| $15,000 to $17,499 | 38 (1.3%) | 88 (4.4%) |
| $17,500 to $19,999 | 27 (0.9%) | 77 (3.9%) |
| $20,000 to $22,499 | 78 (2.6%) | 77 (3.9%) |
| $22,500 to $24,999 | 128 (4.3%) | 122 (6.1%) |
| $25,000 to $29,999 | 253 (8.5%) | 196 (9.8%) |
| $30,000 to $34,999 | 394 (13.2%) | 82 (4.1%) |
| $35,000 to $39,999 | 159 (5.3%) | 187 (9.4%) |
| $40,000 to $44,999 | 369 (12.3%) | 239 (12.0%) |
| $45,000 to $49,999 | 256 (8.6%) | 83 (4.2%) |
| $50,000 to $54,999 | 47 (1.6%) | 39 (1.9%) |
| $55,000 to $64,999 | 271 (9.1%) | 255 (12.8%) |
| $65,000 to $74,999 | 106 (3.5%) | 14 (0.7%) |
| $75,000 to $99,999 | 221 (7.4%) | 90 (4.5%) |
| $100,000+ | 280 (9.4%) | 122 (6.1%) |
| Total | 2,992 (100.0%) | 1,995 (100.0%) |
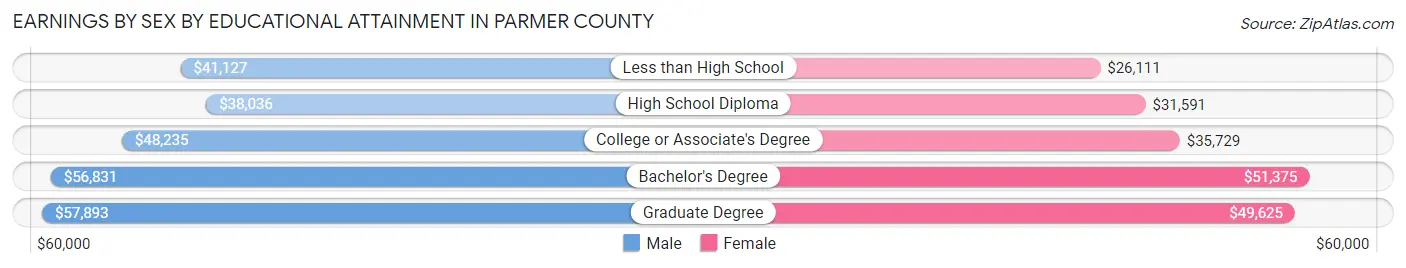
Earnings by Sex by Educational Attainment in Parmer County
Average earnings in Parmer County are $42,329 for men and $38,431 for women, a difference of 9.2%. Men with an educational attainment of graduate degree enjoy the highest average annual earnings of $57,893, while those with high school diploma education earn the least with $38,036. Women with an educational attainment of bachelor's degree earn the most with the average annual earnings of $51,375, while those with less than high school education have the smallest earnings of $26,111.
| Educational Attainment | Male Income | Female Income |
| Less than High School | $41,127 | $26,111 |
| High School Diploma | $38,036 | $31,591 |
| College or Associate's Degree | $48,235 | $35,729 |
| Bachelor's Degree | $56,831 | $51,375 |
| Graduate Degree | $57,893 | $49,625 |
| Total | $42,329 | $38,431 |
Family Income in Parmer County
Family Income Brackets in Parmer County
According to the Parmer County family income data, there are 540 families falling into the $100,000 to $149,999 income range, which is the most common income bracket and makes up 21.2% of all families. Conversely, the less than $10,000 income bracket is the least frequent group with only 25 families (1.0%) belonging to this category.
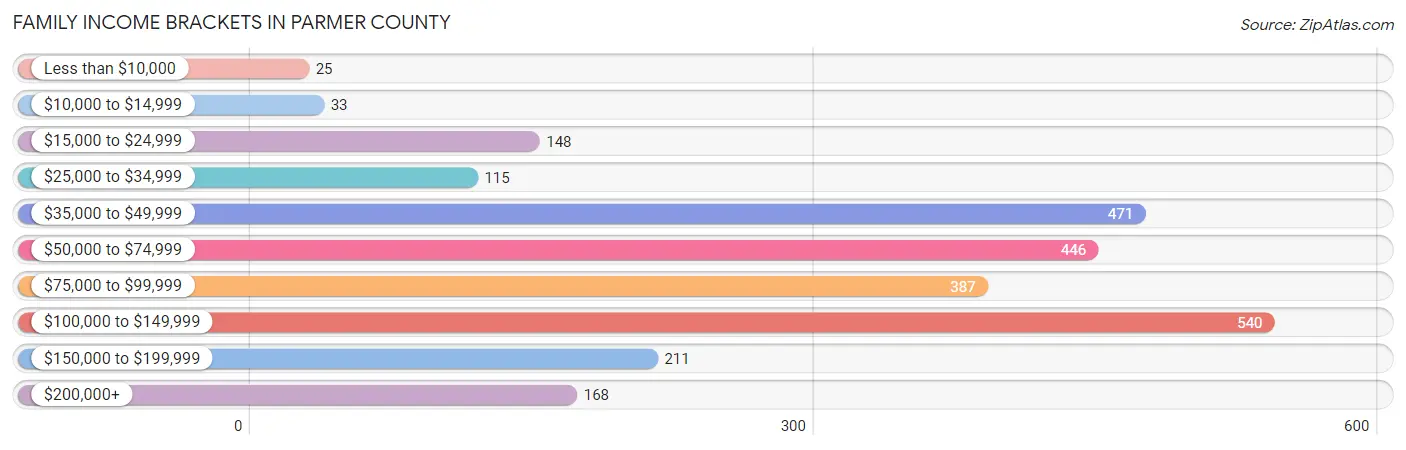
| Income Bracket | # Families | % Families |
| Less than $10,000 | 25 | 1.0% |
| $10,000 to $14,999 | 33 | 1.3% |
| $15,000 to $24,999 | 148 | 5.8% |
| $25,000 to $34,999 | 115 | 4.5% |
| $35,000 to $49,999 | 471 | 18.5% |
| $50,000 to $74,999 | 446 | 17.5% |
| $75,000 to $99,999 | 387 | 15.2% |
| $100,000 to $149,999 | 540 | 21.2% |
| $150,000 to $199,999 | 211 | 8.3% |
| $200,000+ | 168 | 6.6% |
Family Income by Famaliy Size in Parmer County
6-person families (42 | 1.7%) account for the highest median family income in Parmer County with $129,167 per family, while 2-person families (1,230 | 48.3%) have the highest median income of $37,000 per family member.
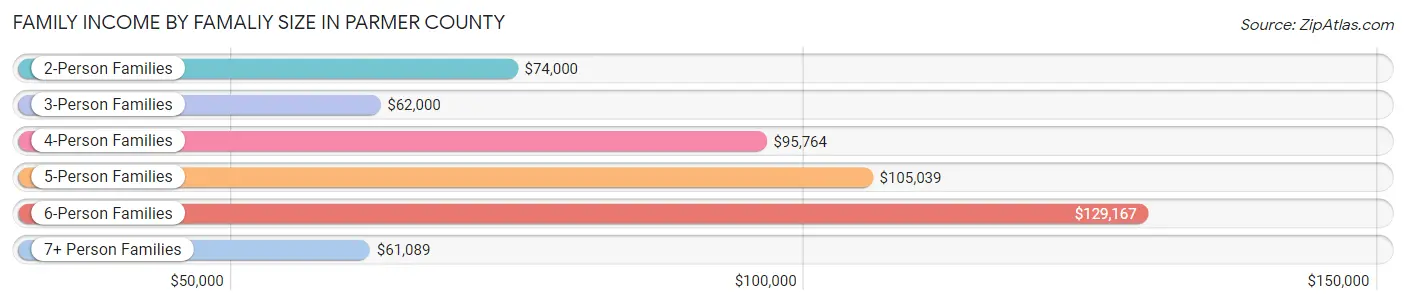
| Income Bracket | # Families | Median Income |
| 2-Person Families | 1,230 (48.3%) | $74,000 |
| 3-Person Families | 584 (22.9%) | $62,000 |
| 4-Person Families | 319 (12.5%) | $95,764 |
| 5-Person Families | 301 (11.8%) | $105,039 |
| 6-Person Families | 42 (1.7%) | $129,167 |
| 7+ Person Families | 71 (2.8%) | $61,089 |
| Total | 2,547 (100.0%) | $78,973 |
Family Income by Number of Earners in Parmer County
The median family income in Parmer County is $78,973, with families comprising 3+ earners (340) having the highest median family income of $125,278, while families with no earners (383) have the lowest median family income of $46,178, accounting for 13.4% and 15.0% of families, respectively.
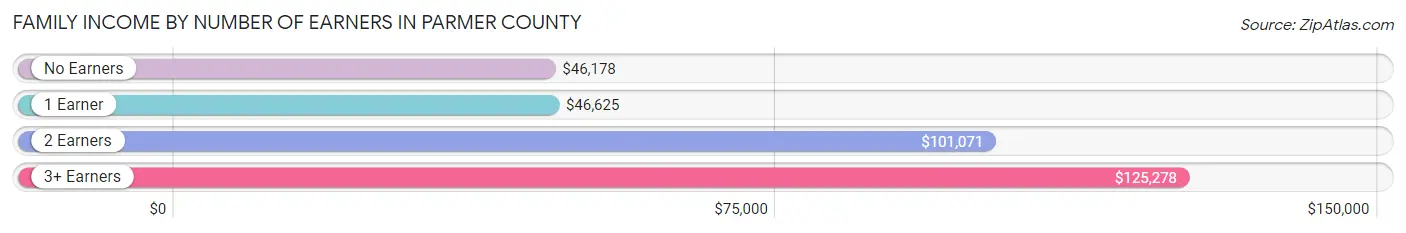
| Number of Earners | # Families | Median Income |
| No Earners | 383 (15.0%) | $46,178 |
| 1 Earner | 744 (29.2%) | $46,625 |
| 2 Earners | 1,080 (42.4%) | $101,071 |
| 3+ Earners | 340 (13.4%) | $125,278 |
| Total | 2,547 (100.0%) | $78,973 |
Household Income in Parmer County
Household Income Brackets in Parmer County
With 621 households falling in the category, the $35,000 to $49,999 income range is the most frequent in Parmer County, accounting for 19.4% of all households. In contrast, only 74 households (2.3%) fall into the less than $10,000 income bracket, making it the least populous group.
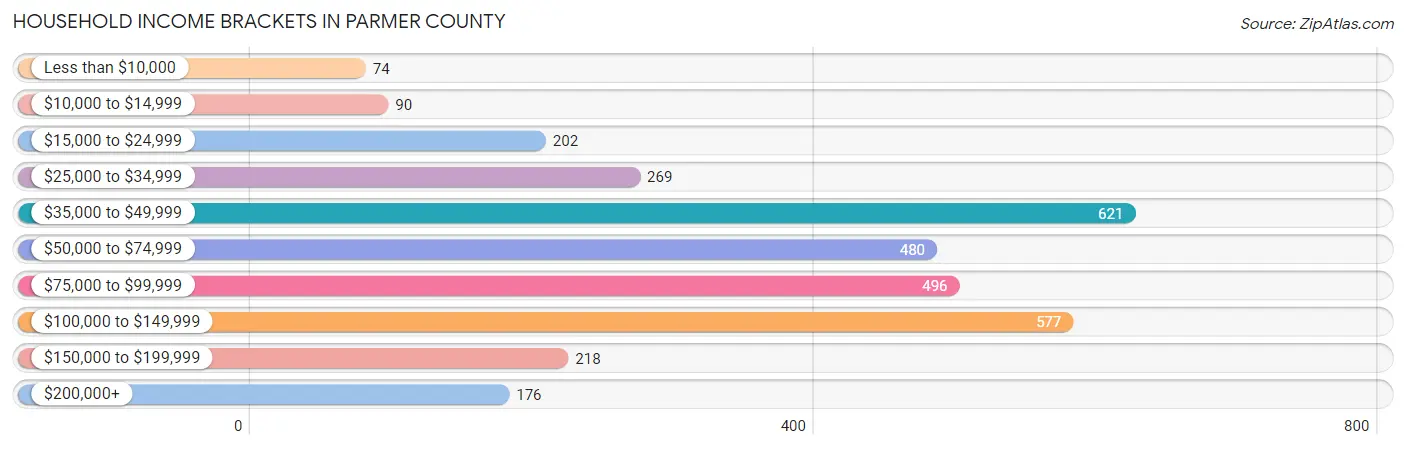
| Income Bracket | # Households | % Households |
| Less than $10,000 | 74 | 2.3% |
| $10,000 to $14,999 | 90 | 2.8% |
| $15,000 to $24,999 | 202 | 6.3% |
| $25,000 to $34,999 | 269 | 8.4% |
| $35,000 to $49,999 | 621 | 19.4% |
| $50,000 to $74,999 | 480 | 15.0% |
| $75,000 to $99,999 | 496 | 15.5% |
| $100,000 to $149,999 | 577 | 18.0% |
| $150,000 to $199,999 | 218 | 6.8% |
| $200,000+ | 176 | 5.5% |
Household Income by Householder Age in Parmer County
The median household income in Parmer County is $65,575, with the highest median household income of $95,972 found in the 45 to 64 years age bracket for the primary householder. A total of 1,000 households (31.2%) fall into this category. Meanwhile, the 15 to 24 years age bracket for the primary householder has the lowest median household income of $40,000, with 102 households (3.2%) in this group.
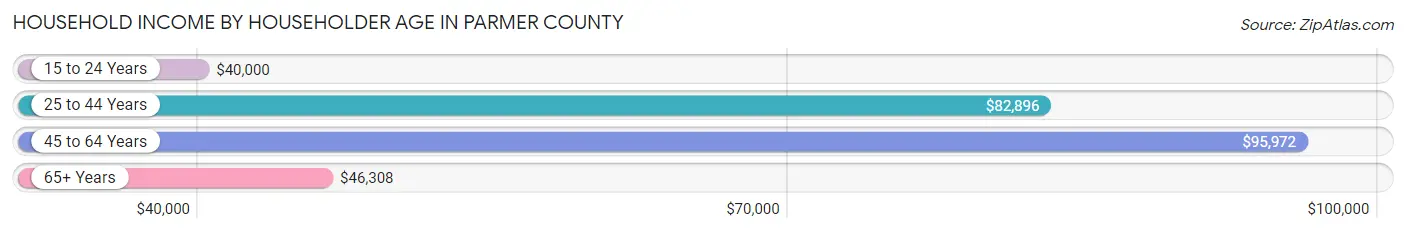
| Income Bracket | # Households | Median Income |
| 15 to 24 Years | 102 (3.2%) | $40,000 |
| 25 to 44 Years | 1,219 (38.1%) | $82,896 |
| 45 to 64 Years | 1,000 (31.2%) | $95,972 |
| 65+ Years | 882 (27.5%) | $46,308 |
| Total | 3,203 (100.0%) | $65,575 |
Poverty in Parmer County
Income Below Poverty by Sex and Age in Parmer County
With 7.9% poverty level for males and 11.3% for females among the residents of Parmer County, 18 to 24 year old males and 16 and 17 year old females are the most vulnerable to poverty, with 91 males (18.5%) and 56 females (35.9%) in their respective age groups living below the poverty level.
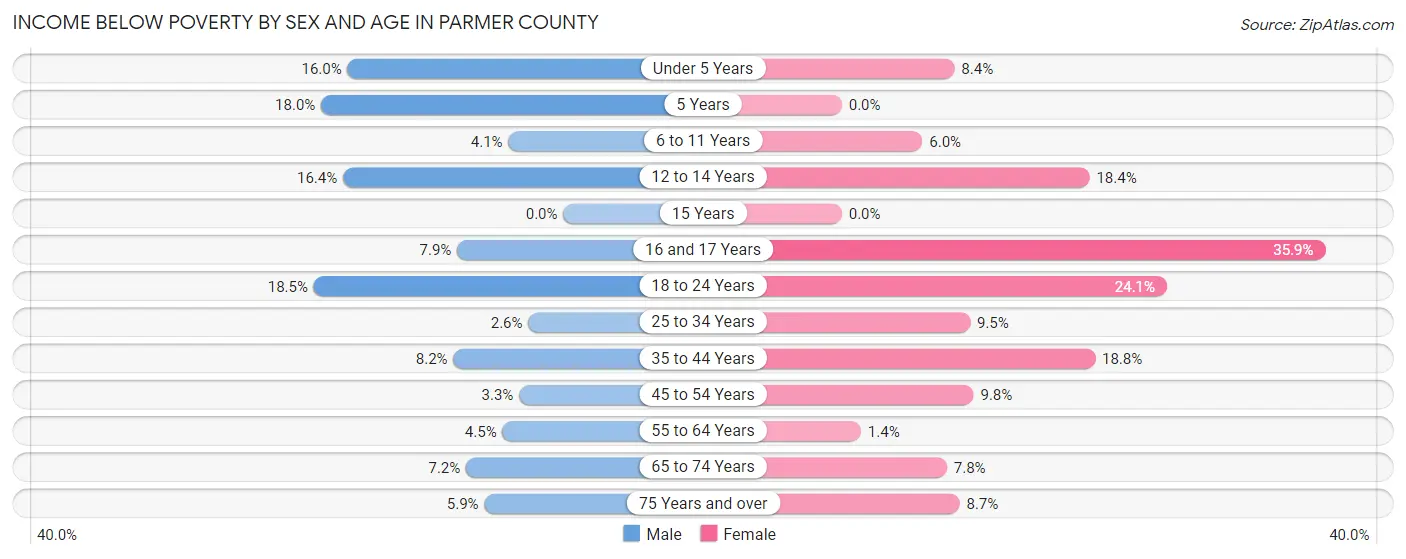
| Age Bracket | Male | Female |
| Under 5 Years | 54 (16.0%) | 31 (8.4%) |
| 5 Years | 16 (18.0%) | 0 (0.0%) |
| 6 to 11 Years | 20 (4.1%) | 21 (6.0%) |
| 12 to 14 Years | 35 (16.4%) | 41 (18.4%) |
| 15 Years | 0 (0.0%) | 0 (0.0%) |
| 16 and 17 Years | 13 (7.9%) | 56 (35.9%) |
| 18 to 24 Years | 91 (18.5%) | 90 (24.1%) |
| 25 to 34 Years | 17 (2.6%) | 54 (9.5%) |
| 35 to 44 Years | 65 (8.2%) | 110 (18.8%) |
| 45 to 54 Years | 13 (3.3%) | 53 (9.8%) |
| 55 to 64 Years | 27 (4.5%) | 8 (1.4%) |
| 65 to 74 Years | 34 (7.2%) | 34 (7.8%) |
| 75 Years and over | 14 (5.9%) | 27 (8.7%) |
| Total | 399 (7.9%) | 525 (11.3%) |
Income Above Poverty by Sex and Age in Parmer County
According to the poverty statistics in Parmer County, males aged 15 years and females aged 5 years are the age groups that are most secure financially, with 100.0% of males and 100.0% of females in these age groups living above the poverty line.
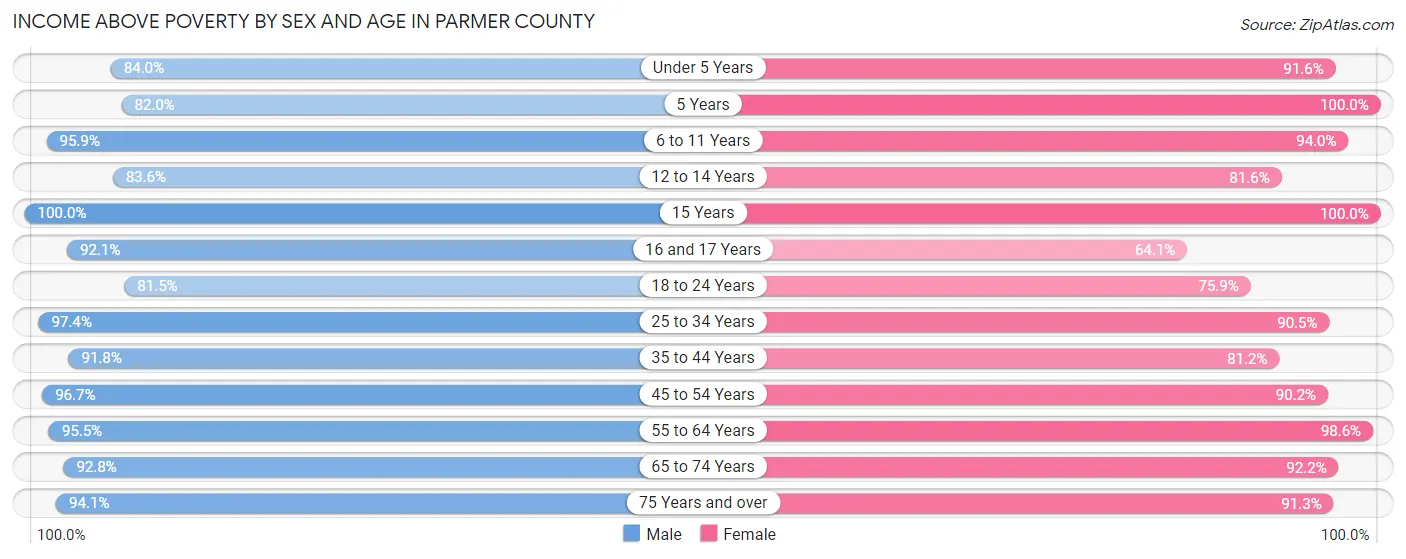
| Age Bracket | Male | Female |
| Under 5 Years | 283 (84.0%) | 340 (91.6%) |
| 5 Years | 73 (82.0%) | 119 (100.0%) |
| 6 to 11 Years | 470 (95.9%) | 330 (94.0%) |
| 12 to 14 Years | 179 (83.6%) | 182 (81.6%) |
| 15 Years | 111 (100.0%) | 68 (100.0%) |
| 16 and 17 Years | 152 (92.1%) | 100 (64.1%) |
| 18 to 24 Years | 400 (81.5%) | 283 (75.9%) |
| 25 to 34 Years | 636 (97.4%) | 513 (90.5%) |
| 35 to 44 Years | 732 (91.8%) | 475 (81.2%) |
| 45 to 54 Years | 383 (96.7%) | 489 (90.2%) |
| 55 to 64 Years | 570 (95.5%) | 555 (98.6%) |
| 65 to 74 Years | 437 (92.8%) | 402 (92.2%) |
| 75 Years and over | 225 (94.1%) | 282 (91.3%) |
| Total | 4,651 (92.1%) | 4,138 (88.7%) |
Income Below Poverty Among Married-Couple Families in Parmer County
The poverty statistics for married-couple families in Parmer County show that 5.1% or 108 of the total 2,104 families live below the poverty line. Families with 1 or 2 children have the highest poverty rate of 8.5%, comprising of 47 families. On the other hand, families with 5 or more children have the lowest poverty rate of 0.0%, which includes 0 families.
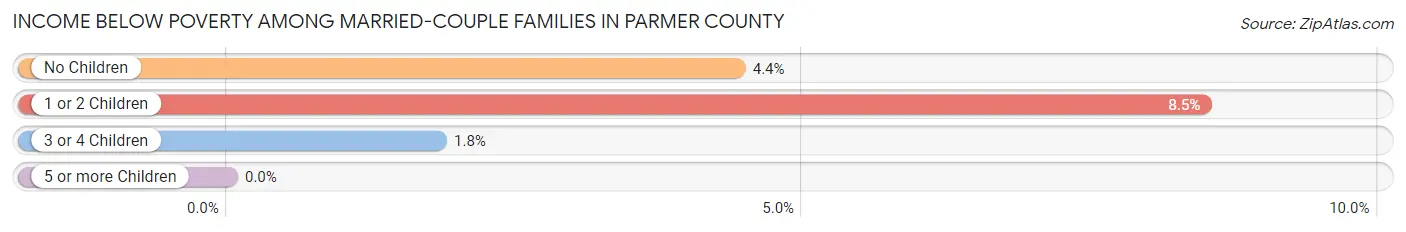
| Children | Above Poverty | Below Poverty |
| No Children | 1,211 (95.6%) | 56 (4.4%) |
| 1 or 2 Children | 507 (91.5%) | 47 (8.5%) |
| 3 or 4 Children | 270 (98.2%) | 5 (1.8%) |
| 5 or more Children | 8 (100.0%) | 0 (0.0%) |
| Total | 1,996 (94.9%) | 108 (5.1%) |
Income Below Poverty Among Single-Parent Households in Parmer County
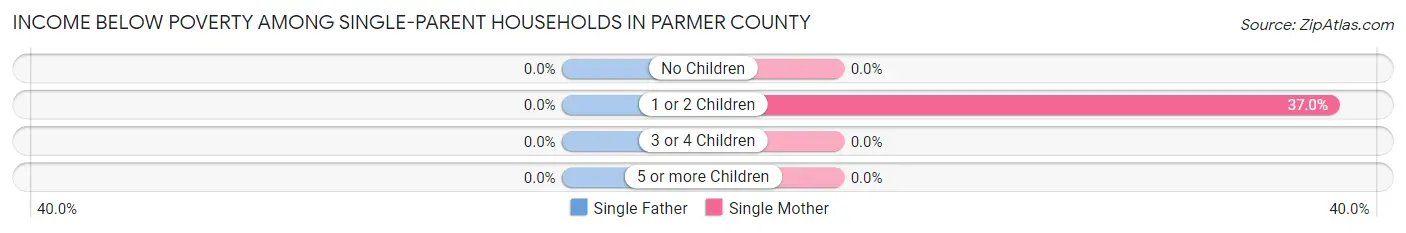
| Children | Single Father | Single Mother |
| No Children | 0 (0.0%) | 0 (0.0%) |
| 1 or 2 Children | 0 (0.0%) | 68 (37.0%) |
| 3 or 4 Children | 0 (0.0%) | 0 (0.0%) |
| 5 or more Children | 0 (0.0%) | 0 (0.0%) |
| Total | 0 (0.0%) | 68 (23.9%) |
Income Below Poverty Among Married-Couple vs Single-Parent Households in Parmer County
The poverty data for Parmer County shows that 108 of the married-couple family households (5.1%) and 68 of the single-parent households (15.3%) are living below the poverty level. Within the married-couple family households, those with 1 or 2 children have the highest poverty rate, with 47 households (8.5%) falling below the poverty line. Among the single-parent households, those with 1 or 2 children have the highest poverty rate, with 68 household (25.0%) living below poverty.
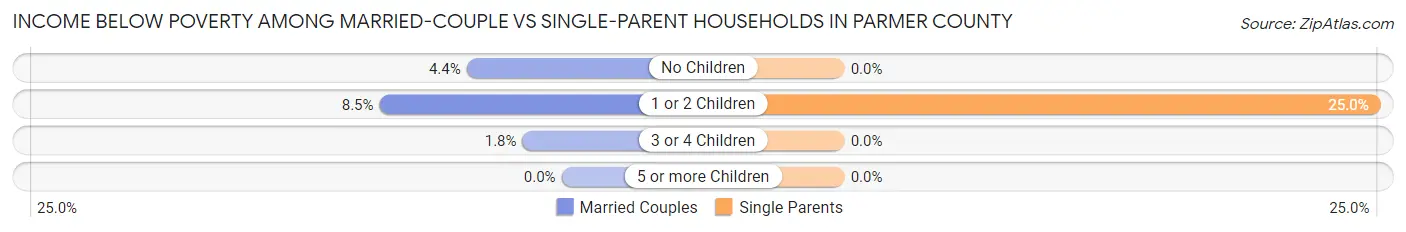
| Children | Married-Couple Families | Single-Parent Households |
| No Children | 56 (4.4%) | 0 (0.0%) |
| 1 or 2 Children | 47 (8.5%) | 68 (25.0%) |
| 3 or 4 Children | 5 (1.8%) | 0 (0.0%) |
| 5 or more Children | 0 (0.0%) | 0 (0.0%) |
| Total | 108 (5.1%) | 68 (15.3%) |
Race in Parmer County
The most populous races in Parmer County are White / Caucasian (7,161 | 73.0%), Hispanic or Latino (6,382 | 65.1%), and Two or more Races (1,945 | 19.8%).
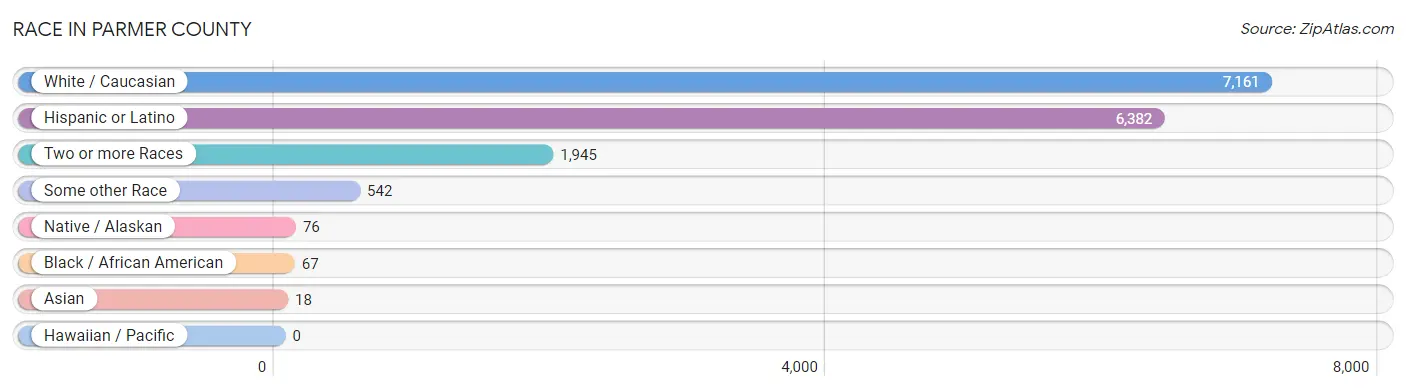
| Race | # Population | % Population |
| Asian | 18 | 0.2% |
| Black / African American | 67 | 0.7% |
| Hawaiian / Pacific | 0 | 0.0% |
| Hispanic or Latino | 6,382 | 65.1% |
| Native / Alaskan | 76 | 0.8% |
| White / Caucasian | 7,161 | 73.0% |
| Two or more Races | 1,945 | 19.8% |
| Some other Race | 542 | 5.5% |
| Total | 9,809 | 100.0% |
Ancestry in Parmer County
The most populous ancestries reported in Parmer County are Mexican (5,679 | 57.9%), Central American (494 | 5.0%), American (463 | 4.7%), German (446 | 4.5%), and Irish (381 | 3.9%), together accounting for 76.1% of all Parmer County residents.
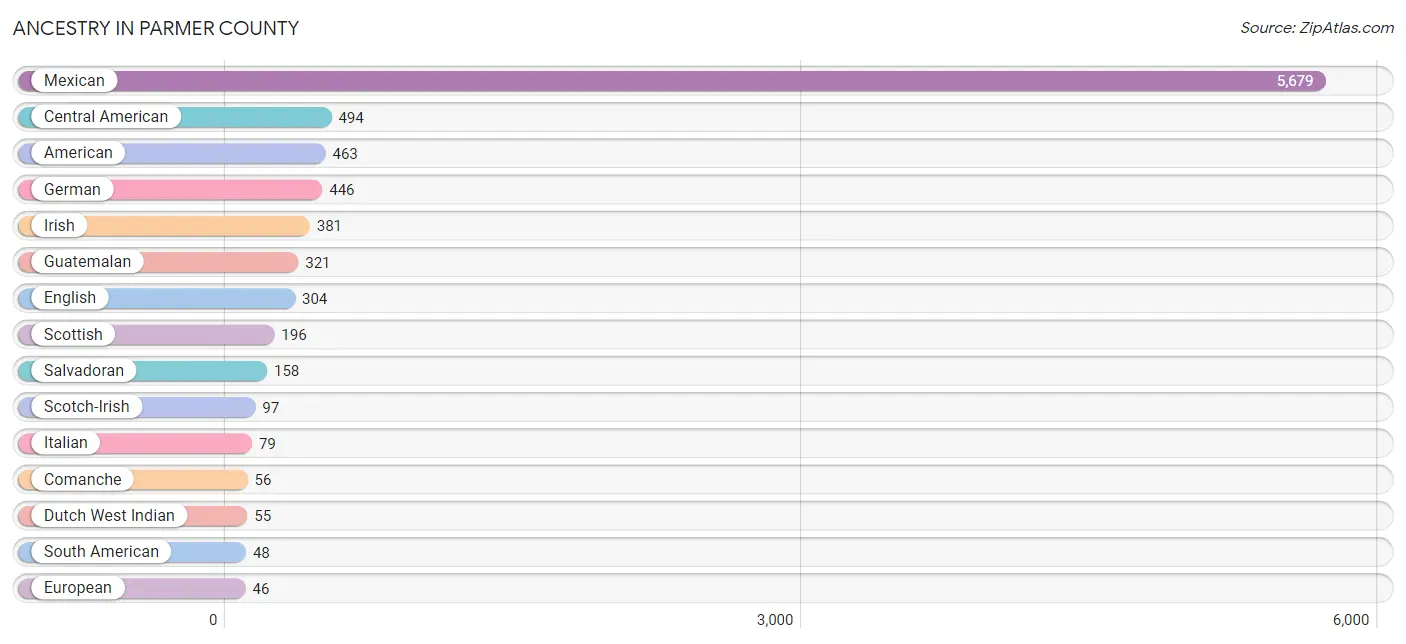
| Ancestry | # Population | % Population |
| American | 463 | 4.7% |
| Arab | 29 | 0.3% |
| Bhutanese | 16 | 0.2% |
| British | 5 | 0.1% |
| Celtic | 2 | 0.0% |
| Central American | 494 | 5.0% |
| Cherokee | 15 | 0.2% |
| Choctaw | 35 | 0.4% |
| Colombian | 8 | 0.1% |
| Comanche | 56 | 0.6% |
| Czech | 12 | 0.1% |
| Dutch | 45 | 0.5% |
| Dutch West Indian | 55 | 0.6% |
| Eastern European | 13 | 0.1% |
| English | 304 | 3.1% |
| European | 46 | 0.5% |
| French | 13 | 0.1% |
| German | 446 | 4.5% |
| Guatemalan | 321 | 3.3% |
| Honduran | 15 | 0.2% |
| Irish | 381 | 3.9% |
| Italian | 79 | 0.8% |
| Korean | 7 | 0.1% |
| Lebanese | 29 | 0.3% |
| Mexican | 5,679 | 57.9% |
| Mexican American Indian | 30 | 0.3% |
| Navajo | 21 | 0.2% |
| Norwegian | 3 | 0.0% |
| Polish | 3 | 0.0% |
| Russian | 8 | 0.1% |
| Salvadoran | 158 | 1.6% |
| Scandinavian | 3 | 0.0% |
| Scotch-Irish | 97 | 1.0% |
| Scottish | 196 | 2.0% |
| South American | 48 | 0.5% |
| Spaniard | 18 | 0.2% |
| Swedish | 2 | 0.0% |
| Swiss | 3 | 0.0% |
| Venezuelan | 40 | 0.4% |
| Welsh | 26 | 0.3% | View All 40 Rows |
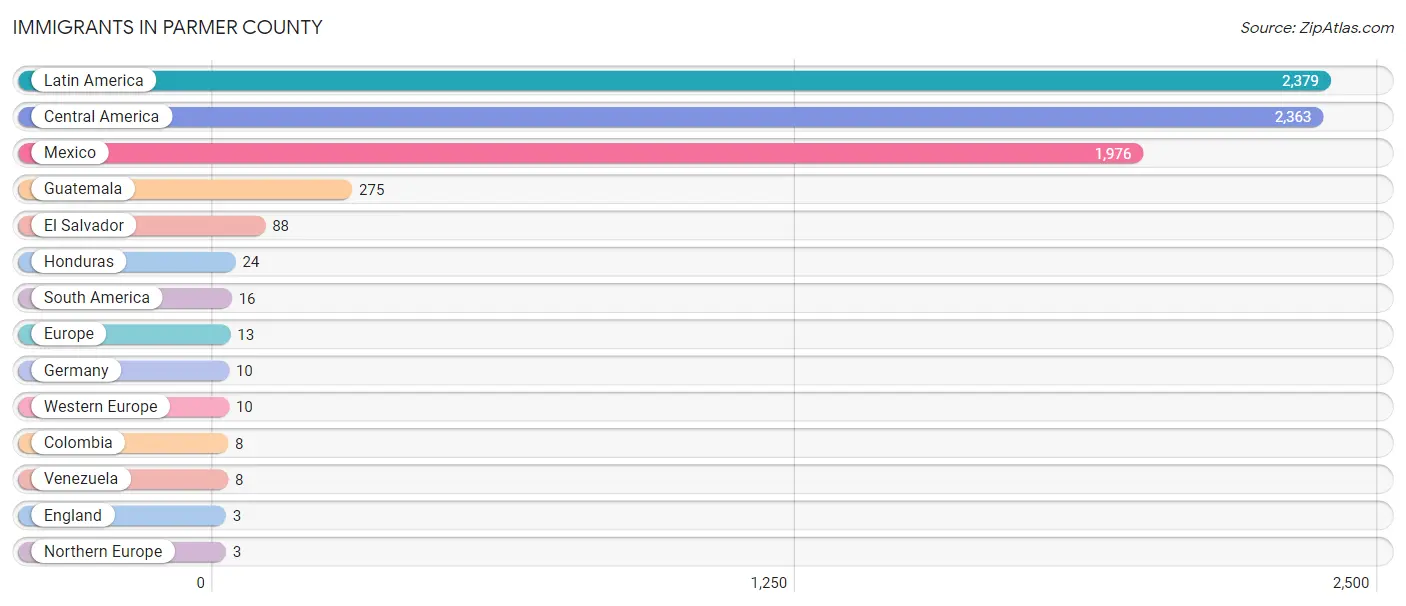
Immigrants in Parmer County
The most numerous immigrant groups reported in Parmer County came from Latin America (2,379 | 24.2%), Central America (2,363 | 24.1%), Mexico (1,976 | 20.1%), Guatemala (275 | 2.8%), and El Salvador (88 | 0.9%), together accounting for 72.2% of all Parmer County residents.
| Immigration Origin | # Population | % Population |
| Central America | 2,363 | 24.1% |
| Colombia | 8 | 0.1% |
| El Salvador | 88 | 0.9% |
| England | 3 | 0.0% |
| Europe | 13 | 0.1% |
| Germany | 10 | 0.1% |
| Guatemala | 275 | 2.8% |
| Honduras | 24 | 0.2% |
| Latin America | 2,379 | 24.2% |
| Mexico | 1,976 | 20.1% |
| Northern Europe | 3 | 0.0% |
| South America | 16 | 0.2% |
| Venezuela | 8 | 0.1% |
| Western Europe | 10 | 0.1% | View All 14 Rows |
Sex and Age in Parmer County
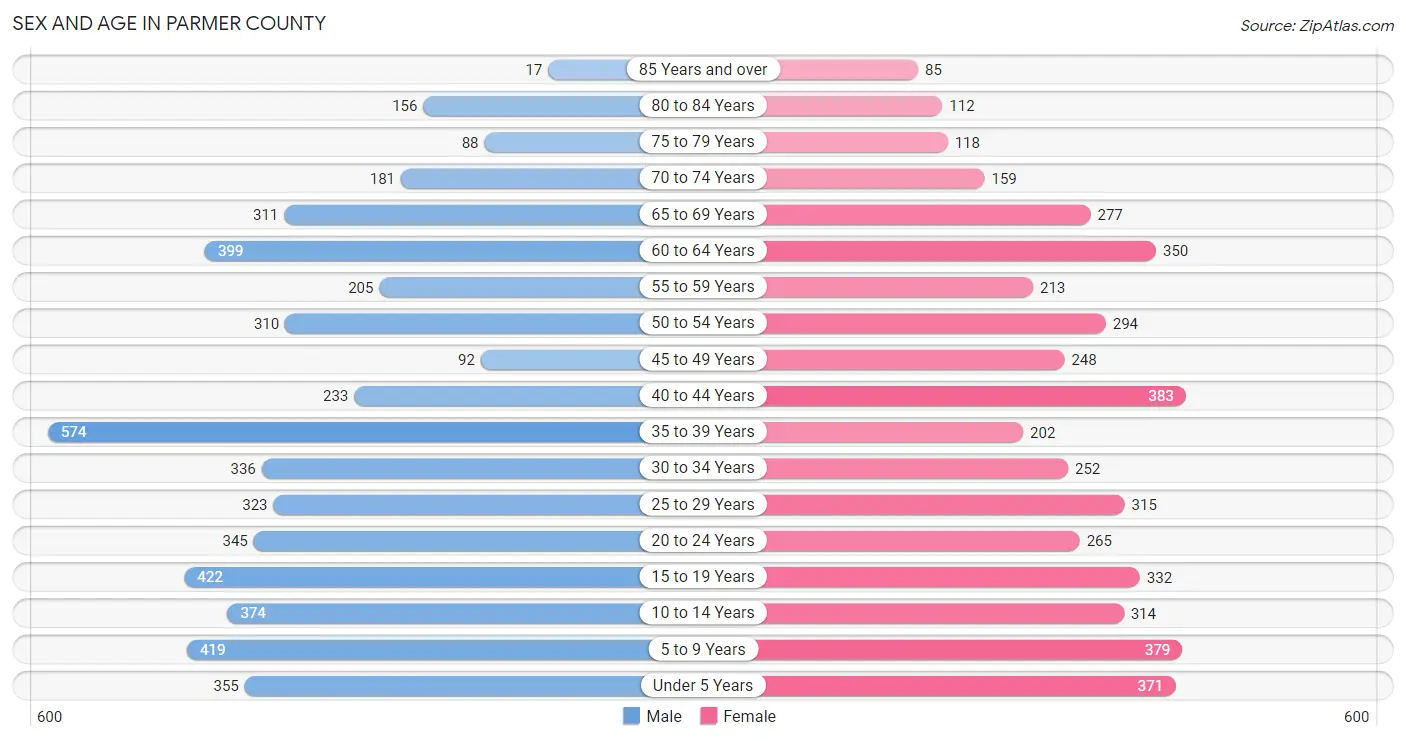
Sex and Age in Parmer County
The most populous age groups in Parmer County are 35 to 39 Years (574 | 11.2%) for men and 40 to 44 Years (383 | 8.2%) for women.
| Age Bracket | Male | Female |
| Under 5 Years | 355 (6.9%) | 371 (8.0%) |
| 5 to 9 Years | 419 (8.2%) | 379 (8.1%) |
| 10 to 14 Years | 374 (7.3%) | 314 (6.7%) |
| 15 to 19 Years | 422 (8.2%) | 332 (7.1%) |
| 20 to 24 Years | 345 (6.7%) | 265 (5.7%) |
| 25 to 29 Years | 323 (6.3%) | 315 (6.8%) |
| 30 to 34 Years | 336 (6.5%) | 252 (5.4%) |
| 35 to 39 Years | 574 (11.2%) | 202 (4.3%) |
| 40 to 44 Years | 233 (4.5%) | 383 (8.2%) |
| 45 to 49 Years | 92 (1.8%) | 248 (5.3%) |
| 50 to 54 Years | 310 (6.0%) | 294 (6.3%) |
| 55 to 59 Years | 205 (4.0%) | 213 (4.6%) |
| 60 to 64 Years | 399 (7.8%) | 350 (7.5%) |
| 65 to 69 Years | 311 (6.0%) | 277 (5.9%) |
| 70 to 74 Years | 181 (3.5%) | 159 (3.4%) |
| 75 to 79 Years | 88 (1.7%) | 118 (2.5%) |
| 80 to 84 Years | 156 (3.0%) | 112 (2.4%) |
| 85 Years and over | 17 (0.3%) | 85 (1.8%) |
| Total | 5,140 (100.0%) | 4,669 (100.0%) |
Families and Households in Parmer County
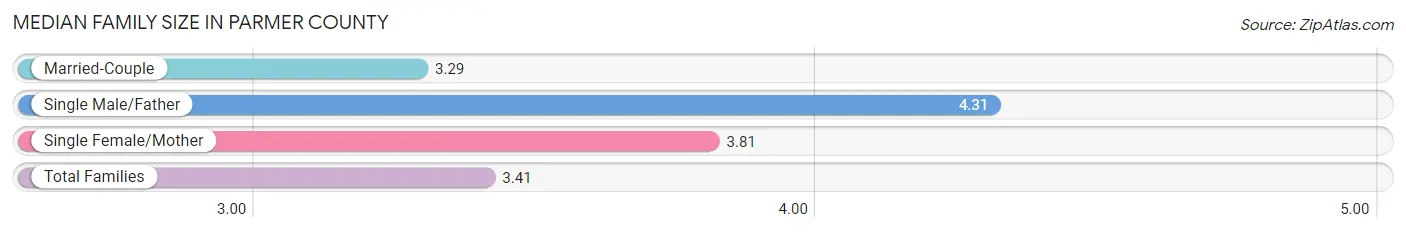
Median Family Size in Parmer County
The median family size in Parmer County is 3.41 persons per family, with single male/father families (159 | 6.2%) accounting for the largest median family size of 4.31 persons per family. On the other hand, married-couple families (2,104 | 82.6%) represent the smallest median family size with 3.29 persons per family.
| Family Type | # Families | Family Size |
| Married-Couple | 2,104 (82.6%) | 3.29 |
| Single Male/Father | 159 (6.2%) | 4.31 |
| Single Female/Mother | 284 (11.2%) | 3.81 |
| Total Families | 2,547 (100.0%) | 3.41 |
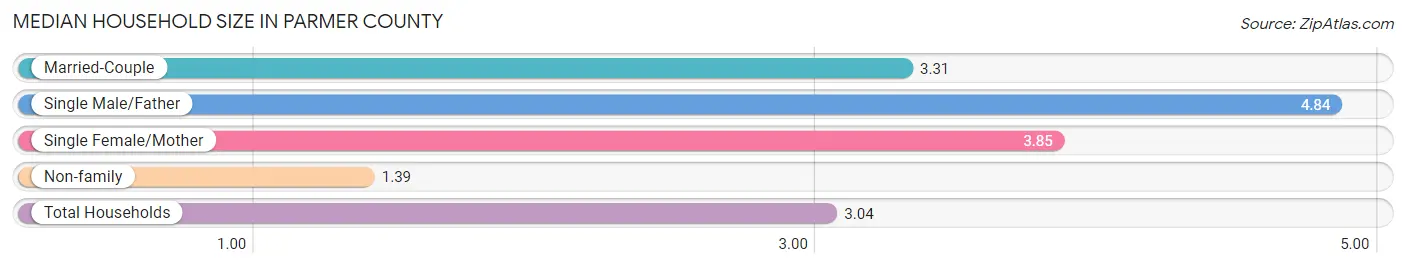
Median Household Size in Parmer County
The median household size in Parmer County is 3.04 persons per household, with single male/father households (159 | 5.0%) accounting for the largest median household size of 4.84 persons per household. non-family households (656 | 20.5%) represent the smallest median household size with 1.39 persons per household.
| Household Type | # Households | Household Size |
| Married-Couple | 2,104 (65.7%) | 3.31 |
| Single Male/Father | 159 (5.0%) | 4.84 |
| Single Female/Mother | 284 (8.9%) | 3.85 |
| Non-family | 656 (20.5%) | 1.39 |
| Total Households | 3,203 (100.0%) | 3.04 |
Household Size by Marriage Status in Parmer County
Out of a total of 3,203 households in Parmer County, 2,547 (79.5%) are family households, while 656 (20.5%) are nonfamily households. The most numerous type of family households are 2-person households, comprising 1,224, and the most common type of nonfamily households are 1-person households, comprising 573.
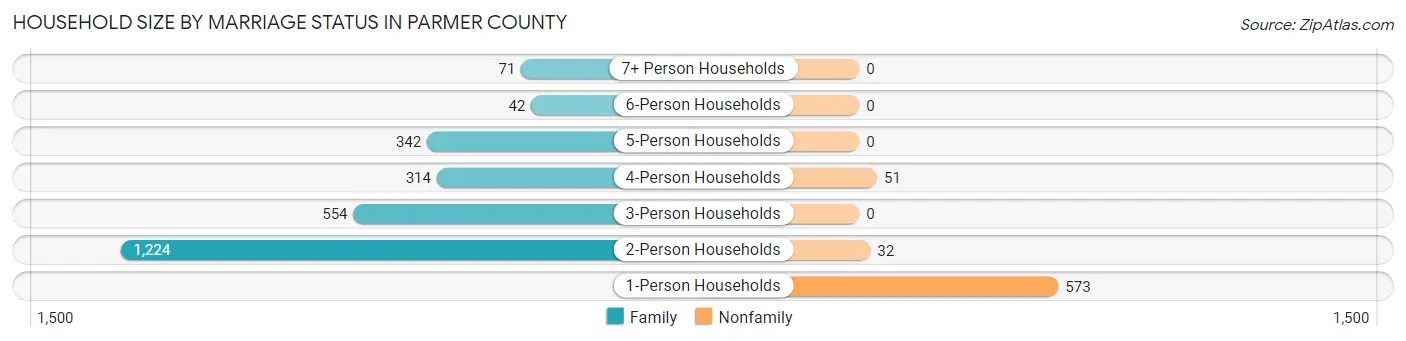
| Household Size | Family Households | Nonfamily Households |
| 1-Person Households | - | 573 (17.9%) |
| 2-Person Households | 1,224 (38.2%) | 32 (1.0%) |
| 3-Person Households | 554 (17.3%) | 0 (0.0%) |
| 4-Person Households | 314 (9.8%) | 51 (1.6%) |
| 5-Person Households | 342 (10.7%) | 0 (0.0%) |
| 6-Person Households | 42 (1.3%) | 0 (0.0%) |
| 7+ Person Households | 71 (2.2%) | 0 (0.0%) |
| Total | 2,547 (79.5%) | 656 (20.5%) |
Female Fertility in Parmer County
Fertility by Age in Parmer County
Average fertility rate in Parmer County is 31.0 births per 1,000 women. Women in the age bracket of 20 to 34 years have the highest fertility rate with 76.0 births per 1,000 women. Women in the age bracket of 20 to 34 years acount for 100.0% of all women with births.
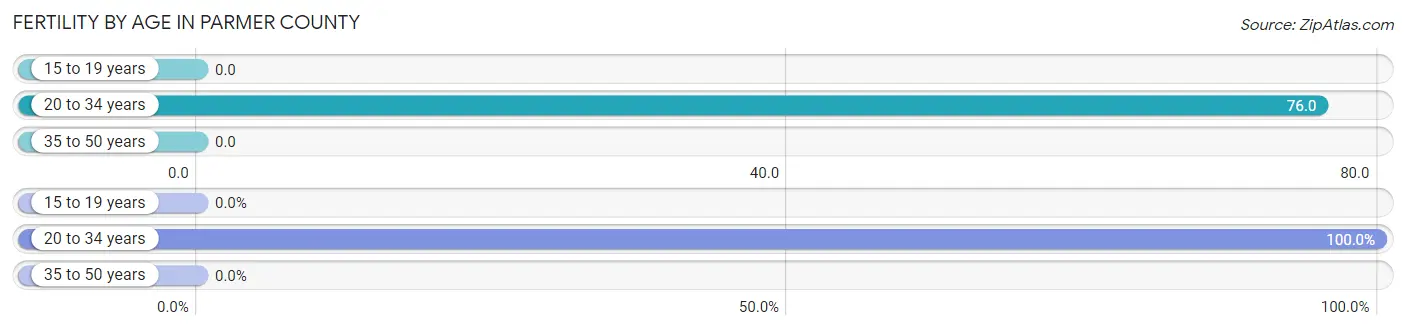
| Age Bracket | Women with Births | Births / 1,000 Women |
| 15 to 19 years | 0 (0.0%) | 0.0 |
| 20 to 34 years | 63 (100.0%) | 76.0 |
| 35 to 50 years | 0 (0.0%) | 0.0 |
| Total | 63 (100.0%) | 31.0 |
Fertility by Age by Marriage Status in Parmer County
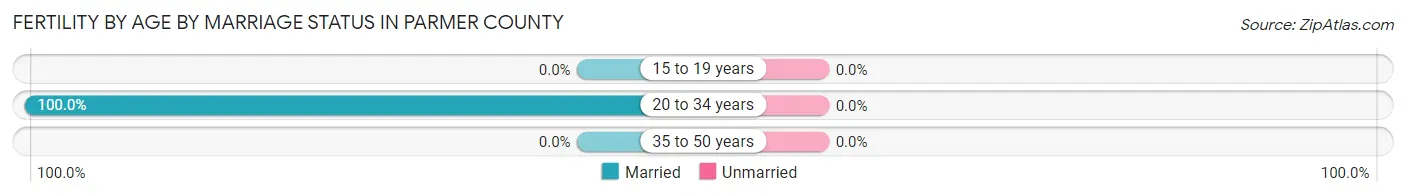
| Age Bracket | Married | Unmarried |
| 15 to 19 years | 0 (0.0%) | 0 (0.0%) |
| 20 to 34 years | 63 (100.0%) | 0 (0.0%) |
| 35 to 50 years | 0 (0.0%) | 0 (0.0%) |
| Total | 63 (100.0%) | 0 (0.0%) |
Fertility by Education in Parmer County
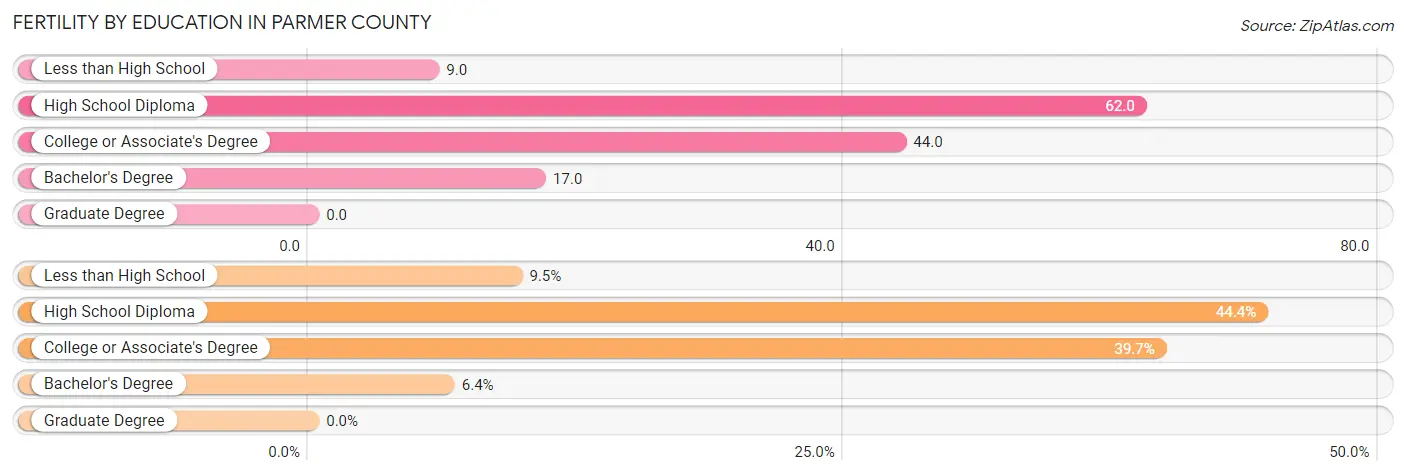
| Educational Attainment | Women with Births | Births / 1,000 Women |
| Less than High School | 6 (9.5%) | 9.0 |
| High School Diploma | 28 (44.4%) | 62.0 |
| College or Associate's Degree | 25 (39.7%) | 44.0 |
| Bachelor's Degree | 4 (6.4%) | 17.0 |
| Graduate Degree | 0 (0.0%) | 0.0 |
| Total | 63 (100.0%) | 31.0 |
Fertility by Education by Marriage Status in Parmer County
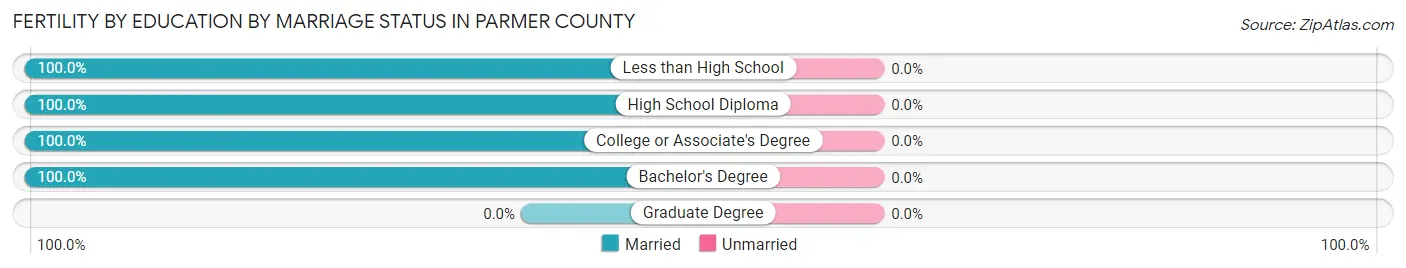
| Educational Attainment | Married | Unmarried |
| Less than High School | 6 (100.0%) | 0 (0.0%) |
| High School Diploma | 28 (100.0%) | 0 (0.0%) |
| College or Associate's Degree | 25 (100.0%) | 0 (0.0%) |
| Bachelor's Degree | 4 (100.0%) | 0 (0.0%) |
| Graduate Degree | 0 (0.0%) | 0 (0.0%) |
| Total | 63 (100.0%) | 0 (0.0%) |
Employment Characteristics in Parmer County
Employment by Class of Employer in Parmer County
Among the 4,677 employed individuals in Parmer County, private company employees (3,215 | 68.7%), local government employees (545 | 11.7%), and self-employed (not incorporated) (317 | 6.8%) make up the most common classes of employment.
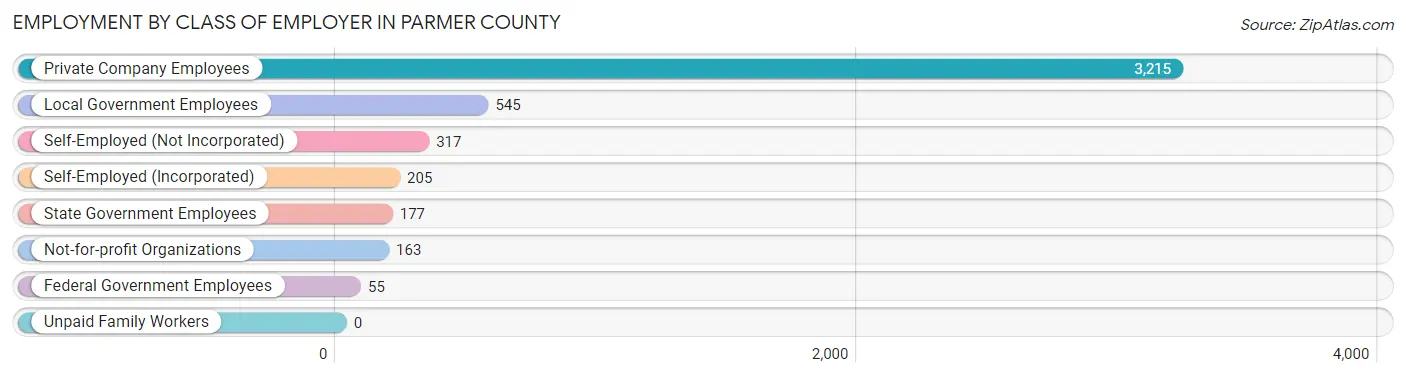
| Employer Class | # Employees | % Employees |
| Private Company Employees | 3,215 | 68.7% |
| Self-Employed (Incorporated) | 205 | 4.4% |
| Self-Employed (Not Incorporated) | 317 | 6.8% |
| Not-for-profit Organizations | 163 | 3.5% |
| Local Government Employees | 545 | 11.7% |
| State Government Employees | 177 | 3.8% |
| Federal Government Employees | 55 | 1.2% |
| Unpaid Family Workers | 0 | 0.0% |
| Total | 4,677 | 100.0% |
Employment Status by Age in Parmer County
According to the labor force statistics for Parmer County, out of the total population over 16 years of age (7,418), 65.1% or 4,829 individuals are in the labor force, with 2.1% or 101 of them unemployed. The age group with the highest labor force participation rate is 20 to 24 years, with 86.2% or 526 individuals in the labor force. Within the labor force, the 16 to 19 years age range has the highest percentage of unemployed individuals, with 21.6% or 45 of them being unemployed.
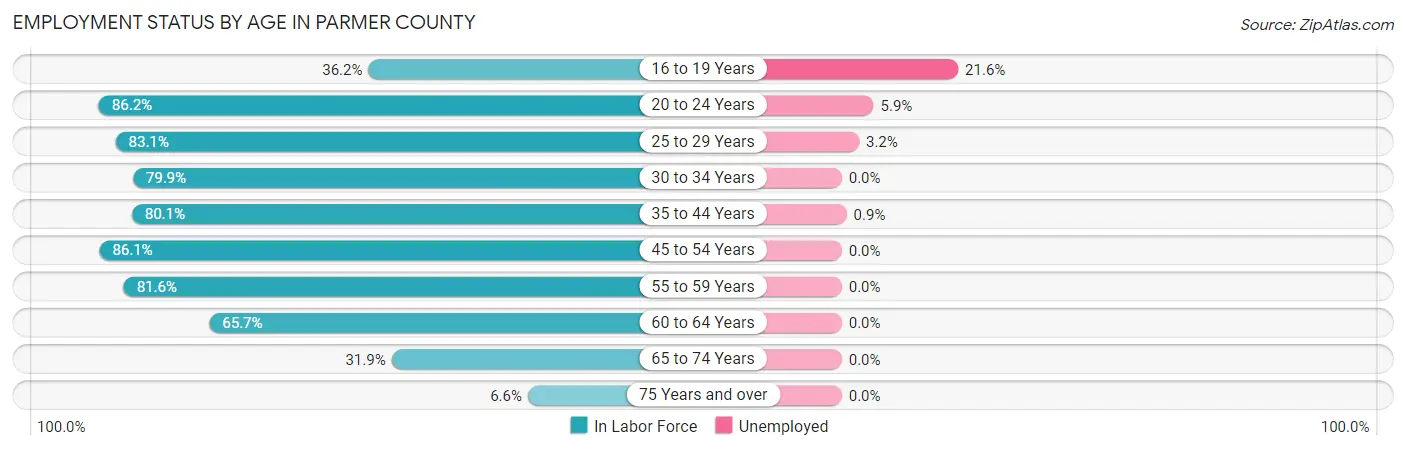
| Age Bracket | In Labor Force | Unemployed |
| 16 to 19 Years | 208 (36.2%) | 45 (21.6%) |
| 20 to 24 Years | 526 (86.2%) | 31 (5.9%) |
| 25 to 29 Years | 530 (83.1%) | 17 (3.2%) |
| 30 to 34 Years | 470 (79.9%) | 0 (0.0%) |
| 35 to 44 Years | 1,115 (80.1%) | 10 (0.9%) |
| 45 to 54 Years | 813 (86.1%) | 0 (0.0%) |
| 55 to 59 Years | 341 (81.6%) | 0 (0.0%) |
| 60 to 64 Years | 492 (65.7%) | 0 (0.0%) |
| 65 to 74 Years | 296 (31.9%) | 0 (0.0%) |
| 75 Years and over | 38 (6.6%) | 0 (0.0%) |
| Total | 4,829 (65.1%) | 101 (2.1%) |
Employment Status by Educational Attainment in Parmer County
According to labor force statistics for Parmer County, 79.5% of individuals (3,760) out of the total population between 25 and 64 years of age (4,729) are in the labor force, with 0.7% or 26 of them being unemployed. The group with the highest labor force participation rate are those with the educational attainment of bachelor's degree or higher, with 94.6% or 885 individuals in the labor force. Within the labor force, individuals with college / associate degree education have the highest percentage of unemployment, with 1.4% or 17 of them being unemployed.
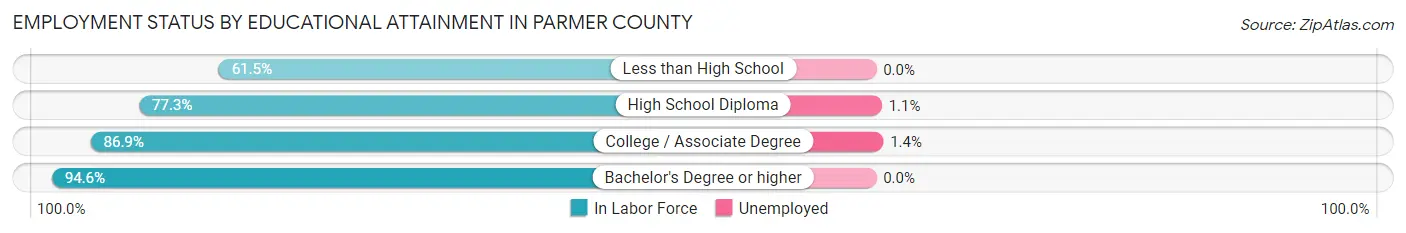
| Educational Attainment | In Labor Force | Unemployed |
| Less than High School | 731 (61.5%) | 0 (0.0%) |
| High School Diploma | 945 (77.3%) | 13 (1.1%) |
| College / Associate Degree | 1,201 (86.9%) | 19 (1.4%) |
| Bachelor's Degree or higher | 885 (94.6%) | 0 (0.0%) |
| Total | 3,760 (79.5%) | 33 (0.7%) |
Employment Occupations by Sex in Parmer County
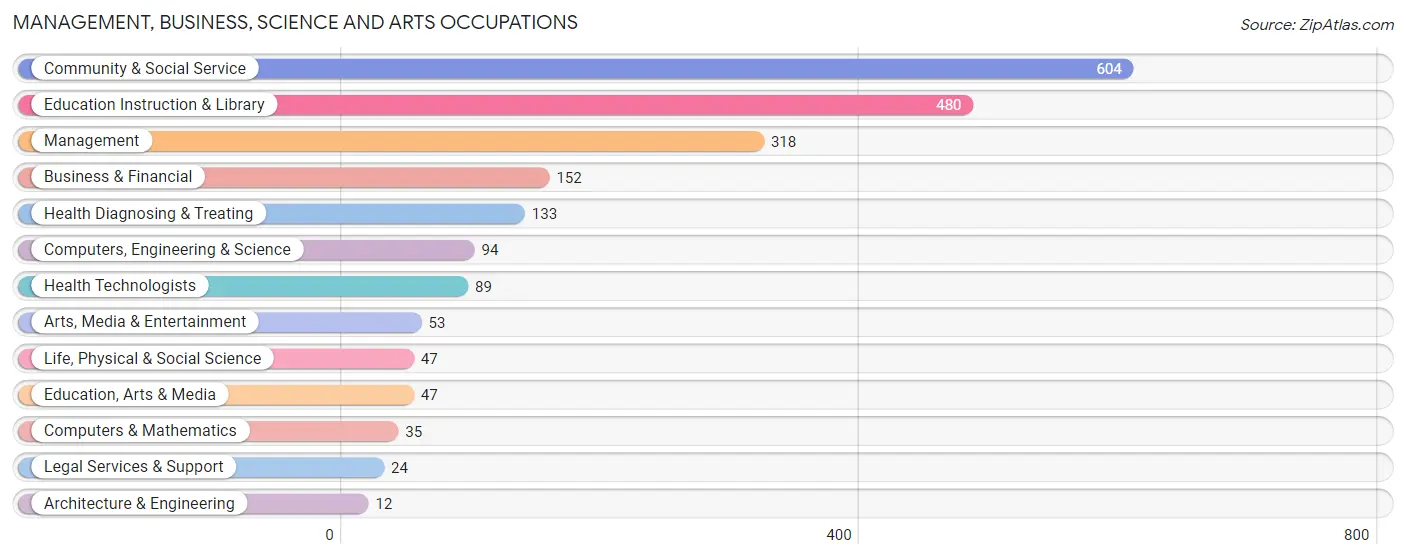
Management, Business, Science and Arts Occupations
The most common Management, Business, Science and Arts occupations in Parmer County are Community & Social Service (604 | 12.8%), Education Instruction & Library (480 | 10.2%), Management (318 | 6.8%), Business & Financial (152 | 3.2%), and Health Diagnosing & Treating (133 | 2.8%).
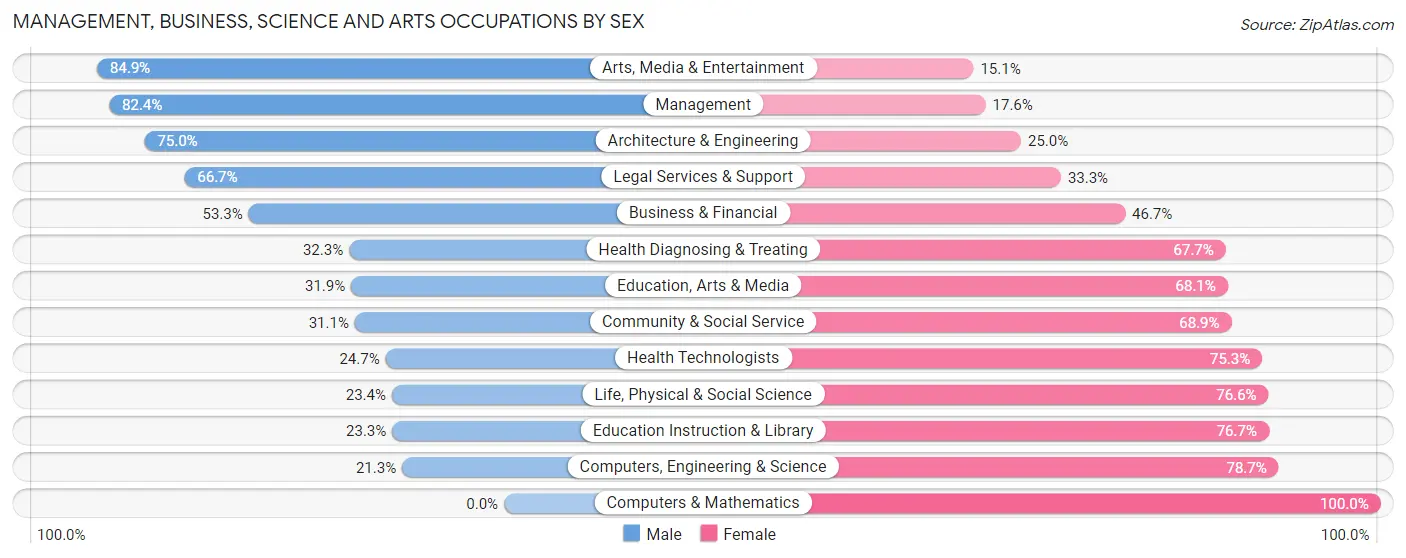
Management, Business, Science and Arts Occupations by Sex
Within the Management, Business, Science and Arts occupations in Parmer County, the most male-oriented occupations are Arts, Media & Entertainment (84.9%), Management (82.4%), and Architecture & Engineering (75.0%), while the most female-oriented occupations are Computers & Mathematics (100.0%), Computers, Engineering & Science (78.7%), and Education Instruction & Library (76.7%).
| Occupation | Male | Female |
| Management | 262 (82.4%) | 56 (17.6%) |
| Business & Financial | 81 (53.3%) | 71 (46.7%) |
| Computers, Engineering & Science | 20 (21.3%) | 74 (78.7%) |
| Computers & Mathematics | 0 (0.0%) | 35 (100.0%) |
| Architecture & Engineering | 9 (75.0%) | 3 (25.0%) |
| Life, Physical & Social Science | 11 (23.4%) | 36 (76.6%) |
| Community & Social Service | 188 (31.1%) | 416 (68.9%) |
| Education, Arts & Media | 15 (31.9%) | 32 (68.1%) |
| Legal Services & Support | 16 (66.7%) | 8 (33.3%) |
| Education Instruction & Library | 112 (23.3%) | 368 (76.7%) |
| Arts, Media & Entertainment | 45 (84.9%) | 8 (15.1%) |
| Health Diagnosing & Treating | 43 (32.3%) | 90 (67.7%) |
| Health Technologists | 22 (24.7%) | 67 (75.3%) |
| Total (Category) | 594 (45.7%) | 707 (54.3%) |
| Total (Overall) | 2,828 (60.0%) | 1,884 (40.0%) |
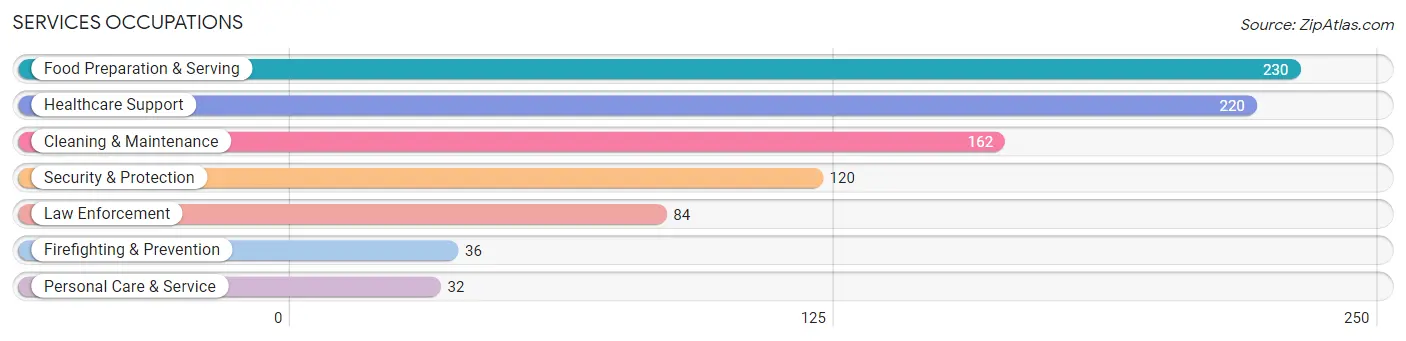
Services Occupations
The most common Services occupations in Parmer County are Food Preparation & Serving (230 | 4.9%), Healthcare Support (220 | 4.7%), Cleaning & Maintenance (162 | 3.4%), Security & Protection (120 | 2.5%), and Law Enforcement (84 | 1.8%).
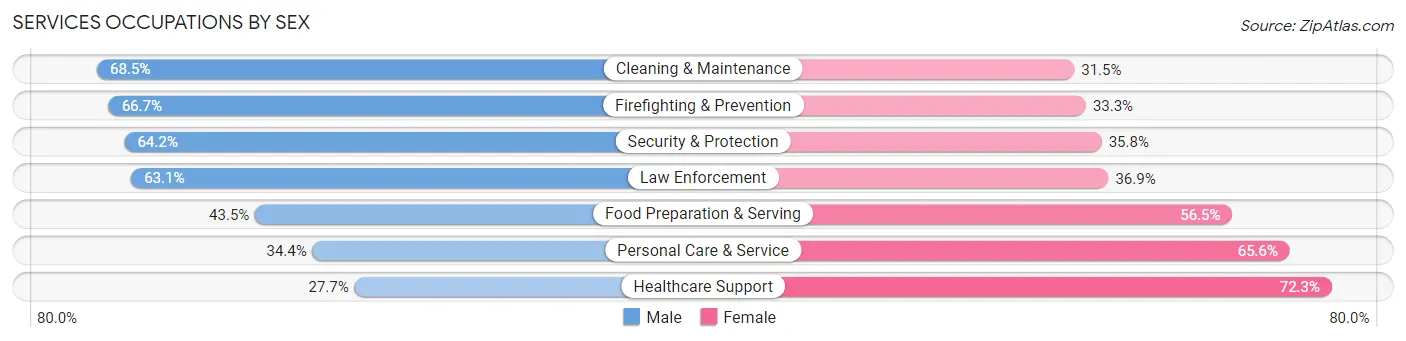
Services Occupations by Sex
Within the Services occupations in Parmer County, the most male-oriented occupations are Cleaning & Maintenance (68.5%), Firefighting & Prevention (66.7%), and Security & Protection (64.2%), while the most female-oriented occupations are Healthcare Support (72.3%), Personal Care & Service (65.6%), and Food Preparation & Serving (56.5%).
| Occupation | Male | Female |
| Healthcare Support | 61 (27.7%) | 159 (72.3%) |
| Security & Protection | 77 (64.2%) | 43 (35.8%) |
| Firefighting & Prevention | 24 (66.7%) | 12 (33.3%) |
| Law Enforcement | 53 (63.1%) | 31 (36.9%) |
| Food Preparation & Serving | 100 (43.5%) | 130 (56.5%) |
| Cleaning & Maintenance | 111 (68.5%) | 51 (31.5%) |
| Personal Care & Service | 11 (34.4%) | 21 (65.6%) |
| Total (Category) | 360 (47.1%) | 404 (52.9%) |
| Total (Overall) | 2,828 (60.0%) | 1,884 (40.0%) |
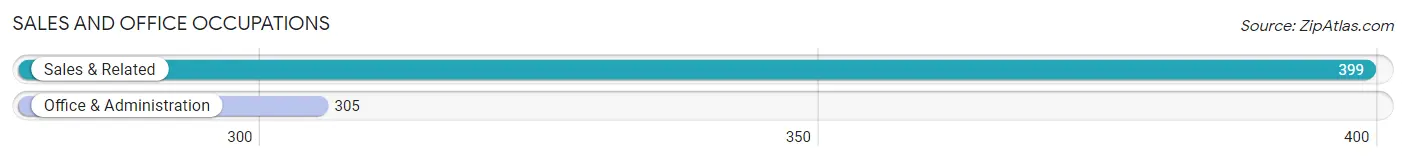
Sales and Office Occupations
The most common Sales and Office occupations in Parmer County are Sales & Related (399 | 8.5%), and Office & Administration (305 | 6.5%).
Sales and Office Occupations by Sex

| Occupation | Male | Female |
| Sales & Related | 212 (53.1%) | 187 (46.9%) |
| Office & Administration | 60 (19.7%) | 245 (80.3%) |
| Total (Category) | 272 (38.6%) | 432 (61.4%) |
| Total (Overall) | 2,828 (60.0%) | 1,884 (40.0%) |
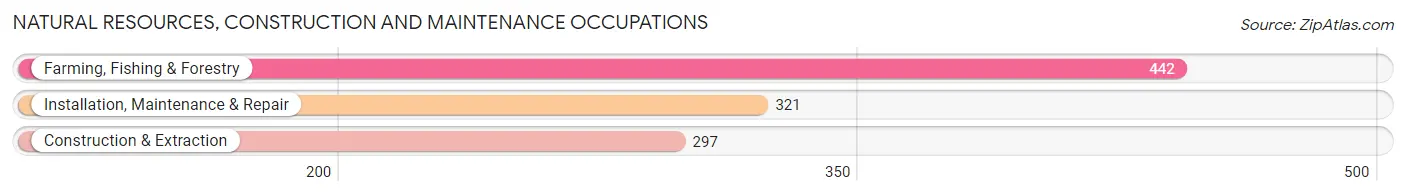
Natural Resources, Construction and Maintenance Occupations
The most common Natural Resources, Construction and Maintenance occupations in Parmer County are Farming, Fishing & Forestry (442 | 9.4%), Installation, Maintenance & Repair (321 | 6.8%), and Construction & Extraction (297 | 6.3%).
Natural Resources, Construction and Maintenance Occupations by Sex
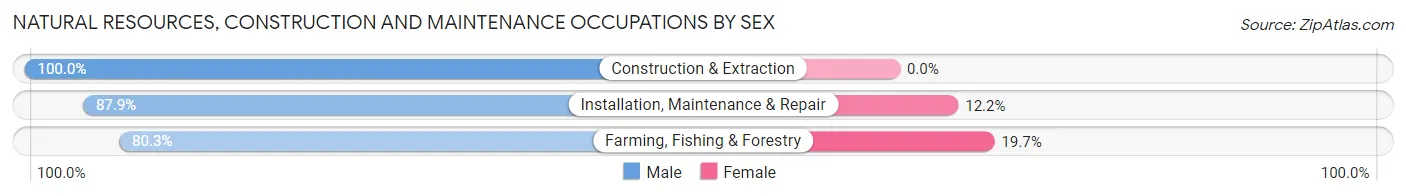
| Occupation | Male | Female |
| Farming, Fishing & Forestry | 355 (80.3%) | 87 (19.7%) |
| Construction & Extraction | 297 (100.0%) | 0 (0.0%) |
| Installation, Maintenance & Repair | 282 (87.8%) | 39 (12.1%) |
| Total (Category) | 934 (88.1%) | 126 (11.9%) |
| Total (Overall) | 2,828 (60.0%) | 1,884 (40.0%) |
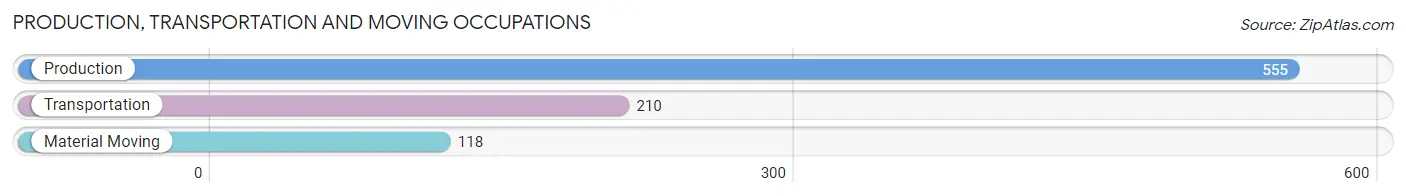
Production, Transportation and Moving Occupations
The most common Production, Transportation and Moving occupations in Parmer County are Production (555 | 11.8%), Transportation (210 | 4.5%), and Material Moving (118 | 2.5%).
Production, Transportation and Moving Occupations by Sex
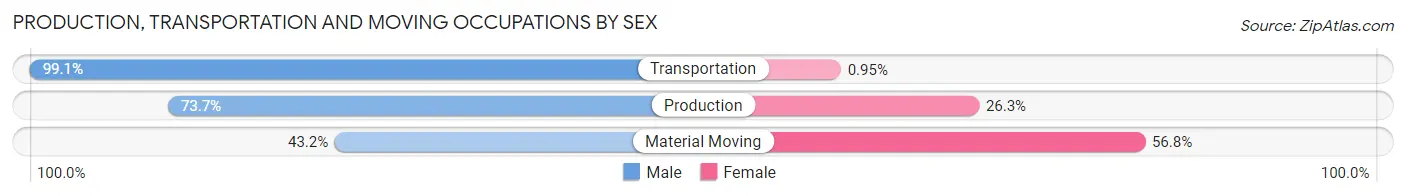
| Occupation | Male | Female |
| Production | 409 (73.7%) | 146 (26.3%) |
| Transportation | 208 (99.1%) | 2 (0.9%) |
| Material Moving | 51 (43.2%) | 67 (56.8%) |
| Total (Category) | 668 (75.6%) | 215 (24.3%) |
| Total (Overall) | 2,828 (60.0%) | 1,884 (40.0%) |
Employment Industries by Sex in Parmer County
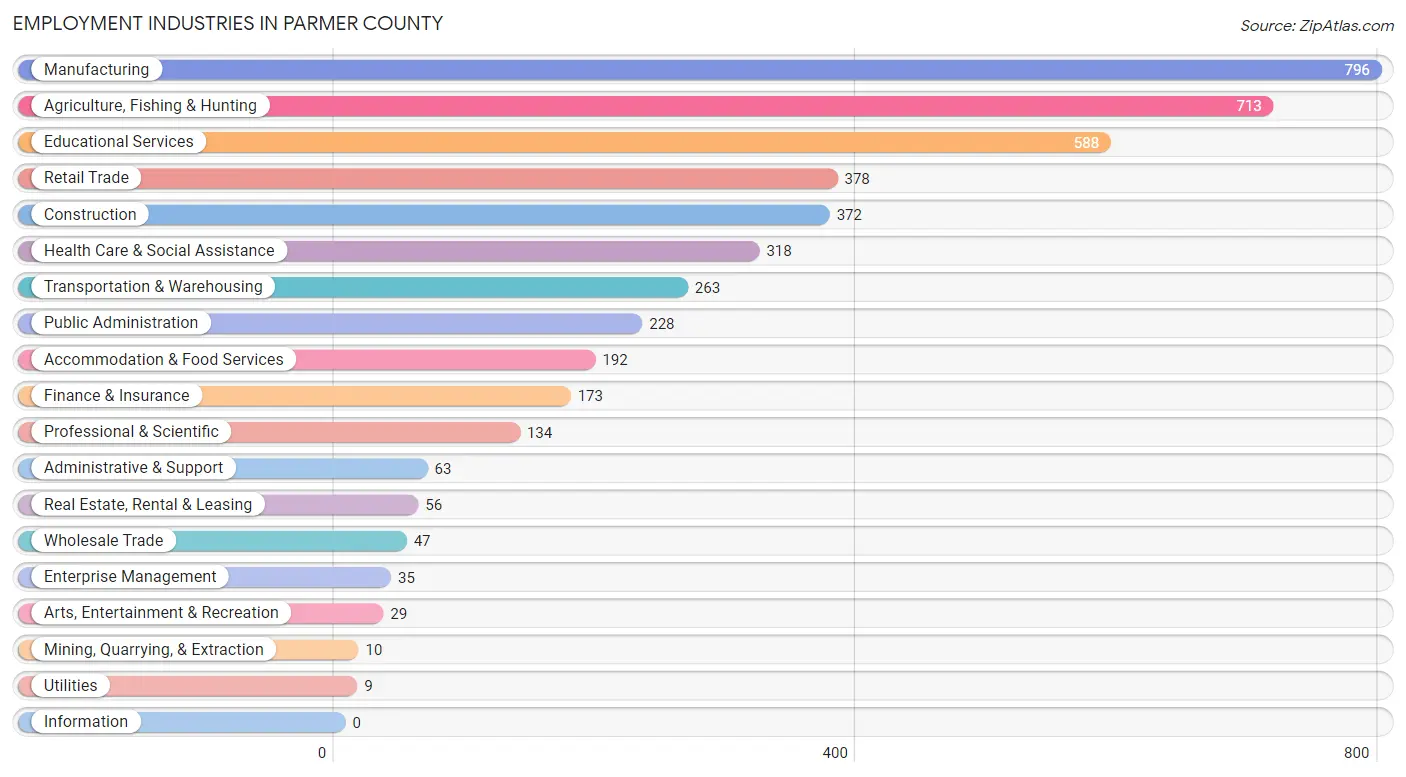
Employment Industries in Parmer County
The major employment industries in Parmer County include Manufacturing (796 | 16.9%), Agriculture, Fishing & Hunting (713 | 15.1%), Educational Services (588 | 12.5%), Retail Trade (378 | 8.0%), and Construction (372 | 7.9%).
Employment Industries by Sex in Parmer County
The Parmer County industries that see more men than women are Construction (100.0%), Utilities (100.0%), and Enterprise Management (100.0%), whereas the industries that tend to have a higher number of women are Arts, Entertainment & Recreation (100.0%), Health Care & Social Assistance (85.2%), and Finance & Insurance (85.0%).
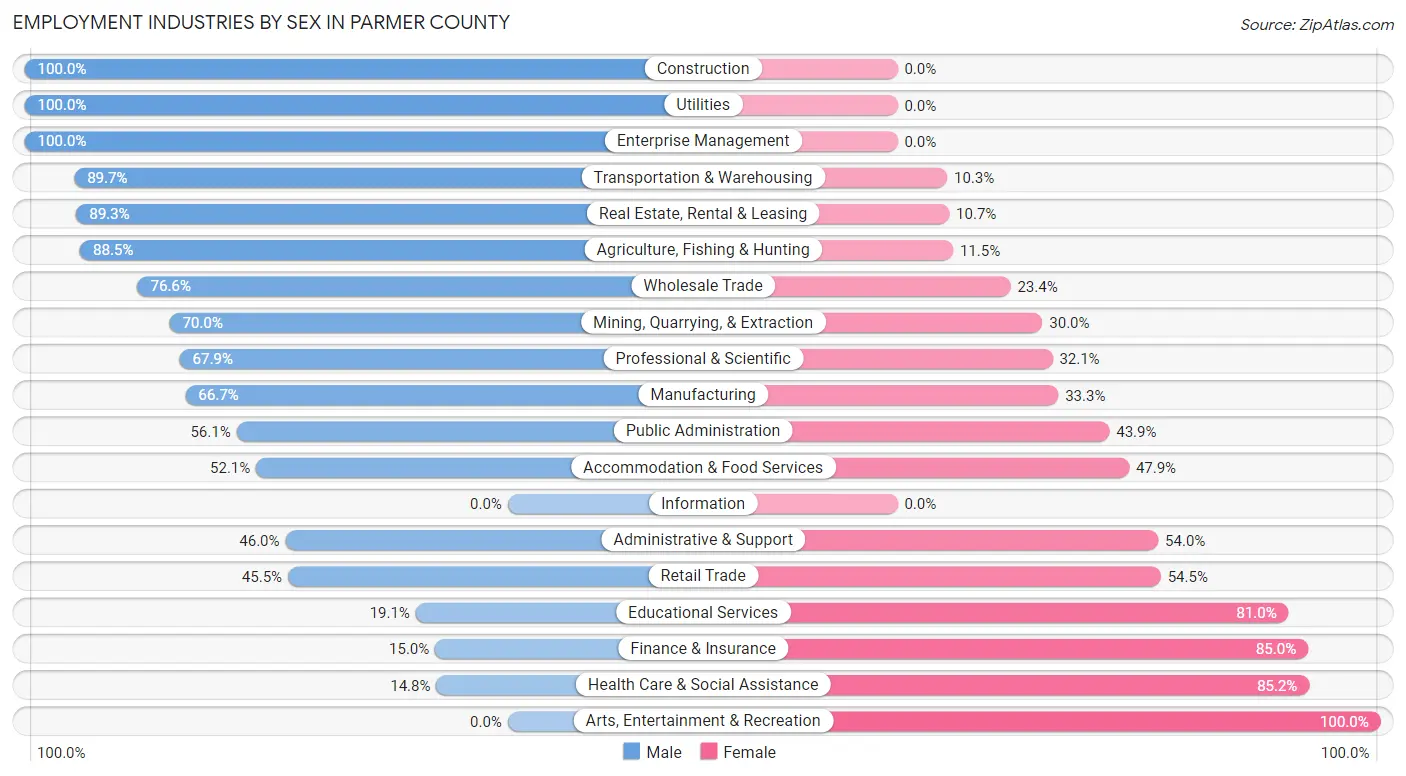
| Industry | Male | Female |
| Agriculture, Fishing & Hunting | 631 (88.5%) | 82 (11.5%) |
| Mining, Quarrying, & Extraction | 7 (70.0%) | 3 (30.0%) |
| Construction | 372 (100.0%) | 0 (0.0%) |
| Manufacturing | 531 (66.7%) | 265 (33.3%) |
| Wholesale Trade | 36 (76.6%) | 11 (23.4%) |
| Retail Trade | 172 (45.5%) | 206 (54.5%) |
| Transportation & Warehousing | 236 (89.7%) | 27 (10.3%) |
| Utilities | 9 (100.0%) | 0 (0.0%) |
| Information | 0 (0.0%) | 0 (0.0%) |
| Finance & Insurance | 26 (15.0%) | 147 (85.0%) |
| Real Estate, Rental & Leasing | 50 (89.3%) | 6 (10.7%) |
| Professional & Scientific | 91 (67.9%) | 43 (32.1%) |
| Enterprise Management | 35 (100.0%) | 0 (0.0%) |
| Administrative & Support | 29 (46.0%) | 34 (54.0%) |
| Educational Services | 112 (19.1%) | 476 (80.9%) |
| Health Care & Social Assistance | 47 (14.8%) | 271 (85.2%) |
| Arts, Entertainment & Recreation | 0 (0.0%) | 29 (100.0%) |
| Accommodation & Food Services | 100 (52.1%) | 92 (47.9%) |
| Public Administration | 128 (56.1%) | 100 (43.9%) |
| Total | 2,828 (60.0%) | 1,884 (40.0%) |
Education in Parmer County
School Enrollment in Parmer County
The most common levels of schooling among the 2,367 students in Parmer County are high school (667 | 28.2%), elementary school (635 | 26.8%), and middle school (580 | 24.5%).
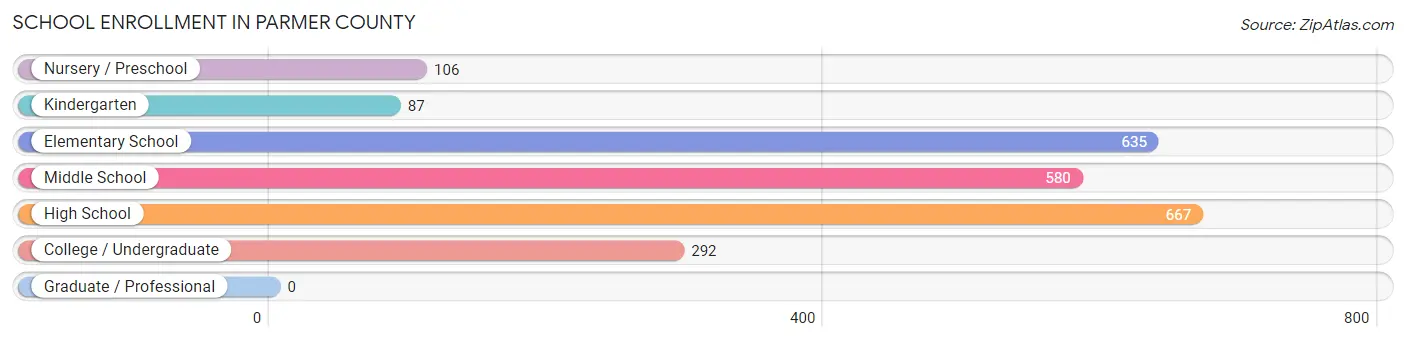
| School Level | # Students | % Students |
| Nursery / Preschool | 106 | 4.5% |
| Kindergarten | 87 | 3.7% |
| Elementary School | 635 | 26.8% |
| Middle School | 580 | 24.5% |
| High School | 667 | 28.2% |
| College / Undergraduate | 292 | 12.3% |
| Graduate / Professional | 0 | 0.0% |
| Total | 2,367 | 100.0% |
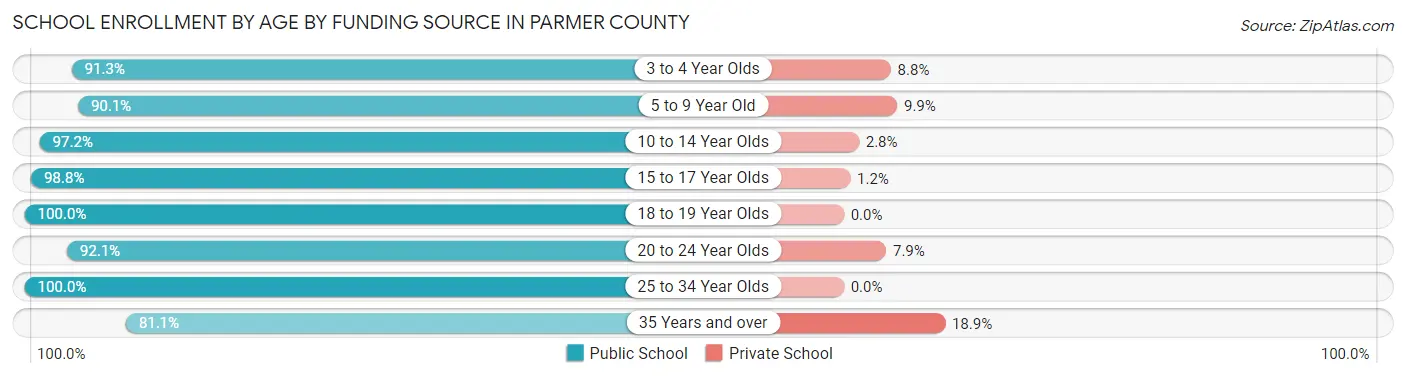
School Enrollment by Age by Funding Source in Parmer County
Out of a total of 2,367 students who are enrolled in schools in Parmer County, 125 (5.3%) attend a private institution, while the remaining 2,242 (94.7%) are enrolled in public schools. The age group of 35 years and over has the highest likelihood of being enrolled in private schools, with 10 (18.9% in the age bracket) enrolled. Conversely, the age group of 18 to 19 year olds has the lowest likelihood of being enrolled in a private school, with 159 (100.0% in the age bracket) attending a public institution.
| Age Bracket | Public School | Private School |
| 3 to 4 Year Olds | 73 (91.2%) | 7 (8.7%) |
| 5 to 9 Year Old | 616 (90.1%) | 68 (9.9%) |
| 10 to 14 Year Olds | 658 (97.2%) | 19 (2.8%) |
| 15 to 17 Year Olds | 494 (98.8%) | 6 (1.2%) |
| 18 to 19 Year Olds | 159 (100.0%) | 0 (0.0%) |
| 20 to 24 Year Olds | 175 (92.1%) | 15 (7.9%) |
| 25 to 34 Year Olds | 24 (100.0%) | 0 (0.0%) |
| 35 Years and over | 43 (81.1%) | 10 (18.9%) |
| Total | 2,242 (94.7%) | 125 (5.3%) |
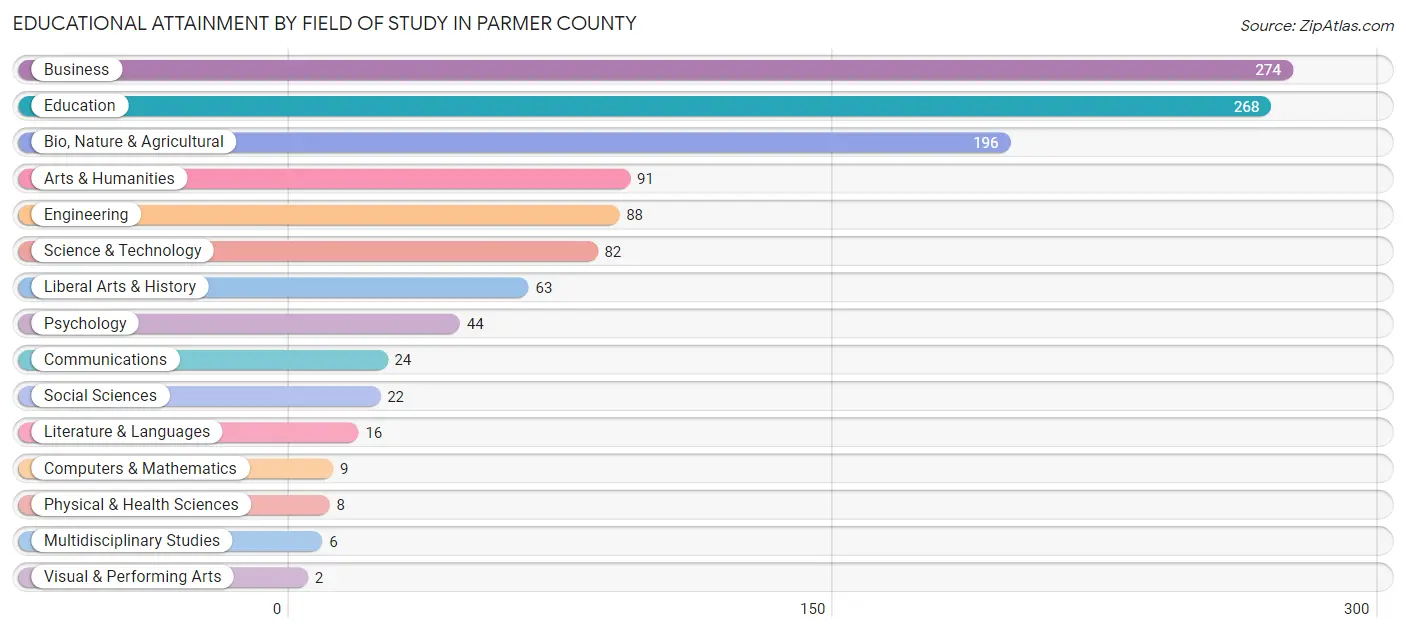
Educational Attainment by Field of Study in Parmer County
Business (274 | 23.0%), education (268 | 22.5%), bio, nature & agricultural (196 | 16.4%), arts & humanities (91 | 7.6%), and engineering (88 | 7.4%) are the most common fields of study among 1,193 individuals in Parmer County who have obtained a bachelor's degree or higher.
| Field of Study | # Graduates | % Graduates |
| Computers & Mathematics | 9 | 0.7% |
| Bio, Nature & Agricultural | 196 | 16.4% |
| Physical & Health Sciences | 8 | 0.7% |
| Psychology | 44 | 3.7% |
| Social Sciences | 22 | 1.8% |
| Engineering | 88 | 7.4% |
| Multidisciplinary Studies | 6 | 0.5% |
| Science & Technology | 82 | 6.9% |
| Business | 274 | 23.0% |
| Education | 268 | 22.5% |
| Literature & Languages | 16 | 1.3% |
| Liberal Arts & History | 63 | 5.3% |
| Visual & Performing Arts | 2 | 0.2% |
| Communications | 24 | 2.0% |
| Arts & Humanities | 91 | 7.6% |
| Total | 1,193 | 100.0% |
Transportation & Commute in Parmer County
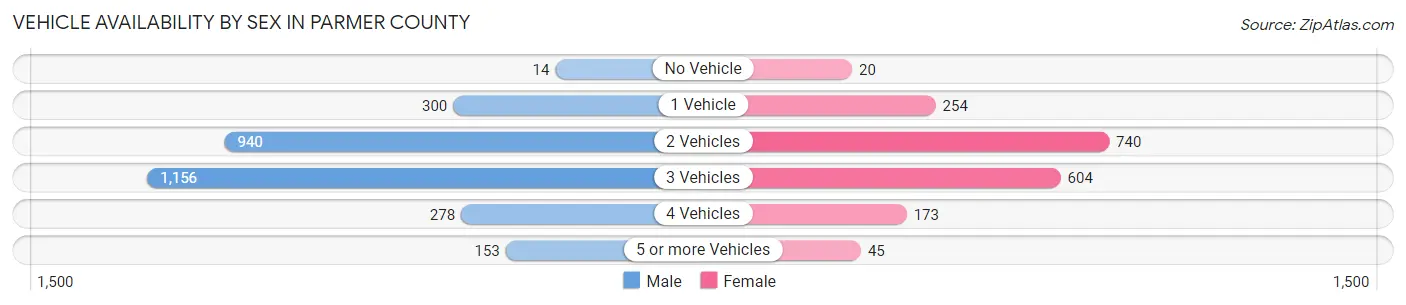
Vehicle Availability by Sex in Parmer County
The most prevalent vehicle ownership categories in Parmer County are males with 3 vehicles (1,156, accounting for 40.7%) and females with 3 vehicles (604, making up 63.0%).
| Vehicles Available | Male | Female |
| No Vehicle | 14 (0.5%) | 20 (1.1%) |
| 1 Vehicle | 300 (10.6%) | 254 (13.8%) |
| 2 Vehicles | 940 (33.1%) | 740 (40.3%) |
| 3 Vehicles | 1,156 (40.7%) | 604 (32.9%) |
| 4 Vehicles | 278 (9.8%) | 173 (9.4%) |
| 5 or more Vehicles | 153 (5.4%) | 45 (2.5%) |
| Total | 2,841 (100.0%) | 1,836 (100.0%) |
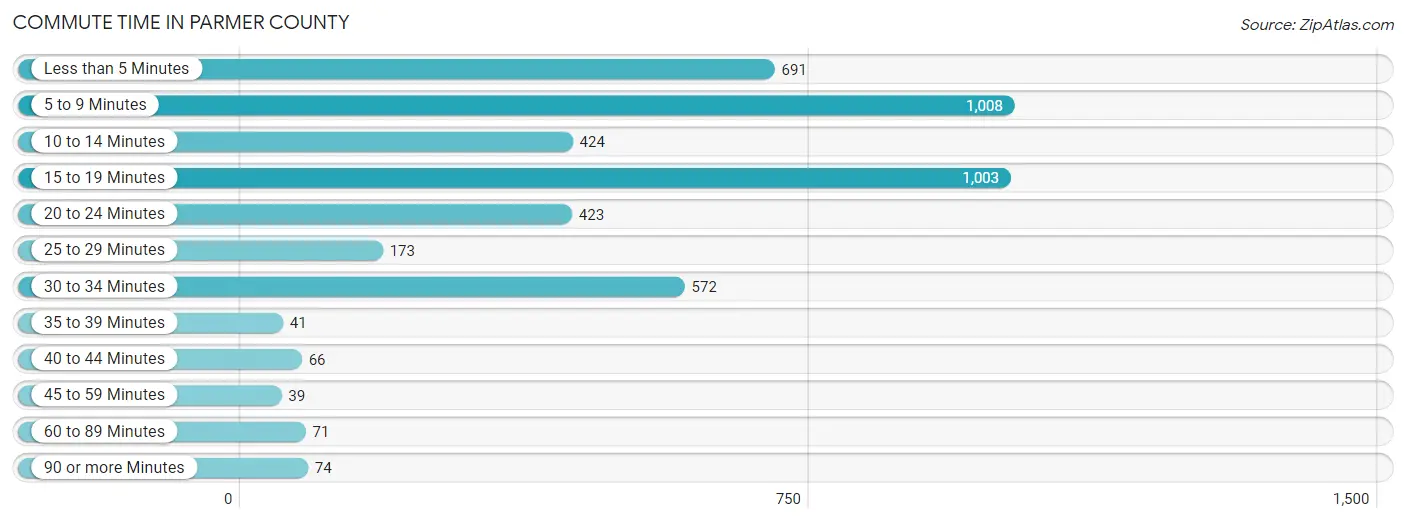
Commute Time in Parmer County
The most frequently occuring commute durations in Parmer County are 5 to 9 minutes (1,008 commuters, 22.0%), 15 to 19 minutes (1,003 commuters, 21.9%), and less than 5 minutes (691 commuters, 15.1%).
| Commute Time | # Commuters | % Commuters |
| Less than 5 Minutes | 691 | 15.1% |
| 5 to 9 Minutes | 1,008 | 22.0% |
| 10 to 14 Minutes | 424 | 9.2% |
| 15 to 19 Minutes | 1,003 | 21.9% |
| 20 to 24 Minutes | 423 | 9.2% |
| 25 to 29 Minutes | 173 | 3.8% |
| 30 to 34 Minutes | 572 | 12.5% |
| 35 to 39 Minutes | 41 | 0.9% |
| 40 to 44 Minutes | 66 | 1.4% |
| 45 to 59 Minutes | 39 | 0.9% |
| 60 to 89 Minutes | 71 | 1.5% |
| 90 or more Minutes | 74 | 1.6% |
Commute Time by Sex in Parmer County
The most common commute times in Parmer County are 15 to 19 minutes (646 commuters, 23.1%) for males and 5 to 9 minutes (482 commuters, 26.9%) for females.
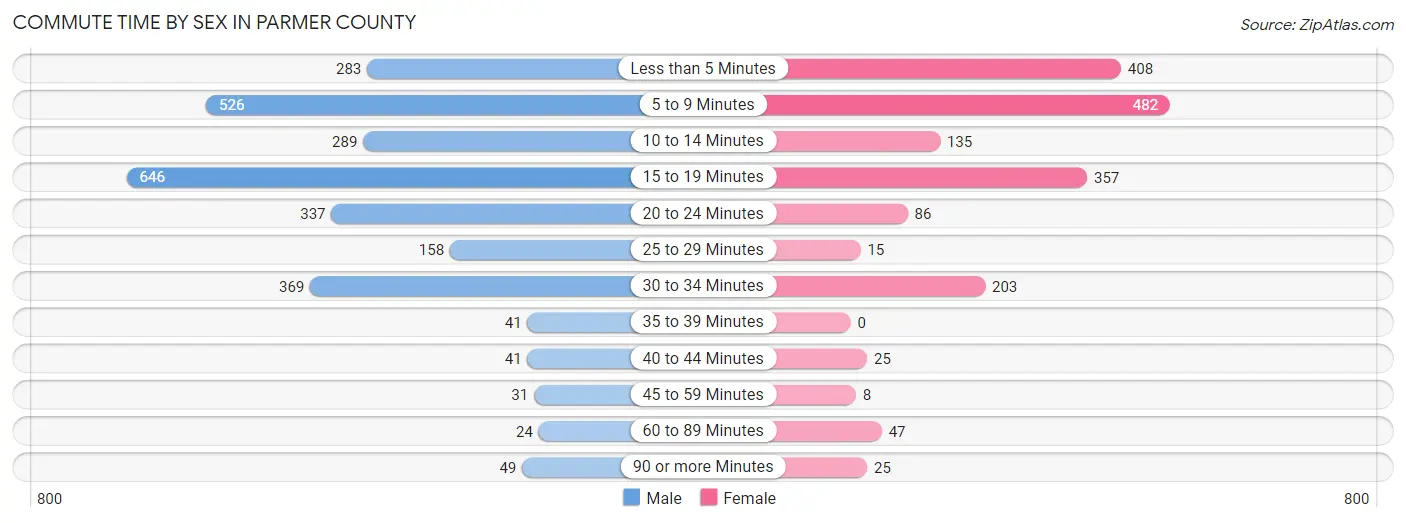
| Commute Time | Male | Female |
| Less than 5 Minutes | 283 (10.1%) | 408 (22.8%) |
| 5 to 9 Minutes | 526 (18.8%) | 482 (26.9%) |
| 10 to 14 Minutes | 289 (10.3%) | 135 (7.5%) |
| 15 to 19 Minutes | 646 (23.1%) | 357 (19.9%) |
| 20 to 24 Minutes | 337 (12.1%) | 86 (4.8%) |
| 25 to 29 Minutes | 158 (5.7%) | 15 (0.8%) |
| 30 to 34 Minutes | 369 (13.2%) | 203 (11.3%) |
| 35 to 39 Minutes | 41 (1.5%) | 0 (0.0%) |
| 40 to 44 Minutes | 41 (1.5%) | 25 (1.4%) |
| 45 to 59 Minutes | 31 (1.1%) | 8 (0.4%) |
| 60 to 89 Minutes | 24 (0.9%) | 47 (2.6%) |
| 90 or more Minutes | 49 (1.8%) | 25 (1.4%) |
Time of Departure to Work by Sex in Parmer County
The most frequent times of departure to work in Parmer County are 7:00 AM to 7:29 AM (437, 15.6%) for males and 7:00 AM to 7:29 AM (374, 20.9%) for females.
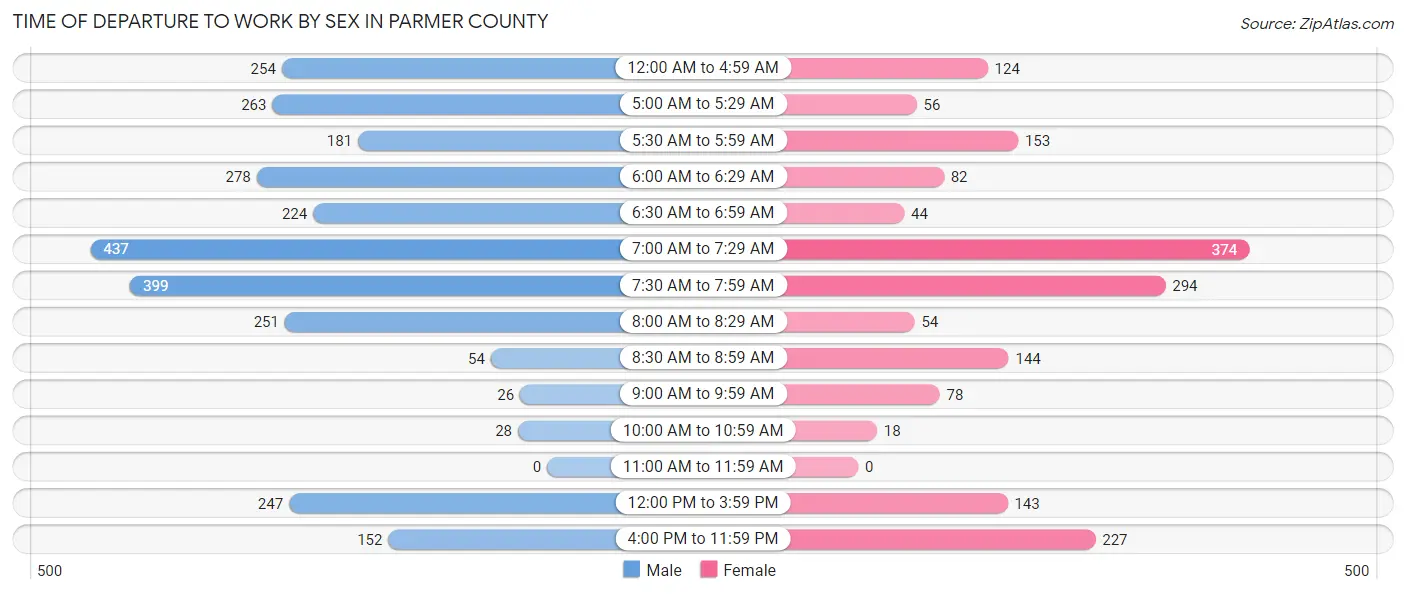
| Time of Departure | Male | Female |
| 12:00 AM to 4:59 AM | 254 (9.1%) | 124 (6.9%) |
| 5:00 AM to 5:29 AM | 263 (9.4%) | 56 (3.1%) |
| 5:30 AM to 5:59 AM | 181 (6.5%) | 153 (8.5%) |
| 6:00 AM to 6:29 AM | 278 (10.0%) | 82 (4.6%) |
| 6:30 AM to 6:59 AM | 224 (8.0%) | 44 (2.5%) |
| 7:00 AM to 7:29 AM | 437 (15.6%) | 374 (20.9%) |
| 7:30 AM to 7:59 AM | 399 (14.3%) | 294 (16.4%) |
| 8:00 AM to 8:29 AM | 251 (9.0%) | 54 (3.0%) |
| 8:30 AM to 8:59 AM | 54 (1.9%) | 144 (8.0%) |
| 9:00 AM to 9:59 AM | 26 (0.9%) | 78 (4.4%) |
| 10:00 AM to 10:59 AM | 28 (1.0%) | 18 (1.0%) |
| 11:00 AM to 11:59 AM | 0 (0.0%) | 0 (0.0%) |
| 12:00 PM to 3:59 PM | 247 (8.8%) | 143 (8.0%) |
| 4:00 PM to 11:59 PM | 152 (5.4%) | 227 (12.7%) |
| Total | 2,794 (100.0%) | 1,791 (100.0%) |
Housing Occupancy in Parmer County
Occupancy by Ownership in Parmer County
Of the total 3,203 dwellings in Parmer County, owner-occupied units account for 2,280 (71.2%), while renter-occupied units make up 923 (28.8%).
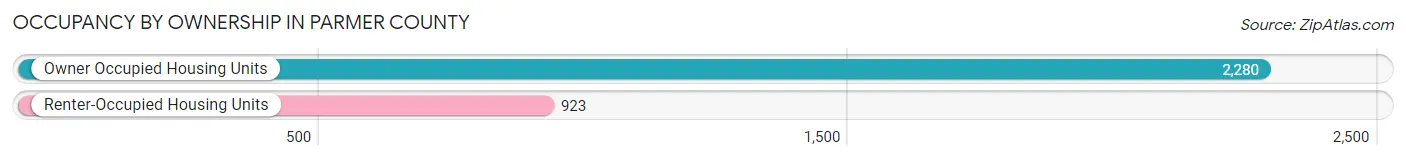
| Occupancy | # Housing Units | % Housing Units |
| Owner Occupied Housing Units | 2,280 | 71.2% |
| Renter-Occupied Housing Units | 923 | 28.8% |
| Total Occupied Housing Units | 3,203 | 100.0% |
Occupancy by Household Size in Parmer County
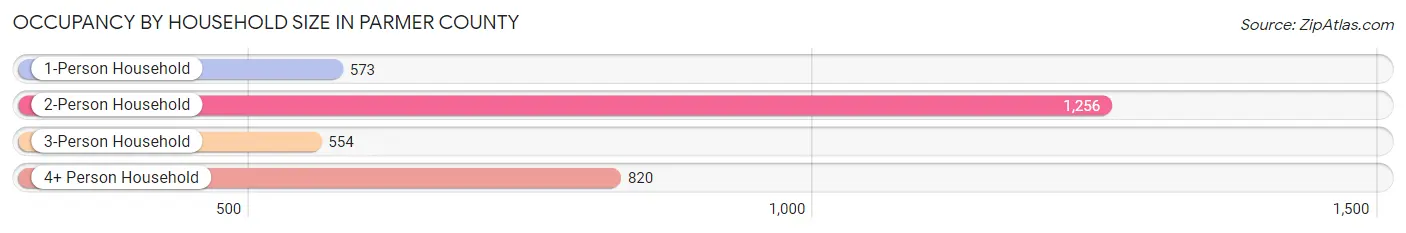
| Household Size | # Housing Units | % Housing Units |
| 1-Person Household | 573 | 17.9% |
| 2-Person Household | 1,256 | 39.2% |
| 3-Person Household | 554 | 17.3% |
| 4+ Person Household | 820 | 25.6% |
| Total Housing Units | 3,203 | 100.0% |
Occupancy by Ownership by Household Size in Parmer County
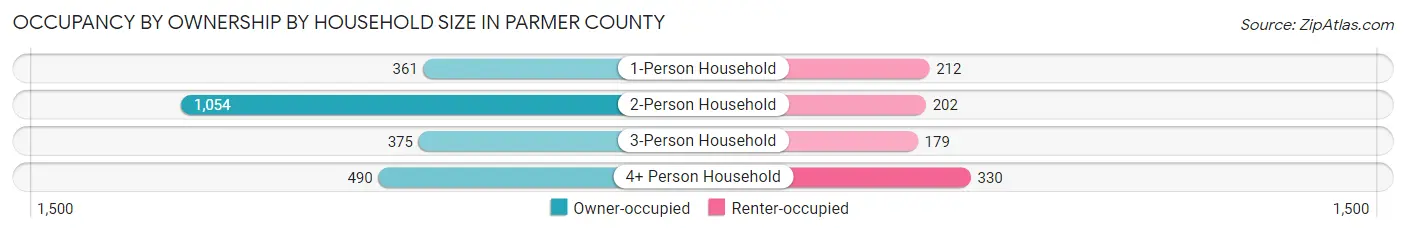
| Household Size | Owner-occupied | Renter-occupied |
| 1-Person Household | 361 (63.0%) | 212 (37.0%) |
| 2-Person Household | 1,054 (83.9%) | 202 (16.1%) |
| 3-Person Household | 375 (67.7%) | 179 (32.3%) |
| 4+ Person Household | 490 (59.8%) | 330 (40.2%) |
| Total Housing Units | 2,280 (71.2%) | 923 (28.8%) |
Occupancy by Educational Attainment in Parmer County
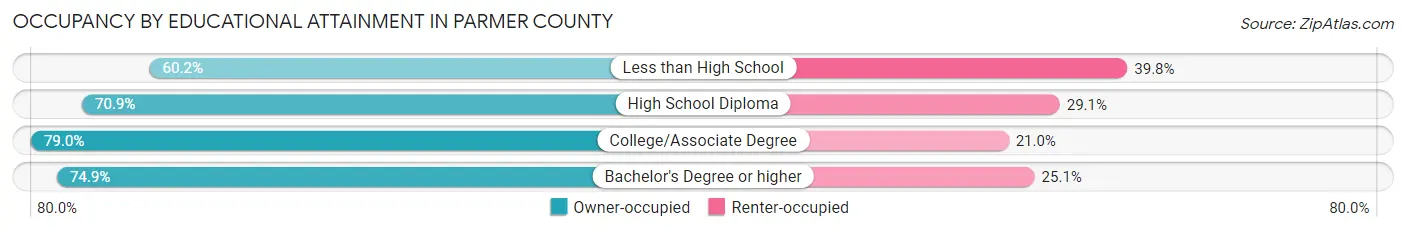
| Household Size | Owner-occupied | Renter-occupied |
| Less than High School | 530 (60.2%) | 351 (39.8%) |
| High School Diploma | 540 (70.9%) | 222 (29.1%) |
| College/Associate Degree | 808 (79.0%) | 215 (21.0%) |
| Bachelor's Degree or higher | 402 (74.9%) | 135 (25.1%) |
Occupancy by Age of Householder in Parmer County
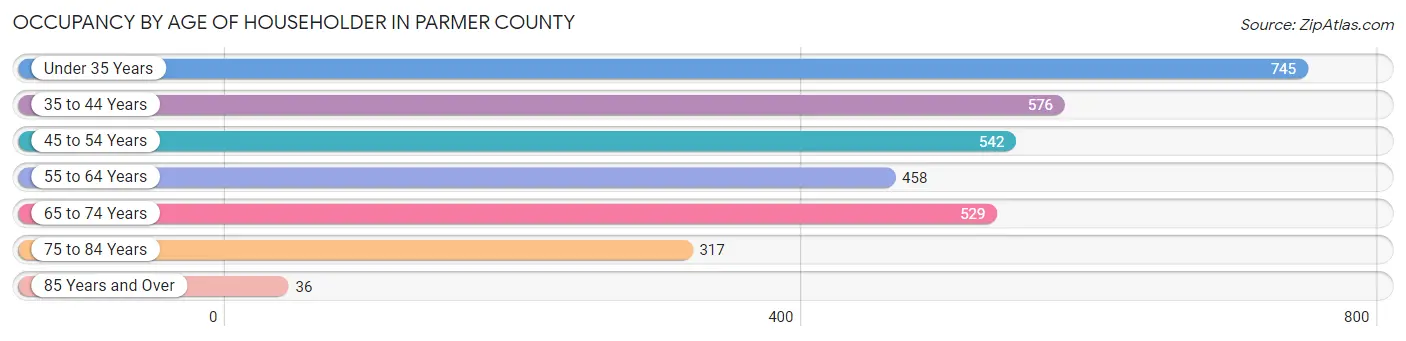
| Age Bracket | # Households | % Households |
| Under 35 Years | 745 | 23.3% |
| 35 to 44 Years | 576 | 18.0% |
| 45 to 54 Years | 542 | 16.9% |
| 55 to 64 Years | 458 | 14.3% |
| 65 to 74 Years | 529 | 16.5% |
| 75 to 84 Years | 317 | 9.9% |
| 85 Years and Over | 36 | 1.1% |
| Total | 3,203 | 100.0% |
Housing Finances in Parmer County
Median Income by Occupancy in Parmer County
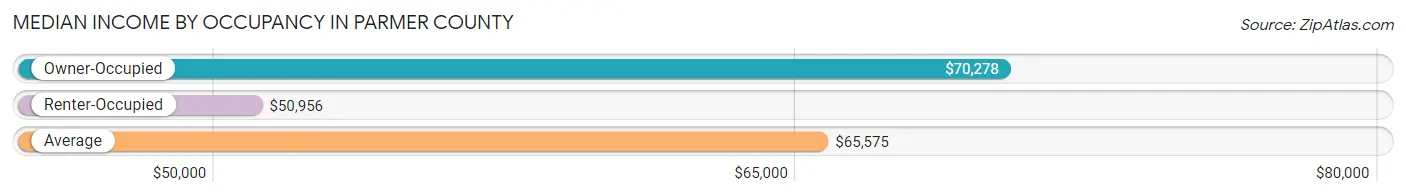
| Occupancy Type | # Households | Median Income |
| Owner-Occupied | 2,280 (71.2%) | $70,278 |
| Renter-Occupied | 923 (28.8%) | $50,956 |
| Average | 3,203 (100.0%) | $65,575 |
Occupancy by Householder Income Bracket in Parmer County
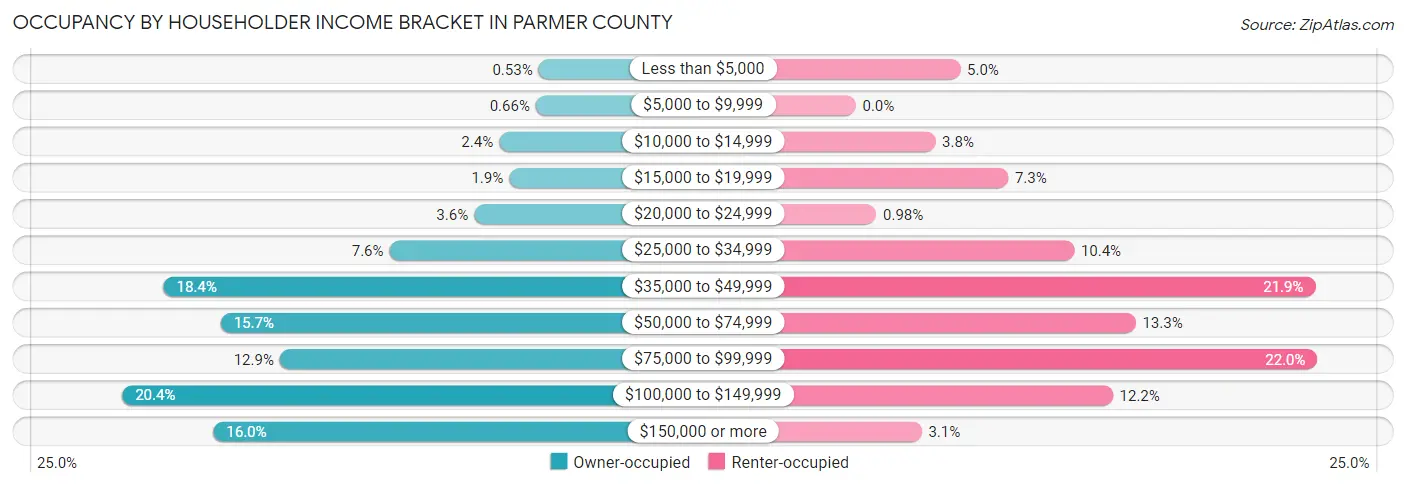
| Income Bracket | Owner-occupied | Renter-occupied |
| Less than $5,000 | 12 (0.5%) | 46 (5.0%) |
| $5,000 to $9,999 | 15 (0.7%) | 0 (0.0%) |
| $10,000 to $14,999 | 55 (2.4%) | 35 (3.8%) |
| $15,000 to $19,999 | 44 (1.9%) | 67 (7.3%) |
| $20,000 to $24,999 | 82 (3.6%) | 9 (1.0%) |
| $25,000 to $34,999 | 174 (7.6%) | 96 (10.4%) |
| $35,000 to $49,999 | 419 (18.4%) | 202 (21.9%) |
| $50,000 to $74,999 | 357 (15.7%) | 123 (13.3%) |
| $75,000 to $99,999 | 293 (12.9%) | 203 (22.0%) |
| $100,000 to $149,999 | 464 (20.3%) | 113 (12.2%) |
| $150,000 or more | 365 (16.0%) | 29 (3.1%) |
| Total | 2,280 (100.0%) | 923 (100.0%) |
Monthly Housing Cost Tiers in Parmer County
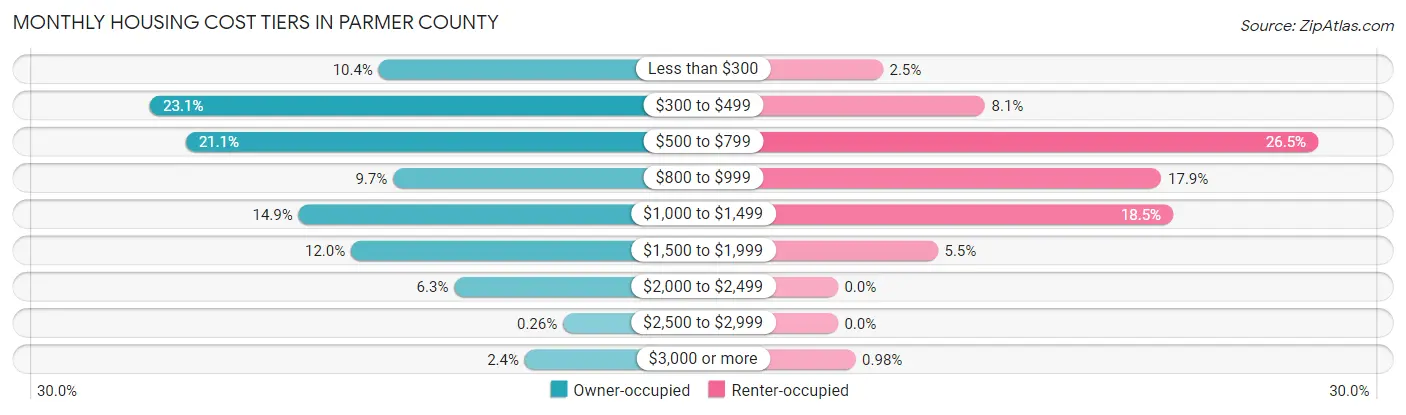
| Monthly Cost | Owner-occupied | Renter-occupied |
| Less than $300 | 238 (10.4%) | 23 (2.5%) |
| $300 to $499 | 526 (23.1%) | 75 (8.1%) |
| $500 to $799 | 481 (21.1%) | 245 (26.5%) |
| $800 to $999 | 220 (9.7%) | 165 (17.9%) |
| $1,000 to $1,499 | 339 (14.9%) | 171 (18.5%) |
| $1,500 to $1,999 | 273 (12.0%) | 51 (5.5%) |
| $2,000 to $2,499 | 143 (6.3%) | 0 (0.0%) |
| $2,500 to $2,999 | 6 (0.3%) | 0 (0.0%) |
| $3,000 or more | 54 (2.4%) | 9 (1.0%) |
| Total | 2,280 (100.0%) | 923 (100.0%) |
Physical Housing Characteristics in Parmer County
Housing Structures in Parmer County
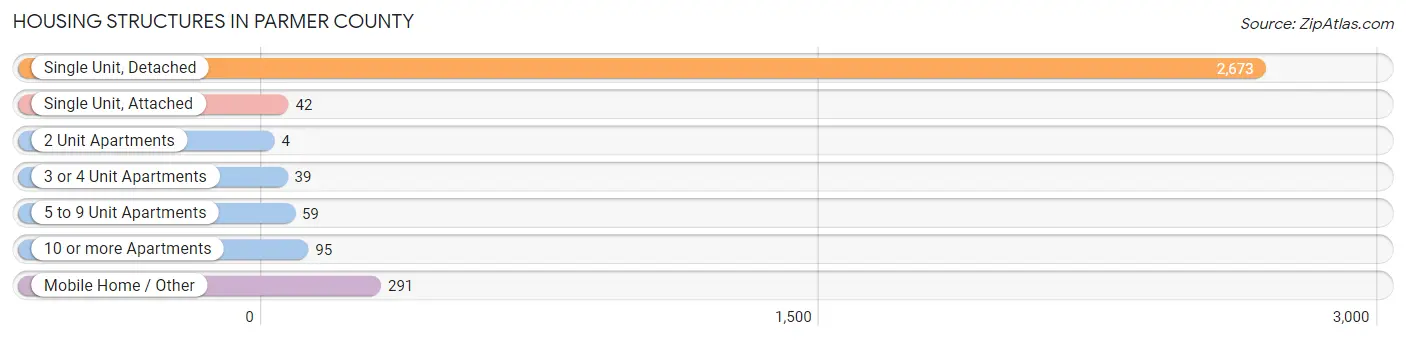
| Structure Type | # Housing Units | % Housing Units |
| Single Unit, Detached | 2,673 | 83.5% |
| Single Unit, Attached | 42 | 1.3% |
| 2 Unit Apartments | 4 | 0.1% |
| 3 or 4 Unit Apartments | 39 | 1.2% |
| 5 to 9 Unit Apartments | 59 | 1.8% |
| 10 or more Apartments | 95 | 3.0% |
| Mobile Home / Other | 291 | 9.1% |
| Total | 3,203 | 100.0% |
Housing Structures by Occupancy in Parmer County
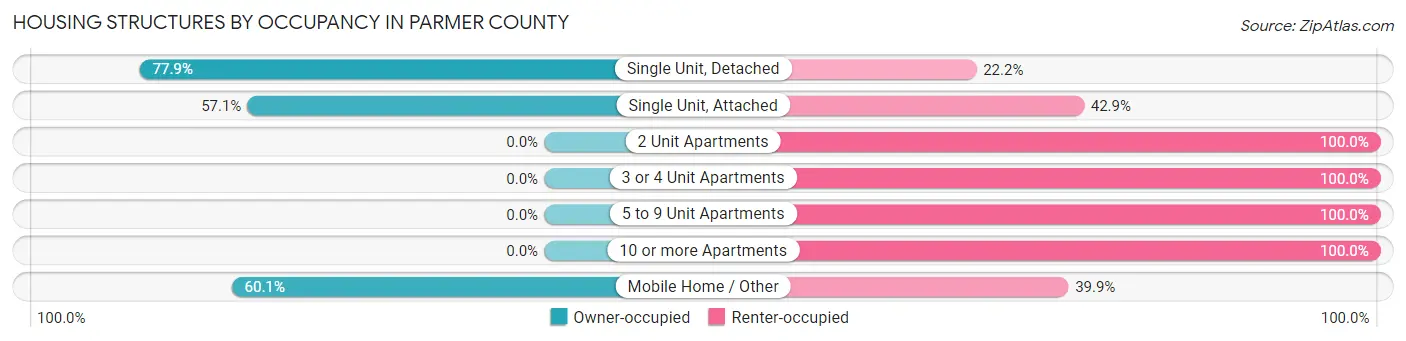
| Structure Type | Owner-occupied | Renter-occupied |
| Single Unit, Detached | 2,081 (77.8%) | 592 (22.2%) |
| Single Unit, Attached | 24 (57.1%) | 18 (42.9%) |
| 2 Unit Apartments | 0 (0.0%) | 4 (100.0%) |
| 3 or 4 Unit Apartments | 0 (0.0%) | 39 (100.0%) |
| 5 to 9 Unit Apartments | 0 (0.0%) | 59 (100.0%) |
| 10 or more Apartments | 0 (0.0%) | 95 (100.0%) |
| Mobile Home / Other | 175 (60.1%) | 116 (39.9%) |
| Total | 2,280 (71.2%) | 923 (28.8%) |
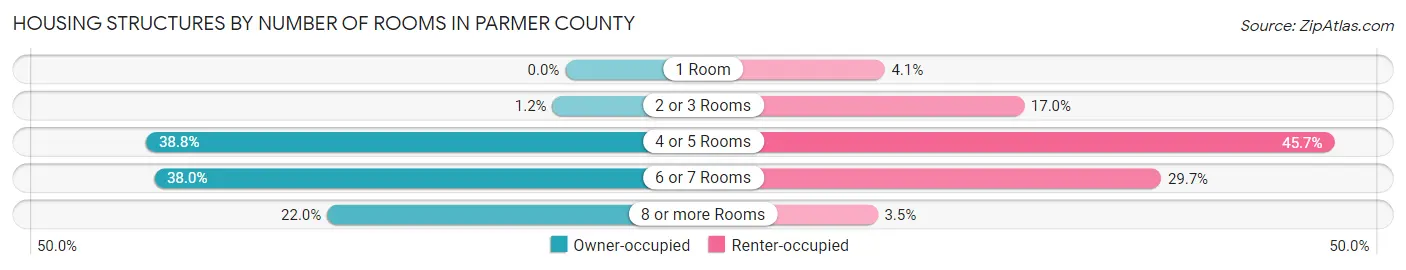
Housing Structures by Number of Rooms in Parmer County
| Number of Rooms | Owner-occupied | Renter-occupied |
| 1 Room | 0 (0.0%) | 38 (4.1%) |
| 2 or 3 Rooms | 27 (1.2%) | 157 (17.0%) |
| 4 or 5 Rooms | 884 (38.8%) | 422 (45.7%) |
| 6 or 7 Rooms | 867 (38.0%) | 274 (29.7%) |
| 8 or more Rooms | 502 (22.0%) | 32 (3.5%) |
| Total | 2,280 (100.0%) | 923 (100.0%) |
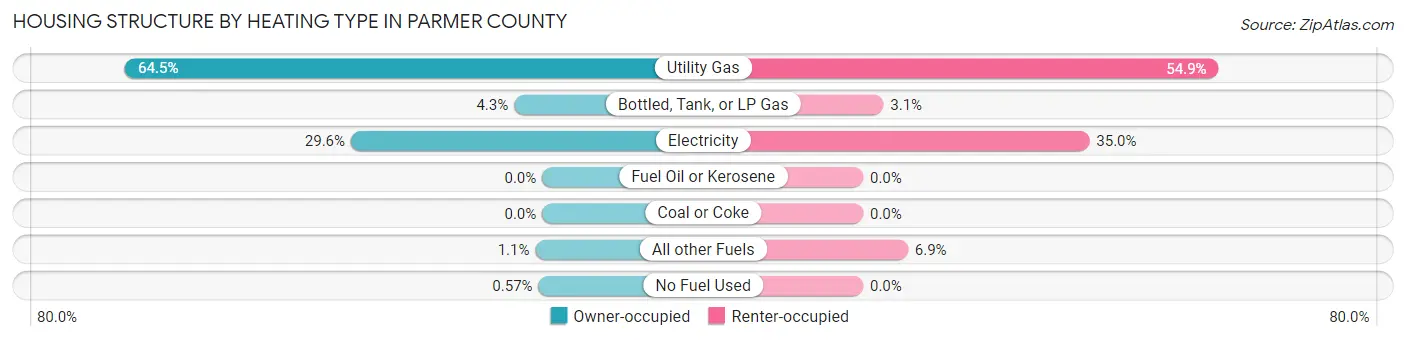
Housing Structure by Heating Type in Parmer County
| Heating Type | Owner-occupied | Renter-occupied |
| Utility Gas | 1,470 (64.5%) | 507 (54.9%) |
| Bottled, Tank, or LP Gas | 99 (4.3%) | 29 (3.1%) |
| Electricity | 674 (29.6%) | 323 (35.0%) |
| Fuel Oil or Kerosene | 0 (0.0%) | 0 (0.0%) |
| Coal or Coke | 0 (0.0%) | 0 (0.0%) |
| All other Fuels | 24 (1.1%) | 64 (6.9%) |
| No Fuel Used | 13 (0.6%) | 0 (0.0%) |
| Total | 2,280 (100.0%) | 923 (100.0%) |
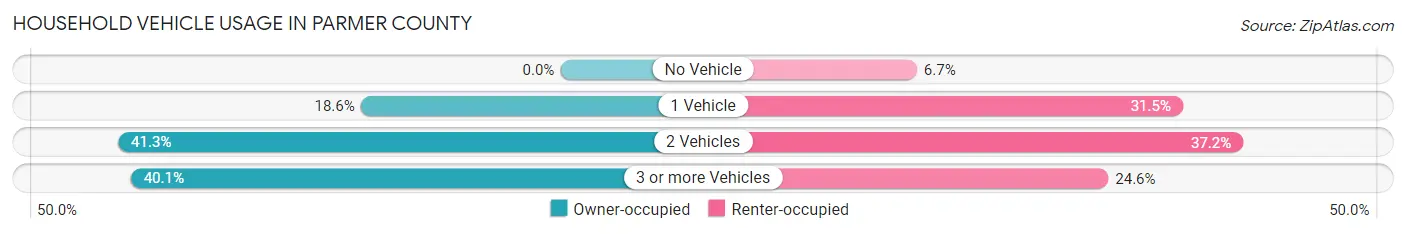
Household Vehicle Usage in Parmer County
| Vehicles per Household | Owner-occupied | Renter-occupied |
| No Vehicle | 0 (0.0%) | 62 (6.7%) |
| 1 Vehicle | 425 (18.6%) | 291 (31.5%) |
| 2 Vehicles | 941 (41.3%) | 343 (37.2%) |
| 3 or more Vehicles | 914 (40.1%) | 227 (24.6%) |
| Total | 2,280 (100.0%) | 923 (100.0%) |
Real Estate & Mortgages in Parmer County
Real Estate and Mortgage Overview in Parmer County
| Characteristic | Without Mortgage | With Mortgage |
| Housing Units | 1,348 | 932 |
| Median Property Value | $97,000 | $158,700 |
| Median Household Income | $61,802 | $215 |
| Monthly Housing Costs | $447 | $54 |
| Real Estate Taxes | $1,483 | $232 |
Property Value by Mortgage Status in Parmer County
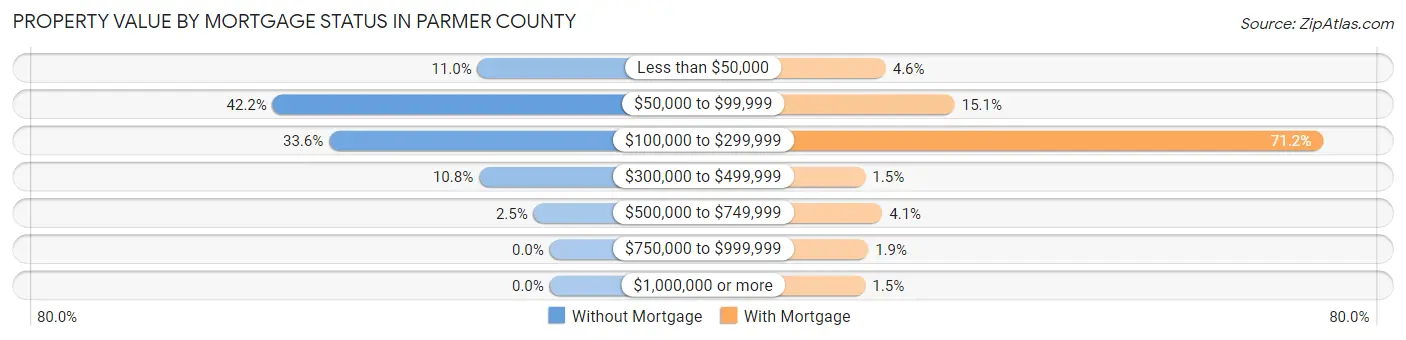
| Property Value | Without Mortgage | With Mortgage |
| Less than $50,000 | 148 (11.0%) | 43 (4.6%) |
| $50,000 to $99,999 | 569 (42.2%) | 141 (15.1%) |
| $100,000 to $299,999 | 453 (33.6%) | 664 (71.2%) |
| $300,000 to $499,999 | 145 (10.8%) | 14 (1.5%) |
| $500,000 to $749,999 | 33 (2.5%) | 38 (4.1%) |
| $750,000 to $999,999 | 0 (0.0%) | 18 (1.9%) |
| $1,000,000 or more | 0 (0.0%) | 14 (1.5%) |
| Total | 1,348 (100.0%) | 932 (100.0%) |
Household Income by Mortgage Status in Parmer County
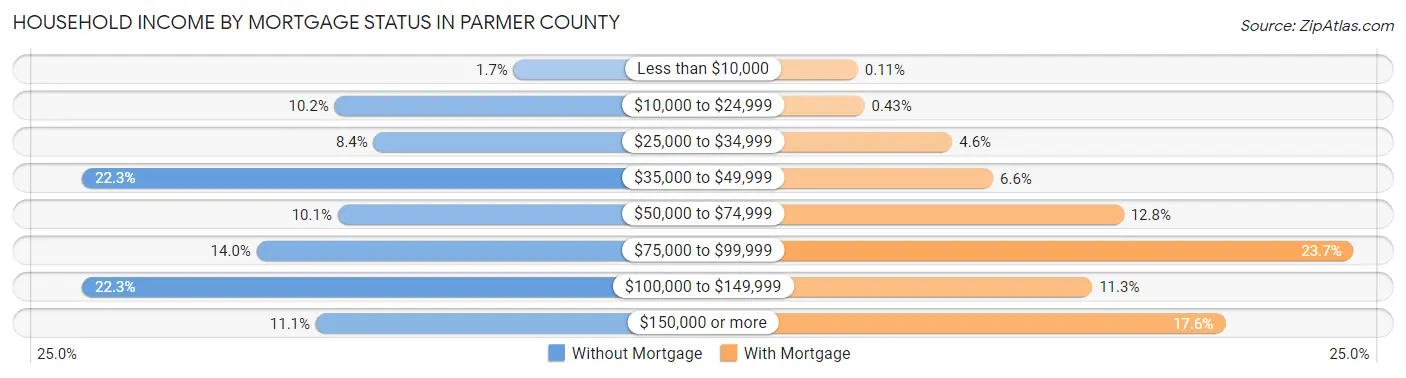
| Household Income | Without Mortgage | With Mortgage |
| Less than $10,000 | 23 (1.7%) | 1 (0.1%) |
| $10,000 to $24,999 | 138 (10.2%) | 4 (0.4%) |
| $25,000 to $34,999 | 113 (8.4%) | 43 (4.6%) |
| $35,000 to $49,999 | 300 (22.3%) | 61 (6.6%) |
| $50,000 to $74,999 | 136 (10.1%) | 119 (12.8%) |
| $75,000 to $99,999 | 188 (14.0%) | 221 (23.7%) |
| $100,000 to $149,999 | 300 (22.3%) | 105 (11.3%) |
| $150,000 or more | 150 (11.1%) | 164 (17.6%) |
| Total | 1,348 (100.0%) | 932 (100.0%) |
Property Value to Household Income Ratio in Parmer County
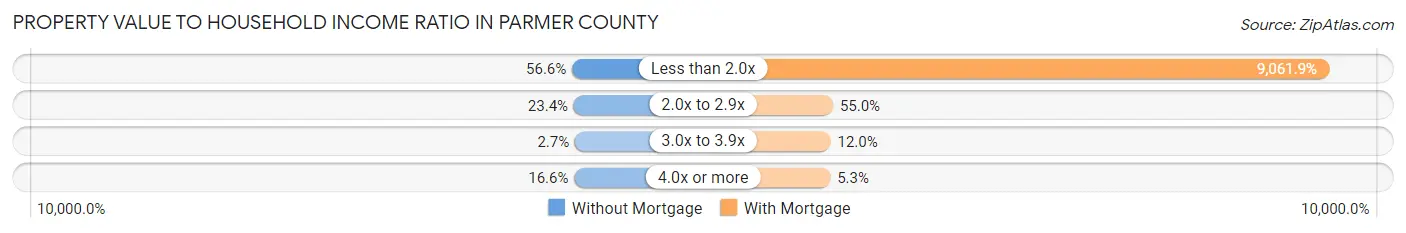
| Value-to-Income Ratio | Without Mortgage | With Mortgage |
| Less than 2.0x | 763 (56.6%) | 84,457 (9,061.9%) |
| 2.0x to 2.9x | 316 (23.4%) | 513 (55.0%) |
| 3.0x to 3.9x | 36 (2.7%) | 112 (12.0%) |
| 4.0x or more | 224 (16.6%) | 49 (5.3%) |
| Total | 1,348 (100.0%) | 932 (100.0%) |
Real Estate Taxes by Mortgage Status in Parmer County
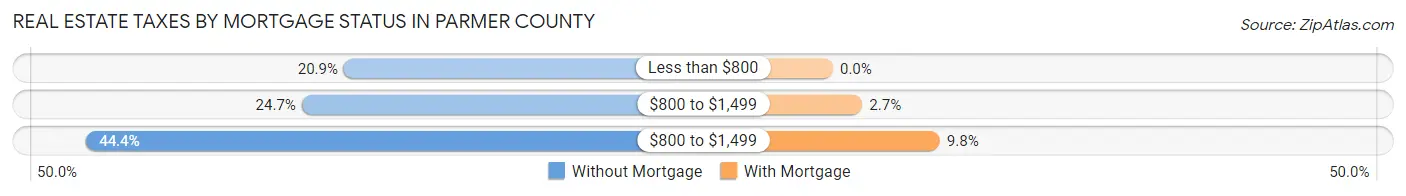
| Property Taxes | Without Mortgage | With Mortgage |
| Less than $800 | 281 (20.8%) | 0 (0.0%) |
| $800 to $1,499 | 333 (24.7%) | 25 (2.7%) |
| $800 to $1,499 | 598 (44.4%) | 91 (9.8%) |
| Total | 1,348 (100.0%) | 932 (100.0%) |
Health & Disability in Parmer County
Health Insurance Coverage by Age in Parmer County
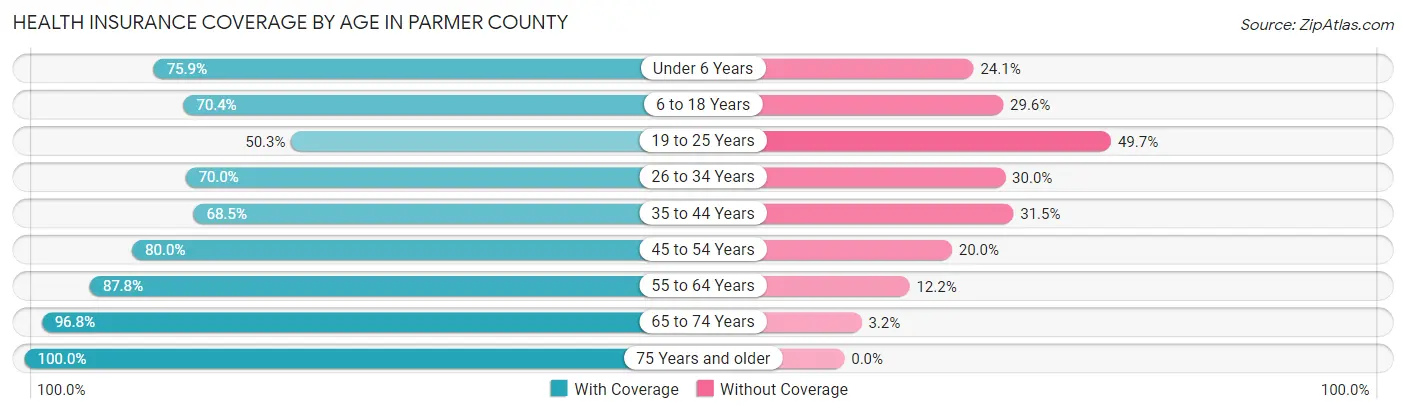
| Age Bracket | With Coverage | Without Coverage |
| Under 6 Years | 709 (75.9%) | 225 (24.1%) |
| 6 to 18 Years | 1,338 (70.4%) | 563 (29.6%) |
| 19 to 25 Years | 463 (50.3%) | 458 (49.7%) |
| 26 to 34 Years | 728 (70.0%) | 312 (30.0%) |
| 35 to 44 Years | 937 (68.5%) | 431 (31.5%) |
| 45 to 54 Years | 750 (80.0%) | 188 (20.0%) |
| 55 to 64 Years | 1,019 (87.8%) | 141 (12.2%) |
| 65 to 74 Years | 878 (96.8%) | 29 (3.2%) |
| 75 Years and older | 548 (100.0%) | 0 (0.0%) |
| Total | 7,370 (75.8%) | 2,347 (24.1%) |
Health Insurance Coverage by Citizenship Status in Parmer County
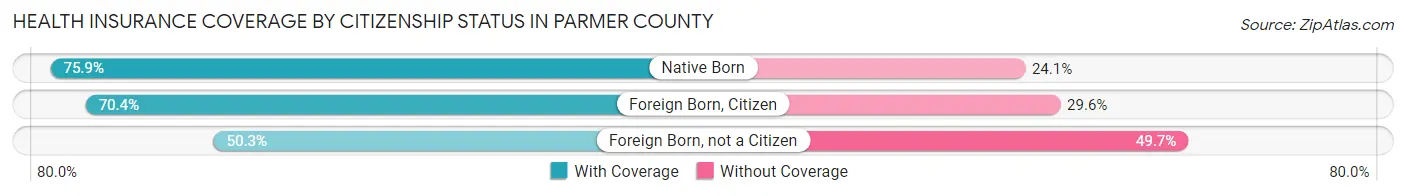
| Citizenship Status | With Coverage | Without Coverage |
| Native Born | 709 (75.9%) | 225 (24.1%) |
| Foreign Born, Citizen | 1,338 (70.4%) | 563 (29.6%) |
| Foreign Born, not a Citizen | 463 (50.3%) | 458 (49.7%) |
Health Insurance Coverage by Household Income in Parmer County
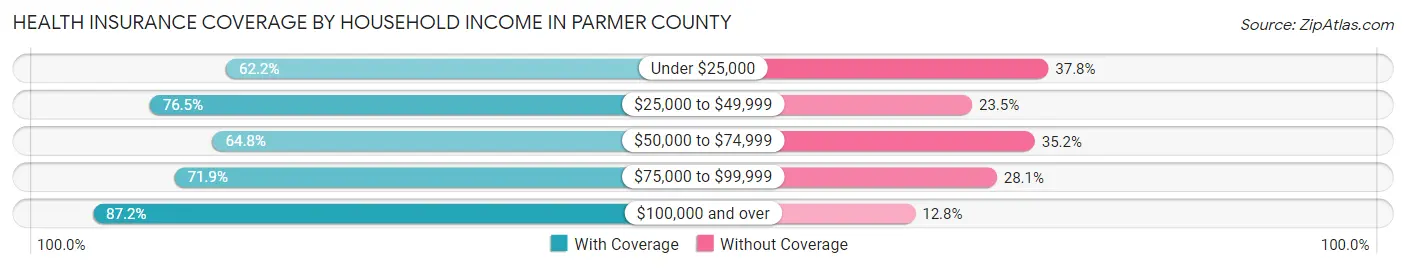
| Household Income | With Coverage | Without Coverage |
| Under $25,000 | 501 (62.2%) | 304 (37.8%) |
| $25,000 to $49,999 | 1,765 (76.5%) | 541 (23.5%) |
| $50,000 to $74,999 | 1,022 (64.8%) | 556 (35.2%) |
| $75,000 to $99,999 | 1,415 (71.9%) | 553 (28.1%) |
| $100,000 and over | 2,667 (87.2%) | 393 (12.8%) |
Public vs Private Health Insurance Coverage by Age in Parmer County
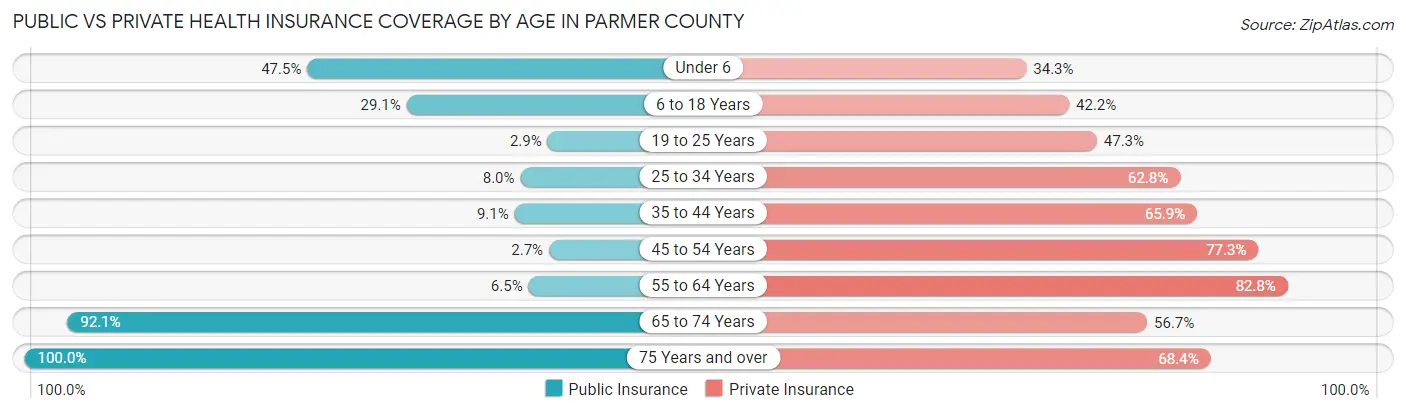
| Age Bracket | Public Insurance | Private Insurance |
| Under 6 | 444 (47.5%) | 320 (34.3%) |
| 6 to 18 Years | 553 (29.1%) | 802 (42.2%) |
| 19 to 25 Years | 27 (2.9%) | 436 (47.3%) |
| 25 to 34 Years | 83 (8.0%) | 653 (62.8%) |
| 35 to 44 Years | 124 (9.1%) | 902 (65.9%) |
| 45 to 54 Years | 25 (2.7%) | 725 (77.3%) |
| 55 to 64 Years | 75 (6.5%) | 960 (82.8%) |
| 65 to 74 Years | 835 (92.1%) | 514 (56.7%) |
| 75 Years and over | 548 (100.0%) | 375 (68.4%) |
| Total | 2,714 (27.9%) | 5,687 (58.5%) |
Disability Status by Sex by Age in Parmer County
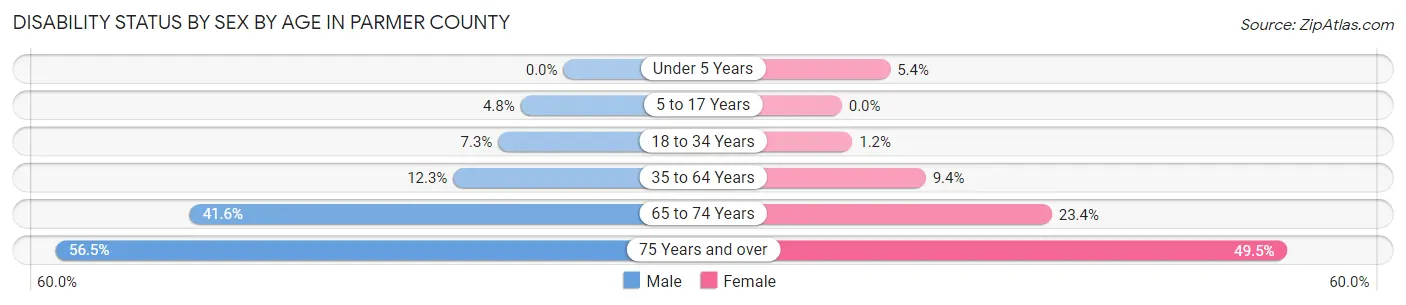
| Age Bracket | Male | Female |
| Under 5 Years | 0 (0.0%) | 20 (5.4%) |
| 5 to 17 Years | 51 (4.8%) | 0 (0.0%) |
| 18 to 34 Years | 83 (7.3%) | 11 (1.2%) |
| 35 to 64 Years | 218 (12.3%) | 158 (9.3%) |
| 65 to 74 Years | 196 (41.6%) | 102 (23.4%) |
| 75 Years and over | 135 (56.5%) | 153 (49.5%) |
Disability Class by Sex by Age in Parmer County
Disability Class: Hearing Difficulty
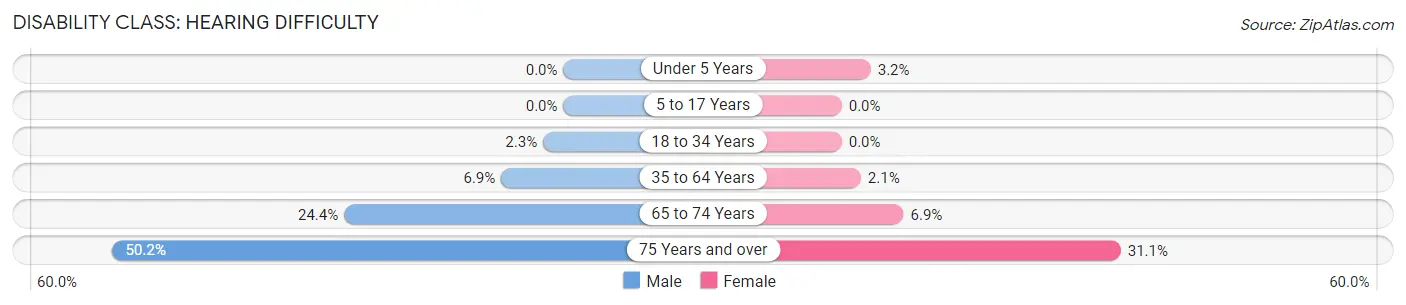
| Age Bracket | Male | Female |
| Under 5 Years | 0 (0.0%) | 12 (3.2%) |
| 5 to 17 Years | 0 (0.0%) | 0 (0.0%) |
| 18 to 34 Years | 26 (2.3%) | 0 (0.0%) |
| 35 to 64 Years | 123 (6.9%) | 36 (2.1%) |
| 65 to 74 Years | 115 (24.4%) | 30 (6.9%) |
| 75 Years and over | 120 (50.2%) | 96 (31.1%) |
Disability Class: Vision Difficulty
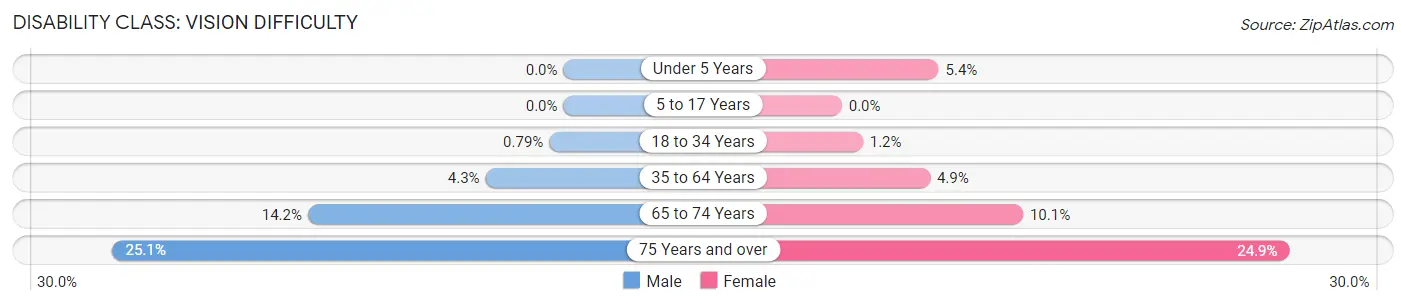
| Age Bracket | Male | Female |
| Under 5 Years | 0 (0.0%) | 20 (5.4%) |
| 5 to 17 Years | 0 (0.0%) | 0 (0.0%) |
| 18 to 34 Years | 9 (0.8%) | 11 (1.2%) |
| 35 to 64 Years | 77 (4.3%) | 83 (4.9%) |
| 65 to 74 Years | 67 (14.2%) | 44 (10.1%) |
| 75 Years and over | 60 (25.1%) | 77 (24.9%) |
Disability Class: Cognitive Difficulty
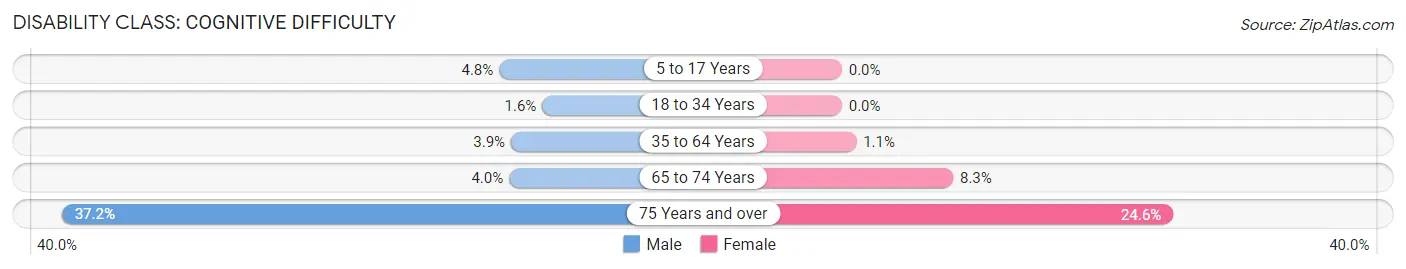
| Age Bracket | Male | Female |
| 5 to 17 Years | 51 (4.8%) | 0 (0.0%) |
| 18 to 34 Years | 18 (1.6%) | 0 (0.0%) |
| 35 to 64 Years | 69 (3.9%) | 18 (1.1%) |
| 65 to 74 Years | 19 (4.0%) | 36 (8.3%) |
| 75 Years and over | 89 (37.2%) | 76 (24.6%) |
Disability Class: Ambulatory Difficulty
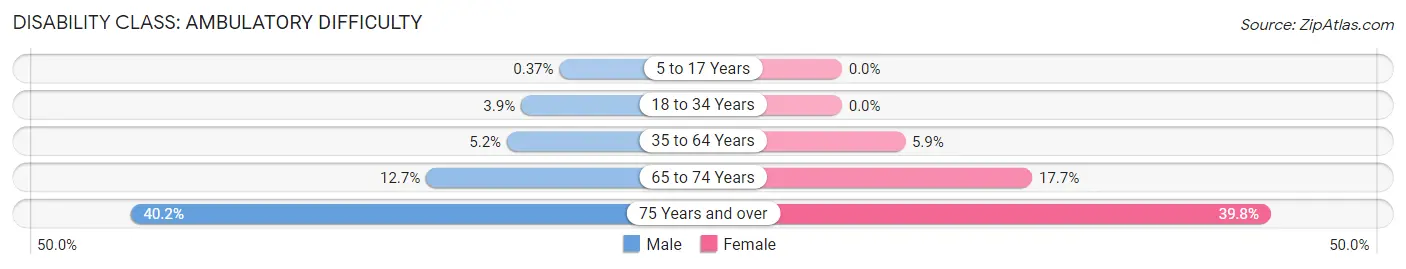
| Age Bracket | Male | Female |
| 5 to 17 Years | 4 (0.4%) | 0 (0.0%) |
| 18 to 34 Years | 45 (3.9%) | 0 (0.0%) |
| 35 to 64 Years | 93 (5.2%) | 99 (5.9%) |
| 65 to 74 Years | 60 (12.7%) | 77 (17.7%) |
| 75 Years and over | 96 (40.2%) | 123 (39.8%) |
Disability Class: Self-Care Difficulty
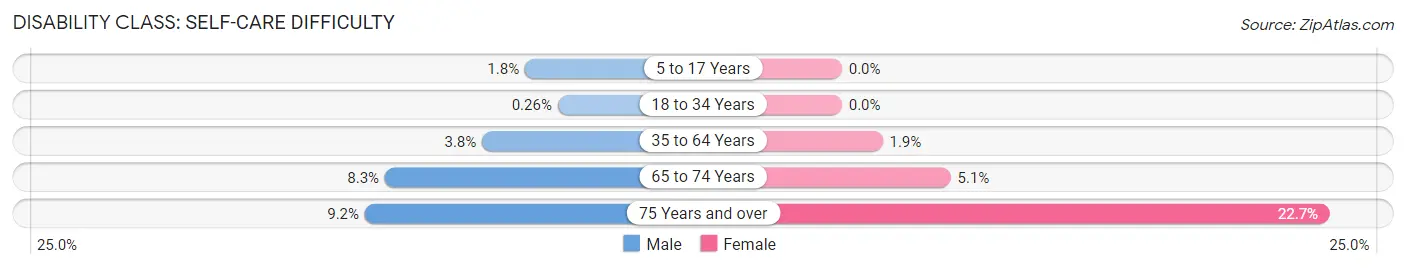
| Age Bracket | Male | Female |
| 5 to 17 Years | 19 (1.8%) | 0 (0.0%) |
| 18 to 34 Years | 3 (0.3%) | 0 (0.0%) |
| 35 to 64 Years | 67 (3.8%) | 32 (1.9%) |
| 65 to 74 Years | 39 (8.3%) | 22 (5.1%) |
| 75 Years and over | 22 (9.2%) | 70 (22.7%) |
Technology Access in Parmer County
Computing Device Access in Parmer County
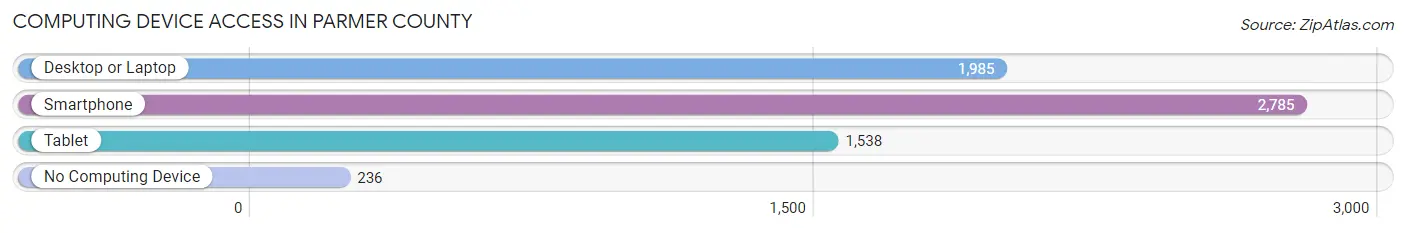
| Device Type | # Households | % Households |
| Desktop or Laptop | 1,985 | 62.0% |
| Smartphone | 2,785 | 87.0% |
| Tablet | 1,538 | 48.0% |
| No Computing Device | 236 | 7.4% |
| Total | 3,203 | 100.0% |
Internet Access in Parmer County
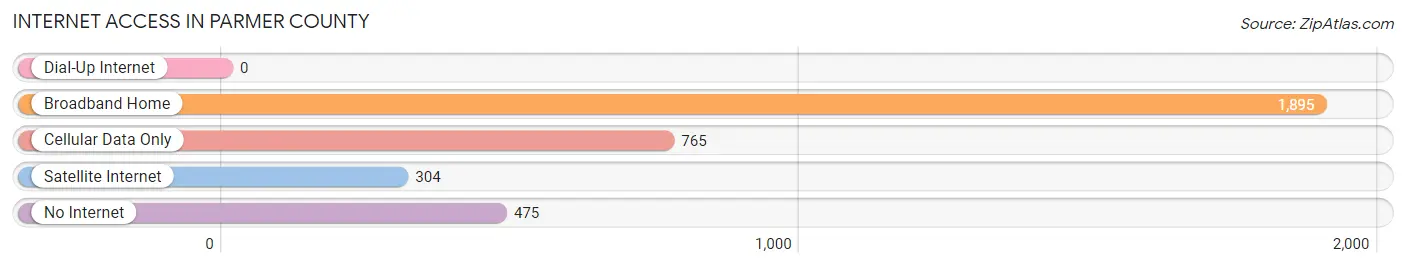
| Internet Type | # Households | % Households |
| Dial-Up Internet | 0 | 0.0% |
| Broadband Home | 1,895 | 59.2% |
| Cellular Data Only | 765 | 23.9% |
| Satellite Internet | 304 | 9.5% |
| No Internet | 475 | 14.8% |
| Total | 3,203 | 100.0% |
Parmer County Summary
Parmer County is located in the Texas Panhandle, in the northwestern corner of the state. It is bordered by Deaf Smith County to the north, Castro County to the east, Bailey County to the south, and New Mexico to the west. The county seat is Farwell, and the largest city is Friona. The county was named for Martin Parmer, a signer of the Texas Declaration of Independence.
Geography
Parmer County covers an area of 902 square miles, making it the second-smallest county in Texas. The terrain is mostly flat, with some rolling hills in the western part of the county. The county is drained by the Salt Fork of the Red River, which flows through the northern part of the county. The county is part of the High Plains region of Texas, and is mostly covered in grasslands.
Demographics
As of the 2010 census, the population of Parmer County was 10,269. The racial makeup of the county was 73.3% White, 0.7% African American, 0.7% Native American, 0.3% Asian, 0.1% Pacific Islander, 22.9% from other races, and 2.0% from two or more races. Hispanic or Latino of any race were 44.2% of the population.
Economy
Agriculture is the main economic activity in Parmer County. The county is home to a variety of crops, including cotton, corn, wheat, sorghum, and hay. Cattle and sheep are also raised in the county. The county is also home to several oil and gas fields, which provide jobs and revenue for the county.
History
Parmer County was created in 1876 from portions of Bexar and Young counties. The county was named for Martin Parmer, a signer of the Texas Declaration of Independence. The county seat was originally located in Friona, but was moved to Farwell in 1891.
In the early 1900s, the county experienced a population boom due to the discovery of oil and gas in the area. The population peaked in 1930, when it reached 12,845. Since then, the population has steadily declined, due to the decline of the oil and gas industry and the outmigration of people to other parts of the state.
Today, Parmer County is a rural county with a population of just over 10,000. Agriculture is still the main economic activity in the county, and the county is home to a variety of crops and livestock. The county is also home to several oil and gas fields, which provide jobs and revenue for the county.
Common Questions
What is Per Capita Income in Parmer County?
Per Capita income in Parmer County is $28,342.
What is the Median Family Income in Parmer County?
Median Family Income in Parmer County is $78,973.
What is the Median Household income in Parmer County?
Median Household Income in Parmer County is $65,575.
What is Income or Wage Gap in Parmer County?
Income or Wage Gap in Parmer County is 12.5%.
Women in Parmer County earn 87.5 cents for every dollar earned by a man.
What is Family Income Deficit in Parmer County?
Family Income Deficit in Parmer County is $7,503.
Families that are below poverty line in Parmer County earn $7,503 less on average than the poverty threshold level.
What is Inequality or Gini Index in Parmer County?
Inequality or Gini Index in Parmer County is 0.40.
What is the Total Population of Parmer County?
Total Population of Parmer County is 9,809.
What is the Total Male Population of Parmer County?
Total Male Population of Parmer County is 5,140.
What is the Total Female Population of Parmer County?
Total Female Population of Parmer County is 4,669.
What is the Ratio of Males per 100 Females in Parmer County?
There are 110.09 Males per 100 Females in Parmer County.
What is the Ratio of Females per 100 Males in Parmer County?
There are 90.84 Females per 100 Males in Parmer County.
What is the Median Population Age in Parmer County?
Median Population Age in Parmer County is 36.3 Years.
What is the Average Family Size in Parmer County
Average Family Size in Parmer County is 3.4 People.
What is the Average Household Size in Parmer County
Average Household Size in Parmer County is 3.0 People.
How Large is the Labor Force in Parmer County?
There are 4,829 People in the Labor Forcein in Parmer County.
What is the Percentage of People in the Labor Force in Parmer County?
65.1% of People are in the Labor Force in Parmer County.
What is the Unemployment Rate in Parmer County?
Unemployment Rate in Parmer County is 2.1%.