Panola County, TX Map & Demographics
Panola County Overview
$32,024
PER CAPITA INCOME
$81,143
AVG FAMILY INCOME
$58,205
AVG HOUSEHOLD INCOME
34.9%
WAGE / INCOME GAP [ % ]
65.1¢/ $1
WAGE / INCOME GAP [ $ ]
$13,274
FAMILY INCOME DEFICIT
0.49
INEQUALITY / GINI INDEX
22,540
TOTAL POPULATION
11,276
MALE POPULATION
11,264
FEMALE POPULATION
100.11
MALES / 100 FEMALES
99.89
FEMALES / 100 MALES
39.2
MEDIAN AGE
3.5
AVG FAMILY SIZE
2.7
AVG HOUSEHOLD SIZE
9,942
LABOR FORCE [ PEOPLE ]
55.6%
PERCENT IN LABOR FORCE
2.9%
UNEMPLOYMENT RATE
Income in Panola County
Income Overview in Panola County
Per Capita Income in Panola County is $32,024, while median incomes of families and households are $81,143 and $58,205 respectively.
| Characteristic | Number | Measure |
| Per Capita Income | 22,540 | $32,024 |
| Median Family Income | 5,391 | $81,143 |
| Mean Family Income | 5,391 | $98,822 |
| Median Household Income | 8,062 | $58,205 |
| Mean Household Income | 8,062 | $84,446 |
| Income Deficit | 5,391 | $13,274 |
| Wage / Income Gap (%) | 22,540 | 34.90% |
| Wage / Income Gap ($) | 22,540 | 65.10¢ per $1 |
| Gini / Inequality Index | 22,540 | 0.49 |
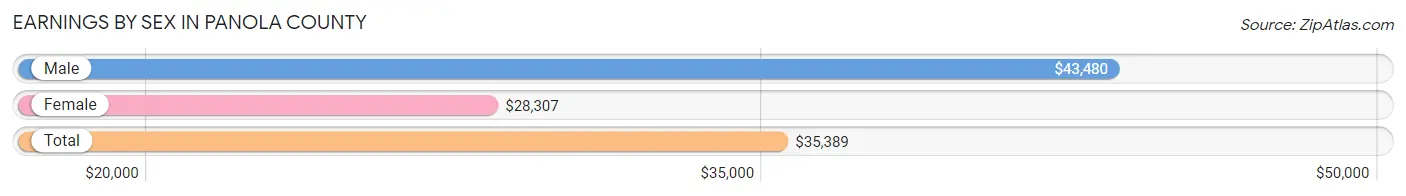
Earnings by Sex in Panola County
Average Earnings in Panola County are $35,389, $43,480 for men and $28,307 for women, a difference of 34.9%.
| Sex | Number | Average Earnings |
| Male | 5,645 (52.9%) | $43,480 |
| Female | 5,027 (47.1%) | $28,307 |
| Total | 10,672 (100.0%) | $35,389 |
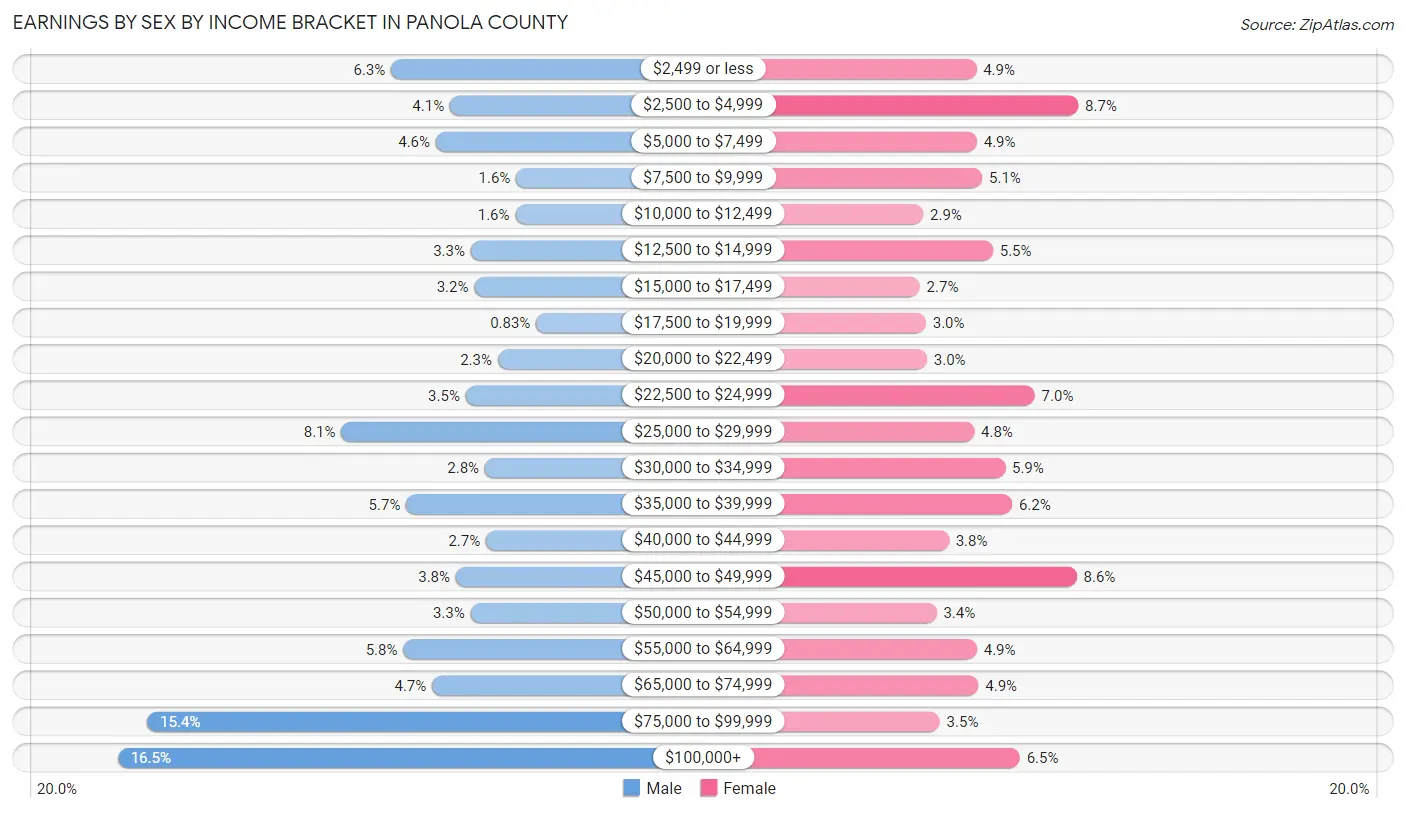
Earnings by Sex by Income Bracket in Panola County
The most common earnings brackets in Panola County are $100,000+ for men (932 | 16.5%) and $2,500 to $4,999 for women (436 | 8.7%).
| Income | Male | Female |
| $2,499 or less | 354 (6.3%) | 244 (4.9%) |
| $2,500 to $4,999 | 229 (4.1%) | 436 (8.7%) |
| $5,000 to $7,499 | 259 (4.6%) | 245 (4.9%) |
| $7,500 to $9,999 | 89 (1.6%) | 255 (5.1%) |
| $10,000 to $12,499 | 91 (1.6%) | 144 (2.9%) |
| $12,500 to $14,999 | 185 (3.3%) | 275 (5.5%) |
| $15,000 to $17,499 | 178 (3.2%) | 137 (2.7%) |
| $17,500 to $19,999 | 47 (0.8%) | 149 (3.0%) |
| $20,000 to $22,499 | 128 (2.3%) | 151 (3.0%) |
| $22,500 to $24,999 | 196 (3.5%) | 354 (7.0%) |
| $25,000 to $29,999 | 459 (8.1%) | 240 (4.8%) |
| $30,000 to $34,999 | 155 (2.8%) | 298 (5.9%) |
| $35,000 to $39,999 | 322 (5.7%) | 311 (6.2%) |
| $40,000 to $44,999 | 153 (2.7%) | 192 (3.8%) |
| $45,000 to $49,999 | 217 (3.8%) | 433 (8.6%) |
| $50,000 to $54,999 | 186 (3.3%) | 169 (3.4%) |
| $55,000 to $64,999 | 328 (5.8%) | 245 (4.9%) |
| $65,000 to $74,999 | 267 (4.7%) | 248 (4.9%) |
| $75,000 to $99,999 | 870 (15.4%) | 175 (3.5%) |
| $100,000+ | 932 (16.5%) | 326 (6.5%) |
| Total | 5,645 (100.0%) | 5,027 (100.0%) |
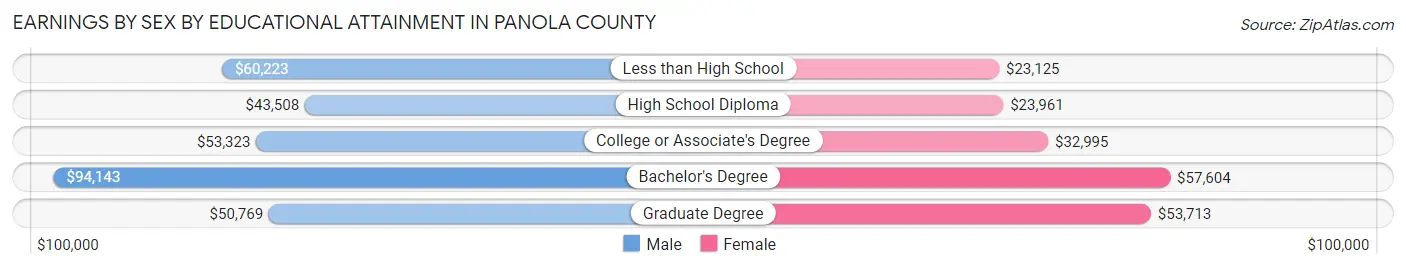
Earnings by Sex by Educational Attainment in Panola County
Average earnings in Panola County are $55,673 for men and $32,976 for women, a difference of 40.8%. Men with an educational attainment of bachelor's degree enjoy the highest average annual earnings of $94,143, while those with high school diploma education earn the least with $43,508. Women with an educational attainment of bachelor's degree earn the most with the average annual earnings of $57,604, while those with less than high school education have the smallest earnings of $23,125.
| Educational Attainment | Male Income | Female Income |
| Less than High School | $60,223 | $23,125 |
| High School Diploma | $43,508 | $23,961 |
| College or Associate's Degree | $53,323 | $32,995 |
| Bachelor's Degree | $94,143 | $57,604 |
| Graduate Degree | $50,769 | $53,713 |
| Total | $55,673 | $32,976 |
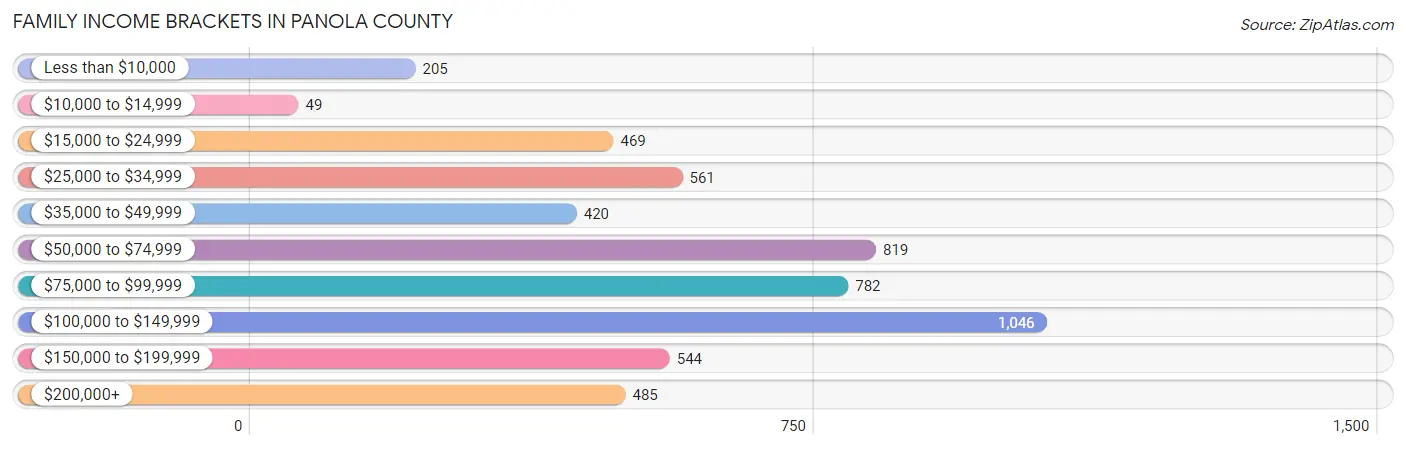
Family Income in Panola County
Family Income Brackets in Panola County
According to the Panola County family income data, there are 1,046 families falling into the $100,000 to $149,999 income range, which is the most common income bracket and makes up 19.4% of all families. Conversely, the $10,000 to $14,999 income bracket is the least frequent group with only 49 families (0.9%) belonging to this category.
| Income Bracket | # Families | % Families |
| Less than $10,000 | 205 | 3.8% |
| $10,000 to $14,999 | 49 | 0.9% |
| $15,000 to $24,999 | 469 | 8.7% |
| $25,000 to $34,999 | 561 | 10.4% |
| $35,000 to $49,999 | 420 | 7.8% |
| $50,000 to $74,999 | 819 | 15.2% |
| $75,000 to $99,999 | 782 | 14.5% |
| $100,000 to $149,999 | 1,046 | 19.4% |
| $150,000 to $199,999 | 544 | 10.1% |
| $200,000+ | 485 | 9.0% |
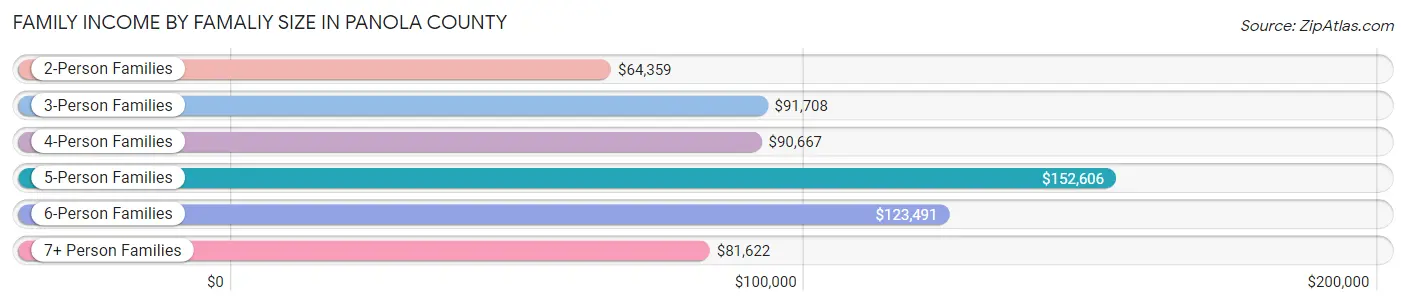
Family Income by Famaliy Size in Panola County
5-person families (342 | 6.3%) account for the highest median family income in Panola County with $152,606 per family, while 2-person families (2,640 | 49.0%) have the highest median income of $32,180 per family member.
| Income Bracket | # Families | Median Income |
| 2-Person Families | 2,640 (49.0%) | $64,359 |
| 3-Person Families | 953 (17.7%) | $91,708 |
| 4-Person Families | 964 (17.9%) | $90,667 |
| 5-Person Families | 342 (6.3%) | $152,606 |
| 6-Person Families | 297 (5.5%) | $123,491 |
| 7+ Person Families | 195 (3.6%) | $81,622 |
| Total | 5,391 (100.0%) | $81,143 |
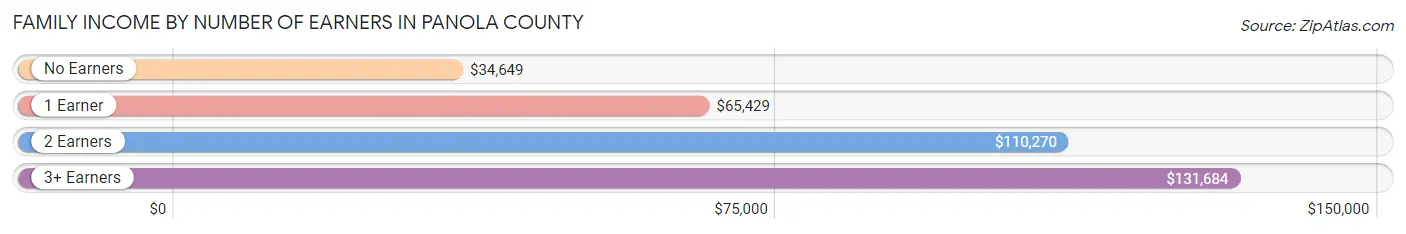
Family Income by Number of Earners in Panola County
The median family income in Panola County is $81,143, with families comprising 3+ earners (658) having the highest median family income of $131,684, while families with no earners (965) have the lowest median family income of $34,649, accounting for 12.2% and 17.9% of families, respectively.
| Number of Earners | # Families | Median Income |
| No Earners | 965 (17.9%) | $34,649 |
| 1 Earner | 1,872 (34.7%) | $65,429 |
| 2 Earners | 1,896 (35.2%) | $110,270 |
| 3+ Earners | 658 (12.2%) | $131,684 |
| Total | 5,391 (100.0%) | $81,143 |
Household Income in Panola County
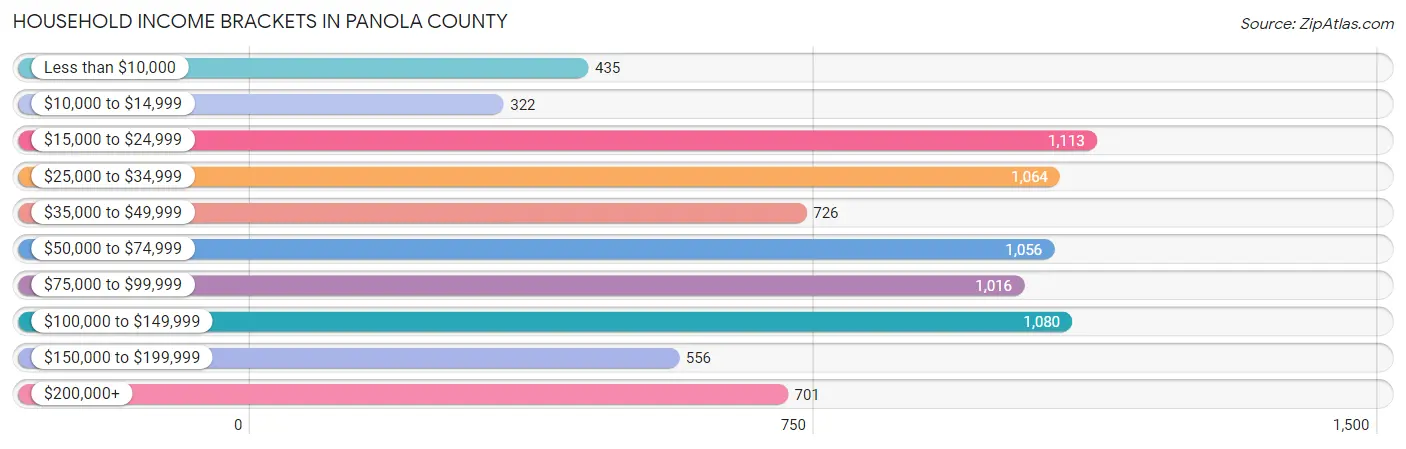
Household Income Brackets in Panola County
With 1,113 households falling in the category, the $15,000 to $24,999 income range is the most frequent in Panola County, accounting for 13.8% of all households. In contrast, only 322 households (4.0%) fall into the $10,000 to $14,999 income bracket, making it the least populous group.
| Income Bracket | # Households | % Households |
| Less than $10,000 | 435 | 5.4% |
| $10,000 to $14,999 | 322 | 4.0% |
| $15,000 to $24,999 | 1,113 | 13.8% |
| $25,000 to $34,999 | 1,064 | 13.2% |
| $35,000 to $49,999 | 726 | 9.0% |
| $50,000 to $74,999 | 1,056 | 13.1% |
| $75,000 to $99,999 | 1,016 | 12.6% |
| $100,000 to $149,999 | 1,080 | 13.4% |
| $150,000 to $199,999 | 556 | 6.9% |
| $200,000+ | 701 | 8.7% |
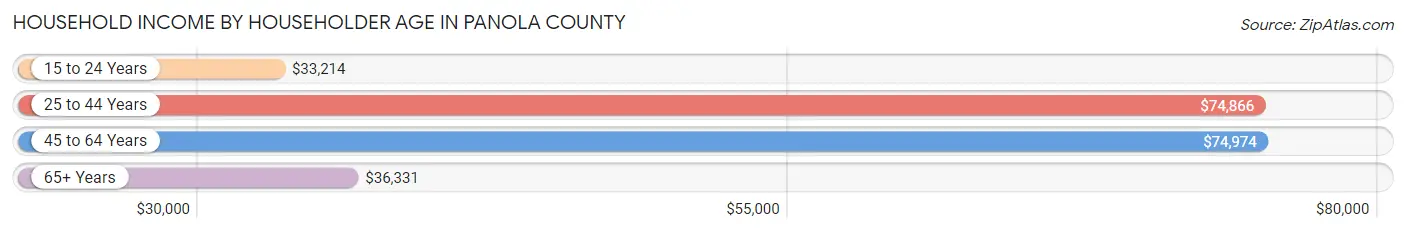
Household Income by Householder Age in Panola County
The median household income in Panola County is $58,205, with the highest median household income of $74,974 found in the 45 to 64 years age bracket for the primary householder. A total of 3,097 households (38.4%) fall into this category. Meanwhile, the 15 to 24 years age bracket for the primary householder has the lowest median household income of $33,214, with 178 households (2.2%) in this group.
| Income Bracket | # Households | Median Income |
| 15 to 24 Years | 178 (2.2%) | $33,214 |
| 25 to 44 Years | 2,061 (25.6%) | $74,866 |
| 45 to 64 Years | 3,097 (38.4%) | $74,974 |
| 65+ Years | 2,726 (33.8%) | $36,331 |
| Total | 8,062 (100.0%) | $58,205 |
Poverty in Panola County
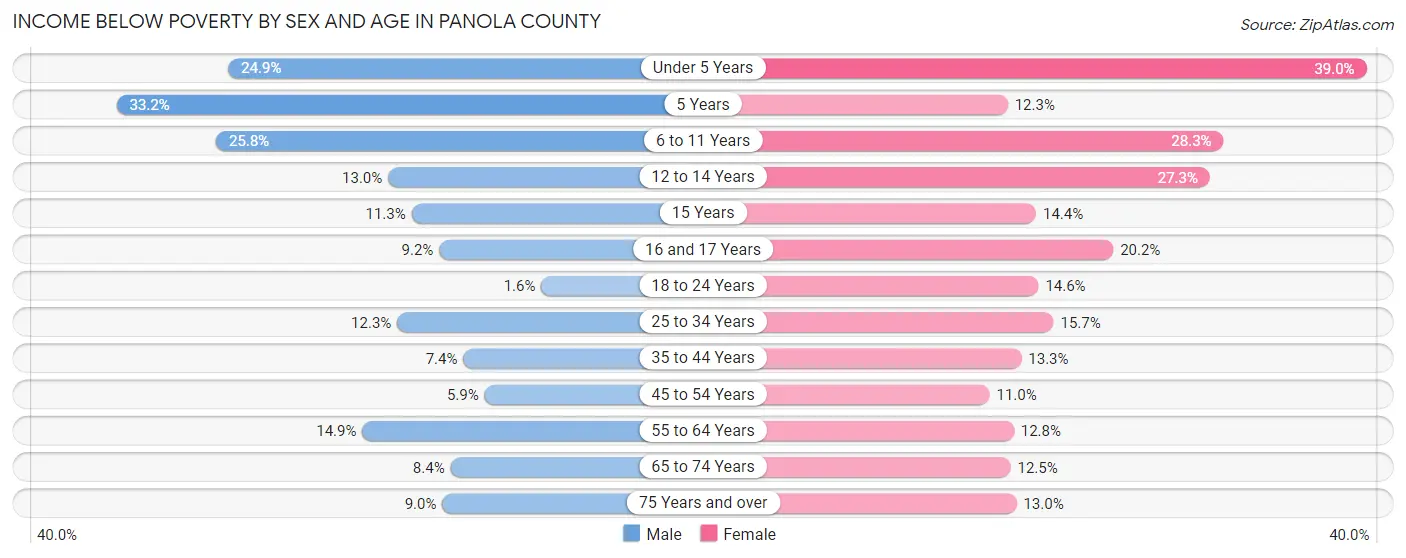
Income Below Poverty by Sex and Age in Panola County
With 11.6% poverty level for males and 16.3% for females among the residents of Panola County, 5 year old males and under 5 year old females are the most vulnerable to poverty, with 70 males (33.2%) and 215 females (39.0%) in their respective age groups living below the poverty level.
| Age Bracket | Male | Female |
| Under 5 Years | 165 (24.9%) | 215 (39.0%) |
| 5 Years | 70 (33.2%) | 25 (12.3%) |
| 6 to 11 Years | 179 (25.8%) | 232 (28.3%) |
| 12 to 14 Years | 77 (13.0%) | 112 (27.3%) |
| 15 Years | 23 (11.3%) | 31 (14.4%) |
| 16 and 17 Years | 26 (9.2%) | 55 (20.2%) |
| 18 to 24 Years | 16 (1.6%) | 125 (14.6%) |
| 25 to 34 Years | 163 (12.3%) | 205 (15.7%) |
| 35 to 44 Years | 90 (7.4%) | 159 (13.3%) |
| 45 to 54 Years | 78 (5.9%) | 146 (11.0%) |
| 55 to 64 Years | 217 (14.9%) | 192 (12.8%) |
| 65 to 74 Years | 110 (8.4%) | 173 (12.5%) |
| 75 Years and over | 70 (9.0%) | 124 (13.0%) |
| Total | 1,284 (11.6%) | 1,794 (16.3%) |
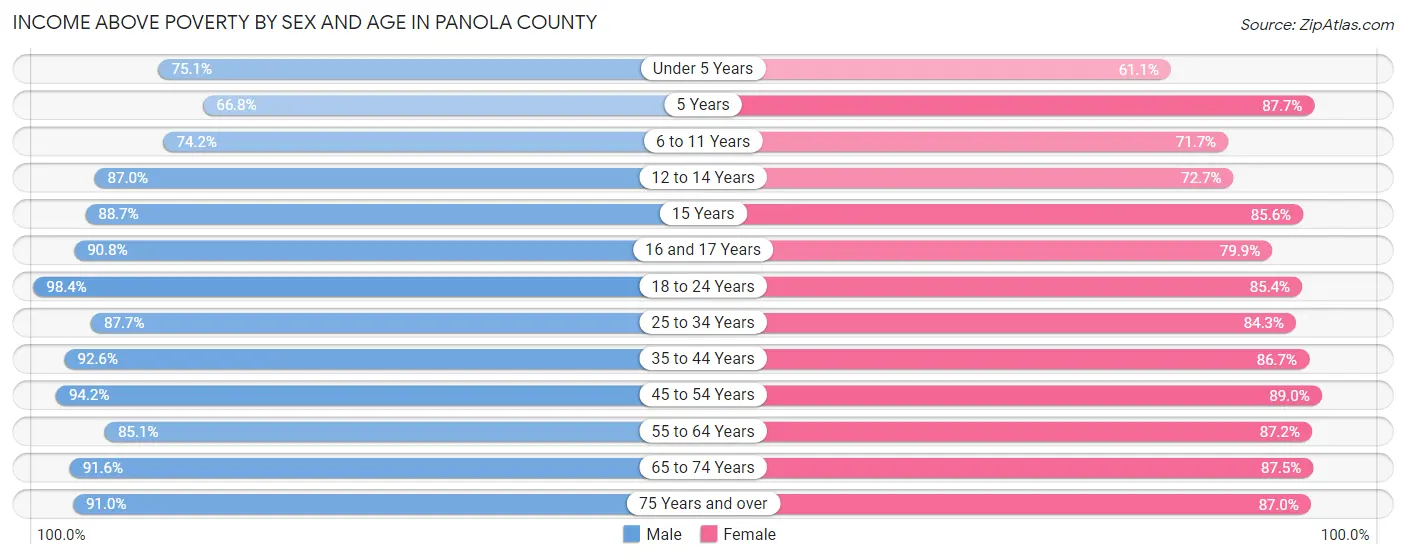
Income Above Poverty by Sex and Age in Panola County
According to the poverty statistics in Panola County, males aged 18 to 24 years and females aged 45 to 54 years are the age groups that are most secure financially, with 98.4% of males and 89.0% of females in these age groups living above the poverty line.
| Age Bracket | Male | Female |
| Under 5 Years | 498 (75.1%) | 337 (61.1%) |
| 5 Years | 141 (66.8%) | 178 (87.7%) |
| 6 to 11 Years | 515 (74.2%) | 587 (71.7%) |
| 12 to 14 Years | 515 (87.0%) | 298 (72.7%) |
| 15 Years | 181 (88.7%) | 184 (85.6%) |
| 16 and 17 Years | 256 (90.8%) | 218 (79.8%) |
| 18 to 24 Years | 960 (98.4%) | 731 (85.4%) |
| 25 to 34 Years | 1,158 (87.7%) | 1,099 (84.3%) |
| 35 to 44 Years | 1,122 (92.6%) | 1,034 (86.7%) |
| 45 to 54 Years | 1,255 (94.2%) | 1,185 (89.0%) |
| 55 to 64 Years | 1,236 (85.1%) | 1,312 (87.2%) |
| 65 to 74 Years | 1,203 (91.6%) | 1,208 (87.5%) |
| 75 Years and over | 709 (91.0%) | 832 (87.0%) |
| Total | 9,749 (88.4%) | 9,203 (83.7%) |
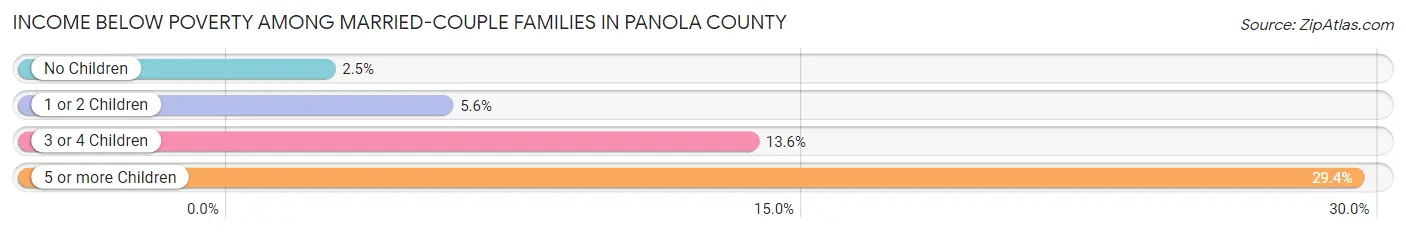
Income Below Poverty Among Married-Couple Families in Panola County
The poverty statistics for married-couple families in Panola County show that 4.9% or 205 of the total 4,184 families live below the poverty line. Families with 5 or more children have the highest poverty rate of 29.4%, comprising of 5 families. On the other hand, families with no children have the lowest poverty rate of 2.5%, which includes 61 families.
| Children | Above Poverty | Below Poverty |
| No Children | 2,342 (97.5%) | 61 (2.5%) |
| 1 or 2 Children | 1,193 (94.4%) | 71 (5.6%) |
| 3 or 4 Children | 432 (86.4%) | 68 (13.6%) |
| 5 or more Children | 12 (70.6%) | 5 (29.4%) |
| Total | 3,979 (95.1%) | 205 (4.9%) |
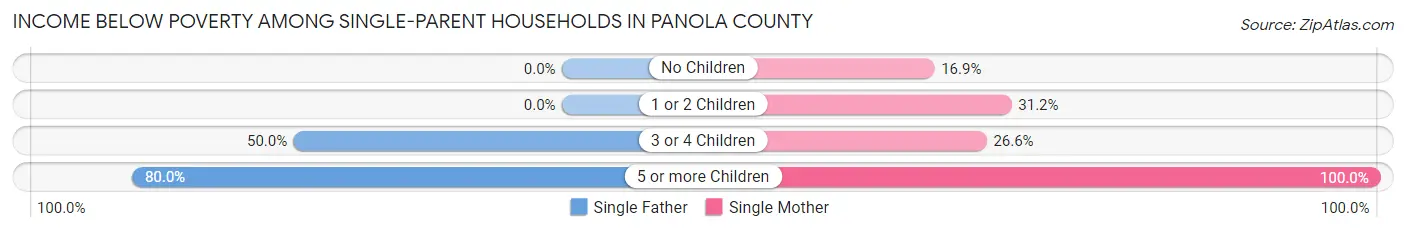
Income Below Poverty Among Single-Parent Households in Panola County
According to the poverty data in Panola County, 11.3% or 27 single-father households and 27.2% or 263 single-mother households are living below the poverty line. Among single-father households, those with 5 or more children have the highest poverty rate, with 20 households (80.0%) experiencing poverty. Likewise, among single-mother households, those with 5 or more children have the highest poverty rate, with 7 households (100.0%) falling below the poverty line.
| Children | Single Father | Single Mother |
| No Children | 0 (0.0%) | 42 (16.9%) |
| 1 or 2 Children | 0 (0.0%) | 168 (31.2%) |
| 3 or 4 Children | 7 (50.0%) | 46 (26.6%) |
| 5 or more Children | 20 (80.0%) | 7 (100.0%) |
| Total | 27 (11.3%) | 263 (27.2%) |
Income Below Poverty Among Married-Couple vs Single-Parent Households in Panola County
The poverty data for Panola County shows that 205 of the married-couple family households (4.9%) and 290 of the single-parent households (24.0%) are living below the poverty level. Within the married-couple family households, those with 5 or more children have the highest poverty rate, with 5 households (29.4%) falling below the poverty line. Among the single-parent households, those with 5 or more children have the highest poverty rate, with 27 household (84.4%) living below poverty.
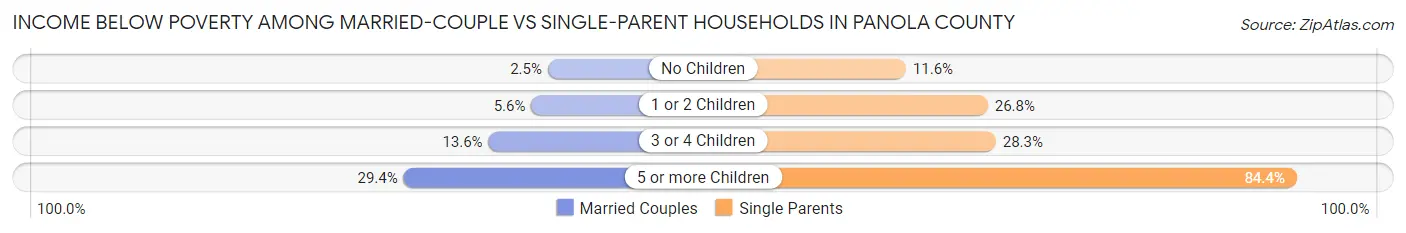
| Children | Married-Couple Families | Single-Parent Households |
| No Children | 61 (2.5%) | 42 (11.6%) |
| 1 or 2 Children | 71 (5.6%) | 168 (26.8%) |
| 3 or 4 Children | 68 (13.6%) | 53 (28.3%) |
| 5 or more Children | 5 (29.4%) | 27 (84.4%) |
| Total | 205 (4.9%) | 290 (24.0%) |
Race in Panola County
The most populous races in Panola County are White / Caucasian (17,138 | 76.0%), Black / African American (2,829 | 12.6%), and Two or more Races (2,153 | 9.6%).
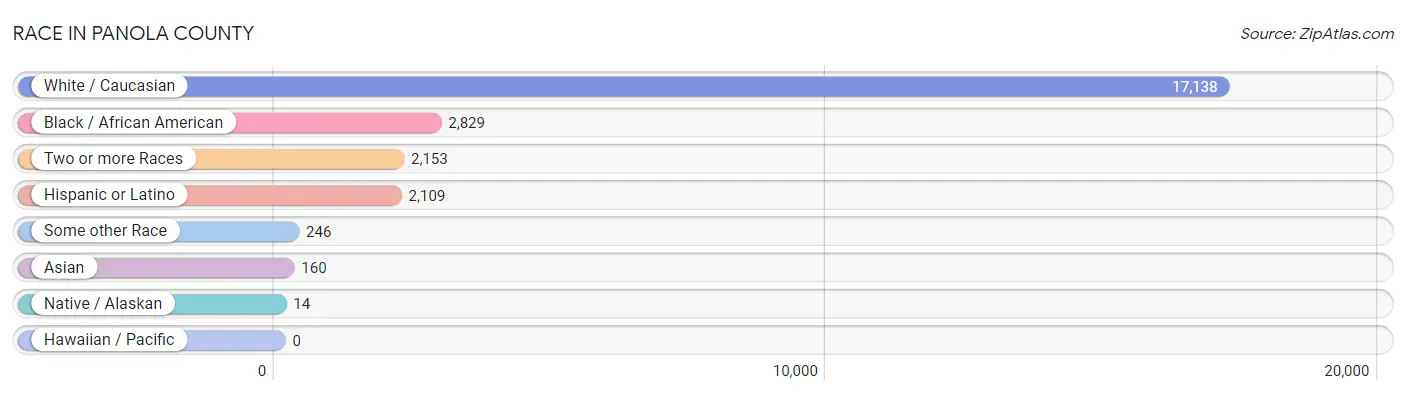
| Race | # Population | % Population |
| Asian | 160 | 0.7% |
| Black / African American | 2,829 | 12.6% |
| Hawaiian / Pacific | 0 | 0.0% |
| Hispanic or Latino | 2,109 | 9.4% |
| Native / Alaskan | 14 | 0.1% |
| White / Caucasian | 17,138 | 76.0% |
| Two or more Races | 2,153 | 9.6% |
| Some other Race | 246 | 1.1% |
| Total | 22,540 | 100.0% |
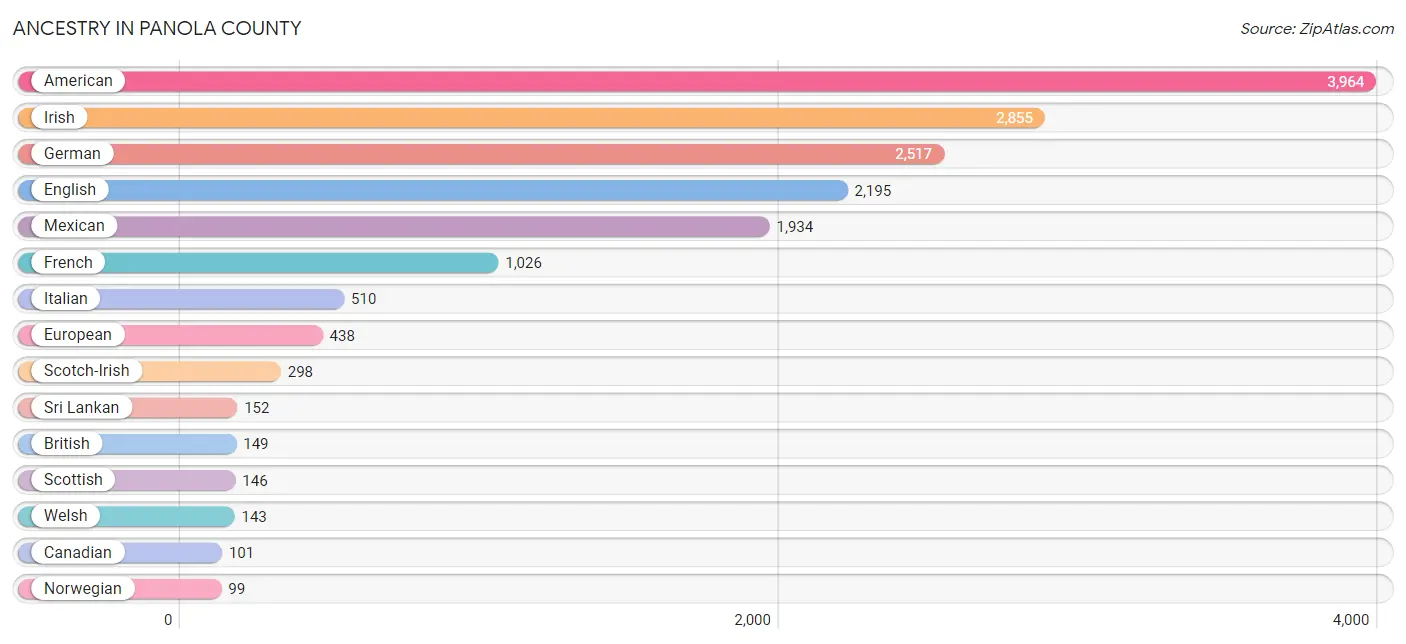
Ancestry in Panola County
The most populous ancestries reported in Panola County are American (3,964 | 17.6%), Irish (2,855 | 12.7%), German (2,517 | 11.2%), English (2,195 | 9.7%), and Mexican (1,934 | 8.6%), together accounting for 59.8% of all Panola County residents.
| Ancestry | # Population | % Population |
| African | 19 | 0.1% |
| Aleut | 2 | 0.0% |
| American | 3,964 | 17.6% |
| Brazilian | 5 | 0.0% |
| British | 149 | 0.7% |
| Burmese | 42 | 0.2% |
| Cajun | 18 | 0.1% |
| Canadian | 101 | 0.4% |
| Central American | 50 | 0.2% |
| Cherokee | 88 | 0.4% |
| Czech | 50 | 0.2% |
| Czechoslovakian | 3 | 0.0% |
| Dutch | 85 | 0.4% |
| Eastern European | 14 | 0.1% |
| Ecuadorian | 14 | 0.1% |
| English | 2,195 | 9.7% |
| European | 438 | 1.9% |
| French | 1,026 | 4.5% |
| French Canadian | 19 | 0.1% |
| German | 2,517 | 11.2% |
| Greek | 4 | 0.0% |
| Honduran | 49 | 0.2% |
| Indian (Asian) | 3 | 0.0% |
| Iranian | 44 | 0.2% |
| Irish | 2,855 | 12.7% |
| Italian | 510 | 2.3% |
| Japanese | 33 | 0.2% |
| Korean | 48 | 0.2% |
| Mexican | 1,934 | 8.6% |
| Native Hawaiian | 15 | 0.1% |
| Nigerian | 5 | 0.0% |
| Northern European | 46 | 0.2% |
| Norwegian | 99 | 0.4% |
| Polish | 49 | 0.2% |
| Portuguese | 15 | 0.1% |
| Salvadoran | 1 | 0.0% |
| Scandinavian | 49 | 0.2% |
| Scotch-Irish | 298 | 1.3% |
| Scottish | 146 | 0.6% |
| Senegalese | 9 | 0.0% |
| Slavic | 7 | 0.0% |
| South American | 14 | 0.1% |
| Spanish | 95 | 0.4% |
| Sri Lankan | 152 | 0.7% |
| Subsaharan African | 33 | 0.2% |
| Swedish | 36 | 0.2% |
| Swiss | 11 | 0.1% |
| Thai | 10 | 0.0% |
| Welsh | 143 | 0.6% | View All 49 Rows |
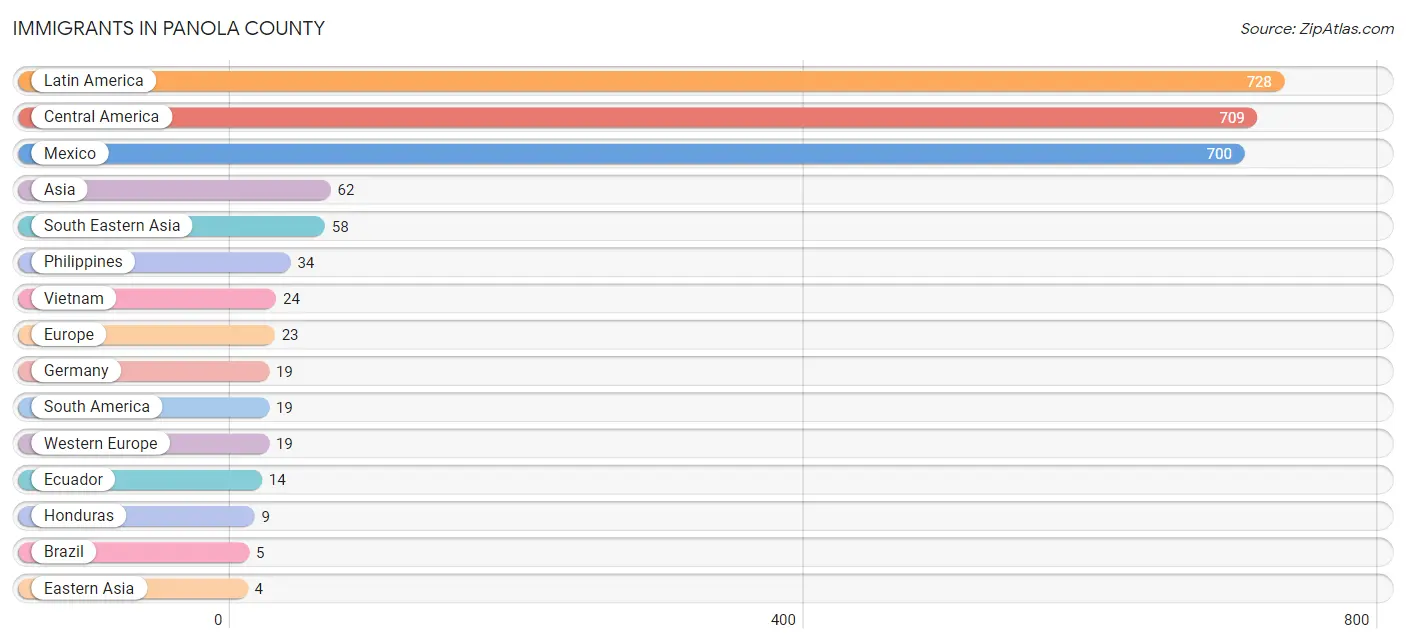
Immigrants in Panola County
The most numerous immigrant groups reported in Panola County came from Latin America (728 | 3.2%), Central America (709 | 3.2%), Mexico (700 | 3.1%), Asia (62 | 0.3%), and South Eastern Asia (58 | 0.3%), together accounting for 10.0% of all Panola County residents.
| Immigration Origin | # Population | % Population |
| Asia | 62 | 0.3% |
| Brazil | 5 | 0.0% |
| Central America | 709 | 3.2% |
| Eastern Asia | 4 | 0.0% |
| Ecuador | 14 | 0.1% |
| Europe | 23 | 0.1% |
| Germany | 19 | 0.1% |
| Honduras | 9 | 0.0% |
| Korea | 4 | 0.0% |
| Latin America | 728 | 3.2% |
| Mexico | 700 | 3.1% |
| Northern Europe | 4 | 0.0% |
| Philippines | 34 | 0.2% |
| Scotland | 4 | 0.0% |
| South America | 19 | 0.1% |
| South Eastern Asia | 58 | 0.3% |
| Vietnam | 24 | 0.1% |
| Western Europe | 19 | 0.1% | View All 18 Rows |
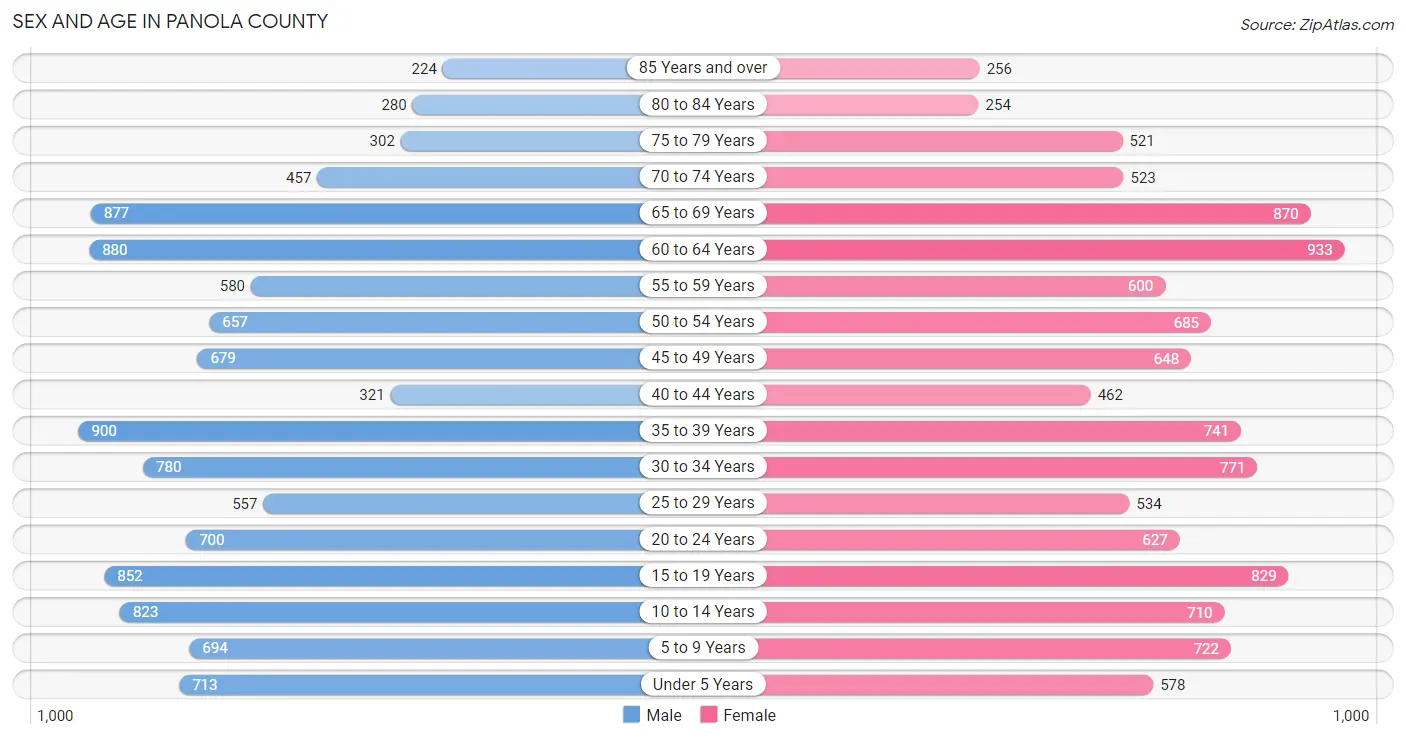
Sex and Age in Panola County
Sex and Age in Panola County
The most populous age groups in Panola County are 35 to 39 Years (900 | 8.0%) for men and 60 to 64 Years (933 | 8.3%) for women.
| Age Bracket | Male | Female |
| Under 5 Years | 713 (6.3%) | 578 (5.1%) |
| 5 to 9 Years | 694 (6.1%) | 722 (6.4%) |
| 10 to 14 Years | 823 (7.3%) | 710 (6.3%) |
| 15 to 19 Years | 852 (7.6%) | 829 (7.4%) |
| 20 to 24 Years | 700 (6.2%) | 627 (5.6%) |
| 25 to 29 Years | 557 (4.9%) | 534 (4.7%) |
| 30 to 34 Years | 780 (6.9%) | 771 (6.8%) |
| 35 to 39 Years | 900 (8.0%) | 741 (6.6%) |
| 40 to 44 Years | 321 (2.9%) | 462 (4.1%) |
| 45 to 49 Years | 679 (6.0%) | 648 (5.8%) |
| 50 to 54 Years | 657 (5.8%) | 685 (6.1%) |
| 55 to 59 Years | 580 (5.1%) | 600 (5.3%) |
| 60 to 64 Years | 880 (7.8%) | 933 (8.3%) |
| 65 to 69 Years | 877 (7.8%) | 870 (7.7%) |
| 70 to 74 Years | 457 (4.1%) | 523 (4.6%) |
| 75 to 79 Years | 302 (2.7%) | 521 (4.6%) |
| 80 to 84 Years | 280 (2.5%) | 254 (2.2%) |
| 85 Years and over | 224 (2.0%) | 256 (2.3%) |
| Total | 11,276 (100.0%) | 11,264 (100.0%) |
Families and Households in Panola County
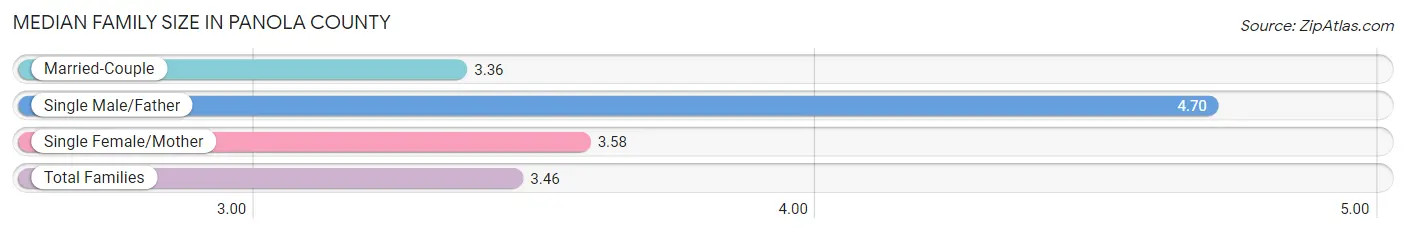
Median Family Size in Panola County
The median family size in Panola County is 3.46 persons per family, with single male/father families (240 | 4.4%) accounting for the largest median family size of 4.7 persons per family. On the other hand, married-couple families (4,184 | 77.6%) represent the smallest median family size with 3.36 persons per family.
| Family Type | # Families | Family Size |
| Married-Couple | 4,184 (77.6%) | 3.36 |
| Single Male/Father | 240 (4.4%) | 4.70 |
| Single Female/Mother | 967 (17.9%) | 3.58 |
| Total Families | 5,391 (100.0%) | 3.46 |
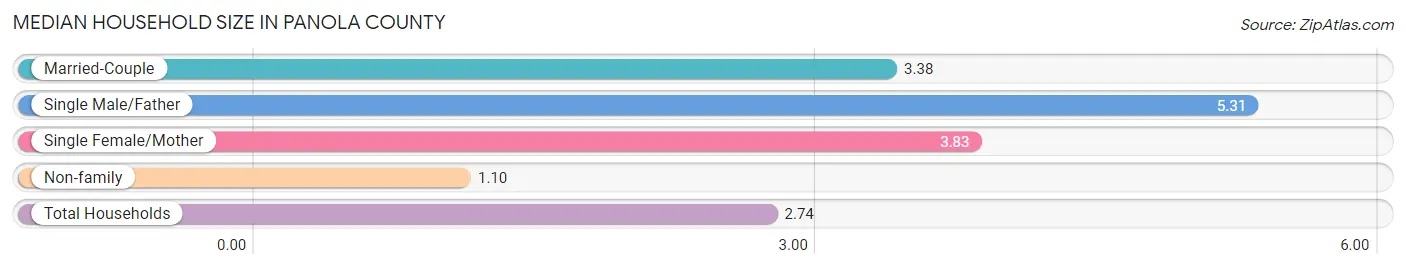
Median Household Size in Panola County
The median household size in Panola County is 2.74 persons per household, with single male/father households (240 | 3.0%) accounting for the largest median household size of 5.31 persons per household. non-family households (2,671 | 33.1%) represent the smallest median household size with 1.10 persons per household.
| Household Type | # Households | Household Size |
| Married-Couple | 4,184 (51.9%) | 3.38 |
| Single Male/Father | 240 (3.0%) | 5.31 |
| Single Female/Mother | 967 (12.0%) | 3.83 |
| Non-family | 2,671 (33.1%) | 1.10 |
| Total Households | 8,062 (100.0%) | 2.74 |
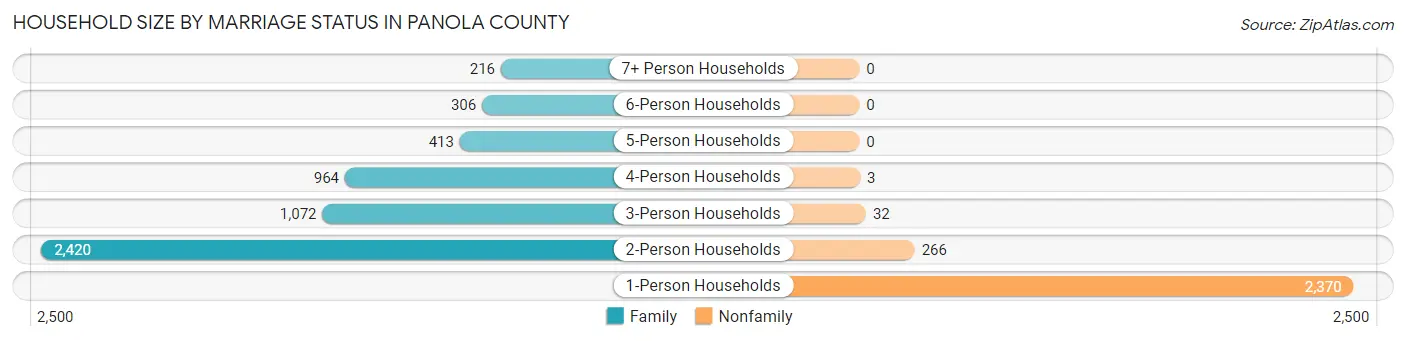
Household Size by Marriage Status in Panola County
Out of a total of 8,062 households in Panola County, 5,391 (66.9%) are family households, while 2,671 (33.1%) are nonfamily households. The most numerous type of family households are 2-person households, comprising 2,420, and the most common type of nonfamily households are 1-person households, comprising 2,370.
| Household Size | Family Households | Nonfamily Households |
| 1-Person Households | - | 2,370 (29.4%) |
| 2-Person Households | 2,420 (30.0%) | 266 (3.3%) |
| 3-Person Households | 1,072 (13.3%) | 32 (0.4%) |
| 4-Person Households | 964 (12.0%) | 3 (0.0%) |
| 5-Person Households | 413 (5.1%) | 0 (0.0%) |
| 6-Person Households | 306 (3.8%) | 0 (0.0%) |
| 7+ Person Households | 216 (2.7%) | 0 (0.0%) |
| Total | 5,391 (66.9%) | 2,671 (33.1%) |
Female Fertility in Panola County
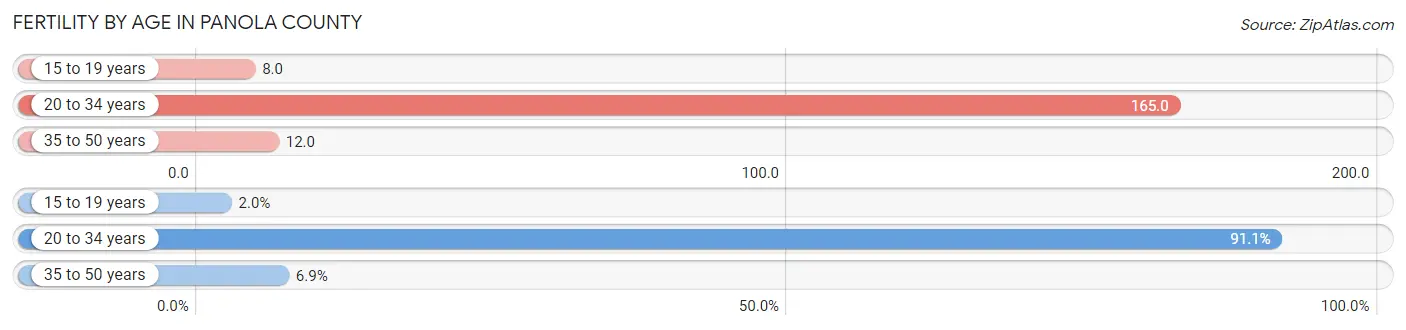
Fertility by Age in Panola County
Average fertility rate in Panola County is 73.0 births per 1,000 women. Women in the age bracket of 20 to 34 years have the highest fertility rate with 165.0 births per 1,000 women. Women in the age bracket of 20 to 34 years acount for 91.1% of all women with births.
| Age Bracket | Women with Births | Births / 1,000 Women |
| 15 to 19 years | 7 (2.0%) | 8.0 |
| 20 to 34 years | 319 (91.1%) | 165.0 |
| 35 to 50 years | 24 (6.9%) | 12.0 |
| Total | 350 (100.0%) | 73.0 |
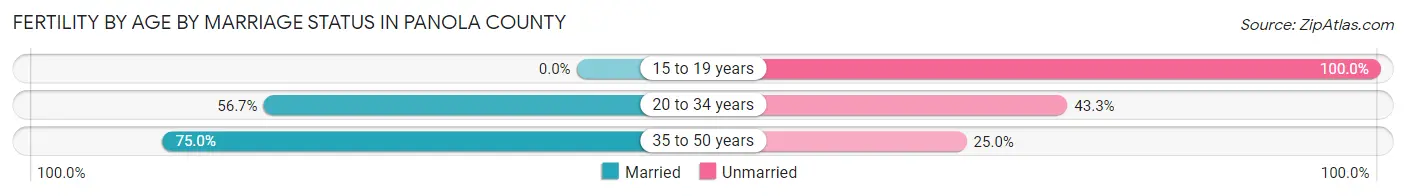
Fertility by Age by Marriage Status in Panola County
56.9% of women with births (350) in Panola County are married. The highest percentage of unmarried women with births falls into 15 to 19 years age bracket with 100.0% of them unmarried at the time of birth, while the lowest percentage of unmarried women with births belong to 35 to 50 years age bracket with 25.0% of them unmarried.
| Age Bracket | Married | Unmarried |
| 15 to 19 years | 0 (0.0%) | 7 (100.0%) |
| 20 to 34 years | 181 (56.7%) | 138 (43.3%) |
| 35 to 50 years | 18 (75.0%) | 6 (25.0%) |
| Total | 199 (56.9%) | 151 (43.1%) |
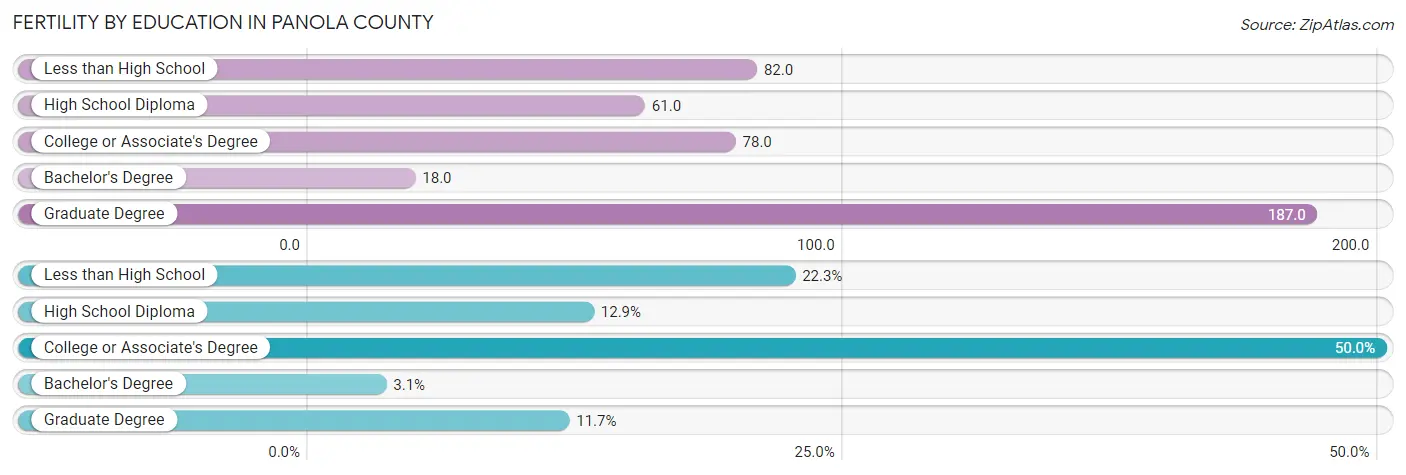
Fertility by Education in Panola County
Average fertility rate in Panola County is 73.0 births per 1,000 women. Women with the education attainment of graduate degree have the highest fertility rate of 187.0 births per 1,000 women, while women with the education attainment of bachelor's degree have the lowest fertility at 18.0 births per 1,000 women. Women with the education attainment of college or associate's degree represent 50.0% of all women with births.
| Educational Attainment | Women with Births | Births / 1,000 Women |
| Less than High School | 78 (22.3%) | 82.0 |
| High School Diploma | 45 (12.9%) | 61.0 |
| College or Associate's Degree | 175 (50.0%) | 78.0 |
| Bachelor's Degree | 11 (3.1%) | 18.0 |
| Graduate Degree | 41 (11.7%) | 187.0 |
| Total | 350 (100.0%) | 73.0 |
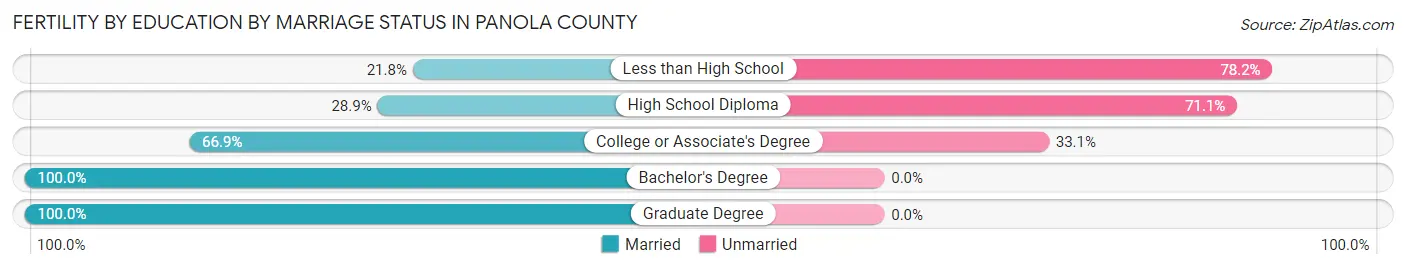
Fertility by Education by Marriage Status in Panola County
43.1% of women with births in Panola County are unmarried. Women with the educational attainment of bachelor's degree are most likely to be married with 100.0% of them married at childbirth, while women with the educational attainment of less than high school are least likely to be married with 78.2% of them unmarried at childbirth.
| Educational Attainment | Married | Unmarried |
| Less than High School | 17 (21.8%) | 61 (78.2%) |
| High School Diploma | 13 (28.9%) | 32 (71.1%) |
| College or Associate's Degree | 117 (66.9%) | 58 (33.1%) |
| Bachelor's Degree | 11 (100.0%) | 0 (0.0%) |
| Graduate Degree | 41 (100.0%) | 0 (0.0%) |
| Total | 199 (56.9%) | 151 (43.1%) |
Employment Characteristics in Panola County
Employment by Class of Employer in Panola County
Among the 9,529 employed individuals in Panola County, private company employees (6,626 | 69.5%), self-employed (not incorporated) (769 | 8.1%), and local government employees (688 | 7.2%) make up the most common classes of employment.
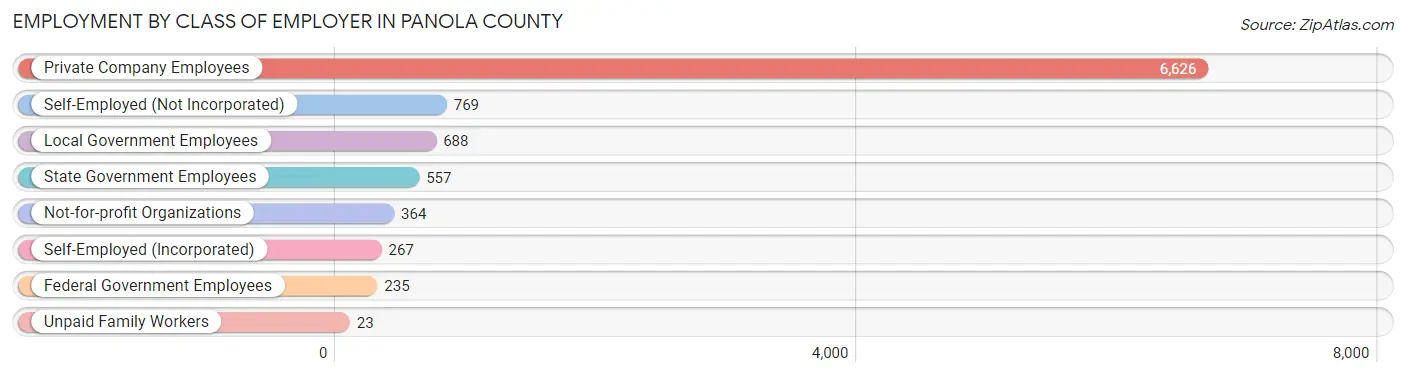
| Employer Class | # Employees | % Employees |
| Private Company Employees | 6,626 | 69.5% |
| Self-Employed (Incorporated) | 267 | 2.8% |
| Self-Employed (Not Incorporated) | 769 | 8.1% |
| Not-for-profit Organizations | 364 | 3.8% |
| Local Government Employees | 688 | 7.2% |
| State Government Employees | 557 | 5.9% |
| Federal Government Employees | 235 | 2.5% |
| Unpaid Family Workers | 23 | 0.2% |
| Total | 9,529 | 100.0% |
Employment Status by Age in Panola County
According to the labor force statistics for Panola County, out of the total population over 16 years of age (17,881), 55.6% or 9,942 individuals are in the labor force, with 2.9% or 288 of them unemployed. The age group with the highest labor force participation rate is 30 to 34 years, with 84.0% or 1,303 individuals in the labor force. Within the labor force, the 30 to 34 years age range has the highest percentage of unemployed individuals, with 9.0% or 117 of them being unemployed.
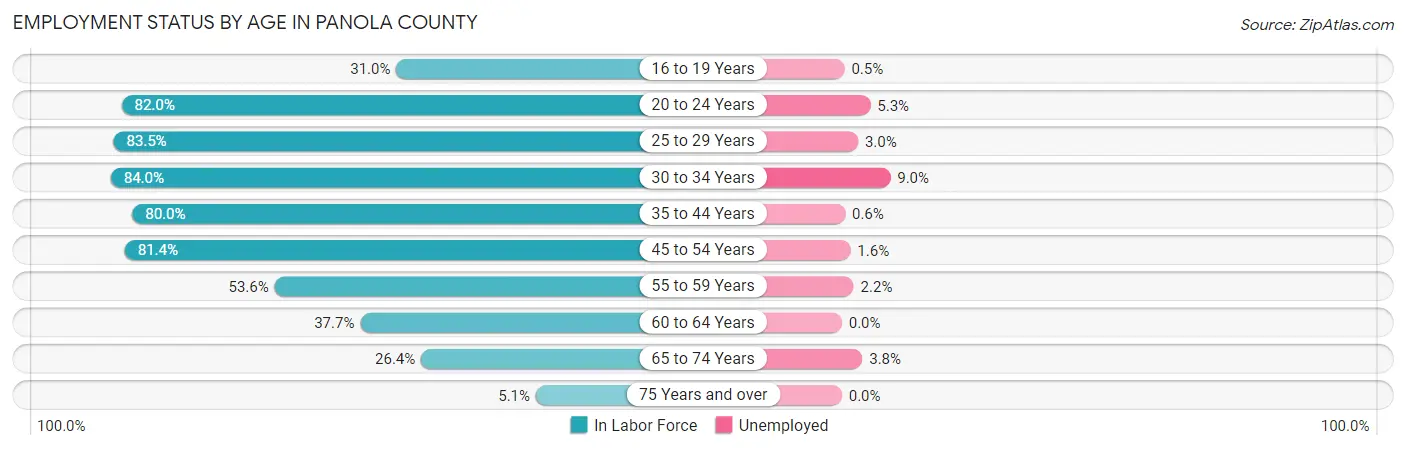
| Age Bracket | In Labor Force | Unemployed |
| 16 to 19 Years | 391 (31.0%) | 2 (0.5%) |
| 20 to 24 Years | 1,088 (82.0%) | 58 (5.3%) |
| 25 to 29 Years | 911 (83.5%) | 27 (3.0%) |
| 30 to 34 Years | 1,303 (84.0%) | 117 (9.0%) |
| 35 to 44 Years | 1,939 (80.0%) | 12 (0.6%) |
| 45 to 54 Years | 2,173 (81.4%) | 35 (1.6%) |
| 55 to 59 Years | 632 (53.6%) | 14 (2.2%) |
| 60 to 64 Years | 684 (37.7%) | 0 (0.0%) |
| 65 to 74 Years | 720 (26.4%) | 27 (3.8%) |
| 75 Years and over | 94 (5.1%) | 0 (0.0%) |
| Total | 9,942 (55.6%) | 288 (2.9%) |
Employment Status by Educational Attainment in Panola County
According to labor force statistics for Panola County, 71.2% of individuals (7,638) out of the total population between 25 and 64 years of age (10,728) are in the labor force, with 2.7% or 206 of them being unemployed. The group with the highest labor force participation rate are those with the educational attainment of bachelor's degree or higher, with 87.0% or 1,583 individuals in the labor force. Within the labor force, individuals with high school diploma education have the highest percentage of unemployment, with 4.7% or 90 of them being unemployed.
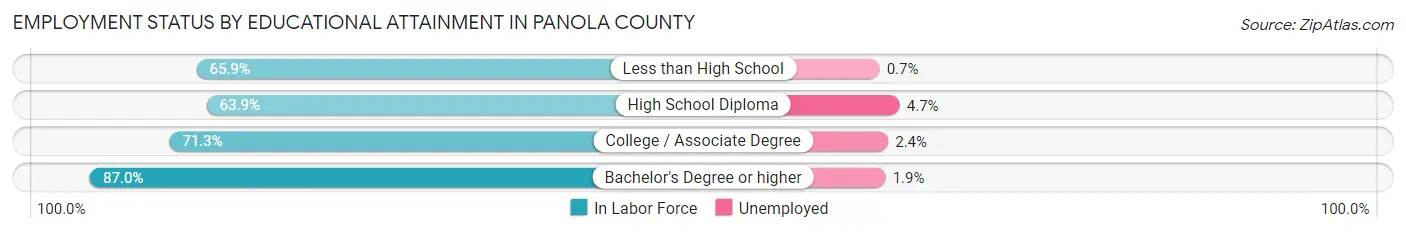
| Educational Attainment | In Labor Force | Unemployed |
| Less than High School | 907 (65.9%) | 10 (0.7%) |
| High School Diploma | 1,916 (63.9%) | 141 (4.7%) |
| College / Associate Degree | 3,232 (71.3%) | 109 (2.4%) |
| Bachelor's Degree or higher | 1,583 (87.0%) | 35 (1.9%) |
| Total | 7,638 (71.2%) | 290 (2.7%) |
Employment Occupations by Sex in Panola County
Management, Business, Science and Arts Occupations
The most common Management, Business, Science and Arts occupations in Panola County are Community & Social Service (933 | 9.7%), Management (848 | 8.8%), Education Instruction & Library (636 | 6.6%), Health Diagnosing & Treating (579 | 6.0%), and Health Technologists (442 | 4.6%).
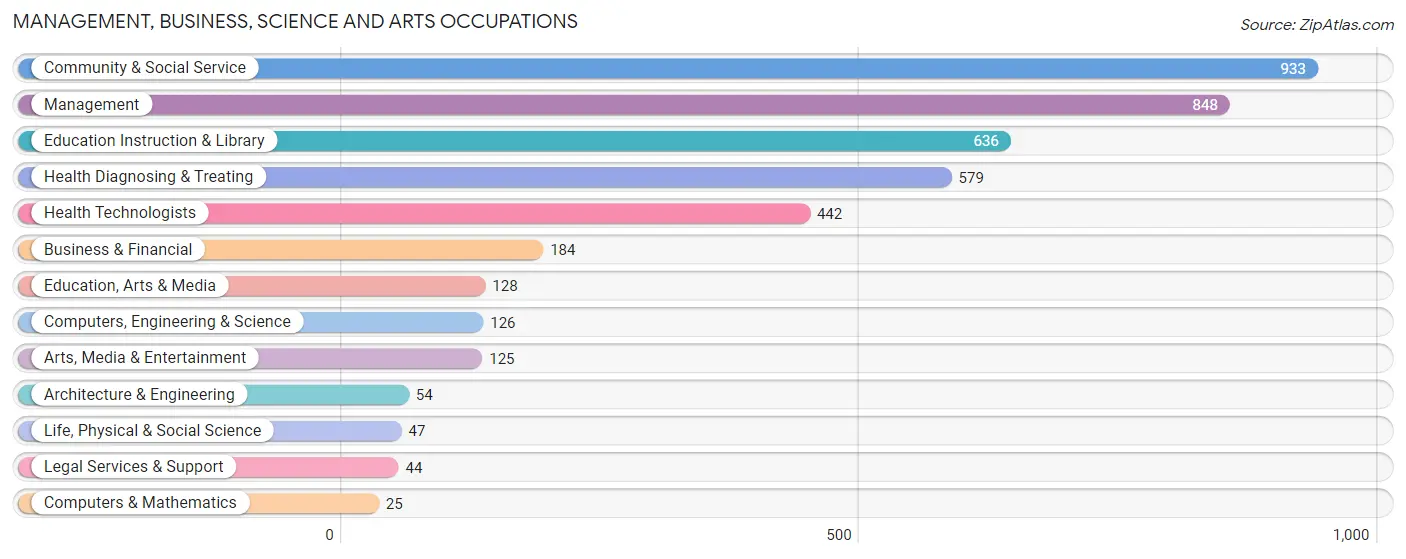
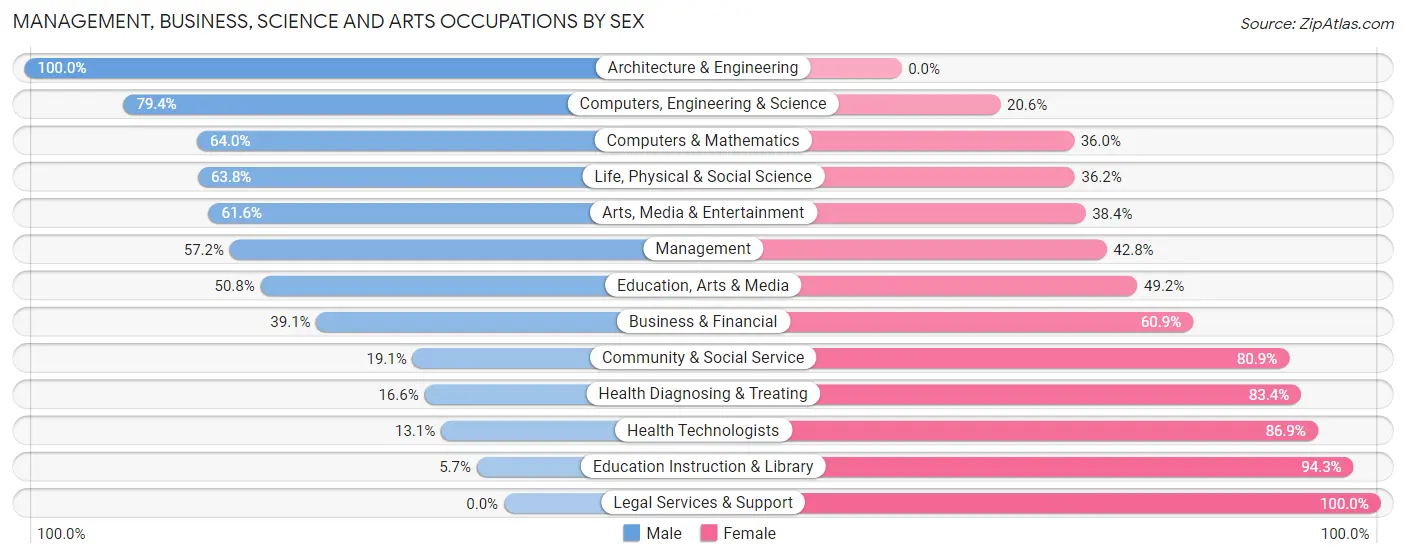
Management, Business, Science and Arts Occupations by Sex
Within the Management, Business, Science and Arts occupations in Panola County, the most male-oriented occupations are Architecture & Engineering (100.0%), Computers, Engineering & Science (79.4%), and Computers & Mathematics (64.0%), while the most female-oriented occupations are Legal Services & Support (100.0%), Education Instruction & Library (94.3%), and Health Technologists (86.9%).
| Occupation | Male | Female |
| Management | 485 (57.2%) | 363 (42.8%) |
| Business & Financial | 72 (39.1%) | 112 (60.9%) |
| Computers, Engineering & Science | 100 (79.4%) | 26 (20.6%) |
| Computers & Mathematics | 16 (64.0%) | 9 (36.0%) |
| Architecture & Engineering | 54 (100.0%) | 0 (0.0%) |
| Life, Physical & Social Science | 30 (63.8%) | 17 (36.2%) |
| Community & Social Service | 178 (19.1%) | 755 (80.9%) |
| Education, Arts & Media | 65 (50.8%) | 63 (49.2%) |
| Legal Services & Support | 0 (0.0%) | 44 (100.0%) |
| Education Instruction & Library | 36 (5.7%) | 600 (94.3%) |
| Arts, Media & Entertainment | 77 (61.6%) | 48 (38.4%) |
| Health Diagnosing & Treating | 96 (16.6%) | 483 (83.4%) |
| Health Technologists | 58 (13.1%) | 384 (86.9%) |
| Total (Category) | 931 (34.9%) | 1,739 (65.1%) |
| Total (Overall) | 5,013 (52.1%) | 4,603 (47.9%) |
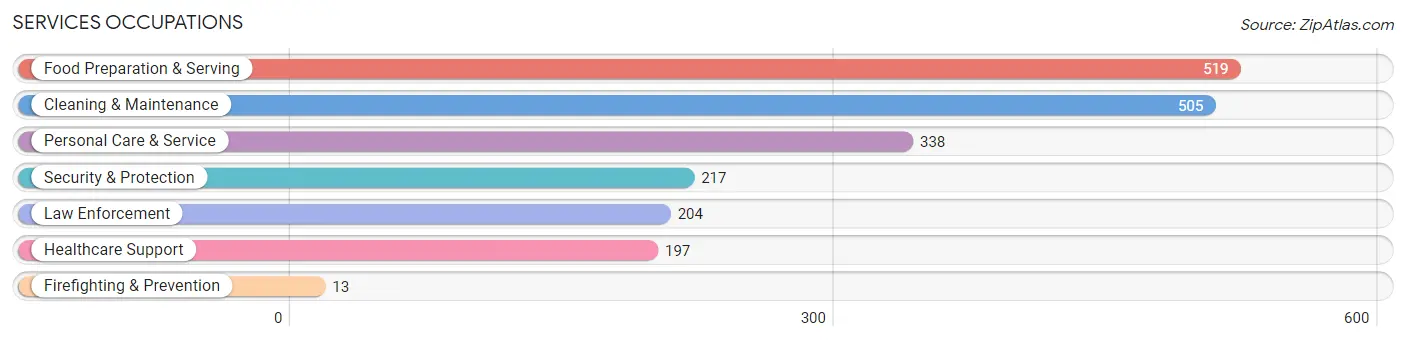
Services Occupations
The most common Services occupations in Panola County are Food Preparation & Serving (519 | 5.4%), Cleaning & Maintenance (505 | 5.2%), Personal Care & Service (338 | 3.5%), Security & Protection (217 | 2.3%), and Law Enforcement (204 | 2.1%).
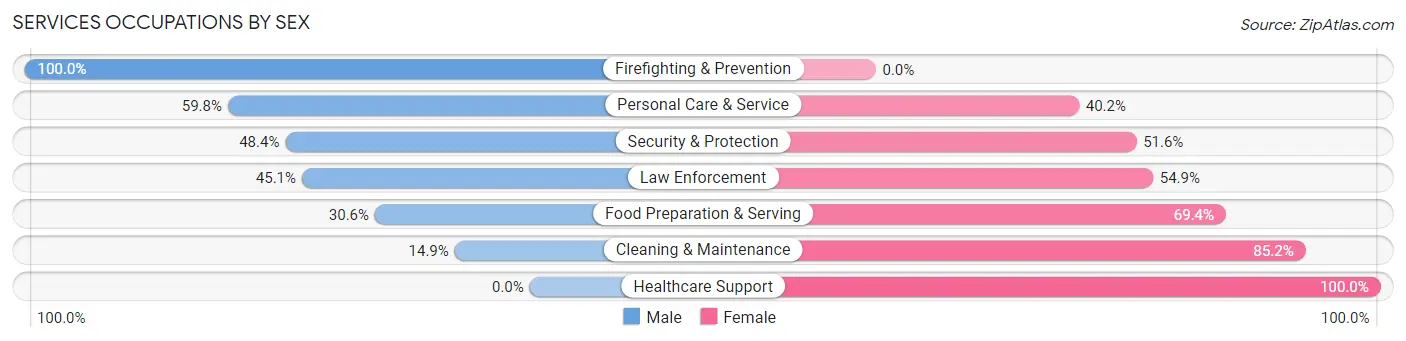
Services Occupations by Sex
Within the Services occupations in Panola County, the most male-oriented occupations are Firefighting & Prevention (100.0%), Personal Care & Service (59.8%), and Security & Protection (48.4%), while the most female-oriented occupations are Healthcare Support (100.0%), Cleaning & Maintenance (85.2%), and Food Preparation & Serving (69.4%).
| Occupation | Male | Female |
| Healthcare Support | 0 (0.0%) | 197 (100.0%) |
| Security & Protection | 105 (48.4%) | 112 (51.6%) |
| Firefighting & Prevention | 13 (100.0%) | 0 (0.0%) |
| Law Enforcement | 92 (45.1%) | 112 (54.9%) |
| Food Preparation & Serving | 159 (30.6%) | 360 (69.4%) |
| Cleaning & Maintenance | 75 (14.8%) | 430 (85.2%) |
| Personal Care & Service | 202 (59.8%) | 136 (40.2%) |
| Total (Category) | 541 (30.5%) | 1,235 (69.5%) |
| Total (Overall) | 5,013 (52.1%) | 4,603 (47.9%) |
Sales and Office Occupations
The most common Sales and Office occupations in Panola County are Office & Administration (948 | 9.9%), and Sales & Related (761 | 7.9%).

Sales and Office Occupations by Sex

| Occupation | Male | Female |
| Sales & Related | 362 (47.6%) | 399 (52.4%) |
| Office & Administration | 132 (13.9%) | 816 (86.1%) |
| Total (Category) | 494 (28.9%) | 1,215 (71.1%) |
| Total (Overall) | 5,013 (52.1%) | 4,603 (47.9%) |
Natural Resources, Construction and Maintenance Occupations
The most common Natural Resources, Construction and Maintenance occupations in Panola County are Construction & Extraction (823 | 8.6%), Installation, Maintenance & Repair (510 | 5.3%), and Farming, Fishing & Forestry (56 | 0.6%).

Natural Resources, Construction and Maintenance Occupations by Sex

| Occupation | Male | Female |
| Farming, Fishing & Forestry | 32 (57.1%) | 24 (42.9%) |
| Construction & Extraction | 818 (99.4%) | 5 (0.6%) |
| Installation, Maintenance & Repair | 510 (100.0%) | 0 (0.0%) |
| Total (Category) | 1,360 (97.9%) | 29 (2.1%) |
| Total (Overall) | 5,013 (52.1%) | 4,603 (47.9%) |
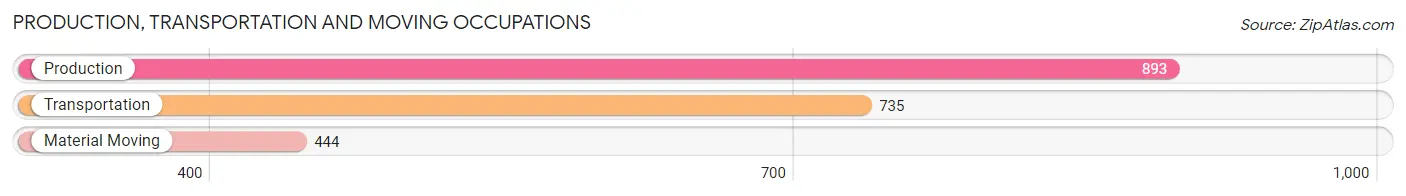
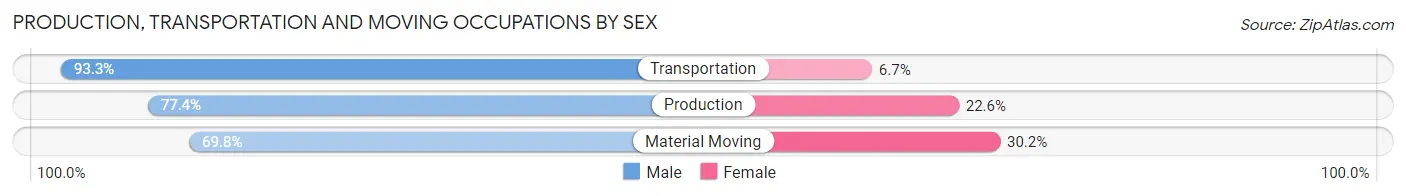
Production, Transportation and Moving Occupations
The most common Production, Transportation and Moving occupations in Panola County are Production (893 | 9.3%), Transportation (735 | 7.6%), and Material Moving (444 | 4.6%).
Production, Transportation and Moving Occupations by Sex
| Occupation | Male | Female |
| Production | 691 (77.4%) | 202 (22.6%) |
| Transportation | 686 (93.3%) | 49 (6.7%) |
| Material Moving | 310 (69.8%) | 134 (30.2%) |
| Total (Category) | 1,687 (81.4%) | 385 (18.6%) |
| Total (Overall) | 5,013 (52.1%) | 4,603 (47.9%) |
Employment Industries by Sex in Panola County
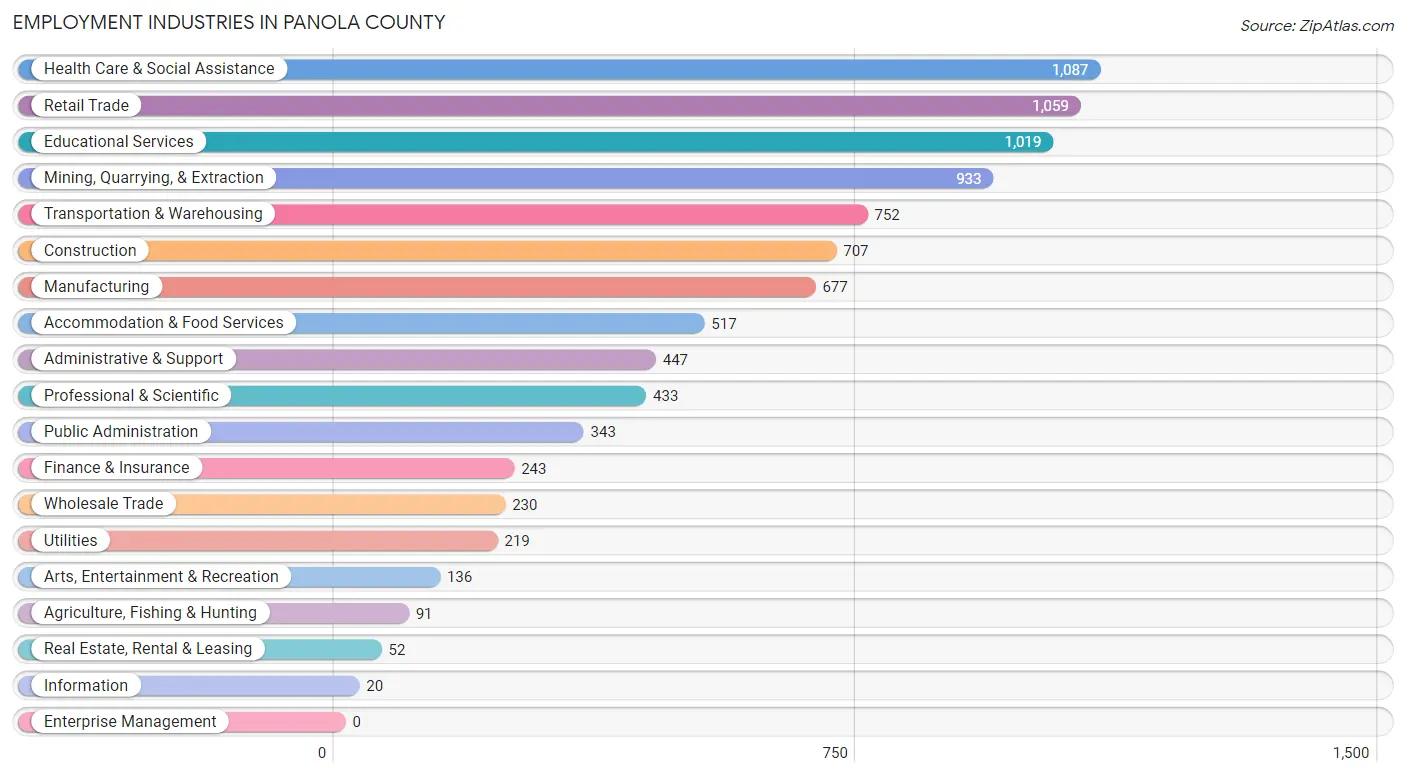
Employment Industries in Panola County
The major employment industries in Panola County include Health Care & Social Assistance (1,087 | 11.3%), Retail Trade (1,059 | 11.0%), Educational Services (1,019 | 10.6%), Mining, Quarrying, & Extraction (933 | 9.7%), and Transportation & Warehousing (752 | 7.8%).
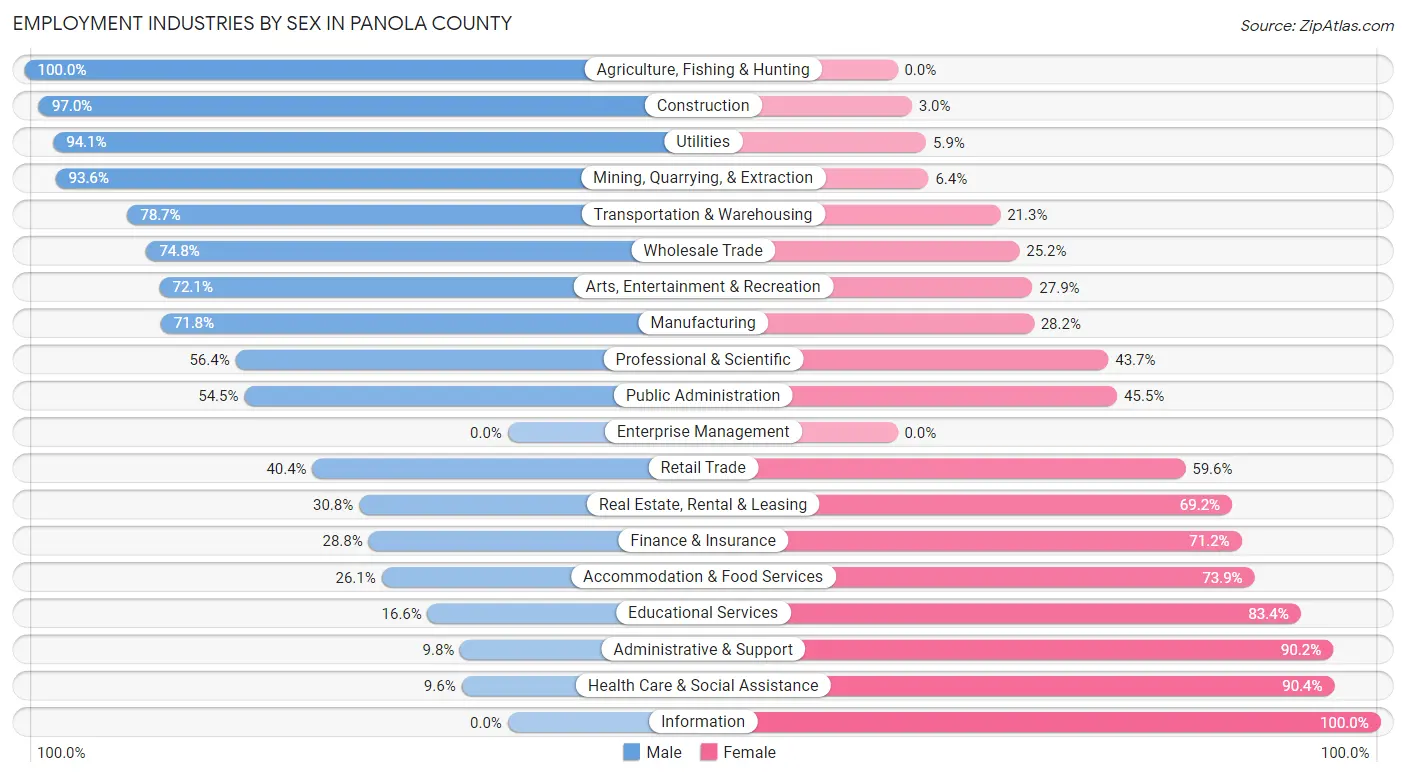
Employment Industries by Sex in Panola County
The Panola County industries that see more men than women are Agriculture, Fishing & Hunting (100.0%), Construction (97.0%), and Utilities (94.1%), whereas the industries that tend to have a higher number of women are Information (100.0%), Health Care & Social Assistance (90.4%), and Administrative & Support (90.2%).
| Industry | Male | Female |
| Agriculture, Fishing & Hunting | 91 (100.0%) | 0 (0.0%) |
| Mining, Quarrying, & Extraction | 873 (93.6%) | 60 (6.4%) |
| Construction | 686 (97.0%) | 21 (3.0%) |
| Manufacturing | 486 (71.8%) | 191 (28.2%) |
| Wholesale Trade | 172 (74.8%) | 58 (25.2%) |
| Retail Trade | 428 (40.4%) | 631 (59.6%) |
| Transportation & Warehousing | 592 (78.7%) | 160 (21.3%) |
| Utilities | 206 (94.1%) | 13 (5.9%) |
| Information | 0 (0.0%) | 20 (100.0%) |
| Finance & Insurance | 70 (28.8%) | 173 (71.2%) |
| Real Estate, Rental & Leasing | 16 (30.8%) | 36 (69.2%) |
| Professional & Scientific | 244 (56.4%) | 189 (43.6%) |
| Enterprise Management | 0 (0.0%) | 0 (0.0%) |
| Administrative & Support | 44 (9.8%) | 403 (90.2%) |
| Educational Services | 169 (16.6%) | 850 (83.4%) |
| Health Care & Social Assistance | 104 (9.6%) | 983 (90.4%) |
| Arts, Entertainment & Recreation | 98 (72.1%) | 38 (27.9%) |
| Accommodation & Food Services | 135 (26.1%) | 382 (73.9%) |
| Public Administration | 187 (54.5%) | 156 (45.5%) |
| Total | 5,013 (52.1%) | 4,603 (47.9%) |
Education in Panola County
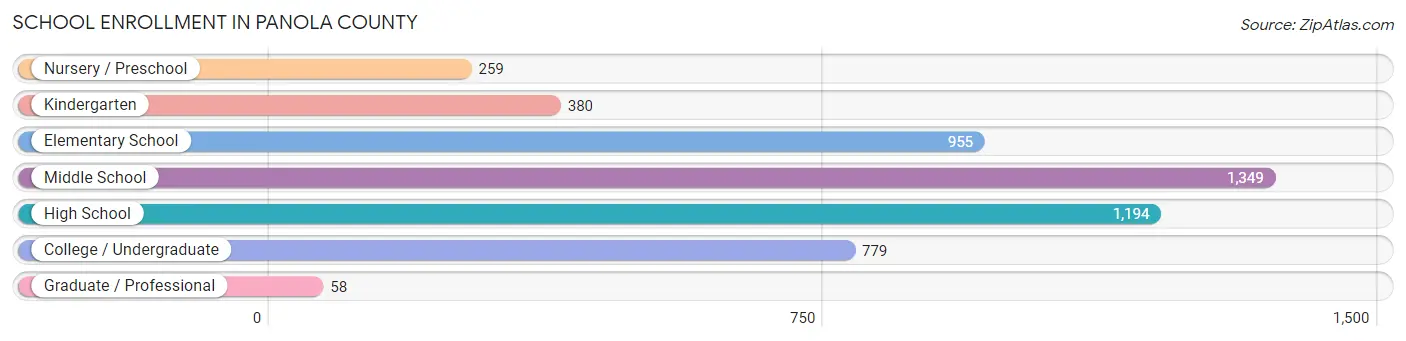
School Enrollment in Panola County
The most common levels of schooling among the 4,974 students in Panola County are middle school (1,349 | 27.1%), high school (1,194 | 24.0%), and elementary school (955 | 19.2%).
| School Level | # Students | % Students |
| Nursery / Preschool | 259 | 5.2% |
| Kindergarten | 380 | 7.6% |
| Elementary School | 955 | 19.2% |
| Middle School | 1,349 | 27.1% |
| High School | 1,194 | 24.0% |
| College / Undergraduate | 779 | 15.7% |
| Graduate / Professional | 58 | 1.2% |
| Total | 4,974 | 100.0% |
School Enrollment by Age by Funding Source in Panola County
Out of a total of 4,974 students who are enrolled in schools in Panola County, 542 (10.9%) attend a private institution, while the remaining 4,432 (89.1%) are enrolled in public schools. The age group of 25 to 34 year olds has the highest likelihood of being enrolled in private schools, with 46 (50.5% in the age bracket) enrolled. Conversely, the age group of 3 to 4 year olds has the lowest likelihood of being enrolled in a private school, with 184 (100.0% in the age bracket) attending a public institution.
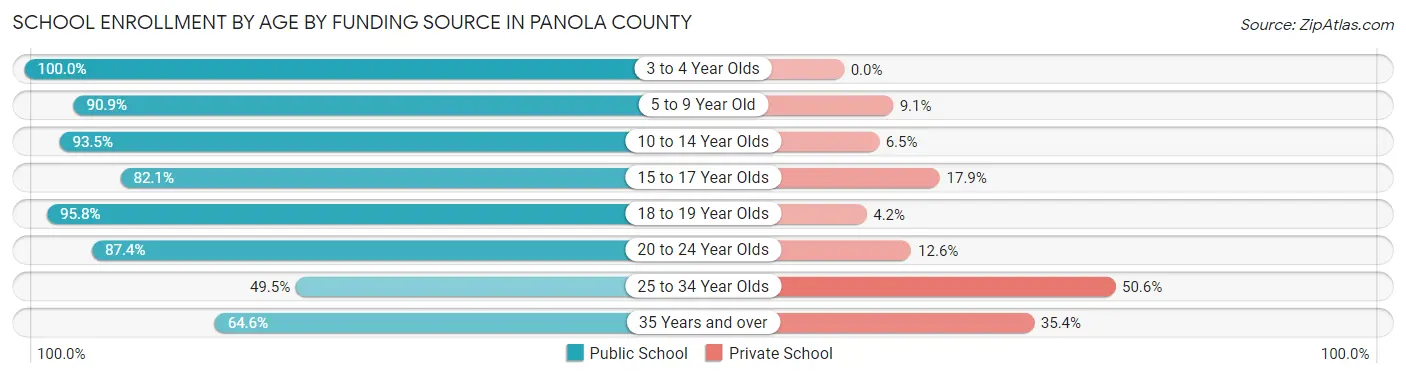
| Age Bracket | Public School | Private School |
| 3 to 4 Year Olds | 184 (100.0%) | 0 (0.0%) |
| 5 to 9 Year Old | 1,145 (90.9%) | 115 (9.1%) |
| 10 to 14 Year Olds | 1,390 (93.5%) | 97 (6.5%) |
| 15 to 17 Year Olds | 795 (82.1%) | 173 (17.9%) |
| 18 to 19 Year Olds | 455 (95.8%) | 20 (4.2%) |
| 20 to 24 Year Olds | 334 (87.4%) | 48 (12.6%) |
| 25 to 34 Year Olds | 45 (49.4%) | 46 (50.5%) |
| 35 Years and over | 82 (64.6%) | 45 (35.4%) |
| Total | 4,432 (89.1%) | 542 (10.9%) |
Educational Attainment by Field of Study in Panola County
Business (595 | 23.3%), education (494 | 19.3%), science & technology (448 | 17.5%), arts & humanities (263 | 10.3%), and bio, nature & agricultural (141 | 5.5%) are the most common fields of study among 2,557 individuals in Panola County who have obtained a bachelor's degree or higher.
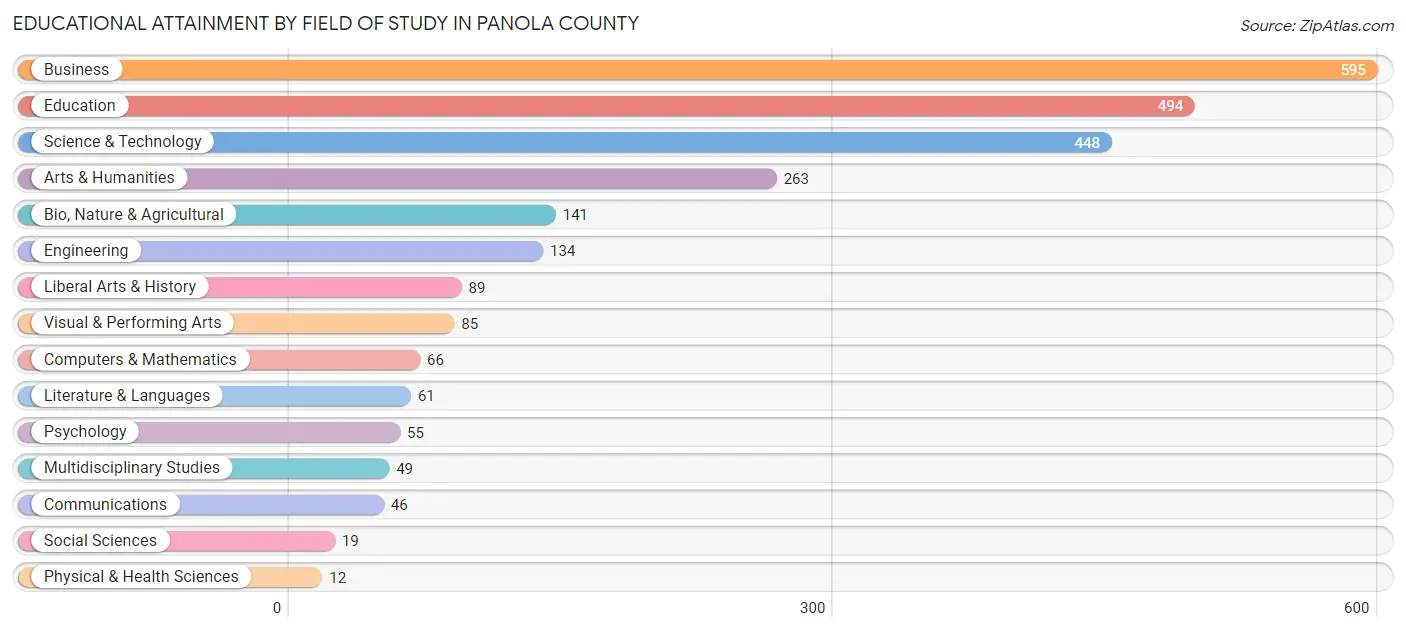
| Field of Study | # Graduates | % Graduates |
| Computers & Mathematics | 66 | 2.6% |
| Bio, Nature & Agricultural | 141 | 5.5% |
| Physical & Health Sciences | 12 | 0.5% |
| Psychology | 55 | 2.1% |
| Social Sciences | 19 | 0.7% |
| Engineering | 134 | 5.2% |
| Multidisciplinary Studies | 49 | 1.9% |
| Science & Technology | 448 | 17.5% |
| Business | 595 | 23.3% |
| Education | 494 | 19.3% |
| Literature & Languages | 61 | 2.4% |
| Liberal Arts & History | 89 | 3.5% |
| Visual & Performing Arts | 85 | 3.3% |
| Communications | 46 | 1.8% |
| Arts & Humanities | 263 | 10.3% |
| Total | 2,557 | 100.0% |
Transportation & Commute in Panola County
Vehicle Availability by Sex in Panola County
The most prevalent vehicle ownership categories in Panola County are males with 2 vehicles (2,056, accounting for 41.5%) and females with 2 vehicles (1,640, making up 46.0%).
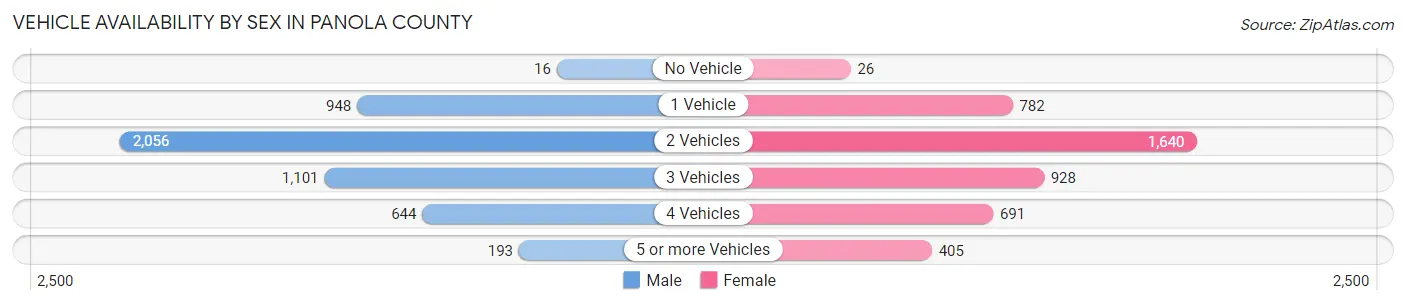
| Vehicles Available | Male | Female |
| No Vehicle | 16 (0.3%) | 26 (0.6%) |
| 1 Vehicle | 948 (19.1%) | 782 (17.5%) |
| 2 Vehicles | 2,056 (41.5%) | 1,640 (36.7%) |
| 3 Vehicles | 1,101 (22.2%) | 928 (20.7%) |
| 4 Vehicles | 644 (13.0%) | 691 (15.4%) |
| 5 or more Vehicles | 193 (3.9%) | 405 (9.1%) |
| Total | 4,958 (100.0%) | 4,472 (100.0%) |
Commute Time in Panola County
The most frequently occuring commute durations in Panola County are 5 to 9 minutes (1,424 commuters, 15.5%), 10 to 14 minutes (1,347 commuters, 14.6%), and 15 to 19 minutes (1,125 commuters, 12.2%).
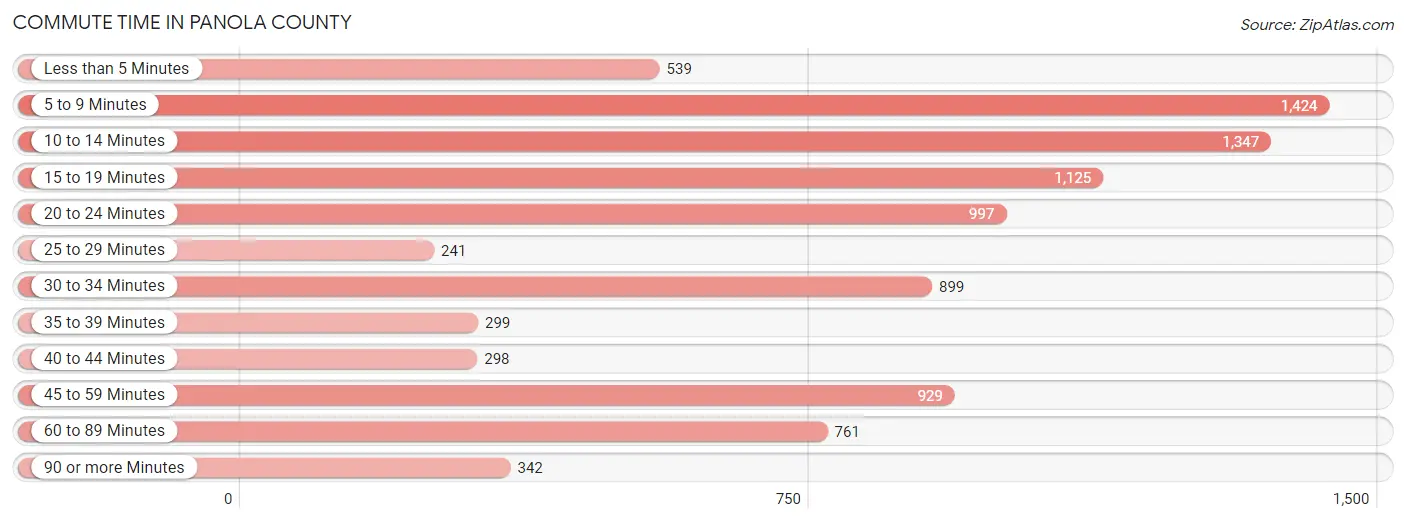
| Commute Time | # Commuters | % Commuters |
| Less than 5 Minutes | 539 | 5.9% |
| 5 to 9 Minutes | 1,424 | 15.5% |
| 10 to 14 Minutes | 1,347 | 14.6% |
| 15 to 19 Minutes | 1,125 | 12.2% |
| 20 to 24 Minutes | 997 | 10.8% |
| 25 to 29 Minutes | 241 | 2.6% |
| 30 to 34 Minutes | 899 | 9.8% |
| 35 to 39 Minutes | 299 | 3.3% |
| 40 to 44 Minutes | 298 | 3.2% |
| 45 to 59 Minutes | 929 | 10.1% |
| 60 to 89 Minutes | 761 | 8.3% |
| 90 or more Minutes | 342 | 3.7% |
Commute Time by Sex in Panola County
The most common commute times in Panola County are 5 to 9 minutes (631 commuters, 13.1%) for males and 10 to 14 minutes (912 commuters, 20.7%) for females.
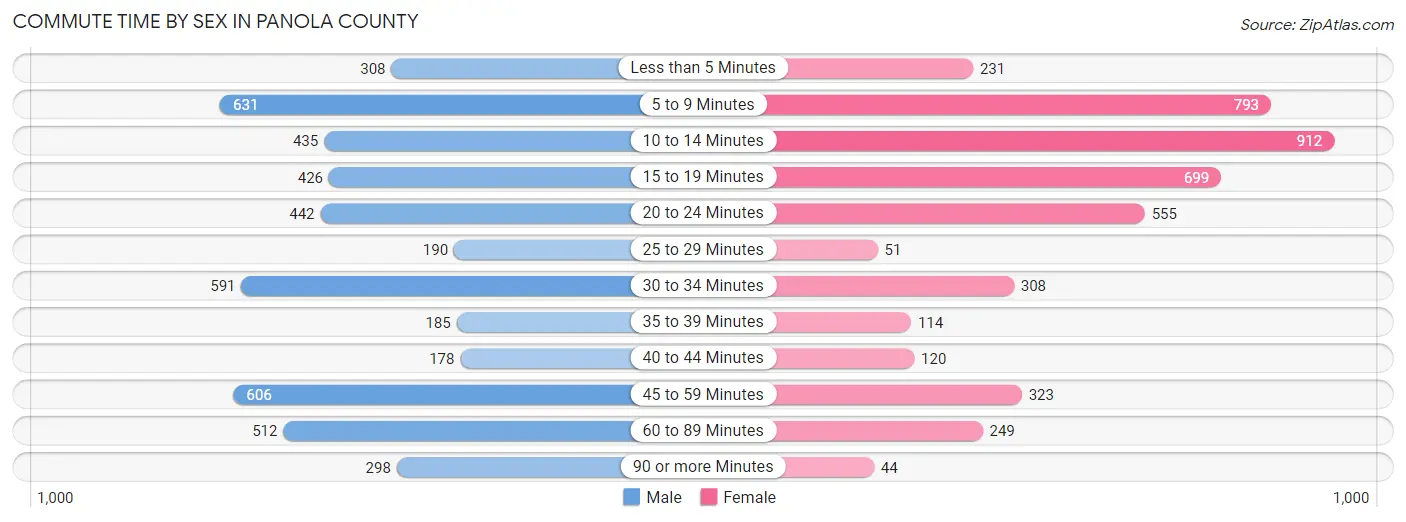
| Commute Time | Male | Female |
| Less than 5 Minutes | 308 (6.4%) | 231 (5.2%) |
| 5 to 9 Minutes | 631 (13.1%) | 793 (18.0%) |
| 10 to 14 Minutes | 435 (9.1%) | 912 (20.7%) |
| 15 to 19 Minutes | 426 (8.9%) | 699 (15.9%) |
| 20 to 24 Minutes | 442 (9.2%) | 555 (12.6%) |
| 25 to 29 Minutes | 190 (4.0%) | 51 (1.2%) |
| 30 to 34 Minutes | 591 (12.3%) | 308 (7.0%) |
| 35 to 39 Minutes | 185 (3.8%) | 114 (2.6%) |
| 40 to 44 Minutes | 178 (3.7%) | 120 (2.7%) |
| 45 to 59 Minutes | 606 (12.6%) | 323 (7.3%) |
| 60 to 89 Minutes | 512 (10.7%) | 249 (5.7%) |
| 90 or more Minutes | 298 (6.2%) | 44 (1.0%) |
Time of Departure to Work by Sex in Panola County
The most frequent times of departure to work in Panola County are 6:00 AM to 6:29 AM (977, 20.3%) for males and 7:00 AM to 7:29 AM (1,277, 29.0%) for females.
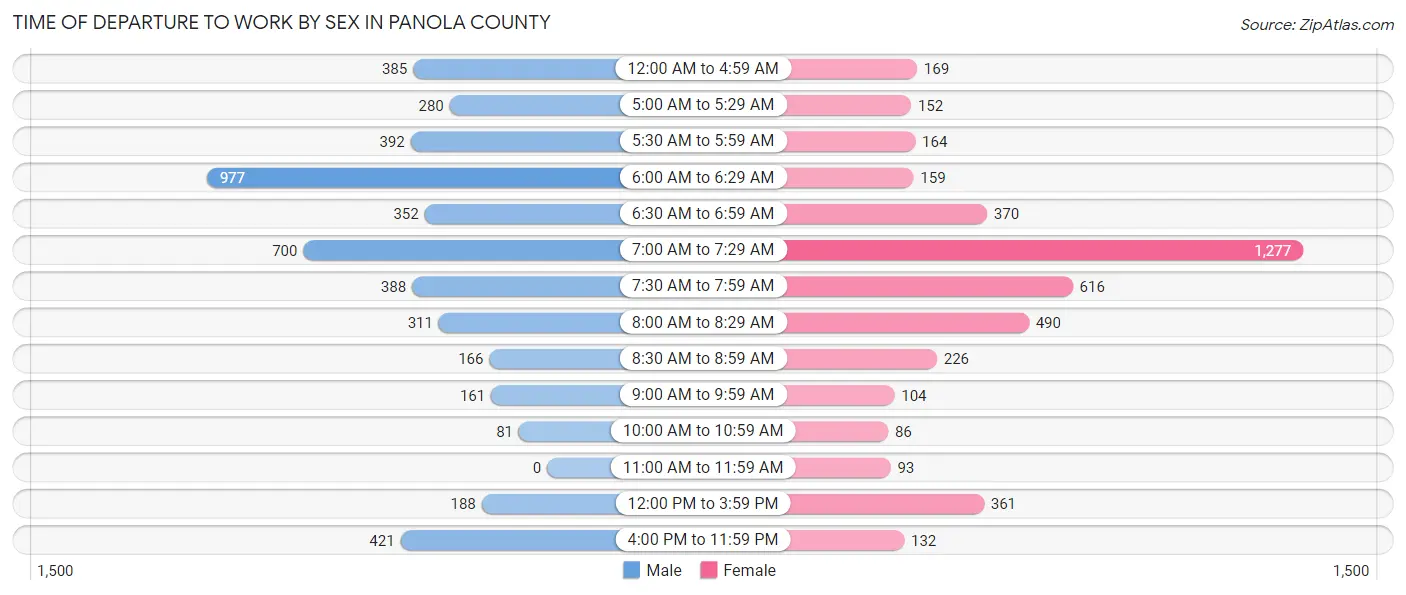
| Time of Departure | Male | Female |
| 12:00 AM to 4:59 AM | 385 (8.0%) | 169 (3.8%) |
| 5:00 AM to 5:29 AM | 280 (5.8%) | 152 (3.5%) |
| 5:30 AM to 5:59 AM | 392 (8.2%) | 164 (3.7%) |
| 6:00 AM to 6:29 AM | 977 (20.3%) | 159 (3.6%) |
| 6:30 AM to 6:59 AM | 352 (7.3%) | 370 (8.4%) |
| 7:00 AM to 7:29 AM | 700 (14.6%) | 1,277 (29.0%) |
| 7:30 AM to 7:59 AM | 388 (8.1%) | 616 (14.0%) |
| 8:00 AM to 8:29 AM | 311 (6.5%) | 490 (11.1%) |
| 8:30 AM to 8:59 AM | 166 (3.5%) | 226 (5.1%) |
| 9:00 AM to 9:59 AM | 161 (3.4%) | 104 (2.4%) |
| 10:00 AM to 10:59 AM | 81 (1.7%) | 86 (1.9%) |
| 11:00 AM to 11:59 AM | 0 (0.0%) | 93 (2.1%) |
| 12:00 PM to 3:59 PM | 188 (3.9%) | 361 (8.2%) |
| 4:00 PM to 11:59 PM | 421 (8.8%) | 132 (3.0%) |
| Total | 4,802 (100.0%) | 4,399 (100.0%) |
Housing Occupancy in Panola County
Occupancy by Ownership in Panola County
Of the total 8,062 dwellings in Panola County, owner-occupied units account for 6,493 (80.5%), while renter-occupied units make up 1,569 (19.5%).
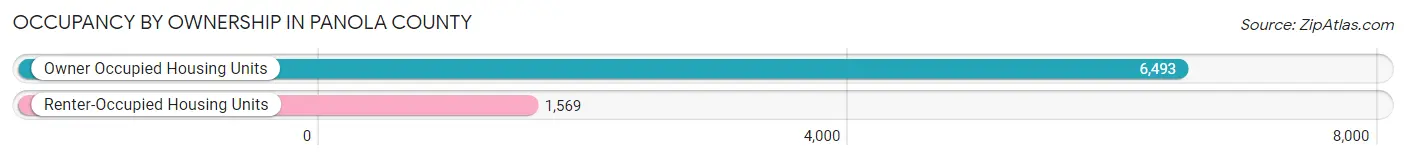
| Occupancy | # Housing Units | % Housing Units |
| Owner Occupied Housing Units | 6,493 | 80.5% |
| Renter-Occupied Housing Units | 1,569 | 19.5% |
| Total Occupied Housing Units | 8,062 | 100.0% |
Occupancy by Household Size in Panola County
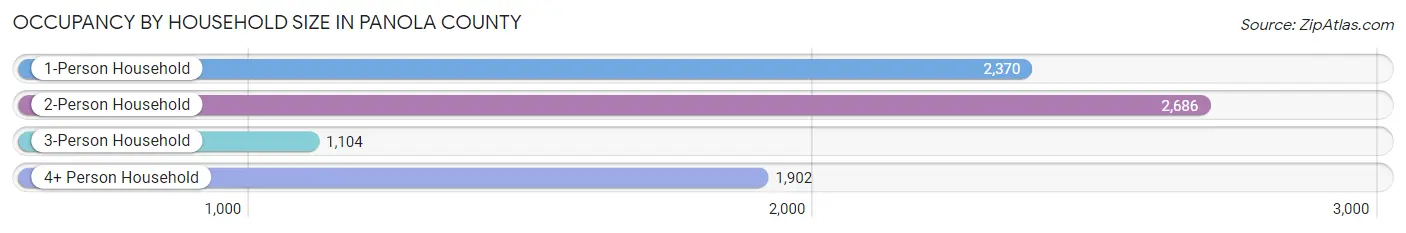
| Household Size | # Housing Units | % Housing Units |
| 1-Person Household | 2,370 | 29.4% |
| 2-Person Household | 2,686 | 33.3% |
| 3-Person Household | 1,104 | 13.7% |
| 4+ Person Household | 1,902 | 23.6% |
| Total Housing Units | 8,062 | 100.0% |
Occupancy by Ownership by Household Size in Panola County
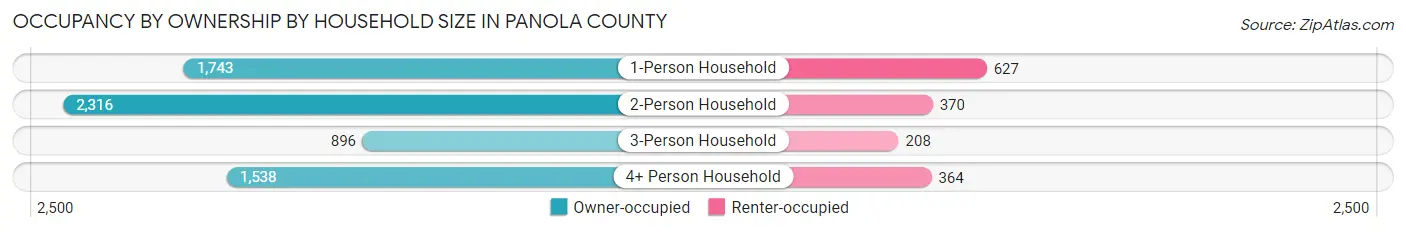
| Household Size | Owner-occupied | Renter-occupied |
| 1-Person Household | 1,743 (73.5%) | 627 (26.5%) |
| 2-Person Household | 2,316 (86.2%) | 370 (13.8%) |
| 3-Person Household | 896 (81.2%) | 208 (18.8%) |
| 4+ Person Household | 1,538 (80.9%) | 364 (19.1%) |
| Total Housing Units | 6,493 (80.5%) | 1,569 (19.5%) |
Occupancy by Educational Attainment in Panola County
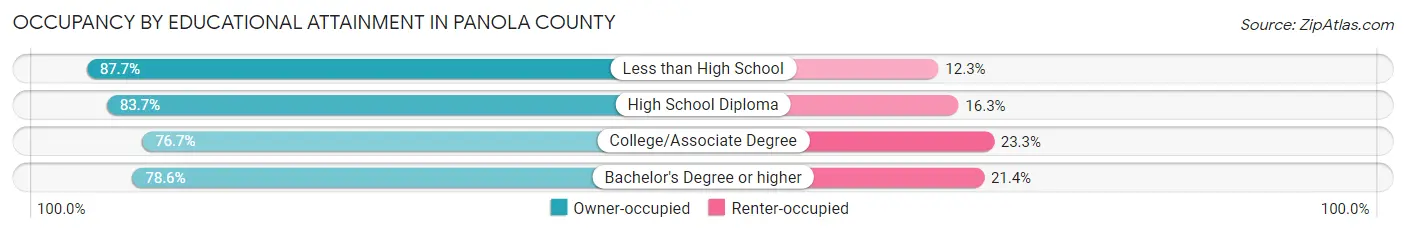
| Household Size | Owner-occupied | Renter-occupied |
| Less than High School | 1,115 (87.7%) | 157 (12.3%) |
| High School Diploma | 1,695 (83.7%) | 330 (16.3%) |
| College/Associate Degree | 2,509 (76.7%) | 763 (23.3%) |
| Bachelor's Degree or higher | 1,174 (78.6%) | 319 (21.4%) |
Occupancy by Age of Householder in Panola County
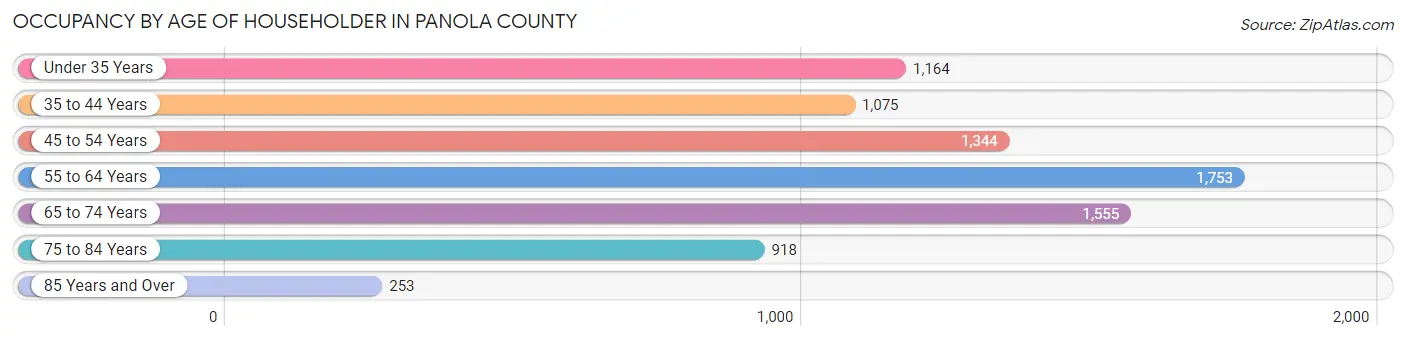
| Age Bracket | # Households | % Households |
| Under 35 Years | 1,164 | 14.4% |
| 35 to 44 Years | 1,075 | 13.3% |
| 45 to 54 Years | 1,344 | 16.7% |
| 55 to 64 Years | 1,753 | 21.7% |
| 65 to 74 Years | 1,555 | 19.3% |
| 75 to 84 Years | 918 | 11.4% |
| 85 Years and Over | 253 | 3.1% |
| Total | 8,062 | 100.0% |
Housing Finances in Panola County
Median Income by Occupancy in Panola County
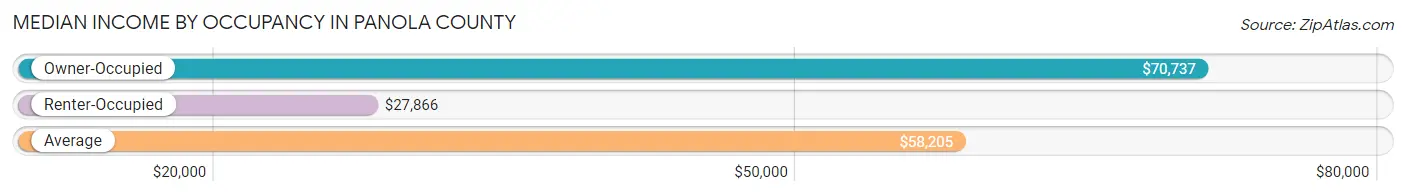
| Occupancy Type | # Households | Median Income |
| Owner-Occupied | 6,493 (80.5%) | $70,737 |
| Renter-Occupied | 1,569 (19.5%) | $27,866 |
| Average | 8,062 (100.0%) | $58,205 |
Occupancy by Householder Income Bracket in Panola County
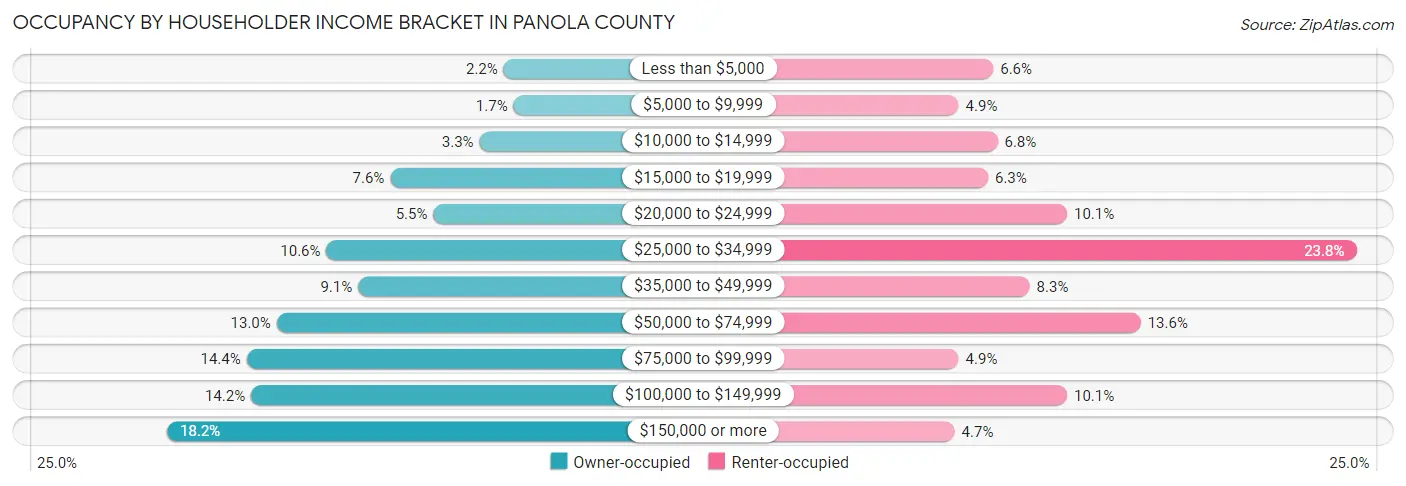
| Income Bracket | Owner-occupied | Renter-occupied |
| Less than $5,000 | 142 (2.2%) | 103 (6.6%) |
| $5,000 to $9,999 | 112 (1.7%) | 77 (4.9%) |
| $10,000 to $14,999 | 217 (3.3%) | 106 (6.8%) |
| $15,000 to $19,999 | 493 (7.6%) | 99 (6.3%) |
| $20,000 to $24,999 | 360 (5.5%) | 158 (10.1%) |
| $25,000 to $34,999 | 690 (10.6%) | 374 (23.8%) |
| $35,000 to $49,999 | 592 (9.1%) | 130 (8.3%) |
| $50,000 to $74,999 | 844 (13.0%) | 213 (13.6%) |
| $75,000 to $99,999 | 937 (14.4%) | 77 (4.9%) |
| $100,000 to $149,999 | 923 (14.2%) | 158 (10.1%) |
| $150,000 or more | 1,183 (18.2%) | 74 (4.7%) |
| Total | 6,493 (100.0%) | 1,569 (100.0%) |
Monthly Housing Cost Tiers in Panola County
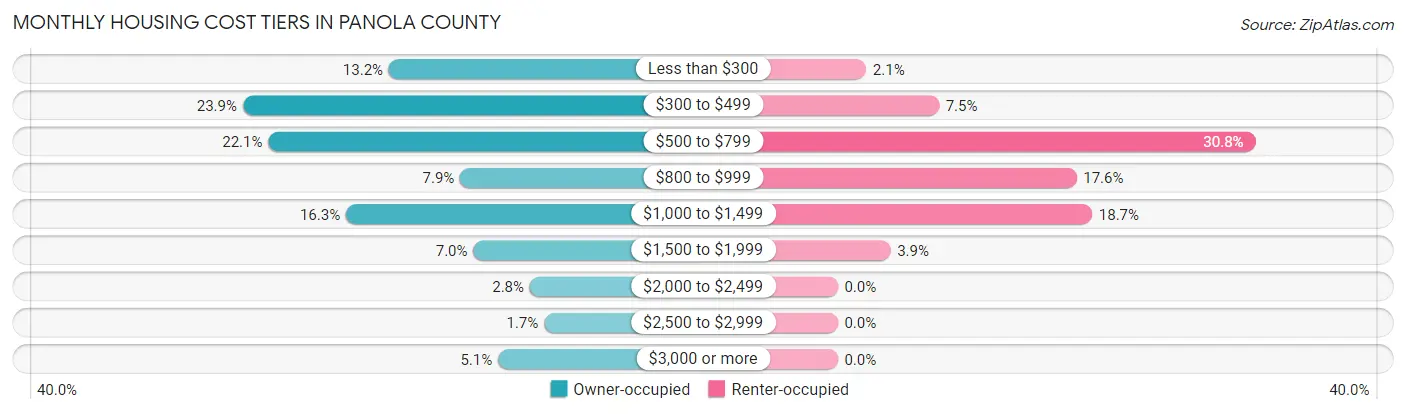
| Monthly Cost | Owner-occupied | Renter-occupied |
| Less than $300 | 855 (13.2%) | 33 (2.1%) |
| $300 to $499 | 1,554 (23.9%) | 117 (7.5%) |
| $500 to $799 | 1,432 (22.1%) | 483 (30.8%) |
| $800 to $999 | 514 (7.9%) | 276 (17.6%) |
| $1,000 to $1,499 | 1,060 (16.3%) | 294 (18.7%) |
| $1,500 to $1,999 | 451 (7.0%) | 61 (3.9%) |
| $2,000 to $2,499 | 181 (2.8%) | 0 (0.0%) |
| $2,500 to $2,999 | 113 (1.7%) | 0 (0.0%) |
| $3,000 or more | 333 (5.1%) | 0 (0.0%) |
| Total | 6,493 (100.0%) | 1,569 (100.0%) |
Physical Housing Characteristics in Panola County
Housing Structures in Panola County
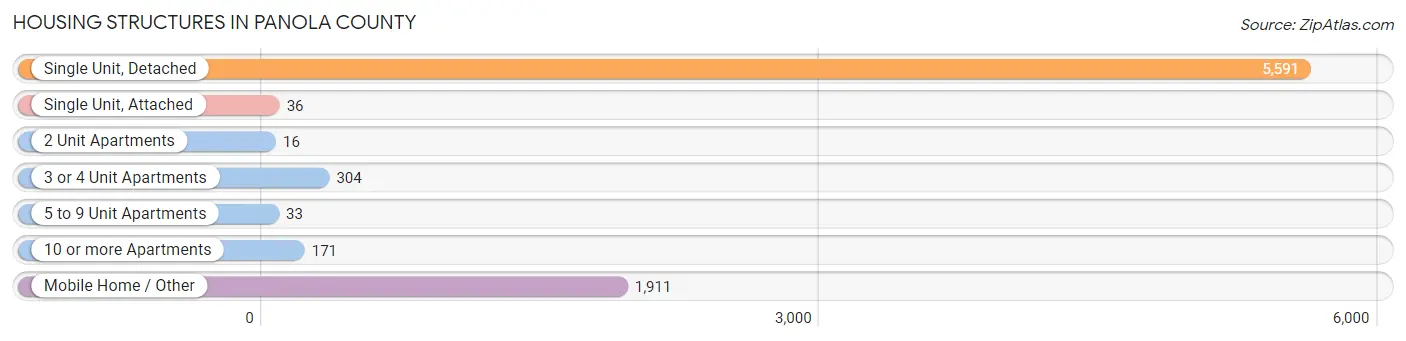
| Structure Type | # Housing Units | % Housing Units |
| Single Unit, Detached | 5,591 | 69.4% |
| Single Unit, Attached | 36 | 0.4% |
| 2 Unit Apartments | 16 | 0.2% |
| 3 or 4 Unit Apartments | 304 | 3.8% |
| 5 to 9 Unit Apartments | 33 | 0.4% |
| 10 or more Apartments | 171 | 2.1% |
| Mobile Home / Other | 1,911 | 23.7% |
| Total | 8,062 | 100.0% |
Housing Structures by Occupancy in Panola County
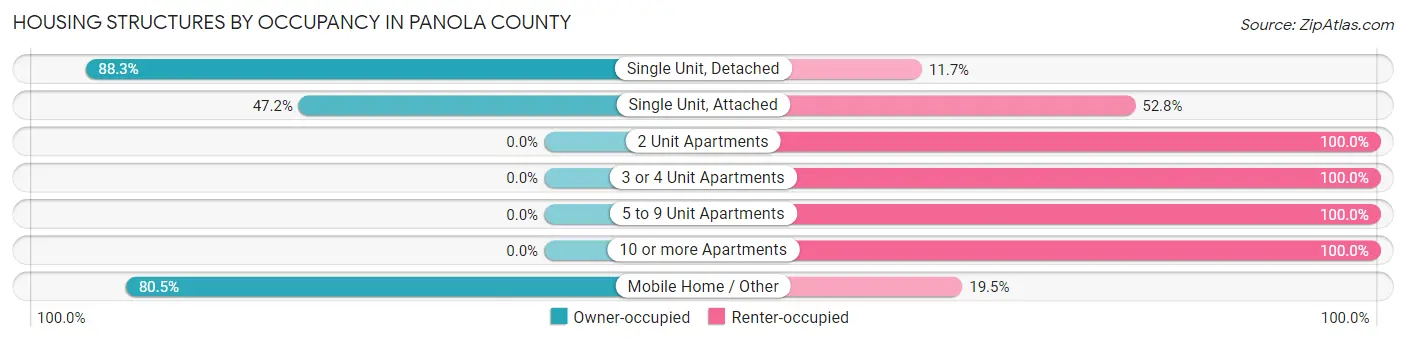
| Structure Type | Owner-occupied | Renter-occupied |
| Single Unit, Detached | 4,937 (88.3%) | 654 (11.7%) |
| Single Unit, Attached | 17 (47.2%) | 19 (52.8%) |
| 2 Unit Apartments | 0 (0.0%) | 16 (100.0%) |
| 3 or 4 Unit Apartments | 0 (0.0%) | 304 (100.0%) |
| 5 to 9 Unit Apartments | 0 (0.0%) | 33 (100.0%) |
| 10 or more Apartments | 0 (0.0%) | 171 (100.0%) |
| Mobile Home / Other | 1,539 (80.5%) | 372 (19.5%) |
| Total | 6,493 (80.5%) | 1,569 (19.5%) |
Housing Structures by Number of Rooms in Panola County
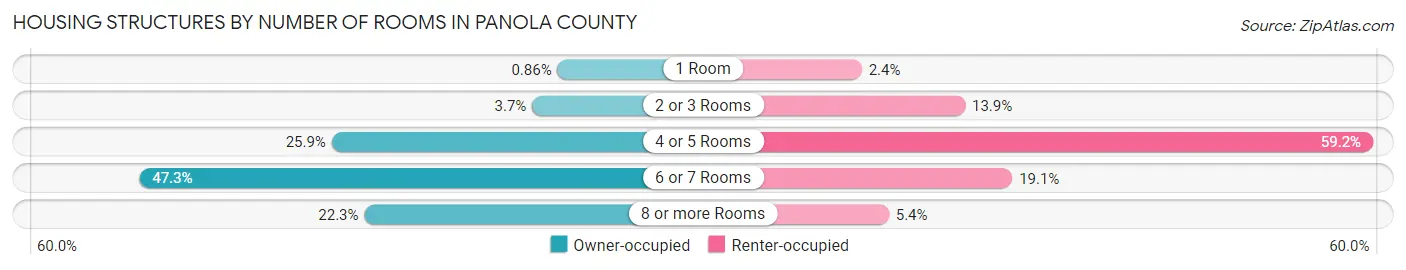
| Number of Rooms | Owner-occupied | Renter-occupied |
| 1 Room | 56 (0.9%) | 38 (2.4%) |
| 2 or 3 Rooms | 238 (3.7%) | 218 (13.9%) |
| 4 or 5 Rooms | 1,683 (25.9%) | 928 (59.2%) |
| 6 or 7 Rooms | 3,069 (47.3%) | 300 (19.1%) |
| 8 or more Rooms | 1,447 (22.3%) | 85 (5.4%) |
| Total | 6,493 (100.0%) | 1,569 (100.0%) |
Housing Structure by Heating Type in Panola County
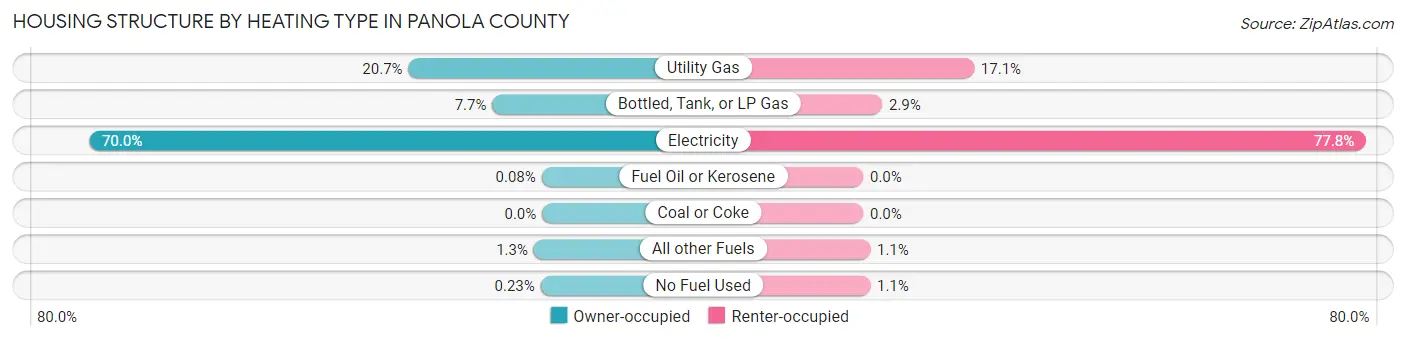
| Heating Type | Owner-occupied | Renter-occupied |
| Utility Gas | 1,342 (20.7%) | 269 (17.1%) |
| Bottled, Tank, or LP Gas | 500 (7.7%) | 46 (2.9%) |
| Electricity | 4,548 (70.0%) | 1,220 (77.8%) |
| Fuel Oil or Kerosene | 5 (0.1%) | 0 (0.0%) |
| Coal or Coke | 0 (0.0%) | 0 (0.0%) |
| All other Fuels | 83 (1.3%) | 17 (1.1%) |
| No Fuel Used | 15 (0.2%) | 17 (1.1%) |
| Total | 6,493 (100.0%) | 1,569 (100.0%) |
Household Vehicle Usage in Panola County
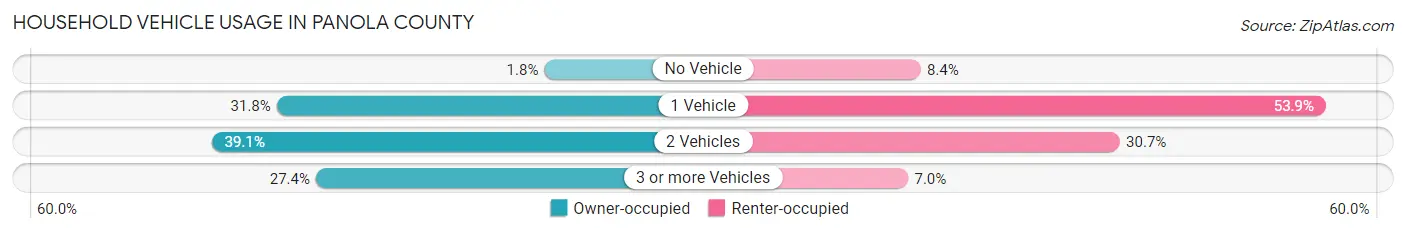
| Vehicles per Household | Owner-occupied | Renter-occupied |
| No Vehicle | 116 (1.8%) | 132 (8.4%) |
| 1 Vehicle | 2,063 (31.8%) | 845 (53.9%) |
| 2 Vehicles | 2,536 (39.1%) | 482 (30.7%) |
| 3 or more Vehicles | 1,778 (27.4%) | 110 (7.0%) |
| Total | 6,493 (100.0%) | 1,569 (100.0%) |
Real Estate & Mortgages in Panola County
Real Estate and Mortgage Overview in Panola County
| Characteristic | Without Mortgage | With Mortgage |
| Housing Units | 3,920 | 2,573 |
| Median Property Value | $116,700 | $175,000 |
| Median Household Income | $44,800 | $896 |
| Monthly Housing Costs | $454 | $319 |
| Real Estate Taxes | $969 | $61 |
Property Value by Mortgage Status in Panola County
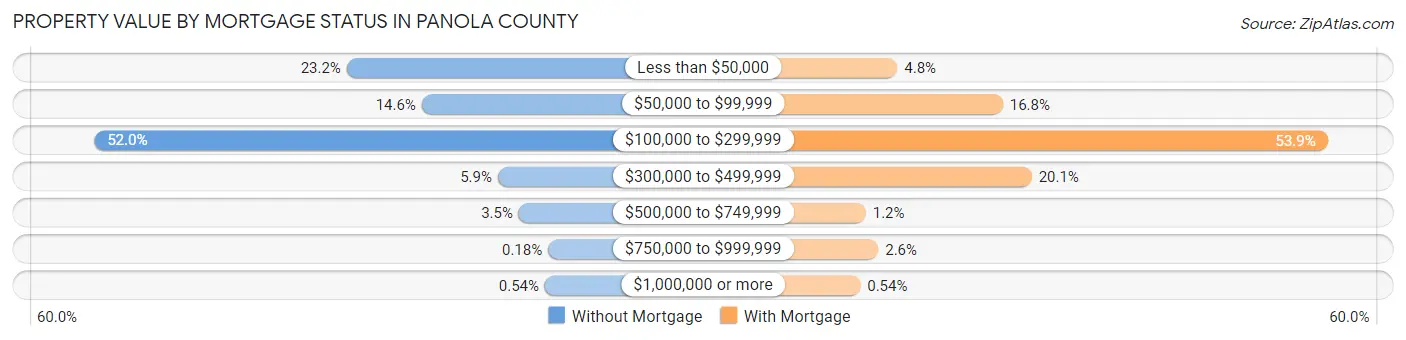
| Property Value | Without Mortgage | With Mortgage |
| Less than $50,000 | 909 (23.2%) | 123 (4.8%) |
| $50,000 to $99,999 | 573 (14.6%) | 433 (16.8%) |
| $100,000 to $299,999 | 2,040 (52.0%) | 1,388 (53.9%) |
| $300,000 to $499,999 | 232 (5.9%) | 518 (20.1%) |
| $500,000 to $749,999 | 138 (3.5%) | 30 (1.2%) |
| $750,000 to $999,999 | 7 (0.2%) | 67 (2.6%) |
| $1,000,000 or more | 21 (0.5%) | 14 (0.5%) |
| Total | 3,920 (100.0%) | 2,573 (100.0%) |
Household Income by Mortgage Status in Panola County
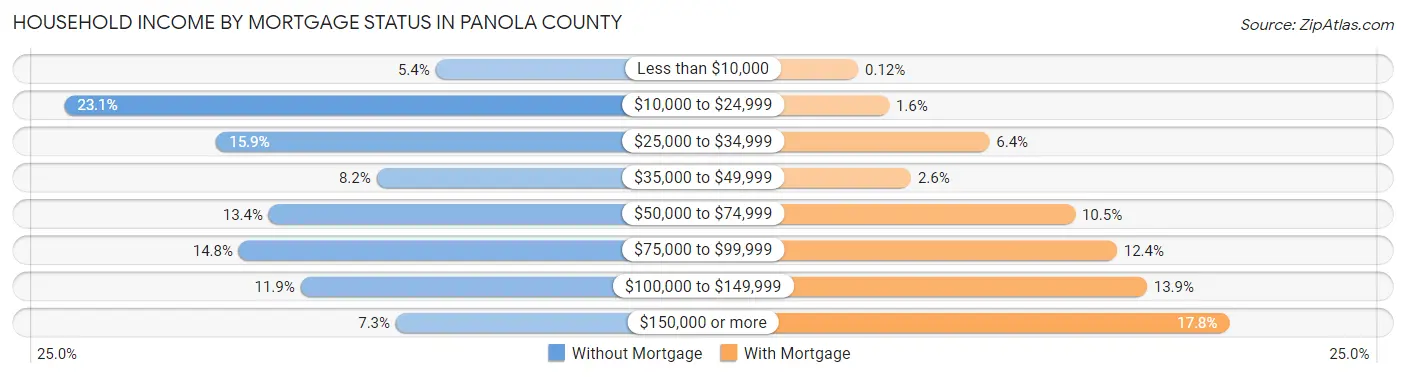
| Household Income | Without Mortgage | With Mortgage |
| Less than $10,000 | 213 (5.4%) | 3 (0.1%) |
| $10,000 to $24,999 | 906 (23.1%) | 41 (1.6%) |
| $25,000 to $34,999 | 622 (15.9%) | 164 (6.4%) |
| $35,000 to $49,999 | 323 (8.2%) | 68 (2.6%) |
| $50,000 to $74,999 | 524 (13.4%) | 269 (10.4%) |
| $75,000 to $99,999 | 580 (14.8%) | 320 (12.4%) |
| $100,000 to $149,999 | 465 (11.9%) | 357 (13.9%) |
| $150,000 or more | 287 (7.3%) | 458 (17.8%) |
| Total | 3,920 (100.0%) | 2,573 (100.0%) |
Property Value to Household Income Ratio in Panola County
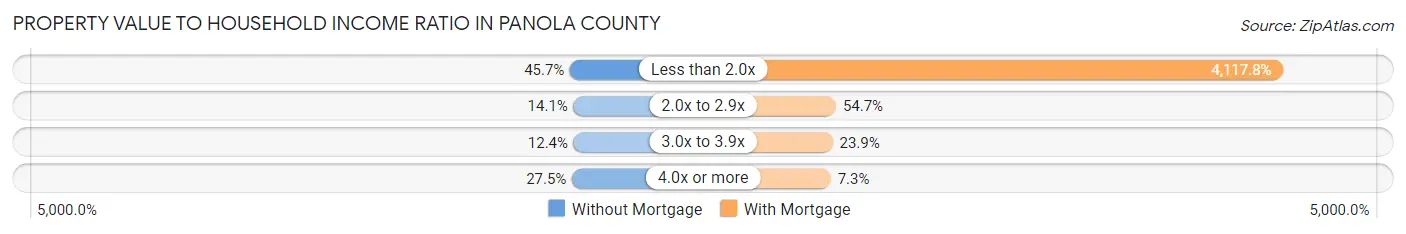
| Value-to-Income Ratio | Without Mortgage | With Mortgage |
| Less than 2.0x | 1,791 (45.7%) | 105,950 (4,117.8%) |
| 2.0x to 2.9x | 554 (14.1%) | 1,407 (54.7%) |
| 3.0x to 3.9x | 487 (12.4%) | 615 (23.9%) |
| 4.0x or more | 1,078 (27.5%) | 187 (7.3%) |
| Total | 3,920 (100.0%) | 2,573 (100.0%) |
Real Estate Taxes by Mortgage Status in Panola County
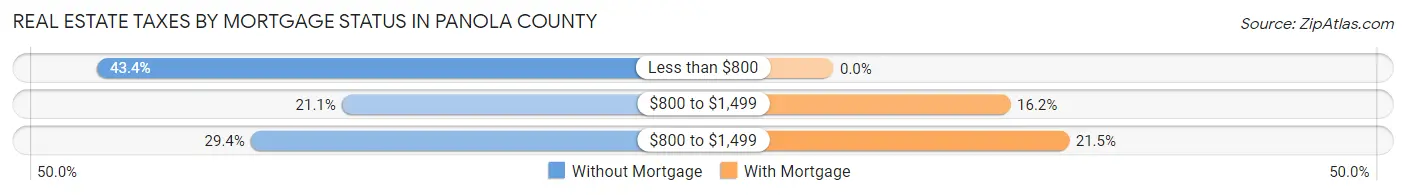
| Property Taxes | Without Mortgage | With Mortgage |
| Less than $800 | 1,700 (43.4%) | 0 (0.0%) |
| $800 to $1,499 | 825 (21.0%) | 416 (16.2%) |
| $800 to $1,499 | 1,151 (29.4%) | 554 (21.5%) |
| Total | 3,920 (100.0%) | 2,573 (100.0%) |
Health & Disability in Panola County
Health Insurance Coverage by Age in Panola County
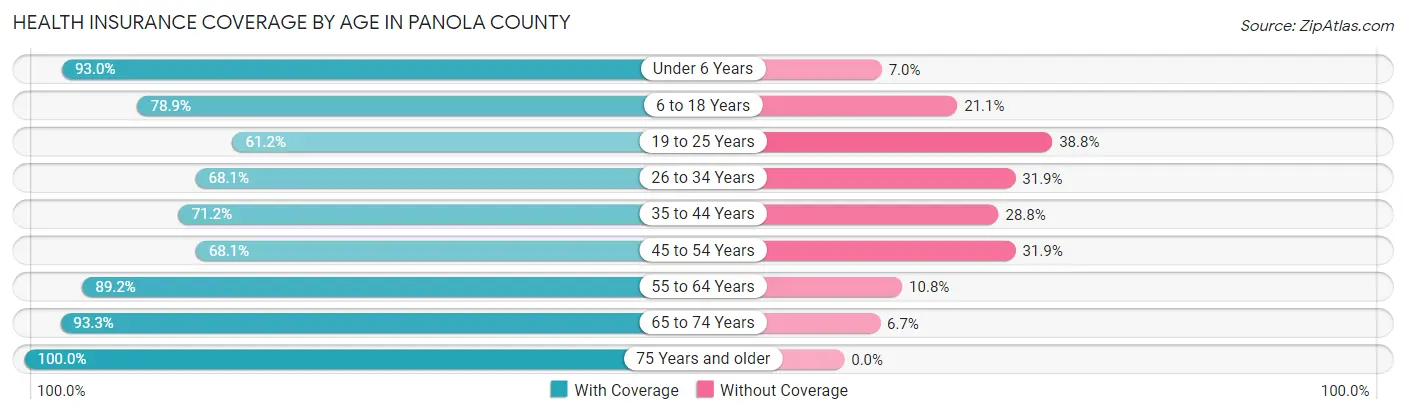
| Age Bracket | With Coverage | Without Coverage |
| Under 6 Years | 1,586 (93.0%) | 119 (7.0%) |
| 6 to 18 Years | 3,123 (78.9%) | 834 (21.1%) |
| 19 to 25 Years | 1,034 (61.2%) | 655 (38.8%) |
| 26 to 34 Years | 1,691 (68.1%) | 792 (31.9%) |
| 35 to 44 Years | 1,713 (71.2%) | 692 (28.8%) |
| 45 to 54 Years | 1,813 (68.1%) | 851 (31.9%) |
| 55 to 64 Years | 2,638 (89.2%) | 319 (10.8%) |
| 65 to 74 Years | 2,514 (93.3%) | 180 (6.7%) |
| 75 Years and older | 1,735 (100.0%) | 0 (0.0%) |
| Total | 17,847 (80.1%) | 4,442 (19.9%) |
Health Insurance Coverage by Citizenship Status in Panola County
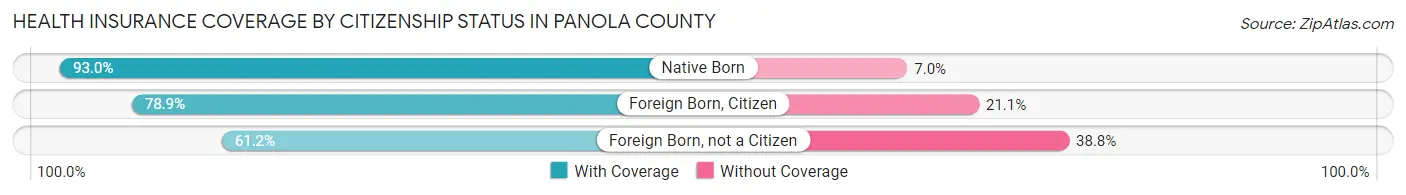
| Citizenship Status | With Coverage | Without Coverage |
| Native Born | 1,586 (93.0%) | 119 (7.0%) |
| Foreign Born, Citizen | 3,123 (78.9%) | 834 (21.1%) |
| Foreign Born, not a Citizen | 1,034 (61.2%) | 655 (38.8%) |
Health Insurance Coverage by Household Income in Panola County
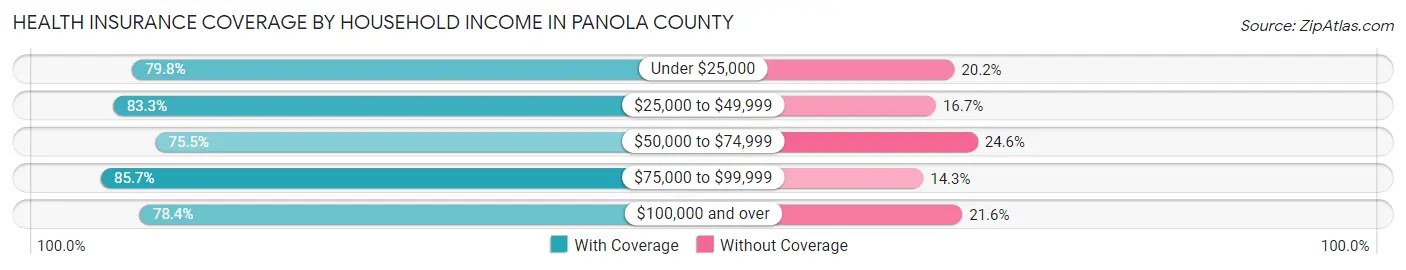
| Household Income | With Coverage | Without Coverage |
| Under $25,000 | 2,881 (79.8%) | 728 (20.2%) |
| $25,000 to $49,999 | 2,877 (83.3%) | 577 (16.7%) |
| $50,000 to $74,999 | 2,456 (75.4%) | 799 (24.5%) |
| $75,000 to $99,999 | 2,643 (85.7%) | 442 (14.3%) |
| $100,000 and over | 6,785 (78.4%) | 1,874 (21.6%) |
Public vs Private Health Insurance Coverage by Age in Panola County
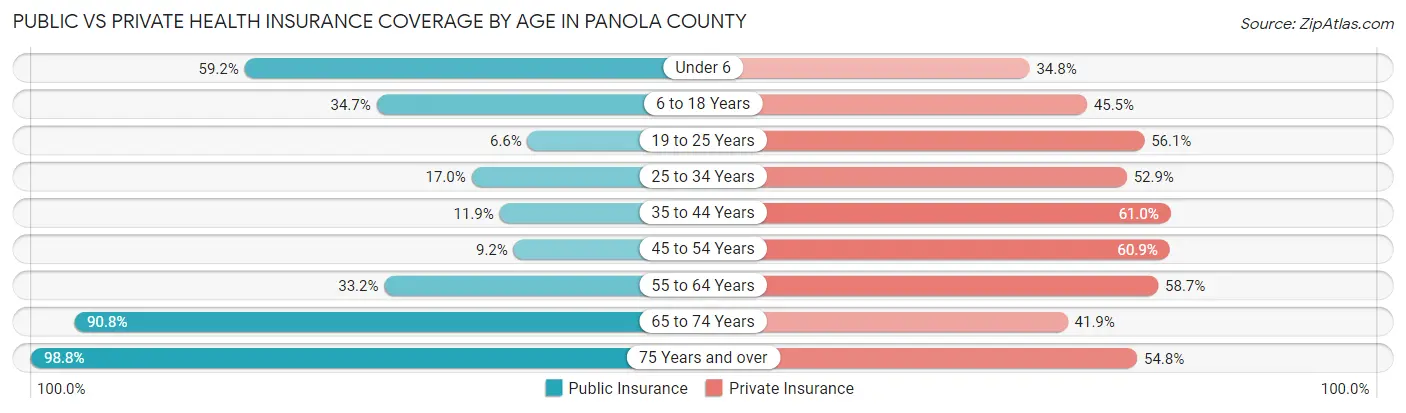
| Age Bracket | Public Insurance | Private Insurance |
| Under 6 | 1,009 (59.2%) | 594 (34.8%) |
| 6 to 18 Years | 1,372 (34.7%) | 1,800 (45.5%) |
| 19 to 25 Years | 112 (6.6%) | 948 (56.1%) |
| 25 to 34 Years | 423 (17.0%) | 1,313 (52.9%) |
| 35 to 44 Years | 285 (11.8%) | 1,468 (61.0%) |
| 45 to 54 Years | 246 (9.2%) | 1,621 (60.9%) |
| 55 to 64 Years | 983 (33.2%) | 1,736 (58.7%) |
| 65 to 74 Years | 2,447 (90.8%) | 1,129 (41.9%) |
| 75 Years and over | 1,714 (98.8%) | 951 (54.8%) |
| Total | 8,591 (38.5%) | 11,560 (51.9%) |
Disability Status by Sex by Age in Panola County
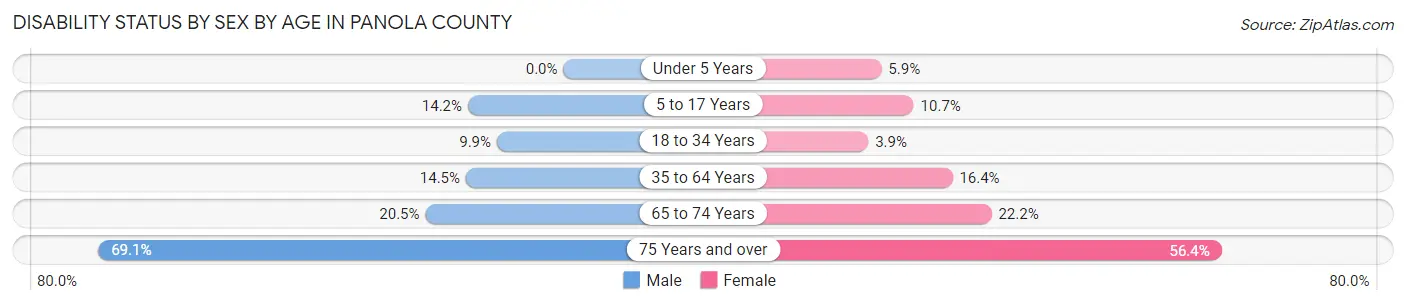
| Age Bracket | Male | Female |
| Under 5 Years | 0 (0.0%) | 34 (5.9%) |
| 5 to 17 Years | 284 (14.2%) | 205 (10.7%) |
| 18 to 34 Years | 232 (9.9%) | 89 (3.9%) |
| 35 to 64 Years | 579 (14.5%) | 662 (16.4%) |
| 65 to 74 Years | 269 (20.5%) | 307 (22.2%) |
| 75 Years and over | 538 (69.1%) | 539 (56.4%) |
Disability Class by Sex by Age in Panola County
Disability Class: Hearing Difficulty
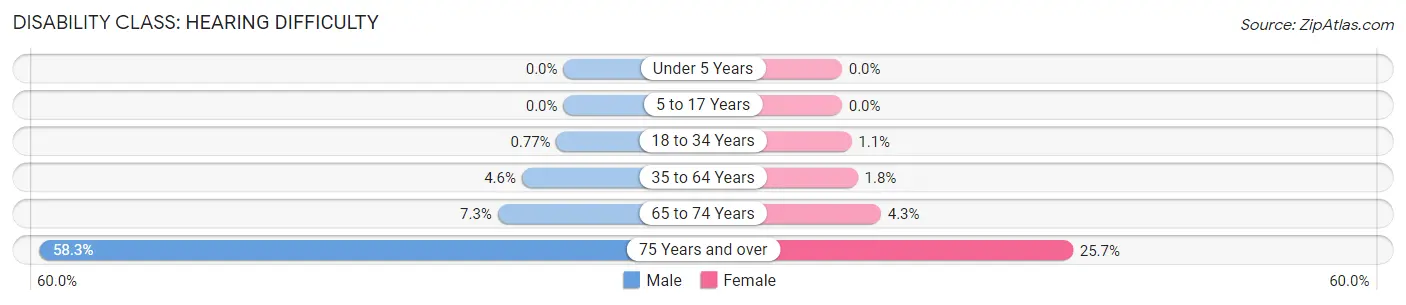
| Age Bracket | Male | Female |
| Under 5 Years | 0 (0.0%) | 0 (0.0%) |
| 5 to 17 Years | 0 (0.0%) | 0 (0.0%) |
| 18 to 34 Years | 18 (0.8%) | 24 (1.1%) |
| 35 to 64 Years | 185 (4.6%) | 71 (1.8%) |
| 65 to 74 Years | 96 (7.3%) | 60 (4.3%) |
| 75 Years and over | 454 (58.3%) | 246 (25.7%) |
Disability Class: Vision Difficulty
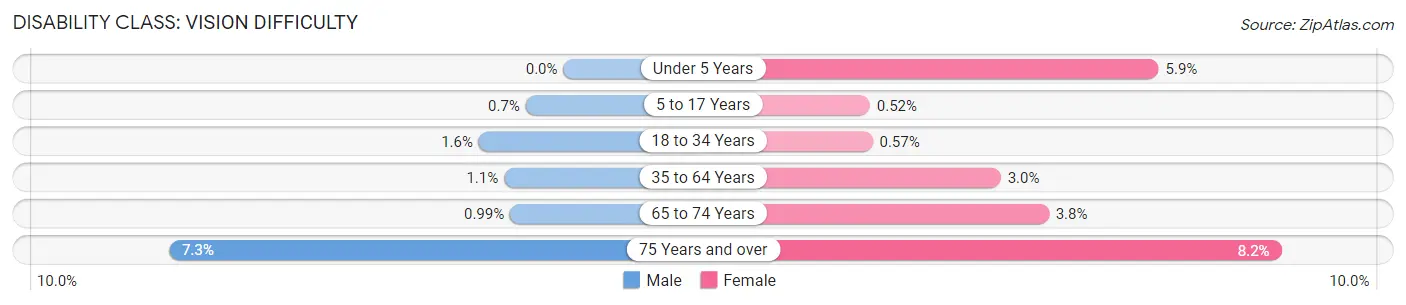
| Age Bracket | Male | Female |
| Under 5 Years | 0 (0.0%) | 34 (5.9%) |
| 5 to 17 Years | 14 (0.7%) | 10 (0.5%) |
| 18 to 34 Years | 37 (1.6%) | 13 (0.6%) |
| 35 to 64 Years | 44 (1.1%) | 119 (2.9%) |
| 65 to 74 Years | 13 (1.0%) | 53 (3.8%) |
| 75 Years and over | 57 (7.3%) | 78 (8.2%) |
Disability Class: Cognitive Difficulty
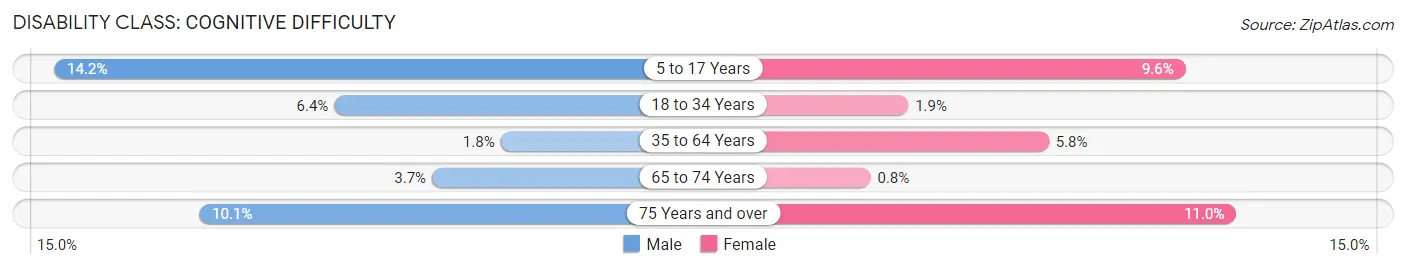
| Age Bracket | Male | Female |
| 5 to 17 Years | 284 (14.2%) | 184 (9.6%) |
| 18 to 34 Years | 150 (6.4%) | 42 (1.8%) |
| 35 to 64 Years | 70 (1.8%) | 232 (5.8%) |
| 65 to 74 Years | 48 (3.7%) | 11 (0.8%) |
| 75 Years and over | 79 (10.1%) | 105 (11.0%) |
Disability Class: Ambulatory Difficulty
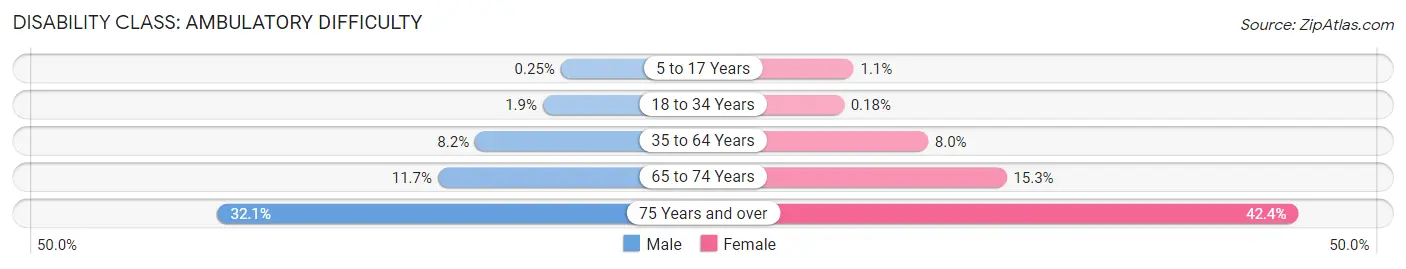
| Age Bracket | Male | Female |
| 5 to 17 Years | 5 (0.3%) | 21 (1.1%) |
| 18 to 34 Years | 45 (1.9%) | 4 (0.2%) |
| 35 to 64 Years | 328 (8.2%) | 322 (8.0%) |
| 65 to 74 Years | 153 (11.7%) | 211 (15.3%) |
| 75 Years and over | 250 (32.1%) | 405 (42.4%) |
Disability Class: Self-Care Difficulty
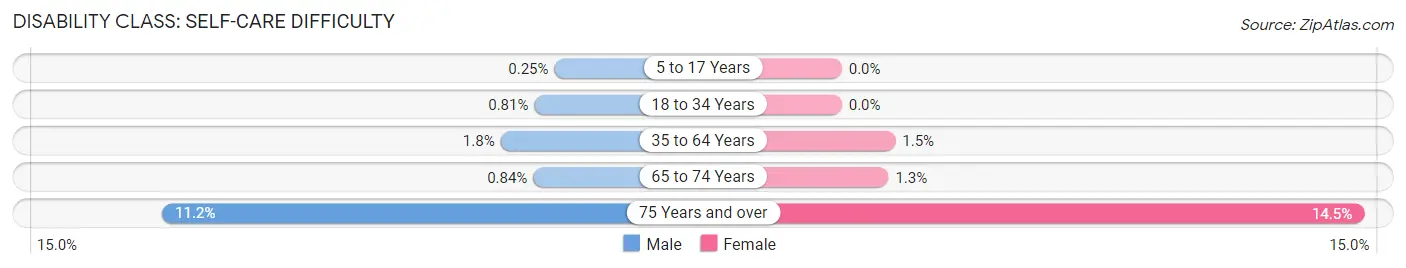
| Age Bracket | Male | Female |
| 5 to 17 Years | 5 (0.3%) | 0 (0.0%) |
| 18 to 34 Years | 19 (0.8%) | 0 (0.0%) |
| 35 to 64 Years | 70 (1.8%) | 60 (1.5%) |
| 65 to 74 Years | 11 (0.8%) | 18 (1.3%) |
| 75 Years and over | 87 (11.2%) | 139 (14.5%) |
Technology Access in Panola County
Computing Device Access in Panola County
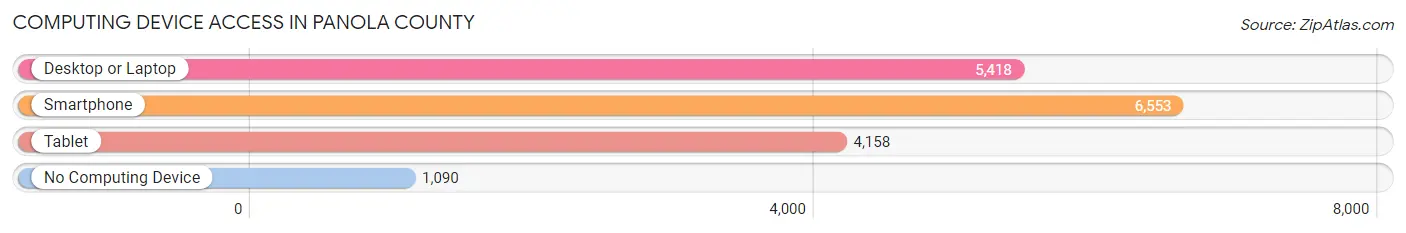
| Device Type | # Households | % Households |
| Desktop or Laptop | 5,418 | 67.2% |
| Smartphone | 6,553 | 81.3% |
| Tablet | 4,158 | 51.6% |
| No Computing Device | 1,090 | 13.5% |
| Total | 8,062 | 100.0% |
Internet Access in Panola County
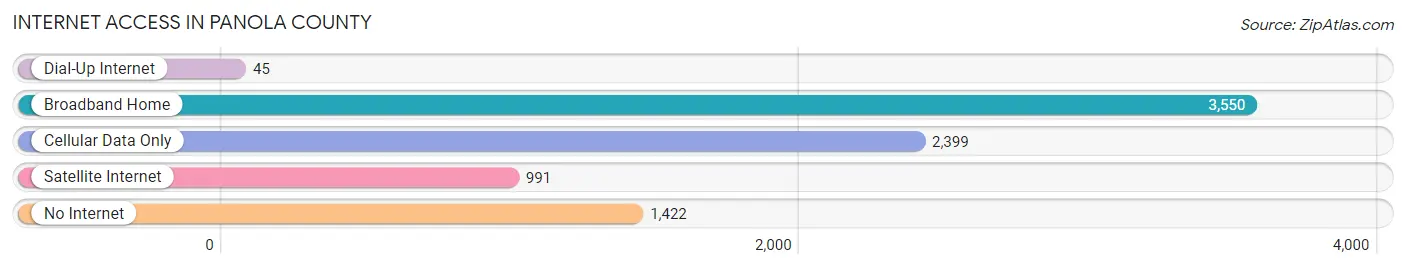
| Internet Type | # Households | % Households |
| Dial-Up Internet | 45 | 0.6% |
| Broadband Home | 3,550 | 44.0% |
| Cellular Data Only | 2,399 | 29.8% |
| Satellite Internet | 991 | 12.3% |
| No Internet | 1,422 | 17.6% |
| Total | 8,062 | 100.0% |
Panola County Summary
Panola County is located in the northeastern corner of Texas, and is part of the Longview Metropolitan Statistical Area. The county is bordered by Harrison County to the north, Rusk County to the east, Shelby County to the south, and Harrison and Upshur Counties to the west. The county seat is Carthage, and the largest city is Longview.
History
Panola County was established in 1846, and was named for a Choctaw Indian word meaning “cotton.” The county was originally part of Harrison County, and was created by the Texas Legislature in 1846. The first settlers in the area were mostly from the southern states, and the county was largely agricultural. The first county seat was at Belmont, but it was moved to Carthage in 1848.
The county was a major cotton producer during the 19th century, and the economy was largely based on agriculture. The county was also home to several sawmills and gristmills, and the town of Longview was established in 1871. The town quickly grew, and by the early 20th century it had become the largest city in the county.
Geography
Panola County covers an area of 845 square miles, and is located in the northeastern corner of Texas. The county is bordered by Harrison County to the north, Rusk County to the east, Shelby County to the south, and Harrison and Upshur Counties to the west. The county is mostly flat, with some rolling hills in the western part of the county. The Sabine River forms the northern border of the county, and the Neches River forms the eastern border.
The county is home to several state parks, including Martin Creek Lake State Park, Caddo Lake State Park, and Lake O’ the Pines State Park. The county is also home to several wildlife management areas, including the Caddo National Grasslands and the Sabine National Forest.
Economy
The economy of Panola County is largely based on agriculture and oil and gas production. The county is home to several large oil and gas companies, including Chevron, ExxonMobil, and Shell. Agriculture is also an important part of the economy, and the county is home to several large farms and ranches. The county is also home to several manufacturing companies, including a paper mill and a steel mill.
Demographics
As of the 2010 census, the population of Panola County was 23,796. The population is largely white (83.3%), with African Americans making up 11.3% of the population. Hispanics make up 4.3% of the population, and Asians make up 0.7%. The median household income is $41,945, and the median home value is $97,400.
Panola County is a rural county, and the population is spread out across the county. The largest city in the county is Longview, which has a population of 81,737. The other cities in the county are Carthage (6,779), Tatum (1,845), and Gary (1,072). The county is served by several school districts, including the Longview Independent School District, the Carthage Independent School District, and the Tatum Independent School District.
Common Questions
What is Per Capita Income in Panola County?
Per Capita income in Panola County is $32,024.
What is the Median Family Income in Panola County?
Median Family Income in Panola County is $81,143.
What is the Median Household income in Panola County?
Median Household Income in Panola County is $58,205.
What is Income or Wage Gap in Panola County?
Income or Wage Gap in Panola County is 34.9%.
Women in Panola County earn 65.1 cents for every dollar earned by a man.
What is Family Income Deficit in Panola County?
Family Income Deficit in Panola County is $13,274.
Families that are below poverty line in Panola County earn $13,274 less on average than the poverty threshold level.
What is Inequality or Gini Index in Panola County?
Inequality or Gini Index in Panola County is 0.49.
What is the Total Population of Panola County?
Total Population of Panola County is 22,540.
What is the Total Male Population of Panola County?
Total Male Population of Panola County is 11,276.
What is the Total Female Population of Panola County?
Total Female Population of Panola County is 11,264.
What is the Ratio of Males per 100 Females in Panola County?
There are 100.11 Males per 100 Females in Panola County.
What is the Ratio of Females per 100 Males in Panola County?
There are 99.89 Females per 100 Males in Panola County.
What is the Median Population Age in Panola County?
Median Population Age in Panola County is 39.2 Years.
What is the Average Family Size in Panola County
Average Family Size in Panola County is 3.5 People.
What is the Average Household Size in Panola County
Average Household Size in Panola County is 2.7 People.
How Large is the Labor Force in Panola County?
There are 9,942 People in the Labor Forcein in Panola County.
What is the Percentage of People in the Labor Force in Panola County?
55.6% of People are in the Labor Force in Panola County.
What is the Unemployment Rate in Panola County?
Unemployment Rate in Panola County is 2.9%.