Palo Pinto County, TX Map & Demographics
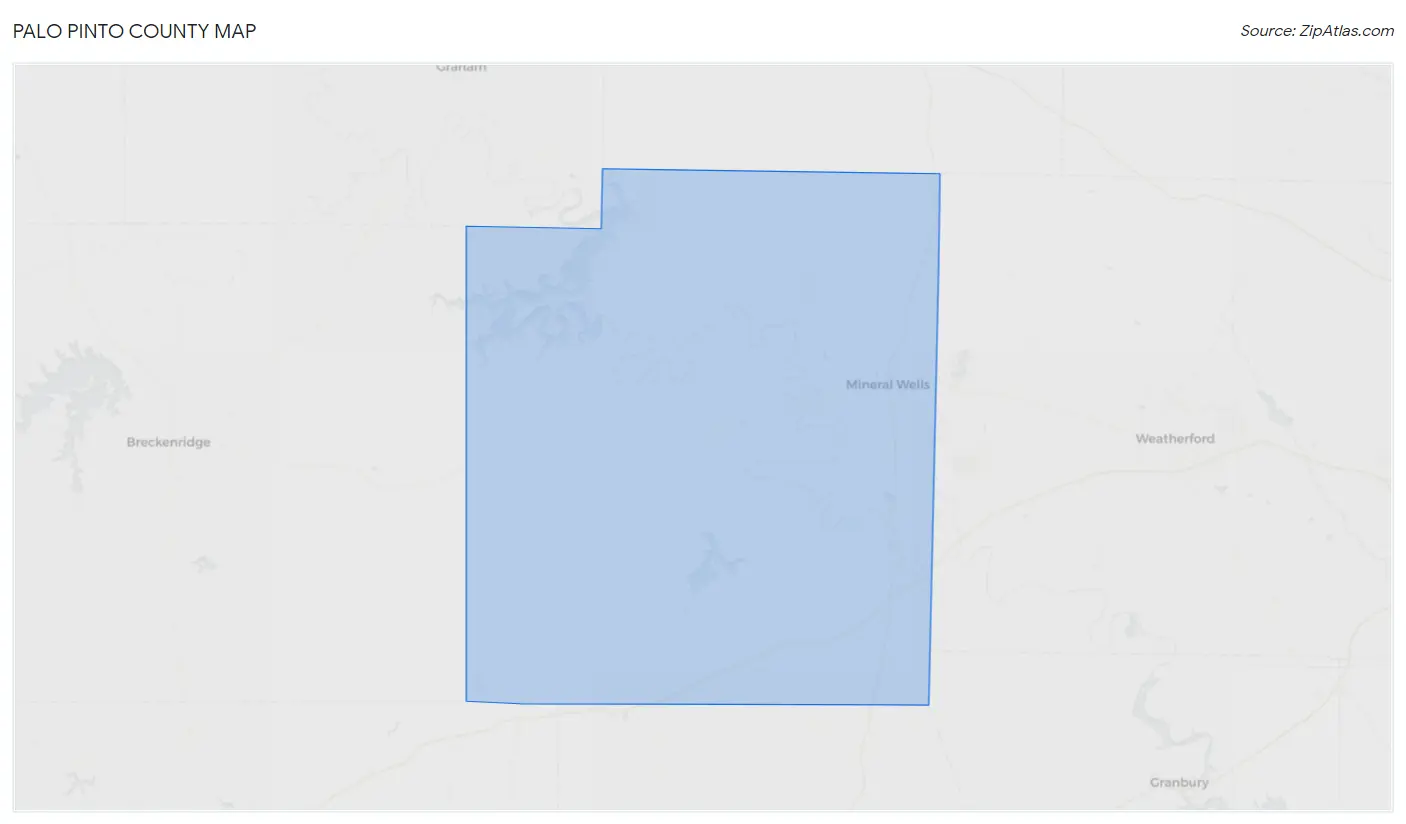
Palo Pinto County Map
Palo Pinto County Overview
$31,890
PER CAPITA INCOME
$76,647
AVG FAMILY INCOME
$65,242
AVG HOUSEHOLD INCOME
33.9%
WAGE / INCOME GAP [ % ]
66.1¢/ $1
WAGE / INCOME GAP [ $ ]
$9,944
FAMILY INCOME DEFICIT
0.45
INEQUALITY / GINI INDEX
28,569
TOTAL POPULATION
14,050
MALE POPULATION
14,519
FEMALE POPULATION
96.77
MALES / 100 FEMALES
103.34
FEMALES / 100 MALES
41.3
MEDIAN AGE
3.2
AVG FAMILY SIZE
2.7
AVG HOUSEHOLD SIZE
13,211
LABOR FORCE [ PEOPLE ]
58.5%
PERCENT IN LABOR FORCE
7.3%
UNEMPLOYMENT RATE
Income in Palo Pinto County
Income Overview in Palo Pinto County
Per Capita Income in Palo Pinto County is $31,890, while median incomes of families and households are $76,647 and $65,242 respectively.
| Characteristic | Number | Measure |
| Per Capita Income | 28,569 | $31,890 |
| Median Family Income | 7,263 | $76,647 |
| Mean Family Income | 7,263 | $95,940 |
| Median Household Income | 10,640 | $65,242 |
| Mean Household Income | 10,640 | $84,036 |
| Income Deficit | 7,263 | $9,944 |
| Wage / Income Gap (%) | 28,569 | 33.91% |
| Wage / Income Gap ($) | 28,569 | 66.09¢ per $1 |
| Gini / Inequality Index | 28,569 | 0.45 |
Earnings by Sex in Palo Pinto County
Average Earnings in Palo Pinto County are $37,286, $44,251 for men and $29,246 for women, a difference of 33.9%.
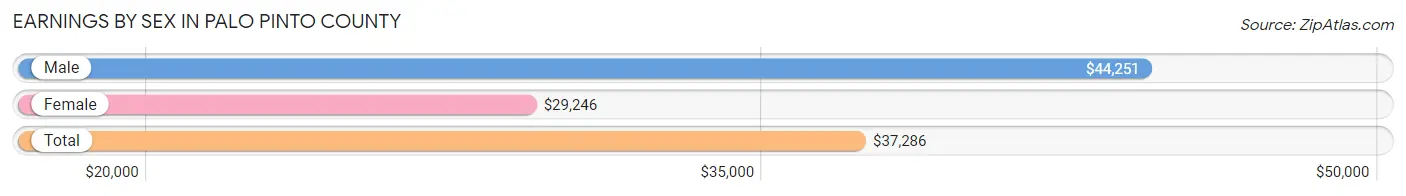
| Sex | Number | Average Earnings |
| Male | 7,300 (53.6%) | $44,251 |
| Female | 6,313 (46.4%) | $29,246 |
| Total | 13,613 (100.0%) | $37,286 |
Earnings by Sex by Income Bracket in Palo Pinto County
The most common earnings brackets in Palo Pinto County are $100,000+ for men (943 | 12.9%) and $55,000 to $64,999 for women (498 | 7.9%).
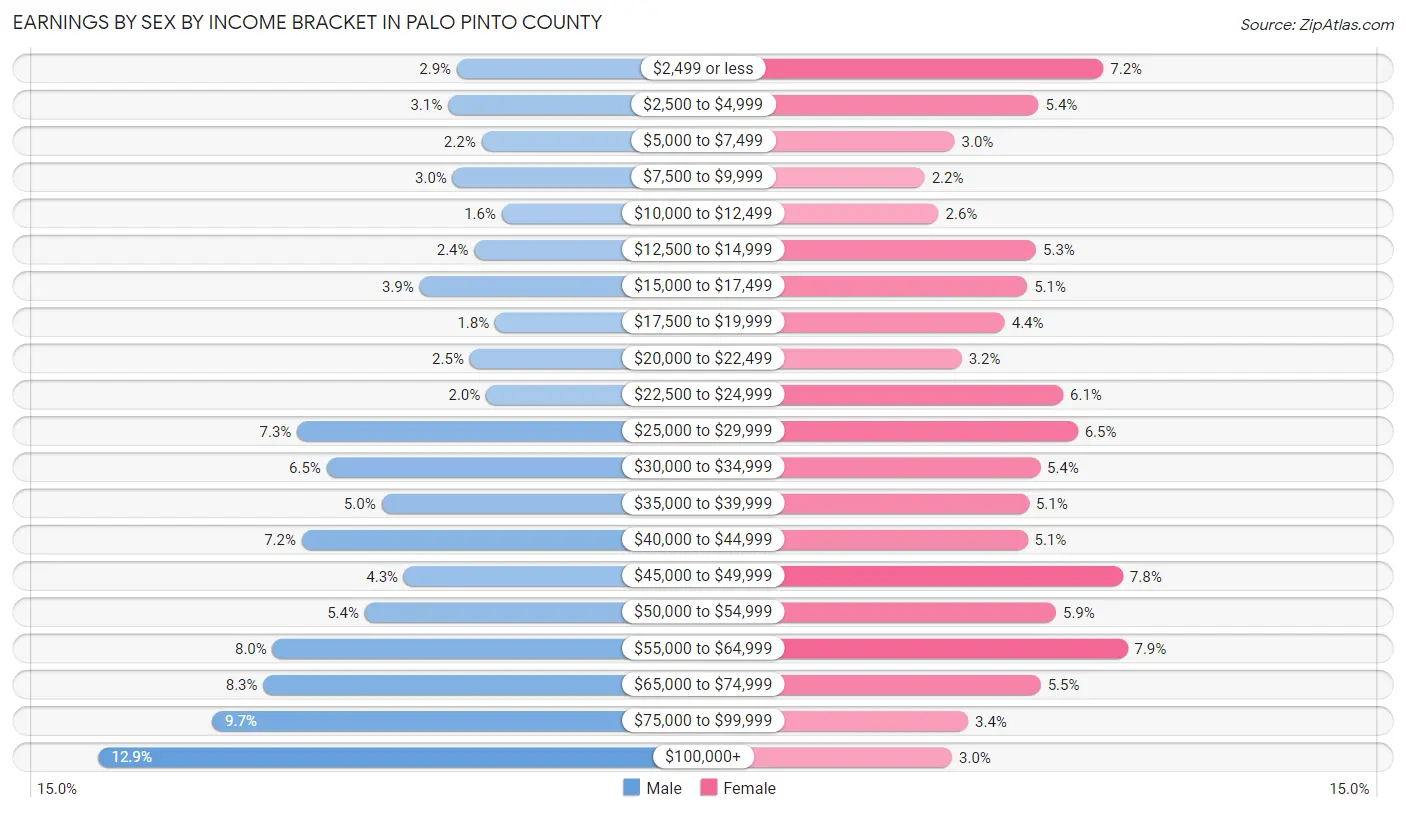
| Income | Male | Female |
| $2,499 or less | 208 (2.9%) | 455 (7.2%) |
| $2,500 to $4,999 | 226 (3.1%) | 340 (5.4%) |
| $5,000 to $7,499 | 158 (2.2%) | 191 (3.0%) |
| $7,500 to $9,999 | 217 (3.0%) | 138 (2.2%) |
| $10,000 to $12,499 | 116 (1.6%) | 163 (2.6%) |
| $12,500 to $14,999 | 172 (2.4%) | 336 (5.3%) |
| $15,000 to $17,499 | 285 (3.9%) | 320 (5.1%) |
| $17,500 to $19,999 | 130 (1.8%) | 280 (4.4%) |
| $20,000 to $22,499 | 182 (2.5%) | 204 (3.2%) |
| $22,500 to $24,999 | 148 (2.0%) | 384 (6.1%) |
| $25,000 to $29,999 | 536 (7.3%) | 410 (6.5%) |
| $30,000 to $34,999 | 475 (6.5%) | 343 (5.4%) |
| $35,000 to $39,999 | 363 (5.0%) | 323 (5.1%) |
| $40,000 to $44,999 | 526 (7.2%) | 321 (5.1%) |
| $45,000 to $49,999 | 317 (4.3%) | 490 (7.8%) |
| $50,000 to $54,999 | 397 (5.4%) | 371 (5.9%) |
| $55,000 to $64,999 | 586 (8.0%) | 498 (7.9%) |
| $65,000 to $74,999 | 605 (8.3%) | 344 (5.4%) |
| $75,000 to $99,999 | 710 (9.7%) | 215 (3.4%) |
| $100,000+ | 943 (12.9%) | 187 (3.0%) |
| Total | 7,300 (100.0%) | 6,313 (100.0%) |
Earnings by Sex by Educational Attainment in Palo Pinto County
Average earnings in Palo Pinto County are $49,226 for men and $33,479 for women, a difference of 32.0%. Men with an educational attainment of graduate degree enjoy the highest average annual earnings of $91,006, while those with less than high school education earn the least with $33,906. Women with an educational attainment of graduate degree earn the most with the average annual earnings of $59,959, while those with less than high school education have the smallest earnings of $20,427.
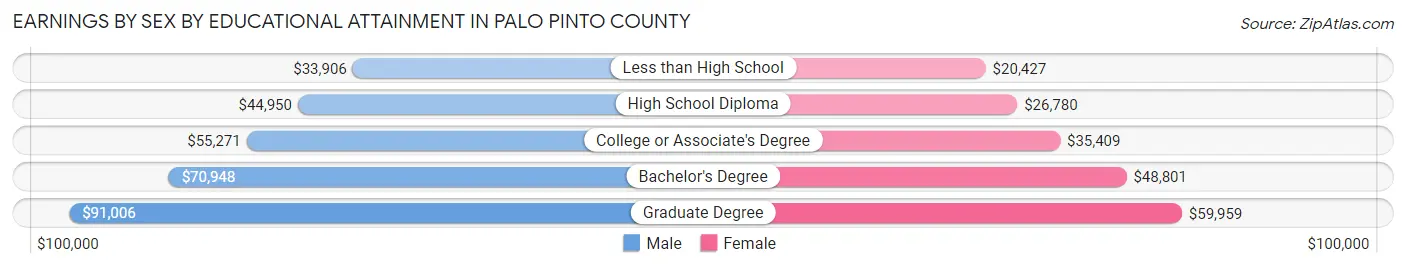
| Educational Attainment | Male Income | Female Income |
| Less than High School | $33,906 | $20,427 |
| High School Diploma | $44,950 | $26,780 |
| College or Associate's Degree | $55,271 | $35,409 |
| Bachelor's Degree | $70,948 | $48,801 |
| Graduate Degree | $91,006 | $59,959 |
| Total | $49,226 | $33,479 |
Family Income in Palo Pinto County
Family Income Brackets in Palo Pinto County
According to the Palo Pinto County family income data, there are 1,474 families falling into the $100,000 to $149,999 income range, which is the most common income bracket and makes up 20.3% of all families. Conversely, the $10,000 to $14,999 income bracket is the least frequent group with only 58 families (0.8%) belonging to this category.
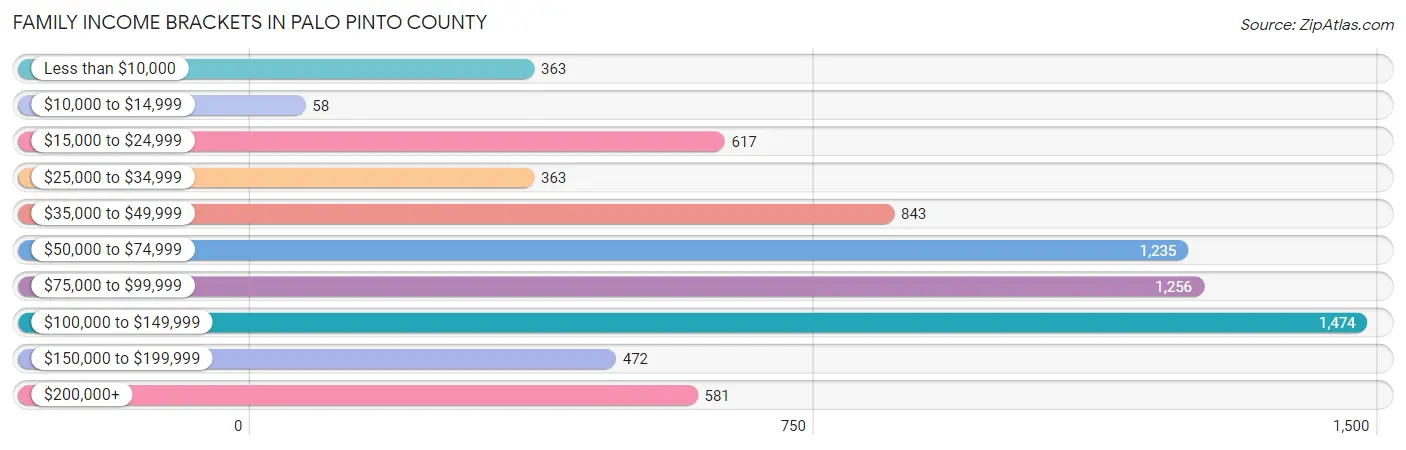
| Income Bracket | # Families | % Families |
| Less than $10,000 | 363 | 5.0% |
| $10,000 to $14,999 | 58 | 0.8% |
| $15,000 to $24,999 | 617 | 8.5% |
| $25,000 to $34,999 | 363 | 5.0% |
| $35,000 to $49,999 | 843 | 11.6% |
| $50,000 to $74,999 | 1,235 | 17.0% |
| $75,000 to $99,999 | 1,256 | 17.3% |
| $100,000 to $149,999 | 1,474 | 20.3% |
| $150,000 to $199,999 | 472 | 6.5% |
| $200,000+ | 581 | 8.0% |
Family Income by Famaliy Size in Palo Pinto County
7+ person families (154 | 2.1%) account for the highest median family income in Palo Pinto County with $170,658 per family, while 2-person families (4,017 | 55.3%) have the highest median income of $38,144 per family member.
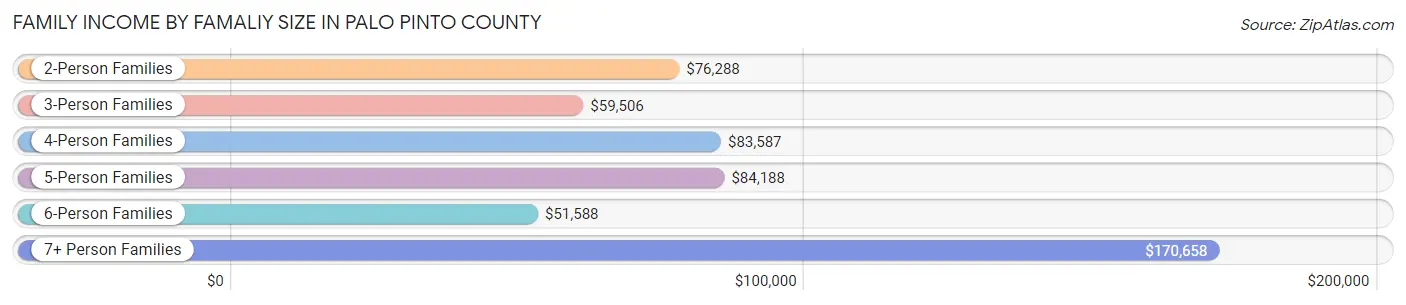
| Income Bracket | # Families | Median Income |
| 2-Person Families | 4,017 (55.3%) | $76,288 |
| 3-Person Families | 1,178 (16.2%) | $59,506 |
| 4-Person Families | 1,166 (16.1%) | $83,587 |
| 5-Person Families | 469 (6.5%) | $84,188 |
| 6-Person Families | 279 (3.8%) | $51,588 |
| 7+ Person Families | 154 (2.1%) | $170,658 |
| Total | 7,263 (100.0%) | $76,647 |
Family Income by Number of Earners in Palo Pinto County
The median family income in Palo Pinto County is $76,647, with families comprising 3+ earners (784) having the highest median family income of $126,806, while families with no earners (1,553) have the lowest median family income of $48,580, accounting for 10.8% and 21.4% of families, respectively.
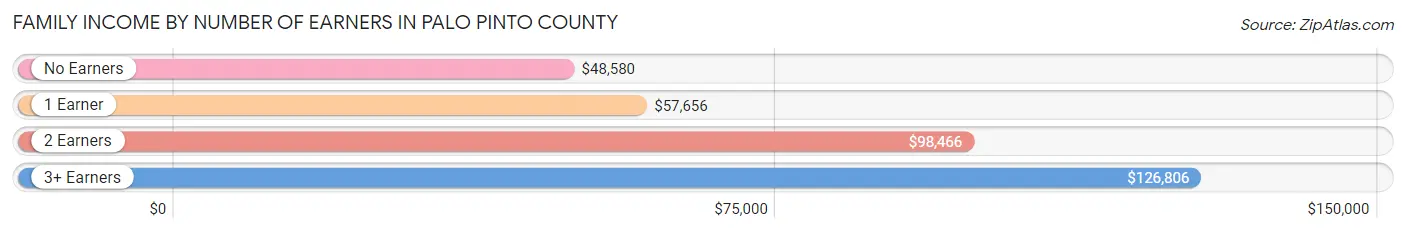
| Number of Earners | # Families | Median Income |
| No Earners | 1,553 (21.4%) | $48,580 |
| 1 Earner | 2,553 (35.1%) | $57,656 |
| 2 Earners | 2,373 (32.7%) | $98,466 |
| 3+ Earners | 784 (10.8%) | $126,806 |
| Total | 7,263 (100.0%) | $76,647 |
Household Income in Palo Pinto County
Household Income Brackets in Palo Pinto County
With 1,979 households falling in the category, the $50,000 to $74,999 income range is the most frequent in Palo Pinto County, accounting for 18.6% of all households. In contrast, only 309 households (2.9%) fall into the $10,000 to $14,999 income bracket, making it the least populous group.
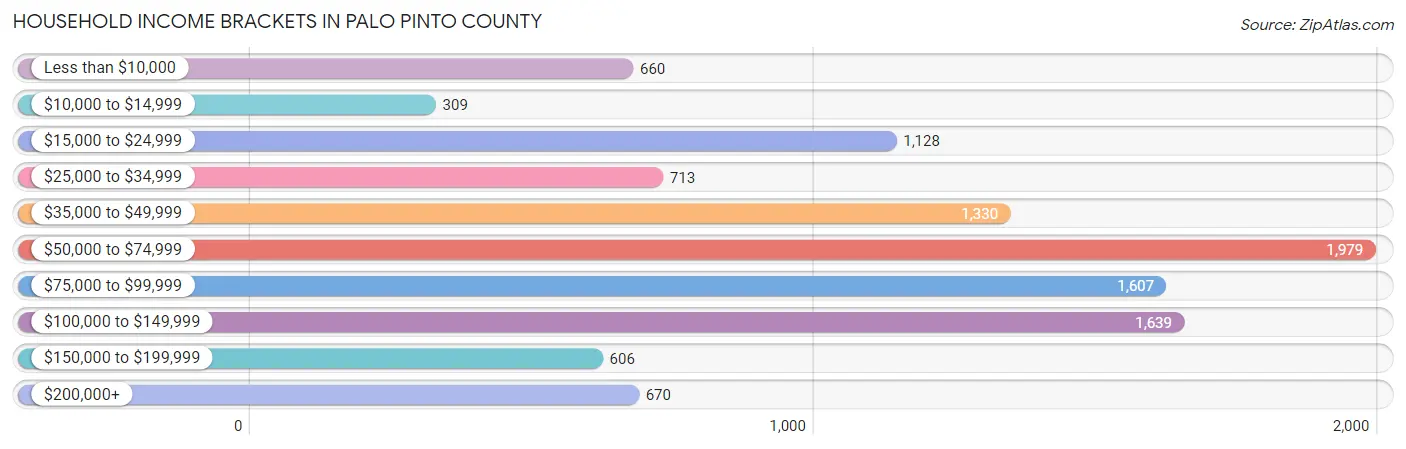
| Income Bracket | # Households | % Households |
| Less than $10,000 | 660 | 6.2% |
| $10,000 to $14,999 | 309 | 2.9% |
| $15,000 to $24,999 | 1,128 | 10.6% |
| $25,000 to $34,999 | 713 | 6.7% |
| $35,000 to $49,999 | 1,330 | 12.5% |
| $50,000 to $74,999 | 1,979 | 18.6% |
| $75,000 to $99,999 | 1,607 | 15.1% |
| $100,000 to $149,999 | 1,639 | 15.4% |
| $150,000 to $199,999 | 606 | 5.7% |
| $200,000+ | 670 | 6.3% |
Household Income by Householder Age in Palo Pinto County
The median household income in Palo Pinto County is $65,242, with the highest median household income of $72,500 found in the 45 to 64 years age bracket for the primary householder. A total of 4,020 households (37.8%) fall into this category. Meanwhile, the 65+ years age bracket for the primary householder has the lowest median household income of $54,393, with 3,270 households (30.7%) in this group.
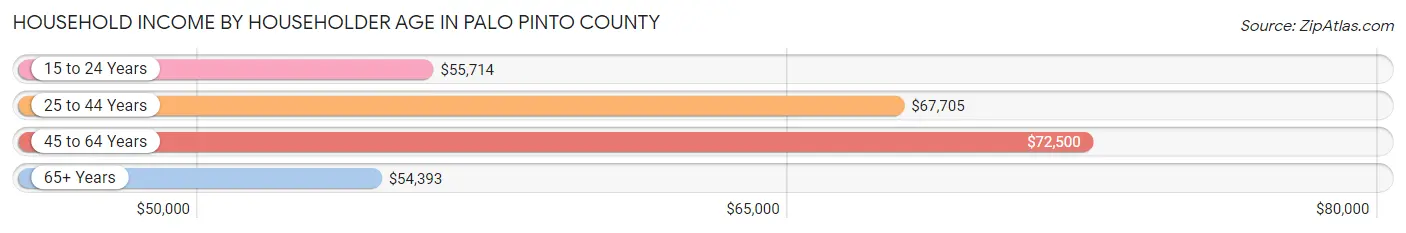
| Income Bracket | # Households | Median Income |
| 15 to 24 Years | 362 (3.4%) | $55,714 |
| 25 to 44 Years | 2,988 (28.1%) | $67,705 |
| 45 to 64 Years | 4,020 (37.8%) | $72,500 |
| 65+ Years | 3,270 (30.7%) | $54,393 |
| Total | 10,640 (100.0%) | $65,242 |
Poverty in Palo Pinto County
Income Below Poverty by Sex and Age in Palo Pinto County
With 14.1% poverty level for males and 17.5% for females among the residents of Palo Pinto County, under 5 year old males and 12 to 14 year old females are the most vulnerable to poverty, with 228 males (29.9%) and 168 females (29.5%) in their respective age groups living below the poverty level.
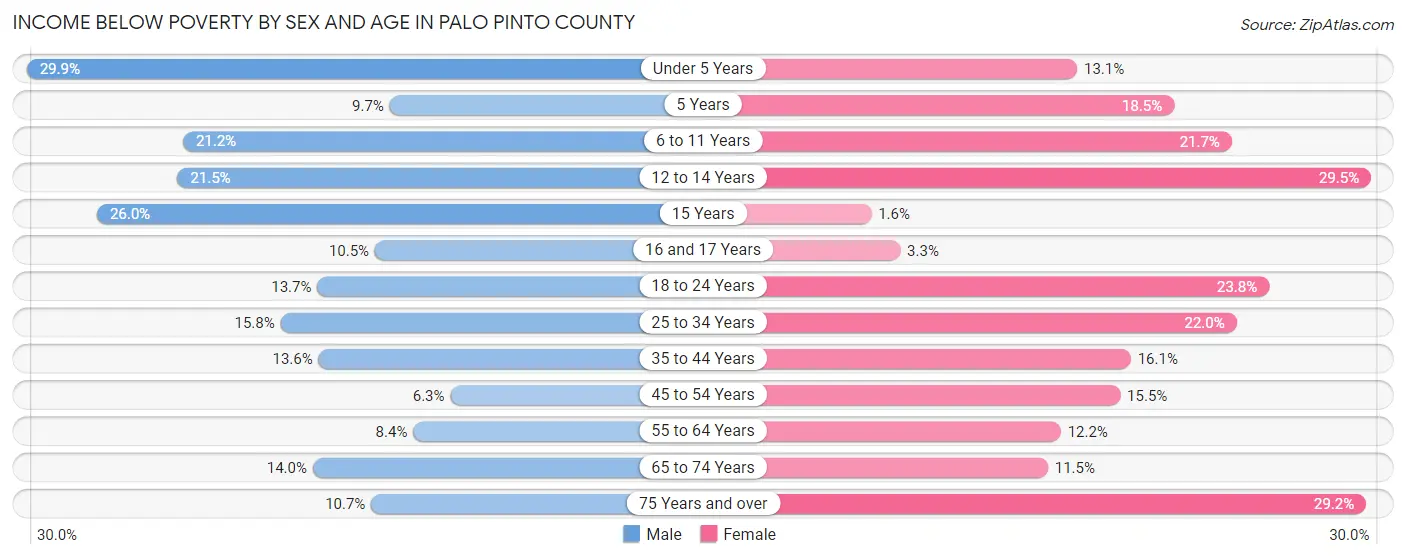
| Age Bracket | Male | Female |
| Under 5 Years | 228 (29.9%) | 118 (13.1%) |
| 5 Years | 29 (9.7%) | 32 (18.5%) |
| 6 to 11 Years | 233 (21.2%) | 221 (21.7%) |
| 12 to 14 Years | 150 (21.5%) | 168 (29.5%) |
| 15 Years | 60 (26.0%) | 3 (1.6%) |
| 16 and 17 Years | 30 (10.5%) | 12 (3.3%) |
| 18 to 24 Years | 161 (13.7%) | 305 (23.8%) |
| 25 to 34 Years | 255 (15.8%) | 353 (22.0%) |
| 35 to 44 Years | 197 (13.6%) | 266 (16.1%) |
| 45 to 54 Years | 103 (6.3%) | 257 (15.5%) |
| 55 to 64 Years | 167 (8.4%) | 257 (12.2%) |
| 65 to 74 Years | 234 (14.0%) | 197 (11.5%) |
| 75 Years and over | 99 (10.7%) | 338 (29.2%) |
| Total | 1,946 (14.1%) | 2,527 (17.5%) |
Income Above Poverty by Sex and Age in Palo Pinto County
According to the poverty statistics in Palo Pinto County, males aged 45 to 54 years and females aged 15 years are the age groups that are most secure financially, with 93.7% of males and 98.4% of females in these age groups living above the poverty line.
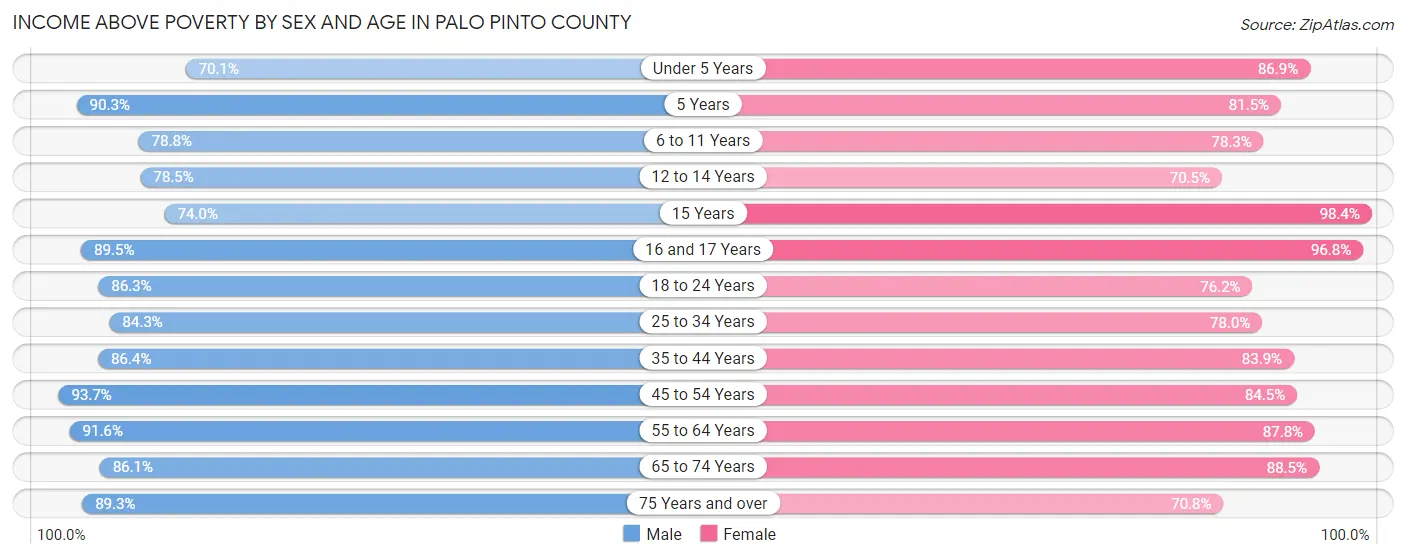
| Age Bracket | Male | Female |
| Under 5 Years | 535 (70.1%) | 783 (86.9%) |
| 5 Years | 271 (90.3%) | 141 (81.5%) |
| 6 to 11 Years | 867 (78.8%) | 797 (78.3%) |
| 12 to 14 Years | 548 (78.5%) | 402 (70.5%) |
| 15 Years | 171 (74.0%) | 180 (98.4%) |
| 16 and 17 Years | 256 (89.5%) | 357 (96.8%) |
| 18 to 24 Years | 1,014 (86.3%) | 977 (76.2%) |
| 25 to 34 Years | 1,364 (84.3%) | 1,253 (78.0%) |
| 35 to 44 Years | 1,248 (86.4%) | 1,387 (83.9%) |
| 45 to 54 Years | 1,534 (93.7%) | 1,401 (84.5%) |
| 55 to 64 Years | 1,831 (91.6%) | 1,851 (87.8%) |
| 65 to 74 Years | 1,443 (86.1%) | 1,520 (88.5%) |
| 75 Years and over | 826 (89.3%) | 820 (70.8%) |
| Total | 11,908 (86.0%) | 11,869 (82.5%) |
Income Below Poverty Among Married-Couple Families in Palo Pinto County
The poverty statistics for married-couple families in Palo Pinto County show that 7.9% or 427 of the total 5,391 families live below the poverty line. Families with 3 or 4 children have the highest poverty rate of 21.2%, comprising of 112 families. On the other hand, families with 5 or more children have the lowest poverty rate of 0.0%, which includes 0 families.
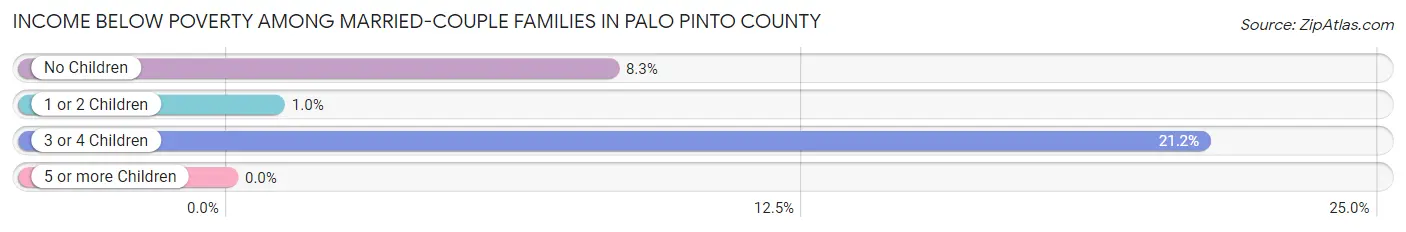
| Children | Above Poverty | Below Poverty |
| No Children | 3,352 (91.7%) | 303 (8.3%) |
| 1 or 2 Children | 1,170 (99.0%) | 12 (1.0%) |
| 3 or 4 Children | 417 (78.8%) | 112 (21.2%) |
| 5 or more Children | 25 (100.0%) | 0 (0.0%) |
| Total | 4,964 (92.1%) | 427 (7.9%) |
Income Below Poverty Among Single-Parent Households in Palo Pinto County
According to the poverty data in Palo Pinto County, 14.7% or 81 single-father households and 25.5% or 337 single-mother households are living below the poverty line. Among single-father households, those with 1 or 2 children have the highest poverty rate, with 79 households (28.9%) experiencing poverty. Likewise, among single-mother households, those with 3 or 4 children have the highest poverty rate, with 97 households (44.5%) falling below the poverty line.
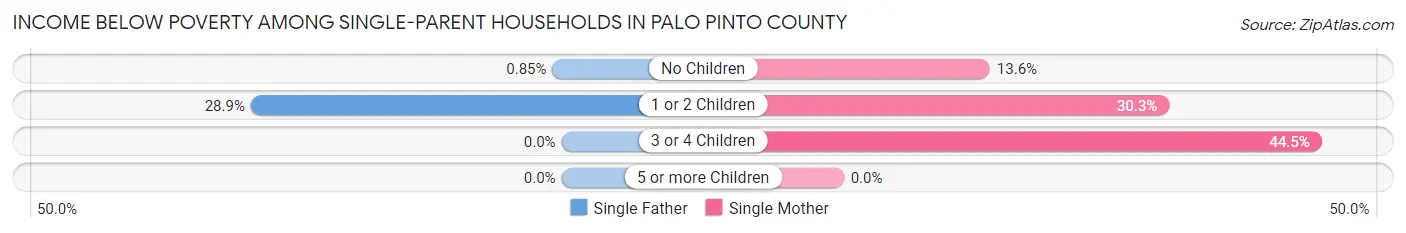
| Children | Single Father | Single Mother |
| No Children | 2 (0.9%) | 76 (13.6%) |
| 1 or 2 Children | 79 (28.9%) | 164 (30.3%) |
| 3 or 4 Children | 0 (0.0%) | 97 (44.5%) |
| 5 or more Children | 0 (0.0%) | 0 (0.0%) |
| Total | 81 (14.7%) | 337 (25.5%) |
Income Below Poverty Among Married-Couple vs Single-Parent Households in Palo Pinto County
The poverty data for Palo Pinto County shows that 427 of the married-couple family households (7.9%) and 418 of the single-parent households (22.3%) are living below the poverty level. Within the married-couple family households, those with 3 or 4 children have the highest poverty rate, with 112 households (21.2%) falling below the poverty line. Among the single-parent households, those with 3 or 4 children have the highest poverty rate, with 97 household (37.2%) living below poverty.
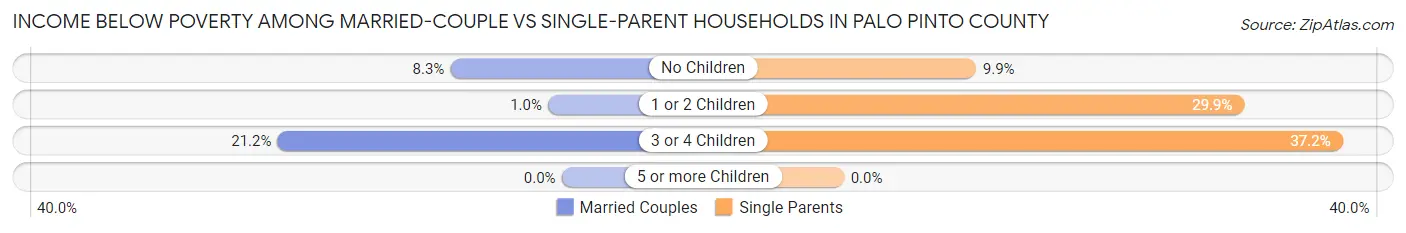
| Children | Married-Couple Families | Single-Parent Households |
| No Children | 303 (8.3%) | 78 (9.9%) |
| 1 or 2 Children | 12 (1.0%) | 243 (29.8%) |
| 3 or 4 Children | 112 (21.2%) | 97 (37.2%) |
| 5 or more Children | 0 (0.0%) | 0 (0.0%) |
| Total | 427 (7.9%) | 418 (22.3%) |
Race in Palo Pinto County
The most populous races in Palo Pinto County are White / Caucasian (24,211 | 84.8%), Hispanic or Latino (5,851 | 20.5%), and Two or more Races (2,041 | 7.1%).
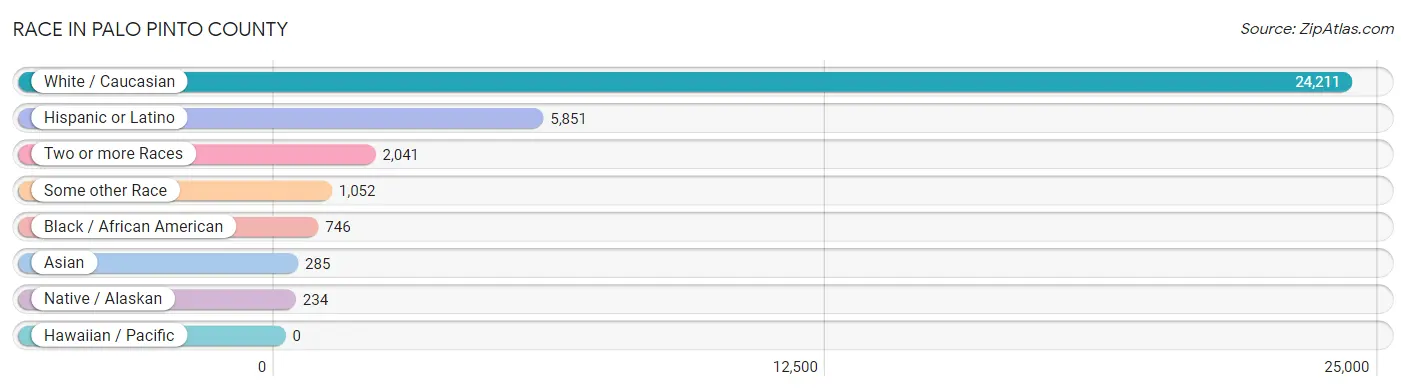
| Race | # Population | % Population |
| Asian | 285 | 1.0% |
| Black / African American | 746 | 2.6% |
| Hawaiian / Pacific | 0 | 0.0% |
| Hispanic or Latino | 5,851 | 20.5% |
| Native / Alaskan | 234 | 0.8% |
| White / Caucasian | 24,211 | 84.8% |
| Two or more Races | 2,041 | 7.1% |
| Some other Race | 1,052 | 3.7% |
| Total | 28,569 | 100.0% |
Ancestry in Palo Pinto County
The most populous ancestries reported in Palo Pinto County are Mexican (4,975 | 17.4%), English (3,520 | 12.3%), Irish (3,114 | 10.9%), German (2,803 | 9.8%), and American (2,783 | 9.7%), together accounting for 60.2% of all Palo Pinto County residents.
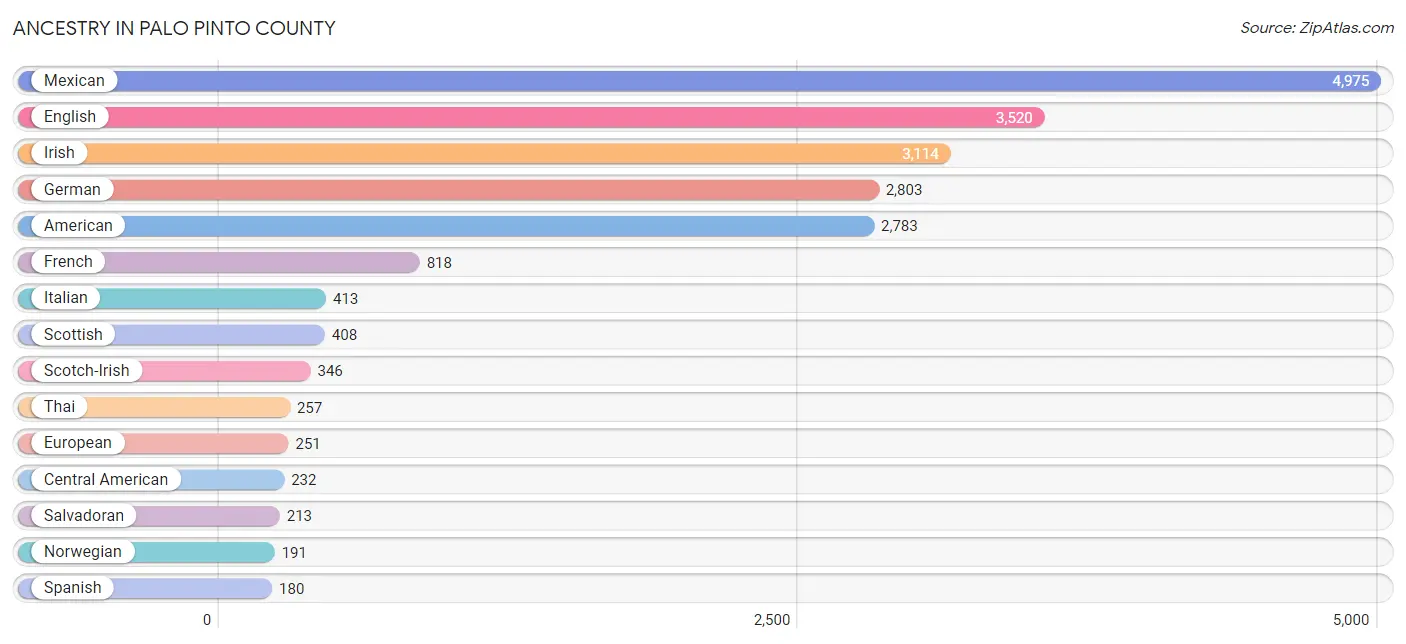
| Ancestry | # Population | % Population |
| African | 24 | 0.1% |
| American | 2,783 | 9.7% |
| Apache | 15 | 0.1% |
| Austrian | 5 | 0.0% |
| Basque | 9 | 0.0% |
| Bhutanese | 44 | 0.2% |
| Blackfeet | 9 | 0.0% |
| British | 59 | 0.2% |
| Cajun | 152 | 0.5% |
| Canadian | 17 | 0.1% |
| Celtic | 10 | 0.0% |
| Central American | 232 | 0.8% |
| Central American Indian | 29 | 0.1% |
| Cherokee | 170 | 0.6% |
| Chickasaw | 2 | 0.0% |
| Choctaw | 62 | 0.2% |
| Comanche | 8 | 0.0% |
| Croatian | 5 | 0.0% |
| Cuban | 27 | 0.1% |
| Czech | 88 | 0.3% |
| Danish | 10 | 0.0% |
| Dutch | 122 | 0.4% |
| Dutch West Indian | 42 | 0.2% |
| Eastern European | 25 | 0.1% |
| English | 3,520 | 12.3% |
| European | 251 | 0.9% |
| French | 818 | 2.9% |
| French Canadian | 37 | 0.1% |
| German | 2,803 | 9.8% |
| German Russian | 8 | 0.0% |
| Guatemalan | 19 | 0.1% |
| Hungarian | 42 | 0.2% |
| Icelander | 15 | 0.1% |
| Indian (Asian) | 7 | 0.0% |
| Irish | 3,114 | 10.9% |
| Italian | 413 | 1.5% |
| Lithuanian | 3 | 0.0% |
| Mexican | 4,975 | 17.4% |
| Native Hawaiian | 5 | 0.0% |
| Northern European | 37 | 0.1% |
| Norwegian | 191 | 0.7% |
| Osage | 4 | 0.0% |
| Pennsylvania German | 46 | 0.2% |
| Polish | 143 | 0.5% |
| Portuguese | 132 | 0.5% |
| Puerto Rican | 165 | 0.6% |
| Romanian | 4 | 0.0% |
| Russian | 6 | 0.0% |
| Salvadoran | 213 | 0.7% |
| Scandinavian | 162 | 0.6% |
| Scotch-Irish | 346 | 1.2% |
| Scottish | 408 | 1.4% |
| Sioux | 13 | 0.1% |
| Slovene | 8 | 0.0% |
| Spaniard | 130 | 0.5% |
| Spanish | 180 | 0.6% |
| Spanish American | 3 | 0.0% |
| Subsaharan African | 24 | 0.1% |
| Swedish | 125 | 0.4% |
| Swiss | 16 | 0.1% |
| Thai | 257 | 0.9% |
| Welsh | 107 | 0.4% |
| Yugoslavian | 5 | 0.0% | View All 63 Rows |
Immigrants in Palo Pinto County
The most numerous immigrant groups reported in Palo Pinto County came from Latin America (1,151 | 4.0%), Central America (1,129 | 4.0%), Mexico (1,043 | 3.6%), Asia (176 | 0.6%), and India (169 | 0.6%), together accounting for 12.8% of all Palo Pinto County residents.
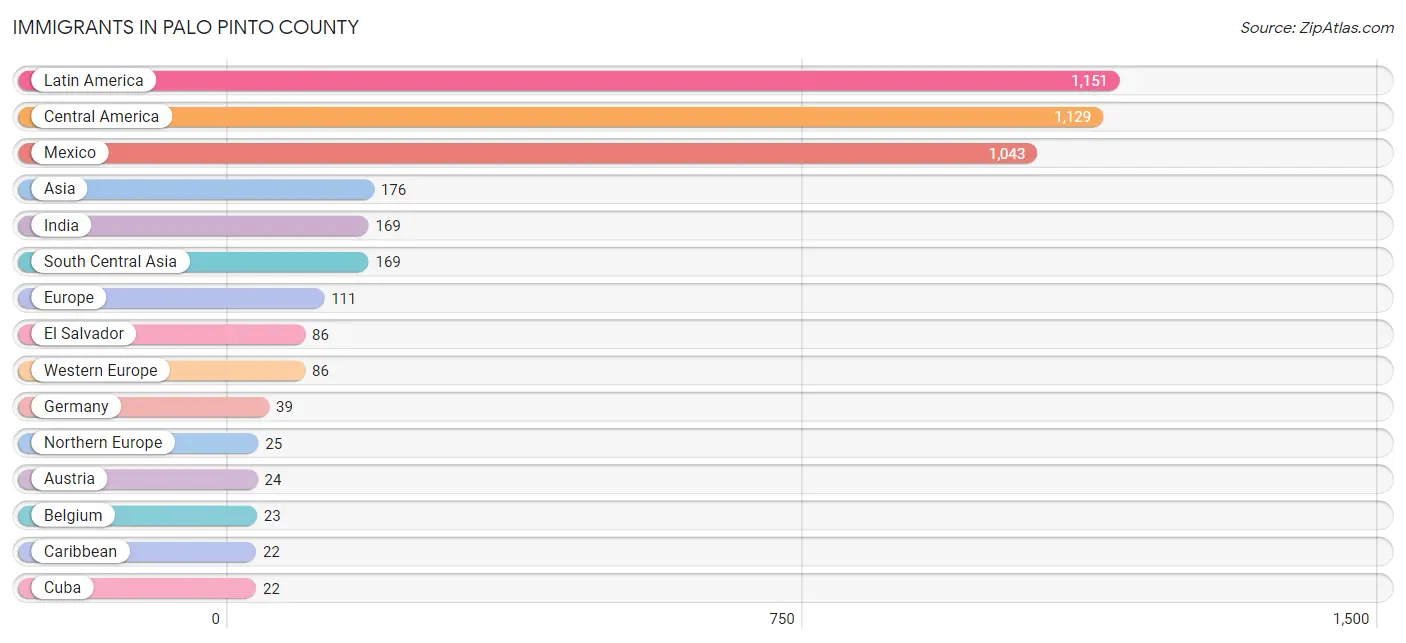
| Immigration Origin | # Population | % Population |
| Asia | 176 | 0.6% |
| Austria | 24 | 0.1% |
| Belgium | 23 | 0.1% |
| Canada | 12 | 0.0% |
| Caribbean | 22 | 0.1% |
| Central America | 1,129 | 4.0% |
| China | 7 | 0.0% |
| Cuba | 22 | 0.1% |
| Eastern Asia | 7 | 0.0% |
| El Salvador | 86 | 0.3% |
| Europe | 111 | 0.4% |
| Germany | 39 | 0.1% |
| India | 169 | 0.6% |
| Ireland | 4 | 0.0% |
| Latin America | 1,151 | 4.0% |
| Mexico | 1,043 | 3.6% |
| Northern Europe | 25 | 0.1% |
| Norway | 10 | 0.0% |
| South Central Asia | 169 | 0.6% |
| Taiwan | 7 | 0.0% |
| Western Europe | 86 | 0.3% | View All 21 Rows |
Sex and Age in Palo Pinto County
Sex and Age in Palo Pinto County
The most populous age groups in Palo Pinto County are 10 to 14 Years (1,164 | 8.3%) for men and 55 to 59 Years (1,080 | 7.4%) for women.
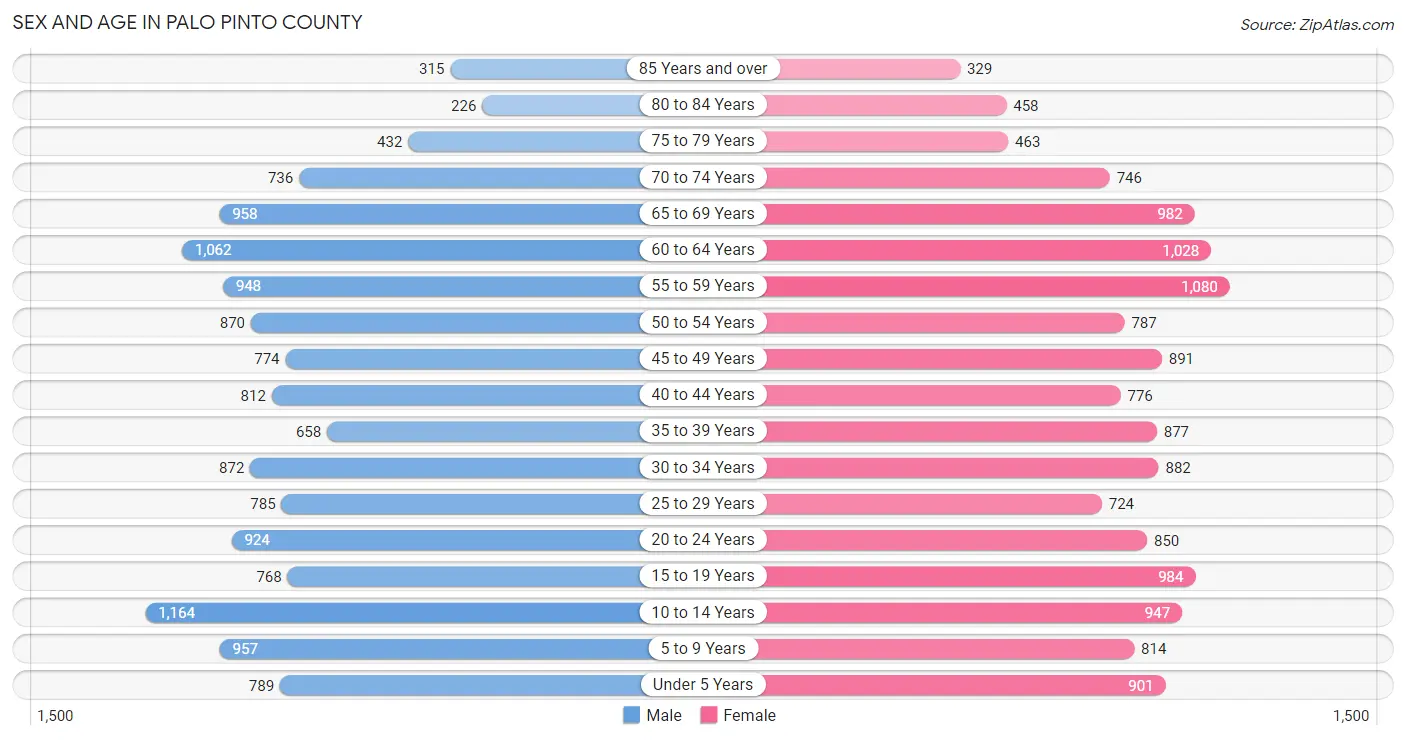
| Age Bracket | Male | Female |
| Under 5 Years | 789 (5.6%) | 901 (6.2%) |
| 5 to 9 Years | 957 (6.8%) | 814 (5.6%) |
| 10 to 14 Years | 1,164 (8.3%) | 947 (6.5%) |
| 15 to 19 Years | 768 (5.5%) | 984 (6.8%) |
| 20 to 24 Years | 924 (6.6%) | 850 (5.9%) |
| 25 to 29 Years | 785 (5.6%) | 724 (5.0%) |
| 30 to 34 Years | 872 (6.2%) | 882 (6.1%) |
| 35 to 39 Years | 658 (4.7%) | 877 (6.0%) |
| 40 to 44 Years | 812 (5.8%) | 776 (5.3%) |
| 45 to 49 Years | 774 (5.5%) | 891 (6.1%) |
| 50 to 54 Years | 870 (6.2%) | 787 (5.4%) |
| 55 to 59 Years | 948 (6.8%) | 1,080 (7.4%) |
| 60 to 64 Years | 1,062 (7.6%) | 1,028 (7.1%) |
| 65 to 69 Years | 958 (6.8%) | 982 (6.8%) |
| 70 to 74 Years | 736 (5.2%) | 746 (5.1%) |
| 75 to 79 Years | 432 (3.1%) | 463 (3.2%) |
| 80 to 84 Years | 226 (1.6%) | 458 (3.2%) |
| 85 Years and over | 315 (2.2%) | 329 (2.3%) |
| Total | 14,050 (100.0%) | 14,519 (100.0%) |
Families and Households in Palo Pinto County
Median Family Size in Palo Pinto County
The median family size in Palo Pinto County is 3.16 persons per family, with single male/father families (550 | 7.6%) accounting for the largest median family size of 3.97 persons per family. On the other hand, married-couple families (5,391 | 74.2%) represent the smallest median family size with 3.06 persons per family.
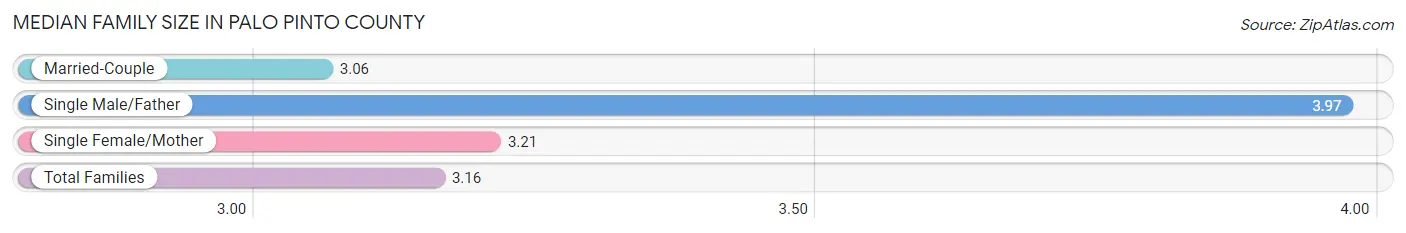
| Family Type | # Families | Family Size |
| Married-Couple | 5,391 (74.2%) | 3.06 |
| Single Male/Father | 550 (7.6%) | 3.97 |
| Single Female/Mother | 1,322 (18.2%) | 3.21 |
| Total Families | 7,263 (100.0%) | 3.16 |
Median Household Size in Palo Pinto County
The median household size in Palo Pinto County is 2.66 persons per household, with single male/father households (550 | 5.2%) accounting for the largest median household size of 4.94 persons per household. non-family households (3,377 | 31.7%) represent the smallest median household size with 1.25 persons per household.
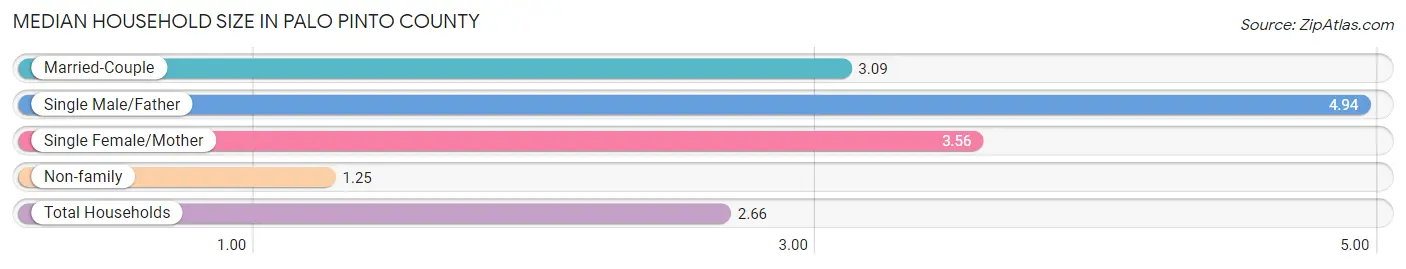
| Household Type | # Households | Household Size |
| Married-Couple | 5,391 (50.7%) | 3.09 |
| Single Male/Father | 550 (5.2%) | 4.94 |
| Single Female/Mother | 1,322 (12.4%) | 3.56 |
| Non-family | 3,377 (31.7%) | 1.25 |
| Total Households | 10,640 (100.0%) | 2.66 |
Household Size by Marriage Status in Palo Pinto County
Out of a total of 10,640 households in Palo Pinto County, 7,263 (68.3%) are family households, while 3,377 (31.7%) are nonfamily households. The most numerous type of family households are 2-person households, comprising 3,722, and the most common type of nonfamily households are 1-person households, comprising 2,754.
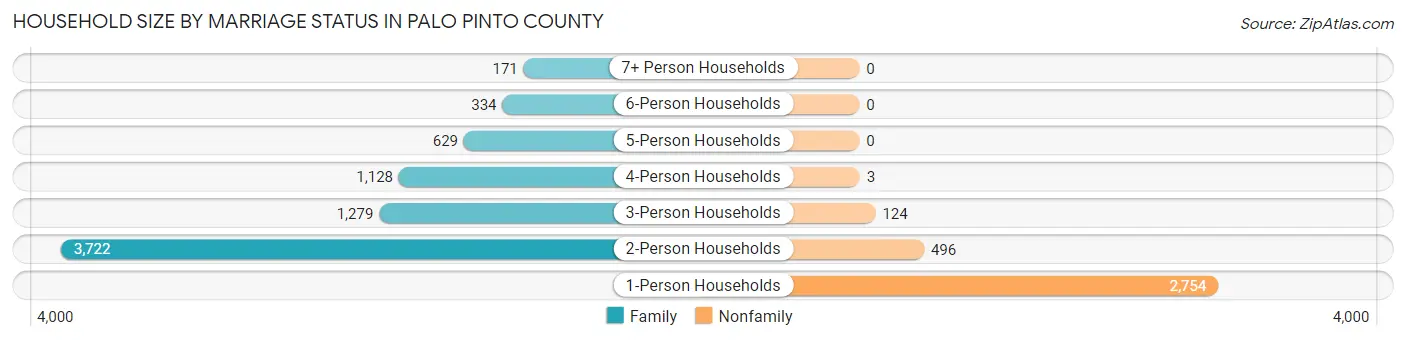
| Household Size | Family Households | Nonfamily Households |
| 1-Person Households | - | 2,754 (25.9%) |
| 2-Person Households | 3,722 (35.0%) | 496 (4.7%) |
| 3-Person Households | 1,279 (12.0%) | 124 (1.2%) |
| 4-Person Households | 1,128 (10.6%) | 3 (0.0%) |
| 5-Person Households | 629 (5.9%) | 0 (0.0%) |
| 6-Person Households | 334 (3.1%) | 0 (0.0%) |
| 7+ Person Households | 171 (1.6%) | 0 (0.0%) |
| Total | 7,263 (68.3%) | 3,377 (31.7%) |
Female Fertility in Palo Pinto County
Fertility by Age in Palo Pinto County
Average fertility rate in Palo Pinto County is 55.0 births per 1,000 women. Women in the age bracket of 20 to 34 years have the highest fertility rate with 124.0 births per 1,000 women. Women in the age bracket of 20 to 34 years acount for 90.2% of all women with births.
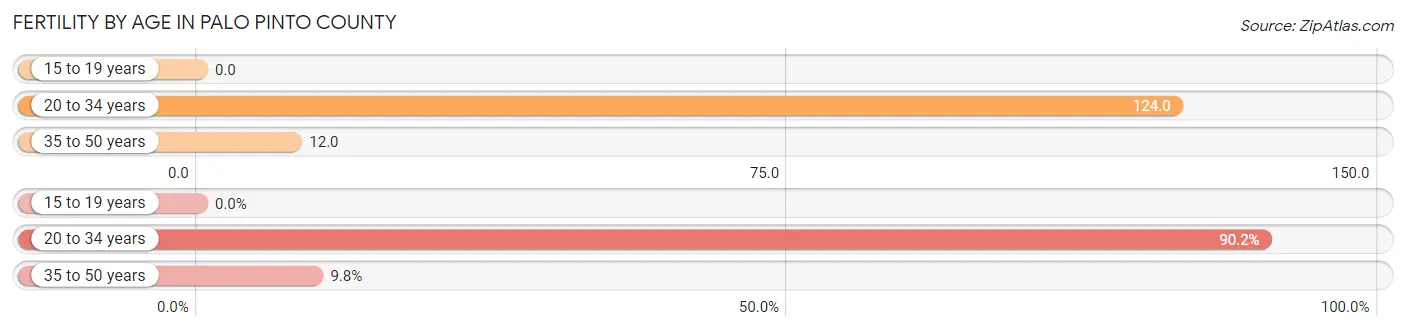
| Age Bracket | Women with Births | Births / 1,000 Women |
| 15 to 19 years | 0 (0.0%) | 0.0 |
| 20 to 34 years | 304 (90.2%) | 124.0 |
| 35 to 50 years | 33 (9.8%) | 12.0 |
| Total | 337 (100.0%) | 55.0 |
Fertility by Age by Marriage Status in Palo Pinto County
41.5% of women with births (337) in Palo Pinto County are married. The highest percentage of unmarried women with births falls into 35 to 50 years age bracket with 100.0% of them unmarried at the time of birth, while the lowest percentage of unmarried women with births belong to 20 to 34 years age bracket with 53.9% of them unmarried.
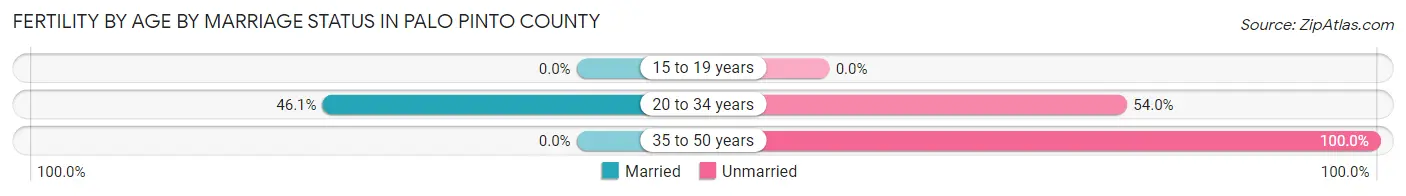
| Age Bracket | Married | Unmarried |
| 15 to 19 years | 0 (0.0%) | 0 (0.0%) |
| 20 to 34 years | 140 (46.1%) | 164 (53.9%) |
| 35 to 50 years | 0 (0.0%) | 33 (100.0%) |
| Total | 140 (41.5%) | 197 (58.5%) |
Fertility by Education in Palo Pinto County
Average fertility rate in Palo Pinto County is 55.0 births per 1,000 women. Women with the education attainment of high school diploma have the highest fertility rate of 77.0 births per 1,000 women, while women with the education attainment of less than high school have the lowest fertility at 16.0 births per 1,000 women. Women with the education attainment of high school diploma represent 46.0% of all women with births.
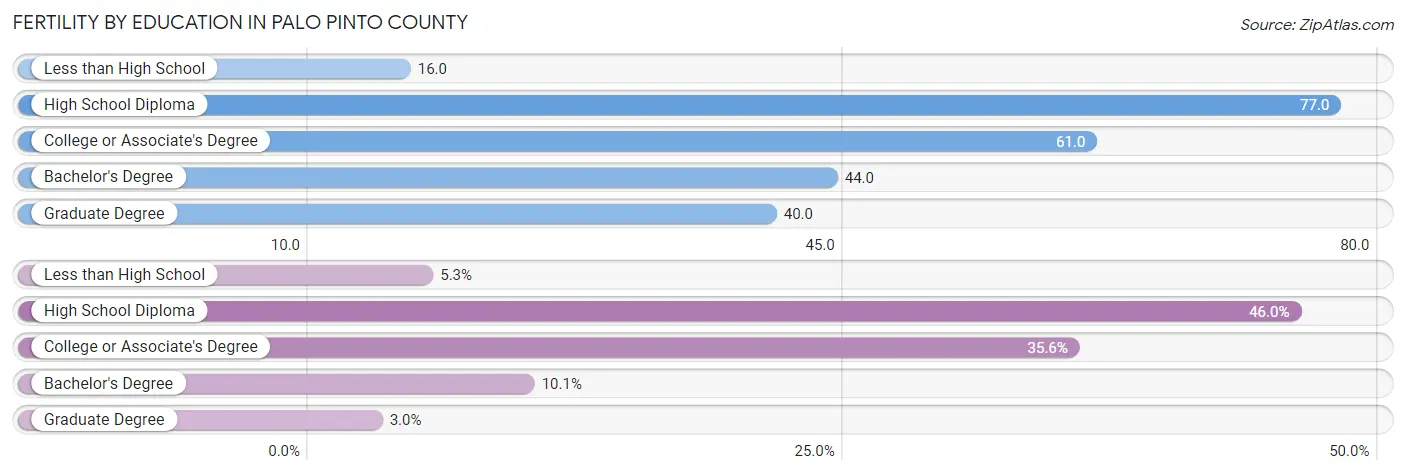
| Educational Attainment | Women with Births | Births / 1,000 Women |
| Less than High School | 18 (5.3%) | 16.0 |
| High School Diploma | 155 (46.0%) | 77.0 |
| College or Associate's Degree | 120 (35.6%) | 61.0 |
| Bachelor's Degree | 34 (10.1%) | 44.0 |
| Graduate Degree | 10 (3.0%) | 40.0 |
| Total | 337 (100.0%) | 55.0 |
Fertility by Education by Marriage Status in Palo Pinto County
58.5% of women with births in Palo Pinto County are unmarried. Women with the educational attainment of less than high school are most likely to be married with 100.0% of them married at childbirth, while women with the educational attainment of high school diploma are least likely to be married with 85.8% of them unmarried at childbirth.
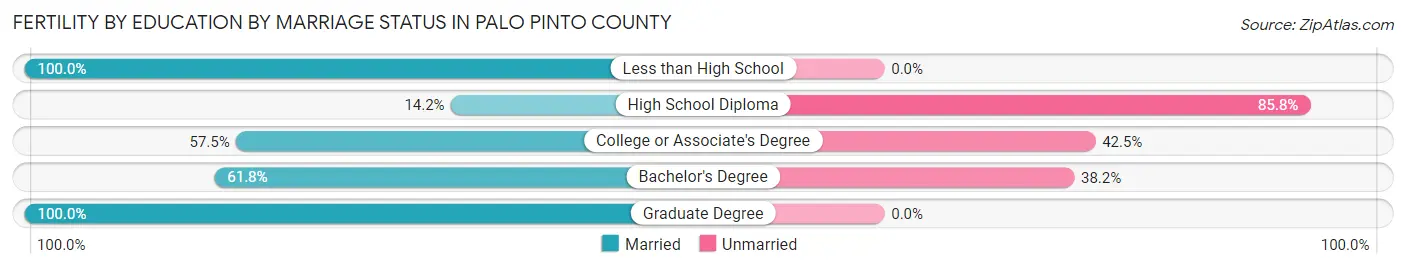
| Educational Attainment | Married | Unmarried |
| Less than High School | 18 (100.0%) | 0 (0.0%) |
| High School Diploma | 22 (14.2%) | 133 (85.8%) |
| College or Associate's Degree | 69 (57.5%) | 51 (42.5%) |
| Bachelor's Degree | 21 (61.8%) | 13 (38.2%) |
| Graduate Degree | 10 (100.0%) | 0 (0.0%) |
| Total | 140 (41.5%) | 197 (58.5%) |
Employment Characteristics in Palo Pinto County
Employment by Class of Employer in Palo Pinto County
Among the 11,985 employed individuals in Palo Pinto County, private company employees (7,877 | 65.7%), local government employees (1,191 | 9.9%), and self-employed (not incorporated) (1,115 | 9.3%) make up the most common classes of employment.
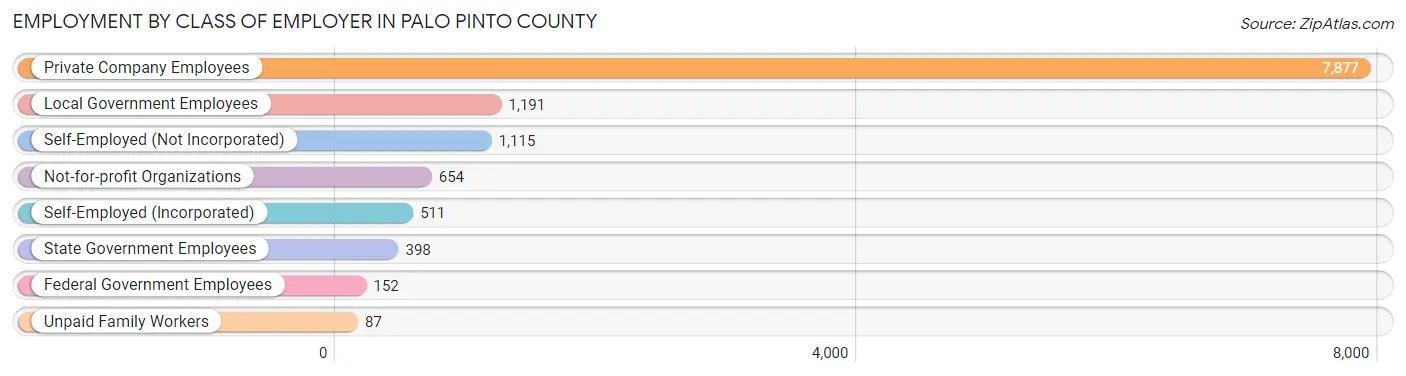
| Employer Class | # Employees | % Employees |
| Private Company Employees | 7,877 | 65.7% |
| Self-Employed (Incorporated) | 511 | 4.3% |
| Self-Employed (Not Incorporated) | 1,115 | 9.3% |
| Not-for-profit Organizations | 654 | 5.5% |
| Local Government Employees | 1,191 | 9.9% |
| State Government Employees | 398 | 3.3% |
| Federal Government Employees | 152 | 1.3% |
| Unpaid Family Workers | 87 | 0.7% |
| Total | 11,985 | 100.0% |
Employment Status by Age in Palo Pinto County
According to the labor force statistics for Palo Pinto County, out of the total population over 16 years of age (22,583), 58.5% or 13,211 individuals are in the labor force, with 7.3% or 964 of them unemployed. The age group with the highest labor force participation rate is 20 to 24 years, with 85.3% or 1,513 individuals in the labor force. Within the labor force, the 16 to 19 years age range has the highest percentage of unemployed individuals, with 26.6% or 142 of them being unemployed.
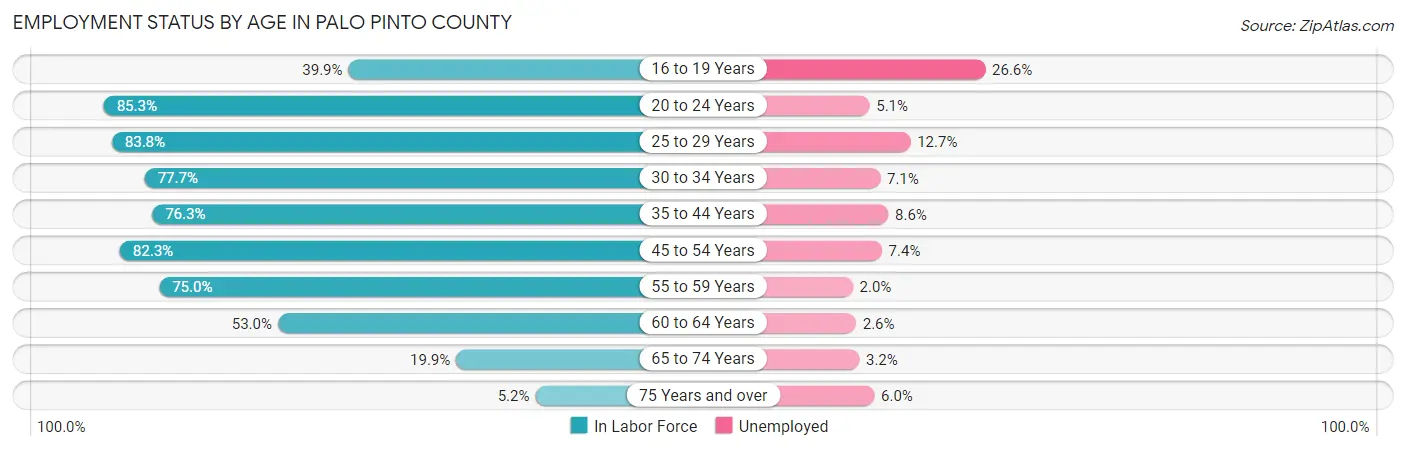
| Age Bracket | In Labor Force | Unemployed |
| 16 to 19 Years | 534 (39.9%) | 142 (26.6%) |
| 20 to 24 Years | 1,513 (85.3%) | 77 (5.1%) |
| 25 to 29 Years | 1,265 (83.8%) | 161 (12.7%) |
| 30 to 34 Years | 1,363 (77.7%) | 97 (7.1%) |
| 35 to 44 Years | 2,383 (76.3%) | 205 (8.6%) |
| 45 to 54 Years | 2,734 (82.3%) | 202 (7.4%) |
| 55 to 59 Years | 1,521 (75.0%) | 30 (2.0%) |
| 60 to 64 Years | 1,108 (53.0%) | 29 (2.6%) |
| 65 to 74 Years | 681 (19.9%) | 22 (3.2%) |
| 75 Years and over | 116 (5.2%) | 7 (6.0%) |
| Total | 13,211 (58.5%) | 964 (7.3%) |
Employment Status by Educational Attainment in Palo Pinto County
According to labor force statistics for Palo Pinto County, 75.0% of individuals (10,370) out of the total population between 25 and 64 years of age (13,826) are in the labor force, with 7.0% or 726 of them being unemployed. The group with the highest labor force participation rate are those with the educational attainment of bachelor's degree or higher, with 82.1% or 1,871 individuals in the labor force. Within the labor force, individuals with high school diploma education have the highest percentage of unemployment, with 8.9% or 363 of them being unemployed.
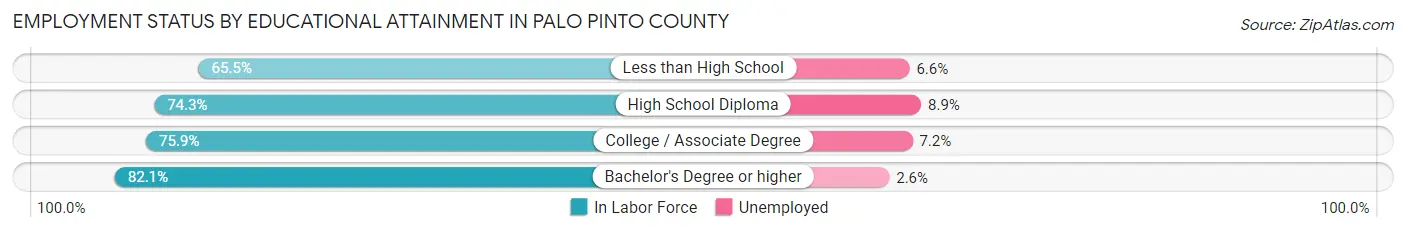
| Educational Attainment | In Labor Force | Unemployed |
| Less than High School | 1,104 (65.5%) | 111 (6.6%) |
| High School Diploma | 4,074 (74.3%) | 488 (8.9%) |
| College / Associate Degree | 3,324 (75.9%) | 315 (7.2%) |
| Bachelor's Degree or higher | 1,871 (82.1%) | 59 (2.6%) |
| Total | 10,370 (75.0%) | 968 (7.0%) |
Employment Occupations by Sex in Palo Pinto County
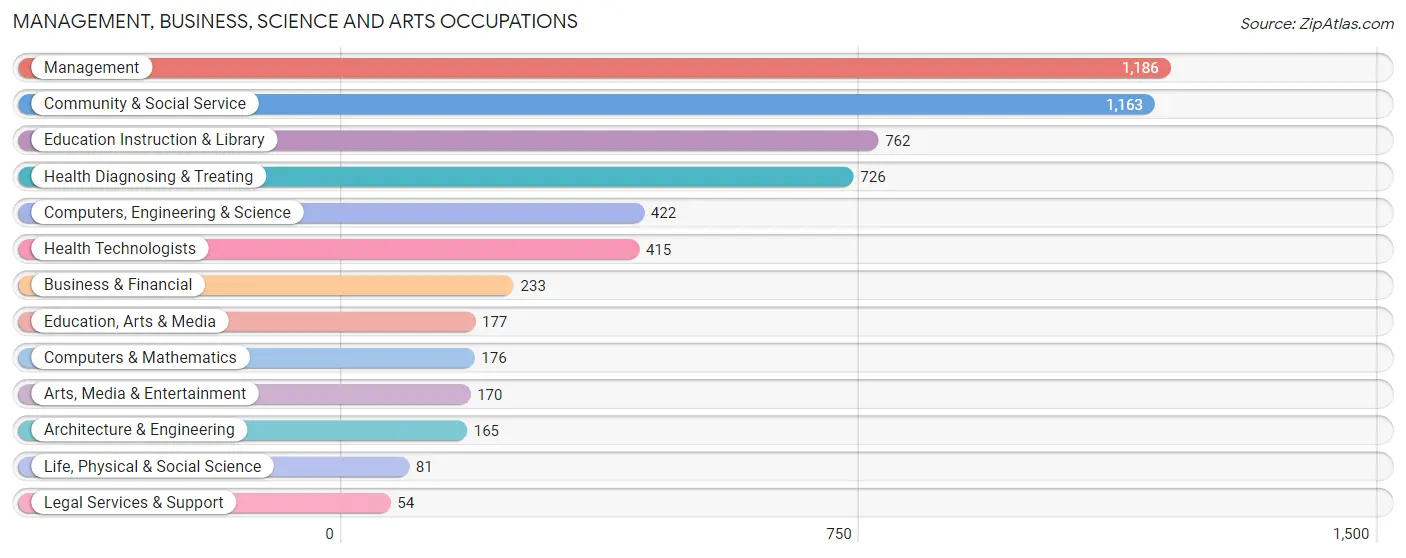
Management, Business, Science and Arts Occupations
The most common Management, Business, Science and Arts occupations in Palo Pinto County are Management (1,186 | 9.7%), Community & Social Service (1,163 | 9.5%), Education Instruction & Library (762 | 6.2%), Health Diagnosing & Treating (726 | 5.9%), and Computers, Engineering & Science (422 | 3.5%).
Management, Business, Science and Arts Occupations by Sex
Within the Management, Business, Science and Arts occupations in Palo Pinto County, the most male-oriented occupations are Computers & Mathematics (94.9%), Computers, Engineering & Science (94.1%), and Life, Physical & Social Science (93.8%), while the most female-oriented occupations are Health Diagnosing & Treating (92.4%), Health Technologists (88.7%), and Education Instruction & Library (82.6%).
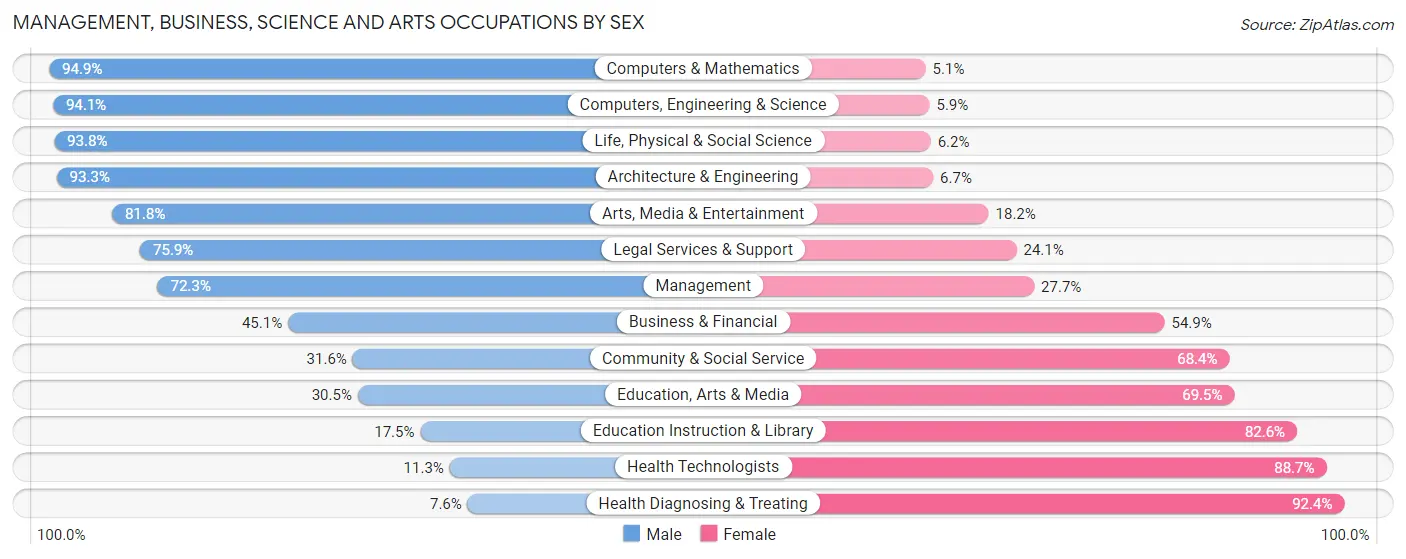
| Occupation | Male | Female |
| Management | 857 (72.3%) | 329 (27.7%) |
| Business & Financial | 105 (45.1%) | 128 (54.9%) |
| Computers, Engineering & Science | 397 (94.1%) | 25 (5.9%) |
| Computers & Mathematics | 167 (94.9%) | 9 (5.1%) |
| Architecture & Engineering | 154 (93.3%) | 11 (6.7%) |
| Life, Physical & Social Science | 76 (93.8%) | 5 (6.2%) |
| Community & Social Service | 367 (31.6%) | 796 (68.4%) |
| Education, Arts & Media | 54 (30.5%) | 123 (69.5%) |
| Legal Services & Support | 41 (75.9%) | 13 (24.1%) |
| Education Instruction & Library | 133 (17.4%) | 629 (82.6%) |
| Arts, Media & Entertainment | 139 (81.8%) | 31 (18.2%) |
| Health Diagnosing & Treating | 55 (7.6%) | 671 (92.4%) |
| Health Technologists | 47 (11.3%) | 368 (88.7%) |
| Total (Category) | 1,781 (47.7%) | 1,949 (52.2%) |
| Total (Overall) | 6,669 (54.5%) | 5,577 (45.5%) |
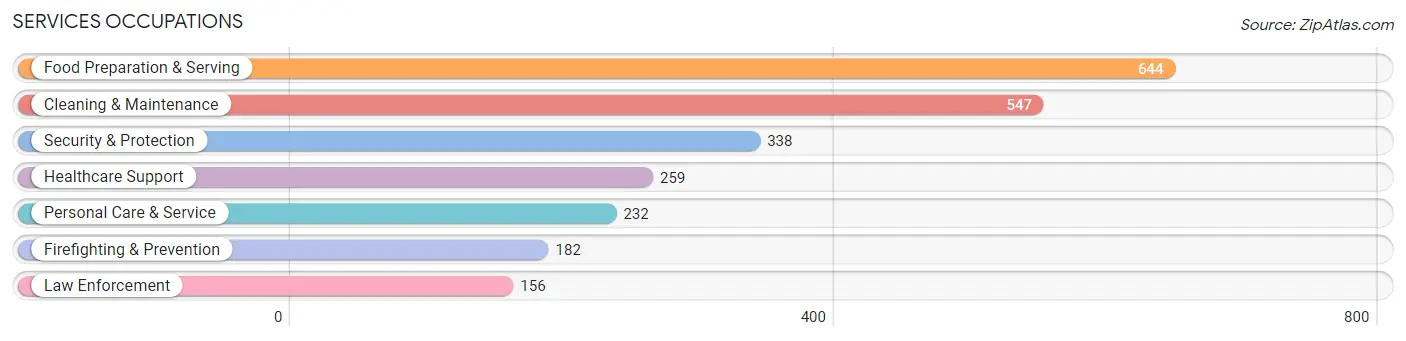
Services Occupations
The most common Services occupations in Palo Pinto County are Food Preparation & Serving (644 | 5.3%), Cleaning & Maintenance (547 | 4.5%), Security & Protection (338 | 2.8%), Healthcare Support (259 | 2.1%), and Personal Care & Service (232 | 1.9%).
Services Occupations by Sex
Within the Services occupations in Palo Pinto County, the most male-oriented occupations are Law Enforcement (76.3%), Security & Protection (69.2%), and Firefighting & Prevention (63.2%), while the most female-oriented occupations are Healthcare Support (84.2%), Personal Care & Service (80.2%), and Food Preparation & Serving (58.9%).
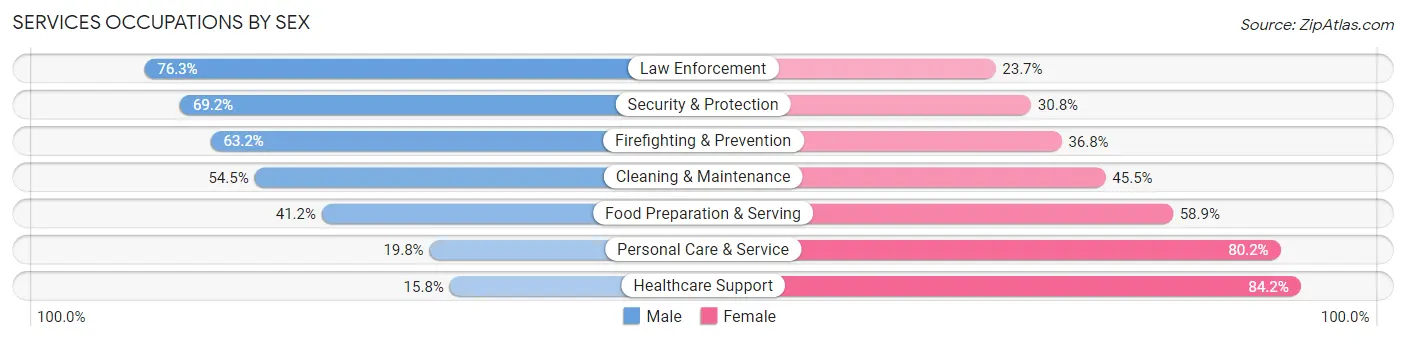
| Occupation | Male | Female |
| Healthcare Support | 41 (15.8%) | 218 (84.2%) |
| Security & Protection | 234 (69.2%) | 104 (30.8%) |
| Firefighting & Prevention | 115 (63.2%) | 67 (36.8%) |
| Law Enforcement | 119 (76.3%) | 37 (23.7%) |
| Food Preparation & Serving | 265 (41.1%) | 379 (58.9%) |
| Cleaning & Maintenance | 298 (54.5%) | 249 (45.5%) |
| Personal Care & Service | 46 (19.8%) | 186 (80.2%) |
| Total (Category) | 884 (43.8%) | 1,136 (56.2%) |
| Total (Overall) | 6,669 (54.5%) | 5,577 (45.5%) |
Sales and Office Occupations
The most common Sales and Office occupations in Palo Pinto County are Office & Administration (1,543 | 12.6%), and Sales & Related (1,067 | 8.7%).

Sales and Office Occupations by Sex

| Occupation | Male | Female |
| Sales & Related | 507 (47.5%) | 560 (52.5%) |
| Office & Administration | 248 (16.1%) | 1,295 (83.9%) |
| Total (Category) | 755 (28.9%) | 1,855 (71.1%) |
| Total (Overall) | 6,669 (54.5%) | 5,577 (45.5%) |
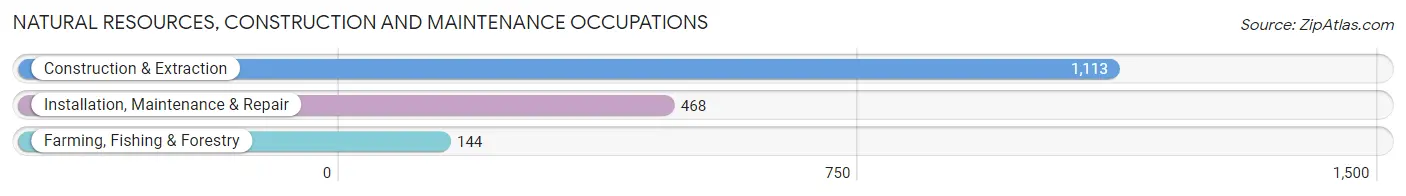
Natural Resources, Construction and Maintenance Occupations
The most common Natural Resources, Construction and Maintenance occupations in Palo Pinto County are Construction & Extraction (1,113 | 9.1%), Installation, Maintenance & Repair (468 | 3.8%), and Farming, Fishing & Forestry (144 | 1.2%).
Natural Resources, Construction and Maintenance Occupations by Sex
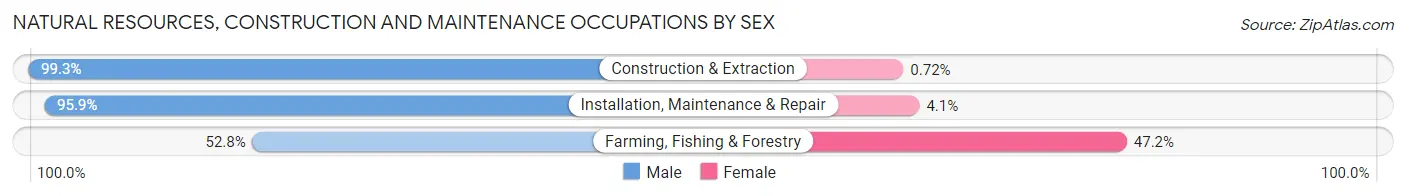
| Occupation | Male | Female |
| Farming, Fishing & Forestry | 76 (52.8%) | 68 (47.2%) |
| Construction & Extraction | 1,105 (99.3%) | 8 (0.7%) |
| Installation, Maintenance & Repair | 449 (95.9%) | 19 (4.1%) |
| Total (Category) | 1,630 (94.5%) | 95 (5.5%) |
| Total (Overall) | 6,669 (54.5%) | 5,577 (45.5%) |
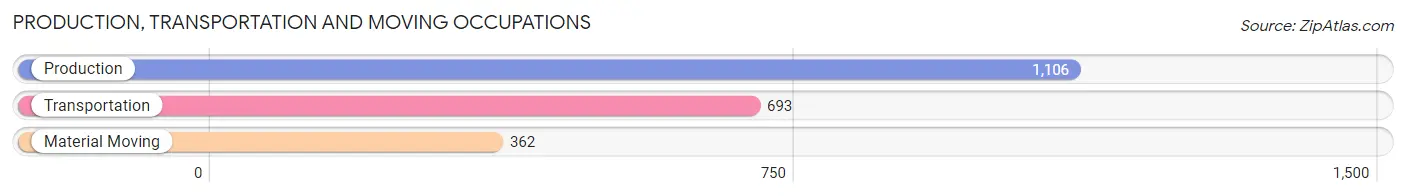
Production, Transportation and Moving Occupations
The most common Production, Transportation and Moving occupations in Palo Pinto County are Production (1,106 | 9.0%), Transportation (693 | 5.7%), and Material Moving (362 | 3.0%).
Production, Transportation and Moving Occupations by Sex
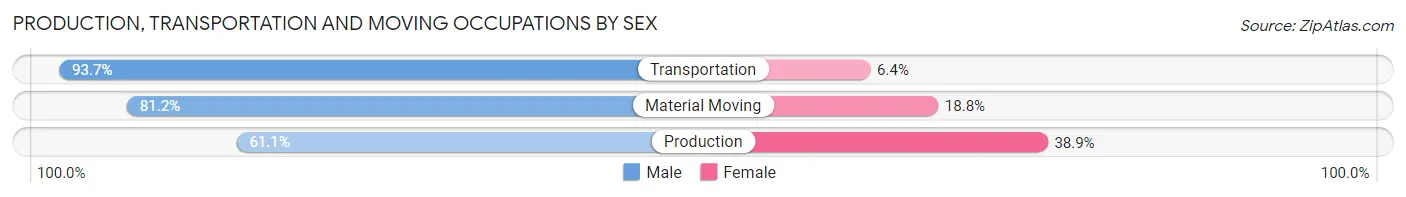
| Occupation | Male | Female |
| Production | 676 (61.1%) | 430 (38.9%) |
| Transportation | 649 (93.6%) | 44 (6.4%) |
| Material Moving | 294 (81.2%) | 68 (18.8%) |
| Total (Category) | 1,619 (74.9%) | 542 (25.1%) |
| Total (Overall) | 6,669 (54.5%) | 5,577 (45.5%) |
Employment Industries by Sex in Palo Pinto County
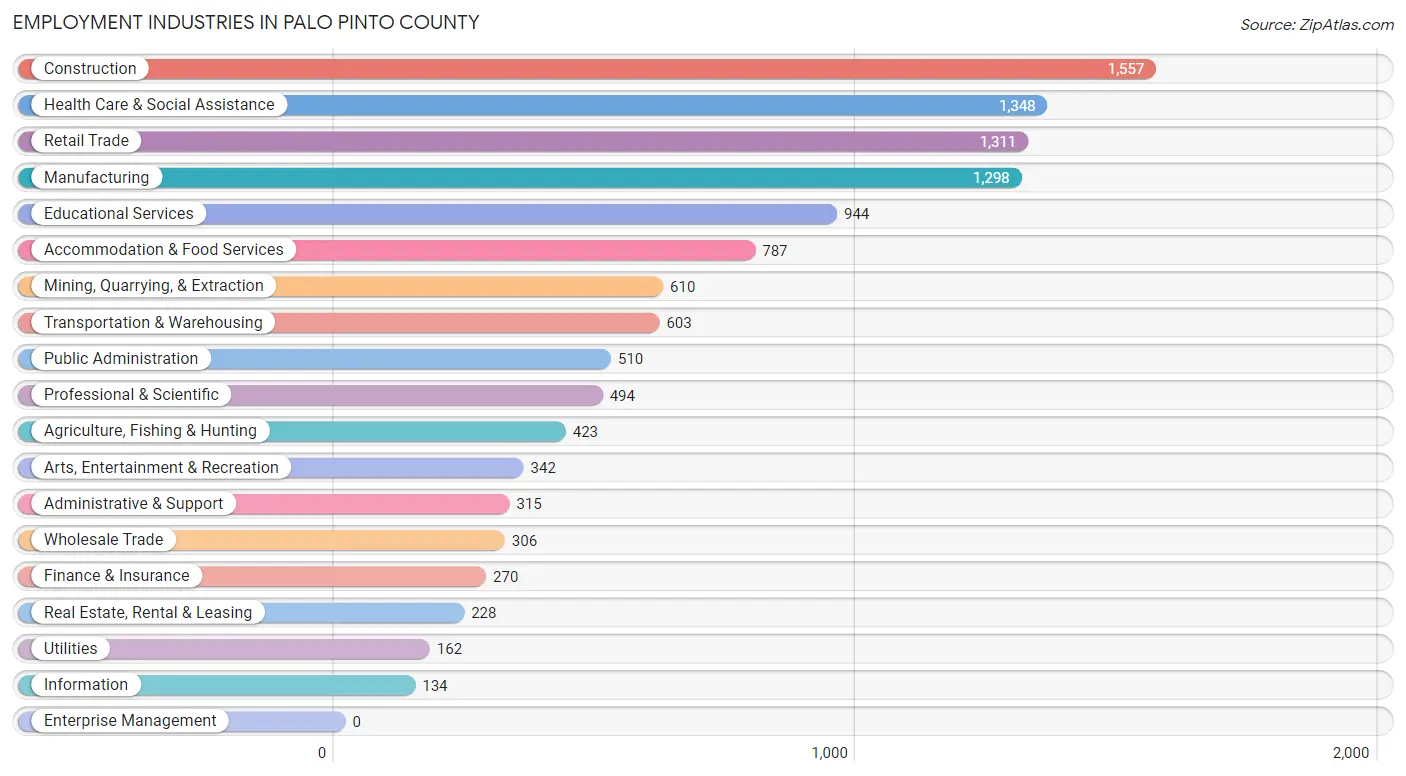
Employment Industries in Palo Pinto County
The major employment industries in Palo Pinto County include Construction (1,557 | 12.7%), Health Care & Social Assistance (1,348 | 11.0%), Retail Trade (1,311 | 10.7%), Manufacturing (1,298 | 10.6%), and Educational Services (944 | 7.7%).
Employment Industries by Sex in Palo Pinto County
The Palo Pinto County industries that see more men than women are Mining, Quarrying, & Extraction (97.9%), Construction (83.2%), and Wholesale Trade (80.7%), whereas the industries that tend to have a higher number of women are Educational Services (86.0%), Health Care & Social Assistance (81.8%), and Finance & Insurance (67.4%).
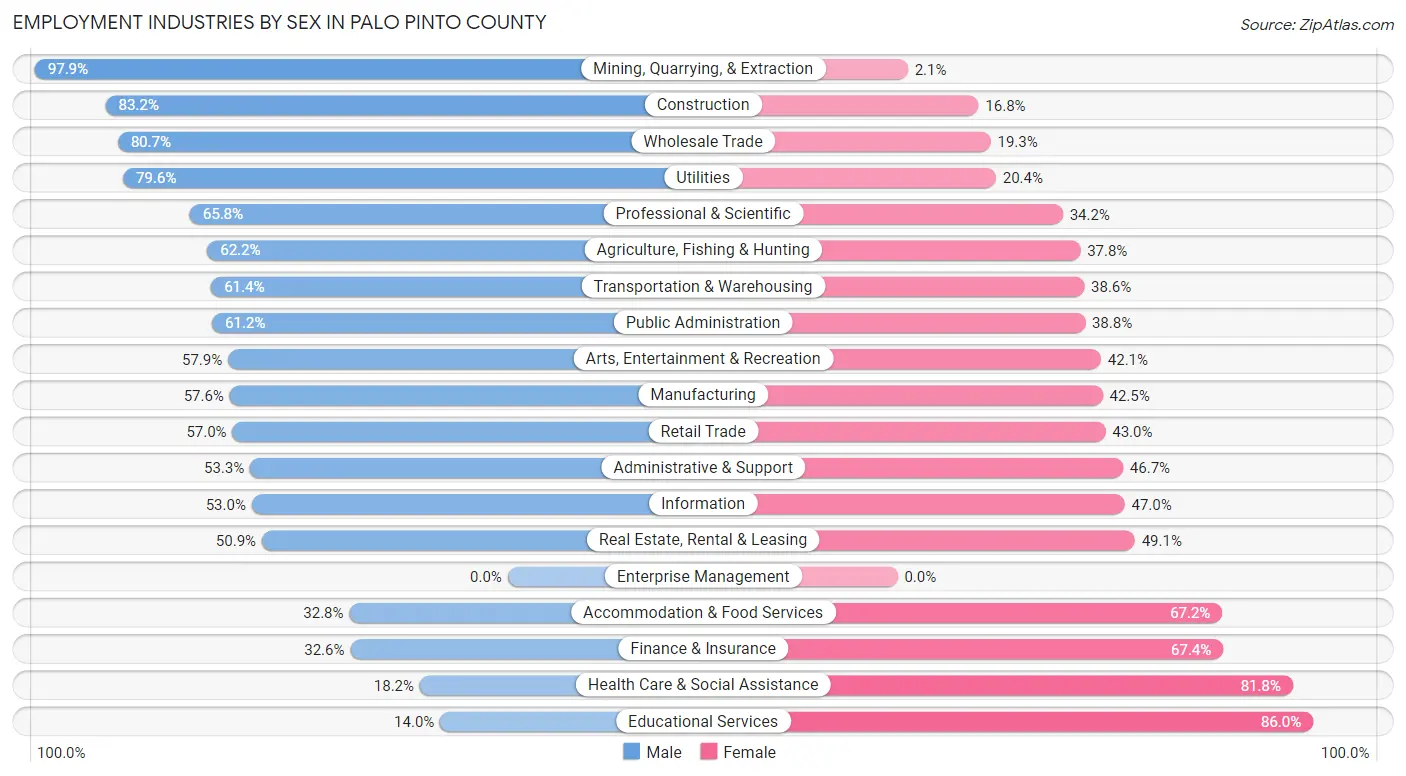
| Industry | Male | Female |
| Agriculture, Fishing & Hunting | 263 (62.2%) | 160 (37.8%) |
| Mining, Quarrying, & Extraction | 597 (97.9%) | 13 (2.1%) |
| Construction | 1,296 (83.2%) | 261 (16.8%) |
| Manufacturing | 747 (57.6%) | 551 (42.4%) |
| Wholesale Trade | 247 (80.7%) | 59 (19.3%) |
| Retail Trade | 747 (57.0%) | 564 (43.0%) |
| Transportation & Warehousing | 370 (61.4%) | 233 (38.6%) |
| Utilities | 129 (79.6%) | 33 (20.4%) |
| Information | 71 (53.0%) | 63 (47.0%) |
| Finance & Insurance | 88 (32.6%) | 182 (67.4%) |
| Real Estate, Rental & Leasing | 116 (50.9%) | 112 (49.1%) |
| Professional & Scientific | 325 (65.8%) | 169 (34.2%) |
| Enterprise Management | 0 (0.0%) | 0 (0.0%) |
| Administrative & Support | 168 (53.3%) | 147 (46.7%) |
| Educational Services | 132 (14.0%) | 812 (86.0%) |
| Health Care & Social Assistance | 245 (18.2%) | 1,103 (81.8%) |
| Arts, Entertainment & Recreation | 198 (57.9%) | 144 (42.1%) |
| Accommodation & Food Services | 258 (32.8%) | 529 (67.2%) |
| Public Administration | 312 (61.2%) | 198 (38.8%) |
| Total | 6,669 (54.5%) | 5,577 (45.5%) |
Education in Palo Pinto County
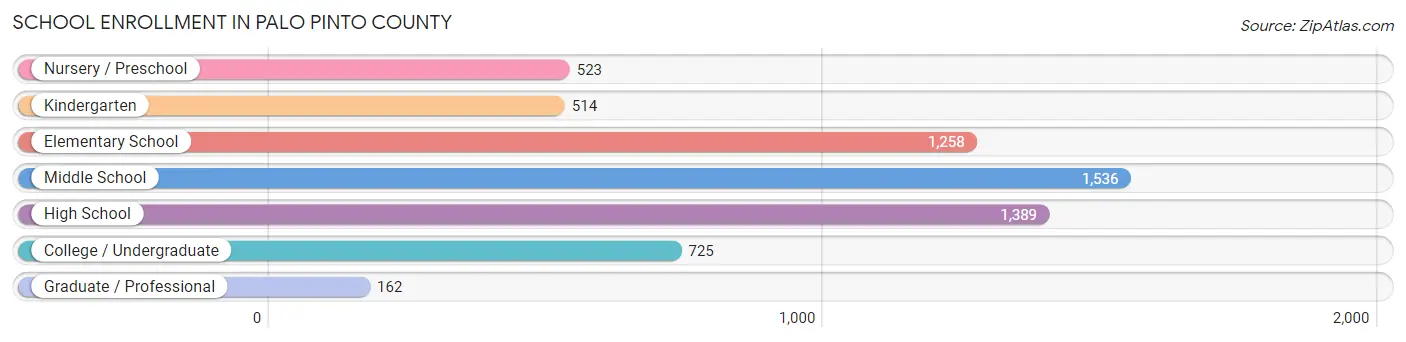
School Enrollment in Palo Pinto County
The most common levels of schooling among the 6,107 students in Palo Pinto County are middle school (1,536 | 25.2%), high school (1,389 | 22.7%), and elementary school (1,258 | 20.6%).
| School Level | # Students | % Students |
| Nursery / Preschool | 523 | 8.6% |
| Kindergarten | 514 | 8.4% |
| Elementary School | 1,258 | 20.6% |
| Middle School | 1,536 | 25.2% |
| High School | 1,389 | 22.7% |
| College / Undergraduate | 725 | 11.9% |
| Graduate / Professional | 162 | 2.6% |
| Total | 6,107 | 100.0% |
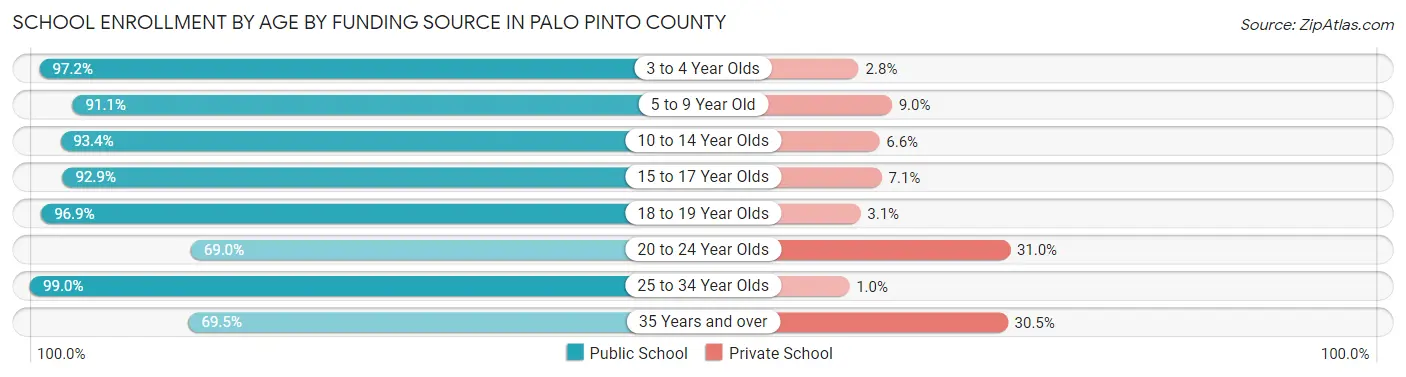
School Enrollment by Age by Funding Source in Palo Pinto County
Out of a total of 6,107 students who are enrolled in schools in Palo Pinto County, 568 (9.3%) attend a private institution, while the remaining 5,539 (90.7%) are enrolled in public schools. The age group of 20 to 24 year olds has the highest likelihood of being enrolled in private schools, with 131 (31.0% in the age bracket) enrolled. Conversely, the age group of 25 to 34 year olds has the lowest likelihood of being enrolled in a private school, with 193 (99.0% in the age bracket) attending a public institution.
| Age Bracket | Public School | Private School |
| 3 to 4 Year Olds | 348 (97.2%) | 10 (2.8%) |
| 5 to 9 Year Old | 1,444 (91.0%) | 142 (8.9%) |
| 10 to 14 Year Olds | 1,898 (93.4%) | 135 (6.6%) |
| 15 to 17 Year Olds | 895 (92.9%) | 68 (7.1%) |
| 18 to 19 Year Olds | 313 (96.9%) | 10 (3.1%) |
| 20 to 24 Year Olds | 292 (69.0%) | 131 (31.0%) |
| 25 to 34 Year Olds | 193 (99.0%) | 2 (1.0%) |
| 35 Years and over | 157 (69.5%) | 69 (30.5%) |
| Total | 5,539 (90.7%) | 568 (9.3%) |
Educational Attainment by Field of Study in Palo Pinto County
Business (822 | 22.3%), education (745 | 20.2%), bio, nature & agricultural (283 | 7.7%), science & technology (272 | 7.4%), and liberal arts & history (266 | 7.2%) are the most common fields of study among 3,683 individuals in Palo Pinto County who have obtained a bachelor's degree or higher.
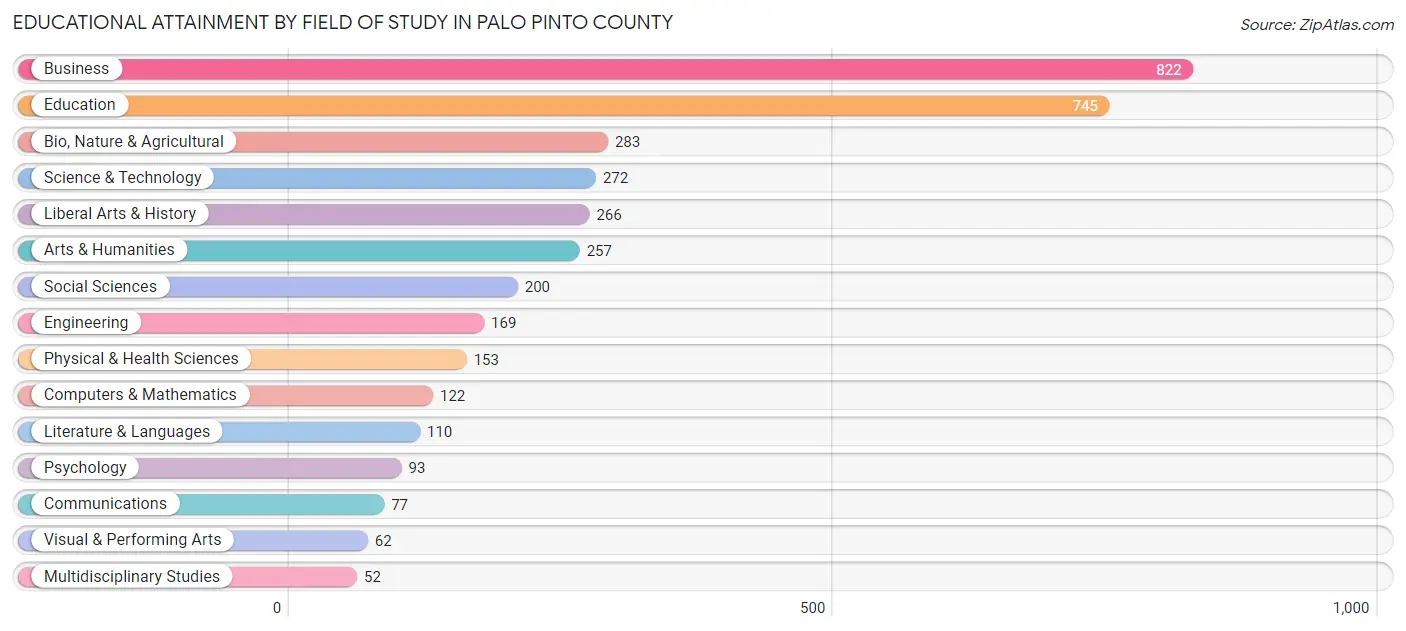
| Field of Study | # Graduates | % Graduates |
| Computers & Mathematics | 122 | 3.3% |
| Bio, Nature & Agricultural | 283 | 7.7% |
| Physical & Health Sciences | 153 | 4.2% |
| Psychology | 93 | 2.5% |
| Social Sciences | 200 | 5.4% |
| Engineering | 169 | 4.6% |
| Multidisciplinary Studies | 52 | 1.4% |
| Science & Technology | 272 | 7.4% |
| Business | 822 | 22.3% |
| Education | 745 | 20.2% |
| Literature & Languages | 110 | 3.0% |
| Liberal Arts & History | 266 | 7.2% |
| Visual & Performing Arts | 62 | 1.7% |
| Communications | 77 | 2.1% |
| Arts & Humanities | 257 | 7.0% |
| Total | 3,683 | 100.0% |
Transportation & Commute in Palo Pinto County
Vehicle Availability by Sex in Palo Pinto County
The most prevalent vehicle ownership categories in Palo Pinto County are males with 2 vehicles (2,467, accounting for 37.5%) and females with 2 vehicles (1,606, making up 45.7%).
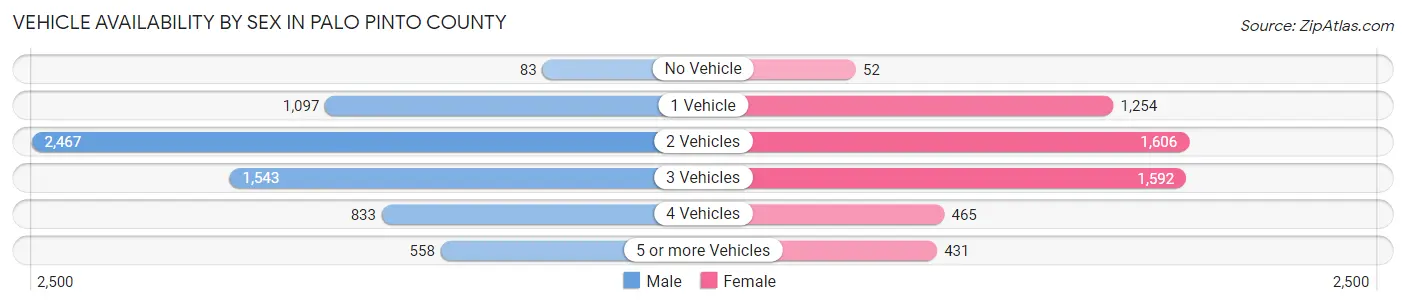
| Vehicles Available | Male | Female |
| No Vehicle | 83 (1.3%) | 52 (1.0%) |
| 1 Vehicle | 1,097 (16.7%) | 1,254 (23.2%) |
| 2 Vehicles | 2,467 (37.5%) | 1,606 (29.7%) |
| 3 Vehicles | 1,543 (23.4%) | 1,592 (29.5%) |
| 4 Vehicles | 833 (12.7%) | 465 (8.6%) |
| 5 or more Vehicles | 558 (8.5%) | 431 (8.0%) |
| Total | 6,581 (100.0%) | 5,400 (100.0%) |
Commute Time in Palo Pinto County
The most frequently occuring commute durations in Palo Pinto County are 10 to 14 minutes (1,719 commuters, 15.5%), 5 to 9 minutes (1,687 commuters, 15.2%), and 30 to 34 minutes (1,259 commuters, 11.4%).
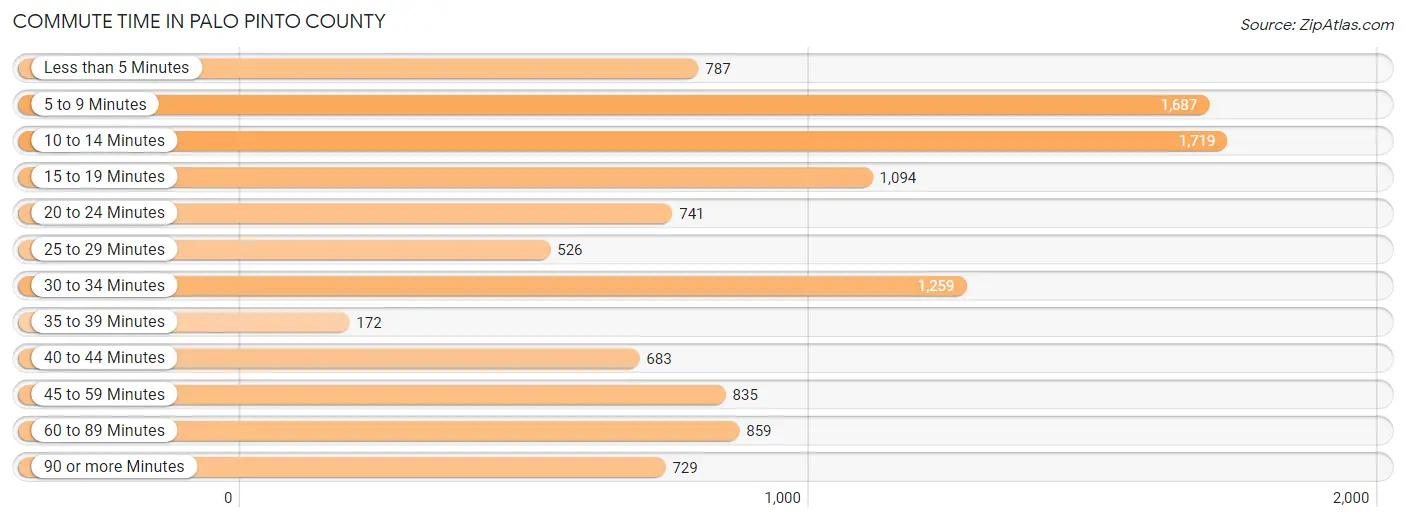
| Commute Time | # Commuters | % Commuters |
| Less than 5 Minutes | 787 | 7.1% |
| 5 to 9 Minutes | 1,687 | 15.2% |
| 10 to 14 Minutes | 1,719 | 15.5% |
| 15 to 19 Minutes | 1,094 | 9.9% |
| 20 to 24 Minutes | 741 | 6.7% |
| 25 to 29 Minutes | 526 | 4.7% |
| 30 to 34 Minutes | 1,259 | 11.4% |
| 35 to 39 Minutes | 172 | 1.5% |
| 40 to 44 Minutes | 683 | 6.2% |
| 45 to 59 Minutes | 835 | 7.5% |
| 60 to 89 Minutes | 859 | 7.7% |
| 90 or more Minutes | 729 | 6.6% |
Commute Time by Sex in Palo Pinto County
The most common commute times in Palo Pinto County are 10 to 14 minutes (805 commuters, 13.1%) for males and 5 to 9 minutes (922 commuters, 18.6%) for females.
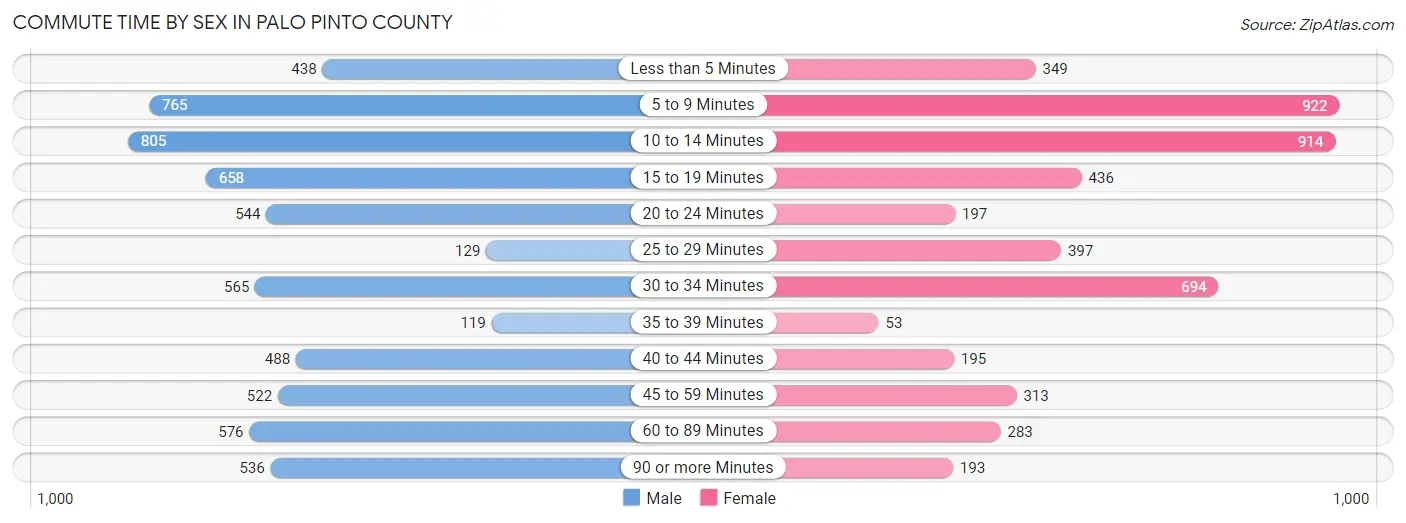
| Commute Time | Male | Female |
| Less than 5 Minutes | 438 (7.1%) | 349 (7.1%) |
| 5 to 9 Minutes | 765 (12.4%) | 922 (18.6%) |
| 10 to 14 Minutes | 805 (13.1%) | 914 (18.5%) |
| 15 to 19 Minutes | 658 (10.7%) | 436 (8.8%) |
| 20 to 24 Minutes | 544 (8.8%) | 197 (4.0%) |
| 25 to 29 Minutes | 129 (2.1%) | 397 (8.0%) |
| 30 to 34 Minutes | 565 (9.2%) | 694 (14.0%) |
| 35 to 39 Minutes | 119 (1.9%) | 53 (1.1%) |
| 40 to 44 Minutes | 488 (7.9%) | 195 (3.9%) |
| 45 to 59 Minutes | 522 (8.5%) | 313 (6.3%) |
| 60 to 89 Minutes | 576 (9.4%) | 283 (5.7%) |
| 90 or more Minutes | 536 (8.7%) | 193 (3.9%) |
Time of Departure to Work by Sex in Palo Pinto County
The most frequent times of departure to work in Palo Pinto County are 7:00 AM to 7:29 AM (1,086, 17.7%) for males and 7:30 AM to 7:59 AM (972, 19.7%) for females.
| Time of Departure | Male | Female |
| 12:00 AM to 4:59 AM | 682 (11.1%) | 369 (7.5%) |
| 5:00 AM to 5:29 AM | 589 (9.6%) | 84 (1.7%) |
| 5:30 AM to 5:59 AM | 278 (4.5%) | 193 (3.9%) |
| 6:00 AM to 6:29 AM | 636 (10.3%) | 277 (5.6%) |
| 6:30 AM to 6:59 AM | 730 (11.9%) | 564 (11.4%) |
| 7:00 AM to 7:29 AM | 1,086 (17.7%) | 895 (18.1%) |
| 7:30 AM to 7:59 AM | 554 (9.0%) | 972 (19.7%) |
| 8:00 AM to 8:29 AM | 514 (8.4%) | 351 (7.1%) |
| 8:30 AM to 8:59 AM | 134 (2.2%) | 188 (3.8%) |
| 9:00 AM to 9:59 AM | 186 (3.0%) | 340 (6.9%) |
| 10:00 AM to 10:59 AM | 56 (0.9%) | 156 (3.2%) |
| 11:00 AM to 11:59 AM | 32 (0.5%) | 21 (0.4%) |
| 12:00 PM to 3:59 PM | 344 (5.6%) | 197 (4.0%) |
| 4:00 PM to 11:59 PM | 324 (5.3%) | 339 (6.9%) |
| Total | 6,145 (100.0%) | 4,946 (100.0%) |
Housing Occupancy in Palo Pinto County
Occupancy by Ownership in Palo Pinto County
Of the total 10,640 dwellings in Palo Pinto County, owner-occupied units account for 7,667 (72.1%), while renter-occupied units make up 2,973 (27.9%).
| Occupancy | # Housing Units | % Housing Units |
| Owner Occupied Housing Units | 7,667 | 72.1% |
| Renter-Occupied Housing Units | 2,973 | 27.9% |
| Total Occupied Housing Units | 10,640 | 100.0% |
Occupancy by Household Size in Palo Pinto County
| Household Size | # Housing Units | % Housing Units |
| 1-Person Household | 2,754 | 25.9% |
| 2-Person Household | 4,218 | 39.6% |
| 3-Person Household | 1,403 | 13.2% |
| 4+ Person Household | 2,265 | 21.3% |
| Total Housing Units | 10,640 | 100.0% |
Occupancy by Ownership by Household Size in Palo Pinto County
| Household Size | Owner-occupied | Renter-occupied |
| 1-Person Household | 1,779 (64.6%) | 975 (35.4%) |
| 2-Person Household | 3,463 (82.1%) | 755 (17.9%) |
| 3-Person Household | 871 (62.1%) | 532 (37.9%) |
| 4+ Person Household | 1,554 (68.6%) | 711 (31.4%) |
| Total Housing Units | 7,667 (72.1%) | 2,973 (27.9%) |
Occupancy by Educational Attainment in Palo Pinto County
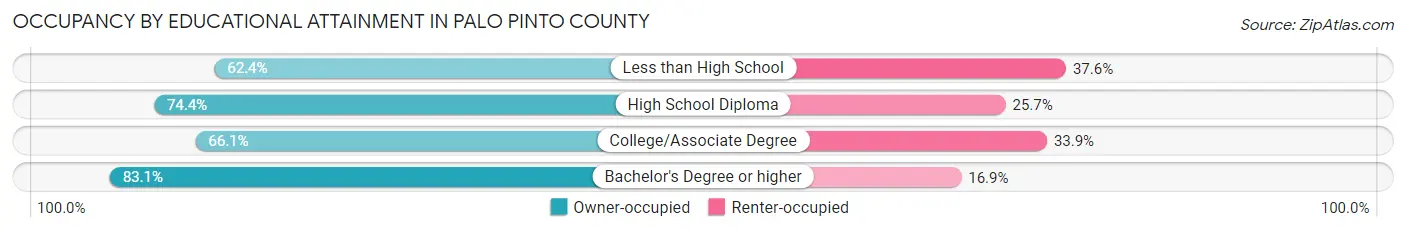
| Household Size | Owner-occupied | Renter-occupied |
| Less than High School | 746 (62.4%) | 450 (37.6%) |
| High School Diploma | 2,786 (74.4%) | 961 (25.7%) |
| College/Associate Degree | 2,338 (66.1%) | 1,197 (33.9%) |
| Bachelor's Degree or higher | 1,797 (83.1%) | 365 (16.9%) |
Occupancy by Age of Householder in Palo Pinto County
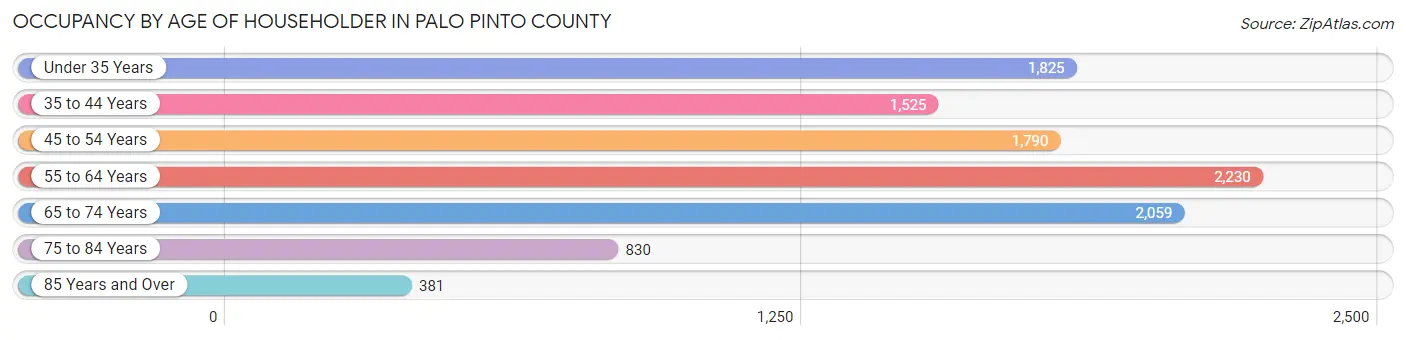
| Age Bracket | # Households | % Households |
| Under 35 Years | 1,825 | 17.2% |
| 35 to 44 Years | 1,525 | 14.3% |
| 45 to 54 Years | 1,790 | 16.8% |
| 55 to 64 Years | 2,230 | 21.0% |
| 65 to 74 Years | 2,059 | 19.4% |
| 75 to 84 Years | 830 | 7.8% |
| 85 Years and Over | 381 | 3.6% |
| Total | 10,640 | 100.0% |
Housing Finances in Palo Pinto County
Median Income by Occupancy in Palo Pinto County
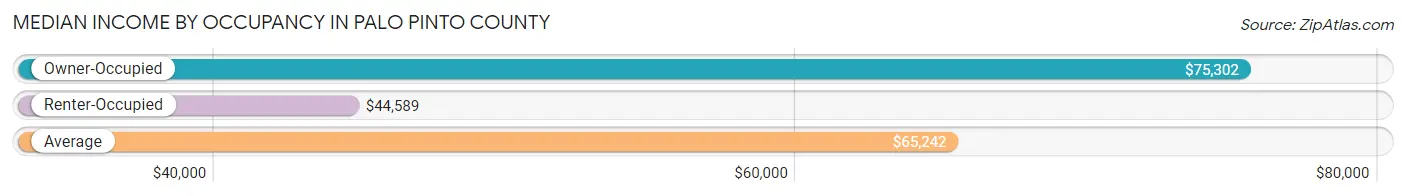
| Occupancy Type | # Households | Median Income |
| Owner-Occupied | 7,667 (72.1%) | $75,302 |
| Renter-Occupied | 2,973 (27.9%) | $44,589 |
| Average | 10,640 (100.0%) | $65,242 |
Occupancy by Householder Income Bracket in Palo Pinto County
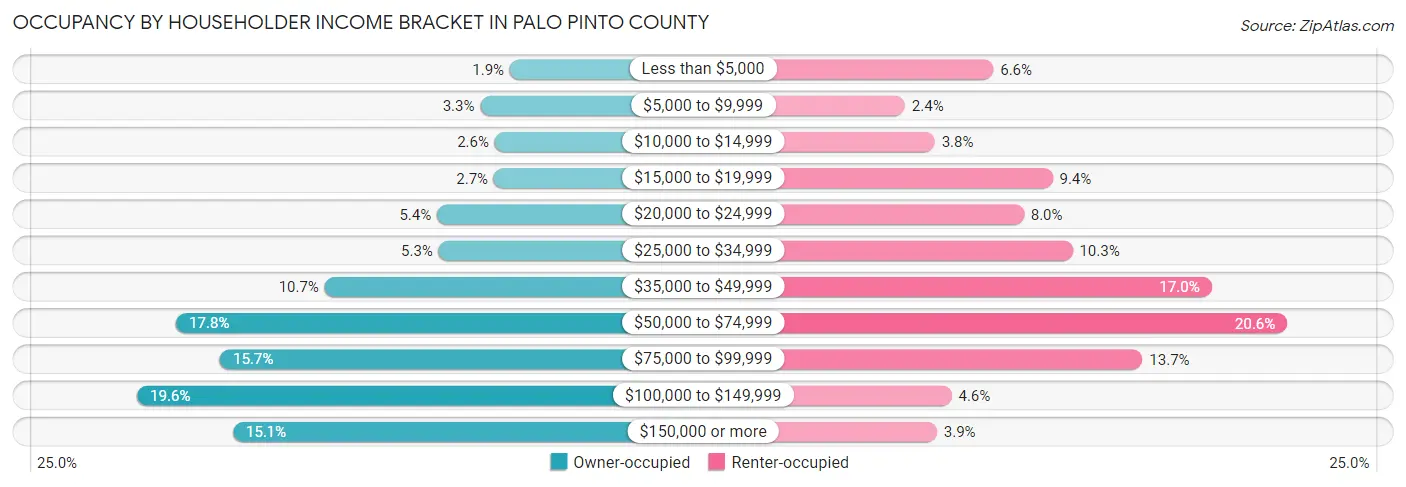
| Income Bracket | Owner-occupied | Renter-occupied |
| Less than $5,000 | 145 (1.9%) | 195 (6.6%) |
| $5,000 to $9,999 | 253 (3.3%) | 70 (2.4%) |
| $10,000 to $14,999 | 200 (2.6%) | 112 (3.8%) |
| $15,000 to $19,999 | 203 (2.6%) | 279 (9.4%) |
| $20,000 to $24,999 | 411 (5.4%) | 238 (8.0%) |
| $25,000 to $34,999 | 405 (5.3%) | 307 (10.3%) |
| $35,000 to $49,999 | 821 (10.7%) | 504 (17.0%) |
| $50,000 to $74,999 | 1,364 (17.8%) | 611 (20.5%) |
| $75,000 to $99,999 | 1,203 (15.7%) | 406 (13.7%) |
| $100,000 to $149,999 | 1,506 (19.6%) | 136 (4.6%) |
| $150,000 or more | 1,156 (15.1%) | 115 (3.9%) |
| Total | 7,667 (100.0%) | 2,973 (100.0%) |
Monthly Housing Cost Tiers in Palo Pinto County
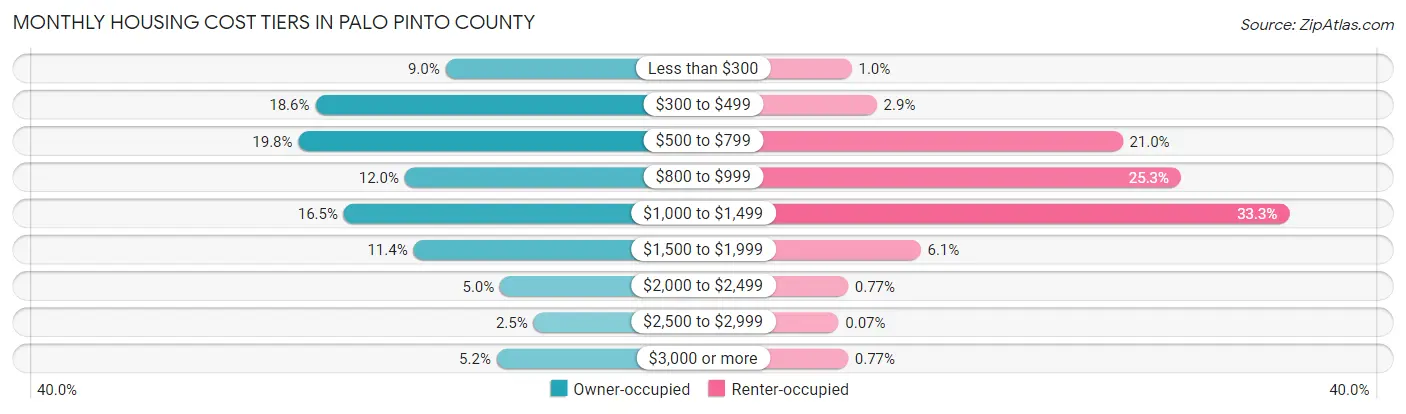
| Monthly Cost | Owner-occupied | Renter-occupied |
| Less than $300 | 690 (9.0%) | 31 (1.0%) |
| $300 to $499 | 1,425 (18.6%) | 86 (2.9%) |
| $500 to $799 | 1,521 (19.8%) | 624 (21.0%) |
| $800 to $999 | 920 (12.0%) | 752 (25.3%) |
| $1,000 to $1,499 | 1,264 (16.5%) | 989 (33.3%) |
| $1,500 to $1,999 | 871 (11.4%) | 182 (6.1%) |
| $2,000 to $2,499 | 382 (5.0%) | 23 (0.8%) |
| $2,500 to $2,999 | 193 (2.5%) | 2 (0.1%) |
| $3,000 or more | 401 (5.2%) | 23 (0.8%) |
| Total | 7,667 (100.0%) | 2,973 (100.0%) |
Physical Housing Characteristics in Palo Pinto County
Housing Structures in Palo Pinto County
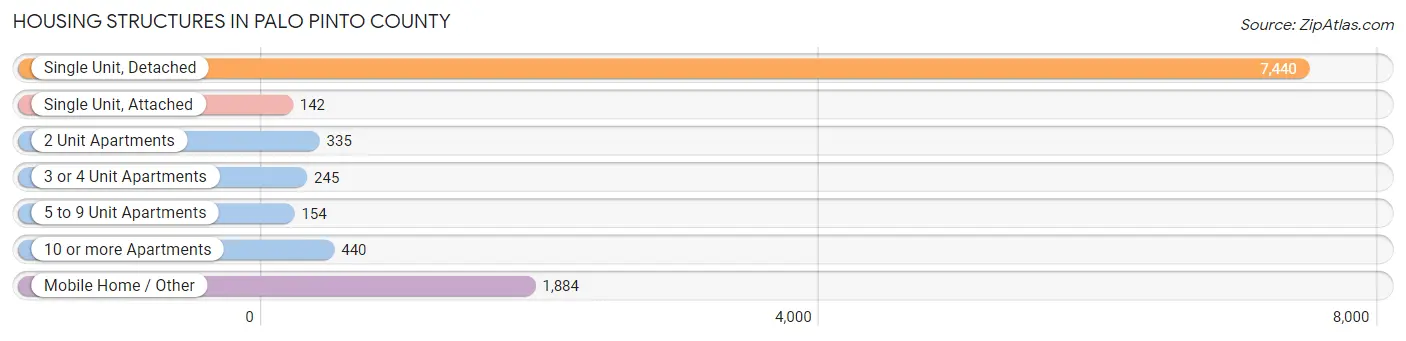
| Structure Type | # Housing Units | % Housing Units |
| Single Unit, Detached | 7,440 | 69.9% |
| Single Unit, Attached | 142 | 1.3% |
| 2 Unit Apartments | 335 | 3.2% |
| 3 or 4 Unit Apartments | 245 | 2.3% |
| 5 to 9 Unit Apartments | 154 | 1.5% |
| 10 or more Apartments | 440 | 4.1% |
| Mobile Home / Other | 1,884 | 17.7% |
| Total | 10,640 | 100.0% |
Housing Structures by Occupancy in Palo Pinto County
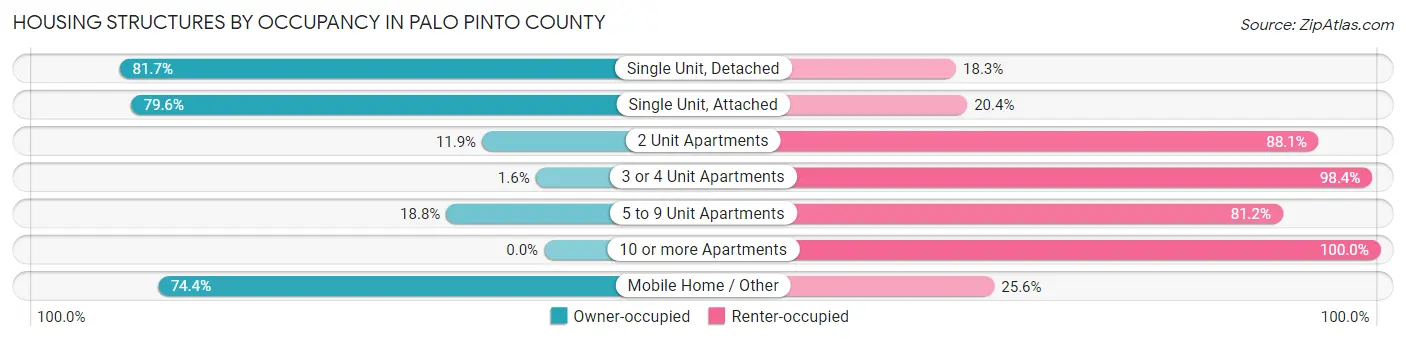
| Structure Type | Owner-occupied | Renter-occupied |
| Single Unit, Detached | 6,080 (81.7%) | 1,360 (18.3%) |
| Single Unit, Attached | 113 (79.6%) | 29 (20.4%) |
| 2 Unit Apartments | 40 (11.9%) | 295 (88.1%) |
| 3 or 4 Unit Apartments | 4 (1.6%) | 241 (98.4%) |
| 5 to 9 Unit Apartments | 29 (18.8%) | 125 (81.2%) |
| 10 or more Apartments | 0 (0.0%) | 440 (100.0%) |
| Mobile Home / Other | 1,401 (74.4%) | 483 (25.6%) |
| Total | 7,667 (72.1%) | 2,973 (27.9%) |
Housing Structures by Number of Rooms in Palo Pinto County
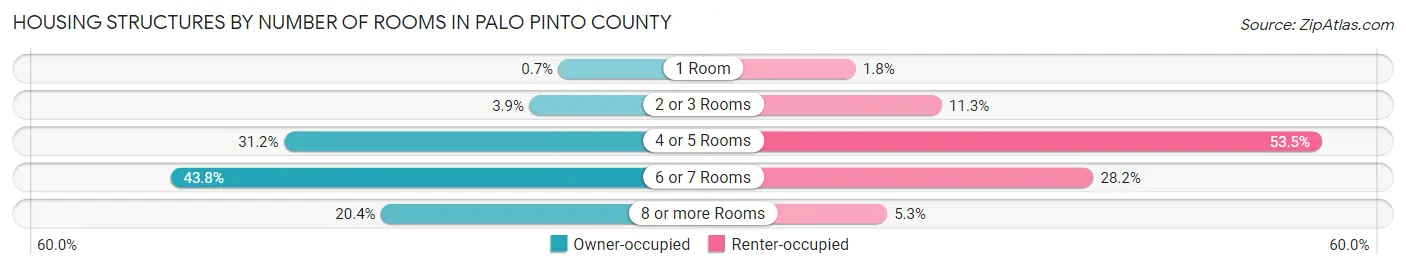
| Number of Rooms | Owner-occupied | Renter-occupied |
| 1 Room | 54 (0.7%) | 53 (1.8%) |
| 2 or 3 Rooms | 301 (3.9%) | 337 (11.3%) |
| 4 or 5 Rooms | 2,390 (31.2%) | 1,590 (53.5%) |
| 6 or 7 Rooms | 3,358 (43.8%) | 837 (28.1%) |
| 8 or more Rooms | 1,564 (20.4%) | 156 (5.2%) |
| Total | 7,667 (100.0%) | 2,973 (100.0%) |
Housing Structure by Heating Type in Palo Pinto County
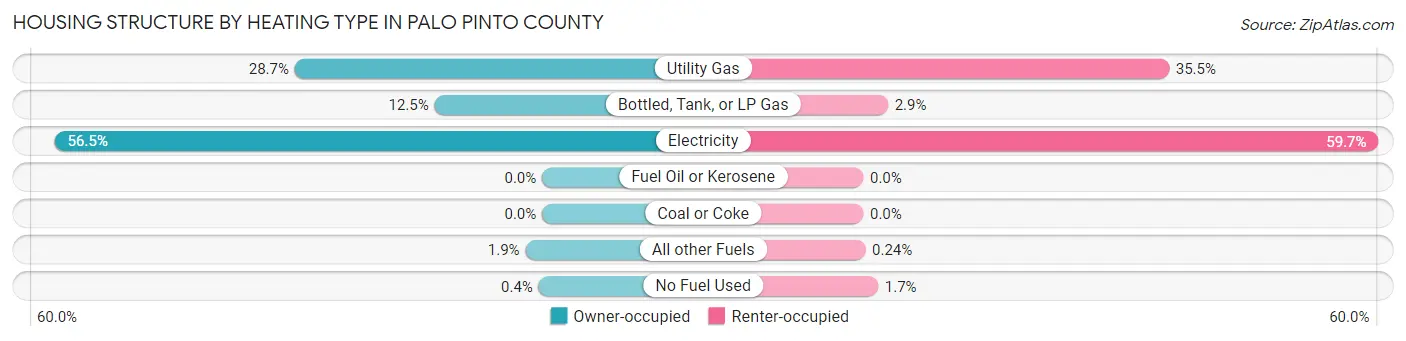
| Heating Type | Owner-occupied | Renter-occupied |
| Utility Gas | 2,198 (28.7%) | 1,054 (35.4%) |
| Bottled, Tank, or LP Gas | 956 (12.5%) | 85 (2.9%) |
| Electricity | 4,334 (56.5%) | 1,776 (59.7%) |
| Fuel Oil or Kerosene | 0 (0.0%) | 0 (0.0%) |
| Coal or Coke | 0 (0.0%) | 0 (0.0%) |
| All other Fuels | 148 (1.9%) | 7 (0.2%) |
| No Fuel Used | 31 (0.4%) | 51 (1.7%) |
| Total | 7,667 (100.0%) | 2,973 (100.0%) |
Household Vehicle Usage in Palo Pinto County
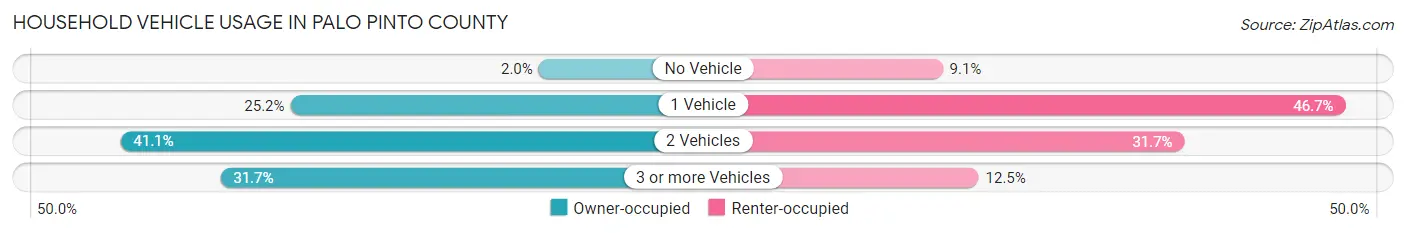
| Vehicles per Household | Owner-occupied | Renter-occupied |
| No Vehicle | 155 (2.0%) | 271 (9.1%) |
| 1 Vehicle | 1,931 (25.2%) | 1,389 (46.7%) |
| 2 Vehicles | 3,148 (41.1%) | 942 (31.7%) |
| 3 or more Vehicles | 2,433 (31.7%) | 371 (12.5%) |
| Total | 7,667 (100.0%) | 2,973 (100.0%) |
Real Estate & Mortgages in Palo Pinto County
Real Estate and Mortgage Overview in Palo Pinto County
| Characteristic | Without Mortgage | With Mortgage |
| Housing Units | 4,770 | 2,897 |
| Median Property Value | $129,700 | $181,700 |
| Median Household Income | $64,344 | $590 |
| Monthly Housing Costs | $548 | $381 |
| Real Estate Taxes | $1,461 | $126 |
Property Value by Mortgage Status in Palo Pinto County
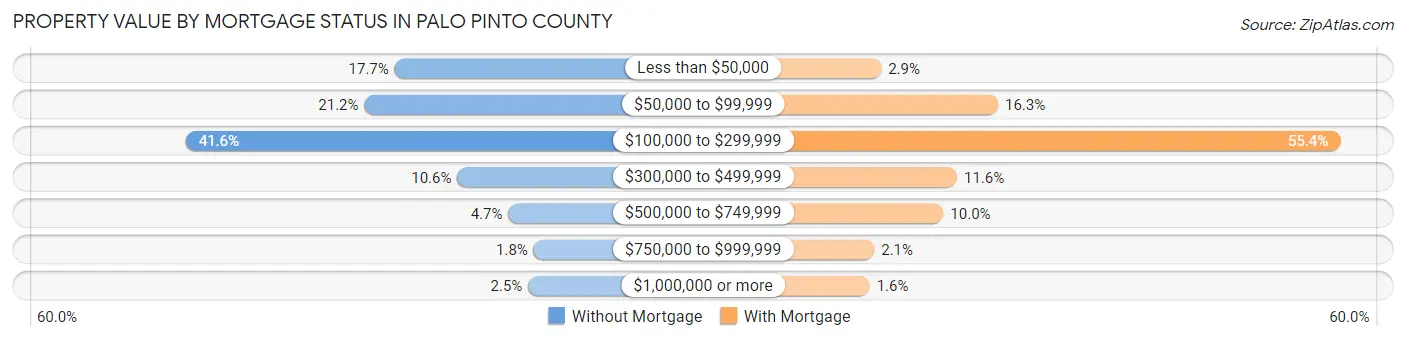
| Property Value | Without Mortgage | With Mortgage |
| Less than $50,000 | 845 (17.7%) | 85 (2.9%) |
| $50,000 to $99,999 | 1,010 (21.2%) | 472 (16.3%) |
| $100,000 to $299,999 | 1,983 (41.6%) | 1,604 (55.4%) |
| $300,000 to $499,999 | 503 (10.5%) | 336 (11.6%) |
| $500,000 to $749,999 | 225 (4.7%) | 291 (10.0%) |
| $750,000 to $999,999 | 87 (1.8%) | 62 (2.1%) |
| $1,000,000 or more | 117 (2.5%) | 47 (1.6%) |
| Total | 4,770 (100.0%) | 2,897 (100.0%) |
Household Income by Mortgage Status in Palo Pinto County
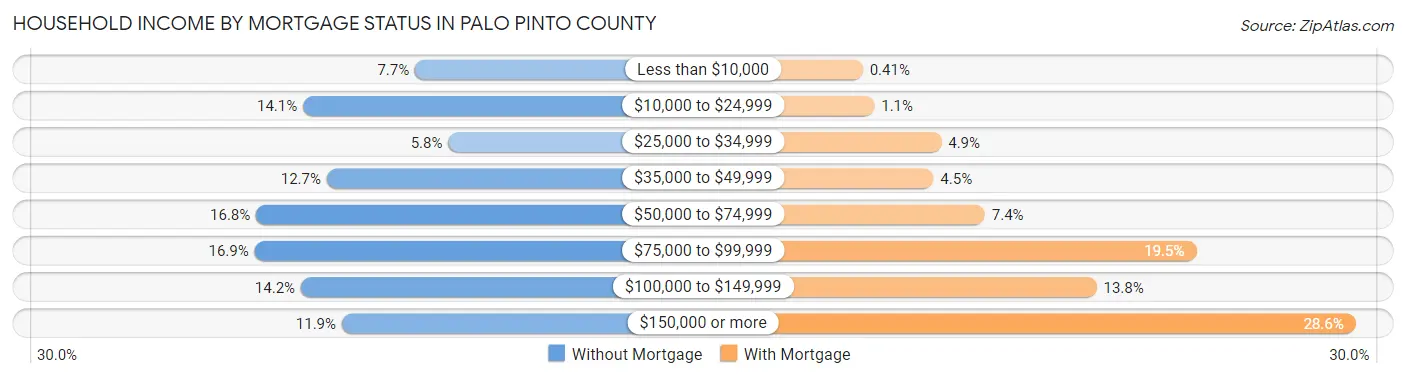
| Household Income | Without Mortgage | With Mortgage |
| Less than $10,000 | 367 (7.7%) | 12 (0.4%) |
| $10,000 to $24,999 | 672 (14.1%) | 31 (1.1%) |
| $25,000 to $34,999 | 276 (5.8%) | 142 (4.9%) |
| $35,000 to $49,999 | 607 (12.7%) | 129 (4.4%) |
| $50,000 to $74,999 | 800 (16.8%) | 214 (7.4%) |
| $75,000 to $99,999 | 804 (16.9%) | 564 (19.5%) |
| $100,000 to $149,999 | 678 (14.2%) | 399 (13.8%) |
| $150,000 or more | 566 (11.9%) | 828 (28.6%) |
| Total | 4,770 (100.0%) | 2,897 (100.0%) |
Property Value to Household Income Ratio in Palo Pinto County
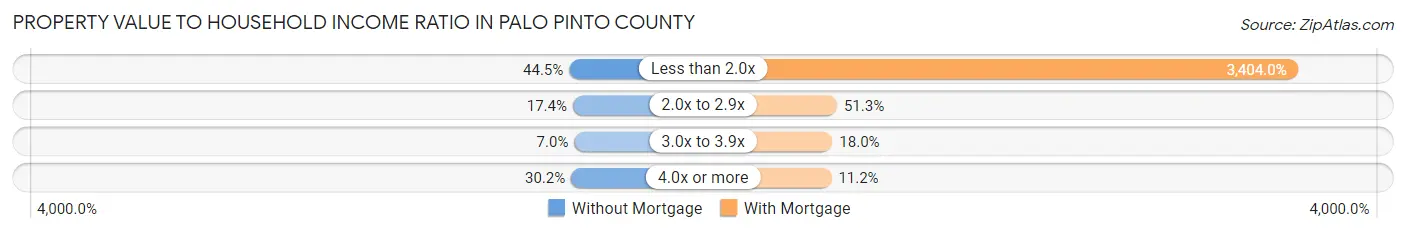
| Value-to-Income Ratio | Without Mortgage | With Mortgage |
| Less than 2.0x | 2,123 (44.5%) | 98,614 (3,404.0%) |
| 2.0x to 2.9x | 829 (17.4%) | 1,487 (51.3%) |
| 3.0x to 3.9x | 332 (7.0%) | 521 (18.0%) |
| 4.0x or more | 1,438 (30.1%) | 323 (11.2%) |
| Total | 4,770 (100.0%) | 2,897 (100.0%) |
Real Estate Taxes by Mortgage Status in Palo Pinto County
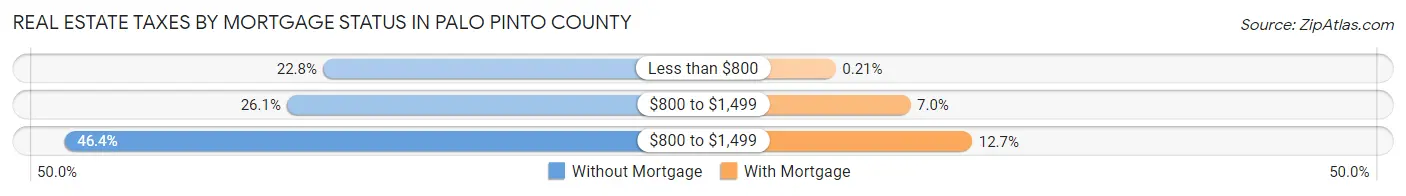
| Property Taxes | Without Mortgage | With Mortgage |
| Less than $800 | 1,086 (22.8%) | 6 (0.2%) |
| $800 to $1,499 | 1,243 (26.1%) | 204 (7.0%) |
| $800 to $1,499 | 2,212 (46.4%) | 367 (12.7%) |
| Total | 4,770 (100.0%) | 2,897 (100.0%) |
Health & Disability in Palo Pinto County
Health Insurance Coverage by Age in Palo Pinto County
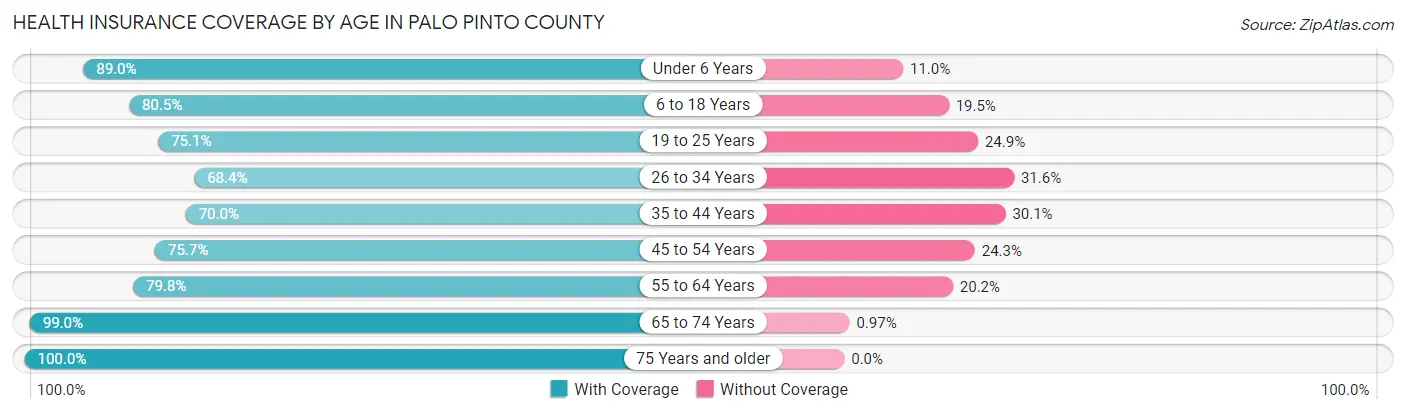
| Age Bracket | With Coverage | Without Coverage |
| Under 6 Years | 1,926 (89.0%) | 237 (11.0%) |
| 6 to 18 Years | 4,042 (80.5%) | 977 (19.5%) |
| 19 to 25 Years | 1,617 (75.1%) | 537 (24.9%) |
| 26 to 34 Years | 2,042 (68.4%) | 945 (31.6%) |
| 35 to 44 Years | 2,167 (70.0%) | 931 (30.0%) |
| 45 to 54 Years | 2,493 (75.7%) | 802 (24.3%) |
| 55 to 64 Years | 3,275 (79.8%) | 831 (20.2%) |
| 65 to 74 Years | 3,361 (99.0%) | 33 (1.0%) |
| 75 Years and older | 2,083 (100.0%) | 0 (0.0%) |
| Total | 23,006 (81.3%) | 5,293 (18.7%) |
Health Insurance Coverage by Citizenship Status in Palo Pinto County
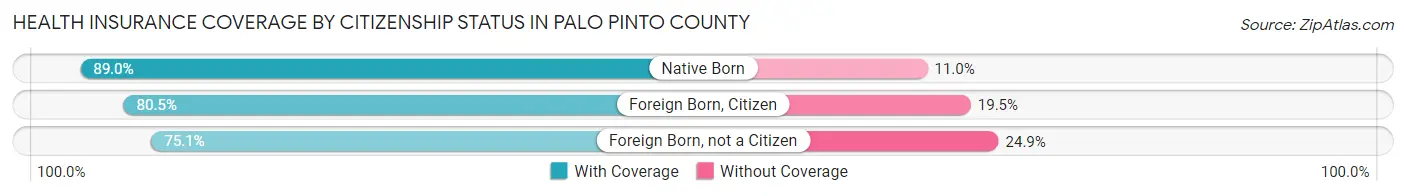
| Citizenship Status | With Coverage | Without Coverage |
| Native Born | 1,926 (89.0%) | 237 (11.0%) |
| Foreign Born, Citizen | 4,042 (80.5%) | 977 (19.5%) |
| Foreign Born, not a Citizen | 1,617 (75.1%) | 537 (24.9%) |
Health Insurance Coverage by Household Income in Palo Pinto County
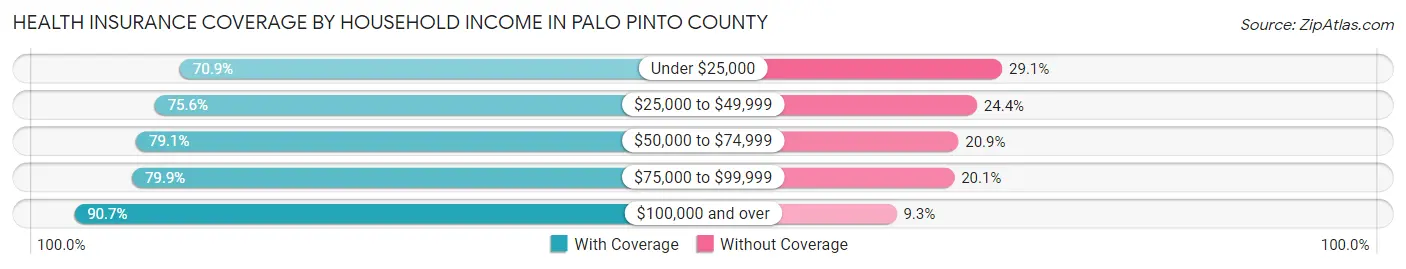
| Household Income | With Coverage | Without Coverage |
| Under $25,000 | 2,946 (70.9%) | 1,209 (29.1%) |
| $25,000 to $49,999 | 3,701 (75.6%) | 1,193 (24.4%) |
| $50,000 to $74,999 | 4,140 (79.1%) | 1,093 (20.9%) |
| $75,000 to $99,999 | 3,661 (79.9%) | 922 (20.1%) |
| $100,000 and over | 8,541 (90.7%) | 876 (9.3%) |
Public vs Private Health Insurance Coverage by Age in Palo Pinto County
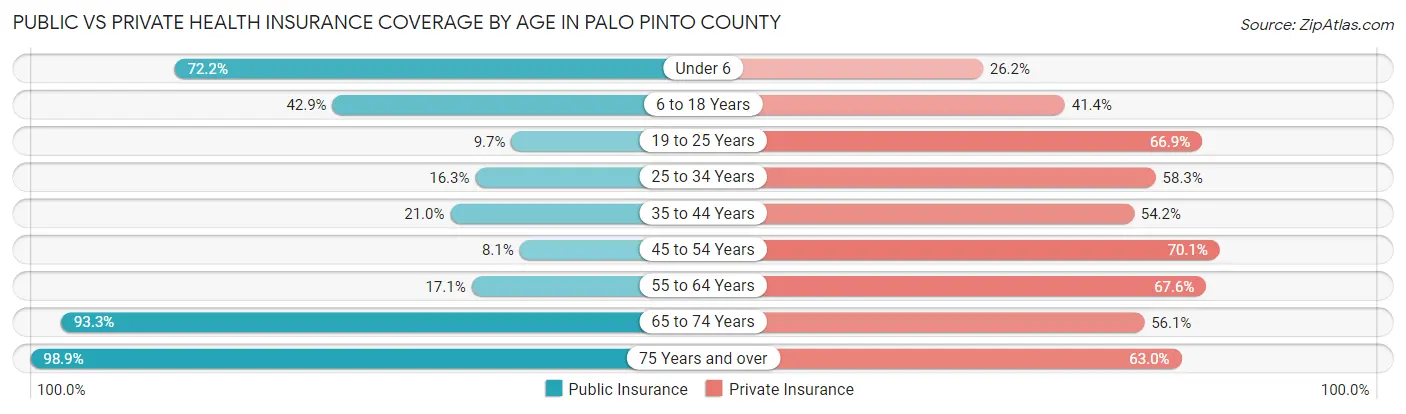
| Age Bracket | Public Insurance | Private Insurance |
| Under 6 | 1,561 (72.2%) | 566 (26.2%) |
| 6 to 18 Years | 2,151 (42.9%) | 2,078 (41.4%) |
| 19 to 25 Years | 208 (9.7%) | 1,440 (66.8%) |
| 25 to 34 Years | 488 (16.3%) | 1,740 (58.3%) |
| 35 to 44 Years | 650 (21.0%) | 1,679 (54.2%) |
| 45 to 54 Years | 268 (8.1%) | 2,311 (70.1%) |
| 55 to 64 Years | 700 (17.1%) | 2,777 (67.6%) |
| 65 to 74 Years | 3,165 (93.2%) | 1,905 (56.1%) |
| 75 Years and over | 2,061 (98.9%) | 1,313 (63.0%) |
| Total | 11,252 (39.8%) | 15,809 (55.9%) |
Disability Status by Sex by Age in Palo Pinto County
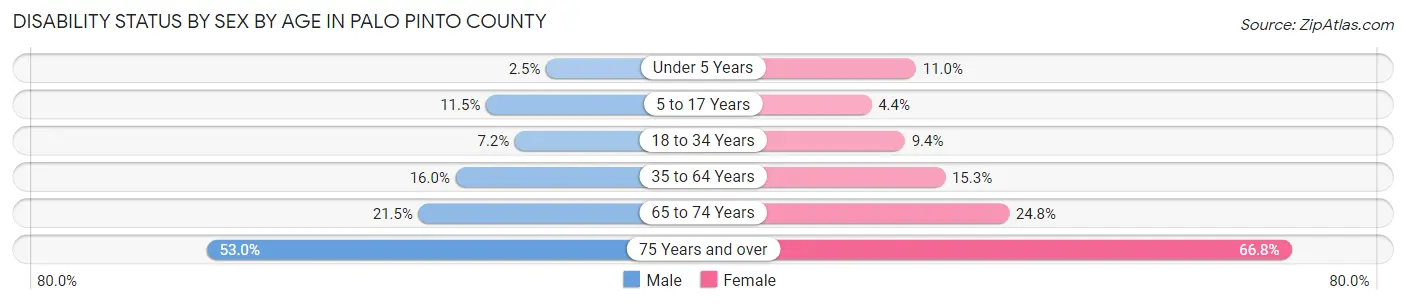
| Age Bracket | Male | Female |
| Under 5 Years | 20 (2.5%) | 99 (11.0%) |
| 5 to 17 Years | 302 (11.5%) | 101 (4.4%) |
| 18 to 34 Years | 200 (7.2%) | 270 (9.3%) |
| 35 to 64 Years | 812 (16.0%) | 830 (15.3%) |
| 65 to 74 Years | 360 (21.5%) | 426 (24.8%) |
| 75 Years and over | 490 (53.0%) | 773 (66.7%) |
Disability Class by Sex by Age in Palo Pinto County
Disability Class: Hearing Difficulty
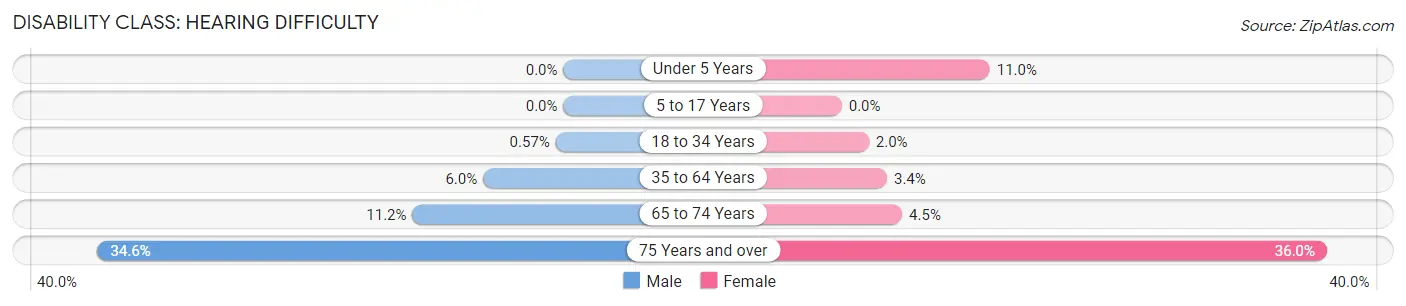
| Age Bracket | Male | Female |
| Under 5 Years | 0 (0.0%) | 99 (11.0%) |
| 5 to 17 Years | 0 (0.0%) | 0 (0.0%) |
| 18 to 34 Years | 16 (0.6%) | 58 (2.0%) |
| 35 to 64 Years | 303 (6.0%) | 182 (3.4%) |
| 65 to 74 Years | 188 (11.2%) | 77 (4.5%) |
| 75 Years and over | 320 (34.6%) | 417 (36.0%) |
Disability Class: Vision Difficulty
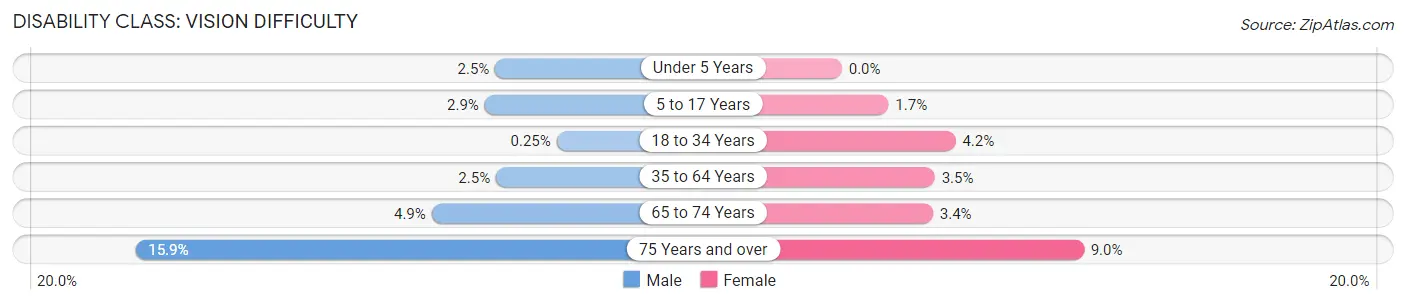
| Age Bracket | Male | Female |
| Under 5 Years | 20 (2.5%) | 0 (0.0%) |
| 5 to 17 Years | 77 (2.9%) | 40 (1.7%) |
| 18 to 34 Years | 7 (0.3%) | 122 (4.2%) |
| 35 to 64 Years | 127 (2.5%) | 187 (3.5%) |
| 65 to 74 Years | 82 (4.9%) | 58 (3.4%) |
| 75 Years and over | 147 (15.9%) | 104 (9.0%) |
Disability Class: Cognitive Difficulty
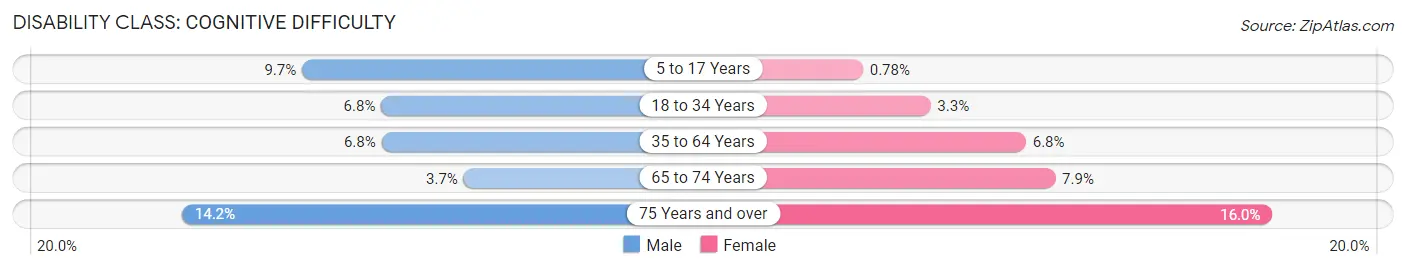
| Age Bracket | Male | Female |
| 5 to 17 Years | 256 (9.7%) | 18 (0.8%) |
| 18 to 34 Years | 189 (6.8%) | 95 (3.3%) |
| 35 to 64 Years | 343 (6.8%) | 370 (6.8%) |
| 65 to 74 Years | 62 (3.7%) | 136 (7.9%) |
| 75 Years and over | 131 (14.2%) | 185 (16.0%) |
Disability Class: Ambulatory Difficulty
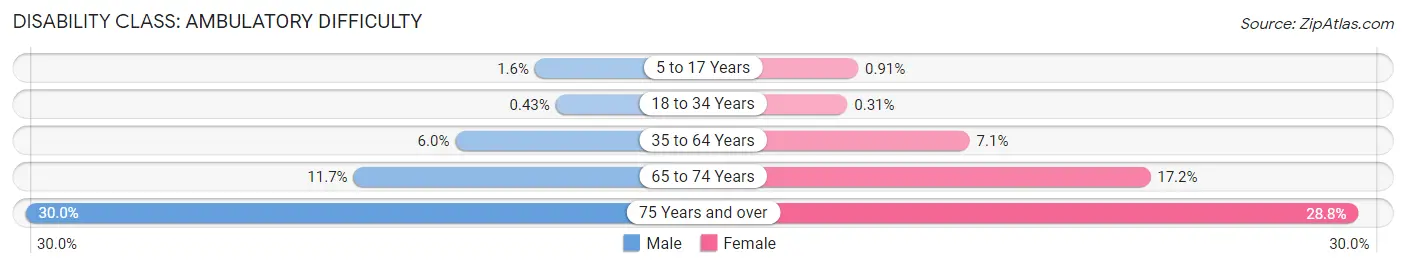
| Age Bracket | Male | Female |
| 5 to 17 Years | 42 (1.6%) | 21 (0.9%) |
| 18 to 34 Years | 12 (0.4%) | 9 (0.3%) |
| 35 to 64 Years | 306 (6.0%) | 386 (7.1%) |
| 65 to 74 Years | 196 (11.7%) | 295 (17.2%) |
| 75 Years and over | 277 (29.9%) | 333 (28.8%) |
Disability Class: Self-Care Difficulty
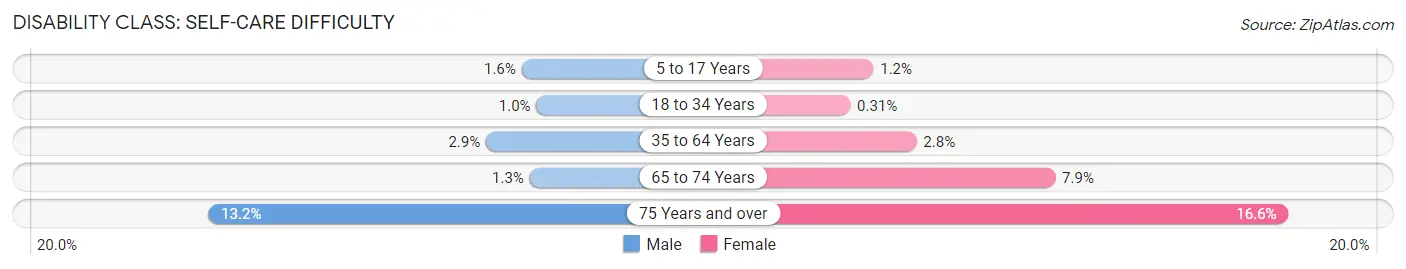
| Age Bracket | Male | Female |
| 5 to 17 Years | 41 (1.5%) | 27 (1.2%) |
| 18 to 34 Years | 28 (1.0%) | 9 (0.3%) |
| 35 to 64 Years | 146 (2.9%) | 150 (2.8%) |
| 65 to 74 Years | 21 (1.3%) | 136 (7.9%) |
| 75 Years and over | 122 (13.2%) | 192 (16.6%) |
Technology Access in Palo Pinto County
Computing Device Access in Palo Pinto County
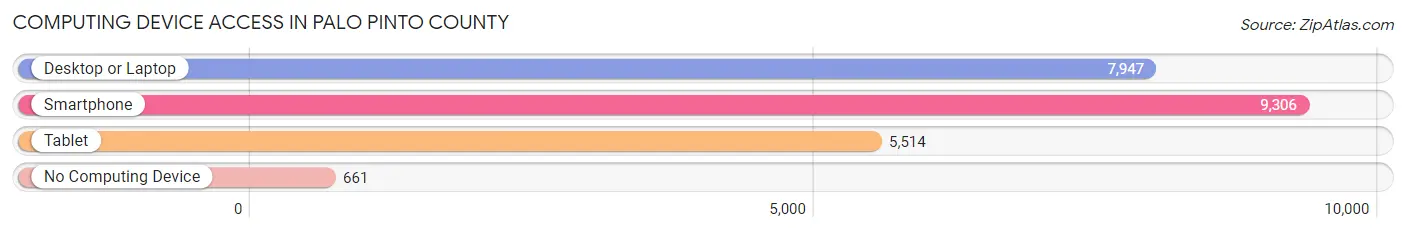
| Device Type | # Households | % Households |
| Desktop or Laptop | 7,947 | 74.7% |
| Smartphone | 9,306 | 87.5% |
| Tablet | 5,514 | 51.8% |
| No Computing Device | 661 | 6.2% |
| Total | 10,640 | 100.0% |
Internet Access in Palo Pinto County
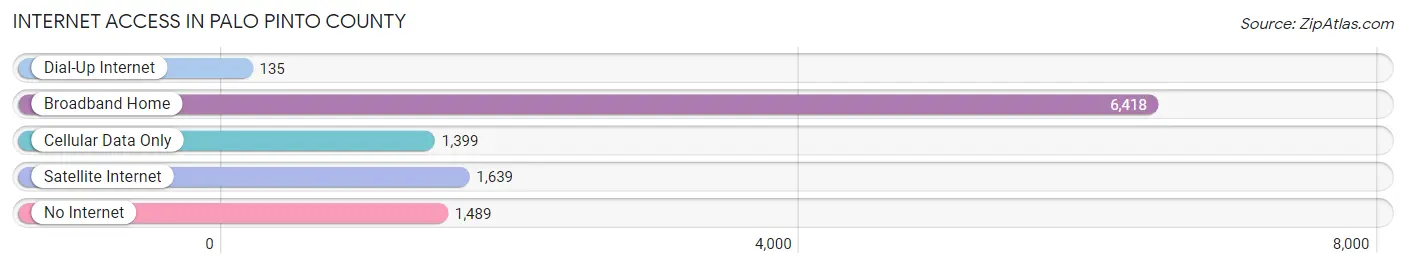
| Internet Type | # Households | % Households |
| Dial-Up Internet | 135 | 1.3% |
| Broadband Home | 6,418 | 60.3% |
| Cellular Data Only | 1,399 | 13.2% |
| Satellite Internet | 1,639 | 15.4% |
| No Internet | 1,489 | 14.0% |
| Total | 10,640 | 100.0% |
Palo Pinto County Summary
Palo Pinto County is located in the north-central region of Texas, and is part of the Dallas-Fort Worth-Arlington metropolitan area. The county is bordered by Jack, Parker, Stephens, Young, and Eastland counties. The county seat is Palo Pinto, and the largest city is Mineral Wells. As of the 2010 census, the population was 28,111.
Geography
Palo Pinto County covers an area of 1,033 square miles, of which 1,032 square miles is land and 1 square mile is water. The county is located in the Cross Timbers region of Texas, and is characterized by rolling hills and wooded areas. The Brazos River forms the eastern boundary of the county, and the Palo Pinto Mountains are located in the western part of the county.
The climate of Palo Pinto County is characterized by hot summers and mild winters. The average annual temperature is 68°F, and the average annual precipitation is 33 inches.
Economy
The economy of Palo Pinto County is largely based on agriculture and oil and gas production. The county is home to several large ranches, and the main crops grown in the county are cotton, corn, wheat, and hay. The county is also home to several oil and gas fields, and the production of oil and gas is a major contributor to the local economy.
In addition to agriculture and oil and gas production, the county is home to several manufacturing companies, including a paper mill, a furniture factory, and a plastics plant. The county is also home to several retail stores, restaurants, and other businesses.
Demographics
As of the 2010 census, the population of Palo Pinto County was 28,111, and the population density was 27.3 people per square mile. The racial makeup of the county was 84.3% White, 8.2% Hispanic or Latino, 5.2% African American, 0.7% Native American, 0.3% Asian, and 0.2% Pacific Islander.
The median household income in the county was $41,945, and the median family income was $48,945. The per capita income was $20,945. About 14.3% of the population was below the poverty line.
The largest cities in the county are Mineral Wells (population 16,788) and Palo Pinto (population 1,788). The county is served by the Palo Pinto County Independent School District, which includes seven elementary schools, two middle schools, and two high schools.
Conclusion
Palo Pinto County is located in the north-central region of Texas, and is part of the Dallas-Fort Worth-Arlington metropolitan area. The county is characterized by rolling hills and wooded areas, and the economy is largely based on agriculture and oil and gas production. As of the 2010 census, the population of the county was 28,111, and the largest cities are Mineral Wells and Palo Pinto. The county is served by the Palo Pinto County Independent School District, and the median household income in the county was $41,945.
Common Questions
What is Per Capita Income in Palo Pinto County?
Per Capita income in Palo Pinto County is $31,890.
What is the Median Family Income in Palo Pinto County?
Median Family Income in Palo Pinto County is $76,647.
What is the Median Household income in Palo Pinto County?
Median Household Income in Palo Pinto County is $65,242.
What is Income or Wage Gap in Palo Pinto County?
Income or Wage Gap in Palo Pinto County is 33.9%.
Women in Palo Pinto County earn 66.1 cents for every dollar earned by a man.
What is Family Income Deficit in Palo Pinto County?
Family Income Deficit in Palo Pinto County is $9,944.
Families that are below poverty line in Palo Pinto County earn $9,944 less on average than the poverty threshold level.
What is Inequality or Gini Index in Palo Pinto County?
Inequality or Gini Index in Palo Pinto County is 0.45.
What is the Total Population of Palo Pinto County?
Total Population of Palo Pinto County is 28,569.
What is the Total Male Population of Palo Pinto County?
Total Male Population of Palo Pinto County is 14,050.
What is the Total Female Population of Palo Pinto County?
Total Female Population of Palo Pinto County is 14,519.
What is the Ratio of Males per 100 Females in Palo Pinto County?
There are 96.77 Males per 100 Females in Palo Pinto County.
What is the Ratio of Females per 100 Males in Palo Pinto County?
There are 103.34 Females per 100 Males in Palo Pinto County.
What is the Median Population Age in Palo Pinto County?
Median Population Age in Palo Pinto County is 41.3 Years.
What is the Average Family Size in Palo Pinto County
Average Family Size in Palo Pinto County is 3.2 People.
What is the Average Household Size in Palo Pinto County
Average Household Size in Palo Pinto County is 2.7 People.
How Large is the Labor Force in Palo Pinto County?
There are 13,211 People in the Labor Forcein in Palo Pinto County.
What is the Percentage of People in the Labor Force in Palo Pinto County?
58.5% of People are in the Labor Force in Palo Pinto County.
What is the Unemployment Rate in Palo Pinto County?
Unemployment Rate in Palo Pinto County is 7.3%.