Orange County, TX Map & Demographics
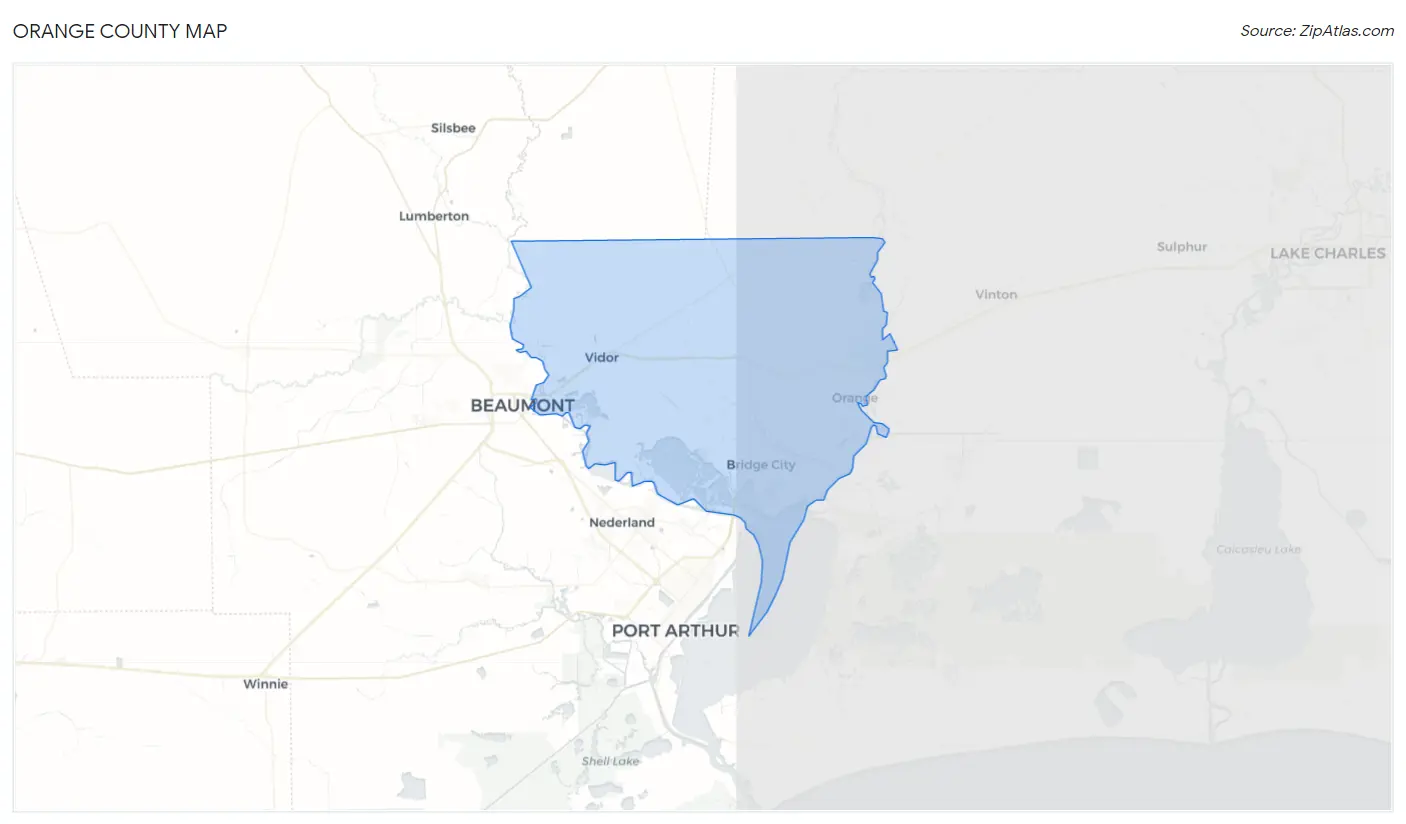
Orange County Map
Orange County Overview
$35,301
PER CAPITA INCOME
$92,500
AVG FAMILY INCOME
$71,910
AVG HOUSEHOLD INCOME
45.4%
WAGE / INCOME GAP [ % ]
54.6¢/ $1
WAGE / INCOME GAP [ $ ]
$12,073
FAMILY INCOME DEFICIT
0.44
INEQUALITY / GINI INDEX
84,761
TOTAL POPULATION
42,264
MALE POPULATION
42,497
FEMALE POPULATION
99.45
MALES / 100 FEMALES
100.55
FEMALES / 100 MALES
37.7
MEDIAN AGE
3.2
AVG FAMILY SIZE
2.7
AVG HOUSEHOLD SIZE
40,640
LABOR FORCE [ PEOPLE ]
61.5%
PERCENT IN LABOR FORCE
5.8%
UNEMPLOYMENT RATE
Orange County Area Codes
Income in Orange County
Income Overview in Orange County
Per Capita Income in Orange County is $35,301, while median incomes of families and households are $92,500 and $71,910 respectively.
| Characteristic | Number | Measure |
| Per Capita Income | 84,761 | $35,301 |
| Median Family Income | 22,276 | $92,500 |
| Mean Family Income | 22,276 | $107,372 |
| Median Household Income | 31,274 | $71,910 |
| Mean Household Income | 31,274 | $93,395 |
| Income Deficit | 22,276 | $12,073 |
| Wage / Income Gap (%) | 84,761 | 45.41% |
| Wage / Income Gap ($) | 84,761 | 54.59¢ per $1 |
| Gini / Inequality Index | 84,761 | 0.44 |
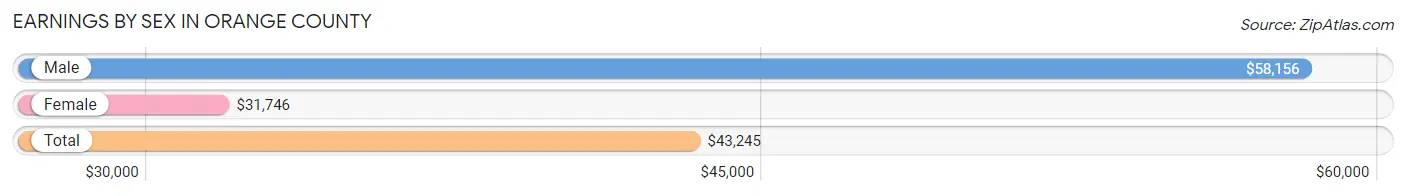
Earnings by Sex in Orange County
Average Earnings in Orange County are $43,245, $58,156 for men and $31,746 for women, a difference of 45.4%.
| Sex | Number | Average Earnings |
| Male | 23,140 (55.8%) | $58,156 |
| Female | 18,357 (44.2%) | $31,746 |
| Total | 41,497 (100.0%) | $43,245 |
Earnings by Sex by Income Bracket in Orange County
The most common earnings brackets in Orange County are $100,000+ for men (5,559 | 24.0%) and $75,000 to $99,999 for women (1,662 | 9.0%).
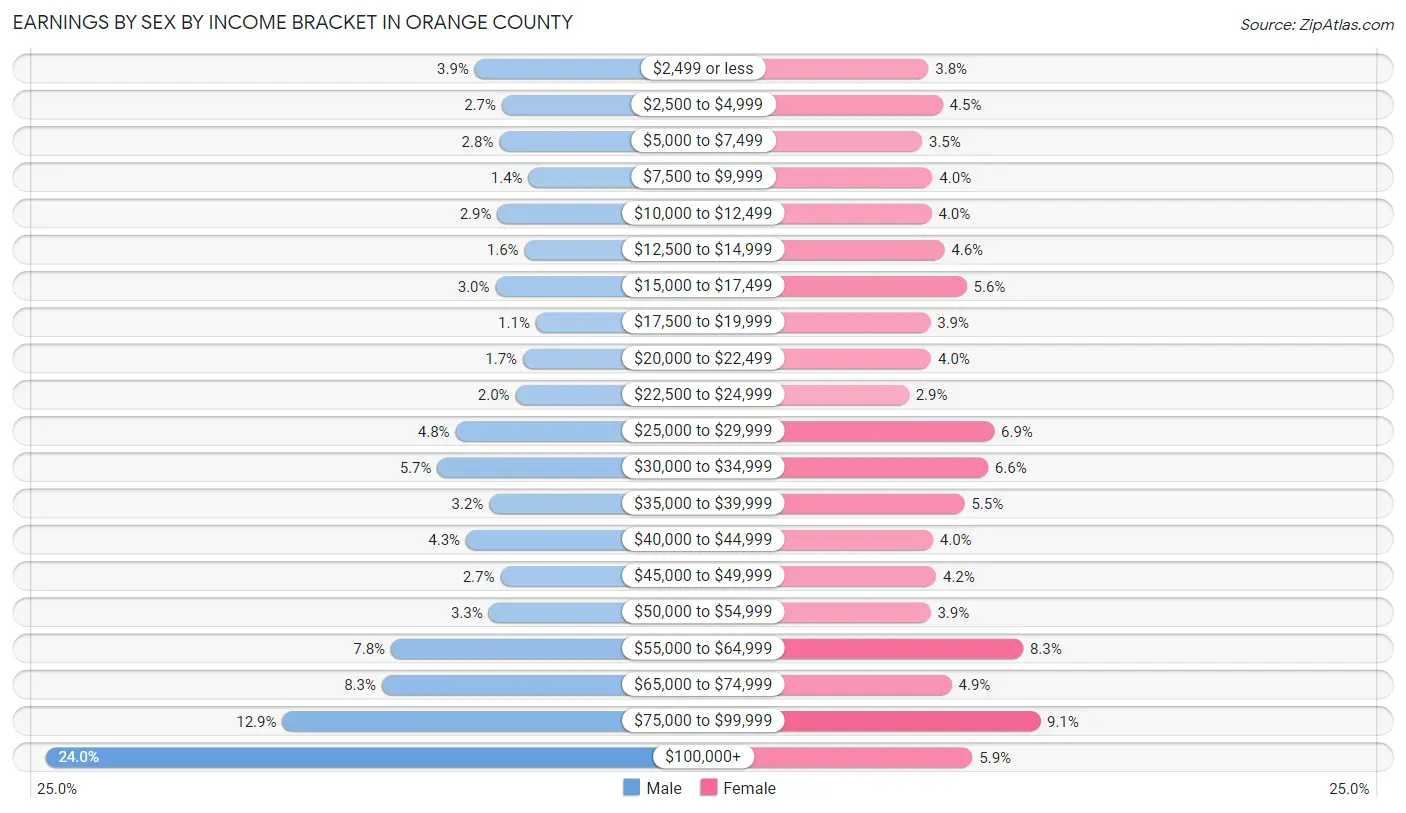
| Income | Male | Female |
| $2,499 or less | 907 (3.9%) | 702 (3.8%) |
| $2,500 to $4,999 | 613 (2.6%) | 825 (4.5%) |
| $5,000 to $7,499 | 641 (2.8%) | 647 (3.5%) |
| $7,500 to $9,999 | 325 (1.4%) | 737 (4.0%) |
| $10,000 to $12,499 | 661 (2.9%) | 728 (4.0%) |
| $12,500 to $14,999 | 369 (1.6%) | 839 (4.6%) |
| $15,000 to $17,499 | 682 (2.9%) | 1,030 (5.6%) |
| $17,500 to $19,999 | 246 (1.1%) | 718 (3.9%) |
| $20,000 to $22,499 | 384 (1.7%) | 725 (4.0%) |
| $22,500 to $24,999 | 465 (2.0%) | 532 (2.9%) |
| $25,000 to $29,999 | 1,116 (4.8%) | 1,266 (6.9%) |
| $30,000 to $34,999 | 1,313 (5.7%) | 1,214 (6.6%) |
| $35,000 to $39,999 | 750 (3.2%) | 1,011 (5.5%) |
| $40,000 to $44,999 | 1,003 (4.3%) | 739 (4.0%) |
| $45,000 to $49,999 | 630 (2.7%) | 767 (4.2%) |
| $50,000 to $54,999 | 757 (3.3%) | 720 (3.9%) |
| $55,000 to $64,999 | 1,814 (7.8%) | 1,514 (8.3%) |
| $65,000 to $74,999 | 1,914 (8.3%) | 901 (4.9%) |
| $75,000 to $99,999 | 2,991 (12.9%) | 1,662 (9.0%) |
| $100,000+ | 5,559 (24.0%) | 1,080 (5.9%) |
| Total | 23,140 (100.0%) | 18,357 (100.0%) |
Earnings by Sex by Educational Attainment in Orange County
Average earnings in Orange County are $67,774 for men and $36,554 for women, a difference of 46.1%. Men with an educational attainment of graduate degree enjoy the highest average annual earnings of $177,721, while those with less than high school education earn the least with $38,864. Women with an educational attainment of graduate degree earn the most with the average annual earnings of $79,612, while those with less than high school education have the smallest earnings of $17,301.
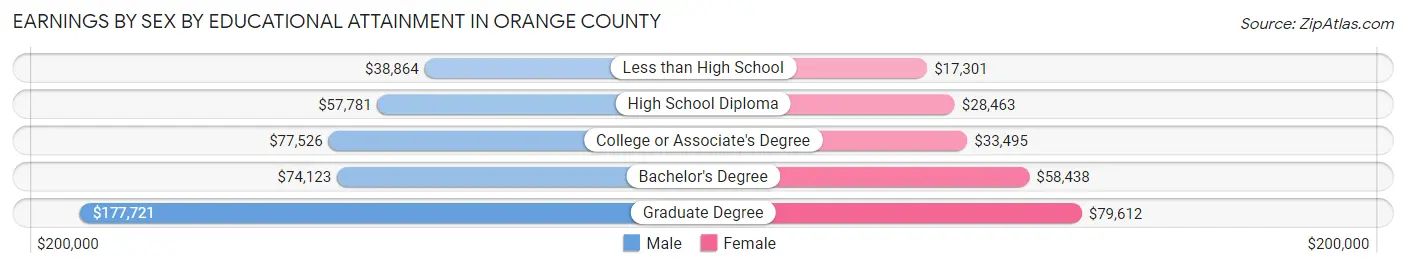
| Educational Attainment | Male Income | Female Income |
| Less than High School | $38,864 | $17,301 |
| High School Diploma | $57,781 | $28,463 |
| College or Associate's Degree | $77,526 | $33,495 |
| Bachelor's Degree | $74,123 | $58,438 |
| Graduate Degree | $177,721 | $79,612 |
| Total | $67,774 | $36,554 |
Family Income in Orange County
Family Income Brackets in Orange County
According to the Orange County family income data, there are 5,569 families falling into the $100,000 to $149,999 income range, which is the most common income bracket and makes up 25.0% of all families. Conversely, the $10,000 to $14,999 income bracket is the least frequent group with only 245 families (1.1%) belonging to this category.
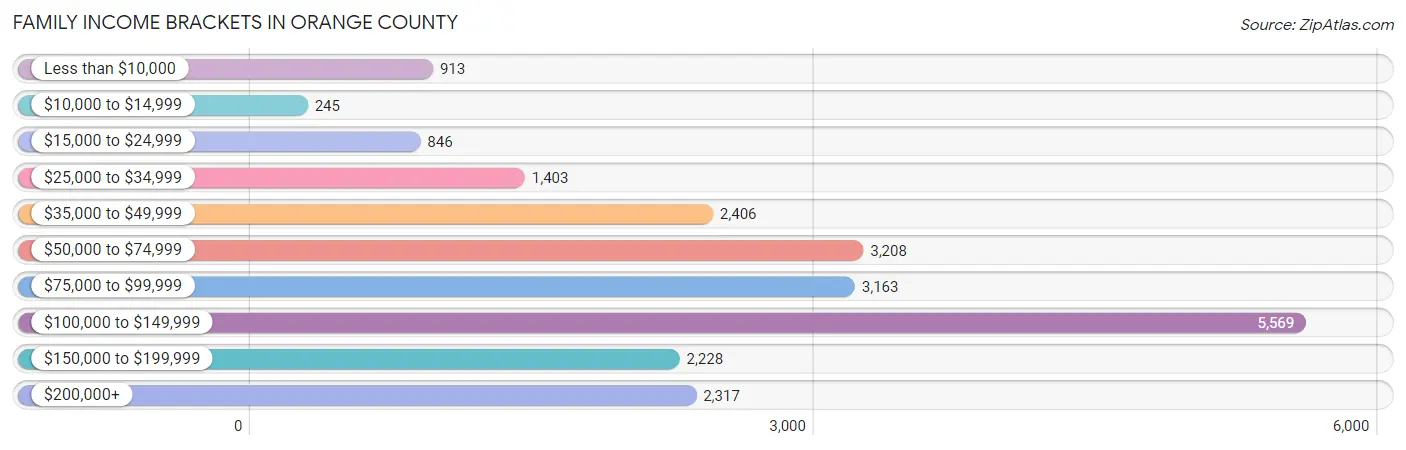
| Income Bracket | # Families | % Families |
| Less than $10,000 | 913 | 4.1% |
| $10,000 to $14,999 | 245 | 1.1% |
| $15,000 to $24,999 | 846 | 3.8% |
| $25,000 to $34,999 | 1,403 | 6.3% |
| $35,000 to $49,999 | 2,406 | 10.8% |
| $50,000 to $74,999 | 3,208 | 14.4% |
| $75,000 to $99,999 | 3,163 | 14.2% |
| $100,000 to $149,999 | 5,569 | 25.0% |
| $150,000 to $199,999 | 2,228 | 10.0% |
| $200,000+ | 2,317 | 10.4% |
Family Income by Famaliy Size in Orange County
6-person families (651 | 2.9%) account for the highest median family income in Orange County with $128,427 per family, while 2-person families (10,328 | 46.4%) have the highest median income of $39,176 per family member.
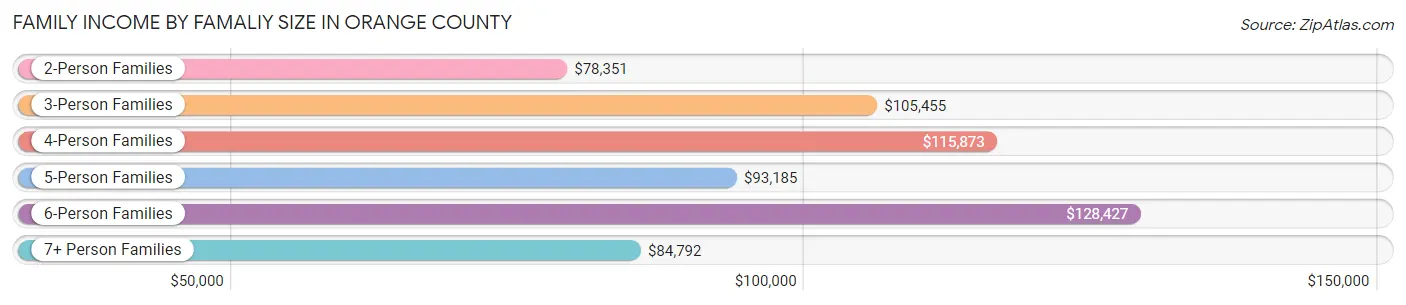
| Income Bracket | # Families | Median Income |
| 2-Person Families | 10,328 (46.4%) | $78,351 |
| 3-Person Families | 5,080 (22.8%) | $105,455 |
| 4-Person Families | 3,478 (15.6%) | $115,873 |
| 5-Person Families | 2,299 (10.3%) | $93,185 |
| 6-Person Families | 651 (2.9%) | $128,427 |
| 7+ Person Families | 440 (2.0%) | $84,792 |
| Total | 22,276 (100.0%) | $92,500 |
Family Income by Number of Earners in Orange County
The median family income in Orange County is $92,500, with families comprising 3+ earners (2,152) having the highest median family income of $155,645, while families with no earners (3,491) have the lowest median family income of $49,358, accounting for 9.7% and 15.7% of families, respectively.
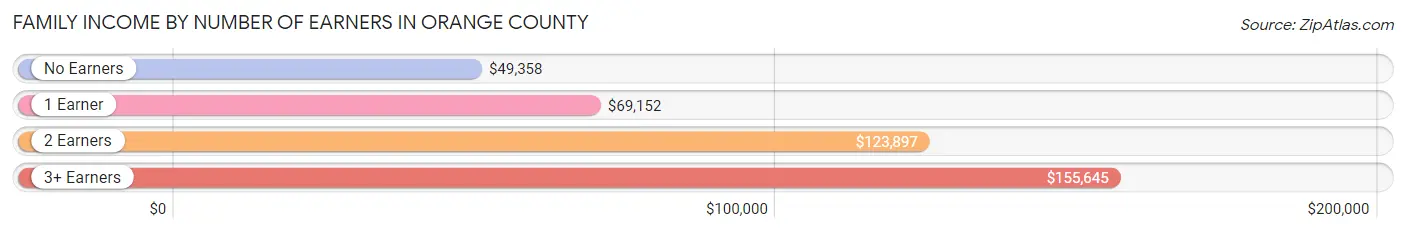
| Number of Earners | # Families | Median Income |
| No Earners | 3,491 (15.7%) | $49,358 |
| 1 Earner | 8,051 (36.1%) | $69,152 |
| 2 Earners | 8,582 (38.5%) | $123,897 |
| 3+ Earners | 2,152 (9.7%) | $155,645 |
| Total | 22,276 (100.0%) | $92,500 |
Household Income in Orange County
Household Income Brackets in Orange County
With 6,161 households falling in the category, the $100,000 to $149,999 income range is the most frequent in Orange County, accounting for 19.7% of all households. In contrast, only 969 households (3.1%) fall into the $10,000 to $14,999 income bracket, making it the least populous group.
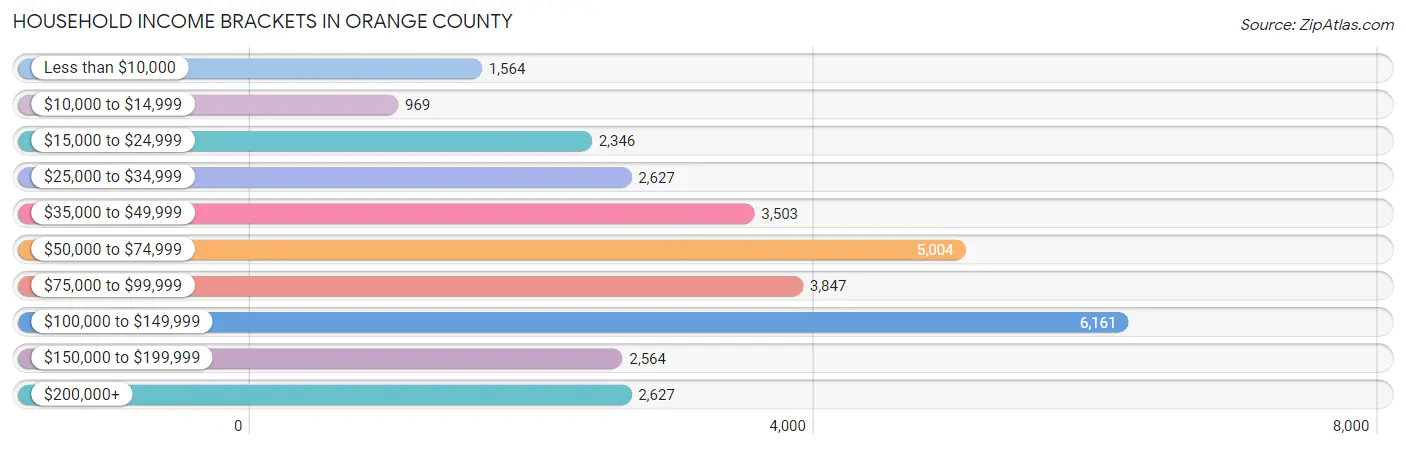
| Income Bracket | # Households | % Households |
| Less than $10,000 | 1,564 | 5.0% |
| $10,000 to $14,999 | 969 | 3.1% |
| $15,000 to $24,999 | 2,346 | 7.5% |
| $25,000 to $34,999 | 2,627 | 8.4% |
| $35,000 to $49,999 | 3,503 | 11.2% |
| $50,000 to $74,999 | 5,004 | 16.0% |
| $75,000 to $99,999 | 3,847 | 12.3% |
| $100,000 to $149,999 | 6,161 | 19.7% |
| $150,000 to $199,999 | 2,564 | 8.2% |
| $200,000+ | 2,627 | 8.4% |
Household Income by Householder Age in Orange County
The median household income in Orange County is $71,910, with the highest median household income of $93,620 found in the 25 to 44 years age bracket for the primary householder. A total of 10,105 households (32.3%) fall into this category. Meanwhile, the 15 to 24 years age bracket for the primary householder has the lowest median household income of $40,309, with 1,433 households (4.6%) in this group.
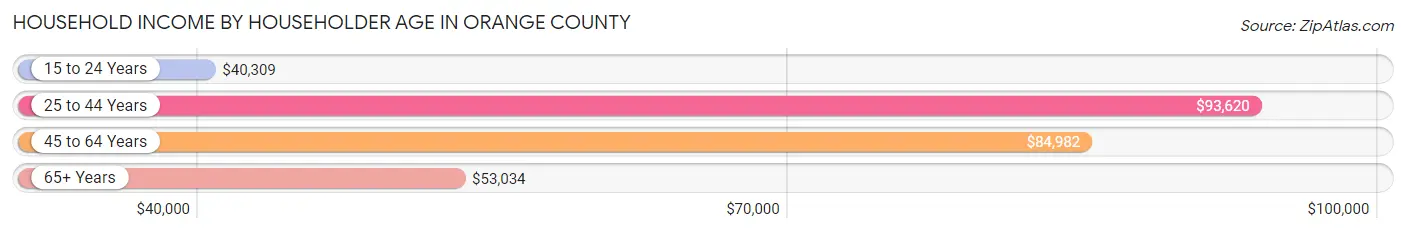
| Income Bracket | # Households | Median Income |
| 15 to 24 Years | 1,433 (4.6%) | $40,309 |
| 25 to 44 Years | 10,105 (32.3%) | $93,620 |
| 45 to 64 Years | 11,780 (37.7%) | $84,982 |
| 65+ Years | 7,956 (25.4%) | $53,034 |
| Total | 31,274 (100.0%) | $71,910 |
Poverty in Orange County
Income Below Poverty by Sex and Age in Orange County
With 10.4% poverty level for males and 13.4% for females among the residents of Orange County, 5 year old males and 18 to 24 year old females are the most vulnerable to poverty, with 101 males (25.7%) and 736 females (22.8%) in their respective age groups living below the poverty level.
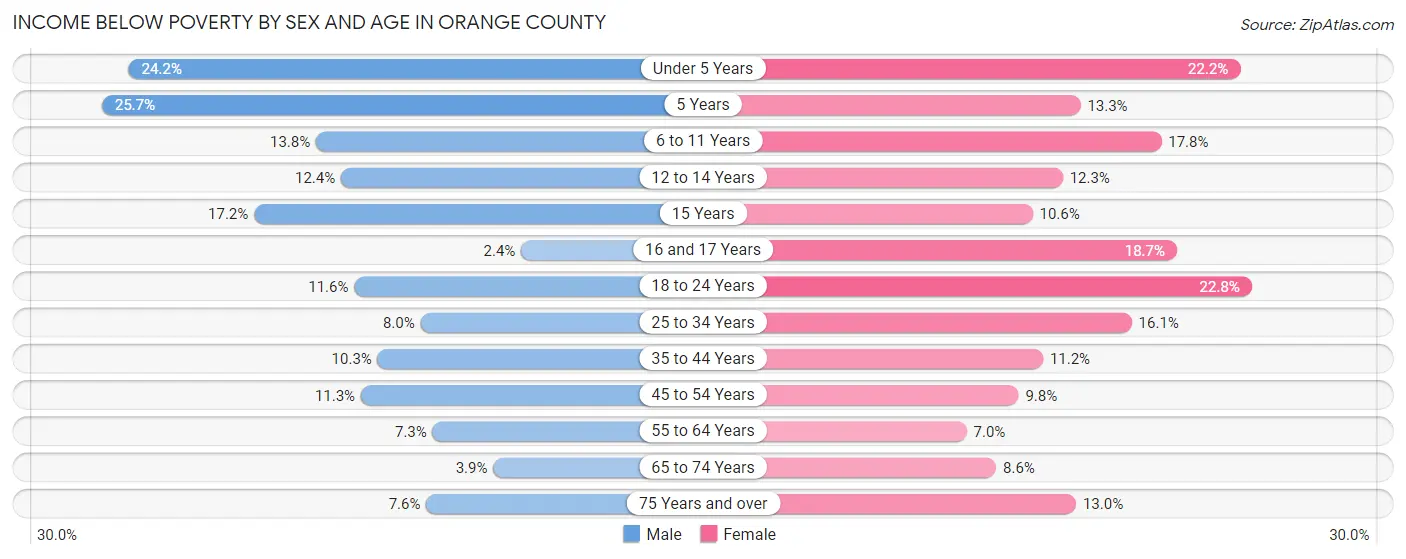
| Age Bracket | Male | Female |
| Under 5 Years | 666 (24.2%) | 596 (22.2%) |
| 5 Years | 101 (25.7%) | 109 (13.3%) |
| 6 to 11 Years | 483 (13.8%) | 584 (17.8%) |
| 12 to 14 Years | 271 (12.4%) | 195 (12.3%) |
| 15 Years | 104 (17.2%) | 65 (10.6%) |
| 16 and 17 Years | 30 (2.4%) | 233 (18.6%) |
| 18 to 24 Years | 417 (11.6%) | 736 (22.8%) |
| 25 to 34 Years | 439 (8.0%) | 876 (16.1%) |
| 35 to 44 Years | 570 (10.3%) | 631 (11.2%) |
| 45 to 54 Years | 557 (11.3%) | 490 (9.8%) |
| 55 to 64 Years | 402 (7.3%) | 383 (7.0%) |
| 65 to 74 Years | 146 (3.9%) | 351 (8.6%) |
| 75 Years and over | 168 (7.6%) | 392 (13.0%) |
| Total | 4,354 (10.4%) | 5,641 (13.4%) |
Income Above Poverty by Sex and Age in Orange County
According to the poverty statistics in Orange County, males aged 16 and 17 years and females aged 55 to 64 years are the age groups that are most secure financially, with 97.7% of males and 93.0% of females in these age groups living above the poverty line.
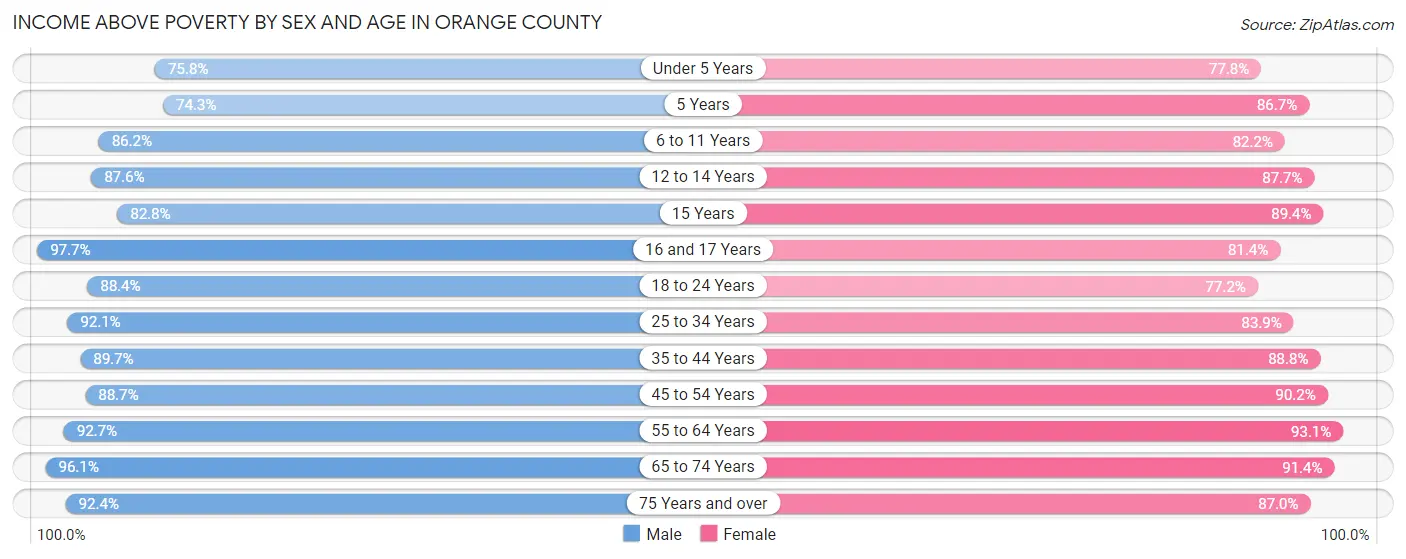
| Age Bracket | Male | Female |
| Under 5 Years | 2,085 (75.8%) | 2,091 (77.8%) |
| 5 Years | 292 (74.3%) | 711 (86.7%) |
| 6 to 11 Years | 3,024 (86.2%) | 2,699 (82.2%) |
| 12 to 14 Years | 1,918 (87.6%) | 1,390 (87.7%) |
| 15 Years | 500 (82.8%) | 547 (89.4%) |
| 16 and 17 Years | 1,246 (97.7%) | 1,016 (81.4%) |
| 18 to 24 Years | 3,167 (88.4%) | 2,489 (77.2%) |
| 25 to 34 Years | 5,083 (92.0%) | 4,551 (83.9%) |
| 35 to 44 Years | 4,941 (89.7%) | 5,005 (88.8%) |
| 45 to 54 Years | 4,386 (88.7%) | 4,488 (90.2%) |
| 55 to 64 Years | 5,122 (92.7%) | 5,126 (93.0%) |
| 65 to 74 Years | 3,593 (96.1%) | 3,736 (91.4%) |
| 75 Years and over | 2,033 (92.4%) | 2,613 (87.0%) |
| Total | 37,390 (89.6%) | 36,462 (86.6%) |
Income Below Poverty Among Married-Couple Families in Orange County
The poverty statistics for married-couple families in Orange County show that 4.4% or 747 of the total 16,977 families live below the poverty line. Families with 5 or more children have the highest poverty rate of 16.7%, comprising of 16 families. On the other hand, families with no children have the lowest poverty rate of 3.2%, which includes 301 families.
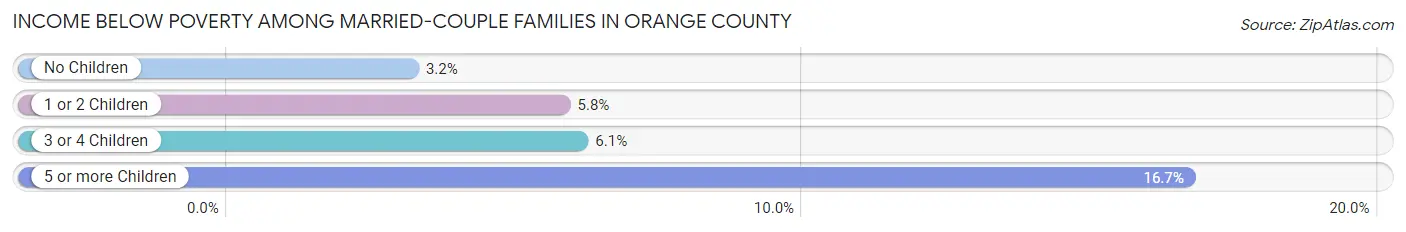
| Children | Above Poverty | Below Poverty |
| No Children | 9,256 (96.9%) | 301 (3.2%) |
| 1 or 2 Children | 5,138 (94.2%) | 316 (5.8%) |
| 3 or 4 Children | 1,756 (93.9%) | 114 (6.1%) |
| 5 or more Children | 80 (83.3%) | 16 (16.7%) |
| Total | 16,230 (95.6%) | 747 (4.4%) |
Income Below Poverty Among Single-Parent Households in Orange County
According to the poverty data in Orange County, 14.6% or 192 single-father households and 27.2% or 1,084 single-mother households are living below the poverty line. Among single-father households, those with 1 or 2 children have the highest poverty rate, with 135 households (24.0%) experiencing poverty. Likewise, among single-mother households, those with 3 or 4 children have the highest poverty rate, with 307 households (52.7%) falling below the poverty line.
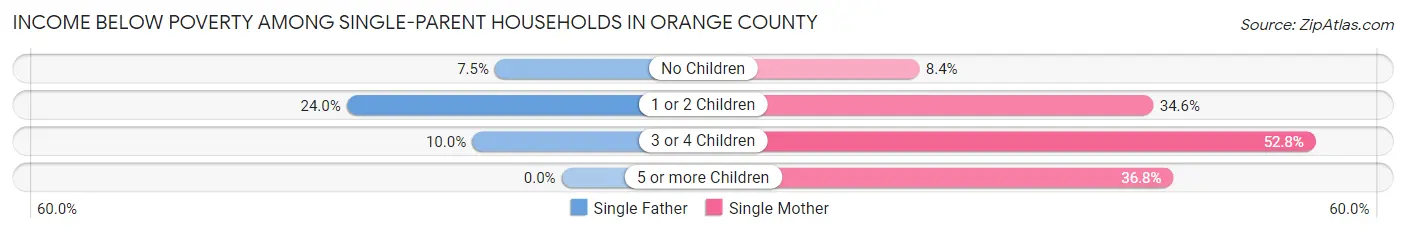
| Children | Single Father | Single Mother |
| No Children | 53 (7.4%) | 129 (8.4%) |
| 1 or 2 Children | 135 (24.0%) | 613 (34.5%) |
| 3 or 4 Children | 4 (10.0%) | 307 (52.7%) |
| 5 or more Children | 0 (0.0%) | 35 (36.8%) |
| Total | 192 (14.6%) | 1,084 (27.2%) |
Income Below Poverty Among Married-Couple vs Single-Parent Households in Orange County
The poverty data for Orange County shows that 747 of the married-couple family households (4.4%) and 1,276 of the single-parent households (24.1%) are living below the poverty level. Within the married-couple family households, those with 5 or more children have the highest poverty rate, with 16 households (16.7%) falling below the poverty line. Among the single-parent households, those with 3 or 4 children have the highest poverty rate, with 311 household (50.0%) living below poverty.
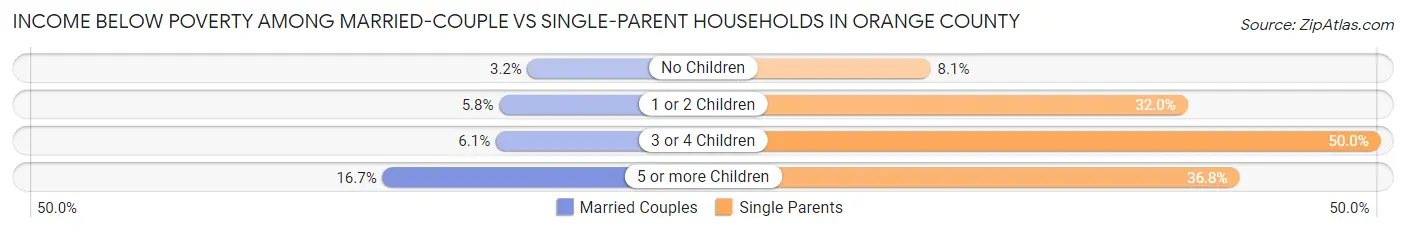
| Children | Married-Couple Families | Single-Parent Households |
| No Children | 301 (3.2%) | 182 (8.1%) |
| 1 or 2 Children | 316 (5.8%) | 748 (32.0%) |
| 3 or 4 Children | 114 (6.1%) | 311 (50.0%) |
| 5 or more Children | 16 (16.7%) | 35 (36.8%) |
| Total | 747 (4.4%) | 1,276 (24.1%) |
Race in Orange County
The most populous races in Orange County are White / Caucasian (69,767 | 82.3%), Hispanic or Latino (7,549 | 8.9%), and Black / African American (7,423 | 8.8%).
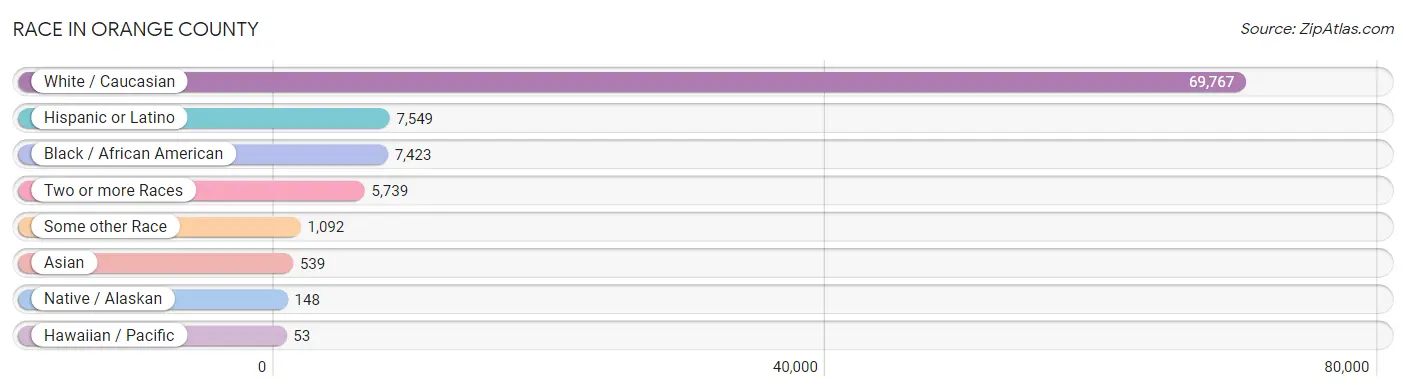
| Race | # Population | % Population |
| Asian | 539 | 0.6% |
| Black / African American | 7,423 | 8.8% |
| Hawaiian / Pacific | 53 | 0.1% |
| Hispanic or Latino | 7,549 | 8.9% |
| Native / Alaskan | 148 | 0.2% |
| White / Caucasian | 69,767 | 82.3% |
| Two or more Races | 5,739 | 6.8% |
| Some other Race | 1,092 | 1.3% |
| Total | 84,761 | 100.0% |
Ancestry in Orange County
The most populous ancestries reported in Orange County are French (10,491 | 12.4%), German (9,953 | 11.7%), Irish (8,383 | 9.9%), English (7,268 | 8.6%), and Mexican (6,034 | 7.1%), together accounting for 49.7% of all Orange County residents.
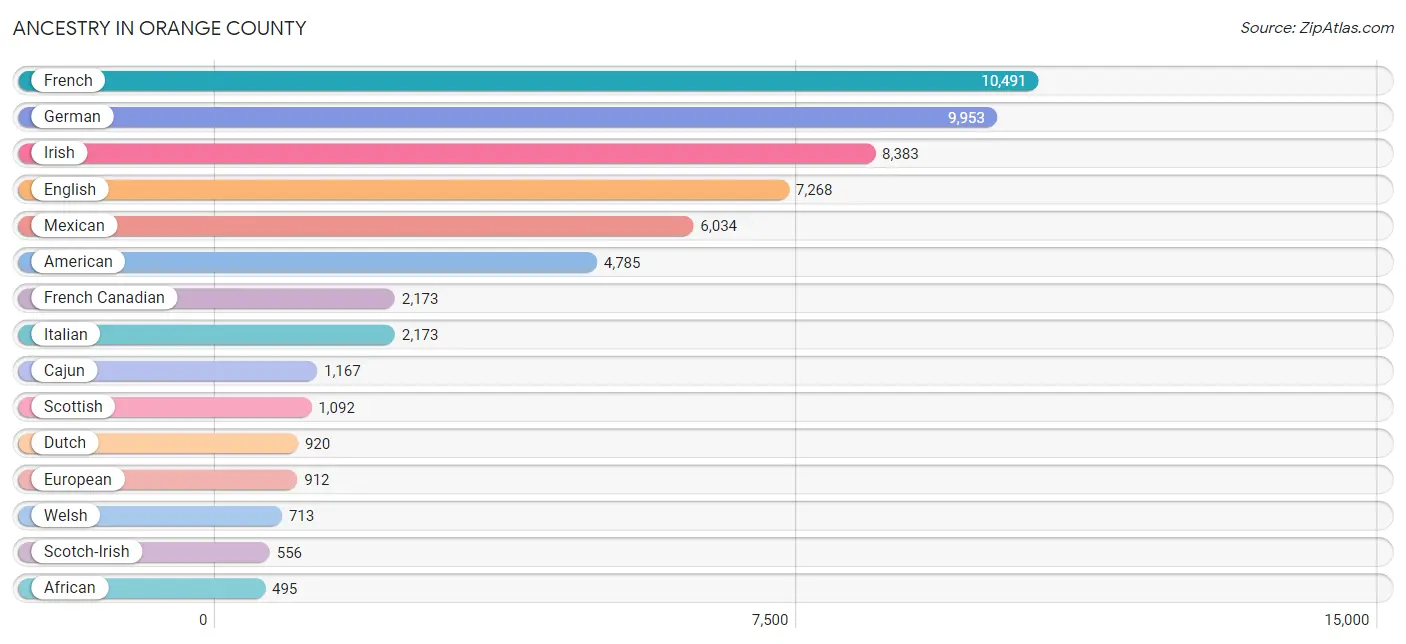
| Ancestry | # Population | % Population |
| African | 495 | 0.6% |
| Alaska Native | 13 | 0.0% |
| Alaskan Athabascan | 1 | 0.0% |
| American | 4,785 | 5.7% |
| Apache | 24 | 0.0% |
| Arab | 115 | 0.1% |
| Austrian | 29 | 0.0% |
| Belgian | 9 | 0.0% |
| Belizean | 87 | 0.1% |
| Bhutanese | 31 | 0.0% |
| Blackfeet | 36 | 0.0% |
| British | 251 | 0.3% |
| British West Indian | 33 | 0.0% |
| Burmese | 217 | 0.3% |
| Cajun | 1,167 | 1.4% |
| Canadian | 51 | 0.1% |
| Celtic | 13 | 0.0% |
| Central American | 493 | 0.6% |
| Cherokee | 266 | 0.3% |
| Chickasaw | 26 | 0.0% |
| Choctaw | 67 | 0.1% |
| Colombian | 30 | 0.0% |
| Comanche | 16 | 0.0% |
| Creek | 44 | 0.1% |
| Cuban | 127 | 0.2% |
| Czech | 215 | 0.3% |
| Czechoslovakian | 35 | 0.0% |
| Danish | 28 | 0.0% |
| Dominican | 235 | 0.3% |
| Dutch | 920 | 1.1% |
| Eastern European | 294 | 0.4% |
| English | 7,268 | 8.6% |
| European | 912 | 1.1% |
| Filipino | 25 | 0.0% |
| French | 10,491 | 12.4% |
| French American Indian | 12 | 0.0% |
| French Canadian | 2,173 | 2.6% |
| German | 9,953 | 11.7% |
| Greek | 21 | 0.0% |
| Guatemalan | 110 | 0.1% |
| Haitian | 48 | 0.1% |
| Honduran | 211 | 0.3% |
| Hungarian | 88 | 0.1% |
| Icelander | 14 | 0.0% |
| Indian (Asian) | 52 | 0.1% |
| Iraqi | 30 | 0.0% |
| Irish | 8,383 | 9.9% |
| Italian | 2,173 | 2.6% |
| Korean | 177 | 0.2% |
| Lebanese | 8 | 0.0% |
| Lithuanian | 75 | 0.1% |
| Mexican | 6,034 | 7.1% |
| Moroccan | 26 | 0.0% |
| Native Hawaiian | 44 | 0.1% |
| Navajo | 14 | 0.0% |
| Northern European | 88 | 0.1% |
| Norwegian | 284 | 0.3% |
| Osage | 27 | 0.0% |
| Palestinian | 2 | 0.0% |
| Panamanian | 30 | 0.0% |
| Pennsylvania German | 1 | 0.0% |
| Polish | 462 | 0.5% |
| Portuguese | 241 | 0.3% |
| Puerto Rican | 139 | 0.2% |
| Russian | 12 | 0.0% |
| Salvadoran | 142 | 0.2% |
| Scandinavian | 85 | 0.1% |
| Scotch-Irish | 556 | 0.7% |
| Scottish | 1,092 | 1.3% |
| Seminole | 1 | 0.0% |
| Serbian | 6 | 0.0% |
| Sioux | 4 | 0.0% |
| Slovak | 76 | 0.1% |
| Slovene | 20 | 0.0% |
| South American | 46 | 0.1% |
| Spaniard | 16 | 0.0% |
| Spanish | 227 | 0.3% |
| Sri Lankan | 100 | 0.1% |
| Subsaharan African | 495 | 0.6% |
| Swedish | 167 | 0.2% |
| Swiss | 23 | 0.0% |
| Syrian | 18 | 0.0% |
| Thai | 78 | 0.1% |
| Ukrainian | 134 | 0.2% |
| Venezuelan | 16 | 0.0% |
| Welsh | 713 | 0.8% | View All 86 Rows |
Immigrants in Orange County
The most numerous immigrant groups reported in Orange County came from Latin America (1,832 | 2.2%), Central America (1,395 | 1.7%), Mexico (1,277 | 1.5%), Asia (796 | 0.9%), and Caribbean (378 | 0.4%), together accounting for 6.7% of all Orange County residents.
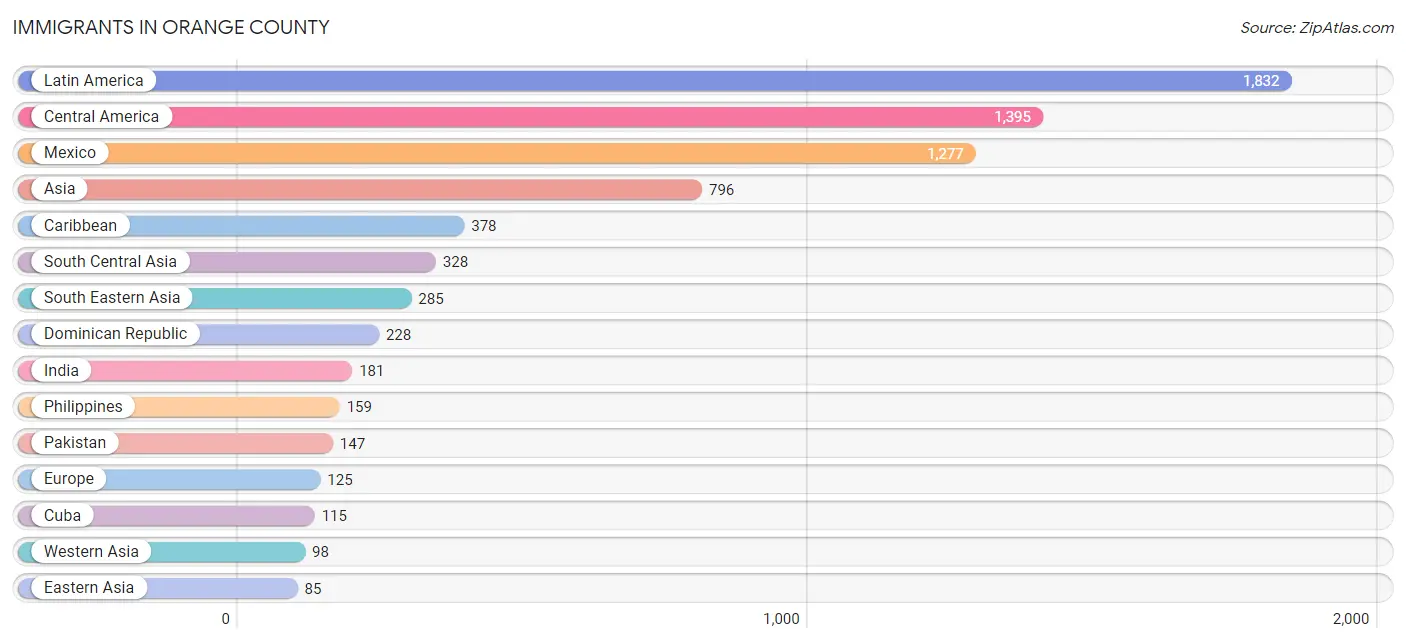
| Immigration Origin | # Population | % Population |
| Africa | 11 | 0.0% |
| Asia | 796 | 0.9% |
| Brazil | 29 | 0.0% |
| Cambodia | 54 | 0.1% |
| Canada | 25 | 0.0% |
| Caribbean | 378 | 0.4% |
| Central America | 1,395 | 1.7% |
| China | 26 | 0.0% |
| Colombia | 14 | 0.0% |
| Cuba | 115 | 0.1% |
| Czechoslovakia | 18 | 0.0% |
| Dominican Republic | 228 | 0.3% |
| Eastern Africa | 11 | 0.0% |
| Eastern Asia | 85 | 0.1% |
| Eastern Europe | 18 | 0.0% |
| El Salvador | 74 | 0.1% |
| England | 27 | 0.0% |
| Europe | 125 | 0.2% |
| Germany | 61 | 0.1% |
| Guatemala | 20 | 0.0% |
| Haiti | 15 | 0.0% |
| Honduras | 21 | 0.0% |
| India | 181 | 0.2% |
| Iraq | 18 | 0.0% |
| Italy | 5 | 0.0% |
| Korea | 59 | 0.1% |
| Latin America | 1,832 | 2.2% |
| Mexico | 1,277 | 1.5% |
| Northern Europe | 41 | 0.1% |
| Pakistan | 147 | 0.2% |
| Panama | 3 | 0.0% |
| Philippines | 159 | 0.2% |
| Saudi Arabia | 79 | 0.1% |
| Scotland | 14 | 0.0% |
| South America | 59 | 0.1% |
| South Central Asia | 328 | 0.4% |
| South Eastern Asia | 285 | 0.3% |
| Southern Europe | 5 | 0.0% |
| Syria | 1 | 0.0% |
| Uganda | 11 | 0.0% |
| Venezuela | 16 | 0.0% |
| Vietnam | 72 | 0.1% |
| Western Asia | 98 | 0.1% |
| Western Europe | 61 | 0.1% | View All 44 Rows |
Sex and Age in Orange County
Sex and Age in Orange County
The most populous age groups in Orange County are 10 to 14 Years (3,417 | 8.1%) for men and 5 to 9 Years (3,335 | 7.9%) for women.
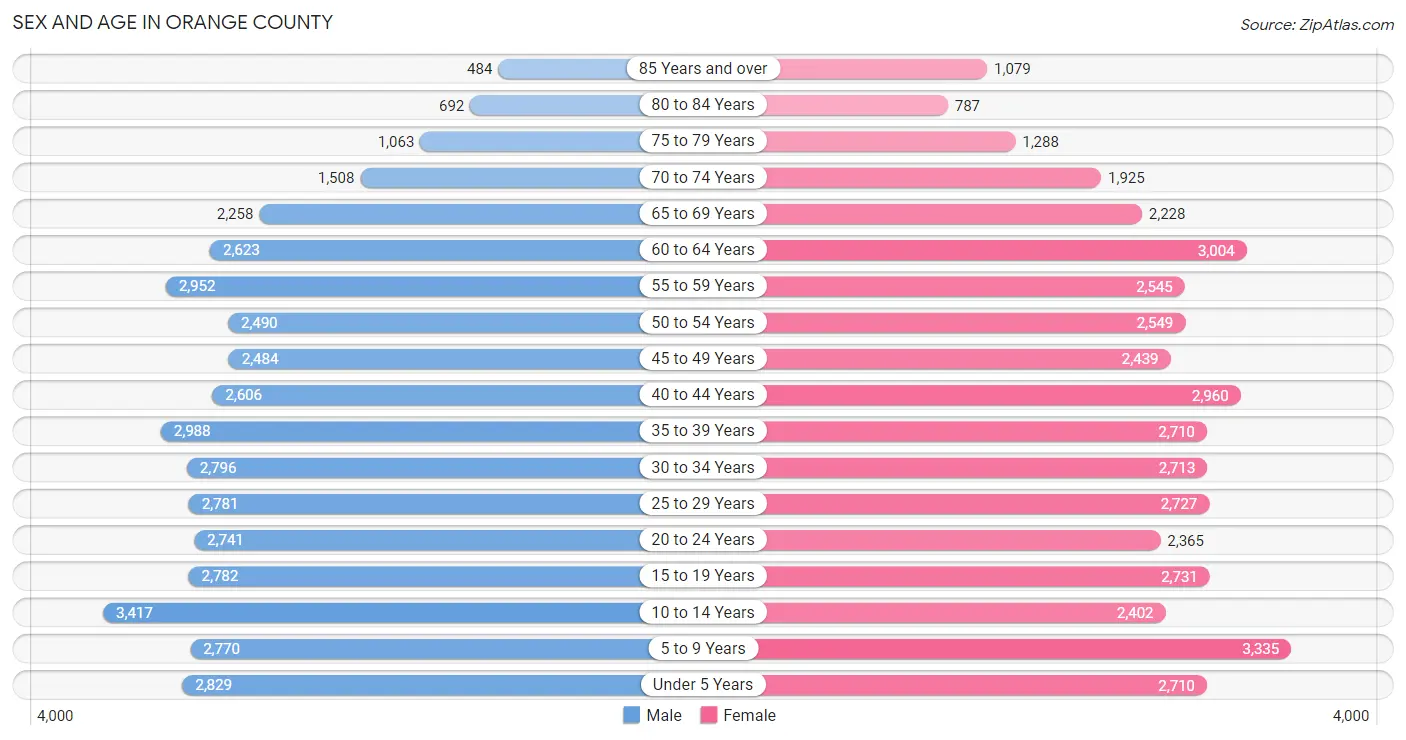
| Age Bracket | Male | Female |
| Under 5 Years | 2,829 (6.7%) | 2,710 (6.4%) |
| 5 to 9 Years | 2,770 (6.6%) | 3,335 (7.9%) |
| 10 to 14 Years | 3,417 (8.1%) | 2,402 (5.7%) |
| 15 to 19 Years | 2,782 (6.6%) | 2,731 (6.4%) |
| 20 to 24 Years | 2,741 (6.5%) | 2,365 (5.6%) |
| 25 to 29 Years | 2,781 (6.6%) | 2,727 (6.4%) |
| 30 to 34 Years | 2,796 (6.6%) | 2,713 (6.4%) |
| 35 to 39 Years | 2,988 (7.1%) | 2,710 (6.4%) |
| 40 to 44 Years | 2,606 (6.2%) | 2,960 (7.0%) |
| 45 to 49 Years | 2,484 (5.9%) | 2,439 (5.7%) |
| 50 to 54 Years | 2,490 (5.9%) | 2,549 (6.0%) |
| 55 to 59 Years | 2,952 (7.0%) | 2,545 (6.0%) |
| 60 to 64 Years | 2,623 (6.2%) | 3,004 (7.1%) |
| 65 to 69 Years | 2,258 (5.3%) | 2,228 (5.2%) |
| 70 to 74 Years | 1,508 (3.6%) | 1,925 (4.5%) |
| 75 to 79 Years | 1,063 (2.5%) | 1,288 (3.0%) |
| 80 to 84 Years | 692 (1.6%) | 787 (1.8%) |
| 85 Years and over | 484 (1.1%) | 1,079 (2.5%) |
| Total | 42,264 (100.0%) | 42,497 (100.0%) |
Families and Households in Orange County
Median Family Size in Orange County
The median family size in Orange County is 3.20 persons per family, with single female/mother families (3,986 | 17.9%) accounting for the largest median family size of 3.22 persons per family. On the other hand, single male/father families (1,313 | 5.9%) represent the smallest median family size with 2.99 persons per family.

| Family Type | # Families | Family Size |
| Married-Couple | 16,977 (76.2%) | 3.21 |
| Single Male/Father | 1,313 (5.9%) | 2.99 |
| Single Female/Mother | 3,986 (17.9%) | 3.22 |
| Total Families | 22,276 (100.0%) | 3.20 |
Median Household Size in Orange County
The median household size in Orange County is 2.69 persons per household, with single male/father households (1,313 | 4.2%) accounting for the largest median household size of 3.49 persons per household. non-family households (8,998 | 28.8%) represent the smallest median household size with 1.19 persons per household.
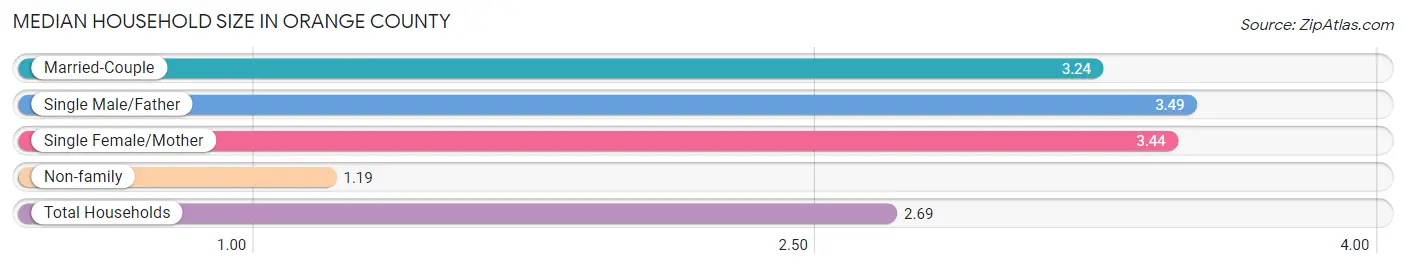
| Household Type | # Households | Household Size |
| Married-Couple | 16,977 (54.3%) | 3.24 |
| Single Male/Father | 1,313 (4.2%) | 3.49 |
| Single Female/Mother | 3,986 (12.8%) | 3.44 |
| Non-family | 8,998 (28.8%) | 1.19 |
| Total Households | 31,274 (100.0%) | 2.69 |
Household Size by Marriage Status in Orange County
Out of a total of 31,274 households in Orange County, 22,276 (71.2%) are family households, while 8,998 (28.8%) are nonfamily households. The most numerous type of family households are 2-person households, comprising 9,746, and the most common type of nonfamily households are 1-person households, comprising 7,609.
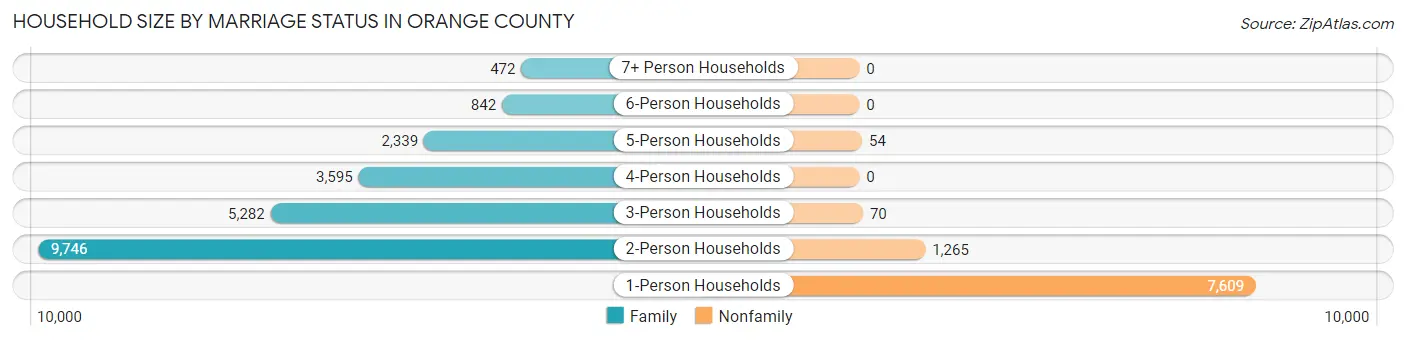
| Household Size | Family Households | Nonfamily Households |
| 1-Person Households | - | 7,609 (24.3%) |
| 2-Person Households | 9,746 (31.2%) | 1,265 (4.0%) |
| 3-Person Households | 5,282 (16.9%) | 70 (0.2%) |
| 4-Person Households | 3,595 (11.5%) | 0 (0.0%) |
| 5-Person Households | 2,339 (7.5%) | 54 (0.2%) |
| 6-Person Households | 842 (2.7%) | 0 (0.0%) |
| 7+ Person Households | 472 (1.5%) | 0 (0.0%) |
| Total | 22,276 (71.2%) | 8,998 (28.8%) |
Female Fertility in Orange County
Fertility by Age in Orange County
Average fertility rate in Orange County is 66.0 births per 1,000 women. Women in the age bracket of 20 to 34 years have the highest fertility rate with 139.0 births per 1,000 women. Women in the age bracket of 20 to 34 years acount for 85.7% of all women with births.
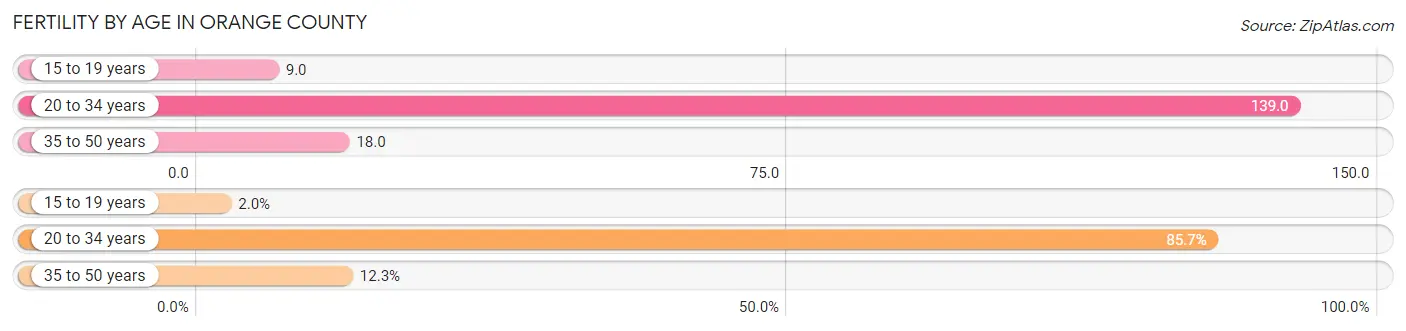
| Age Bracket | Women with Births | Births / 1,000 Women |
| 15 to 19 years | 25 (2.0%) | 9.0 |
| 20 to 34 years | 1,081 (85.7%) | 139.0 |
| 35 to 50 years | 155 (12.3%) | 18.0 |
| Total | 1,261 (100.0%) | 66.0 |
Fertility by Age by Marriage Status in Orange County
65.0% of women with births (1,261) in Orange County are married. The highest percentage of unmarried women with births falls into 15 to 19 years age bracket with 76.0% of them unmarried at the time of birth, while the lowest percentage of unmarried women with births belong to 35 to 50 years age bracket with 9.7% of them unmarried.
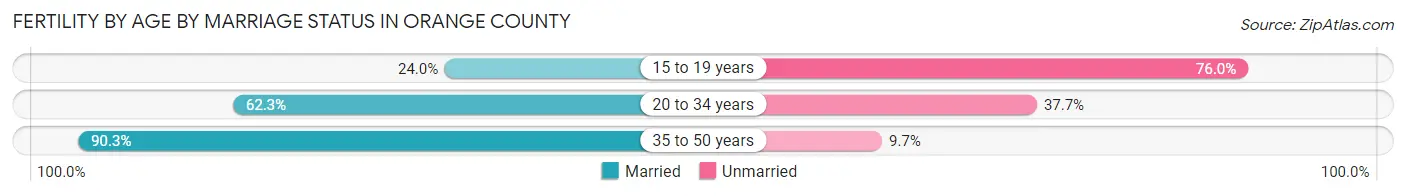
| Age Bracket | Married | Unmarried |
| 15 to 19 years | 6 (24.0%) | 19 (76.0%) |
| 20 to 34 years | 673 (62.3%) | 408 (37.7%) |
| 35 to 50 years | 140 (90.3%) | 15 (9.7%) |
| Total | 820 (65.0%) | 441 (35.0%) |
Fertility by Education in Orange County
Average fertility rate in Orange County is 66.0 births per 1,000 women. Women with the education attainment of bachelor's degree have the highest fertility rate of 86.0 births per 1,000 women, while women with the education attainment of graduate degree have the lowest fertility at 29.0 births per 1,000 women. Women with the education attainment of college or associate's degree represent 37.8% of all women with births.
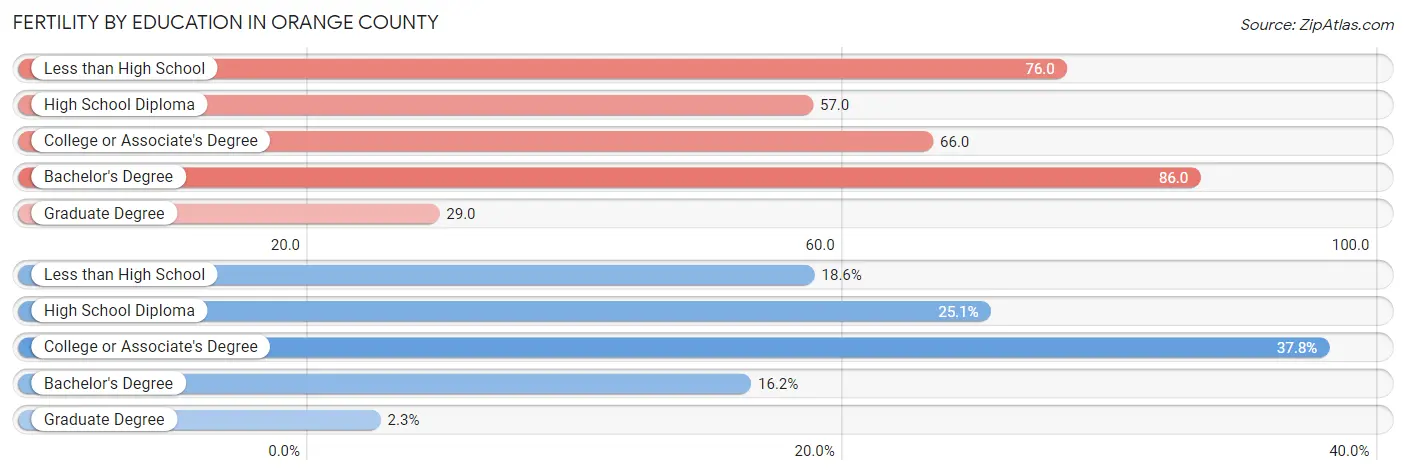
| Educational Attainment | Women with Births | Births / 1,000 Women |
| Less than High School | 234 (18.6%) | 76.0 |
| High School Diploma | 317 (25.1%) | 57.0 |
| College or Associate's Degree | 477 (37.8%) | 66.0 |
| Bachelor's Degree | 204 (16.2%) | 86.0 |
| Graduate Degree | 29 (2.3%) | 29.0 |
| Total | 1,261 (100.0%) | 66.0 |
Fertility by Education by Marriage Status in Orange County
35.0% of women with births in Orange County are unmarried. Women with the educational attainment of bachelor's degree are most likely to be married with 100.0% of them married at childbirth, while women with the educational attainment of less than high school are least likely to be married with 85.9% of them unmarried at childbirth.
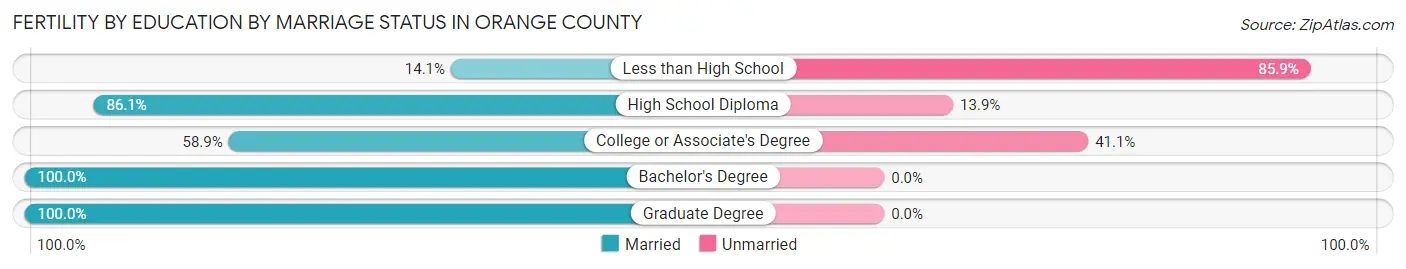
| Educational Attainment | Married | Unmarried |
| Less than High School | 33 (14.1%) | 201 (85.9%) |
| High School Diploma | 273 (86.1%) | 44 (13.9%) |
| College or Associate's Degree | 281 (58.9%) | 196 (41.1%) |
| Bachelor's Degree | 204 (100.0%) | 0 (0.0%) |
| Graduate Degree | 29 (100.0%) | 0 (0.0%) |
| Total | 820 (65.0%) | 441 (35.0%) |
Employment Characteristics in Orange County
Employment by Class of Employer in Orange County
Among the 37,696 employed individuals in Orange County, private company employees (27,853 | 73.9%), local government employees (2,916 | 7.7%), and self-employed (not incorporated) (2,474 | 6.6%) make up the most common classes of employment.
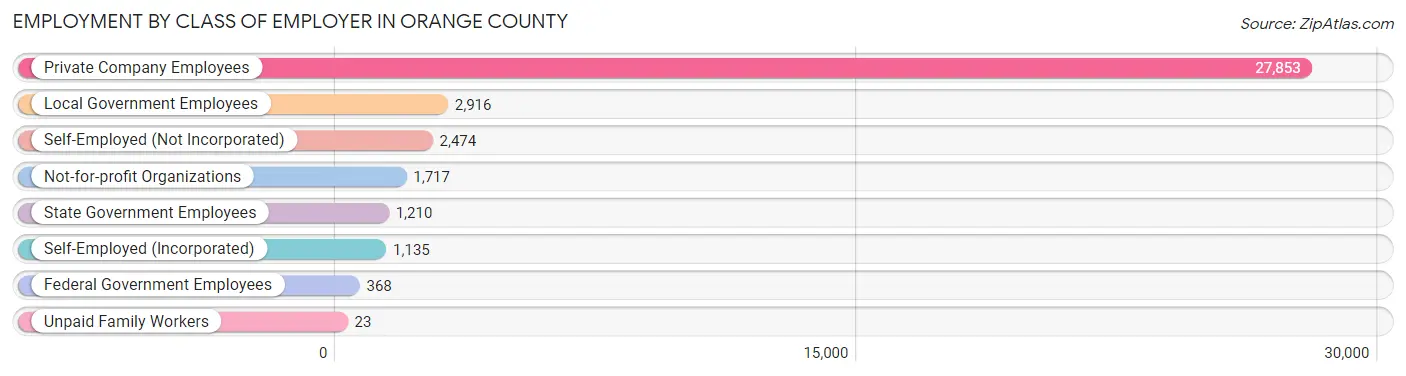
| Employer Class | # Employees | % Employees |
| Private Company Employees | 27,853 | 73.9% |
| Self-Employed (Incorporated) | 1,135 | 3.0% |
| Self-Employed (Not Incorporated) | 2,474 | 6.6% |
| Not-for-profit Organizations | 1,717 | 4.5% |
| Local Government Employees | 2,916 | 7.7% |
| State Government Employees | 1,210 | 3.2% |
| Federal Government Employees | 368 | 1.0% |
| Unpaid Family Workers | 23 | 0.1% |
| Total | 37,696 | 100.0% |
Employment Status by Age in Orange County
According to the labor force statistics for Orange County, out of the total population over 16 years of age (66,081), 61.5% or 40,640 individuals are in the labor force, with 5.8% or 2,357 of them unemployed. The age group with the highest labor force participation rate is 30 to 34 years, with 81.7% or 4,501 individuals in the labor force. Within the labor force, the 16 to 19 years age range has the highest percentage of unemployed individuals, with 12.6% or 222 of them being unemployed.
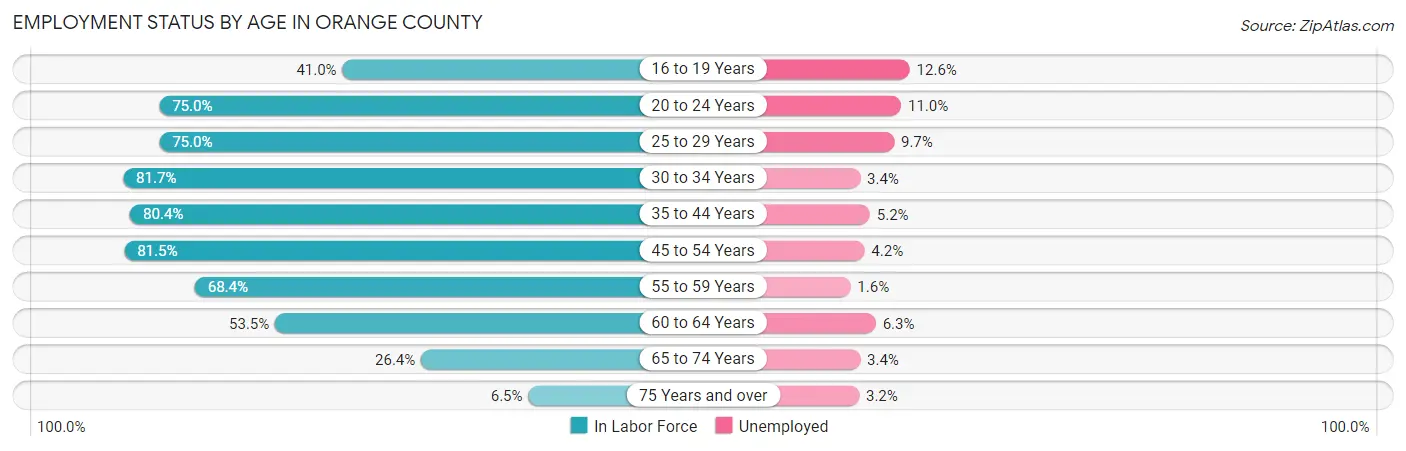
| Age Bracket | In Labor Force | Unemployed |
| 16 to 19 Years | 1,761 (41.0%) | 222 (12.6%) |
| 20 to 24 Years | 3,830 (75.0%) | 421 (11.0%) |
| 25 to 29 Years | 4,131 (75.0%) | 401 (9.7%) |
| 30 to 34 Years | 4,501 (81.7%) | 153 (3.4%) |
| 35 to 44 Years | 9,056 (80.4%) | 471 (5.2%) |
| 45 to 54 Years | 8,119 (81.5%) | 341 (4.2%) |
| 55 to 59 Years | 3,760 (68.4%) | 60 (1.6%) |
| 60 to 64 Years | 3,010 (53.5%) | 190 (6.3%) |
| 65 to 74 Years | 2,091 (26.4%) | 71 (3.4%) |
| 75 Years and over | 351 (6.5%) | 11 (3.2%) |
| Total | 40,640 (61.5%) | 2,357 (5.8%) |
Employment Status by Educational Attainment in Orange County
According to labor force statistics for Orange County, 75.1% of individuals (32,569) out of the total population between 25 and 64 years of age (43,367) are in the labor force, with 5.0% or 1,628 of them being unemployed. The group with the highest labor force participation rate are those with the educational attainment of bachelor's degree or higher, with 84.8% or 6,650 individuals in the labor force. Within the labor force, individuals with less than high school education have the highest percentage of unemployment, with 8.4% or 234 of them being unemployed.
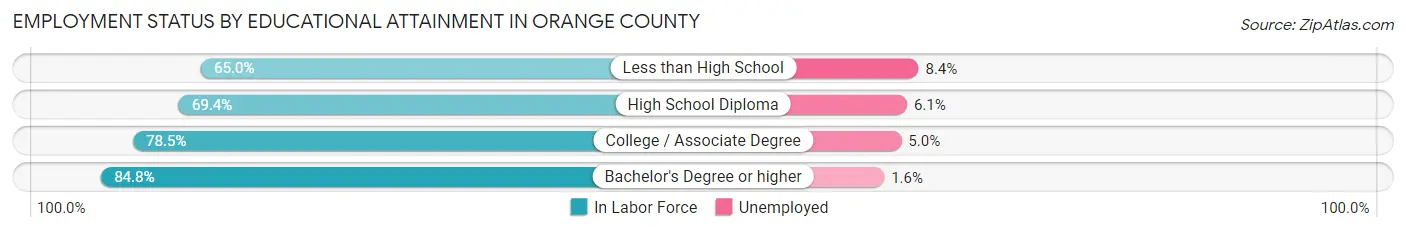
| Educational Attainment | In Labor Force | Unemployed |
| Less than High School | 2,790 (65.0%) | 361 (8.4%) |
| High School Diploma | 10,450 (69.4%) | 918 (6.1%) |
| College / Associate Degree | 12,697 (78.5%) | 809 (5.0%) |
| Bachelor's Degree or higher | 6,650 (84.8%) | 125 (1.6%) |
| Total | 32,569 (75.1%) | 2,168 (5.0%) |
Employment Occupations by Sex in Orange County
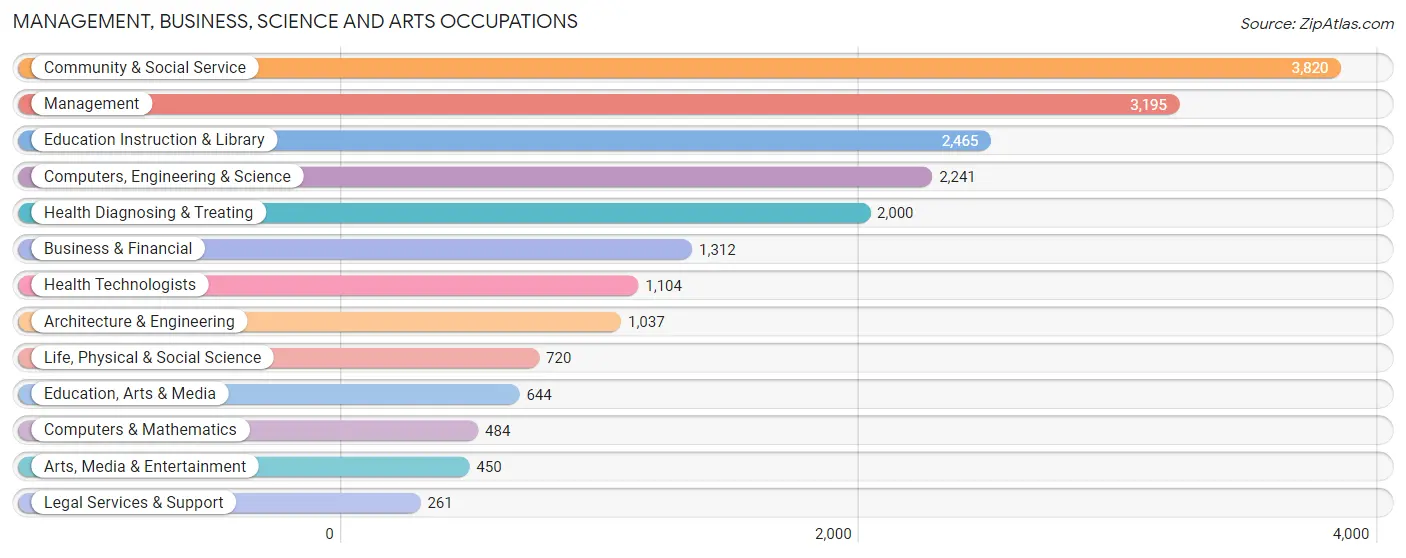
Management, Business, Science and Arts Occupations
The most common Management, Business, Science and Arts occupations in Orange County are Community & Social Service (3,820 | 10.0%), Management (3,195 | 8.4%), Education Instruction & Library (2,465 | 6.5%), Computers, Engineering & Science (2,241 | 5.9%), and Health Diagnosing & Treating (2,000 | 5.2%).
Management, Business, Science and Arts Occupations by Sex
Within the Management, Business, Science and Arts occupations in Orange County, the most male-oriented occupations are Architecture & Engineering (87.7%), Computers & Mathematics (75.8%), and Computers, Engineering & Science (72.2%), while the most female-oriented occupations are Health Diagnosing & Treating (82.5%), Health Technologists (77.7%), and Education Instruction & Library (73.4%).
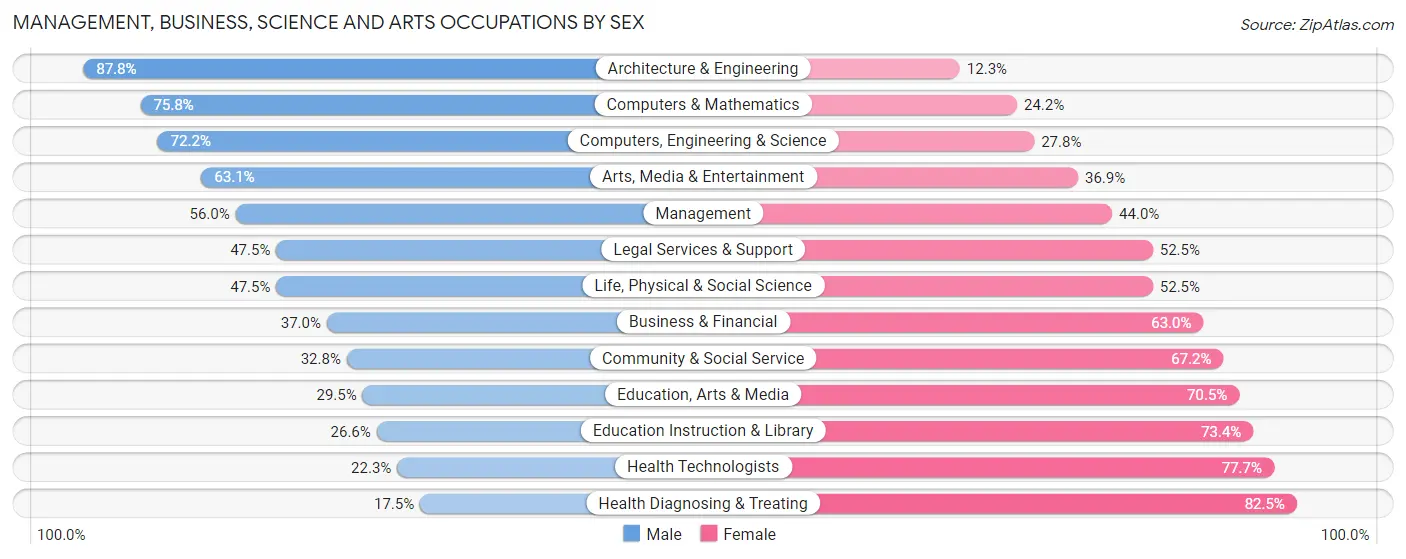
| Occupation | Male | Female |
| Management | 1,789 (56.0%) | 1,406 (44.0%) |
| Business & Financial | 485 (37.0%) | 827 (63.0%) |
| Computers, Engineering & Science | 1,619 (72.2%) | 622 (27.8%) |
| Computers & Mathematics | 367 (75.8%) | 117 (24.2%) |
| Architecture & Engineering | 910 (87.7%) | 127 (12.2%) |
| Life, Physical & Social Science | 342 (47.5%) | 378 (52.5%) |
| Community & Social Service | 1,253 (32.8%) | 2,567 (67.2%) |
| Education, Arts & Media | 190 (29.5%) | 454 (70.5%) |
| Legal Services & Support | 124 (47.5%) | 137 (52.5%) |
| Education Instruction & Library | 655 (26.6%) | 1,810 (73.4%) |
| Arts, Media & Entertainment | 284 (63.1%) | 166 (36.9%) |
| Health Diagnosing & Treating | 350 (17.5%) | 1,650 (82.5%) |
| Health Technologists | 246 (22.3%) | 858 (77.7%) |
| Total (Category) | 5,496 (43.7%) | 7,072 (56.3%) |
| Total (Overall) | 21,460 (56.1%) | 16,780 (43.9%) |
Services Occupations
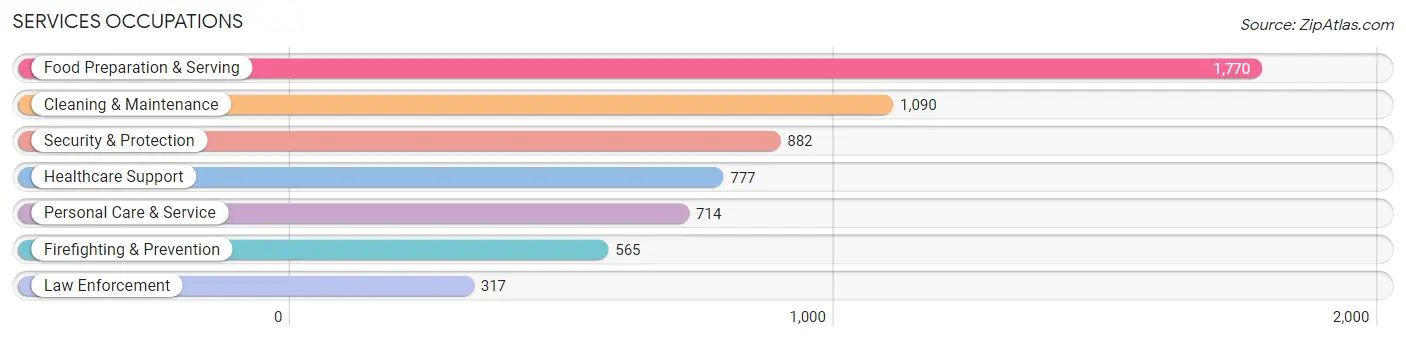
The most common Services occupations in Orange County are Food Preparation & Serving (1,770 | 4.6%), Cleaning & Maintenance (1,090 | 2.9%), Security & Protection (882 | 2.3%), Healthcare Support (777 | 2.0%), and Personal Care & Service (714 | 1.9%).
Services Occupations by Sex
Within the Services occupations in Orange County, the most male-oriented occupations are Firefighting & Prevention (85.1%), Security & Protection (80.9%), and Law Enforcement (73.5%), while the most female-oriented occupations are Healthcare Support (89.6%), Personal Care & Service (75.1%), and Food Preparation & Serving (60.5%).
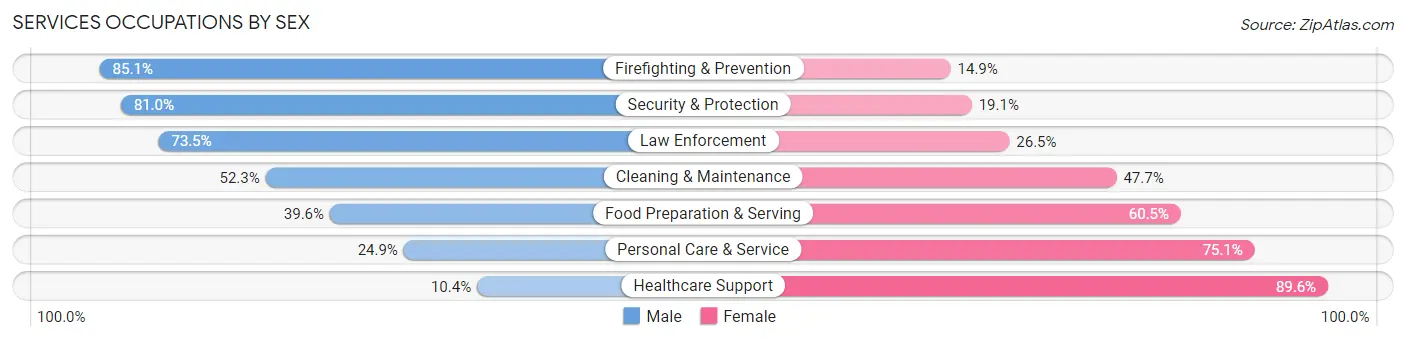
| Occupation | Male | Female |
| Healthcare Support | 81 (10.4%) | 696 (89.6%) |
| Security & Protection | 714 (80.9%) | 168 (19.1%) |
| Firefighting & Prevention | 481 (85.1%) | 84 (14.9%) |
| Law Enforcement | 233 (73.5%) | 84 (26.5%) |
| Food Preparation & Serving | 700 (39.6%) | 1,070 (60.5%) |
| Cleaning & Maintenance | 570 (52.3%) | 520 (47.7%) |
| Personal Care & Service | 178 (24.9%) | 536 (75.1%) |
| Total (Category) | 2,243 (42.9%) | 2,990 (57.1%) |
| Total (Overall) | 21,460 (56.1%) | 16,780 (43.9%) |
Sales and Office Occupations
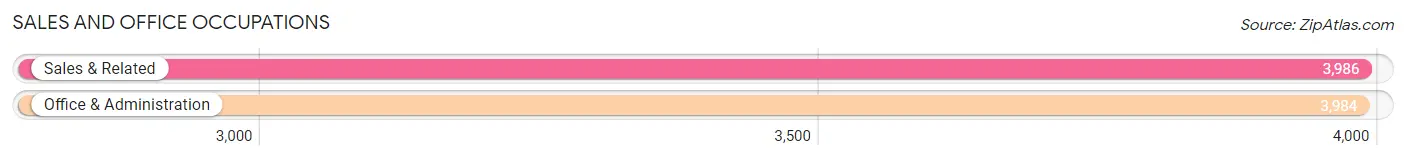
The most common Sales and Office occupations in Orange County are Sales & Related (3,986 | 10.4%), and Office & Administration (3,984 | 10.4%).
Sales and Office Occupations by Sex
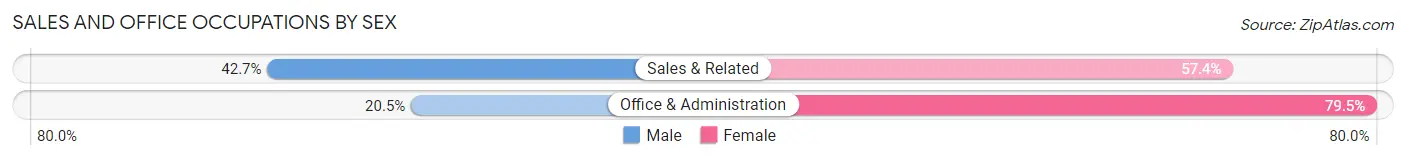
| Occupation | Male | Female |
| Sales & Related | 1,700 (42.6%) | 2,286 (57.4%) |
| Office & Administration | 818 (20.5%) | 3,166 (79.5%) |
| Total (Category) | 2,518 (31.6%) | 5,452 (68.4%) |
| Total (Overall) | 21,460 (56.1%) | 16,780 (43.9%) |
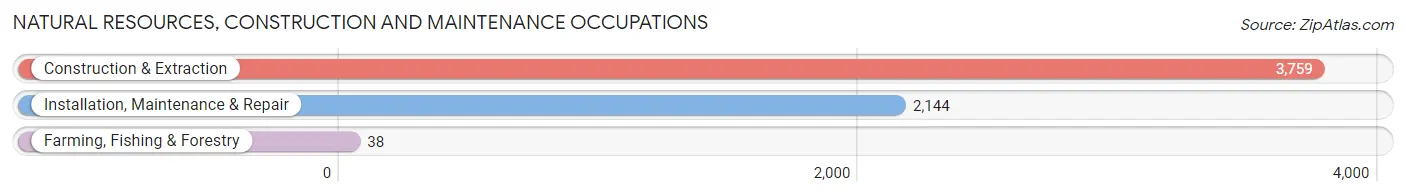
Natural Resources, Construction and Maintenance Occupations
The most common Natural Resources, Construction and Maintenance occupations in Orange County are Construction & Extraction (3,759 | 9.8%), Installation, Maintenance & Repair (2,144 | 5.6%), and Farming, Fishing & Forestry (38 | 0.1%).
Natural Resources, Construction and Maintenance Occupations by Sex
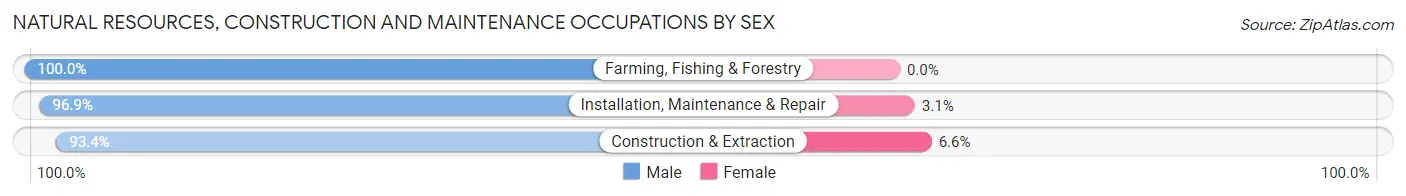
| Occupation | Male | Female |
| Farming, Fishing & Forestry | 38 (100.0%) | 0 (0.0%) |
| Construction & Extraction | 3,510 (93.4%) | 249 (6.6%) |
| Installation, Maintenance & Repair | 2,077 (96.9%) | 67 (3.1%) |
| Total (Category) | 5,625 (94.7%) | 316 (5.3%) |
| Total (Overall) | 21,460 (56.1%) | 16,780 (43.9%) |
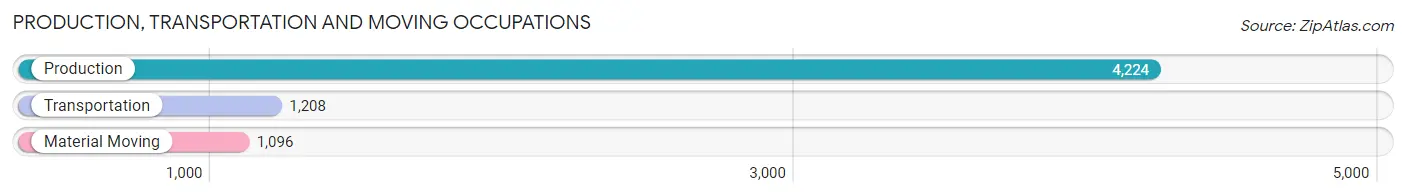
Production, Transportation and Moving Occupations
The most common Production, Transportation and Moving occupations in Orange County are Production (4,224 | 11.1%), Transportation (1,208 | 3.2%), and Material Moving (1,096 | 2.9%).
Production, Transportation and Moving Occupations by Sex
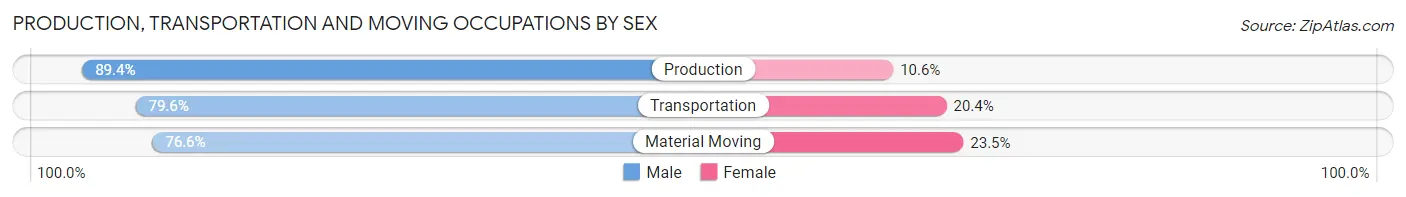
| Occupation | Male | Female |
| Production | 3,777 (89.4%) | 447 (10.6%) |
| Transportation | 962 (79.6%) | 246 (20.4%) |
| Material Moving | 839 (76.5%) | 257 (23.4%) |
| Total (Category) | 5,578 (85.5%) | 950 (14.5%) |
| Total (Overall) | 21,460 (56.1%) | 16,780 (43.9%) |
Employment Industries by Sex in Orange County
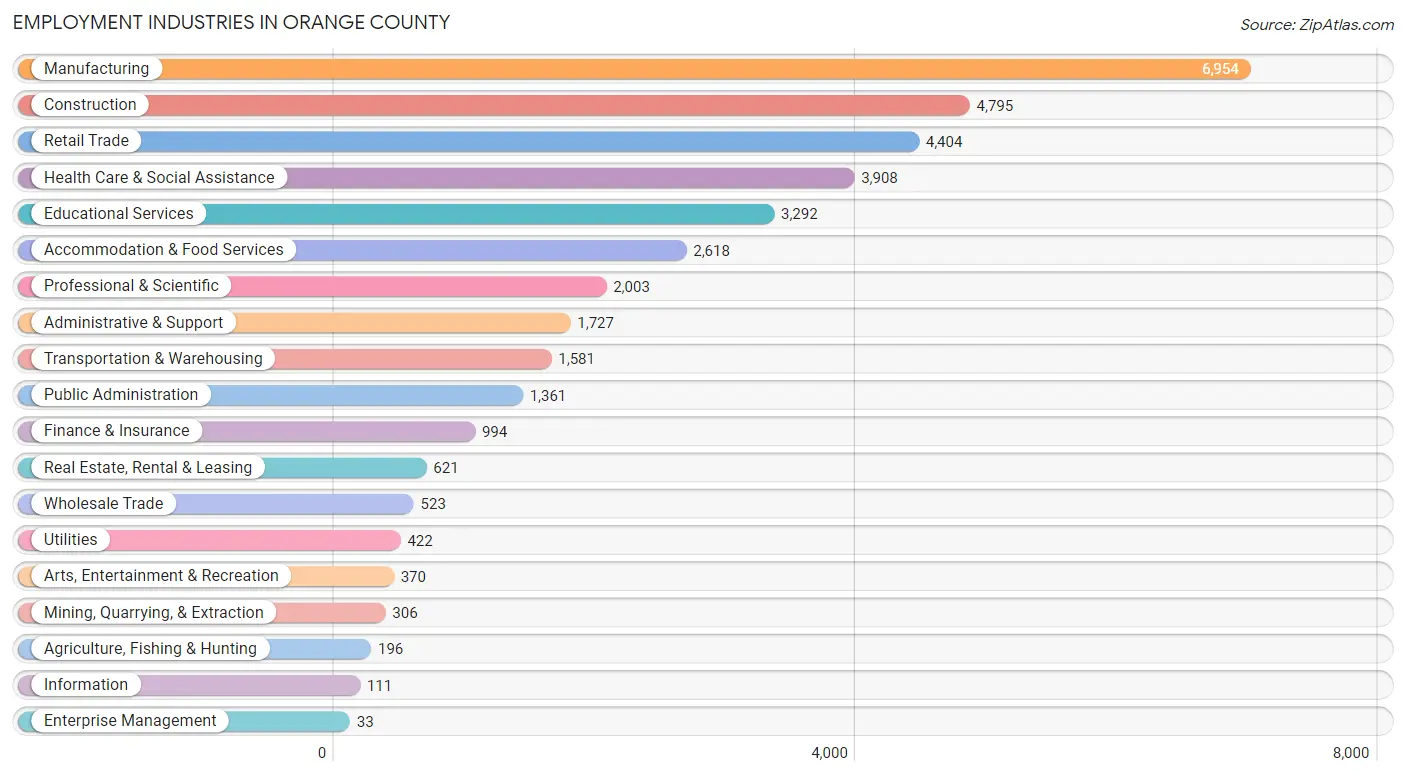
Employment Industries in Orange County
The major employment industries in Orange County include Manufacturing (6,954 | 18.2%), Construction (4,795 | 12.5%), Retail Trade (4,404 | 11.5%), Health Care & Social Assistance (3,908 | 10.2%), and Educational Services (3,292 | 8.6%).
Employment Industries by Sex in Orange County
The Orange County industries that see more men than women are Agriculture, Fishing & Hunting (89.3%), Transportation & Warehousing (88.2%), and Construction (84.9%), whereas the industries that tend to have a higher number of women are Health Care & Social Assistance (83.8%), Finance & Insurance (80.5%), and Educational Services (67.4%).
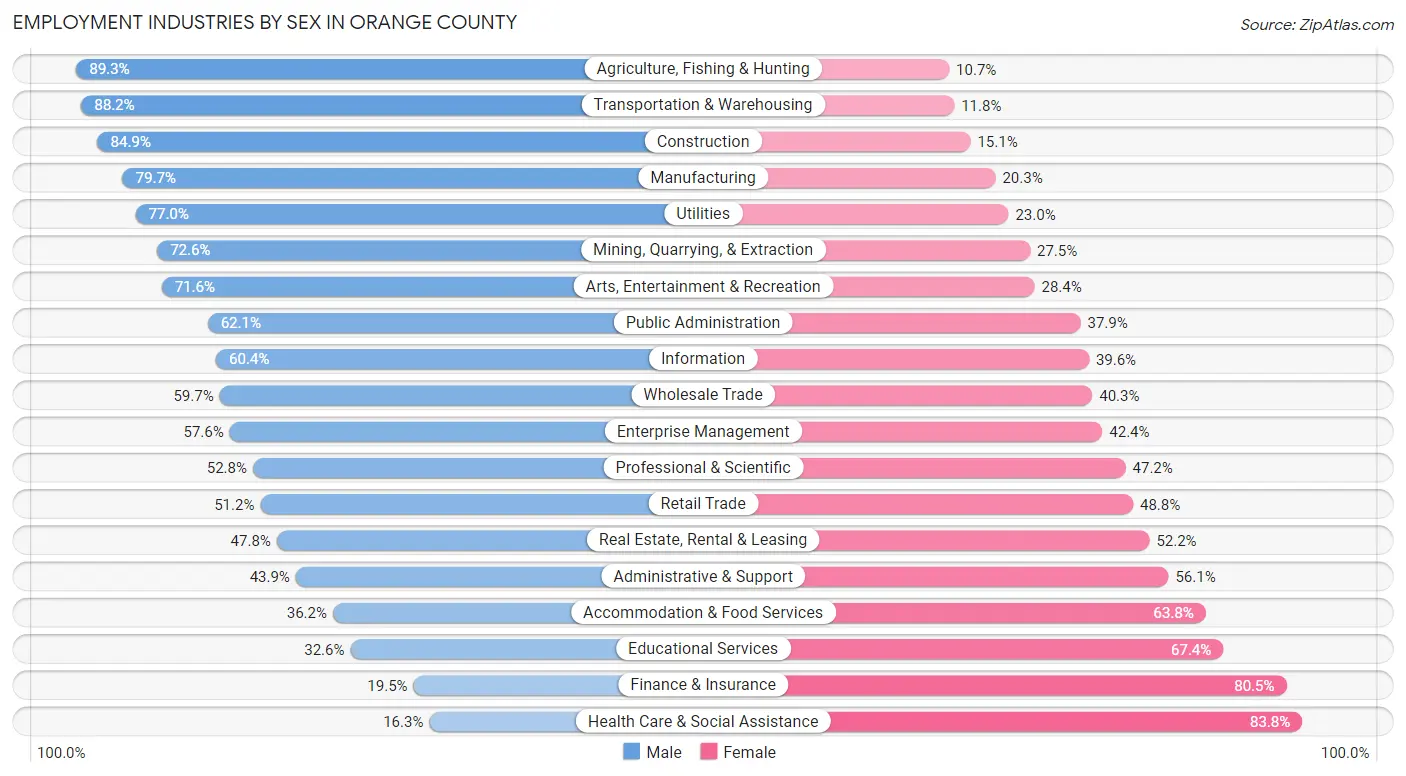
| Industry | Male | Female |
| Agriculture, Fishing & Hunting | 175 (89.3%) | 21 (10.7%) |
| Mining, Quarrying, & Extraction | 222 (72.6%) | 84 (27.5%) |
| Construction | 4,070 (84.9%) | 725 (15.1%) |
| Manufacturing | 5,542 (79.7%) | 1,412 (20.3%) |
| Wholesale Trade | 312 (59.7%) | 211 (40.3%) |
| Retail Trade | 2,256 (51.2%) | 2,148 (48.8%) |
| Transportation & Warehousing | 1,395 (88.2%) | 186 (11.8%) |
| Utilities | 325 (77.0%) | 97 (23.0%) |
| Information | 67 (60.4%) | 44 (39.6%) |
| Finance & Insurance | 194 (19.5%) | 800 (80.5%) |
| Real Estate, Rental & Leasing | 297 (47.8%) | 324 (52.2%) |
| Professional & Scientific | 1,057 (52.8%) | 946 (47.2%) |
| Enterprise Management | 19 (57.6%) | 14 (42.4%) |
| Administrative & Support | 758 (43.9%) | 969 (56.1%) |
| Educational Services | 1,073 (32.6%) | 2,219 (67.4%) |
| Health Care & Social Assistance | 635 (16.3%) | 3,273 (83.8%) |
| Arts, Entertainment & Recreation | 265 (71.6%) | 105 (28.4%) |
| Accommodation & Food Services | 948 (36.2%) | 1,670 (63.8%) |
| Public Administration | 845 (62.1%) | 516 (37.9%) |
| Total | 21,460 (56.1%) | 16,780 (43.9%) |
Education in Orange County
School Enrollment in Orange County
The most common levels of schooling among the 19,425 students in Orange County are high school (4,644 | 23.9%), middle school (4,506 | 23.2%), and elementary school (4,496 | 23.2%).
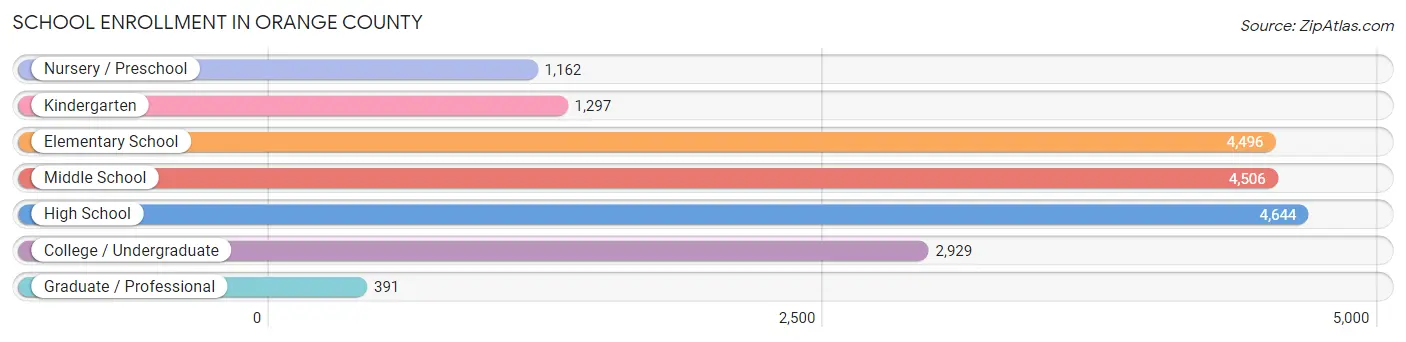
| School Level | # Students | % Students |
| Nursery / Preschool | 1,162 | 6.0% |
| Kindergarten | 1,297 | 6.7% |
| Elementary School | 4,496 | 23.2% |
| Middle School | 4,506 | 23.2% |
| High School | 4,644 | 23.9% |
| College / Undergraduate | 2,929 | 15.1% |
| Graduate / Professional | 391 | 2.0% |
| Total | 19,425 | 100.0% |
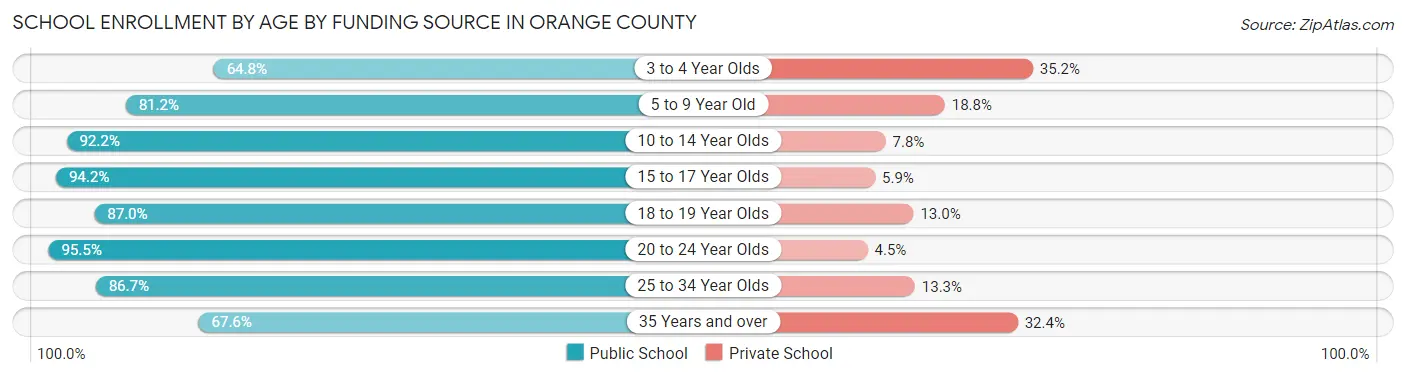
School Enrollment by Age by Funding Source in Orange County
Out of a total of 19,425 students who are enrolled in schools in Orange County, 2,506 (12.9%) attend a private institution, while the remaining 16,919 (87.1%) are enrolled in public schools. The age group of 3 to 4 year olds has the highest likelihood of being enrolled in private schools, with 277 (35.2% in the age bracket) enrolled. Conversely, the age group of 20 to 24 year olds has the lowest likelihood of being enrolled in a private school, with 1,329 (95.5% in the age bracket) attending a public institution.
| Age Bracket | Public School | Private School |
| 3 to 4 Year Olds | 509 (64.8%) | 277 (35.2%) |
| 5 to 9 Year Old | 4,664 (81.2%) | 1,083 (18.8%) |
| 10 to 14 Year Olds | 5,219 (92.2%) | 442 (7.8%) |
| 15 to 17 Year Olds | 3,331 (94.2%) | 207 (5.9%) |
| 18 to 19 Year Olds | 743 (87.0%) | 111 (13.0%) |
| 20 to 24 Year Olds | 1,329 (95.5%) | 62 (4.5%) |
| 25 to 34 Year Olds | 654 (86.7%) | 100 (13.3%) |
| 35 Years and over | 469 (67.6%) | 225 (32.4%) |
| Total | 16,919 (87.1%) | 2,506 (12.9%) |
Educational Attainment by Field of Study in Orange County
Business (1,736 | 17.0%), science & technology (1,346 | 13.2%), education (1,315 | 12.9%), engineering (862 | 8.4%), and arts & humanities (859 | 8.4%) are the most common fields of study among 10,231 individuals in Orange County who have obtained a bachelor's degree or higher.
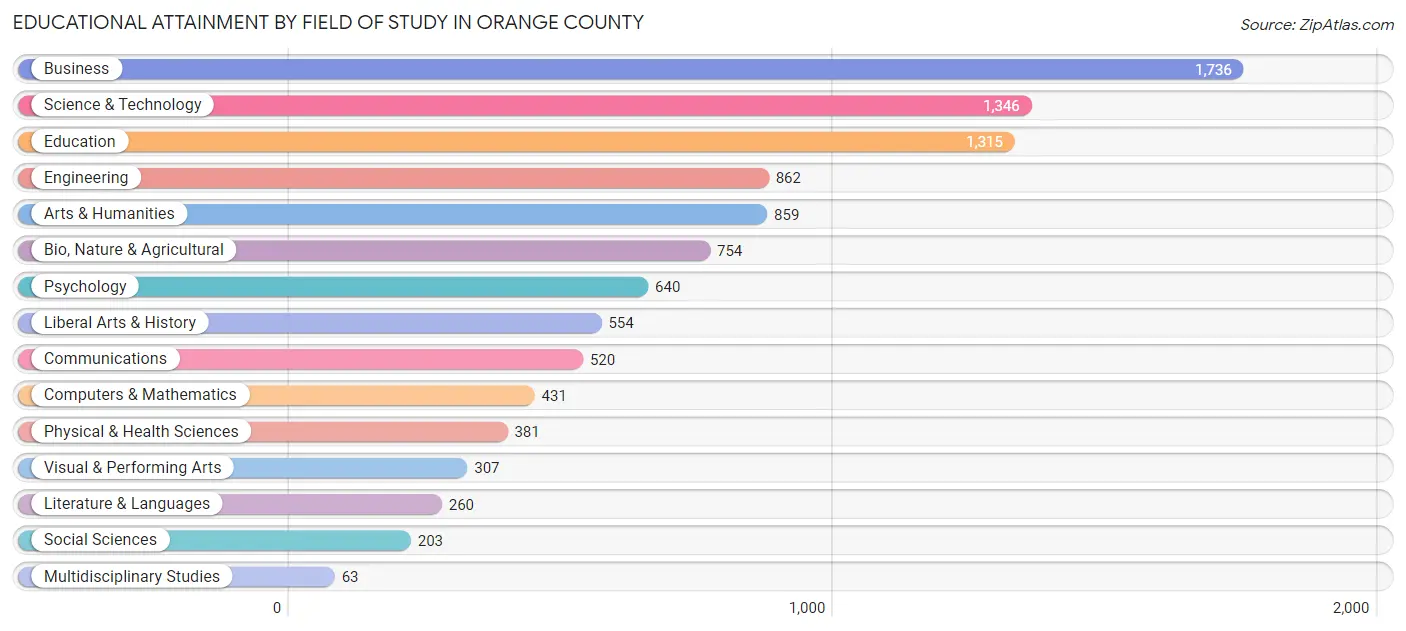
| Field of Study | # Graduates | % Graduates |
| Computers & Mathematics | 431 | 4.2% |
| Bio, Nature & Agricultural | 754 | 7.4% |
| Physical & Health Sciences | 381 | 3.7% |
| Psychology | 640 | 6.3% |
| Social Sciences | 203 | 2.0% |
| Engineering | 862 | 8.4% |
| Multidisciplinary Studies | 63 | 0.6% |
| Science & Technology | 1,346 | 13.2% |
| Business | 1,736 | 17.0% |
| Education | 1,315 | 12.9% |
| Literature & Languages | 260 | 2.5% |
| Liberal Arts & History | 554 | 5.4% |
| Visual & Performing Arts | 307 | 3.0% |
| Communications | 520 | 5.1% |
| Arts & Humanities | 859 | 8.4% |
| Total | 10,231 | 100.0% |
Transportation & Commute in Orange County
Vehicle Availability by Sex in Orange County
The most prevalent vehicle ownership categories in Orange County are males with 2 vehicles (9,093, accounting for 43.0%) and females with 2 vehicles (7,364, making up 55.0%).
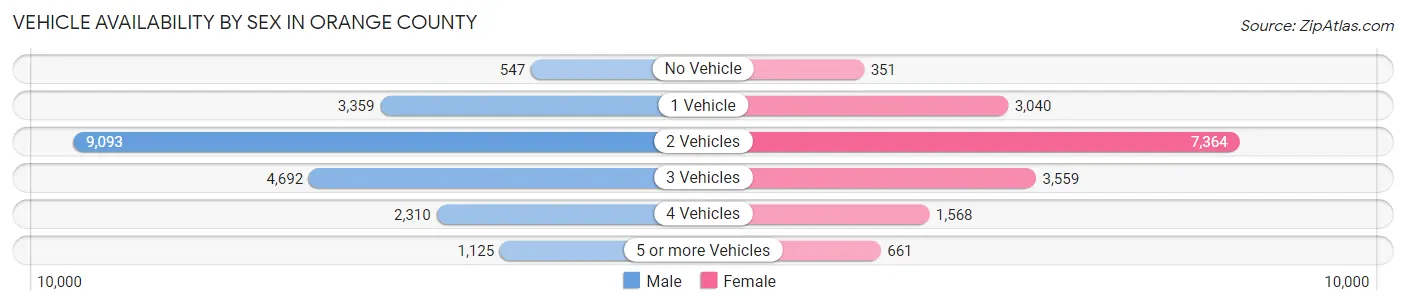
| Vehicles Available | Male | Female |
| No Vehicle | 547 (2.6%) | 351 (2.1%) |
| 1 Vehicle | 3,359 (15.9%) | 3,040 (18.4%) |
| 2 Vehicles | 9,093 (43.0%) | 7,364 (44.5%) |
| 3 Vehicles | 4,692 (22.2%) | 3,559 (21.5%) |
| 4 Vehicles | 2,310 (10.9%) | 1,568 (9.5%) |
| 5 or more Vehicles | 1,125 (5.3%) | 661 (4.0%) |
| Total | 21,126 (100.0%) | 16,543 (100.0%) |
Commute Time in Orange County
The most frequently occuring commute durations in Orange County are 20 to 24 minutes (6,574 commuters, 17.9%), 30 to 34 minutes (5,502 commuters, 15.0%), and 15 to 19 minutes (5,349 commuters, 14.6%).
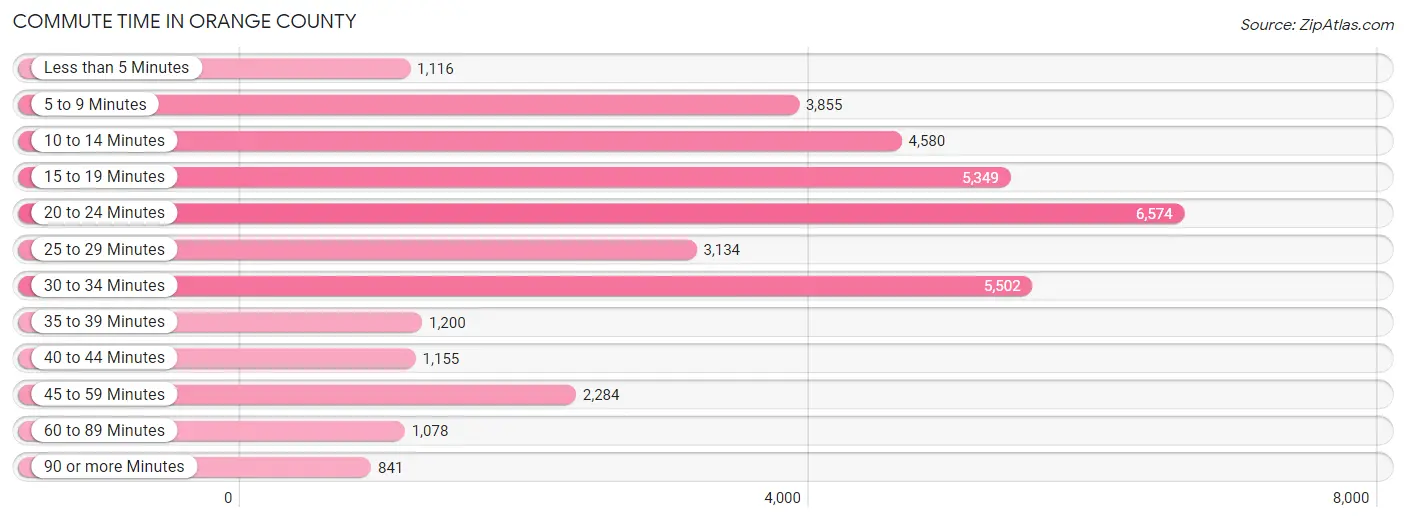
| Commute Time | # Commuters | % Commuters |
| Less than 5 Minutes | 1,116 | 3.0% |
| 5 to 9 Minutes | 3,855 | 10.5% |
| 10 to 14 Minutes | 4,580 | 12.5% |
| 15 to 19 Minutes | 5,349 | 14.6% |
| 20 to 24 Minutes | 6,574 | 17.9% |
| 25 to 29 Minutes | 3,134 | 8.6% |
| 30 to 34 Minutes | 5,502 | 15.0% |
| 35 to 39 Minutes | 1,200 | 3.3% |
| 40 to 44 Minutes | 1,155 | 3.2% |
| 45 to 59 Minutes | 2,284 | 6.2% |
| 60 to 89 Minutes | 1,078 | 2.9% |
| 90 or more Minutes | 841 | 2.3% |
Commute Time by Sex in Orange County
The most common commute times in Orange County are 20 to 24 minutes (3,966 commuters, 19.1%) for males and 15 to 19 minutes (2,703 commuters, 17.0%) for females.
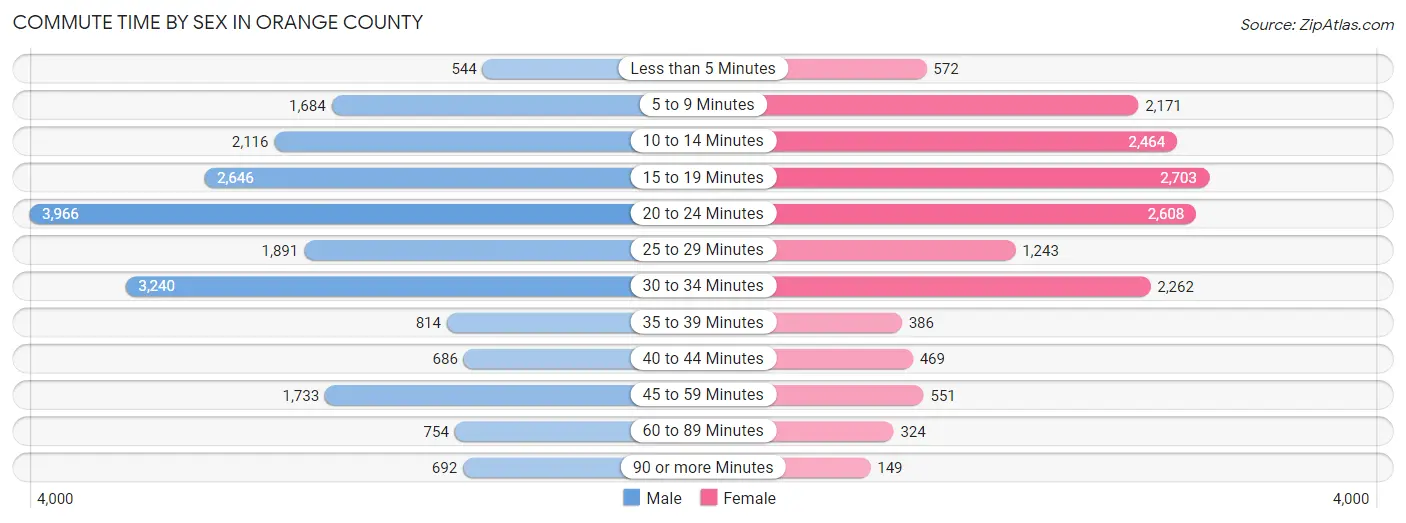
| Commute Time | Male | Female |
| Less than 5 Minutes | 544 (2.6%) | 572 (3.6%) |
| 5 to 9 Minutes | 1,684 (8.1%) | 2,171 (13.7%) |
| 10 to 14 Minutes | 2,116 (10.2%) | 2,464 (15.5%) |
| 15 to 19 Minutes | 2,646 (12.7%) | 2,703 (17.0%) |
| 20 to 24 Minutes | 3,966 (19.1%) | 2,608 (16.4%) |
| 25 to 29 Minutes | 1,891 (9.1%) | 1,243 (7.8%) |
| 30 to 34 Minutes | 3,240 (15.6%) | 2,262 (14.2%) |
| 35 to 39 Minutes | 814 (3.9%) | 386 (2.4%) |
| 40 to 44 Minutes | 686 (3.3%) | 469 (2.9%) |
| 45 to 59 Minutes | 1,733 (8.4%) | 551 (3.5%) |
| 60 to 89 Minutes | 754 (3.6%) | 324 (2.0%) |
| 90 or more Minutes | 692 (3.3%) | 149 (0.9%) |
Time of Departure to Work by Sex in Orange County
The most frequent times of departure to work in Orange County are 7:00 AM to 7:29 AM (3,402, 16.4%) for males and 7:00 AM to 7:29 AM (3,493, 22.0%) for females.
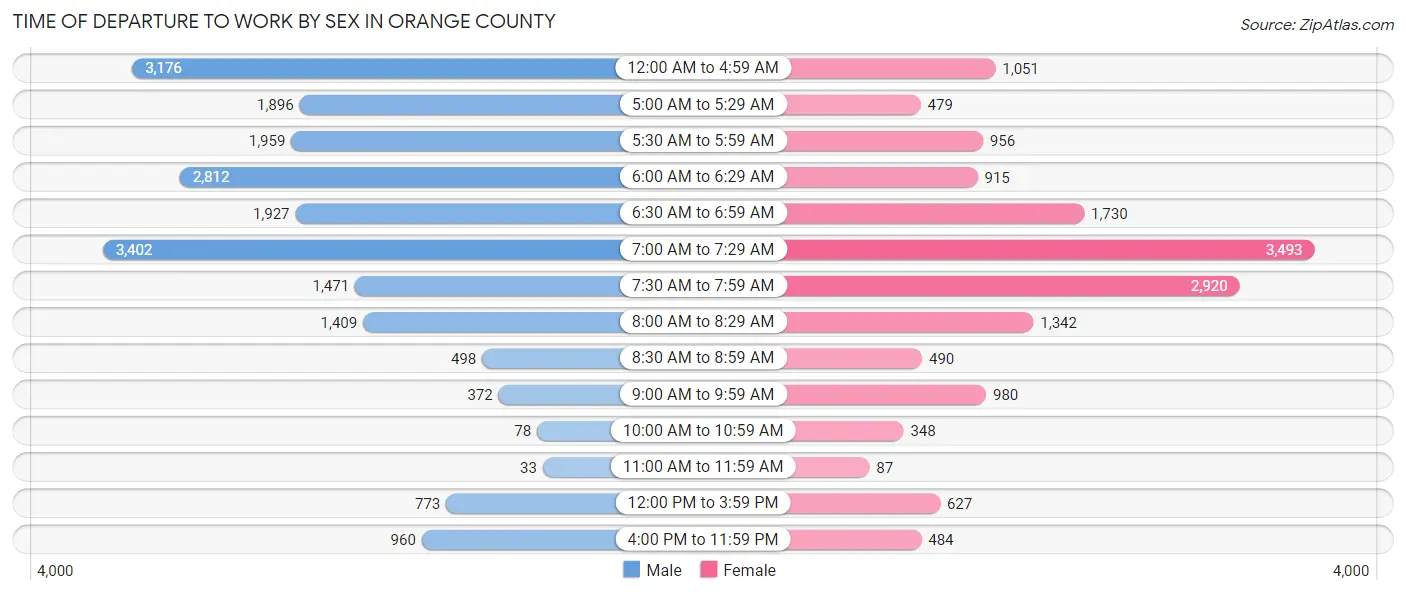
| Time of Departure | Male | Female |
| 12:00 AM to 4:59 AM | 3,176 (15.3%) | 1,051 (6.6%) |
| 5:00 AM to 5:29 AM | 1,896 (9.1%) | 479 (3.0%) |
| 5:30 AM to 5:59 AM | 1,959 (9.4%) | 956 (6.0%) |
| 6:00 AM to 6:29 AM | 2,812 (13.5%) | 915 (5.8%) |
| 6:30 AM to 6:59 AM | 1,927 (9.3%) | 1,730 (10.9%) |
| 7:00 AM to 7:29 AM | 3,402 (16.4%) | 3,493 (22.0%) |
| 7:30 AM to 7:59 AM | 1,471 (7.1%) | 2,920 (18.4%) |
| 8:00 AM to 8:29 AM | 1,409 (6.8%) | 1,342 (8.4%) |
| 8:30 AM to 8:59 AM | 498 (2.4%) | 490 (3.1%) |
| 9:00 AM to 9:59 AM | 372 (1.8%) | 980 (6.2%) |
| 10:00 AM to 10:59 AM | 78 (0.4%) | 348 (2.2%) |
| 11:00 AM to 11:59 AM | 33 (0.2%) | 87 (0.5%) |
| 12:00 PM to 3:59 PM | 773 (3.7%) | 627 (3.9%) |
| 4:00 PM to 11:59 PM | 960 (4.6%) | 484 (3.0%) |
| Total | 20,766 (100.0%) | 15,902 (100.0%) |
Housing Occupancy in Orange County
Occupancy by Ownership in Orange County
Of the total 31,274 dwellings in Orange County, owner-occupied units account for 23,503 (75.1%), while renter-occupied units make up 7,771 (24.8%).
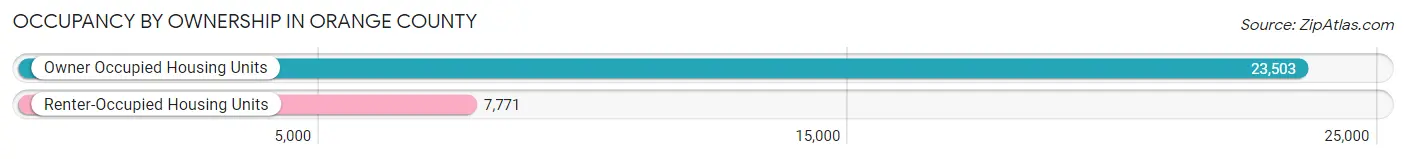
| Occupancy | # Housing Units | % Housing Units |
| Owner Occupied Housing Units | 23,503 | 75.1% |
| Renter-Occupied Housing Units | 7,771 | 24.8% |
| Total Occupied Housing Units | 31,274 | 100.0% |
Occupancy by Household Size in Orange County
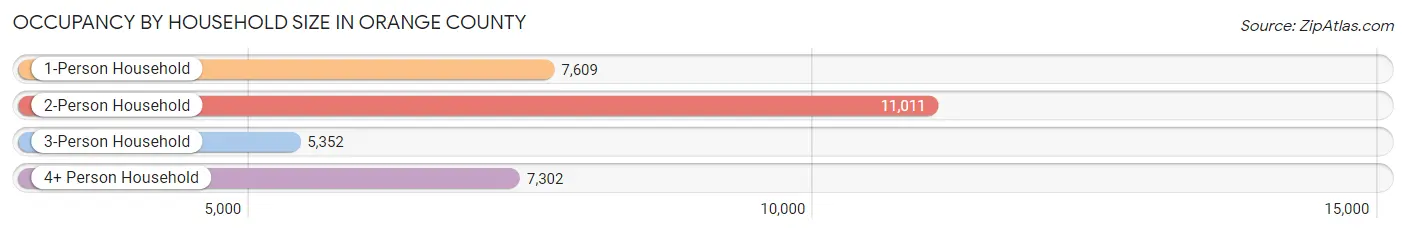
| Household Size | # Housing Units | % Housing Units |
| 1-Person Household | 7,609 | 24.3% |
| 2-Person Household | 11,011 | 35.2% |
| 3-Person Household | 5,352 | 17.1% |
| 4+ Person Household | 7,302 | 23.4% |
| Total Housing Units | 31,274 | 100.0% |
Occupancy by Ownership by Household Size in Orange County
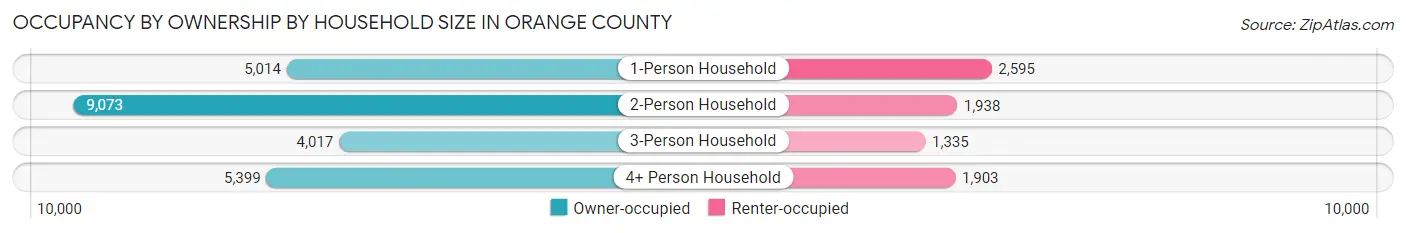
| Household Size | Owner-occupied | Renter-occupied |
| 1-Person Household | 5,014 (65.9%) | 2,595 (34.1%) |
| 2-Person Household | 9,073 (82.4%) | 1,938 (17.6%) |
| 3-Person Household | 4,017 (75.1%) | 1,335 (24.9%) |
| 4+ Person Household | 5,399 (73.9%) | 1,903 (26.1%) |
| Total Housing Units | 23,503 (75.1%) | 7,771 (24.8%) |
Occupancy by Educational Attainment in Orange County
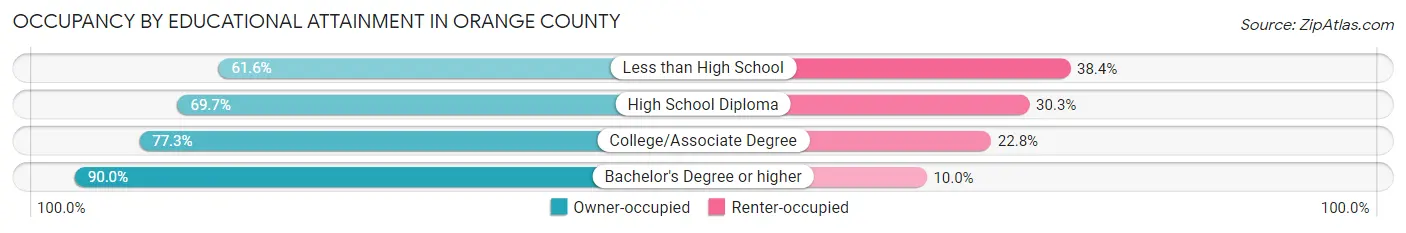
| Household Size | Owner-occupied | Renter-occupied |
| Less than High School | 2,077 (61.6%) | 1,297 (38.4%) |
| High School Diploma | 7,464 (69.7%) | 3,249 (30.3%) |
| College/Associate Degree | 9,132 (77.2%) | 2,690 (22.8%) |
| Bachelor's Degree or higher | 4,830 (90.0%) | 535 (10.0%) |
Occupancy by Age of Householder in Orange County
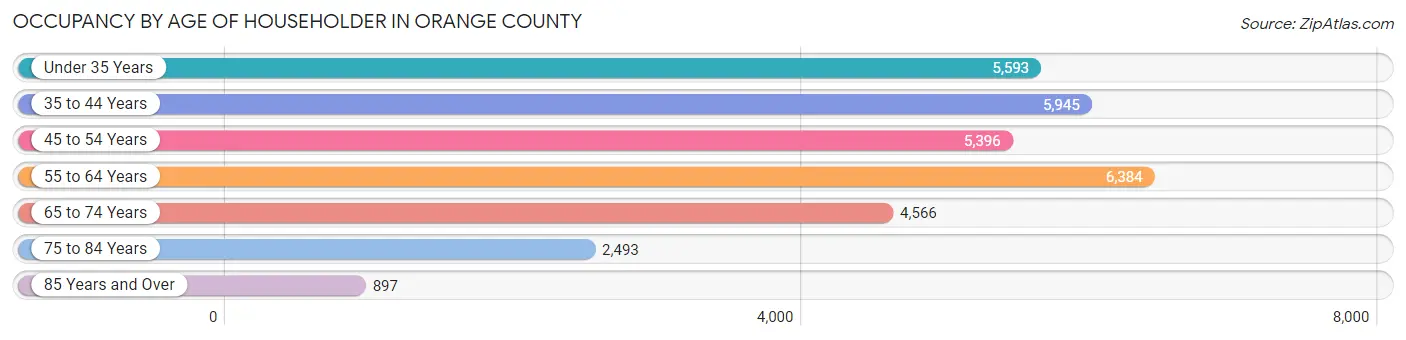
| Age Bracket | # Households | % Households |
| Under 35 Years | 5,593 | 17.9% |
| 35 to 44 Years | 5,945 | 19.0% |
| 45 to 54 Years | 5,396 | 17.2% |
| 55 to 64 Years | 6,384 | 20.4% |
| 65 to 74 Years | 4,566 | 14.6% |
| 75 to 84 Years | 2,493 | 8.0% |
| 85 Years and Over | 897 | 2.9% |
| Total | 31,274 | 100.0% |
Housing Finances in Orange County
Median Income by Occupancy in Orange County
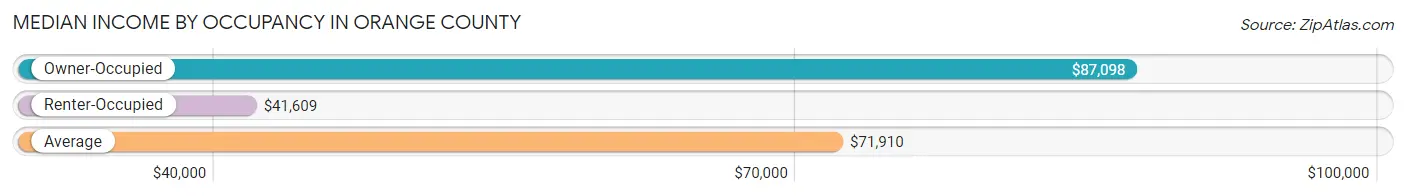
| Occupancy Type | # Households | Median Income |
| Owner-Occupied | 23,503 (75.1%) | $87,098 |
| Renter-Occupied | 7,771 (24.8%) | $41,609 |
| Average | 31,274 (100.0%) | $71,910 |
Occupancy by Householder Income Bracket in Orange County
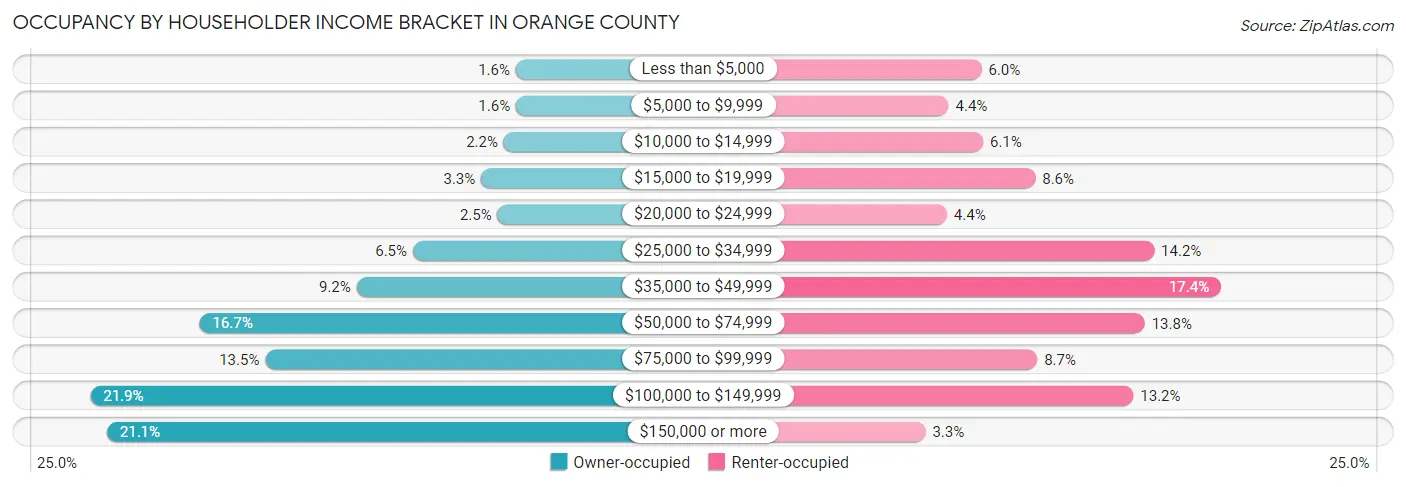
| Income Bracket | Owner-occupied | Renter-occupied |
| Less than $5,000 | 379 (1.6%) | 466 (6.0%) |
| $5,000 to $9,999 | 375 (1.6%) | 344 (4.4%) |
| $10,000 to $14,999 | 513 (2.2%) | 472 (6.1%) |
| $15,000 to $19,999 | 766 (3.3%) | 665 (8.6%) |
| $20,000 to $24,999 | 582 (2.5%) | 338 (4.3%) |
| $25,000 to $34,999 | 1,530 (6.5%) | 1,105 (14.2%) |
| $35,000 to $49,999 | 2,161 (9.2%) | 1,352 (17.4%) |
| $50,000 to $74,999 | 3,919 (16.7%) | 1,070 (13.8%) |
| $75,000 to $99,999 | 3,183 (13.5%) | 672 (8.6%) |
| $100,000 to $149,999 | 5,140 (21.9%) | 1,028 (13.2%) |
| $150,000 or more | 4,955 (21.1%) | 259 (3.3%) |
| Total | 23,503 (100.0%) | 7,771 (100.0%) |
Monthly Housing Cost Tiers in Orange County
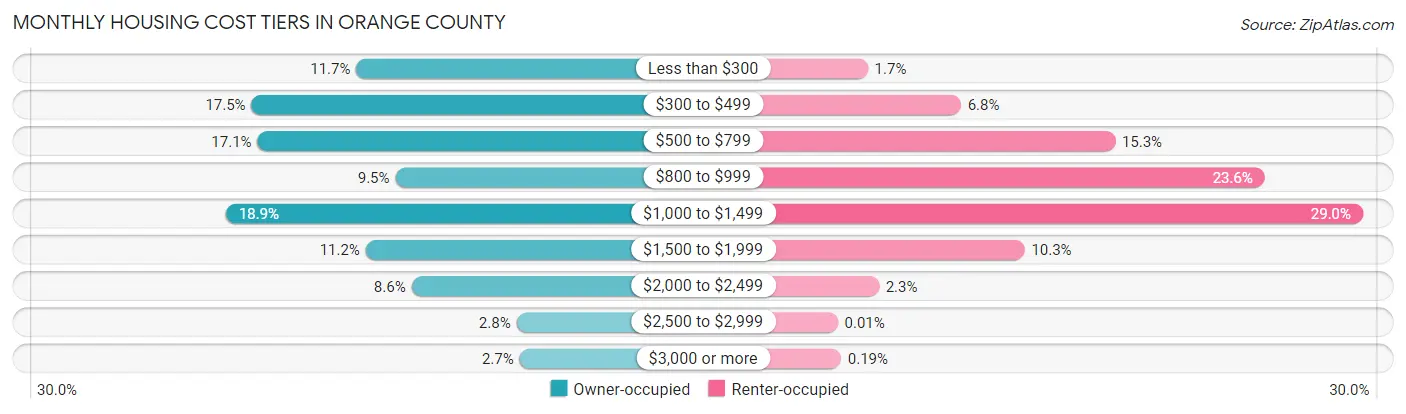
| Monthly Cost | Owner-occupied | Renter-occupied |
| Less than $300 | 2,746 (11.7%) | 130 (1.7%) |
| $300 to $499 | 4,106 (17.5%) | 529 (6.8%) |
| $500 to $799 | 4,029 (17.1%) | 1,191 (15.3%) |
| $800 to $999 | 2,238 (9.5%) | 1,834 (23.6%) |
| $1,000 to $1,499 | 4,440 (18.9%) | 2,255 (29.0%) |
| $1,500 to $1,999 | 2,624 (11.2%) | 803 (10.3%) |
| $2,000 to $2,499 | 2,029 (8.6%) | 177 (2.3%) |
| $2,500 to $2,999 | 665 (2.8%) | 1 (0.0%) |
| $3,000 or more | 626 (2.7%) | 15 (0.2%) |
| Total | 23,503 (100.0%) | 7,771 (100.0%) |
Physical Housing Characteristics in Orange County
Housing Structures in Orange County
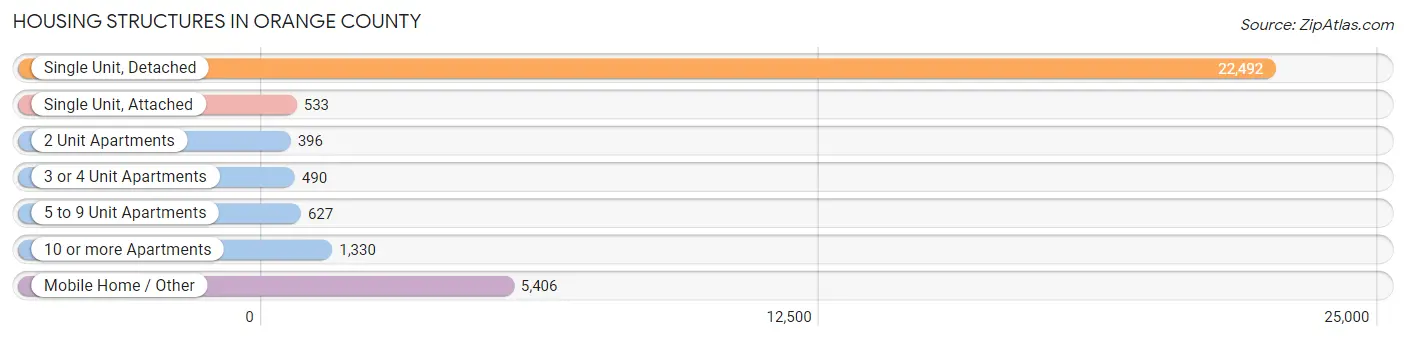
| Structure Type | # Housing Units | % Housing Units |
| Single Unit, Detached | 22,492 | 71.9% |
| Single Unit, Attached | 533 | 1.7% |
| 2 Unit Apartments | 396 | 1.3% |
| 3 or 4 Unit Apartments | 490 | 1.6% |
| 5 to 9 Unit Apartments | 627 | 2.0% |
| 10 or more Apartments | 1,330 | 4.3% |
| Mobile Home / Other | 5,406 | 17.3% |
| Total | 31,274 | 100.0% |
Housing Structures by Occupancy in Orange County
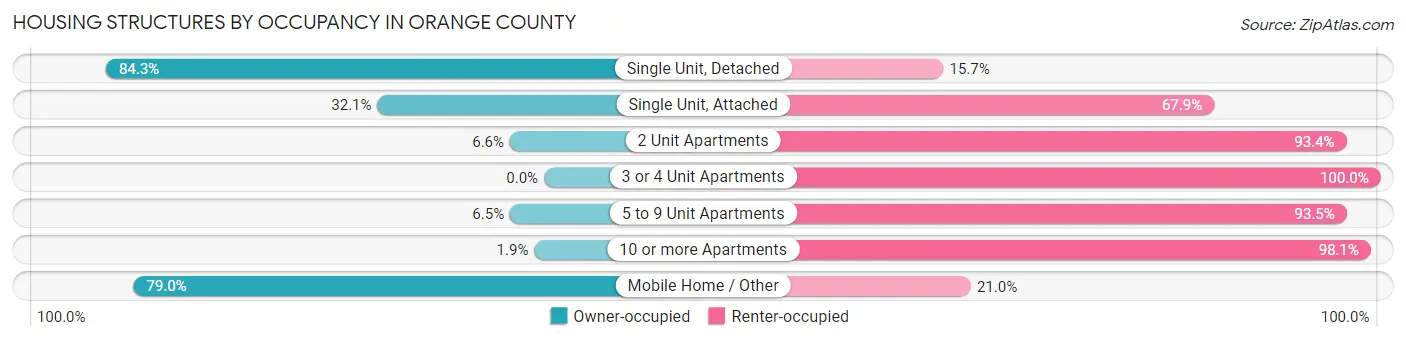
| Structure Type | Owner-occupied | Renter-occupied |
| Single Unit, Detached | 18,967 (84.3%) | 3,525 (15.7%) |
| Single Unit, Attached | 171 (32.1%) | 362 (67.9%) |
| 2 Unit Apartments | 26 (6.6%) | 370 (93.4%) |
| 3 or 4 Unit Apartments | 0 (0.0%) | 490 (100.0%) |
| 5 to 9 Unit Apartments | 41 (6.5%) | 586 (93.5%) |
| 10 or more Apartments | 25 (1.9%) | 1,305 (98.1%) |
| Mobile Home / Other | 4,273 (79.0%) | 1,133 (21.0%) |
| Total | 23,503 (75.1%) | 7,771 (24.8%) |
Housing Structures by Number of Rooms in Orange County
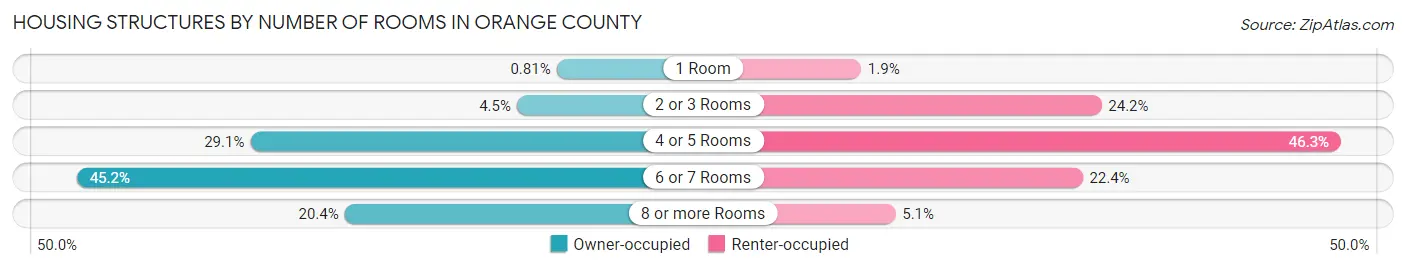
| Number of Rooms | Owner-occupied | Renter-occupied |
| 1 Room | 190 (0.8%) | 151 (1.9%) |
| 2 or 3 Rooms | 1,052 (4.5%) | 1,879 (24.2%) |
| 4 or 5 Rooms | 6,846 (29.1%) | 3,600 (46.3%) |
| 6 or 7 Rooms | 10,618 (45.2%) | 1,743 (22.4%) |
| 8 or more Rooms | 4,797 (20.4%) | 398 (5.1%) |
| Total | 23,503 (100.0%) | 7,771 (100.0%) |
Housing Structure by Heating Type in Orange County
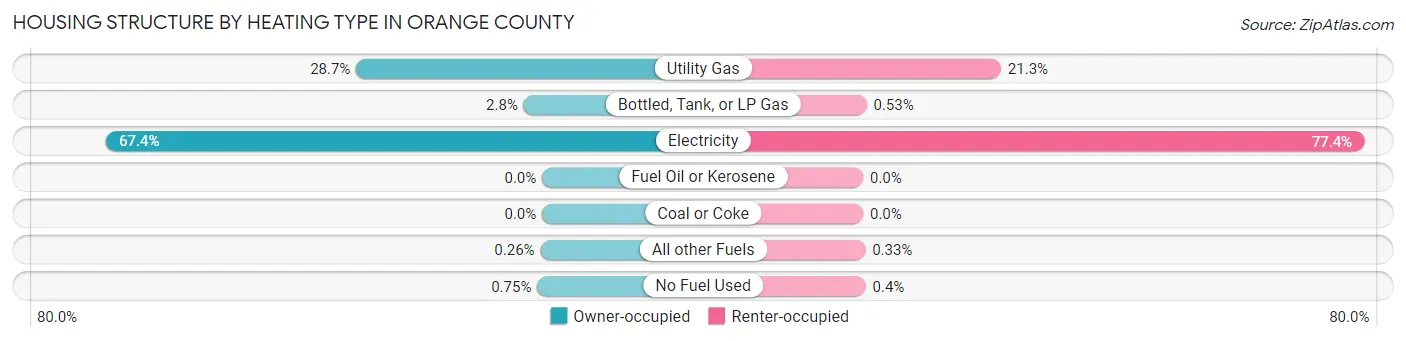
| Heating Type | Owner-occupied | Renter-occupied |
| Utility Gas | 6,755 (28.7%) | 1,656 (21.3%) |
| Bottled, Tank, or LP Gas | 667 (2.8%) | 41 (0.5%) |
| Electricity | 15,844 (67.4%) | 6,017 (77.4%) |
| Fuel Oil or Kerosene | 0 (0.0%) | 0 (0.0%) |
| Coal or Coke | 0 (0.0%) | 0 (0.0%) |
| All other Fuels | 61 (0.3%) | 26 (0.3%) |
| No Fuel Used | 176 (0.7%) | 31 (0.4%) |
| Total | 23,503 (100.0%) | 7,771 (100.0%) |
Household Vehicle Usage in Orange County
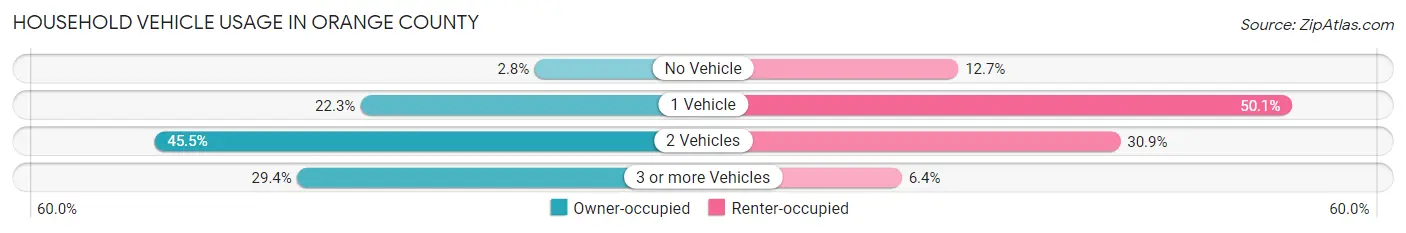
| Vehicles per Household | Owner-occupied | Renter-occupied |
| No Vehicle | 660 (2.8%) | 986 (12.7%) |
| 1 Vehicle | 5,242 (22.3%) | 3,894 (50.1%) |
| 2 Vehicles | 10,687 (45.5%) | 2,397 (30.8%) |
| 3 or more Vehicles | 6,914 (29.4%) | 494 (6.4%) |
| Total | 23,503 (100.0%) | 7,771 (100.0%) |
Real Estate & Mortgages in Orange County
Real Estate and Mortgage Overview in Orange County
| Characteristic | Without Mortgage | With Mortgage |
| Housing Units | 12,339 | 11,164 |
| Median Property Value | $117,000 | $186,000 |
| Median Household Income | $60,911 | $3,547 |
| Monthly Housing Costs | $470 | $626 |
| Real Estate Taxes | $1,376 | $308 |
Property Value by Mortgage Status in Orange County
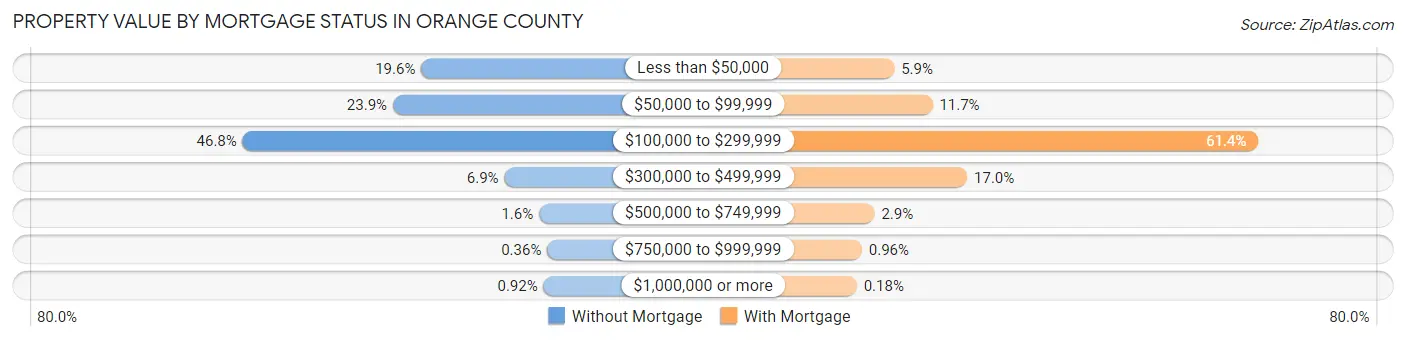
| Property Value | Without Mortgage | With Mortgage |
| Less than $50,000 | 2,413 (19.6%) | 658 (5.9%) |
| $50,000 to $99,999 | 2,947 (23.9%) | 1,308 (11.7%) |
| $100,000 to $299,999 | 5,772 (46.8%) | 6,851 (61.4%) |
| $300,000 to $499,999 | 849 (6.9%) | 1,898 (17.0%) |
| $500,000 to $749,999 | 199 (1.6%) | 322 (2.9%) |
| $750,000 to $999,999 | 45 (0.4%) | 107 (1.0%) |
| $1,000,000 or more | 114 (0.9%) | 20 (0.2%) |
| Total | 12,339 (100.0%) | 11,164 (100.0%) |
Household Income by Mortgage Status in Orange County
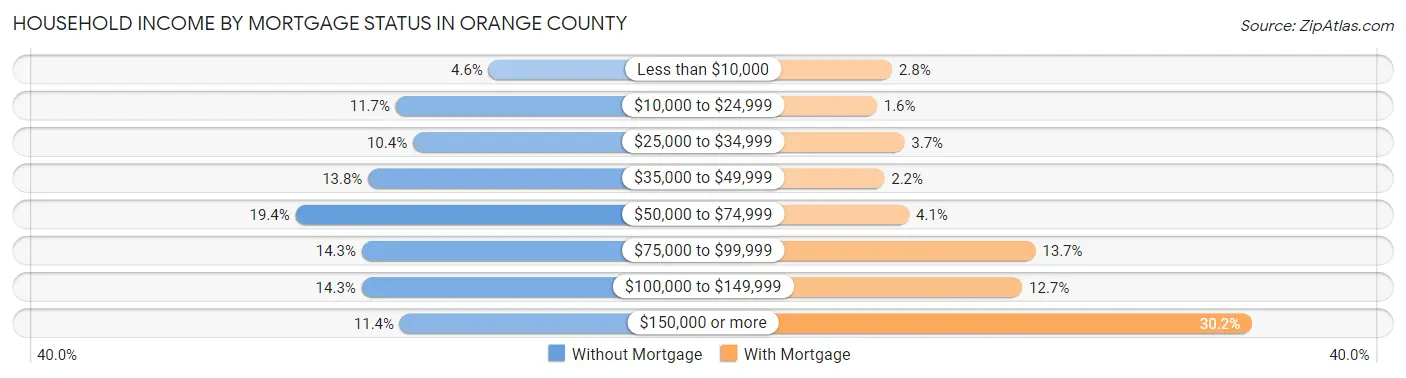
| Household Income | Without Mortgage | With Mortgage |
| Less than $10,000 | 573 (4.6%) | 309 (2.8%) |
| $10,000 to $24,999 | 1,446 (11.7%) | 181 (1.6%) |
| $25,000 to $34,999 | 1,285 (10.4%) | 415 (3.7%) |
| $35,000 to $49,999 | 1,705 (13.8%) | 245 (2.2%) |
| $50,000 to $74,999 | 2,389 (19.4%) | 456 (4.1%) |
| $75,000 to $99,999 | 1,766 (14.3%) | 1,530 (13.7%) |
| $100,000 to $149,999 | 1,767 (14.3%) | 1,417 (12.7%) |
| $150,000 or more | 1,408 (11.4%) | 3,373 (30.2%) |
| Total | 12,339 (100.0%) | 11,164 (100.0%) |
Property Value to Household Income Ratio in Orange County
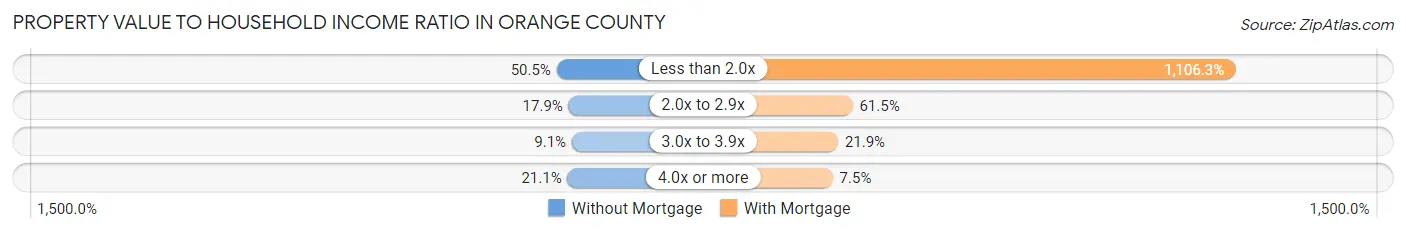
| Value-to-Income Ratio | Without Mortgage | With Mortgage |
| Less than 2.0x | 6,226 (50.5%) | 123,506 (1,106.3%) |
| 2.0x to 2.9x | 2,212 (17.9%) | 6,862 (61.5%) |
| 3.0x to 3.9x | 1,117 (9.0%) | 2,443 (21.9%) |
| 4.0x or more | 2,600 (21.1%) | 837 (7.5%) |
| Total | 12,339 (100.0%) | 11,164 (100.0%) |
Real Estate Taxes by Mortgage Status in Orange County
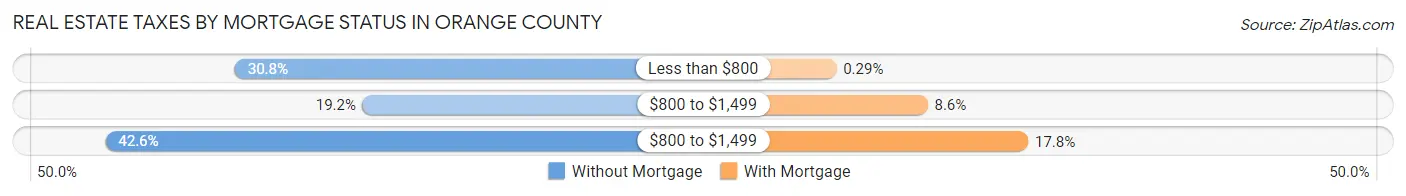
| Property Taxes | Without Mortgage | With Mortgage |
| Less than $800 | 3,801 (30.8%) | 32 (0.3%) |
| $800 to $1,499 | 2,370 (19.2%) | 964 (8.6%) |
| $800 to $1,499 | 5,259 (42.6%) | 1,988 (17.8%) |
| Total | 12,339 (100.0%) | 11,164 (100.0%) |
Health & Disability in Orange County
Health Insurance Coverage by Age in Orange County
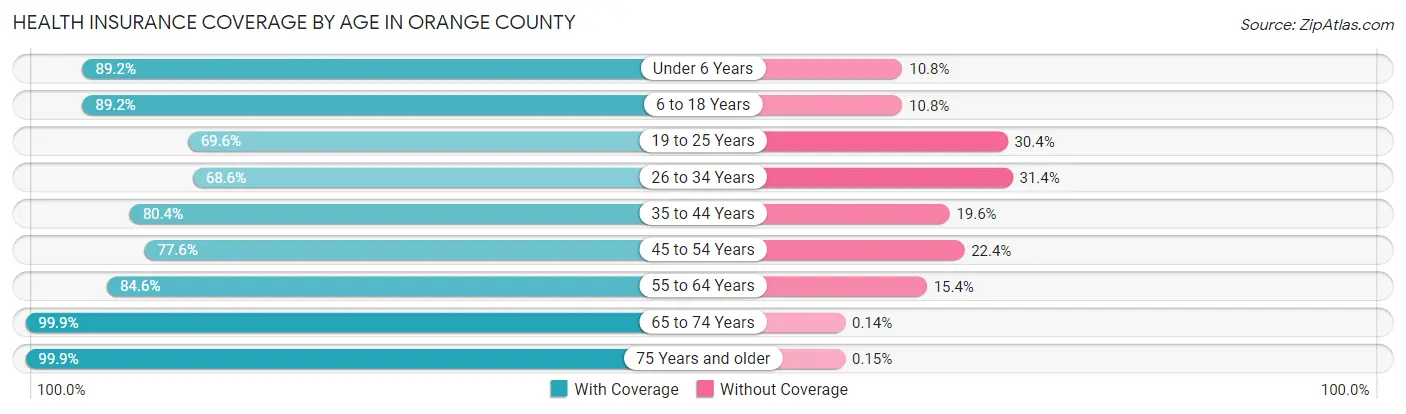
| Age Bracket | With Coverage | Without Coverage |
| Under 6 Years | 6,023 (89.2%) | 731 (10.8%) |
| 6 to 18 Years | 13,773 (89.2%) | 1,665 (10.8%) |
| 19 to 25 Years | 4,874 (69.6%) | 2,132 (30.4%) |
| 26 to 34 Years | 6,683 (68.6%) | 3,055 (31.4%) |
| 35 to 44 Years | 8,961 (80.4%) | 2,186 (19.6%) |
| 45 to 54 Years | 7,703 (77.6%) | 2,218 (22.4%) |
| 55 to 64 Years | 9,337 (84.6%) | 1,696 (15.4%) |
| 65 to 74 Years | 7,815 (99.9%) | 11 (0.1%) |
| 75 Years and older | 5,198 (99.9%) | 8 (0.2%) |
| Total | 70,367 (83.7%) | 13,702 (16.3%) |
Health Insurance Coverage by Citizenship Status in Orange County
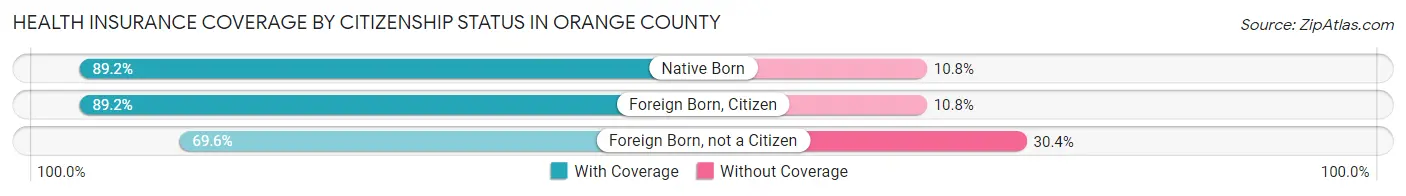
| Citizenship Status | With Coverage | Without Coverage |
| Native Born | 6,023 (89.2%) | 731 (10.8%) |
| Foreign Born, Citizen | 13,773 (89.2%) | 1,665 (10.8%) |
| Foreign Born, not a Citizen | 4,874 (69.6%) | 2,132 (30.4%) |
Health Insurance Coverage by Household Income in Orange County
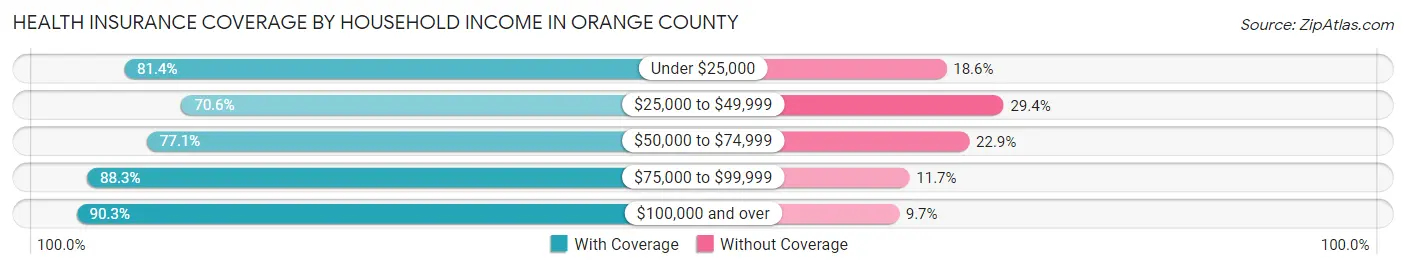
| Household Income | With Coverage | Without Coverage |
| Under $25,000 | 7,027 (81.4%) | 1,610 (18.6%) |
| $25,000 to $49,999 | 10,263 (70.6%) | 4,266 (29.4%) |
| $50,000 to $74,999 | 9,575 (77.1%) | 2,847 (22.9%) |
| $75,000 to $99,999 | 10,163 (88.3%) | 1,349 (11.7%) |
| $100,000 and over | 33,302 (90.3%) | 3,594 (9.7%) |
Public vs Private Health Insurance Coverage by Age in Orange County
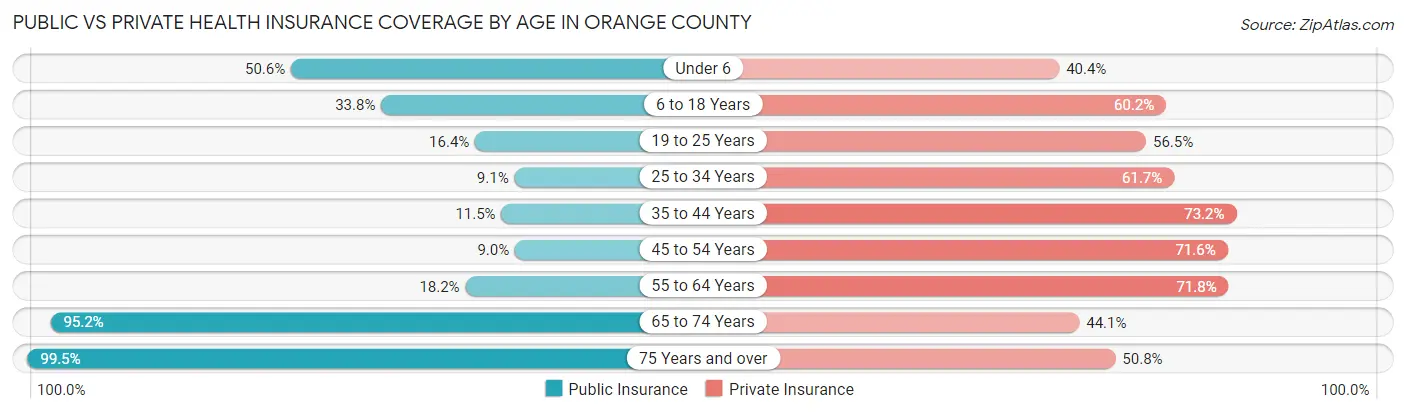
| Age Bracket | Public Insurance | Private Insurance |
| Under 6 | 3,414 (50.5%) | 2,725 (40.4%) |
| 6 to 18 Years | 5,218 (33.8%) | 9,294 (60.2%) |
| 19 to 25 Years | 1,147 (16.4%) | 3,956 (56.5%) |
| 25 to 34 Years | 883 (9.1%) | 6,006 (61.7%) |
| 35 to 44 Years | 1,281 (11.5%) | 8,162 (73.2%) |
| 45 to 54 Years | 890 (9.0%) | 7,101 (71.6%) |
| 55 to 64 Years | 2,005 (18.2%) | 7,918 (71.8%) |
| 65 to 74 Years | 7,450 (95.2%) | 3,450 (44.1%) |
| 75 Years and over | 5,179 (99.5%) | 2,644 (50.8%) |
| Total | 27,467 (32.7%) | 51,256 (61.0%) |
Disability Status by Sex by Age in Orange County
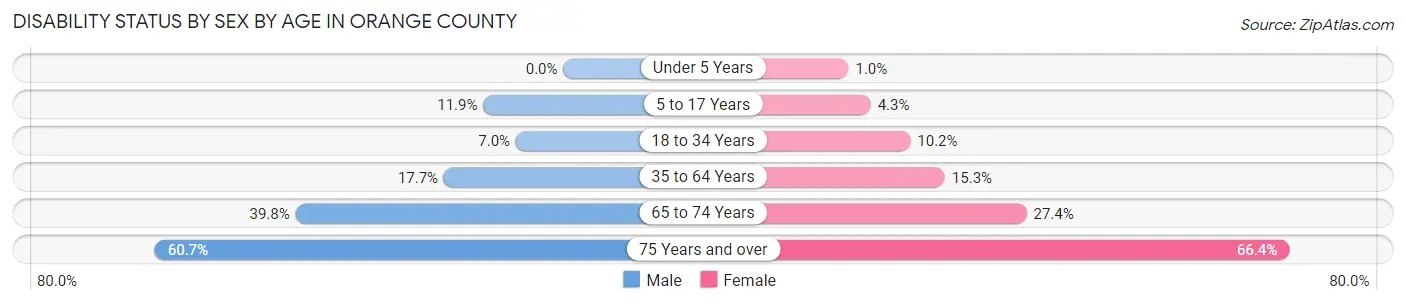
| Age Bracket | Male | Female |
| Under 5 Years | 0 (0.0%) | 27 (1.0%) |
| 5 to 17 Years | 959 (11.9%) | 326 (4.3%) |
| 18 to 34 Years | 640 (7.0%) | 880 (10.2%) |
| 35 to 64 Years | 2,833 (17.7%) | 2,468 (15.3%) |
| 65 to 74 Years | 1,487 (39.8%) | 1,121 (27.4%) |
| 75 Years and over | 1,335 (60.7%) | 1,996 (66.4%) |
Disability Class by Sex by Age in Orange County
Disability Class: Hearing Difficulty
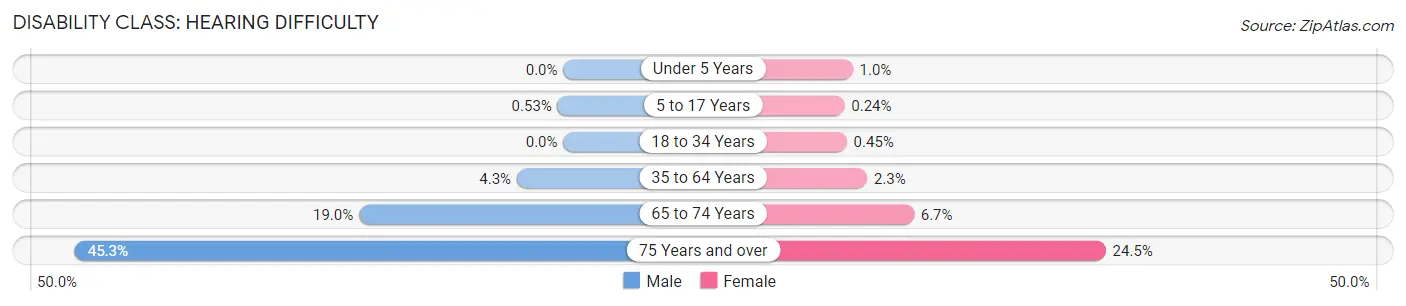
| Age Bracket | Male | Female |
| Under 5 Years | 0 (0.0%) | 27 (1.0%) |
| 5 to 17 Years | 43 (0.5%) | 18 (0.2%) |
| 18 to 34 Years | 0 (0.0%) | 39 (0.4%) |
| 35 to 64 Years | 689 (4.3%) | 377 (2.3%) |
| 65 to 74 Years | 709 (19.0%) | 273 (6.7%) |
| 75 Years and over | 998 (45.3%) | 736 (24.5%) |
Disability Class: Vision Difficulty
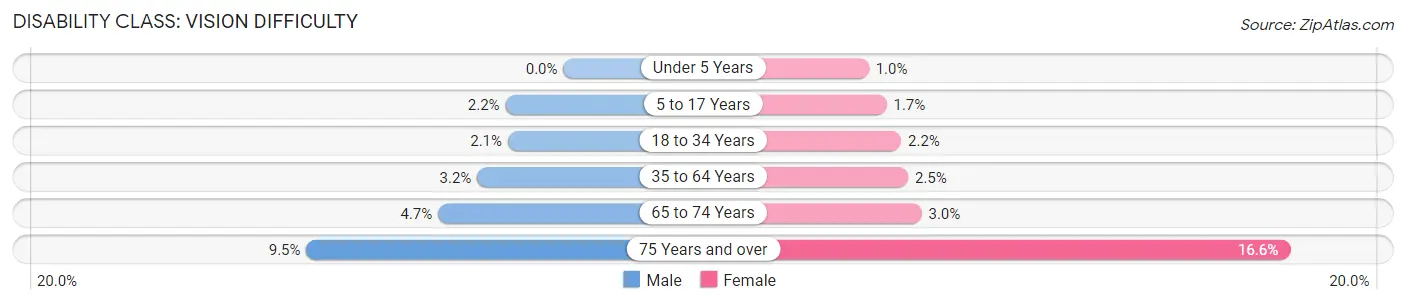
| Age Bracket | Male | Female |
| Under 5 Years | 0 (0.0%) | 27 (1.0%) |
| 5 to 17 Years | 173 (2.1%) | 126 (1.7%) |
| 18 to 34 Years | 187 (2.1%) | 190 (2.2%) |
| 35 to 64 Years | 511 (3.2%) | 396 (2.5%) |
| 65 to 74 Years | 174 (4.6%) | 121 (3.0%) |
| 75 Years and over | 210 (9.5%) | 500 (16.6%) |
Disability Class: Cognitive Difficulty
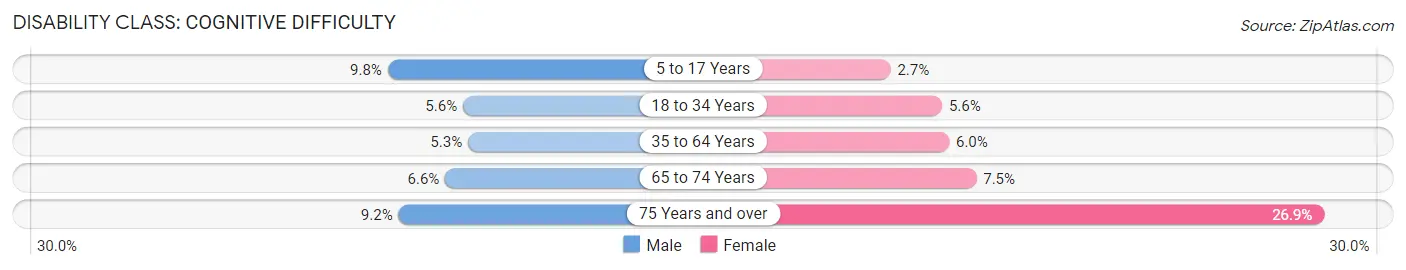
| Age Bracket | Male | Female |
| 5 to 17 Years | 789 (9.8%) | 206 (2.7%) |
| 18 to 34 Years | 508 (5.6%) | 482 (5.6%) |
| 35 to 64 Years | 848 (5.3%) | 963 (6.0%) |
| 65 to 74 Years | 246 (6.6%) | 306 (7.5%) |
| 75 Years and over | 202 (9.2%) | 807 (26.9%) |
Disability Class: Ambulatory Difficulty
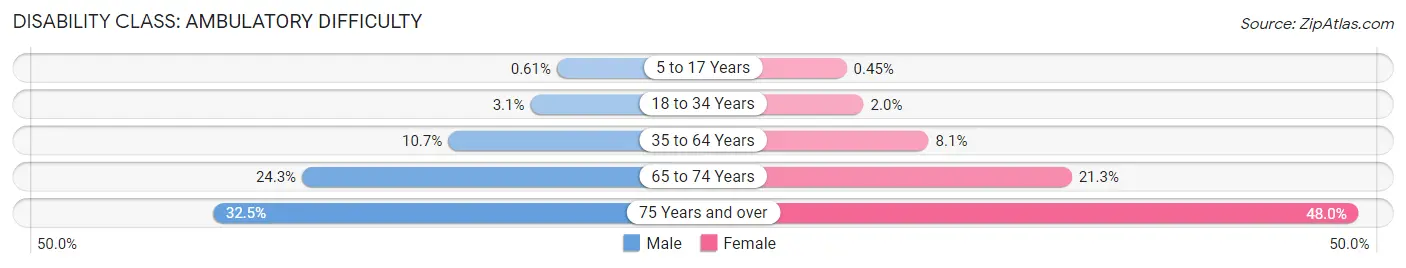
| Age Bracket | Male | Female |
| 5 to 17 Years | 49 (0.6%) | 34 (0.4%) |
| 18 to 34 Years | 279 (3.1%) | 175 (2.0%) |
| 35 to 64 Years | 1,709 (10.7%) | 1,299 (8.1%) |
| 65 to 74 Years | 907 (24.3%) | 872 (21.3%) |
| 75 Years and over | 716 (32.5%) | 1,441 (47.9%) |
Disability Class: Self-Care Difficulty
| Age Bracket | Male | Female |
| 5 to 17 Years | 164 (2.0%) | 34 (0.4%) |
| 18 to 34 Years | 226 (2.5%) | 182 (2.1%) |
| 35 to 64 Years | 419 (2.6%) | 241 (1.5%) |
| 65 to 74 Years | 181 (4.8%) | 156 (3.8%) |
| 75 Years and over | 157 (7.1%) | 377 (12.6%) |
Technology Access in Orange County
Computing Device Access in Orange County
| Device Type | # Households | % Households |
| Desktop or Laptop | 22,728 | 72.7% |
| Smartphone | 28,211 | 90.2% |
| Tablet | 18,681 | 59.7% |
| No Computing Device | 1,788 | 5.7% |
| Total | 31,274 | 100.0% |
Internet Access in Orange County
| Internet Type | # Households | % Households |
| Dial-Up Internet | 7 | 0.0% |
| Broadband Home | 21,173 | 67.7% |
| Cellular Data Only | 5,376 | 17.2% |
| Satellite Internet | 2,324 | 7.4% |
| No Internet | 2,949 | 9.4% |
| Total | 31,274 | 100.0% |
Orange County Summary
Orange County, Texas is located in the southeastern corner of the state, and is bordered by Jefferson County to the north, Hardin County to the east, Jasper County to the south, and Newton County to the west. The county seat is Orange, and the county is part of the Beaumont-Port Arthur Metropolitan Statistical Area.
History
Orange County was established in 1852, and was named for the orange groves that were found in the area. The county was originally part of Jefferson County, and was created by an act of the Texas Legislature. The first settlers in the area were French-speaking immigrants from Nova Scotia, who arrived in the early 1800s.
The county was home to several battles during the Civil War, including the Battle of Sabine Pass, which was fought in 1863. The Confederate forces were victorious in this battle, and the Union forces were forced to retreat.
In the late 1800s, the county experienced a period of growth and development, as the lumber industry began to take off. The lumber industry was a major source of employment for the county, and it helped to spur the growth of the county’s population.
Geography
Orange County is located in the southeastern corner of Texas, and is bordered by Jefferson County to the north, Hardin County to the east, Jasper County to the south, and Newton County to the west. The county is located on the Gulf Coast, and is part of the Beaumont-Port Arthur Metropolitan Statistical Area.
The county has a total area of 845 square miles, of which 837 square miles is land and 8 square miles is water. The terrain of the county is mostly flat, with some rolling hills in the northern part of the county. The Sabine River forms the eastern border of the county, and the Neches River forms the western border.
Economy
The economy of Orange County is largely based on the oil and gas industry, as well as the lumber industry. The county is home to several oil and gas refineries, as well as several lumber mills. The county is also home to several chemical plants, which produce a variety of products, including plastics and rubber.
The county is also home to several manufacturing plants, which produce a variety of products, including furniture, clothing, and electronics. The county is also home to several retail stores, which sell a variety of goods, including clothing, furniture, and electronics.
Demographics
As of the 2010 census, the population of Orange County was 81,837. The population is made up of a variety of ethnic and racial groups, including White (63.2%), African American (20.2%), Hispanic or Latino (14.2%), and Asian (2.2%).
The median household income in the county is $45,837, and the median family income is $54,837. The per capita income in the county is $22,837. The unemployment rate in the county is 5.2%, which is lower than the national average.
Conclusion
Orange County, Texas is located in the southeastern corner of the state, and is bordered by Jefferson County to the north, Hardin County to the east, Jasper County to the south, and Newton County to the west. The county is part of the Beaumont-Port Arthur Metropolitan Statistical Area, and has a population of 81,837, as of the 2010 census. The economy of the county is largely based on the oil and gas industry, as well as the lumber industry. The county is also home to several manufacturing plants, which produce a variety of products, including furniture, clothing, and electronics. The median household income in the county is $45,837, and the median family income is $54,837. The per capita income in the county is $22,837.
Common Questions
What is Per Capita Income in Orange County?
Per Capita income in Orange County is $35,301.
What is the Median Family Income in Orange County?
Median Family Income in Orange County is $92,500.
What is the Median Household income in Orange County?
Median Household Income in Orange County is $71,910.
What is Income or Wage Gap in Orange County?
Income or Wage Gap in Orange County is 45.4%.
Women in Orange County earn 54.6 cents for every dollar earned by a man.
What is Family Income Deficit in Orange County?
Family Income Deficit in Orange County is $12,073.
Families that are below poverty line in Orange County earn $12,073 less on average than the poverty threshold level.
What is Inequality or Gini Index in Orange County?
Inequality or Gini Index in Orange County is 0.44.
What is the Total Population of Orange County?
Total Population of Orange County is 84,761.
What is the Total Male Population of Orange County?
Total Male Population of Orange County is 42,264.
What is the Total Female Population of Orange County?
Total Female Population of Orange County is 42,497.
What is the Ratio of Males per 100 Females in Orange County?
There are 99.45 Males per 100 Females in Orange County.
What is the Ratio of Females per 100 Males in Orange County?
There are 100.55 Females per 100 Males in Orange County.
What is the Median Population Age in Orange County?
Median Population Age in Orange County is 37.7 Years.
What is the Average Family Size in Orange County
Average Family Size in Orange County is 3.2 People.
What is the Average Household Size in Orange County
Average Household Size in Orange County is 2.7 People.
How Large is the Labor Force in Orange County?
There are 40,640 People in the Labor Forcein in Orange County.
What is the Percentage of People in the Labor Force in Orange County?
61.5% of People are in the Labor Force in Orange County.
What is the Unemployment Rate in Orange County?
Unemployment Rate in Orange County is 5.8%.