Oldham County, TX Map & Demographics
Oldham County Map
Oldham County Overview
$27,710
PER CAPITA INCOME
$75,515
AVG FAMILY INCOME
$71,103
AVG HOUSEHOLD INCOME
43.4%
WAGE / INCOME GAP [ % ]
56.6¢/ $1
WAGE / INCOME GAP [ $ ]
0.43
INEQUALITY / GINI INDEX
2,171
TOTAL POPULATION
1,284
MALE POPULATION
887
FEMALE POPULATION
144.76
MALES / 100 FEMALES
69.08
FEMALES / 100 MALES
35.0
MEDIAN AGE
3.3
AVG FAMILY SIZE
2.9
AVG HOUSEHOLD SIZE
895
LABOR FORCE [ PEOPLE ]
54.6%
PERCENT IN LABOR FORCE
1.5%
UNEMPLOYMENT RATE
Oldham County Area Codes
Income in Oldham County
Income Overview in Oldham County
Per Capita Income in Oldham County is $27,710, while median incomes of families and households are $75,515 and $71,103 respectively.
| Characteristic | Number | Measure |
| Per Capita Income | 2,171 | $27,710 |
| Median Family Income | 485 | $75,515 |
| Mean Family Income | 485 | $100,493 |
| Median Household Income | 631 | $71,103 |
| Mean Household Income | 631 | $89,702 |
| Income Deficit | 485 | $0 |
| Wage / Income Gap (%) | 2,171 | 43.39% |
| Wage / Income Gap ($) | 2,171 | 56.61¢ per $1 |
| Gini / Inequality Index | 2,171 | 0.43 |
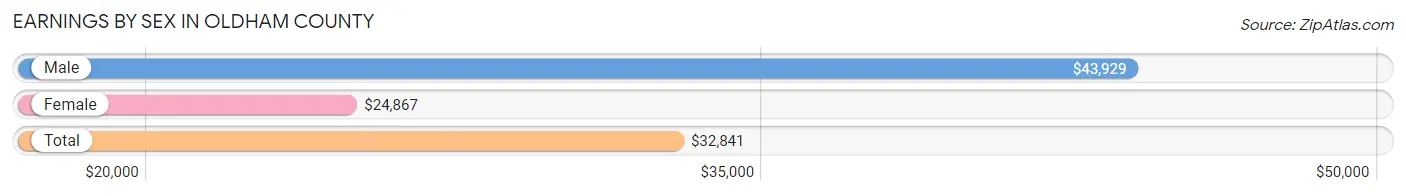
Earnings by Sex in Oldham County
Average Earnings in Oldham County are $32,841, $43,929 for men and $24,867 for women, a difference of 43.4%.
| Sex | Number | Average Earnings |
| Male | 634 (60.8%) | $43,929 |
| Female | 409 (39.2%) | $24,867 |
| Total | 1,043 (100.0%) | $32,841 |
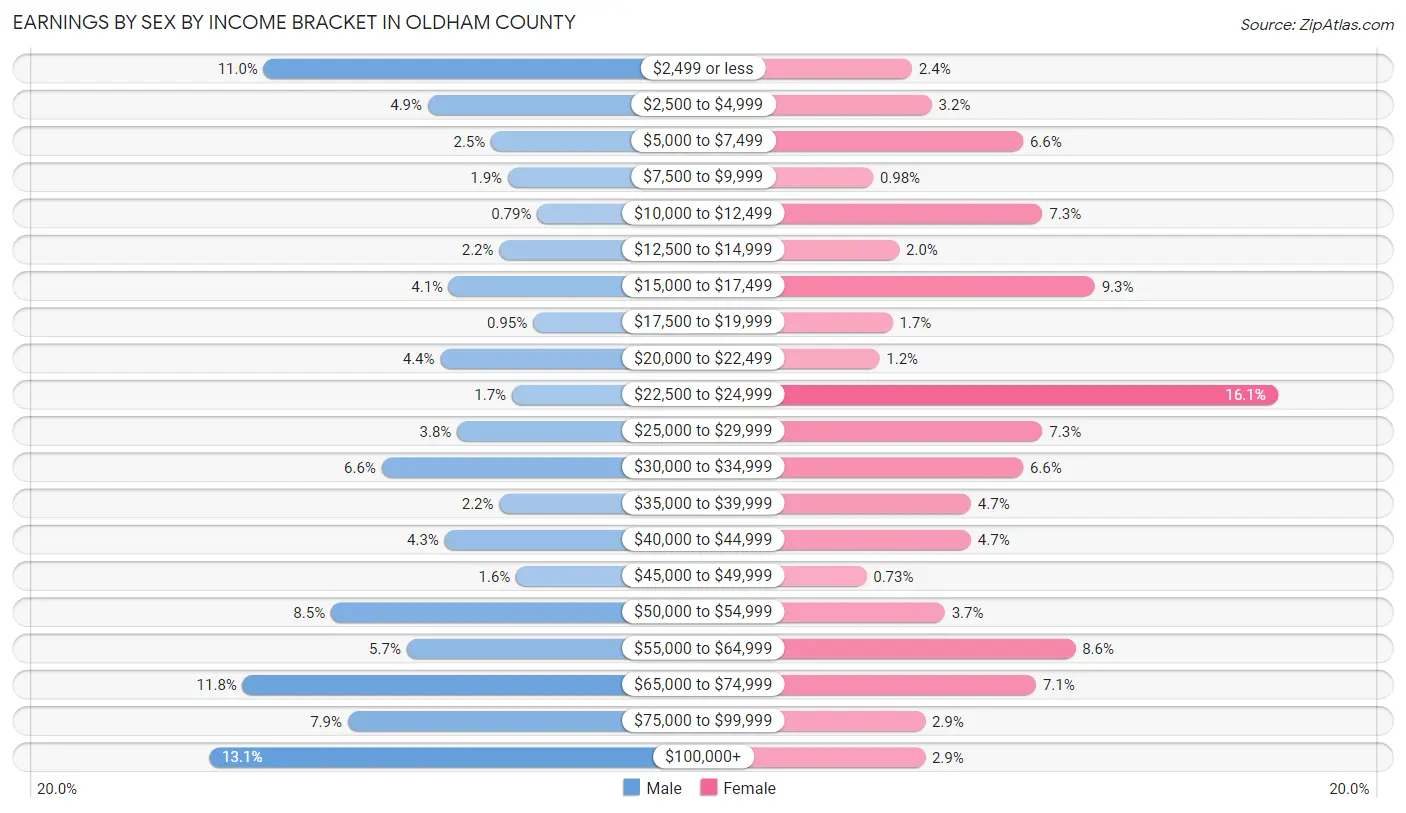
Earnings by Sex by Income Bracket in Oldham County
The most common earnings brackets in Oldham County are $100,000+ for men (83 | 13.1%) and $22,500 to $24,999 for women (66 | 16.1%).
| Income | Male | Female |
| $2,499 or less | 70 (11.0%) | 10 (2.4%) |
| $2,500 to $4,999 | 31 (4.9%) | 13 (3.2%) |
| $5,000 to $7,499 | 16 (2.5%) | 27 (6.6%) |
| $7,500 to $9,999 | 12 (1.9%) | 4 (1.0%) |
| $10,000 to $12,499 | 5 (0.8%) | 30 (7.3%) |
| $12,500 to $14,999 | 14 (2.2%) | 8 (2.0%) |
| $15,000 to $17,499 | 26 (4.1%) | 38 (9.3%) |
| $17,500 to $19,999 | 6 (0.9%) | 7 (1.7%) |
| $20,000 to $22,499 | 28 (4.4%) | 5 (1.2%) |
| $22,500 to $24,999 | 11 (1.7%) | 66 (16.1%) |
| $25,000 to $29,999 | 24 (3.8%) | 30 (7.3%) |
| $30,000 to $34,999 | 42 (6.6%) | 27 (6.6%) |
| $35,000 to $39,999 | 14 (2.2%) | 19 (4.6%) |
| $40,000 to $44,999 | 27 (4.3%) | 19 (4.6%) |
| $45,000 to $49,999 | 10 (1.6%) | 3 (0.7%) |
| $50,000 to $54,999 | 54 (8.5%) | 15 (3.7%) |
| $55,000 to $64,999 | 36 (5.7%) | 35 (8.6%) |
| $65,000 to $74,999 | 75 (11.8%) | 29 (7.1%) |
| $75,000 to $99,999 | 50 (7.9%) | 12 (2.9%) |
| $100,000+ | 83 (13.1%) | 12 (2.9%) |
| Total | 634 (100.0%) | 409 (100.0%) |
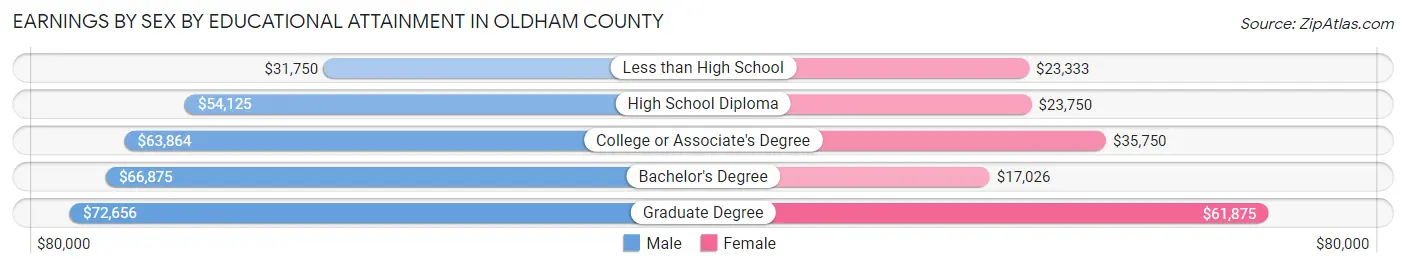
Earnings by Sex by Educational Attainment in Oldham County
Average earnings in Oldham County are $54,289 for men and $27,560 for women, a difference of 49.2%. Men with an educational attainment of graduate degree enjoy the highest average annual earnings of $72,656, while those with less than high school education earn the least with $31,750. Women with an educational attainment of graduate degree earn the most with the average annual earnings of $61,875, while those with bachelor's degree education have the smallest earnings of $17,026.
| Educational Attainment | Male Income | Female Income |
| Less than High School | $31,750 | $23,333 |
| High School Diploma | $54,125 | $23,750 |
| College or Associate's Degree | $63,864 | $35,750 |
| Bachelor's Degree | $66,875 | $17,026 |
| Graduate Degree | $72,656 | $61,875 |
| Total | $54,289 | $27,560 |
Family Income in Oldham County
Family Income Brackets in Oldham County
According to the Oldham County family income data, there are 118 families falling into the $50,000 to $74,999 income range, which is the most common income bracket and makes up 24.3% of all families. Conversely, the $15,000 to $24,999 income bracket is the least frequent group with only 9 families (1.9%) belonging to this category.
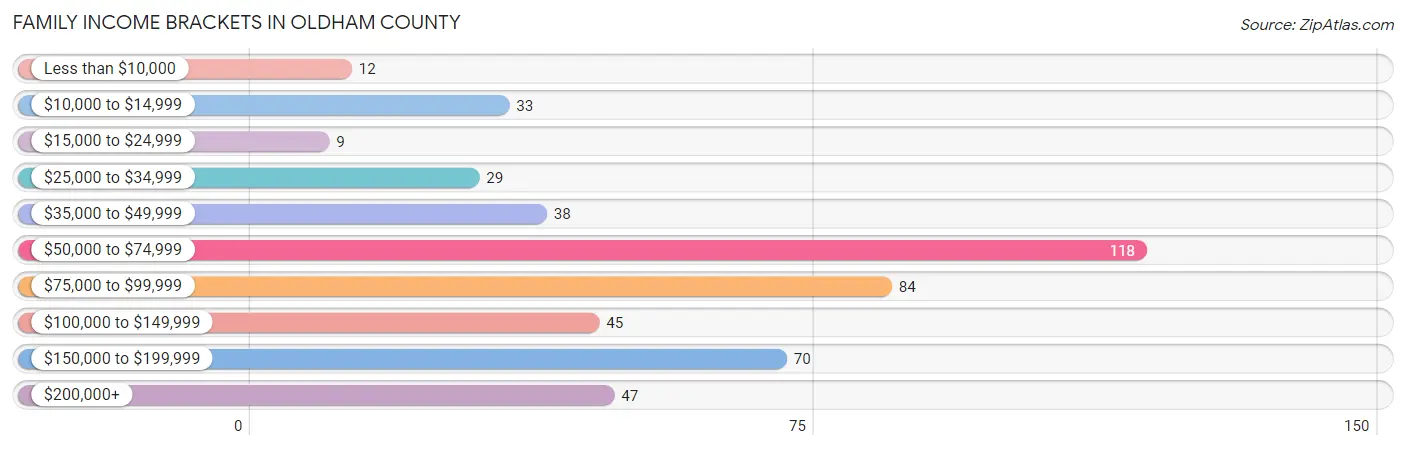
| Income Bracket | # Families | % Families |
| Less than $10,000 | 12 | 2.5% |
| $10,000 to $14,999 | 33 | 6.8% |
| $15,000 to $24,999 | 9 | 1.9% |
| $25,000 to $34,999 | 29 | 6.0% |
| $35,000 to $49,999 | 38 | 7.8% |
| $50,000 to $74,999 | 118 | 24.3% |
| $75,000 to $99,999 | 84 | 17.3% |
| $100,000 to $149,999 | 45 | 9.3% |
| $150,000 to $199,999 | 70 | 14.4% |
| $200,000+ | 47 | 9.7% |
Family Income by Famaliy Size in Oldham County
6-person families (51 | 10.5%) account for the highest median family income in Oldham County with $250,001 per family, while 6-person families (51 | 10.5%) have the highest median income of $41,667 per family member.
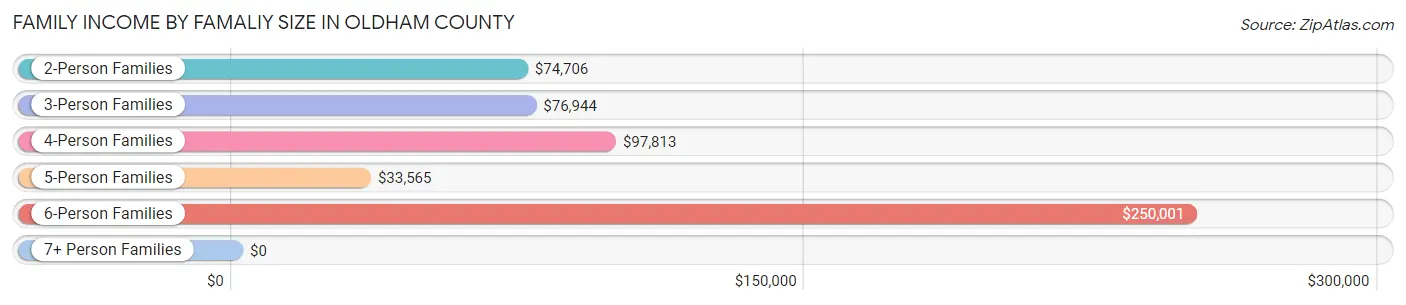
| Income Bracket | # Families | Median Income |
| 2-Person Families | 200 (41.2%) | $74,706 |
| 3-Person Families | 76 (15.7%) | $76,944 |
| 4-Person Families | 75 (15.5%) | $97,813 |
| 5-Person Families | 79 (16.3%) | $33,565 |
| 6-Person Families | 51 (10.5%) | $250,001 |
| 7+ Person Families | 4 (0.8%) | $0 |
| Total | 485 (100.0%) | $75,515 |
Family Income by Number of Earners in Oldham County
The median family income in Oldham County is $75,515, with families comprising 3+ earners (24) having the highest median family income of $166,250, while families with 1 earner (152) have the lowest median family income of $59,750, accounting for 5.0% and 31.3% of families, respectively.
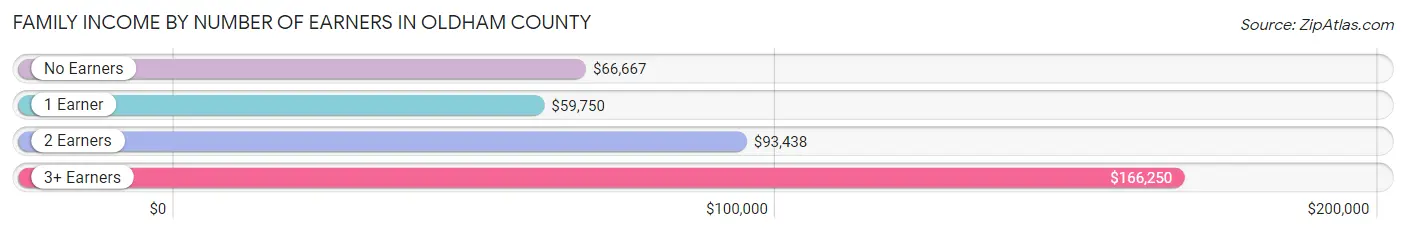
| Number of Earners | # Families | Median Income |
| No Earners | 48 (9.9%) | $66,667 |
| 1 Earner | 152 (31.3%) | $59,750 |
| 2 Earners | 261 (53.8%) | $93,438 |
| 3+ Earners | 24 (5.0%) | $166,250 |
| Total | 485 (100.0%) | $75,515 |
Household Income in Oldham County
Household Income Brackets in Oldham County
With 153 households falling in the category, the $50,000 to $74,999 income range is the most frequent in Oldham County, accounting for 24.2% of all households. In contrast, only 16 households (2.5%) fall into the $15,000 to $24,999 income bracket, making it the least populous group.
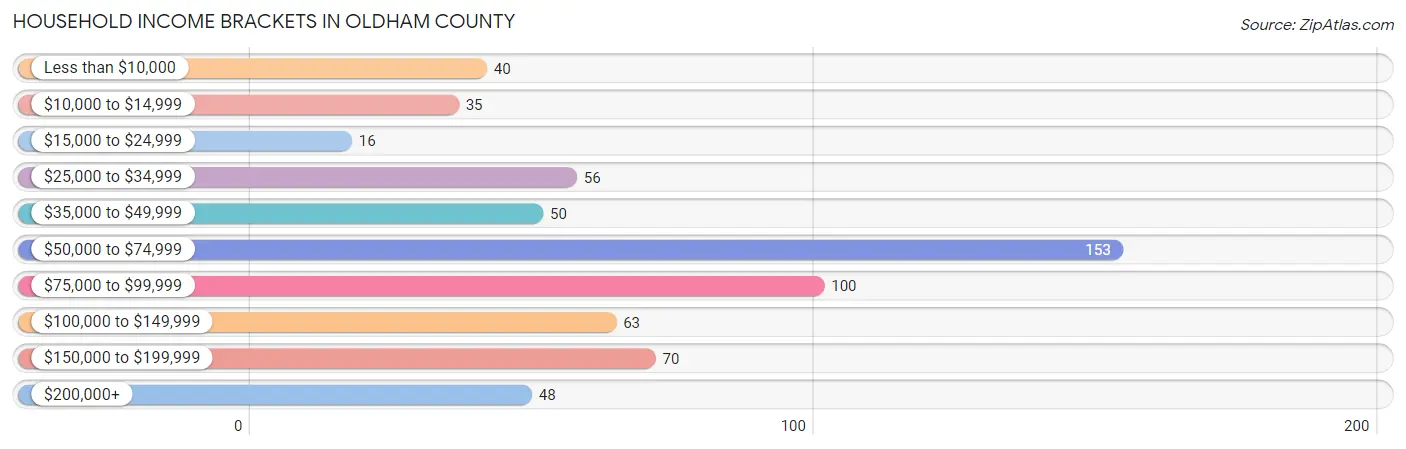
| Income Bracket | # Households | % Households |
| Less than $10,000 | 40 | 6.3% |
| $10,000 to $14,999 | 35 | 5.5% |
| $15,000 to $24,999 | 16 | 2.5% |
| $25,000 to $34,999 | 56 | 8.9% |
| $35,000 to $49,999 | 50 | 7.9% |
| $50,000 to $74,999 | 153 | 24.2% |
| $75,000 to $99,999 | 100 | 15.8% |
| $100,000 to $149,999 | 63 | 10.0% |
| $150,000 to $199,999 | 70 | 11.1% |
| $200,000+ | 48 | 7.6% |
Household Income by Householder Age in Oldham County
The median household income in Oldham County is $71,103, with the highest median household income of $82,083 found in the 45 to 64 years age bracket for the primary householder. A total of 241 households (38.2%) fall into this category. Meanwhile, the 65+ years age bracket for the primary householder has the lowest median household income of $42,500, with 154 households (24.4%) in this group.
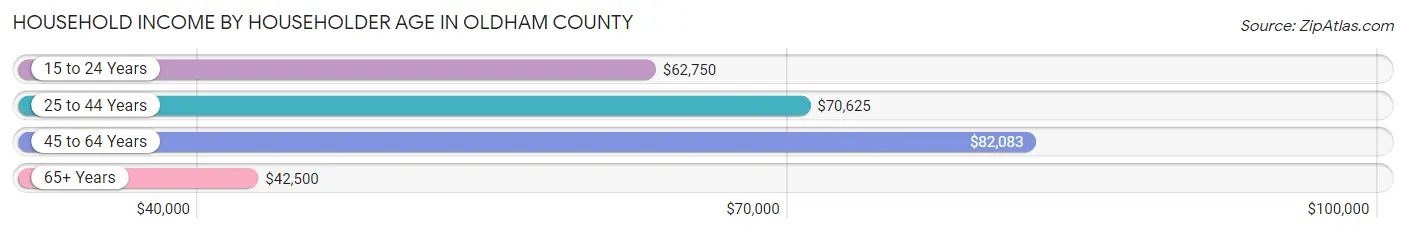
| Income Bracket | # Households | Median Income |
| 15 to 24 Years | 9 (1.4%) | $62,750 |
| 25 to 44 Years | 227 (36.0%) | $70,625 |
| 45 to 64 Years | 241 (38.2%) | $82,083 |
| 65+ Years | 154 (24.4%) | $42,500 |
| Total | 631 (100.0%) | $71,103 |
Poverty in Oldham County
Income Below Poverty by Sex and Age in Oldham County
With 13.8% poverty level for males and 20.9% for females among the residents of Oldham County, 5 year old males and 35 to 44 year old females are the most vulnerable to poverty, with 8 males (57.1%) and 65 females (40.9%) in their respective age groups living below the poverty level.
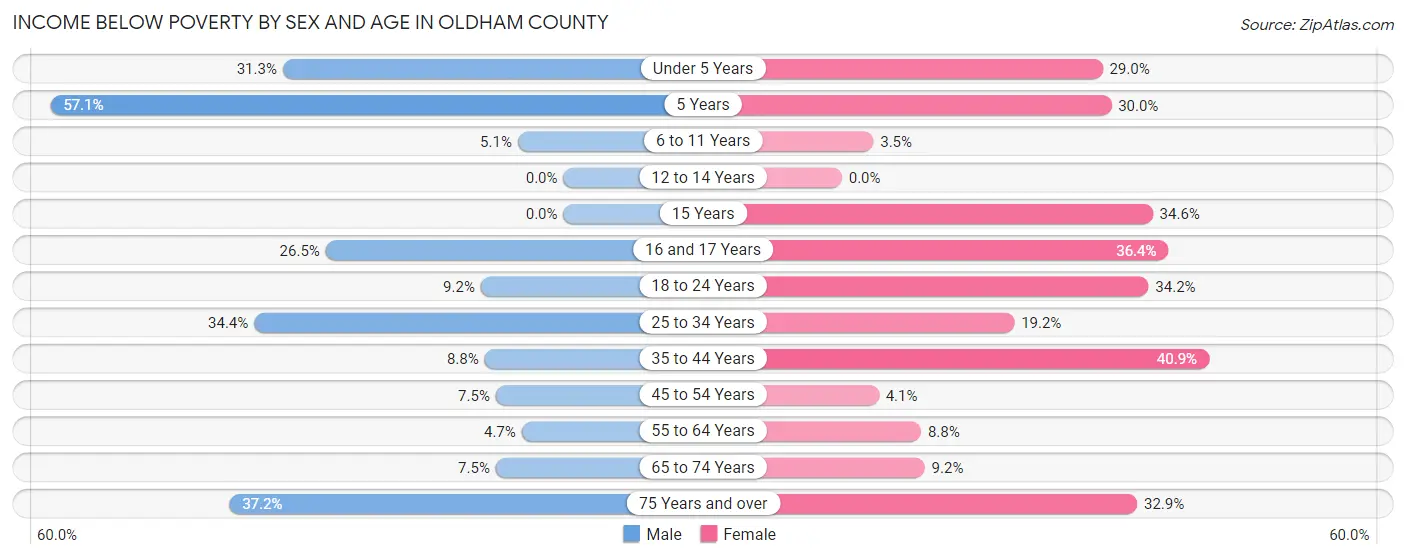
| Age Bracket | Male | Female |
| Under 5 Years | 20 (31.2%) | 18 (29.0%) |
| 5 Years | 8 (57.1%) | 3 (30.0%) |
| 6 to 11 Years | 3 (5.1%) | 2 (3.5%) |
| 12 to 14 Years | 0 (0.0%) | 0 (0.0%) |
| 15 Years | 0 (0.0%) | 9 (34.6%) |
| 16 and 17 Years | 9 (26.5%) | 8 (36.4%) |
| 18 to 24 Years | 8 (9.2%) | 14 (34.2%) |
| 25 to 34 Years | 31 (34.4%) | 24 (19.2%) |
| 35 to 44 Years | 18 (8.8%) | 65 (40.9%) |
| 45 to 54 Years | 7 (7.5%) | 6 (4.1%) |
| 55 to 64 Years | 6 (4.6%) | 6 (8.8%) |
| 65 to 74 Years | 7 (7.5%) | 6 (9.2%) |
| 75 Years and over | 16 (37.2%) | 24 (32.9%) |
| Total | 133 (13.8%) | 185 (20.9%) |
Income Above Poverty by Sex and Age in Oldham County
According to the poverty statistics in Oldham County, males aged 12 to 14 years and females aged 12 to 14 years are the age groups that are most secure financially, with 100.0% of males and 100.0% of females in these age groups living above the poverty line.
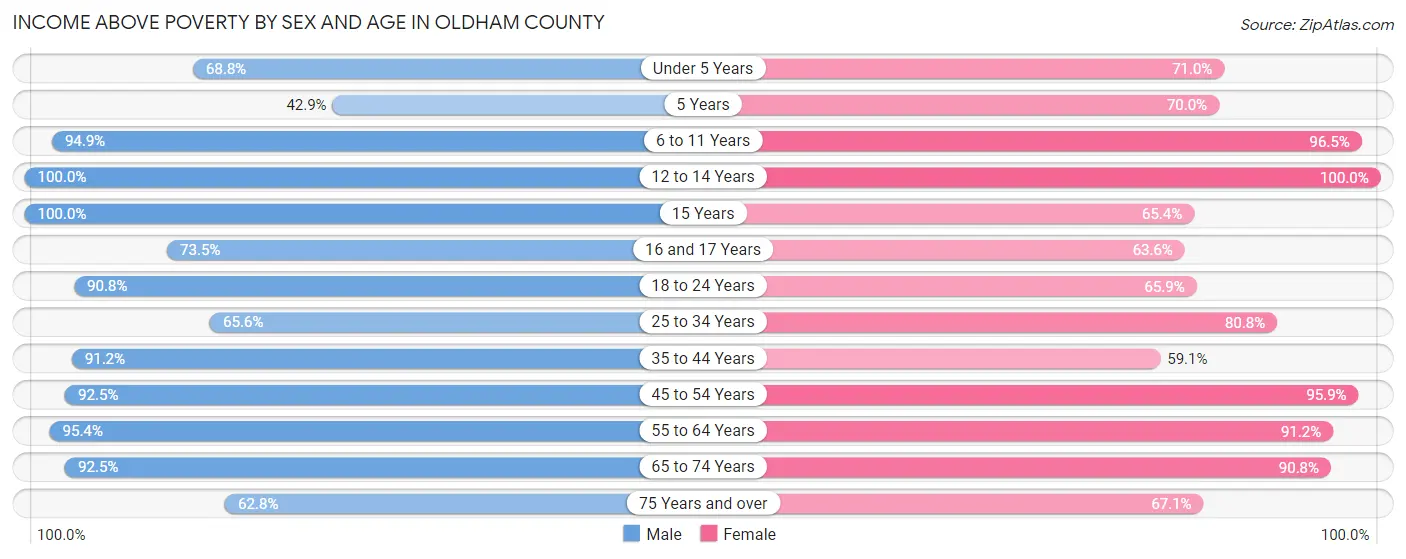
| Age Bracket | Male | Female |
| Under 5 Years | 44 (68.8%) | 44 (71.0%) |
| 5 Years | 6 (42.9%) | 7 (70.0%) |
| 6 to 11 Years | 56 (94.9%) | 55 (96.5%) |
| 12 to 14 Years | 47 (100.0%) | 33 (100.0%) |
| 15 Years | 7 (100.0%) | 17 (65.4%) |
| 16 and 17 Years | 25 (73.5%) | 14 (63.6%) |
| 18 to 24 Years | 79 (90.8%) | 27 (65.8%) |
| 25 to 34 Years | 59 (65.6%) | 101 (80.8%) |
| 35 to 44 Years | 187 (91.2%) | 94 (59.1%) |
| 45 to 54 Years | 86 (92.5%) | 140 (95.9%) |
| 55 to 64 Years | 123 (95.4%) | 62 (91.2%) |
| 65 to 74 Years | 86 (92.5%) | 59 (90.8%) |
| 75 Years and over | 27 (62.8%) | 49 (67.1%) |
| Total | 832 (86.2%) | 702 (79.1%) |
Income Below Poverty Among Married-Couple Families in Oldham County
The poverty statistics for married-couple families in Oldham County show that 16.7% or 70 of the total 419 families live below the poverty line. Families with 3 or 4 children have the highest poverty rate of 48.2%, comprising of 55 families. On the other hand, families with no children have the lowest poverty rate of 4.2%, which includes 8 families.
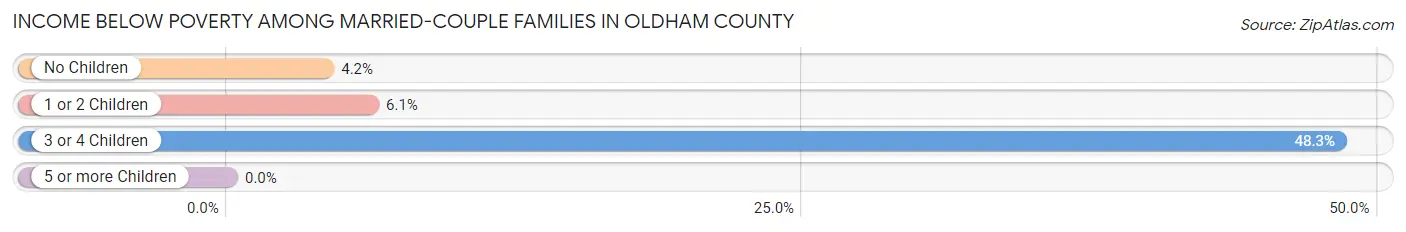
| Children | Above Poverty | Below Poverty |
| No Children | 183 (95.8%) | 8 (4.2%) |
| 1 or 2 Children | 107 (93.9%) | 7 (6.1%) |
| 3 or 4 Children | 59 (51.7%) | 55 (48.2%) |
| 5 or more Children | 0 (0.0%) | 0 (0.0%) |
| Total | 349 (83.3%) | 70 (16.7%) |
Income Below Poverty Among Single-Parent Households in Oldham County
According to the poverty data in Oldham County, 15.8% or 3 single-father households and 6.4% or 3 single-mother households are living below the poverty line. Among single-father households, those with 1 or 2 children have the highest poverty rate, with 3 households (60.0%) experiencing poverty. Likewise, among single-mother households, those with 1 or 2 children have the highest poverty rate, with 2 households (20.0%) falling below the poverty line.
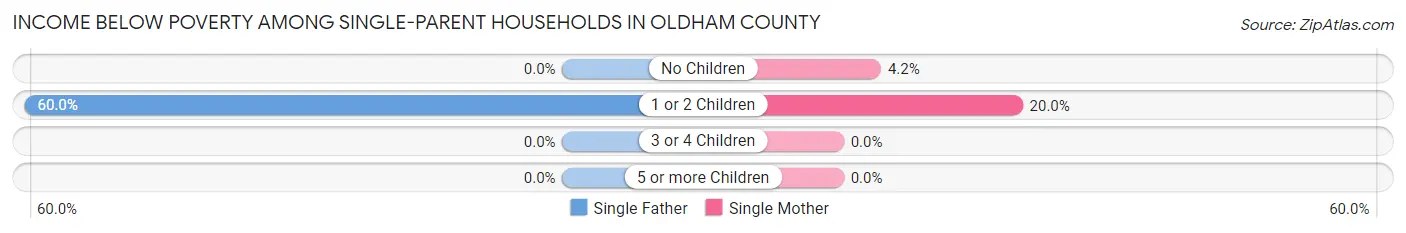
| Children | Single Father | Single Mother |
| No Children | 0 (0.0%) | 1 (4.2%) |
| 1 or 2 Children | 3 (60.0%) | 2 (20.0%) |
| 3 or 4 Children | 0 (0.0%) | 0 (0.0%) |
| 5 or more Children | 0 (0.0%) | 0 (0.0%) |
| Total | 3 (15.8%) | 3 (6.4%) |
Income Below Poverty Among Married-Couple vs Single-Parent Households in Oldham County
The poverty data for Oldham County shows that 70 of the married-couple family households (16.7%) and 6 of the single-parent households (9.1%) are living below the poverty level. Within the married-couple family households, those with 3 or 4 children have the highest poverty rate, with 55 households (48.2%) falling below the poverty line. Among the single-parent households, those with 1 or 2 children have the highest poverty rate, with 5 household (33.3%) living below poverty.
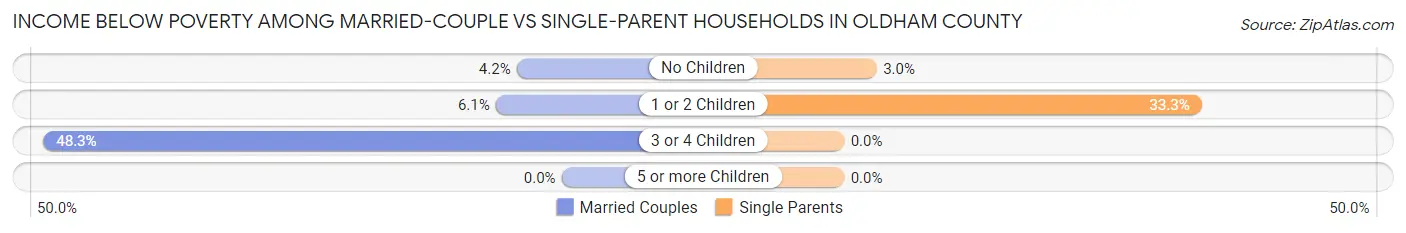
| Children | Married-Couple Families | Single-Parent Households |
| No Children | 8 (4.2%) | 1 (3.0%) |
| 1 or 2 Children | 7 (6.1%) | 5 (33.3%) |
| 3 or 4 Children | 55 (48.2%) | 0 (0.0%) |
| 5 or more Children | 0 (0.0%) | 0 (0.0%) |
| Total | 70 (16.7%) | 6 (9.1%) |
Race in Oldham County
The most populous races in Oldham County are White / Caucasian (1,763 | 81.2%), Hispanic or Latino (568 | 26.2%), and Two or more Races (201 | 9.3%).
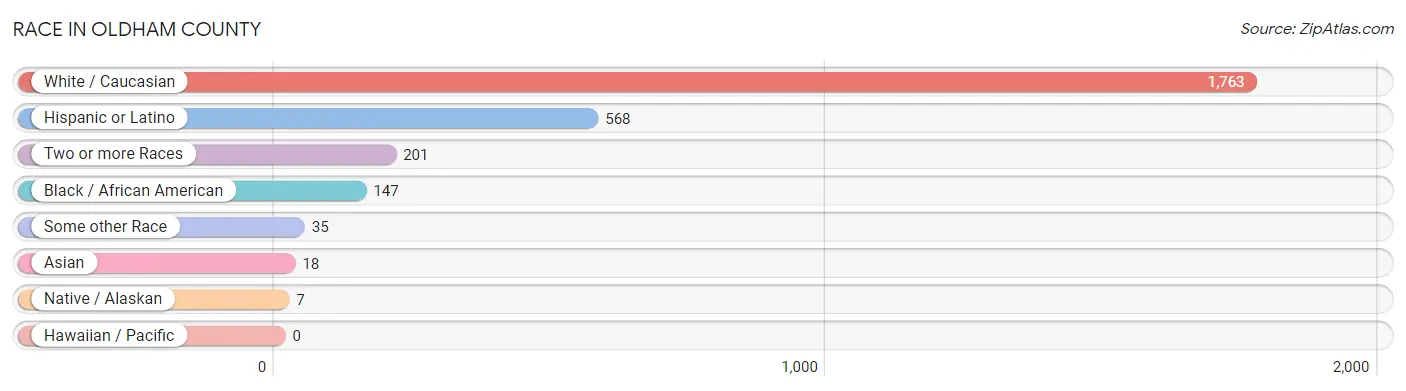
| Race | # Population | % Population |
| Asian | 18 | 0.8% |
| Black / African American | 147 | 6.8% |
| Hawaiian / Pacific | 0 | 0.0% |
| Hispanic or Latino | 568 | 26.2% |
| Native / Alaskan | 7 | 0.3% |
| White / Caucasian | 1,763 | 81.2% |
| Two or more Races | 201 | 9.3% |
| Some other Race | 35 | 1.6% |
| Total | 2,171 | 100.0% |
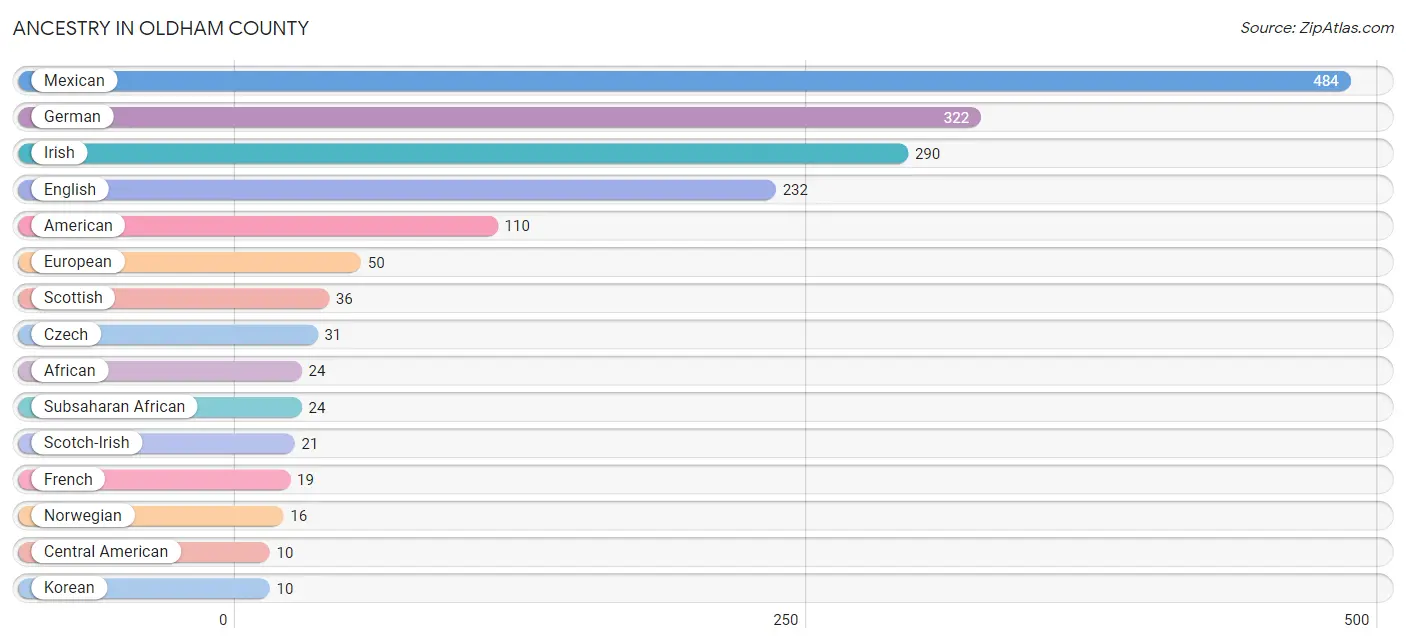
Ancestry in Oldham County
The most populous ancestries reported in Oldham County are Mexican (484 | 22.3%), German (322 | 14.8%), Irish (290 | 13.4%), English (232 | 10.7%), and American (110 | 5.1%), together accounting for 66.2% of all Oldham County residents.
| Ancestry | # Population | % Population |
| African | 24 | 1.1% |
| American | 110 | 5.1% |
| British | 4 | 0.2% |
| Celtic | 1 | 0.1% |
| Central American | 10 | 0.5% |
| Cherokee | 4 | 0.2% |
| Choctaw | 1 | 0.1% |
| Czech | 31 | 1.4% |
| Czechoslovakian | 8 | 0.4% |
| Dutch | 1 | 0.1% |
| Dutch West Indian | 5 | 0.2% |
| English | 232 | 10.7% |
| European | 50 | 2.3% |
| French | 19 | 0.9% |
| German | 322 | 14.8% |
| Haitian | 5 | 0.2% |
| Honduran | 5 | 0.2% |
| Indian (Asian) | 4 | 0.2% |
| Irish | 290 | 13.4% |
| Italian | 5 | 0.2% |
| Korean | 10 | 0.5% |
| Lithuanian | 2 | 0.1% |
| Mexican | 484 | 22.3% |
| Norwegian | 16 | 0.7% |
| Polish | 6 | 0.3% |
| Portuguese | 2 | 0.1% |
| Salvadoran | 5 | 0.2% |
| Scandinavian | 5 | 0.2% |
| Scotch-Irish | 21 | 1.0% |
| Scottish | 36 | 1.7% |
| Spaniard | 1 | 0.1% |
| Spanish | 3 | 0.1% |
| Sri Lankan | 4 | 0.2% |
| Subsaharan African | 24 | 1.1% |
| Swedish | 1 | 0.1% |
| Swiss | 10 | 0.5% |
| Ukrainian | 5 | 0.2% |
| Welsh | 4 | 0.2% | View All 38 Rows |
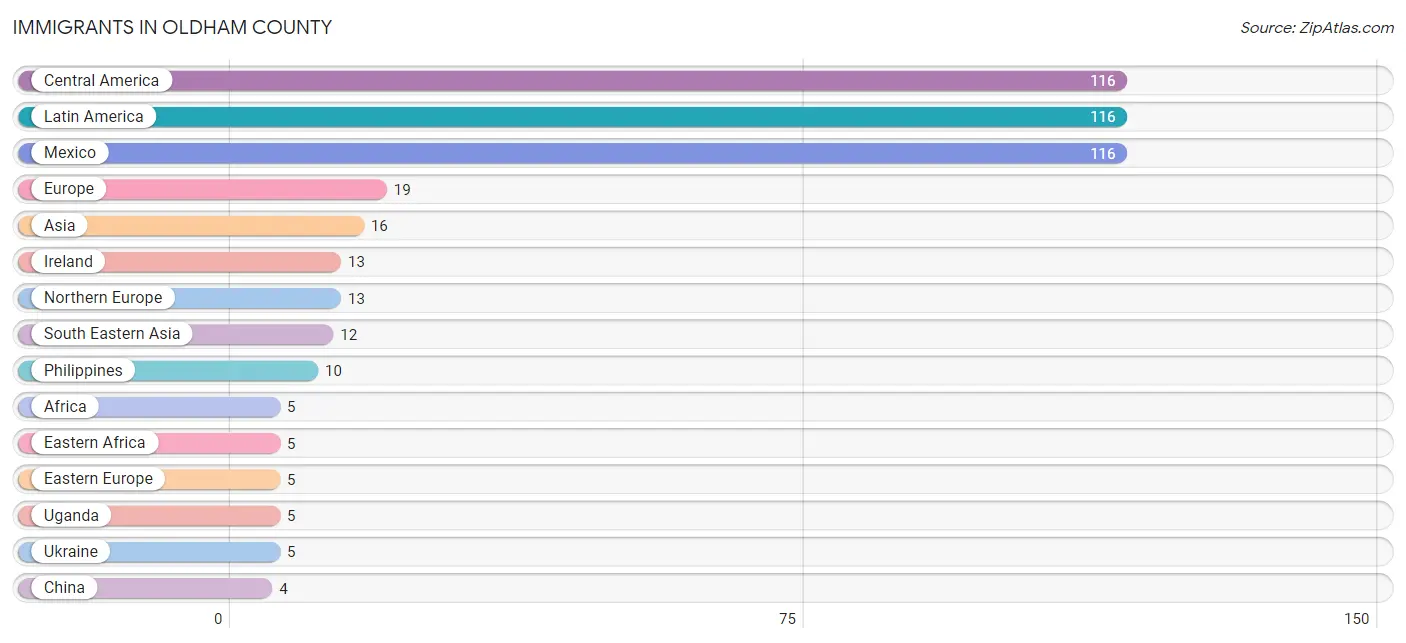
Immigrants in Oldham County
The most numerous immigrant groups reported in Oldham County came from Central America (116 | 5.3%), Latin America (116 | 5.3%), Mexico (116 | 5.3%), Europe (19 | 0.9%), and Asia (16 | 0.7%), together accounting for 17.6% of all Oldham County residents.
| Immigration Origin | # Population | % Population |
| Africa | 5 | 0.2% |
| Asia | 16 | 0.7% |
| Central America | 116 | 5.3% |
| China | 4 | 0.2% |
| Eastern Africa | 5 | 0.2% |
| Eastern Asia | 4 | 0.2% |
| Eastern Europe | 5 | 0.2% |
| Europe | 19 | 0.9% |
| Ireland | 13 | 0.6% |
| Latin America | 116 | 5.3% |
| Mexico | 116 | 5.3% |
| Northern Europe | 13 | 0.6% |
| Philippines | 10 | 0.5% |
| South Eastern Asia | 12 | 0.5% |
| Southern Europe | 1 | 0.1% |
| Spain | 1 | 0.1% |
| Uganda | 5 | 0.2% |
| Ukraine | 5 | 0.2% |
| Vietnam | 2 | 0.1% | View All 19 Rows |
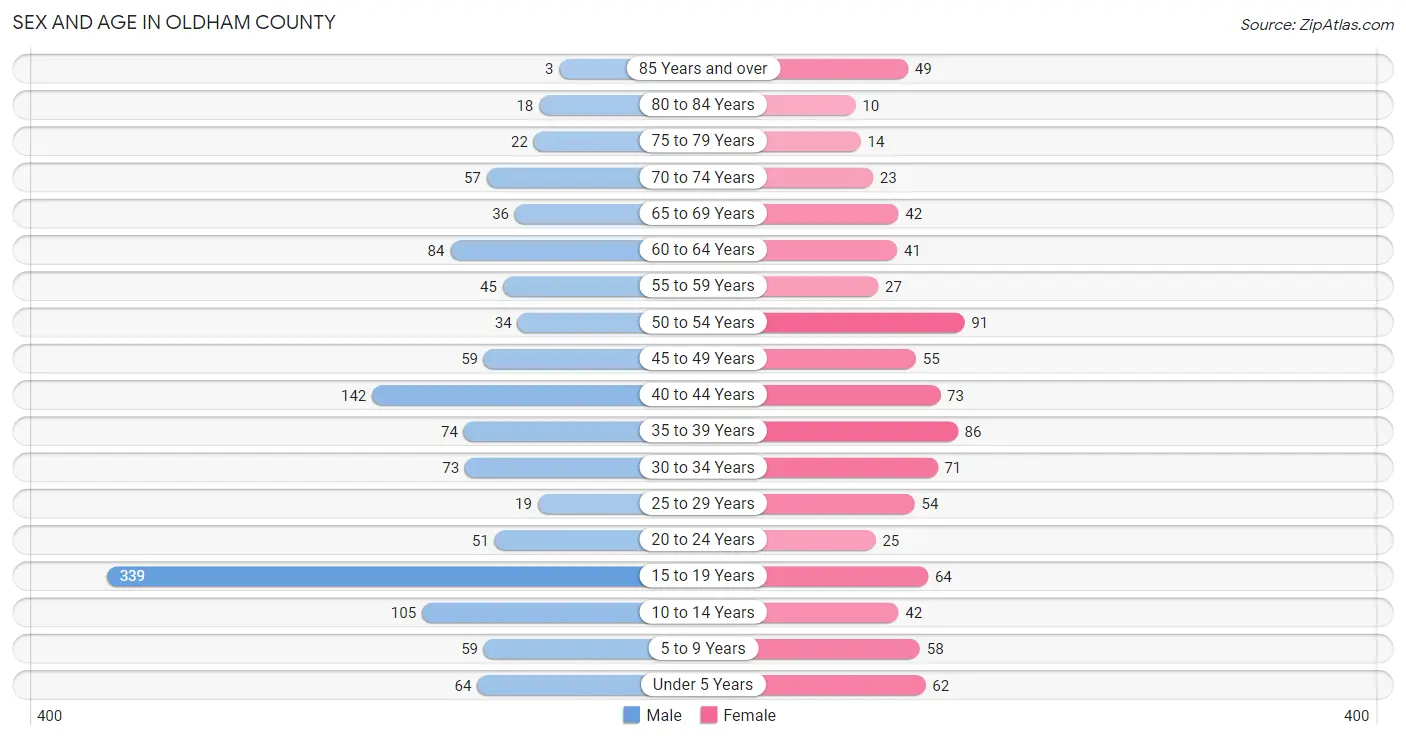
Sex and Age in Oldham County
Sex and Age in Oldham County
The most populous age groups in Oldham County are 15 to 19 Years (339 | 26.4%) for men and 50 to 54 Years (91 | 10.3%) for women.
| Age Bracket | Male | Female |
| Under 5 Years | 64 (5.0%) | 62 (7.0%) |
| 5 to 9 Years | 59 (4.6%) | 58 (6.5%) |
| 10 to 14 Years | 105 (8.2%) | 42 (4.7%) |
| 15 to 19 Years | 339 (26.4%) | 64 (7.2%) |
| 20 to 24 Years | 51 (4.0%) | 25 (2.8%) |
| 25 to 29 Years | 19 (1.5%) | 54 (6.1%) |
| 30 to 34 Years | 73 (5.7%) | 71 (8.0%) |
| 35 to 39 Years | 74 (5.8%) | 86 (9.7%) |
| 40 to 44 Years | 142 (11.1%) | 73 (8.2%) |
| 45 to 49 Years | 59 (4.6%) | 55 (6.2%) |
| 50 to 54 Years | 34 (2.6%) | 91 (10.3%) |
| 55 to 59 Years | 45 (3.5%) | 27 (3.0%) |
| 60 to 64 Years | 84 (6.5%) | 41 (4.6%) |
| 65 to 69 Years | 36 (2.8%) | 42 (4.7%) |
| 70 to 74 Years | 57 (4.4%) | 23 (2.6%) |
| 75 to 79 Years | 22 (1.7%) | 14 (1.6%) |
| 80 to 84 Years | 18 (1.4%) | 10 (1.1%) |
| 85 Years and over | 3 (0.2%) | 49 (5.5%) |
| Total | 1,284 (100.0%) | 887 (100.0%) |
Families and Households in Oldham County
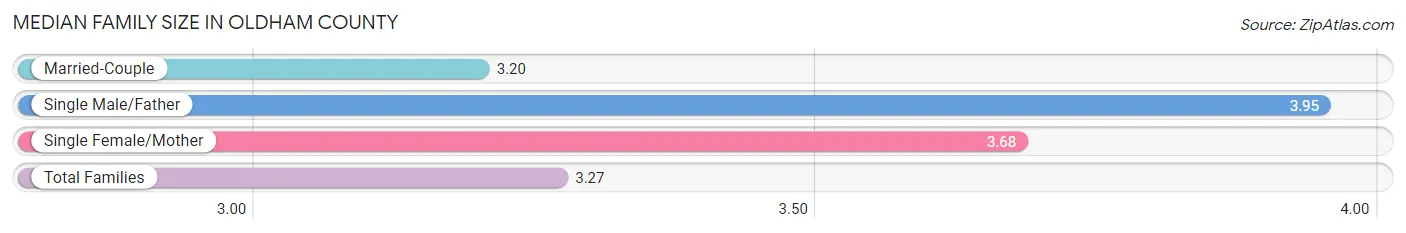
Median Family Size in Oldham County
The median family size in Oldham County is 3.27 persons per family, with single male/father families (19 | 3.9%) accounting for the largest median family size of 3.95 persons per family. On the other hand, married-couple families (419 | 86.4%) represent the smallest median family size with 3.20 persons per family.
| Family Type | # Families | Family Size |
| Married-Couple | 419 (86.4%) | 3.20 |
| Single Male/Father | 19 (3.9%) | 3.95 |
| Single Female/Mother | 47 (9.7%) | 3.68 |
| Total Families | 485 (100.0%) | 3.27 |
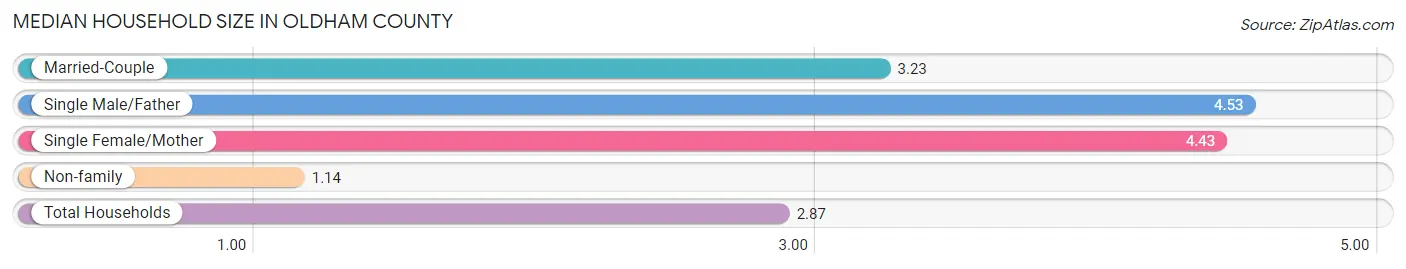
Median Household Size in Oldham County
The median household size in Oldham County is 2.87 persons per household, with single male/father households (19 | 3.0%) accounting for the largest median household size of 4.53 persons per household. non-family households (146 | 23.1%) represent the smallest median household size with 1.14 persons per household.
| Household Type | # Households | Household Size |
| Married-Couple | 419 (66.4%) | 3.23 |
| Single Male/Father | 19 (3.0%) | 4.53 |
| Single Female/Mother | 47 (7.4%) | 4.43 |
| Non-family | 146 (23.1%) | 1.14 |
| Total Households | 631 (100.0%) | 2.87 |
Household Size by Marriage Status in Oldham County
Out of a total of 631 households in Oldham County, 485 (76.9%) are family households, while 146 (23.1%) are nonfamily households. The most numerous type of family households are 2-person households, comprising 195, and the most common type of nonfamily households are 1-person households, comprising 129.
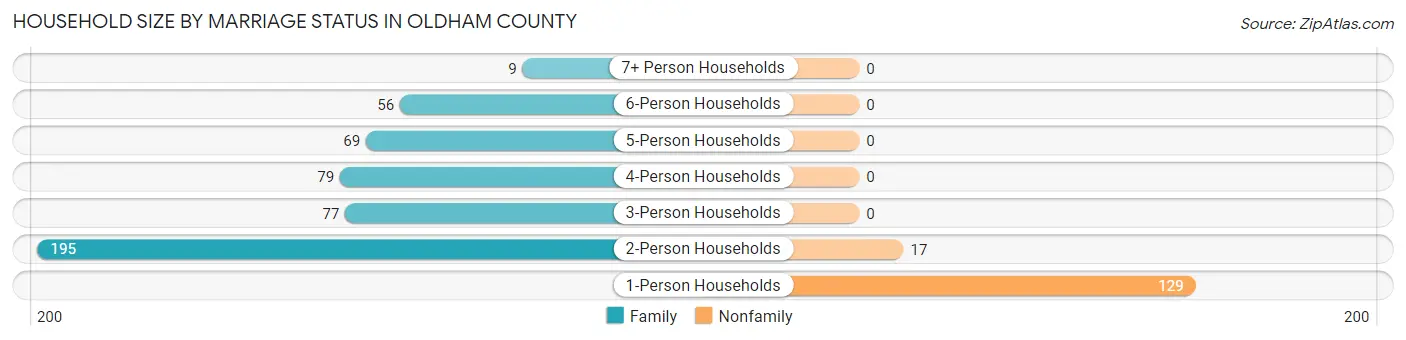
| Household Size | Family Households | Nonfamily Households |
| 1-Person Households | - | 129 (20.4%) |
| 2-Person Households | 195 (30.9%) | 17 (2.7%) |
| 3-Person Households | 77 (12.2%) | 0 (0.0%) |
| 4-Person Households | 79 (12.5%) | 0 (0.0%) |
| 5-Person Households | 69 (10.9%) | 0 (0.0%) |
| 6-Person Households | 56 (8.9%) | 0 (0.0%) |
| 7+ Person Households | 9 (1.4%) | 0 (0.0%) |
| Total | 485 (76.9%) | 146 (23.1%) |
Female Fertility in Oldham County
Fertility by Age in Oldham County
Average fertility rate in Oldham County is 64.0 births per 1,000 women. Women in the age bracket of 20 to 34 years have the highest fertility rate with 80.0 births per 1,000 women. Women in the age bracket of 35 to 50 years acount for 57.1% of all women with births.
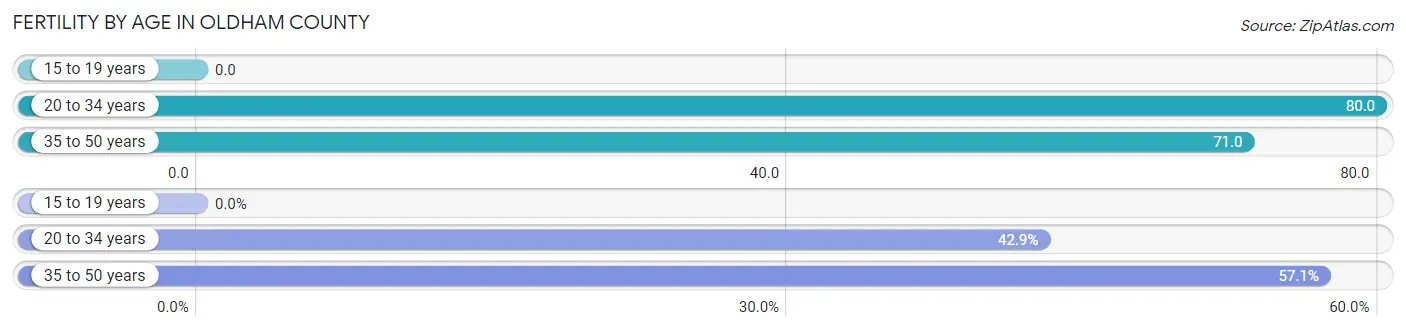
| Age Bracket | Women with Births | Births / 1,000 Women |
| 15 to 19 years | 0 (0.0%) | 0.0 |
| 20 to 34 years | 12 (42.9%) | 80.0 |
| 35 to 50 years | 16 (57.1%) | 71.0 |
| Total | 28 (100.0%) | 64.0 |
Fertility by Age by Marriage Status in Oldham County
46.4% of women with births (28) in Oldham County are married. The highest percentage of unmarried women with births falls into 35 to 50 years age bracket with 68.8% of them unmarried at the time of birth, while the lowest percentage of unmarried women with births belong to 20 to 34 years age bracket with 33.3% of them unmarried.
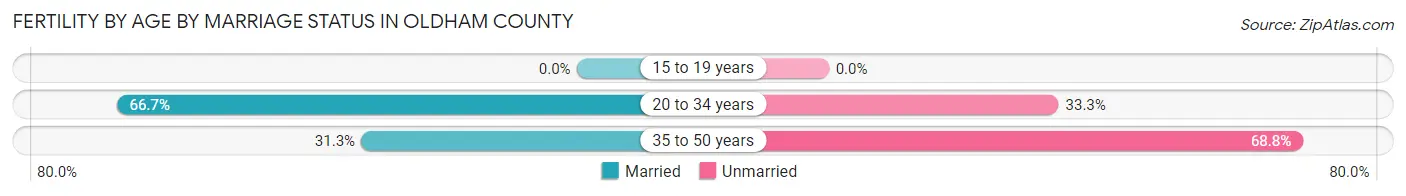
| Age Bracket | Married | Unmarried |
| 15 to 19 years | 0 (0.0%) | 0 (0.0%) |
| 20 to 34 years | 8 (66.7%) | 4 (33.3%) |
| 35 to 50 years | 5 (31.2%) | 11 (68.8%) |
| Total | 13 (46.4%) | 15 (53.6%) |
Fertility by Education in Oldham County
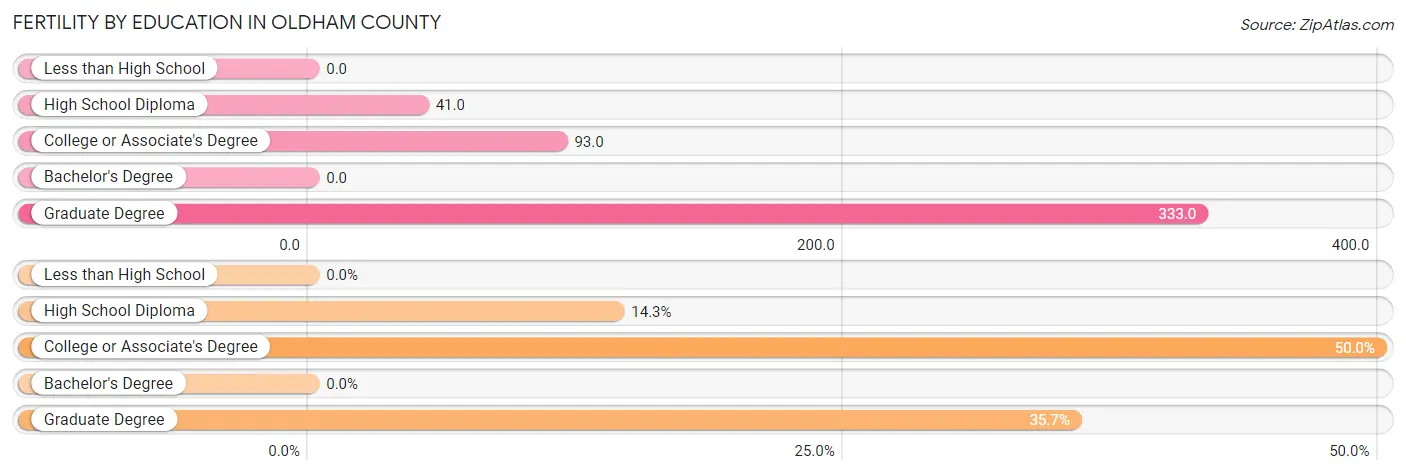
| Educational Attainment | Women with Births | Births / 1,000 Women |
| Less than High School | 0 (0.0%) | 0.0 |
| High School Diploma | 4 (14.3%) | 41.0 |
| College or Associate's Degree | 14 (50.0%) | 93.0 |
| Bachelor's Degree | 0 (0.0%) | 0.0 |
| Graduate Degree | 10 (35.7%) | 333.0 |
| Total | 28 (100.0%) | 64.0 |
Fertility by Education by Marriage Status in Oldham County
53.6% of women with births in Oldham County are unmarried. Women with the educational attainment of graduate degree are most likely to be married with 100.0% of them married at childbirth, while women with the educational attainment of high school diploma are least likely to be married with 100.0% of them unmarried at childbirth.
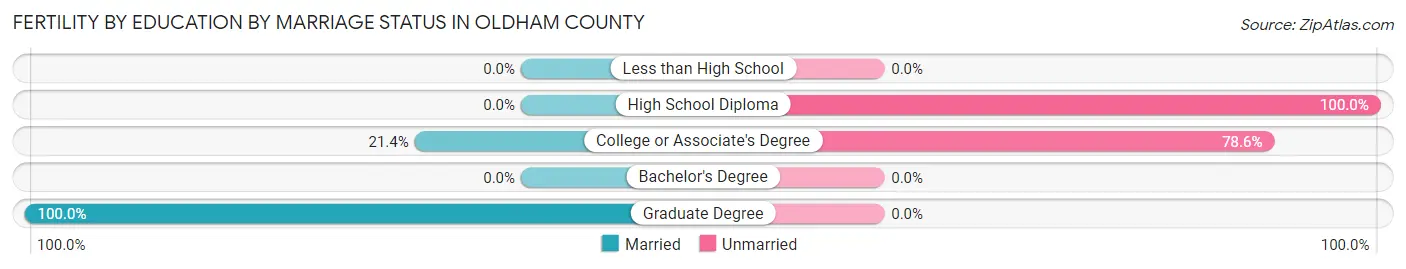
| Educational Attainment | Married | Unmarried |
| Less than High School | 0 (0.0%) | 0 (0.0%) |
| High School Diploma | 0 (0.0%) | 4 (100.0%) |
| College or Associate's Degree | 3 (21.4%) | 11 (78.6%) |
| Bachelor's Degree | 0 (0.0%) | 0 (0.0%) |
| Graduate Degree | 10 (100.0%) | 0 (0.0%) |
| Total | 13 (46.4%) | 15 (53.6%) |
Employment Characteristics in Oldham County
Employment by Class of Employer in Oldham County
Among the 874 employed individuals in Oldham County, private company employees (510 | 58.4%), local government employees (104 | 11.9%), and not-for-profit organizations (90 | 10.3%) make up the most common classes of employment.
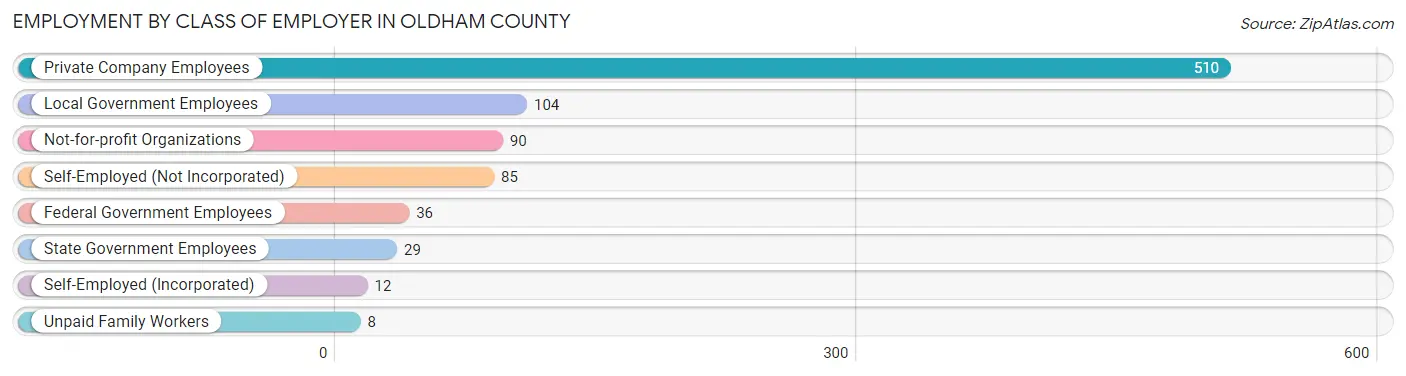
| Employer Class | # Employees | % Employees |
| Private Company Employees | 510 | 58.4% |
| Self-Employed (Incorporated) | 12 | 1.4% |
| Self-Employed (Not Incorporated) | 85 | 9.7% |
| Not-for-profit Organizations | 90 | 10.3% |
| Local Government Employees | 104 | 11.9% |
| State Government Employees | 29 | 3.3% |
| Federal Government Employees | 36 | 4.1% |
| Unpaid Family Workers | 8 | 0.9% |
| Total | 874 | 100.0% |
Employment Status by Age in Oldham County
According to the labor force statistics for Oldham County, out of the total population over 16 years of age (1,640), 54.6% or 895 individuals are in the labor force, with 1.5% or 13 of them unemployed. The age group with the highest labor force participation rate is 55 to 59 years, with 94.4% or 68 individuals in the labor force. Within the labor force, the 25 to 29 years age range has the highest percentage of unemployed individuals, with 30.0% or 9 of them being unemployed.
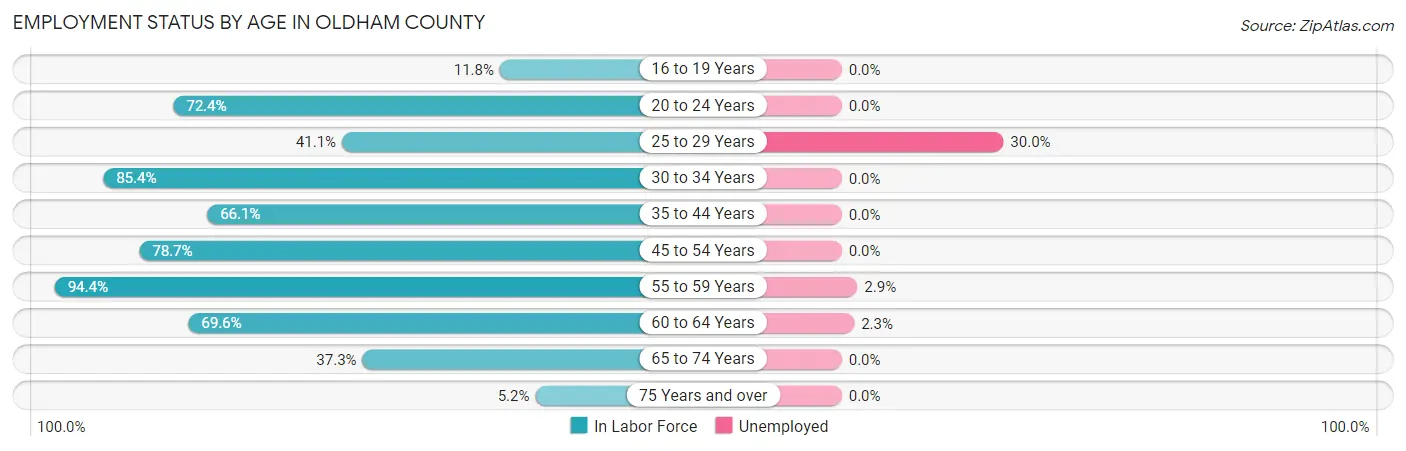
| Age Bracket | In Labor Force | Unemployed |
| 16 to 19 Years | 31 (11.8%) | 0 (0.0%) |
| 20 to 24 Years | 55 (72.4%) | 0 (0.0%) |
| 25 to 29 Years | 30 (41.1%) | 9 (30.0%) |
| 30 to 34 Years | 123 (85.4%) | 0 (0.0%) |
| 35 to 44 Years | 248 (66.1%) | 0 (0.0%) |
| 45 to 54 Years | 188 (78.7%) | 0 (0.0%) |
| 55 to 59 Years | 68 (94.4%) | 2 (2.9%) |
| 60 to 64 Years | 87 (69.6%) | 2 (2.3%) |
| 65 to 74 Years | 59 (37.3%) | 0 (0.0%) |
| 75 Years and over | 6 (5.2%) | 0 (0.0%) |
| Total | 895 (54.6%) | 13 (1.5%) |
Employment Status by Educational Attainment in Oldham County
According to labor force statistics for Oldham County, 72.4% of individuals (744) out of the total population between 25 and 64 years of age (1,028) are in the labor force, with 1.7% or 13 of them being unemployed. The group with the highest labor force participation rate are those with the educational attainment of college / associate degree, with 82.5% or 298 individuals in the labor force. Within the labor force, individuals with less than high school education have the highest percentage of unemployment, with 11.7% or 9 of them being unemployed.
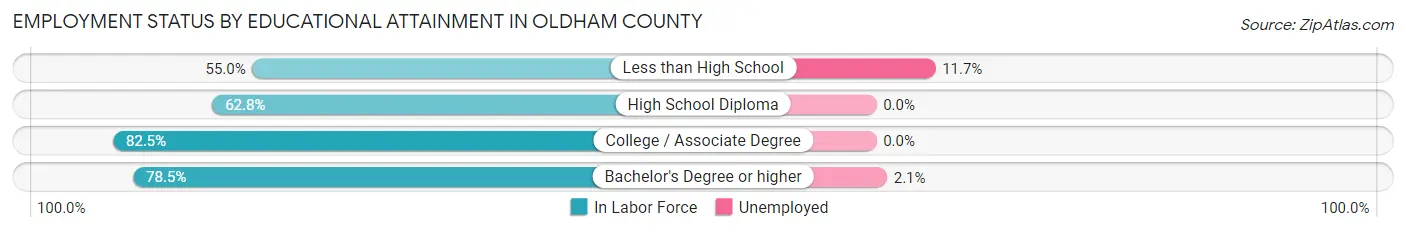
| Educational Attainment | In Labor Force | Unemployed |
| Less than High School | 77 (55.0%) | 16 (11.7%) |
| High School Diploma | 179 (62.8%) | 0 (0.0%) |
| College / Associate Degree | 298 (82.5%) | 0 (0.0%) |
| Bachelor's Degree or higher | 190 (78.5%) | 5 (2.1%) |
| Total | 744 (72.4%) | 17 (1.7%) |
Employment Occupations by Sex in Oldham County
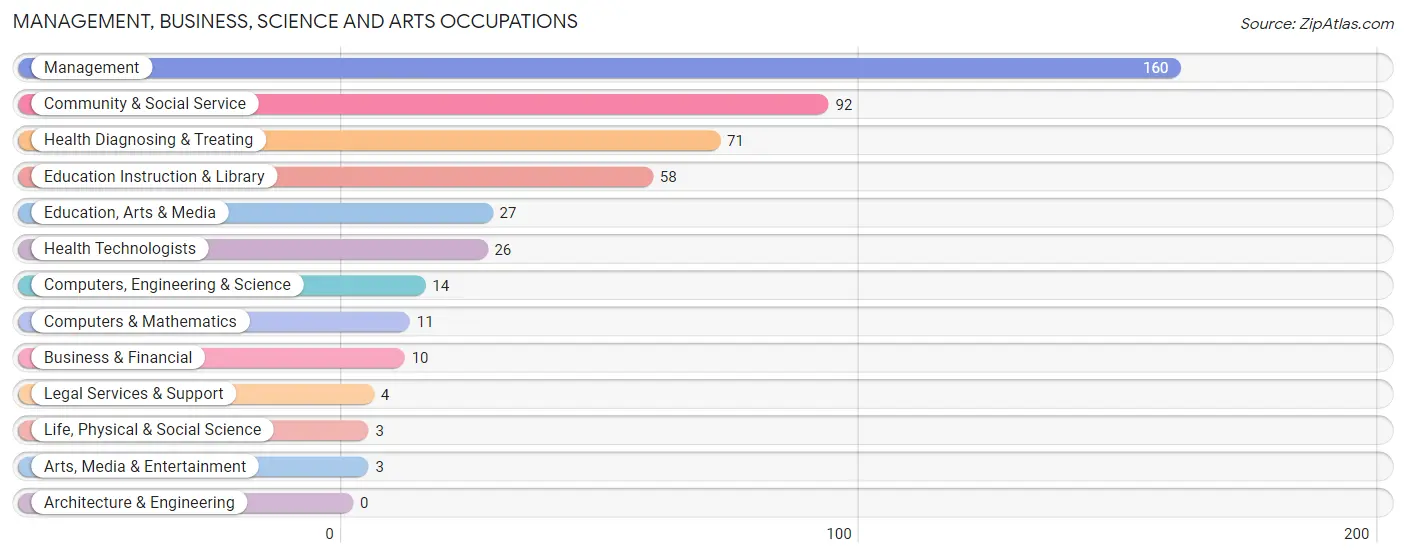
Management, Business, Science and Arts Occupations
The most common Management, Business, Science and Arts occupations in Oldham County are Management (160 | 18.1%), Community & Social Service (92 | 10.4%), Health Diagnosing & Treating (71 | 8.1%), Education Instruction & Library (58 | 6.6%), and Education, Arts & Media (27 | 3.1%).
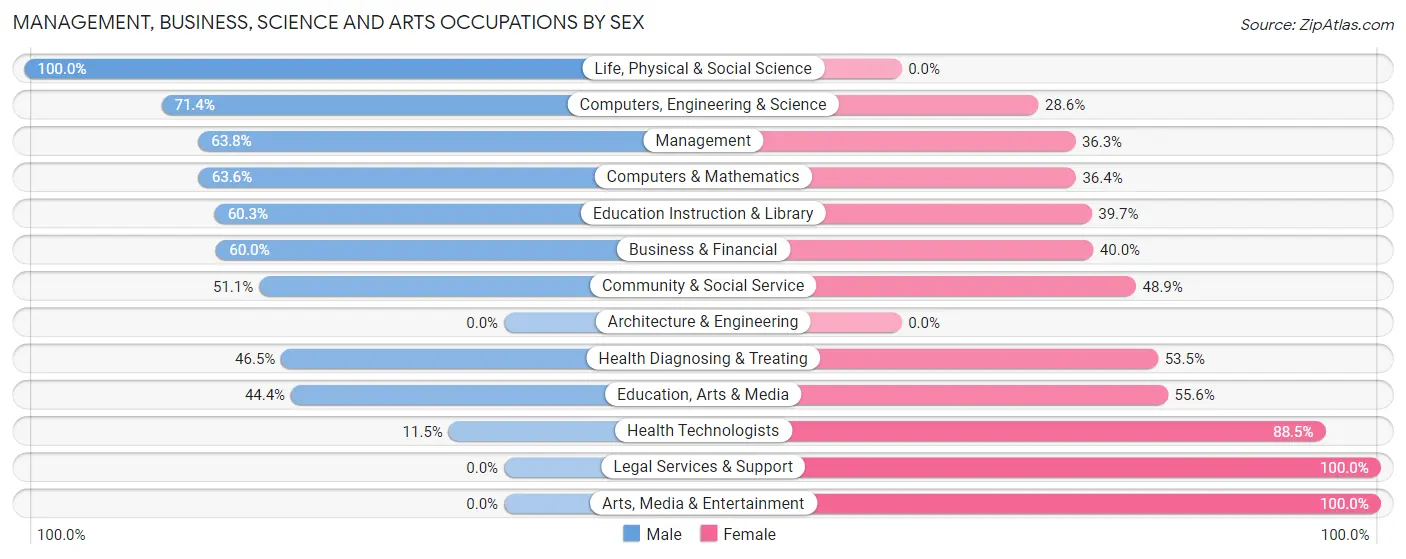
Management, Business, Science and Arts Occupations by Sex
Within the Management, Business, Science and Arts occupations in Oldham County, the most male-oriented occupations are Life, Physical & Social Science (100.0%), Computers, Engineering & Science (71.4%), and Management (63.7%), while the most female-oriented occupations are Legal Services & Support (100.0%), Arts, Media & Entertainment (100.0%), and Health Technologists (88.5%).
| Occupation | Male | Female |
| Management | 102 (63.7%) | 58 (36.2%) |
| Business & Financial | 6 (60.0%) | 4 (40.0%) |
| Computers, Engineering & Science | 10 (71.4%) | 4 (28.6%) |
| Computers & Mathematics | 7 (63.6%) | 4 (36.4%) |
| Architecture & Engineering | 0 (0.0%) | 0 (0.0%) |
| Life, Physical & Social Science | 3 (100.0%) | 0 (0.0%) |
| Community & Social Service | 47 (51.1%) | 45 (48.9%) |
| Education, Arts & Media | 12 (44.4%) | 15 (55.6%) |
| Legal Services & Support | 0 (0.0%) | 4 (100.0%) |
| Education Instruction & Library | 35 (60.3%) | 23 (39.7%) |
| Arts, Media & Entertainment | 0 (0.0%) | 3 (100.0%) |
| Health Diagnosing & Treating | 33 (46.5%) | 38 (53.5%) |
| Health Technologists | 3 (11.5%) | 23 (88.5%) |
| Total (Category) | 198 (57.1%) | 149 (42.9%) |
| Total (Overall) | 533 (60.4%) | 349 (39.6%) |
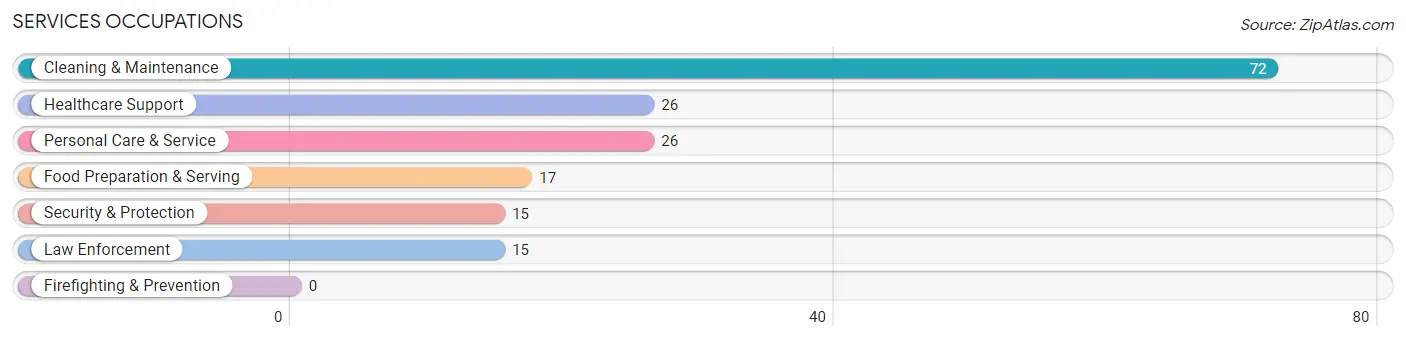
Services Occupations
The most common Services occupations in Oldham County are Cleaning & Maintenance (72 | 8.2%), Healthcare Support (26 | 2.9%), Personal Care & Service (26 | 2.9%), Food Preparation & Serving (17 | 1.9%), and Security & Protection (15 | 1.7%).
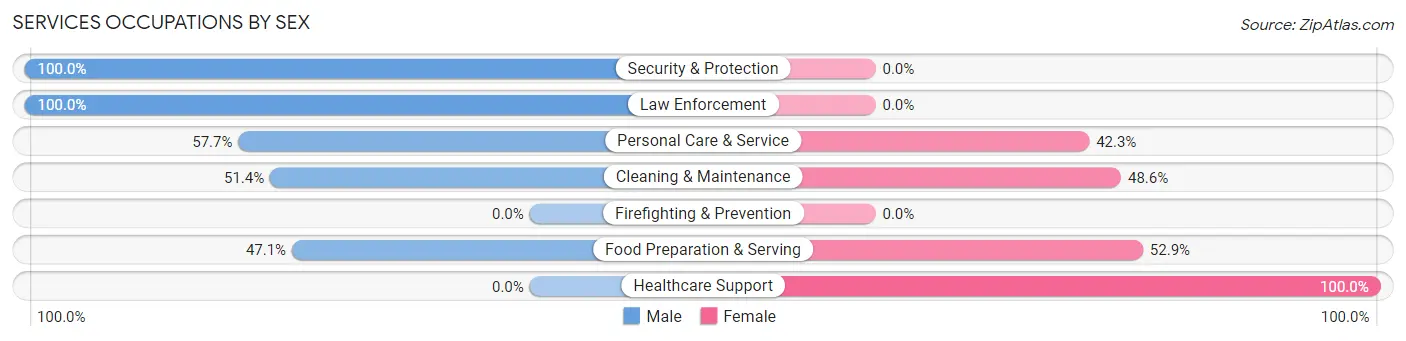
Services Occupations by Sex
Within the Services occupations in Oldham County, the most male-oriented occupations are Security & Protection (100.0%), Law Enforcement (100.0%), and Personal Care & Service (57.7%), while the most female-oriented occupations are Healthcare Support (100.0%), Food Preparation & Serving (52.9%), and Cleaning & Maintenance (48.6%).
| Occupation | Male | Female |
| Healthcare Support | 0 (0.0%) | 26 (100.0%) |
| Security & Protection | 15 (100.0%) | 0 (0.0%) |
| Firefighting & Prevention | 0 (0.0%) | 0 (0.0%) |
| Law Enforcement | 15 (100.0%) | 0 (0.0%) |
| Food Preparation & Serving | 8 (47.1%) | 9 (52.9%) |
| Cleaning & Maintenance | 37 (51.4%) | 35 (48.6%) |
| Personal Care & Service | 15 (57.7%) | 11 (42.3%) |
| Total (Category) | 75 (48.1%) | 81 (51.9%) |
| Total (Overall) | 533 (60.4%) | 349 (39.6%) |
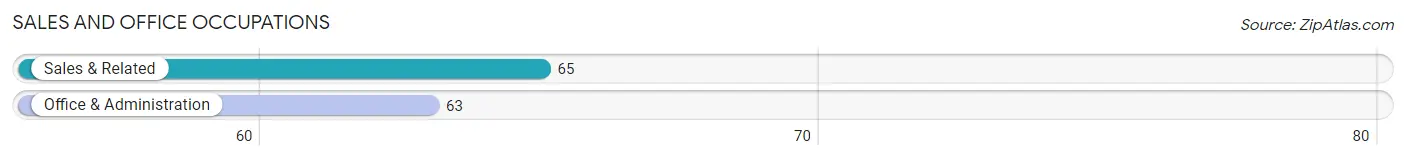
Sales and Office Occupations
The most common Sales and Office occupations in Oldham County are Sales & Related (65 | 7.4%), and Office & Administration (63 | 7.1%).
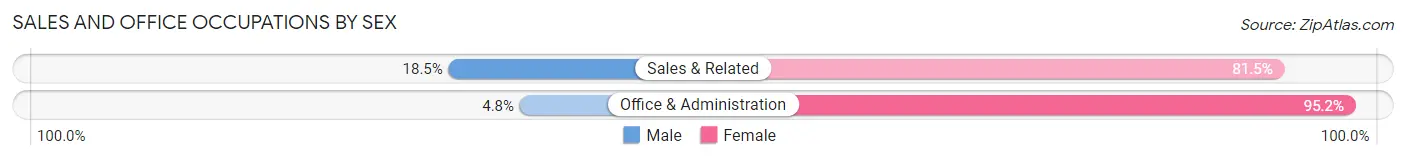
Sales and Office Occupations by Sex
| Occupation | Male | Female |
| Sales & Related | 12 (18.5%) | 53 (81.5%) |
| Office & Administration | 3 (4.8%) | 60 (95.2%) |
| Total (Category) | 15 (11.7%) | 113 (88.3%) |
| Total (Overall) | 533 (60.4%) | 349 (39.6%) |
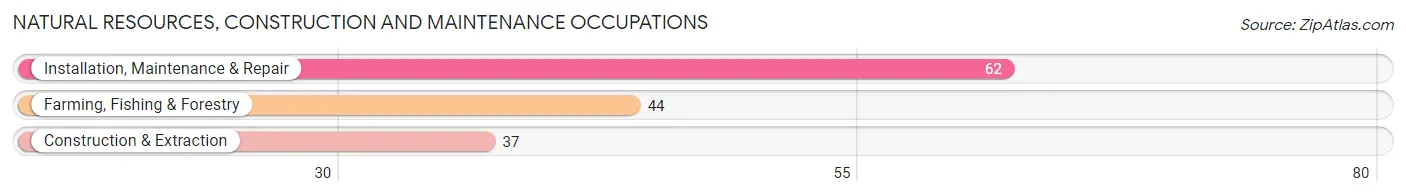
Natural Resources, Construction and Maintenance Occupations
The most common Natural Resources, Construction and Maintenance occupations in Oldham County are Installation, Maintenance & Repair (62 | 7.0%), Farming, Fishing & Forestry (44 | 5.0%), and Construction & Extraction (37 | 4.2%).
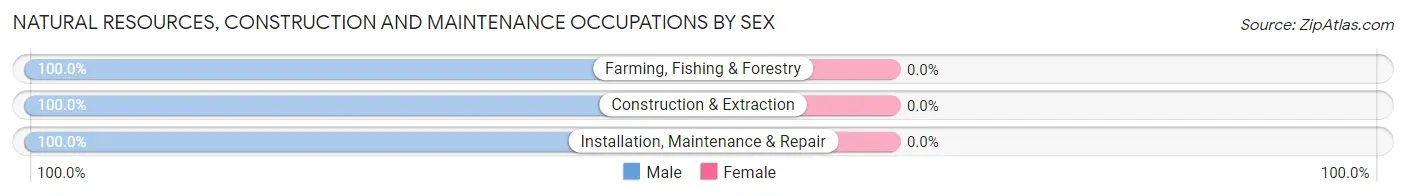
Natural Resources, Construction and Maintenance Occupations by Sex
| Occupation | Male | Female |
| Farming, Fishing & Forestry | 44 (100.0%) | 0 (0.0%) |
| Construction & Extraction | 37 (100.0%) | 0 (0.0%) |
| Installation, Maintenance & Repair | 62 (100.0%) | 0 (0.0%) |
| Total (Category) | 143 (100.0%) | 0 (0.0%) |
| Total (Overall) | 533 (60.4%) | 349 (39.6%) |
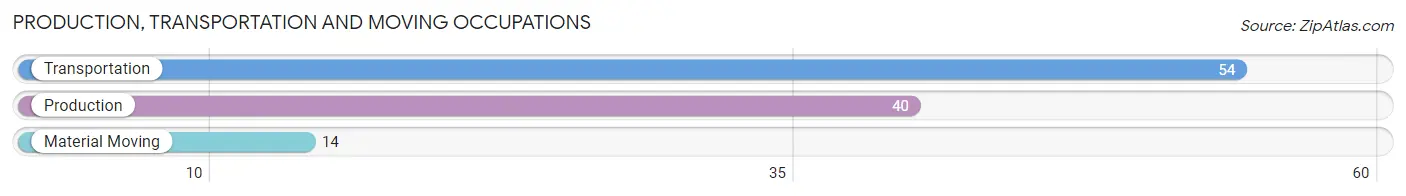
Production, Transportation and Moving Occupations
The most common Production, Transportation and Moving occupations in Oldham County are Transportation (54 | 6.1%), Production (40 | 4.5%), and Material Moving (14 | 1.6%).
Production, Transportation and Moving Occupations by Sex
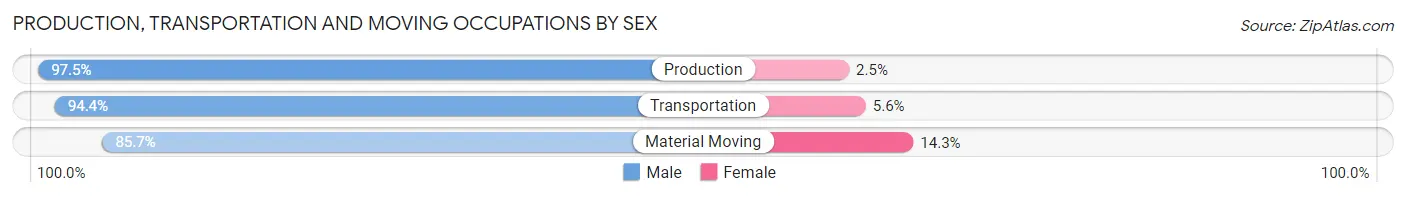
| Occupation | Male | Female |
| Production | 39 (97.5%) | 1 (2.5%) |
| Transportation | 51 (94.4%) | 3 (5.6%) |
| Material Moving | 12 (85.7%) | 2 (14.3%) |
| Total (Category) | 102 (94.4%) | 6 (5.6%) |
| Total (Overall) | 533 (60.4%) | 349 (39.6%) |
Employment Industries by Sex in Oldham County
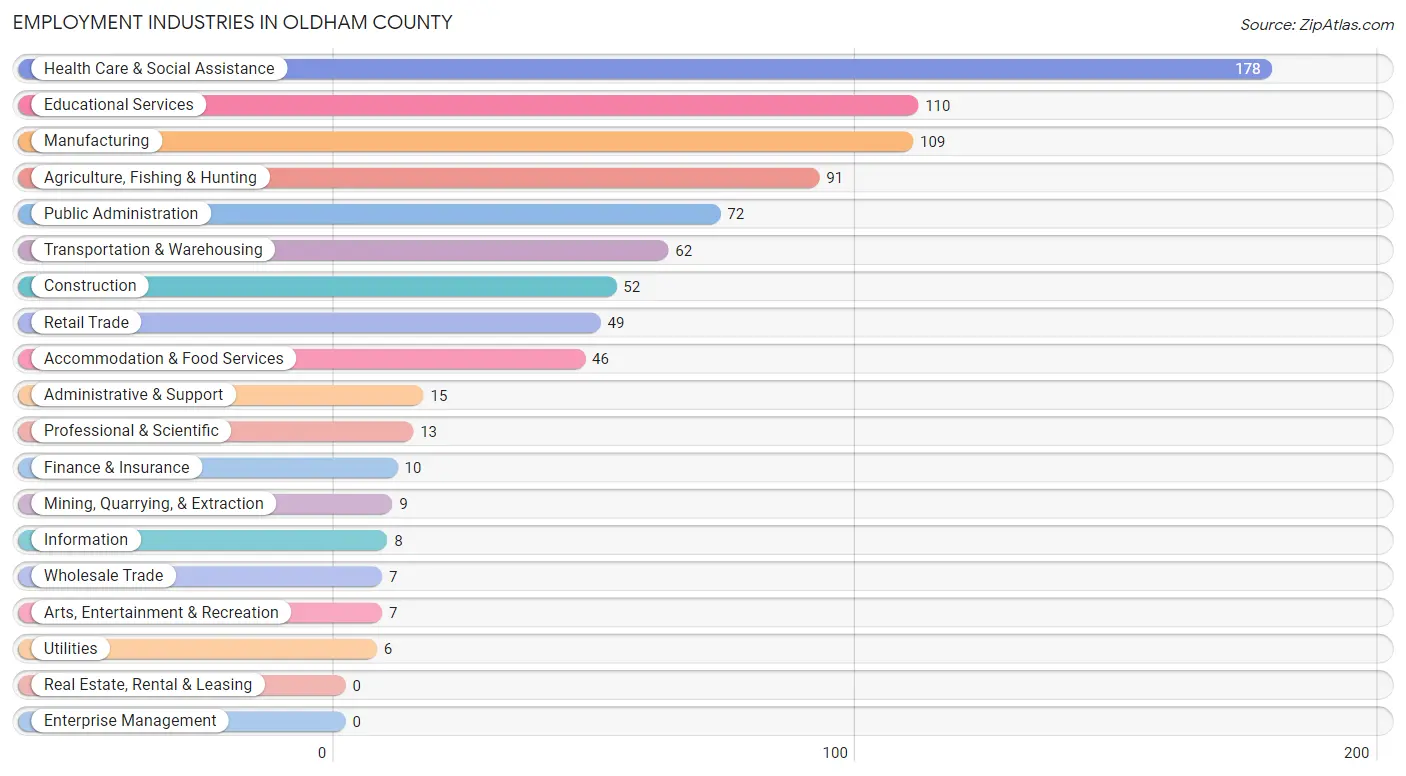
Employment Industries in Oldham County
The major employment industries in Oldham County include Health Care & Social Assistance (178 | 20.2%), Educational Services (110 | 12.5%), Manufacturing (109 | 12.4%), Agriculture, Fishing & Hunting (91 | 10.3%), and Public Administration (72 | 8.2%).
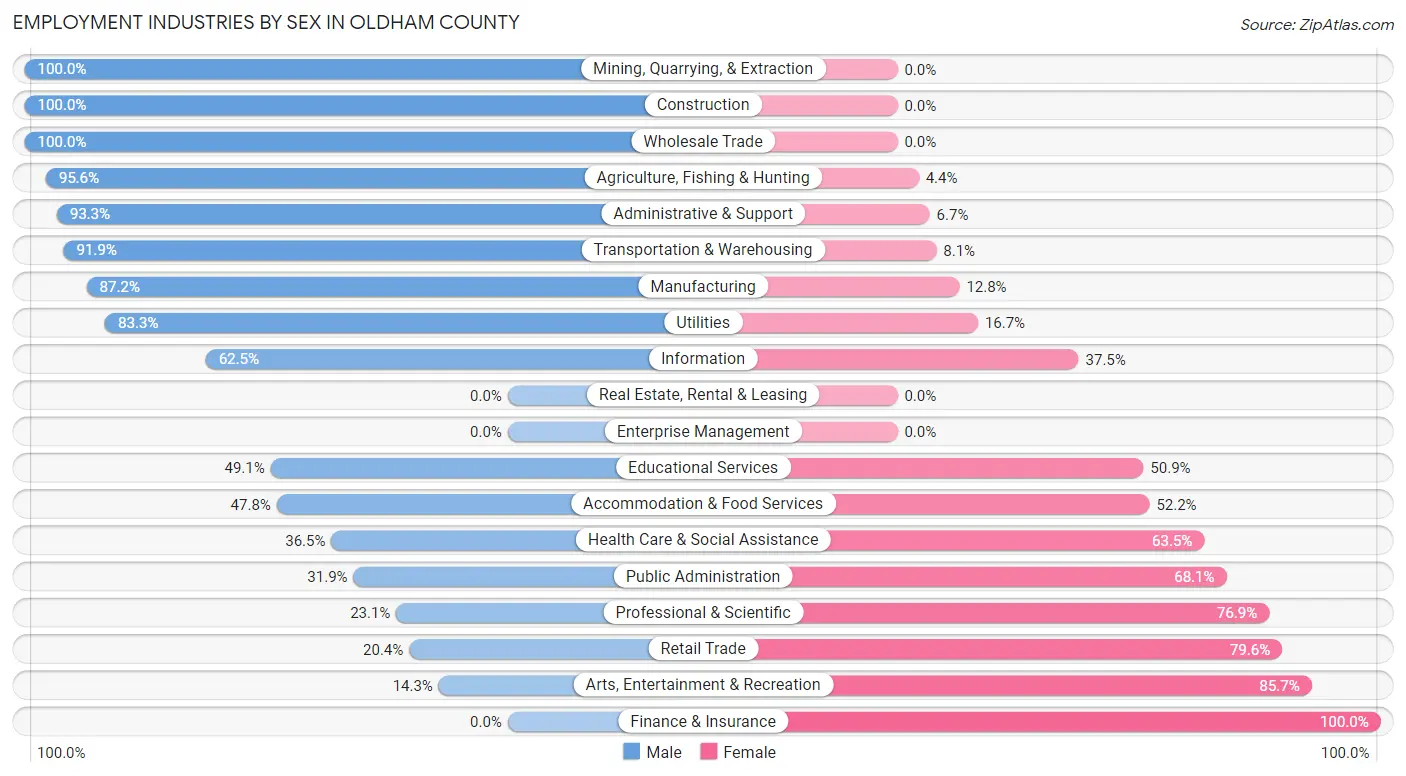
Employment Industries by Sex in Oldham County
The Oldham County industries that see more men than women are Mining, Quarrying, & Extraction (100.0%), Construction (100.0%), and Wholesale Trade (100.0%), whereas the industries that tend to have a higher number of women are Finance & Insurance (100.0%), Arts, Entertainment & Recreation (85.7%), and Retail Trade (79.6%).
| Industry | Male | Female |
| Agriculture, Fishing & Hunting | 87 (95.6%) | 4 (4.4%) |
| Mining, Quarrying, & Extraction | 9 (100.0%) | 0 (0.0%) |
| Construction | 52 (100.0%) | 0 (0.0%) |
| Manufacturing | 95 (87.2%) | 14 (12.8%) |
| Wholesale Trade | 7 (100.0%) | 0 (0.0%) |
| Retail Trade | 10 (20.4%) | 39 (79.6%) |
| Transportation & Warehousing | 57 (91.9%) | 5 (8.1%) |
| Utilities | 5 (83.3%) | 1 (16.7%) |
| Information | 5 (62.5%) | 3 (37.5%) |
| Finance & Insurance | 0 (0.0%) | 10 (100.0%) |
| Real Estate, Rental & Leasing | 0 (0.0%) | 0 (0.0%) |
| Professional & Scientific | 3 (23.1%) | 10 (76.9%) |
| Enterprise Management | 0 (0.0%) | 0 (0.0%) |
| Administrative & Support | 14 (93.3%) | 1 (6.7%) |
| Educational Services | 54 (49.1%) | 56 (50.9%) |
| Health Care & Social Assistance | 65 (36.5%) | 113 (63.5%) |
| Arts, Entertainment & Recreation | 1 (14.3%) | 6 (85.7%) |
| Accommodation & Food Services | 22 (47.8%) | 24 (52.2%) |
| Public Administration | 23 (31.9%) | 49 (68.1%) |
| Total | 533 (60.4%) | 349 (39.6%) |
Education in Oldham County
School Enrollment in Oldham County
The most common levels of schooling among the 698 students in Oldham County are high school (375 | 53.7%), middle school (135 | 19.3%), and elementary school (77 | 11.0%).
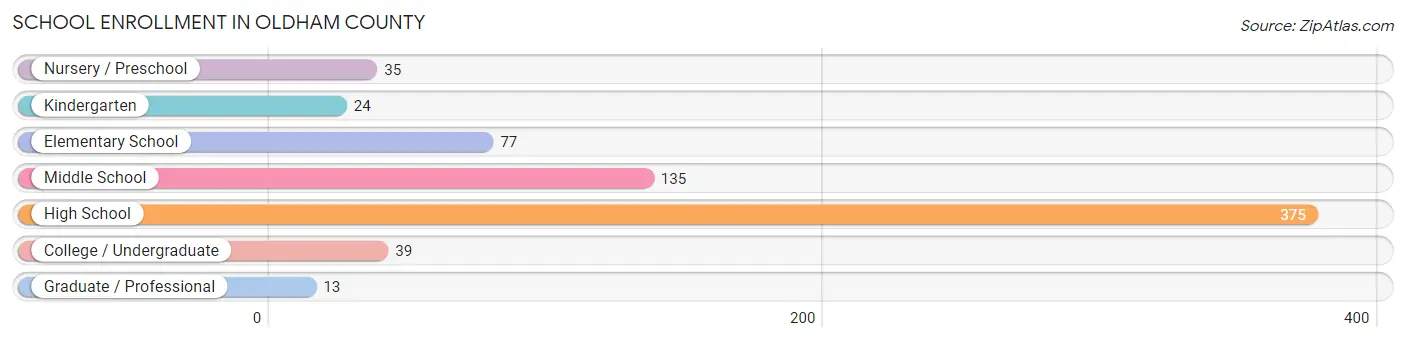
| School Level | # Students | % Students |
| Nursery / Preschool | 35 | 5.0% |
| Kindergarten | 24 | 3.4% |
| Elementary School | 77 | 11.0% |
| Middle School | 135 | 19.3% |
| High School | 375 | 53.7% |
| College / Undergraduate | 39 | 5.6% |
| Graduate / Professional | 13 | 1.9% |
| Total | 698 | 100.0% |
School Enrollment by Age by Funding Source in Oldham County
Out of a total of 698 students who are enrolled in schools in Oldham County, 159 (22.8%) attend a private institution, while the remaining 539 (77.2%) are enrolled in public schools. The age group of 3 to 4 year olds has the highest likelihood of being enrolled in private schools, with 15 (75.0% in the age bracket) enrolled. Conversely, the age group of 20 to 24 year olds has the lowest likelihood of being enrolled in a private school, with 15 (100.0% in the age bracket) attending a public institution.
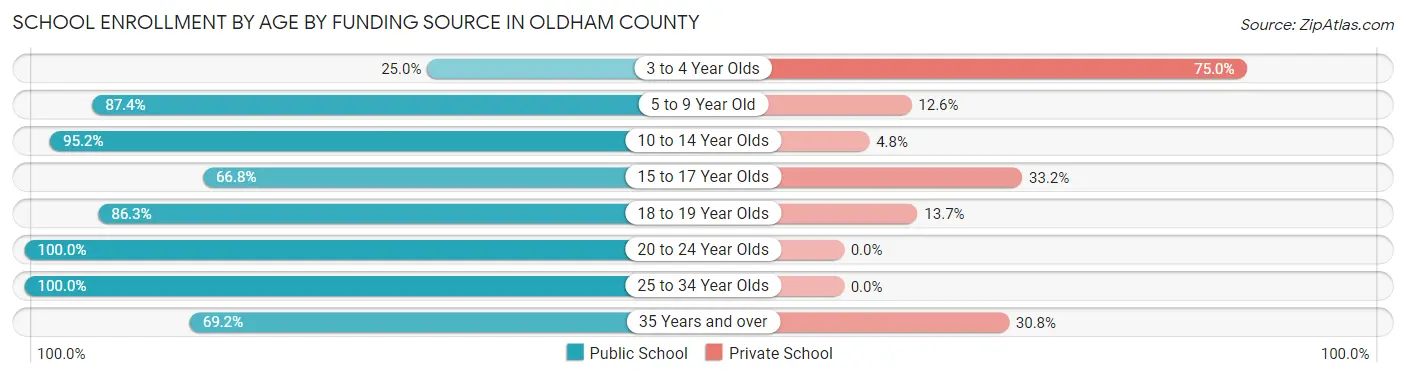
| Age Bracket | Public School | Private School |
| 3 to 4 Year Olds | 5 (25.0%) | 15 (75.0%) |
| 5 to 9 Year Old | 97 (87.4%) | 14 (12.6%) |
| 10 to 14 Year Olds | 140 (95.2%) | 7 (4.8%) |
| 15 to 17 Year Olds | 217 (66.8%) | 108 (33.2%) |
| 18 to 19 Year Olds | 44 (86.3%) | 7 (13.7%) |
| 20 to 24 Year Olds | 15 (100.0%) | 0 (0.0%) |
| 25 to 34 Year Olds | 3 (100.0%) | 0 (0.0%) |
| 35 Years and over | 18 (69.2%) | 8 (30.8%) |
| Total | 539 (77.2%) | 159 (22.8%) |
Educational Attainment by Field of Study in Oldham County
Education (119 | 35.5%), bio, nature & agricultural (56 | 16.7%), business (35 | 10.4%), liberal arts & history (29 | 8.7%), and visual & performing arts (24 | 7.2%) are the most common fields of study among 335 individuals in Oldham County who have obtained a bachelor's degree or higher.
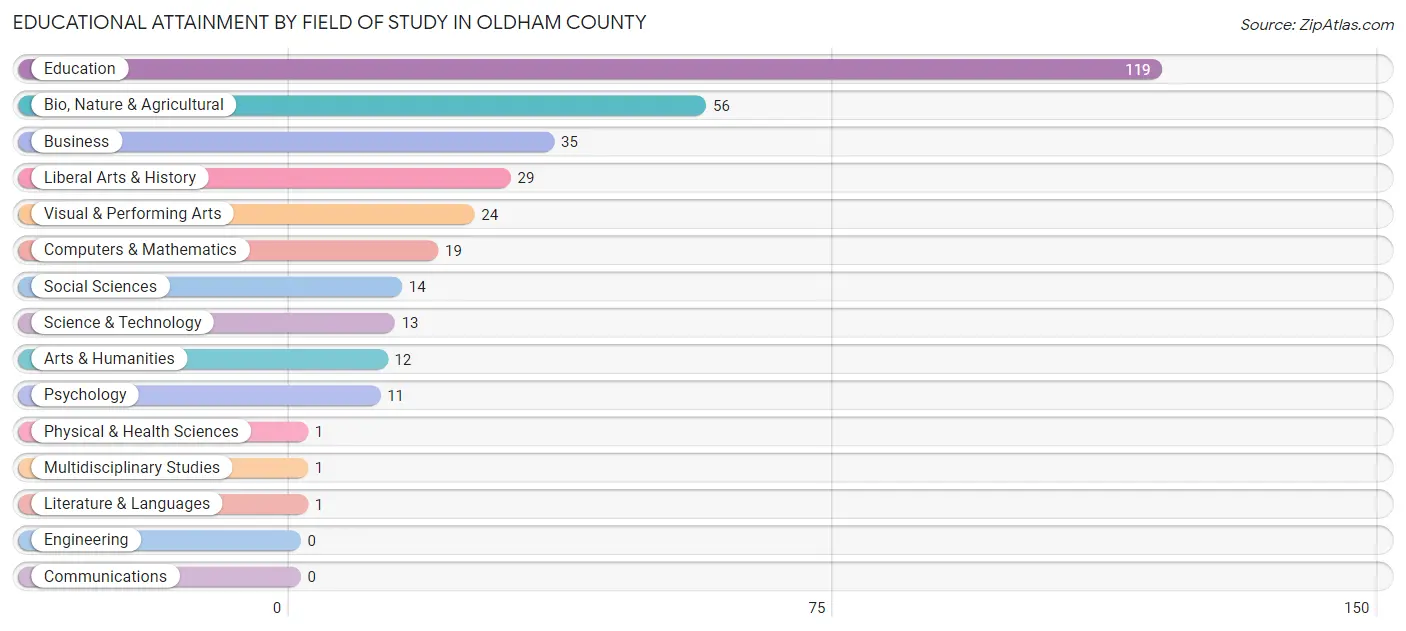
| Field of Study | # Graduates | % Graduates |
| Computers & Mathematics | 19 | 5.7% |
| Bio, Nature & Agricultural | 56 | 16.7% |
| Physical & Health Sciences | 1 | 0.3% |
| Psychology | 11 | 3.3% |
| Social Sciences | 14 | 4.2% |
| Engineering | 0 | 0.0% |
| Multidisciplinary Studies | 1 | 0.3% |
| Science & Technology | 13 | 3.9% |
| Business | 35 | 10.4% |
| Education | 119 | 35.5% |
| Literature & Languages | 1 | 0.3% |
| Liberal Arts & History | 29 | 8.7% |
| Visual & Performing Arts | 24 | 7.2% |
| Communications | 0 | 0.0% |
| Arts & Humanities | 12 | 3.6% |
| Total | 335 | 100.0% |
Transportation & Commute in Oldham County
Vehicle Availability by Sex in Oldham County
The most prevalent vehicle ownership categories in Oldham County are males with 2 vehicles (257, accounting for 48.5%) and females with 2 vehicles (159, making up 77.6%).
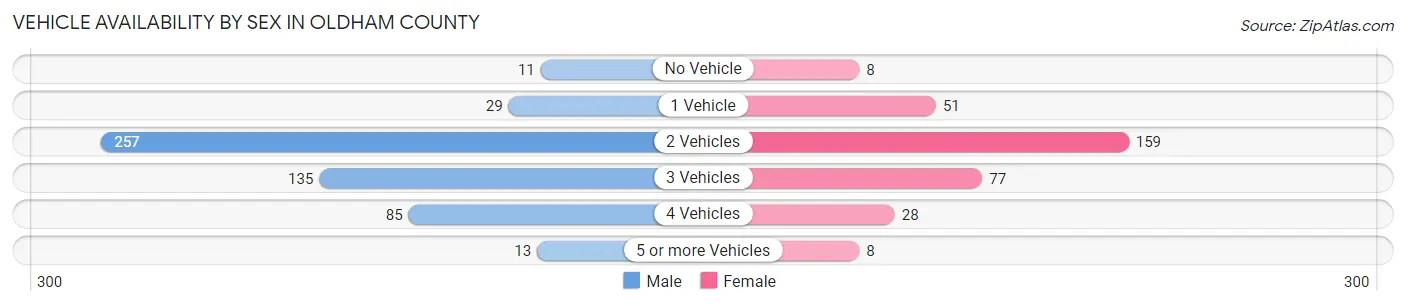
| Vehicles Available | Male | Female |
| No Vehicle | 11 (2.1%) | 8 (2.4%) |
| 1 Vehicle | 29 (5.5%) | 51 (15.4%) |
| 2 Vehicles | 257 (48.5%) | 159 (48.0%) |
| 3 Vehicles | 135 (25.5%) | 77 (23.3%) |
| 4 Vehicles | 85 (16.0%) | 28 (8.5%) |
| 5 or more Vehicles | 13 (2.5%) | 8 (2.4%) |
| Total | 530 (100.0%) | 331 (100.0%) |
Commute Time in Oldham County
The most frequently occuring commute durations in Oldham County are 30 to 34 minutes (202 commuters, 24.8%), 5 to 9 minutes (163 commuters, 20.0%), and 45 to 59 minutes (76 commuters, 9.3%).
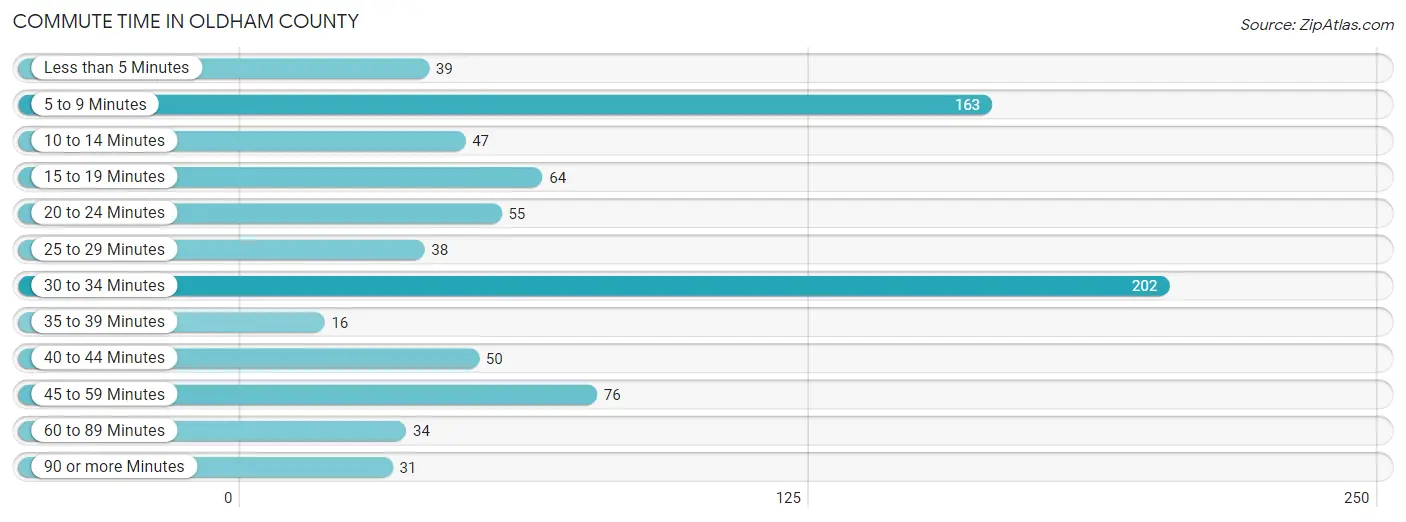
| Commute Time | # Commuters | % Commuters |
| Less than 5 Minutes | 39 | 4.8% |
| 5 to 9 Minutes | 163 | 20.0% |
| 10 to 14 Minutes | 47 | 5.8% |
| 15 to 19 Minutes | 64 | 7.9% |
| 20 to 24 Minutes | 55 | 6.8% |
| 25 to 29 Minutes | 38 | 4.7% |
| 30 to 34 Minutes | 202 | 24.8% |
| 35 to 39 Minutes | 16 | 2.0% |
| 40 to 44 Minutes | 50 | 6.1% |
| 45 to 59 Minutes | 76 | 9.3% |
| 60 to 89 Minutes | 34 | 4.2% |
| 90 or more Minutes | 31 | 3.8% |
Commute Time by Sex in Oldham County
The most common commute times in Oldham County are 30 to 34 minutes (120 commuters, 24.5%) for males and 5 to 9 minutes (84 commuters, 25.8%) for females.
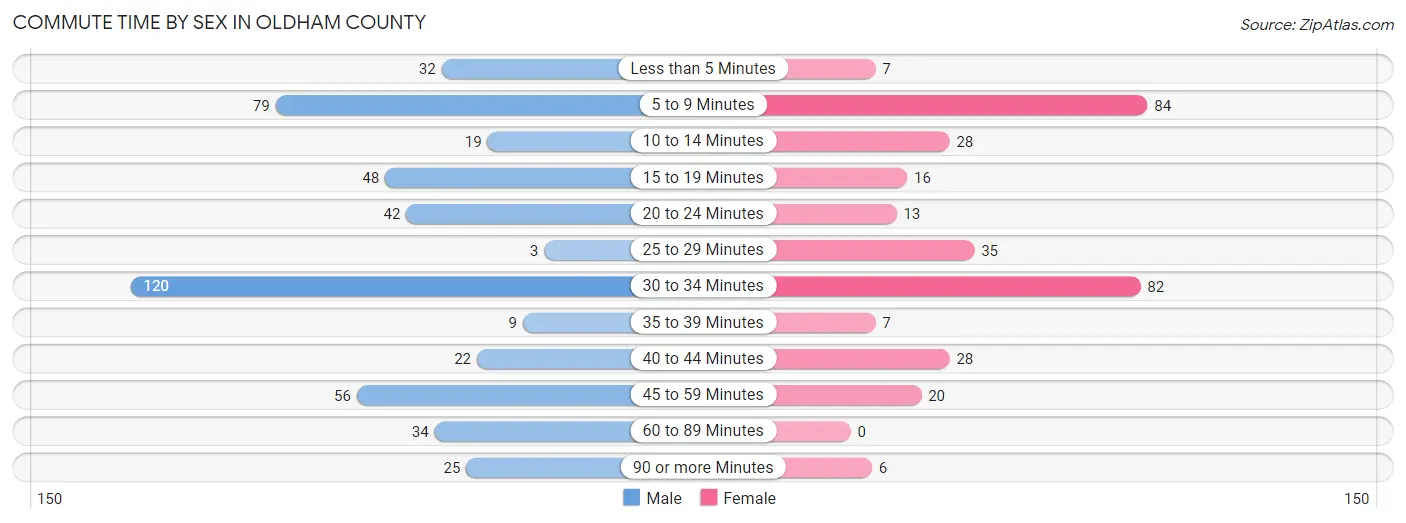
| Commute Time | Male | Female |
| Less than 5 Minutes | 32 (6.5%) | 7 (2.1%) |
| 5 to 9 Minutes | 79 (16.2%) | 84 (25.8%) |
| 10 to 14 Minutes | 19 (3.9%) | 28 (8.6%) |
| 15 to 19 Minutes | 48 (9.8%) | 16 (4.9%) |
| 20 to 24 Minutes | 42 (8.6%) | 13 (4.0%) |
| 25 to 29 Minutes | 3 (0.6%) | 35 (10.7%) |
| 30 to 34 Minutes | 120 (24.5%) | 82 (25.2%) |
| 35 to 39 Minutes | 9 (1.8%) | 7 (2.1%) |
| 40 to 44 Minutes | 22 (4.5%) | 28 (8.6%) |
| 45 to 59 Minutes | 56 (11.5%) | 20 (6.1%) |
| 60 to 89 Minutes | 34 (7.0%) | 0 (0.0%) |
| 90 or more Minutes | 25 (5.1%) | 6 (1.8%) |
Time of Departure to Work by Sex in Oldham County
The most frequent times of departure to work in Oldham County are 7:00 AM to 7:29 AM (133, 27.2%) for males and 7:30 AM to 7:59 AM (94, 28.8%) for females.
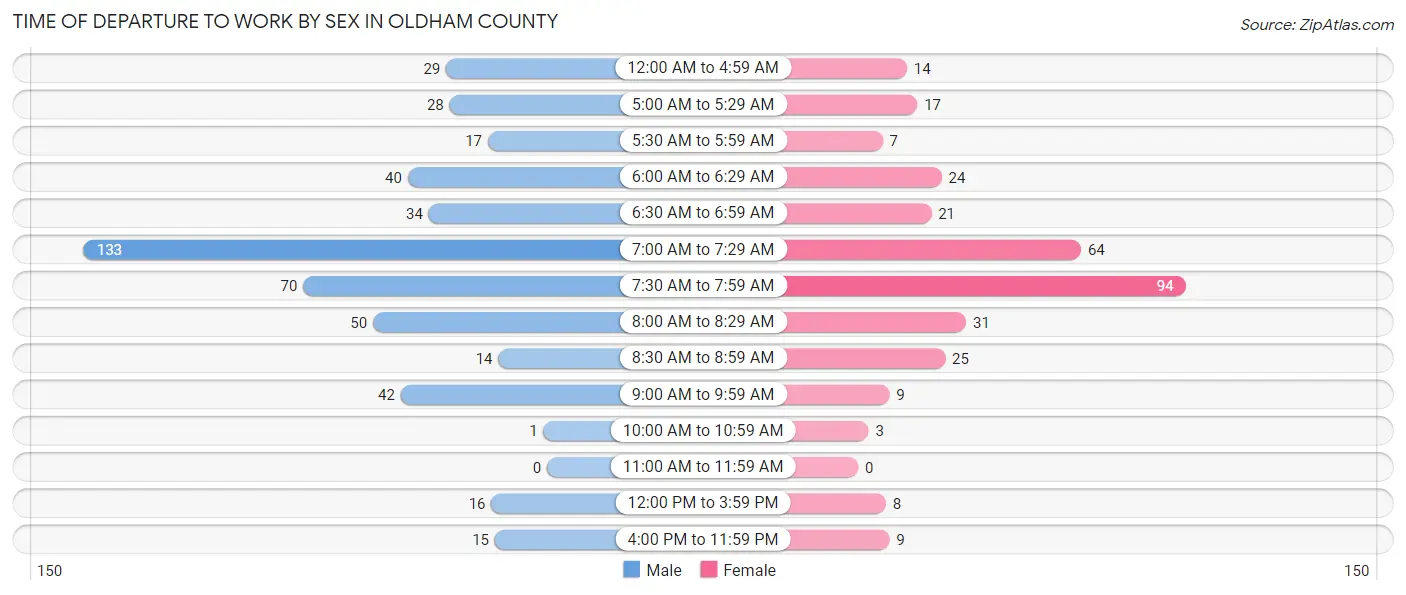
| Time of Departure | Male | Female |
| 12:00 AM to 4:59 AM | 29 (5.9%) | 14 (4.3%) |
| 5:00 AM to 5:29 AM | 28 (5.7%) | 17 (5.2%) |
| 5:30 AM to 5:59 AM | 17 (3.5%) | 7 (2.1%) |
| 6:00 AM to 6:29 AM | 40 (8.2%) | 24 (7.4%) |
| 6:30 AM to 6:59 AM | 34 (7.0%) | 21 (6.4%) |
| 7:00 AM to 7:29 AM | 133 (27.2%) | 64 (19.6%) |
| 7:30 AM to 7:59 AM | 70 (14.3%) | 94 (28.8%) |
| 8:00 AM to 8:29 AM | 50 (10.2%) | 31 (9.5%) |
| 8:30 AM to 8:59 AM | 14 (2.9%) | 25 (7.7%) |
| 9:00 AM to 9:59 AM | 42 (8.6%) | 9 (2.8%) |
| 10:00 AM to 10:59 AM | 1 (0.2%) | 3 (0.9%) |
| 11:00 AM to 11:59 AM | 0 (0.0%) | 0 (0.0%) |
| 12:00 PM to 3:59 PM | 16 (3.3%) | 8 (2.5%) |
| 4:00 PM to 11:59 PM | 15 (3.1%) | 9 (2.8%) |
| Total | 489 (100.0%) | 326 (100.0%) |
Housing Occupancy in Oldham County
Occupancy by Ownership in Oldham County
Of the total 631 dwellings in Oldham County, owner-occupied units account for 452 (71.6%), while renter-occupied units make up 179 (28.4%).
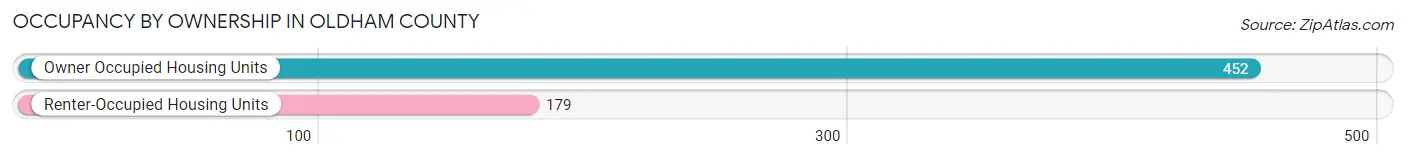
| Occupancy | # Housing Units | % Housing Units |
| Owner Occupied Housing Units | 452 | 71.6% |
| Renter-Occupied Housing Units | 179 | 28.4% |
| Total Occupied Housing Units | 631 | 100.0% |
Occupancy by Household Size in Oldham County
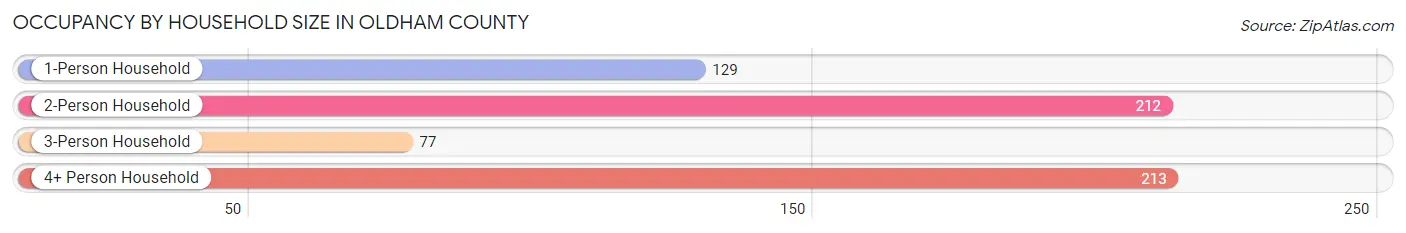
| Household Size | # Housing Units | % Housing Units |
| 1-Person Household | 129 | 20.4% |
| 2-Person Household | 212 | 33.6% |
| 3-Person Household | 77 | 12.2% |
| 4+ Person Household | 213 | 33.8% |
| Total Housing Units | 631 | 100.0% |
Occupancy by Ownership by Household Size in Oldham County
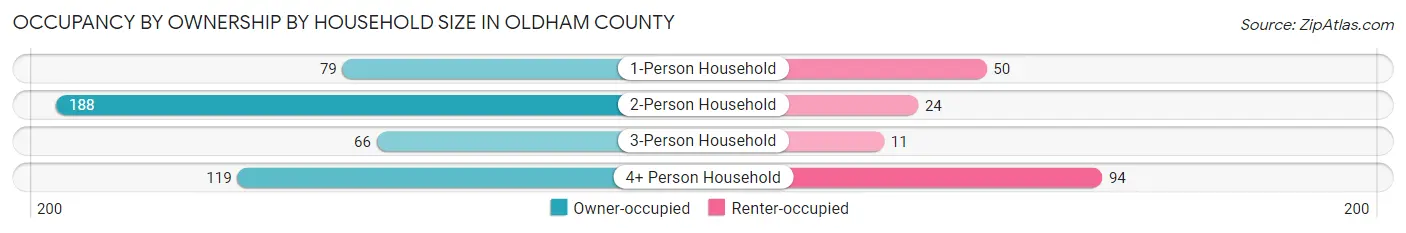
| Household Size | Owner-occupied | Renter-occupied |
| 1-Person Household | 79 (61.2%) | 50 (38.8%) |
| 2-Person Household | 188 (88.7%) | 24 (11.3%) |
| 3-Person Household | 66 (85.7%) | 11 (14.3%) |
| 4+ Person Household | 119 (55.9%) | 94 (44.1%) |
| Total Housing Units | 452 (71.6%) | 179 (28.4%) |
Occupancy by Educational Attainment in Oldham County
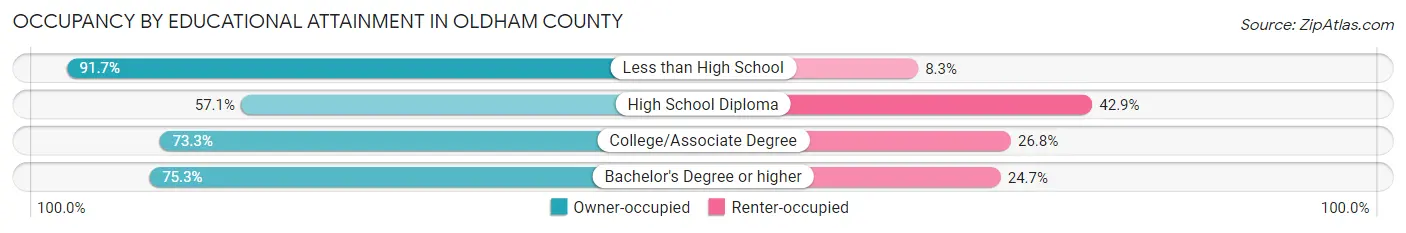
| Household Size | Owner-occupied | Renter-occupied |
| Less than High School | 55 (91.7%) | 5 (8.3%) |
| High School Diploma | 88 (57.1%) | 66 (42.9%) |
| College/Associate Degree | 178 (73.3%) | 65 (26.8%) |
| Bachelor's Degree or higher | 131 (75.3%) | 43 (24.7%) |
Occupancy by Age of Householder in Oldham County
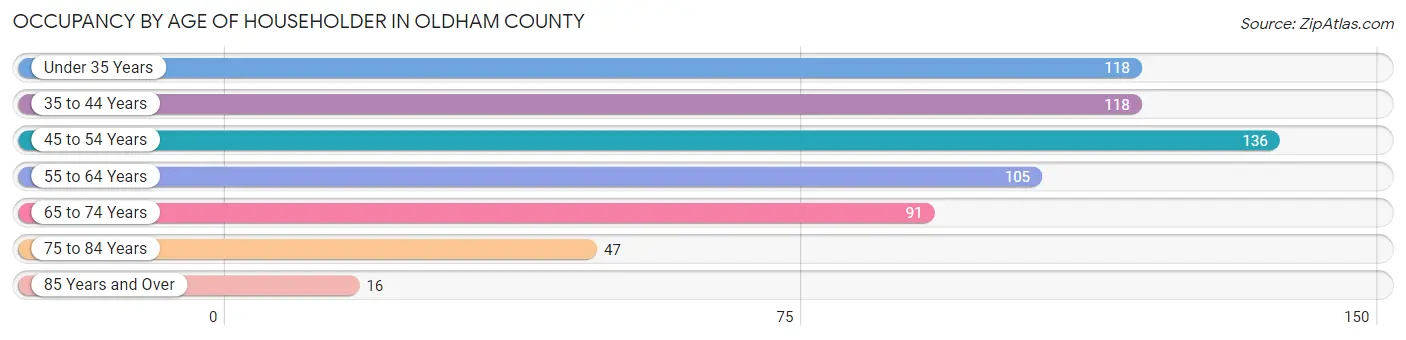
| Age Bracket | # Households | % Households |
| Under 35 Years | 118 | 18.7% |
| 35 to 44 Years | 118 | 18.7% |
| 45 to 54 Years | 136 | 21.5% |
| 55 to 64 Years | 105 | 16.6% |
| 65 to 74 Years | 91 | 14.4% |
| 75 to 84 Years | 47 | 7.4% |
| 85 Years and Over | 16 | 2.5% |
| Total | 631 | 100.0% |
Housing Finances in Oldham County
Median Income by Occupancy in Oldham County
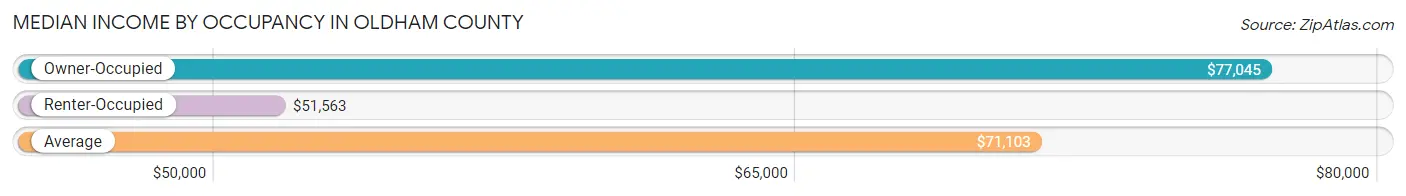
| Occupancy Type | # Households | Median Income |
| Owner-Occupied | 452 (71.6%) | $77,045 |
| Renter-Occupied | 179 (28.4%) | $51,563 |
| Average | 631 (100.0%) | $71,103 |
Occupancy by Householder Income Bracket in Oldham County
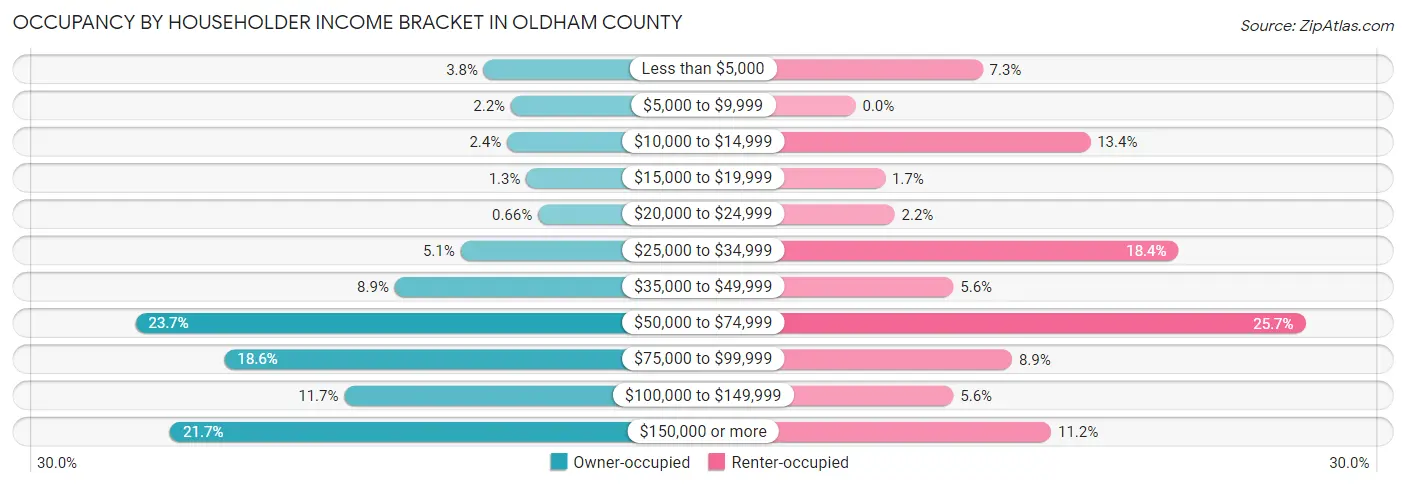
| Income Bracket | Owner-occupied | Renter-occupied |
| Less than $5,000 | 17 (3.8%) | 13 (7.3%) |
| $5,000 to $9,999 | 10 (2.2%) | 0 (0.0%) |
| $10,000 to $14,999 | 11 (2.4%) | 24 (13.4%) |
| $15,000 to $19,999 | 6 (1.3%) | 3 (1.7%) |
| $20,000 to $24,999 | 3 (0.7%) | 4 (2.2%) |
| $25,000 to $34,999 | 23 (5.1%) | 33 (18.4%) |
| $35,000 to $49,999 | 40 (8.8%) | 10 (5.6%) |
| $50,000 to $74,999 | 107 (23.7%) | 46 (25.7%) |
| $75,000 to $99,999 | 84 (18.6%) | 16 (8.9%) |
| $100,000 to $149,999 | 53 (11.7%) | 10 (5.6%) |
| $150,000 or more | 98 (21.7%) | 20 (11.2%) |
| Total | 452 (100.0%) | 179 (100.0%) |
Monthly Housing Cost Tiers in Oldham County
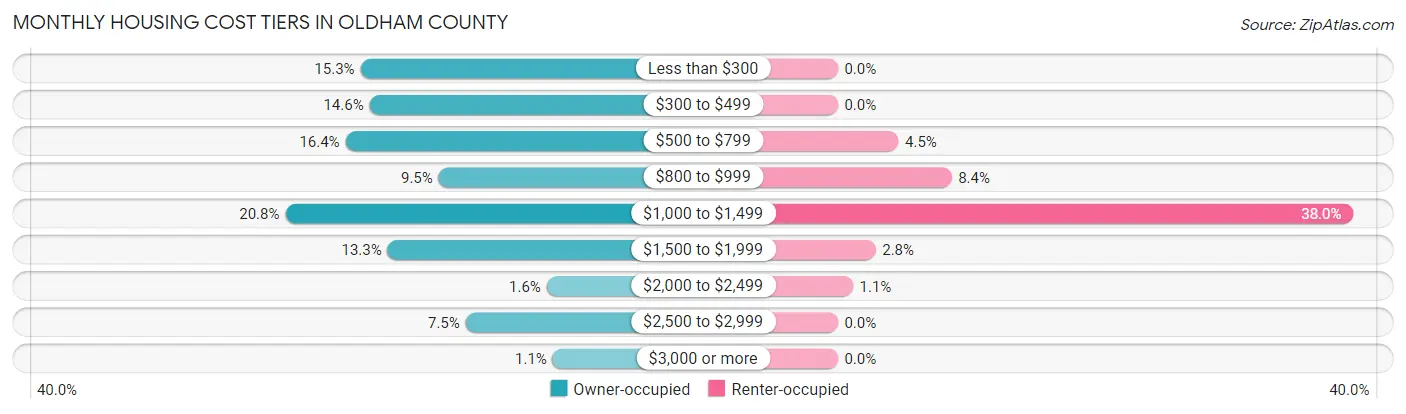
| Monthly Cost | Owner-occupied | Renter-occupied |
| Less than $300 | 69 (15.3%) | 0 (0.0%) |
| $300 to $499 | 66 (14.6%) | 0 (0.0%) |
| $500 to $799 | 74 (16.4%) | 8 (4.5%) |
| $800 to $999 | 43 (9.5%) | 15 (8.4%) |
| $1,000 to $1,499 | 94 (20.8%) | 68 (38.0%) |
| $1,500 to $1,999 | 60 (13.3%) | 5 (2.8%) |
| $2,000 to $2,499 | 7 (1.5%) | 2 (1.1%) |
| $2,500 to $2,999 | 34 (7.5%) | 0 (0.0%) |
| $3,000 or more | 5 (1.1%) | 0 (0.0%) |
| Total | 452 (100.0%) | 179 (100.0%) |
Physical Housing Characteristics in Oldham County
Housing Structures in Oldham County
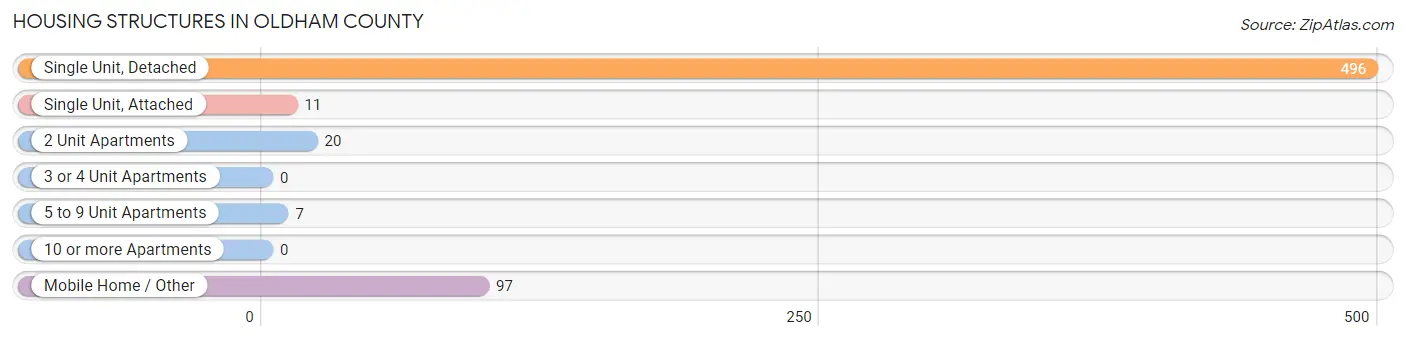
| Structure Type | # Housing Units | % Housing Units |
| Single Unit, Detached | 496 | 78.6% |
| Single Unit, Attached | 11 | 1.7% |
| 2 Unit Apartments | 20 | 3.2% |
| 3 or 4 Unit Apartments | 0 | 0.0% |
| 5 to 9 Unit Apartments | 7 | 1.1% |
| 10 or more Apartments | 0 | 0.0% |
| Mobile Home / Other | 97 | 15.4% |
| Total | 631 | 100.0% |
Housing Structures by Occupancy in Oldham County
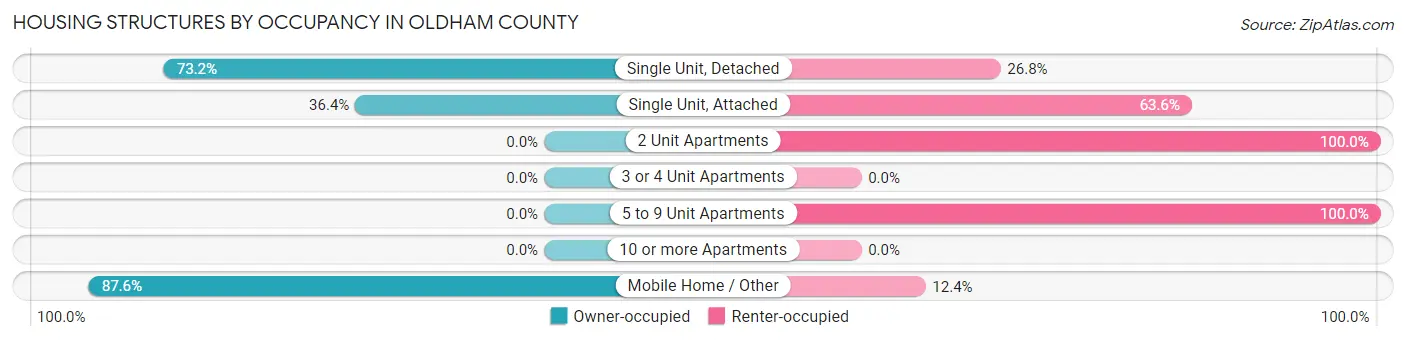
| Structure Type | Owner-occupied | Renter-occupied |
| Single Unit, Detached | 363 (73.2%) | 133 (26.8%) |
| Single Unit, Attached | 4 (36.4%) | 7 (63.6%) |
| 2 Unit Apartments | 0 (0.0%) | 20 (100.0%) |
| 3 or 4 Unit Apartments | 0 (0.0%) | 0 (0.0%) |
| 5 to 9 Unit Apartments | 0 (0.0%) | 7 (100.0%) |
| 10 or more Apartments | 0 (0.0%) | 0 (0.0%) |
| Mobile Home / Other | 85 (87.6%) | 12 (12.4%) |
| Total | 452 (71.6%) | 179 (28.4%) |
Housing Structures by Number of Rooms in Oldham County
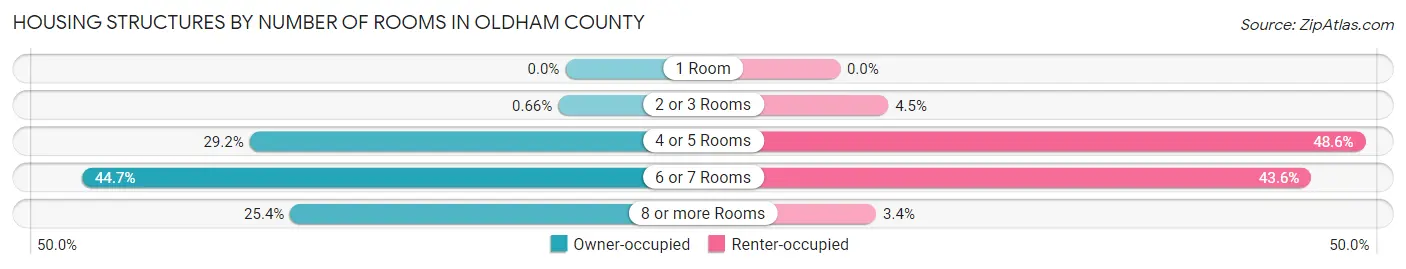
| Number of Rooms | Owner-occupied | Renter-occupied |
| 1 Room | 0 (0.0%) | 0 (0.0%) |
| 2 or 3 Rooms | 3 (0.7%) | 8 (4.5%) |
| 4 or 5 Rooms | 132 (29.2%) | 87 (48.6%) |
| 6 or 7 Rooms | 202 (44.7%) | 78 (43.6%) |
| 8 or more Rooms | 115 (25.4%) | 6 (3.4%) |
| Total | 452 (100.0%) | 179 (100.0%) |
Housing Structure by Heating Type in Oldham County
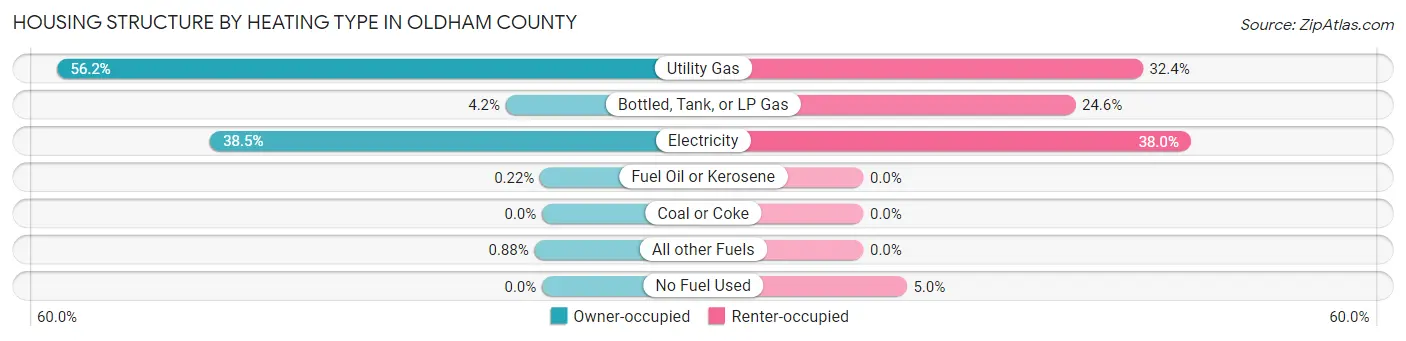
| Heating Type | Owner-occupied | Renter-occupied |
| Utility Gas | 254 (56.2%) | 58 (32.4%) |
| Bottled, Tank, or LP Gas | 19 (4.2%) | 44 (24.6%) |
| Electricity | 174 (38.5%) | 68 (38.0%) |
| Fuel Oil or Kerosene | 1 (0.2%) | 0 (0.0%) |
| Coal or Coke | 0 (0.0%) | 0 (0.0%) |
| All other Fuels | 4 (0.9%) | 0 (0.0%) |
| No Fuel Used | 0 (0.0%) | 9 (5.0%) |
| Total | 452 (100.0%) | 179 (100.0%) |
Household Vehicle Usage in Oldham County
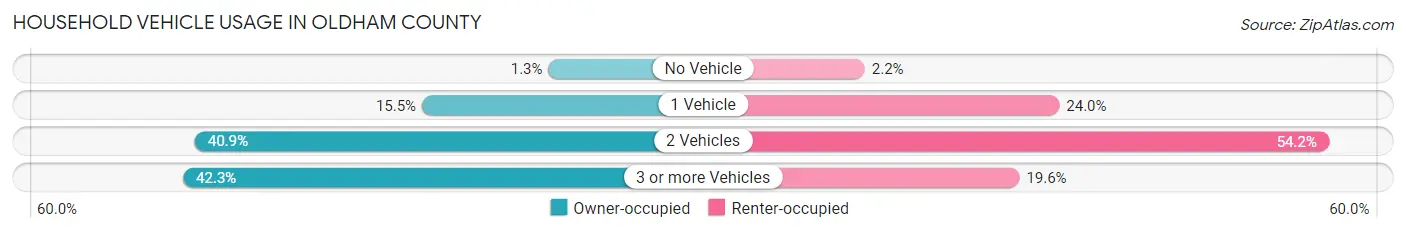
| Vehicles per Household | Owner-occupied | Renter-occupied |
| No Vehicle | 6 (1.3%) | 4 (2.2%) |
| 1 Vehicle | 70 (15.5%) | 43 (24.0%) |
| 2 Vehicles | 185 (40.9%) | 97 (54.2%) |
| 3 or more Vehicles | 191 (42.3%) | 35 (19.6%) |
| Total | 452 (100.0%) | 179 (100.0%) |
Real Estate & Mortgages in Oldham County
Real Estate and Mortgage Overview in Oldham County
| Characteristic | Without Mortgage | With Mortgage |
| Housing Units | 228 | 224 |
| Median Property Value | $83,300 | $179,000 |
| Median Household Income | $61,875 | $83 |
| Monthly Housing Costs | $456 | $5 |
| Real Estate Taxes | $1,419 | $29 |
Property Value by Mortgage Status in Oldham County
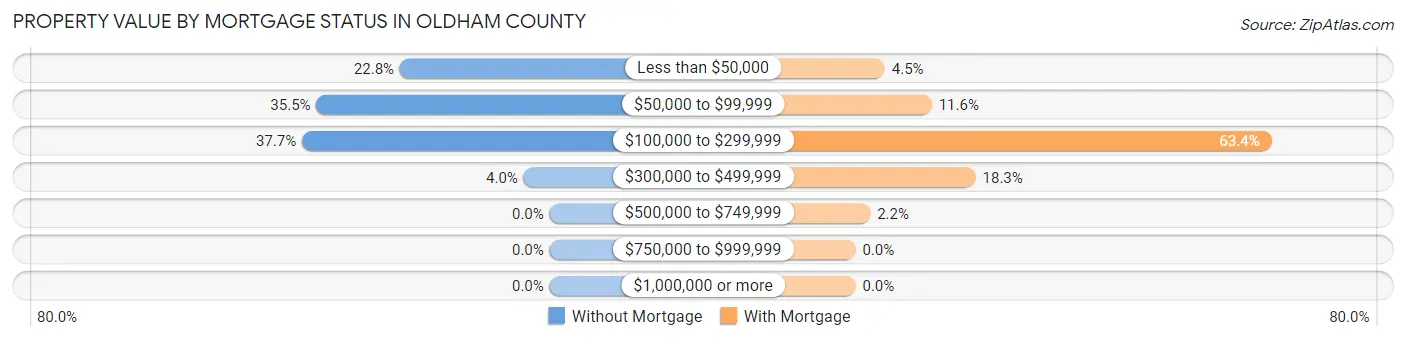
| Property Value | Without Mortgage | With Mortgage |
| Less than $50,000 | 52 (22.8%) | 10 (4.5%) |
| $50,000 to $99,999 | 81 (35.5%) | 26 (11.6%) |
| $100,000 to $299,999 | 86 (37.7%) | 142 (63.4%) |
| $300,000 to $499,999 | 9 (4.0%) | 41 (18.3%) |
| $500,000 to $749,999 | 0 (0.0%) | 5 (2.2%) |
| $750,000 to $999,999 | 0 (0.0%) | 0 (0.0%) |
| $1,000,000 or more | 0 (0.0%) | 0 (0.0%) |
| Total | 228 (100.0%) | 224 (100.0%) |
Household Income by Mortgage Status in Oldham County
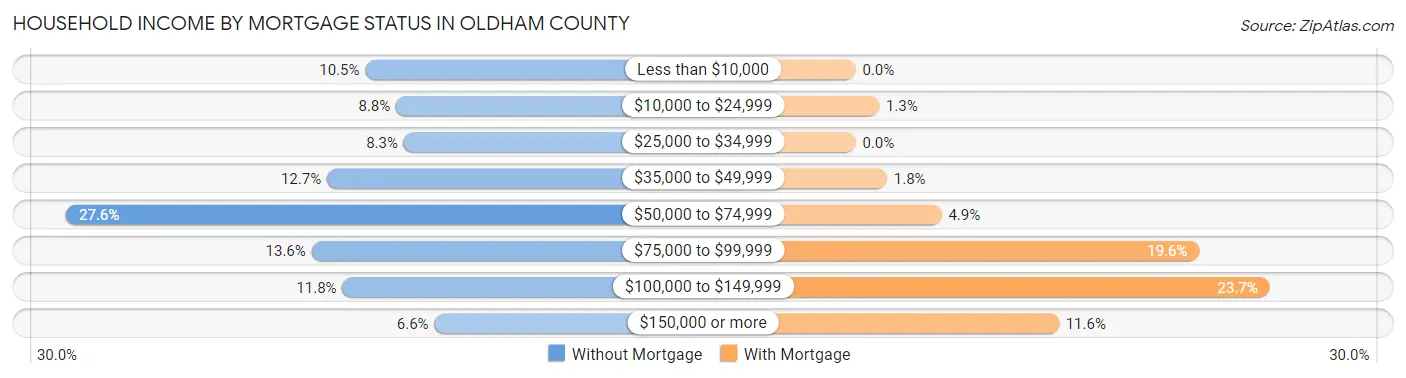
| Household Income | Without Mortgage | With Mortgage |
| Less than $10,000 | 24 (10.5%) | 0 (0.0%) |
| $10,000 to $24,999 | 20 (8.8%) | 3 (1.3%) |
| $25,000 to $34,999 | 19 (8.3%) | 0 (0.0%) |
| $35,000 to $49,999 | 29 (12.7%) | 4 (1.8%) |
| $50,000 to $74,999 | 63 (27.6%) | 11 (4.9%) |
| $75,000 to $99,999 | 31 (13.6%) | 44 (19.6%) |
| $100,000 to $149,999 | 27 (11.8%) | 53 (23.7%) |
| $150,000 or more | 15 (6.6%) | 26 (11.6%) |
| Total | 228 (100.0%) | 224 (100.0%) |
Property Value to Household Income Ratio in Oldham County
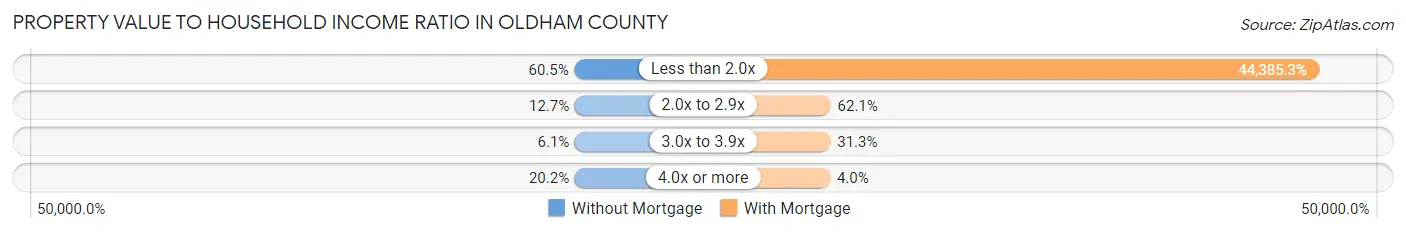
| Value-to-Income Ratio | Without Mortgage | With Mortgage |
| Less than 2.0x | 138 (60.5%) | 99,423 (44,385.3%) |
| 2.0x to 2.9x | 29 (12.7%) | 139 (62.1%) |
| 3.0x to 3.9x | 14 (6.1%) | 70 (31.2%) |
| 4.0x or more | 46 (20.2%) | 9 (4.0%) |
| Total | 228 (100.0%) | 224 (100.0%) |
Real Estate Taxes by Mortgage Status in Oldham County
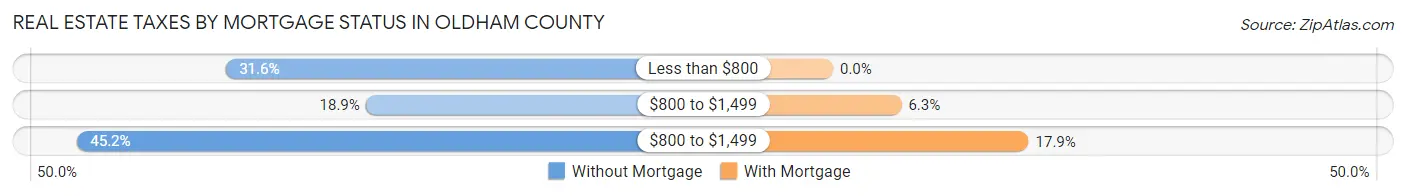
| Property Taxes | Without Mortgage | With Mortgage |
| Less than $800 | 72 (31.6%) | 0 (0.0%) |
| $800 to $1,499 | 43 (18.9%) | 14 (6.2%) |
| $800 to $1,499 | 103 (45.2%) | 40 (17.9%) |
| Total | 228 (100.0%) | 224 (100.0%) |
Health & Disability in Oldham County
Health Insurance Coverage by Age in Oldham County
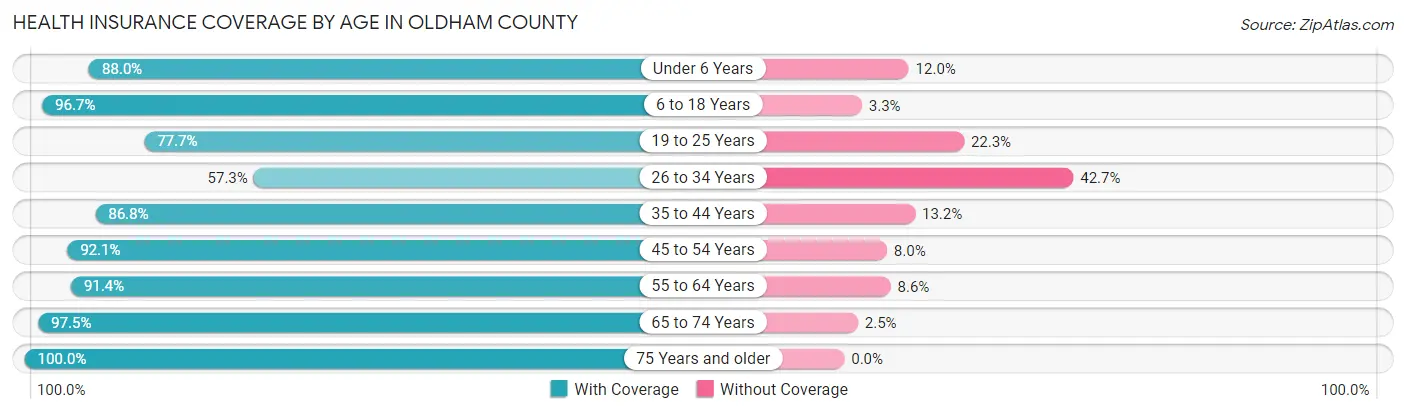
| Age Bracket | With Coverage | Without Coverage |
| Under 6 Years | 132 (88.0%) | 18 (12.0%) |
| 6 to 18 Years | 296 (96.7%) | 10 (3.3%) |
| 19 to 25 Years | 101 (77.7%) | 29 (22.3%) |
| 26 to 34 Years | 110 (57.3%) | 82 (42.7%) |
| 35 to 44 Years | 316 (86.8%) | 48 (13.2%) |
| 45 to 54 Years | 220 (92.0%) | 19 (8.0%) |
| 55 to 64 Years | 180 (91.4%) | 17 (8.6%) |
| 65 to 74 Years | 154 (97.5%) | 4 (2.5%) |
| 75 Years and older | 116 (100.0%) | 0 (0.0%) |
| Total | 1,625 (87.7%) | 227 (12.3%) |
Health Insurance Coverage by Citizenship Status in Oldham County
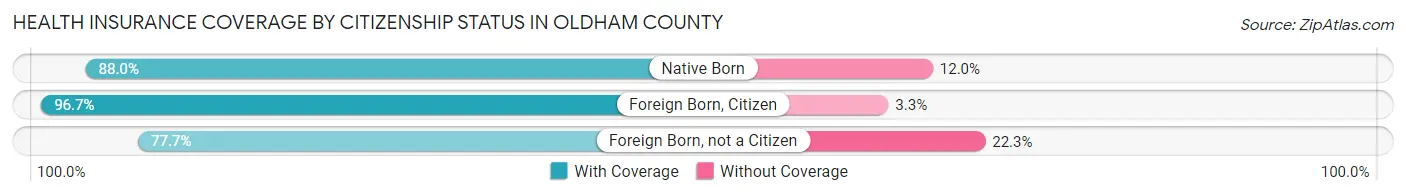
| Citizenship Status | With Coverage | Without Coverage |
| Native Born | 132 (88.0%) | 18 (12.0%) |
| Foreign Born, Citizen | 296 (96.7%) | 10 (3.3%) |
| Foreign Born, not a Citizen | 101 (77.7%) | 29 (22.3%) |
Health Insurance Coverage by Household Income in Oldham County
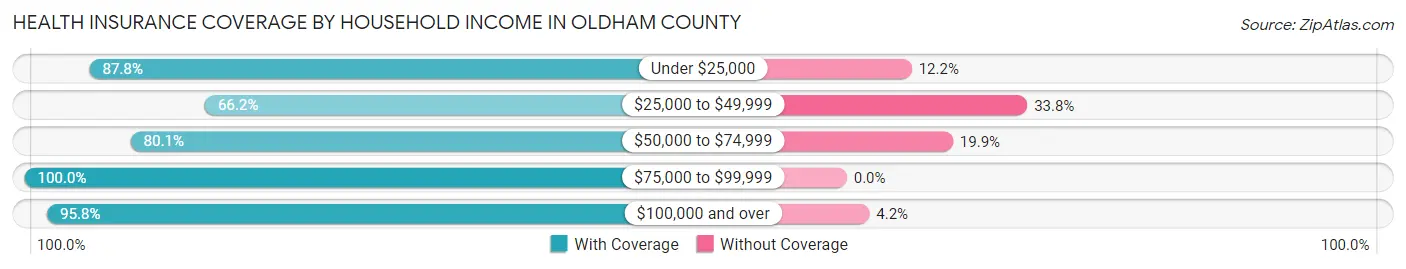
| Household Income | With Coverage | Without Coverage |
| Under $25,000 | 202 (87.8%) | 28 (12.2%) |
| $25,000 to $49,999 | 141 (66.2%) | 72 (33.8%) |
| $50,000 to $74,999 | 391 (80.1%) | 97 (19.9%) |
| $75,000 to $99,999 | 338 (100.0%) | 0 (0.0%) |
| $100,000 and over | 522 (95.8%) | 23 (4.2%) |
Public vs Private Health Insurance Coverage by Age in Oldham County
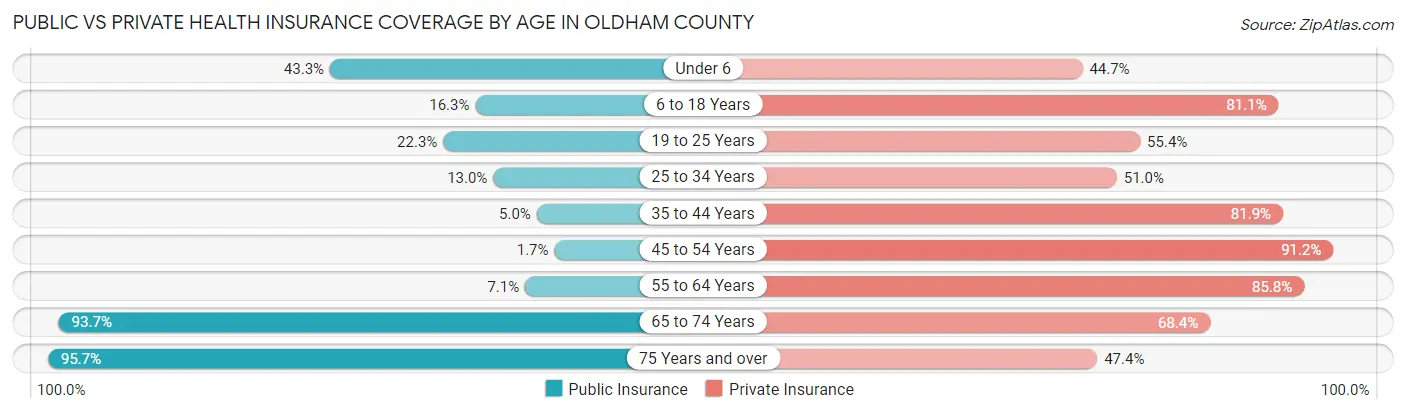
| Age Bracket | Public Insurance | Private Insurance |
| Under 6 | 65 (43.3%) | 67 (44.7%) |
| 6 to 18 Years | 50 (16.3%) | 248 (81.0%) |
| 19 to 25 Years | 29 (22.3%) | 72 (55.4%) |
| 25 to 34 Years | 25 (13.0%) | 98 (51.0%) |
| 35 to 44 Years | 18 (5.0%) | 298 (81.9%) |
| 45 to 54 Years | 4 (1.7%) | 218 (91.2%) |
| 55 to 64 Years | 14 (7.1%) | 169 (85.8%) |
| 65 to 74 Years | 148 (93.7%) | 108 (68.3%) |
| 75 Years and over | 111 (95.7%) | 55 (47.4%) |
| Total | 464 (25.1%) | 1,333 (72.0%) |
Disability Status by Sex by Age in Oldham County
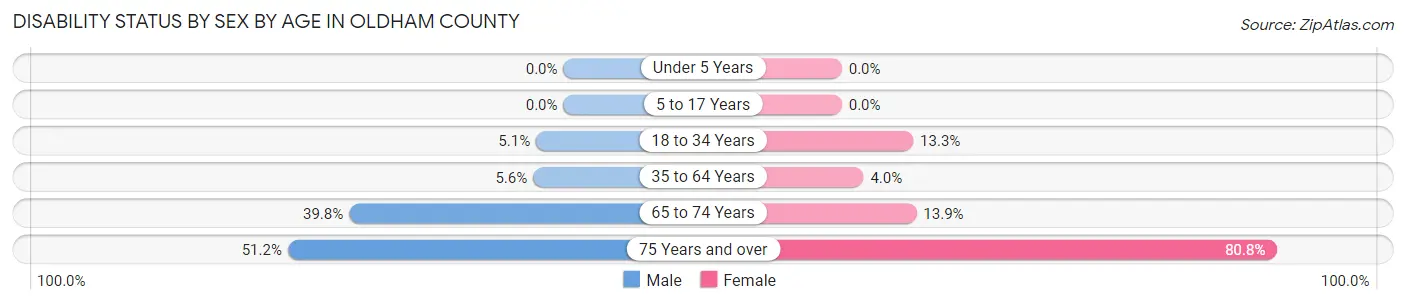
| Age Bracket | Male | Female |
| Under 5 Years | 0 (0.0%) | 0 (0.0%) |
| 5 to 17 Years | 0 (0.0%) | 0 (0.0%) |
| 18 to 34 Years | 9 (5.1%) | 22 (13.3%) |
| 35 to 64 Years | 24 (5.6%) | 15 (4.0%) |
| 65 to 74 Years | 37 (39.8%) | 9 (13.9%) |
| 75 Years and over | 22 (51.2%) | 59 (80.8%) |
Disability Class by Sex by Age in Oldham County
Disability Class: Hearing Difficulty
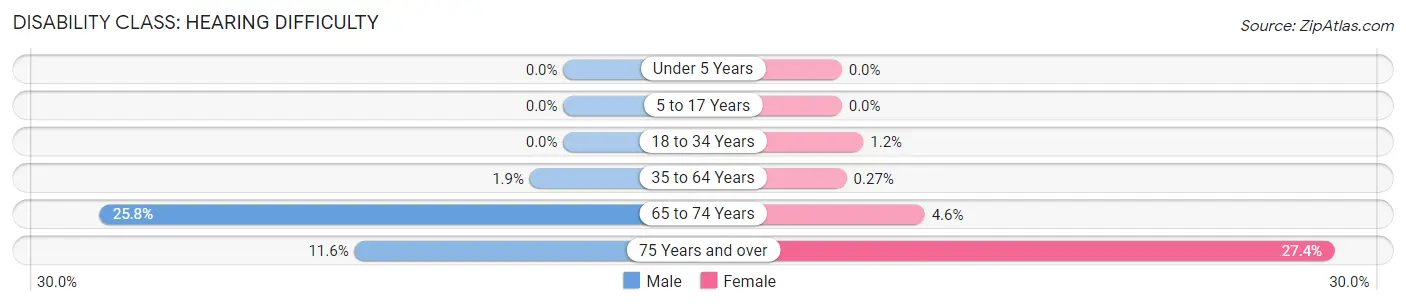
| Age Bracket | Male | Female |
| Under 5 Years | 0 (0.0%) | 0 (0.0%) |
| 5 to 17 Years | 0 (0.0%) | 0 (0.0%) |
| 18 to 34 Years | 0 (0.0%) | 2 (1.2%) |
| 35 to 64 Years | 8 (1.9%) | 1 (0.3%) |
| 65 to 74 Years | 24 (25.8%) | 3 (4.6%) |
| 75 Years and over | 5 (11.6%) | 20 (27.4%) |
Disability Class: Vision Difficulty
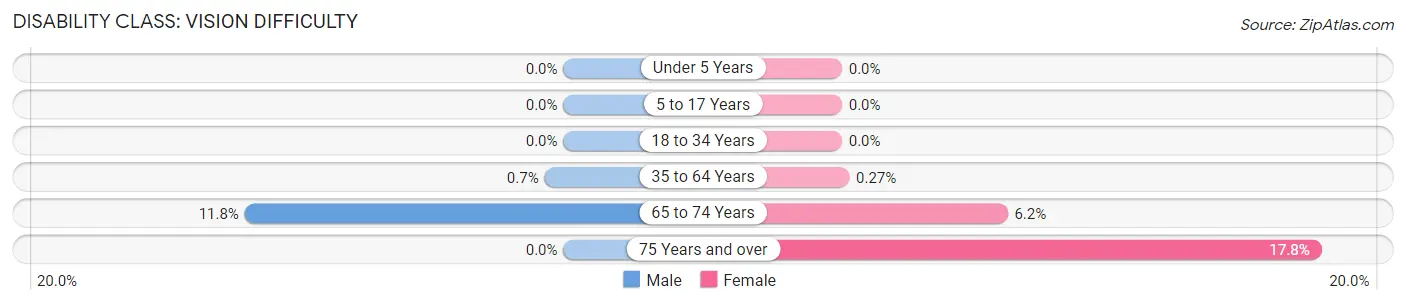
| Age Bracket | Male | Female |
| Under 5 Years | 0 (0.0%) | 0 (0.0%) |
| 5 to 17 Years | 0 (0.0%) | 0 (0.0%) |
| 18 to 34 Years | 0 (0.0%) | 0 (0.0%) |
| 35 to 64 Years | 3 (0.7%) | 1 (0.3%) |
| 65 to 74 Years | 11 (11.8%) | 4 (6.1%) |
| 75 Years and over | 0 (0.0%) | 13 (17.8%) |
Disability Class: Cognitive Difficulty
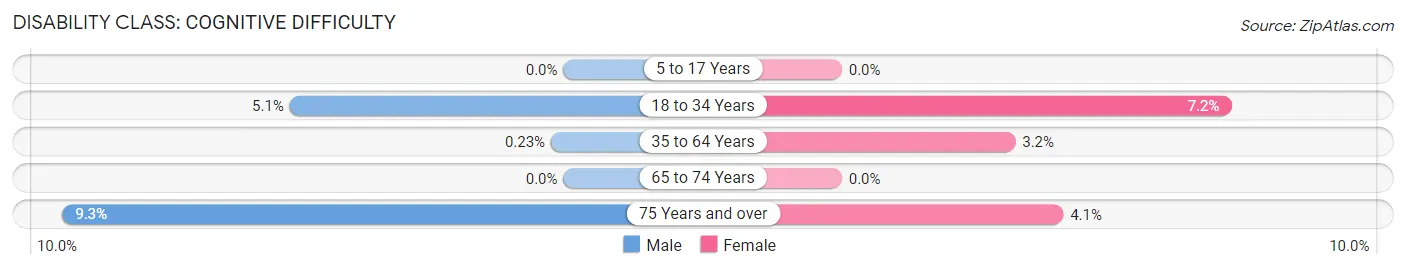
| Age Bracket | Male | Female |
| 5 to 17 Years | 0 (0.0%) | 0 (0.0%) |
| 18 to 34 Years | 9 (5.1%) | 12 (7.2%) |
| 35 to 64 Years | 1 (0.2%) | 12 (3.2%) |
| 65 to 74 Years | 0 (0.0%) | 0 (0.0%) |
| 75 Years and over | 4 (9.3%) | 3 (4.1%) |
Disability Class: Ambulatory Difficulty
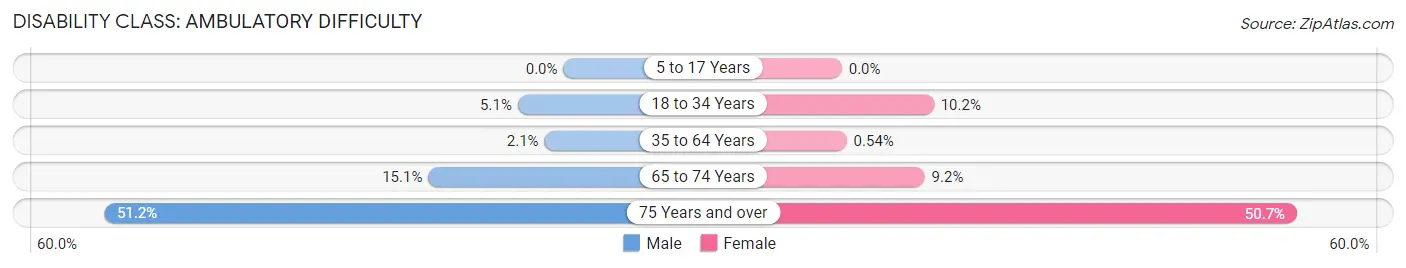
| Age Bracket | Male | Female |
| 5 to 17 Years | 0 (0.0%) | 0 (0.0%) |
| 18 to 34 Years | 9 (5.1%) | 17 (10.2%) |
| 35 to 64 Years | 9 (2.1%) | 2 (0.5%) |
| 65 to 74 Years | 14 (15.0%) | 6 (9.2%) |
| 75 Years and over | 22 (51.2%) | 37 (50.7%) |
Disability Class: Self-Care Difficulty
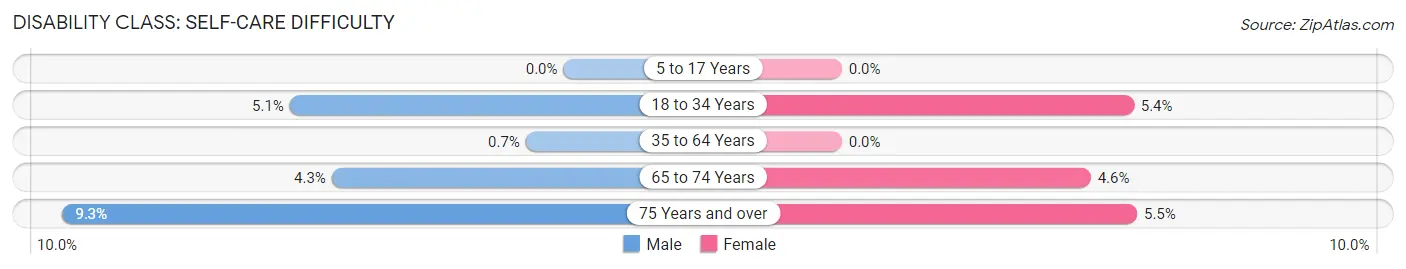
| Age Bracket | Male | Female |
| 5 to 17 Years | 0 (0.0%) | 0 (0.0%) |
| 18 to 34 Years | 9 (5.1%) | 9 (5.4%) |
| 35 to 64 Years | 3 (0.7%) | 0 (0.0%) |
| 65 to 74 Years | 4 (4.3%) | 3 (4.6%) |
| 75 Years and over | 4 (9.3%) | 4 (5.5%) |
Technology Access in Oldham County
Computing Device Access in Oldham County
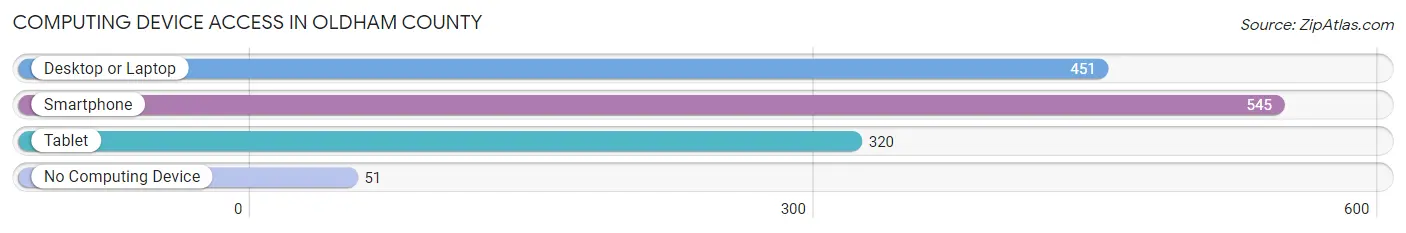
| Device Type | # Households | % Households |
| Desktop or Laptop | 451 | 71.5% |
| Smartphone | 545 | 86.4% |
| Tablet | 320 | 50.7% |
| No Computing Device | 51 | 8.1% |
| Total | 631 | 100.0% |
Internet Access in Oldham County
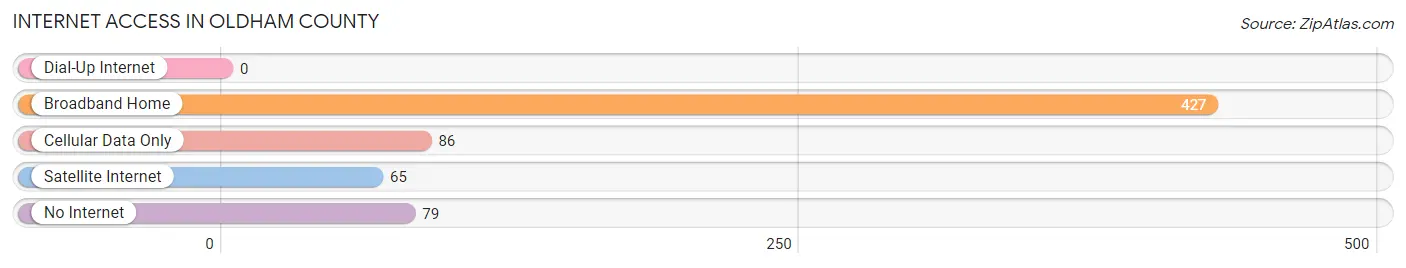
| Internet Type | # Households | % Households |
| Dial-Up Internet | 0 | 0.0% |
| Broadband Home | 427 | 67.7% |
| Cellular Data Only | 86 | 13.6% |
| Satellite Internet | 65 | 10.3% |
| No Internet | 79 | 12.5% |
| Total | 631 | 100.0% |
Oldham County Summary
Oldham County is located in the Texas Panhandle, in the northwest corner of the state. It is bordered by Potter County to the north, Deaf Smith County to the east, Randall County to the south, and Hartley County to the west. The county seat is Vega, and the largest city is Adrian.
History
Oldham County was created in 1876 from portions of Bexar and Young counties. It was named for William S. Oldham, a Texas state senator and Confederate soldier. The county was organized in 1881, and the first county seat was Tascosa. In 1891, the county seat was moved to Vega.
Geography
Oldham County covers an area of 1,072 square miles. The terrain is mostly flat, with some rolling hills in the western part of the county. The Canadian River forms the northern boundary of the county. The climate is semi-arid, with hot summers and mild winters.
Economy
Agriculture is the main economic activity in Oldham County. The county is home to a large cattle ranching industry, and the main crops grown are wheat, sorghum, and hay. Oil and gas production is also important to the local economy.
Demographics
As of the 2010 census, Oldham County had a population of 2,052. The racial makeup of the county was 94.3% White, 0.3% African American, 0.3% Native American, 0.2% Asian, 0.1% Pacific Islander, 3.7% from other races, and 1.2% from two or more races. Hispanic or Latino of any race were 8.2% of the population.
The median household income was $41,944, and the median family income was $48,750. The per capita income was $20,945. About 11.2% of families and 14.2% of the population were below the poverty line, including 18.2% of those under age 18 and 10.2% of those age 65 or over.
Education
Oldham County is served by the Oldham County Independent School District. The district has one elementary school, one middle school, and one high school. There are also several private schools in the county.
Conclusion
Oldham County is a rural county located in the Texas Panhandle. It is home to a large cattle ranching industry, and oil and gas production is also important to the local economy. The population is mostly White, with a small percentage of African American, Native American, Asian, and Pacific Islander residents. The county is served by the Oldham County Independent School District, as well as several private schools.
Common Questions
What is Per Capita Income in Oldham County?
Per Capita income in Oldham County is $27,710.
What is the Median Family Income in Oldham County?
Median Family Income in Oldham County is $75,515.
What is the Median Household income in Oldham County?
Median Household Income in Oldham County is $71,103.
What is Income or Wage Gap in Oldham County?
Income or Wage Gap in Oldham County is 43.4%.
Women in Oldham County earn 56.6 cents for every dollar earned by a man.
What is Inequality or Gini Index in Oldham County?
Inequality or Gini Index in Oldham County is 0.43.
What is the Total Population of Oldham County?
Total Population of Oldham County is 2,171.
What is the Total Male Population of Oldham County?
Total Male Population of Oldham County is 1,284.
What is the Total Female Population of Oldham County?
Total Female Population of Oldham County is 887.
What is the Ratio of Males per 100 Females in Oldham County?
There are 144.76 Males per 100 Females in Oldham County.
What is the Ratio of Females per 100 Males in Oldham County?
There are 69.08 Females per 100 Males in Oldham County.
What is the Median Population Age in Oldham County?
Median Population Age in Oldham County is 35.0 Years.
What is the Average Family Size in Oldham County
Average Family Size in Oldham County is 3.3 People.
What is the Average Household Size in Oldham County
Average Household Size in Oldham County is 2.9 People.
How Large is the Labor Force in Oldham County?
There are 895 People in the Labor Forcein in Oldham County.
What is the Percentage of People in the Labor Force in Oldham County?
54.6% of People are in the Labor Force in Oldham County.
What is the Unemployment Rate in Oldham County?
Unemployment Rate in Oldham County is 1.5%.