Ochiltree County, TX Map & Demographics
Ochiltree County Map
Ochiltree County Overview
$30,836
PER CAPITA INCOME
$77,117
AVG FAMILY INCOME
$62,240
AVG HOUSEHOLD INCOME
48.7%
WAGE / INCOME GAP [ % ]
51.3¢/ $1
WAGE / INCOME GAP [ $ ]
$12,125
FAMILY INCOME DEFICIT
0.42
INEQUALITY / GINI INDEX
9,924
TOTAL POPULATION
4,994
MALE POPULATION
4,930
FEMALE POPULATION
101.30
MALES / 100 FEMALES
98.72
FEMALES / 100 MALES
33.0
MEDIAN AGE
3.1
AVG FAMILY SIZE
2.7
AVG HOUSEHOLD SIZE
4,955
LABOR FORCE [ PEOPLE ]
67.3%
PERCENT IN LABOR FORCE
1.5%
UNEMPLOYMENT RATE
Ochiltree County Area Codes
Income in Ochiltree County
Income Overview in Ochiltree County
Per Capita Income in Ochiltree County is $30,836, while median incomes of families and households are $77,117 and $62,240 respectively.
| Characteristic | Number | Measure |
| Per Capita Income | 9,924 | $30,836 |
| Median Family Income | 2,637 | $77,117 |
| Mean Family Income | 2,637 | $86,326 |
| Median Household Income | 3,684 | $62,240 |
| Mean Household Income | 3,684 | $80,514 |
| Income Deficit | 2,637 | $12,125 |
| Wage / Income Gap (%) | 9,924 | 48.68% |
| Wage / Income Gap ($) | 9,924 | 51.32¢ per $1 |
| Gini / Inequality Index | 9,924 | 0.42 |
Earnings by Sex in Ochiltree County
Average Earnings in Ochiltree County are $41,886, $48,036 for men and $24,654 for women, a difference of 48.7%.
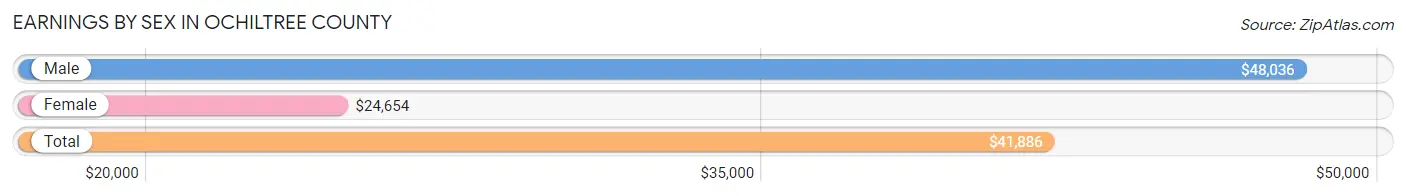
| Sex | Number | Average Earnings |
| Male | 3,092 (60.2%) | $48,036 |
| Female | 2,044 (39.8%) | $24,654 |
| Total | 5,136 (100.0%) | $41,886 |
Earnings by Sex by Income Bracket in Ochiltree County
The most common earnings brackets in Ochiltree County are $75,000 to $99,999 for men (455 | 14.7%) and $30,000 to $34,999 for women (208 | 10.2%).
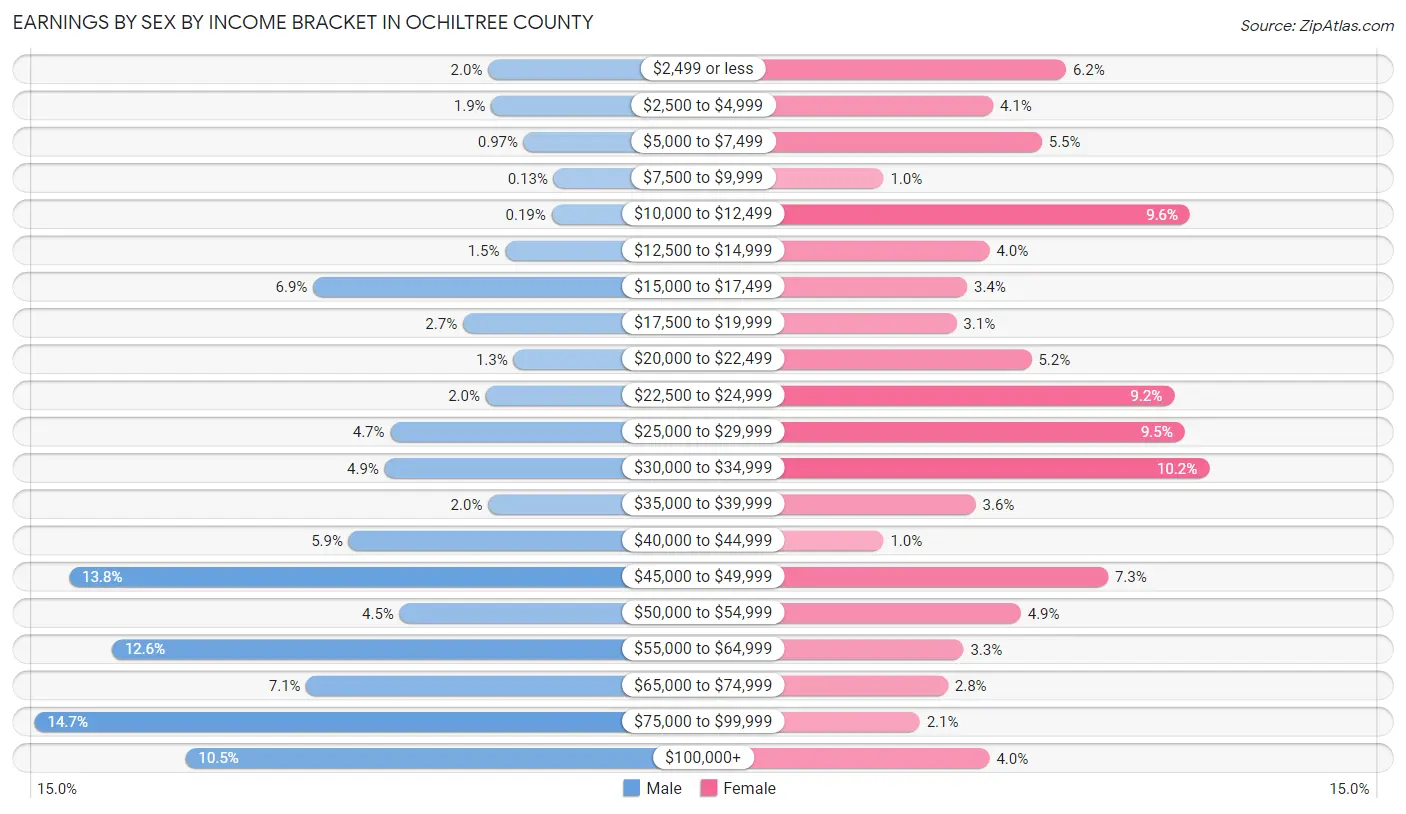
| Income | Male | Female |
| $2,499 or less | 61 (2.0%) | 126 (6.2%) |
| $2,500 to $4,999 | 58 (1.9%) | 84 (4.1%) |
| $5,000 to $7,499 | 30 (1.0%) | 112 (5.5%) |
| $7,500 to $9,999 | 4 (0.1%) | 21 (1.0%) |
| $10,000 to $12,499 | 6 (0.2%) | 197 (9.6%) |
| $12,500 to $14,999 | 46 (1.5%) | 82 (4.0%) |
| $15,000 to $17,499 | 213 (6.9%) | 69 (3.4%) |
| $17,500 to $19,999 | 83 (2.7%) | 63 (3.1%) |
| $20,000 to $22,499 | 39 (1.3%) | 106 (5.2%) |
| $22,500 to $24,999 | 63 (2.0%) | 188 (9.2%) |
| $25,000 to $29,999 | 146 (4.7%) | 194 (9.5%) |
| $30,000 to $34,999 | 151 (4.9%) | 208 (10.2%) |
| $35,000 to $39,999 | 61 (2.0%) | 74 (3.6%) |
| $40,000 to $44,999 | 182 (5.9%) | 21 (1.0%) |
| $45,000 to $49,999 | 425 (13.8%) | 150 (7.3%) |
| $50,000 to $54,999 | 138 (4.5%) | 100 (4.9%) |
| $55,000 to $64,999 | 388 (12.6%) | 67 (3.3%) |
| $65,000 to $74,999 | 219 (7.1%) | 58 (2.8%) |
| $75,000 to $99,999 | 455 (14.7%) | 42 (2.1%) |
| $100,000+ | 324 (10.5%) | 82 (4.0%) |
| Total | 3,092 (100.0%) | 2,044 (100.0%) |
Earnings by Sex by Educational Attainment in Ochiltree County
Average earnings in Ochiltree County are $54,731 for men and $24,654 for women, a difference of 54.9%. Men with an educational attainment of graduate degree enjoy the highest average annual earnings of $92,000, while those with less than high school education earn the least with $45,000. Women with an educational attainment of graduate degree earn the most with the average annual earnings of $68,300, while those with high school diploma education have the smallest earnings of $18,750.
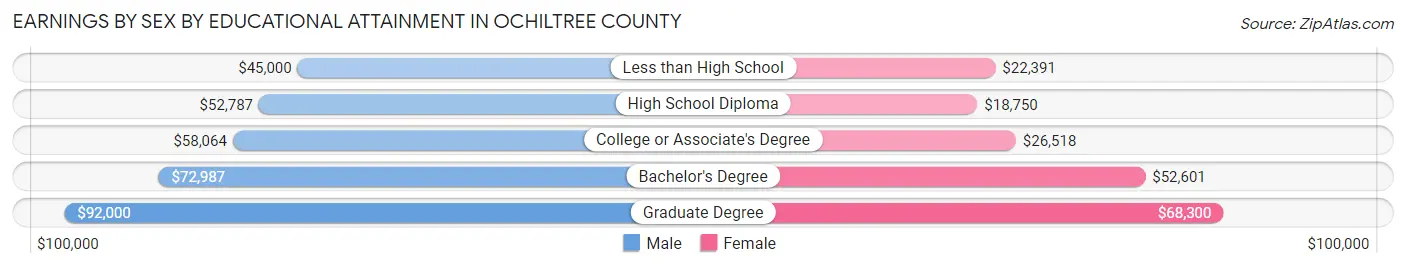
| Educational Attainment | Male Income | Female Income |
| Less than High School | $45,000 | $22,391 |
| High School Diploma | $52,787 | $18,750 |
| College or Associate's Degree | $58,064 | $26,518 |
| Bachelor's Degree | $72,987 | $52,601 |
| Graduate Degree | $92,000 | $68,300 |
| Total | $54,731 | $24,654 |
Family Income in Ochiltree County
Family Income Brackets in Ochiltree County
According to the Ochiltree County family income data, there are 596 families falling into the $100,000 to $149,999 income range, which is the most common income bracket and makes up 22.6% of all families. Conversely, the $10,000 to $14,999 income bracket is the least frequent group with only 34 families (1.3%) belonging to this category.
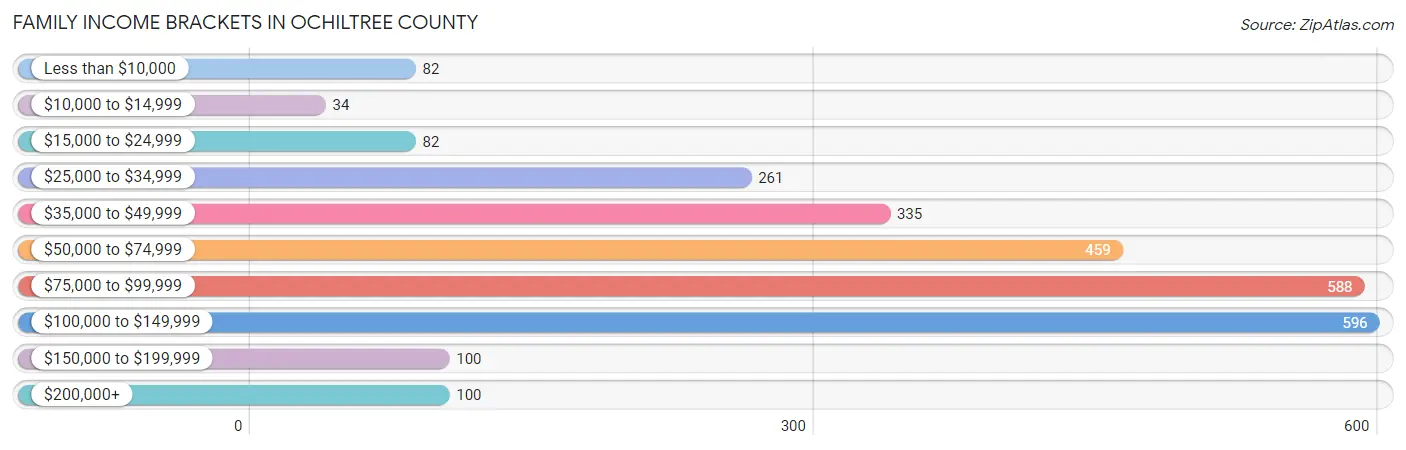
| Income Bracket | # Families | % Families |
| Less than $10,000 | 82 | 3.1% |
| $10,000 to $14,999 | 34 | 1.3% |
| $15,000 to $24,999 | 82 | 3.1% |
| $25,000 to $34,999 | 261 | 9.9% |
| $35,000 to $49,999 | 335 | 12.7% |
| $50,000 to $74,999 | 459 | 17.4% |
| $75,000 to $99,999 | 588 | 22.3% |
| $100,000 to $149,999 | 596 | 22.6% |
| $150,000 to $199,999 | 100 | 3.8% |
| $200,000+ | 100 | 3.8% |
Family Income by Famaliy Size in Ochiltree County
5-person families (294 | 11.2%) account for the highest median family income in Ochiltree County with $90,375 per family, while 2-person families (1,140 | 43.2%) have the highest median income of $40,092 per family member.
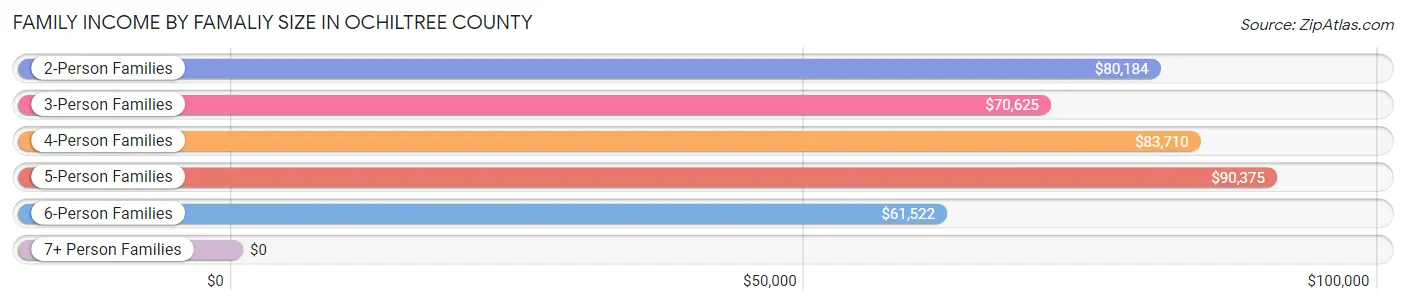
| Income Bracket | # Families | Median Income |
| 2-Person Families | 1,140 (43.2%) | $80,184 |
| 3-Person Families | 443 (16.8%) | $70,625 |
| 4-Person Families | 521 (19.8%) | $83,710 |
| 5-Person Families | 294 (11.2%) | $90,375 |
| 6-Person Families | 222 (8.4%) | $61,522 |
| 7+ Person Families | 17 (0.6%) | $0 |
| Total | 2,637 (100.0%) | $77,117 |
Family Income by Number of Earners in Ochiltree County
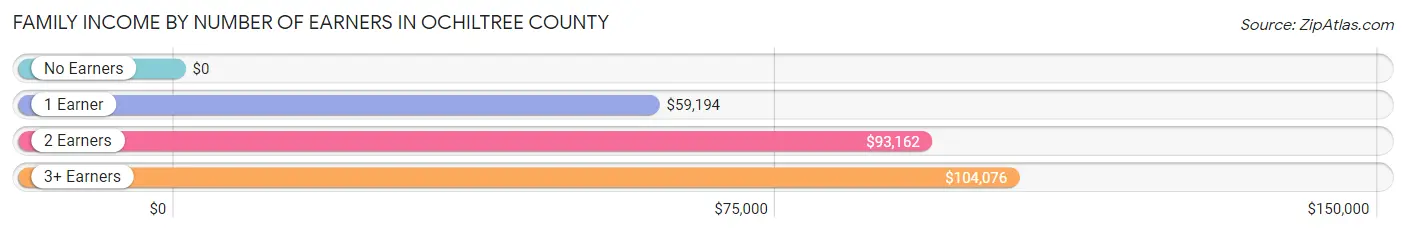
| Number of Earners | # Families | Median Income |
| No Earners | 150 (5.7%) | $0 |
| 1 Earner | 1,286 (48.8%) | $59,194 |
| 2 Earners | 1,030 (39.1%) | $93,162 |
| 3+ Earners | 171 (6.5%) | $104,076 |
| Total | 2,637 (100.0%) | $77,117 |
Household Income in Ochiltree County
Household Income Brackets in Ochiltree County
With 652 households falling in the category, the $100,000 to $149,999 income range is the most frequent in Ochiltree County, accounting for 17.7% of all households. In contrast, only 122 households (3.3%) fall into the $10,000 to $14,999 income bracket, making it the least populous group.
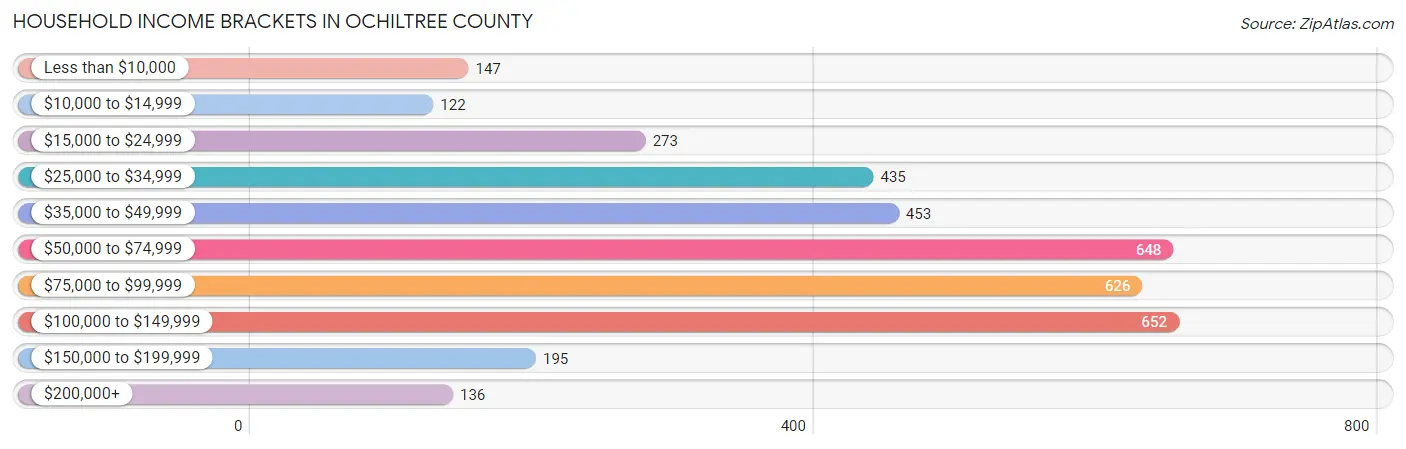
| Income Bracket | # Households | % Households |
| Less than $10,000 | 147 | 4.0% |
| $10,000 to $14,999 | 122 | 3.3% |
| $15,000 to $24,999 | 273 | 7.4% |
| $25,000 to $34,999 | 435 | 11.8% |
| $35,000 to $49,999 | 453 | 12.3% |
| $50,000 to $74,999 | 648 | 17.6% |
| $75,000 to $99,999 | 626 | 17.0% |
| $100,000 to $149,999 | 652 | 17.7% |
| $150,000 to $199,999 | 195 | 5.3% |
| $200,000+ | 136 | 3.7% |
Household Income by Householder Age in Ochiltree County
The median household income in Ochiltree County is $62,240, with the highest median household income of $78,839 found in the 45 to 64 years age bracket for the primary householder. A total of 1,262 households (34.3%) fall into this category. Meanwhile, the 15 to 24 years age bracket for the primary householder has the lowest median household income of $47,368, with 290 households (7.9%) in this group.
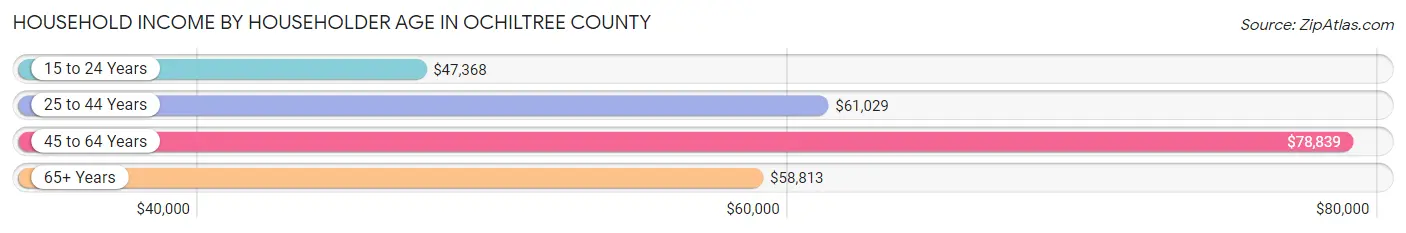
| Income Bracket | # Households | Median Income |
| 15 to 24 Years | 290 (7.9%) | $47,368 |
| 25 to 44 Years | 1,482 (40.2%) | $61,029 |
| 45 to 64 Years | 1,262 (34.3%) | $78,839 |
| 65+ Years | 650 (17.6%) | $58,813 |
| Total | 3,684 (100.0%) | $62,240 |
Poverty in Ochiltree County
Income Below Poverty by Sex and Age in Ochiltree County
With 8.9% poverty level for males and 15.6% for females among the residents of Ochiltree County, 12 to 14 year old males and 65 to 74 year old females are the most vulnerable to poverty, with 57 males (27.8%) and 87 females (27.9%) in their respective age groups living below the poverty level.
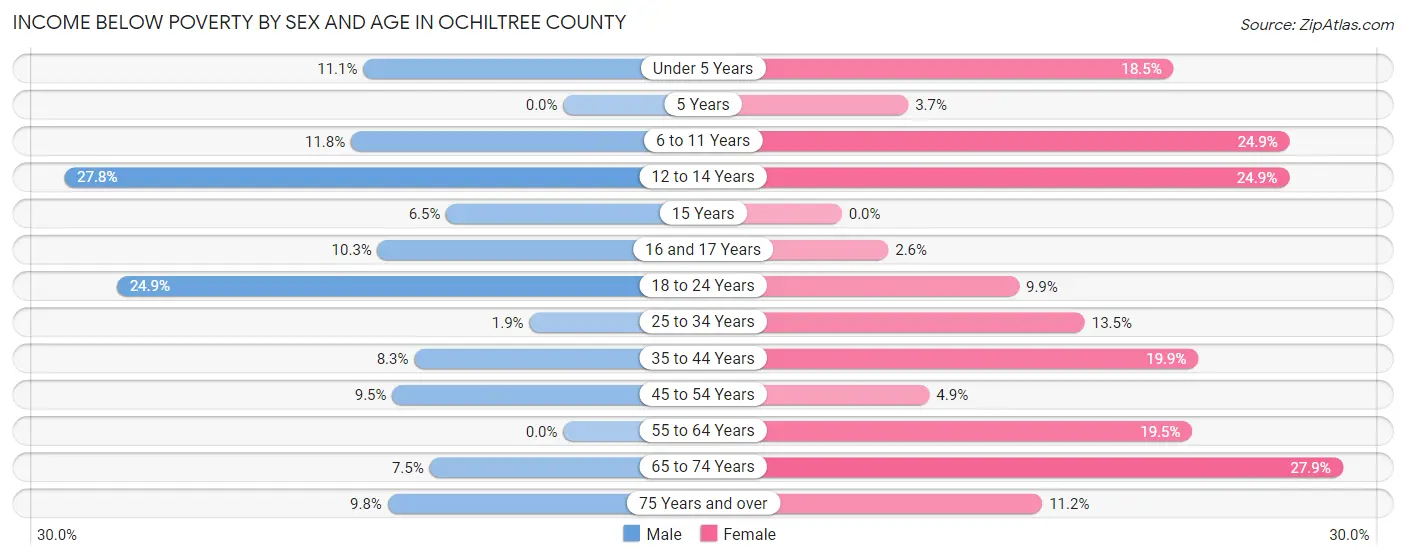
| Age Bracket | Male | Female |
| Under 5 Years | 41 (11.1%) | 70 (18.5%) |
| 5 Years | 0 (0.0%) | 6 (3.7%) |
| 6 to 11 Years | 67 (11.8%) | 104 (24.9%) |
| 12 to 14 Years | 57 (27.8%) | 63 (24.9%) |
| 15 Years | 3 (6.5%) | 0 (0.0%) |
| 16 and 17 Years | 18 (10.3%) | 7 (2.6%) |
| 18 to 24 Years | 95 (24.9%) | 45 (9.9%) |
| 25 to 34 Years | 15 (1.9%) | 87 (13.5%) |
| 35 to 44 Years | 60 (8.3%) | 130 (19.9%) |
| 45 to 54 Years | 42 (9.5%) | 22 (4.9%) |
| 55 to 64 Years | 0 (0.0%) | 115 (19.5%) |
| 65 to 74 Years | 21 (7.4%) | 87 (27.9%) |
| 75 Years and over | 18 (9.8%) | 27 (11.2%) |
| Total | 437 (8.9%) | 763 (15.6%) |
Income Above Poverty by Sex and Age in Ochiltree County
According to the poverty statistics in Ochiltree County, males aged 5 years and females aged 15 years are the age groups that are most secure financially, with 100.0% of males and 100.0% of females in these age groups living above the poverty line.
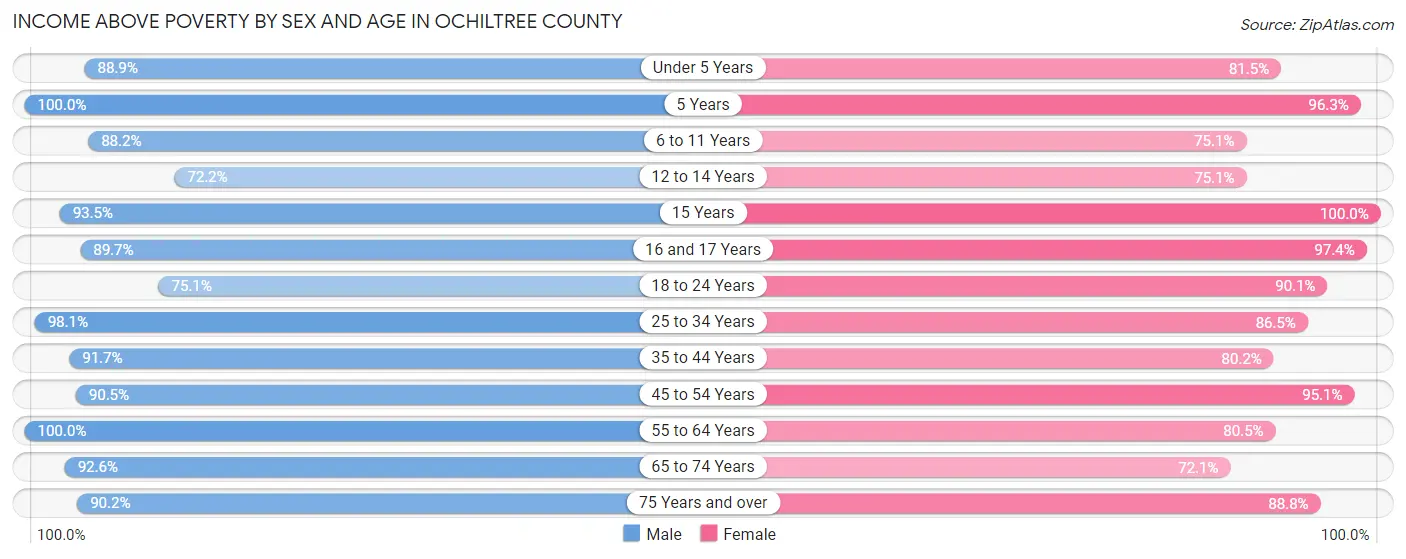
| Age Bracket | Male | Female |
| Under 5 Years | 327 (88.9%) | 309 (81.5%) |
| 5 Years | 70 (100.0%) | 156 (96.3%) |
| 6 to 11 Years | 500 (88.2%) | 313 (75.1%) |
| 12 to 14 Years | 148 (72.2%) | 190 (75.1%) |
| 15 Years | 43 (93.5%) | 67 (100.0%) |
| 16 and 17 Years | 156 (89.7%) | 263 (97.4%) |
| 18 to 24 Years | 287 (75.1%) | 411 (90.1%) |
| 25 to 34 Years | 778 (98.1%) | 556 (86.5%) |
| 35 to 44 Years | 663 (91.7%) | 525 (80.1%) |
| 45 to 54 Years | 399 (90.5%) | 429 (95.1%) |
| 55 to 64 Years | 692 (100.0%) | 474 (80.5%) |
| 65 to 74 Years | 261 (92.5%) | 225 (72.1%) |
| 75 Years and over | 166 (90.2%) | 215 (88.8%) |
| Total | 4,490 (91.1%) | 4,133 (84.4%) |
Income Below Poverty Among Married-Couple Families in Ochiltree County
The poverty statistics for married-couple families in Ochiltree County show that 5.6% or 97 of the total 1,725 families live below the poverty line. Families with 3 or 4 children have the highest poverty rate of 9.4%, comprising of 33 families. On the other hand, families with 5 or more children have the lowest poverty rate of 0.0%, which includes 0 families.
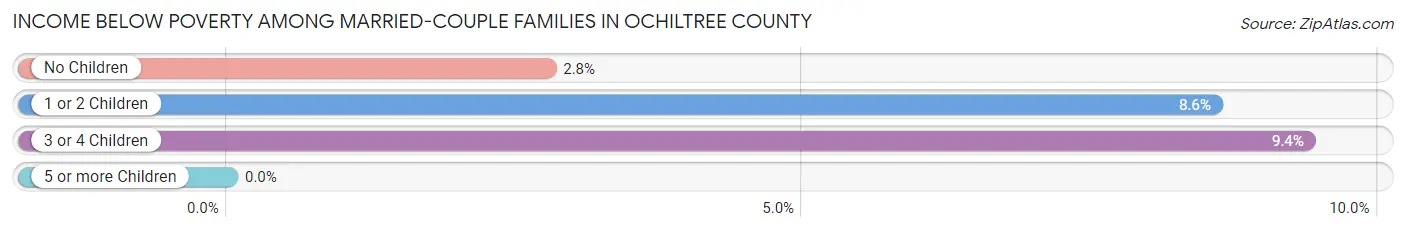
| Children | Above Poverty | Below Poverty |
| No Children | 876 (97.2%) | 25 (2.8%) |
| 1 or 2 Children | 416 (91.4%) | 39 (8.6%) |
| 3 or 4 Children | 319 (90.6%) | 33 (9.4%) |
| 5 or more Children | 17 (100.0%) | 0 (0.0%) |
| Total | 1,628 (94.4%) | 97 (5.6%) |
Income Below Poverty Among Single-Parent Households in Ochiltree County
| Children | Single Father | Single Mother |
| No Children | 0 (0.0%) | 4 (4.5%) |
| 1 or 2 Children | 0 (0.0%) | 43 (13.7%) |
| 3 or 4 Children | 0 (0.0%) | 80 (44.9%) |
| 5 or more Children | 0 (0.0%) | 0 (0.0%) |
| Total | 0 (0.0%) | 127 (21.9%) |
Income Below Poverty Among Married-Couple vs Single-Parent Households in Ochiltree County
The poverty data for Ochiltree County shows that 97 of the married-couple family households (5.6%) and 127 of the single-parent households (13.9%) are living below the poverty level. Within the married-couple family households, those with 3 or 4 children have the highest poverty rate, with 33 households (9.4%) falling below the poverty line. Among the single-parent households, those with 3 or 4 children have the highest poverty rate, with 80 household (38.1%) living below poverty.
| Children | Married-Couple Families | Single-Parent Households |
| No Children | 25 (2.8%) | 4 (2.3%) |
| 1 or 2 Children | 39 (8.6%) | 43 (8.1%) |
| 3 or 4 Children | 33 (9.4%) | 80 (38.1%) |
| 5 or more Children | 0 (0.0%) | 0 (0.0%) |
| Total | 97 (5.6%) | 127 (13.9%) |
Race in Ochiltree County
The most populous races in Ochiltree County are White / Caucasian (7,261 | 73.2%), Hispanic or Latino (5,571 | 56.1%), and Some other Race (1,344 | 13.5%).
| Race | # Population | % Population |
| Asian | 45 | 0.4% |
| Black / African American | 82 | 0.8% |
| Hawaiian / Pacific | 0 | 0.0% |
| Hispanic or Latino | 5,571 | 56.1% |
| Native / Alaskan | 103 | 1.0% |
| White / Caucasian | 7,261 | 73.2% |
| Two or more Races | 1,089 | 11.0% |
| Some other Race | 1,344 | 13.5% |
| Total | 9,924 | 100.0% |
Ancestry in Ochiltree County
The most populous ancestries reported in Ochiltree County are Mexican (5,458 | 55.0%), German (756 | 7.6%), English (733 | 7.4%), Irish (497 | 5.0%), and American (391 | 3.9%), together accounting for 79.0% of all Ochiltree County residents.
| Ancestry | # Population | % Population |
| American | 391 | 3.9% |
| Apache | 6 | 0.1% |
| Bhutanese | 34 | 0.3% |
| Blackfeet | 27 | 0.3% |
| British | 32 | 0.3% |
| Central American | 3 | 0.0% |
| Central American Indian | 13 | 0.1% |
| Cherokee | 16 | 0.2% |
| Choctaw | 15 | 0.2% |
| Creek | 59 | 0.6% |
| Cuban | 44 | 0.4% |
| Czech | 12 | 0.1% |
| Dutch | 31 | 0.3% |
| Eastern European | 3 | 0.0% |
| English | 733 | 7.4% |
| European | 53 | 0.5% |
| French | 121 | 1.2% |
| French Canadian | 9 | 0.1% |
| German | 756 | 7.6% |
| Guatemalan | 3 | 0.0% |
| Irish | 497 | 5.0% |
| Iroquois | 11 | 0.1% |
| Italian | 38 | 0.4% |
| Mexican | 5,458 | 55.0% |
| Mexican American Indian | 20 | 0.2% |
| Norwegian | 46 | 0.5% |
| Pennsylvania German | 1 | 0.0% |
| Polish | 15 | 0.2% |
| Potawatomi | 11 | 0.1% |
| Russian | 23 | 0.2% |
| Scandinavian | 17 | 0.2% |
| Scotch-Irish | 46 | 0.5% |
| Scottish | 93 | 0.9% |
| Sioux | 23 | 0.2% |
| Spaniard | 6 | 0.1% |
| Spanish | 41 | 0.4% |
| Swedish | 6 | 0.1% |
| Swiss | 12 | 0.1% |
| Thai | 45 | 0.4% |
| Welsh | 58 | 0.6% | View All 40 Rows |
Immigrants in Ochiltree County
The most numerous immigrant groups reported in Ochiltree County came from Latin America (3,024 | 30.5%), Central America (2,980 | 30.0%), Mexico (2,977 | 30.0%), Asia (57 | 0.6%), and India (45 | 0.4%), together accounting for 91.5% of all Ochiltree County residents.
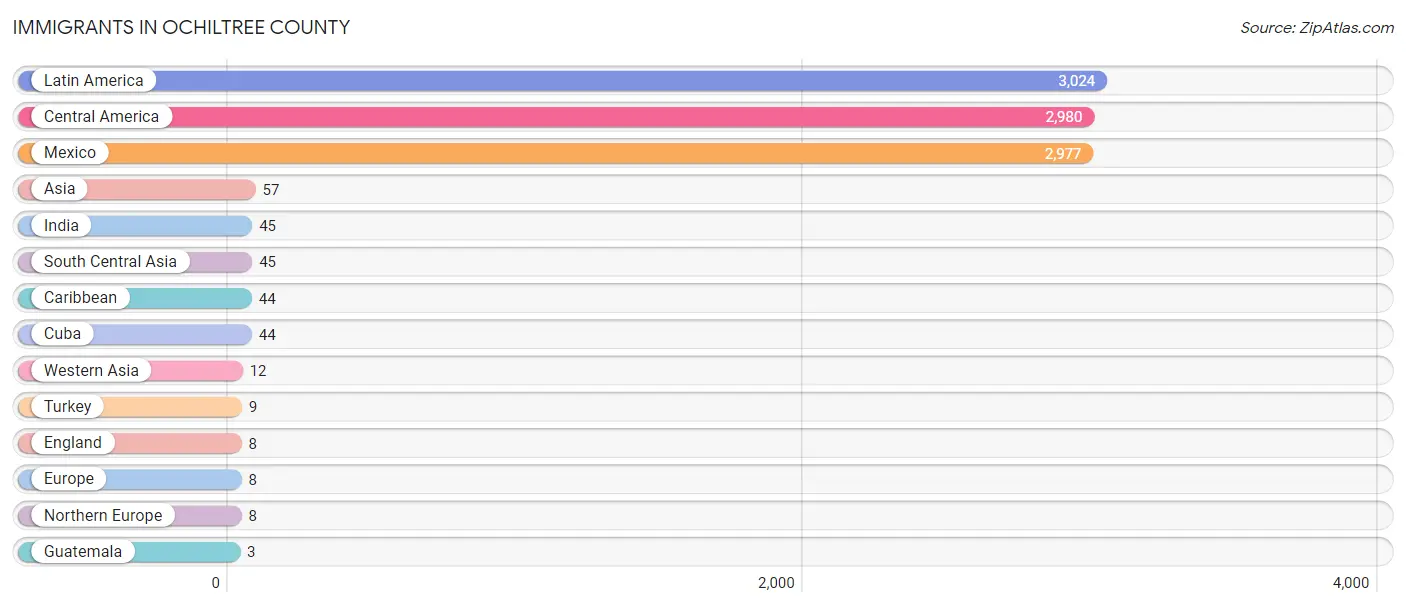
| Immigration Origin | # Population | % Population |
| Asia | 57 | 0.6% |
| Caribbean | 44 | 0.4% |
| Central America | 2,980 | 30.0% |
| Cuba | 44 | 0.4% |
| England | 8 | 0.1% |
| Europe | 8 | 0.1% |
| Guatemala | 3 | 0.0% |
| India | 45 | 0.4% |
| Latin America | 3,024 | 30.5% |
| Mexico | 2,977 | 30.0% |
| Northern Europe | 8 | 0.1% |
| South Central Asia | 45 | 0.4% |
| Turkey | 9 | 0.1% |
| Western Asia | 12 | 0.1% | View All 14 Rows |
Sex and Age in Ochiltree County
Sex and Age in Ochiltree County
The most populous age groups in Ochiltree County are 40 to 44 Years (459 | 9.2%) for men and 55 to 59 Years (453 | 9.2%) for women.
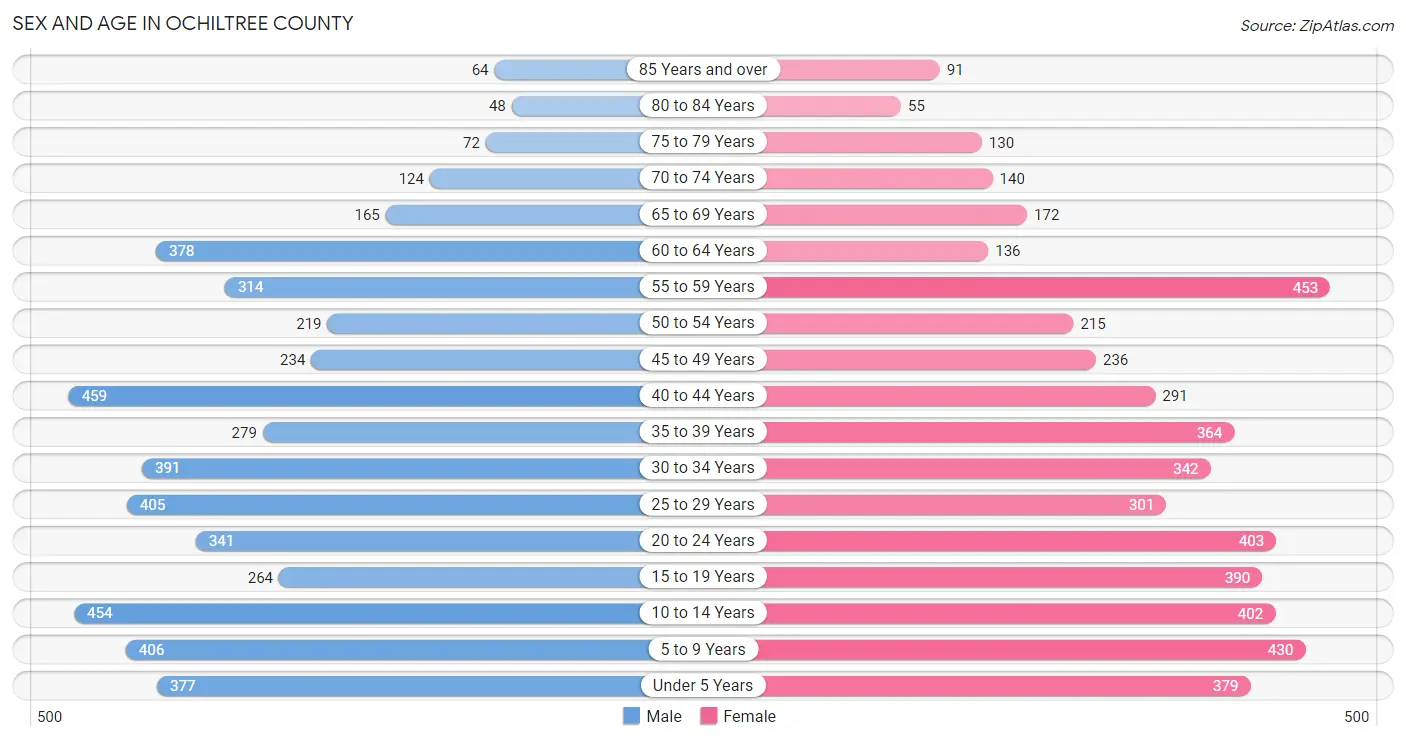
| Age Bracket | Male | Female |
| Under 5 Years | 377 (7.5%) | 379 (7.7%) |
| 5 to 9 Years | 406 (8.1%) | 430 (8.7%) |
| 10 to 14 Years | 454 (9.1%) | 402 (8.2%) |
| 15 to 19 Years | 264 (5.3%) | 390 (7.9%) |
| 20 to 24 Years | 341 (6.8%) | 403 (8.2%) |
| 25 to 29 Years | 405 (8.1%) | 301 (6.1%) |
| 30 to 34 Years | 391 (7.8%) | 342 (6.9%) |
| 35 to 39 Years | 279 (5.6%) | 364 (7.4%) |
| 40 to 44 Years | 459 (9.2%) | 291 (5.9%) |
| 45 to 49 Years | 234 (4.7%) | 236 (4.8%) |
| 50 to 54 Years | 219 (4.4%) | 215 (4.4%) |
| 55 to 59 Years | 314 (6.3%) | 453 (9.2%) |
| 60 to 64 Years | 378 (7.6%) | 136 (2.8%) |
| 65 to 69 Years | 165 (3.3%) | 172 (3.5%) |
| 70 to 74 Years | 124 (2.5%) | 140 (2.8%) |
| 75 to 79 Years | 72 (1.4%) | 130 (2.6%) |
| 80 to 84 Years | 48 (1.0%) | 55 (1.1%) |
| 85 Years and over | 64 (1.3%) | 91 (1.8%) |
| Total | 4,994 (100.0%) | 4,930 (100.0%) |
Families and Households in Ochiltree County
Median Family Size in Ochiltree County
The median family size in Ochiltree County is 3.14 persons per family, with married-couple families (1,725 | 65.4%) accounting for the largest median family size of 3.28 persons per family. On the other hand, single female/mother families (581 | 22.0%) represent the smallest median family size with 2.82 persons per family.
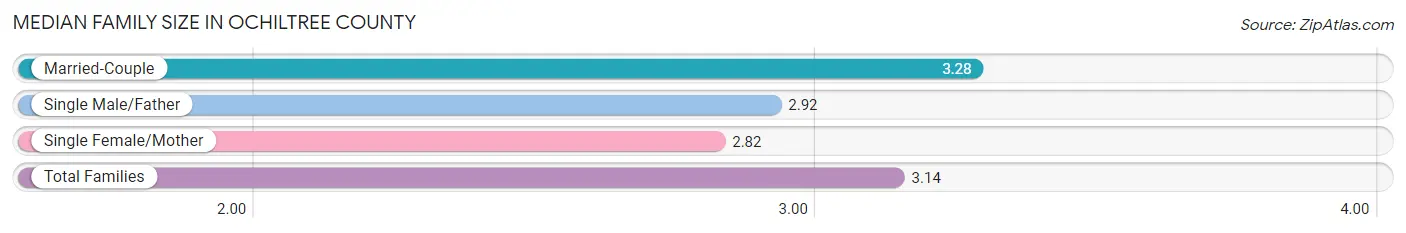
| Family Type | # Families | Family Size |
| Married-Couple | 1,725 (65.4%) | 3.28 |
| Single Male/Father | 331 (12.6%) | 2.92 |
| Single Female/Mother | 581 (22.0%) | 2.82 |
| Total Families | 2,637 (100.0%) | 3.14 |
Median Household Size in Ochiltree County
The median household size in Ochiltree County is 2.67 persons per household, with single male/father households (331 | 9.0%) accounting for the largest median household size of 3.34 persons per household. non-family households (1,047 | 28.4%) represent the smallest median household size with 1.18 persons per household.
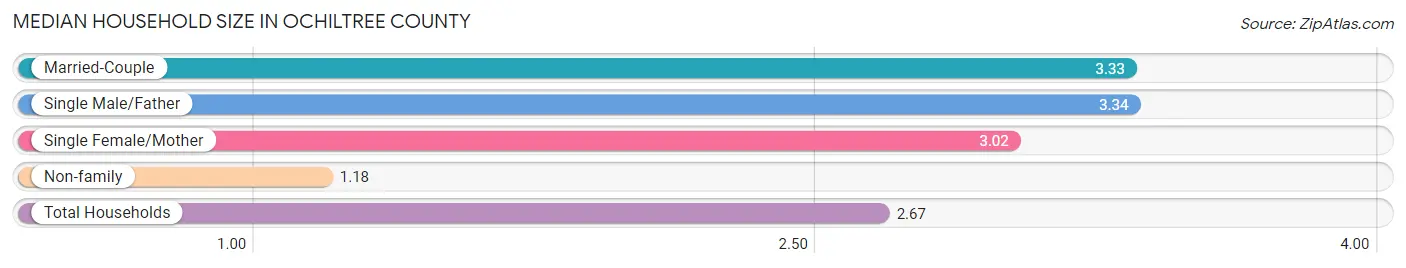
| Household Type | # Households | Household Size |
| Married-Couple | 1,725 (46.8%) | 3.33 |
| Single Male/Father | 331 (9.0%) | 3.34 |
| Single Female/Mother | 581 (15.8%) | 3.02 |
| Non-family | 1,047 (28.4%) | 1.18 |
| Total Households | 3,684 (100.0%) | 2.67 |
Household Size by Marriage Status in Ochiltree County
Out of a total of 3,684 households in Ochiltree County, 2,637 (71.6%) are family households, while 1,047 (28.4%) are nonfamily households. The most numerous type of family households are 2-person households, comprising 1,057, and the most common type of nonfamily households are 1-person households, comprising 887.
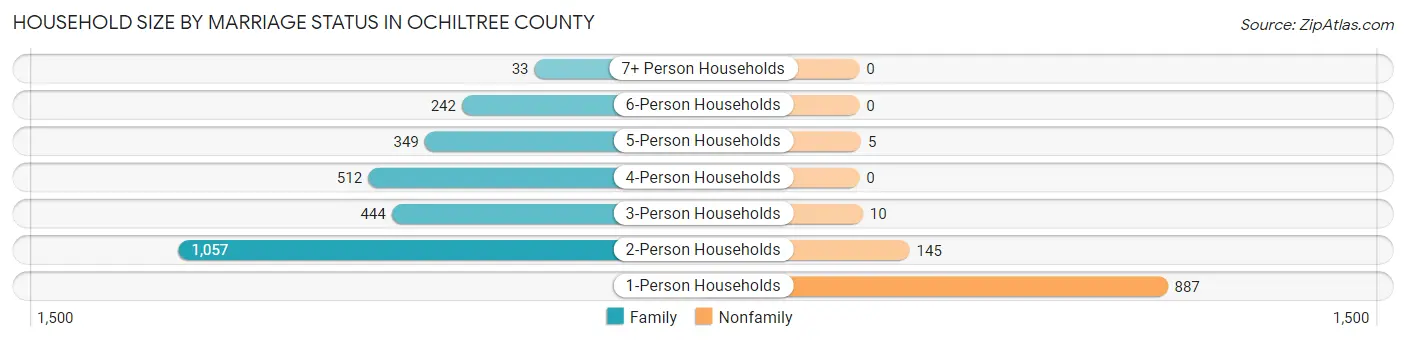
| Household Size | Family Households | Nonfamily Households |
| 1-Person Households | - | 887 (24.1%) |
| 2-Person Households | 1,057 (28.7%) | 145 (3.9%) |
| 3-Person Households | 444 (12.0%) | 10 (0.3%) |
| 4-Person Households | 512 (13.9%) | 0 (0.0%) |
| 5-Person Households | 349 (9.5%) | 5 (0.1%) |
| 6-Person Households | 242 (6.6%) | 0 (0.0%) |
| 7+ Person Households | 33 (0.9%) | 0 (0.0%) |
| Total | 2,637 (71.6%) | 1,047 (28.4%) |
Female Fertility in Ochiltree County
Fertility by Age in Ochiltree County
Average fertility rate in Ochiltree County is 87.0 births per 1,000 women. Women in the age bracket of 20 to 34 years have the highest fertility rate with 150.0 births per 1,000 women. Women in the age bracket of 20 to 34 years acount for 77.0% of all women with births.
| Age Bracket | Women with Births | Births / 1,000 Women |
| 15 to 19 years | 36 (17.6%) | 92.0 |
| 20 to 34 years | 157 (77.0%) | 150.0 |
| 35 to 50 years | 11 (5.4%) | 12.0 |
| Total | 204 (100.0%) | 87.0 |
Fertility by Age by Marriage Status in Ochiltree County
55.4% of women with births (204) in Ochiltree County are married. The highest percentage of unmarried women with births falls into 15 to 19 years age bracket with 100.0% of them unmarried at the time of birth, while the lowest percentage of unmarried women with births belong to 35 to 50 years age bracket with 18.2% of them unmarried.
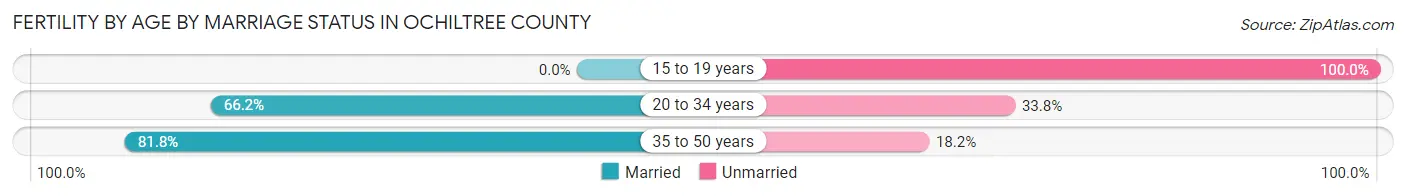
| Age Bracket | Married | Unmarried |
| 15 to 19 years | 0 (0.0%) | 36 (100.0%) |
| 20 to 34 years | 104 (66.2%) | 53 (33.8%) |
| 35 to 50 years | 9 (81.8%) | 2 (18.2%) |
| Total | 113 (55.4%) | 91 (44.6%) |
Fertility by Education in Ochiltree County
Average fertility rate in Ochiltree County is 87.0 births per 1,000 women. Women with the education attainment of high school diploma have the highest fertility rate of 123.0 births per 1,000 women, while women with the education attainment of graduate degree have the lowest fertility at 32.0 births per 1,000 women. Women with the education attainment of high school diploma represent 38.2% of all women with births.
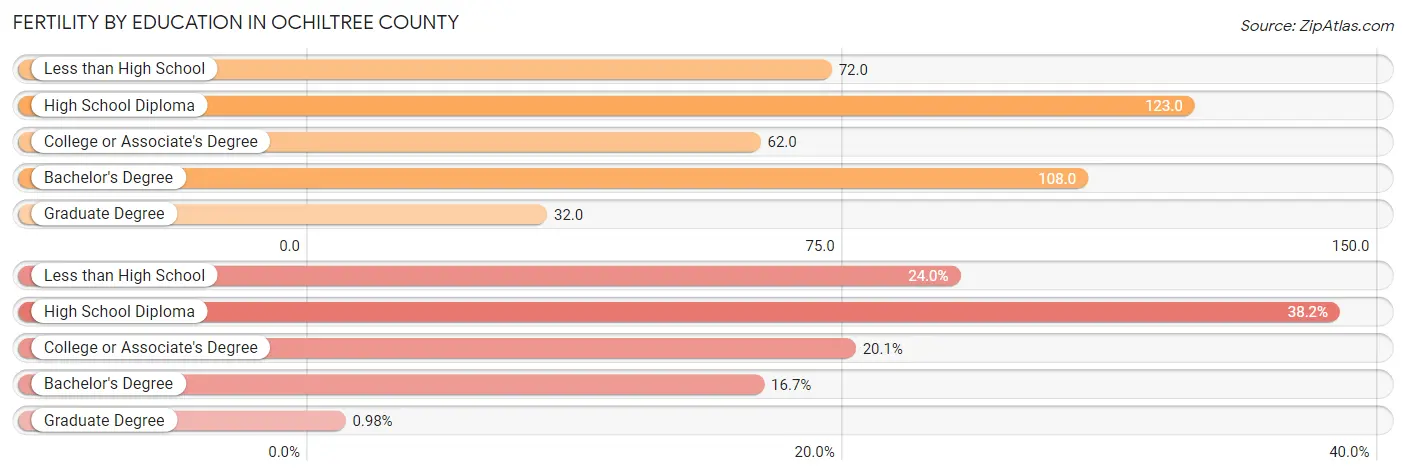
| Educational Attainment | Women with Births | Births / 1,000 Women |
| Less than High School | 49 (24.0%) | 72.0 |
| High School Diploma | 78 (38.2%) | 123.0 |
| College or Associate's Degree | 41 (20.1%) | 62.0 |
| Bachelor's Degree | 34 (16.7%) | 108.0 |
| Graduate Degree | 2 (1.0%) | 32.0 |
| Total | 204 (100.0%) | 87.0 |
Fertility by Education by Marriage Status in Ochiltree County
44.6% of women with births in Ochiltree County are unmarried. Women with the educational attainment of bachelor's degree are most likely to be married with 100.0% of them married at childbirth, while women with the educational attainment of graduate degree are least likely to be married with 100.0% of them unmarried at childbirth.
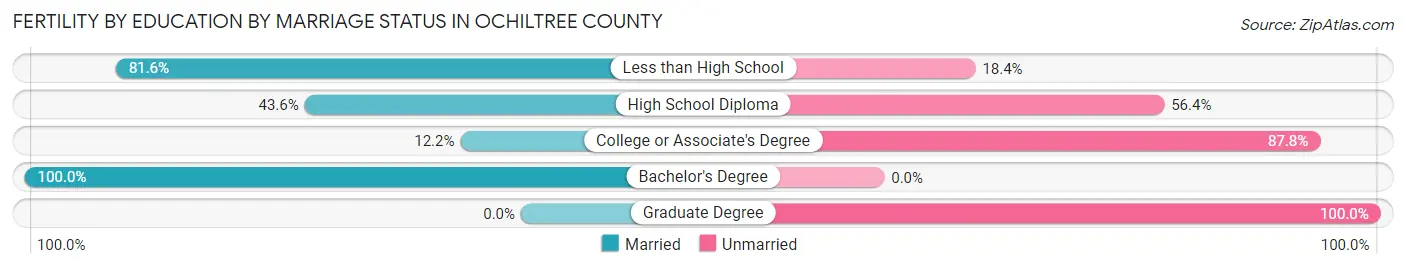
| Educational Attainment | Married | Unmarried |
| Less than High School | 40 (81.6%) | 9 (18.4%) |
| High School Diploma | 34 (43.6%) | 44 (56.4%) |
| College or Associate's Degree | 5 (12.2%) | 36 (87.8%) |
| Bachelor's Degree | 34 (100.0%) | 0 (0.0%) |
| Graduate Degree | 0 (0.0%) | 2 (100.0%) |
| Total | 113 (55.4%) | 91 (44.6%) |
Employment Characteristics in Ochiltree County
Employment by Class of Employer in Ochiltree County
Among the 4,804 employed individuals in Ochiltree County, private company employees (3,557 | 74.0%), local government employees (546 | 11.4%), and self-employed (not incorporated) (296 | 6.2%) make up the most common classes of employment.
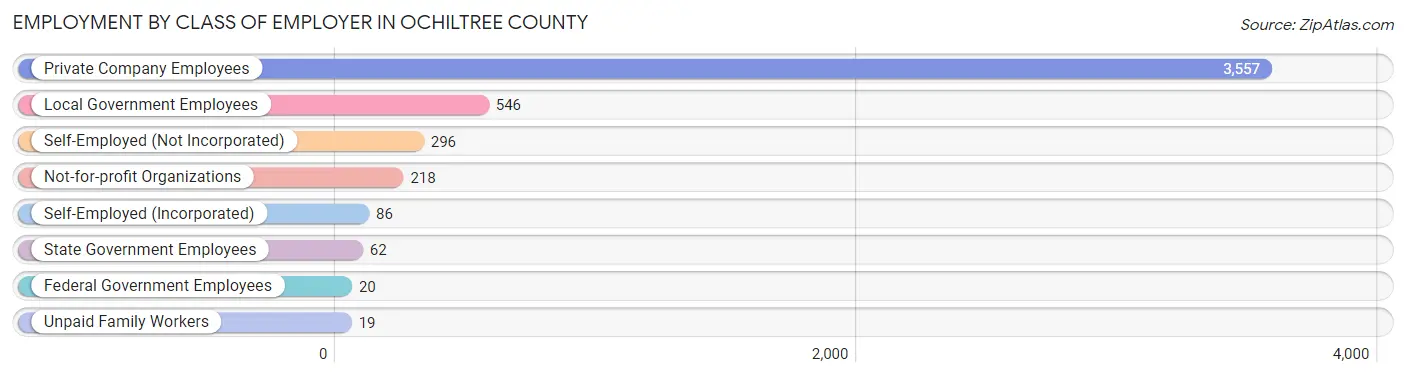
| Employer Class | # Employees | % Employees |
| Private Company Employees | 3,557 | 74.0% |
| Self-Employed (Incorporated) | 86 | 1.8% |
| Self-Employed (Not Incorporated) | 296 | 6.2% |
| Not-for-profit Organizations | 218 | 4.5% |
| Local Government Employees | 546 | 11.4% |
| State Government Employees | 62 | 1.3% |
| Federal Government Employees | 20 | 0.4% |
| Unpaid Family Workers | 19 | 0.4% |
| Total | 4,804 | 100.0% |
Employment Status by Age in Ochiltree County
According to the labor force statistics for Ochiltree County, out of the total population over 16 years of age (7,363), 67.3% or 4,955 individuals are in the labor force, with 1.5% or 74 of them unemployed. The age group with the highest labor force participation rate is 30 to 34 years, with 86.8% or 636 individuals in the labor force. Within the labor force, the 16 to 19 years age range has the highest percentage of unemployed individuals, with 17.8% or 21 of them being unemployed.
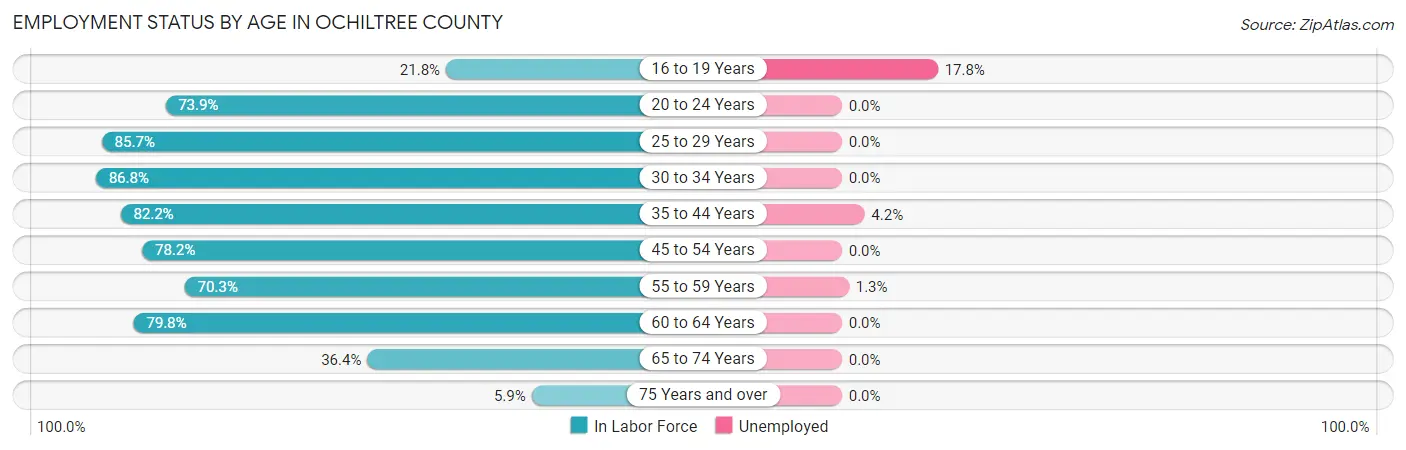
| Age Bracket | In Labor Force | Unemployed |
| 16 to 19 Years | 118 (21.8%) | 21 (17.8%) |
| 20 to 24 Years | 550 (73.9%) | 0 (0.0%) |
| 25 to 29 Years | 605 (85.7%) | 0 (0.0%) |
| 30 to 34 Years | 636 (86.8%) | 0 (0.0%) |
| 35 to 44 Years | 1,145 (82.2%) | 48 (4.2%) |
| 45 to 54 Years | 707 (78.2%) | 0 (0.0%) |
| 55 to 59 Years | 539 (70.3%) | 7 (1.3%) |
| 60 to 64 Years | 410 (79.8%) | 0 (0.0%) |
| 65 to 74 Years | 219 (36.4%) | 0 (0.0%) |
| 75 Years and over | 27 (5.9%) | 0 (0.0%) |
| Total | 4,955 (67.3%) | 74 (1.5%) |
Employment Status by Educational Attainment in Ochiltree County
According to labor force statistics for Ochiltree County, 80.6% of individuals (4,044) out of the total population between 25 and 64 years of age (5,017) are in the labor force, with 1.4% or 57 of them being unemployed. The group with the highest labor force participation rate are those with the educational attainment of bachelor's degree or higher, with 92.0% or 820 individuals in the labor force. Within the labor force, individuals with high school diploma education have the highest percentage of unemployment, with 3.3% or 44 of them being unemployed.
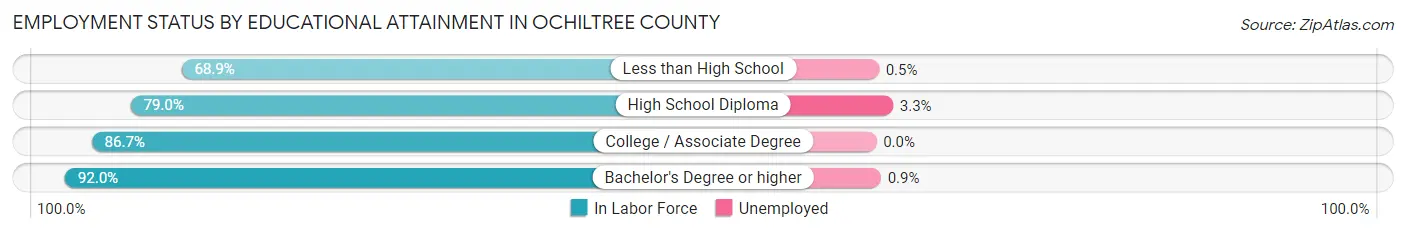
| Educational Attainment | In Labor Force | Unemployed |
| Less than High School | 875 (68.9%) | 6 (0.5%) |
| High School Diploma | 1,334 (79.0%) | 56 (3.3%) |
| College / Associate Degree | 1,013 (86.7%) | 0 (0.0%) |
| Bachelor's Degree or higher | 820 (92.0%) | 8 (0.9%) |
| Total | 4,044 (80.6%) | 70 (1.4%) |
Employment Occupations by Sex in Ochiltree County
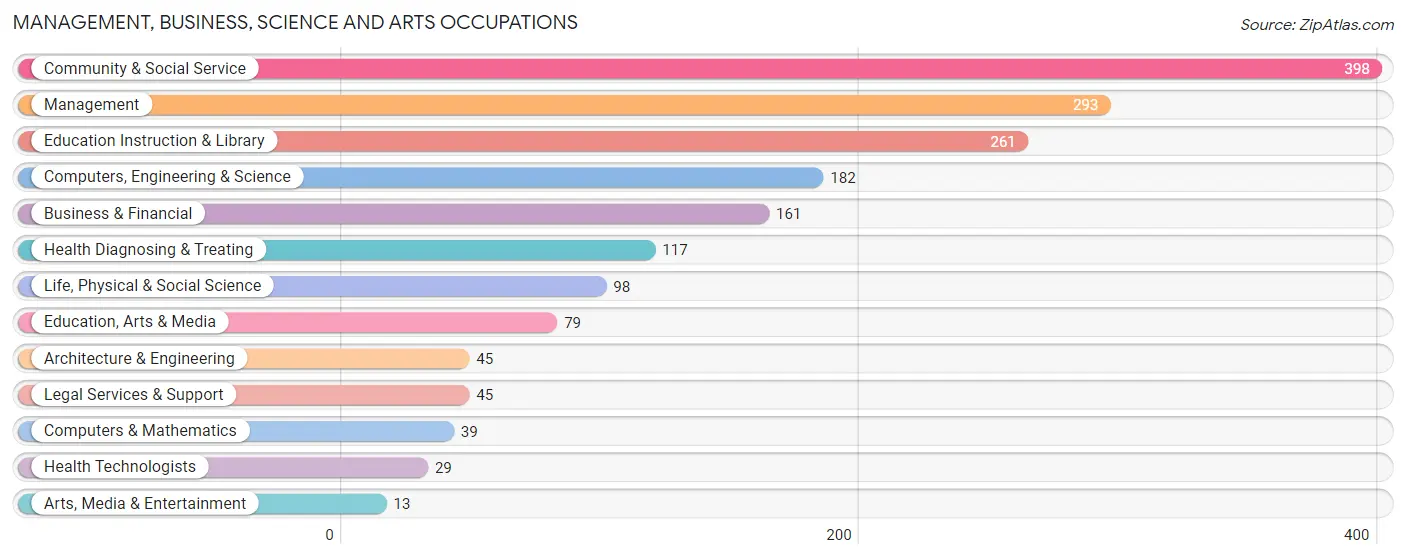
Management, Business, Science and Arts Occupations
The most common Management, Business, Science and Arts occupations in Ochiltree County are Community & Social Service (398 | 8.2%), Management (293 | 6.0%), Education Instruction & Library (261 | 5.3%), Computers, Engineering & Science (182 | 3.7%), and Business & Financial (161 | 3.3%).
Management, Business, Science and Arts Occupations by Sex
Within the Management, Business, Science and Arts occupations in Ochiltree County, the most male-oriented occupations are Architecture & Engineering (100.0%), Management (88.4%), and Business & Financial (57.1%), while the most female-oriented occupations are Legal Services & Support (100.0%), Arts, Media & Entertainment (100.0%), and Health Diagnosing & Treating (92.3%).
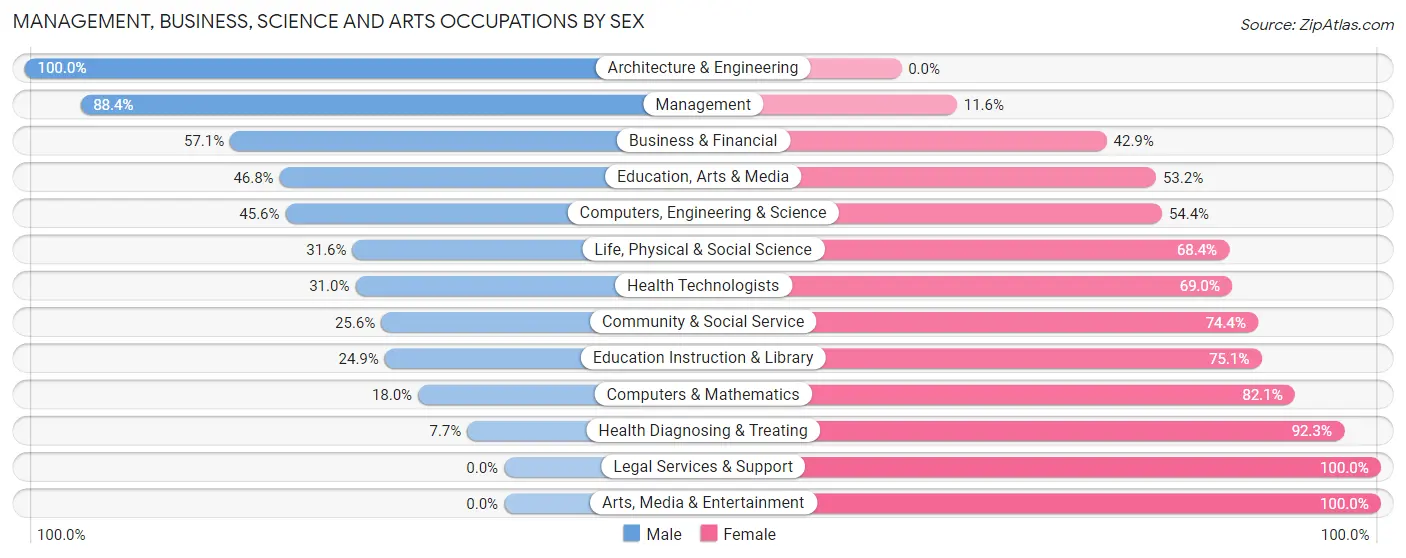
| Occupation | Male | Female |
| Management | 259 (88.4%) | 34 (11.6%) |
| Business & Financial | 92 (57.1%) | 69 (42.9%) |
| Computers, Engineering & Science | 83 (45.6%) | 99 (54.4%) |
| Computers & Mathematics | 7 (17.9%) | 32 (82.1%) |
| Architecture & Engineering | 45 (100.0%) | 0 (0.0%) |
| Life, Physical & Social Science | 31 (31.6%) | 67 (68.4%) |
| Community & Social Service | 102 (25.6%) | 296 (74.4%) |
| Education, Arts & Media | 37 (46.8%) | 42 (53.2%) |
| Legal Services & Support | 0 (0.0%) | 45 (100.0%) |
| Education Instruction & Library | 65 (24.9%) | 196 (75.1%) |
| Arts, Media & Entertainment | 0 (0.0%) | 13 (100.0%) |
| Health Diagnosing & Treating | 9 (7.7%) | 108 (92.3%) |
| Health Technologists | 9 (31.0%) | 20 (69.0%) |
| Total (Category) | 545 (47.3%) | 606 (52.6%) |
| Total (Overall) | 2,927 (60.0%) | 1,953 (40.0%) |
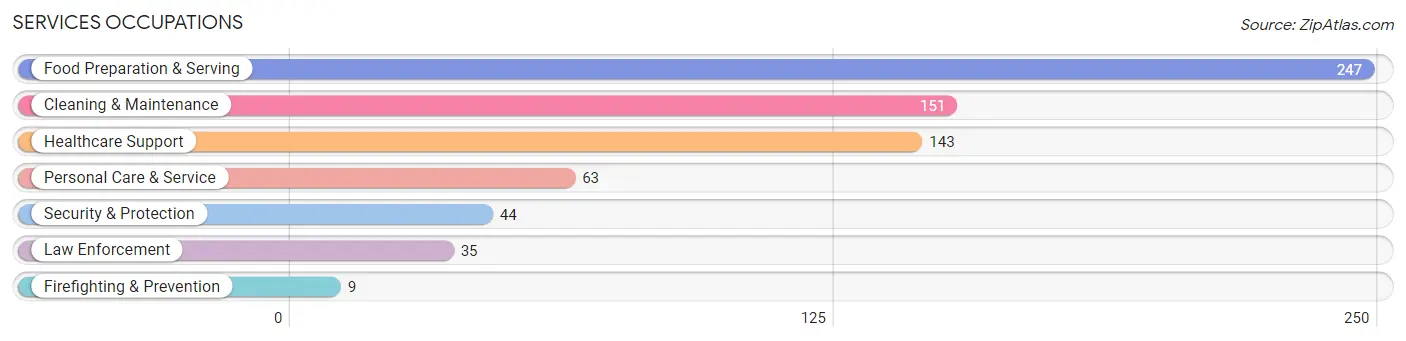
Services Occupations
The most common Services occupations in Ochiltree County are Food Preparation & Serving (247 | 5.1%), Cleaning & Maintenance (151 | 3.1%), Healthcare Support (143 | 2.9%), Personal Care & Service (63 | 1.3%), and Security & Protection (44 | 0.9%).
Services Occupations by Sex
Within the Services occupations in Ochiltree County, the most male-oriented occupations are Firefighting & Prevention (100.0%), Security & Protection (56.8%), and Law Enforcement (45.7%), while the most female-oriented occupations are Healthcare Support (100.0%), Personal Care & Service (100.0%), and Cleaning & Maintenance (88.1%).
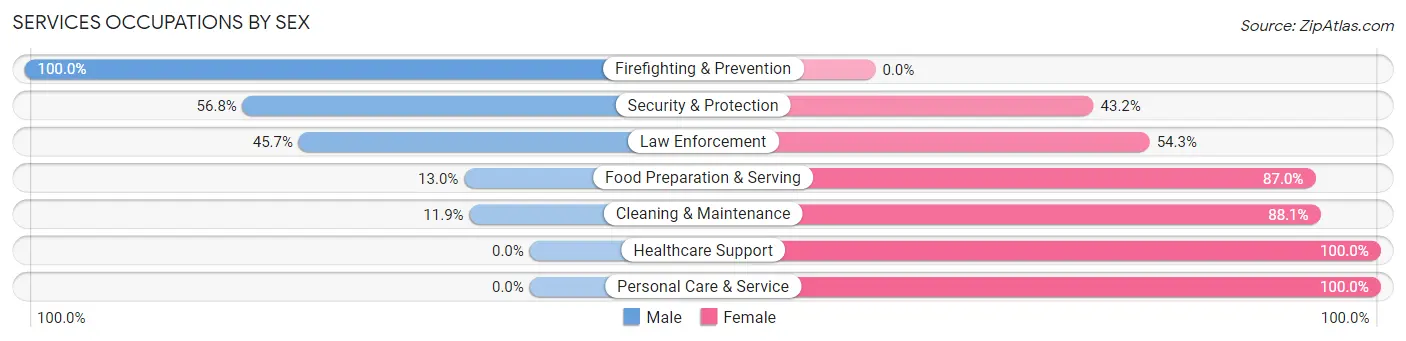
| Occupation | Male | Female |
| Healthcare Support | 0 (0.0%) | 143 (100.0%) |
| Security & Protection | 25 (56.8%) | 19 (43.2%) |
| Firefighting & Prevention | 9 (100.0%) | 0 (0.0%) |
| Law Enforcement | 16 (45.7%) | 19 (54.3%) |
| Food Preparation & Serving | 32 (13.0%) | 215 (87.0%) |
| Cleaning & Maintenance | 18 (11.9%) | 133 (88.1%) |
| Personal Care & Service | 0 (0.0%) | 63 (100.0%) |
| Total (Category) | 75 (11.6%) | 573 (88.4%) |
| Total (Overall) | 2,927 (60.0%) | 1,953 (40.0%) |
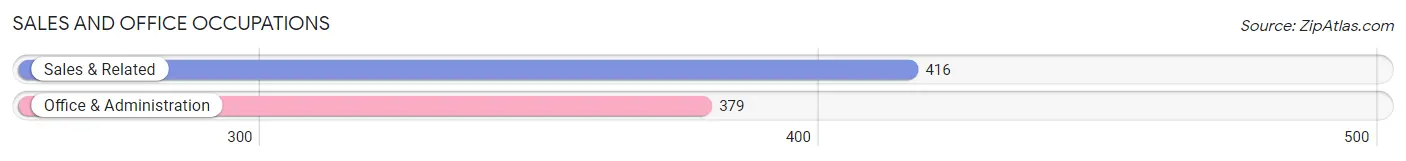
Sales and Office Occupations
The most common Sales and Office occupations in Ochiltree County are Sales & Related (416 | 8.5%), and Office & Administration (379 | 7.8%).
Sales and Office Occupations by Sex
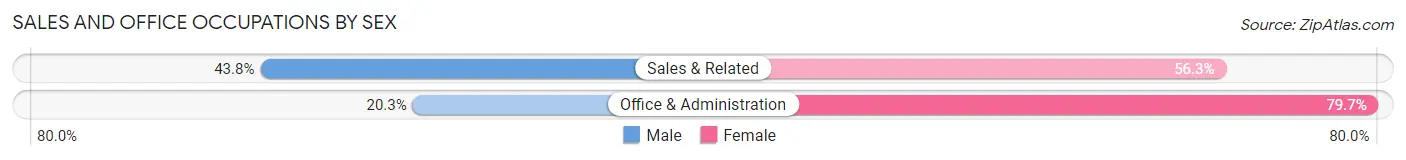
| Occupation | Male | Female |
| Sales & Related | 182 (43.8%) | 234 (56.2%) |
| Office & Administration | 77 (20.3%) | 302 (79.7%) |
| Total (Category) | 259 (32.6%) | 536 (67.4%) |
| Total (Overall) | 2,927 (60.0%) | 1,953 (40.0%) |
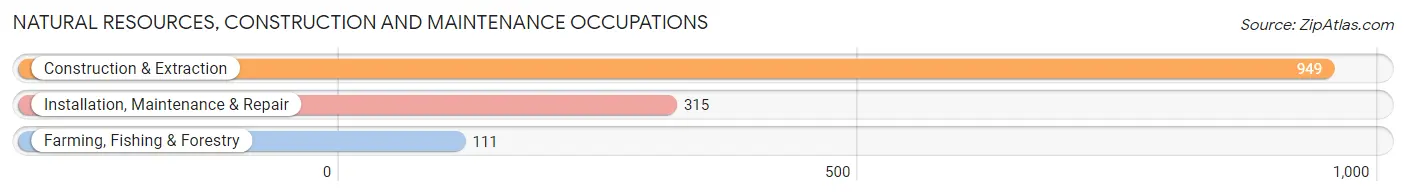
Natural Resources, Construction and Maintenance Occupations
The most common Natural Resources, Construction and Maintenance occupations in Ochiltree County are Construction & Extraction (949 | 19.5%), Installation, Maintenance & Repair (315 | 6.5%), and Farming, Fishing & Forestry (111 | 2.3%).
Natural Resources, Construction and Maintenance Occupations by Sex
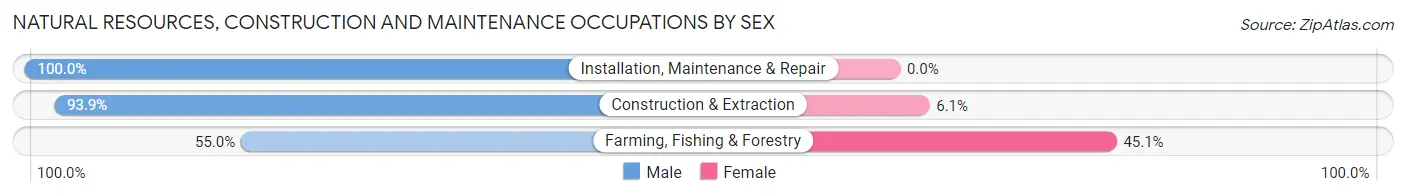
| Occupation | Male | Female |
| Farming, Fishing & Forestry | 61 (54.9%) | 50 (45.1%) |
| Construction & Extraction | 891 (93.9%) | 58 (6.1%) |
| Installation, Maintenance & Repair | 315 (100.0%) | 0 (0.0%) |
| Total (Category) | 1,267 (92.1%) | 108 (7.9%) |
| Total (Overall) | 2,927 (60.0%) | 1,953 (40.0%) |
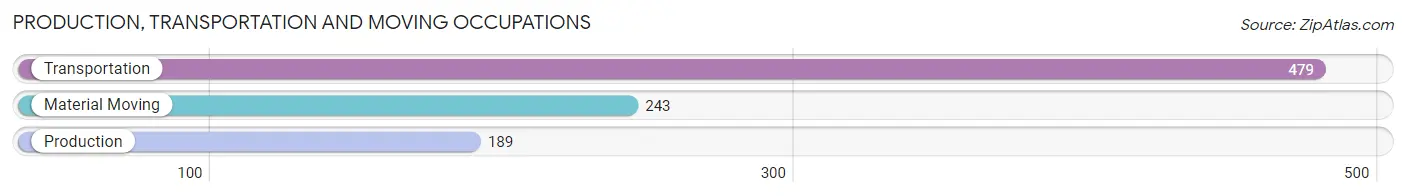
Production, Transportation and Moving Occupations
The most common Production, Transportation and Moving occupations in Ochiltree County are Transportation (479 | 9.8%), Material Moving (243 | 5.0%), and Production (189 | 3.9%).
Production, Transportation and Moving Occupations by Sex
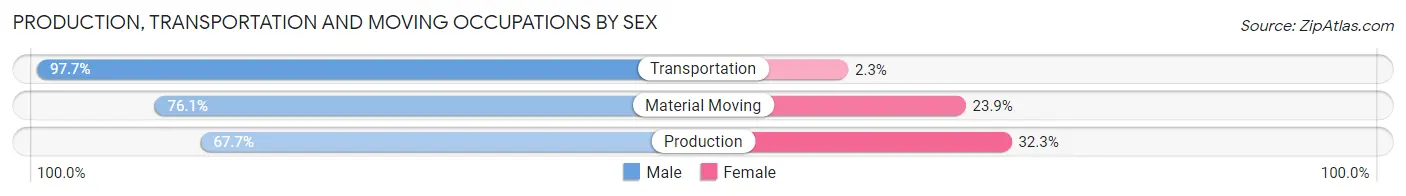
| Occupation | Male | Female |
| Production | 128 (67.7%) | 61 (32.3%) |
| Transportation | 468 (97.7%) | 11 (2.3%) |
| Material Moving | 185 (76.1%) | 58 (23.9%) |
| Total (Category) | 781 (85.7%) | 130 (14.3%) |
| Total (Overall) | 2,927 (60.0%) | 1,953 (40.0%) |
Employment Industries by Sex in Ochiltree County
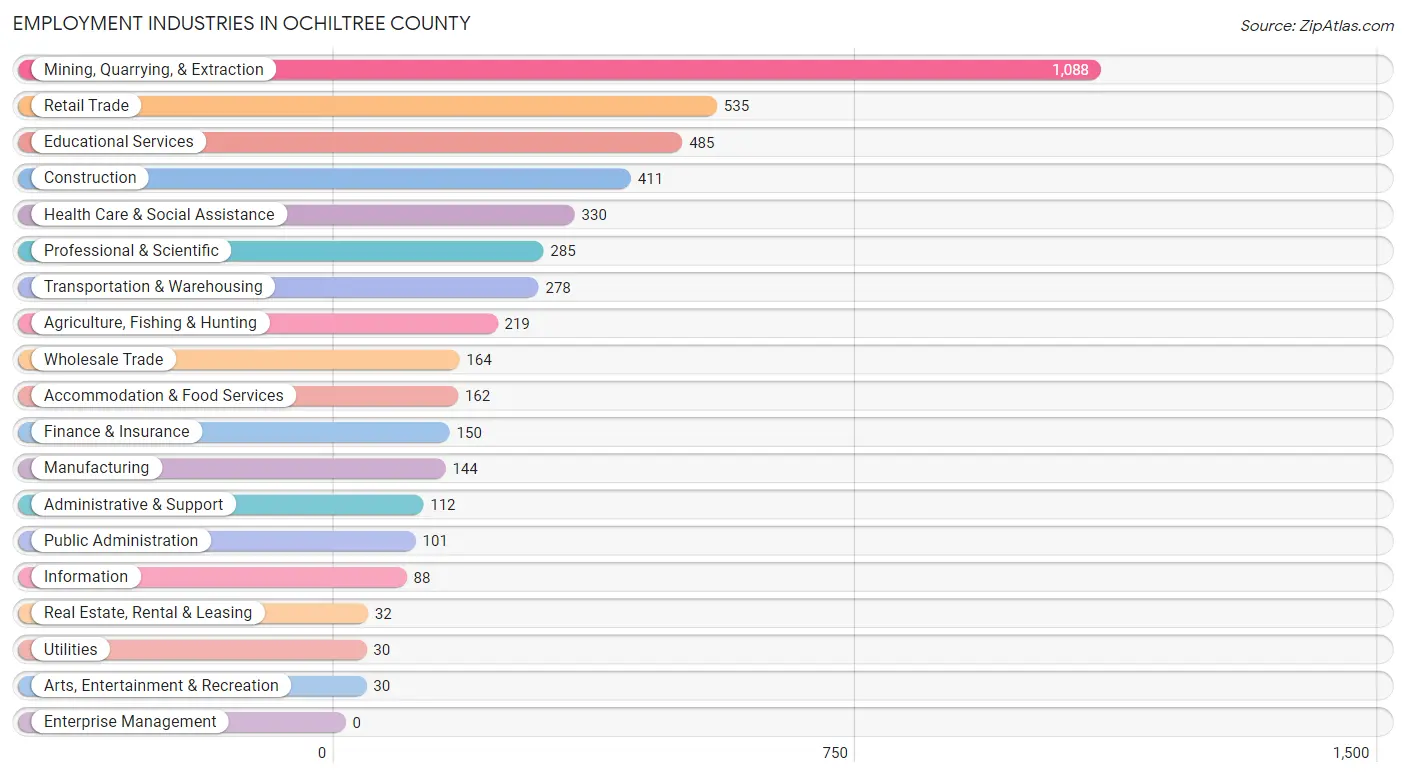
Employment Industries in Ochiltree County
The major employment industries in Ochiltree County include Mining, Quarrying, & Extraction (1,088 | 22.3%), Retail Trade (535 | 11.0%), Educational Services (485 | 9.9%), Construction (411 | 8.4%), and Health Care & Social Assistance (330 | 6.8%).
Employment Industries by Sex in Ochiltree County
The Ochiltree County industries that see more men than women are Construction (100.0%), Arts, Entertainment & Recreation (100.0%), and Mining, Quarrying, & Extraction (97.0%), whereas the industries that tend to have a higher number of women are Health Care & Social Assistance (100.0%), Information (92.0%), and Educational Services (85.2%).
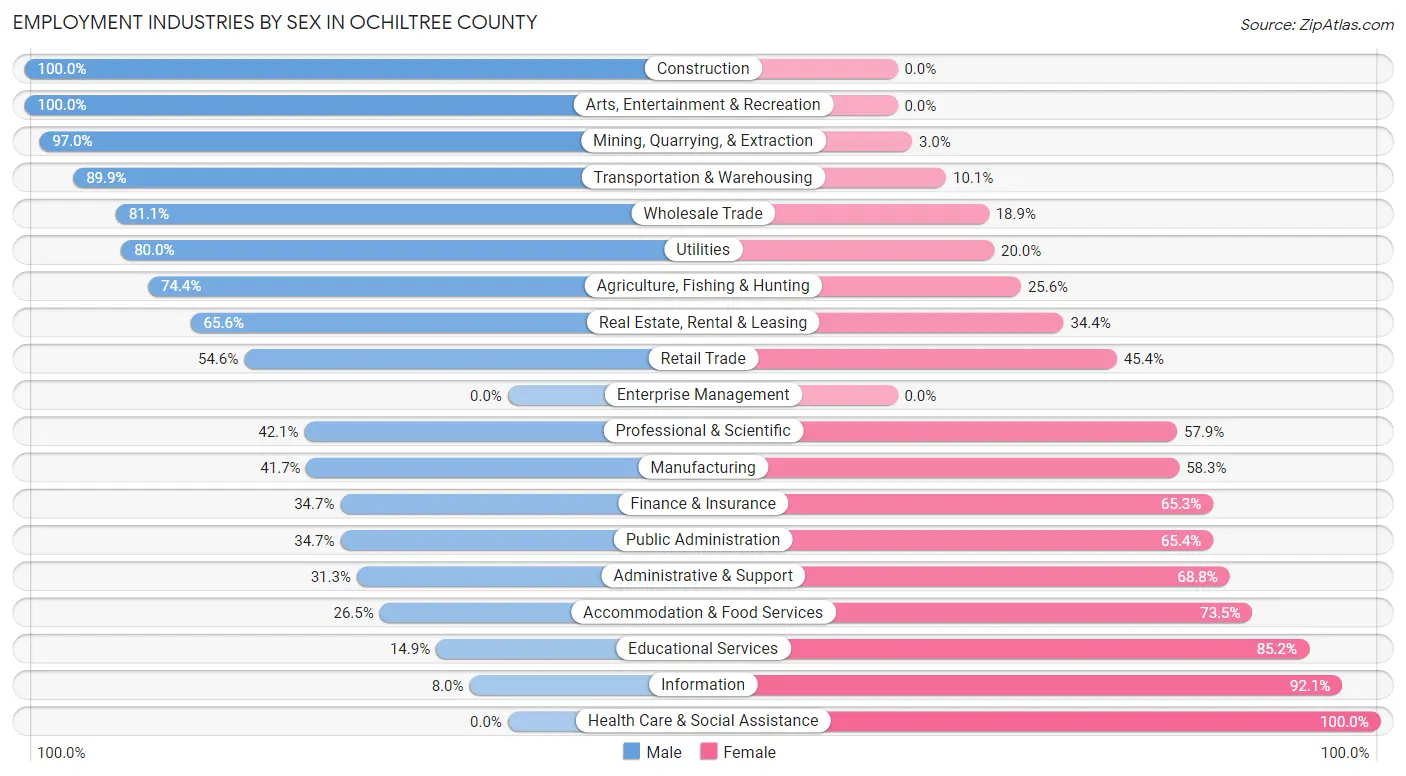
| Industry | Male | Female |
| Agriculture, Fishing & Hunting | 163 (74.4%) | 56 (25.6%) |
| Mining, Quarrying, & Extraction | 1,055 (97.0%) | 33 (3.0%) |
| Construction | 411 (100.0%) | 0 (0.0%) |
| Manufacturing | 60 (41.7%) | 84 (58.3%) |
| Wholesale Trade | 133 (81.1%) | 31 (18.9%) |
| Retail Trade | 292 (54.6%) | 243 (45.4%) |
| Transportation & Warehousing | 250 (89.9%) | 28 (10.1%) |
| Utilities | 24 (80.0%) | 6 (20.0%) |
| Information | 7 (8.0%) | 81 (92.0%) |
| Finance & Insurance | 52 (34.7%) | 98 (65.3%) |
| Real Estate, Rental & Leasing | 21 (65.6%) | 11 (34.4%) |
| Professional & Scientific | 120 (42.1%) | 165 (57.9%) |
| Enterprise Management | 0 (0.0%) | 0 (0.0%) |
| Administrative & Support | 35 (31.2%) | 77 (68.8%) |
| Educational Services | 72 (14.8%) | 413 (85.2%) |
| Health Care & Social Assistance | 0 (0.0%) | 330 (100.0%) |
| Arts, Entertainment & Recreation | 30 (100.0%) | 0 (0.0%) |
| Accommodation & Food Services | 43 (26.5%) | 119 (73.5%) |
| Public Administration | 35 (34.6%) | 66 (65.3%) |
| Total | 2,927 (60.0%) | 1,953 (40.0%) |
Education in Ochiltree County
School Enrollment in Ochiltree County
The most common levels of schooling among the 2,769 students in Ochiltree County are middle school (663 | 23.9%), high school (626 | 22.6%), and elementary school (542 | 19.6%).
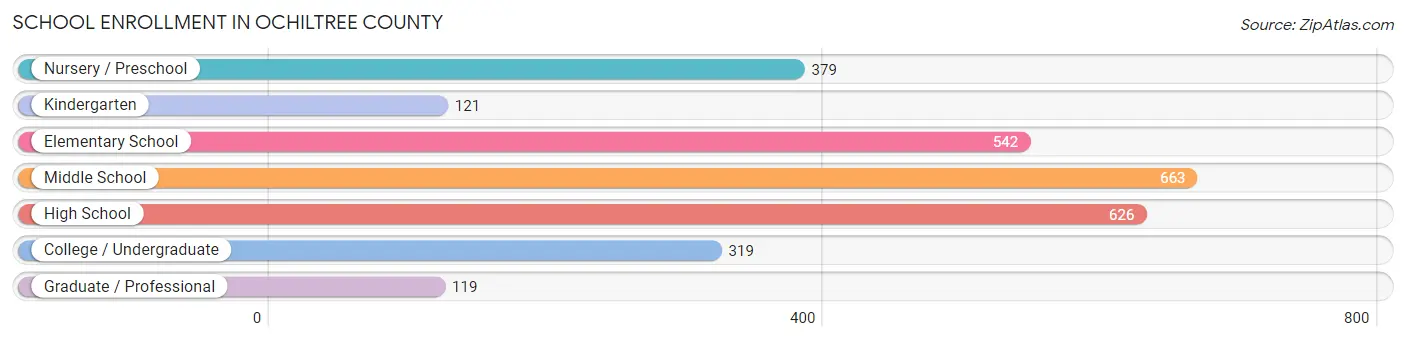
| School Level | # Students | % Students |
| Nursery / Preschool | 379 | 13.7% |
| Kindergarten | 121 | 4.4% |
| Elementary School | 542 | 19.6% |
| Middle School | 663 | 23.9% |
| High School | 626 | 22.6% |
| College / Undergraduate | 319 | 11.5% |
| Graduate / Professional | 119 | 4.3% |
| Total | 2,769 | 100.0% |
School Enrollment by Age by Funding Source in Ochiltree County
Out of a total of 2,769 students who are enrolled in schools in Ochiltree County, 280 (10.1%) attend a private institution, while the remaining 2,489 (89.9%) are enrolled in public schools. The age group of 20 to 24 year olds has the highest likelihood of being enrolled in private schools, with 136 (61.5% in the age bracket) enrolled. Conversely, the age group of 18 to 19 year olds has the lowest likelihood of being enrolled in a private school, with 66 (100.0% in the age bracket) attending a public institution.
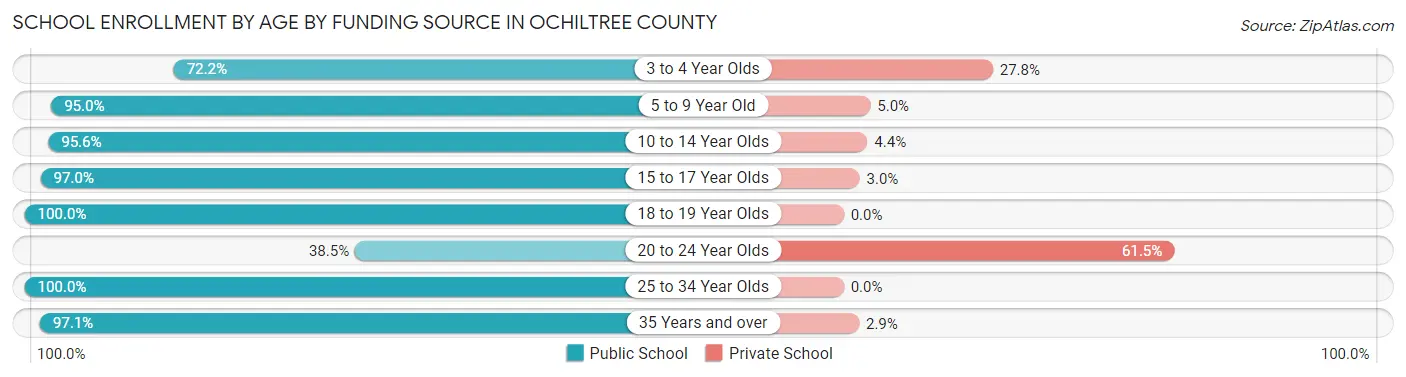
| Age Bracket | Public School | Private School |
| 3 to 4 Year Olds | 130 (72.2%) | 50 (27.8%) |
| 5 to 9 Year Old | 727 (95.0%) | 38 (5.0%) |
| 10 to 14 Year Olds | 778 (95.6%) | 36 (4.4%) |
| 15 to 17 Year Olds | 523 (97.0%) | 16 (3.0%) |
| 18 to 19 Year Olds | 66 (100.0%) | 0 (0.0%) |
| 20 to 24 Year Olds | 85 (38.5%) | 136 (61.5%) |
| 25 to 34 Year Olds | 44 (100.0%) | 0 (0.0%) |
| 35 Years and over | 136 (97.1%) | 4 (2.9%) |
| Total | 2,489 (89.9%) | 280 (10.1%) |
Educational Attainment by Field of Study in Ochiltree County
Business (221 | 18.9%), science & technology (206 | 17.6%), education (166 | 14.2%), arts & humanities (122 | 10.4%), and bio, nature & agricultural (83 | 7.1%) are the most common fields of study among 1,171 individuals in Ochiltree County who have obtained a bachelor's degree or higher.
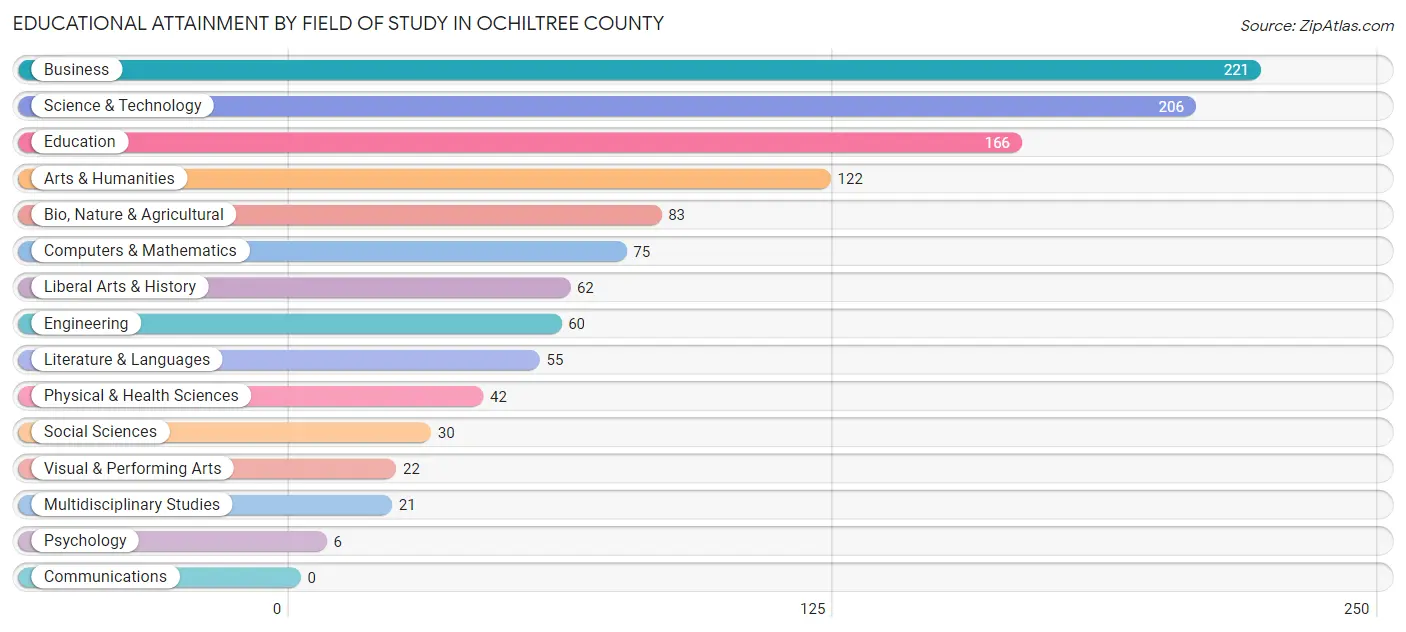
| Field of Study | # Graduates | % Graduates |
| Computers & Mathematics | 75 | 6.4% |
| Bio, Nature & Agricultural | 83 | 7.1% |
| Physical & Health Sciences | 42 | 3.6% |
| Psychology | 6 | 0.5% |
| Social Sciences | 30 | 2.6% |
| Engineering | 60 | 5.1% |
| Multidisciplinary Studies | 21 | 1.8% |
| Science & Technology | 206 | 17.6% |
| Business | 221 | 18.9% |
| Education | 166 | 14.2% |
| Literature & Languages | 55 | 4.7% |
| Liberal Arts & History | 62 | 5.3% |
| Visual & Performing Arts | 22 | 1.9% |
| Communications | 0 | 0.0% |
| Arts & Humanities | 122 | 10.4% |
| Total | 1,171 | 100.0% |
Transportation & Commute in Ochiltree County
Vehicle Availability by Sex in Ochiltree County
The most prevalent vehicle ownership categories in Ochiltree County are males with 2 vehicles (1,528, accounting for 53.3%) and females with 2 vehicles (947, making up 79.0%).
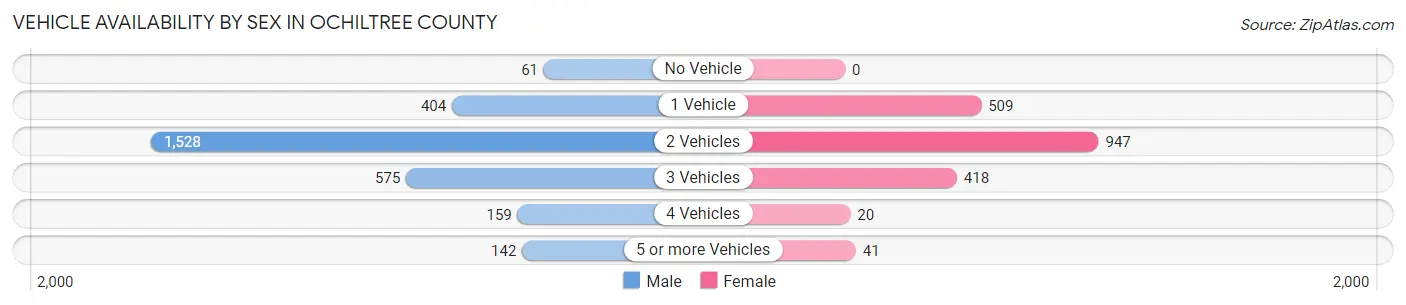
| Vehicles Available | Male | Female |
| No Vehicle | 61 (2.1%) | 0 (0.0%) |
| 1 Vehicle | 404 (14.1%) | 509 (26.3%) |
| 2 Vehicles | 1,528 (53.3%) | 947 (48.9%) |
| 3 Vehicles | 575 (20.0%) | 418 (21.6%) |
| 4 Vehicles | 159 (5.5%) | 20 (1.0%) |
| 5 or more Vehicles | 142 (5.0%) | 41 (2.1%) |
| Total | 2,869 (100.0%) | 1,935 (100.0%) |
Commute Time in Ochiltree County
The most frequently occuring commute durations in Ochiltree County are 5 to 9 minutes (1,625 commuters, 34.5%), less than 5 minutes (762 commuters, 16.2%), and 15 to 19 minutes (593 commuters, 12.6%).
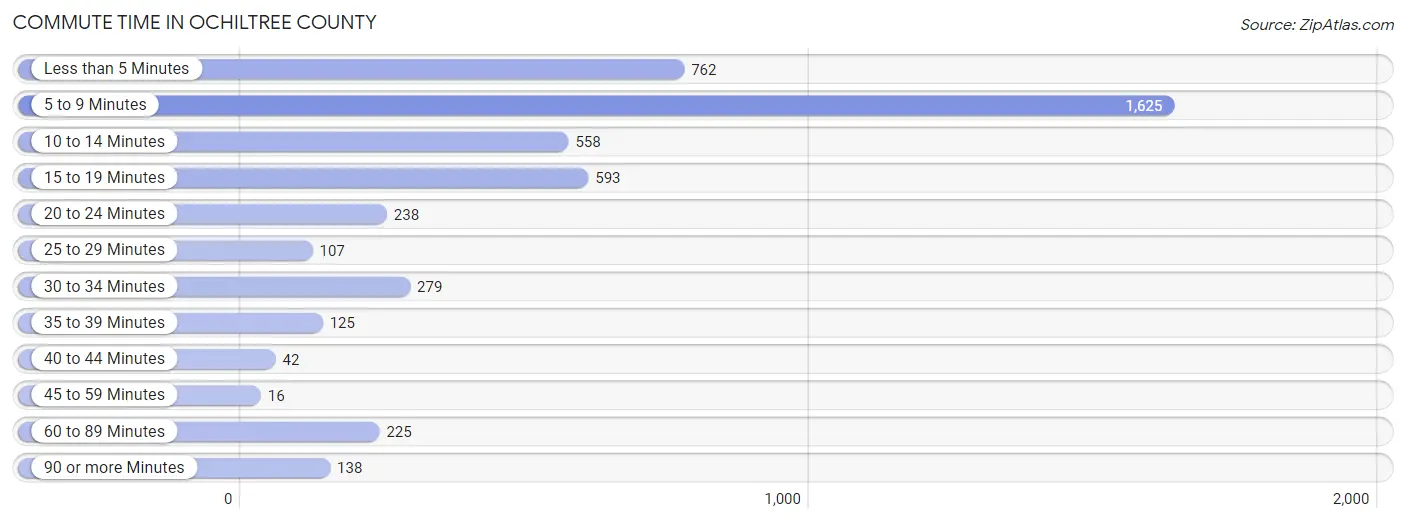
| Commute Time | # Commuters | % Commuters |
| Less than 5 Minutes | 762 | 16.2% |
| 5 to 9 Minutes | 1,625 | 34.5% |
| 10 to 14 Minutes | 558 | 11.8% |
| 15 to 19 Minutes | 593 | 12.6% |
| 20 to 24 Minutes | 238 | 5.1% |
| 25 to 29 Minutes | 107 | 2.3% |
| 30 to 34 Minutes | 279 | 5.9% |
| 35 to 39 Minutes | 125 | 2.7% |
| 40 to 44 Minutes | 42 | 0.9% |
| 45 to 59 Minutes | 16 | 0.3% |
| 60 to 89 Minutes | 225 | 4.8% |
| 90 or more Minutes | 138 | 2.9% |
Commute Time by Sex in Ochiltree County
The most common commute times in Ochiltree County are 5 to 9 minutes (885 commuters, 31.2%) for males and 5 to 9 minutes (740 commuters, 39.6%) for females.
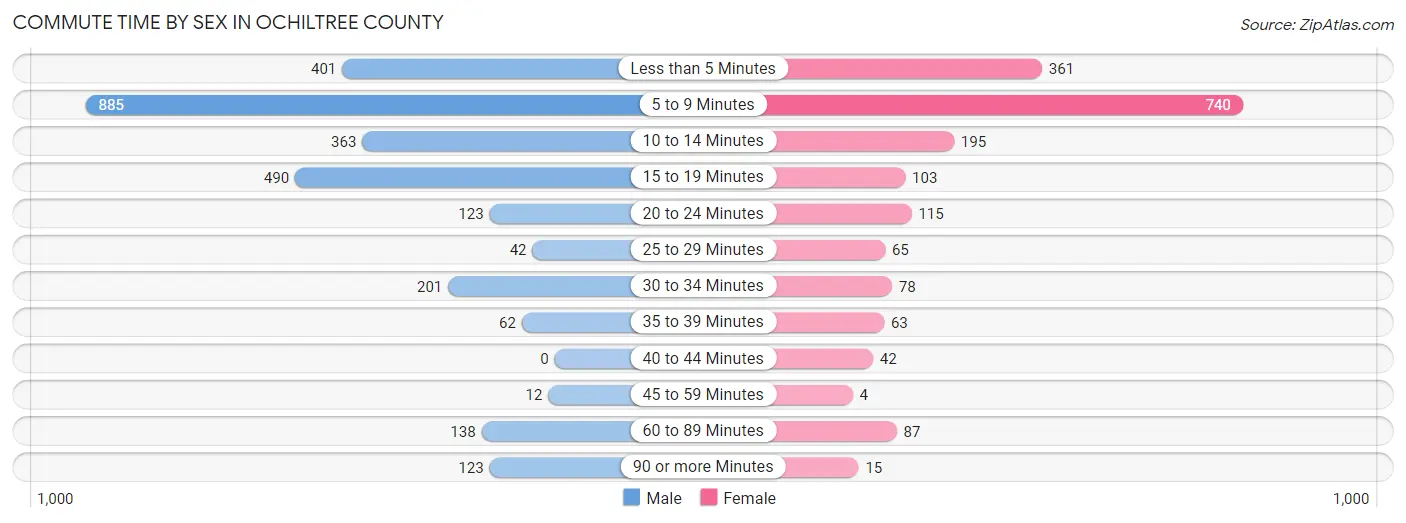
| Commute Time | Male | Female |
| Less than 5 Minutes | 401 (14.1%) | 361 (19.3%) |
| 5 to 9 Minutes | 885 (31.2%) | 740 (39.6%) |
| 10 to 14 Minutes | 363 (12.8%) | 195 (10.4%) |
| 15 to 19 Minutes | 490 (17.2%) | 103 (5.5%) |
| 20 to 24 Minutes | 123 (4.3%) | 115 (6.2%) |
| 25 to 29 Minutes | 42 (1.5%) | 65 (3.5%) |
| 30 to 34 Minutes | 201 (7.1%) | 78 (4.2%) |
| 35 to 39 Minutes | 62 (2.2%) | 63 (3.4%) |
| 40 to 44 Minutes | 0 (0.0%) | 42 (2.2%) |
| 45 to 59 Minutes | 12 (0.4%) | 4 (0.2%) |
| 60 to 89 Minutes | 138 (4.9%) | 87 (4.7%) |
| 90 or more Minutes | 123 (4.3%) | 15 (0.8%) |
Time of Departure to Work by Sex in Ochiltree County
The most frequent times of departure to work in Ochiltree County are 7:30 AM to 7:59 AM (542, 19.1%) for males and 7:30 AM to 7:59 AM (335, 17.9%) for females.
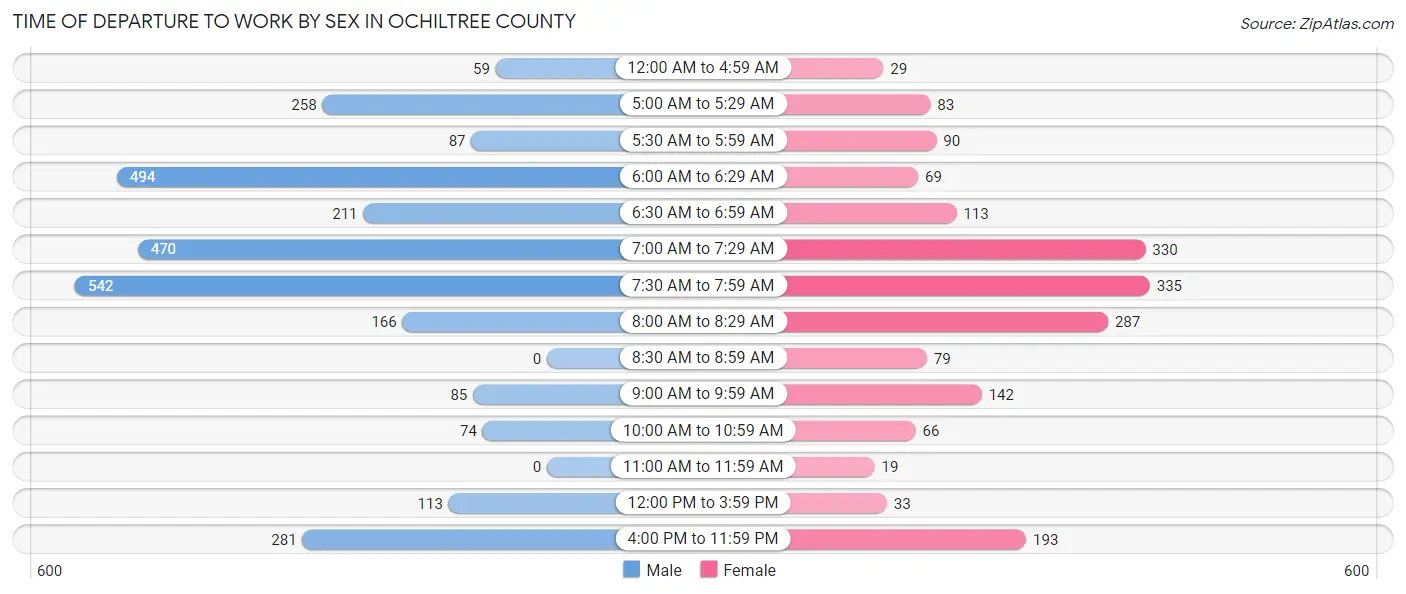
| Time of Departure | Male | Female |
| 12:00 AM to 4:59 AM | 59 (2.1%) | 29 (1.5%) |
| 5:00 AM to 5:29 AM | 258 (9.1%) | 83 (4.4%) |
| 5:30 AM to 5:59 AM | 87 (3.1%) | 90 (4.8%) |
| 6:00 AM to 6:29 AM | 494 (17.4%) | 69 (3.7%) |
| 6:30 AM to 6:59 AM | 211 (7.4%) | 113 (6.0%) |
| 7:00 AM to 7:29 AM | 470 (16.6%) | 330 (17.7%) |
| 7:30 AM to 7:59 AM | 542 (19.1%) | 335 (17.9%) |
| 8:00 AM to 8:29 AM | 166 (5.9%) | 287 (15.4%) |
| 8:30 AM to 8:59 AM | 0 (0.0%) | 79 (4.2%) |
| 9:00 AM to 9:59 AM | 85 (3.0%) | 142 (7.6%) |
| 10:00 AM to 10:59 AM | 74 (2.6%) | 66 (3.5%) |
| 11:00 AM to 11:59 AM | 0 (0.0%) | 19 (1.0%) |
| 12:00 PM to 3:59 PM | 113 (4.0%) | 33 (1.8%) |
| 4:00 PM to 11:59 PM | 281 (9.9%) | 193 (10.3%) |
| Total | 2,840 (100.0%) | 1,868 (100.0%) |
Housing Occupancy in Ochiltree County
Occupancy by Ownership in Ochiltree County
Of the total 3,684 dwellings in Ochiltree County, owner-occupied units account for 2,597 (70.5%), while renter-occupied units make up 1,087 (29.5%).
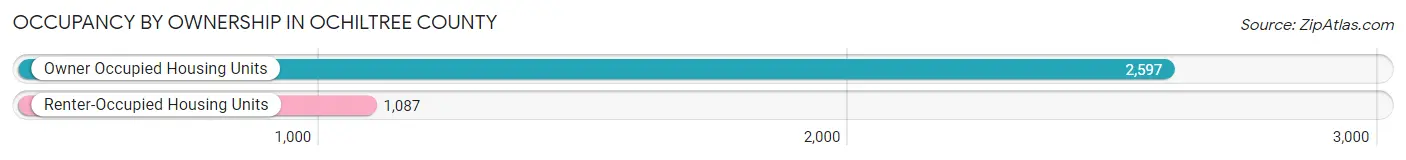
| Occupancy | # Housing Units | % Housing Units |
| Owner Occupied Housing Units | 2,597 | 70.5% |
| Renter-Occupied Housing Units | 1,087 | 29.5% |
| Total Occupied Housing Units | 3,684 | 100.0% |
Occupancy by Household Size in Ochiltree County
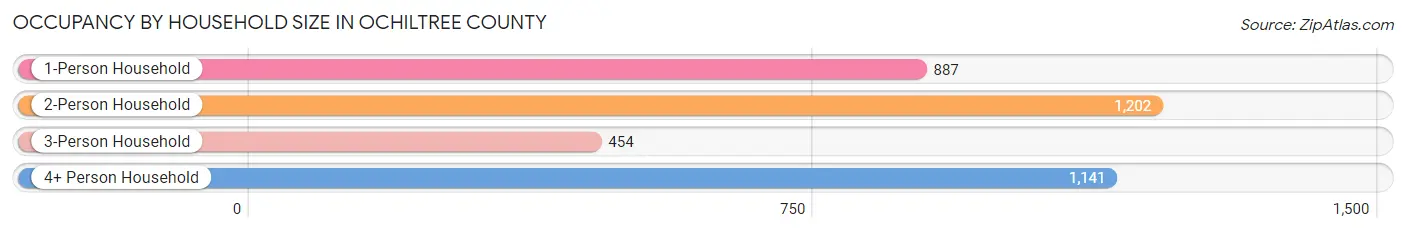
| Household Size | # Housing Units | % Housing Units |
| 1-Person Household | 887 | 24.1% |
| 2-Person Household | 1,202 | 32.6% |
| 3-Person Household | 454 | 12.3% |
| 4+ Person Household | 1,141 | 31.0% |
| Total Housing Units | 3,684 | 100.0% |
Occupancy by Ownership by Household Size in Ochiltree County
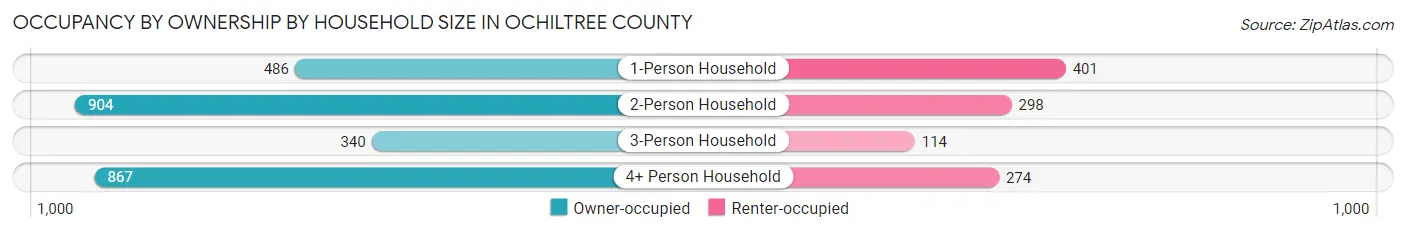
| Household Size | Owner-occupied | Renter-occupied |
| 1-Person Household | 486 (54.8%) | 401 (45.2%) |
| 2-Person Household | 904 (75.2%) | 298 (24.8%) |
| 3-Person Household | 340 (74.9%) | 114 (25.1%) |
| 4+ Person Household | 867 (76.0%) | 274 (24.0%) |
| Total Housing Units | 2,597 (70.5%) | 1,087 (29.5%) |
Occupancy by Educational Attainment in Ochiltree County
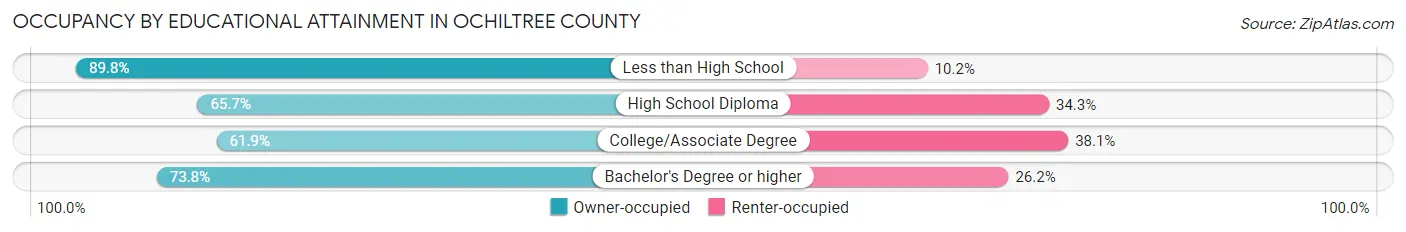
| Household Size | Owner-occupied | Renter-occupied |
| Less than High School | 580 (89.8%) | 66 (10.2%) |
| High School Diploma | 761 (65.7%) | 397 (34.3%) |
| College/Associate Degree | 685 (61.9%) | 421 (38.1%) |
| Bachelor's Degree or higher | 571 (73.8%) | 203 (26.2%) |
Occupancy by Age of Householder in Ochiltree County
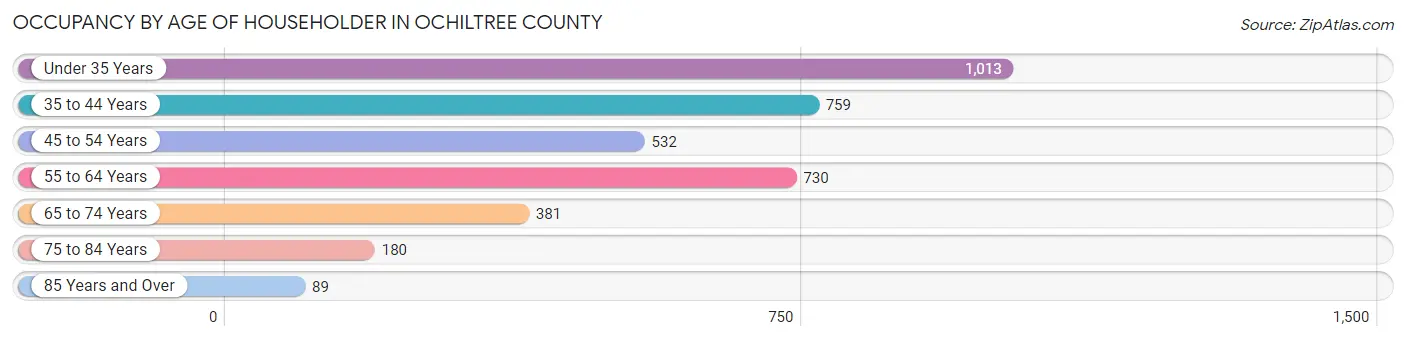
| Age Bracket | # Households | % Households |
| Under 35 Years | 1,013 | 27.5% |
| 35 to 44 Years | 759 | 20.6% |
| 45 to 54 Years | 532 | 14.4% |
| 55 to 64 Years | 730 | 19.8% |
| 65 to 74 Years | 381 | 10.3% |
| 75 to 84 Years | 180 | 4.9% |
| 85 Years and Over | 89 | 2.4% |
| Total | 3,684 | 100.0% |
Housing Finances in Ochiltree County
Median Income by Occupancy in Ochiltree County
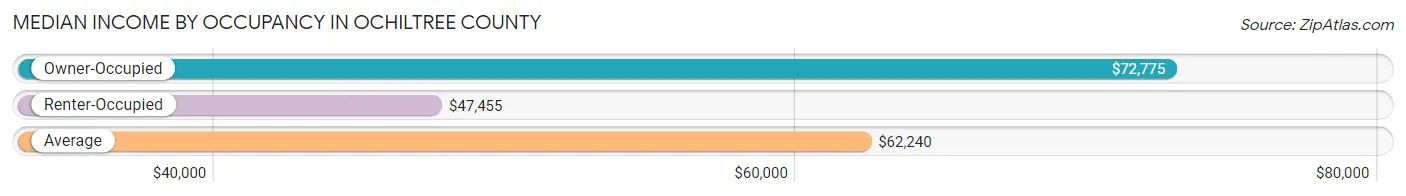
| Occupancy Type | # Households | Median Income |
| Owner-Occupied | 2,597 (70.5%) | $72,775 |
| Renter-Occupied | 1,087 (29.5%) | $47,455 |
| Average | 3,684 (100.0%) | $62,240 |
Occupancy by Householder Income Bracket in Ochiltree County
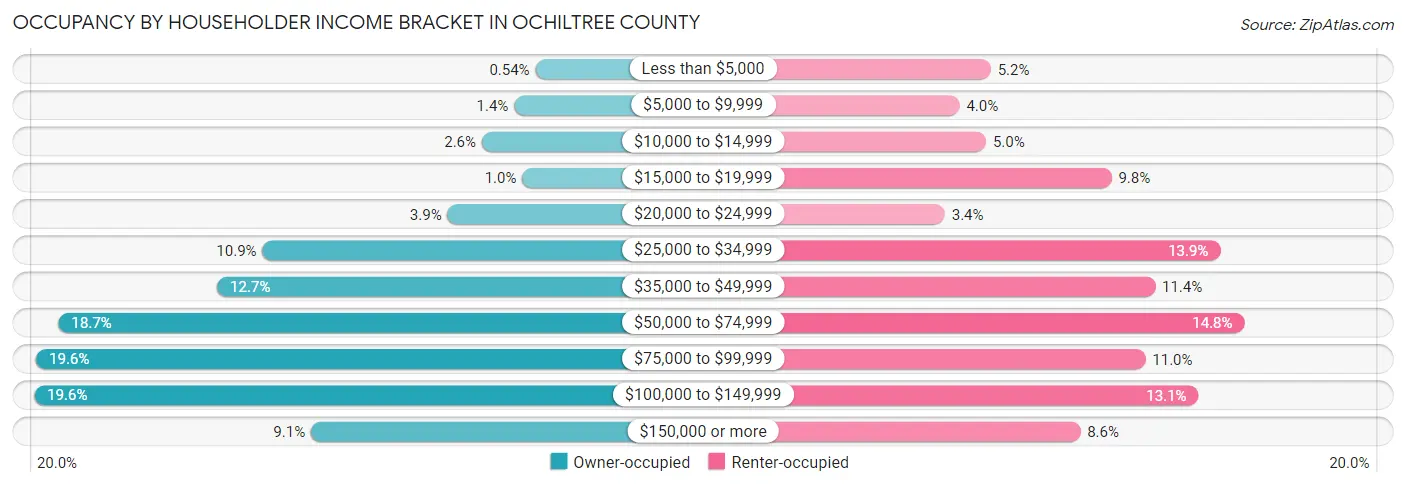
| Income Bracket | Owner-occupied | Renter-occupied |
| Less than $5,000 | 14 (0.5%) | 56 (5.1%) |
| $5,000 to $9,999 | 35 (1.3%) | 43 (4.0%) |
| $10,000 to $14,999 | 67 (2.6%) | 54 (5.0%) |
| $15,000 to $19,999 | 27 (1.0%) | 106 (9.8%) |
| $20,000 to $24,999 | 101 (3.9%) | 37 (3.4%) |
| $25,000 to $34,999 | 284 (10.9%) | 151 (13.9%) |
| $35,000 to $49,999 | 329 (12.7%) | 124 (11.4%) |
| $50,000 to $74,999 | 486 (18.7%) | 161 (14.8%) |
| $75,000 to $99,999 | 508 (19.6%) | 120 (11.0%) |
| $100,000 to $149,999 | 510 (19.6%) | 142 (13.1%) |
| $150,000 or more | 236 (9.1%) | 93 (8.6%) |
| Total | 2,597 (100.0%) | 1,087 (100.0%) |
Monthly Housing Cost Tiers in Ochiltree County
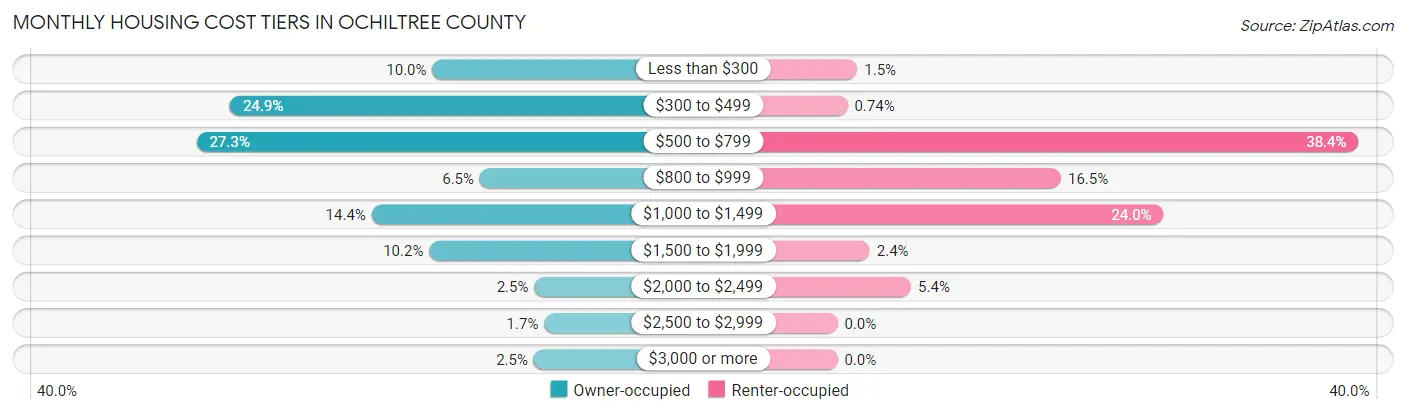
| Monthly Cost | Owner-occupied | Renter-occupied |
| Less than $300 | 259 (10.0%) | 16 (1.5%) |
| $300 to $499 | 646 (24.9%) | 8 (0.7%) |
| $500 to $799 | 710 (27.3%) | 417 (38.4%) |
| $800 to $999 | 168 (6.5%) | 179 (16.5%) |
| $1,000 to $1,499 | 375 (14.4%) | 261 (24.0%) |
| $1,500 to $1,999 | 265 (10.2%) | 26 (2.4%) |
| $2,000 to $2,499 | 64 (2.5%) | 59 (5.4%) |
| $2,500 to $2,999 | 45 (1.7%) | 0 (0.0%) |
| $3,000 or more | 65 (2.5%) | 0 (0.0%) |
| Total | 2,597 (100.0%) | 1,087 (100.0%) |
Physical Housing Characteristics in Ochiltree County
Housing Structures in Ochiltree County
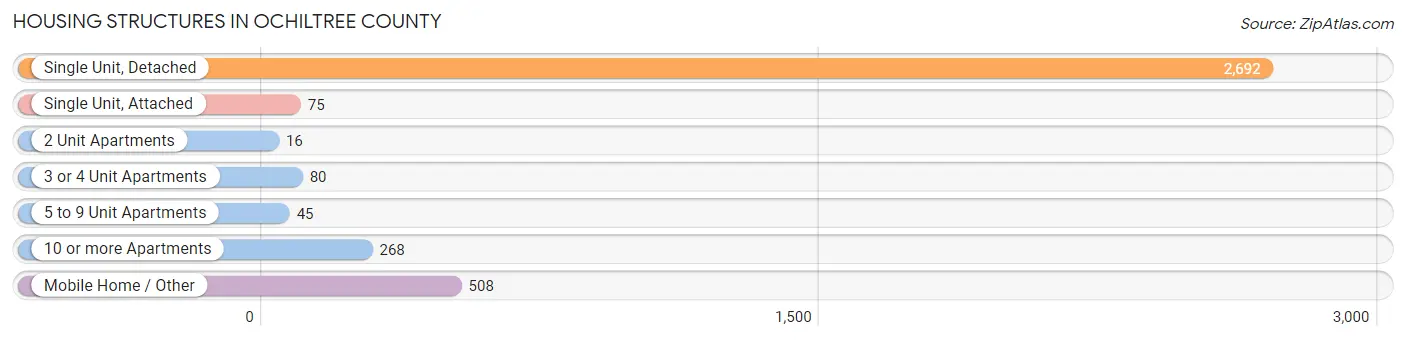
| Structure Type | # Housing Units | % Housing Units |
| Single Unit, Detached | 2,692 | 73.1% |
| Single Unit, Attached | 75 | 2.0% |
| 2 Unit Apartments | 16 | 0.4% |
| 3 or 4 Unit Apartments | 80 | 2.2% |
| 5 to 9 Unit Apartments | 45 | 1.2% |
| 10 or more Apartments | 268 | 7.3% |
| Mobile Home / Other | 508 | 13.8% |
| Total | 3,684 | 100.0% |
Housing Structures by Occupancy in Ochiltree County
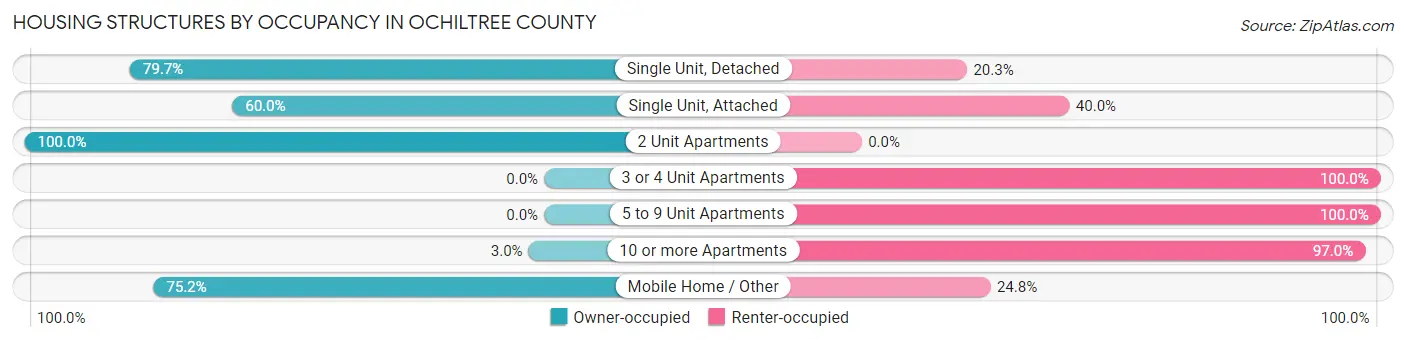
| Structure Type | Owner-occupied | Renter-occupied |
| Single Unit, Detached | 2,146 (79.7%) | 546 (20.3%) |
| Single Unit, Attached | 45 (60.0%) | 30 (40.0%) |
| 2 Unit Apartments | 16 (100.0%) | 0 (0.0%) |
| 3 or 4 Unit Apartments | 0 (0.0%) | 80 (100.0%) |
| 5 to 9 Unit Apartments | 0 (0.0%) | 45 (100.0%) |
| 10 or more Apartments | 8 (3.0%) | 260 (97.0%) |
| Mobile Home / Other | 382 (75.2%) | 126 (24.8%) |
| Total | 2,597 (70.5%) | 1,087 (29.5%) |
Housing Structures by Number of Rooms in Ochiltree County
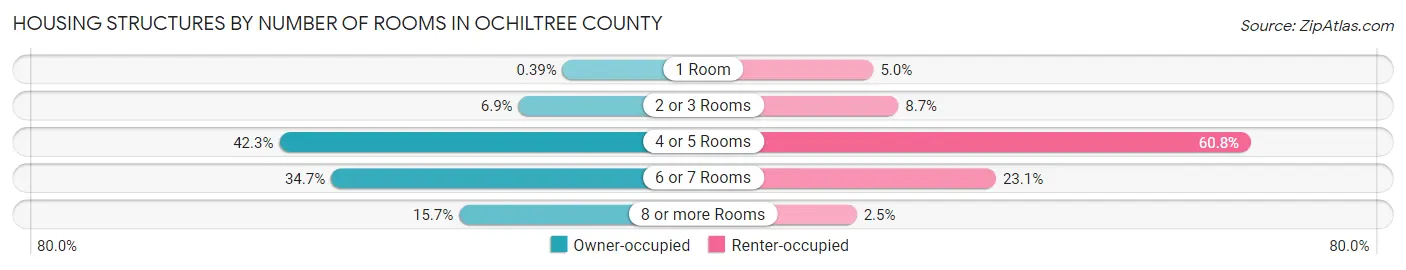
| Number of Rooms | Owner-occupied | Renter-occupied |
| 1 Room | 10 (0.4%) | 54 (5.0%) |
| 2 or 3 Rooms | 180 (6.9%) | 94 (8.6%) |
| 4 or 5 Rooms | 1,099 (42.3%) | 661 (60.8%) |
| 6 or 7 Rooms | 900 (34.7%) | 251 (23.1%) |
| 8 or more Rooms | 408 (15.7%) | 27 (2.5%) |
| Total | 2,597 (100.0%) | 1,087 (100.0%) |
Housing Structure by Heating Type in Ochiltree County
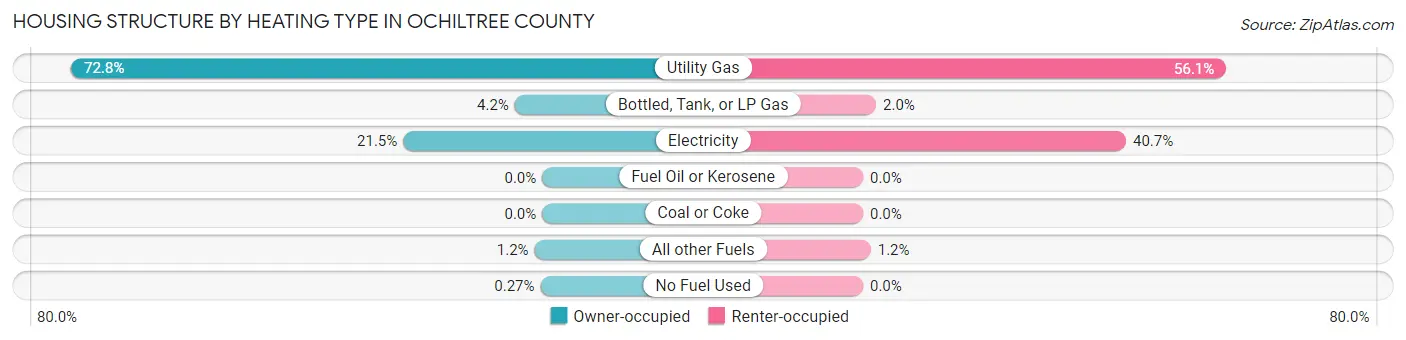
| Heating Type | Owner-occupied | Renter-occupied |
| Utility Gas | 1,891 (72.8%) | 610 (56.1%) |
| Bottled, Tank, or LP Gas | 110 (4.2%) | 22 (2.0%) |
| Electricity | 558 (21.5%) | 442 (40.7%) |
| Fuel Oil or Kerosene | 0 (0.0%) | 0 (0.0%) |
| Coal or Coke | 0 (0.0%) | 0 (0.0%) |
| All other Fuels | 31 (1.2%) | 13 (1.2%) |
| No Fuel Used | 7 (0.3%) | 0 (0.0%) |
| Total | 2,597 (100.0%) | 1,087 (100.0%) |
Household Vehicle Usage in Ochiltree County
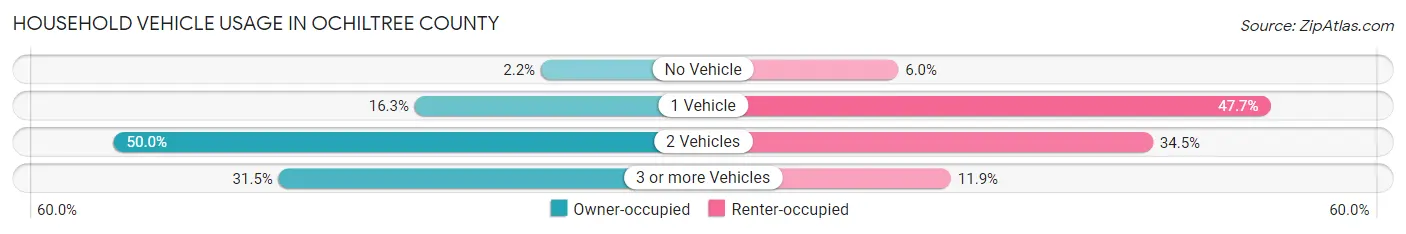
| Vehicles per Household | Owner-occupied | Renter-occupied |
| No Vehicle | 56 (2.2%) | 65 (6.0%) |
| 1 Vehicle | 423 (16.3%) | 518 (47.6%) |
| 2 Vehicles | 1,299 (50.0%) | 375 (34.5%) |
| 3 or more Vehicles | 819 (31.5%) | 129 (11.9%) |
| Total | 2,597 (100.0%) | 1,087 (100.0%) |
Real Estate & Mortgages in Ochiltree County
Real Estate and Mortgage Overview in Ochiltree County
| Characteristic | Without Mortgage | With Mortgage |
| Housing Units | 1,838 | 759 |
| Median Property Value | $101,800 | $162,100 |
| Median Household Income | $70,521 | $71 |
| Monthly Housing Costs | $506 | $57 |
| Real Estate Taxes | $1,447 | $0 |
Property Value by Mortgage Status in Ochiltree County
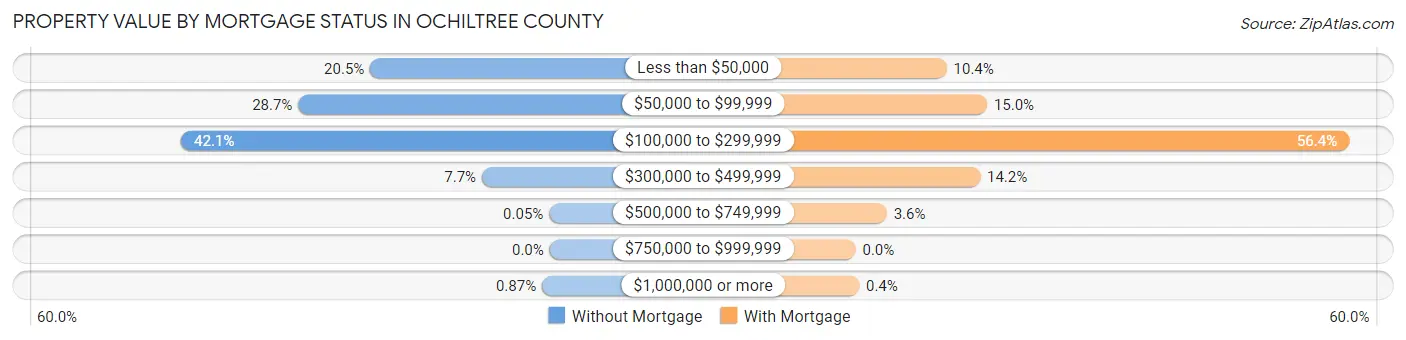
| Property Value | Without Mortgage | With Mortgage |
| Less than $50,000 | 377 (20.5%) | 79 (10.4%) |
| $50,000 to $99,999 | 528 (28.7%) | 114 (15.0%) |
| $100,000 to $299,999 | 774 (42.1%) | 428 (56.4%) |
| $300,000 to $499,999 | 142 (7.7%) | 108 (14.2%) |
| $500,000 to $749,999 | 1 (0.1%) | 27 (3.6%) |
| $750,000 to $999,999 | 0 (0.0%) | 0 (0.0%) |
| $1,000,000 or more | 16 (0.9%) | 3 (0.4%) |
| Total | 1,838 (100.0%) | 759 (100.0%) |
Household Income by Mortgage Status in Ochiltree County
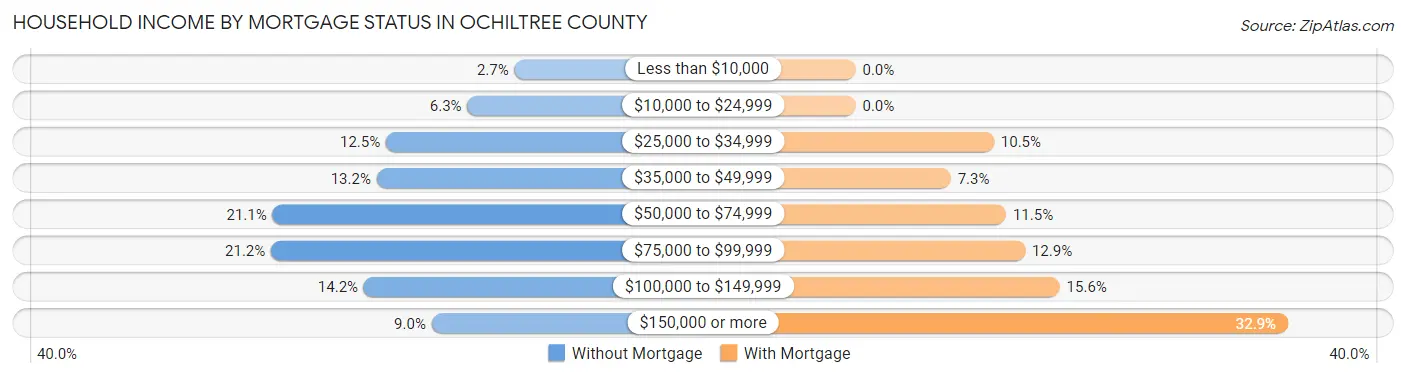
| Household Income | Without Mortgage | With Mortgage |
| Less than $10,000 | 49 (2.7%) | 0 (0.0%) |
| $10,000 to $24,999 | 115 (6.3%) | 0 (0.0%) |
| $25,000 to $34,999 | 229 (12.5%) | 80 (10.5%) |
| $35,000 to $49,999 | 242 (13.2%) | 55 (7.2%) |
| $50,000 to $74,999 | 388 (21.1%) | 87 (11.5%) |
| $75,000 to $99,999 | 390 (21.2%) | 98 (12.9%) |
| $100,000 to $149,999 | 260 (14.1%) | 118 (15.5%) |
| $150,000 or more | 165 (9.0%) | 250 (32.9%) |
| Total | 1,838 (100.0%) | 759 (100.0%) |
Property Value to Household Income Ratio in Ochiltree County
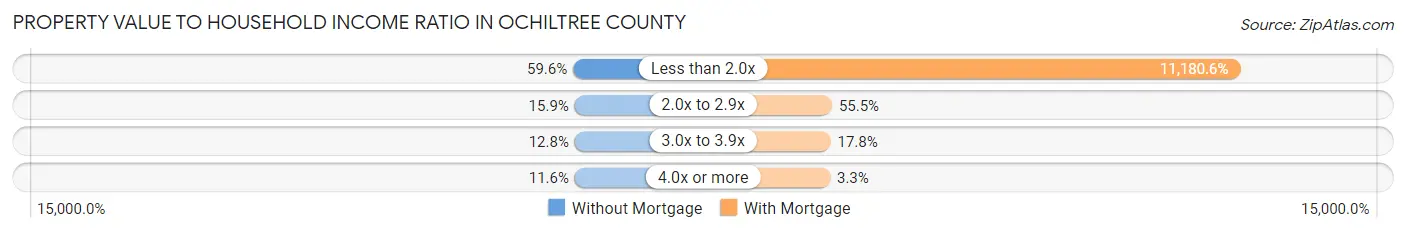
| Value-to-Income Ratio | Without Mortgage | With Mortgage |
| Less than 2.0x | 1,096 (59.6%) | 84,861 (11,180.6%) |
| 2.0x to 2.9x | 292 (15.9%) | 421 (55.5%) |
| 3.0x to 3.9x | 236 (12.8%) | 135 (17.8%) |
| 4.0x or more | 214 (11.6%) | 25 (3.3%) |
| Total | 1,838 (100.0%) | 759 (100.0%) |
Real Estate Taxes by Mortgage Status in Ochiltree County
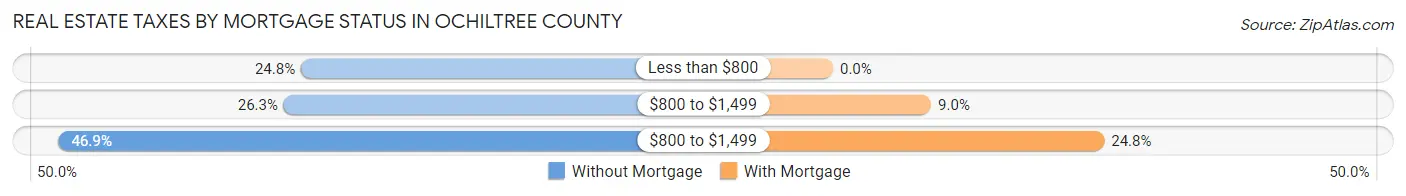
| Property Taxes | Without Mortgage | With Mortgage |
| Less than $800 | 455 (24.8%) | 0 (0.0%) |
| $800 to $1,499 | 484 (26.3%) | 68 (9.0%) |
| $800 to $1,499 | 862 (46.9%) | 188 (24.8%) |
| Total | 1,838 (100.0%) | 759 (100.0%) |
Health & Disability in Ochiltree County
Health Insurance Coverage by Age in Ochiltree County
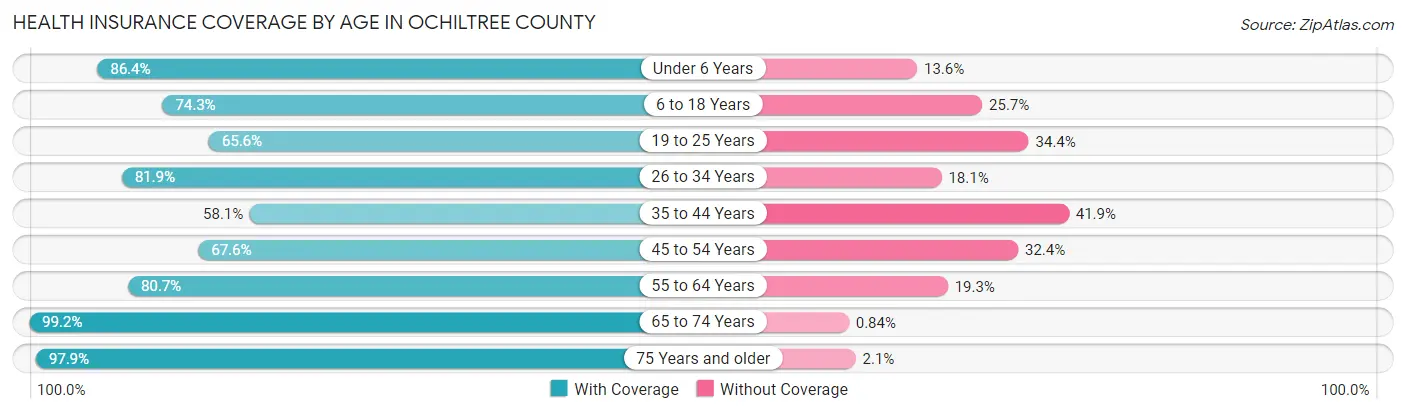
| Age Bracket | With Coverage | Without Coverage |
| Under 6 Years | 854 (86.4%) | 134 (13.6%) |
| 6 to 18 Years | 1,521 (74.3%) | 526 (25.7%) |
| 19 to 25 Years | 571 (65.6%) | 299 (34.4%) |
| 26 to 34 Years | 1,125 (81.9%) | 249 (18.1%) |
| 35 to 44 Years | 801 (58.1%) | 577 (41.9%) |
| 45 to 54 Years | 603 (67.6%) | 289 (32.4%) |
| 55 to 64 Years | 1,034 (80.7%) | 247 (19.3%) |
| 65 to 74 Years | 589 (99.2%) | 5 (0.8%) |
| 75 Years and older | 417 (97.9%) | 9 (2.1%) |
| Total | 7,515 (76.3%) | 2,335 (23.7%) |
Health Insurance Coverage by Citizenship Status in Ochiltree County
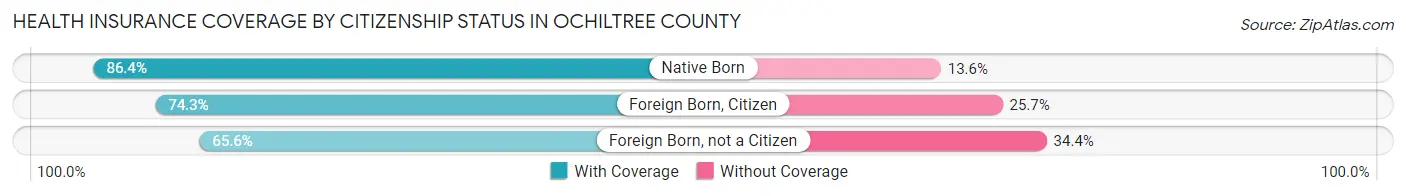
| Citizenship Status | With Coverage | Without Coverage |
| Native Born | 854 (86.4%) | 134 (13.6%) |
| Foreign Born, Citizen | 1,521 (74.3%) | 526 (25.7%) |
| Foreign Born, not a Citizen | 571 (65.6%) | 299 (34.4%) |
Health Insurance Coverage by Household Income in Ochiltree County
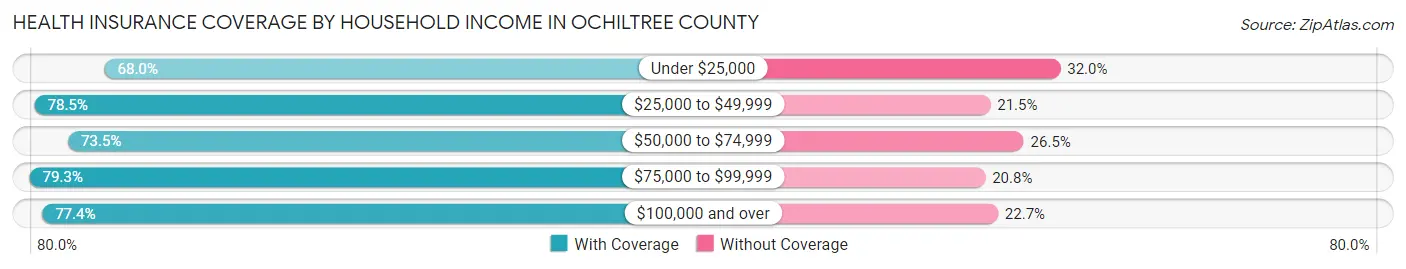
| Household Income | With Coverage | Without Coverage |
| Under $25,000 | 663 (68.0%) | 312 (32.0%) |
| $25,000 to $49,999 | 1,711 (78.5%) | 469 (21.5%) |
| $50,000 to $74,999 | 1,422 (73.5%) | 513 (26.5%) |
| $75,000 to $99,999 | 1,551 (79.2%) | 406 (20.7%) |
| $100,000 and over | 2,168 (77.3%) | 635 (22.7%) |
Public vs Private Health Insurance Coverage by Age in Ochiltree County
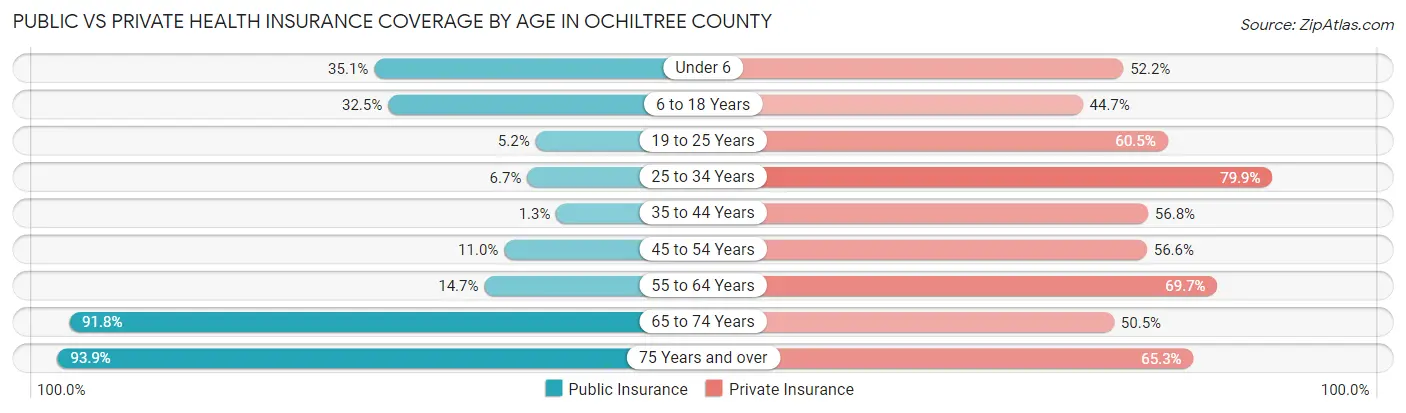
| Age Bracket | Public Insurance | Private Insurance |
| Under 6 | 347 (35.1%) | 516 (52.2%) |
| 6 to 18 Years | 666 (32.5%) | 915 (44.7%) |
| 19 to 25 Years | 45 (5.2%) | 526 (60.5%) |
| 25 to 34 Years | 92 (6.7%) | 1,098 (79.9%) |
| 35 to 44 Years | 18 (1.3%) | 783 (56.8%) |
| 45 to 54 Years | 98 (11.0%) | 505 (56.6%) |
| 55 to 64 Years | 188 (14.7%) | 893 (69.7%) |
| 65 to 74 Years | 545 (91.7%) | 300 (50.5%) |
| 75 Years and over | 400 (93.9%) | 278 (65.3%) |
| Total | 2,399 (24.4%) | 5,814 (59.0%) |
Disability Status by Sex by Age in Ochiltree County
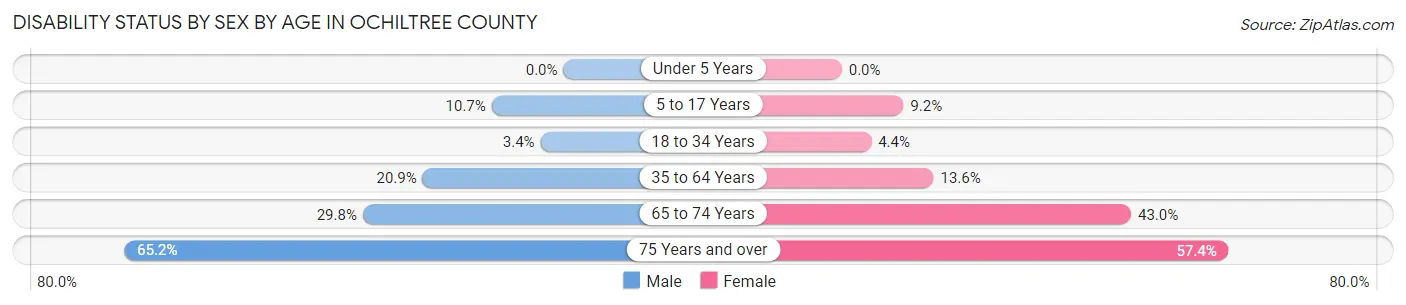
| Age Bracket | Male | Female |
| Under 5 Years | 0 (0.0%) | 0 (0.0%) |
| 5 to 17 Years | 115 (10.6%) | 107 (9.1%) |
| 18 to 34 Years | 40 (3.4%) | 48 (4.4%) |
| 35 to 64 Years | 388 (20.9%) | 231 (13.6%) |
| 65 to 74 Years | 84 (29.8%) | 134 (42.9%) |
| 75 Years and over | 120 (65.2%) | 139 (57.4%) |
Disability Class by Sex by Age in Ochiltree County
Disability Class: Hearing Difficulty
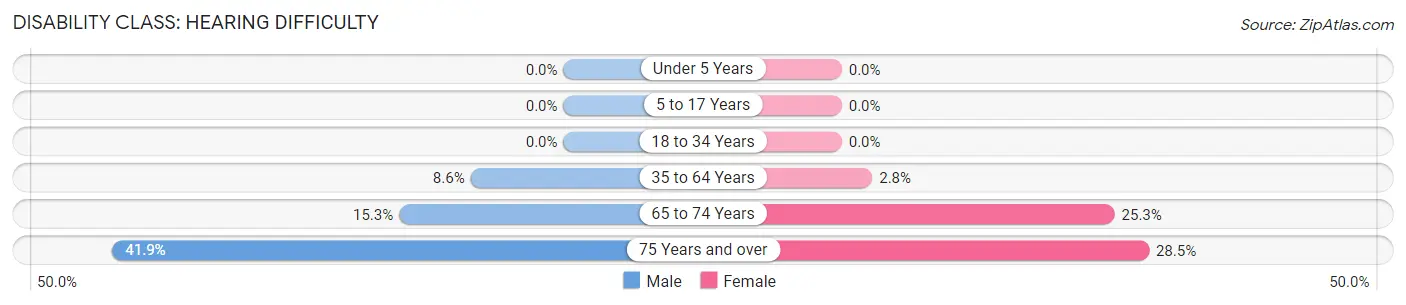
| Age Bracket | Male | Female |
| Under 5 Years | 0 (0.0%) | 0 (0.0%) |
| 5 to 17 Years | 0 (0.0%) | 0 (0.0%) |
| 18 to 34 Years | 0 (0.0%) | 0 (0.0%) |
| 35 to 64 Years | 160 (8.6%) | 48 (2.8%) |
| 65 to 74 Years | 43 (15.2%) | 79 (25.3%) |
| 75 Years and over | 77 (41.8%) | 69 (28.5%) |
Disability Class: Vision Difficulty
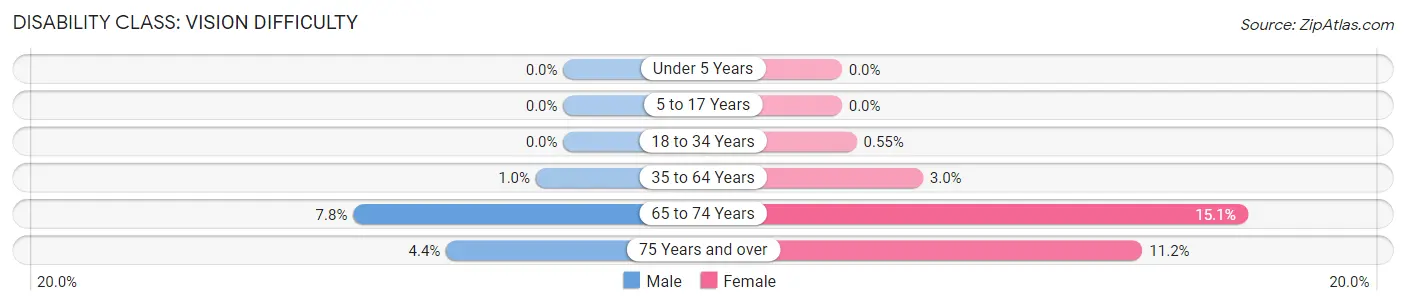
| Age Bracket | Male | Female |
| Under 5 Years | 0 (0.0%) | 0 (0.0%) |
| 5 to 17 Years | 0 (0.0%) | 0 (0.0%) |
| 18 to 34 Years | 0 (0.0%) | 6 (0.5%) |
| 35 to 64 Years | 19 (1.0%) | 51 (3.0%) |
| 65 to 74 Years | 22 (7.8%) | 47 (15.1%) |
| 75 Years and over | 8 (4.3%) | 27 (11.2%) |
Disability Class: Cognitive Difficulty
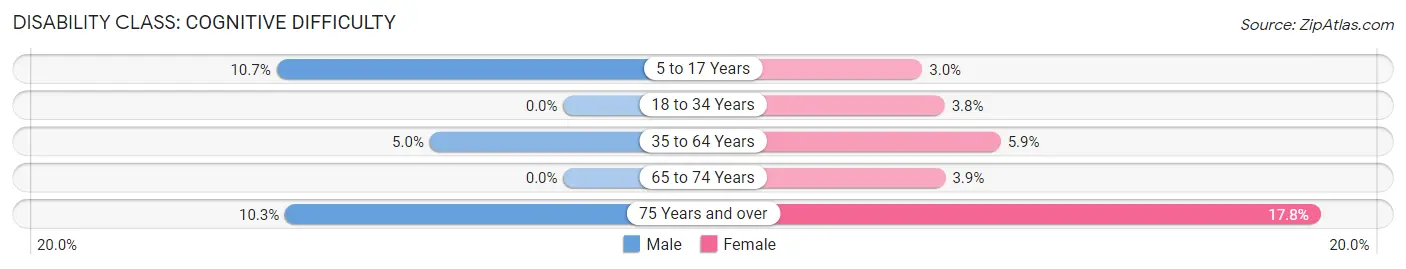
| Age Bracket | Male | Female |
| 5 to 17 Years | 115 (10.6%) | 35 (3.0%) |
| 18 to 34 Years | 0 (0.0%) | 42 (3.8%) |
| 35 to 64 Years | 92 (5.0%) | 100 (5.9%) |
| 65 to 74 Years | 0 (0.0%) | 12 (3.8%) |
| 75 Years and over | 19 (10.3%) | 43 (17.8%) |
Disability Class: Ambulatory Difficulty
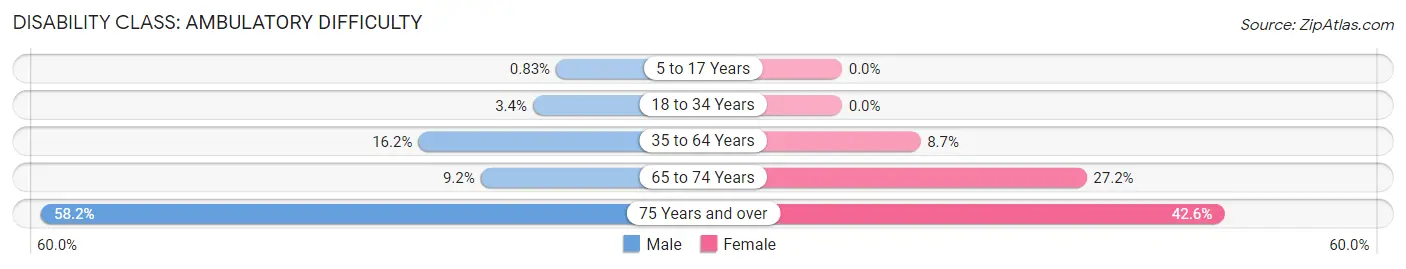
| Age Bracket | Male | Female |
| 5 to 17 Years | 9 (0.8%) | 0 (0.0%) |
| 18 to 34 Years | 40 (3.4%) | 0 (0.0%) |
| 35 to 64 Years | 300 (16.2%) | 148 (8.7%) |
| 65 to 74 Years | 26 (9.2%) | 85 (27.2%) |
| 75 Years and over | 107 (58.2%) | 103 (42.6%) |
Disability Class: Self-Care Difficulty
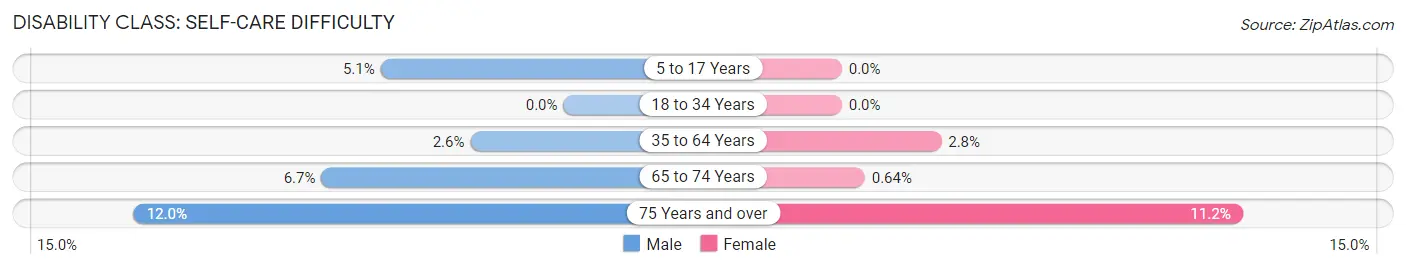
| Age Bracket | Male | Female |
| 5 to 17 Years | 55 (5.1%) | 0 (0.0%) |
| 18 to 34 Years | 0 (0.0%) | 0 (0.0%) |
| 35 to 64 Years | 48 (2.6%) | 47 (2.8%) |
| 65 to 74 Years | 19 (6.7%) | 2 (0.6%) |
| 75 Years and over | 22 (12.0%) | 27 (11.2%) |
Technology Access in Ochiltree County
Computing Device Access in Ochiltree County
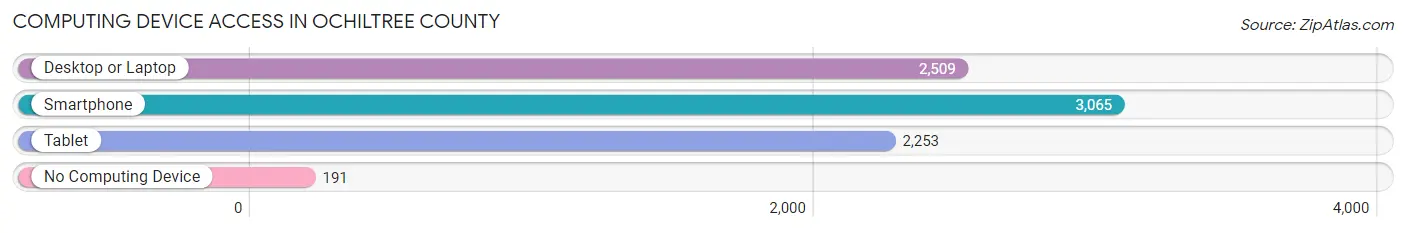
| Device Type | # Households | % Households |
| Desktop or Laptop | 2,509 | 68.1% |
| Smartphone | 3,065 | 83.2% |
| Tablet | 2,253 | 61.2% |
| No Computing Device | 191 | 5.2% |
| Total | 3,684 | 100.0% |
Internet Access in Ochiltree County
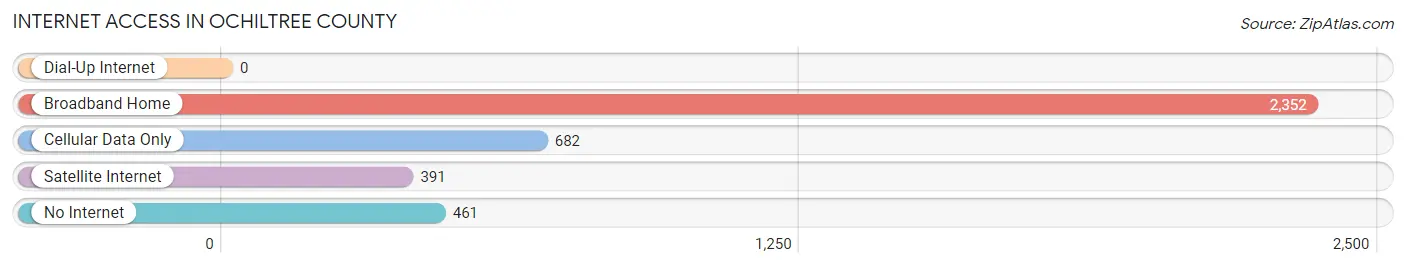
| Internet Type | # Households | % Households |
| Dial-Up Internet | 0 | 0.0% |
| Broadband Home | 2,352 | 63.8% |
| Cellular Data Only | 682 | 18.5% |
| Satellite Internet | 391 | 10.6% |
| No Internet | 461 | 12.5% |
| Total | 3,684 | 100.0% |
Ochiltree County Summary
Ochiltree County is located in the Texas Panhandle, in the northern part of the state. It is bordered by Lipscomb County to the north, Roberts County to the east, Hansford County to the south, and Hemphill County to the west. The county seat is Perryton, and the county has a total area of 902 square miles.
History
Ochiltree County was created in 1876 from lands that were formerly part of Bexar County. It was named for William Beck Ochiltree, a Texas politician and Confederate veteran. The county was organized in 1891, and the town of Perryton was established as the county seat.
In the early 1900s, the county was largely agricultural, with cotton and wheat being the main crops. The Santa Fe Railroad was built through the county in 1908, and this helped to spur economic growth. The county also experienced a population boom during this time, as many people moved to the area to take advantage of the new opportunities.
In the 1920s, oil was discovered in the county, and this led to a new wave of economic growth. The oil industry has remained an important part of the county’s economy ever since.
Geography
Ochiltree County is located in the Texas Panhandle, in the northern part of the state. It is bordered by Lipscomb County to the north, Roberts County to the east, Hansford County to the south, and Hemphill County to the west. The county has a total area of 902 square miles, and it is mostly flat, with some rolling hills in the western part of the county.
The county is home to several lakes, including Lake Fryer, Lake Greenbelt, and Lake Perryton. The Canadian River runs through the county, and there are several creeks and streams as well. The county is also home to several wildlife refuges, including the Ochiltree County Wildlife Refuge and the Perryton Wildlife Refuge.
Economy
Ochiltree County’s economy is largely based on agriculture and oil. The county is home to several large farms, and cotton and wheat are the main crops. The oil industry is also an important part of the county’s economy, and there are several oil and gas companies operating in the area.
The county is also home to several manufacturing companies, including a plastics plant and a metal fabrication plant. The county also has a large retail sector, with several stores and restaurants located in the county seat of Perryton.
Demographics
As of the 2010 census, Ochiltree County had a population of 10,223. The racial makeup of the county was 79.3% White, 0.7% African American, 0.7% Native American, 0.3% Asian, 0.1% Pacific Islander, 16.7% from other races, and 2.1% from two or more races. Hispanic or Latino of any race were 33.2% of the population.
The median income for a household in the county was $37,945, and the median income for a family was $45,938. The per capita income for the county was $18,945. About 14.2% of the population was below the poverty line.
Common Questions
What is Per Capita Income in Ochiltree County?
Per Capita income in Ochiltree County is $30,836.
What is the Median Family Income in Ochiltree County?
Median Family Income in Ochiltree County is $77,117.
What is the Median Household income in Ochiltree County?
Median Household Income in Ochiltree County is $62,240.
What is Income or Wage Gap in Ochiltree County?
Income or Wage Gap in Ochiltree County is 48.7%.
Women in Ochiltree County earn 51.3 cents for every dollar earned by a man.
What is Family Income Deficit in Ochiltree County?
Family Income Deficit in Ochiltree County is $12,125.
Families that are below poverty line in Ochiltree County earn $12,125 less on average than the poverty threshold level.
What is Inequality or Gini Index in Ochiltree County?
Inequality or Gini Index in Ochiltree County is 0.42.
What is the Total Population of Ochiltree County?
Total Population of Ochiltree County is 9,924.
What is the Total Male Population of Ochiltree County?
Total Male Population of Ochiltree County is 4,994.
What is the Total Female Population of Ochiltree County?
Total Female Population of Ochiltree County is 4,930.
What is the Ratio of Males per 100 Females in Ochiltree County?
There are 101.30 Males per 100 Females in Ochiltree County.
What is the Ratio of Females per 100 Males in Ochiltree County?
There are 98.72 Females per 100 Males in Ochiltree County.
What is the Median Population Age in Ochiltree County?
Median Population Age in Ochiltree County is 33.0 Years.
What is the Average Family Size in Ochiltree County
Average Family Size in Ochiltree County is 3.1 People.
What is the Average Household Size in Ochiltree County
Average Household Size in Ochiltree County is 2.7 People.
How Large is the Labor Force in Ochiltree County?
There are 4,955 People in the Labor Forcein in Ochiltree County.
What is the Percentage of People in the Labor Force in Ochiltree County?
67.3% of People are in the Labor Force in Ochiltree County.
What is the Unemployment Rate in Ochiltree County?
Unemployment Rate in Ochiltree County is 1.5%.