Nolan County, TX Map & Demographics
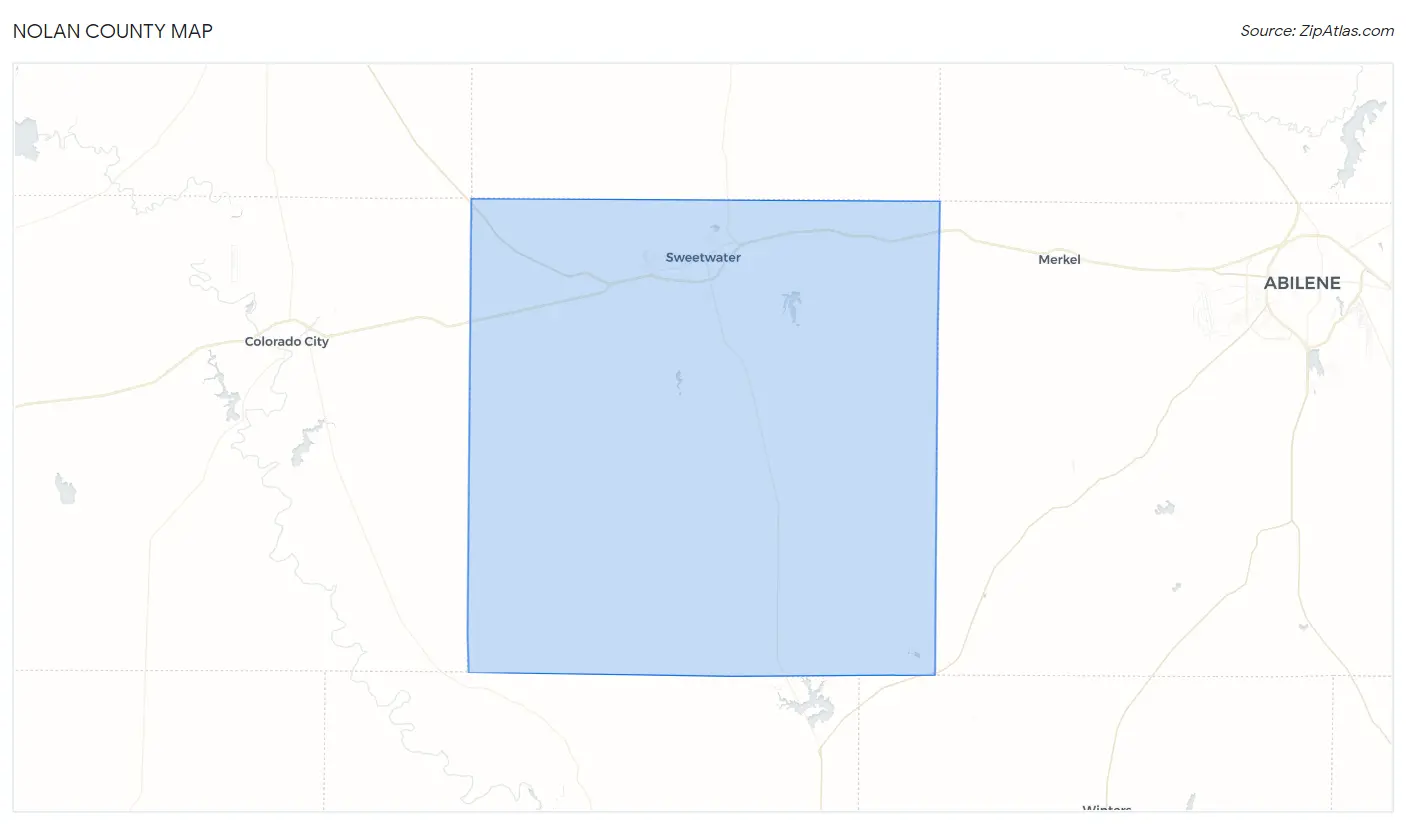
Nolan County Map
Nolan County Overview
$30,572
PER CAPITA INCOME
$59,222
AVG FAMILY INCOME
$47,437
AVG HOUSEHOLD INCOME
28.2%
WAGE / INCOME GAP [ % ]
71.8¢/ $1
WAGE / INCOME GAP [ $ ]
0.52
INEQUALITY / GINI INDEX
14,657
TOTAL POPULATION
7,429
MALE POPULATION
7,228
FEMALE POPULATION
102.78
MALES / 100 FEMALES
97.29
FEMALES / 100 MALES
36.6
MEDIAN AGE
3.2
AVG FAMILY SIZE
2.5
AVG HOUSEHOLD SIZE
6,744
LABOR FORCE [ PEOPLE ]
59.5%
PERCENT IN LABOR FORCE
6.6%
UNEMPLOYMENT RATE
Nolan County Area Codes
Income in Nolan County
Income Overview in Nolan County
Per Capita Income in Nolan County is $30,572, while median incomes of families and households are $59,222 and $47,437 respectively.
| Characteristic | Number | Measure |
| Per Capita Income | 14,657 | $30,572 |
| Median Family Income | 3,571 | $59,222 |
| Mean Family Income | 3,571 | $92,493 |
| Median Household Income | 5,670 | $47,437 |
| Mean Household Income | 5,670 | $75,043 |
| Income Deficit | 3,571 | $0 |
| Wage / Income Gap (%) | 14,657 | 28.20% |
| Wage / Income Gap ($) | 14,657 | 71.80¢ per $1 |
| Gini / Inequality Index | 14,657 | 0.52 |
Earnings by Sex in Nolan County
Average Earnings in Nolan County are $30,436, $34,426 for men and $24,718 for women, a difference of 28.2%.
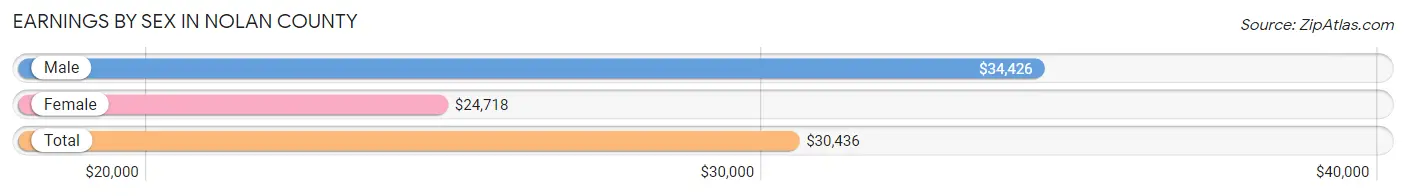
| Sex | Number | Average Earnings |
| Male | 4,094 (57.3%) | $34,426 |
| Female | 3,050 (42.7%) | $24,718 |
| Total | 7,144 (100.0%) | $30,436 |
Earnings by Sex by Income Bracket in Nolan County
The most common earnings brackets in Nolan County are $100,000+ for men (417 | 10.2%) and $12,500 to $14,999 for women (303 | 9.9%).
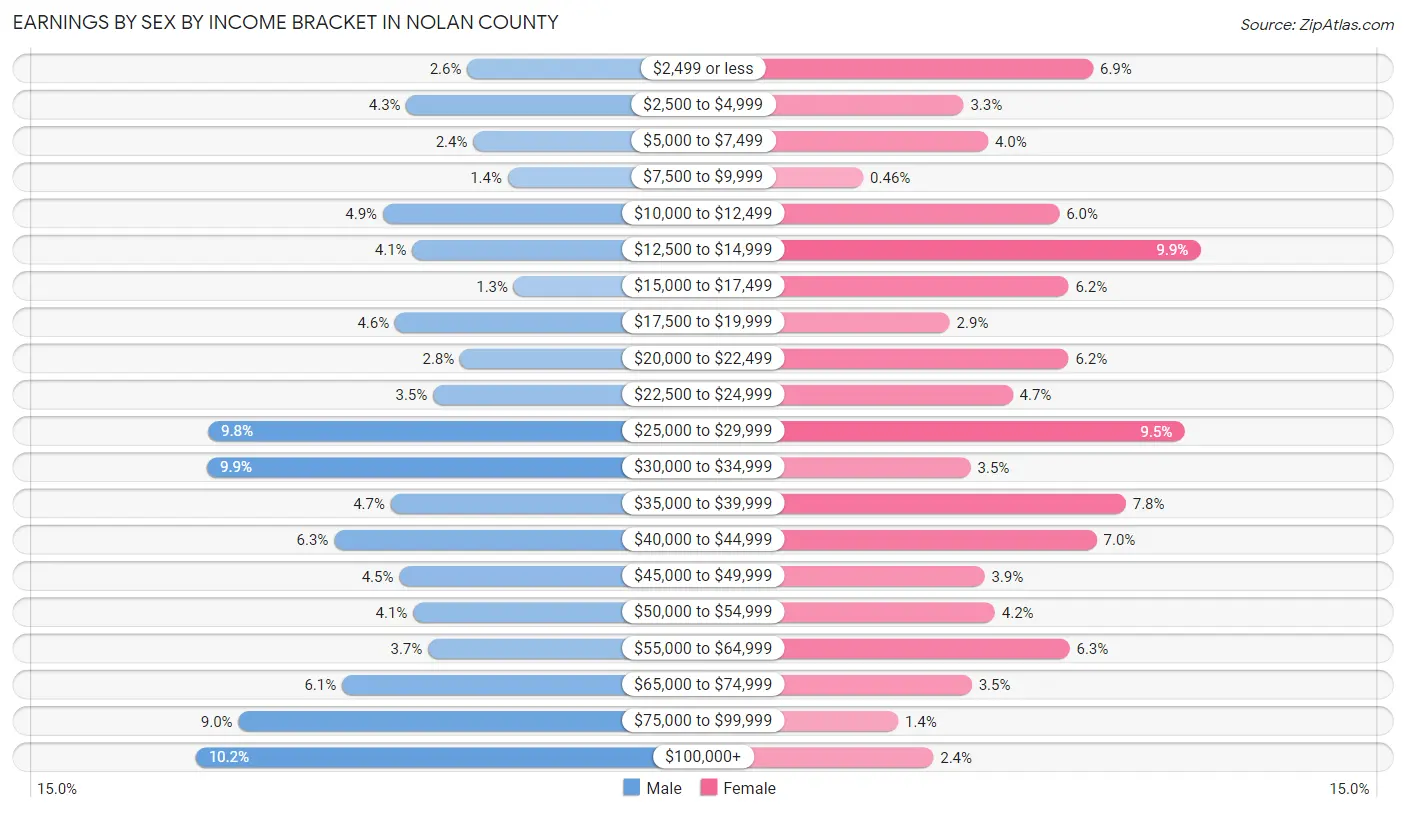
| Income | Male | Female |
| $2,499 or less | 105 (2.6%) | 211 (6.9%) |
| $2,500 to $4,999 | 175 (4.3%) | 100 (3.3%) |
| $5,000 to $7,499 | 98 (2.4%) | 121 (4.0%) |
| $7,500 to $9,999 | 58 (1.4%) | 14 (0.5%) |
| $10,000 to $12,499 | 202 (4.9%) | 182 (6.0%) |
| $12,500 to $14,999 | 168 (4.1%) | 303 (9.9%) |
| $15,000 to $17,499 | 51 (1.3%) | 190 (6.2%) |
| $17,500 to $19,999 | 188 (4.6%) | 88 (2.9%) |
| $20,000 to $22,499 | 113 (2.8%) | 190 (6.2%) |
| $22,500 to $24,999 | 144 (3.5%) | 142 (4.7%) |
| $25,000 to $29,999 | 403 (9.8%) | 289 (9.5%) |
| $30,000 to $34,999 | 404 (9.9%) | 106 (3.5%) |
| $35,000 to $39,999 | 193 (4.7%) | 239 (7.8%) |
| $40,000 to $44,999 | 258 (6.3%) | 214 (7.0%) |
| $45,000 to $49,999 | 183 (4.5%) | 118 (3.9%) |
| $50,000 to $54,999 | 167 (4.1%) | 127 (4.2%) |
| $55,000 to $64,999 | 150 (3.7%) | 191 (6.3%) |
| $65,000 to $74,999 | 249 (6.1%) | 107 (3.5%) |
| $75,000 to $99,999 | 368 (9.0%) | 44 (1.4%) |
| $100,000+ | 417 (10.2%) | 74 (2.4%) |
| Total | 4,094 (100.0%) | 3,050 (100.0%) |
Earnings by Sex by Educational Attainment in Nolan County
Average earnings in Nolan County are $41,313 for men and $26,412 for women, a difference of 36.1%. Men with an educational attainment of graduate degree enjoy the highest average annual earnings of $102,917, while those with less than high school education earn the least with $32,557. Women with an educational attainment of graduate degree earn the most with the average annual earnings of $50,036, while those with less than high school education have the smallest earnings of $14,529.
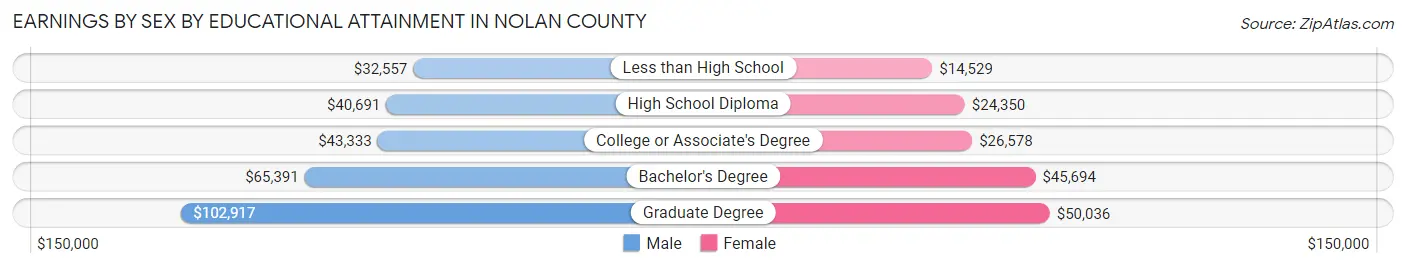
| Educational Attainment | Male Income | Female Income |
| Less than High School | $32,557 | $14,529 |
| High School Diploma | $40,691 | $24,350 |
| College or Associate's Degree | $43,333 | $26,578 |
| Bachelor's Degree | $65,391 | $45,694 |
| Graduate Degree | $102,917 | $50,036 |
| Total | $41,313 | $26,412 |
Family Income in Nolan County
Family Income Brackets in Nolan County
According to the Nolan County family income data, there are 743 families falling into the $35,000 to $49,999 income range, which is the most common income bracket and makes up 20.8% of all families. Conversely, the $10,000 to $14,999 income bracket is the least frequent group with only 68 families (1.9%) belonging to this category.
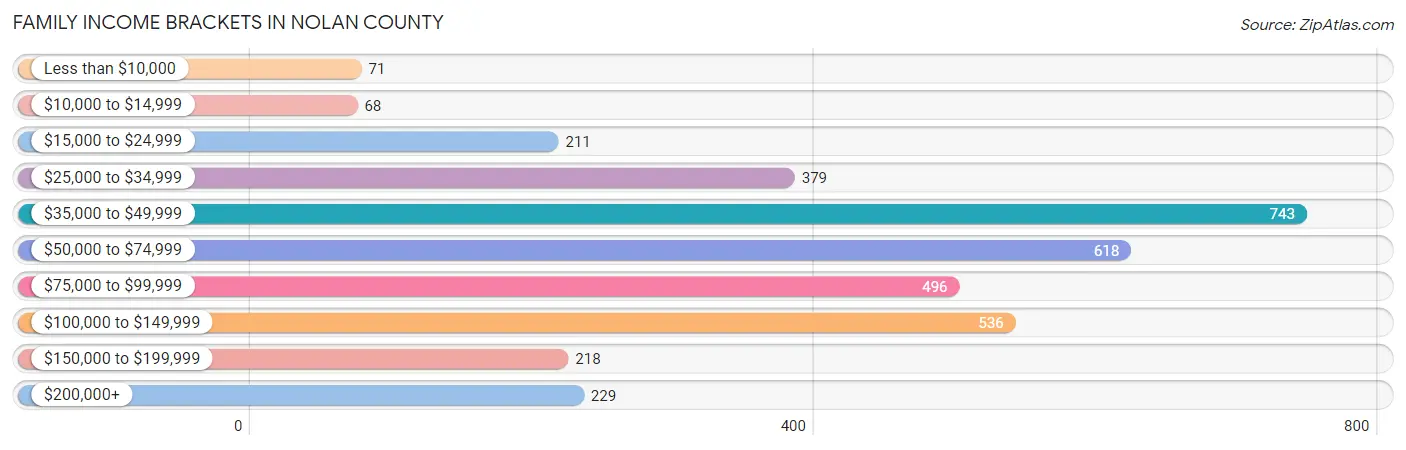
| Income Bracket | # Families | % Families |
| Less than $10,000 | 71 | 2.0% |
| $10,000 to $14,999 | 68 | 1.9% |
| $15,000 to $24,999 | 211 | 5.9% |
| $25,000 to $34,999 | 379 | 10.6% |
| $35,000 to $49,999 | 743 | 20.8% |
| $50,000 to $74,999 | 618 | 17.3% |
| $75,000 to $99,999 | 496 | 13.9% |
| $100,000 to $149,999 | 536 | 15.0% |
| $150,000 to $199,999 | 218 | 6.1% |
| $200,000+ | 229 | 6.4% |
Family Income by Famaliy Size in Nolan County
6-person families (159 | 4.4%) account for the highest median family income in Nolan County with $84,534 per family, while 2-person families (1,611 | 45.1%) have the highest median income of $30,966 per family member.
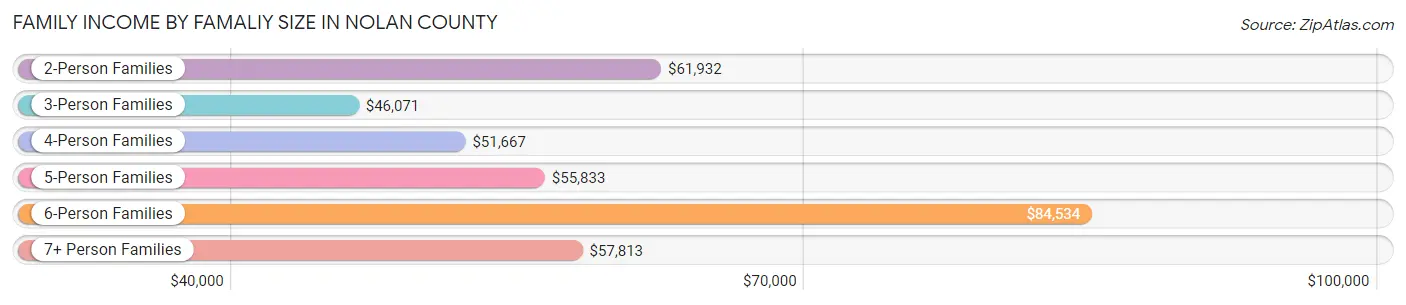
| Income Bracket | # Families | Median Income |
| 2-Person Families | 1,611 (45.1%) | $61,932 |
| 3-Person Families | 786 (22.0%) | $46,071 |
| 4-Person Families | 526 (14.7%) | $51,667 |
| 5-Person Families | 356 (10.0%) | $55,833 |
| 6-Person Families | 159 (4.4%) | $84,534 |
| 7+ Person Families | 133 (3.7%) | $57,813 |
| Total | 3,571 (100.0%) | $59,222 |
Family Income by Number of Earners in Nolan County
The median family income in Nolan County is $59,222, with families comprising 3+ earners (223) having the highest median family income of $101,359, while families with no earners (502) have the lowest median family income of $39,630, accounting for 6.2% and 14.1% of families, respectively.
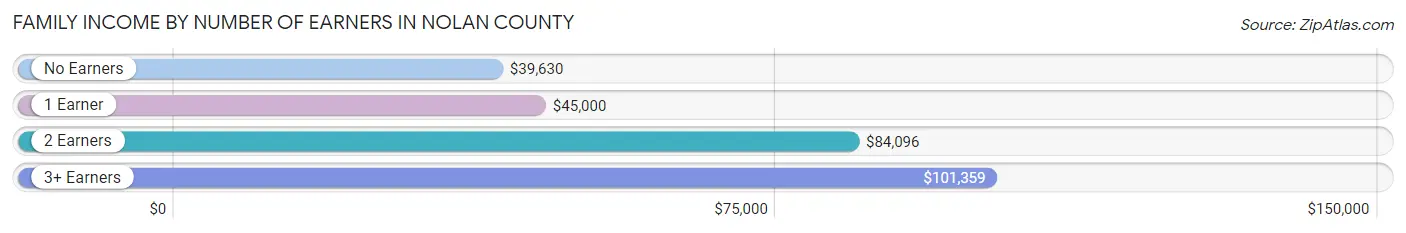
| Number of Earners | # Families | Median Income |
| No Earners | 502 (14.1%) | $39,630 |
| 1 Earner | 1,350 (37.8%) | $45,000 |
| 2 Earners | 1,496 (41.9%) | $84,096 |
| 3+ Earners | 223 (6.2%) | $101,359 |
| Total | 3,571 (100.0%) | $59,222 |
Household Income in Nolan County
Household Income Brackets in Nolan County
With 1,077 households falling in the category, the $35,000 to $49,999 income range is the most frequent in Nolan County, accounting for 19.0% of all households. In contrast, only 244 households (4.3%) fall into the $150,000 to $199,999 income bracket, making it the least populous group.
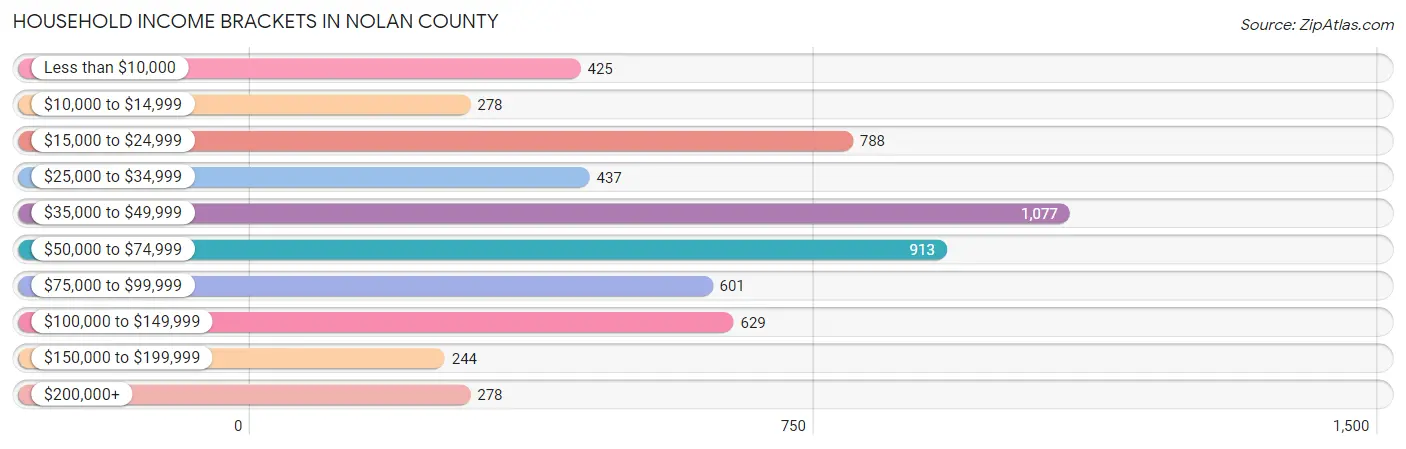
| Income Bracket | # Households | % Households |
| Less than $10,000 | 425 | 7.5% |
| $10,000 to $14,999 | 278 | 4.9% |
| $15,000 to $24,999 | 788 | 13.9% |
| $25,000 to $34,999 | 437 | 7.7% |
| $35,000 to $49,999 | 1,077 | 19.0% |
| $50,000 to $74,999 | 913 | 16.1% |
| $75,000 to $99,999 | 601 | 10.6% |
| $100,000 to $149,999 | 629 | 11.1% |
| $150,000 to $199,999 | 244 | 4.3% |
| $200,000+ | 278 | 4.9% |
Household Income by Householder Age in Nolan County
The median household income in Nolan County is $47,437, with the highest median household income of $58,309 found in the 15 to 24 years age bracket for the primary householder. A total of 121 households (2.1%) fall into this category. Meanwhile, the 65+ years age bracket for the primary householder has the lowest median household income of $38,160, with 1,800 households (31.8%) in this group.
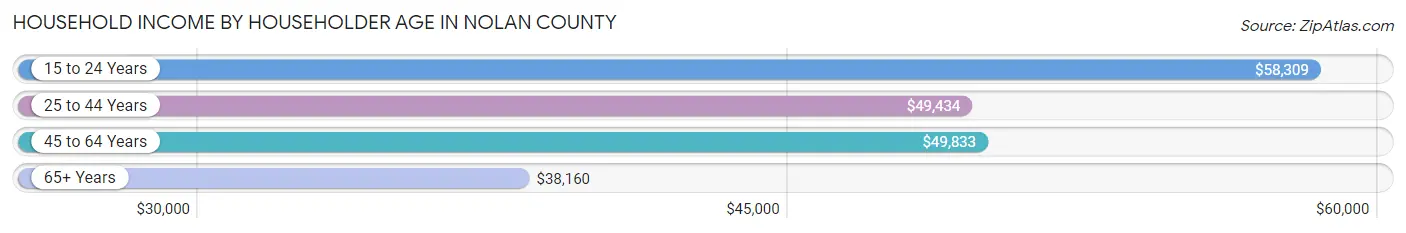
| Income Bracket | # Households | Median Income |
| 15 to 24 Years | 121 (2.1%) | $58,309 |
| 25 to 44 Years | 1,777 (31.3%) | $49,434 |
| 45 to 64 Years | 1,972 (34.8%) | $49,833 |
| 65+ Years | 1,800 (31.8%) | $38,160 |
| Total | 5,670 (100.0%) | $47,437 |
Poverty in Nolan County
Income Below Poverty by Sex and Age in Nolan County
With 11.0% poverty level for males and 20.3% for females among the residents of Nolan County, 5 year old males and 16 and 17 year old females are the most vulnerable to poverty, with 18 males (72.0%) and 93 females (50.3%) in their respective age groups living below the poverty level.
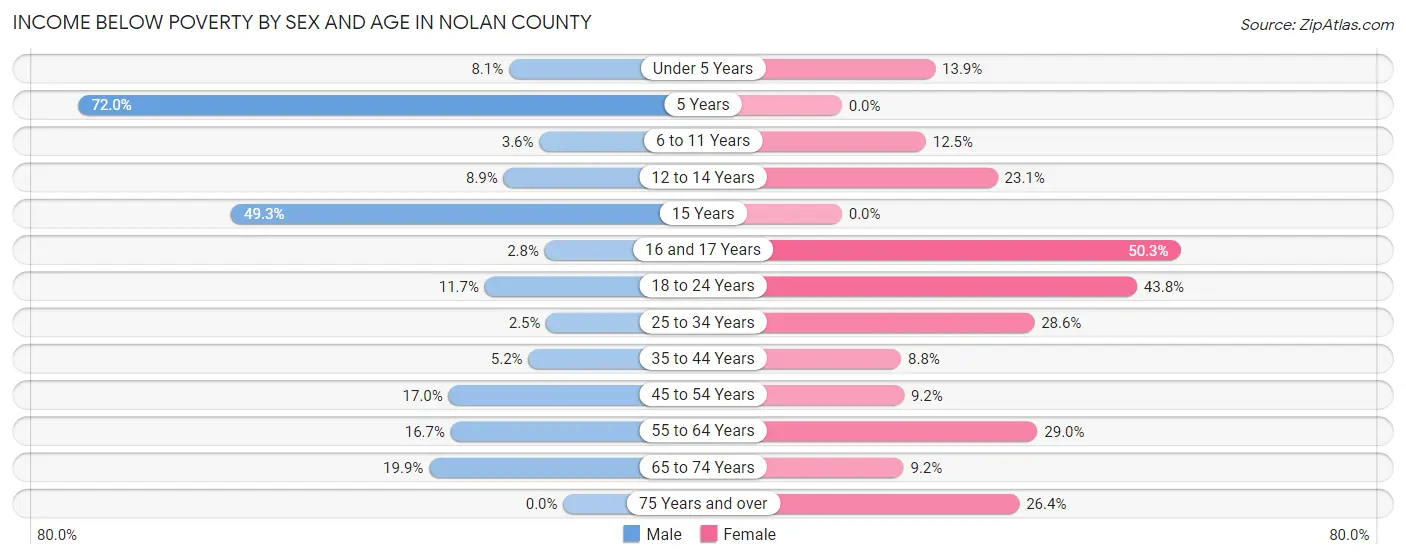
| Age Bracket | Male | Female |
| Under 5 Years | 34 (8.1%) | 83 (13.9%) |
| 5 Years | 18 (72.0%) | 0 (0.0%) |
| 6 to 11 Years | 24 (3.6%) | 67 (12.5%) |
| 12 to 14 Years | 29 (8.9%) | 84 (23.1%) |
| 15 Years | 73 (49.3%) | 0 (0.0%) |
| 16 and 17 Years | 8 (2.8%) | 93 (50.3%) |
| 18 to 24 Years | 88 (11.7%) | 220 (43.8%) |
| 25 to 34 Years | 21 (2.5%) | 252 (28.6%) |
| 35 to 44 Years | 43 (5.2%) | 66 (8.8%) |
| 45 to 54 Years | 138 (17.0%) | 74 (9.2%) |
| 55 to 64 Years | 144 (16.7%) | 255 (29.0%) |
| 65 to 74 Years | 180 (19.9%) | 70 (9.2%) |
| 75 Years and over | 0 (0.0%) | 166 (26.4%) |
| Total | 800 (11.0%) | 1,430 (20.3%) |
Income Above Poverty by Sex and Age in Nolan County
According to the poverty statistics in Nolan County, males aged 75 years and over and females aged 5 years are the age groups that are most secure financially, with 100.0% of males and 100.0% of females in these age groups living above the poverty line.
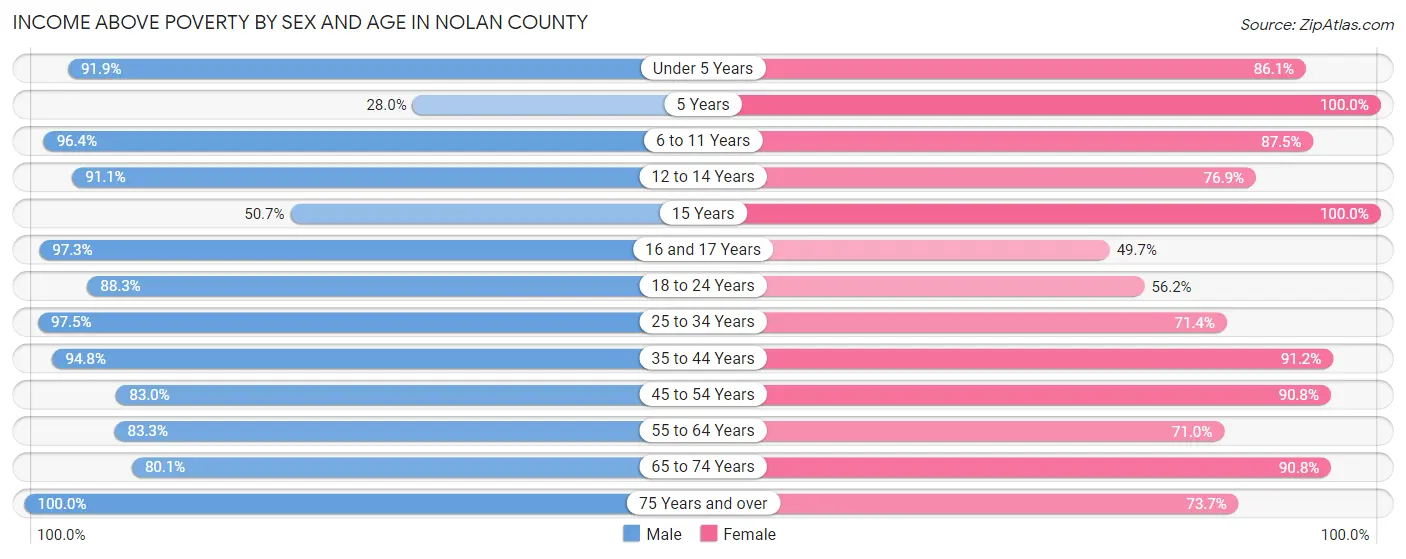
| Age Bracket | Male | Female |
| Under 5 Years | 388 (91.9%) | 516 (86.1%) |
| 5 Years | 7 (28.0%) | 133 (100.0%) |
| 6 to 11 Years | 651 (96.4%) | 470 (87.5%) |
| 12 to 14 Years | 298 (91.1%) | 279 (76.9%) |
| 15 Years | 75 (50.7%) | 39 (100.0%) |
| 16 and 17 Years | 283 (97.3%) | 92 (49.7%) |
| 18 to 24 Years | 667 (88.3%) | 282 (56.2%) |
| 25 to 34 Years | 813 (97.5%) | 630 (71.4%) |
| 35 to 44 Years | 786 (94.8%) | 683 (91.2%) |
| 45 to 54 Years | 672 (83.0%) | 727 (90.8%) |
| 55 to 64 Years | 718 (83.3%) | 623 (71.0%) |
| 65 to 74 Years | 723 (80.1%) | 693 (90.8%) |
| 75 Years and over | 412 (100.0%) | 464 (73.7%) |
| Total | 6,493 (89.0%) | 5,631 (79.7%) |
Income Below Poverty Among Married-Couple Families in Nolan County
The poverty statistics for married-couple families in Nolan County show that 3.3% or 80 of the total 2,465 families live below the poverty line. Families with 1 or 2 children have the highest poverty rate of 8.3%, comprising of 54 families. On the other hand, families with 5 or more children have the lowest poverty rate of 0.0%, which includes 0 families.
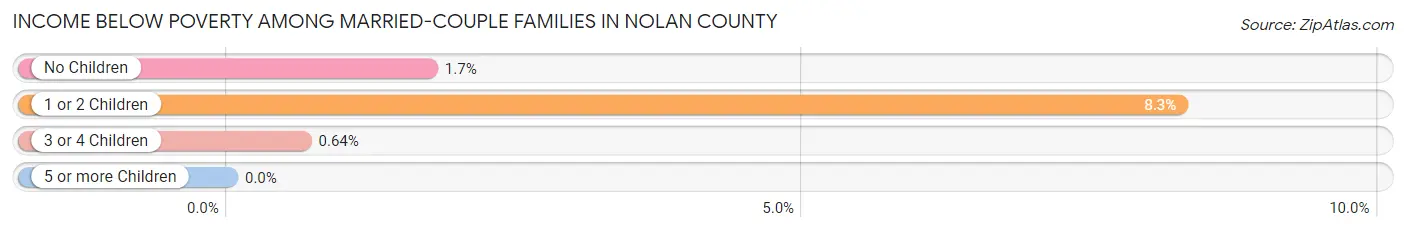
| Children | Above Poverty | Below Poverty |
| No Children | 1,353 (98.3%) | 24 (1.7%) |
| 1 or 2 Children | 599 (91.7%) | 54 (8.3%) |
| 3 or 4 Children | 310 (99.4%) | 2 (0.6%) |
| 5 or more Children | 123 (100.0%) | 0 (0.0%) |
| Total | 2,385 (96.8%) | 80 (3.3%) |
Income Below Poverty Among Single-Parent Households in Nolan County
According to the poverty data in Nolan County, 3.7% or 12 single-father households and 37.1% or 289 single-mother households are living below the poverty line. Among single-father households, those with no children have the highest poverty rate, with 7 households (6.0%) experiencing poverty. Likewise, among single-mother households, those with 1 or 2 children have the highest poverty rate, with 218 households (56.3%) falling below the poverty line.
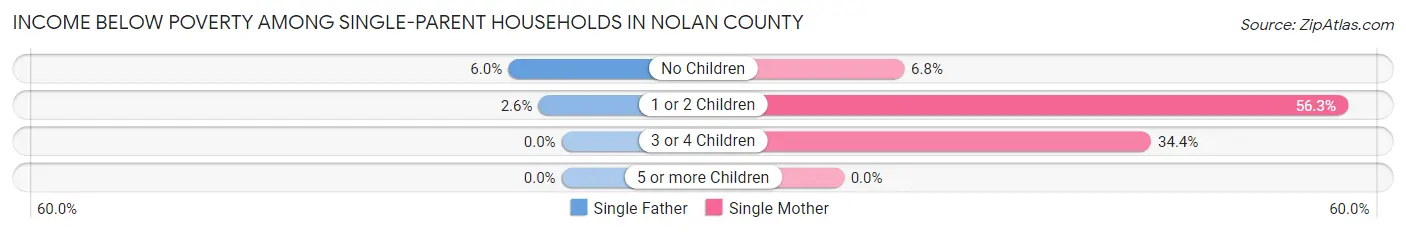
| Children | Single Father | Single Mother |
| No Children | 7 (6.0%) | 15 (6.8%) |
| 1 or 2 Children | 5 (2.6%) | 218 (56.3%) |
| 3 or 4 Children | 0 (0.0%) | 56 (34.4%) |
| 5 or more Children | 0 (0.0%) | 0 (0.0%) |
| Total | 12 (3.7%) | 289 (37.1%) |
Income Below Poverty Among Married-Couple vs Single-Parent Households in Nolan County
The poverty data for Nolan County shows that 80 of the married-couple family households (3.3%) and 301 of the single-parent households (27.2%) are living below the poverty level. Within the married-couple family households, those with 1 or 2 children have the highest poverty rate, with 54 households (8.3%) falling below the poverty line. Among the single-parent households, those with 1 or 2 children have the highest poverty rate, with 223 household (38.5%) living below poverty.
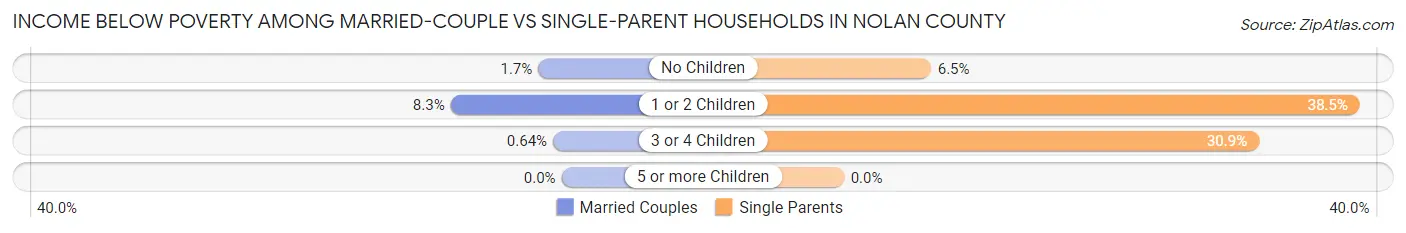
| Children | Married-Couple Families | Single-Parent Households |
| No Children | 24 (1.7%) | 22 (6.5%) |
| 1 or 2 Children | 54 (8.3%) | 223 (38.5%) |
| 3 or 4 Children | 2 (0.6%) | 56 (30.9%) |
| 5 or more Children | 0 (0.0%) | 0 (0.0%) |
| Total | 80 (3.3%) | 301 (27.2%) |
Race in Nolan County
The most populous races in Nolan County are White / Caucasian (10,973 | 74.9%), Hispanic or Latino (5,777 | 39.4%), and Two or more Races (1,746 | 11.9%).
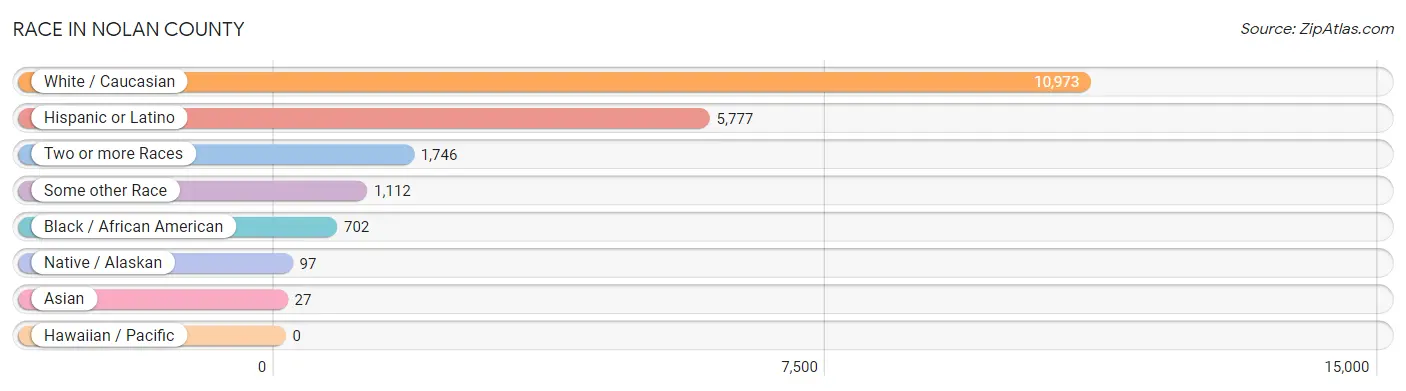
| Race | # Population | % Population |
| Asian | 27 | 0.2% |
| Black / African American | 702 | 4.8% |
| Hawaiian / Pacific | 0 | 0.0% |
| Hispanic or Latino | 5,777 | 39.4% |
| Native / Alaskan | 97 | 0.7% |
| White / Caucasian | 10,973 | 74.9% |
| Two or more Races | 1,746 | 11.9% |
| Some other Race | 1,112 | 7.6% |
| Total | 14,657 | 100.0% |
Ancestry in Nolan County
The most populous ancestries reported in Nolan County are Mexican (5,454 | 37.2%), English (1,318 | 9.0%), German (1,317 | 9.0%), American (1,261 | 8.6%), and Irish (953 | 6.5%), together accounting for 70.3% of all Nolan County residents.
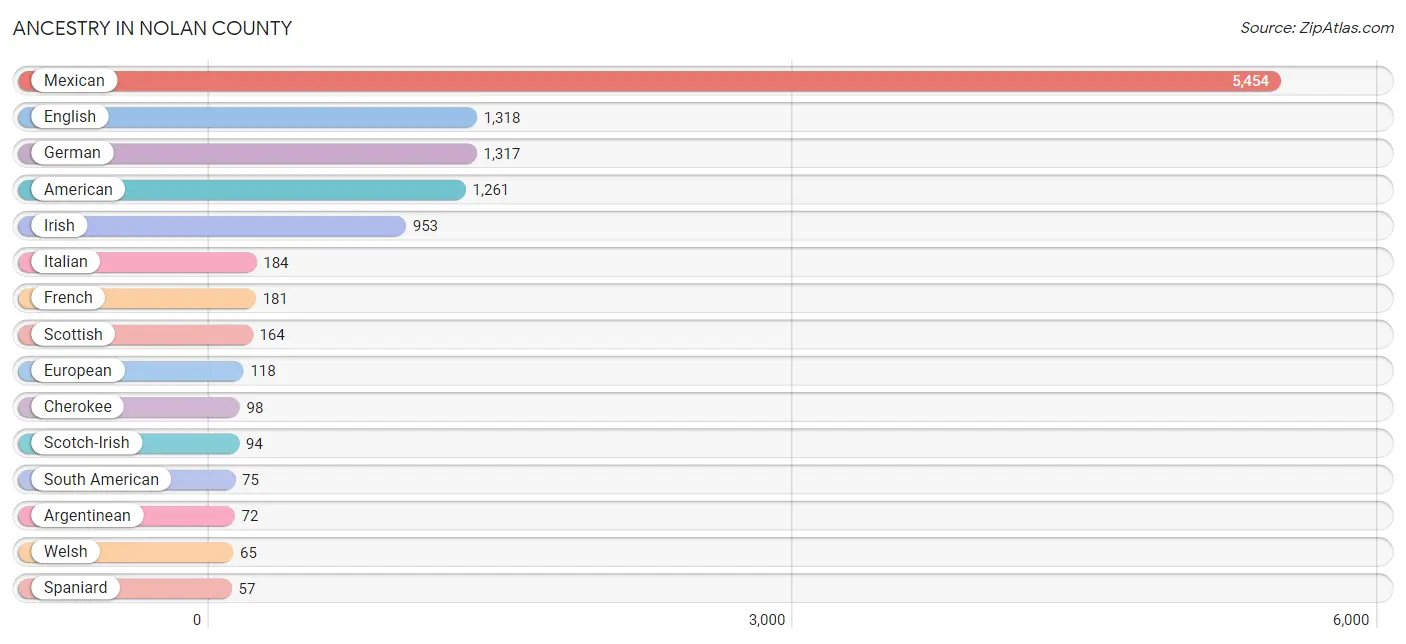
| Ancestry | # Population | % Population |
| African | 13 | 0.1% |
| American | 1,261 | 8.6% |
| Apache | 48 | 0.3% |
| Arab | 14 | 0.1% |
| Argentinean | 72 | 0.5% |
| Bhutanese | 17 | 0.1% |
| Bolivian | 3 | 0.0% |
| Brazilian | 5 | 0.0% |
| British | 37 | 0.3% |
| Burmese | 10 | 0.1% |
| Cajun | 1 | 0.0% |
| Canadian | 16 | 0.1% |
| Central American | 5 | 0.0% |
| Cherokee | 98 | 0.7% |
| Chickasaw | 5 | 0.0% |
| Comanche | 42 | 0.3% |
| Dutch | 16 | 0.1% |
| Dutch West Indian | 1 | 0.0% |
| Eastern European | 3 | 0.0% |
| English | 1,318 | 9.0% |
| European | 118 | 0.8% |
| French | 181 | 1.2% |
| French Canadian | 24 | 0.2% |
| German | 1,317 | 9.0% |
| Houma | 29 | 0.2% |
| Hungarian | 3 | 0.0% |
| Iranian | 33 | 0.2% |
| Irish | 953 | 6.5% |
| Italian | 184 | 1.3% |
| Korean | 29 | 0.2% |
| Mexican | 5,454 | 37.2% |
| Mexican American Indian | 24 | 0.2% |
| Nicaraguan | 5 | 0.0% |
| Nigerian | 39 | 0.3% |
| Norwegian | 27 | 0.2% |
| Puerto Rican | 9 | 0.1% |
| Scandinavian | 21 | 0.1% |
| Scotch-Irish | 94 | 0.6% |
| Scottish | 164 | 1.1% |
| Slovak | 10 | 0.1% |
| South American | 75 | 0.5% |
| Spaniard | 57 | 0.4% |
| Spanish | 2 | 0.0% |
| Subsaharan African | 52 | 0.4% |
| Swedish | 13 | 0.1% |
| Swiss | 2 | 0.0% |
| Syrian | 11 | 0.1% |
| Thai | 8 | 0.1% |
| Turkish | 5 | 0.0% |
| Ukrainian | 10 | 0.1% |
| Welsh | 65 | 0.4% | View All 51 Rows |
Immigrants in Nolan County
The most numerous immigrant groups reported in Nolan County came from Latin America (779 | 5.3%), Central America (699 | 4.8%), Mexico (694 | 4.7%), South America (80 | 0.5%), and Argentina (72 | 0.5%), together accounting for 15.9% of all Nolan County residents.
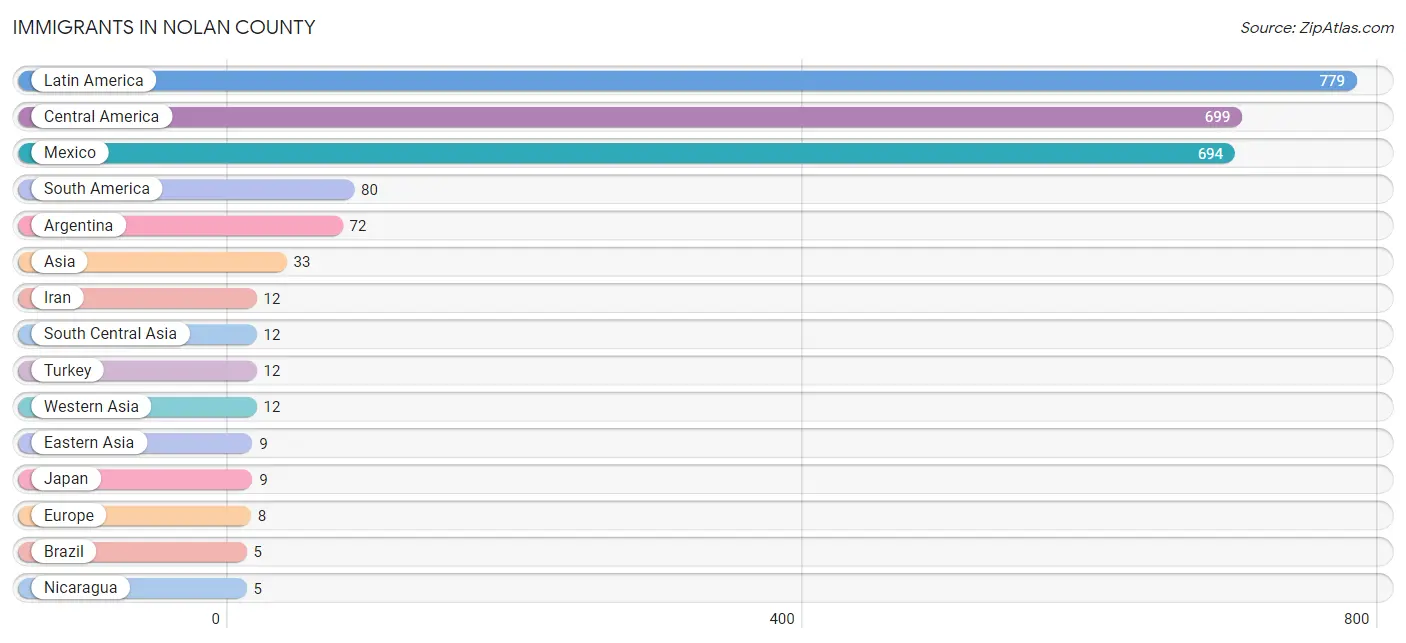
| Immigration Origin | # Population | % Population |
| Argentina | 72 | 0.5% |
| Asia | 33 | 0.2% |
| Bolivia | 3 | 0.0% |
| Brazil | 5 | 0.0% |
| Central America | 699 | 4.8% |
| Eastern Asia | 9 | 0.1% |
| Europe | 8 | 0.1% |
| Germany | 4 | 0.0% |
| Iran | 12 | 0.1% |
| Japan | 9 | 0.1% |
| Latin America | 779 | 5.3% |
| Mexico | 694 | 4.7% |
| Nicaragua | 5 | 0.0% |
| South America | 80 | 0.5% |
| South Central Asia | 12 | 0.1% |
| Southern Europe | 4 | 0.0% |
| Spain | 4 | 0.0% |
| Turkey | 12 | 0.1% |
| Western Asia | 12 | 0.1% |
| Western Europe | 4 | 0.0% | View All 20 Rows |
Sex and Age in Nolan County
Sex and Age in Nolan County
The most populous age groups in Nolan County are 15 to 19 Years (694 | 9.3%) for men and Under 5 Years (599 | 8.3%) for women.
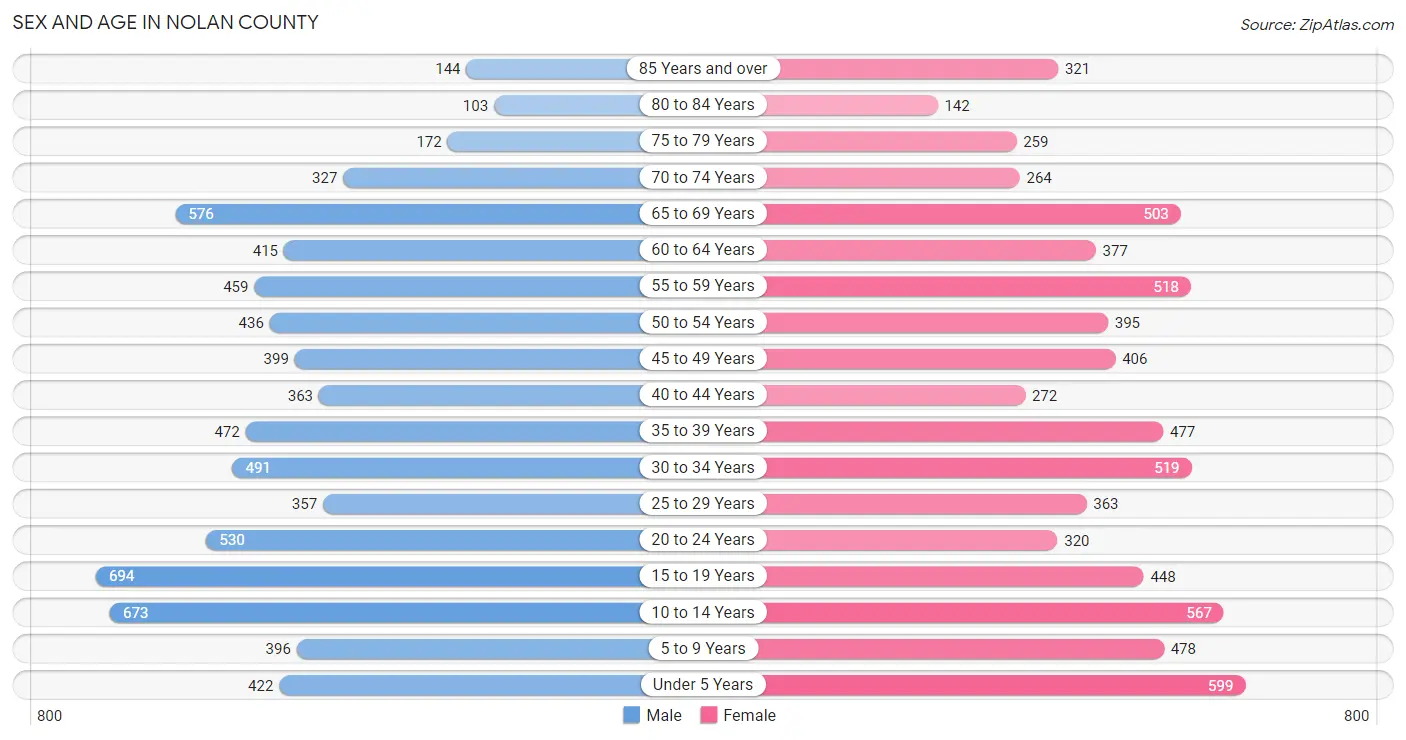
| Age Bracket | Male | Female |
| Under 5 Years | 422 (5.7%) | 599 (8.3%) |
| 5 to 9 Years | 396 (5.3%) | 478 (6.6%) |
| 10 to 14 Years | 673 (9.1%) | 567 (7.8%) |
| 15 to 19 Years | 694 (9.3%) | 448 (6.2%) |
| 20 to 24 Years | 530 (7.1%) | 320 (4.4%) |
| 25 to 29 Years | 357 (4.8%) | 363 (5.0%) |
| 30 to 34 Years | 491 (6.6%) | 519 (7.2%) |
| 35 to 39 Years | 472 (6.4%) | 477 (6.6%) |
| 40 to 44 Years | 363 (4.9%) | 272 (3.8%) |
| 45 to 49 Years | 399 (5.4%) | 406 (5.6%) |
| 50 to 54 Years | 436 (5.9%) | 395 (5.5%) |
| 55 to 59 Years | 459 (6.2%) | 518 (7.2%) |
| 60 to 64 Years | 415 (5.6%) | 377 (5.2%) |
| 65 to 69 Years | 576 (7.7%) | 503 (7.0%) |
| 70 to 74 Years | 327 (4.4%) | 264 (3.6%) |
| 75 to 79 Years | 172 (2.3%) | 259 (3.6%) |
| 80 to 84 Years | 103 (1.4%) | 142 (2.0%) |
| 85 Years and over | 144 (1.9%) | 321 (4.4%) |
| Total | 7,429 (100.0%) | 7,228 (100.0%) |
Families and Households in Nolan County
Median Family Size in Nolan County
The median family size in Nolan County is 3.23 persons per family, with married-couple families (2,465 | 69.0%) accounting for the largest median family size of 3.32 persons per family. On the other hand, single male/father families (328 | 9.2%) represent the smallest median family size with 2.63 persons per family.
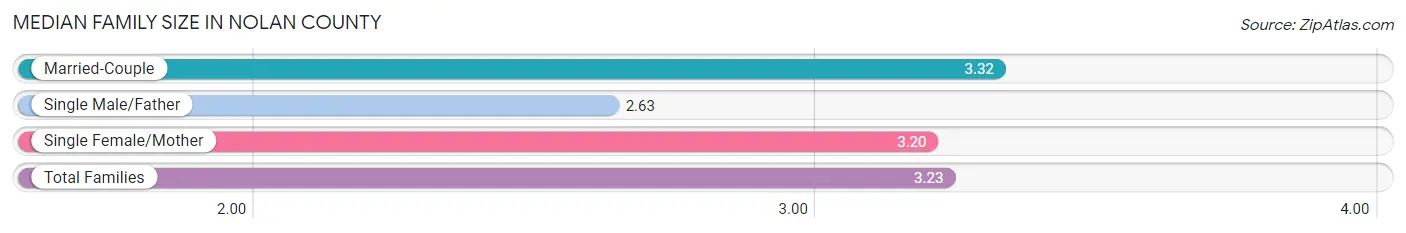
| Family Type | # Families | Family Size |
| Married-Couple | 2,465 (69.0%) | 3.32 |
| Single Male/Father | 328 (9.2%) | 2.63 |
| Single Female/Mother | 778 (21.8%) | 3.20 |
| Total Families | 3,571 (100.0%) | 3.23 |
Median Household Size in Nolan County
The median household size in Nolan County is 2.53 persons per household, with single female/mother households (778 | 13.7%) accounting for the largest median household size of 3.39 persons per household. non-family households (2,099 | 37.0%) represent the smallest median household size with 1.14 persons per household.
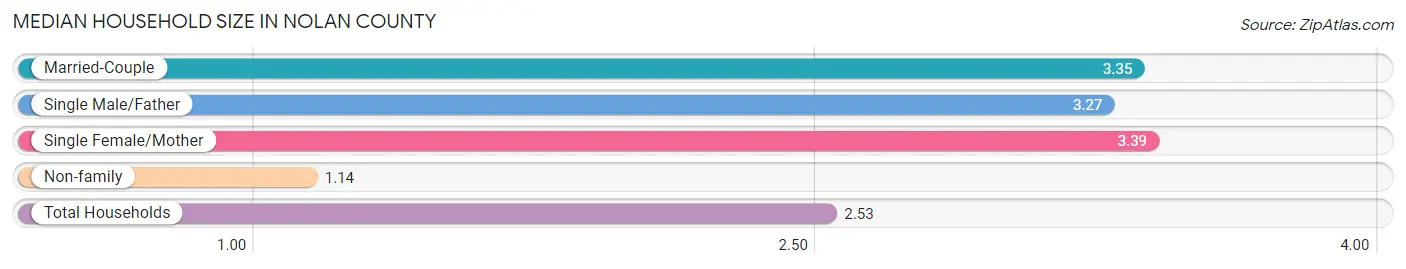
| Household Type | # Households | Household Size |
| Married-Couple | 2,465 (43.5%) | 3.35 |
| Single Male/Father | 328 (5.8%) | 3.27 |
| Single Female/Mother | 778 (13.7%) | 3.39 |
| Non-family | 2,099 (37.0%) | 1.14 |
| Total Households | 5,670 (100.0%) | 2.53 |
Household Size by Marriage Status in Nolan County
Out of a total of 5,670 households in Nolan County, 3,571 (63.0%) are family households, while 2,099 (37.0%) are nonfamily households. The most numerous type of family households are 2-person households, comprising 1,486, and the most common type of nonfamily households are 1-person households, comprising 1,906.
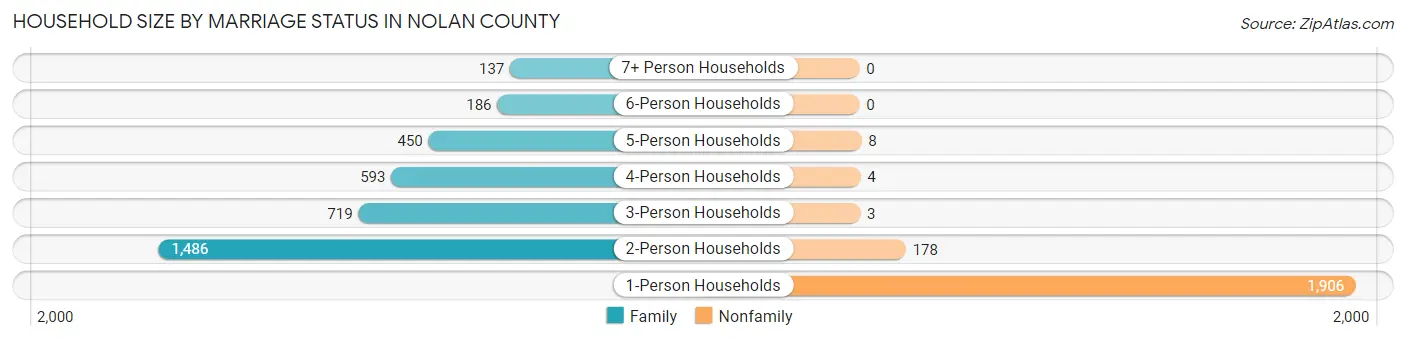
| Household Size | Family Households | Nonfamily Households |
| 1-Person Households | - | 1,906 (33.6%) |
| 2-Person Households | 1,486 (26.2%) | 178 (3.1%) |
| 3-Person Households | 719 (12.7%) | 3 (0.1%) |
| 4-Person Households | 593 (10.5%) | 4 (0.1%) |
| 5-Person Households | 450 (7.9%) | 8 (0.1%) |
| 6-Person Households | 186 (3.3%) | 0 (0.0%) |
| 7+ Person Households | 137 (2.4%) | 0 (0.0%) |
| Total | 3,571 (63.0%) | 2,099 (37.0%) |
Female Fertility in Nolan County
Fertility by Age in Nolan County
Average fertility rate in Nolan County is 67.0 births per 1,000 women. Women in the age bracket of 20 to 34 years have the highest fertility rate with 127.0 births per 1,000 women. Women in the age bracket of 20 to 34 years acount for 80.9% of all women with births.
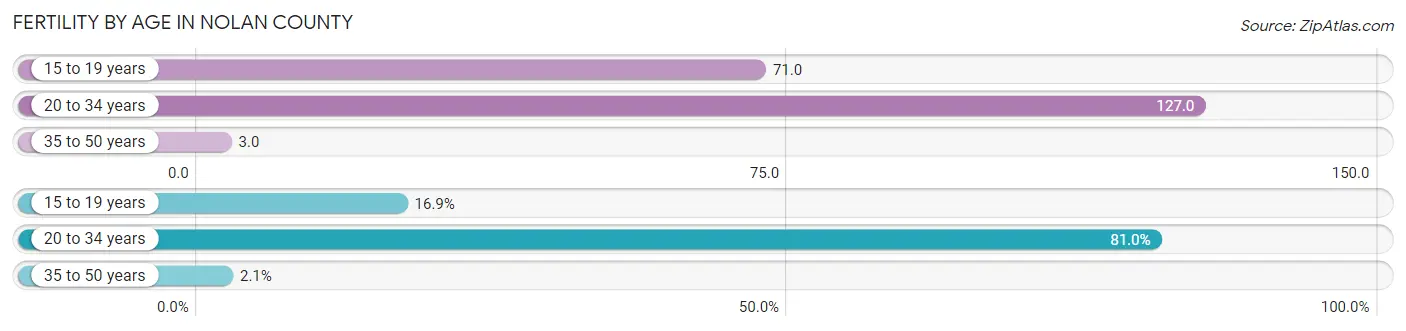
| Age Bracket | Women with Births | Births / 1,000 Women |
| 15 to 19 years | 32 (16.9%) | 71.0 |
| 20 to 34 years | 153 (80.9%) | 127.0 |
| 35 to 50 years | 4 (2.1%) | 3.0 |
| Total | 189 (100.0%) | 67.0 |
Fertility by Age by Marriage Status in Nolan County
61.4% of women with births (189) in Nolan County are married. The highest percentage of unmarried women with births falls into 15 to 19 years age bracket with 68.8% of them unmarried at the time of birth, while the lowest percentage of unmarried women with births belong to 35 to 50 years age bracket with 0.0% of them unmarried.
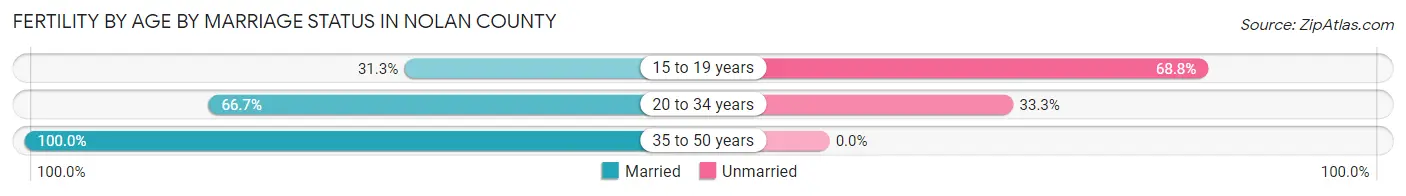
| Age Bracket | Married | Unmarried |
| 15 to 19 years | 10 (31.2%) | 22 (68.8%) |
| 20 to 34 years | 102 (66.7%) | 51 (33.3%) |
| 35 to 50 years | 4 (100.0%) | 0 (0.0%) |
| Total | 116 (61.4%) | 73 (38.6%) |
Fertility by Education in Nolan County
Average fertility rate in Nolan County is 67.0 births per 1,000 women. Women with the education attainment of high school diploma have the highest fertility rate of 91.0 births per 1,000 women, while women with the education attainment of bachelor's degree have the lowest fertility at 15.0 births per 1,000 women. Women with the education attainment of college or associate's degree represent 39.7% of all women with births.
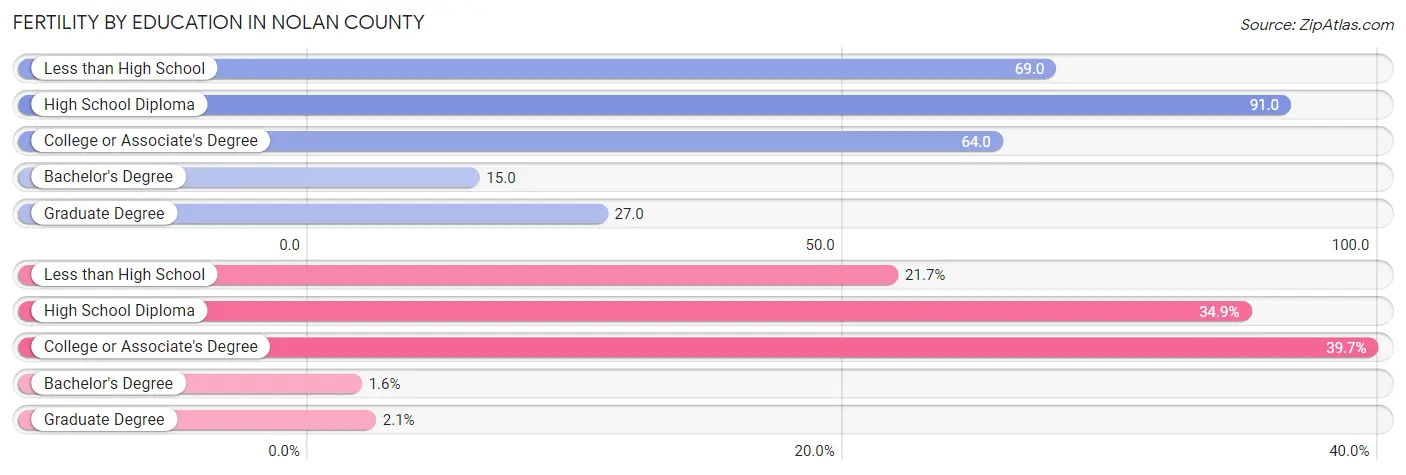
| Educational Attainment | Women with Births | Births / 1,000 Women |
| Less than High School | 41 (21.7%) | 69.0 |
| High School Diploma | 66 (34.9%) | 91.0 |
| College or Associate's Degree | 75 (39.7%) | 64.0 |
| Bachelor's Degree | 3 (1.6%) | 15.0 |
| Graduate Degree | 4 (2.1%) | 27.0 |
| Total | 189 (100.0%) | 67.0 |
Fertility by Education by Marriage Status in Nolan County
38.6% of women with births in Nolan County are unmarried. Women with the educational attainment of bachelor's degree are most likely to be married with 100.0% of them married at childbirth, while women with the educational attainment of less than high school are least likely to be married with 75.6% of them unmarried at childbirth.
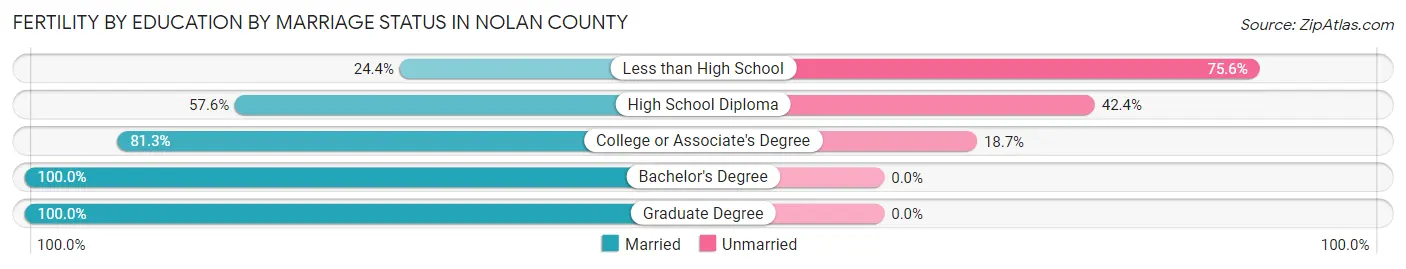
| Educational Attainment | Married | Unmarried |
| Less than High School | 10 (24.4%) | 31 (75.6%) |
| High School Diploma | 38 (57.6%) | 28 (42.4%) |
| College or Associate's Degree | 61 (81.3%) | 14 (18.7%) |
| Bachelor's Degree | 3 (100.0%) | 0 (0.0%) |
| Graduate Degree | 4 (100.0%) | 0 (0.0%) |
| Total | 116 (61.4%) | 73 (38.6%) |
Employment Characteristics in Nolan County
Employment by Class of Employer in Nolan County
Among the 6,187 employed individuals in Nolan County, private company employees (4,361 | 70.5%), local government employees (662 | 10.7%), and self-employed (not incorporated) (385 | 6.2%) make up the most common classes of employment.
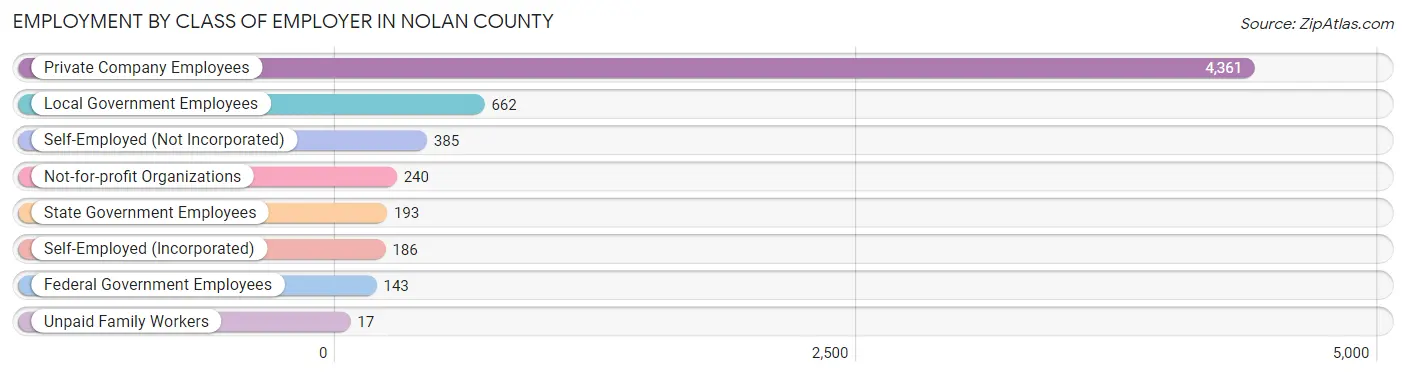
| Employer Class | # Employees | % Employees |
| Private Company Employees | 4,361 | 70.5% |
| Self-Employed (Incorporated) | 186 | 3.0% |
| Self-Employed (Not Incorporated) | 385 | 6.2% |
| Not-for-profit Organizations | 240 | 3.9% |
| Local Government Employees | 662 | 10.7% |
| State Government Employees | 193 | 3.1% |
| Federal Government Employees | 143 | 2.3% |
| Unpaid Family Workers | 17 | 0.3% |
| Total | 6,187 | 100.0% |
Employment Status by Age in Nolan County
According to the labor force statistics for Nolan County, out of the total population over 16 years of age (11,335), 59.5% or 6,744 individuals are in the labor force, with 6.6% or 445 of them unemployed. The age group with the highest labor force participation rate is 25 to 29 years, with 86.4% or 622 individuals in the labor force. Within the labor force, the 16 to 19 years age range has the highest percentage of unemployed individuals, with 25.3% or 103 of them being unemployed.
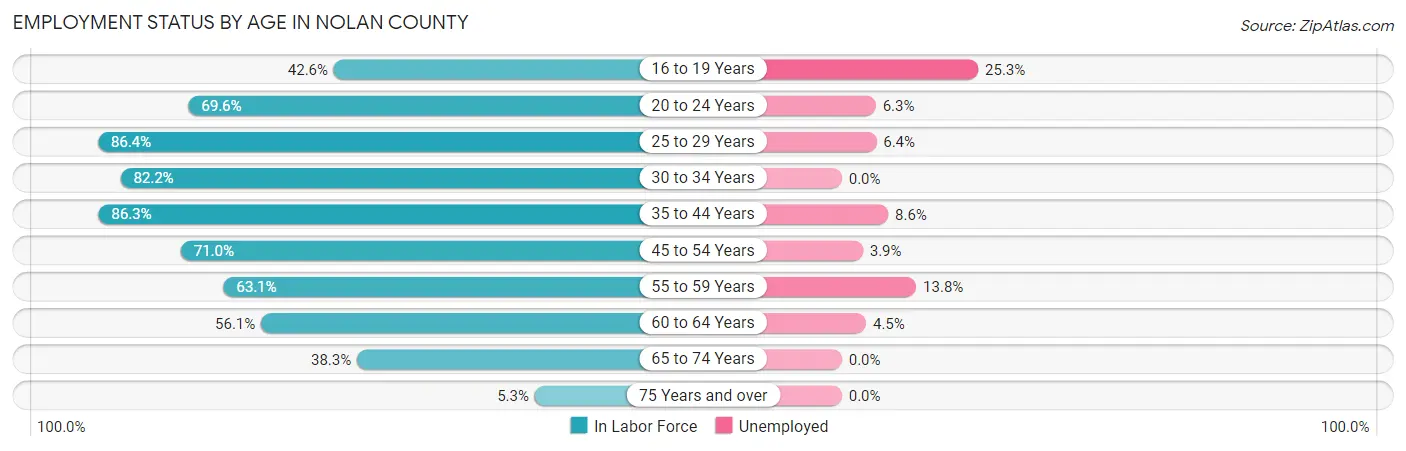
| Age Bracket | In Labor Force | Unemployed |
| 16 to 19 Years | 407 (42.6%) | 103 (25.3%) |
| 20 to 24 Years | 592 (69.6%) | 37 (6.3%) |
| 25 to 29 Years | 622 (86.4%) | 40 (6.4%) |
| 30 to 34 Years | 830 (82.2%) | 0 (0.0%) |
| 35 to 44 Years | 1,367 (86.3%) | 118 (8.6%) |
| 45 to 54 Years | 1,162 (71.0%) | 45 (3.9%) |
| 55 to 59 Years | 616 (63.1%) | 85 (13.8%) |
| 60 to 64 Years | 444 (56.1%) | 20 (4.5%) |
| 65 to 74 Years | 640 (38.3%) | 0 (0.0%) |
| 75 Years and over | 60 (5.3%) | 0 (0.0%) |
| Total | 6,744 (59.5%) | 445 (6.6%) |
Employment Status by Educational Attainment in Nolan County
According to labor force statistics for Nolan County, 75.0% of individuals (5,039) out of the total population between 25 and 64 years of age (6,719) are in the labor force, with 6.1% or 307 of them being unemployed. The group with the highest labor force participation rate are those with the educational attainment of bachelor's degree or higher, with 84.1% or 885 individuals in the labor force. Within the labor force, individuals with high school diploma education have the highest percentage of unemployment, with 7.9% or 132 of them being unemployed.

| Educational Attainment | In Labor Force | Unemployed |
| Less than High School | 511 (64.2%) | 29 (3.7%) |
| High School Diploma | 1,674 (71.1%) | 186 (7.9%) |
| College / Associate Degree | 1,970 (78.3%) | 148 (5.9%) |
| Bachelor's Degree or higher | 885 (84.1%) | 48 (4.6%) |
| Total | 5,039 (75.0%) | 410 (6.1%) |
Employment Occupations by Sex in Nolan County
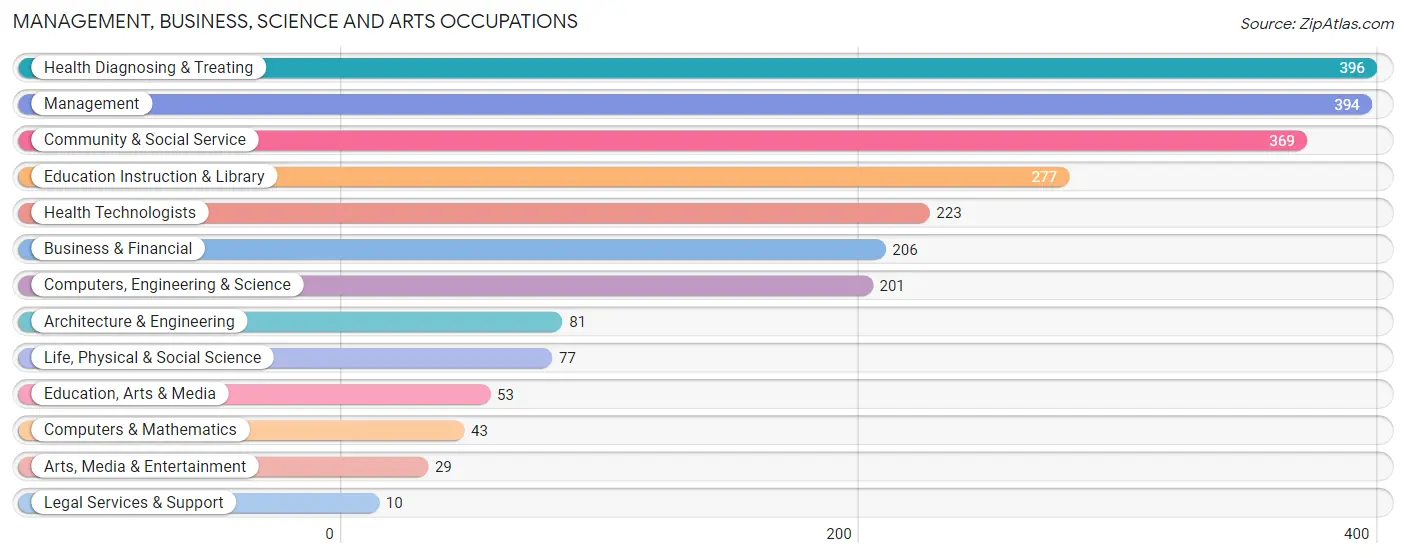
Management, Business, Science and Arts Occupations
The most common Management, Business, Science and Arts occupations in Nolan County are Health Diagnosing & Treating (396 | 6.3%), Management (394 | 6.3%), Community & Social Service (369 | 5.9%), Education Instruction & Library (277 | 4.4%), and Health Technologists (223 | 3.5%).
Management, Business, Science and Arts Occupations by Sex
Within the Management, Business, Science and Arts occupations in Nolan County, the most male-oriented occupations are Architecture & Engineering (100.0%), Legal Services & Support (100.0%), and Computers, Engineering & Science (81.1%), while the most female-oriented occupations are Education Instruction & Library (92.4%), Community & Social Service (82.9%), and Health Diagnosing & Treating (81.1%).
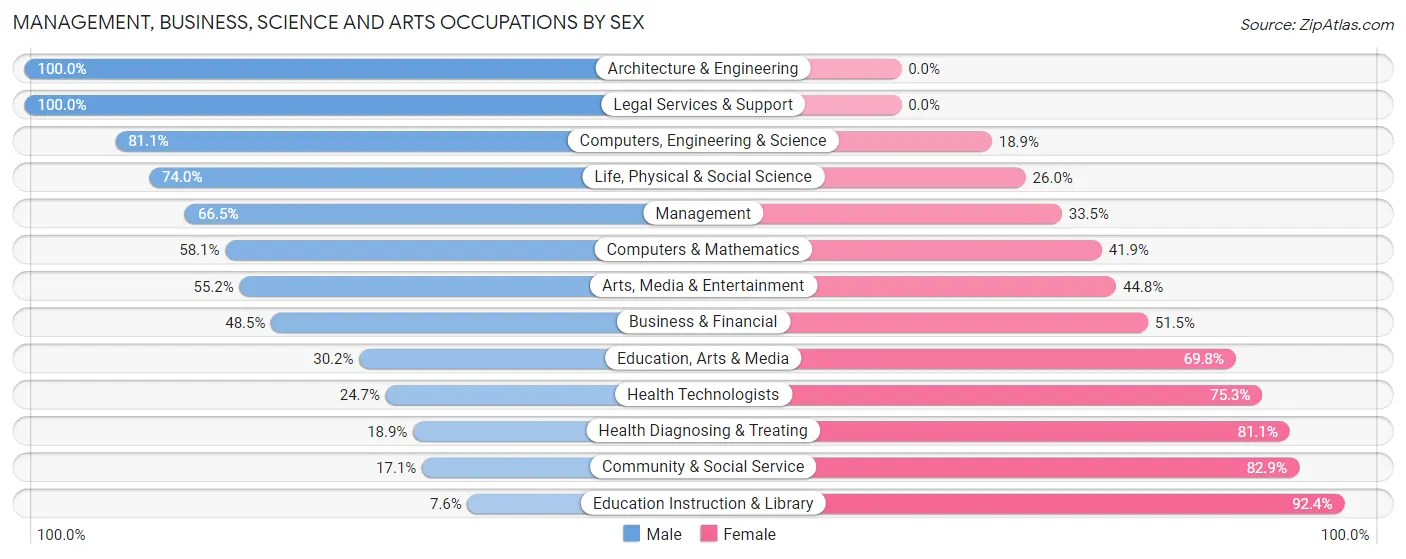
| Occupation | Male | Female |
| Management | 262 (66.5%) | 132 (33.5%) |
| Business & Financial | 100 (48.5%) | 106 (51.5%) |
| Computers, Engineering & Science | 163 (81.1%) | 38 (18.9%) |
| Computers & Mathematics | 25 (58.1%) | 18 (41.9%) |
| Architecture & Engineering | 81 (100.0%) | 0 (0.0%) |
| Life, Physical & Social Science | 57 (74.0%) | 20 (26.0%) |
| Community & Social Service | 63 (17.1%) | 306 (82.9%) |
| Education, Arts & Media | 16 (30.2%) | 37 (69.8%) |
| Legal Services & Support | 10 (100.0%) | 0 (0.0%) |
| Education Instruction & Library | 21 (7.6%) | 256 (92.4%) |
| Arts, Media & Entertainment | 16 (55.2%) | 13 (44.8%) |
| Health Diagnosing & Treating | 75 (18.9%) | 321 (81.1%) |
| Health Technologists | 55 (24.7%) | 168 (75.3%) |
| Total (Category) | 663 (42.3%) | 903 (57.7%) |
| Total (Overall) | 3,731 (59.3%) | 2,560 (40.7%) |
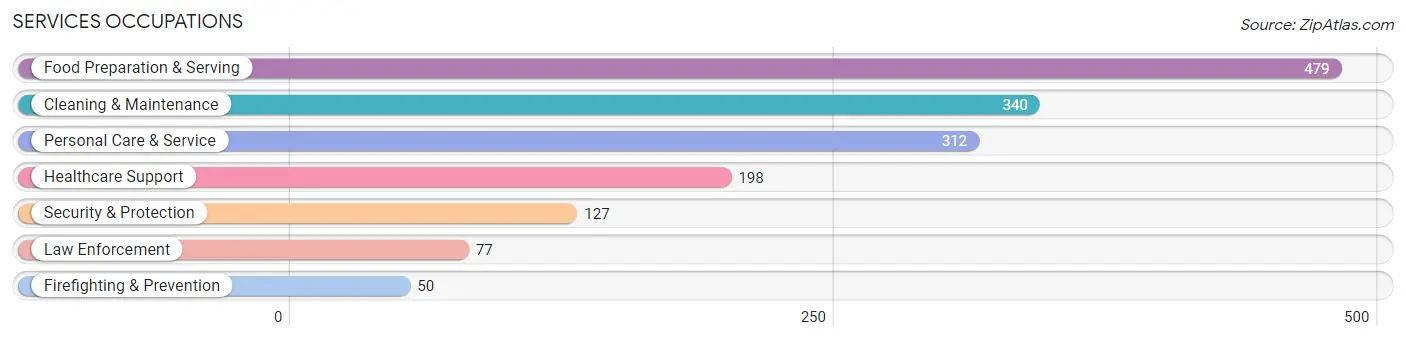
Services Occupations
The most common Services occupations in Nolan County are Food Preparation & Serving (479 | 7.6%), Cleaning & Maintenance (340 | 5.4%), Personal Care & Service (312 | 5.0%), Healthcare Support (198 | 3.2%), and Security & Protection (127 | 2.0%).
Services Occupations by Sex
Within the Services occupations in Nolan County, the most male-oriented occupations are Law Enforcement (92.2%), Security & Protection (87.4%), and Firefighting & Prevention (80.0%), while the most female-oriented occupations are Healthcare Support (84.9%), Food Preparation & Serving (54.7%), and Personal Care & Service (51.9%).
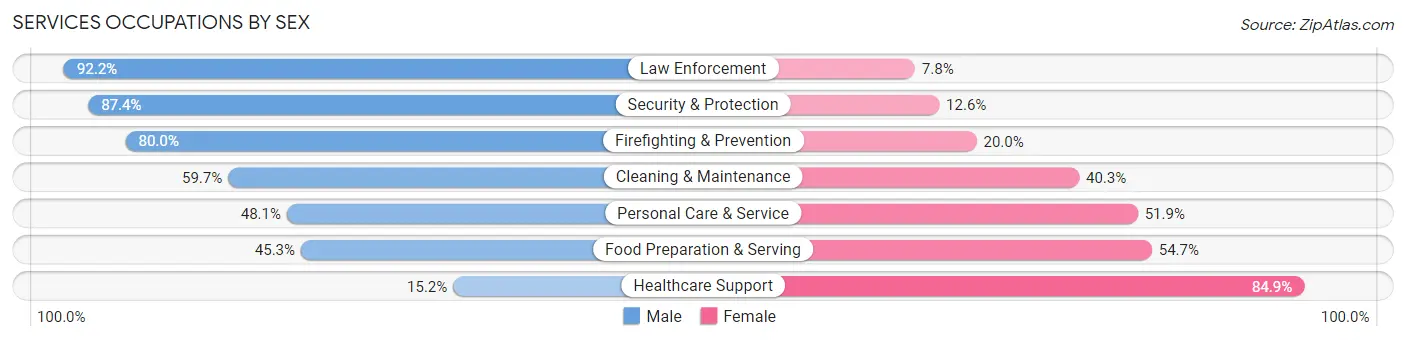
| Occupation | Male | Female |
| Healthcare Support | 30 (15.1%) | 168 (84.9%) |
| Security & Protection | 111 (87.4%) | 16 (12.6%) |
| Firefighting & Prevention | 40 (80.0%) | 10 (20.0%) |
| Law Enforcement | 71 (92.2%) | 6 (7.8%) |
| Food Preparation & Serving | 217 (45.3%) | 262 (54.7%) |
| Cleaning & Maintenance | 203 (59.7%) | 137 (40.3%) |
| Personal Care & Service | 150 (48.1%) | 162 (51.9%) |
| Total (Category) | 711 (48.8%) | 745 (51.2%) |
| Total (Overall) | 3,731 (59.3%) | 2,560 (40.7%) |
Sales and Office Occupations
The most common Sales and Office occupations in Nolan County are Sales & Related (610 | 9.7%), and Office & Administration (538 | 8.6%).

Sales and Office Occupations by Sex
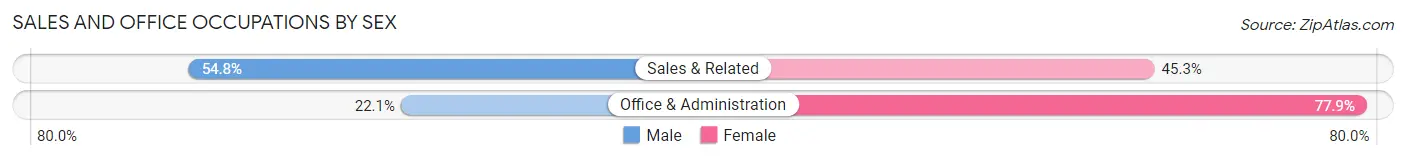
| Occupation | Male | Female |
| Sales & Related | 334 (54.7%) | 276 (45.3%) |
| Office & Administration | 119 (22.1%) | 419 (77.9%) |
| Total (Category) | 453 (39.5%) | 695 (60.5%) |
| Total (Overall) | 3,731 (59.3%) | 2,560 (40.7%) |
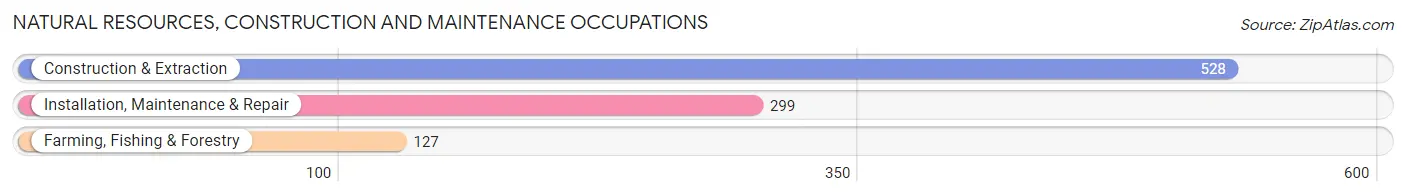
Natural Resources, Construction and Maintenance Occupations
The most common Natural Resources, Construction and Maintenance occupations in Nolan County are Construction & Extraction (528 | 8.4%), Installation, Maintenance & Repair (299 | 4.8%), and Farming, Fishing & Forestry (127 | 2.0%).
Natural Resources, Construction and Maintenance Occupations by Sex
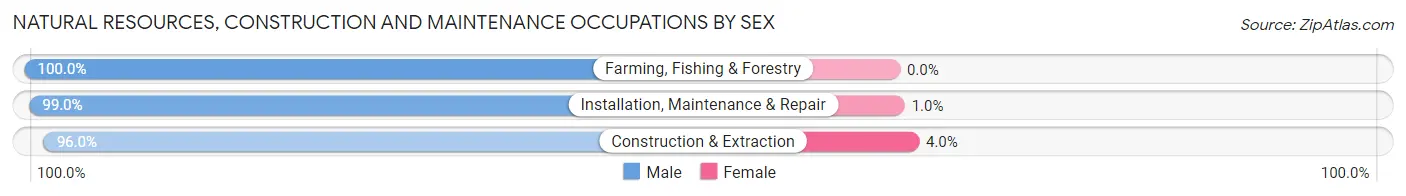
| Occupation | Male | Female |
| Farming, Fishing & Forestry | 127 (100.0%) | 0 (0.0%) |
| Construction & Extraction | 507 (96.0%) | 21 (4.0%) |
| Installation, Maintenance & Repair | 296 (99.0%) | 3 (1.0%) |
| Total (Category) | 930 (97.5%) | 24 (2.5%) |
| Total (Overall) | 3,731 (59.3%) | 2,560 (40.7%) |
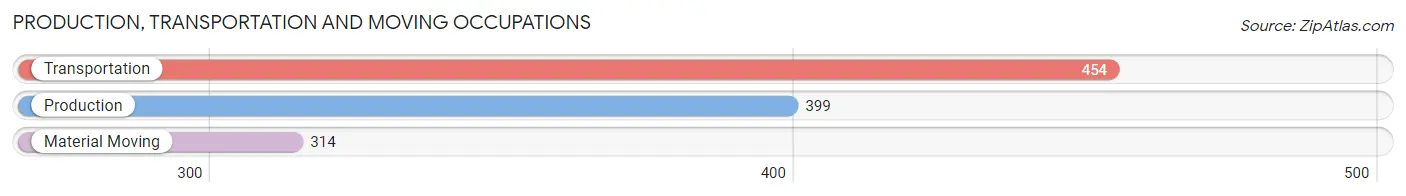
Production, Transportation and Moving Occupations
The most common Production, Transportation and Moving occupations in Nolan County are Transportation (454 | 7.2%), Production (399 | 6.3%), and Material Moving (314 | 5.0%).
Production, Transportation and Moving Occupations by Sex
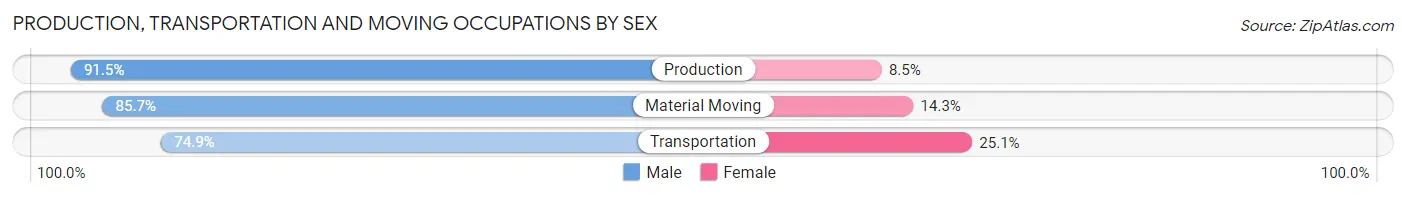
| Occupation | Male | Female |
| Production | 365 (91.5%) | 34 (8.5%) |
| Transportation | 340 (74.9%) | 114 (25.1%) |
| Material Moving | 269 (85.7%) | 45 (14.3%) |
| Total (Category) | 974 (83.5%) | 193 (16.5%) |
| Total (Overall) | 3,731 (59.3%) | 2,560 (40.7%) |
Employment Industries by Sex in Nolan County
Employment Industries in Nolan County
The major employment industries in Nolan County include Health Care & Social Assistance (808 | 12.8%), Retail Trade (806 | 12.8%), Manufacturing (705 | 11.2%), Transportation & Warehousing (579 | 9.2%), and Accommodation & Food Services (518 | 8.2%).
Employment Industries by Sex in Nolan County
The Nolan County industries that see more men than women are Construction (90.4%), Manufacturing (89.4%), and Mining, Quarrying, & Extraction (88.3%), whereas the industries that tend to have a higher number of women are Health Care & Social Assistance (87.7%), Professional & Scientific (84.5%), and Educational Services (78.8%).
| Industry | Male | Female |
| Agriculture, Fishing & Hunting | 159 (85.0%) | 28 (15.0%) |
| Mining, Quarrying, & Extraction | 211 (88.3%) | 28 (11.7%) |
| Construction | 349 (90.4%) | 37 (9.6%) |
| Manufacturing | 630 (89.4%) | 75 (10.6%) |
| Wholesale Trade | 72 (72.0%) | 28 (28.0%) |
| Retail Trade | 529 (65.6%) | 277 (34.4%) |
| Transportation & Warehousing | 481 (83.1%) | 98 (16.9%) |
| Utilities | 57 (50.9%) | 55 (49.1%) |
| Information | 11 (84.6%) | 2 (15.4%) |
| Finance & Insurance | 48 (43.2%) | 63 (56.8%) |
| Real Estate, Rental & Leasing | 27 (47.4%) | 30 (52.6%) |
| Professional & Scientific | 29 (15.5%) | 158 (84.5%) |
| Enterprise Management | 0 (0.0%) | 0 (0.0%) |
| Administrative & Support | 93 (65.0%) | 50 (35.0%) |
| Educational Services | 109 (21.2%) | 405 (78.8%) |
| Health Care & Social Assistance | 99 (12.2%) | 709 (87.7%) |
| Arts, Entertainment & Recreation | 133 (83.1%) | 27 (16.9%) |
| Accommodation & Food Services | 268 (51.7%) | 250 (48.3%) |
| Public Administration | 199 (63.4%) | 115 (36.6%) |
| Total | 3,731 (59.3%) | 2,560 (40.7%) |
Education in Nolan County
School Enrollment in Nolan County
The most common levels of schooling among the 3,442 students in Nolan County are high school (959 | 27.9%), middle school (906 | 26.3%), and elementary school (737 | 21.4%).
| School Level | # Students | % Students |
| Nursery / Preschool | 223 | 6.5% |
| Kindergarten | 164 | 4.8% |
| Elementary School | 737 | 21.4% |
| Middle School | 906 | 26.3% |
| High School | 959 | 27.9% |
| College / Undergraduate | 362 | 10.5% |
| Graduate / Professional | 91 | 2.6% |
| Total | 3,442 | 100.0% |
School Enrollment by Age by Funding Source in Nolan County
Out of a total of 3,442 students who are enrolled in schools in Nolan County, 138 (4.0%) attend a private institution, while the remaining 3,304 (96.0%) are enrolled in public schools. The age group of 35 years and over has the highest likelihood of being enrolled in private schools, with 10 (8.4% in the age bracket) enrolled. Conversely, the age group of 25 to 34 year olds has the lowest likelihood of being enrolled in a private school, with 52 (100.0% in the age bracket) attending a public institution.
| Age Bracket | Public School | Private School |
| 3 to 4 Year Olds | 154 (96.9%) | 5 (3.1%) |
| 5 to 9 Year Old | 809 (95.7%) | 36 (4.3%) |
| 10 to 14 Year Olds | 1,214 (97.9%) | 26 (2.1%) |
| 15 to 17 Year Olds | 588 (94.4%) | 35 (5.6%) |
| 18 to 19 Year Olds | 213 (93.4%) | 15 (6.6%) |
| 20 to 24 Year Olds | 166 (94.3%) | 10 (5.7%) |
| 25 to 34 Year Olds | 52 (100.0%) | 0 (0.0%) |
| 35 Years and over | 109 (91.6%) | 10 (8.4%) |
| Total | 3,304 (96.0%) | 138 (4.0%) |
Educational Attainment by Field of Study in Nolan County
Business (383 | 27.3%), education (320 | 22.8%), science & technology (151 | 10.7%), engineering (90 | 6.4%), and bio, nature & agricultural (86 | 6.1%) are the most common fields of study among 1,405 individuals in Nolan County who have obtained a bachelor's degree or higher.
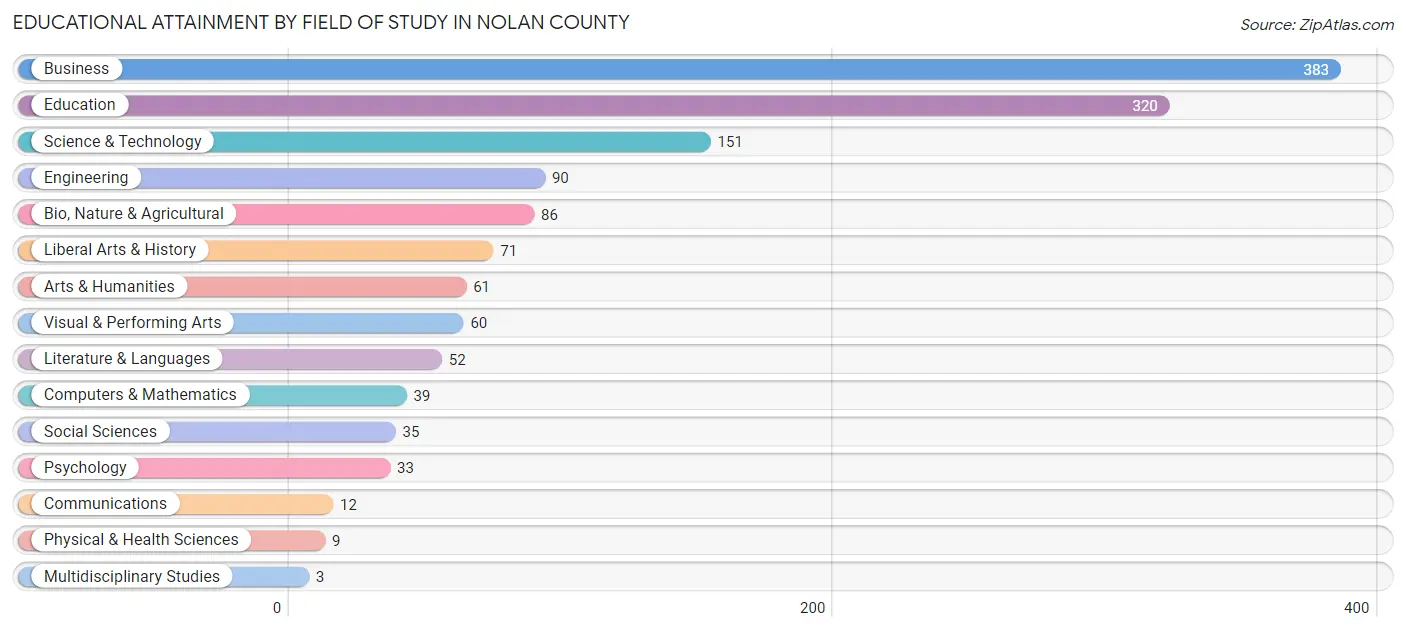
| Field of Study | # Graduates | % Graduates |
| Computers & Mathematics | 39 | 2.8% |
| Bio, Nature & Agricultural | 86 | 6.1% |
| Physical & Health Sciences | 9 | 0.6% |
| Psychology | 33 | 2.4% |
| Social Sciences | 35 | 2.5% |
| Engineering | 90 | 6.4% |
| Multidisciplinary Studies | 3 | 0.2% |
| Science & Technology | 151 | 10.7% |
| Business | 383 | 27.3% |
| Education | 320 | 22.8% |
| Literature & Languages | 52 | 3.7% |
| Liberal Arts & History | 71 | 5.1% |
| Visual & Performing Arts | 60 | 4.3% |
| Communications | 12 | 0.9% |
| Arts & Humanities | 61 | 4.3% |
| Total | 1,405 | 100.0% |
Transportation & Commute in Nolan County
Vehicle Availability by Sex in Nolan County
The most prevalent vehicle ownership categories in Nolan County are males with 2 vehicles (1,309, accounting for 35.8%) and females with 2 vehicles (942, making up 52.3%).
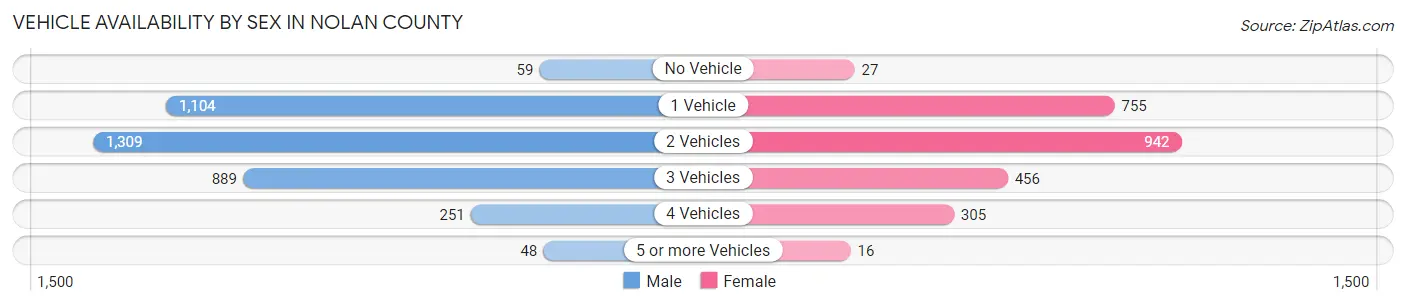
| Vehicles Available | Male | Female |
| No Vehicle | 59 (1.6%) | 27 (1.1%) |
| 1 Vehicle | 1,104 (30.2%) | 755 (30.2%) |
| 2 Vehicles | 1,309 (35.8%) | 942 (37.7%) |
| 3 Vehicles | 889 (24.3%) | 456 (18.2%) |
| 4 Vehicles | 251 (6.9%) | 305 (12.2%) |
| 5 or more Vehicles | 48 (1.3%) | 16 (0.6%) |
| Total | 3,660 (100.0%) | 2,501 (100.0%) |
Commute Time in Nolan County
The most frequently occuring commute durations in Nolan County are 5 to 9 minutes (1,576 commuters, 26.3%), 10 to 14 minutes (1,483 commuters, 24.7%), and 15 to 19 minutes (837 commuters, 14.0%).
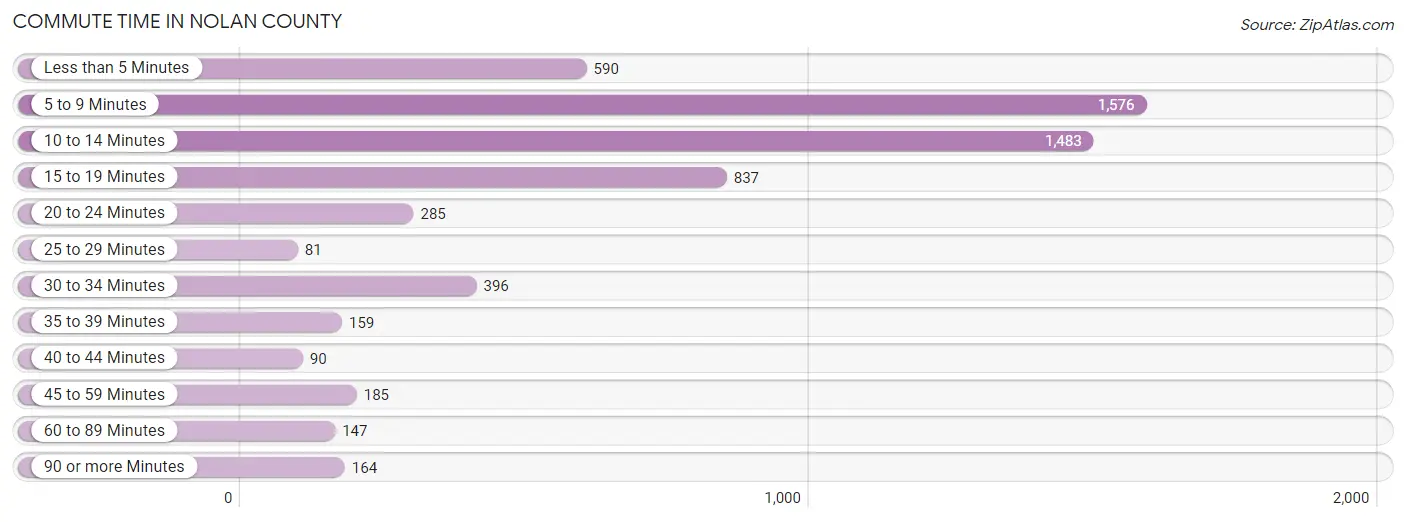
| Commute Time | # Commuters | % Commuters |
| Less than 5 Minutes | 590 | 9.8% |
| 5 to 9 Minutes | 1,576 | 26.3% |
| 10 to 14 Minutes | 1,483 | 24.7% |
| 15 to 19 Minutes | 837 | 14.0% |
| 20 to 24 Minutes | 285 | 4.8% |
| 25 to 29 Minutes | 81 | 1.3% |
| 30 to 34 Minutes | 396 | 6.6% |
| 35 to 39 Minutes | 159 | 2.6% |
| 40 to 44 Minutes | 90 | 1.5% |
| 45 to 59 Minutes | 185 | 3.1% |
| 60 to 89 Minutes | 147 | 2.5% |
| 90 or more Minutes | 164 | 2.7% |
Commute Time by Sex in Nolan County
The most common commute times in Nolan County are 10 to 14 minutes (838 commuters, 23.4%) for males and 5 to 9 minutes (774 commuters, 32.0%) for females.
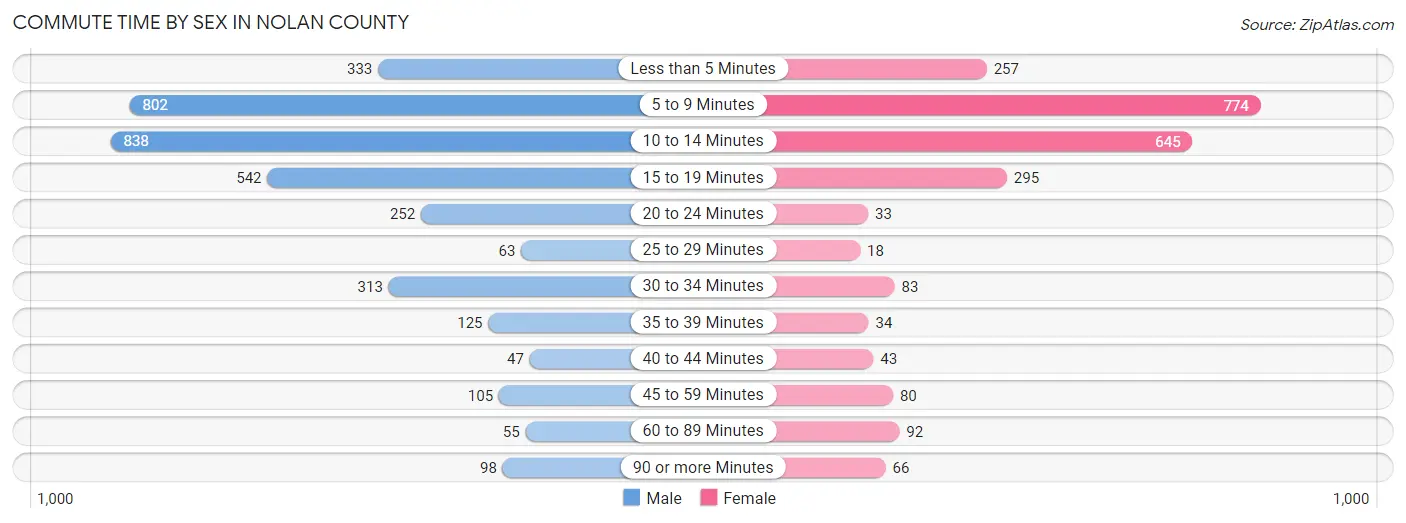
| Commute Time | Male | Female |
| Less than 5 Minutes | 333 (9.3%) | 257 (10.6%) |
| 5 to 9 Minutes | 802 (22.5%) | 774 (32.0%) |
| 10 to 14 Minutes | 838 (23.4%) | 645 (26.7%) |
| 15 to 19 Minutes | 542 (15.2%) | 295 (12.2%) |
| 20 to 24 Minutes | 252 (7.0%) | 33 (1.4%) |
| 25 to 29 Minutes | 63 (1.8%) | 18 (0.7%) |
| 30 to 34 Minutes | 313 (8.8%) | 83 (3.4%) |
| 35 to 39 Minutes | 125 (3.5%) | 34 (1.4%) |
| 40 to 44 Minutes | 47 (1.3%) | 43 (1.8%) |
| 45 to 59 Minutes | 105 (2.9%) | 80 (3.3%) |
| 60 to 89 Minutes | 55 (1.5%) | 92 (3.8%) |
| 90 or more Minutes | 98 (2.7%) | 66 (2.7%) |
Time of Departure to Work by Sex in Nolan County
The most frequent times of departure to work in Nolan County are 7:00 AM to 7:29 AM (753, 21.1%) for males and 7:00 AM to 7:29 AM (396, 16.4%) for females.
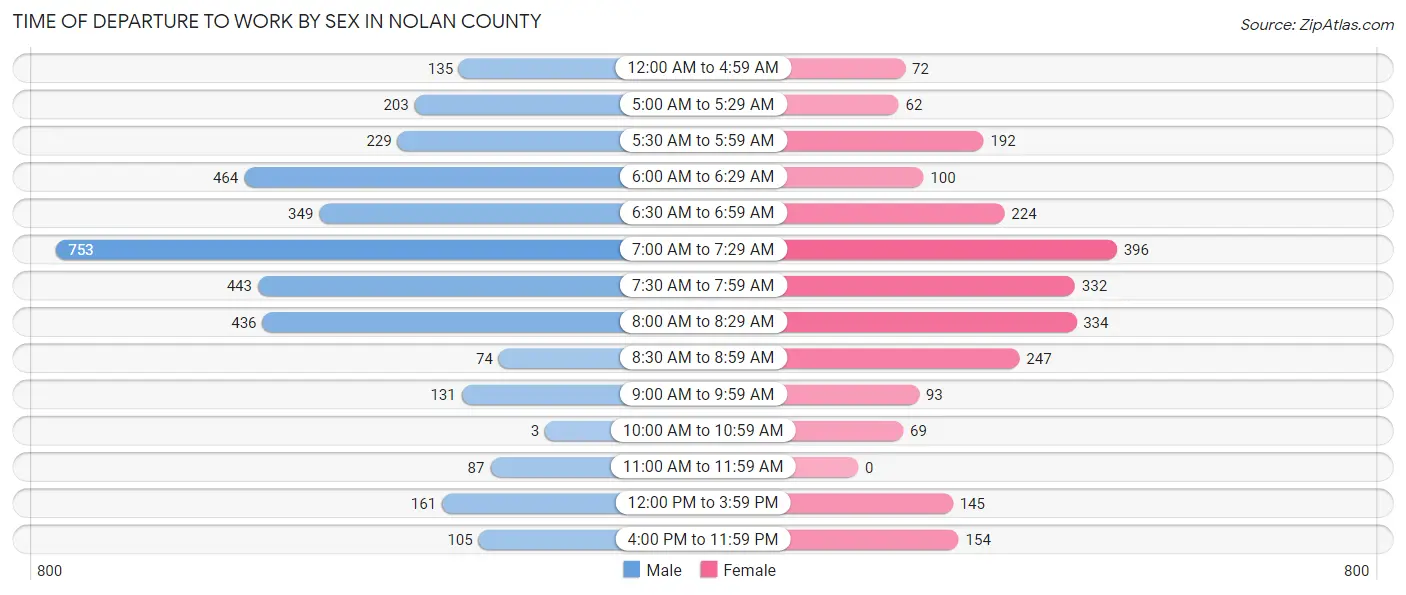
| Time of Departure | Male | Female |
| 12:00 AM to 4:59 AM | 135 (3.8%) | 72 (3.0%) |
| 5:00 AM to 5:29 AM | 203 (5.7%) | 62 (2.6%) |
| 5:30 AM to 5:59 AM | 229 (6.4%) | 192 (7.9%) |
| 6:00 AM to 6:29 AM | 464 (13.0%) | 100 (4.1%) |
| 6:30 AM to 6:59 AM | 349 (9.8%) | 224 (9.3%) |
| 7:00 AM to 7:29 AM | 753 (21.1%) | 396 (16.4%) |
| 7:30 AM to 7:59 AM | 443 (12.4%) | 332 (13.7%) |
| 8:00 AM to 8:29 AM | 436 (12.2%) | 334 (13.8%) |
| 8:30 AM to 8:59 AM | 74 (2.1%) | 247 (10.2%) |
| 9:00 AM to 9:59 AM | 131 (3.7%) | 93 (3.8%) |
| 10:00 AM to 10:59 AM | 3 (0.1%) | 69 (2.9%) |
| 11:00 AM to 11:59 AM | 87 (2.4%) | 0 (0.0%) |
| 12:00 PM to 3:59 PM | 161 (4.5%) | 145 (6.0%) |
| 4:00 PM to 11:59 PM | 105 (2.9%) | 154 (6.4%) |
| Total | 3,573 (100.0%) | 2,420 (100.0%) |
Housing Occupancy in Nolan County
Occupancy by Ownership in Nolan County
Of the total 5,670 dwellings in Nolan County, owner-occupied units account for 3,711 (65.4%), while renter-occupied units make up 1,959 (34.5%).
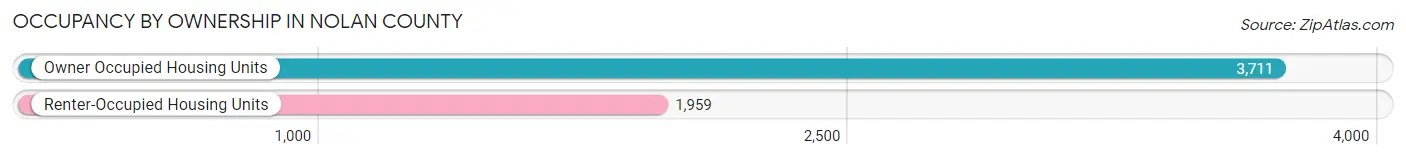
| Occupancy | # Housing Units | % Housing Units |
| Owner Occupied Housing Units | 3,711 | 65.4% |
| Renter-Occupied Housing Units | 1,959 | 34.5% |
| Total Occupied Housing Units | 5,670 | 100.0% |
Occupancy by Household Size in Nolan County
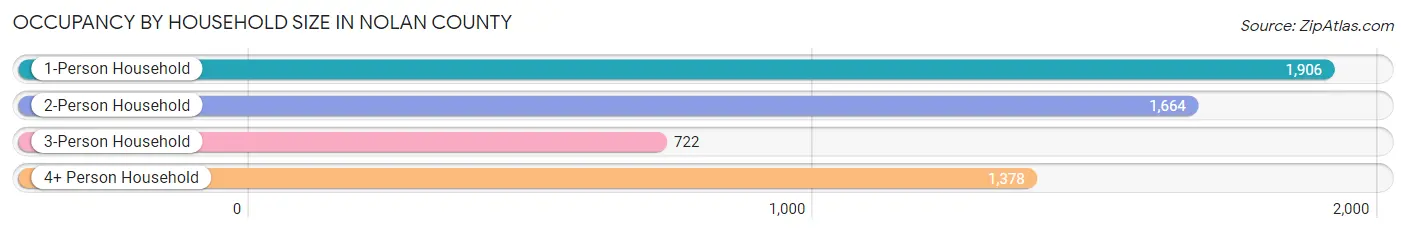
| Household Size | # Housing Units | % Housing Units |
| 1-Person Household | 1,906 | 33.6% |
| 2-Person Household | 1,664 | 29.3% |
| 3-Person Household | 722 | 12.7% |
| 4+ Person Household | 1,378 | 24.3% |
| Total Housing Units | 5,670 | 100.0% |
Occupancy by Ownership by Household Size in Nolan County
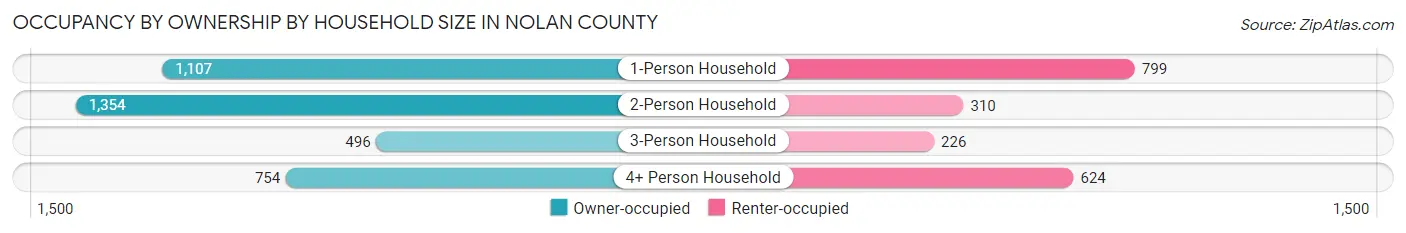
| Household Size | Owner-occupied | Renter-occupied |
| 1-Person Household | 1,107 (58.1%) | 799 (41.9%) |
| 2-Person Household | 1,354 (81.4%) | 310 (18.6%) |
| 3-Person Household | 496 (68.7%) | 226 (31.3%) |
| 4+ Person Household | 754 (54.7%) | 624 (45.3%) |
| Total Housing Units | 3,711 (65.4%) | 1,959 (34.5%) |
Occupancy by Educational Attainment in Nolan County
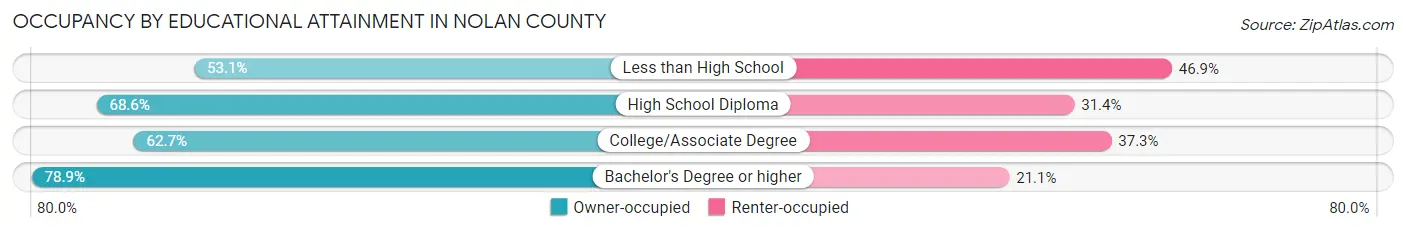
| Household Size | Owner-occupied | Renter-occupied |
| Less than High School | 488 (53.1%) | 431 (46.9%) |
| High School Diploma | 1,257 (68.6%) | 576 (31.4%) |
| College/Associate Degree | 1,301 (62.7%) | 774 (37.3%) |
| Bachelor's Degree or higher | 665 (78.9%) | 178 (21.1%) |
Occupancy by Age of Householder in Nolan County
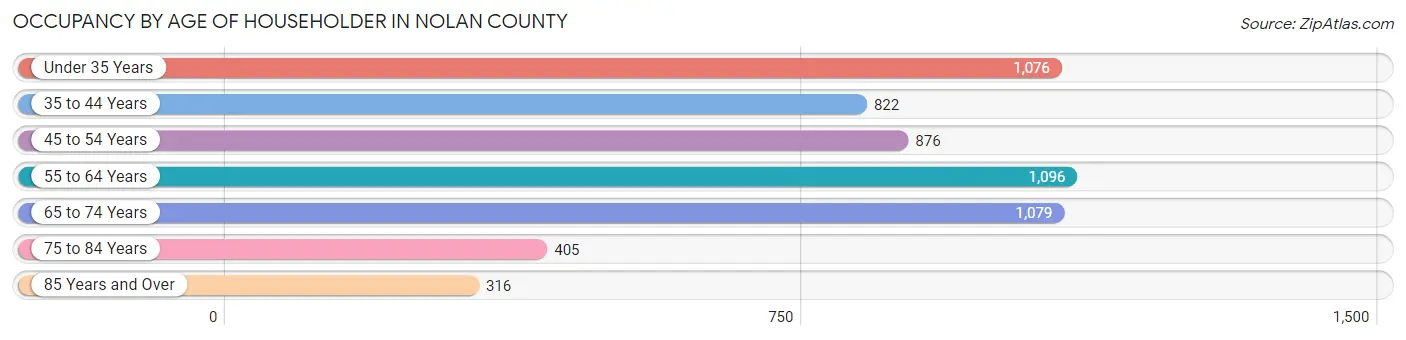
| Age Bracket | # Households | % Households |
| Under 35 Years | 1,076 | 19.0% |
| 35 to 44 Years | 822 | 14.5% |
| 45 to 54 Years | 876 | 15.4% |
| 55 to 64 Years | 1,096 | 19.3% |
| 65 to 74 Years | 1,079 | 19.0% |
| 75 to 84 Years | 405 | 7.1% |
| 85 Years and Over | 316 | 5.6% |
| Total | 5,670 | 100.0% |
Housing Finances in Nolan County
Median Income by Occupancy in Nolan County
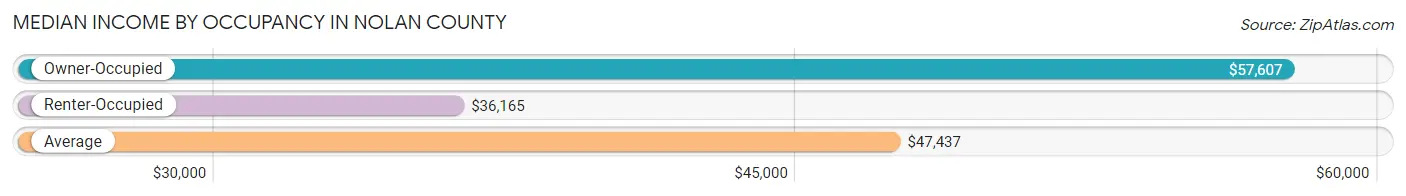
| Occupancy Type | # Households | Median Income |
| Owner-Occupied | 3,711 (65.4%) | $57,607 |
| Renter-Occupied | 1,959 (34.5%) | $36,165 |
| Average | 5,670 (100.0%) | $47,437 |
Occupancy by Householder Income Bracket in Nolan County
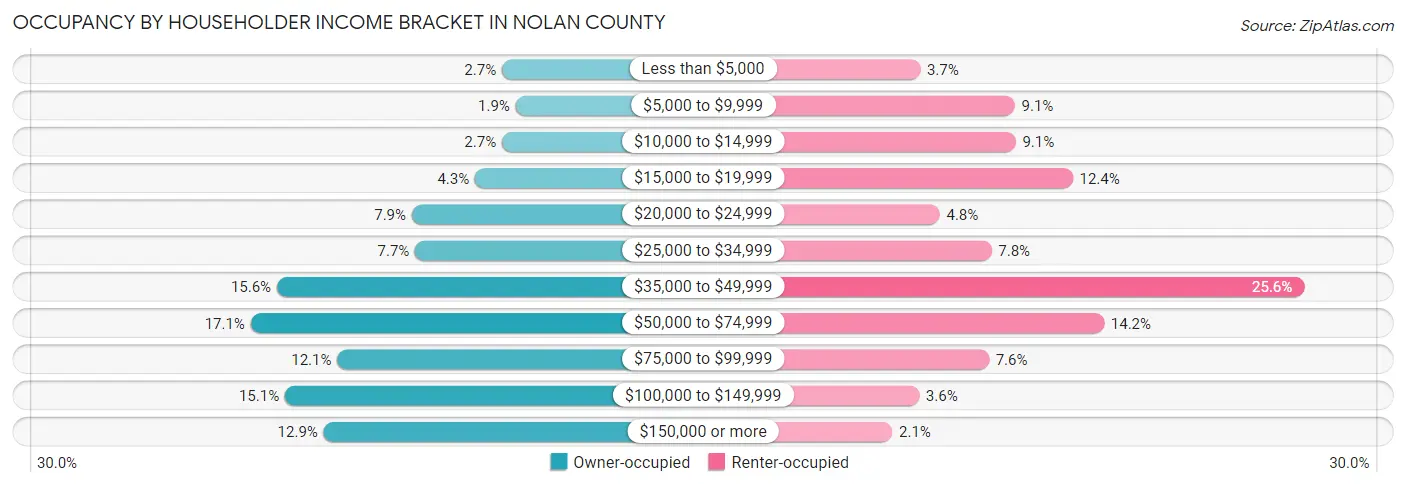
| Income Bracket | Owner-occupied | Renter-occupied |
| Less than $5,000 | 101 (2.7%) | 72 (3.7%) |
| $5,000 to $9,999 | 72 (1.9%) | 178 (9.1%) |
| $10,000 to $14,999 | 101 (2.7%) | 179 (9.1%) |
| $15,000 to $19,999 | 158 (4.3%) | 243 (12.4%) |
| $20,000 to $24,999 | 292 (7.9%) | 94 (4.8%) |
| $25,000 to $34,999 | 285 (7.7%) | 152 (7.8%) |
| $35,000 to $49,999 | 578 (15.6%) | 502 (25.6%) |
| $50,000 to $74,999 | 634 (17.1%) | 278 (14.2%) |
| $75,000 to $99,999 | 450 (12.1%) | 149 (7.6%) |
| $100,000 to $149,999 | 561 (15.1%) | 71 (3.6%) |
| $150,000 or more | 479 (12.9%) | 41 (2.1%) |
| Total | 3,711 (100.0%) | 1,959 (100.0%) |
Monthly Housing Cost Tiers in Nolan County
| Monthly Cost | Owner-occupied | Renter-occupied |
| Less than $300 | 538 (14.5%) | 197 (10.1%) |
| $300 to $499 | 776 (20.9%) | 232 (11.8%) |
| $500 to $799 | 957 (25.8%) | 405 (20.7%) |
| $800 to $999 | 344 (9.3%) | 353 (18.0%) |
| $1,000 to $1,499 | 535 (14.4%) | 470 (24.0%) |
| $1,500 to $1,999 | 336 (9.0%) | 45 (2.3%) |
| $2,000 to $2,499 | 138 (3.7%) | 6 (0.3%) |
| $2,500 to $2,999 | 30 (0.8%) | 7 (0.4%) |
| $3,000 or more | 57 (1.5%) | 0 (0.0%) |
| Total | 3,711 (100.0%) | 1,959 (100.0%) |
Physical Housing Characteristics in Nolan County
Housing Structures in Nolan County
| Structure Type | # Housing Units | % Housing Units |
| Single Unit, Detached | 4,521 | 79.7% |
| Single Unit, Attached | 31 | 0.5% |
| 2 Unit Apartments | 125 | 2.2% |
| 3 or 4 Unit Apartments | 236 | 4.2% |
| 5 to 9 Unit Apartments | 159 | 2.8% |
| 10 or more Apartments | 278 | 4.9% |
| Mobile Home / Other | 320 | 5.6% |
| Total | 5,670 | 100.0% |
Housing Structures by Occupancy in Nolan County
| Structure Type | Owner-occupied | Renter-occupied |
| Single Unit, Detached | 3,442 (76.1%) | 1,079 (23.9%) |
| Single Unit, Attached | 9 (29.0%) | 22 (71.0%) |
| 2 Unit Apartments | 7 (5.6%) | 118 (94.4%) |
| 3 or 4 Unit Apartments | 27 (11.4%) | 209 (88.6%) |
| 5 to 9 Unit Apartments | 0 (0.0%) | 159 (100.0%) |
| 10 or more Apartments | 0 (0.0%) | 278 (100.0%) |
| Mobile Home / Other | 226 (70.6%) | 94 (29.4%) |
| Total | 3,711 (65.4%) | 1,959 (34.5%) |
Housing Structures by Number of Rooms in Nolan County
| Number of Rooms | Owner-occupied | Renter-occupied |
| 1 Room | 41 (1.1%) | 129 (6.6%) |
| 2 or 3 Rooms | 106 (2.9%) | 264 (13.5%) |
| 4 or 5 Rooms | 1,596 (43.0%) | 983 (50.2%) |
| 6 or 7 Rooms | 1,399 (37.7%) | 491 (25.1%) |
| 8 or more Rooms | 569 (15.3%) | 92 (4.7%) |
| Total | 3,711 (100.0%) | 1,959 (100.0%) |
Housing Structure by Heating Type in Nolan County
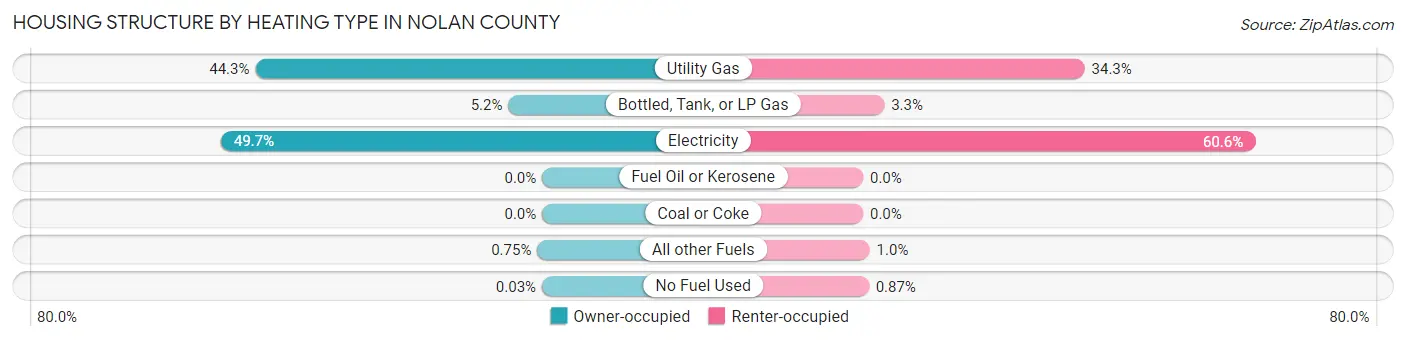
| Heating Type | Owner-occupied | Renter-occupied |
| Utility Gas | 1,645 (44.3%) | 671 (34.3%) |
| Bottled, Tank, or LP Gas | 194 (5.2%) | 64 (3.3%) |
| Electricity | 1,843 (49.7%) | 1,187 (60.6%) |
| Fuel Oil or Kerosene | 0 (0.0%) | 0 (0.0%) |
| Coal or Coke | 0 (0.0%) | 0 (0.0%) |
| All other Fuels | 28 (0.7%) | 20 (1.0%) |
| No Fuel Used | 1 (0.0%) | 17 (0.9%) |
| Total | 3,711 (100.0%) | 1,959 (100.0%) |
Household Vehicle Usage in Nolan County
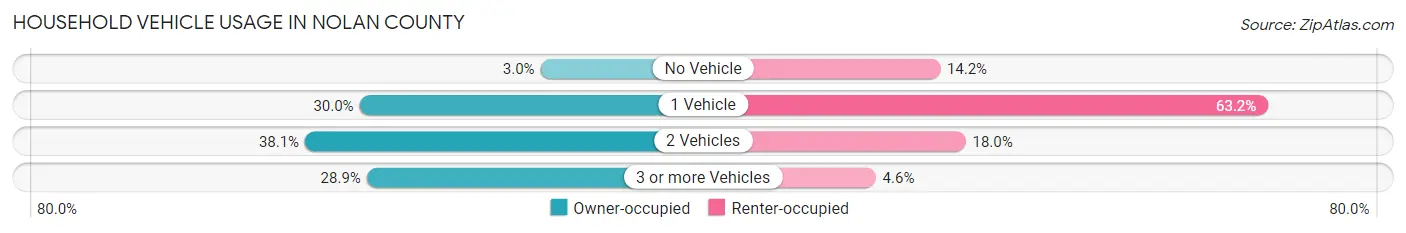
| Vehicles per Household | Owner-occupied | Renter-occupied |
| No Vehicle | 110 (3.0%) | 278 (14.2%) |
| 1 Vehicle | 1,113 (30.0%) | 1,238 (63.2%) |
| 2 Vehicles | 1,415 (38.1%) | 353 (18.0%) |
| 3 or more Vehicles | 1,073 (28.9%) | 90 (4.6%) |
| Total | 3,711 (100.0%) | 1,959 (100.0%) |
Real Estate & Mortgages in Nolan County
Real Estate and Mortgage Overview in Nolan County
| Characteristic | Without Mortgage | With Mortgage |
| Housing Units | 2,592 | 1,119 |
| Median Property Value | $75,700 | $138,400 |
| Median Household Income | $48,682 | $281 |
| Monthly Housing Costs | $502 | $51 |
| Real Estate Taxes | $941 | $77 |
Property Value by Mortgage Status in Nolan County
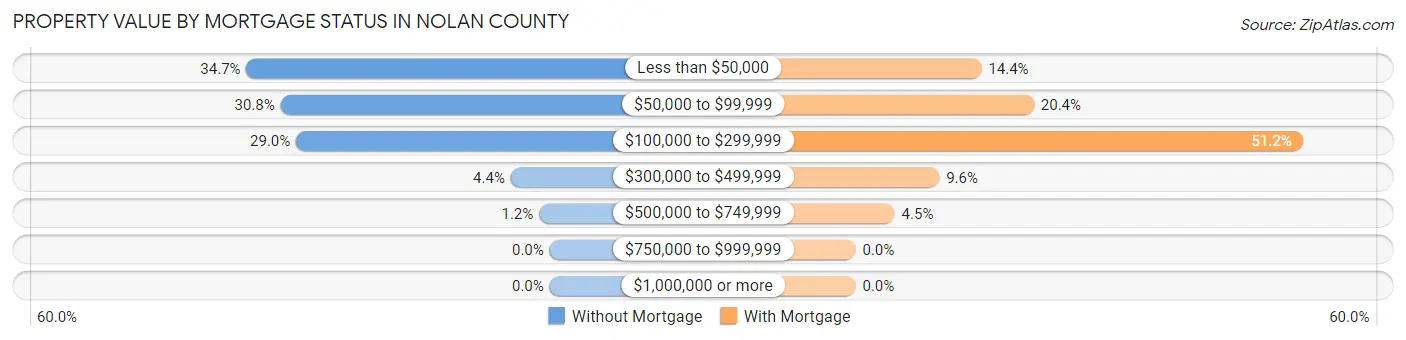
| Property Value | Without Mortgage | With Mortgage |
| Less than $50,000 | 898 (34.6%) | 161 (14.4%) |
| $50,000 to $99,999 | 797 (30.7%) | 228 (20.4%) |
| $100,000 to $299,999 | 751 (29.0%) | 573 (51.2%) |
| $300,000 to $499,999 | 115 (4.4%) | 107 (9.6%) |
| $500,000 to $749,999 | 31 (1.2%) | 50 (4.5%) |
| $750,000 to $999,999 | 0 (0.0%) | 0 (0.0%) |
| $1,000,000 or more | 0 (0.0%) | 0 (0.0%) |
| Total | 2,592 (100.0%) | 1,119 (100.0%) |
Household Income by Mortgage Status in Nolan County
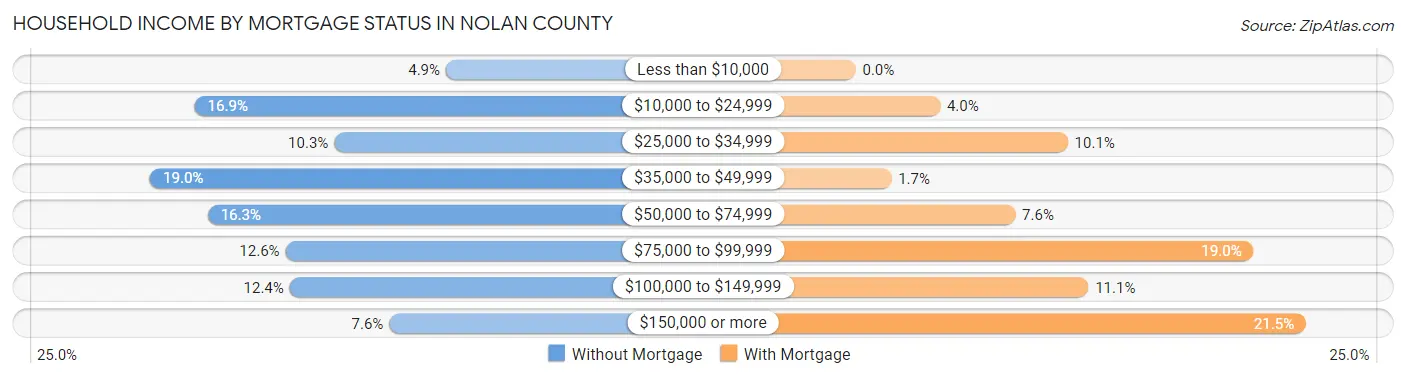
| Household Income | Without Mortgage | With Mortgage |
| Less than $10,000 | 128 (4.9%) | 0 (0.0%) |
| $10,000 to $24,999 | 438 (16.9%) | 45 (4.0%) |
| $25,000 to $34,999 | 266 (10.3%) | 113 (10.1%) |
| $35,000 to $49,999 | 493 (19.0%) | 19 (1.7%) |
| $50,000 to $74,999 | 422 (16.3%) | 85 (7.6%) |
| $75,000 to $99,999 | 326 (12.6%) | 212 (19.0%) |
| $100,000 to $149,999 | 321 (12.4%) | 124 (11.1%) |
| $150,000 or more | 198 (7.6%) | 240 (21.4%) |
| Total | 2,592 (100.0%) | 1,119 (100.0%) |
Property Value to Household Income Ratio in Nolan County
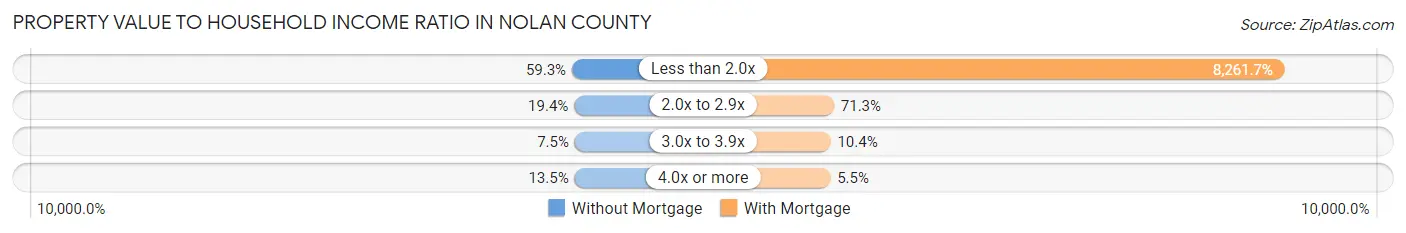
| Value-to-Income Ratio | Without Mortgage | With Mortgage |
| Less than 2.0x | 1,536 (59.3%) | 92,448 (8,261.7%) |
| 2.0x to 2.9x | 504 (19.4%) | 798 (71.3%) |
| 3.0x to 3.9x | 195 (7.5%) | 116 (10.4%) |
| 4.0x or more | 351 (13.5%) | 62 (5.5%) |
| Total | 2,592 (100.0%) | 1,119 (100.0%) |
Real Estate Taxes by Mortgage Status in Nolan County
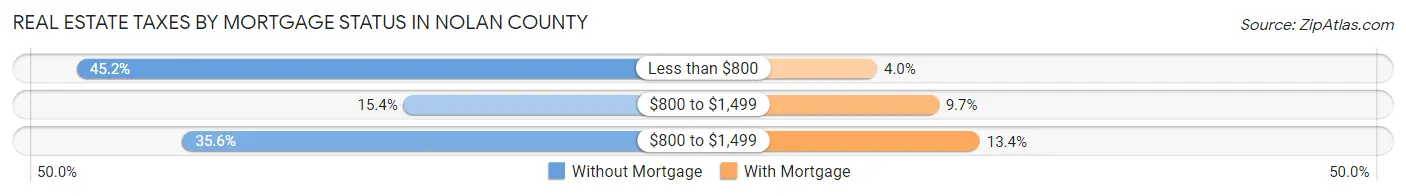
| Property Taxes | Without Mortgage | With Mortgage |
| Less than $800 | 1,172 (45.2%) | 45 (4.0%) |
| $800 to $1,499 | 399 (15.4%) | 108 (9.7%) |
| $800 to $1,499 | 922 (35.6%) | 150 (13.4%) |
| Total | 2,592 (100.0%) | 1,119 (100.0%) |
Health & Disability in Nolan County
Health Insurance Coverage by Age in Nolan County
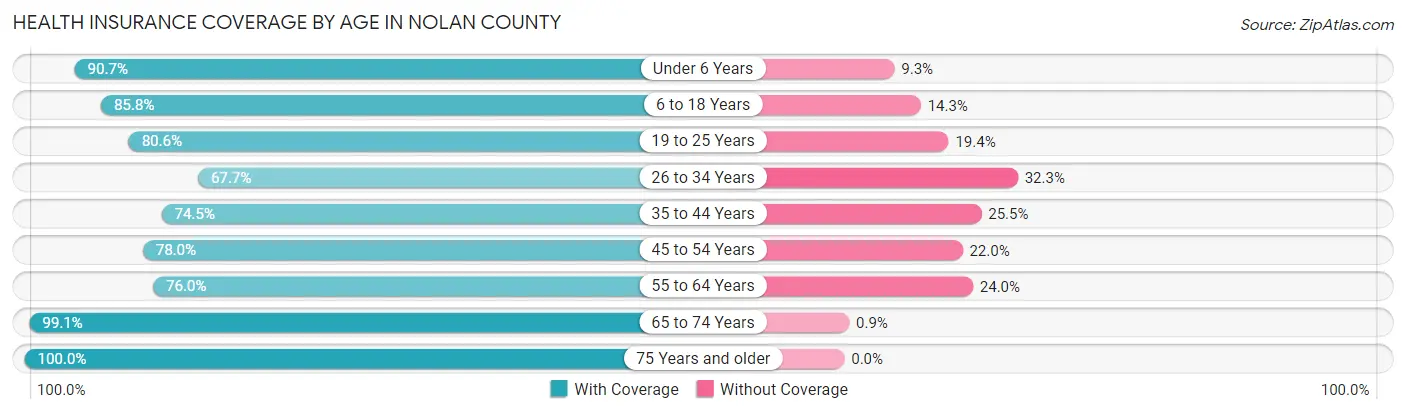
| Age Bracket | With Coverage | Without Coverage |
| Under 6 Years | 1,069 (90.7%) | 110 (9.3%) |
| 6 to 18 Years | 2,444 (85.8%) | 406 (14.2%) |
| 19 to 25 Years | 912 (80.6%) | 220 (19.4%) |
| 26 to 34 Years | 1,138 (67.7%) | 544 (32.3%) |
| 35 to 44 Years | 1,175 (74.5%) | 403 (25.5%) |
| 45 to 54 Years | 1,256 (78.0%) | 355 (22.0%) |
| 55 to 64 Years | 1,323 (76.0%) | 417 (24.0%) |
| 65 to 74 Years | 1,651 (99.1%) | 15 (0.9%) |
| 75 Years and older | 1,042 (100.0%) | 0 (0.0%) |
| Total | 12,010 (82.9%) | 2,470 (17.1%) |
Health Insurance Coverage by Citizenship Status in Nolan County
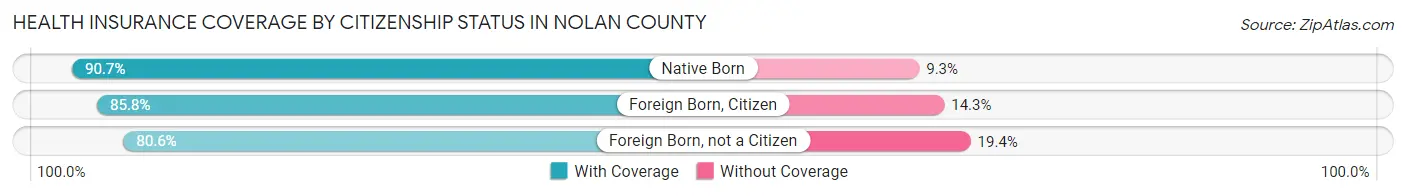
| Citizenship Status | With Coverage | Without Coverage |
| Native Born | 1,069 (90.7%) | 110 (9.3%) |
| Foreign Born, Citizen | 2,444 (85.8%) | 406 (14.2%) |
| Foreign Born, not a Citizen | 912 (80.6%) | 220 (19.4%) |
Health Insurance Coverage by Household Income in Nolan County
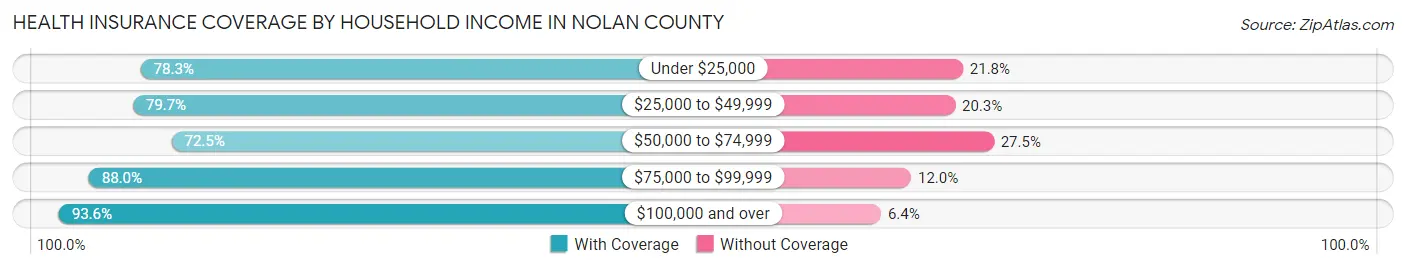
| Household Income | With Coverage | Without Coverage |
| Under $25,000 | 1,601 (78.2%) | 445 (21.7%) |
| $25,000 to $49,999 | 3,195 (79.7%) | 813 (20.3%) |
| $50,000 to $74,999 | 1,877 (72.5%) | 713 (27.5%) |
| $75,000 to $99,999 | 1,958 (88.0%) | 268 (12.0%) |
| $100,000 and over | 3,268 (93.6%) | 224 (6.4%) |
Public vs Private Health Insurance Coverage by Age in Nolan County
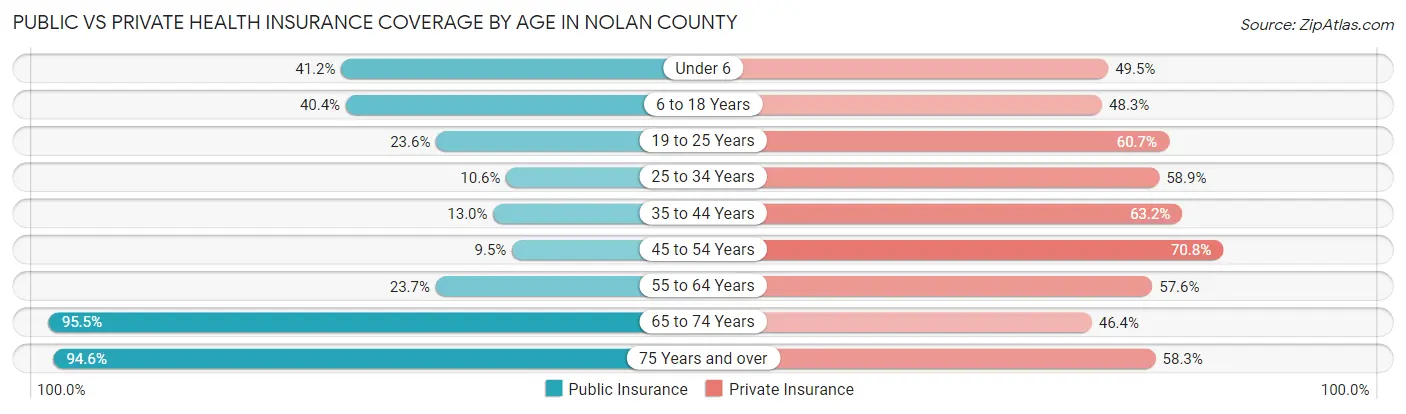
| Age Bracket | Public Insurance | Private Insurance |
| Under 6 | 486 (41.2%) | 583 (49.4%) |
| 6 to 18 Years | 1,150 (40.4%) | 1,377 (48.3%) |
| 19 to 25 Years | 267 (23.6%) | 687 (60.7%) |
| 25 to 34 Years | 178 (10.6%) | 991 (58.9%) |
| 35 to 44 Years | 205 (13.0%) | 997 (63.2%) |
| 45 to 54 Years | 153 (9.5%) | 1,140 (70.8%) |
| 55 to 64 Years | 412 (23.7%) | 1,003 (57.6%) |
| 65 to 74 Years | 1,591 (95.5%) | 773 (46.4%) |
| 75 Years and over | 986 (94.6%) | 607 (58.3%) |
| Total | 5,428 (37.5%) | 8,158 (56.3%) |
Disability Status by Sex by Age in Nolan County
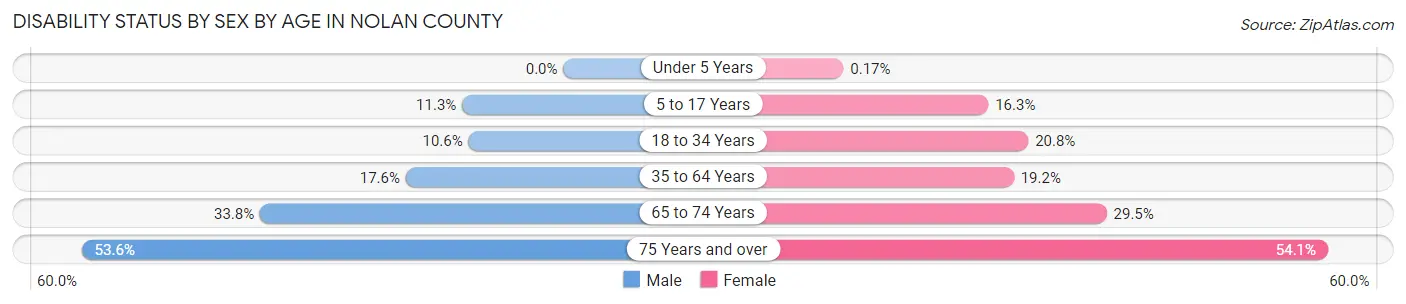
| Age Bracket | Male | Female |
| Under 5 Years | 0 (0.0%) | 1 (0.2%) |
| 5 to 17 Years | 170 (11.3%) | 207 (16.3%) |
| 18 to 34 Years | 171 (10.6%) | 296 (20.8%) |
| 35 to 64 Years | 439 (17.5%) | 465 (19.2%) |
| 65 to 74 Years | 305 (33.8%) | 225 (29.5%) |
| 75 Years and over | 221 (53.6%) | 341 (54.1%) |
Disability Class by Sex by Age in Nolan County
Disability Class: Hearing Difficulty
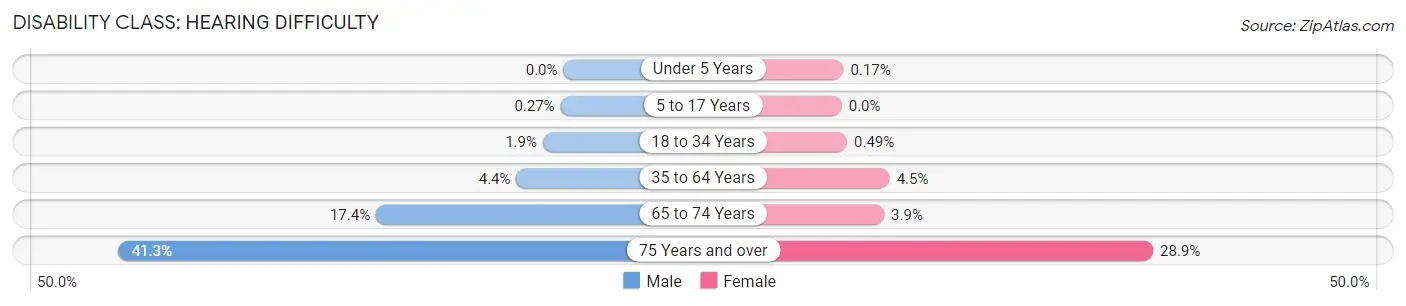
| Age Bracket | Male | Female |
| Under 5 Years | 0 (0.0%) | 1 (0.2%) |
| 5 to 17 Years | 4 (0.3%) | 0 (0.0%) |
| 18 to 34 Years | 31 (1.9%) | 7 (0.5%) |
| 35 to 64 Years | 109 (4.4%) | 108 (4.4%) |
| 65 to 74 Years | 157 (17.4%) | 30 (3.9%) |
| 75 Years and over | 170 (41.3%) | 182 (28.9%) |
Disability Class: Vision Difficulty
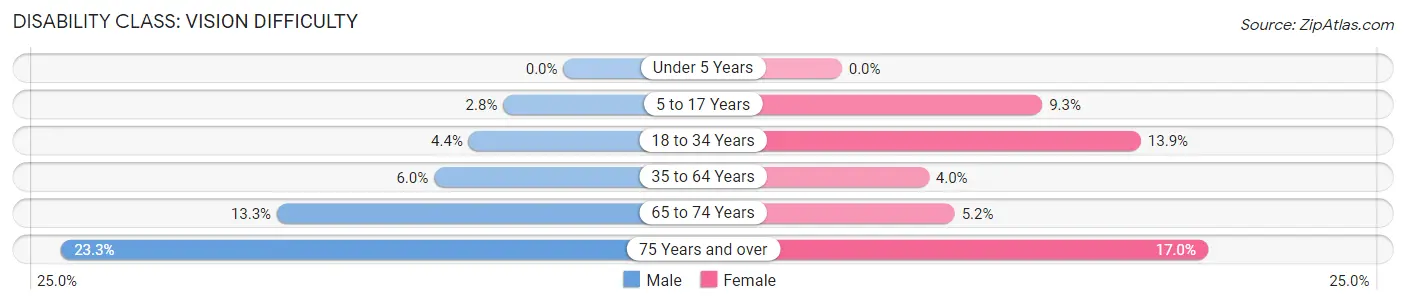
| Age Bracket | Male | Female |
| Under 5 Years | 0 (0.0%) | 0 (0.0%) |
| 5 to 17 Years | 42 (2.8%) | 118 (9.3%) |
| 18 to 34 Years | 71 (4.4%) | 198 (13.9%) |
| 35 to 64 Years | 150 (6.0%) | 98 (4.0%) |
| 65 to 74 Years | 120 (13.3%) | 40 (5.2%) |
| 75 Years and over | 96 (23.3%) | 107 (17.0%) |
Disability Class: Cognitive Difficulty
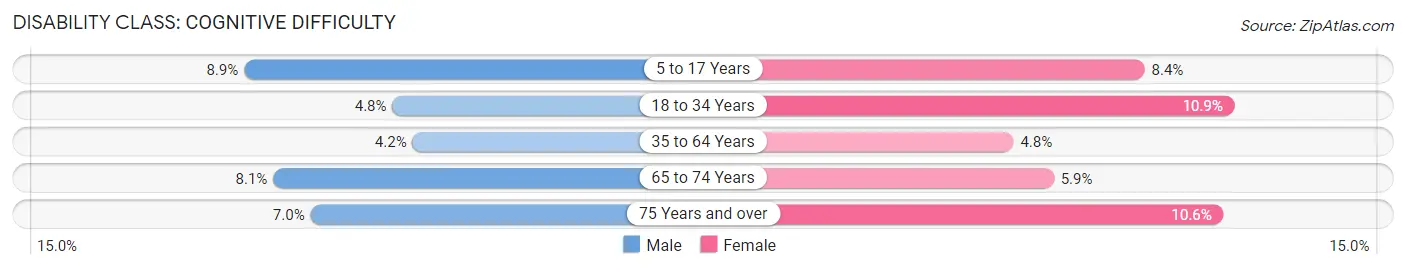
| Age Bracket | Male | Female |
| 5 to 17 Years | 134 (8.9%) | 107 (8.4%) |
| 18 to 34 Years | 77 (4.8%) | 156 (10.9%) |
| 35 to 64 Years | 105 (4.2%) | 116 (4.8%) |
| 65 to 74 Years | 73 (8.1%) | 45 (5.9%) |
| 75 Years and over | 29 (7.0%) | 67 (10.6%) |
Disability Class: Ambulatory Difficulty
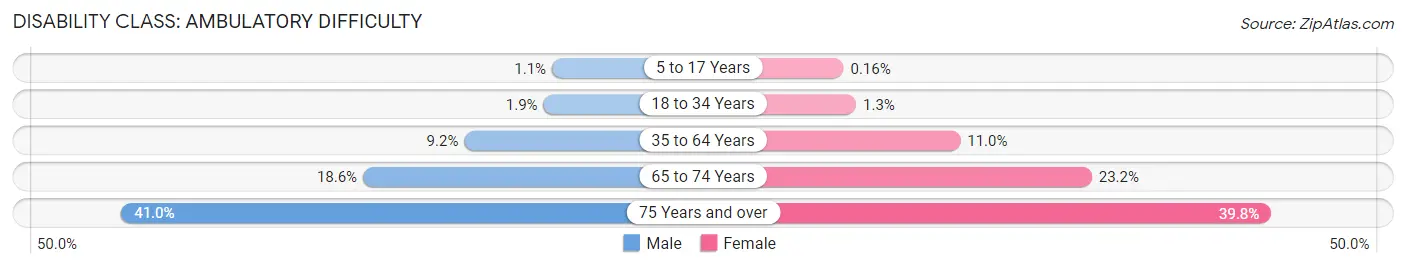
| Age Bracket | Male | Female |
| 5 to 17 Years | 16 (1.1%) | 2 (0.2%) |
| 18 to 34 Years | 30 (1.8%) | 19 (1.3%) |
| 35 to 64 Years | 230 (9.2%) | 267 (11.0%) |
| 65 to 74 Years | 168 (18.6%) | 177 (23.2%) |
| 75 Years and over | 169 (41.0%) | 251 (39.8%) |
Disability Class: Self-Care Difficulty
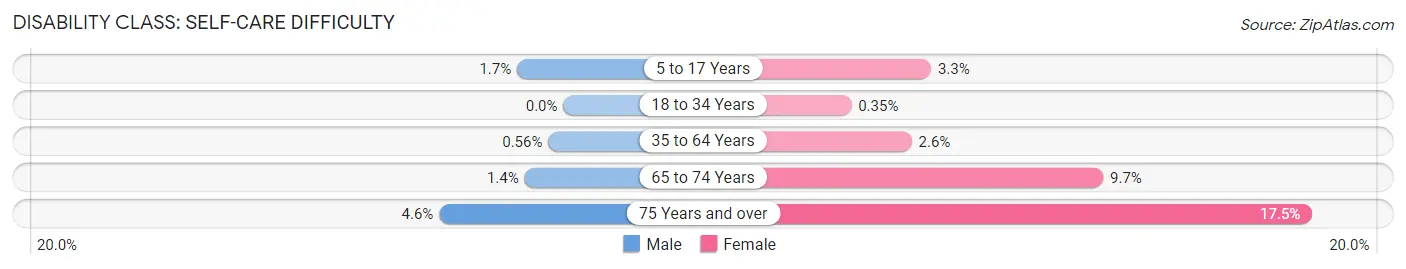
| Age Bracket | Male | Female |
| 5 to 17 Years | 26 (1.7%) | 42 (3.3%) |
| 18 to 34 Years | 0 (0.0%) | 5 (0.4%) |
| 35 to 64 Years | 14 (0.6%) | 63 (2.6%) |
| 65 to 74 Years | 13 (1.4%) | 74 (9.7%) |
| 75 Years and over | 19 (4.6%) | 110 (17.5%) |
Technology Access in Nolan County
Computing Device Access in Nolan County
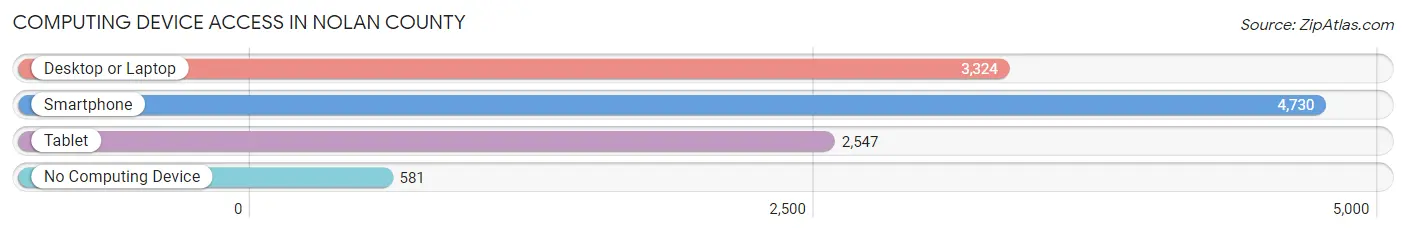
| Device Type | # Households | % Households |
| Desktop or Laptop | 3,324 | 58.6% |
| Smartphone | 4,730 | 83.4% |
| Tablet | 2,547 | 44.9% |
| No Computing Device | 581 | 10.2% |
| Total | 5,670 | 100.0% |
Internet Access in Nolan County
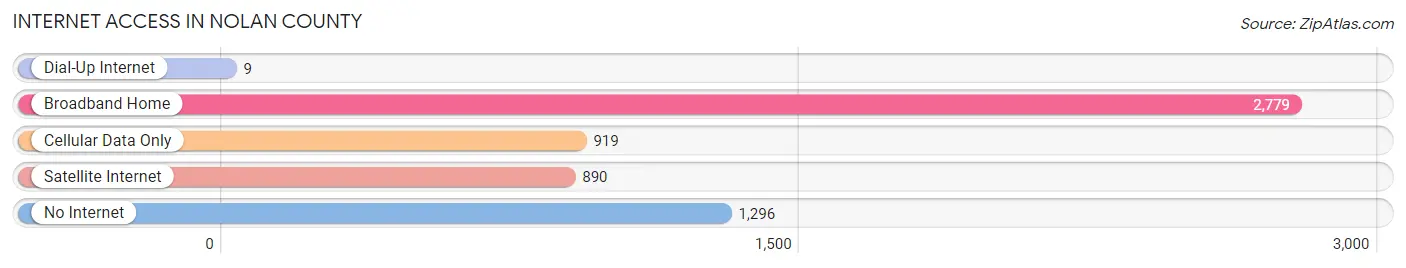
| Internet Type | # Households | % Households |
| Dial-Up Internet | 9 | 0.2% |
| Broadband Home | 2,779 | 49.0% |
| Cellular Data Only | 919 | 16.2% |
| Satellite Internet | 890 | 15.7% |
| No Internet | 1,296 | 22.9% |
| Total | 5,670 | 100.0% |
Nolan County Summary
Nolan County is located in the western part of Texas, in the heart of the Big Country region. It is bordered by Fisher County to the north, Taylor County to the east, Runnels County to the south, and Mitchell County to the west. The county seat is Sweetwater, and the largest city is Sweetwater. The county was named for Philip Nolan, a scout and explorer who was killed in 1801 while searching for the Comanche Indians.
Geography
Nolan County covers an area of 914 square miles, making it the 33rd largest county in Texas. The terrain is mostly flat, with some rolling hills in the western part of the county. The county is drained by the Colorado River, which forms the western boundary of the county. The county is also home to several small lakes, including Lake Sweetwater, Lake J.B. Thomas, and Lake Trammell.
The climate of Nolan County is semi-arid, with hot summers and mild winters. The average annual temperature is 68°F, and the average annual precipitation is 19.5 inches.
Demographics
As of the 2010 census, there were 15,216 people, 5,845 households, and 4,072 families living in Nolan County. The population density was 17 people per square mile. The racial makeup of the county was 79.2% White, 8.2% African American, 0.7% Native American, 0.4% Asian, 0.1% Pacific Islander, 9.3% from other races, and 2.1% from two or more races. Hispanic or Latino of any race were 24.3% of the population.
The median income for a household in the county was $35,945, and the median income for a family was $43,945. The per capita income for the county was $17,845. About 17.2% of families and 21.2% of the population were below the poverty line, including 28.2% of those under age 18 and 13.2% of those age 65 or over.
Economy
Nolan County's economy is largely based on agriculture and oil and gas production. The county is home to several large ranches, and the main crops grown in the county are cotton, wheat, and sorghum. The county is also home to several oil and gas fields, and the production of oil and gas is a major contributor to the local economy.
In addition to agriculture and oil and gas production, Nolan County is home to several manufacturing companies, including a large wind turbine manufacturing plant. The county is also home to several retail stores, restaurants, and other businesses.
Conclusion
Nolan County is a rural county located in the western part of Texas. It is home to several large ranches, and the main crops grown in the county are cotton, wheat, and sorghum. The county is also home to several oil and gas fields, and the production of oil and gas is a major contributor to the local economy. In addition to agriculture and oil and gas production, Nolan County is home to several manufacturing companies, retail stores, restaurants, and other businesses. The population of the county is largely white, with a significant Hispanic population. The median income for a household in the county is $35,945, and the median income for a family is $43,945.
Common Questions
What is Per Capita Income in Nolan County?
Per Capita income in Nolan County is $30,572.
What is the Median Family Income in Nolan County?
Median Family Income in Nolan County is $59,222.
What is the Median Household income in Nolan County?
Median Household Income in Nolan County is $47,437.
What is Income or Wage Gap in Nolan County?
Income or Wage Gap in Nolan County is 28.2%.
Women in Nolan County earn 71.8 cents for every dollar earned by a man.
What is Inequality or Gini Index in Nolan County?
Inequality or Gini Index in Nolan County is 0.52.
What is the Total Population of Nolan County?
Total Population of Nolan County is 14,657.
What is the Total Male Population of Nolan County?
Total Male Population of Nolan County is 7,429.
What is the Total Female Population of Nolan County?
Total Female Population of Nolan County is 7,228.
What is the Ratio of Males per 100 Females in Nolan County?
There are 102.78 Males per 100 Females in Nolan County.
What is the Ratio of Females per 100 Males in Nolan County?
There are 97.29 Females per 100 Males in Nolan County.
What is the Median Population Age in Nolan County?
Median Population Age in Nolan County is 36.6 Years.
What is the Average Family Size in Nolan County
Average Family Size in Nolan County is 3.2 People.
What is the Average Household Size in Nolan County
Average Household Size in Nolan County is 2.5 People.
How Large is the Labor Force in Nolan County?
There are 6,744 People in the Labor Forcein in Nolan County.
What is the Percentage of People in the Labor Force in Nolan County?
59.5% of People are in the Labor Force in Nolan County.
What is the Unemployment Rate in Nolan County?
Unemployment Rate in Nolan County is 6.6%.