Newton County, TX Map & Demographics
Newton County Overview
$23,995
PER CAPITA INCOME
$55,313
AVG FAMILY INCOME
$38,871
AVG HOUSEHOLD INCOME
54.3%
WAGE / INCOME GAP [ % ]
45.7¢/ $1
WAGE / INCOME GAP [ $ ]
$12,249
FAMILY INCOME DEFICIT
0.49
INEQUALITY / GINI INDEX
12,333
TOTAL POPULATION
6,175
MALE POPULATION
6,158
FEMALE POPULATION
100.28
MALES / 100 FEMALES
99.72
FEMALES / 100 MALES
45.5
MEDIAN AGE
3.1
AVG FAMILY SIZE
2.5
AVG HOUSEHOLD SIZE
4,901
LABOR FORCE [ PEOPLE ]
49.1%
PERCENT IN LABOR FORCE
10.6%
UNEMPLOYMENT RATE
Newton County Area Codes
Income in Newton County
Income Overview in Newton County
Per Capita Income in Newton County is $23,995, while median incomes of families and households are $55,313 and $38,871 respectively.
| Characteristic | Number | Measure |
| Per Capita Income | 12,333 | $23,995 |
| Median Family Income | 3,396 | $55,313 |
| Mean Family Income | 3,396 | $71,114 |
| Median Household Income | 4,787 | $38,871 |
| Mean Household Income | 4,787 | $58,462 |
| Income Deficit | 3,396 | $12,249 |
| Wage / Income Gap (%) | 12,333 | 54.35% |
| Wage / Income Gap ($) | 12,333 | 45.65¢ per $1 |
| Gini / Inequality Index | 12,333 | 0.49 |
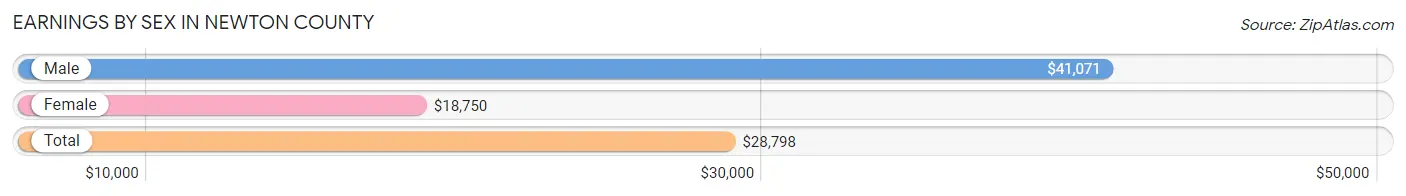
Earnings by Sex in Newton County
Average Earnings in Newton County are $28,798, $41,071 for men and $18,750 for women, a difference of 54.3%.
| Sex | Number | Average Earnings |
| Male | 2,510 (52.6%) | $41,071 |
| Female | 2,257 (47.3%) | $18,750 |
| Total | 4,767 (100.0%) | $28,798 |
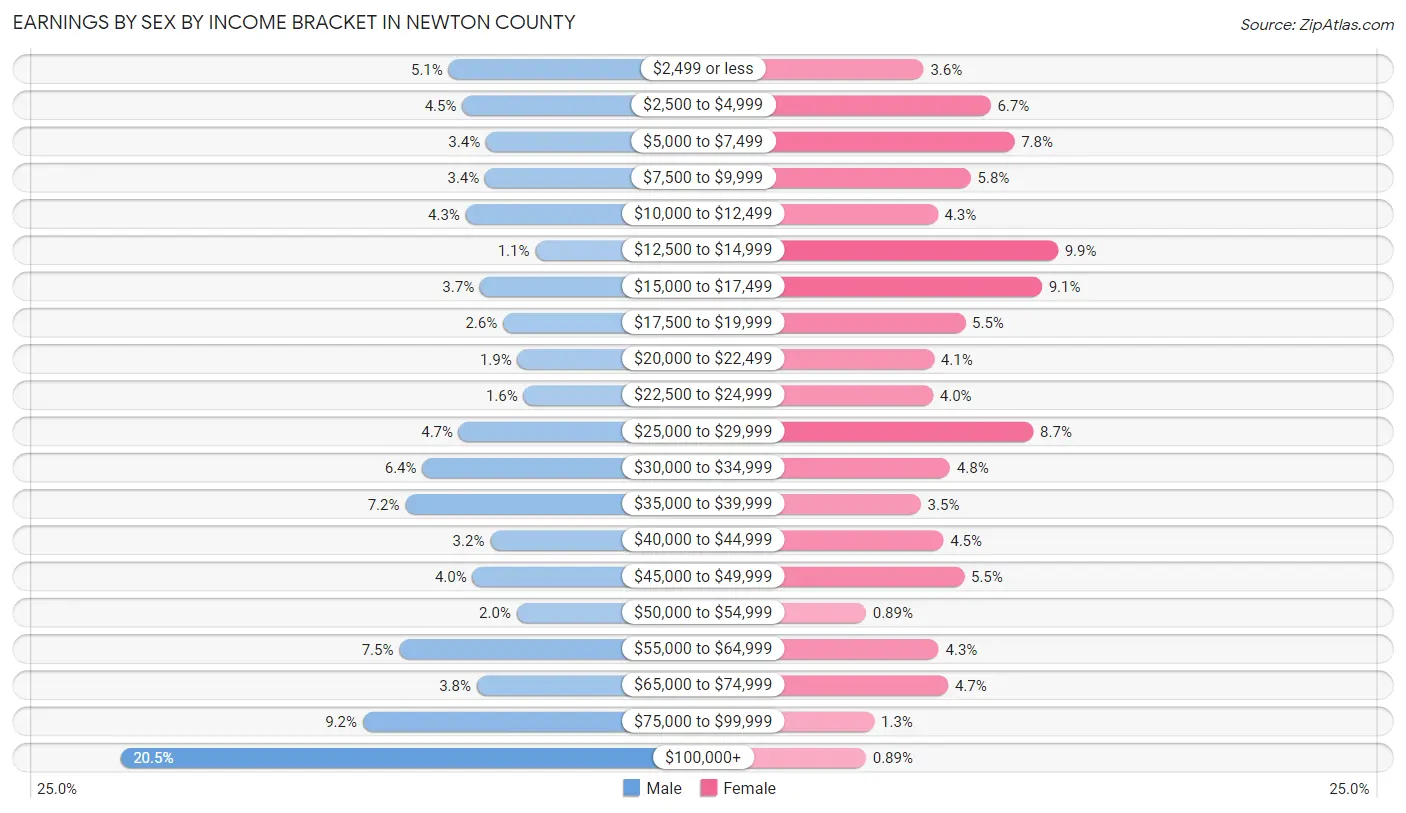
Earnings by Sex by Income Bracket in Newton County
The most common earnings brackets in Newton County are $100,000+ for men (515 | 20.5%) and $12,500 to $14,999 for women (223 | 9.9%).
| Income | Male | Female |
| $2,499 or less | 129 (5.1%) | 81 (3.6%) |
| $2,500 to $4,999 | 113 (4.5%) | 152 (6.7%) |
| $5,000 to $7,499 | 85 (3.4%) | 177 (7.8%) |
| $7,500 to $9,999 | 86 (3.4%) | 131 (5.8%) |
| $10,000 to $12,499 | 109 (4.3%) | 96 (4.3%) |
| $12,500 to $14,999 | 27 (1.1%) | 223 (9.9%) |
| $15,000 to $17,499 | 92 (3.7%) | 206 (9.1%) |
| $17,500 to $19,999 | 65 (2.6%) | 125 (5.5%) |
| $20,000 to $22,499 | 48 (1.9%) | 92 (4.1%) |
| $22,500 to $24,999 | 41 (1.6%) | 91 (4.0%) |
| $25,000 to $29,999 | 117 (4.7%) | 197 (8.7%) |
| $30,000 to $34,999 | 160 (6.4%) | 109 (4.8%) |
| $35,000 to $39,999 | 180 (7.2%) | 78 (3.5%) |
| $40,000 to $44,999 | 80 (3.2%) | 102 (4.5%) |
| $45,000 to $49,999 | 101 (4.0%) | 124 (5.5%) |
| $50,000 to $54,999 | 49 (1.9%) | 20 (0.9%) |
| $55,000 to $64,999 | 187 (7.4%) | 97 (4.3%) |
| $65,000 to $74,999 | 96 (3.8%) | 107 (4.7%) |
| $75,000 to $99,999 | 230 (9.2%) | 29 (1.3%) |
| $100,000+ | 515 (20.5%) | 20 (0.9%) |
| Total | 2,510 (100.0%) | 2,257 (100.0%) |
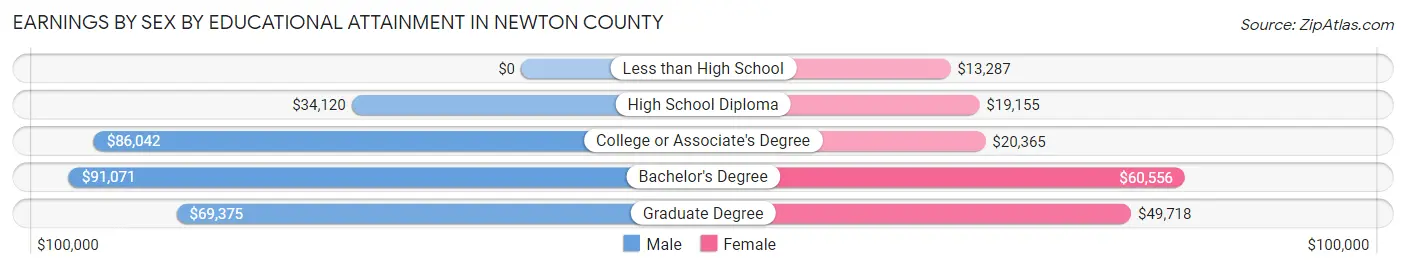
Earnings by Sex by Educational Attainment in Newton County
Average earnings in Newton County are $44,555 for men and $20,299 for women, a difference of 54.4%. Men with an educational attainment of bachelor's degree enjoy the highest average annual earnings of $91,071, while those with high school diploma education earn the least with $34,120. Women with an educational attainment of bachelor's degree earn the most with the average annual earnings of $60,556, while those with less than high school education have the smallest earnings of $13,287.
| Educational Attainment | Male Income | Female Income |
| Less than High School | - | - |
| High School Diploma | $34,120 | $19,155 |
| College or Associate's Degree | $86,042 | $20,365 |
| Bachelor's Degree | $91,071 | $60,556 |
| Graduate Degree | $69,375 | $49,718 |
| Total | $44,555 | $20,299 |
Family Income in Newton County
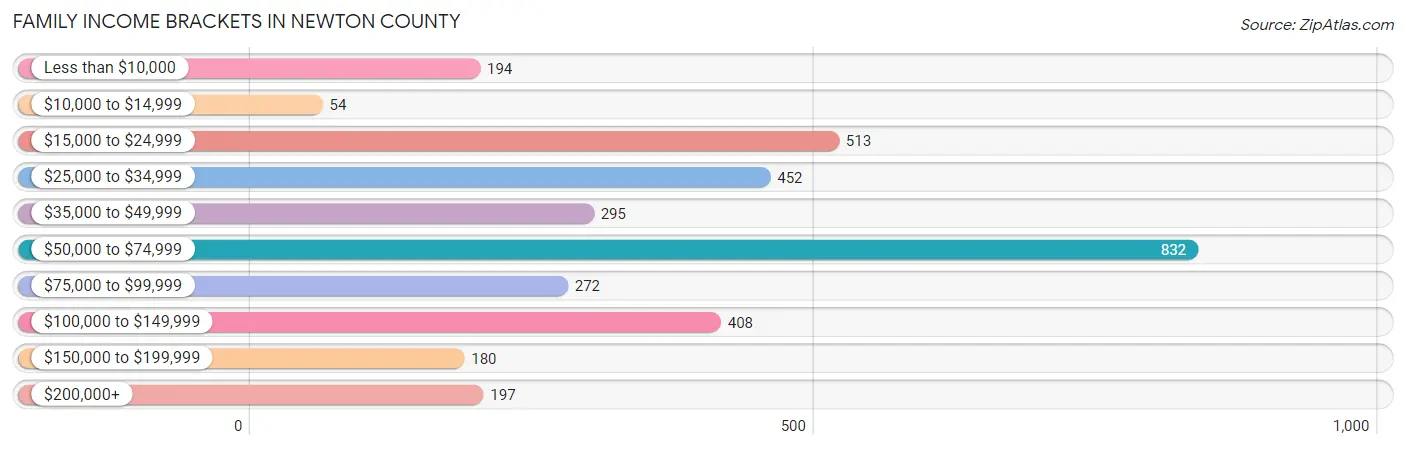
Family Income Brackets in Newton County
According to the Newton County family income data, there are 832 families falling into the $50,000 to $74,999 income range, which is the most common income bracket and makes up 24.5% of all families. Conversely, the $10,000 to $14,999 income bracket is the least frequent group with only 54 families (1.6%) belonging to this category.
| Income Bracket | # Families | % Families |
| Less than $10,000 | 194 | 5.7% |
| $10,000 to $14,999 | 54 | 1.6% |
| $15,000 to $24,999 | 513 | 15.1% |
| $25,000 to $34,999 | 452 | 13.3% |
| $35,000 to $49,999 | 295 | 8.7% |
| $50,000 to $74,999 | 832 | 24.5% |
| $75,000 to $99,999 | 272 | 8.0% |
| $100,000 to $149,999 | 408 | 12.0% |
| $150,000 to $199,999 | 180 | 5.3% |
| $200,000+ | 197 | 5.8% |
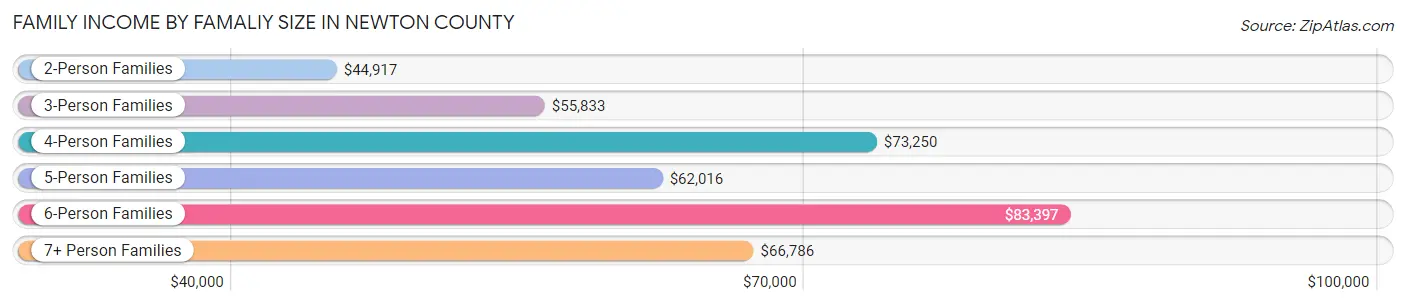
Family Income by Famaliy Size in Newton County
6-person families (71 | 2.1%) account for the highest median family income in Newton County with $83,397 per family, while 2-person families (1,733 | 51.0%) have the highest median income of $22,458 per family member.
| Income Bracket | # Families | Median Income |
| 2-Person Families | 1,733 (51.0%) | $44,917 |
| 3-Person Families | 704 (20.7%) | $55,833 |
| 4-Person Families | 488 (14.4%) | $73,250 |
| 5-Person Families | 310 (9.1%) | $62,016 |
| 6-Person Families | 71 (2.1%) | $83,397 |
| 7+ Person Families | 90 (2.6%) | $66,786 |
| Total | 3,396 (100.0%) | $55,313 |
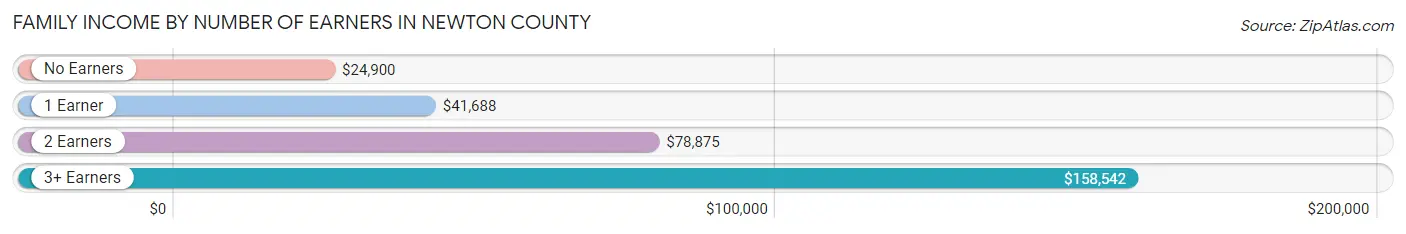
Family Income by Number of Earners in Newton County
The median family income in Newton County is $55,313, with families comprising 3+ earners (105) having the highest median family income of $158,542, while families with no earners (883) have the lowest median family income of $24,900, accounting for 3.1% and 26.0% of families, respectively.
| Number of Earners | # Families | Median Income |
| No Earners | 883 (26.0%) | $24,900 |
| 1 Earner | 1,182 (34.8%) | $41,688 |
| 2 Earners | 1,226 (36.1%) | $78,875 |
| 3+ Earners | 105 (3.1%) | $158,542 |
| Total | 3,396 (100.0%) | $55,313 |
Household Income in Newton County
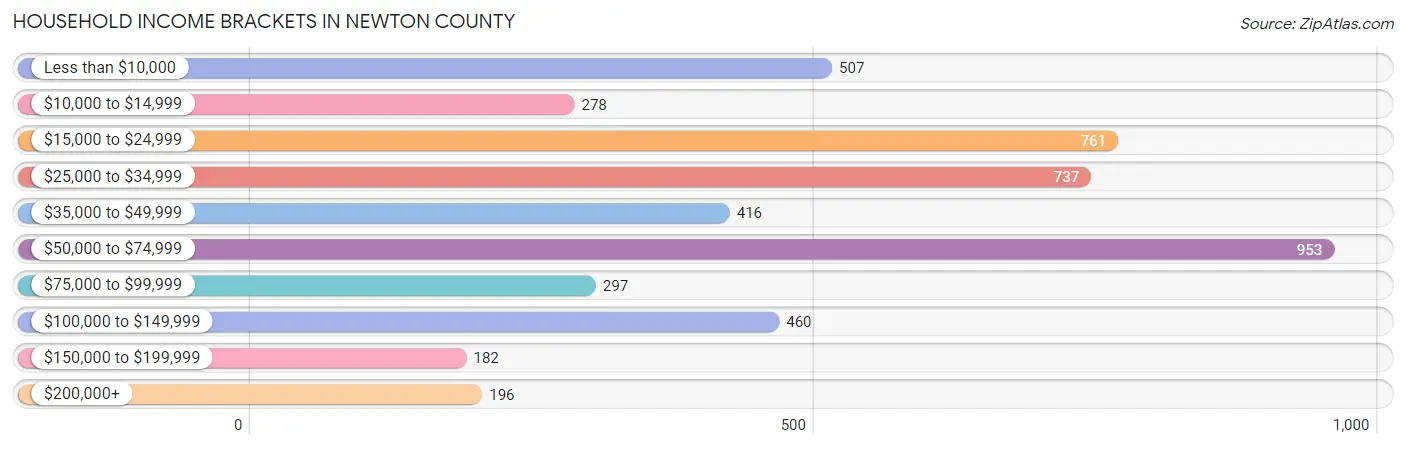
Household Income Brackets in Newton County
With 953 households falling in the category, the $50,000 to $74,999 income range is the most frequent in Newton County, accounting for 19.9% of all households. In contrast, only 182 households (3.8%) fall into the $150,000 to $199,999 income bracket, making it the least populous group.
| Income Bracket | # Households | % Households |
| Less than $10,000 | 507 | 10.6% |
| $10,000 to $14,999 | 278 | 5.8% |
| $15,000 to $24,999 | 761 | 15.9% |
| $25,000 to $34,999 | 737 | 15.4% |
| $35,000 to $49,999 | 416 | 8.7% |
| $50,000 to $74,999 | 953 | 19.9% |
| $75,000 to $99,999 | 297 | 6.2% |
| $100,000 to $149,999 | 460 | 9.6% |
| $150,000 to $199,999 | 182 | 3.8% |
| $200,000+ | 196 | 4.1% |
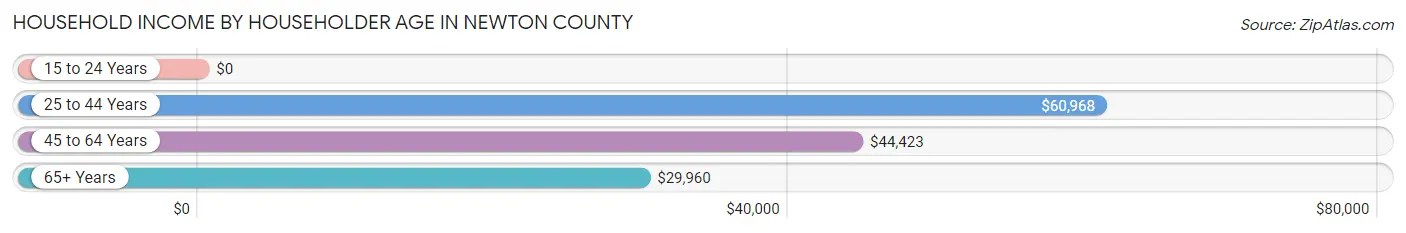
Household Income by Householder Age in Newton County
The median household income in Newton County is $38,871, with the highest median household income of $60,968 found in the 25 to 44 years age bracket for the primary householder. A total of 1,092 households (22.8%) fall into this category. Meanwhile, the 15 to 24 years age bracket for the primary householder has the lowest median household income of $0, with 128 households (2.7%) in this group.
| Income Bracket | # Households | Median Income |
| 15 to 24 Years | 128 (2.7%) | $0 |
| 25 to 44 Years | 1,092 (22.8%) | $60,968 |
| 45 to 64 Years | 1,854 (38.7%) | $44,423 |
| 65+ Years | 1,713 (35.8%) | $29,960 |
| Total | 4,787 (100.0%) | $38,871 |
Poverty in Newton County
Income Below Poverty by Sex and Age in Newton County
With 23.6% poverty level for males and 24.9% for females among the residents of Newton County, under 5 year old males and 5 year old females are the most vulnerable to poverty, with 190 males (52.9%) and 68 females (95.8%) in their respective age groups living below the poverty level.
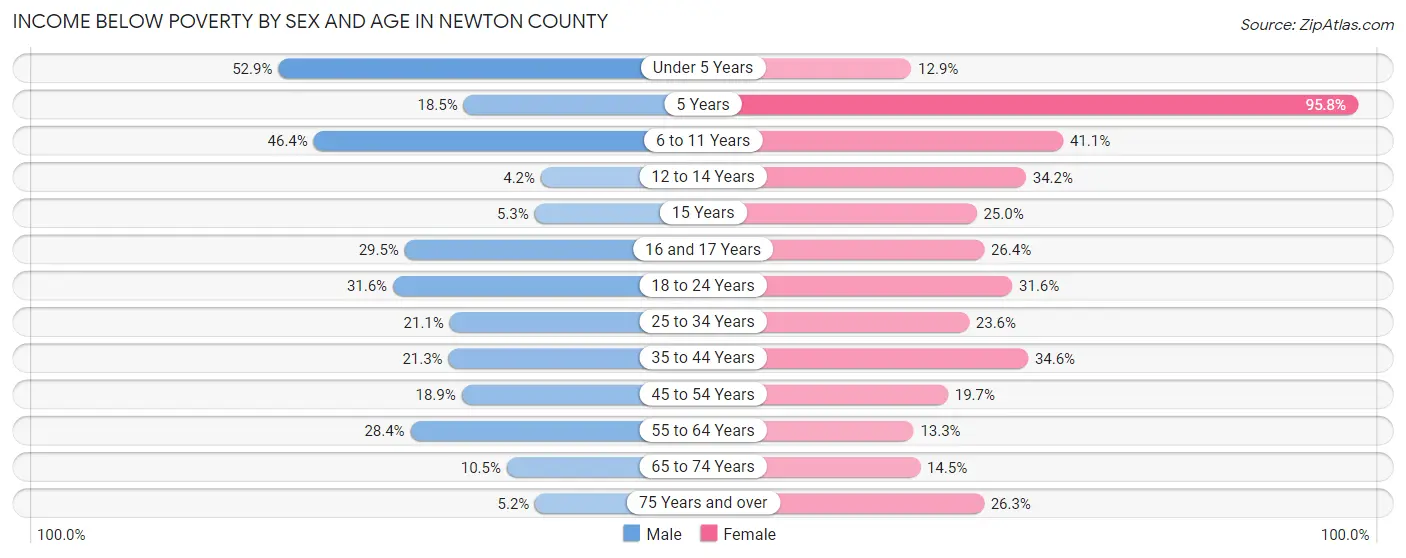
| Age Bracket | Male | Female |
| Under 5 Years | 190 (52.9%) | 26 (12.9%) |
| 5 Years | 5 (18.5%) | 68 (95.8%) |
| 6 to 11 Years | 260 (46.4%) | 200 (41.1%) |
| 12 to 14 Years | 9 (4.2%) | 84 (34.2%) |
| 15 Years | 4 (5.3%) | 20 (25.0%) |
| 16 and 17 Years | 48 (29.4%) | 38 (26.4%) |
| 18 to 24 Years | 149 (31.6%) | 147 (31.6%) |
| 25 to 34 Years | 122 (21.1%) | 145 (23.6%) |
| 35 to 44 Years | 119 (21.3%) | 227 (34.5%) |
| 45 to 54 Years | 164 (18.9%) | 144 (19.7%) |
| 55 to 64 Years | 260 (28.4%) | 131 (13.3%) |
| 65 to 74 Years | 80 (10.5%) | 103 (14.5%) |
| 75 Years and over | 29 (5.2%) | 172 (26.3%) |
| Total | 1,439 (23.6%) | 1,505 (24.9%) |
Income Above Poverty by Sex and Age in Newton County
According to the poverty statistics in Newton County, males aged 12 to 14 years and females aged under 5 years are the age groups that are most secure financially, with 95.8% of males and 87.1% of females in these age groups living above the poverty line.
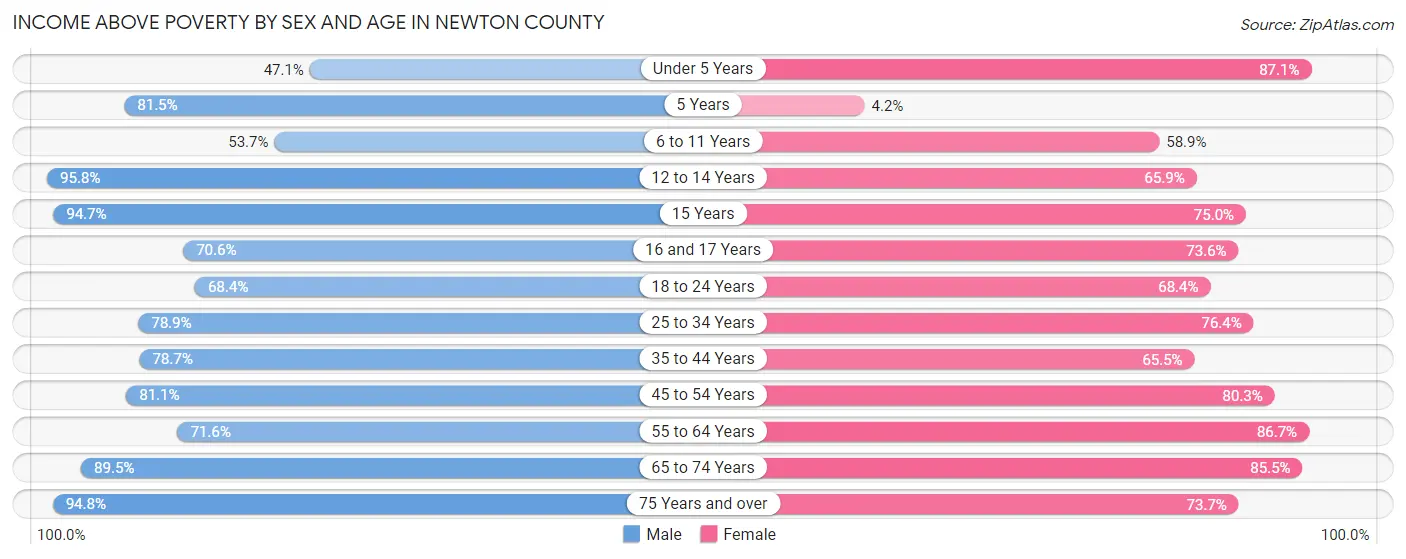
| Age Bracket | Male | Female |
| Under 5 Years | 169 (47.1%) | 176 (87.1%) |
| 5 Years | 22 (81.5%) | 3 (4.2%) |
| 6 to 11 Years | 301 (53.6%) | 287 (58.9%) |
| 12 to 14 Years | 207 (95.8%) | 162 (65.8%) |
| 15 Years | 71 (94.7%) | 60 (75.0%) |
| 16 and 17 Years | 115 (70.6%) | 106 (73.6%) |
| 18 to 24 Years | 322 (68.4%) | 318 (68.4%) |
| 25 to 34 Years | 456 (78.9%) | 470 (76.4%) |
| 35 to 44 Years | 439 (78.7%) | 430 (65.4%) |
| 45 to 54 Years | 704 (81.1%) | 588 (80.3%) |
| 55 to 64 Years | 656 (71.6%) | 854 (86.7%) |
| 65 to 74 Years | 682 (89.5%) | 607 (85.5%) |
| 75 Years and over | 526 (94.8%) | 481 (73.7%) |
| Total | 4,670 (76.4%) | 4,542 (75.1%) |
Income Below Poverty Among Married-Couple Families in Newton County
The poverty statistics for married-couple families in Newton County show that 9.0% or 219 of the total 2,443 families live below the poverty line. Families with 3 or 4 children have the highest poverty rate of 22.1%, comprising of 49 families. On the other hand, families with 5 or more children have the lowest poverty rate of 0.0%, which includes 0 families.
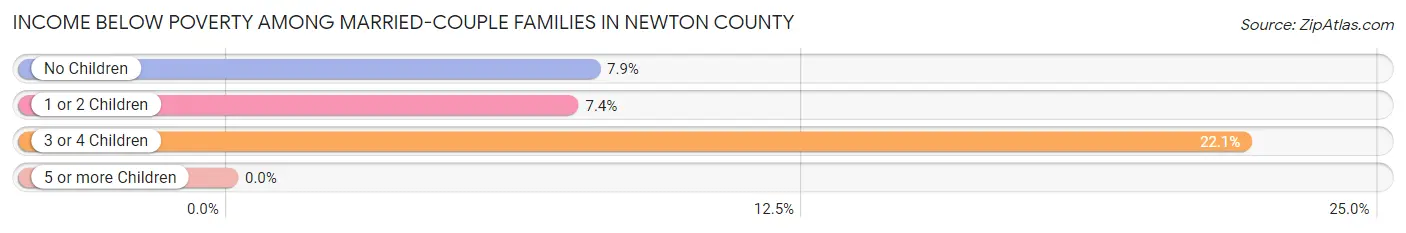
| Children | Above Poverty | Below Poverty |
| No Children | 1,461 (92.1%) | 125 (7.9%) |
| 1 or 2 Children | 562 (92.6%) | 45 (7.4%) |
| 3 or 4 Children | 173 (77.9%) | 49 (22.1%) |
| 5 or more Children | 28 (100.0%) | 0 (0.0%) |
| Total | 2,224 (91.0%) | 219 (9.0%) |
Income Below Poverty Among Single-Parent Households in Newton County
According to the poverty data in Newton County, 37.1% or 128 single-father households and 33.4% or 203 single-mother households are living below the poverty line. Among single-father households, those with 3 or 4 children have the highest poverty rate, with 33 households (57.9%) experiencing poverty. Likewise, among single-mother households, those with 3 or 4 children have the highest poverty rate, with 86 households (100.0%) falling below the poverty line.
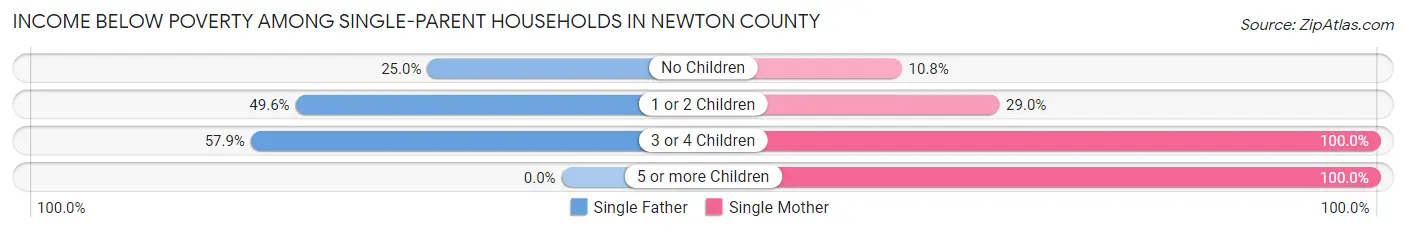
| Children | Single Father | Single Mother |
| No Children | 39 (25.0%) | 30 (10.8%) |
| 1 or 2 Children | 56 (49.6%) | 64 (29.0%) |
| 3 or 4 Children | 33 (57.9%) | 86 (100.0%) |
| 5 or more Children | 0 (0.0%) | 23 (100.0%) |
| Total | 128 (37.1%) | 203 (33.4%) |
Income Below Poverty Among Married-Couple vs Single-Parent Households in Newton County
The poverty data for Newton County shows that 219 of the married-couple family households (9.0%) and 331 of the single-parent households (34.7%) are living below the poverty level. Within the married-couple family households, those with 3 or 4 children have the highest poverty rate, with 49 households (22.1%) falling below the poverty line. Among the single-parent households, those with 3 or 4 children have the highest poverty rate, with 119 household (83.2%) living below poverty.
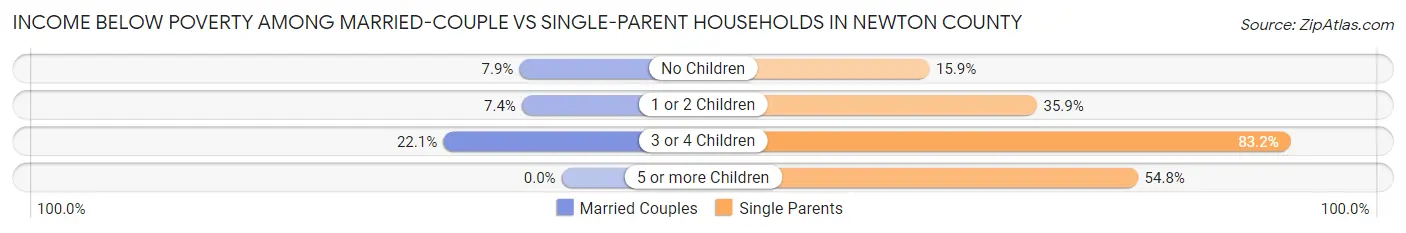
| Children | Married-Couple Families | Single-Parent Households |
| No Children | 125 (7.9%) | 69 (15.9%) |
| 1 or 2 Children | 45 (7.4%) | 120 (35.9%) |
| 3 or 4 Children | 49 (22.1%) | 119 (83.2%) |
| 5 or more Children | 0 (0.0%) | 23 (54.8%) |
| Total | 219 (9.0%) | 331 (34.7%) |
Race in Newton County
The most populous races in Newton County are White / Caucasian (9,277 | 75.2%), Black / African American (2,272 | 18.4%), and Two or more Races (602 | 4.9%).
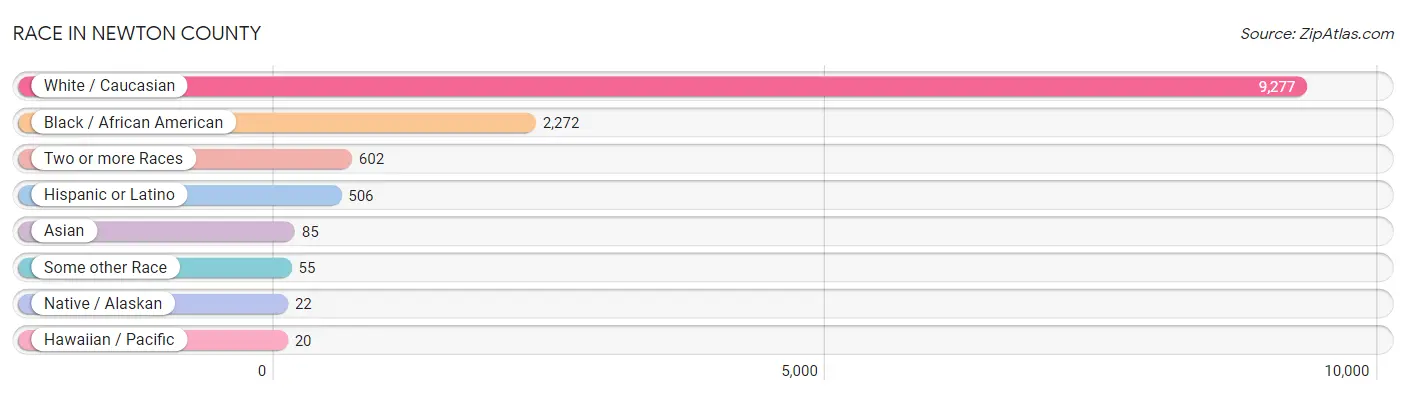
| Race | # Population | % Population |
| Asian | 85 | 0.7% |
| Black / African American | 2,272 | 18.4% |
| Hawaiian / Pacific | 20 | 0.2% |
| Hispanic or Latino | 506 | 4.1% |
| Native / Alaskan | 22 | 0.2% |
| White / Caucasian | 9,277 | 75.2% |
| Two or more Races | 602 | 4.9% |
| Some other Race | 55 | 0.4% |
| Total | 12,333 | 100.0% |
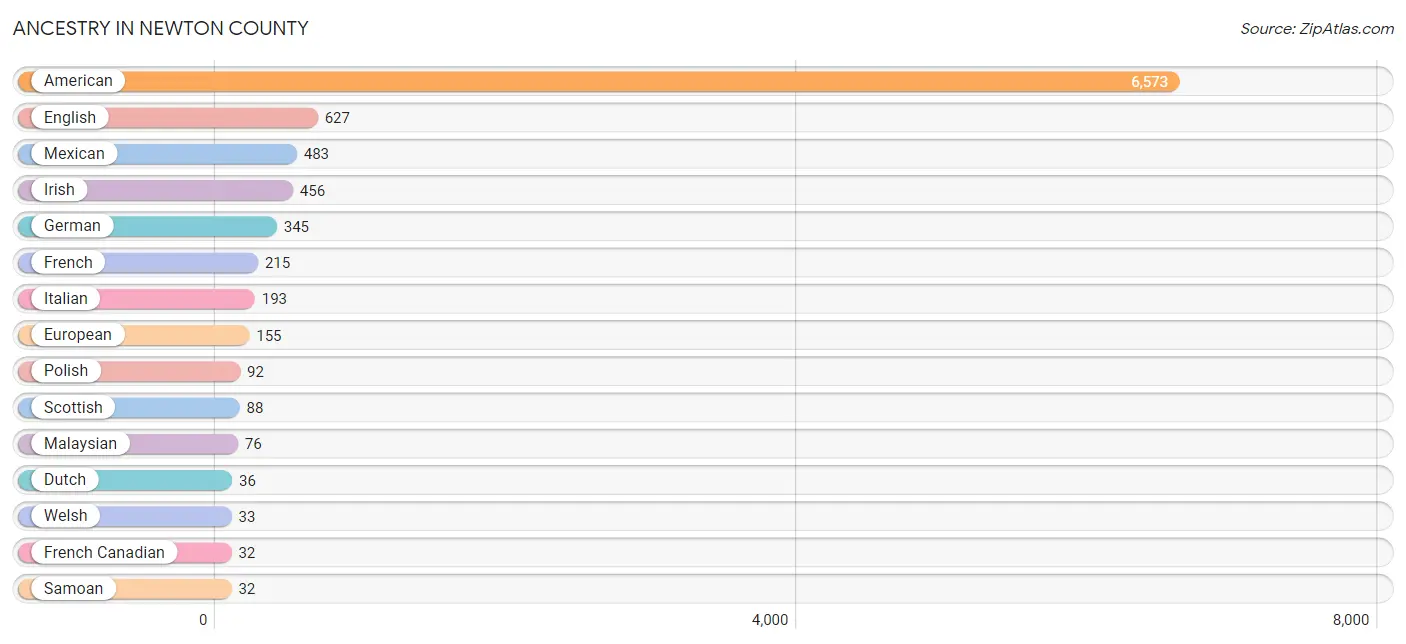
Ancestry in Newton County
The most populous ancestries reported in Newton County are American (6,573 | 53.3%), English (627 | 5.1%), Mexican (483 | 3.9%), Irish (456 | 3.7%), and German (345 | 2.8%), together accounting for 68.8% of all Newton County residents.
| Ancestry | # Population | % Population |
| American | 6,573 | 53.3% |
| Arab | 5 | 0.0% |
| Bhutanese | 1 | 0.0% |
| British | 30 | 0.2% |
| Burmese | 11 | 0.1% |
| Cajun | 9 | 0.1% |
| Central American | 6 | 0.1% |
| Cherokee | 19 | 0.2% |
| Czech | 2 | 0.0% |
| Dutch | 36 | 0.3% |
| Eastern European | 1 | 0.0% |
| English | 627 | 5.1% |
| European | 155 | 1.3% |
| French | 215 | 1.7% |
| French Canadian | 32 | 0.3% |
| German | 345 | 2.8% |
| Greek | 16 | 0.1% |
| Honduran | 6 | 0.1% |
| Indian (Asian) | 17 | 0.1% |
| Irish | 456 | 3.7% |
| Italian | 193 | 1.6% |
| Korean | 18 | 0.2% |
| Lebanese | 5 | 0.0% |
| Malaysian | 76 | 0.6% |
| Mexican | 483 | 3.9% |
| Navajo | 9 | 0.1% |
| Norwegian | 4 | 0.0% |
| Pakistani | 1 | 0.0% |
| Polish | 92 | 0.7% |
| Portuguese | 24 | 0.2% |
| Puerto Rican | 5 | 0.0% |
| Samoan | 32 | 0.3% |
| Scandinavian | 4 | 0.0% |
| Scotch-Irish | 28 | 0.2% |
| Scottish | 88 | 0.7% |
| Swedish | 15 | 0.1% |
| Swiss | 27 | 0.2% |
| Tohono O'Odham | 9 | 0.1% |
| Welsh | 33 | 0.3% |
| West Indian | 2 | 0.0% | View All 40 Rows |
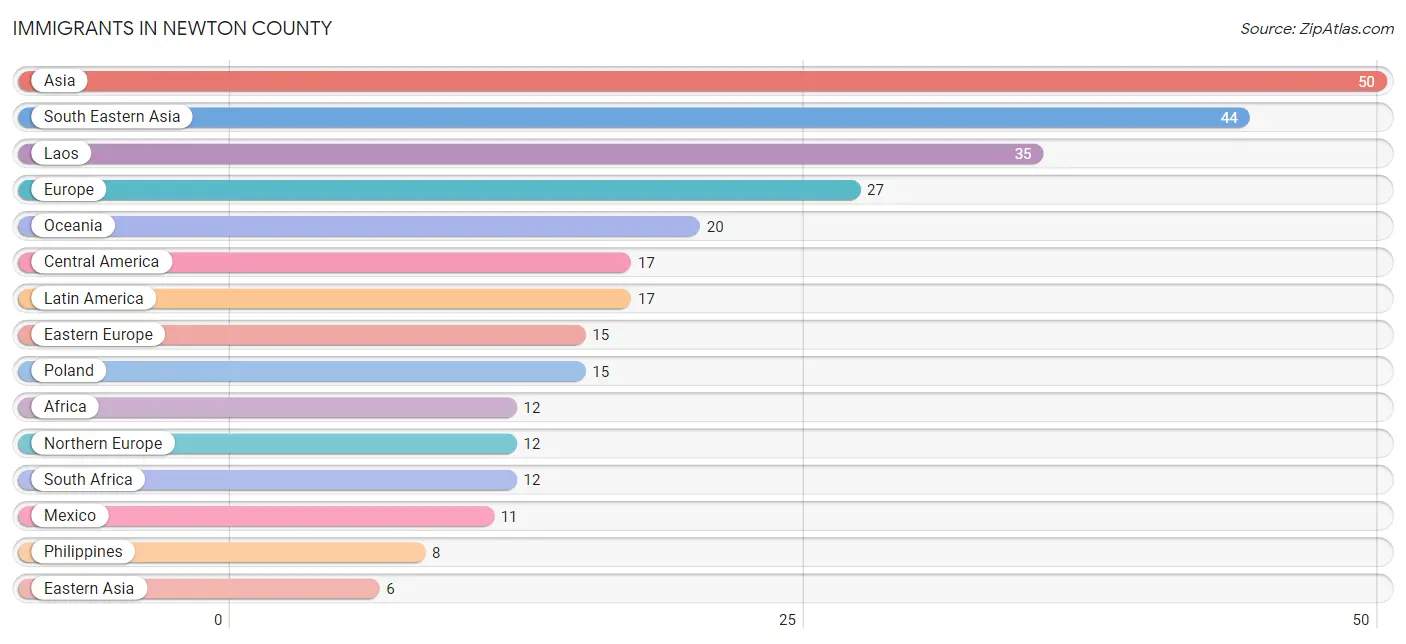
Immigrants in Newton County
The most numerous immigrant groups reported in Newton County came from Asia (50 | 0.4%), South Eastern Asia (44 | 0.4%), Laos (35 | 0.3%), Europe (27 | 0.2%), and Oceania (20 | 0.2%), together accounting for 1.4% of all Newton County residents.
| Immigration Origin | # Population | % Population |
| Africa | 12 | 0.1% |
| Asia | 50 | 0.4% |
| Central America | 17 | 0.1% |
| China | 5 | 0.0% |
| Eastern Asia | 6 | 0.1% |
| Eastern Europe | 15 | 0.1% |
| Europe | 27 | 0.2% |
| Honduras | 6 | 0.1% |
| Hong Kong | 5 | 0.0% |
| Japan | 1 | 0.0% |
| Laos | 35 | 0.3% |
| Latin America | 17 | 0.1% |
| Mexico | 11 | 0.1% |
| Northern Europe | 12 | 0.1% |
| Oceania | 20 | 0.2% |
| Philippines | 8 | 0.1% |
| Poland | 15 | 0.1% |
| South Africa | 12 | 0.1% |
| South Eastern Asia | 44 | 0.4% |
| Thailand | 1 | 0.0% | View All 20 Rows |
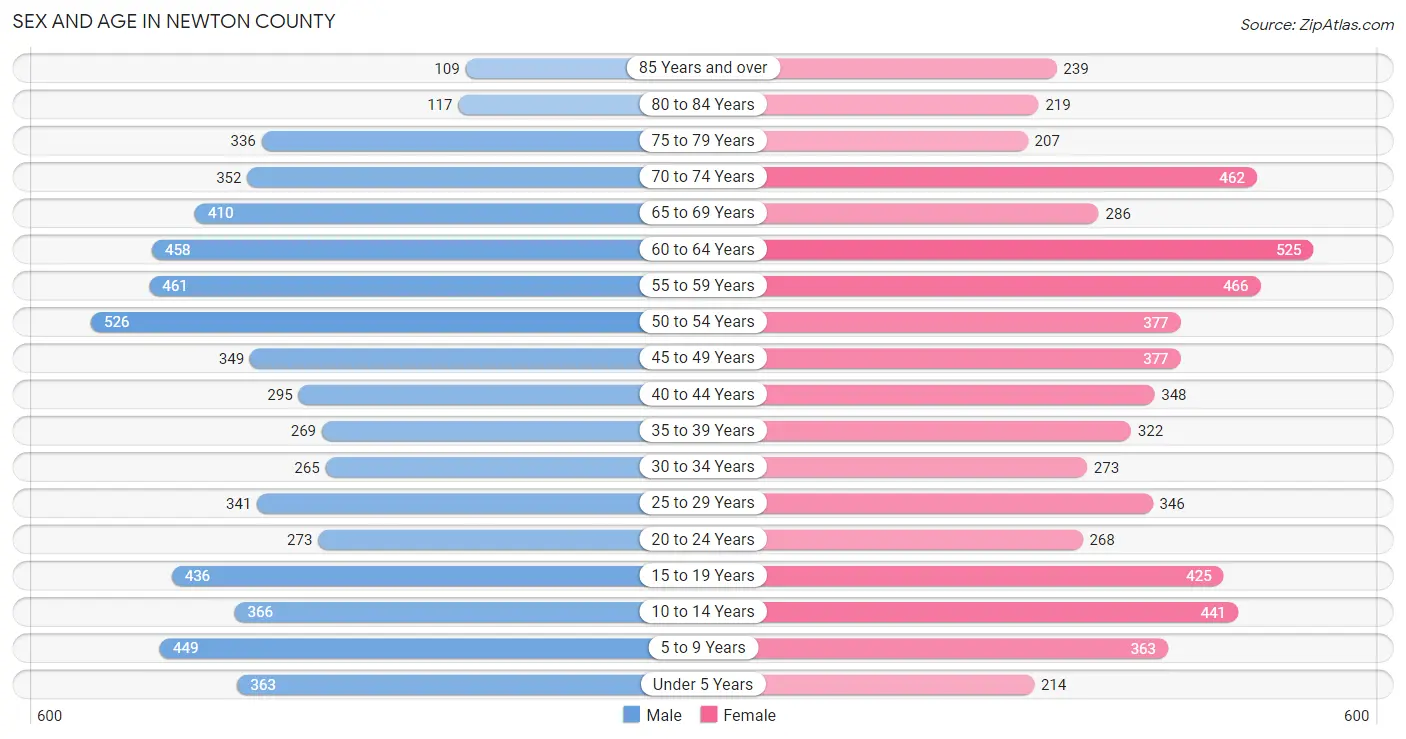
Sex and Age in Newton County
Sex and Age in Newton County
The most populous age groups in Newton County are 50 to 54 Years (526 | 8.5%) for men and 60 to 64 Years (525 | 8.5%) for women.
| Age Bracket | Male | Female |
| Under 5 Years | 363 (5.9%) | 214 (3.5%) |
| 5 to 9 Years | 449 (7.3%) | 363 (5.9%) |
| 10 to 14 Years | 366 (5.9%) | 441 (7.2%) |
| 15 to 19 Years | 436 (7.1%) | 425 (6.9%) |
| 20 to 24 Years | 273 (4.4%) | 268 (4.3%) |
| 25 to 29 Years | 341 (5.5%) | 346 (5.6%) |
| 30 to 34 Years | 265 (4.3%) | 273 (4.4%) |
| 35 to 39 Years | 269 (4.4%) | 322 (5.2%) |
| 40 to 44 Years | 295 (4.8%) | 348 (5.7%) |
| 45 to 49 Years | 349 (5.7%) | 377 (6.1%) |
| 50 to 54 Years | 526 (8.5%) | 377 (6.1%) |
| 55 to 59 Years | 461 (7.5%) | 466 (7.6%) |
| 60 to 64 Years | 458 (7.4%) | 525 (8.5%) |
| 65 to 69 Years | 410 (6.6%) | 286 (4.6%) |
| 70 to 74 Years | 352 (5.7%) | 462 (7.5%) |
| 75 to 79 Years | 336 (5.4%) | 207 (3.4%) |
| 80 to 84 Years | 117 (1.9%) | 219 (3.6%) |
| 85 Years and over | 109 (1.8%) | 239 (3.9%) |
| Total | 6,175 (100.0%) | 6,158 (100.0%) |
Families and Households in Newton County
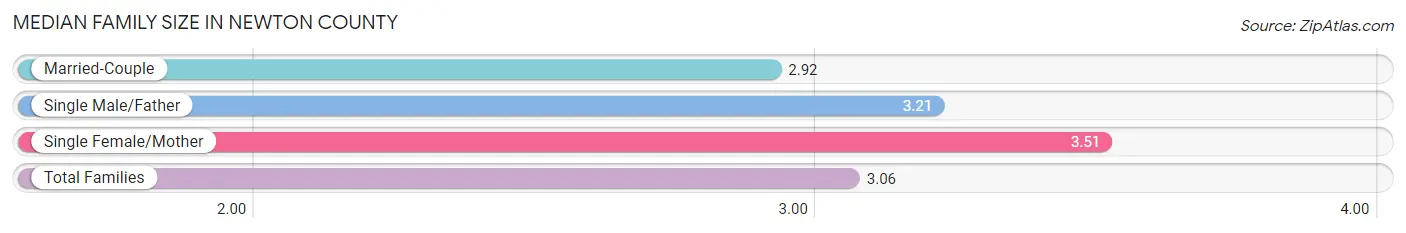
Median Family Size in Newton County
The median family size in Newton County is 3.06 persons per family, with single female/mother families (608 | 17.9%) accounting for the largest median family size of 3.51 persons per family. On the other hand, married-couple families (2,443 | 71.9%) represent the smallest median family size with 2.92 persons per family.
| Family Type | # Families | Family Size |
| Married-Couple | 2,443 (71.9%) | 2.92 |
| Single Male/Father | 345 (10.2%) | 3.21 |
| Single Female/Mother | 608 (17.9%) | 3.51 |
| Total Families | 3,396 (100.0%) | 3.06 |
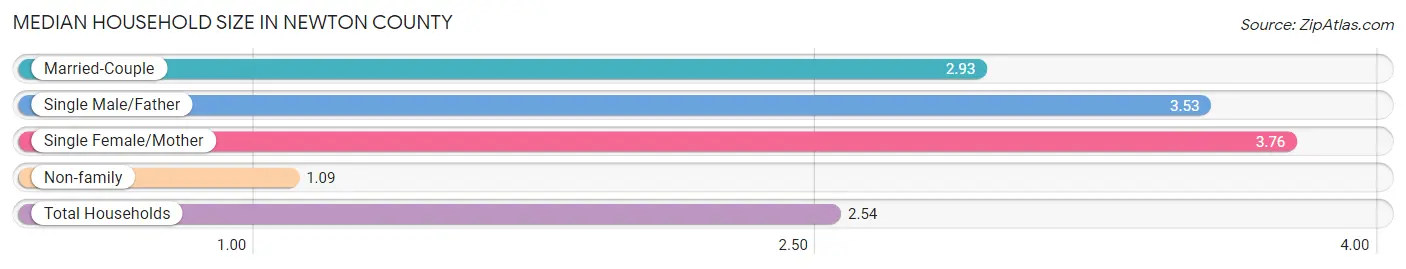
Median Household Size in Newton County
The median household size in Newton County is 2.54 persons per household, with single female/mother households (608 | 12.7%) accounting for the largest median household size of 3.76 persons per household. non-family households (1,391 | 29.1%) represent the smallest median household size with 1.09 persons per household.
| Household Type | # Households | Household Size |
| Married-Couple | 2,443 (51.0%) | 2.93 |
| Single Male/Father | 345 (7.2%) | 3.53 |
| Single Female/Mother | 608 (12.7%) | 3.76 |
| Non-family | 1,391 (29.1%) | 1.09 |
| Total Households | 4,787 (100.0%) | 2.54 |
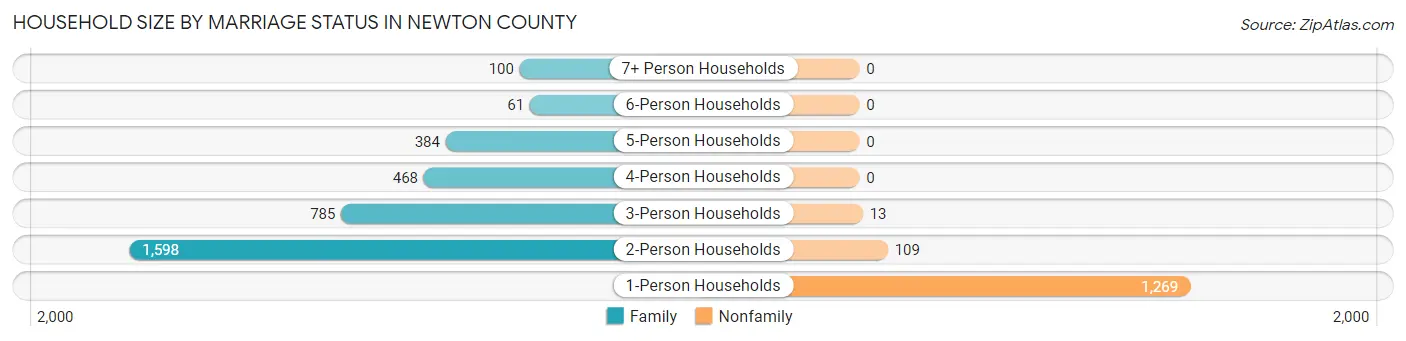
Household Size by Marriage Status in Newton County
Out of a total of 4,787 households in Newton County, 3,396 (70.9%) are family households, while 1,391 (29.1%) are nonfamily households. The most numerous type of family households are 2-person households, comprising 1,598, and the most common type of nonfamily households are 1-person households, comprising 1,269.
| Household Size | Family Households | Nonfamily Households |
| 1-Person Households | - | 1,269 (26.5%) |
| 2-Person Households | 1,598 (33.4%) | 109 (2.3%) |
| 3-Person Households | 785 (16.4%) | 13 (0.3%) |
| 4-Person Households | 468 (9.8%) | 0 (0.0%) |
| 5-Person Households | 384 (8.0%) | 0 (0.0%) |
| 6-Person Households | 61 (1.3%) | 0 (0.0%) |
| 7+ Person Households | 100 (2.1%) | 0 (0.0%) |
| Total | 3,396 (70.9%) | 1,391 (29.1%) |
Female Fertility in Newton County
Fertility by Age in Newton County
Average fertility rate in Newton County is 93.0 births per 1,000 women. Women in the age bracket of 20 to 34 years have the highest fertility rate with 201.0 births per 1,000 women. Women in the age bracket of 20 to 34 years acount for 77.4% of all women with births.
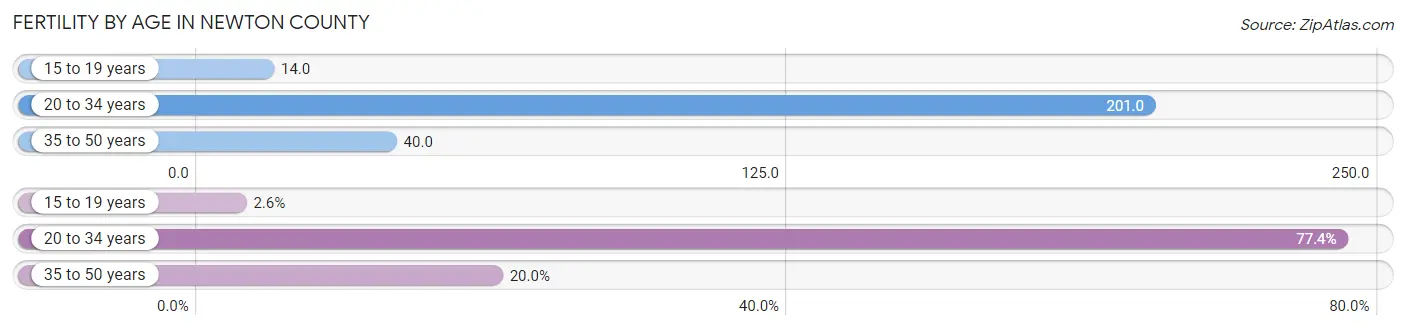
| Age Bracket | Women with Births | Births / 1,000 Women |
| 15 to 19 years | 6 (2.6%) | 14.0 |
| 20 to 34 years | 178 (77.4%) | 201.0 |
| 35 to 50 years | 46 (20.0%) | 40.0 |
| Total | 230 (100.0%) | 93.0 |
Fertility by Age by Marriage Status in Newton County
49.6% of women with births (230) in Newton County are married. The highest percentage of unmarried women with births falls into 15 to 19 years age bracket with 100.0% of them unmarried at the time of birth, while the lowest percentage of unmarried women with births belong to 20 to 34 years age bracket with 46.1% of them unmarried.
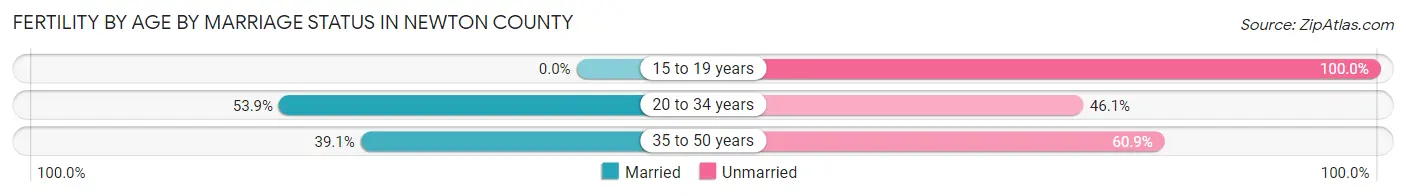
| Age Bracket | Married | Unmarried |
| 15 to 19 years | 0 (0.0%) | 6 (100.0%) |
| 20 to 34 years | 96 (53.9%) | 82 (46.1%) |
| 35 to 50 years | 18 (39.1%) | 28 (60.9%) |
| Total | 114 (49.6%) | 116 (50.4%) |
Fertility by Education in Newton County
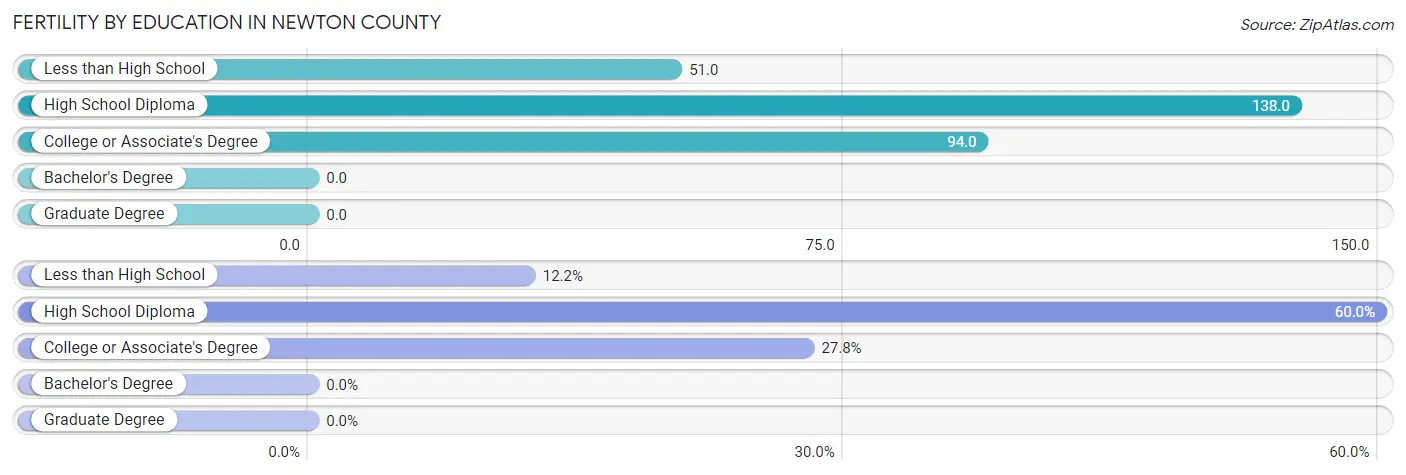
| Educational Attainment | Women with Births | Births / 1,000 Women |
| Less than High School | 28 (12.2%) | 51.0 |
| High School Diploma | 138 (60.0%) | 138.0 |
| College or Associate's Degree | 64 (27.8%) | 94.0 |
| Bachelor's Degree | 0 (0.0%) | 0.0 |
| Graduate Degree | 0 (0.0%) | 0.0 |
| Total | 230 (100.0%) | 93.0 |
Fertility by Education by Marriage Status in Newton County
50.4% of women with births in Newton County are unmarried. Women with the educational attainment of high school diploma are most likely to be married with 56.5% of them married at childbirth, while women with the educational attainment of less than high school are least likely to be married with 100.0% of them unmarried at childbirth.
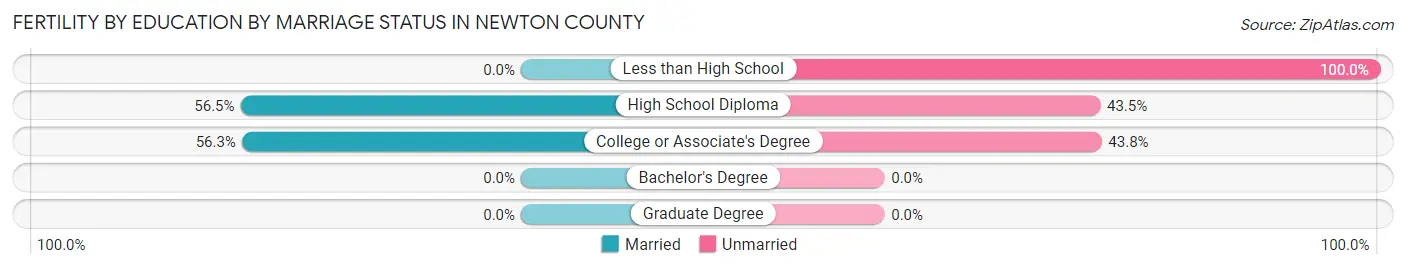
| Educational Attainment | Married | Unmarried |
| Less than High School | 0 (0.0%) | 28 (100.0%) |
| High School Diploma | 78 (56.5%) | 60 (43.5%) |
| College or Associate's Degree | 36 (56.2%) | 28 (43.8%) |
| Bachelor's Degree | 0 (0.0%) | 0 (0.0%) |
| Graduate Degree | 0 (0.0%) | 0 (0.0%) |
| Total | 114 (49.6%) | 116 (50.4%) |
Employment Characteristics in Newton County
Employment by Class of Employer in Newton County
Among the 4,221 employed individuals in Newton County, private company employees (2,751 | 65.2%), local government employees (468 | 11.1%), and not-for-profit organizations (306 | 7.2%) make up the most common classes of employment.
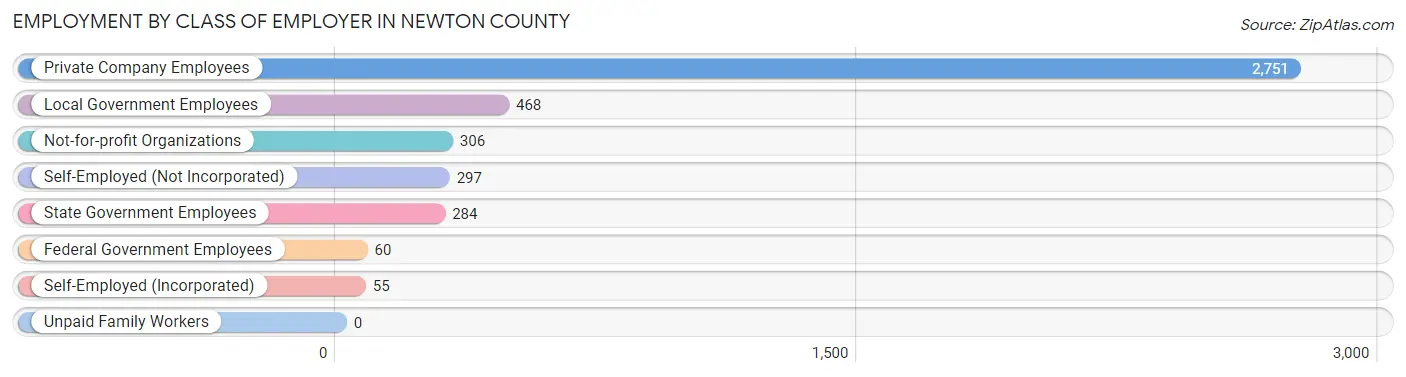
| Employer Class | # Employees | % Employees |
| Private Company Employees | 2,751 | 65.2% |
| Self-Employed (Incorporated) | 55 | 1.3% |
| Self-Employed (Not Incorporated) | 297 | 7.0% |
| Not-for-profit Organizations | 306 | 7.2% |
| Local Government Employees | 468 | 11.1% |
| State Government Employees | 284 | 6.7% |
| Federal Government Employees | 60 | 1.4% |
| Unpaid Family Workers | 0 | 0.0% |
| Total | 4,221 | 100.0% |
Employment Status by Age in Newton County
According to the labor force statistics for Newton County, out of the total population over 16 years of age (9,982), 49.1% or 4,901 individuals are in the labor force, with 10.6% or 520 of them unemployed. The age group with the highest labor force participation rate is 25 to 29 years, with 82.8% or 569 individuals in the labor force. Within the labor force, the 16 to 19 years age range has the highest percentage of unemployed individuals, with 65.8% or 181 of them being unemployed.
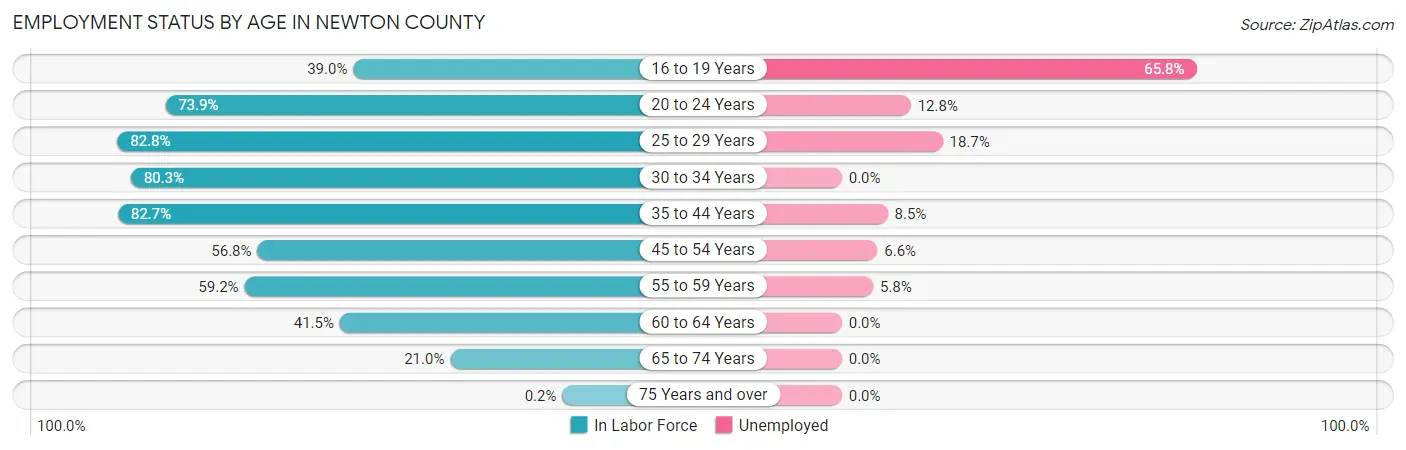
| Age Bracket | In Labor Force | Unemployed |
| 16 to 19 Years | 275 (39.0%) | 181 (65.8%) |
| 20 to 24 Years | 400 (73.9%) | 51 (12.8%) |
| 25 to 29 Years | 569 (82.8%) | 106 (18.7%) |
| 30 to 34 Years | 432 (80.3%) | 0 (0.0%) |
| 35 to 44 Years | 1,021 (82.7%) | 87 (8.5%) |
| 45 to 54 Years | 925 (56.8%) | 61 (6.6%) |
| 55 to 59 Years | 549 (59.2%) | 32 (5.8%) |
| 60 to 64 Years | 408 (41.5%) | 0 (0.0%) |
| 65 to 74 Years | 317 (21.0%) | 0 (0.0%) |
| 75 Years and over | 2 (0.2%) | 0 (0.0%) |
| Total | 4,901 (49.1%) | 520 (10.6%) |
Employment Status by Educational Attainment in Newton County
According to labor force statistics for Newton County, 65.1% of individuals (3,905) out of the total population between 25 and 64 years of age (5,998) are in the labor force, with 7.3% or 285 of them being unemployed. The group with the highest labor force participation rate are those with the educational attainment of bachelor's degree or higher, with 84.9% or 361 individuals in the labor force. Within the labor force, individuals with high school diploma education have the highest percentage of unemployment, with 12.4% or 233 of them being unemployed.
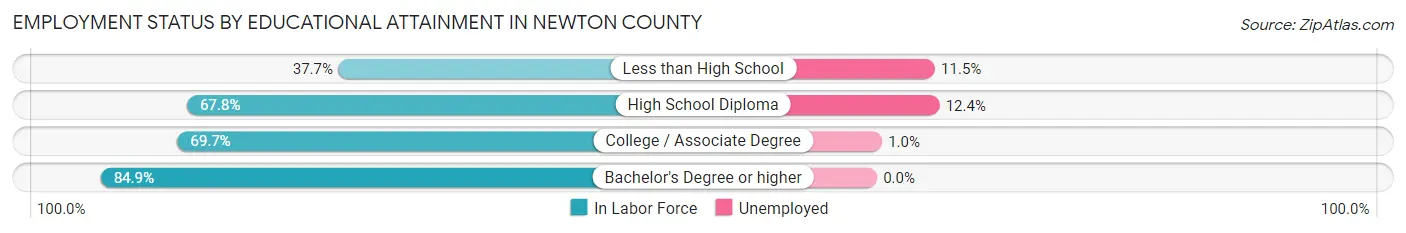
| Educational Attainment | In Labor Force | Unemployed |
| Less than High School | 340 (37.7%) | 104 (11.5%) |
| High School Diploma | 1,879 (67.8%) | 344 (12.4%) |
| College / Associate Degree | 1,324 (69.7%) | 19 (1.0%) |
| Bachelor's Degree or higher | 361 (84.9%) | 0 (0.0%) |
| Total | 3,905 (65.1%) | 438 (7.3%) |
Employment Occupations by Sex in Newton County
Management, Business, Science and Arts Occupations
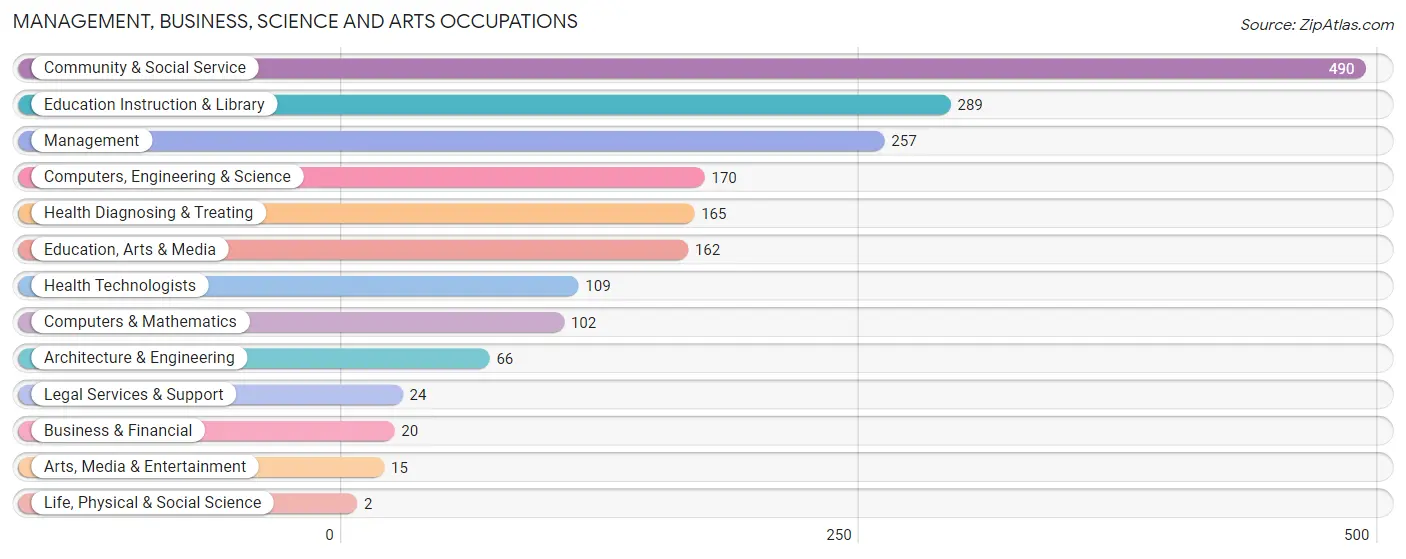
The most common Management, Business, Science and Arts occupations in Newton County are Community & Social Service (490 | 11.2%), Education Instruction & Library (289 | 6.6%), Management (257 | 5.9%), Computers, Engineering & Science (170 | 3.9%), and Health Diagnosing & Treating (165 | 3.8%).
Management, Business, Science and Arts Occupations by Sex
Within the Management, Business, Science and Arts occupations in Newton County, the most male-oriented occupations are Architecture & Engineering (100.0%), Legal Services & Support (100.0%), and Management (77.8%), while the most female-oriented occupations are Life, Physical & Social Science (100.0%), Education Instruction & Library (96.9%), and Health Technologists (91.7%).
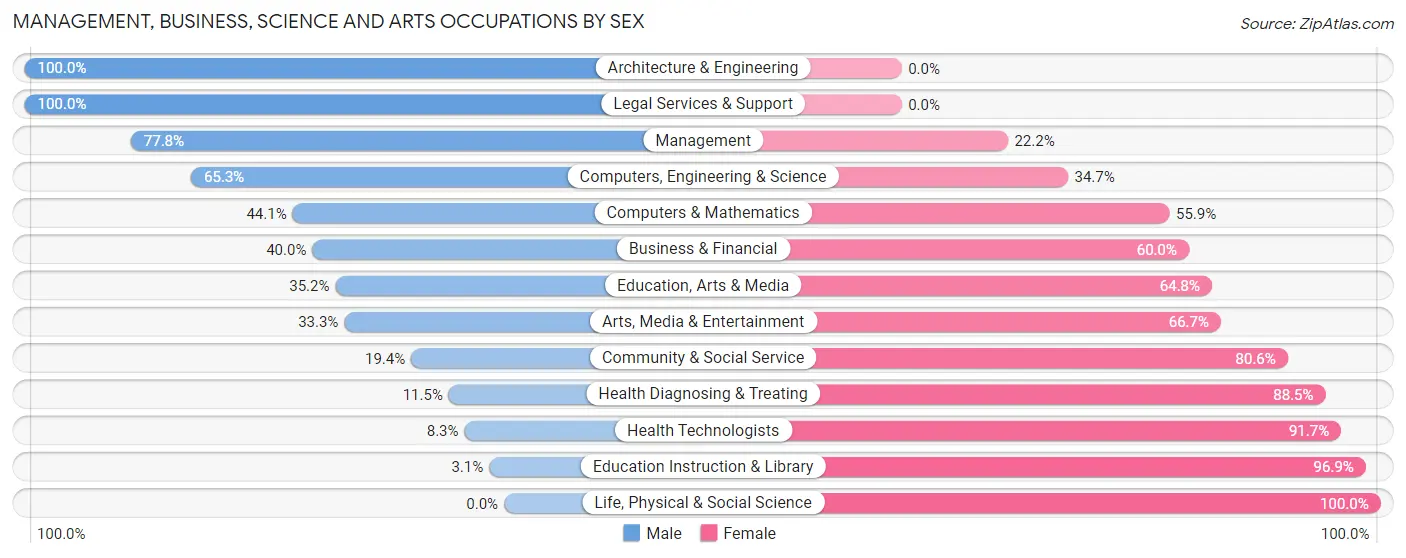
| Occupation | Male | Female |
| Management | 200 (77.8%) | 57 (22.2%) |
| Business & Financial | 8 (40.0%) | 12 (60.0%) |
| Computers, Engineering & Science | 111 (65.3%) | 59 (34.7%) |
| Computers & Mathematics | 45 (44.1%) | 57 (55.9%) |
| Architecture & Engineering | 66 (100.0%) | 0 (0.0%) |
| Life, Physical & Social Science | 0 (0.0%) | 2 (100.0%) |
| Community & Social Service | 95 (19.4%) | 395 (80.6%) |
| Education, Arts & Media | 57 (35.2%) | 105 (64.8%) |
| Legal Services & Support | 24 (100.0%) | 0 (0.0%) |
| Education Instruction & Library | 9 (3.1%) | 280 (96.9%) |
| Arts, Media & Entertainment | 5 (33.3%) | 10 (66.7%) |
| Health Diagnosing & Treating | 19 (11.5%) | 146 (88.5%) |
| Health Technologists | 9 (8.3%) | 100 (91.7%) |
| Total (Category) | 433 (39.3%) | 669 (60.7%) |
| Total (Overall) | 2,359 (53.9%) | 2,019 (46.1%) |
Services Occupations
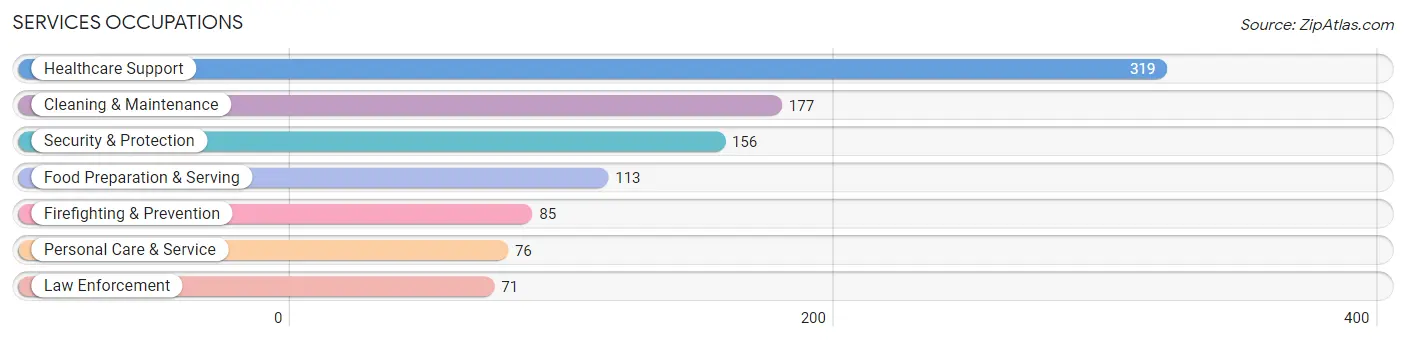
The most common Services occupations in Newton County are Healthcare Support (319 | 7.3%), Cleaning & Maintenance (177 | 4.0%), Security & Protection (156 | 3.6%), Food Preparation & Serving (113 | 2.6%), and Firefighting & Prevention (85 | 1.9%).
Services Occupations by Sex
Within the Services occupations in Newton County, the most male-oriented occupations are Law Enforcement (93.0%), Security & Protection (52.6%), and Cleaning & Maintenance (46.3%), while the most female-oriented occupations are Personal Care & Service (100.0%), Healthcare Support (93.7%), and Firefighting & Prevention (81.2%).
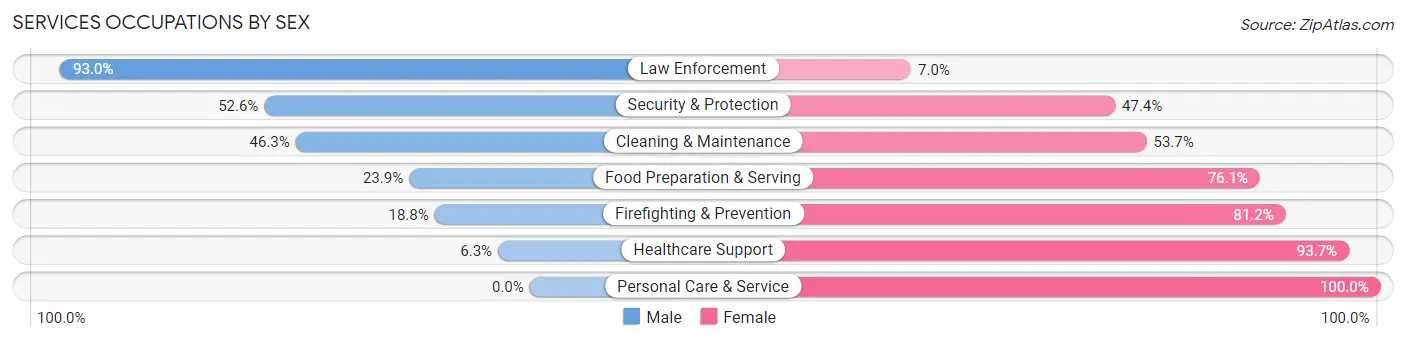
| Occupation | Male | Female |
| Healthcare Support | 20 (6.3%) | 299 (93.7%) |
| Security & Protection | 82 (52.6%) | 74 (47.4%) |
| Firefighting & Prevention | 16 (18.8%) | 69 (81.2%) |
| Law Enforcement | 66 (93.0%) | 5 (7.0%) |
| Food Preparation & Serving | 27 (23.9%) | 86 (76.1%) |
| Cleaning & Maintenance | 82 (46.3%) | 95 (53.7%) |
| Personal Care & Service | 0 (0.0%) | 76 (100.0%) |
| Total (Category) | 211 (25.1%) | 630 (74.9%) |
| Total (Overall) | 2,359 (53.9%) | 2,019 (46.1%) |
Sales and Office Occupations
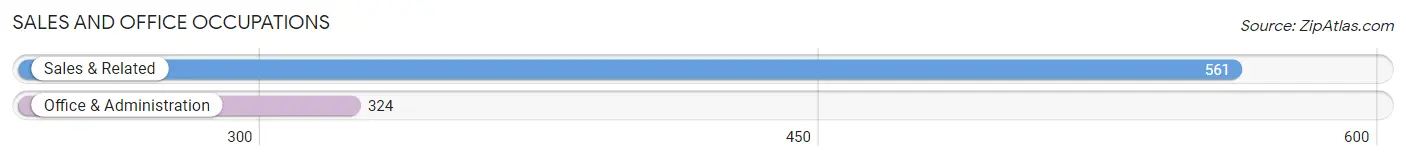
The most common Sales and Office occupations in Newton County are Sales & Related (561 | 12.8%), and Office & Administration (324 | 7.4%).
Sales and Office Occupations by Sex
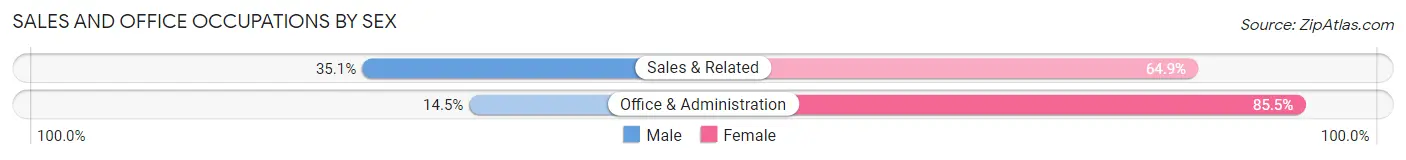
| Occupation | Male | Female |
| Sales & Related | 197 (35.1%) | 364 (64.9%) |
| Office & Administration | 47 (14.5%) | 277 (85.5%) |
| Total (Category) | 244 (27.6%) | 641 (72.4%) |
| Total (Overall) | 2,359 (53.9%) | 2,019 (46.1%) |
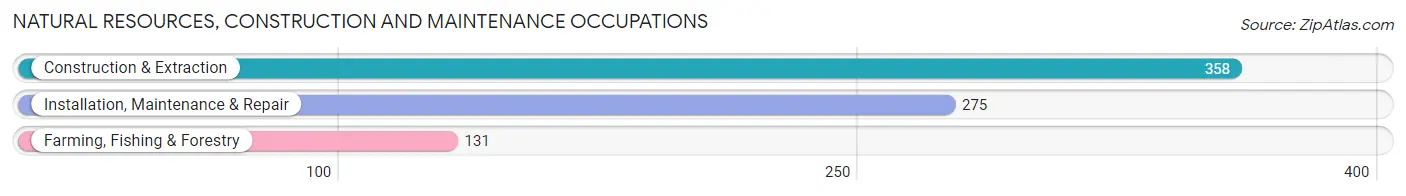
Natural Resources, Construction and Maintenance Occupations
The most common Natural Resources, Construction and Maintenance occupations in Newton County are Construction & Extraction (358 | 8.2%), Installation, Maintenance & Repair (275 | 6.3%), and Farming, Fishing & Forestry (131 | 3.0%).
Natural Resources, Construction and Maintenance Occupations by Sex
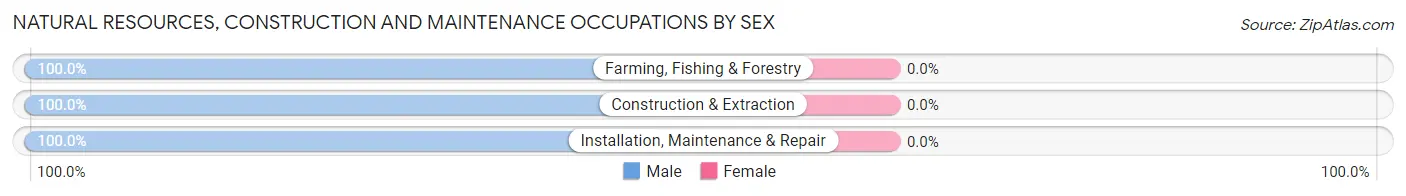
| Occupation | Male | Female |
| Farming, Fishing & Forestry | 131 (100.0%) | 0 (0.0%) |
| Construction & Extraction | 358 (100.0%) | 0 (0.0%) |
| Installation, Maintenance & Repair | 275 (100.0%) | 0 (0.0%) |
| Total (Category) | 764 (100.0%) | 0 (0.0%) |
| Total (Overall) | 2,359 (53.9%) | 2,019 (46.1%) |
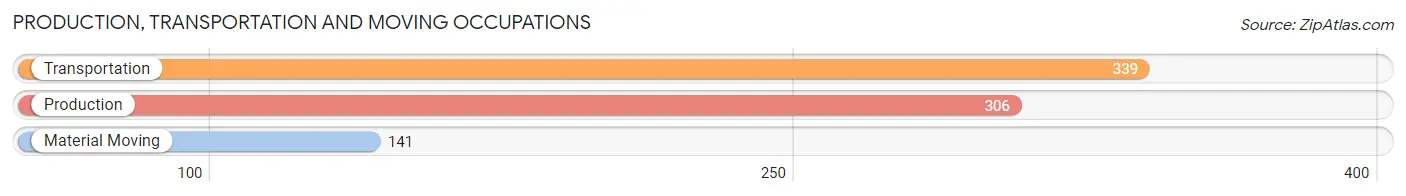
Production, Transportation and Moving Occupations
The most common Production, Transportation and Moving occupations in Newton County are Transportation (339 | 7.7%), Production (306 | 7.0%), and Material Moving (141 | 3.2%).
Production, Transportation and Moving Occupations by Sex
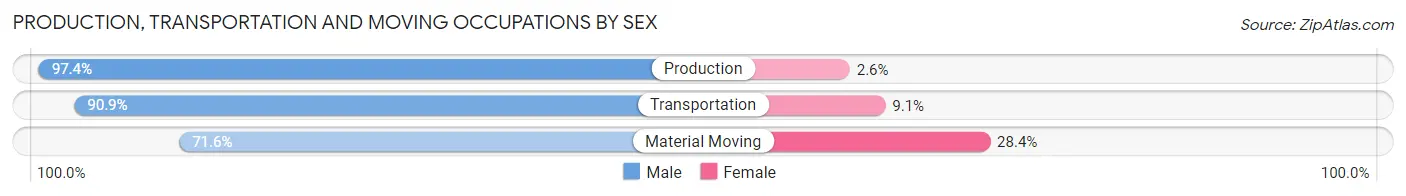
| Occupation | Male | Female |
| Production | 298 (97.4%) | 8 (2.6%) |
| Transportation | 308 (90.9%) | 31 (9.1%) |
| Material Moving | 101 (71.6%) | 40 (28.4%) |
| Total (Category) | 707 (89.9%) | 79 (10.1%) |
| Total (Overall) | 2,359 (53.9%) | 2,019 (46.1%) |
Employment Industries by Sex in Newton County
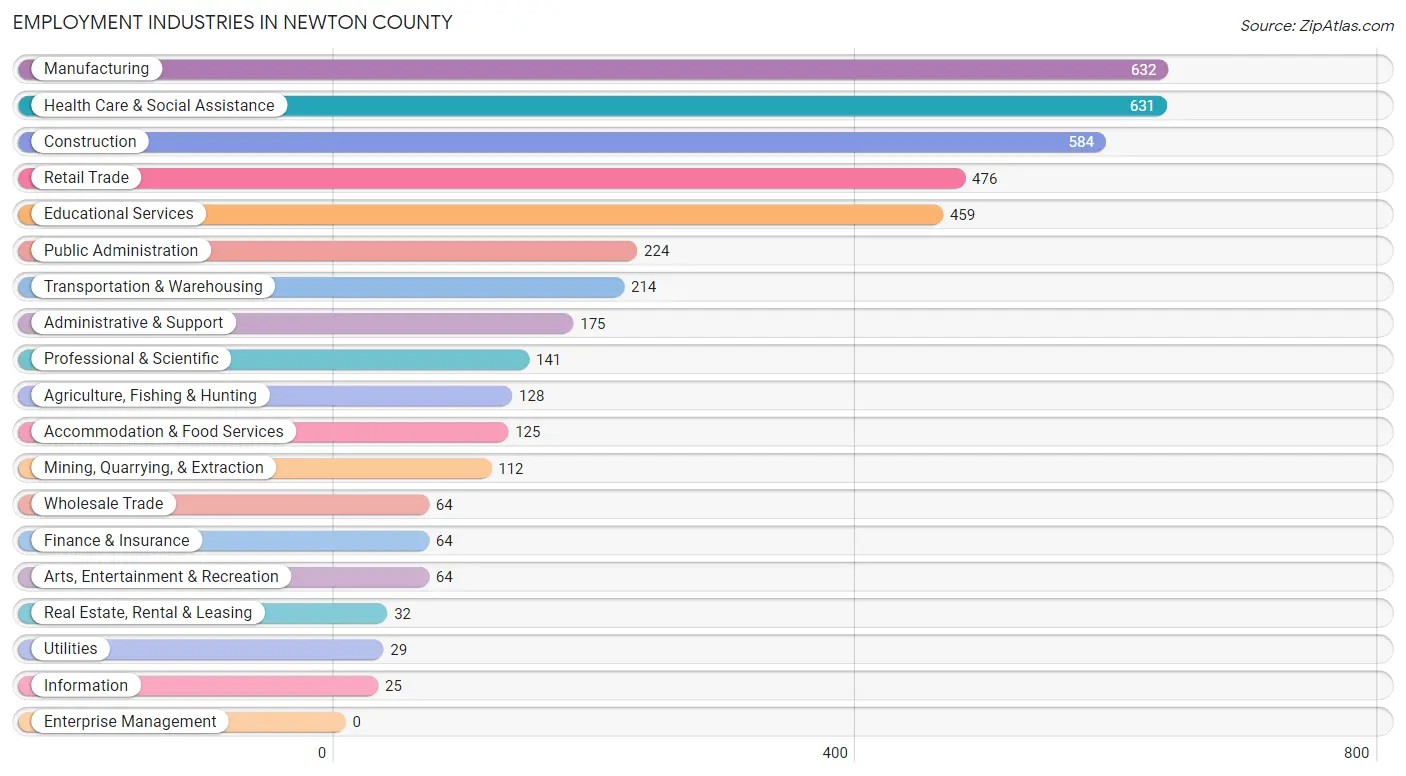
Employment Industries in Newton County
The major employment industries in Newton County include Manufacturing (632 | 14.4%), Health Care & Social Assistance (631 | 14.4%), Construction (584 | 13.3%), Retail Trade (476 | 10.9%), and Educational Services (459 | 10.5%).
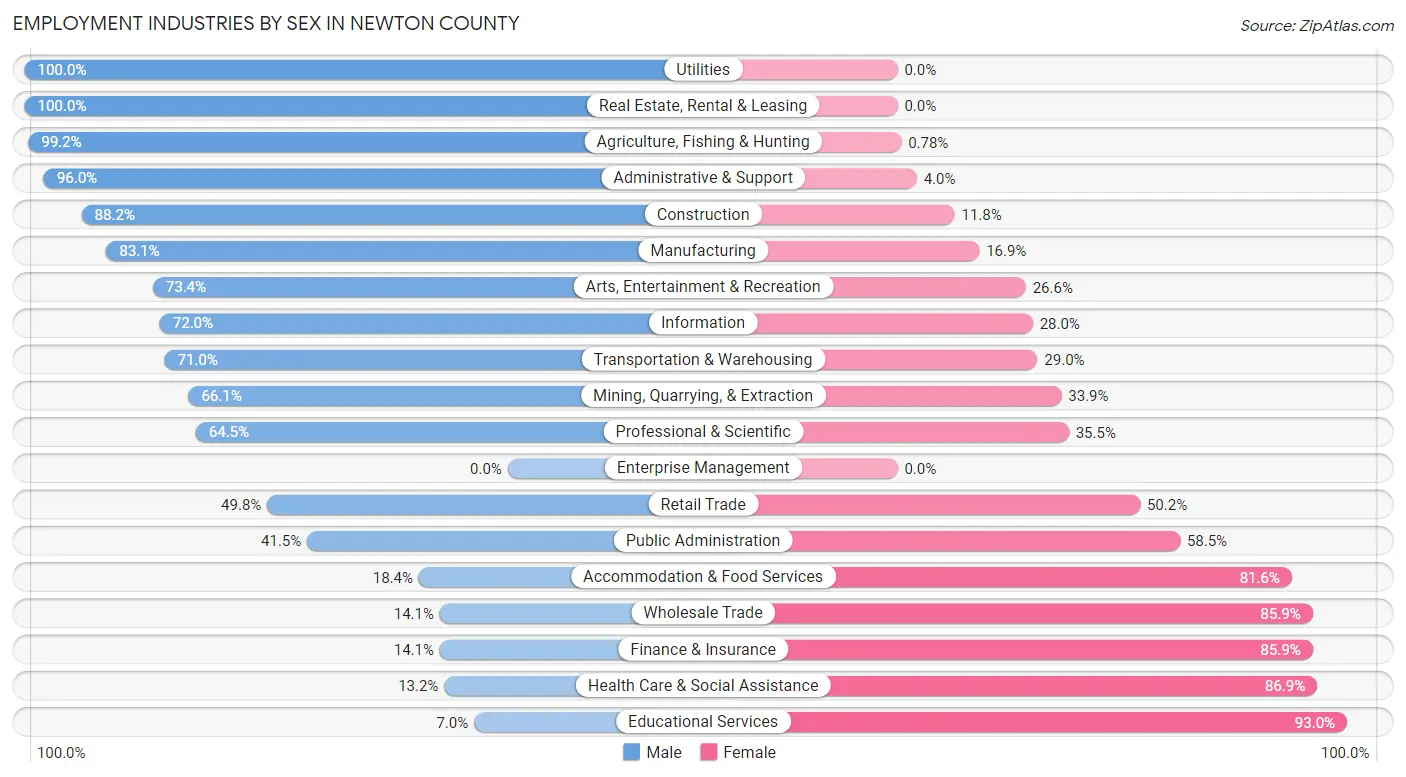
Employment Industries by Sex in Newton County
The Newton County industries that see more men than women are Utilities (100.0%), Real Estate, Rental & Leasing (100.0%), and Agriculture, Fishing & Hunting (99.2%), whereas the industries that tend to have a higher number of women are Educational Services (93.0%), Health Care & Social Assistance (86.9%), and Wholesale Trade (85.9%).
| Industry | Male | Female |
| Agriculture, Fishing & Hunting | 127 (99.2%) | 1 (0.8%) |
| Mining, Quarrying, & Extraction | 74 (66.1%) | 38 (33.9%) |
| Construction | 515 (88.2%) | 69 (11.8%) |
| Manufacturing | 525 (83.1%) | 107 (16.9%) |
| Wholesale Trade | 9 (14.1%) | 55 (85.9%) |
| Retail Trade | 237 (49.8%) | 239 (50.2%) |
| Transportation & Warehousing | 152 (71.0%) | 62 (29.0%) |
| Utilities | 29 (100.0%) | 0 (0.0%) |
| Information | 18 (72.0%) | 7 (28.0%) |
| Finance & Insurance | 9 (14.1%) | 55 (85.9%) |
| Real Estate, Rental & Leasing | 32 (100.0%) | 0 (0.0%) |
| Professional & Scientific | 91 (64.5%) | 50 (35.5%) |
| Enterprise Management | 0 (0.0%) | 0 (0.0%) |
| Administrative & Support | 168 (96.0%) | 7 (4.0%) |
| Educational Services | 32 (7.0%) | 427 (93.0%) |
| Health Care & Social Assistance | 83 (13.2%) | 548 (86.9%) |
| Arts, Entertainment & Recreation | 47 (73.4%) | 17 (26.6%) |
| Accommodation & Food Services | 23 (18.4%) | 102 (81.6%) |
| Public Administration | 93 (41.5%) | 131 (58.5%) |
| Total | 2,359 (53.9%) | 2,019 (46.1%) |
Education in Newton County
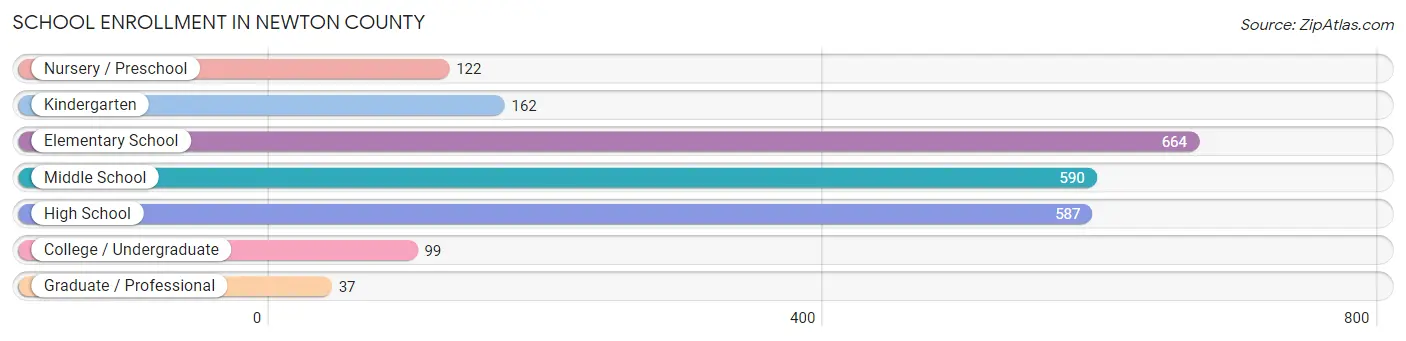
School Enrollment in Newton County
The most common levels of schooling among the 2,261 students in Newton County are elementary school (664 | 29.4%), middle school (590 | 26.1%), and high school (587 | 26.0%).
| School Level | # Students | % Students |
| Nursery / Preschool | 122 | 5.4% |
| Kindergarten | 162 | 7.2% |
| Elementary School | 664 | 29.4% |
| Middle School | 590 | 26.1% |
| High School | 587 | 26.0% |
| College / Undergraduate | 99 | 4.4% |
| Graduate / Professional | 37 | 1.6% |
| Total | 2,261 | 100.0% |
School Enrollment by Age by Funding Source in Newton County
Out of a total of 2,261 students who are enrolled in schools in Newton County, 237 (10.5%) attend a private institution, while the remaining 2,024 (89.5%) are enrolled in public schools. The age group of 20 to 24 year olds has the highest likelihood of being enrolled in private schools, with 8 (29.6% in the age bracket) enrolled. Conversely, the age group of 18 to 19 year olds has the lowest likelihood of being enrolled in a private school, with 127 (100.0% in the age bracket) attending a public institution.
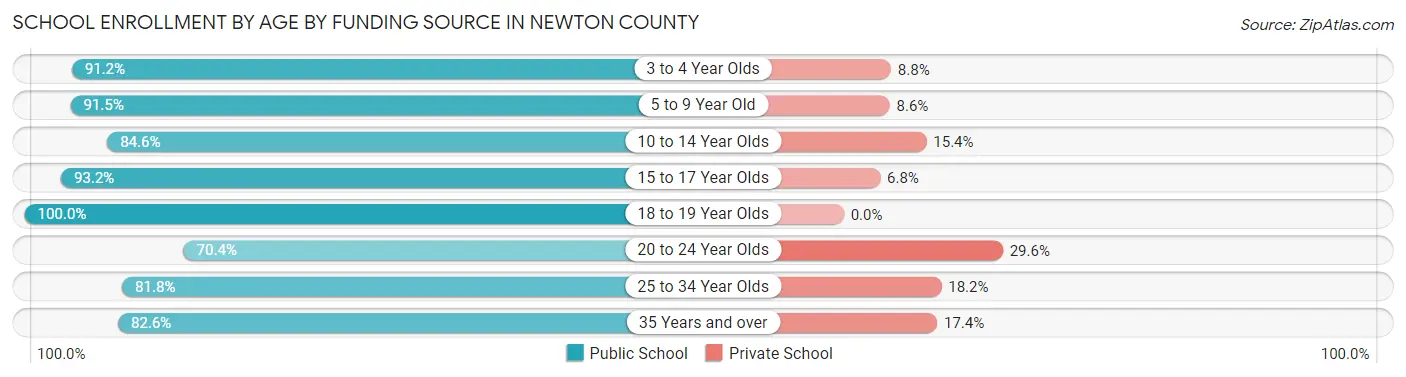
| Age Bracket | Public School | Private School |
| 3 to 4 Year Olds | 114 (91.2%) | 11 (8.8%) |
| 5 to 9 Year Old | 663 (91.4%) | 62 (8.6%) |
| 10 to 14 Year Olds | 610 (84.6%) | 111 (15.4%) |
| 15 to 17 Year Olds | 426 (93.2%) | 31 (6.8%) |
| 18 to 19 Year Olds | 127 (100.0%) | 0 (0.0%) |
| 20 to 24 Year Olds | 19 (70.4%) | 8 (29.6%) |
| 25 to 34 Year Olds | 27 (81.8%) | 6 (18.2%) |
| 35 Years and over | 38 (82.6%) | 8 (17.4%) |
| Total | 2,024 (89.5%) | 237 (10.5%) |
Educational Attainment by Field of Study in Newton County
Education (179 | 27.3%), business (128 | 19.5%), psychology (89 | 13.6%), science & technology (51 | 7.8%), and social sciences (42 | 6.4%) are the most common fields of study among 656 individuals in Newton County who have obtained a bachelor's degree or higher.
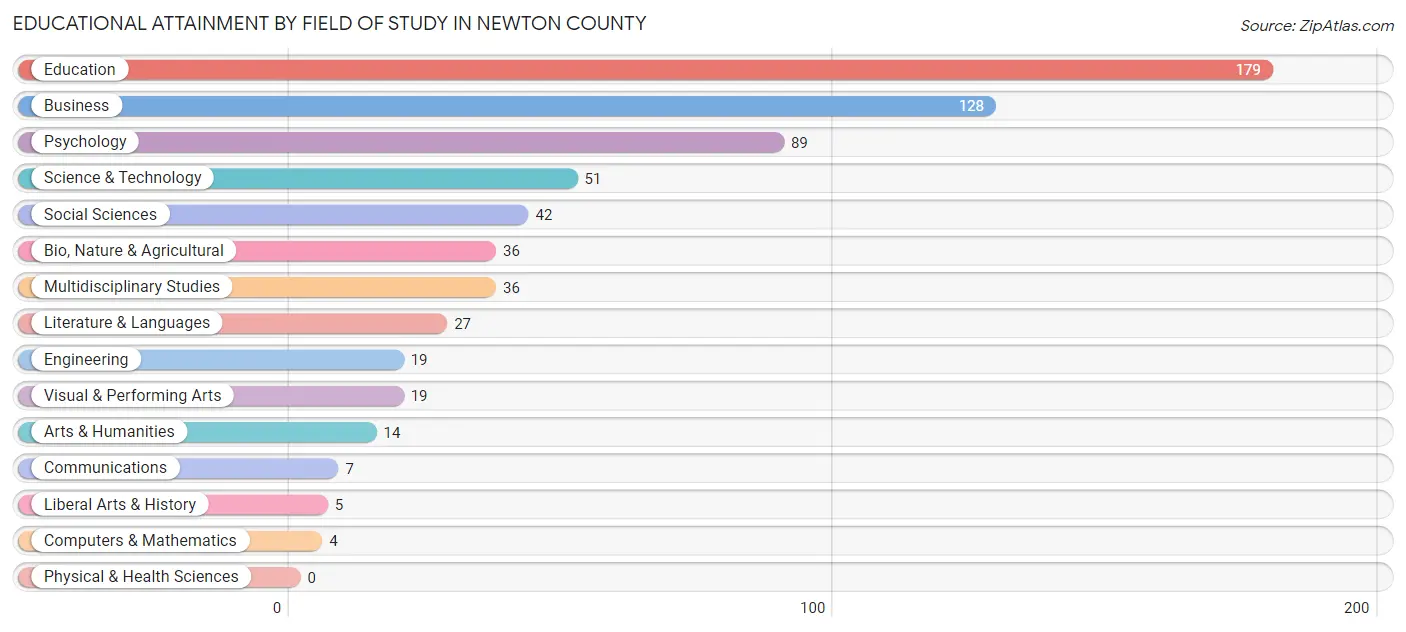
| Field of Study | # Graduates | % Graduates |
| Computers & Mathematics | 4 | 0.6% |
| Bio, Nature & Agricultural | 36 | 5.5% |
| Physical & Health Sciences | 0 | 0.0% |
| Psychology | 89 | 13.6% |
| Social Sciences | 42 | 6.4% |
| Engineering | 19 | 2.9% |
| Multidisciplinary Studies | 36 | 5.5% |
| Science & Technology | 51 | 7.8% |
| Business | 128 | 19.5% |
| Education | 179 | 27.3% |
| Literature & Languages | 27 | 4.1% |
| Liberal Arts & History | 5 | 0.8% |
| Visual & Performing Arts | 19 | 2.9% |
| Communications | 7 | 1.1% |
| Arts & Humanities | 14 | 2.1% |
| Total | 656 | 100.0% |
Transportation & Commute in Newton County
Vehicle Availability by Sex in Newton County
The most prevalent vehicle ownership categories in Newton County are males with 2 vehicles (1,072, accounting for 47.1%) and females with 2 vehicles (892, making up 55.1%).
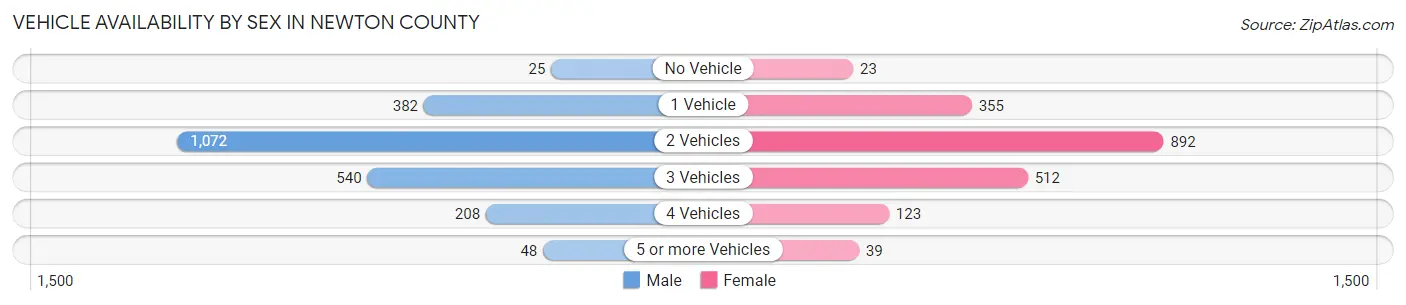
| Vehicles Available | Male | Female |
| No Vehicle | 25 (1.1%) | 23 (1.2%) |
| 1 Vehicle | 382 (16.8%) | 355 (18.3%) |
| 2 Vehicles | 1,072 (47.1%) | 892 (45.9%) |
| 3 Vehicles | 540 (23.7%) | 512 (26.3%) |
| 4 Vehicles | 208 (9.1%) | 123 (6.3%) |
| 5 or more Vehicles | 48 (2.1%) | 39 (2.0%) |
| Total | 2,275 (100.0%) | 1,944 (100.0%) |
Commute Time in Newton County
The most frequently occuring commute durations in Newton County are 30 to 34 minutes (608 commuters, 15.0%), 60 to 89 minutes (507 commuters, 12.5%), and 45 to 59 minutes (462 commuters, 11.4%).
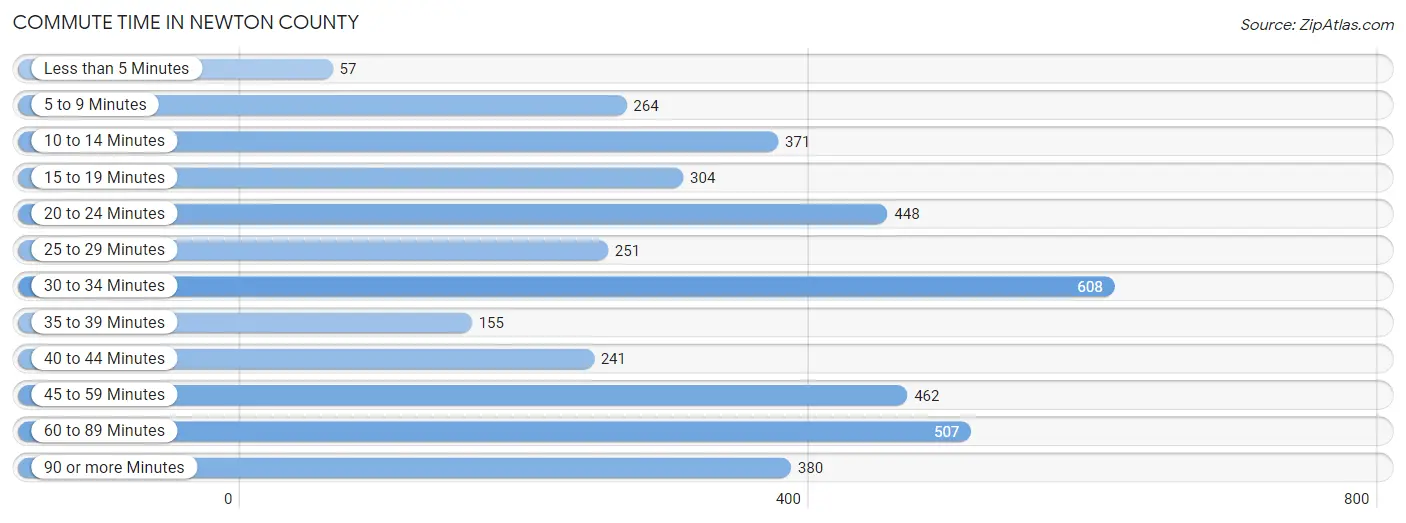
| Commute Time | # Commuters | % Commuters |
| Less than 5 Minutes | 57 | 1.4% |
| 5 to 9 Minutes | 264 | 6.5% |
| 10 to 14 Minutes | 371 | 9.2% |
| 15 to 19 Minutes | 304 | 7.5% |
| 20 to 24 Minutes | 448 | 11.1% |
| 25 to 29 Minutes | 251 | 6.2% |
| 30 to 34 Minutes | 608 | 15.0% |
| 35 to 39 Minutes | 155 | 3.8% |
| 40 to 44 Minutes | 241 | 5.9% |
| 45 to 59 Minutes | 462 | 11.4% |
| 60 to 89 Minutes | 507 | 12.5% |
| 90 or more Minutes | 380 | 9.4% |
Commute Time by Sex in Newton County
The most common commute times in Newton County are 60 to 89 minutes (361 commuters, 16.9%) for males and 20 to 24 minutes (296 commuters, 15.4%) for females.
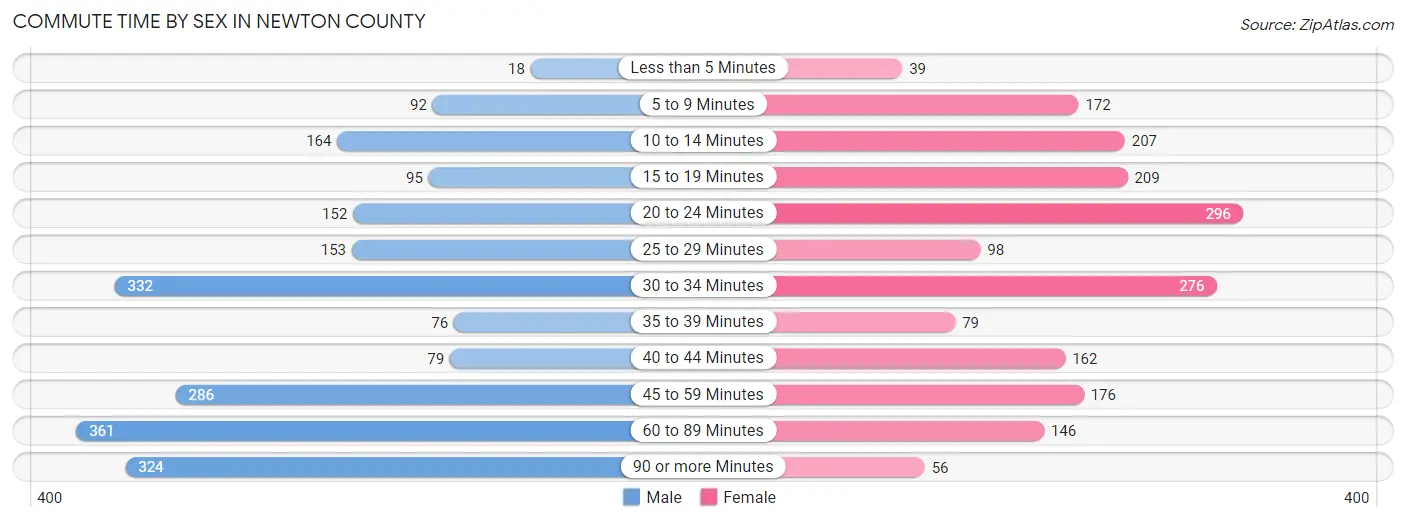
| Commute Time | Male | Female |
| Less than 5 Minutes | 18 (0.8%) | 39 (2.0%) |
| 5 to 9 Minutes | 92 (4.3%) | 172 (9.0%) |
| 10 to 14 Minutes | 164 (7.7%) | 207 (10.8%) |
| 15 to 19 Minutes | 95 (4.5%) | 209 (10.9%) |
| 20 to 24 Minutes | 152 (7.1%) | 296 (15.4%) |
| 25 to 29 Minutes | 153 (7.2%) | 98 (5.1%) |
| 30 to 34 Minutes | 332 (15.6%) | 276 (14.4%) |
| 35 to 39 Minutes | 76 (3.6%) | 79 (4.1%) |
| 40 to 44 Minutes | 79 (3.7%) | 162 (8.5%) |
| 45 to 59 Minutes | 286 (13.4%) | 176 (9.2%) |
| 60 to 89 Minutes | 361 (16.9%) | 146 (7.6%) |
| 90 or more Minutes | 324 (15.2%) | 56 (2.9%) |
Time of Departure to Work by Sex in Newton County
The most frequent times of departure to work in Newton County are 6:00 AM to 6:29 AM (517, 24.2%) for males and 7:00 AM to 7:29 AM (362, 18.9%) for females.
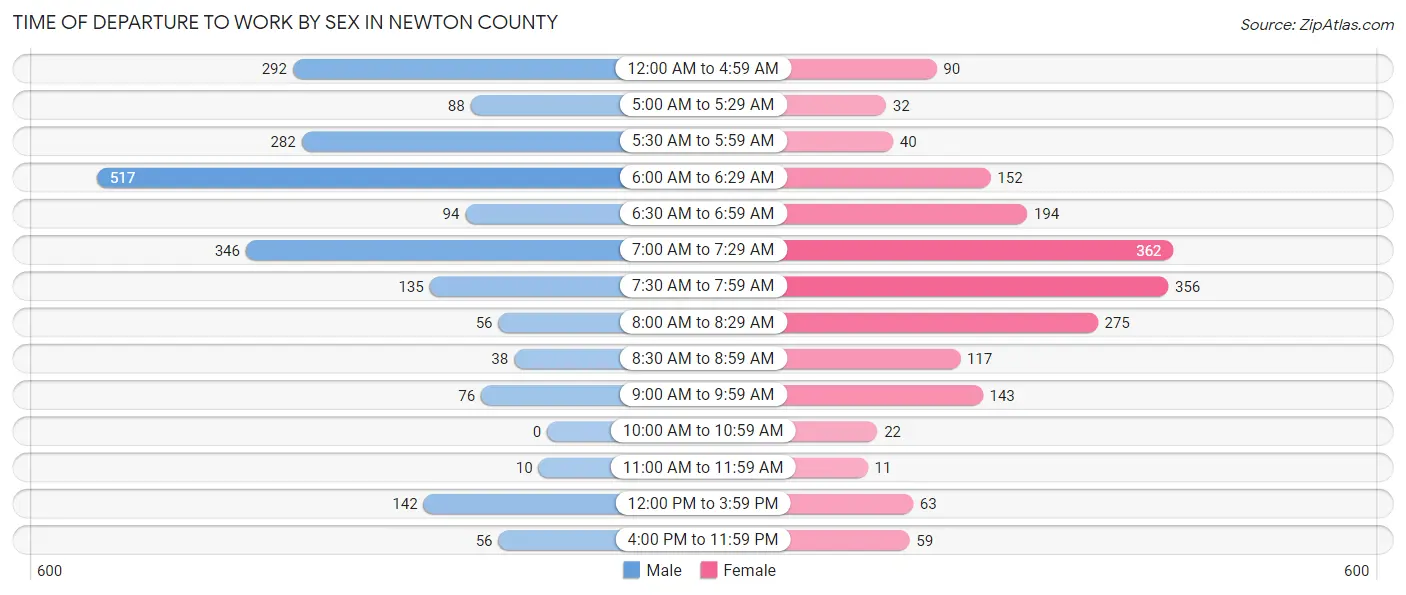
| Time of Departure | Male | Female |
| 12:00 AM to 4:59 AM | 292 (13.7%) | 90 (4.7%) |
| 5:00 AM to 5:29 AM | 88 (4.1%) | 32 (1.7%) |
| 5:30 AM to 5:59 AM | 282 (13.2%) | 40 (2.1%) |
| 6:00 AM to 6:29 AM | 517 (24.2%) | 152 (7.9%) |
| 6:30 AM to 6:59 AM | 94 (4.4%) | 194 (10.1%) |
| 7:00 AM to 7:29 AM | 346 (16.2%) | 362 (18.9%) |
| 7:30 AM to 7:59 AM | 135 (6.3%) | 356 (18.6%) |
| 8:00 AM to 8:29 AM | 56 (2.6%) | 275 (14.3%) |
| 8:30 AM to 8:59 AM | 38 (1.8%) | 117 (6.1%) |
| 9:00 AM to 9:59 AM | 76 (3.6%) | 143 (7.5%) |
| 10:00 AM to 10:59 AM | 0 (0.0%) | 22 (1.1%) |
| 11:00 AM to 11:59 AM | 10 (0.5%) | 11 (0.6%) |
| 12:00 PM to 3:59 PM | 142 (6.7%) | 63 (3.3%) |
| 4:00 PM to 11:59 PM | 56 (2.6%) | 59 (3.1%) |
| Total | 2,132 (100.0%) | 1,916 (100.0%) |
Housing Occupancy in Newton County
Occupancy by Ownership in Newton County
Of the total 4,787 dwellings in Newton County, owner-occupied units account for 3,858 (80.6%), while renter-occupied units make up 929 (19.4%).
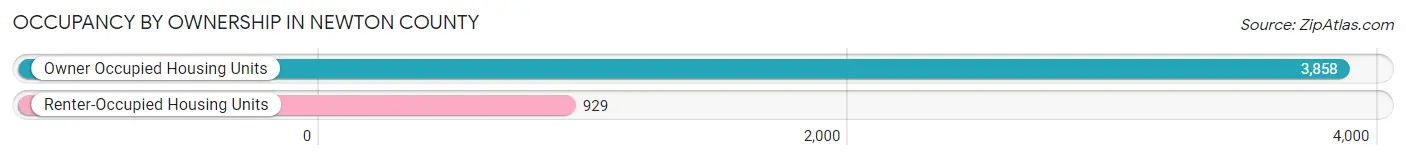
| Occupancy | # Housing Units | % Housing Units |
| Owner Occupied Housing Units | 3,858 | 80.6% |
| Renter-Occupied Housing Units | 929 | 19.4% |
| Total Occupied Housing Units | 4,787 | 100.0% |
Occupancy by Household Size in Newton County
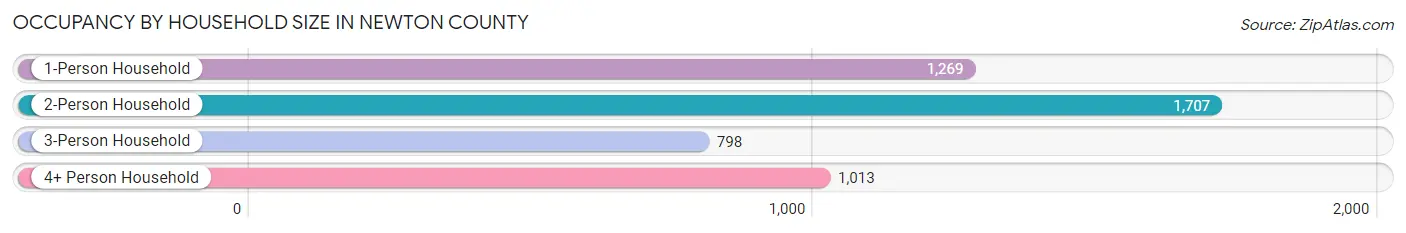
| Household Size | # Housing Units | % Housing Units |
| 1-Person Household | 1,269 | 26.5% |
| 2-Person Household | 1,707 | 35.7% |
| 3-Person Household | 798 | 16.7% |
| 4+ Person Household | 1,013 | 21.2% |
| Total Housing Units | 4,787 | 100.0% |
Occupancy by Ownership by Household Size in Newton County
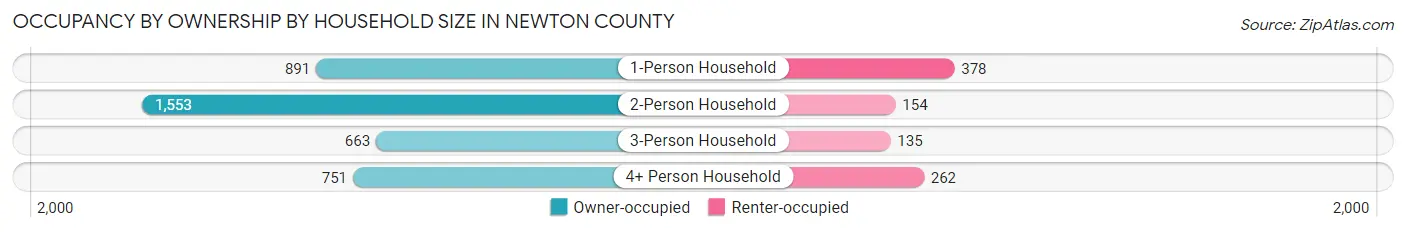
| Household Size | Owner-occupied | Renter-occupied |
| 1-Person Household | 891 (70.2%) | 378 (29.8%) |
| 2-Person Household | 1,553 (91.0%) | 154 (9.0%) |
| 3-Person Household | 663 (83.1%) | 135 (16.9%) |
| 4+ Person Household | 751 (74.1%) | 262 (25.9%) |
| Total Housing Units | 3,858 (80.6%) | 929 (19.4%) |
Occupancy by Educational Attainment in Newton County
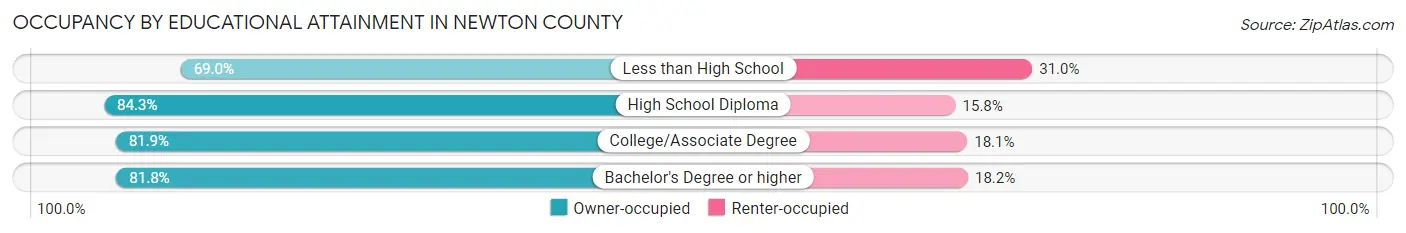
| Household Size | Owner-occupied | Renter-occupied |
| Less than High School | 602 (69.0%) | 270 (31.0%) |
| High School Diploma | 1,771 (84.3%) | 331 (15.8%) |
| College/Associate Degree | 1,247 (81.9%) | 275 (18.1%) |
| Bachelor's Degree or higher | 238 (81.8%) | 53 (18.2%) |
Occupancy by Age of Householder in Newton County
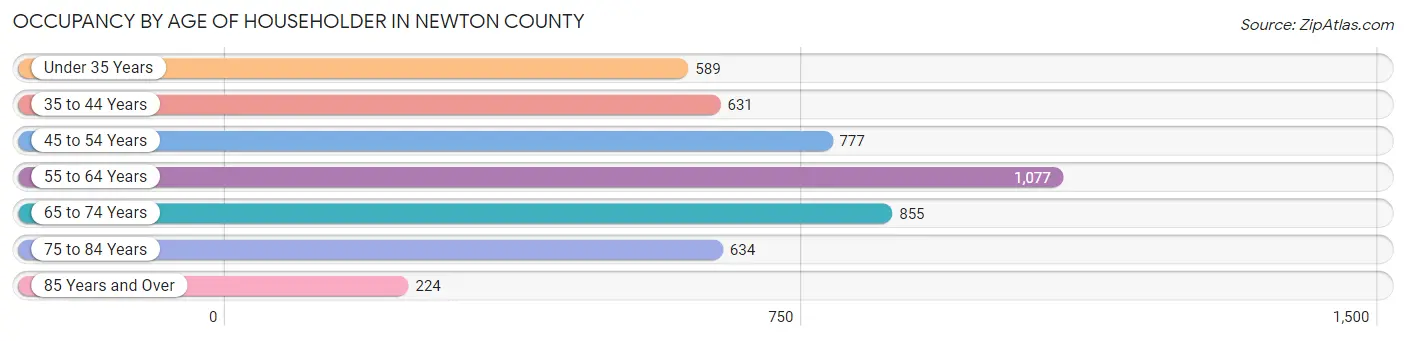
| Age Bracket | # Households | % Households |
| Under 35 Years | 589 | 12.3% |
| 35 to 44 Years | 631 | 13.2% |
| 45 to 54 Years | 777 | 16.2% |
| 55 to 64 Years | 1,077 | 22.5% |
| 65 to 74 Years | 855 | 17.9% |
| 75 to 84 Years | 634 | 13.2% |
| 85 Years and Over | 224 | 4.7% |
| Total | 4,787 | 100.0% |
Housing Finances in Newton County
Median Income by Occupancy in Newton County
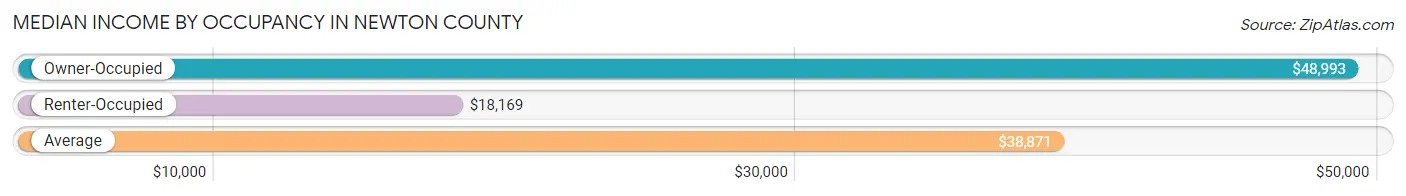
| Occupancy Type | # Households | Median Income |
| Owner-Occupied | 3,858 (80.6%) | $48,993 |
| Renter-Occupied | 929 (19.4%) | $18,169 |
| Average | 4,787 (100.0%) | $38,871 |
Occupancy by Householder Income Bracket in Newton County
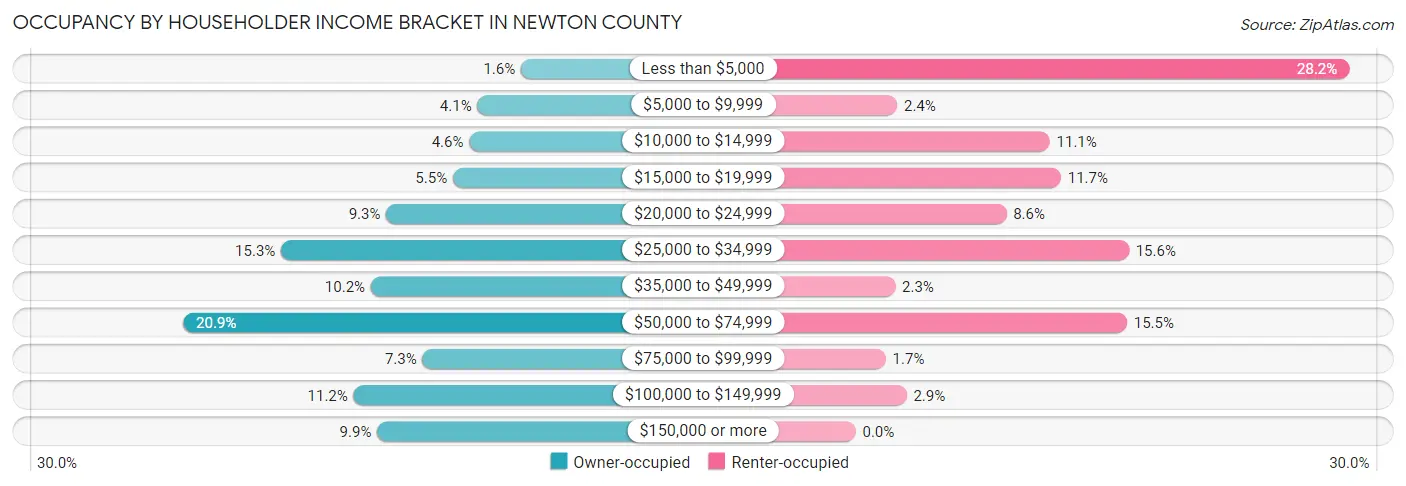
| Income Bracket | Owner-occupied | Renter-occupied |
| Less than $5,000 | 63 (1.6%) | 262 (28.2%) |
| $5,000 to $9,999 | 159 (4.1%) | 22 (2.4%) |
| $10,000 to $14,999 | 177 (4.6%) | 103 (11.1%) |
| $15,000 to $19,999 | 213 (5.5%) | 109 (11.7%) |
| $20,000 to $24,999 | 360 (9.3%) | 80 (8.6%) |
| $25,000 to $34,999 | 592 (15.3%) | 145 (15.6%) |
| $35,000 to $49,999 | 394 (10.2%) | 21 (2.3%) |
| $50,000 to $74,999 | 808 (20.9%) | 144 (15.5%) |
| $75,000 to $99,999 | 280 (7.3%) | 16 (1.7%) |
| $100,000 to $149,999 | 432 (11.2%) | 27 (2.9%) |
| $150,000 or more | 380 (9.9%) | 0 (0.0%) |
| Total | 3,858 (100.0%) | 929 (100.0%) |
Monthly Housing Cost Tiers in Newton County
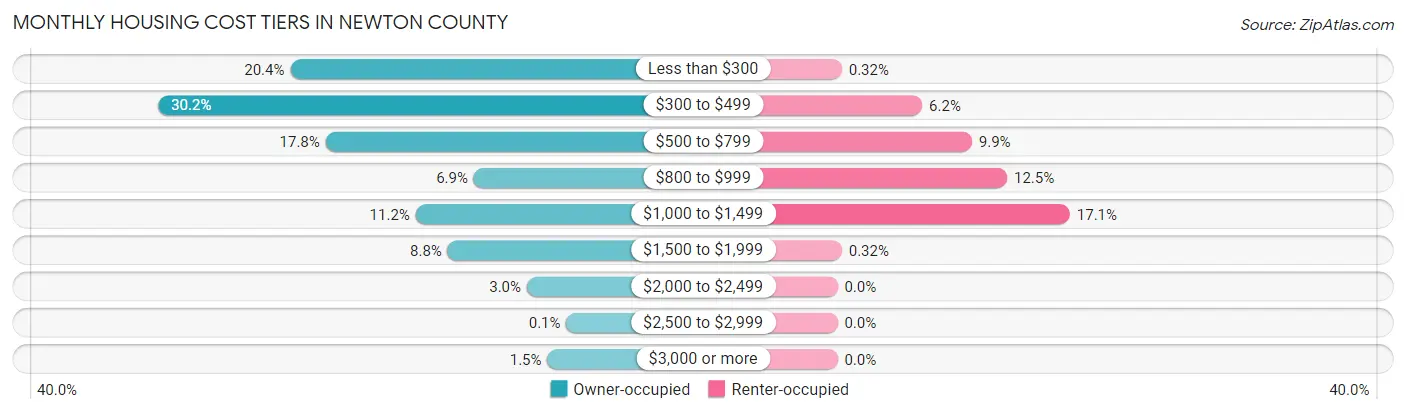
| Monthly Cost | Owner-occupied | Renter-occupied |
| Less than $300 | 788 (20.4%) | 3 (0.3%) |
| $300 to $499 | 1,164 (30.2%) | 58 (6.2%) |
| $500 to $799 | 688 (17.8%) | 92 (9.9%) |
| $800 to $999 | 267 (6.9%) | 116 (12.5%) |
| $1,000 to $1,499 | 432 (11.2%) | 159 (17.1%) |
| $1,500 to $1,999 | 341 (8.8%) | 3 (0.3%) |
| $2,000 to $2,499 | 116 (3.0%) | 0 (0.0%) |
| $2,500 to $2,999 | 4 (0.1%) | 0 (0.0%) |
| $3,000 or more | 58 (1.5%) | 0 (0.0%) |
| Total | 3,858 (100.0%) | 929 (100.0%) |
Physical Housing Characteristics in Newton County
Housing Structures in Newton County
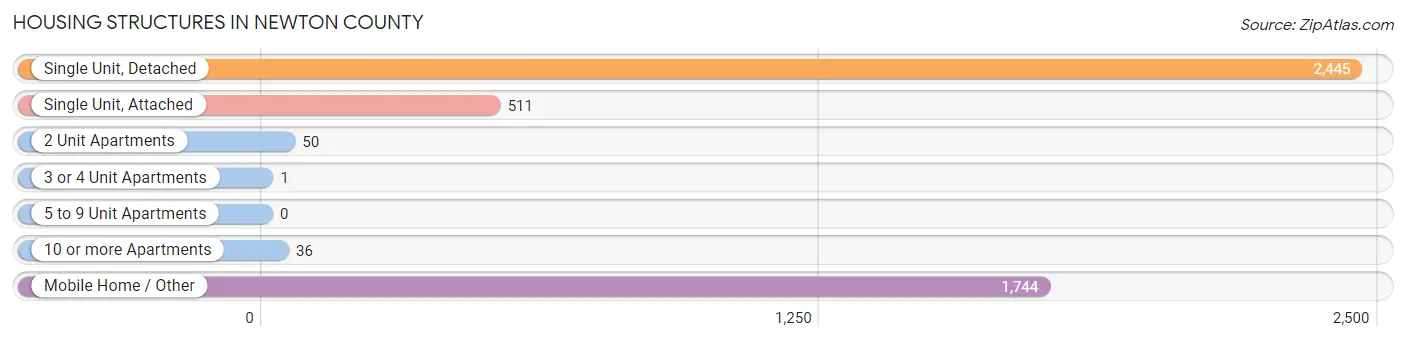
| Structure Type | # Housing Units | % Housing Units |
| Single Unit, Detached | 2,445 | 51.1% |
| Single Unit, Attached | 511 | 10.7% |
| 2 Unit Apartments | 50 | 1.0% |
| 3 or 4 Unit Apartments | 1 | 0.0% |
| 5 to 9 Unit Apartments | 0 | 0.0% |
| 10 or more Apartments | 36 | 0.7% |
| Mobile Home / Other | 1,744 | 36.4% |
| Total | 4,787 | 100.0% |
Housing Structures by Occupancy in Newton County
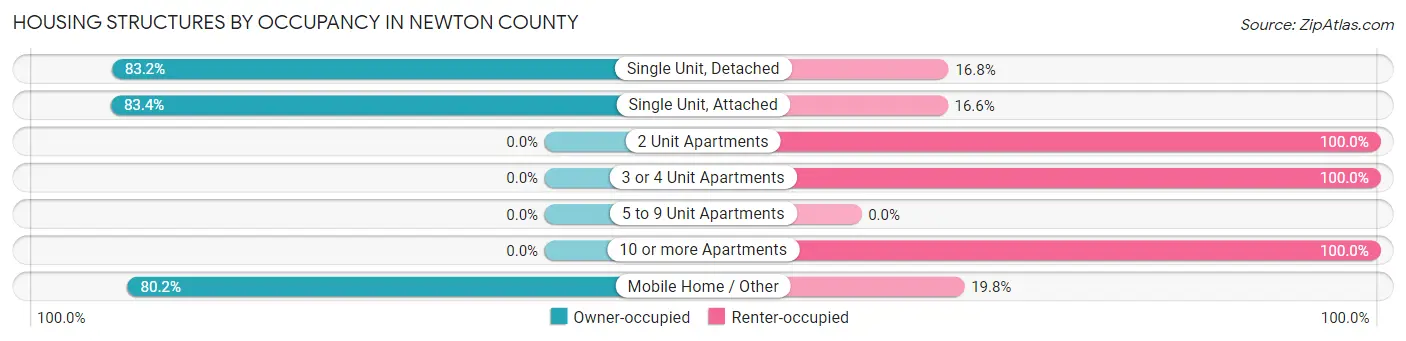
| Structure Type | Owner-occupied | Renter-occupied |
| Single Unit, Detached | 2,034 (83.2%) | 411 (16.8%) |
| Single Unit, Attached | 426 (83.4%) | 85 (16.6%) |
| 2 Unit Apartments | 0 (0.0%) | 50 (100.0%) |
| 3 or 4 Unit Apartments | 0 (0.0%) | 1 (100.0%) |
| 5 to 9 Unit Apartments | 0 (0.0%) | 0 (0.0%) |
| 10 or more Apartments | 0 (0.0%) | 36 (100.0%) |
| Mobile Home / Other | 1,398 (80.2%) | 346 (19.8%) |
| Total | 3,858 (80.6%) | 929 (19.4%) |
Housing Structures by Number of Rooms in Newton County
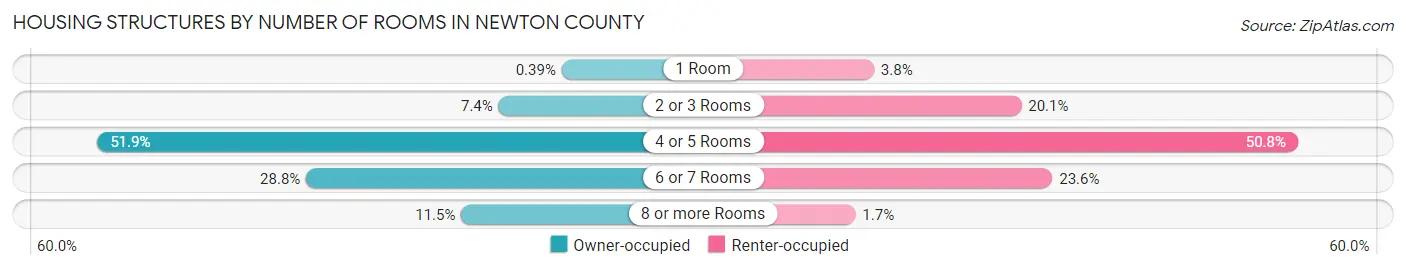
| Number of Rooms | Owner-occupied | Renter-occupied |
| 1 Room | 15 (0.4%) | 35 (3.8%) |
| 2 or 3 Rooms | 285 (7.4%) | 187 (20.1%) |
| 4 or 5 Rooms | 2,004 (51.9%) | 472 (50.8%) |
| 6 or 7 Rooms | 1,109 (28.7%) | 219 (23.6%) |
| 8 or more Rooms | 445 (11.5%) | 16 (1.7%) |
| Total | 3,858 (100.0%) | 929 (100.0%) |
Housing Structure by Heating Type in Newton County
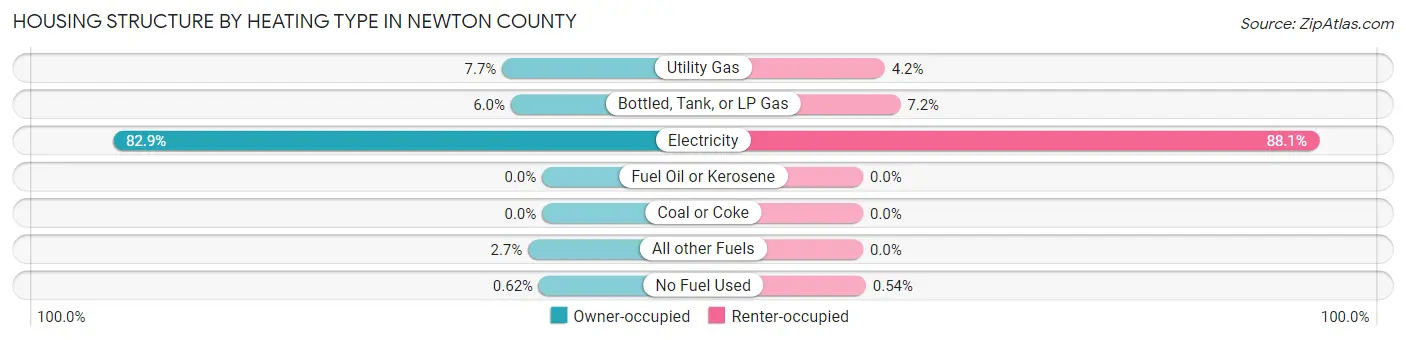
| Heating Type | Owner-occupied | Renter-occupied |
| Utility Gas | 298 (7.7%) | 39 (4.2%) |
| Bottled, Tank, or LP Gas | 233 (6.0%) | 67 (7.2%) |
| Electricity | 3,199 (82.9%) | 818 (88.0%) |
| Fuel Oil or Kerosene | 0 (0.0%) | 0 (0.0%) |
| Coal or Coke | 0 (0.0%) | 0 (0.0%) |
| All other Fuels | 104 (2.7%) | 0 (0.0%) |
| No Fuel Used | 24 (0.6%) | 5 (0.5%) |
| Total | 3,858 (100.0%) | 929 (100.0%) |
Household Vehicle Usage in Newton County
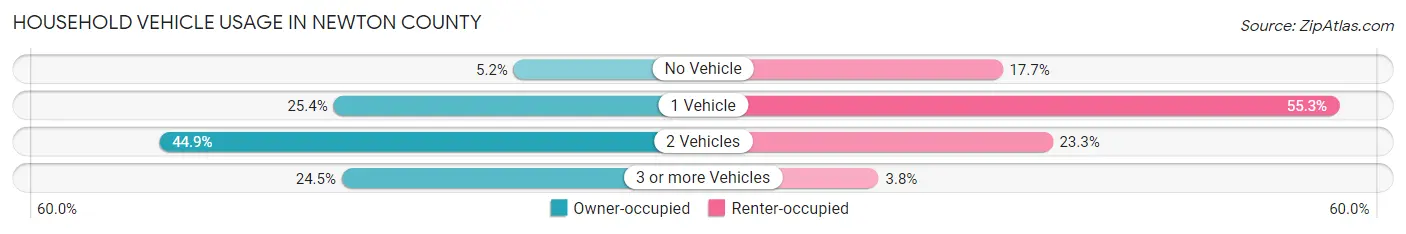
| Vehicles per Household | Owner-occupied | Renter-occupied |
| No Vehicle | 201 (5.2%) | 164 (17.6%) |
| 1 Vehicle | 980 (25.4%) | 514 (55.3%) |
| 2 Vehicles | 1,733 (44.9%) | 216 (23.3%) |
| 3 or more Vehicles | 944 (24.5%) | 35 (3.8%) |
| Total | 3,858 (100.0%) | 929 (100.0%) |
Real Estate & Mortgages in Newton County
Real Estate and Mortgage Overview in Newton County
| Characteristic | Without Mortgage | With Mortgage |
| Housing Units | 2,585 | 1,273 |
| Median Property Value | $65,600 | $141,900 |
| Median Household Income | $33,462 | $275 |
| Monthly Housing Costs | $381 | $58 |
| Real Estate Taxes | $568 | $128 |
Property Value by Mortgage Status in Newton County
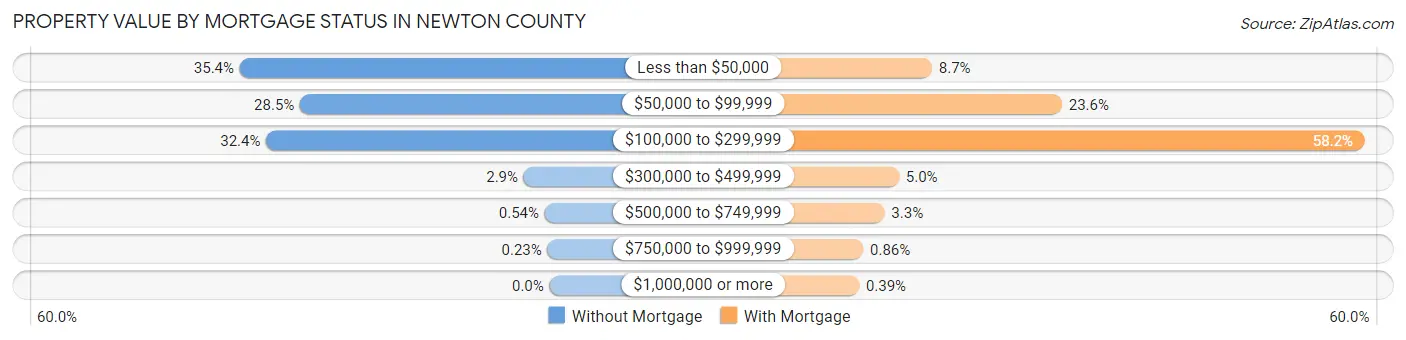
| Property Value | Without Mortgage | With Mortgage |
| Less than $50,000 | 915 (35.4%) | 111 (8.7%) |
| $50,000 to $99,999 | 737 (28.5%) | 300 (23.6%) |
| $100,000 to $299,999 | 837 (32.4%) | 741 (58.2%) |
| $300,000 to $499,999 | 76 (2.9%) | 63 (5.0%) |
| $500,000 to $749,999 | 14 (0.5%) | 42 (3.3%) |
| $750,000 to $999,999 | 6 (0.2%) | 11 (0.9%) |
| $1,000,000 or more | 0 (0.0%) | 5 (0.4%) |
| Total | 2,585 (100.0%) | 1,273 (100.0%) |
Household Income by Mortgage Status in Newton County
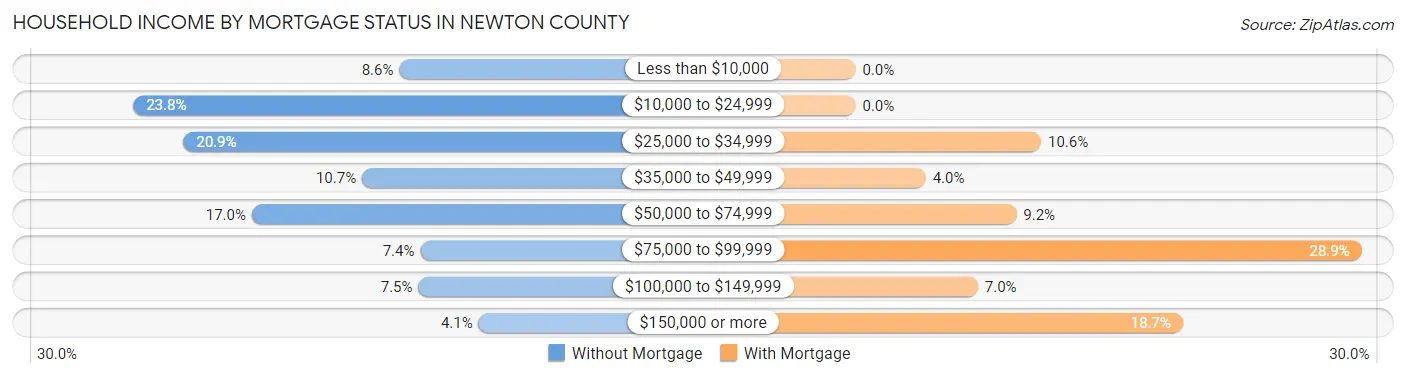
| Household Income | Without Mortgage | With Mortgage |
| Less than $10,000 | 222 (8.6%) | 0 (0.0%) |
| $10,000 to $24,999 | 615 (23.8%) | 0 (0.0%) |
| $25,000 to $34,999 | 541 (20.9%) | 135 (10.6%) |
| $35,000 to $49,999 | 277 (10.7%) | 51 (4.0%) |
| $50,000 to $74,999 | 440 (17.0%) | 117 (9.2%) |
| $75,000 to $99,999 | 191 (7.4%) | 368 (28.9%) |
| $100,000 to $149,999 | 194 (7.5%) | 89 (7.0%) |
| $150,000 or more | 105 (4.1%) | 238 (18.7%) |
| Total | 2,585 (100.0%) | 1,273 (100.0%) |
Property Value to Household Income Ratio in Newton County
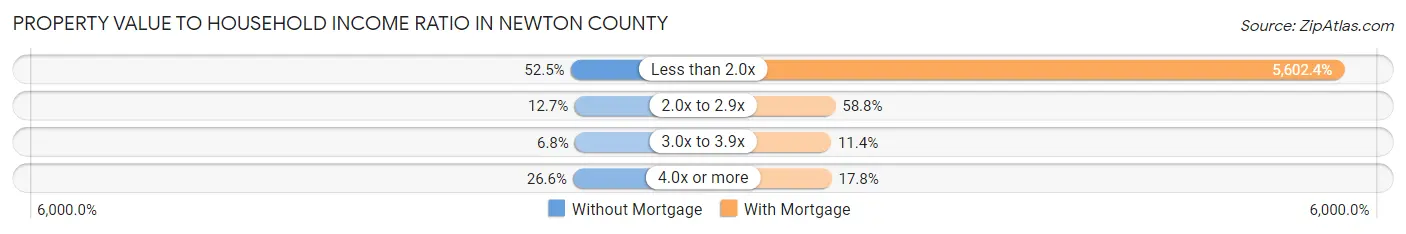
| Value-to-Income Ratio | Without Mortgage | With Mortgage |
| Less than 2.0x | 1,358 (52.5%) | 71,319 (5,602.4%) |
| 2.0x to 2.9x | 327 (12.7%) | 749 (58.8%) |
| 3.0x to 3.9x | 176 (6.8%) | 145 (11.4%) |
| 4.0x or more | 687 (26.6%) | 227 (17.8%) |
| Total | 2,585 (100.0%) | 1,273 (100.0%) |
Real Estate Taxes by Mortgage Status in Newton County
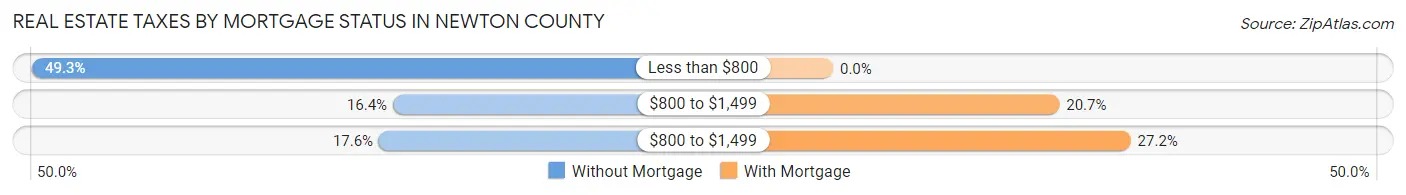
| Property Taxes | Without Mortgage | With Mortgage |
| Less than $800 | 1,275 (49.3%) | 0 (0.0%) |
| $800 to $1,499 | 423 (16.4%) | 263 (20.7%) |
| $800 to $1,499 | 456 (17.6%) | 346 (27.2%) |
| Total | 2,585 (100.0%) | 1,273 (100.0%) |
Health & Disability in Newton County
Health Insurance Coverage by Age in Newton County
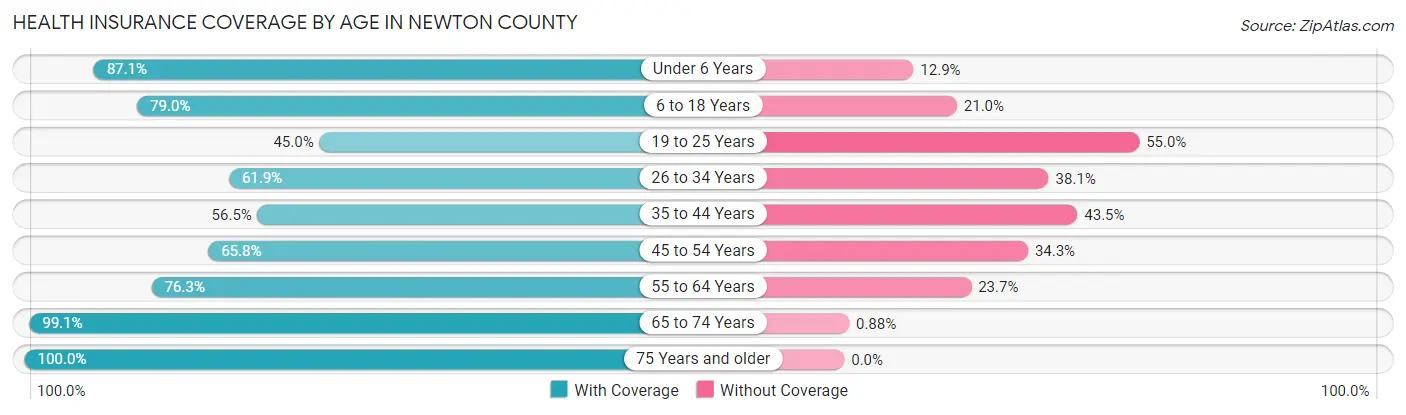
| Age Bracket | With Coverage | Without Coverage |
| Under 6 Years | 588 (87.1%) | 87 (12.9%) |
| 6 to 18 Years | 1,739 (79.0%) | 462 (21.0%) |
| 19 to 25 Years | 401 (45.0%) | 490 (55.0%) |
| 26 to 34 Years | 630 (61.9%) | 388 (38.1%) |
| 35 to 44 Years | 687 (56.5%) | 528 (43.5%) |
| 45 to 54 Years | 1,052 (65.7%) | 548 (34.3%) |
| 55 to 64 Years | 1,451 (76.3%) | 450 (23.7%) |
| 65 to 74 Years | 1,459 (99.1%) | 13 (0.9%) |
| 75 Years and older | 1,208 (100.0%) | 0 (0.0%) |
| Total | 9,215 (75.6%) | 2,966 (24.3%) |
Health Insurance Coverage by Citizenship Status in Newton County
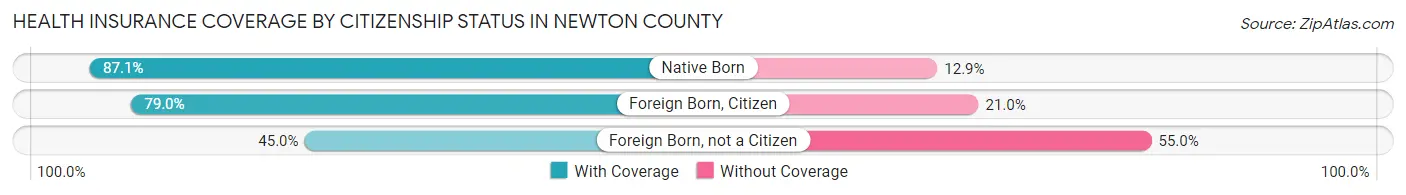
| Citizenship Status | With Coverage | Without Coverage |
| Native Born | 588 (87.1%) | 87 (12.9%) |
| Foreign Born, Citizen | 1,739 (79.0%) | 462 (21.0%) |
| Foreign Born, not a Citizen | 401 (45.0%) | 490 (55.0%) |
Health Insurance Coverage by Household Income in Newton County
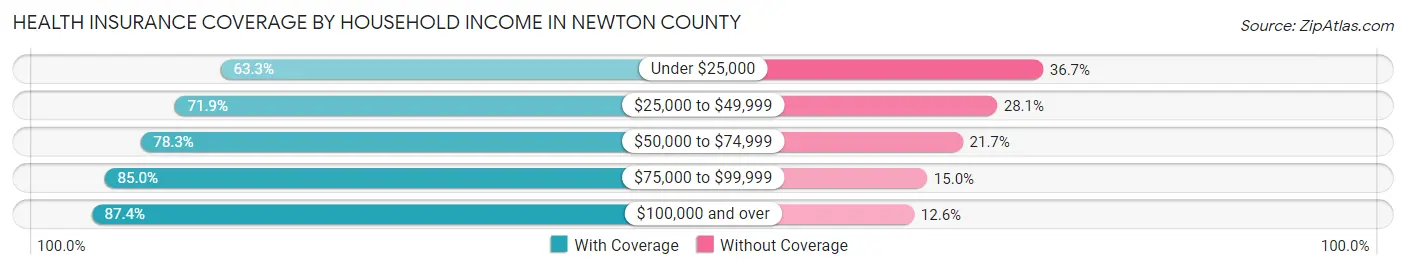
| Household Income | With Coverage | Without Coverage |
| Under $25,000 | 1,957 (63.3%) | 1,136 (36.7%) |
| $25,000 to $49,999 | 2,002 (71.9%) | 783 (28.1%) |
| $50,000 to $74,999 | 1,948 (78.3%) | 540 (21.7%) |
| $75,000 to $99,999 | 866 (85.0%) | 153 (15.0%) |
| $100,000 and over | 2,435 (87.4%) | 350 (12.6%) |
Public vs Private Health Insurance Coverage by Age in Newton County
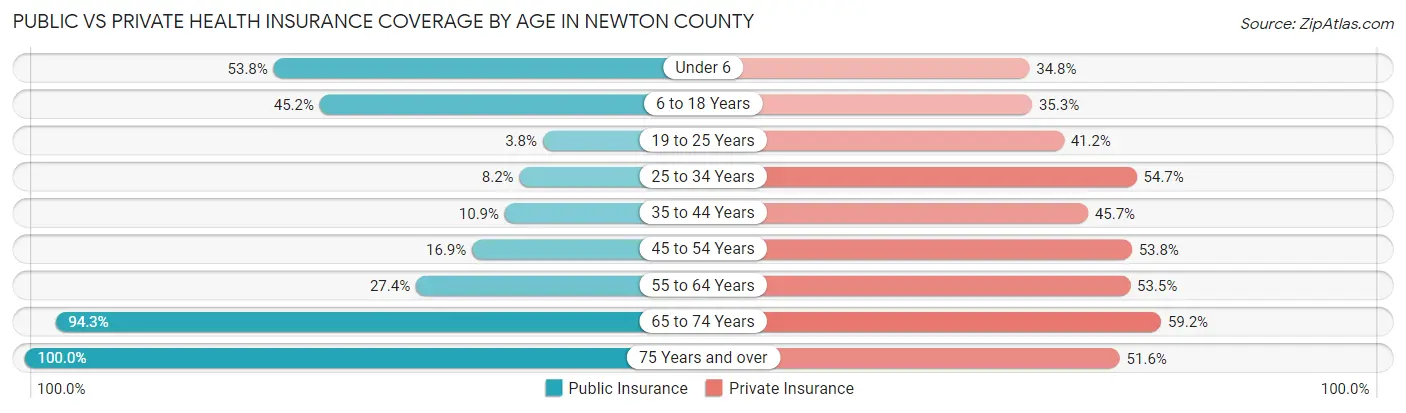
| Age Bracket | Public Insurance | Private Insurance |
| Under 6 | 363 (53.8%) | 235 (34.8%) |
| 6 to 18 Years | 995 (45.2%) | 777 (35.3%) |
| 19 to 25 Years | 34 (3.8%) | 367 (41.2%) |
| 25 to 34 Years | 83 (8.2%) | 557 (54.7%) |
| 35 to 44 Years | 132 (10.9%) | 555 (45.7%) |
| 45 to 54 Years | 271 (16.9%) | 861 (53.8%) |
| 55 to 64 Years | 520 (27.4%) | 1,017 (53.5%) |
| 65 to 74 Years | 1,388 (94.3%) | 872 (59.2%) |
| 75 Years and over | 1,208 (100.0%) | 623 (51.6%) |
| Total | 4,994 (41.0%) | 5,864 (48.1%) |
Disability Status by Sex by Age in Newton County
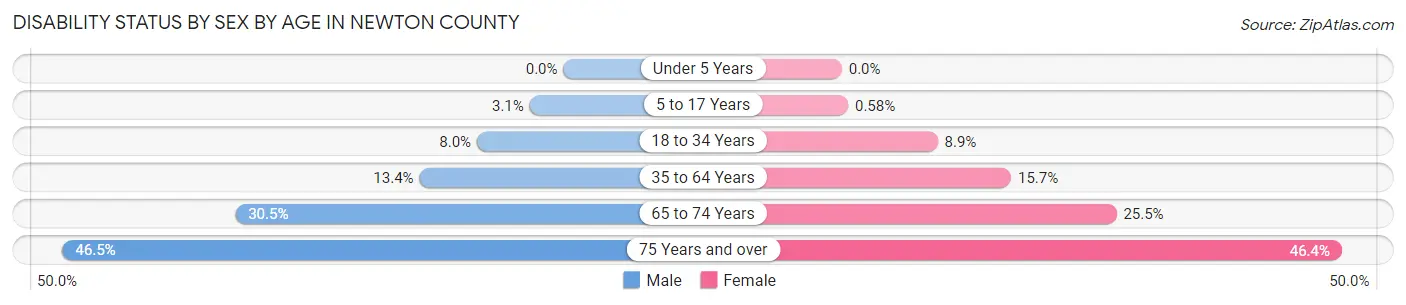
| Age Bracket | Male | Female |
| Under 5 Years | 0 (0.0%) | 0 (0.0%) |
| 5 to 17 Years | 33 (3.1%) | 6 (0.6%) |
| 18 to 34 Years | 84 (8.0%) | 96 (8.9%) |
| 35 to 64 Years | 313 (13.4%) | 373 (15.7%) |
| 65 to 74 Years | 232 (30.4%) | 181 (25.5%) |
| 75 Years and over | 258 (46.5%) | 303 (46.4%) |
Disability Class by Sex by Age in Newton County
Disability Class: Hearing Difficulty
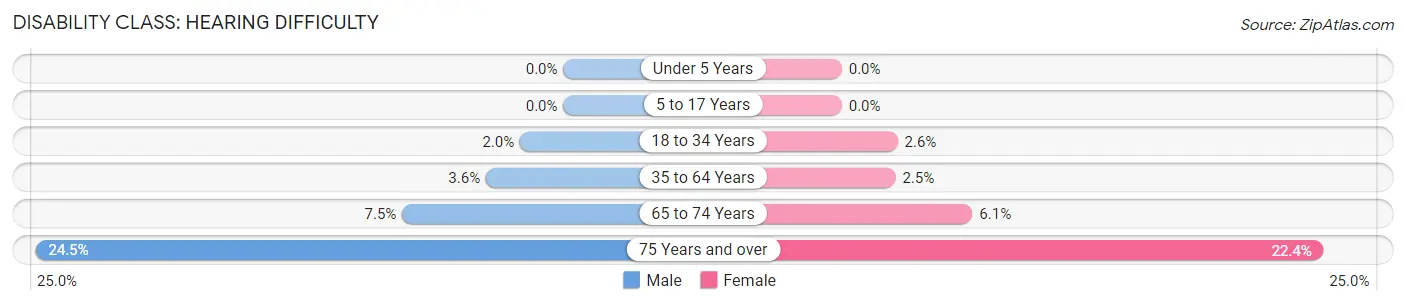
| Age Bracket | Male | Female |
| Under 5 Years | 0 (0.0%) | 0 (0.0%) |
| 5 to 17 Years | 0 (0.0%) | 0 (0.0%) |
| 18 to 34 Years | 21 (2.0%) | 28 (2.6%) |
| 35 to 64 Years | 84 (3.6%) | 59 (2.5%) |
| 65 to 74 Years | 57 (7.5%) | 43 (6.1%) |
| 75 Years and over | 136 (24.5%) | 146 (22.4%) |
Disability Class: Vision Difficulty
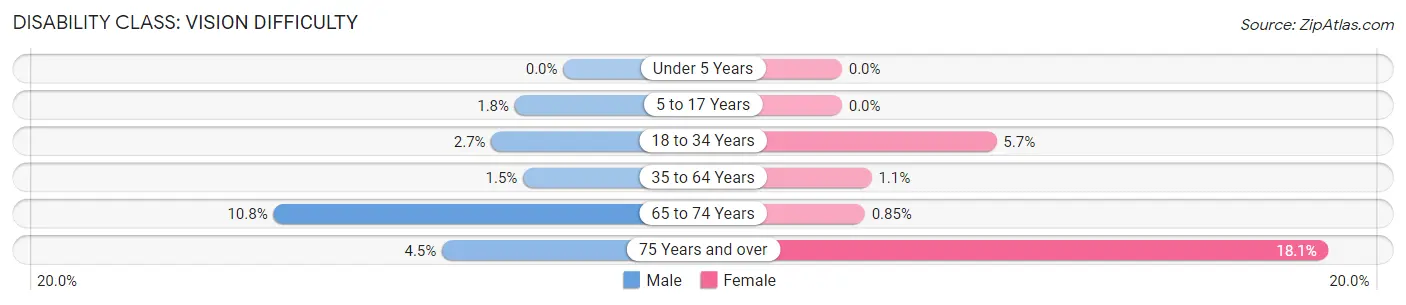
| Age Bracket | Male | Female |
| Under 5 Years | 0 (0.0%) | 0 (0.0%) |
| 5 to 17 Years | 19 (1.8%) | 0 (0.0%) |
| 18 to 34 Years | 28 (2.7%) | 62 (5.7%) |
| 35 to 64 Years | 35 (1.5%) | 26 (1.1%) |
| 65 to 74 Years | 82 (10.8%) | 6 (0.9%) |
| 75 Years and over | 25 (4.5%) | 118 (18.1%) |
Disability Class: Cognitive Difficulty
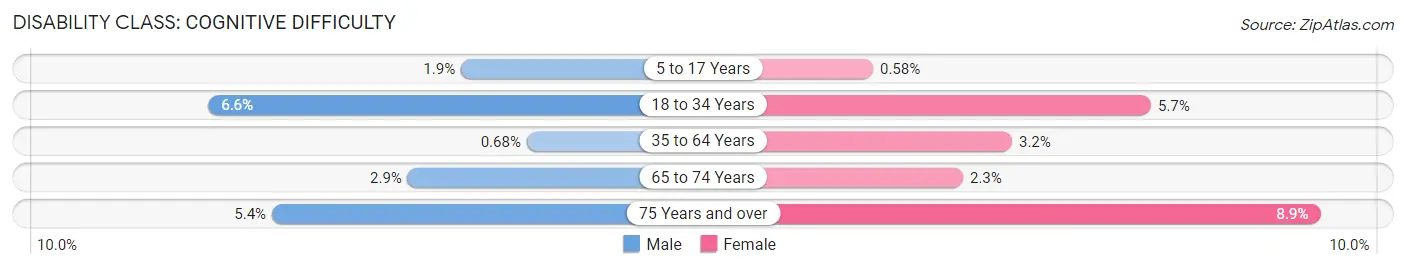
| Age Bracket | Male | Female |
| 5 to 17 Years | 20 (1.9%) | 6 (0.6%) |
| 18 to 34 Years | 69 (6.6%) | 62 (5.7%) |
| 35 to 64 Years | 16 (0.7%) | 75 (3.2%) |
| 65 to 74 Years | 22 (2.9%) | 16 (2.2%) |
| 75 Years and over | 30 (5.4%) | 58 (8.9%) |
Disability Class: Ambulatory Difficulty
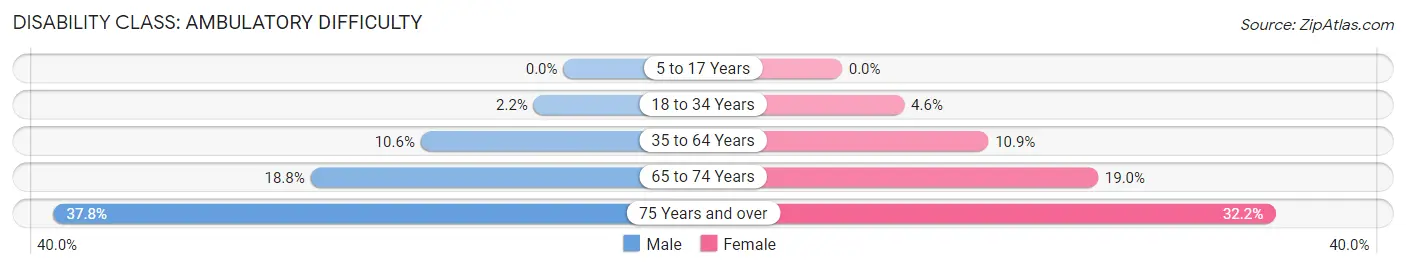
| Age Bracket | Male | Female |
| 5 to 17 Years | 0 (0.0%) | 0 (0.0%) |
| 18 to 34 Years | 23 (2.2%) | 50 (4.6%) |
| 35 to 64 Years | 248 (10.6%) | 258 (10.9%) |
| 65 to 74 Years | 143 (18.8%) | 135 (19.0%) |
| 75 Years and over | 210 (37.8%) | 210 (32.2%) |
Disability Class: Self-Care Difficulty
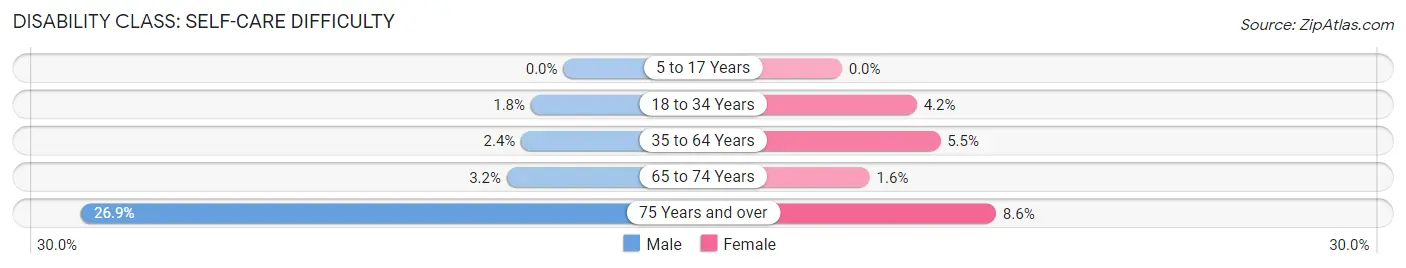
| Age Bracket | Male | Female |
| 5 to 17 Years | 0 (0.0%) | 0 (0.0%) |
| 18 to 34 Years | 19 (1.8%) | 45 (4.2%) |
| 35 to 64 Years | 55 (2.4%) | 130 (5.5%) |
| 65 to 74 Years | 24 (3.2%) | 11 (1.5%) |
| 75 Years and over | 149 (26.9%) | 56 (8.6%) |
Technology Access in Newton County
Computing Device Access in Newton County
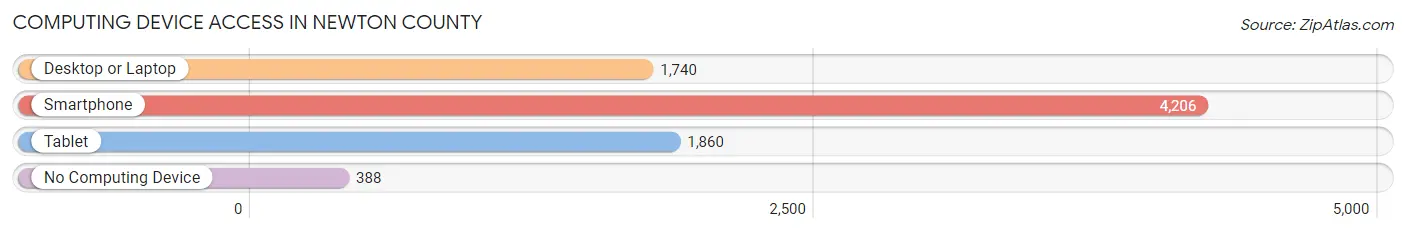
| Device Type | # Households | % Households |
| Desktop or Laptop | 1,740 | 36.3% |
| Smartphone | 4,206 | 87.9% |
| Tablet | 1,860 | 38.9% |
| No Computing Device | 388 | 8.1% |
| Total | 4,787 | 100.0% |
Internet Access in Newton County
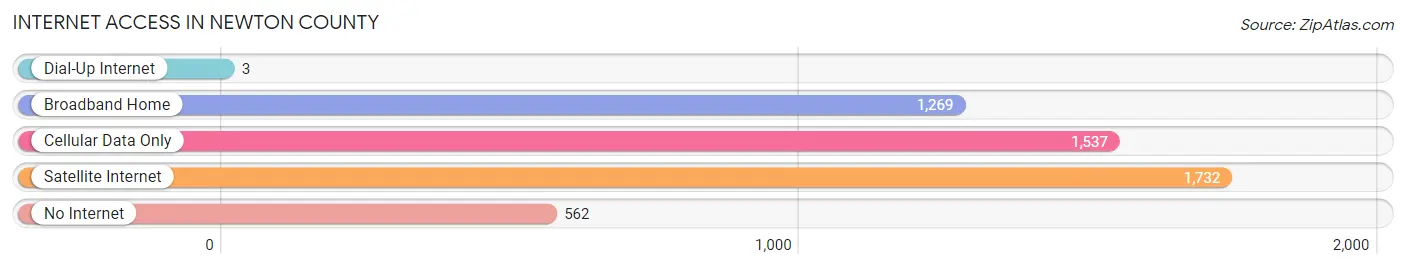
| Internet Type | # Households | % Households |
| Dial-Up Internet | 3 | 0.1% |
| Broadband Home | 1,269 | 26.5% |
| Cellular Data Only | 1,537 | 32.1% |
| Satellite Internet | 1,732 | 36.2% |
| No Internet | 562 | 11.7% |
| Total | 4,787 | 100.0% |
Newton County Summary
Newton County is located in the eastern part of Texas, and is part of the Beaumont-Port Arthur metropolitan area. It is bordered by Jasper County to the north, Tyler County to the east, Hardin County to the south, and Orange County to the west. The county seat is Newton, and the county has a total area of 590 square miles.
History
Newton County was established in 1846, and was named after John Newton, a veteran of the American Revolutionary War. The county was originally part of Jasper County, but was later divided into its own county. The first settlers in the area were mostly from the southern states, and the county was largely agricultural.
In the late 19th century, the lumber industry began to take off in the county, and the town of Burkeville was established as a major lumber center. The lumber industry continued to be a major part of the county’s economy until the mid-20th century.
In the early 20th century, oil was discovered in the county, and the town of Newton became a major oil center. The oil industry continued to be a major part of the county’s economy until the late 20th century.
Geography
Newton County is located in the eastern part of Texas, and is part of the Beaumont-Port Arthur metropolitan area. It is bordered by Jasper County to the north, Tyler County to the east, Hardin County to the south, and Orange County to the west. The county has a total area of 590 square miles, and is mostly flat with some rolling hills. The Sabine River forms the northern border of the county, and the Neches River forms the western border.
The climate of Newton County is humid subtropical, with hot summers and mild winters. The average annual temperature is around 70 degrees Fahrenheit, and the average annual precipitation is around 45 inches.
Economy
The economy of Newton County is largely based on agriculture and oil. The county is home to several large farms, and the main crops grown in the area are cotton, corn, soybeans, and hay. The county is also home to several oil and gas companies, and oil and gas production is a major part of the county’s economy.
In addition to agriculture and oil, the county is also home to several manufacturing companies, including a paper mill and a furniture factory. The county is also home to several retail stores, restaurants, and other businesses.
Demographics
As of the 2010 census, the population of Newton County was 14,445. The population is largely white (83.3%), with small percentages of African American (11.2%), Hispanic (3.3%), and other races (2.2%). The median household income in the county is $37,945, and the median age is 41.
The largest city in the county is Newton, with a population of 2,845. Other cities in the county include Burkeville, with a population of 1,093, and Wiergate, with a population of 845.
Conclusion
Newton County is located in the eastern part of Texas, and is part of the Beaumont-Port Arthur metropolitan area. The county has a total area of 590 square miles, and is mostly flat with some rolling hills. The economy of Newton County is largely based on agriculture and oil, and the population is largely white. The county is home to several large farms, oil and gas companies, and manufacturing companies, and is also home to several retail stores, restaurants, and other businesses.
Common Questions
What is Per Capita Income in Newton County?
Per Capita income in Newton County is $23,995.
What is the Median Family Income in Newton County?
Median Family Income in Newton County is $55,313.
What is the Median Household income in Newton County?
Median Household Income in Newton County is $38,871.
What is Income or Wage Gap in Newton County?
Income or Wage Gap in Newton County is 54.3%.
Women in Newton County earn 45.7 cents for every dollar earned by a man.
What is Family Income Deficit in Newton County?
Family Income Deficit in Newton County is $12,249.
Families that are below poverty line in Newton County earn $12,249 less on average than the poverty threshold level.
What is Inequality or Gini Index in Newton County?
Inequality or Gini Index in Newton County is 0.49.
What is the Total Population of Newton County?
Total Population of Newton County is 12,333.
What is the Total Male Population of Newton County?
Total Male Population of Newton County is 6,175.
What is the Total Female Population of Newton County?
Total Female Population of Newton County is 6,158.
What is the Ratio of Males per 100 Females in Newton County?
There are 100.28 Males per 100 Females in Newton County.
What is the Ratio of Females per 100 Males in Newton County?
There are 99.72 Females per 100 Males in Newton County.
What is the Median Population Age in Newton County?
Median Population Age in Newton County is 45.5 Years.
What is the Average Family Size in Newton County
Average Family Size in Newton County is 3.1 People.
What is the Average Household Size in Newton County
Average Household Size in Newton County is 2.5 People.
How Large is the Labor Force in Newton County?
There are 4,901 People in the Labor Forcein in Newton County.
What is the Percentage of People in the Labor Force in Newton County?
49.1% of People are in the Labor Force in Newton County.
What is the Unemployment Rate in Newton County?
Unemployment Rate in Newton County is 10.6%.