Navarro County, TX Map & Demographics
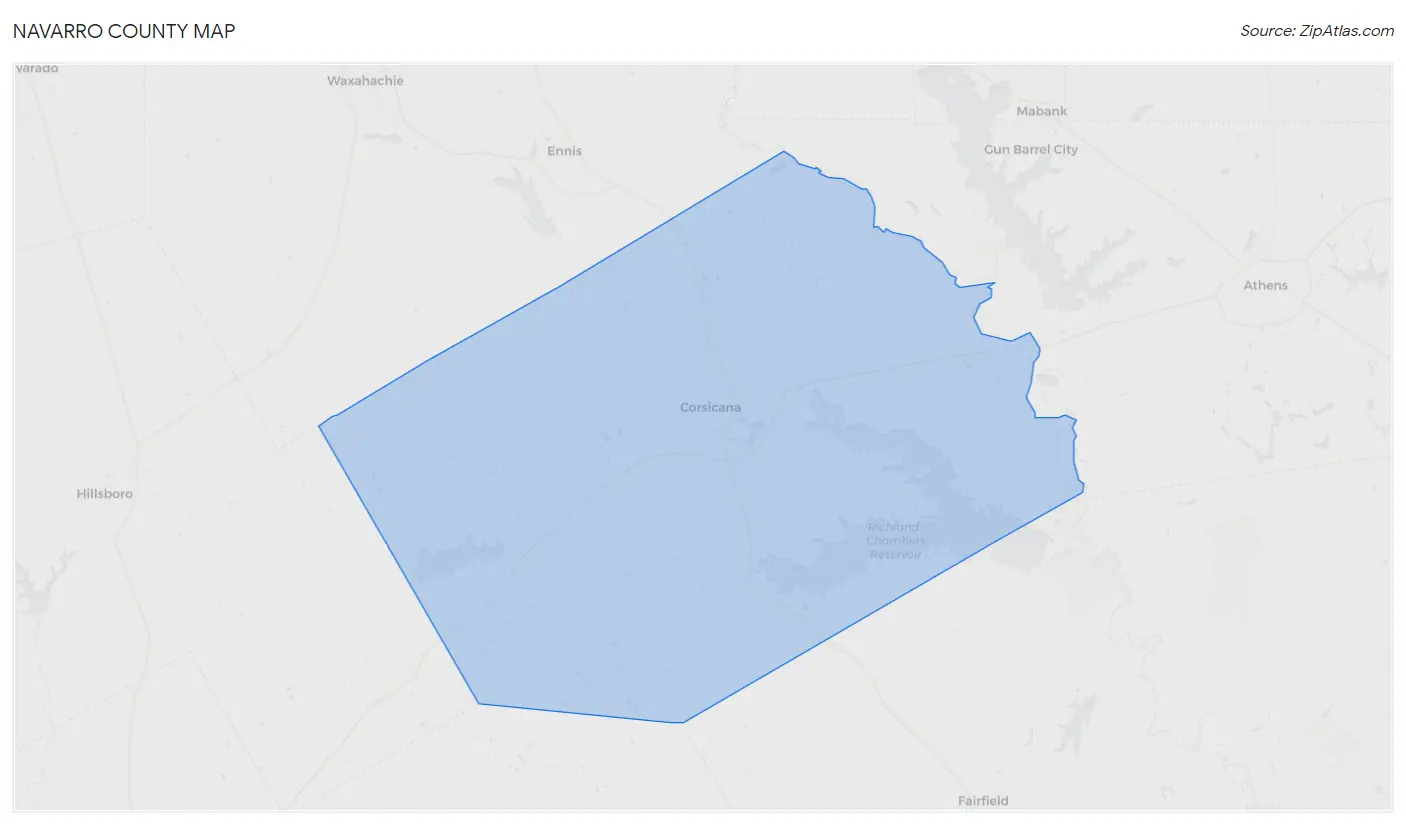
Navarro County Map
Navarro County Overview
$26,910
PER CAPITA INCOME
$71,098
AVG FAMILY INCOME
$56,261
AVG HOUSEHOLD INCOME
26.8%
WAGE / INCOME GAP [ % ]
73.2¢/ $1
WAGE / INCOME GAP [ $ ]
$10,114
FAMILY INCOME DEFICIT
0.46
INEQUALITY / GINI INDEX
52,834
TOTAL POPULATION
26,564
MALE POPULATION
26,270
FEMALE POPULATION
101.12
MALES / 100 FEMALES
98.89
FEMALES / 100 MALES
37.5
MEDIAN AGE
3.5
AVG FAMILY SIZE
2.9
AVG HOUSEHOLD SIZE
24,277
LABOR FORCE [ PEOPLE ]
59.4%
PERCENT IN LABOR FORCE
5.6%
UNEMPLOYMENT RATE
Income in Navarro County
Income Overview in Navarro County
Per Capita Income in Navarro County is $26,910, while median incomes of families and households are $71,098 and $56,261 respectively.
| Characteristic | Number | Measure |
| Per Capita Income | 52,834 | $26,910 |
| Median Family Income | 12,879 | $71,098 |
| Mean Family Income | 12,879 | $89,600 |
| Median Household Income | 18,058 | $56,261 |
| Mean Household Income | 18,058 | $76,660 |
| Income Deficit | 12,879 | $10,114 |
| Wage / Income Gap (%) | 52,834 | 26.80% |
| Wage / Income Gap ($) | 52,834 | 73.20¢ per $1 |
| Gini / Inequality Index | 52,834 | 0.46 |
Earnings by Sex in Navarro County
Average Earnings in Navarro County are $31,667, $36,715 for men and $26,876 for women, a difference of 26.8%.
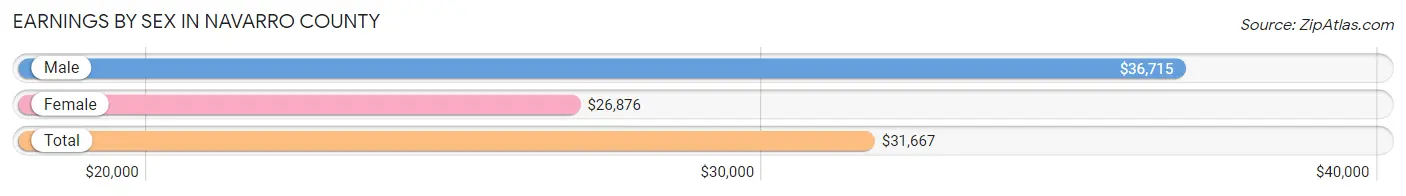
| Sex | Number | Average Earnings |
| Male | 13,843 (55.4%) | $36,715 |
| Female | 11,135 (44.6%) | $26,876 |
| Total | 24,978 (100.0%) | $31,667 |
Earnings by Sex by Income Bracket in Navarro County
The most common earnings brackets in Navarro County are $100,000+ for men (1,331 | 9.6%) and $25,000 to $29,999 for women (1,004 | 9.0%).
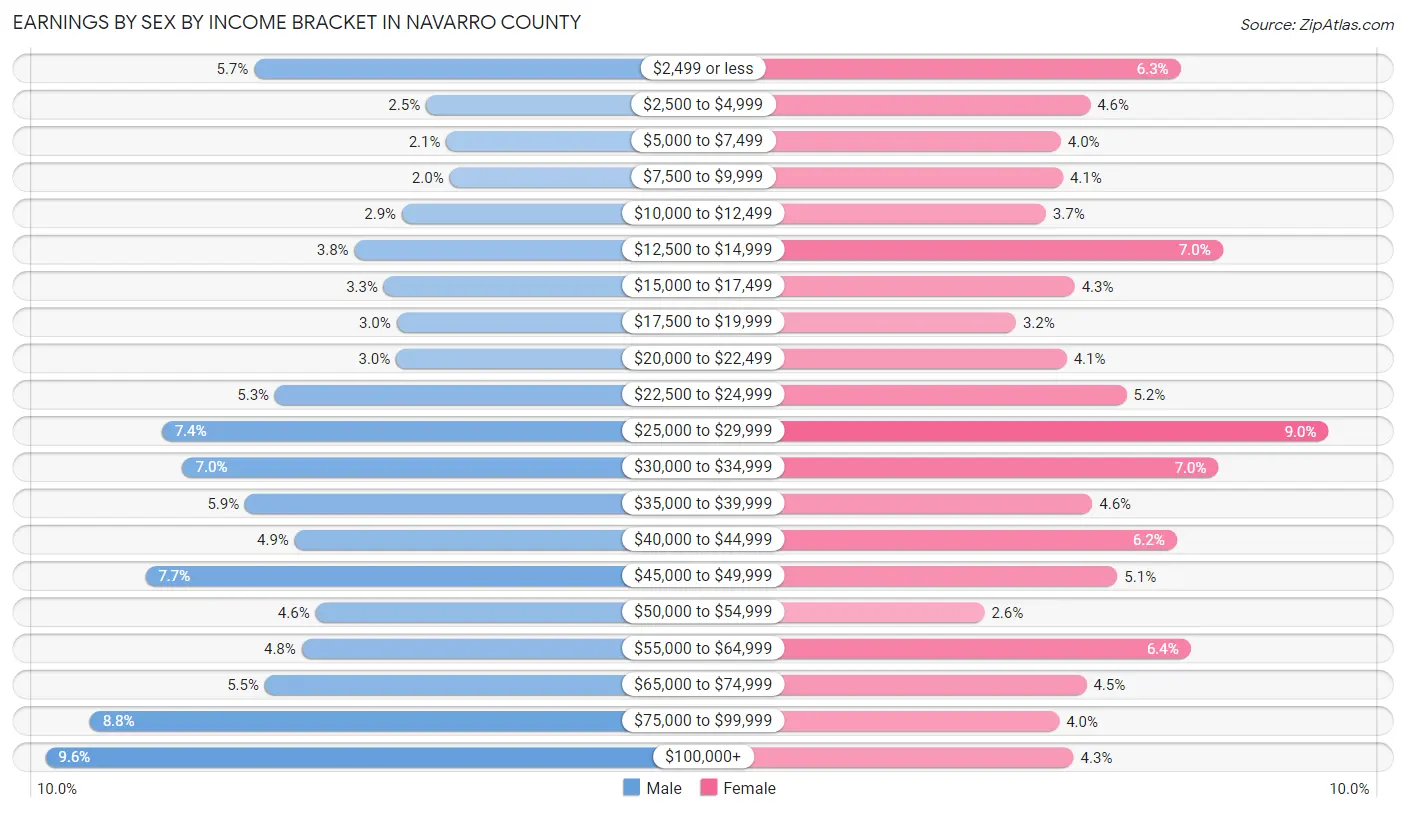
| Income | Male | Female |
| $2,499 or less | 789 (5.7%) | 696 (6.2%) |
| $2,500 to $4,999 | 343 (2.5%) | 508 (4.6%) |
| $5,000 to $7,499 | 291 (2.1%) | 446 (4.0%) |
| $7,500 to $9,999 | 282 (2.0%) | 451 (4.1%) |
| $10,000 to $12,499 | 405 (2.9%) | 415 (3.7%) |
| $12,500 to $14,999 | 529 (3.8%) | 784 (7.0%) |
| $15,000 to $17,499 | 453 (3.3%) | 476 (4.3%) |
| $17,500 to $19,999 | 419 (3.0%) | 353 (3.2%) |
| $20,000 to $22,499 | 421 (3.0%) | 459 (4.1%) |
| $22,500 to $24,999 | 735 (5.3%) | 584 (5.2%) |
| $25,000 to $29,999 | 1,028 (7.4%) | 1,004 (9.0%) |
| $30,000 to $34,999 | 974 (7.0%) | 775 (7.0%) |
| $35,000 to $39,999 | 813 (5.9%) | 512 (4.6%) |
| $40,000 to $44,999 | 684 (4.9%) | 688 (6.2%) |
| $45,000 to $49,999 | 1,072 (7.7%) | 564 (5.1%) |
| $50,000 to $54,999 | 630 (4.5%) | 287 (2.6%) |
| $55,000 to $64,999 | 666 (4.8%) | 717 (6.4%) |
| $65,000 to $74,999 | 762 (5.5%) | 500 (4.5%) |
| $75,000 to $99,999 | 1,216 (8.8%) | 443 (4.0%) |
| $100,000+ | 1,331 (9.6%) | 473 (4.3%) |
| Total | 13,843 (100.0%) | 11,135 (100.0%) |
Earnings by Sex by Educational Attainment in Navarro County
Average earnings in Navarro County are $42,360 for men and $30,519 for women, a difference of 28.0%. Men with an educational attainment of graduate degree enjoy the highest average annual earnings of $123,250, while those with high school diploma education earn the least with $37,823. Women with an educational attainment of graduate degree earn the most with the average annual earnings of $68,231, while those with less than high school education have the smallest earnings of $23,361.
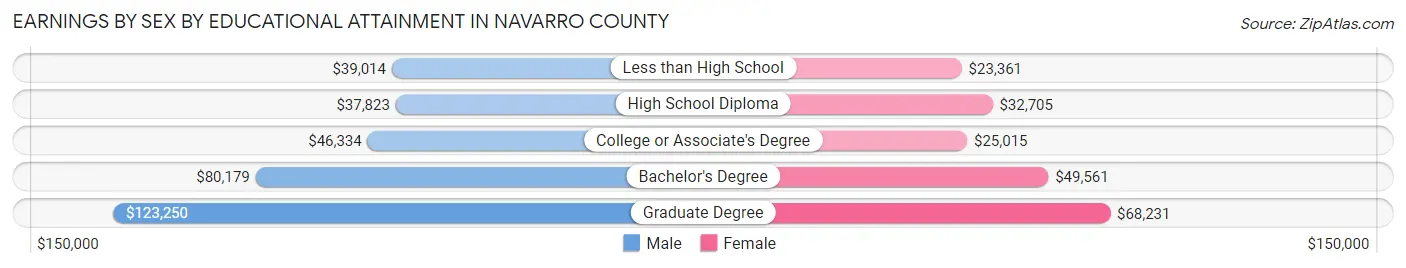
| Educational Attainment | Male Income | Female Income |
| Less than High School | $39,014 | $23,361 |
| High School Diploma | $37,823 | $32,705 |
| College or Associate's Degree | $46,334 | $25,015 |
| Bachelor's Degree | $80,179 | $49,561 |
| Graduate Degree | $123,250 | $68,231 |
| Total | $42,360 | $30,519 |
Family Income in Navarro County
Family Income Brackets in Navarro County
According to the Navarro County family income data, there are 2,486 families falling into the $100,000 to $149,999 income range, which is the most common income bracket and makes up 19.3% of all families. Conversely, the $10,000 to $14,999 income bracket is the least frequent group with only 219 families (1.7%) belonging to this category.
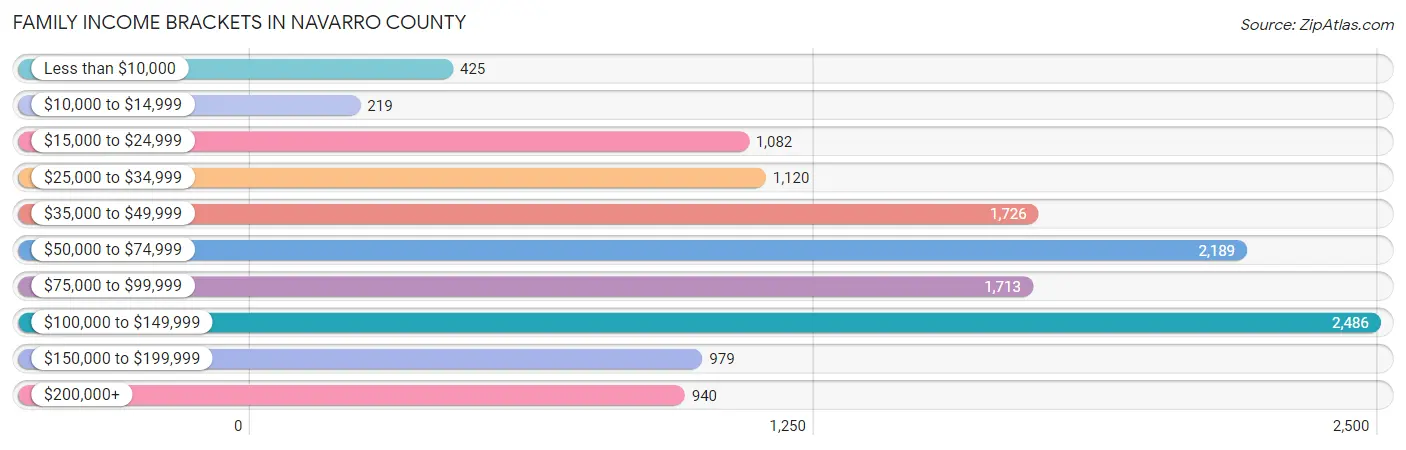
| Income Bracket | # Families | % Families |
| Less than $10,000 | 425 | 3.3% |
| $10,000 to $14,999 | 219 | 1.7% |
| $15,000 to $24,999 | 1,082 | 8.4% |
| $25,000 to $34,999 | 1,120 | 8.7% |
| $35,000 to $49,999 | 1,726 | 13.4% |
| $50,000 to $74,999 | 2,189 | 17.0% |
| $75,000 to $99,999 | 1,713 | 13.3% |
| $100,000 to $149,999 | 2,486 | 19.3% |
| $150,000 to $199,999 | 979 | 7.6% |
| $200,000+ | 940 | 7.3% |
Family Income by Famaliy Size in Navarro County
6-person families (743 | 5.8%) account for the highest median family income in Navarro County with $103,505 per family, while 2-person families (5,865 | 45.5%) have the highest median income of $29,284 per family member.
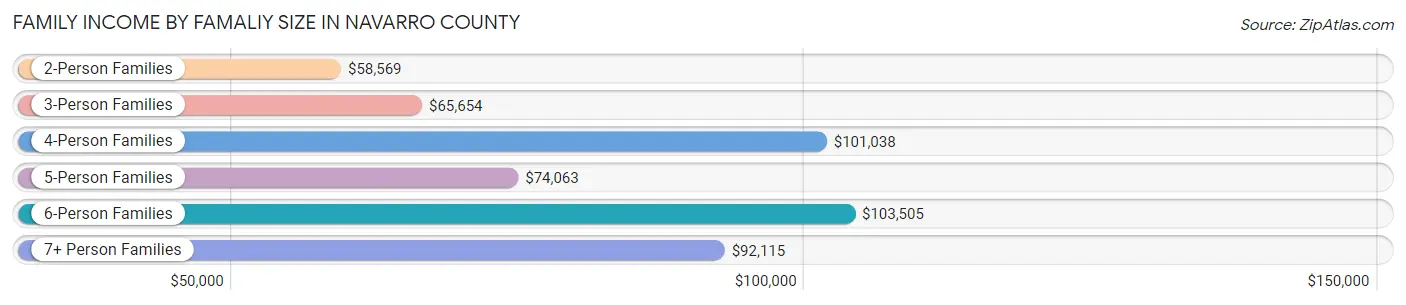
| Income Bracket | # Families | Median Income |
| 2-Person Families | 5,865 (45.5%) | $58,569 |
| 3-Person Families | 2,421 (18.8%) | $65,654 |
| 4-Person Families | 2,302 (17.9%) | $101,038 |
| 5-Person Families | 1,120 (8.7%) | $74,063 |
| 6-Person Families | 743 (5.8%) | $103,505 |
| 7+ Person Families | 428 (3.3%) | $92,115 |
| Total | 12,879 (100.0%) | $71,098 |
Family Income by Number of Earners in Navarro County
The median family income in Navarro County is $71,098, with families comprising 3+ earners (1,563) having the highest median family income of $122,987, while families with no earners (1,946) have the lowest median family income of $36,289, accounting for 12.1% and 15.1% of families, respectively.
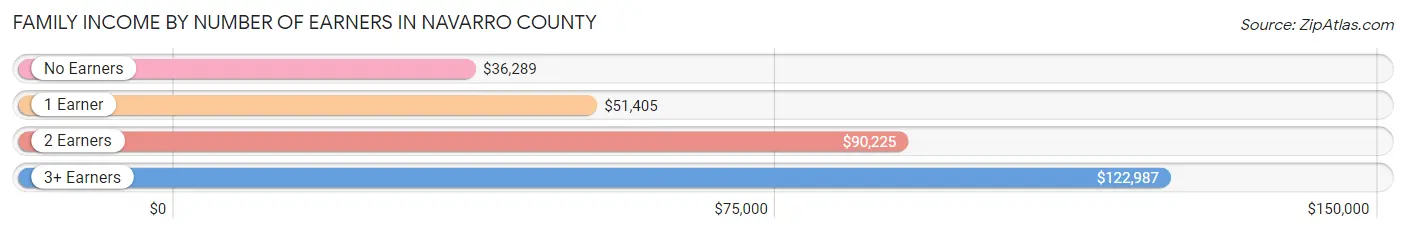
| Number of Earners | # Families | Median Income |
| No Earners | 1,946 (15.1%) | $36,289 |
| 1 Earner | 4,716 (36.6%) | $51,405 |
| 2 Earners | 4,654 (36.1%) | $90,225 |
| 3+ Earners | 1,563 (12.1%) | $122,987 |
| Total | 12,879 (100.0%) | $71,098 |
Household Income in Navarro County
Household Income Brackets in Navarro County
With 2,907 households falling in the category, the $50,000 to $74,999 income range is the most frequent in Navarro County, accounting for 16.1% of all households. In contrast, only 776 households (4.3%) fall into the $10,000 to $14,999 income bracket, making it the least populous group.
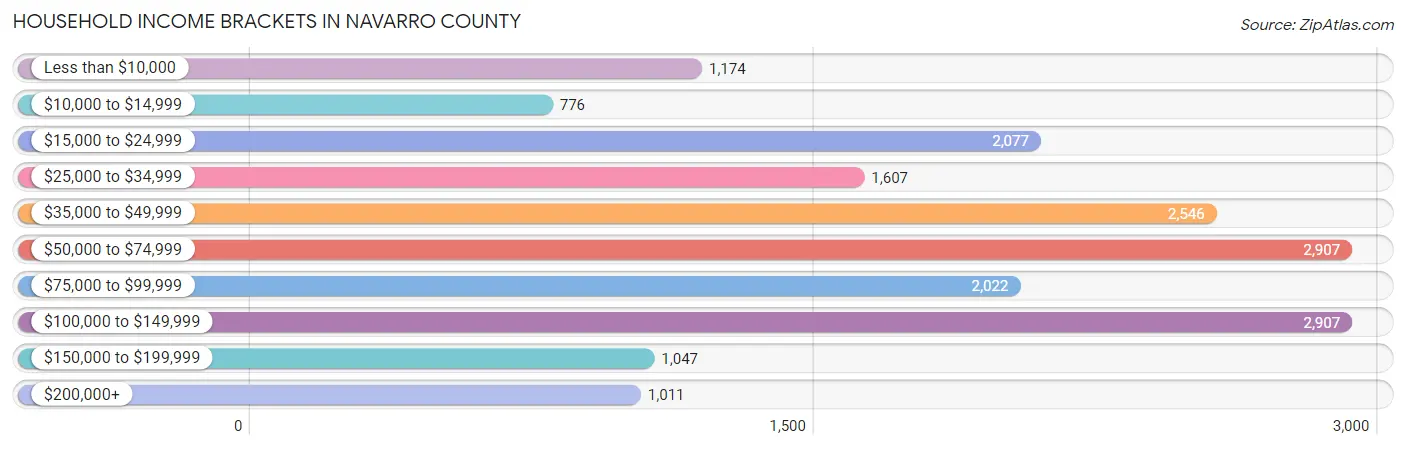
| Income Bracket | # Households | % Households |
| Less than $10,000 | 1,174 | 6.5% |
| $10,000 to $14,999 | 776 | 4.3% |
| $15,000 to $24,999 | 2,077 | 11.5% |
| $25,000 to $34,999 | 1,607 | 8.9% |
| $35,000 to $49,999 | 2,546 | 14.1% |
| $50,000 to $74,999 | 2,907 | 16.1% |
| $75,000 to $99,999 | 2,022 | 11.2% |
| $100,000 to $149,999 | 2,907 | 16.1% |
| $150,000 to $199,999 | 1,047 | 5.8% |
| $200,000+ | 1,011 | 5.6% |
Household Income by Householder Age in Navarro County
The median household income in Navarro County is $56,261, with the highest median household income of $64,940 found in the 45 to 64 years age bracket for the primary householder. A total of 6,724 households (37.2%) fall into this category. Meanwhile, the 15 to 24 years age bracket for the primary householder has the lowest median household income of $38,529, with 574 households (3.2%) in this group.
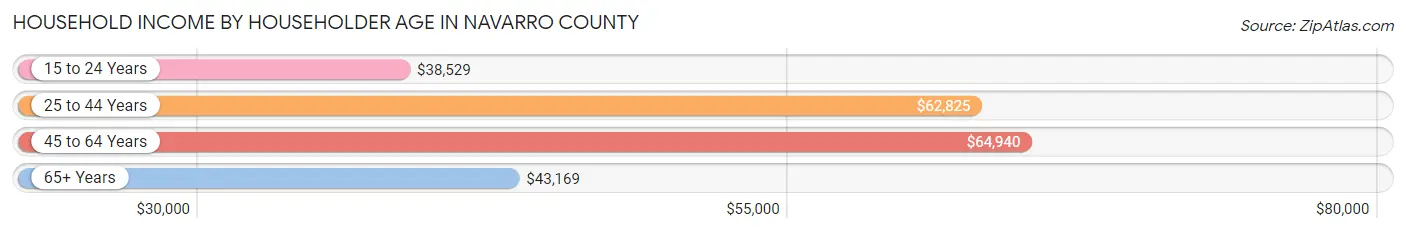
| Income Bracket | # Households | Median Income |
| 15 to 24 Years | 574 (3.2%) | $38,529 |
| 25 to 44 Years | 5,301 (29.4%) | $62,825 |
| 45 to 64 Years | 6,724 (37.2%) | $64,940 |
| 65+ Years | 5,459 (30.2%) | $43,169 |
| Total | 18,058 (100.0%) | $56,261 |
Poverty in Navarro County
Income Below Poverty by Sex and Age in Navarro County
With 14.7% poverty level for males and 18.2% for females among the residents of Navarro County, 12 to 14 year old males and 15 year old females are the most vulnerable to poverty, with 305 males (27.6%) and 132 females (29.1%) in their respective age groups living below the poverty level.
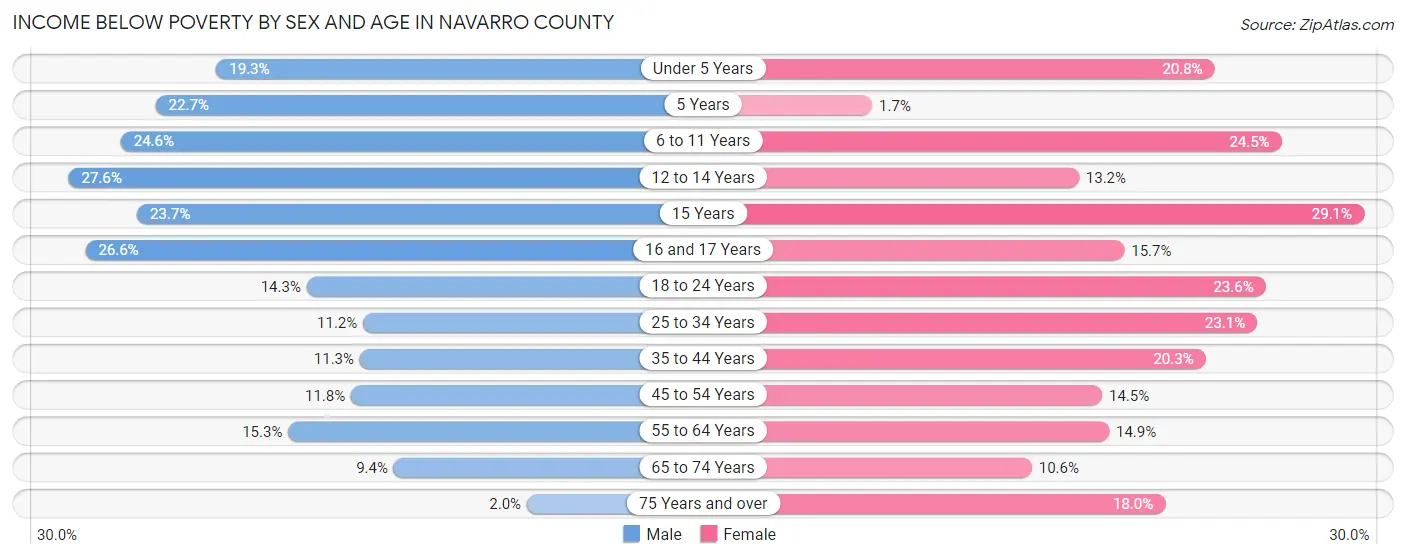
| Age Bracket | Male | Female |
| Under 5 Years | 325 (19.3%) | 348 (20.7%) |
| 5 Years | 79 (22.7%) | 7 (1.7%) |
| 6 to 11 Years | 600 (24.6%) | 563 (24.5%) |
| 12 to 14 Years | 305 (27.6%) | 128 (13.2%) |
| 15 Years | 85 (23.7%) | 132 (29.1%) |
| 16 and 17 Years | 194 (26.6%) | 117 (15.7%) |
| 18 to 24 Years | 428 (14.3%) | 493 (23.6%) |
| 25 to 34 Years | 321 (11.2%) | 695 (23.1%) |
| 35 to 44 Years | 365 (11.3%) | 619 (20.3%) |
| 45 to 54 Years | 360 (11.8%) | 441 (14.5%) |
| 55 to 64 Years | 498 (15.3%) | 511 (14.9%) |
| 65 to 74 Years | 234 (9.4%) | 279 (10.6%) |
| 75 Years and over | 28 (2.0%) | 347 (18.0%) |
| Total | 3,822 (14.7%) | 4,680 (18.2%) |
Income Above Poverty by Sex and Age in Navarro County
According to the poverty statistics in Navarro County, males aged 75 years and over and females aged 5 years are the age groups that are most secure financially, with 98.0% of males and 98.3% of females in these age groups living above the poverty line.
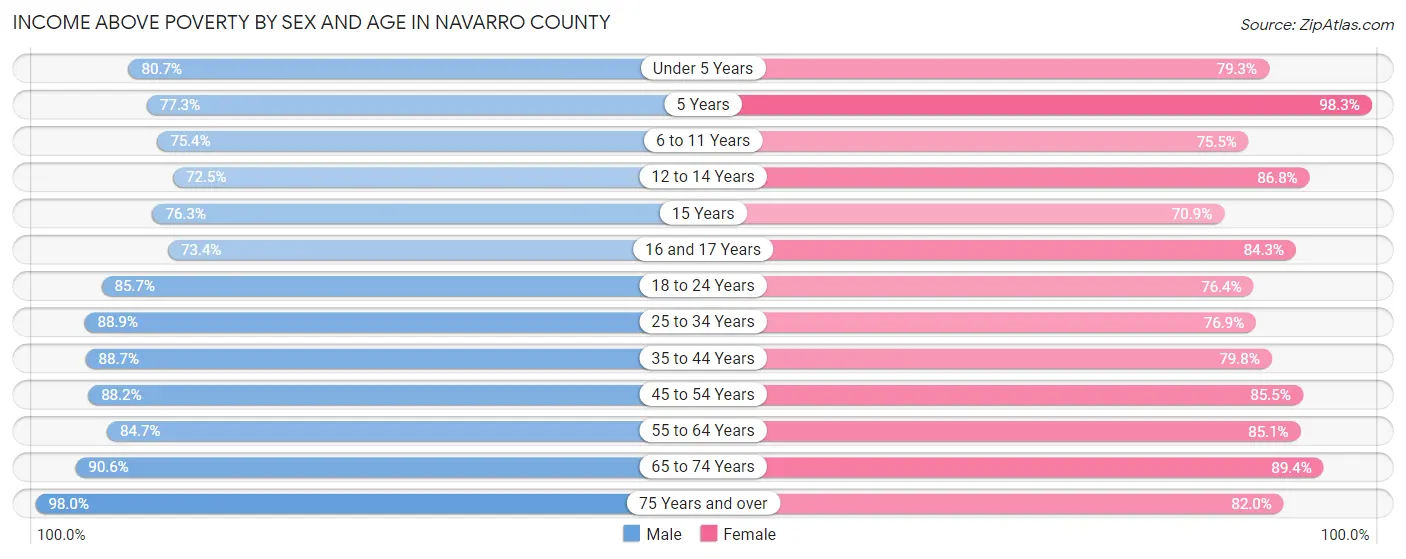
| Age Bracket | Male | Female |
| Under 5 Years | 1,357 (80.7%) | 1,329 (79.2%) |
| 5 Years | 269 (77.3%) | 408 (98.3%) |
| 6 to 11 Years | 1,835 (75.4%) | 1,737 (75.5%) |
| 12 to 14 Years | 802 (72.5%) | 842 (86.8%) |
| 15 Years | 273 (76.3%) | 322 (70.9%) |
| 16 and 17 Years | 535 (73.4%) | 627 (84.3%) |
| 18 to 24 Years | 2,568 (85.7%) | 1,597 (76.4%) |
| 25 to 34 Years | 2,557 (88.8%) | 2,311 (76.9%) |
| 35 to 44 Years | 2,856 (88.7%) | 2,438 (79.7%) |
| 45 to 54 Years | 2,685 (88.2%) | 2,602 (85.5%) |
| 55 to 64 Years | 2,753 (84.7%) | 2,924 (85.1%) |
| 65 to 74 Years | 2,245 (90.6%) | 2,358 (89.4%) |
| 75 Years and over | 1,349 (98.0%) | 1,581 (82.0%) |
| Total | 22,084 (85.3%) | 21,076 (81.8%) |
Income Below Poverty Among Married-Couple Families in Navarro County
The poverty statistics for married-couple families in Navarro County show that 9.0% or 846 of the total 9,436 families live below the poverty line. Families with 5 or more children have the highest poverty rate of 20.2%, comprising of 23 families. On the other hand, families with no children have the lowest poverty rate of 7.2%, which includes 398 families.
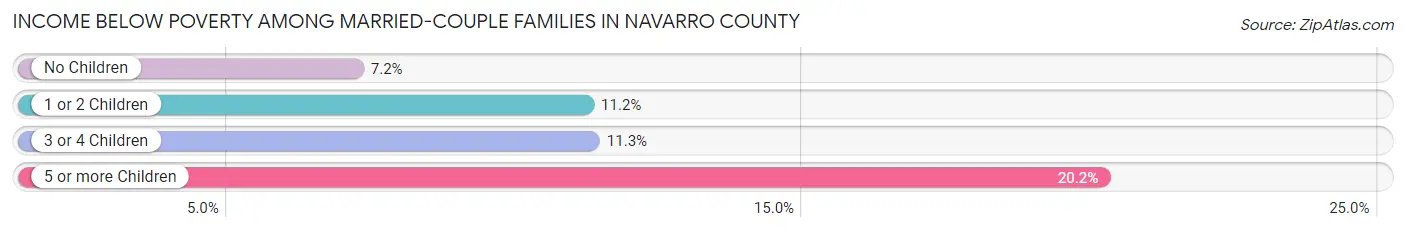
| Children | Above Poverty | Below Poverty |
| No Children | 5,137 (92.8%) | 398 (7.2%) |
| 1 or 2 Children | 2,593 (88.8%) | 327 (11.2%) |
| 3 or 4 Children | 769 (88.7%) | 98 (11.3%) |
| 5 or more Children | 91 (79.8%) | 23 (20.2%) |
| Total | 8,590 (91.0%) | 846 (9.0%) |
Income Below Poverty Among Single-Parent Households in Navarro County
According to the poverty data in Navarro County, 10.0% or 100 single-father households and 26.8% or 655 single-mother households are living below the poverty line. Among single-father households, those with 1 or 2 children have the highest poverty rate, with 80 households (17.9%) experiencing poverty. Likewise, among single-mother households, those with 3 or 4 children have the highest poverty rate, with 174 households (50.4%) falling below the poverty line.
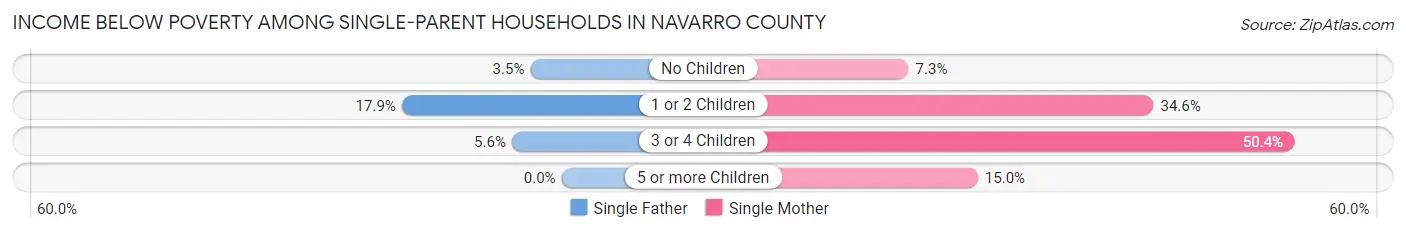
| Children | Single Father | Single Mother |
| No Children | 18 (3.5%) | 62 (7.3%) |
| 1 or 2 Children | 80 (17.9%) | 410 (34.6%) |
| 3 or 4 Children | 2 (5.6%) | 174 (50.4%) |
| 5 or more Children | 0 (0.0%) | 9 (15.0%) |
| Total | 100 (10.0%) | 655 (26.8%) |
Income Below Poverty Among Married-Couple vs Single-Parent Households in Navarro County
The poverty data for Navarro County shows that 846 of the married-couple family households (9.0%) and 755 of the single-parent households (21.9%) are living below the poverty level. Within the married-couple family households, those with 5 or more children have the highest poverty rate, with 23 households (20.2%) falling below the poverty line. Among the single-parent households, those with 3 or 4 children have the highest poverty rate, with 176 household (46.2%) living below poverty.
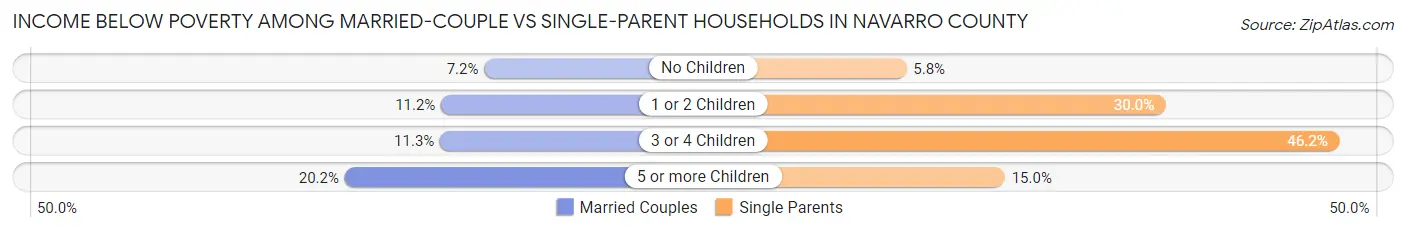
| Children | Married-Couple Families | Single-Parent Households |
| No Children | 398 (7.2%) | 80 (5.8%) |
| 1 or 2 Children | 327 (11.2%) | 490 (30.0%) |
| 3 or 4 Children | 98 (11.3%) | 176 (46.2%) |
| 5 or more Children | 23 (20.2%) | 9 (15.0%) |
| Total | 846 (9.0%) | 755 (21.9%) |
Race in Navarro County
The most populous races in Navarro County are White / Caucasian (33,993 | 64.3%), Hispanic or Latino (15,439 | 29.2%), and Black / African American (6,128 | 11.6%).
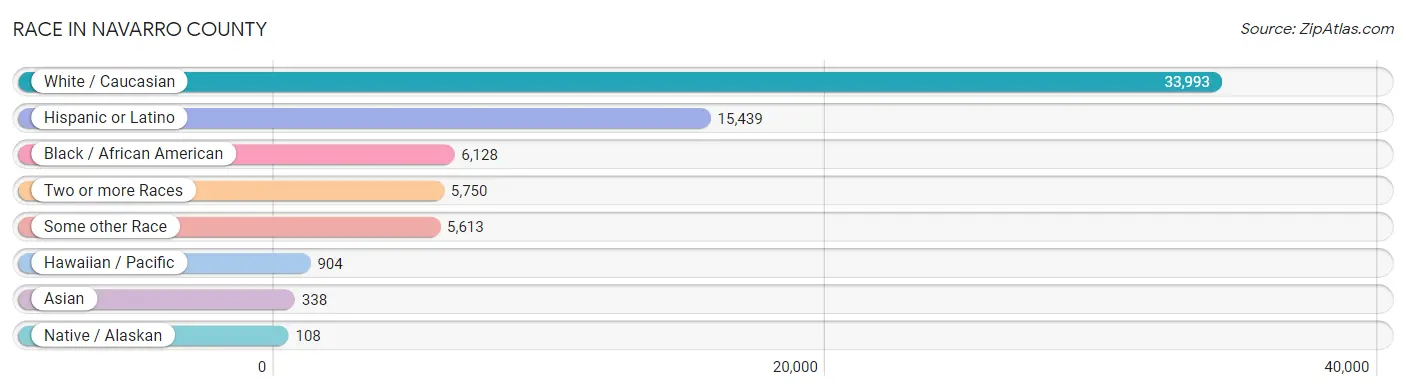
| Race | # Population | % Population |
| Asian | 338 | 0.6% |
| Black / African American | 6,128 | 11.6% |
| Hawaiian / Pacific | 904 | 1.7% |
| Hispanic or Latino | 15,439 | 29.2% |
| Native / Alaskan | 108 | 0.2% |
| White / Caucasian | 33,993 | 64.3% |
| Two or more Races | 5,750 | 10.9% |
| Some other Race | 5,613 | 10.6% |
| Total | 52,834 | 100.0% |
Ancestry in Navarro County
The most populous ancestries reported in Navarro County are Mexican (14,389 | 27.2%), Irish (3,898 | 7.4%), English (3,219 | 6.1%), German (3,176 | 6.0%), and American (2,870 | 5.4%), together accounting for 52.1% of all Navarro County residents.
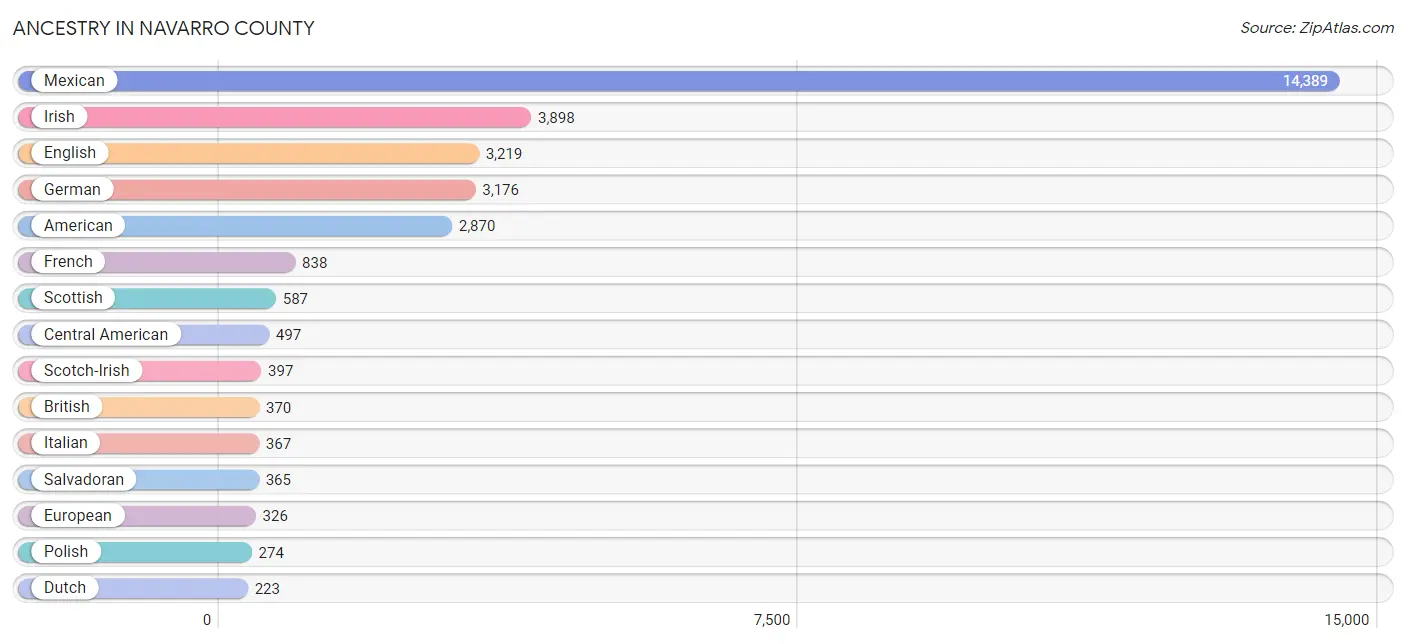
| Ancestry | # Population | % Population |
| African | 73 | 0.1% |
| American | 2,870 | 5.4% |
| Apache | 6 | 0.0% |
| Arab | 46 | 0.1% |
| Austrian | 39 | 0.1% |
| Belizean | 19 | 0.0% |
| Bhutanese | 10 | 0.0% |
| Blackfeet | 18 | 0.0% |
| Brazilian | 34 | 0.1% |
| British | 370 | 0.7% |
| Burmese | 11 | 0.0% |
| Canadian | 6 | 0.0% |
| Celtic | 4 | 0.0% |
| Central American | 497 | 0.9% |
| Central American Indian | 2 | 0.0% |
| Cherokee | 171 | 0.3% |
| Choctaw | 103 | 0.2% |
| Colombian | 53 | 0.1% |
| Comanche | 5 | 0.0% |
| Creek | 11 | 0.0% |
| Cuban | 9 | 0.0% |
| Czech | 222 | 0.4% |
| Danish | 47 | 0.1% |
| Dominican | 24 | 0.1% |
| Dutch | 223 | 0.4% |
| Dutch West Indian | 22 | 0.0% |
| Eastern European | 15 | 0.0% |
| English | 3,219 | 6.1% |
| European | 326 | 0.6% |
| Finnish | 53 | 0.1% |
| French | 838 | 1.6% |
| French Canadian | 29 | 0.1% |
| German | 3,176 | 6.0% |
| Greek | 45 | 0.1% |
| Guatemalan | 17 | 0.0% |
| Honduran | 7 | 0.0% |
| Hungarian | 103 | 0.2% |
| Indian (Asian) | 115 | 0.2% |
| Iranian | 4 | 0.0% |
| Irish | 3,898 | 7.4% |
| Israeli | 13 | 0.0% |
| Italian | 367 | 0.7% |
| Jamaican | 2 | 0.0% |
| Japanese | 192 | 0.4% |
| Korean | 168 | 0.3% |
| Lebanese | 2 | 0.0% |
| Mexican | 14,389 | 27.2% |
| Mexican American Indian | 51 | 0.1% |
| Moroccan | 3 | 0.0% |
| Native Hawaiian | 200 | 0.4% |
| Nigerian | 9 | 0.0% |
| Northern European | 46 | 0.1% |
| Norwegian | 116 | 0.2% |
| Pakistani | 47 | 0.1% |
| Palestinian | 32 | 0.1% |
| Panamanian | 108 | 0.2% |
| Polish | 274 | 0.5% |
| Puerto Rican | 106 | 0.2% |
| Russian | 13 | 0.0% |
| Salvadoran | 365 | 0.7% |
| Scandinavian | 70 | 0.1% |
| Scotch-Irish | 397 | 0.7% |
| Scottish | 587 | 1.1% |
| Sioux | 3 | 0.0% |
| Slovak | 12 | 0.0% |
| South American | 59 | 0.1% |
| Spaniard | 145 | 0.3% |
| Spanish | 17 | 0.0% |
| Sri Lankan | 111 | 0.2% |
| Subsaharan African | 82 | 0.2% |
| Swedish | 110 | 0.2% |
| Swiss | 4 | 0.0% |
| Thai | 145 | 0.3% |
| Tlingit-Haida | 2 | 0.0% |
| Ukrainian | 19 | 0.0% |
| Venezuelan | 6 | 0.0% |
| Welsh | 200 | 0.4% |
| Yup'ik | 9 | 0.0% | View All 78 Rows |
Immigrants in Navarro County
The most numerous immigrant groups reported in Navarro County came from Latin America (5,773 | 10.9%), Central America (5,716 | 10.8%), Mexico (5,361 | 10.2%), Oceania (672 | 1.3%), and Micronesia (669 | 1.3%), together accounting for 34.4% of all Navarro County residents.
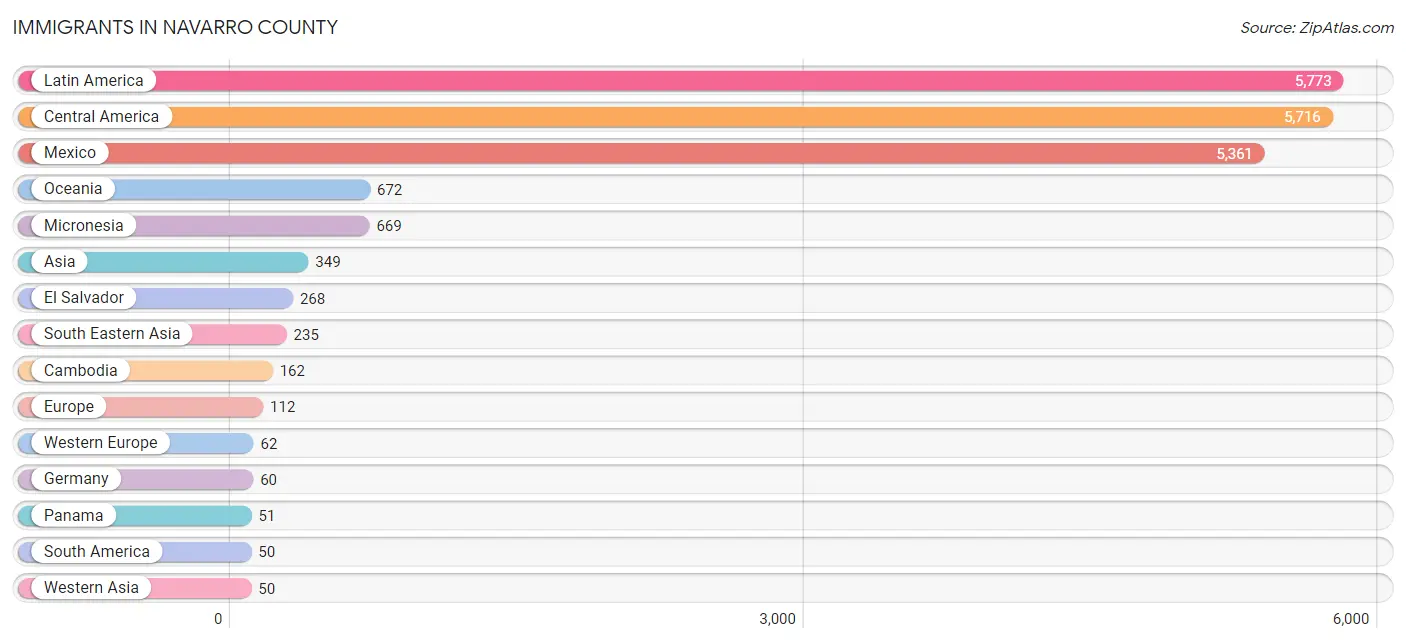
| Immigration Origin | # Population | % Population |
| Africa | 41 | 0.1% |
| Asia | 349 | 0.7% |
| Belize | 18 | 0.0% |
| Brazil | 9 | 0.0% |
| Cambodia | 162 | 0.3% |
| Canada | 16 | 0.0% |
| Caribbean | 7 | 0.0% |
| Central America | 5,716 | 10.8% |
| China | 33 | 0.1% |
| Colombia | 35 | 0.1% |
| Cuba | 4 | 0.0% |
| Eastern Africa | 38 | 0.1% |
| Eastern Asia | 33 | 0.1% |
| Eastern Europe | 13 | 0.0% |
| El Salvador | 268 | 0.5% |
| Europe | 112 | 0.2% |
| Germany | 60 | 0.1% |
| Guatemala | 11 | 0.0% |
| Honduras | 7 | 0.0% |
| India | 22 | 0.0% |
| Israel | 4 | 0.0% |
| Jamaica | 3 | 0.0% |
| Jordan | 46 | 0.1% |
| Latin America | 5,773 | 10.9% |
| Mexico | 5,361 | 10.2% |
| Micronesia | 669 | 1.3% |
| Morocco | 3 | 0.0% |
| Netherlands | 2 | 0.0% |
| Northern Africa | 3 | 0.0% |
| Northern Europe | 37 | 0.1% |
| Oceania | 672 | 1.3% |
| Panama | 51 | 0.1% |
| Philippines | 28 | 0.1% |
| Russia | 7 | 0.0% |
| South America | 50 | 0.1% |
| South Central Asia | 22 | 0.0% |
| South Eastern Asia | 235 | 0.4% |
| Taiwan | 30 | 0.1% |
| Thailand | 37 | 0.1% |
| Ukraine | 6 | 0.0% |
| Venezuela | 6 | 0.0% |
| Vietnam | 8 | 0.0% |
| Western Asia | 50 | 0.1% |
| Western Europe | 62 | 0.1% |
| Zimbabwe | 32 | 0.1% | View All 45 Rows |
Sex and Age in Navarro County
Sex and Age in Navarro County
The most populous age groups in Navarro County are 20 to 24 Years (2,317 | 8.7%) for men and 5 to 9 Years (1,924 | 7.3%) for women.
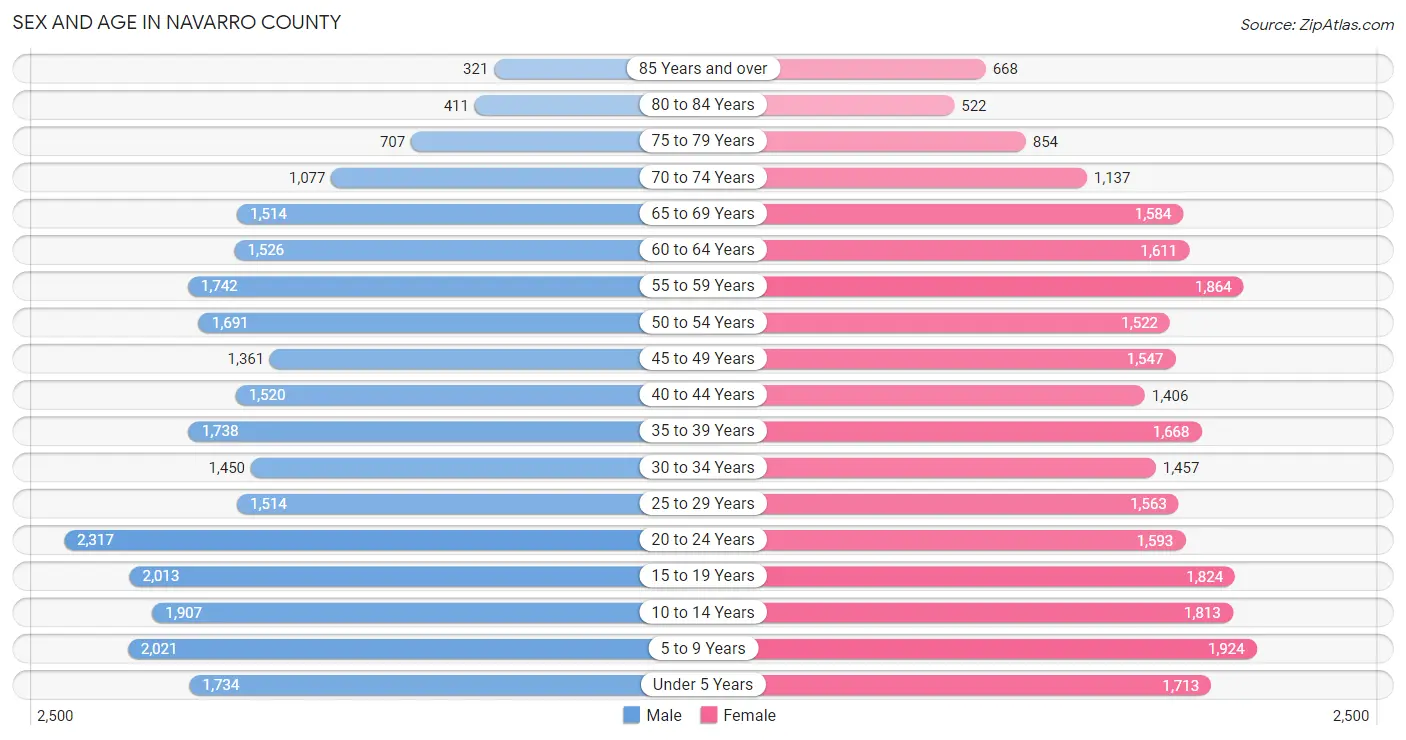
| Age Bracket | Male | Female |
| Under 5 Years | 1,734 (6.5%) | 1,713 (6.5%) |
| 5 to 9 Years | 2,021 (7.6%) | 1,924 (7.3%) |
| 10 to 14 Years | 1,907 (7.2%) | 1,813 (6.9%) |
| 15 to 19 Years | 2,013 (7.6%) | 1,824 (6.9%) |
| 20 to 24 Years | 2,317 (8.7%) | 1,593 (6.1%) |
| 25 to 29 Years | 1,514 (5.7%) | 1,563 (5.9%) |
| 30 to 34 Years | 1,450 (5.5%) | 1,457 (5.6%) |
| 35 to 39 Years | 1,738 (6.5%) | 1,668 (6.4%) |
| 40 to 44 Years | 1,520 (5.7%) | 1,406 (5.3%) |
| 45 to 49 Years | 1,361 (5.1%) | 1,547 (5.9%) |
| 50 to 54 Years | 1,691 (6.4%) | 1,522 (5.8%) |
| 55 to 59 Years | 1,742 (6.6%) | 1,864 (7.1%) |
| 60 to 64 Years | 1,526 (5.7%) | 1,611 (6.1%) |
| 65 to 69 Years | 1,514 (5.7%) | 1,584 (6.0%) |
| 70 to 74 Years | 1,077 (4.1%) | 1,137 (4.3%) |
| 75 to 79 Years | 707 (2.7%) | 854 (3.3%) |
| 80 to 84 Years | 411 (1.5%) | 522 (2.0%) |
| 85 Years and over | 321 (1.2%) | 668 (2.5%) |
| Total | 26,564 (100.0%) | 26,270 (100.0%) |
Families and Households in Navarro County
Median Family Size in Navarro County
The median family size in Navarro County is 3.47 persons per family, with single female/mother families (2,443 | 19.0%) accounting for the largest median family size of 3.61 persons per family. On the other hand, single male/father families (1,000 | 7.8%) represent the smallest median family size with 3.11 persons per family.
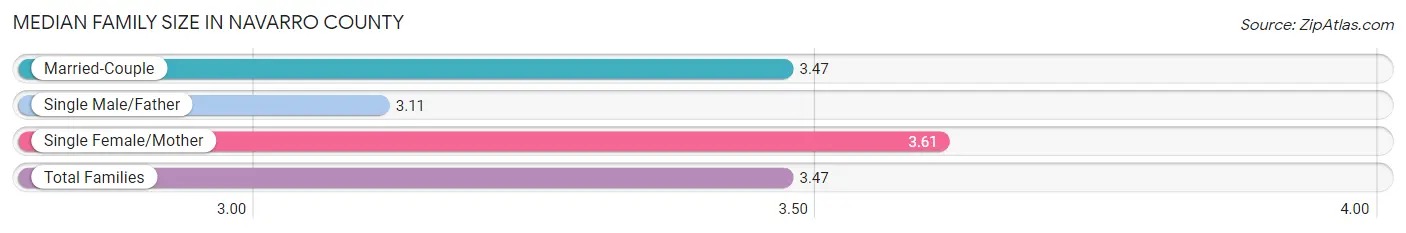
| Family Type | # Families | Family Size |
| Married-Couple | 9,436 (73.3%) | 3.47 |
| Single Male/Father | 1,000 (7.8%) | 3.11 |
| Single Female/Mother | 2,443 (19.0%) | 3.61 |
| Total Families | 12,879 (100.0%) | 3.47 |
Median Household Size in Navarro County
The median household size in Navarro County is 2.87 persons per household, with single female/mother households (2,443 | 13.5%) accounting for the largest median household size of 3.84 persons per household. non-family households (5,179 | 28.7%) represent the smallest median household size with 1.18 persons per household.
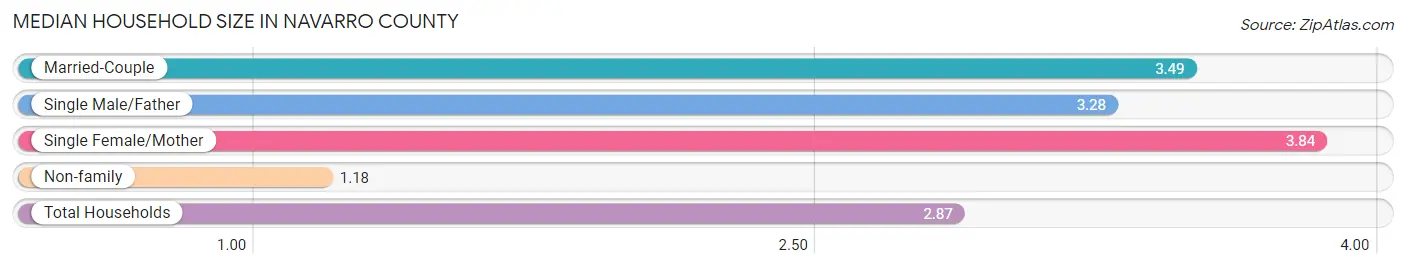
| Household Type | # Households | Household Size |
| Married-Couple | 9,436 (52.2%) | 3.49 |
| Single Male/Father | 1,000 (5.5%) | 3.28 |
| Single Female/Mother | 2,443 (13.5%) | 3.84 |
| Non-family | 5,179 (28.7%) | 1.18 |
| Total Households | 18,058 (100.0%) | 2.87 |
Household Size by Marriage Status in Navarro County
Out of a total of 18,058 households in Navarro County, 12,879 (71.3%) are family households, while 5,179 (28.7%) are nonfamily households. The most numerous type of family households are 2-person households, comprising 5,667, and the most common type of nonfamily households are 1-person households, comprising 4,488.
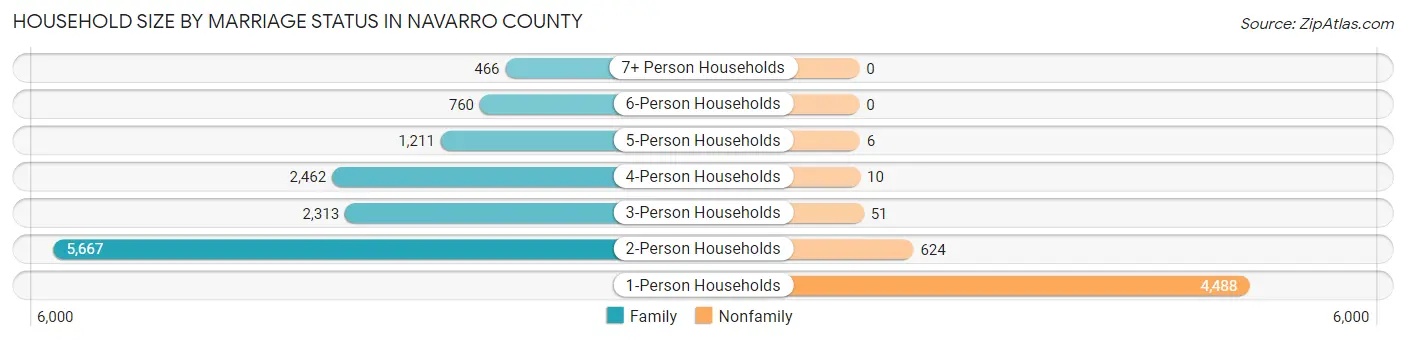
| Household Size | Family Households | Nonfamily Households |
| 1-Person Households | - | 4,488 (24.8%) |
| 2-Person Households | 5,667 (31.4%) | 624 (3.5%) |
| 3-Person Households | 2,313 (12.8%) | 51 (0.3%) |
| 4-Person Households | 2,462 (13.6%) | 10 (0.1%) |
| 5-Person Households | 1,211 (6.7%) | 6 (0.0%) |
| 6-Person Households | 760 (4.2%) | 0 (0.0%) |
| 7+ Person Households | 466 (2.6%) | 0 (0.0%) |
| Total | 12,879 (71.3%) | 5,179 (28.7%) |
Female Fertility in Navarro County
Fertility by Age in Navarro County
Average fertility rate in Navarro County is 57.0 births per 1,000 women. Women in the age bracket of 20 to 34 years have the highest fertility rate with 108.0 births per 1,000 women. Women in the age bracket of 20 to 34 years acount for 76.5% of all women with births.
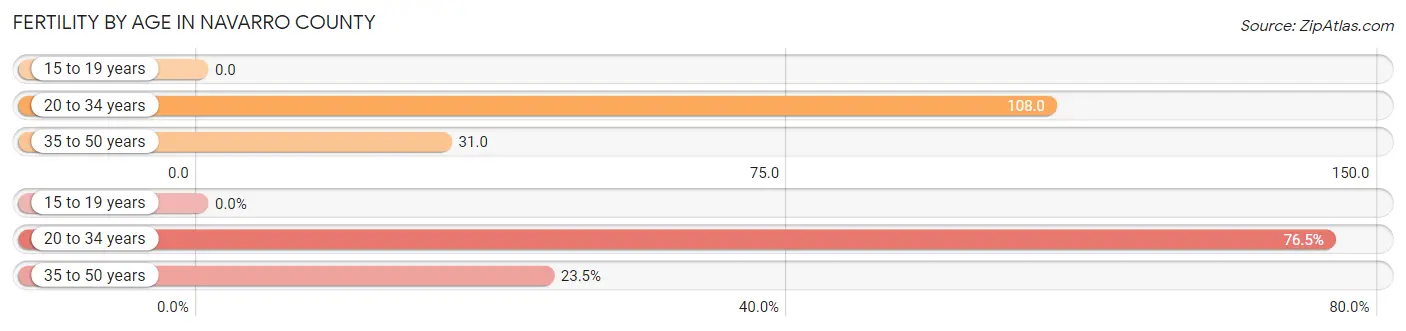
| Age Bracket | Women with Births | Births / 1,000 Women |
| 15 to 19 years | 0 (0.0%) | 0.0 |
| 20 to 34 years | 499 (76.5%) | 108.0 |
| 35 to 50 years | 153 (23.5%) | 31.0 |
| Total | 652 (100.0%) | 57.0 |
Fertility by Age by Marriage Status in Navarro County
55.7% of women with births (652) in Navarro County are married. The highest percentage of unmarried women with births falls into 20 to 34 years age bracket with 54.9% of them unmarried at the time of birth, while the lowest percentage of unmarried women with births belong to 35 to 50 years age bracket with 9.8% of them unmarried.
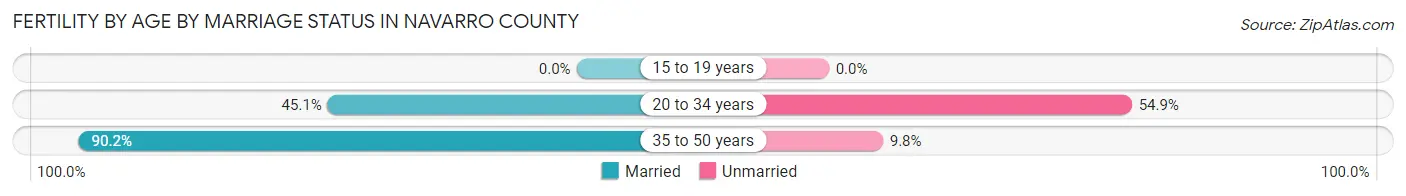
| Age Bracket | Married | Unmarried |
| 15 to 19 years | 0 (0.0%) | 0 (0.0%) |
| 20 to 34 years | 225 (45.1%) | 274 (54.9%) |
| 35 to 50 years | 138 (90.2%) | 15 (9.8%) |
| Total | 363 (55.7%) | 289 (44.3%) |
Fertility by Education in Navarro County
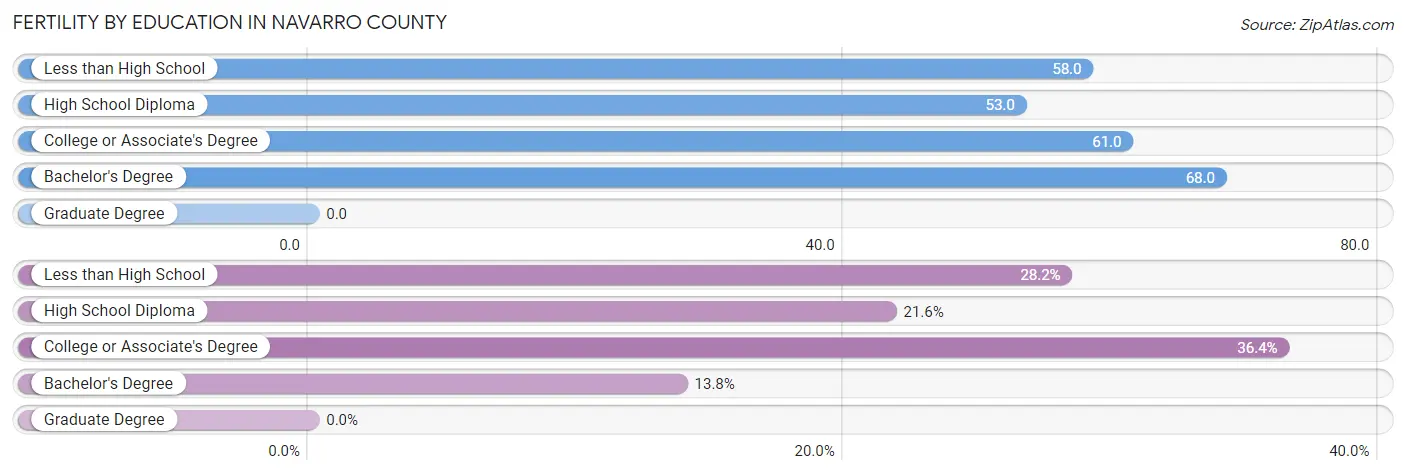
| Educational Attainment | Women with Births | Births / 1,000 Women |
| Less than High School | 184 (28.2%) | 58.0 |
| High School Diploma | 141 (21.6%) | 53.0 |
| College or Associate's Degree | 237 (36.3%) | 61.0 |
| Bachelor's Degree | 90 (13.8%) | 68.0 |
| Graduate Degree | 0 (0.0%) | 0.0 |
| Total | 652 (100.0%) | 57.0 |
Fertility by Education by Marriage Status in Navarro County
44.3% of women with births in Navarro County are unmarried. Women with the educational attainment of bachelor's degree are most likely to be married with 88.9% of them married at childbirth, while women with the educational attainment of less than high school are least likely to be married with 67.9% of them unmarried at childbirth.
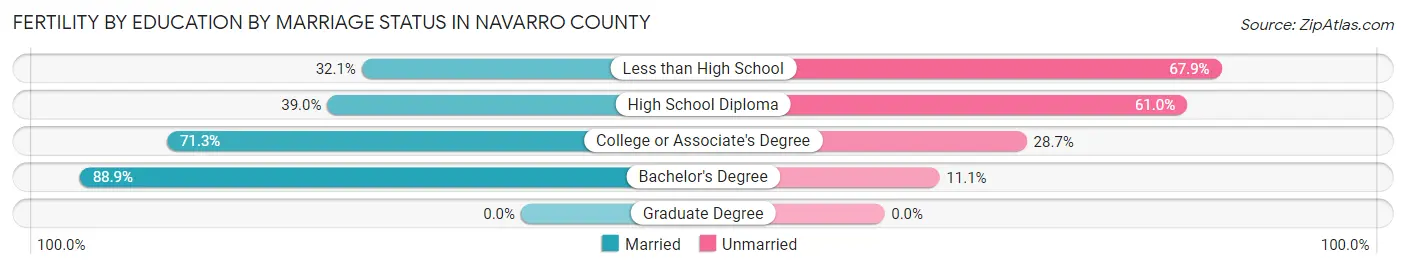
| Educational Attainment | Married | Unmarried |
| Less than High School | 59 (32.1%) | 125 (67.9%) |
| High School Diploma | 55 (39.0%) | 86 (61.0%) |
| College or Associate's Degree | 169 (71.3%) | 68 (28.7%) |
| Bachelor's Degree | 80 (88.9%) | 10 (11.1%) |
| Graduate Degree | 0 (0.0%) | 0 (0.0%) |
| Total | 363 (55.7%) | 289 (44.3%) |
Employment Characteristics in Navarro County
Employment by Class of Employer in Navarro County
Among the 22,195 employed individuals in Navarro County, private company employees (14,895 | 67.1%), local government employees (1,990 | 9.0%), and self-employed (not incorporated) (1,849 | 8.3%) make up the most common classes of employment.
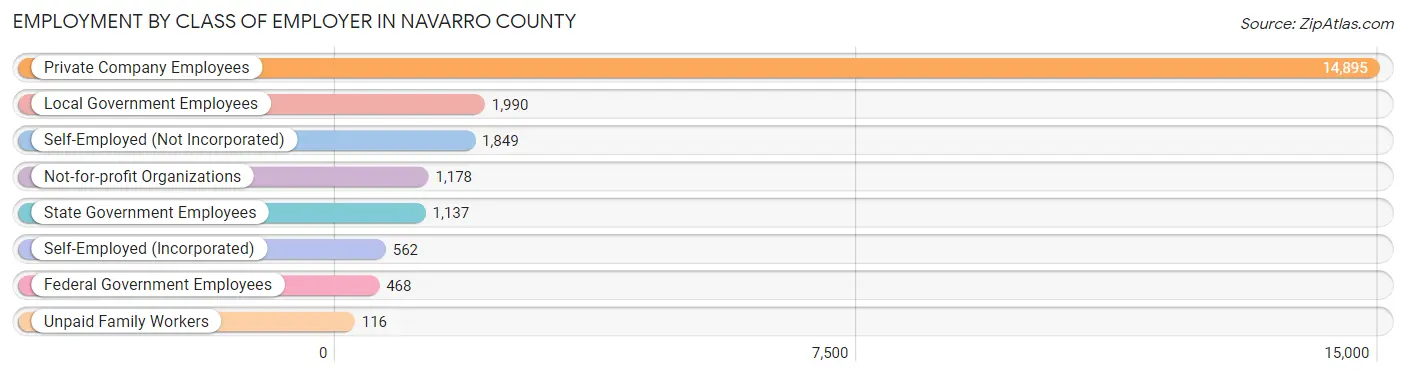
| Employer Class | # Employees | % Employees |
| Private Company Employees | 14,895 | 67.1% |
| Self-Employed (Incorporated) | 562 | 2.5% |
| Self-Employed (Not Incorporated) | 1,849 | 8.3% |
| Not-for-profit Organizations | 1,178 | 5.3% |
| Local Government Employees | 1,990 | 9.0% |
| State Government Employees | 1,137 | 5.1% |
| Federal Government Employees | 468 | 2.1% |
| Unpaid Family Workers | 116 | 0.5% |
| Total | 22,195 | 100.0% |
Employment Status by Age in Navarro County
According to the labor force statistics for Navarro County, out of the total population over 16 years of age (40,870), 59.4% or 24,277 individuals are in the labor force, with 5.6% or 1,360 of them unemployed. The age group with the highest labor force participation rate is 35 to 44 years, with 80.8% or 5,116 individuals in the labor force. Within the labor force, the 75 years and over age range has the highest percentage of unemployed individuals, with 18.4% or 64 of them being unemployed.
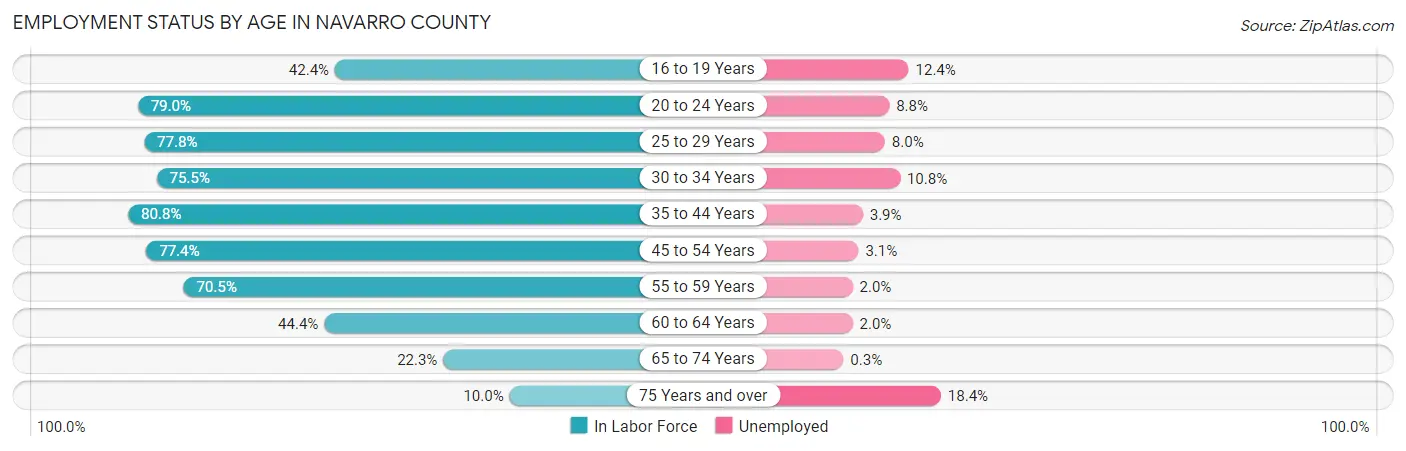
| Age Bracket | In Labor Force | Unemployed |
| 16 to 19 Years | 1,266 (42.4%) | 157 (12.4%) |
| 20 to 24 Years | 3,089 (79.0%) | 272 (8.8%) |
| 25 to 29 Years | 2,394 (77.8%) | 192 (8.0%) |
| 30 to 34 Years | 2,195 (75.5%) | 237 (10.8%) |
| 35 to 44 Years | 5,116 (80.8%) | 200 (3.9%) |
| 45 to 54 Years | 4,738 (77.4%) | 147 (3.1%) |
| 55 to 59 Years | 2,542 (70.5%) | 51 (2.0%) |
| 60 to 64 Years | 1,393 (44.4%) | 28 (2.0%) |
| 65 to 74 Years | 1,185 (22.3%) | 4 (0.3%) |
| 75 Years and over | 348 (10.0%) | 64 (18.4%) |
| Total | 24,277 (59.4%) | 1,360 (5.6%) |
Employment Status by Educational Attainment in Navarro County
According to labor force statistics for Navarro County, 73.0% of individuals (18,381) out of the total population between 25 and 64 years of age (25,180) are in the labor force, with 4.7% or 864 of them being unemployed. The group with the highest labor force participation rate are those with the educational attainment of college / associate degree, with 81.9% or 7,102 individuals in the labor force. Within the labor force, individuals with less than high school education have the highest percentage of unemployment, with 6.7% or 200 of them being unemployed.
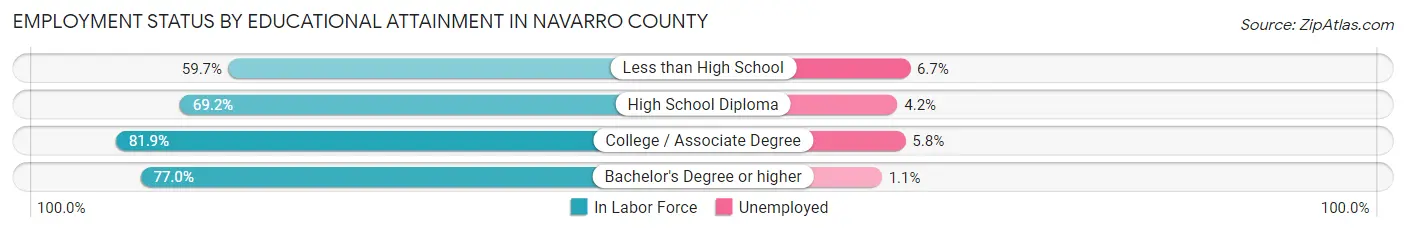
| Educational Attainment | In Labor Force | Unemployed |
| Less than High School | 2,978 (59.7%) | 334 (6.7%) |
| High School Diploma | 5,072 (69.2%) | 308 (4.2%) |
| College / Associate Degree | 7,102 (81.9%) | 503 (5.8%) |
| Bachelor's Degree or higher | 3,228 (77.0%) | 46 (1.1%) |
| Total | 18,381 (73.0%) | 1,183 (4.7%) |
Employment Occupations by Sex in Navarro County
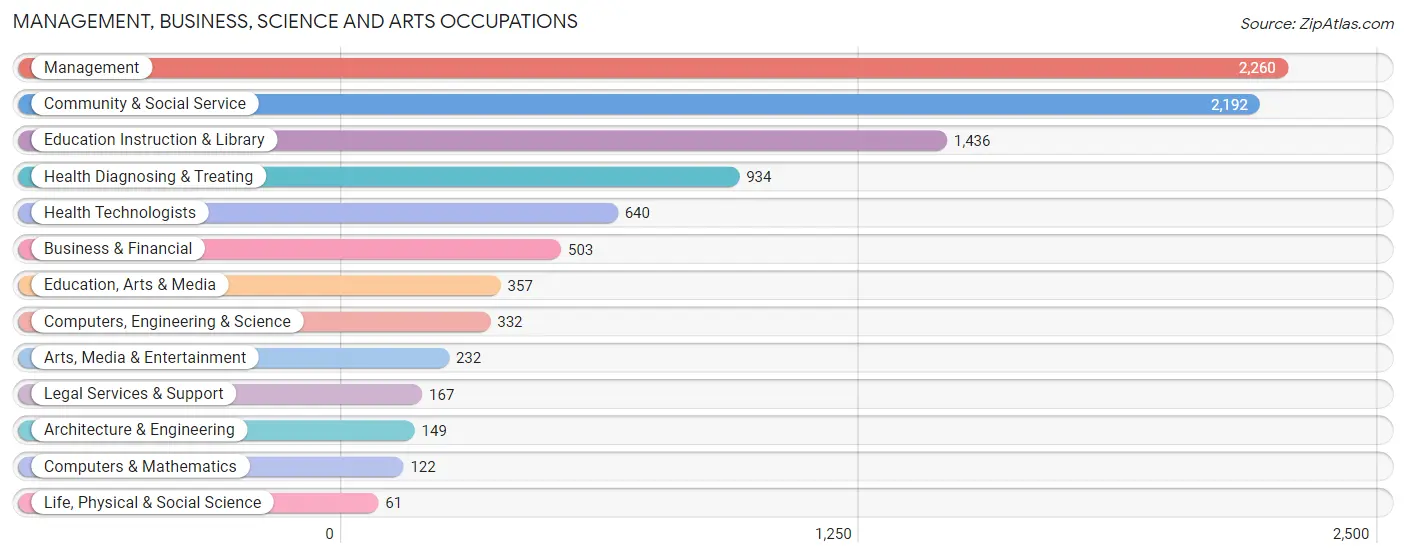
Management, Business, Science and Arts Occupations
The most common Management, Business, Science and Arts occupations in Navarro County are Management (2,260 | 9.9%), Community & Social Service (2,192 | 9.6%), Education Instruction & Library (1,436 | 6.3%), Health Diagnosing & Treating (934 | 4.1%), and Health Technologists (640 | 2.8%).
Management, Business, Science and Arts Occupations by Sex
Within the Management, Business, Science and Arts occupations in Navarro County, the most male-oriented occupations are Life, Physical & Social Science (95.1%), Architecture & Engineering (94.6%), and Computers, Engineering & Science (90.1%), while the most female-oriented occupations are Education Instruction & Library (87.6%), Health Diagnosing & Treating (85.4%), and Health Technologists (85.0%).
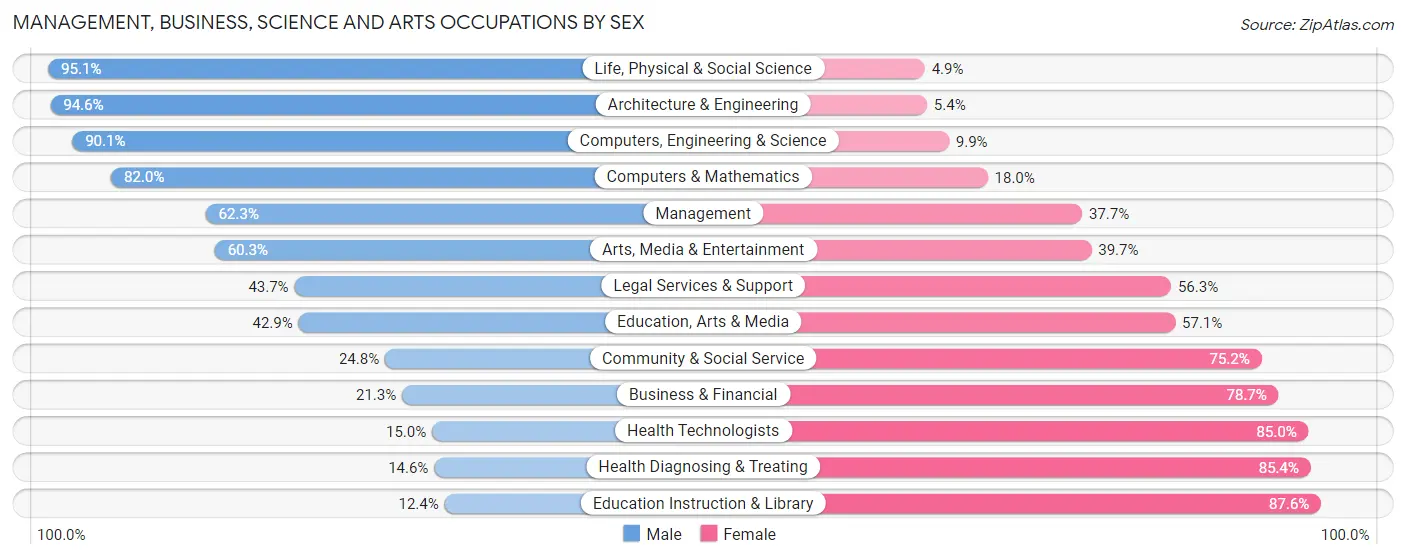
| Occupation | Male | Female |
| Management | 1,407 (62.3%) | 853 (37.7%) |
| Business & Financial | 107 (21.3%) | 396 (78.7%) |
| Computers, Engineering & Science | 299 (90.1%) | 33 (9.9%) |
| Computers & Mathematics | 100 (82.0%) | 22 (18.0%) |
| Architecture & Engineering | 141 (94.6%) | 8 (5.4%) |
| Life, Physical & Social Science | 58 (95.1%) | 3 (4.9%) |
| Community & Social Service | 544 (24.8%) | 1,648 (75.2%) |
| Education, Arts & Media | 153 (42.9%) | 204 (57.1%) |
| Legal Services & Support | 73 (43.7%) | 94 (56.3%) |
| Education Instruction & Library | 178 (12.4%) | 1,258 (87.6%) |
| Arts, Media & Entertainment | 140 (60.3%) | 92 (39.7%) |
| Health Diagnosing & Treating | 136 (14.6%) | 798 (85.4%) |
| Health Technologists | 96 (15.0%) | 544 (85.0%) |
| Total (Category) | 2,493 (40.1%) | 3,728 (59.9%) |
| Total (Overall) | 12,796 (56.0%) | 10,064 (44.0%) |
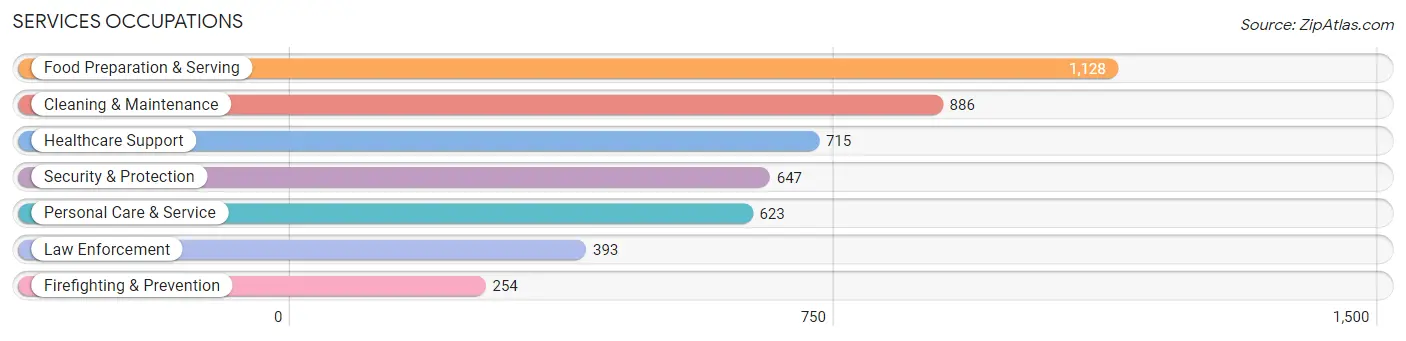
Services Occupations
The most common Services occupations in Navarro County are Food Preparation & Serving (1,128 | 4.9%), Cleaning & Maintenance (886 | 3.9%), Healthcare Support (715 | 3.1%), Security & Protection (647 | 2.8%), and Personal Care & Service (623 | 2.7%).
Services Occupations by Sex
Within the Services occupations in Navarro County, the most male-oriented occupations are Firefighting & Prevention (96.5%), Security & Protection (76.3%), and Law Enforcement (63.4%), while the most female-oriented occupations are Personal Care & Service (90.4%), Healthcare Support (88.7%), and Food Preparation & Serving (62.2%).
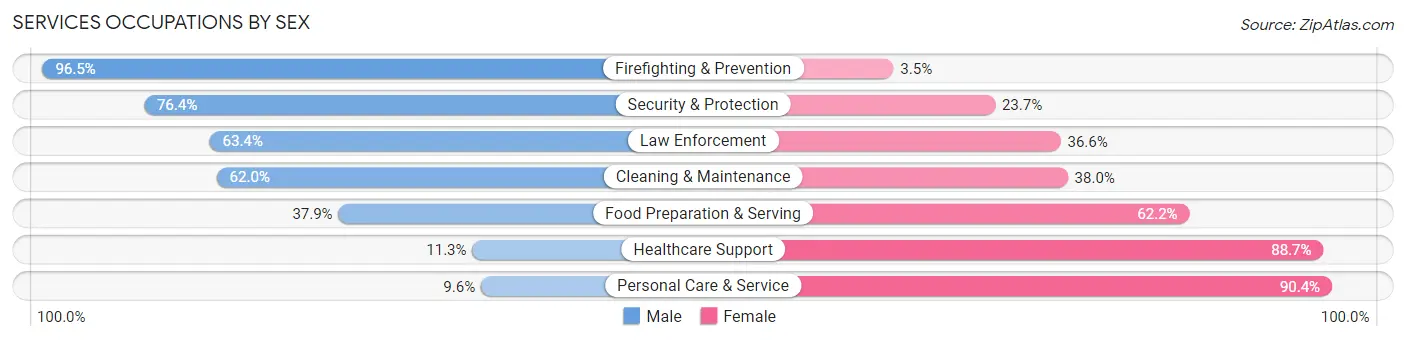
| Occupation | Male | Female |
| Healthcare Support | 81 (11.3%) | 634 (88.7%) |
| Security & Protection | 494 (76.3%) | 153 (23.6%) |
| Firefighting & Prevention | 245 (96.5%) | 9 (3.5%) |
| Law Enforcement | 249 (63.4%) | 144 (36.6%) |
| Food Preparation & Serving | 427 (37.9%) | 701 (62.2%) |
| Cleaning & Maintenance | 549 (62.0%) | 337 (38.0%) |
| Personal Care & Service | 60 (9.6%) | 563 (90.4%) |
| Total (Category) | 1,611 (40.3%) | 2,388 (59.7%) |
| Total (Overall) | 12,796 (56.0%) | 10,064 (44.0%) |
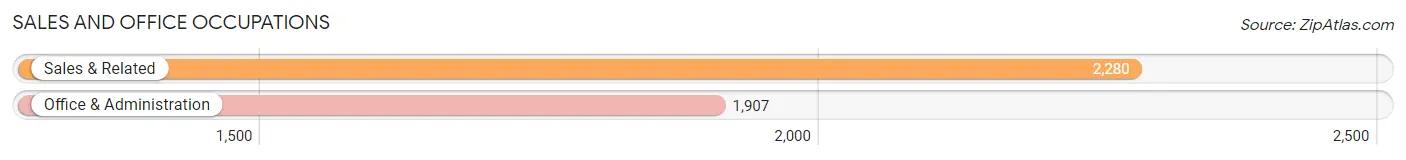
Sales and Office Occupations
The most common Sales and Office occupations in Navarro County are Sales & Related (2,280 | 10.0%), and Office & Administration (1,907 | 8.3%).
Sales and Office Occupations by Sex
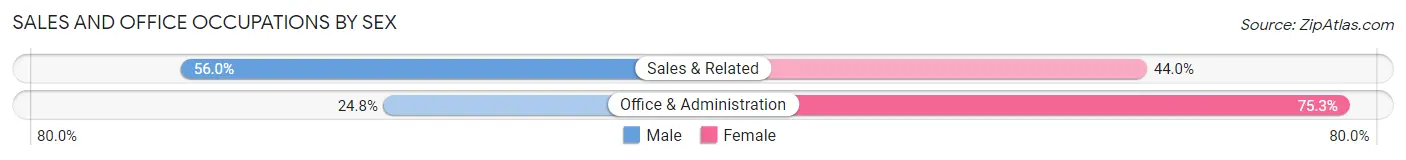
| Occupation | Male | Female |
| Sales & Related | 1,276 (56.0%) | 1,004 (44.0%) |
| Office & Administration | 472 (24.7%) | 1,435 (75.2%) |
| Total (Category) | 1,748 (41.7%) | 2,439 (58.3%) |
| Total (Overall) | 12,796 (56.0%) | 10,064 (44.0%) |
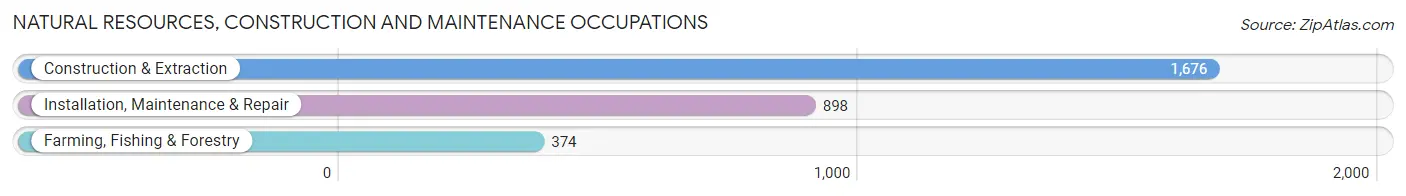
Natural Resources, Construction and Maintenance Occupations
The most common Natural Resources, Construction and Maintenance occupations in Navarro County are Construction & Extraction (1,676 | 7.3%), Installation, Maintenance & Repair (898 | 3.9%), and Farming, Fishing & Forestry (374 | 1.6%).
Natural Resources, Construction and Maintenance Occupations by Sex
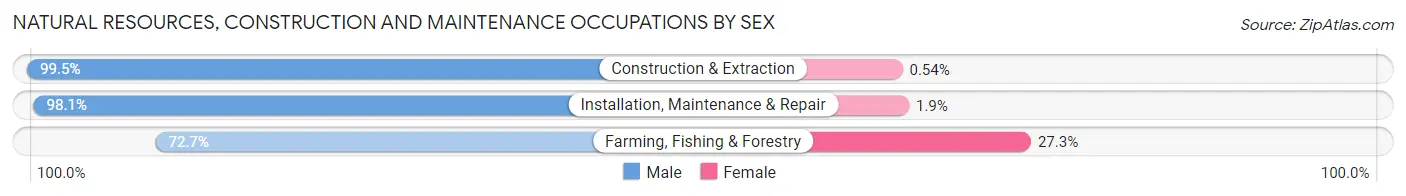
| Occupation | Male | Female |
| Farming, Fishing & Forestry | 272 (72.7%) | 102 (27.3%) |
| Construction & Extraction | 1,667 (99.5%) | 9 (0.5%) |
| Installation, Maintenance & Repair | 881 (98.1%) | 17 (1.9%) |
| Total (Category) | 2,820 (95.7%) | 128 (4.3%) |
| Total (Overall) | 12,796 (56.0%) | 10,064 (44.0%) |
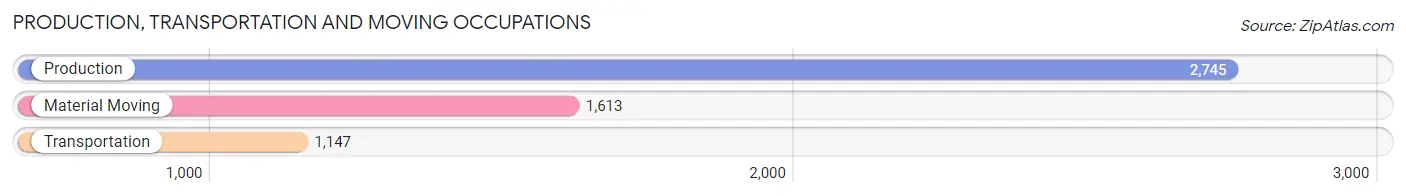
Production, Transportation and Moving Occupations
The most common Production, Transportation and Moving occupations in Navarro County are Production (2,745 | 12.0%), Material Moving (1,613 | 7.1%), and Transportation (1,147 | 5.0%).
Production, Transportation and Moving Occupations by Sex
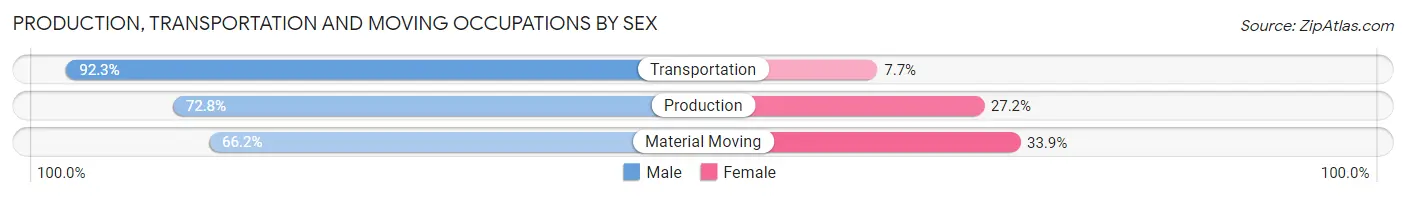
| Occupation | Male | Female |
| Production | 1,998 (72.8%) | 747 (27.2%) |
| Transportation | 1,059 (92.3%) | 88 (7.7%) |
| Material Moving | 1,067 (66.1%) | 546 (33.9%) |
| Total (Category) | 4,124 (74.9%) | 1,381 (25.1%) |
| Total (Overall) | 12,796 (56.0%) | 10,064 (44.0%) |
Employment Industries by Sex in Navarro County
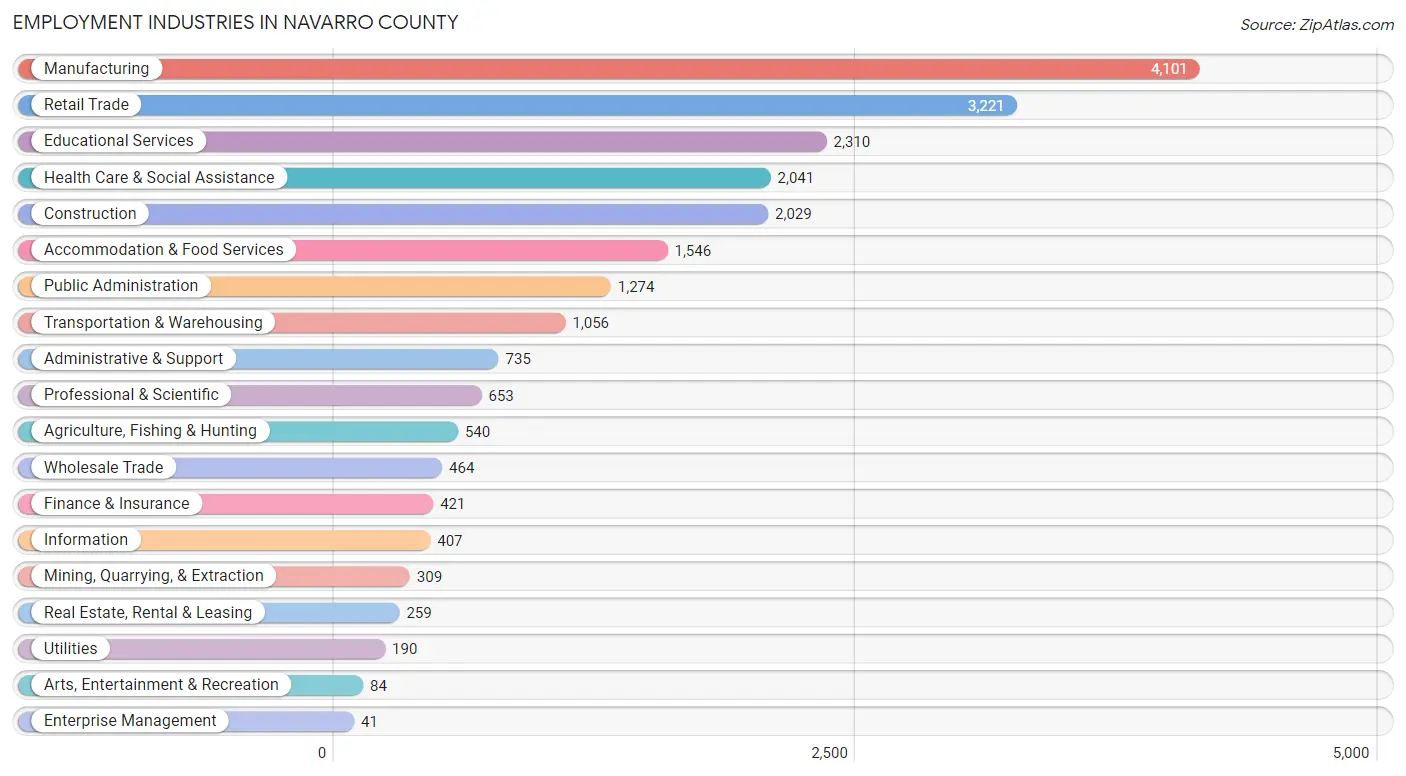
Employment Industries in Navarro County
The major employment industries in Navarro County include Manufacturing (4,101 | 17.9%), Retail Trade (3,221 | 14.1%), Educational Services (2,310 | 10.1%), Health Care & Social Assistance (2,041 | 8.9%), and Construction (2,029 | 8.9%).
Employment Industries by Sex in Navarro County
The Navarro County industries that see more men than women are Utilities (96.8%), Construction (95.9%), and Agriculture, Fishing & Hunting (85.0%), whereas the industries that tend to have a higher number of women are Enterprise Management (85.4%), Educational Services (84.7%), and Health Care & Social Assistance (83.5%).
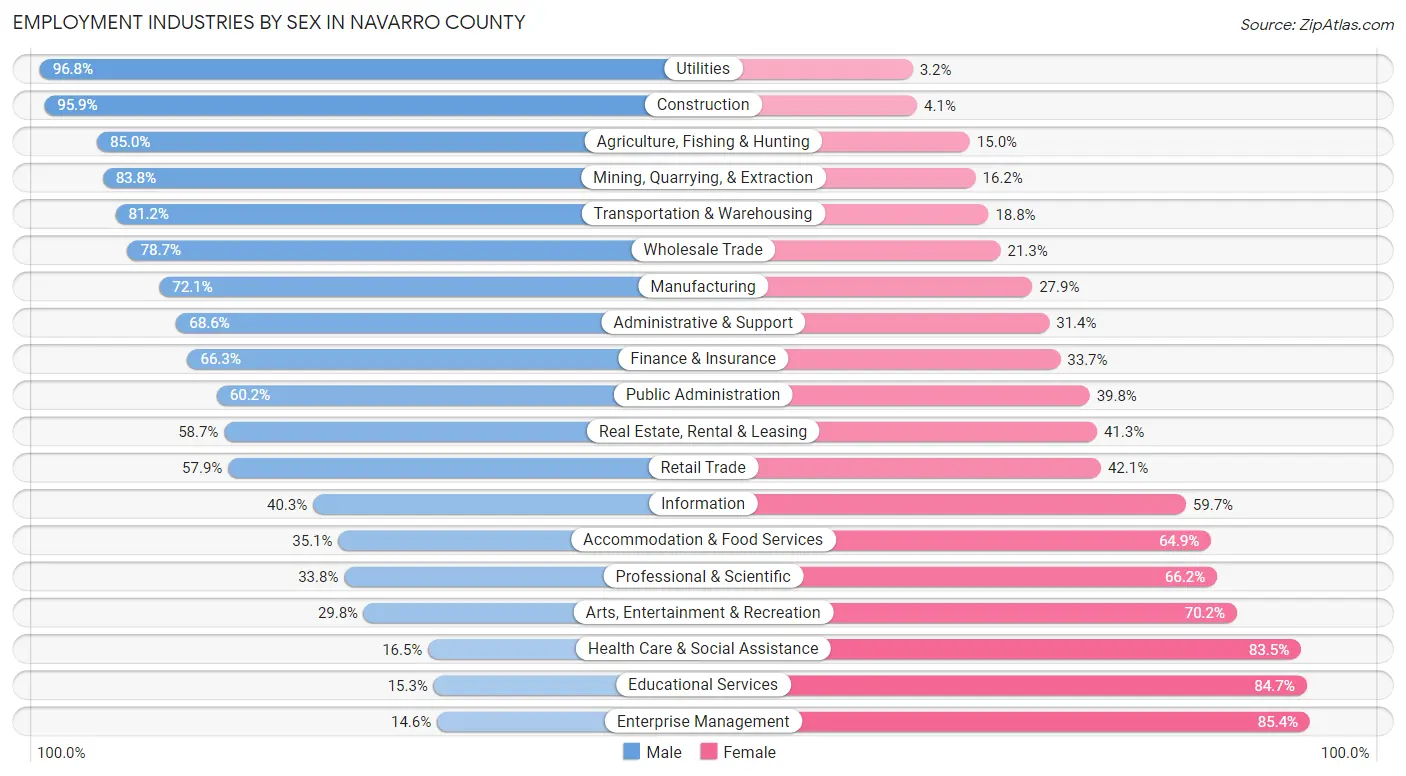
| Industry | Male | Female |
| Agriculture, Fishing & Hunting | 459 (85.0%) | 81 (15.0%) |
| Mining, Quarrying, & Extraction | 259 (83.8%) | 50 (16.2%) |
| Construction | 1,946 (95.9%) | 83 (4.1%) |
| Manufacturing | 2,957 (72.1%) | 1,144 (27.9%) |
| Wholesale Trade | 365 (78.7%) | 99 (21.3%) |
| Retail Trade | 1,864 (57.9%) | 1,357 (42.1%) |
| Transportation & Warehousing | 857 (81.2%) | 199 (18.8%) |
| Utilities | 184 (96.8%) | 6 (3.2%) |
| Information | 164 (40.3%) | 243 (59.7%) |
| Finance & Insurance | 279 (66.3%) | 142 (33.7%) |
| Real Estate, Rental & Leasing | 152 (58.7%) | 107 (41.3%) |
| Professional & Scientific | 221 (33.8%) | 432 (66.2%) |
| Enterprise Management | 6 (14.6%) | 35 (85.4%) |
| Administrative & Support | 504 (68.6%) | 231 (31.4%) |
| Educational Services | 354 (15.3%) | 1,956 (84.7%) |
| Health Care & Social Assistance | 336 (16.5%) | 1,705 (83.5%) |
| Arts, Entertainment & Recreation | 25 (29.8%) | 59 (70.2%) |
| Accommodation & Food Services | 542 (35.1%) | 1,004 (64.9%) |
| Public Administration | 767 (60.2%) | 507 (39.8%) |
| Total | 12,796 (56.0%) | 10,064 (44.0%) |
Education in Navarro County
School Enrollment in Navarro County
The most common levels of schooling among the 13,274 students in Navarro County are elementary school (3,303 | 24.9%), middle school (2,997 | 22.6%), and high school (2,992 | 22.5%).
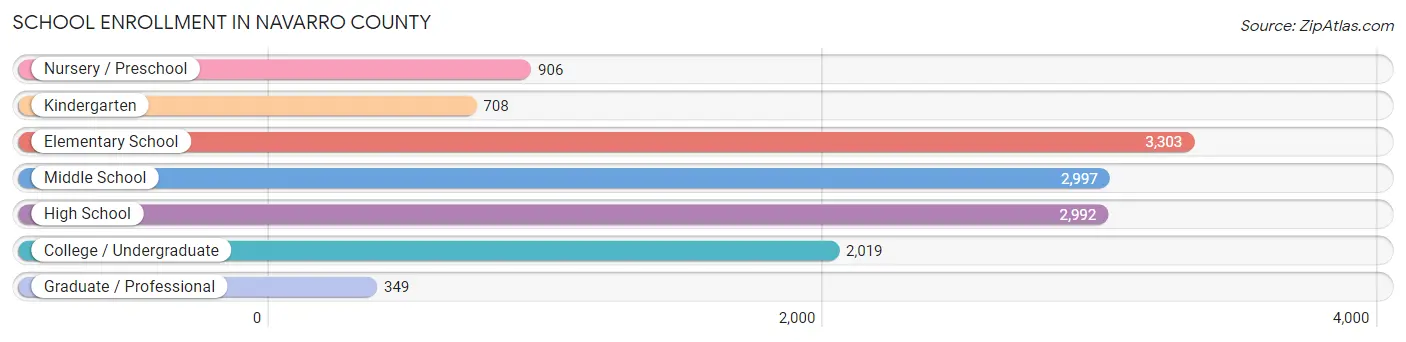
| School Level | # Students | % Students |
| Nursery / Preschool | 906 | 6.8% |
| Kindergarten | 708 | 5.3% |
| Elementary School | 3,303 | 24.9% |
| Middle School | 2,997 | 22.6% |
| High School | 2,992 | 22.5% |
| College / Undergraduate | 2,019 | 15.2% |
| Graduate / Professional | 349 | 2.6% |
| Total | 13,274 | 100.0% |
School Enrollment by Age by Funding Source in Navarro County
Out of a total of 13,274 students who are enrolled in schools in Navarro County, 1,049 (7.9%) attend a private institution, while the remaining 12,225 (92.1%) are enrolled in public schools. The age group of 25 to 34 year olds has the highest likelihood of being enrolled in private schools, with 160 (38.8% in the age bracket) enrolled. Conversely, the age group of 18 to 19 year olds has the lowest likelihood of being enrolled in a private school, with 903 (98.6% in the age bracket) attending a public institution.
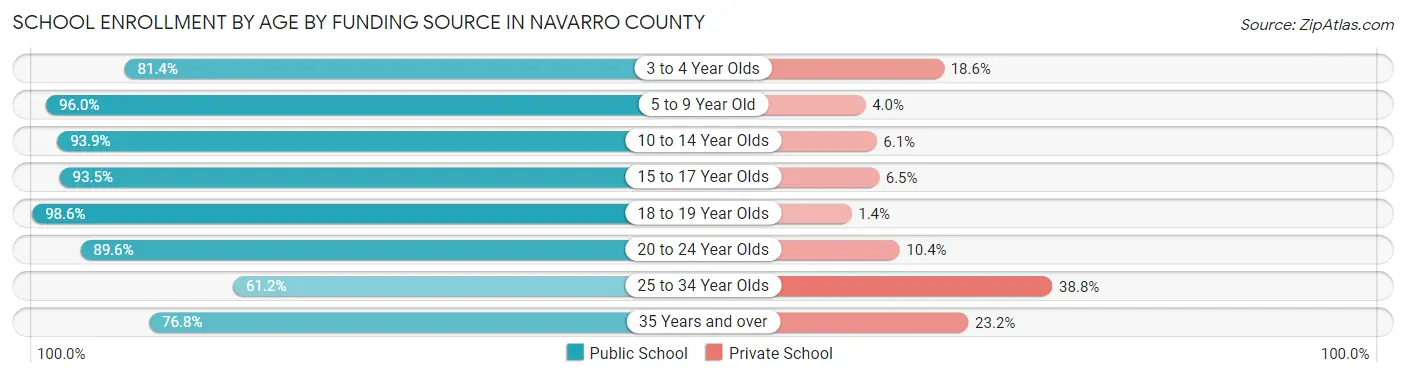
| Age Bracket | Public School | Private School |
| 3 to 4 Year Olds | 528 (81.4%) | 121 (18.6%) |
| 5 to 9 Year Old | 3,687 (96.0%) | 154 (4.0%) |
| 10 to 14 Year Olds | 3,461 (93.9%) | 224 (6.1%) |
| 15 to 17 Year Olds | 2,087 (93.5%) | 146 (6.5%) |
| 18 to 19 Year Olds | 903 (98.6%) | 13 (1.4%) |
| 20 to 24 Year Olds | 907 (89.6%) | 105 (10.4%) |
| 25 to 34 Year Olds | 252 (61.2%) | 160 (38.8%) |
| 35 Years and over | 404 (76.8%) | 122 (23.2%) |
| Total | 12,225 (92.1%) | 1,049 (7.9%) |
Educational Attainment by Field of Study in Navarro County
Business (1,292 | 21.2%), education (1,033 | 17.0%), science & technology (820 | 13.5%), bio, nature & agricultural (646 | 10.6%), and arts & humanities (398 | 6.5%) are the most common fields of study among 6,085 individuals in Navarro County who have obtained a bachelor's degree or higher.
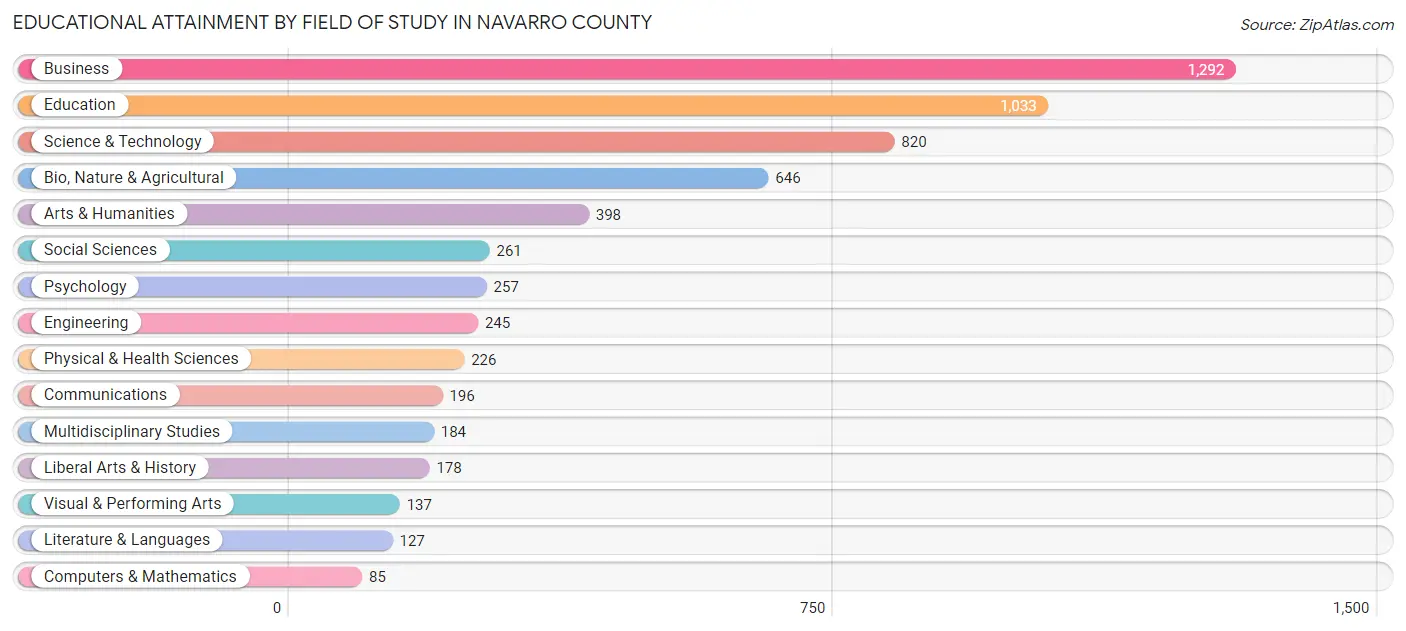
| Field of Study | # Graduates | % Graduates |
| Computers & Mathematics | 85 | 1.4% |
| Bio, Nature & Agricultural | 646 | 10.6% |
| Physical & Health Sciences | 226 | 3.7% |
| Psychology | 257 | 4.2% |
| Social Sciences | 261 | 4.3% |
| Engineering | 245 | 4.0% |
| Multidisciplinary Studies | 184 | 3.0% |
| Science & Technology | 820 | 13.5% |
| Business | 1,292 | 21.2% |
| Education | 1,033 | 17.0% |
| Literature & Languages | 127 | 2.1% |
| Liberal Arts & History | 178 | 2.9% |
| Visual & Performing Arts | 137 | 2.2% |
| Communications | 196 | 3.2% |
| Arts & Humanities | 398 | 6.5% |
| Total | 6,085 | 100.0% |
Transportation & Commute in Navarro County
Vehicle Availability by Sex in Navarro County
The most prevalent vehicle ownership categories in Navarro County are males with 2 vehicles (4,468, accounting for 35.8%) and females with 2 vehicles (3,865, making up 46.4%).
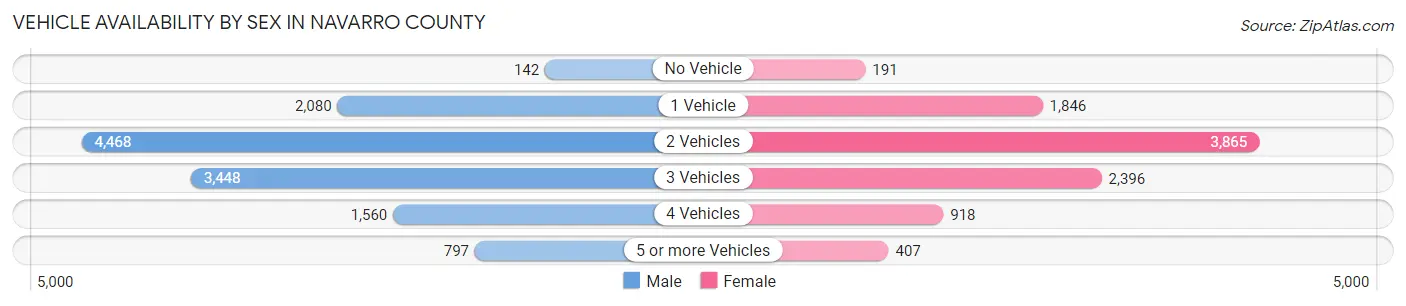
| Vehicles Available | Male | Female |
| No Vehicle | 142 (1.1%) | 191 (2.0%) |
| 1 Vehicle | 2,080 (16.7%) | 1,846 (19.2%) |
| 2 Vehicles | 4,468 (35.8%) | 3,865 (40.2%) |
| 3 Vehicles | 3,448 (27.6%) | 2,396 (24.9%) |
| 4 Vehicles | 1,560 (12.5%) | 918 (9.5%) |
| 5 or more Vehicles | 797 (6.4%) | 407 (4.2%) |
| Total | 12,495 (100.0%) | 9,623 (100.0%) |
Commute Time in Navarro County
The most frequently occuring commute durations in Navarro County are 5 to 9 minutes (4,062 commuters, 19.5%), 15 to 19 minutes (3,444 commuters, 16.5%), and 10 to 14 minutes (3,165 commuters, 15.2%).
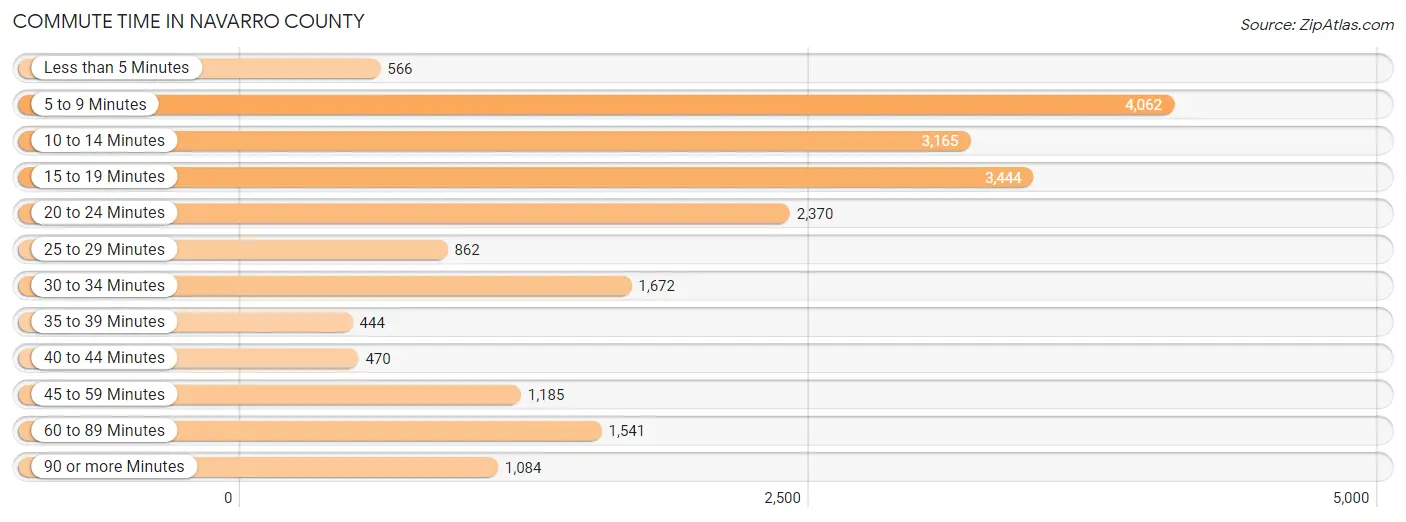
| Commute Time | # Commuters | % Commuters |
| Less than 5 Minutes | 566 | 2.7% |
| 5 to 9 Minutes | 4,062 | 19.5% |
| 10 to 14 Minutes | 3,165 | 15.2% |
| 15 to 19 Minutes | 3,444 | 16.5% |
| 20 to 24 Minutes | 2,370 | 11.4% |
| 25 to 29 Minutes | 862 | 4.1% |
| 30 to 34 Minutes | 1,672 | 8.0% |
| 35 to 39 Minutes | 444 | 2.1% |
| 40 to 44 Minutes | 470 | 2.2% |
| 45 to 59 Minutes | 1,185 | 5.7% |
| 60 to 89 Minutes | 1,541 | 7.4% |
| 90 or more Minutes | 1,084 | 5.2% |
Commute Time by Sex in Navarro County
The most common commute times in Navarro County are 5 to 9 minutes (2,079 commuters, 17.4%) for males and 5 to 9 minutes (1,983 commuters, 22.3%) for females.
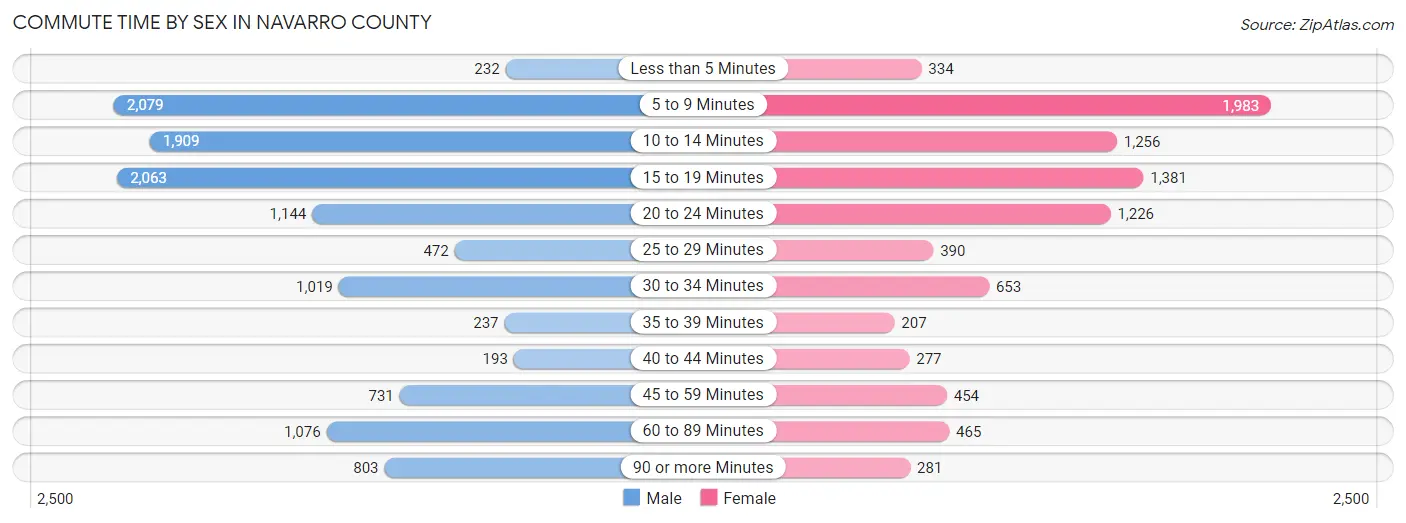
| Commute Time | Male | Female |
| Less than 5 Minutes | 232 (1.9%) | 334 (3.7%) |
| 5 to 9 Minutes | 2,079 (17.4%) | 1,983 (22.3%) |
| 10 to 14 Minutes | 1,909 (16.0%) | 1,256 (14.1%) |
| 15 to 19 Minutes | 2,063 (17.2%) | 1,381 (15.5%) |
| 20 to 24 Minutes | 1,144 (9.6%) | 1,226 (13.8%) |
| 25 to 29 Minutes | 472 (4.0%) | 390 (4.4%) |
| 30 to 34 Minutes | 1,019 (8.5%) | 653 (7.3%) |
| 35 to 39 Minutes | 237 (2.0%) | 207 (2.3%) |
| 40 to 44 Minutes | 193 (1.6%) | 277 (3.1%) |
| 45 to 59 Minutes | 731 (6.1%) | 454 (5.1%) |
| 60 to 89 Minutes | 1,076 (9.0%) | 465 (5.2%) |
| 90 or more Minutes | 803 (6.7%) | 281 (3.2%) |
Time of Departure to Work by Sex in Navarro County
The most frequent times of departure to work in Navarro County are 12:00 AM to 4:59 AM (1,755, 14.7%) for males and 7:00 AM to 7:29 AM (1,706, 19.2%) for females.
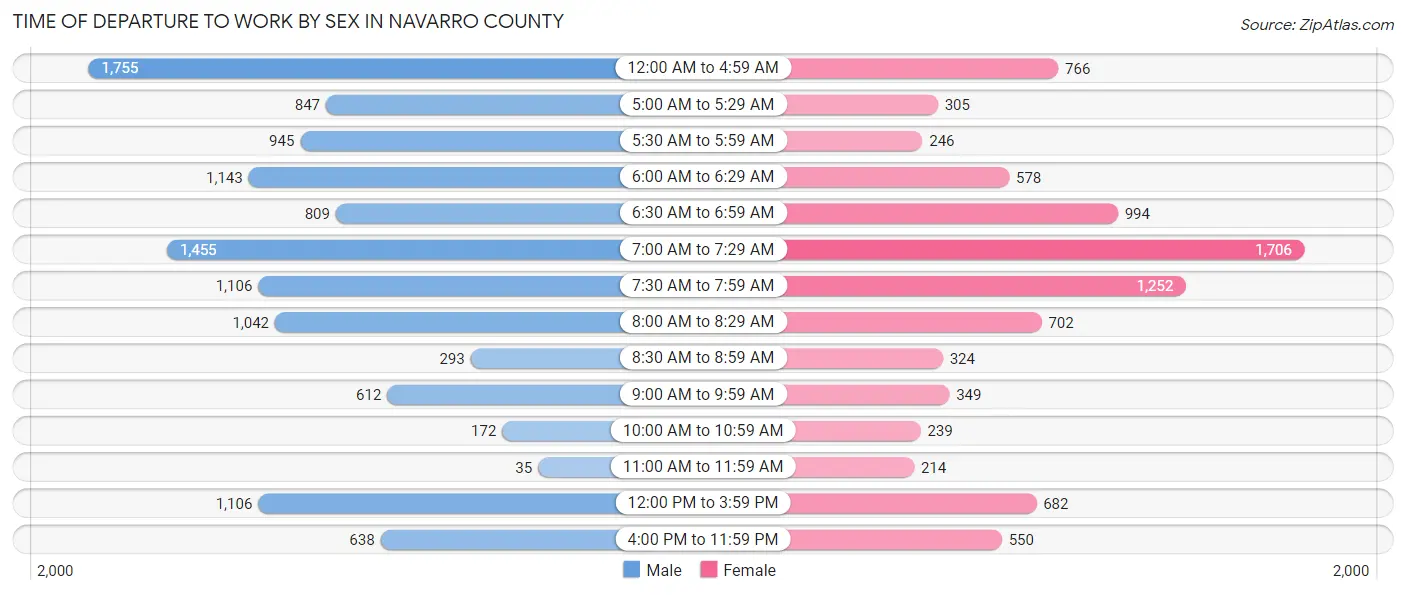
| Time of Departure | Male | Female |
| 12:00 AM to 4:59 AM | 1,755 (14.7%) | 766 (8.6%) |
| 5:00 AM to 5:29 AM | 847 (7.1%) | 305 (3.4%) |
| 5:30 AM to 5:59 AM | 945 (7.9%) | 246 (2.8%) |
| 6:00 AM to 6:29 AM | 1,143 (9.6%) | 578 (6.5%) |
| 6:30 AM to 6:59 AM | 809 (6.8%) | 994 (11.2%) |
| 7:00 AM to 7:29 AM | 1,455 (12.2%) | 1,706 (19.2%) |
| 7:30 AM to 7:59 AM | 1,106 (9.2%) | 1,252 (14.1%) |
| 8:00 AM to 8:29 AM | 1,042 (8.7%) | 702 (7.9%) |
| 8:30 AM to 8:59 AM | 293 (2.5%) | 324 (3.6%) |
| 9:00 AM to 9:59 AM | 612 (5.1%) | 349 (3.9%) |
| 10:00 AM to 10:59 AM | 172 (1.4%) | 239 (2.7%) |
| 11:00 AM to 11:59 AM | 35 (0.3%) | 214 (2.4%) |
| 12:00 PM to 3:59 PM | 1,106 (9.2%) | 682 (7.7%) |
| 4:00 PM to 11:59 PM | 638 (5.3%) | 550 (6.2%) |
| Total | 11,958 (100.0%) | 8,907 (100.0%) |
Housing Occupancy in Navarro County
Occupancy by Ownership in Navarro County
Of the total 18,058 dwellings in Navarro County, owner-occupied units account for 12,257 (67.9%), while renter-occupied units make up 5,801 (32.1%).
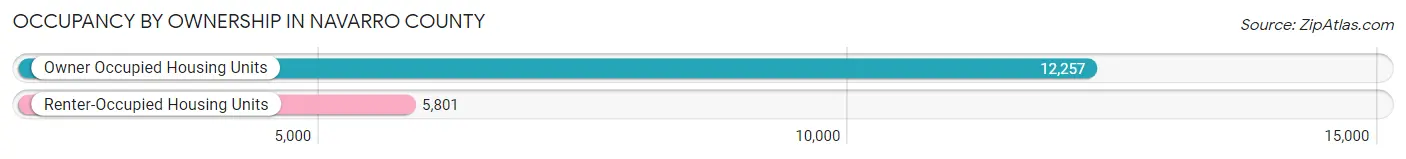
| Occupancy | # Housing Units | % Housing Units |
| Owner Occupied Housing Units | 12,257 | 67.9% |
| Renter-Occupied Housing Units | 5,801 | 32.1% |
| Total Occupied Housing Units | 18,058 | 100.0% |
Occupancy by Household Size in Navarro County
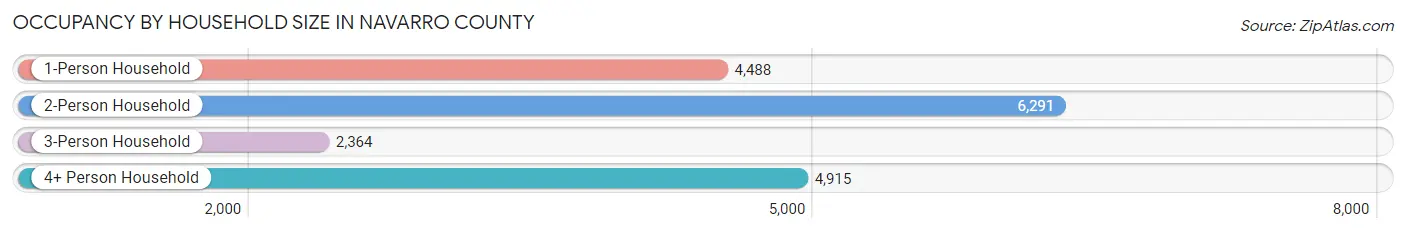
| Household Size | # Housing Units | % Housing Units |
| 1-Person Household | 4,488 | 24.8% |
| 2-Person Household | 6,291 | 34.8% |
| 3-Person Household | 2,364 | 13.1% |
| 4+ Person Household | 4,915 | 27.2% |
| Total Housing Units | 18,058 | 100.0% |
Occupancy by Ownership by Household Size in Navarro County
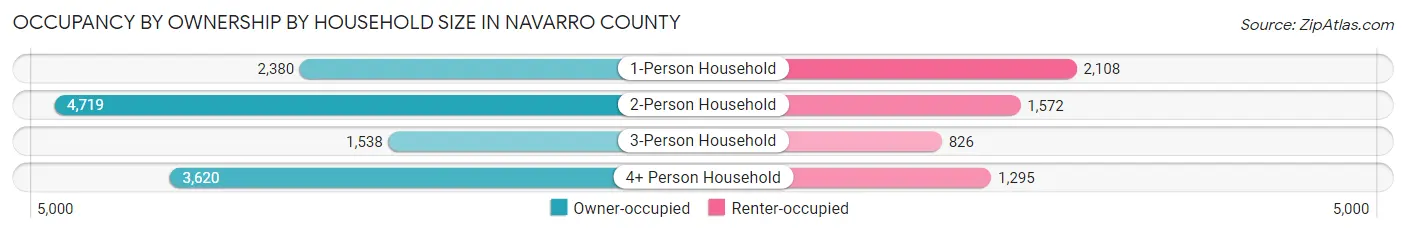
| Household Size | Owner-occupied | Renter-occupied |
| 1-Person Household | 2,380 (53.0%) | 2,108 (47.0%) |
| 2-Person Household | 4,719 (75.0%) | 1,572 (25.0%) |
| 3-Person Household | 1,538 (65.1%) | 826 (34.9%) |
| 4+ Person Household | 3,620 (73.7%) | 1,295 (26.4%) |
| Total Housing Units | 12,257 (67.9%) | 5,801 (32.1%) |
Occupancy by Educational Attainment in Navarro County
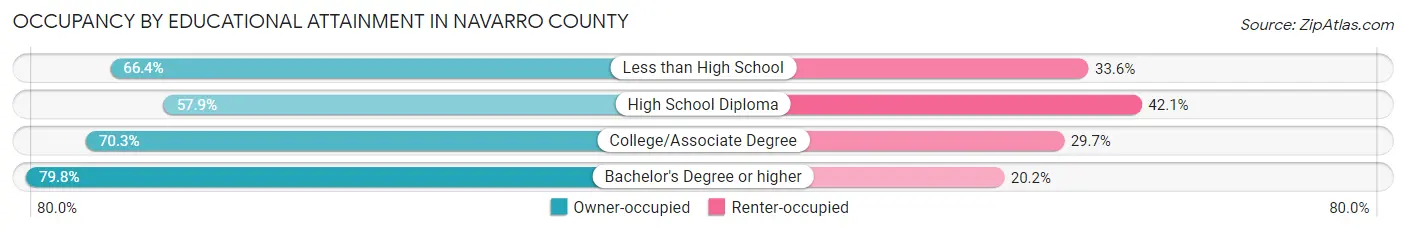
| Household Size | Owner-occupied | Renter-occupied |
| Less than High School | 2,181 (66.4%) | 1,104 (33.6%) |
| High School Diploma | 2,908 (57.9%) | 2,112 (42.1%) |
| College/Associate Degree | 4,520 (70.3%) | 1,913 (29.7%) |
| Bachelor's Degree or higher | 2,648 (79.8%) | 672 (20.2%) |
Occupancy by Age of Householder in Navarro County
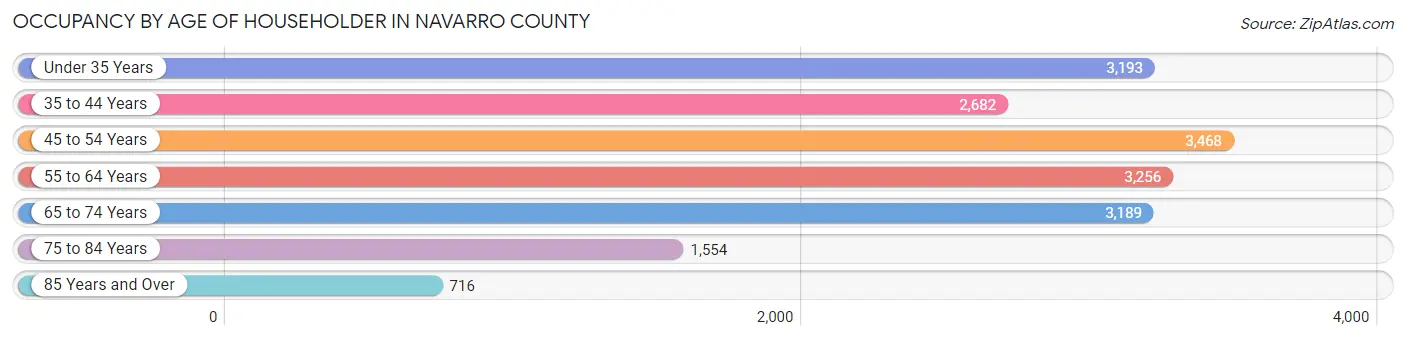
| Age Bracket | # Households | % Households |
| Under 35 Years | 3,193 | 17.7% |
| 35 to 44 Years | 2,682 | 14.8% |
| 45 to 54 Years | 3,468 | 19.2% |
| 55 to 64 Years | 3,256 | 18.0% |
| 65 to 74 Years | 3,189 | 17.7% |
| 75 to 84 Years | 1,554 | 8.6% |
| 85 Years and Over | 716 | 4.0% |
| Total | 18,058 | 100.0% |
Housing Finances in Navarro County
Median Income by Occupancy in Navarro County
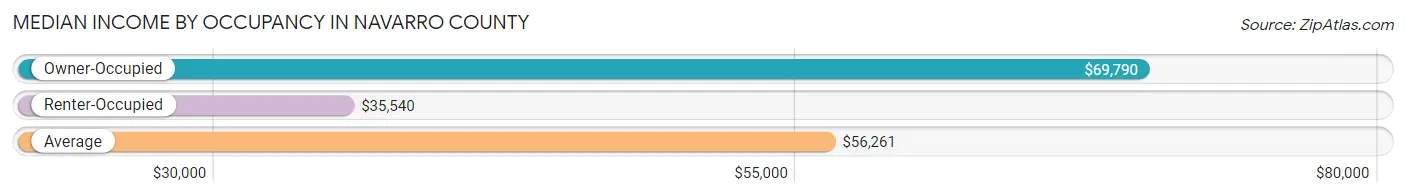
| Occupancy Type | # Households | Median Income |
| Owner-Occupied | 12,257 (67.9%) | $69,790 |
| Renter-Occupied | 5,801 (32.1%) | $35,540 |
| Average | 18,058 (100.0%) | $56,261 |
Occupancy by Householder Income Bracket in Navarro County
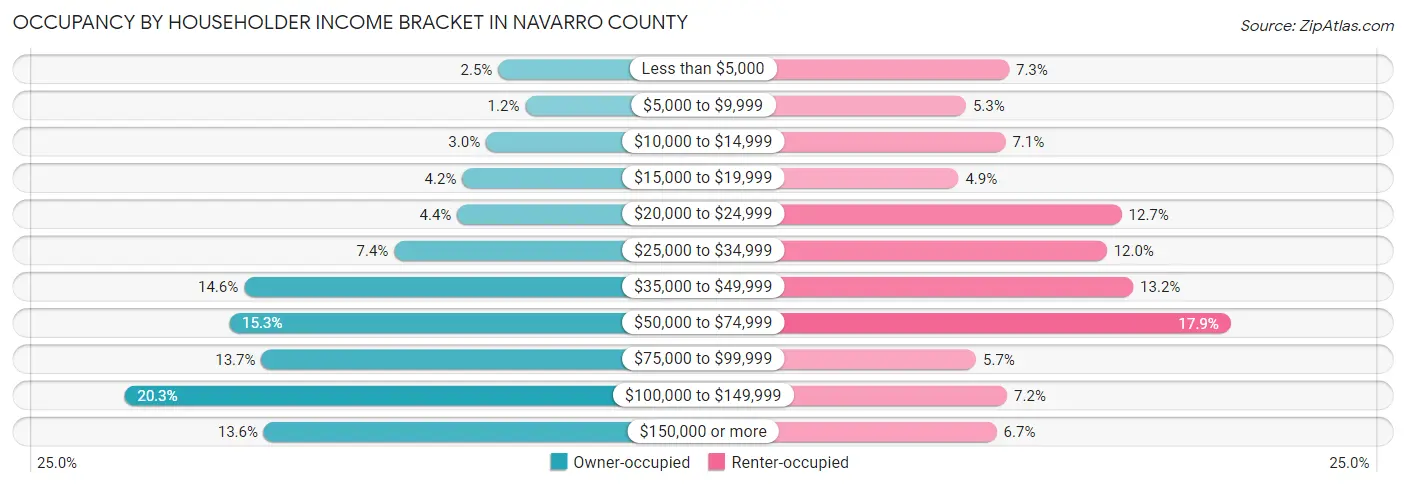
| Income Bracket | Owner-occupied | Renter-occupied |
| Less than $5,000 | 300 (2.5%) | 424 (7.3%) |
| $5,000 to $9,999 | 142 (1.2%) | 305 (5.3%) |
| $10,000 to $14,999 | 371 (3.0%) | 414 (7.1%) |
| $15,000 to $19,999 | 510 (4.2%) | 284 (4.9%) |
| $20,000 to $24,999 | 539 (4.4%) | 735 (12.7%) |
| $25,000 to $34,999 | 907 (7.4%) | 694 (12.0%) |
| $35,000 to $49,999 | 1,784 (14.5%) | 767 (13.2%) |
| $50,000 to $74,999 | 1,871 (15.3%) | 1,036 (17.9%) |
| $75,000 to $99,999 | 1,683 (13.7%) | 333 (5.7%) |
| $100,000 to $149,999 | 2,482 (20.3%) | 419 (7.2%) |
| $150,000 or more | 1,668 (13.6%) | 390 (6.7%) |
| Total | 12,257 (100.0%) | 5,801 (100.0%) |
Monthly Housing Cost Tiers in Navarro County
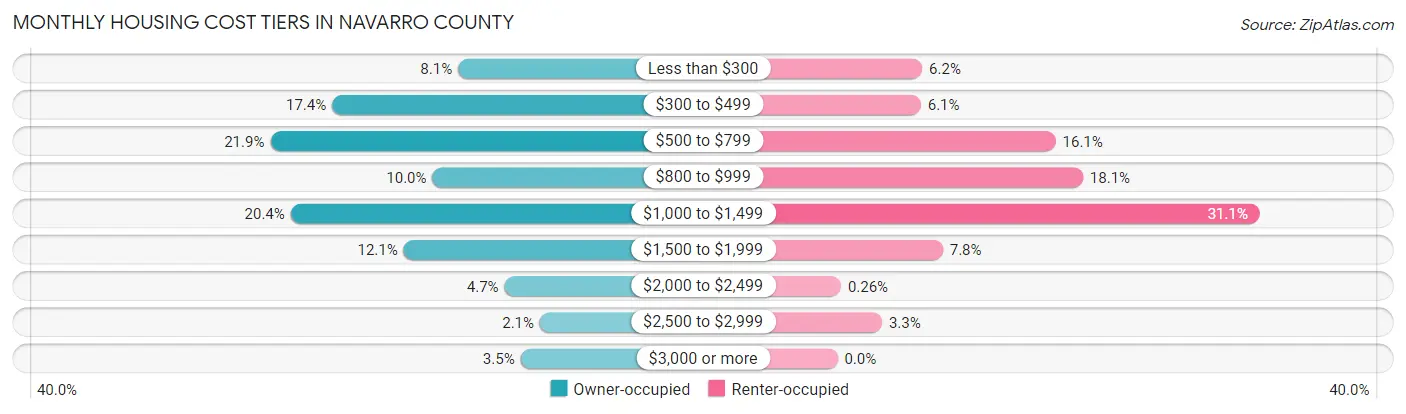
| Monthly Cost | Owner-occupied | Renter-occupied |
| Less than $300 | 990 (8.1%) | 362 (6.2%) |
| $300 to $499 | 2,128 (17.4%) | 356 (6.1%) |
| $500 to $799 | 2,685 (21.9%) | 932 (16.1%) |
| $800 to $999 | 1,222 (10.0%) | 1,049 (18.1%) |
| $1,000 to $1,499 | 2,502 (20.4%) | 1,804 (31.1%) |
| $1,500 to $1,999 | 1,482 (12.1%) | 450 (7.8%) |
| $2,000 to $2,499 | 571 (4.7%) | 15 (0.3%) |
| $2,500 to $2,999 | 251 (2.1%) | 190 (3.3%) |
| $3,000 or more | 426 (3.5%) | 0 (0.0%) |
| Total | 12,257 (100.0%) | 5,801 (100.0%) |
Physical Housing Characteristics in Navarro County
Housing Structures in Navarro County
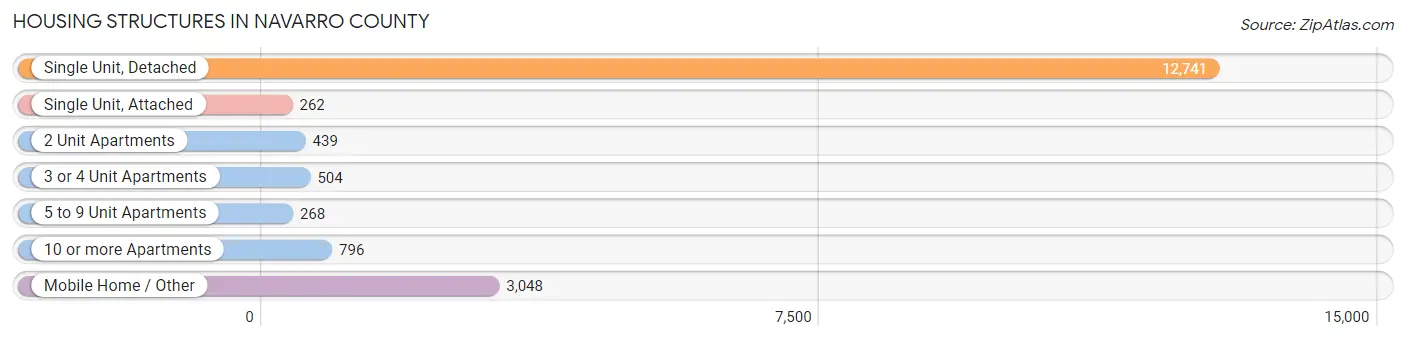
| Structure Type | # Housing Units | % Housing Units |
| Single Unit, Detached | 12,741 | 70.6% |
| Single Unit, Attached | 262 | 1.5% |
| 2 Unit Apartments | 439 | 2.4% |
| 3 or 4 Unit Apartments | 504 | 2.8% |
| 5 to 9 Unit Apartments | 268 | 1.5% |
| 10 or more Apartments | 796 | 4.4% |
| Mobile Home / Other | 3,048 | 16.9% |
| Total | 18,058 | 100.0% |
Housing Structures by Occupancy in Navarro County
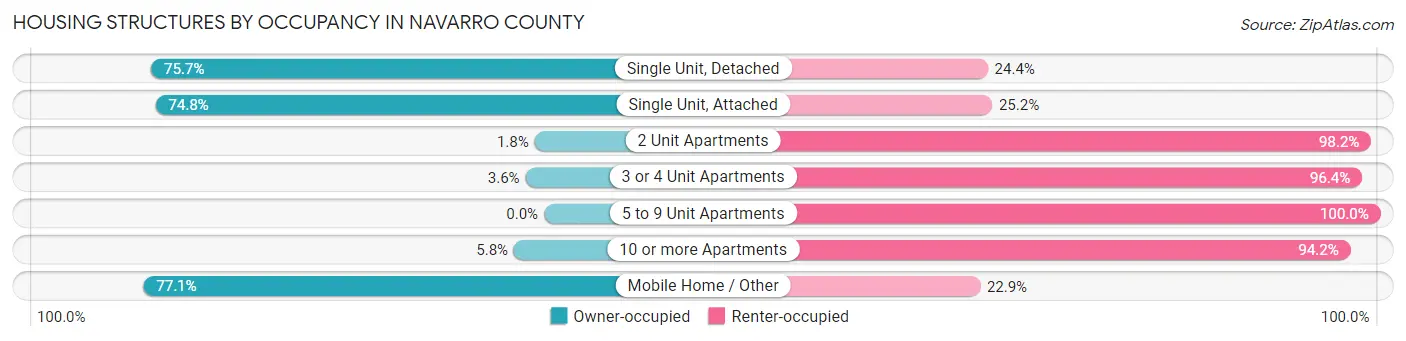
| Structure Type | Owner-occupied | Renter-occupied |
| Single Unit, Detached | 9,638 (75.6%) | 3,103 (24.3%) |
| Single Unit, Attached | 196 (74.8%) | 66 (25.2%) |
| 2 Unit Apartments | 8 (1.8%) | 431 (98.2%) |
| 3 or 4 Unit Apartments | 18 (3.6%) | 486 (96.4%) |
| 5 to 9 Unit Apartments | 0 (0.0%) | 268 (100.0%) |
| 10 or more Apartments | 46 (5.8%) | 750 (94.2%) |
| Mobile Home / Other | 2,351 (77.1%) | 697 (22.9%) |
| Total | 12,257 (67.9%) | 5,801 (32.1%) |
Housing Structures by Number of Rooms in Navarro County
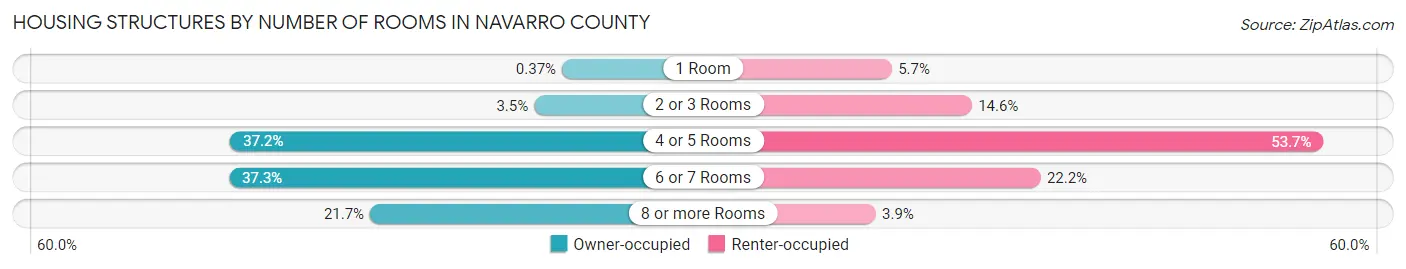
| Number of Rooms | Owner-occupied | Renter-occupied |
| 1 Room | 45 (0.4%) | 330 (5.7%) |
| 2 or 3 Rooms | 424 (3.5%) | 845 (14.6%) |
| 4 or 5 Rooms | 4,558 (37.2%) | 3,112 (53.6%) |
| 6 or 7 Rooms | 4,574 (37.3%) | 1,288 (22.2%) |
| 8 or more Rooms | 2,656 (21.7%) | 226 (3.9%) |
| Total | 12,257 (100.0%) | 5,801 (100.0%) |
Housing Structure by Heating Type in Navarro County
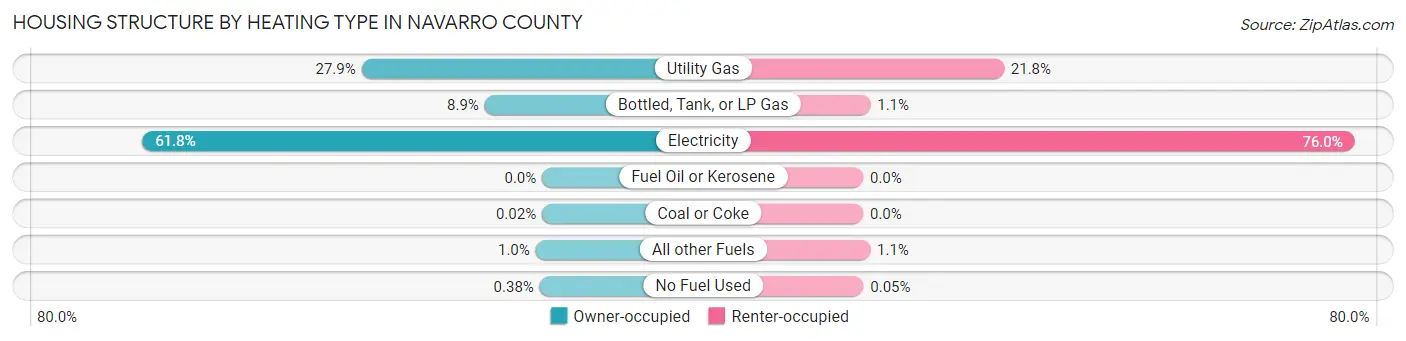
| Heating Type | Owner-occupied | Renter-occupied |
| Utility Gas | 3,421 (27.9%) | 1,263 (21.8%) |
| Bottled, Tank, or LP Gas | 1,088 (8.9%) | 65 (1.1%) |
| Electricity | 7,576 (61.8%) | 4,407 (76.0%) |
| Fuel Oil or Kerosene | 0 (0.0%) | 0 (0.0%) |
| Coal or Coke | 2 (0.0%) | 0 (0.0%) |
| All other Fuels | 123 (1.0%) | 63 (1.1%) |
| No Fuel Used | 47 (0.4%) | 3 (0.1%) |
| Total | 12,257 (100.0%) | 5,801 (100.0%) |
Household Vehicle Usage in Navarro County
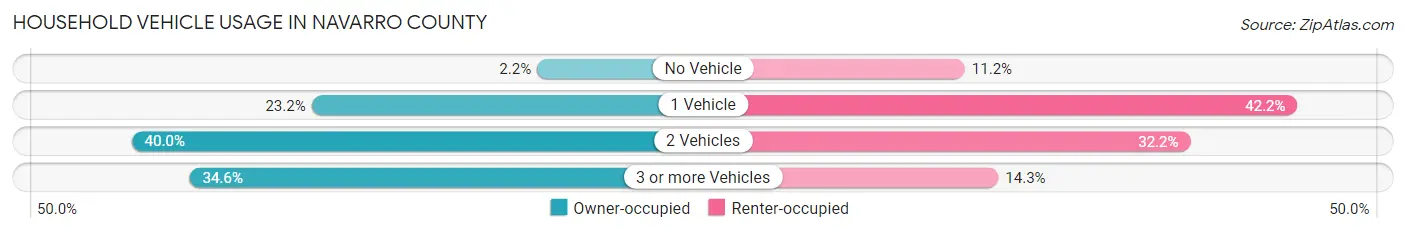
| Vehicles per Household | Owner-occupied | Renter-occupied |
| No Vehicle | 266 (2.2%) | 650 (11.2%) |
| 1 Vehicle | 2,846 (23.2%) | 2,450 (42.2%) |
| 2 Vehicles | 4,904 (40.0%) | 1,870 (32.2%) |
| 3 or more Vehicles | 4,241 (34.6%) | 831 (14.3%) |
| Total | 12,257 (100.0%) | 5,801 (100.0%) |
Real Estate & Mortgages in Navarro County
Real Estate and Mortgage Overview in Navarro County
| Characteristic | Without Mortgage | With Mortgage |
| Housing Units | 6,510 | 5,747 |
| Median Property Value | $116,600 | $171,700 |
| Median Household Income | $55,459 | $953 |
| Monthly Housing Costs | $538 | $421 |
| Real Estate Taxes | $1,655 | $296 |
Property Value by Mortgage Status in Navarro County
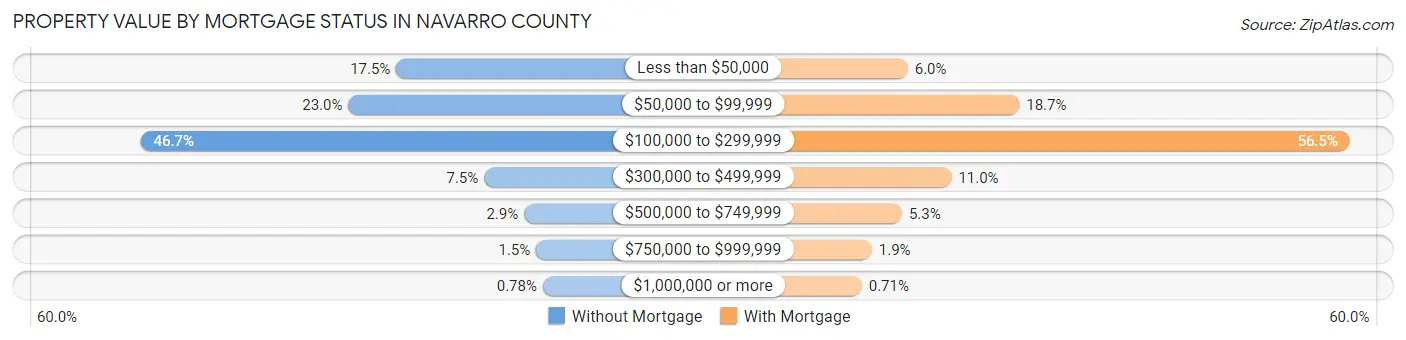
| Property Value | Without Mortgage | With Mortgage |
| Less than $50,000 | 1,141 (17.5%) | 343 (6.0%) |
| $50,000 to $99,999 | 1,498 (23.0%) | 1,075 (18.7%) |
| $100,000 to $299,999 | 3,043 (46.7%) | 3,246 (56.5%) |
| $300,000 to $499,999 | 487 (7.5%) | 630 (11.0%) |
| $500,000 to $749,999 | 190 (2.9%) | 305 (5.3%) |
| $750,000 to $999,999 | 100 (1.5%) | 107 (1.9%) |
| $1,000,000 or more | 51 (0.8%) | 41 (0.7%) |
| Total | 6,510 (100.0%) | 5,747 (100.0%) |
Household Income by Mortgage Status in Navarro County
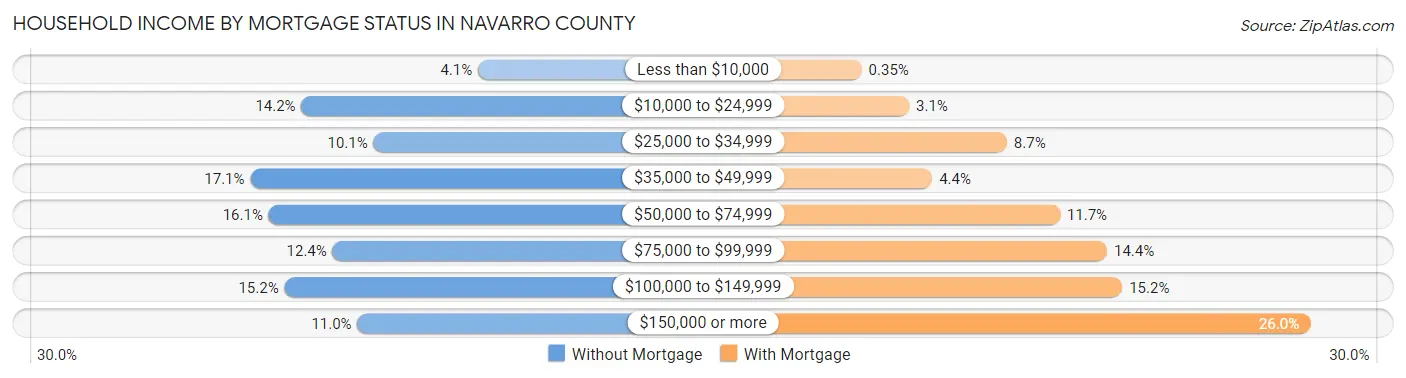
| Household Income | Without Mortgage | With Mortgage |
| Less than $10,000 | 266 (4.1%) | 20 (0.4%) |
| $10,000 to $24,999 | 923 (14.2%) | 176 (3.1%) |
| $25,000 to $34,999 | 655 (10.1%) | 497 (8.6%) |
| $35,000 to $49,999 | 1,113 (17.1%) | 252 (4.4%) |
| $50,000 to $74,999 | 1,045 (16.1%) | 671 (11.7%) |
| $75,000 to $99,999 | 807 (12.4%) | 826 (14.4%) |
| $100,000 to $149,999 | 986 (15.1%) | 876 (15.2%) |
| $150,000 or more | 715 (11.0%) | 1,496 (26.0%) |
| Total | 6,510 (100.0%) | 5,747 (100.0%) |
Property Value to Household Income Ratio in Navarro County
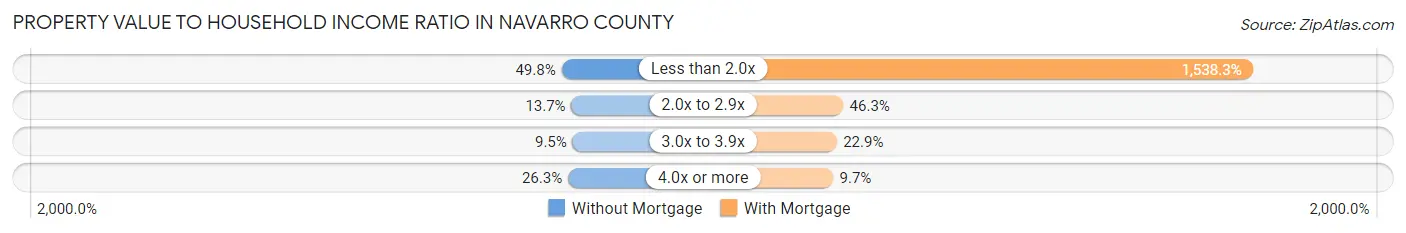
| Value-to-Income Ratio | Without Mortgage | With Mortgage |
| Less than 2.0x | 3,244 (49.8%) | 88,408 (1,538.3%) |
| 2.0x to 2.9x | 894 (13.7%) | 2,659 (46.3%) |
| 3.0x to 3.9x | 621 (9.5%) | 1,315 (22.9%) |
| 4.0x or more | 1,710 (26.3%) | 557 (9.7%) |
| Total | 6,510 (100.0%) | 5,747 (100.0%) |
Real Estate Taxes by Mortgage Status in Navarro County
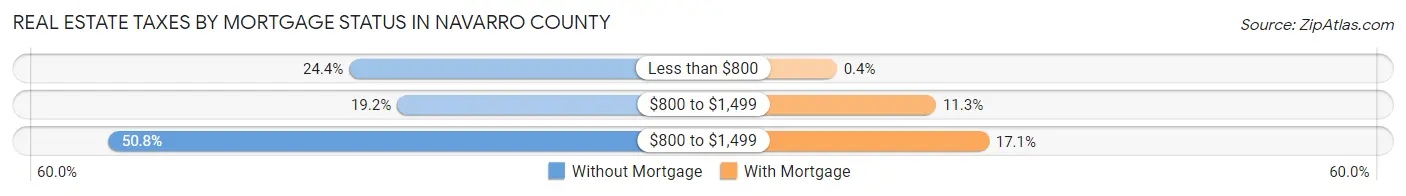
| Property Taxes | Without Mortgage | With Mortgage |
| Less than $800 | 1,591 (24.4%) | 23 (0.4%) |
| $800 to $1,499 | 1,249 (19.2%) | 648 (11.3%) |
| $800 to $1,499 | 3,305 (50.8%) | 981 (17.1%) |
| Total | 6,510 (100.0%) | 5,747 (100.0%) |
Health & Disability in Navarro County
Health Insurance Coverage by Age in Navarro County
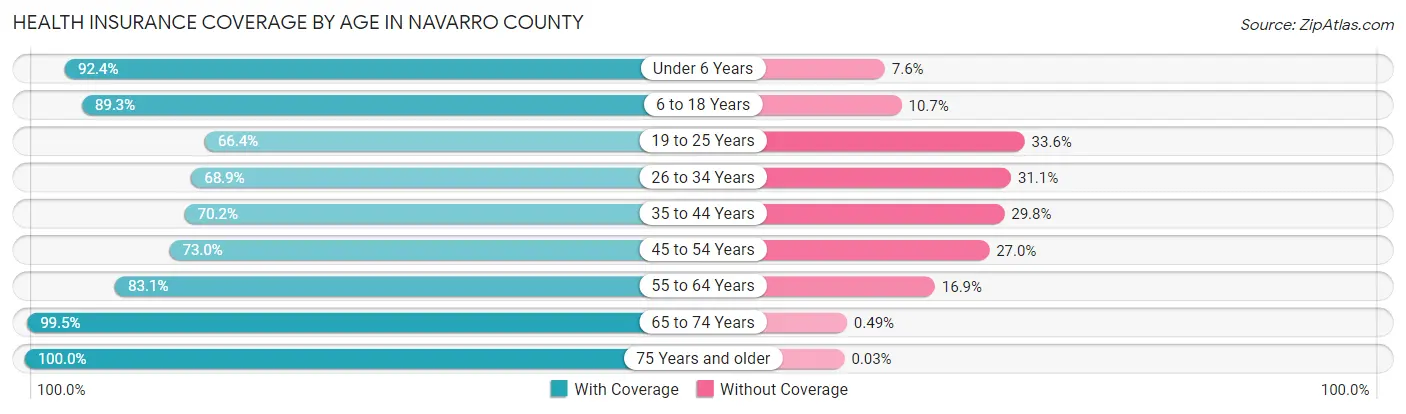
| Age Bracket | With Coverage | Without Coverage |
| Under 6 Years | 3,891 (92.4%) | 318 (7.6%) |
| 6 to 18 Years | 8,891 (89.3%) | 1,063 (10.7%) |
| 19 to 25 Years | 3,256 (66.4%) | 1,650 (33.6%) |
| 26 to 34 Years | 3,794 (68.9%) | 1,712 (31.1%) |
| 35 to 44 Years | 4,399 (70.2%) | 1,870 (29.8%) |
| 45 to 54 Years | 4,432 (73.0%) | 1,641 (27.0%) |
| 55 to 64 Years | 5,557 (83.1%) | 1,129 (16.9%) |
| 65 to 74 Years | 5,091 (99.5%) | 25 (0.5%) |
| 75 Years and older | 3,304 (100.0%) | 1 (0.0%) |
| Total | 42,615 (81.9%) | 9,409 (18.1%) |
Health Insurance Coverage by Citizenship Status in Navarro County
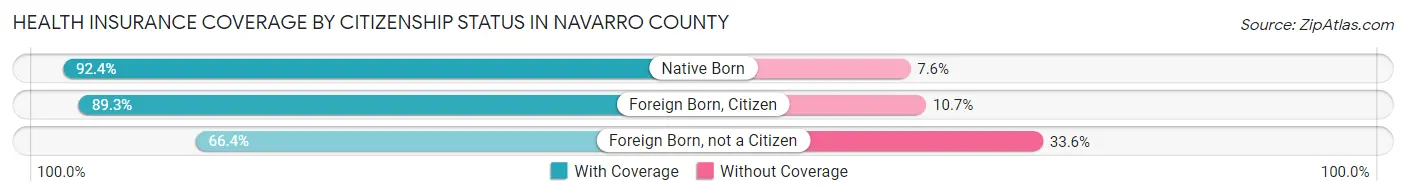
| Citizenship Status | With Coverage | Without Coverage |
| Native Born | 3,891 (92.4%) | 318 (7.6%) |
| Foreign Born, Citizen | 8,891 (89.3%) | 1,063 (10.7%) |
| Foreign Born, not a Citizen | 3,256 (66.4%) | 1,650 (33.6%) |
Health Insurance Coverage by Household Income in Navarro County
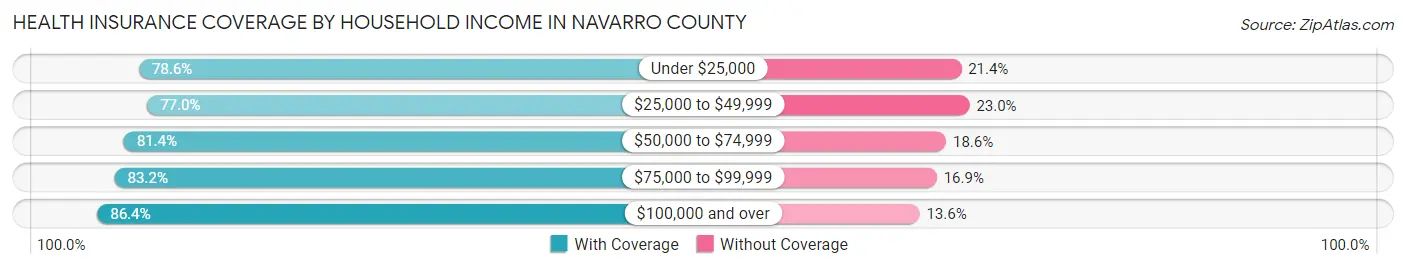
| Household Income | With Coverage | Without Coverage |
| Under $25,000 | 6,115 (78.6%) | 1,668 (21.4%) |
| $25,000 to $49,999 | 8,662 (77.0%) | 2,585 (23.0%) |
| $50,000 to $74,999 | 7,042 (81.4%) | 1,608 (18.6%) |
| $75,000 to $99,999 | 5,479 (83.2%) | 1,110 (16.9%) |
| $100,000 and over | 15,045 (86.4%) | 2,373 (13.6%) |
Public vs Private Health Insurance Coverage by Age in Navarro County
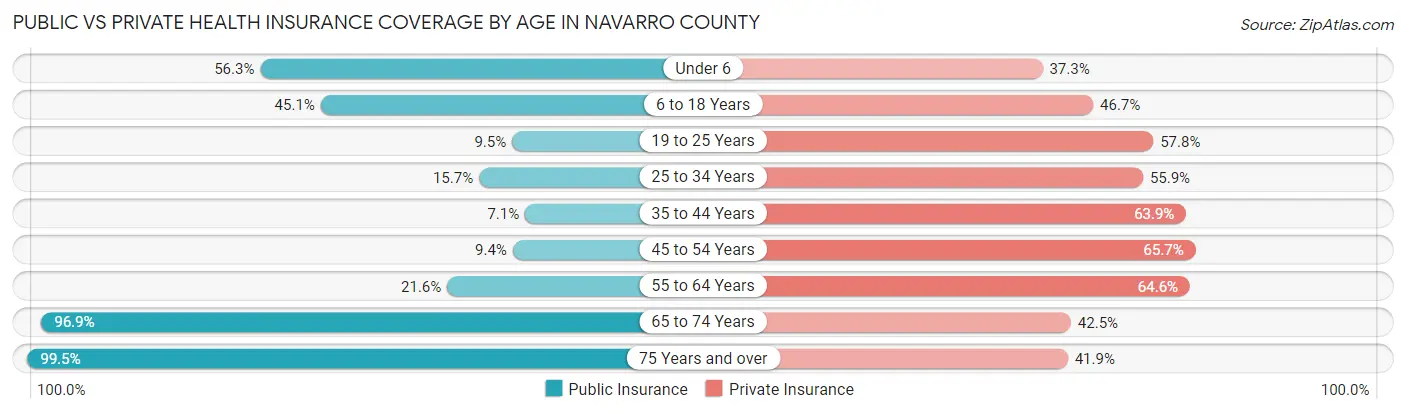
| Age Bracket | Public Insurance | Private Insurance |
| Under 6 | 2,368 (56.3%) | 1,568 (37.2%) |
| 6 to 18 Years | 4,484 (45.1%) | 4,644 (46.7%) |
| 19 to 25 Years | 467 (9.5%) | 2,836 (57.8%) |
| 25 to 34 Years | 862 (15.7%) | 3,078 (55.9%) |
| 35 to 44 Years | 446 (7.1%) | 4,007 (63.9%) |
| 45 to 54 Years | 571 (9.4%) | 3,988 (65.7%) |
| 55 to 64 Years | 1,443 (21.6%) | 4,320 (64.6%) |
| 65 to 74 Years | 4,957 (96.9%) | 2,176 (42.5%) |
| 75 Years and over | 3,288 (99.5%) | 1,386 (41.9%) |
| Total | 18,886 (36.3%) | 28,003 (53.8%) |
Disability Status by Sex by Age in Navarro County
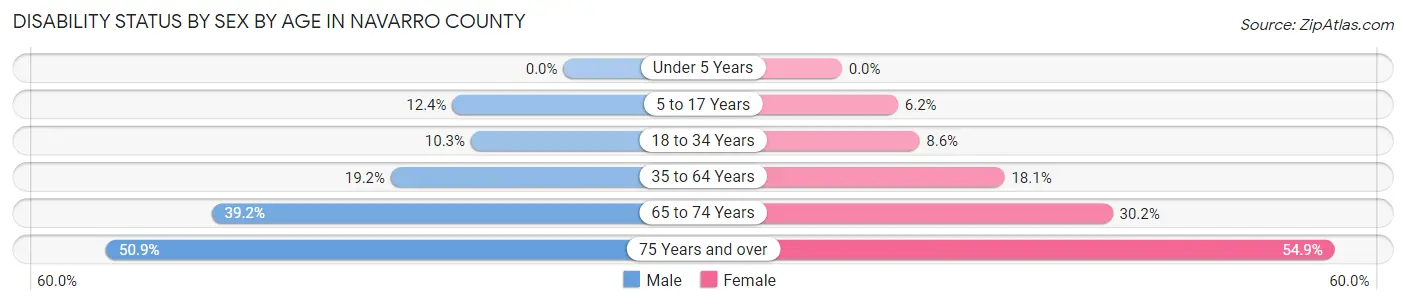
| Age Bracket | Male | Female |
| Under 5 Years | 0 (0.0%) | 0 (0.0%) |
| 5 to 17 Years | 620 (12.4%) | 308 (6.2%) |
| 18 to 34 Years | 615 (10.3%) | 450 (8.6%) |
| 35 to 64 Years | 1,824 (19.2%) | 1,728 (18.1%) |
| 65 to 74 Years | 971 (39.2%) | 795 (30.1%) |
| 75 Years and over | 701 (50.9%) | 1,058 (54.9%) |
Disability Class by Sex by Age in Navarro County
Disability Class: Hearing Difficulty
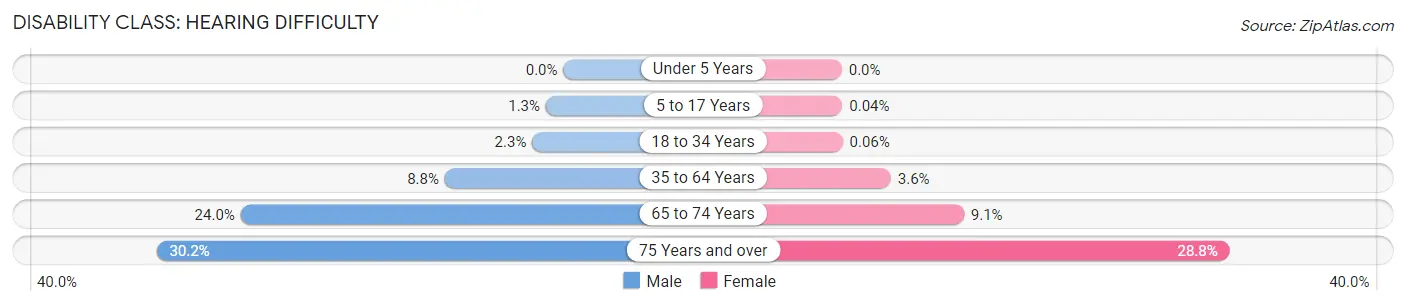
| Age Bracket | Male | Female |
| Under 5 Years | 0 (0.0%) | 0 (0.0%) |
| 5 to 17 Years | 65 (1.3%) | 2 (0.0%) |
| 18 to 34 Years | 138 (2.3%) | 3 (0.1%) |
| 35 to 64 Years | 835 (8.8%) | 347 (3.6%) |
| 65 to 74 Years | 594 (24.0%) | 239 (9.1%) |
| 75 Years and over | 416 (30.2%) | 555 (28.8%) |
Disability Class: Vision Difficulty
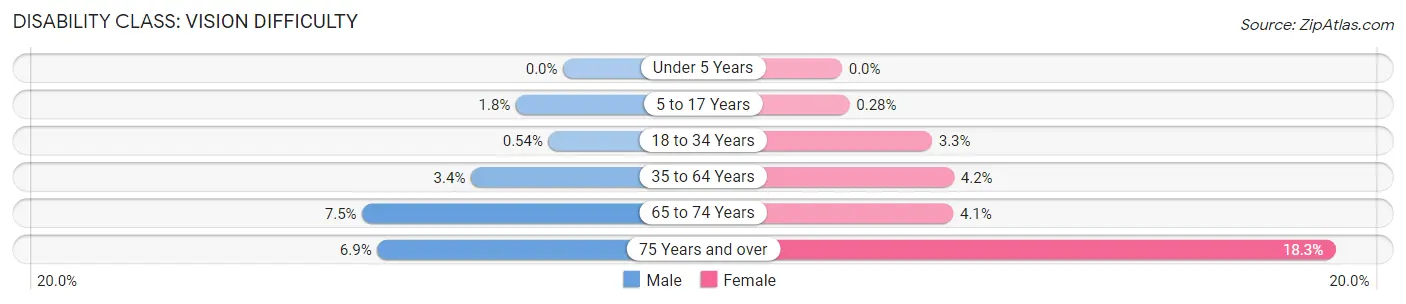
| Age Bracket | Male | Female |
| Under 5 Years | 0 (0.0%) | 0 (0.0%) |
| 5 to 17 Years | 88 (1.8%) | 14 (0.3%) |
| 18 to 34 Years | 32 (0.5%) | 174 (3.3%) |
| 35 to 64 Years | 325 (3.4%) | 397 (4.2%) |
| 65 to 74 Years | 185 (7.5%) | 109 (4.1%) |
| 75 Years and over | 95 (6.9%) | 353 (18.3%) |
Disability Class: Cognitive Difficulty
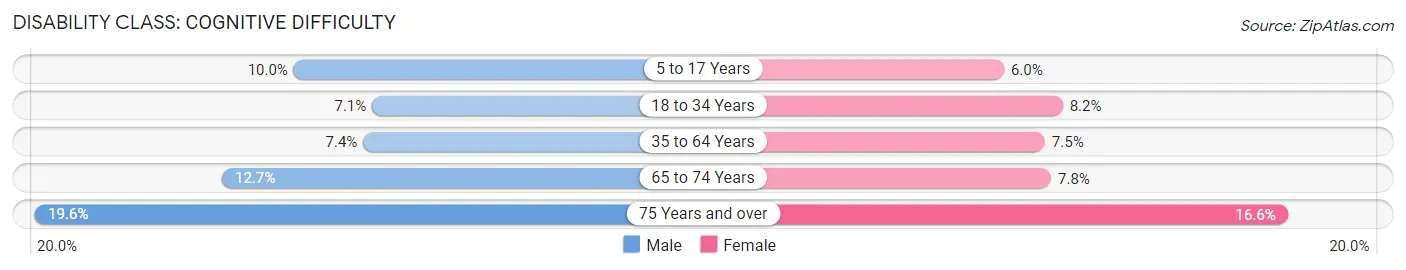
| Age Bracket | Male | Female |
| 5 to 17 Years | 502 (10.0%) | 297 (6.0%) |
| 18 to 34 Years | 424 (7.1%) | 427 (8.2%) |
| 35 to 64 Years | 705 (7.4%) | 719 (7.5%) |
| 65 to 74 Years | 314 (12.7%) | 205 (7.8%) |
| 75 Years and over | 270 (19.6%) | 319 (16.6%) |
Disability Class: Ambulatory Difficulty
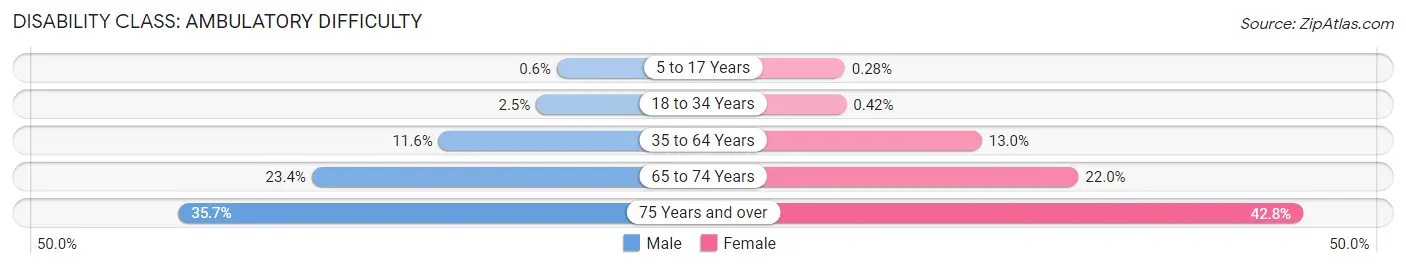
| Age Bracket | Male | Female |
| 5 to 17 Years | 30 (0.6%) | 14 (0.3%) |
| 18 to 34 Years | 151 (2.5%) | 22 (0.4%) |
| 35 to 64 Years | 1,100 (11.6%) | 1,239 (13.0%) |
| 65 to 74 Years | 579 (23.4%) | 579 (22.0%) |
| 75 Years and over | 492 (35.7%) | 825 (42.8%) |
Disability Class: Self-Care Difficulty
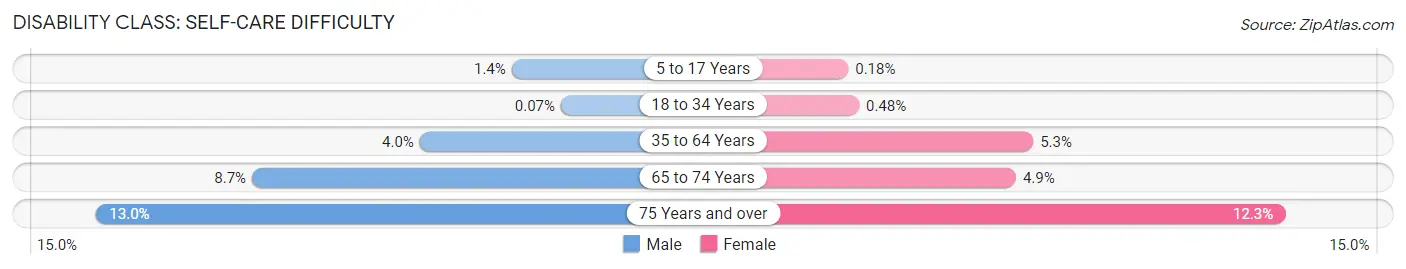
| Age Bracket | Male | Female |
| 5 to 17 Years | 72 (1.4%) | 9 (0.2%) |
| 18 to 34 Years | 4 (0.1%) | 25 (0.5%) |
| 35 to 64 Years | 380 (4.0%) | 508 (5.3%) |
| 65 to 74 Years | 215 (8.7%) | 128 (4.9%) |
| 75 Years and over | 179 (13.0%) | 238 (12.3%) |
Technology Access in Navarro County
Computing Device Access in Navarro County
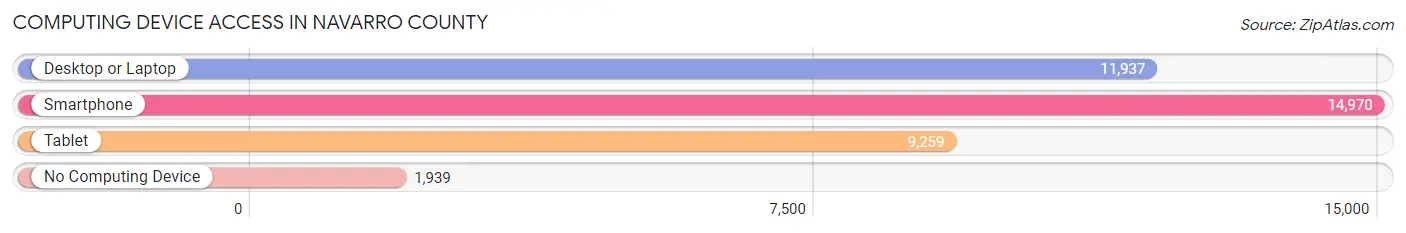
| Device Type | # Households | % Households |
| Desktop or Laptop | 11,937 | 66.1% |
| Smartphone | 14,970 | 82.9% |
| Tablet | 9,259 | 51.3% |
| No Computing Device | 1,939 | 10.7% |
| Total | 18,058 | 100.0% |
Internet Access in Navarro County
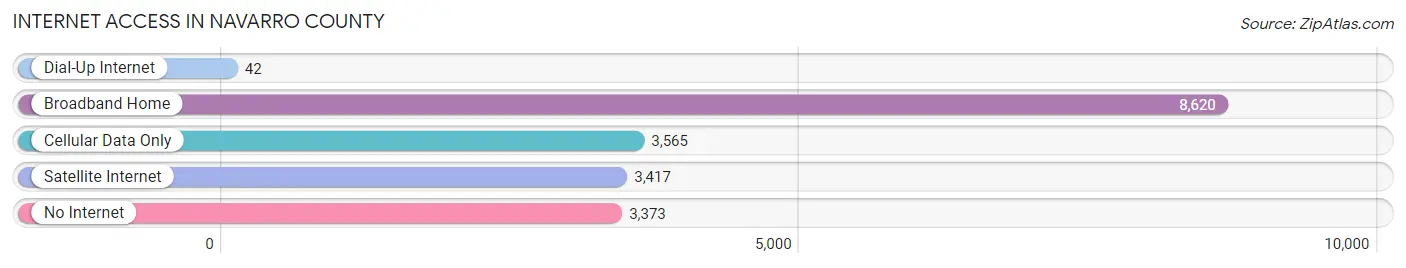
| Internet Type | # Households | % Households |
| Dial-Up Internet | 42 | 0.2% |
| Broadband Home | 8,620 | 47.7% |
| Cellular Data Only | 3,565 | 19.7% |
| Satellite Internet | 3,417 | 18.9% |
| No Internet | 3,373 | 18.7% |
| Total | 18,058 | 100.0% |
Navarro County Summary
Navarro County is located in the north-central region of Texas, and is part of the Dallas-Fort Worth-Arlington metropolitan area. The county is bordered by Ellis, Hill, Freestone, Limestone, and Henderson counties. The county seat is Corsicana, and the county has a population of approximately 48,000 people.
History
Navarro County was established in 1846, and was named after José Antonio Navarro, a Tejano leader who fought for Texas independence. The county was originally part of Robertson County, and was later divided into Navarro and Freestone counties. The county was initially populated by Native Americans, and later by settlers from the United States and Europe. The county was home to several Native American tribes, including the Caddo, Cherokee, and Comanche.
The county was an important center of the cotton industry in the 19th century, and the town of Corsicana was established in 1848. The town was named after the Corsicana tribe, which had inhabited the area for centuries. The county was also home to several other towns, including Blooming Grove, Frost, and Emhouse.
Geography
Navarro County is located in the north-central region of Texas, and is part of the Dallas-Fort Worth-Arlington metropolitan area. The county is bordered by Ellis, Hill, Freestone, Limestone, and Henderson counties. The county has a total area of 845 square miles, and is mostly flat with some rolling hills. The county is drained by the Navasota River, which flows through the county from east to west.
The county is home to several state parks, including Richland Creek Wildlife Management Area, Lake Navarro Mills State Park, and Fort Parker State Park. The county is also home to several lakes, including Richland Creek Reservoir, Lake Navarro Mills, and Lake Limestone.
Economy
Navarro County has a diverse economy, with a mix of manufacturing, agriculture, and services. The county is home to several manufacturing companies, including Navarro Mills Manufacturing, Navarro County Electric, and Navarro County Plastics. The county is also home to several agricultural operations, including cattle, poultry, and dairy farms.
The county is also home to several service-based businesses, including healthcare, retail, and hospitality. The county is home to several hospitals, including Navarro Regional Hospital and Navarro County Medical Center. The county is also home to several retail stores, including Walmart, Target, and Home Depot.
Demographics
As of the 2010 census, Navarro County had a population of 48,000 people. The population is predominantly white (78.3%), with smaller percentages of African American (14.2%), Hispanic (4.7%), and Asian (2.8%) populations. The median household income in the county is $45,000, and the median age is 38.
Navarro County is home to several colleges and universities, including Navarro College, Texas A&M University-Commerce, and the University of Texas at Tyler. The county is also home to several public schools, including Corsicana High School, Blooming Grove High School, and Frost High School.
Common Questions
What is Per Capita Income in Navarro County?
Per Capita income in Navarro County is $26,910.
What is the Median Family Income in Navarro County?
Median Family Income in Navarro County is $71,098.
What is the Median Household income in Navarro County?
Median Household Income in Navarro County is $56,261.
What is Income or Wage Gap in Navarro County?
Income or Wage Gap in Navarro County is 26.8%.
Women in Navarro County earn 73.2 cents for every dollar earned by a man.
What is Family Income Deficit in Navarro County?
Family Income Deficit in Navarro County is $10,114.
Families that are below poverty line in Navarro County earn $10,114 less on average than the poverty threshold level.
What is Inequality or Gini Index in Navarro County?
Inequality or Gini Index in Navarro County is 0.46.
What is the Total Population of Navarro County?
Total Population of Navarro County is 52,834.
What is the Total Male Population of Navarro County?
Total Male Population of Navarro County is 26,564.
What is the Total Female Population of Navarro County?
Total Female Population of Navarro County is 26,270.
What is the Ratio of Males per 100 Females in Navarro County?
There are 101.12 Males per 100 Females in Navarro County.
What is the Ratio of Females per 100 Males in Navarro County?
There are 98.89 Females per 100 Males in Navarro County.
What is the Median Population Age in Navarro County?
Median Population Age in Navarro County is 37.5 Years.
What is the Average Family Size in Navarro County
Average Family Size in Navarro County is 3.5 People.
What is the Average Household Size in Navarro County
Average Household Size in Navarro County is 2.9 People.
How Large is the Labor Force in Navarro County?
There are 24,277 People in the Labor Forcein in Navarro County.
What is the Percentage of People in the Labor Force in Navarro County?
59.4% of People are in the Labor Force in Navarro County.
What is the Unemployment Rate in Navarro County?
Unemployment Rate in Navarro County is 5.6%.