Moore County, TX Map & Demographics
Moore County Overview
$26,321
PER CAPITA INCOME
$65,868
AVG FAMILY INCOME
$59,041
AVG HOUSEHOLD INCOME
28.9%
WAGE / INCOME GAP [ % ]
71.1¢/ $1
WAGE / INCOME GAP [ $ ]
$9,104
FAMILY INCOME DEFICIT
0.41
INEQUALITY / GINI INDEX
21,284
TOTAL POPULATION
11,073
MALE POPULATION
10,211
FEMALE POPULATION
108.44
MALES / 100 FEMALES
92.22
FEMALES / 100 MALES
30.7
MEDIAN AGE
3.6
AVG FAMILY SIZE
3.0
AVG HOUSEHOLD SIZE
9,963
LABOR FORCE [ PEOPLE ]
65.2%
PERCENT IN LABOR FORCE
2.5%
UNEMPLOYMENT RATE
Moore County Area Codes
Income in Moore County
Income Overview in Moore County
Per Capita Income in Moore County is $26,321, while median incomes of families and households are $65,868 and $59,041 respectively.
| Characteristic | Number | Measure |
| Per Capita Income | 21,284 | $26,321 |
| Median Family Income | 5,121 | $65,868 |
| Mean Family Income | 5,121 | $84,572 |
| Median Household Income | 6,989 | $59,041 |
| Mean Household Income | 6,989 | $77,084 |
| Income Deficit | 5,121 | $9,104 |
| Wage / Income Gap (%) | 21,284 | 28.90% |
| Wage / Income Gap ($) | 21,284 | 71.10¢ per $1 |
| Gini / Inequality Index | 21,284 | 0.41 |
Earnings by Sex in Moore County
Average Earnings in Moore County are $39,352, $44,210 for men and $31,433 for women, a difference of 28.9%.
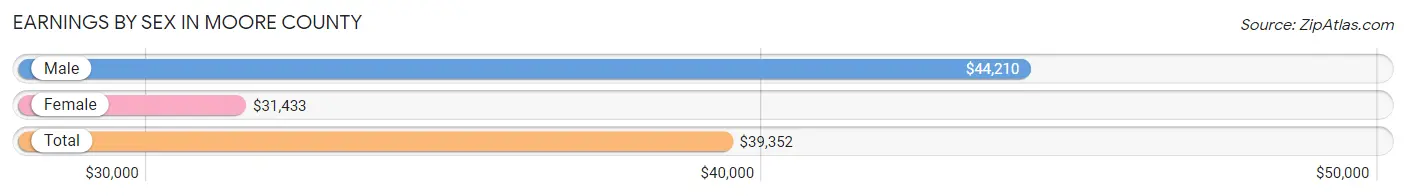
| Sex | Number | Average Earnings |
| Male | 6,141 (60.7%) | $44,210 |
| Female | 3,973 (39.3%) | $31,433 |
| Total | 10,114 (100.0%) | $39,352 |
Earnings by Sex by Income Bracket in Moore County
The most common earnings brackets in Moore County are $55,000 to $64,999 for men (664 | 10.8%) and $25,000 to $29,999 for women (456 | 11.5%).
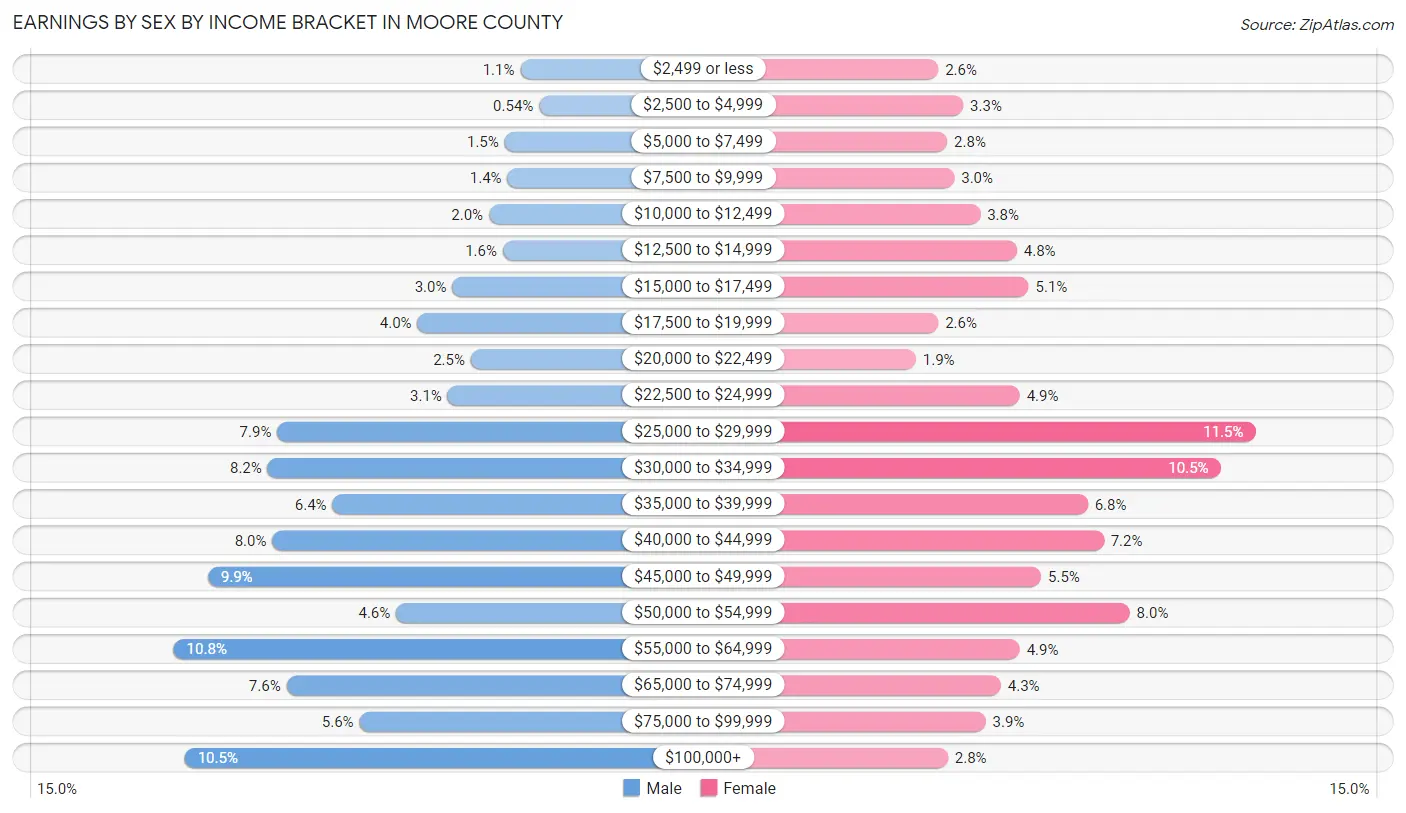
| Income | Male | Female |
| $2,499 or less | 66 (1.1%) | 102 (2.6%) |
| $2,500 to $4,999 | 33 (0.5%) | 130 (3.3%) |
| $5,000 to $7,499 | 93 (1.5%) | 112 (2.8%) |
| $7,500 to $9,999 | 88 (1.4%) | 120 (3.0%) |
| $10,000 to $12,499 | 120 (1.9%) | 149 (3.7%) |
| $12,500 to $14,999 | 96 (1.6%) | 190 (4.8%) |
| $15,000 to $17,499 | 183 (3.0%) | 203 (5.1%) |
| $17,500 to $19,999 | 243 (4.0%) | 102 (2.6%) |
| $20,000 to $22,499 | 151 (2.5%) | 77 (1.9%) |
| $22,500 to $24,999 | 191 (3.1%) | 193 (4.9%) |
| $25,000 to $29,999 | 485 (7.9%) | 456 (11.5%) |
| $30,000 to $34,999 | 502 (8.2%) | 417 (10.5%) |
| $35,000 to $39,999 | 390 (6.4%) | 269 (6.8%) |
| $40,000 to $44,999 | 494 (8.0%) | 287 (7.2%) |
| $45,000 to $49,999 | 605 (9.9%) | 217 (5.5%) |
| $50,000 to $54,999 | 280 (4.6%) | 316 (8.0%) |
| $55,000 to $64,999 | 664 (10.8%) | 193 (4.9%) |
| $65,000 to $74,999 | 469 (7.6%) | 172 (4.3%) |
| $75,000 to $99,999 | 343 (5.6%) | 155 (3.9%) |
| $100,000+ | 645 (10.5%) | 113 (2.8%) |
| Total | 6,141 (100.0%) | 3,973 (100.0%) |
Earnings by Sex by Educational Attainment in Moore County
Average earnings in Moore County are $46,819 for men and $33,244 for women, a difference of 29.0%. Men with an educational attainment of college or associate's degree enjoy the highest average annual earnings of $60,724, while those with less than high school education earn the least with $42,122. Women with an educational attainment of graduate degree earn the most with the average annual earnings of $69,135, while those with less than high school education have the smallest earnings of $26,071.
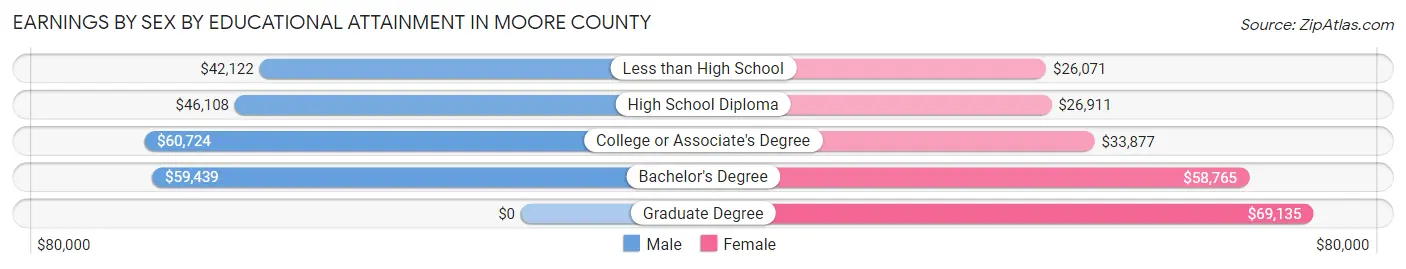
| Educational Attainment | Male Income | Female Income |
| Less than High School | $42,122 | $26,071 |
| High School Diploma | $46,108 | $26,911 |
| College or Associate's Degree | $60,724 | $33,877 |
| Bachelor's Degree | $59,439 | $58,765 |
| Graduate Degree | - | - |
| Total | $46,819 | $33,244 |
Family Income in Moore County
Family Income Brackets in Moore County
According to the Moore County family income data, there are 1,178 families falling into the $50,000 to $74,999 income range, which is the most common income bracket and makes up 23.0% of all families. Conversely, the $10,000 to $14,999 income bracket is the least frequent group with only 108 families (2.1%) belonging to this category.
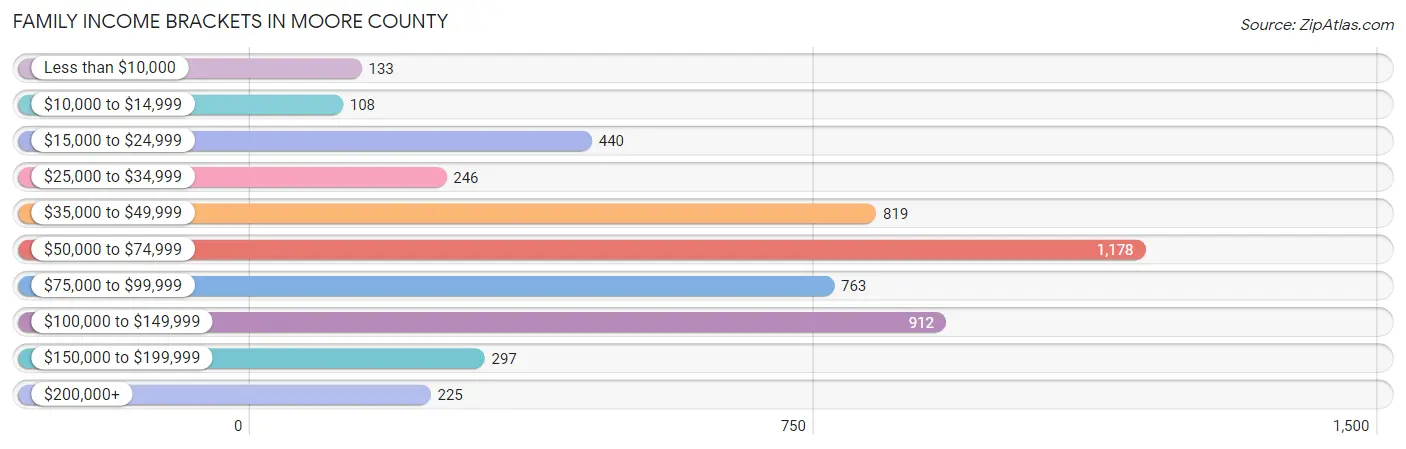
| Income Bracket | # Families | % Families |
| Less than $10,000 | 133 | 2.6% |
| $10,000 to $14,999 | 108 | 2.1% |
| $15,000 to $24,999 | 440 | 8.6% |
| $25,000 to $34,999 | 246 | 4.8% |
| $35,000 to $49,999 | 819 | 16.0% |
| $50,000 to $74,999 | 1,178 | 23.0% |
| $75,000 to $99,999 | 763 | 14.9% |
| $100,000 to $149,999 | 912 | 17.8% |
| $150,000 to $199,999 | 297 | 5.8% |
| $200,000+ | 225 | 4.4% |
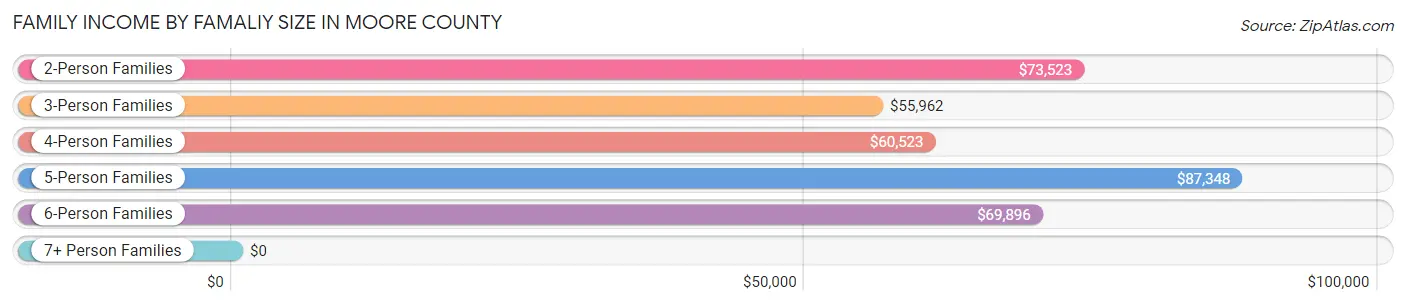
Family Income by Famaliy Size in Moore County
5-person families (757 | 14.8%) account for the highest median family income in Moore County with $87,348 per family, while 2-person families (1,573 | 30.7%) have the highest median income of $36,762 per family member.
| Income Bracket | # Families | Median Income |
| 2-Person Families | 1,573 (30.7%) | $73,523 |
| 3-Person Families | 1,200 (23.4%) | $55,962 |
| 4-Person Families | 1,209 (23.6%) | $60,523 |
| 5-Person Families | 757 (14.8%) | $87,348 |
| 6-Person Families | 235 (4.6%) | $69,896 |
| 7+ Person Families | 147 (2.9%) | $0 |
| Total | 5,121 (100.0%) | $65,868 |
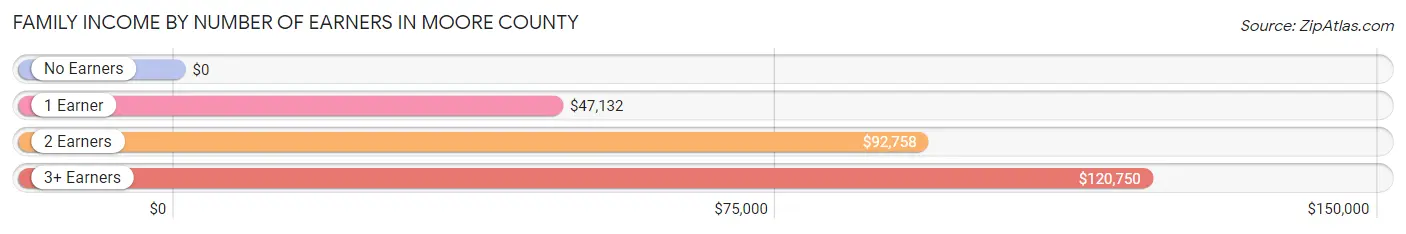
Family Income by Number of Earners in Moore County
| Number of Earners | # Families | Median Income |
| No Earners | 483 (9.4%) | $0 |
| 1 Earner | 2,136 (41.7%) | $47,132 |
| 2 Earners | 1,874 (36.6%) | $92,758 |
| 3+ Earners | 628 (12.3%) | $120,750 |
| Total | 5,121 (100.0%) | $65,868 |
Household Income in Moore County
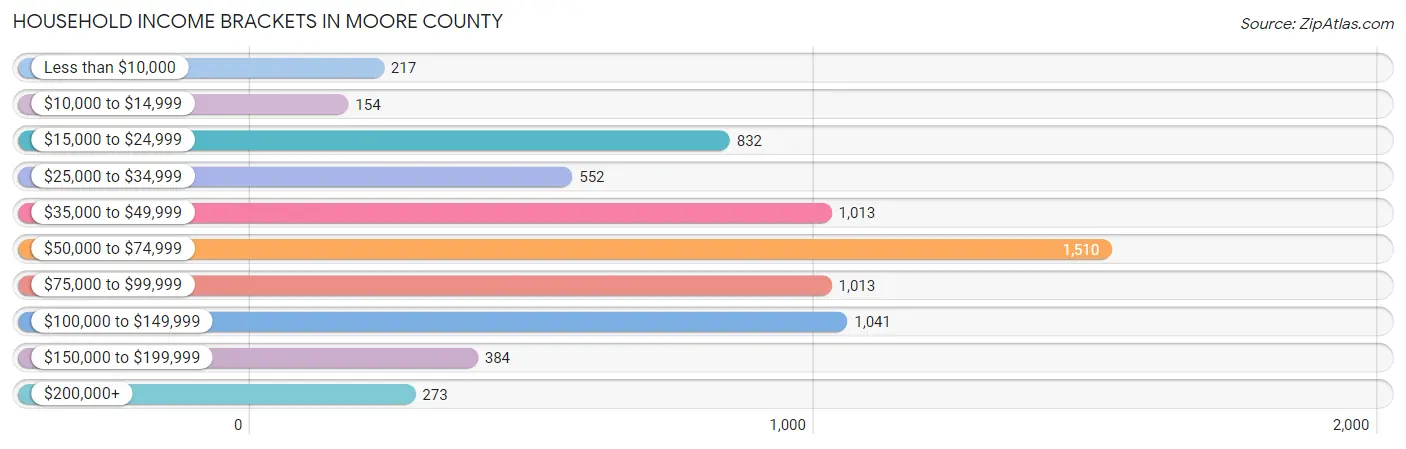
Household Income Brackets in Moore County
With 1,510 households falling in the category, the $50,000 to $74,999 income range is the most frequent in Moore County, accounting for 21.6% of all households. In contrast, only 154 households (2.2%) fall into the $10,000 to $14,999 income bracket, making it the least populous group.
| Income Bracket | # Households | % Households |
| Less than $10,000 | 217 | 3.1% |
| $10,000 to $14,999 | 154 | 2.2% |
| $15,000 to $24,999 | 832 | 11.9% |
| $25,000 to $34,999 | 552 | 7.9% |
| $35,000 to $49,999 | 1,013 | 14.5% |
| $50,000 to $74,999 | 1,510 | 21.6% |
| $75,000 to $99,999 | 1,013 | 14.5% |
| $100,000 to $149,999 | 1,041 | 14.9% |
| $150,000 to $199,999 | 384 | 5.5% |
| $200,000+ | 273 | 3.9% |
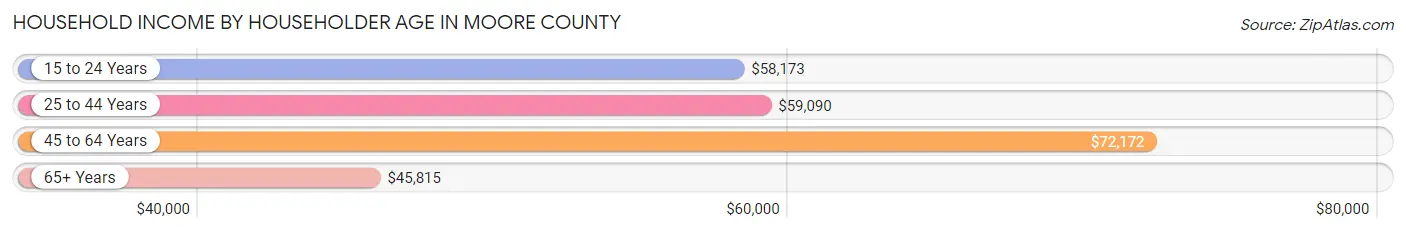
Household Income by Householder Age in Moore County
The median household income in Moore County is $59,041, with the highest median household income of $72,172 found in the 45 to 64 years age bracket for the primary householder. A total of 2,435 households (34.8%) fall into this category. Meanwhile, the 65+ years age bracket for the primary householder has the lowest median household income of $45,815, with 1,520 households (21.7%) in this group.
| Income Bracket | # Households | Median Income |
| 15 to 24 Years | 395 (5.7%) | $58,173 |
| 25 to 44 Years | 2,639 (37.8%) | $59,090 |
| 45 to 64 Years | 2,435 (34.8%) | $72,172 |
| 65+ Years | 1,520 (21.7%) | $45,815 |
| Total | 6,989 (100.0%) | $59,041 |
Poverty in Moore County
Income Below Poverty by Sex and Age in Moore County
With 12.1% poverty level for males and 14.9% for females among the residents of Moore County, under 5 year old males and 75 year old and over females are the most vulnerable to poverty, with 266 males (29.5%) and 158 females (33.8%) in their respective age groups living below the poverty level.
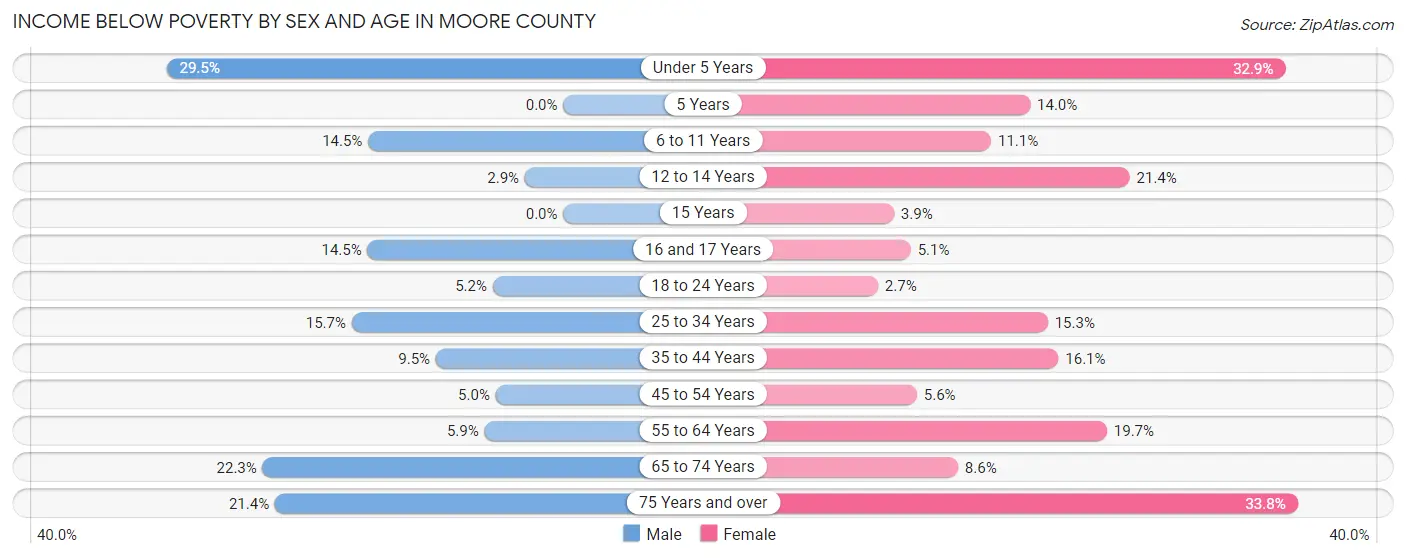
| Age Bracket | Male | Female |
| Under 5 Years | 266 (29.5%) | 320 (32.9%) |
| 5 Years | 0 (0.0%) | 13 (14.0%) |
| 6 to 11 Years | 204 (14.5%) | 134 (11.1%) |
| 12 to 14 Years | 18 (2.9%) | 78 (21.4%) |
| 15 Years | 0 (0.0%) | 7 (3.9%) |
| 16 and 17 Years | 49 (14.5%) | 17 (5.1%) |
| 18 to 24 Years | 59 (5.2%) | 25 (2.7%) |
| 25 to 34 Years | 229 (15.7%) | 229 (15.3%) |
| 35 to 44 Years | 139 (9.5%) | 195 (16.1%) |
| 45 to 54 Years | 64 (5.0%) | 56 (5.6%) |
| 55 to 64 Years | 65 (5.9%) | 208 (19.7%) |
| 65 to 74 Years | 159 (22.3%) | 65 (8.6%) |
| 75 Years and over | 82 (21.4%) | 158 (33.8%) |
| Total | 1,334 (12.1%) | 1,505 (14.9%) |
Income Above Poverty by Sex and Age in Moore County
According to the poverty statistics in Moore County, males aged 5 years and females aged 18 to 24 years are the age groups that are most secure financially, with 100.0% of males and 97.3% of females in these age groups living above the poverty line.
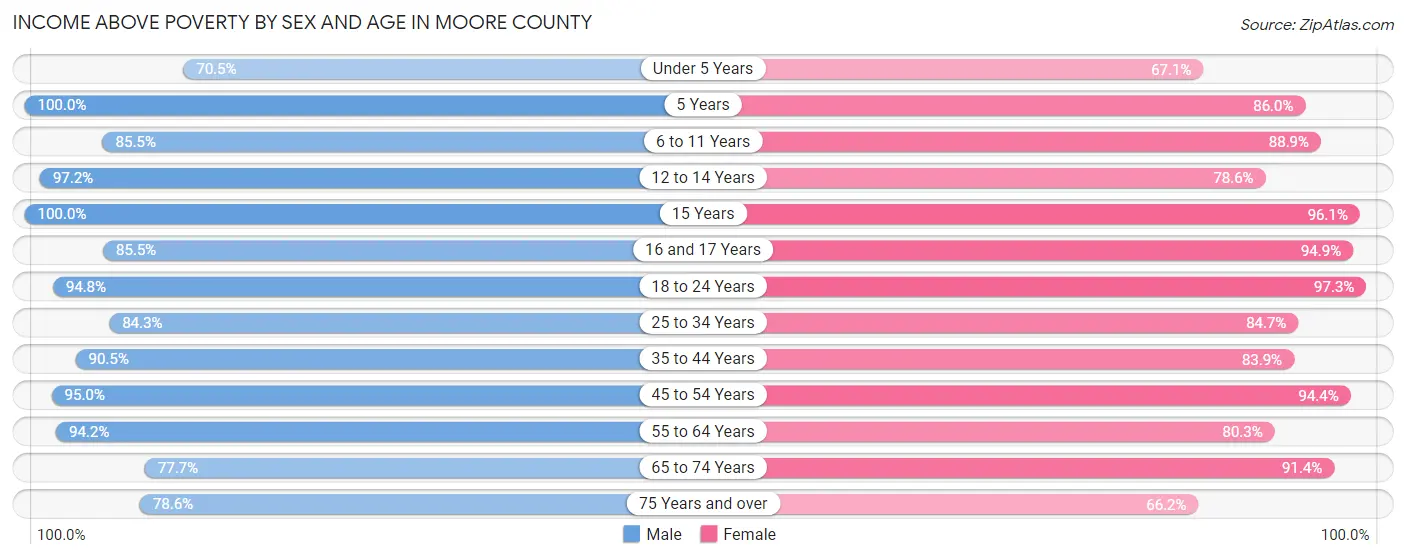
| Age Bracket | Male | Female |
| Under 5 Years | 637 (70.5%) | 652 (67.1%) |
| 5 Years | 35 (100.0%) | 80 (86.0%) |
| 6 to 11 Years | 1,204 (85.5%) | 1,075 (88.9%) |
| 12 to 14 Years | 613 (97.2%) | 287 (78.6%) |
| 15 Years | 130 (100.0%) | 174 (96.1%) |
| 16 and 17 Years | 288 (85.5%) | 315 (94.9%) |
| 18 to 24 Years | 1,068 (94.8%) | 908 (97.3%) |
| 25 to 34 Years | 1,229 (84.3%) | 1,269 (84.7%) |
| 35 to 44 Years | 1,331 (90.5%) | 1,018 (83.9%) |
| 45 to 54 Years | 1,211 (95.0%) | 950 (94.4%) |
| 55 to 64 Years | 1,047 (94.2%) | 849 (80.3%) |
| 65 to 74 Years | 553 (77.7%) | 689 (91.4%) |
| 75 Years and over | 301 (78.6%) | 309 (66.2%) |
| Total | 9,647 (87.8%) | 8,575 (85.1%) |
Income Below Poverty Among Married-Couple Families in Moore County
The poverty statistics for married-couple families in Moore County show that 10.6% or 395 of the total 3,714 families live below the poverty line. Families with 5 or more children have the highest poverty rate of 84.9%, comprising of 45 families. On the other hand, families with 1 or 2 children have the lowest poverty rate of 5.4%, which includes 78 families.
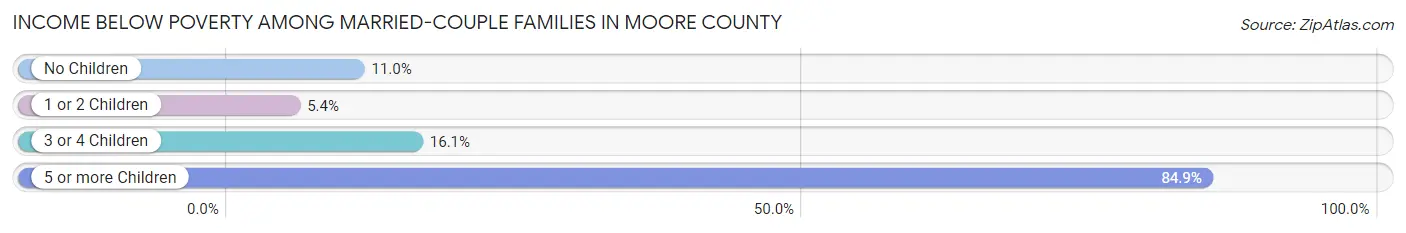
| Children | Above Poverty | Below Poverty |
| No Children | 1,487 (89.0%) | 184 (11.0%) |
| 1 or 2 Children | 1,365 (94.6%) | 78 (5.4%) |
| 3 or 4 Children | 459 (83.9%) | 88 (16.1%) |
| 5 or more Children | 8 (15.1%) | 45 (84.9%) |
| Total | 3,319 (89.4%) | 395 (10.6%) |
Income Below Poverty Among Single-Parent Households in Moore County
According to the poverty data in Moore County, 15.0% or 74 single-father households and 25.5% or 233 single-mother households are living below the poverty line. Among single-father households, those with 3 or 4 children have the highest poverty rate, with 18 households (36.0%) experiencing poverty. Likewise, among single-mother households, those with 1 or 2 children have the highest poverty rate, with 145 households (25.7%) falling below the poverty line.
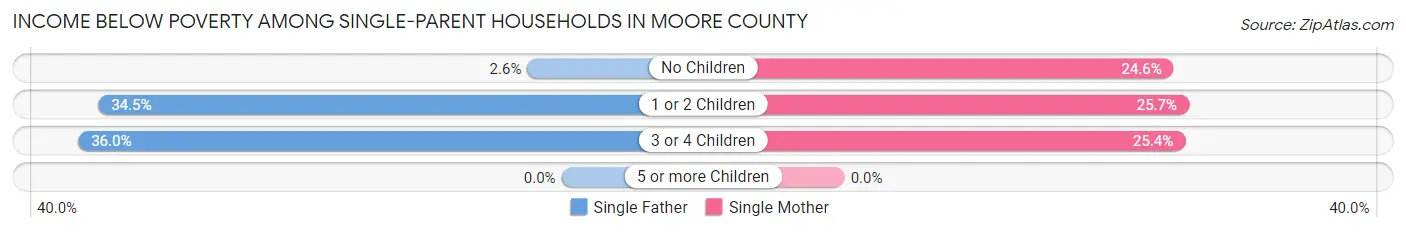
| Children | Single Father | Single Mother |
| No Children | 7 (2.5%) | 29 (24.6%) |
| 1 or 2 Children | 49 (34.5%) | 145 (25.7%) |
| 3 or 4 Children | 18 (36.0%) | 59 (25.4%) |
| 5 or more Children | 0 (0.0%) | 0 (0.0%) |
| Total | 74 (15.0%) | 233 (25.5%) |
Income Below Poverty Among Married-Couple vs Single-Parent Households in Moore County
The poverty data for Moore County shows that 395 of the married-couple family households (10.6%) and 307 of the single-parent households (21.8%) are living below the poverty level. Within the married-couple family households, those with 5 or more children have the highest poverty rate, with 45 households (84.9%) falling below the poverty line. Among the single-parent households, those with 1 or 2 children have the highest poverty rate, with 194 household (27.5%) living below poverty.
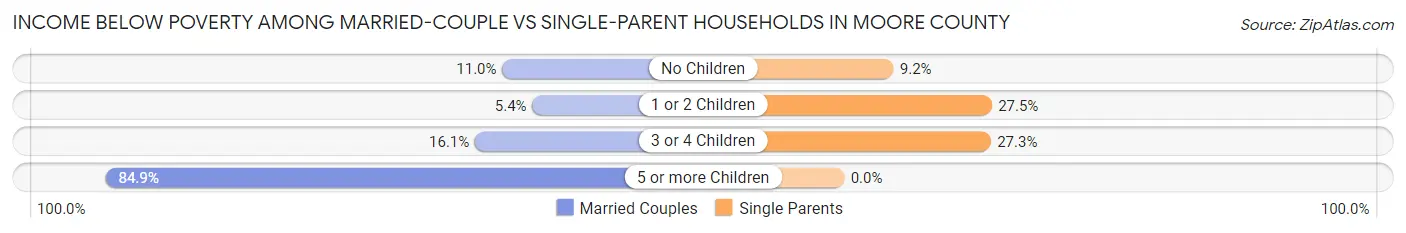
| Children | Married-Couple Families | Single-Parent Households |
| No Children | 184 (11.0%) | 36 (9.2%) |
| 1 or 2 Children | 78 (5.4%) | 194 (27.5%) |
| 3 or 4 Children | 88 (16.1%) | 77 (27.3%) |
| 5 or more Children | 45 (84.9%) | 0 (0.0%) |
| Total | 395 (10.6%) | 307 (21.8%) |
Race in Moore County
The most populous races in Moore County are White / Caucasian (13,861 | 65.1%), Hispanic or Latino (12,443 | 58.5%), and Two or more Races (3,908 | 18.4%).
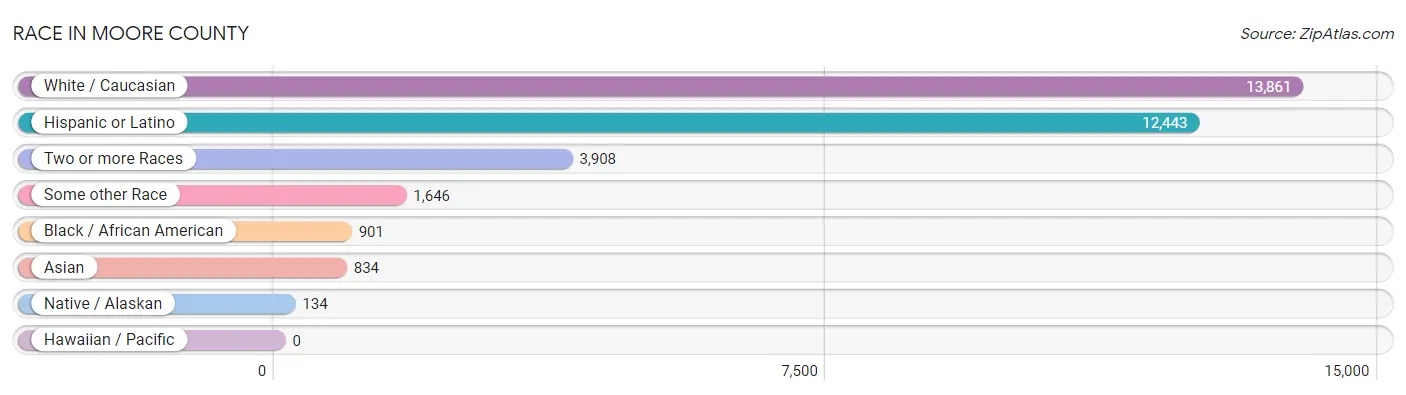
| Race | # Population | % Population |
| Asian | 834 | 3.9% |
| Black / African American | 901 | 4.2% |
| Hawaiian / Pacific | 0 | 0.0% |
| Hispanic or Latino | 12,443 | 58.5% |
| Native / Alaskan | 134 | 0.6% |
| White / Caucasian | 13,861 | 65.1% |
| Two or more Races | 3,908 | 18.4% |
| Some other Race | 1,646 | 7.7% |
| Total | 21,284 | 100.0% |
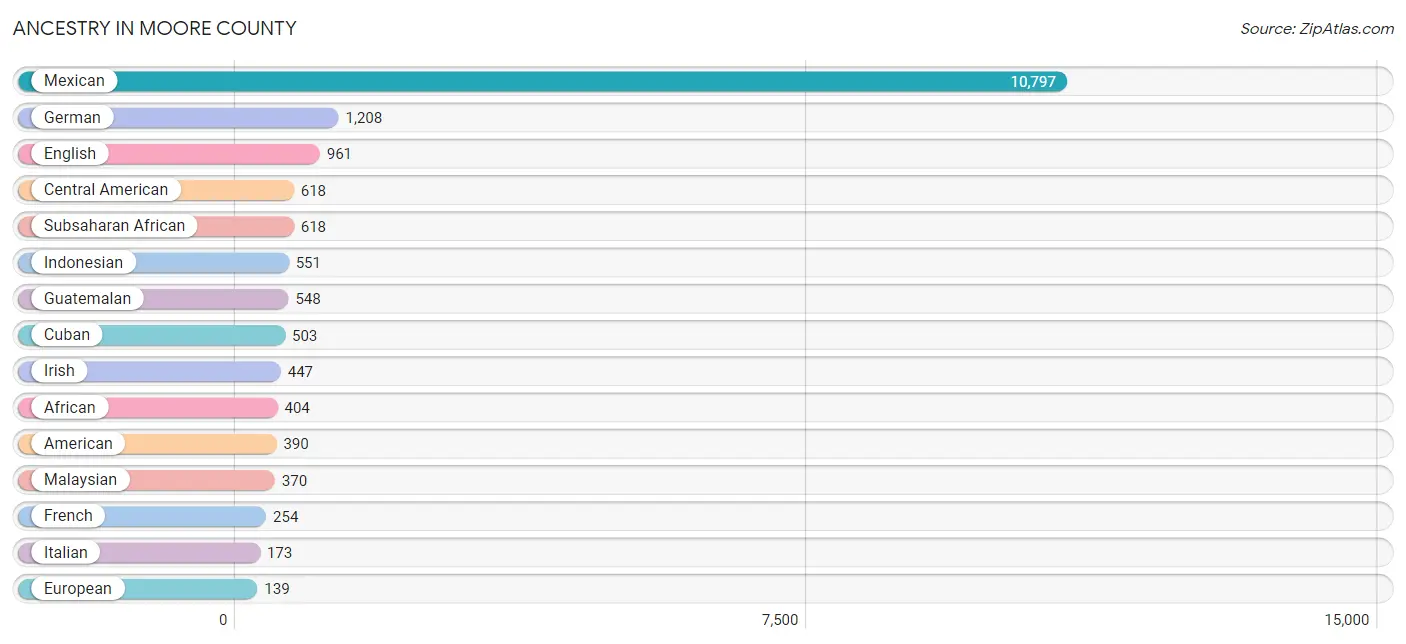
Ancestry in Moore County
The most populous ancestries reported in Moore County are Mexican (10,797 | 50.7%), German (1,208 | 5.7%), English (961 | 4.5%), Central American (618 | 2.9%), and Subsaharan African (618 | 2.9%), together accounting for 66.7% of all Moore County residents.
| Ancestry | # Population | % Population |
| African | 404 | 1.9% |
| American | 390 | 1.8% |
| Arab | 73 | 0.3% |
| Basque | 14 | 0.1% |
| Bhutanese | 3 | 0.0% |
| British | 70 | 0.3% |
| Burmese | 3 | 0.0% |
| Central American | 618 | 2.9% |
| Cherokee | 48 | 0.2% |
| Chilean | 40 | 0.2% |
| Chippewa | 9 | 0.0% |
| Choctaw | 33 | 0.2% |
| Colombian | 10 | 0.1% |
| Comanche | 13 | 0.1% |
| Creek | 6 | 0.0% |
| Cuban | 503 | 2.4% |
| Czech | 55 | 0.3% |
| Danish | 17 | 0.1% |
| Dutch | 100 | 0.5% |
| Dutch West Indian | 11 | 0.1% |
| English | 961 | 4.5% |
| Ethiopian | 126 | 0.6% |
| European | 139 | 0.6% |
| French | 254 | 1.2% |
| French Canadian | 6 | 0.0% |
| German | 1,208 | 5.7% |
| Guatemalan | 548 | 2.6% |
| Honduran | 61 | 0.3% |
| Indonesian | 551 | 2.6% |
| Irish | 447 | 2.1% |
| Italian | 173 | 0.8% |
| Korean | 10 | 0.1% |
| Lebanese | 73 | 0.3% |
| Lithuanian | 13 | 0.1% |
| Malaysian | 370 | 1.7% |
| Mexican | 10,797 | 50.7% |
| Mexican American Indian | 57 | 0.3% |
| Navajo | 1 | 0.0% |
| Nigerian | 27 | 0.1% |
| Norwegian | 41 | 0.2% |
| Pakistani | 49 | 0.2% |
| Polish | 14 | 0.1% |
| Portuguese | 14 | 0.1% |
| Puerto Rican | 4 | 0.0% |
| Salvadoran | 9 | 0.0% |
| Scotch-Irish | 125 | 0.6% |
| Scottish | 87 | 0.4% |
| Somali | 47 | 0.2% |
| South American | 50 | 0.2% |
| Spaniard | 111 | 0.5% |
| Subsaharan African | 618 | 2.9% |
| Swedish | 28 | 0.1% |
| Thai | 69 | 0.3% |
| Ukrainian | 10 | 0.1% |
| Welsh | 58 | 0.3% | View All 55 Rows |
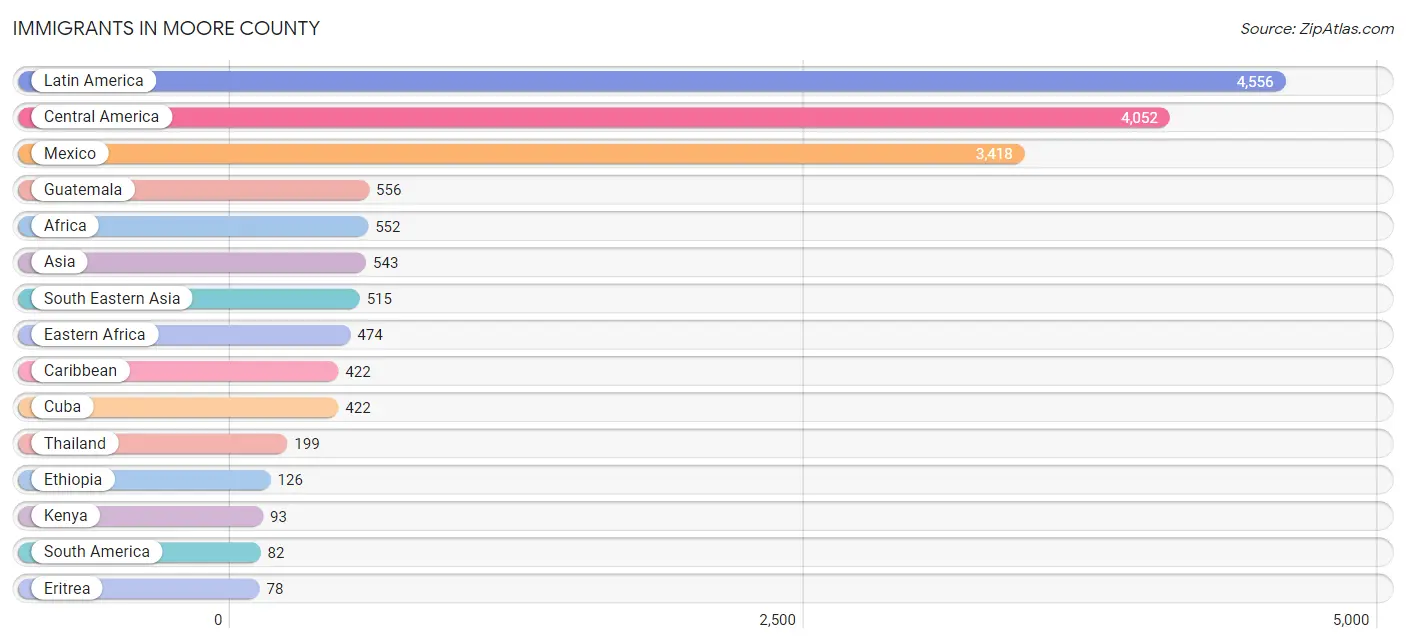
Immigrants in Moore County
The most numerous immigrant groups reported in Moore County came from Latin America (4,556 | 21.4%), Central America (4,052 | 19.0%), Mexico (3,418 | 16.1%), Guatemala (556 | 2.6%), and Africa (552 | 2.6%), together accounting for 61.7% of all Moore County residents.
| Immigration Origin | # Population | % Population |
| Africa | 552 | 2.6% |
| Asia | 543 | 2.5% |
| Brazil | 23 | 0.1% |
| Caribbean | 422 | 2.0% |
| Central America | 4,052 | 19.0% |
| Chile | 43 | 0.2% |
| Colombia | 16 | 0.1% |
| Congo | 14 | 0.1% |
| Cuba | 422 | 2.0% |
| Eastern Africa | 474 | 2.2% |
| Eastern Asia | 3 | 0.0% |
| Eritrea | 78 | 0.4% |
| Ethiopia | 126 | 0.6% |
| Europe | 38 | 0.2% |
| France | 30 | 0.1% |
| Germany | 8 | 0.0% |
| Guatemala | 556 | 2.6% |
| Honduras | 78 | 0.4% |
| India | 25 | 0.1% |
| Kenya | 93 | 0.4% |
| Korea | 3 | 0.0% |
| Laos | 47 | 0.2% |
| Latin America | 4,556 | 21.4% |
| Malaysia | 34 | 0.2% |
| Mexico | 3,418 | 16.1% |
| Middle Africa | 51 | 0.2% |
| Nigeria | 27 | 0.1% |
| Philippines | 10 | 0.1% |
| Somalia | 51 | 0.2% |
| South America | 82 | 0.4% |
| South Central Asia | 25 | 0.1% |
| South Eastern Asia | 515 | 2.4% |
| Thailand | 199 | 0.9% |
| Western Africa | 27 | 0.1% |
| Western Europe | 38 | 0.2% |
| Zaire | 37 | 0.2% | View All 36 Rows |
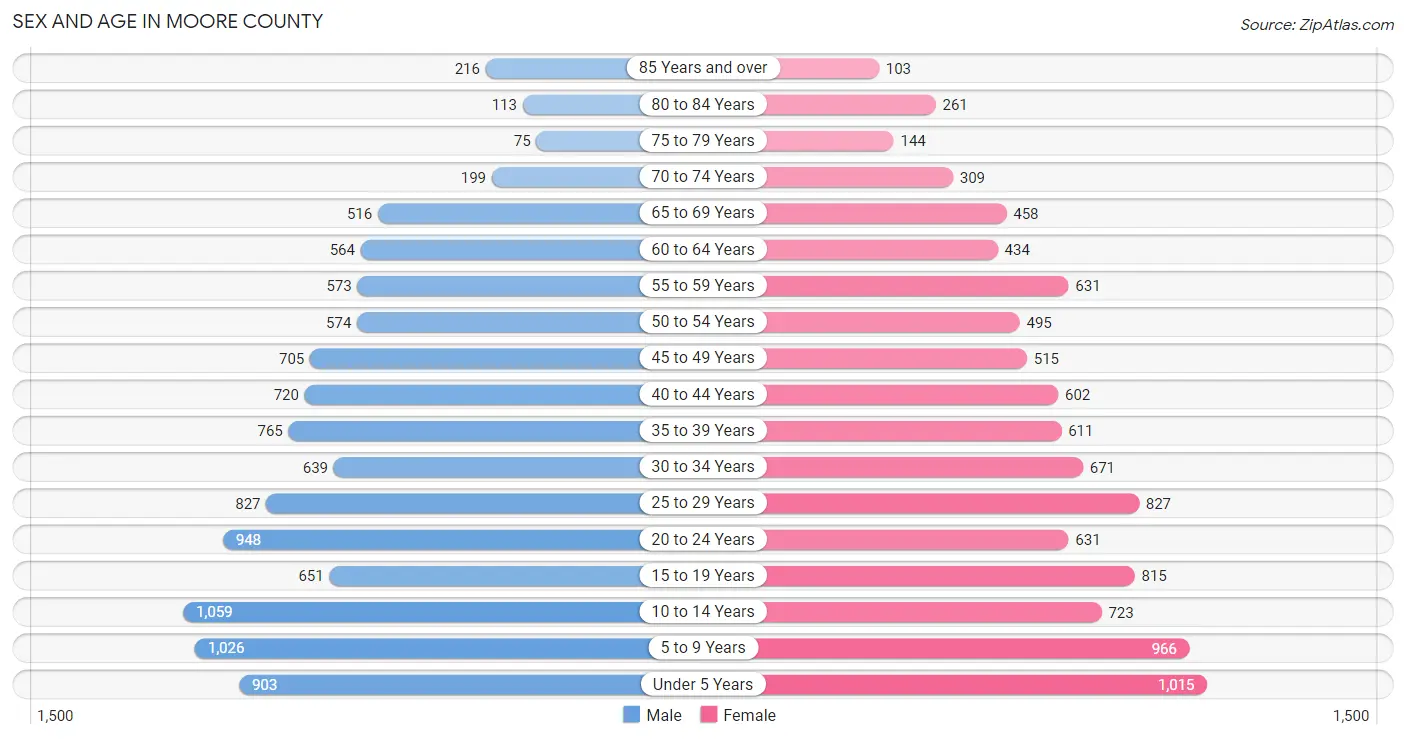
Sex and Age in Moore County
Sex and Age in Moore County
The most populous age groups in Moore County are 10 to 14 Years (1,059 | 9.6%) for men and Under 5 Years (1,015 | 9.9%) for women.
| Age Bracket | Male | Female |
| Under 5 Years | 903 (8.2%) | 1,015 (9.9%) |
| 5 to 9 Years | 1,026 (9.3%) | 966 (9.5%) |
| 10 to 14 Years | 1,059 (9.6%) | 723 (7.1%) |
| 15 to 19 Years | 651 (5.9%) | 815 (8.0%) |
| 20 to 24 Years | 948 (8.6%) | 631 (6.2%) |
| 25 to 29 Years | 827 (7.5%) | 827 (8.1%) |
| 30 to 34 Years | 639 (5.8%) | 671 (6.6%) |
| 35 to 39 Years | 765 (6.9%) | 611 (6.0%) |
| 40 to 44 Years | 720 (6.5%) | 602 (5.9%) |
| 45 to 49 Years | 705 (6.4%) | 515 (5.0%) |
| 50 to 54 Years | 574 (5.2%) | 495 (4.9%) |
| 55 to 59 Years | 573 (5.2%) | 631 (6.2%) |
| 60 to 64 Years | 564 (5.1%) | 434 (4.3%) |
| 65 to 69 Years | 516 (4.7%) | 458 (4.5%) |
| 70 to 74 Years | 199 (1.8%) | 309 (3.0%) |
| 75 to 79 Years | 75 (0.7%) | 144 (1.4%) |
| 80 to 84 Years | 113 (1.0%) | 261 (2.6%) |
| 85 Years and over | 216 (1.9%) | 103 (1.0%) |
| Total | 11,073 (100.0%) | 10,211 (100.0%) |
Families and Households in Moore County
Median Family Size in Moore County
The median family size in Moore County is 3.58 persons per family, with single female/mother families (914 | 17.8%) accounting for the largest median family size of 3.71 persons per family. On the other hand, single male/father families (493 | 9.6%) represent the smallest median family size with 2.77 persons per family.

| Family Type | # Families | Family Size |
| Married-Couple | 3,714 (72.5%) | 3.65 |
| Single Male/Father | 493 (9.6%) | 2.77 |
| Single Female/Mother | 914 (17.8%) | 3.71 |
| Total Families | 5,121 (100.0%) | 3.58 |
Median Household Size in Moore County
The median household size in Moore County is 3.02 persons per household, with single female/mother households (914 | 13.1%) accounting for the largest median household size of 4.06 persons per household. non-family households (1,868 | 26.7%) represent the smallest median household size with 1.16 persons per household.

| Household Type | # Households | Household Size |
| Married-Couple | 3,714 (53.1%) | 3.70 |
| Single Male/Father | 493 (7.0%) | 3.10 |
| Single Female/Mother | 914 (13.1%) | 4.06 |
| Non-family | 1,868 (26.7%) | 1.16 |
| Total Households | 6,989 (100.0%) | 3.02 |
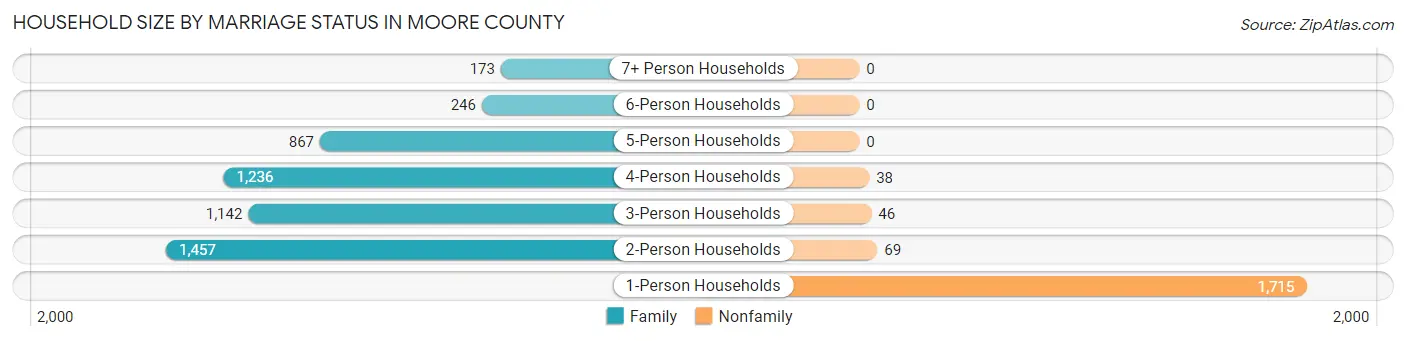
Household Size by Marriage Status in Moore County
Out of a total of 6,989 households in Moore County, 5,121 (73.3%) are family households, while 1,868 (26.7%) are nonfamily households. The most numerous type of family households are 2-person households, comprising 1,457, and the most common type of nonfamily households are 1-person households, comprising 1,715.
| Household Size | Family Households | Nonfamily Households |
| 1-Person Households | - | 1,715 (24.5%) |
| 2-Person Households | 1,457 (20.8%) | 69 (1.0%) |
| 3-Person Households | 1,142 (16.3%) | 46 (0.7%) |
| 4-Person Households | 1,236 (17.7%) | 38 (0.5%) |
| 5-Person Households | 867 (12.4%) | 0 (0.0%) |
| 6-Person Households | 246 (3.5%) | 0 (0.0%) |
| 7+ Person Households | 173 (2.5%) | 0 (0.0%) |
| Total | 5,121 (73.3%) | 1,868 (26.7%) |
Female Fertility in Moore County
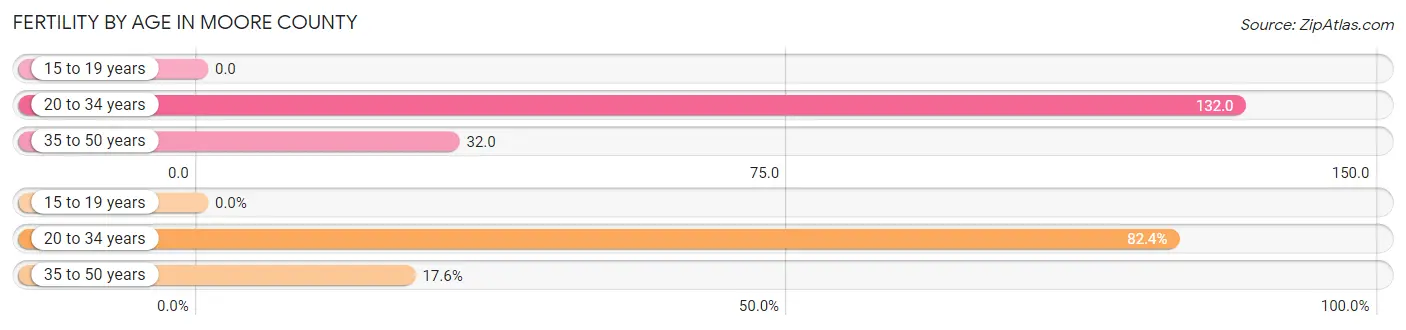
Fertility by Age in Moore County
Average fertility rate in Moore County is 71.0 births per 1,000 women. Women in the age bracket of 20 to 34 years have the highest fertility rate with 132.0 births per 1,000 women. Women in the age bracket of 20 to 34 years acount for 82.4% of all women with births.
| Age Bracket | Women with Births | Births / 1,000 Women |
| 15 to 19 years | 0 (0.0%) | 0.0 |
| 20 to 34 years | 281 (82.4%) | 132.0 |
| 35 to 50 years | 60 (17.6%) | 32.0 |
| Total | 341 (100.0%) | 71.0 |
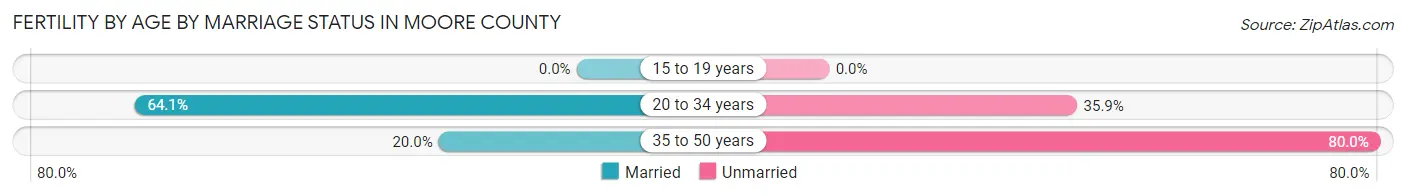
Fertility by Age by Marriage Status in Moore County
56.3% of women with births (341) in Moore County are married. The highest percentage of unmarried women with births falls into 35 to 50 years age bracket with 80.0% of them unmarried at the time of birth, while the lowest percentage of unmarried women with births belong to 20 to 34 years age bracket with 35.9% of them unmarried.
| Age Bracket | Married | Unmarried |
| 15 to 19 years | 0 (0.0%) | 0 (0.0%) |
| 20 to 34 years | 180 (64.1%) | 101 (35.9%) |
| 35 to 50 years | 12 (20.0%) | 48 (80.0%) |
| Total | 192 (56.3%) | 149 (43.7%) |
Fertility by Education in Moore County
Average fertility rate in Moore County is 71.0 births per 1,000 women. Women with the education attainment of bachelor's degree have the highest fertility rate of 134.0 births per 1,000 women, while women with the education attainment of high school diploma have the lowest fertility at 29.0 births per 1,000 women. Women with the education attainment of college or associate's degree represent 46.9% of all women with births.
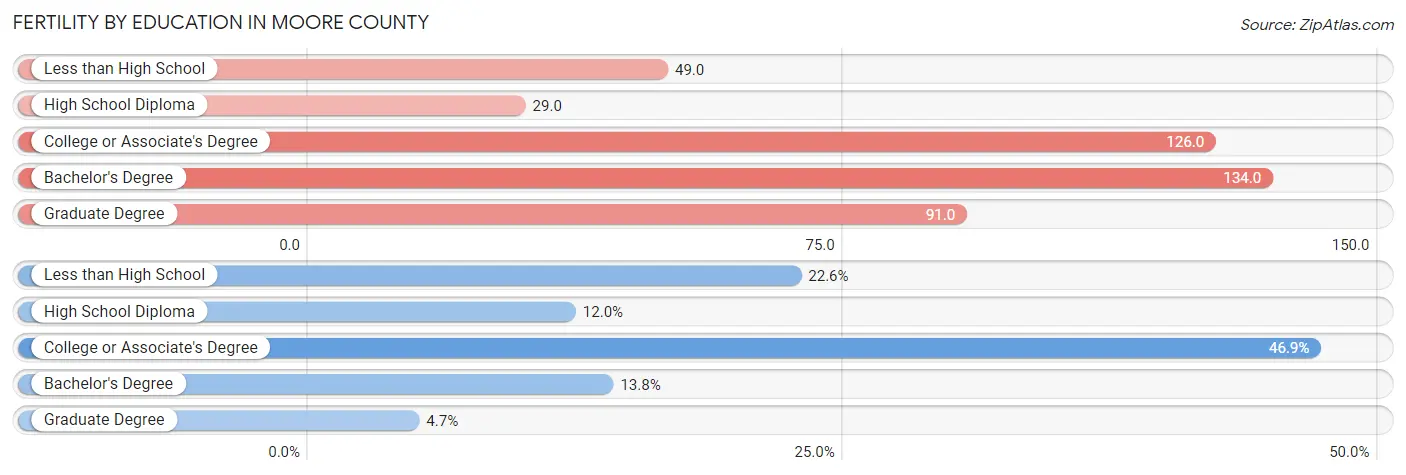
| Educational Attainment | Women with Births | Births / 1,000 Women |
| Less than High School | 77 (22.6%) | 49.0 |
| High School Diploma | 41 (12.0%) | 29.0 |
| College or Associate's Degree | 160 (46.9%) | 126.0 |
| Bachelor's Degree | 47 (13.8%) | 134.0 |
| Graduate Degree | 16 (4.7%) | 91.0 |
| Total | 341 (100.0%) | 71.0 |
Fertility by Education by Marriage Status in Moore County
43.7% of women with births in Moore County are unmarried. Women with the educational attainment of high school diploma are most likely to be married with 100.0% of them married at childbirth, while women with the educational attainment of less than high school are least likely to be married with 89.6% of them unmarried at childbirth.
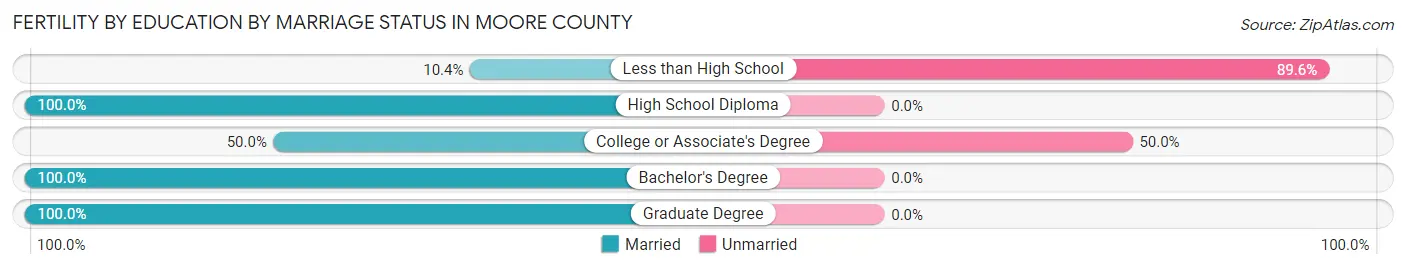
| Educational Attainment | Married | Unmarried |
| Less than High School | 8 (10.4%) | 69 (89.6%) |
| High School Diploma | 41 (100.0%) | 0 (0.0%) |
| College or Associate's Degree | 80 (50.0%) | 80 (50.0%) |
| Bachelor's Degree | 47 (100.0%) | 0 (0.0%) |
| Graduate Degree | 16 (100.0%) | 0 (0.0%) |
| Total | 192 (56.3%) | 149 (43.7%) |
Employment Characteristics in Moore County
Employment by Class of Employer in Moore County
Among the 9,653 employed individuals in Moore County, private company employees (7,298 | 75.6%), local government employees (843 | 8.7%), and state government employees (391 | 4.1%) make up the most common classes of employment.
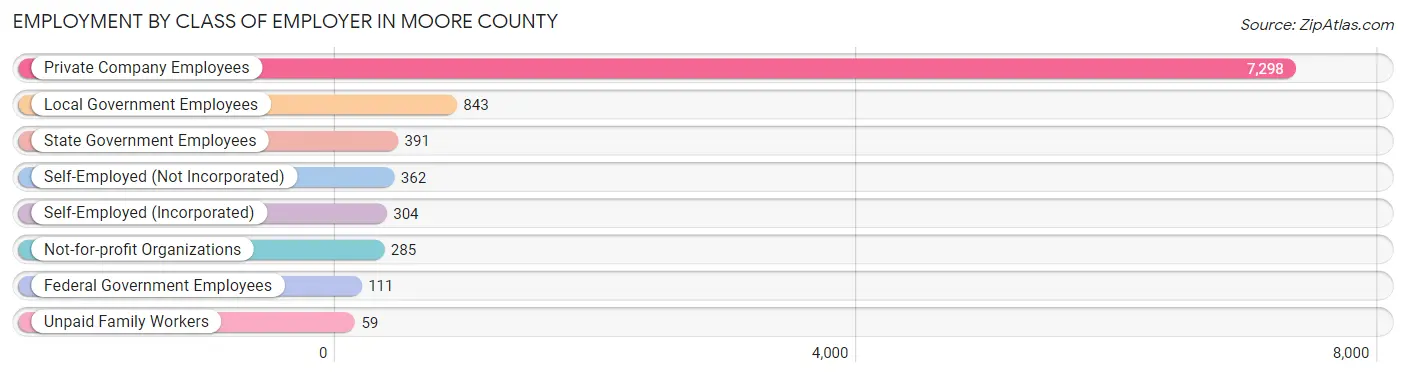
| Employer Class | # Employees | % Employees |
| Private Company Employees | 7,298 | 75.6% |
| Self-Employed (Incorporated) | 304 | 3.2% |
| Self-Employed (Not Incorporated) | 362 | 3.7% |
| Not-for-profit Organizations | 285 | 2.9% |
| Local Government Employees | 843 | 8.7% |
| State Government Employees | 391 | 4.1% |
| Federal Government Employees | 111 | 1.1% |
| Unpaid Family Workers | 59 | 0.6% |
| Total | 9,653 | 100.0% |
Employment Status by Age in Moore County
According to the labor force statistics for Moore County, out of the total population over 16 years of age (15,281), 65.2% or 9,963 individuals are in the labor force, with 2.5% or 249 of them unemployed. The age group with the highest labor force participation rate is 30 to 34 years, with 87.5% or 1,146 individuals in the labor force. Within the labor force, the 16 to 19 years age range has the highest percentage of unemployed individuals, with 9.5% or 46 of them being unemployed.
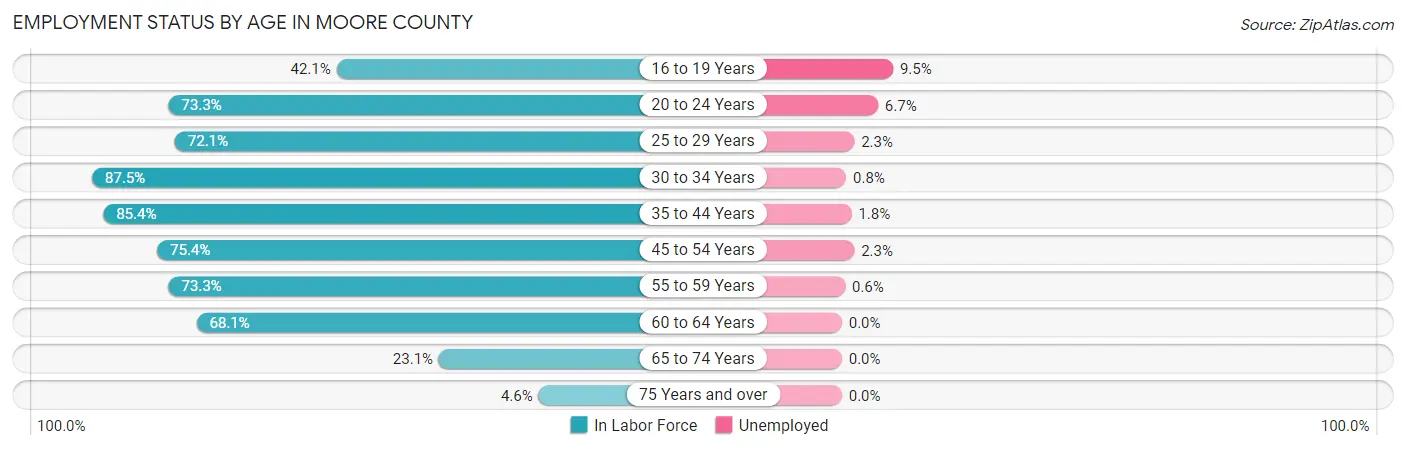
| Age Bracket | In Labor Force | Unemployed |
| 16 to 19 Years | 486 (42.1%) | 46 (9.5%) |
| 20 to 24 Years | 1,157 (73.3%) | 78 (6.7%) |
| 25 to 29 Years | 1,193 (72.1%) | 27 (2.3%) |
| 30 to 34 Years | 1,146 (87.5%) | 9 (0.8%) |
| 35 to 44 Years | 2,304 (85.4%) | 41 (1.8%) |
| 45 to 54 Years | 1,726 (75.4%) | 40 (2.3%) |
| 55 to 59 Years | 883 (73.3%) | 5 (0.6%) |
| 60 to 64 Years | 680 (68.1%) | 0 (0.0%) |
| 65 to 74 Years | 342 (23.1%) | 0 (0.0%) |
| 75 Years and over | 42 (4.6%) | 0 (0.0%) |
| Total | 9,963 (65.2%) | 249 (2.5%) |
Employment Status by Educational Attainment in Moore County
According to labor force statistics for Moore County, 78.1% of individuals (7,929) out of the total population between 25 and 64 years of age (10,153) are in the labor force, with 1.5% or 119 of them being unemployed. The group with the highest labor force participation rate are those with the educational attainment of bachelor's degree or higher, with 91.5% or 1,202 individuals in the labor force. Within the labor force, individuals with bachelor's degree or higher education have the highest percentage of unemployment, with 3.3% or 40 of them being unemployed.
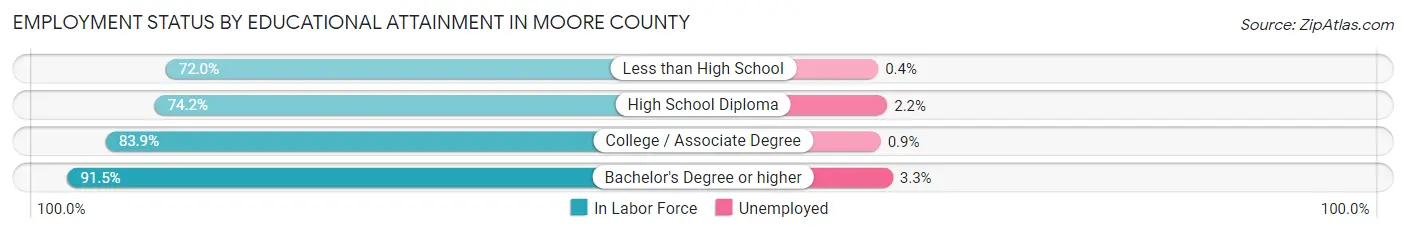
| Educational Attainment | In Labor Force | Unemployed |
| Less than High School | 2,282 (72.0%) | 13 (0.4%) |
| High School Diploma | 2,367 (74.2%) | 70 (2.2%) |
| College / Associate Degree | 2,081 (83.9%) | 22 (0.9%) |
| Bachelor's Degree or higher | 1,202 (91.5%) | 43 (3.3%) |
| Total | 7,929 (78.1%) | 152 (1.5%) |
Employment Occupations by Sex in Moore County
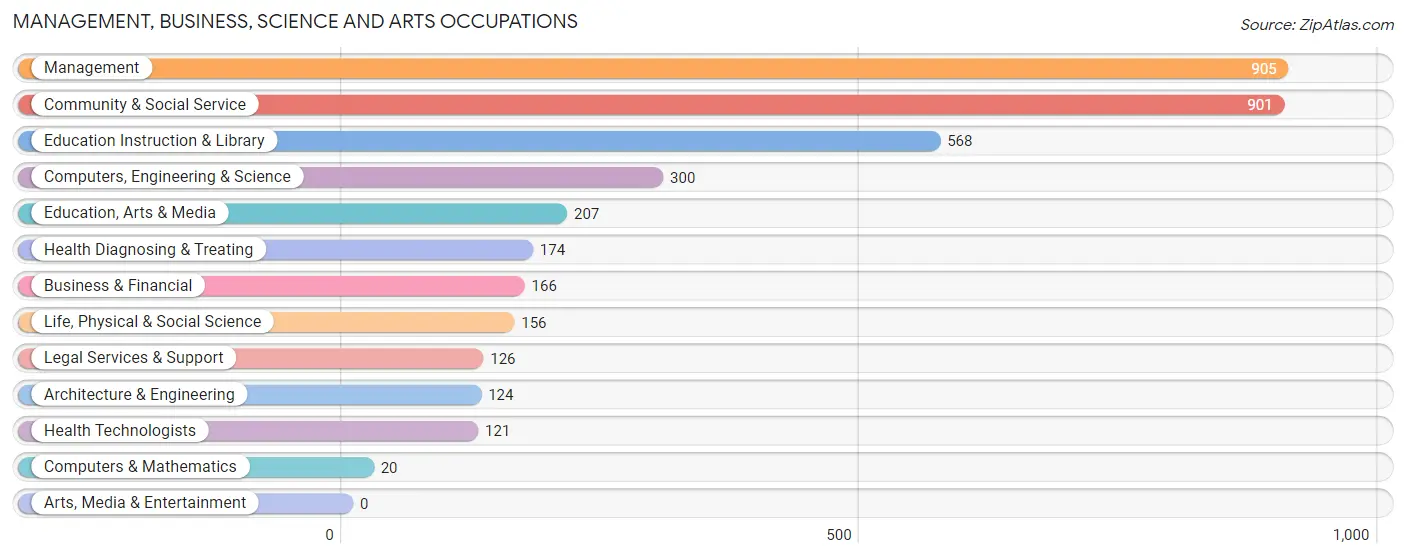
Management, Business, Science and Arts Occupations
The most common Management, Business, Science and Arts occupations in Moore County are Management (905 | 9.3%), Community & Social Service (901 | 9.3%), Education Instruction & Library (568 | 5.9%), Computers, Engineering & Science (300 | 3.1%), and Education, Arts & Media (207 | 2.1%).
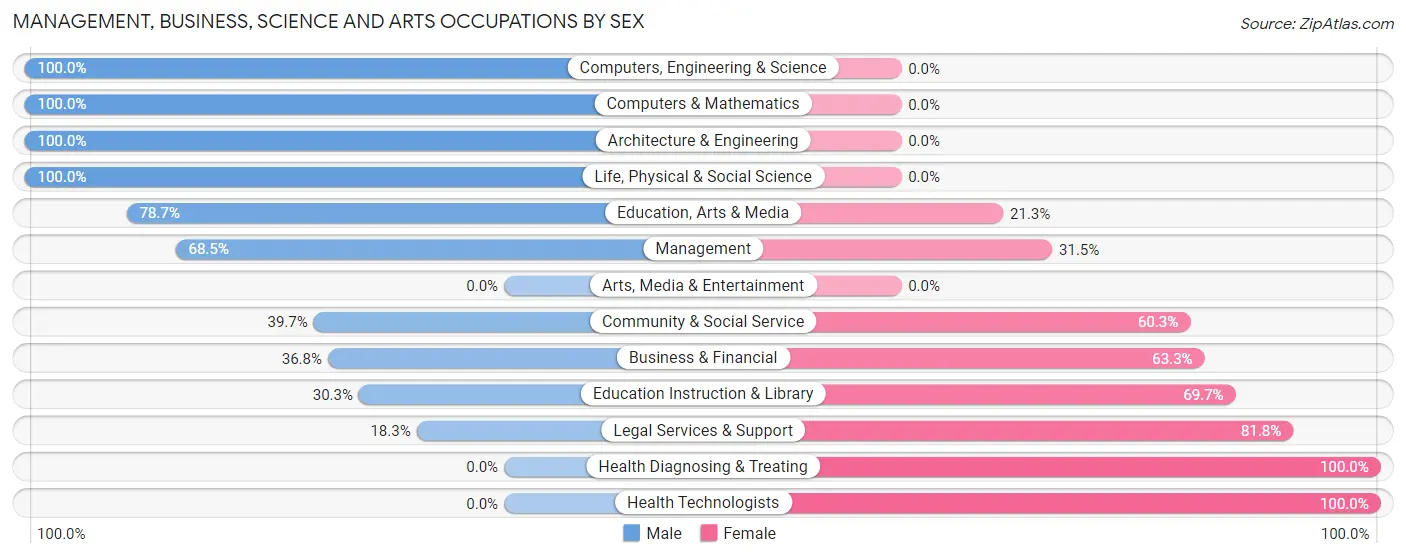
Management, Business, Science and Arts Occupations by Sex
Within the Management, Business, Science and Arts occupations in Moore County, the most male-oriented occupations are Computers, Engineering & Science (100.0%), Computers & Mathematics (100.0%), and Architecture & Engineering (100.0%), while the most female-oriented occupations are Health Diagnosing & Treating (100.0%), Health Technologists (100.0%), and Legal Services & Support (81.8%).
| Occupation | Male | Female |
| Management | 620 (68.5%) | 285 (31.5%) |
| Business & Financial | 61 (36.7%) | 105 (63.2%) |
| Computers, Engineering & Science | 300 (100.0%) | 0 (0.0%) |
| Computers & Mathematics | 20 (100.0%) | 0 (0.0%) |
| Architecture & Engineering | 124 (100.0%) | 0 (0.0%) |
| Life, Physical & Social Science | 156 (100.0%) | 0 (0.0%) |
| Community & Social Service | 358 (39.7%) | 543 (60.3%) |
| Education, Arts & Media | 163 (78.7%) | 44 (21.3%) |
| Legal Services & Support | 23 (18.2%) | 103 (81.8%) |
| Education Instruction & Library | 172 (30.3%) | 396 (69.7%) |
| Arts, Media & Entertainment | 0 (0.0%) | 0 (0.0%) |
| Health Diagnosing & Treating | 0 (0.0%) | 174 (100.0%) |
| Health Technologists | 0 (0.0%) | 121 (100.0%) |
| Total (Category) | 1,339 (54.7%) | 1,107 (45.3%) |
| Total (Overall) | 5,919 (60.9%) | 3,794 (39.1%) |
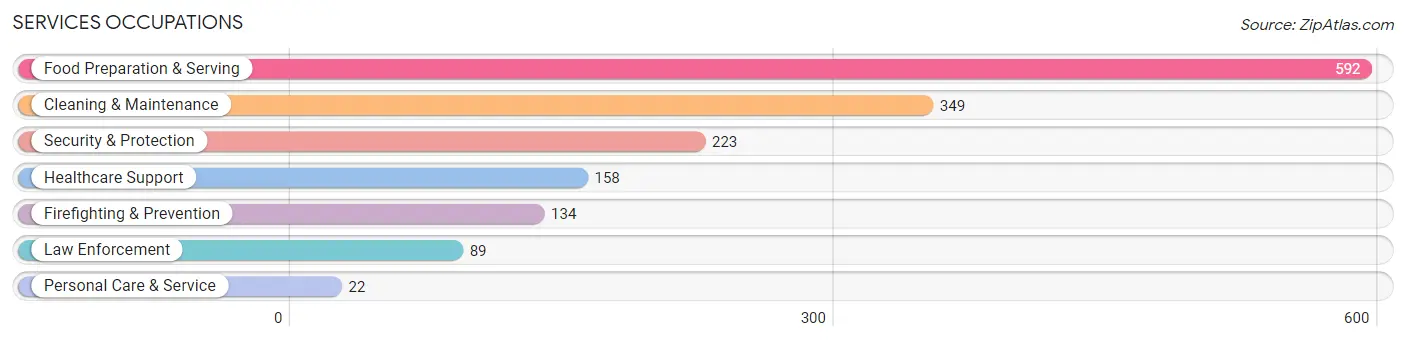
Services Occupations
The most common Services occupations in Moore County are Food Preparation & Serving (592 | 6.1%), Cleaning & Maintenance (349 | 3.6%), Security & Protection (223 | 2.3%), Healthcare Support (158 | 1.6%), and Firefighting & Prevention (134 | 1.4%).
Services Occupations by Sex
Within the Services occupations in Moore County, the most male-oriented occupations are Law Enforcement (93.3%), Security & Protection (76.2%), and Cleaning & Maintenance (74.8%), while the most female-oriented occupations are Personal Care & Service (90.9%), Food Preparation & Serving (67.9%), and Healthcare Support (58.2%).
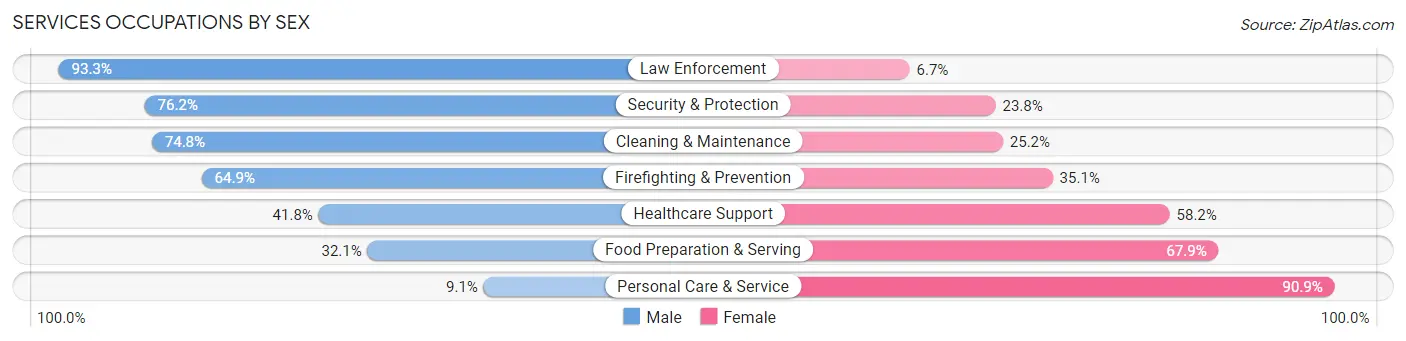
| Occupation | Male | Female |
| Healthcare Support | 66 (41.8%) | 92 (58.2%) |
| Security & Protection | 170 (76.2%) | 53 (23.8%) |
| Firefighting & Prevention | 87 (64.9%) | 47 (35.1%) |
| Law Enforcement | 83 (93.3%) | 6 (6.7%) |
| Food Preparation & Serving | 190 (32.1%) | 402 (67.9%) |
| Cleaning & Maintenance | 261 (74.8%) | 88 (25.2%) |
| Personal Care & Service | 2 (9.1%) | 20 (90.9%) |
| Total (Category) | 689 (51.3%) | 655 (48.7%) |
| Total (Overall) | 5,919 (60.9%) | 3,794 (39.1%) |
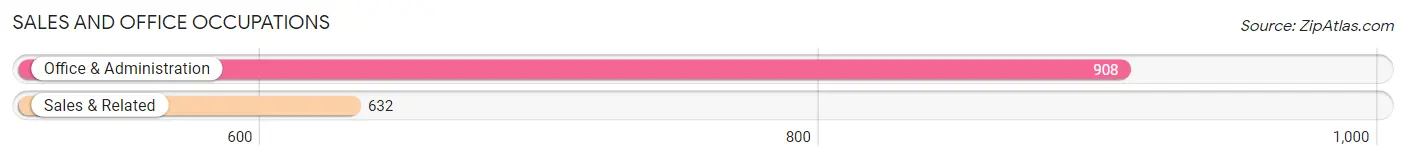
Sales and Office Occupations
The most common Sales and Office occupations in Moore County are Office & Administration (908 | 9.3%), and Sales & Related (632 | 6.5%).
Sales and Office Occupations by Sex
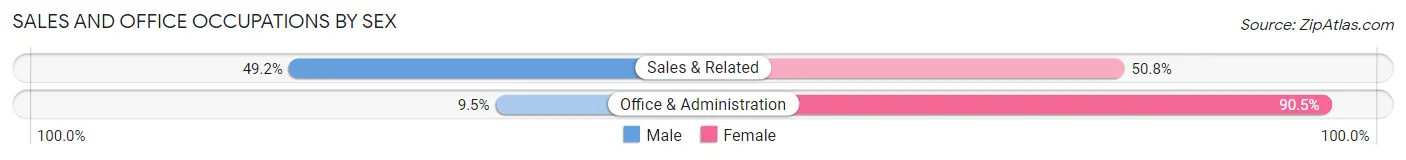
| Occupation | Male | Female |
| Sales & Related | 311 (49.2%) | 321 (50.8%) |
| Office & Administration | 86 (9.5%) | 822 (90.5%) |
| Total (Category) | 397 (25.8%) | 1,143 (74.2%) |
| Total (Overall) | 5,919 (60.9%) | 3,794 (39.1%) |
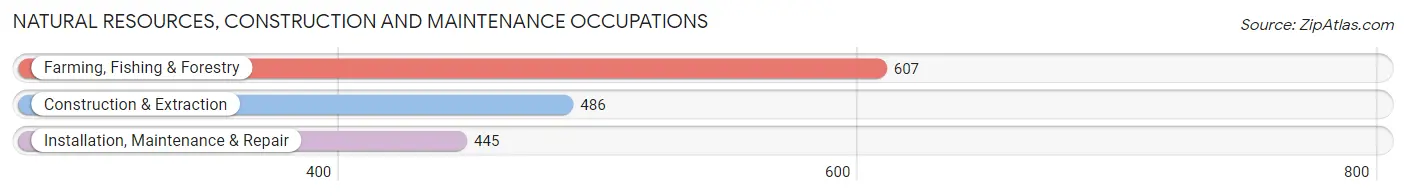
Natural Resources, Construction and Maintenance Occupations
The most common Natural Resources, Construction and Maintenance occupations in Moore County are Farming, Fishing & Forestry (607 | 6.2%), Construction & Extraction (486 | 5.0%), and Installation, Maintenance & Repair (445 | 4.6%).
Natural Resources, Construction and Maintenance Occupations by Sex
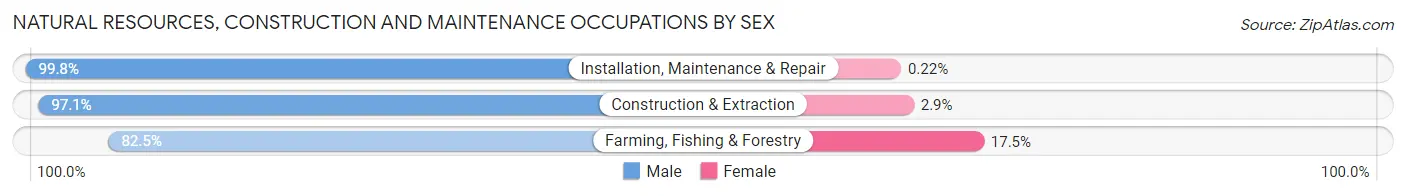
| Occupation | Male | Female |
| Farming, Fishing & Forestry | 501 (82.5%) | 106 (17.5%) |
| Construction & Extraction | 472 (97.1%) | 14 (2.9%) |
| Installation, Maintenance & Repair | 444 (99.8%) | 1 (0.2%) |
| Total (Category) | 1,417 (92.1%) | 121 (7.9%) |
| Total (Overall) | 5,919 (60.9%) | 3,794 (39.1%) |
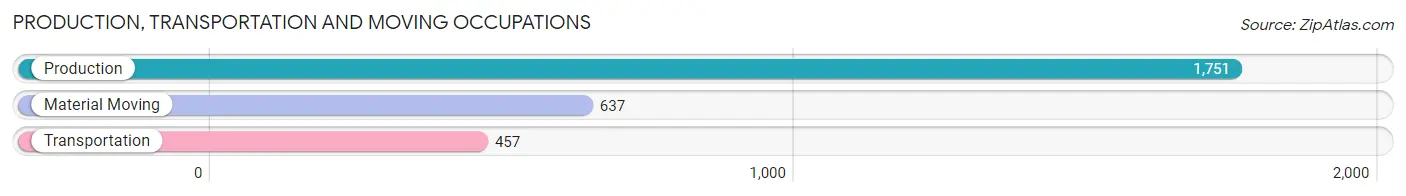
Production, Transportation and Moving Occupations
The most common Production, Transportation and Moving occupations in Moore County are Production (1,751 | 18.0%), Material Moving (637 | 6.6%), and Transportation (457 | 4.7%).
Production, Transportation and Moving Occupations by Sex
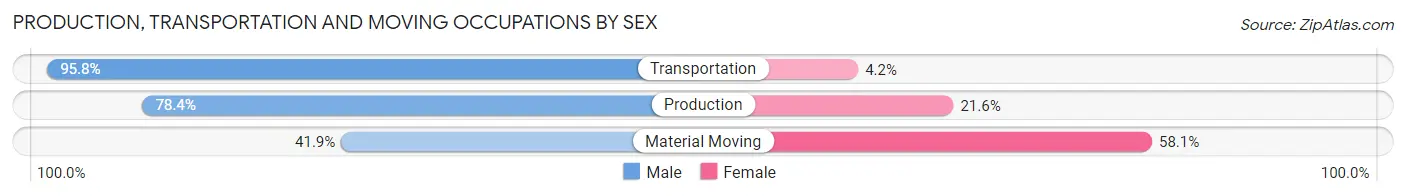
| Occupation | Male | Female |
| Production | 1,372 (78.4%) | 379 (21.6%) |
| Transportation | 438 (95.8%) | 19 (4.2%) |
| Material Moving | 267 (41.9%) | 370 (58.1%) |
| Total (Category) | 2,077 (73.0%) | 768 (27.0%) |
| Total (Overall) | 5,919 (60.9%) | 3,794 (39.1%) |
Employment Industries by Sex in Moore County
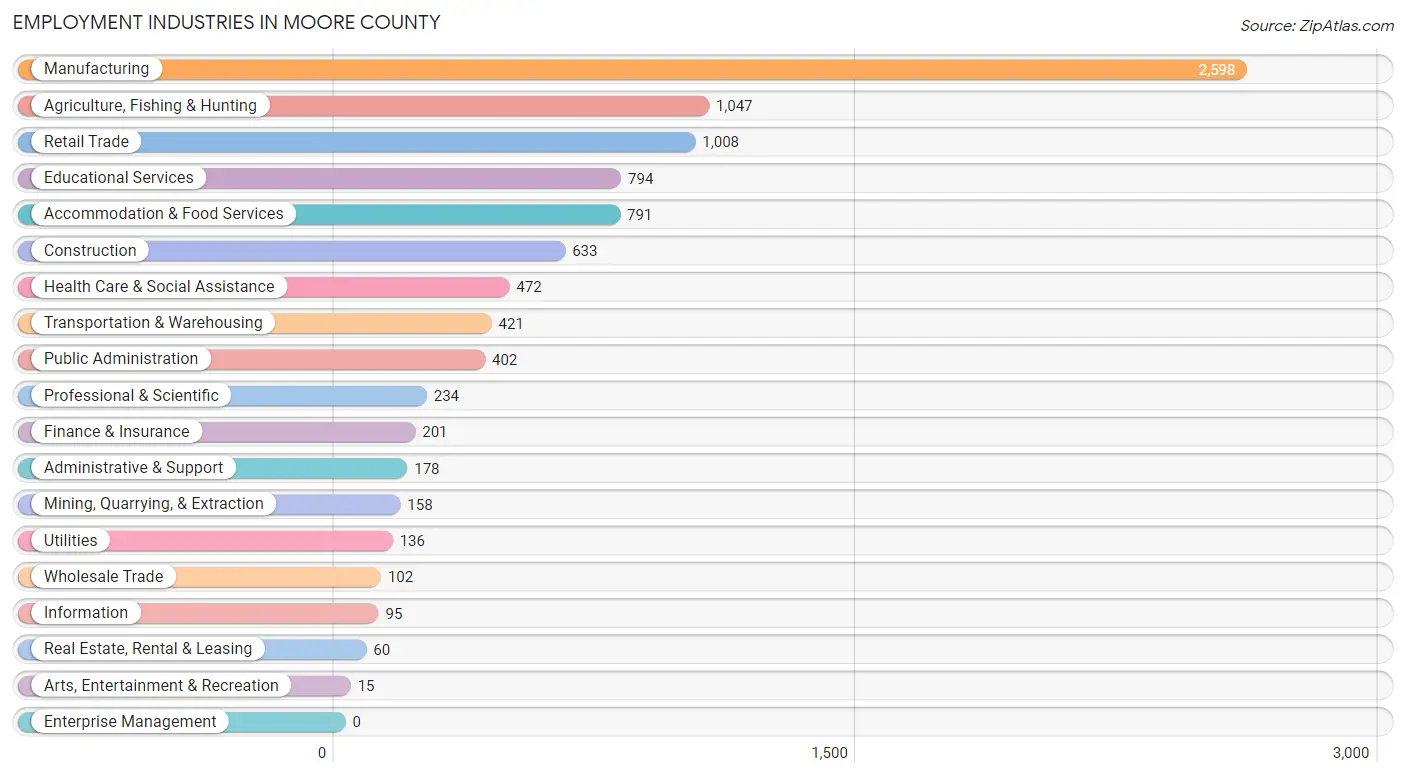
Employment Industries in Moore County
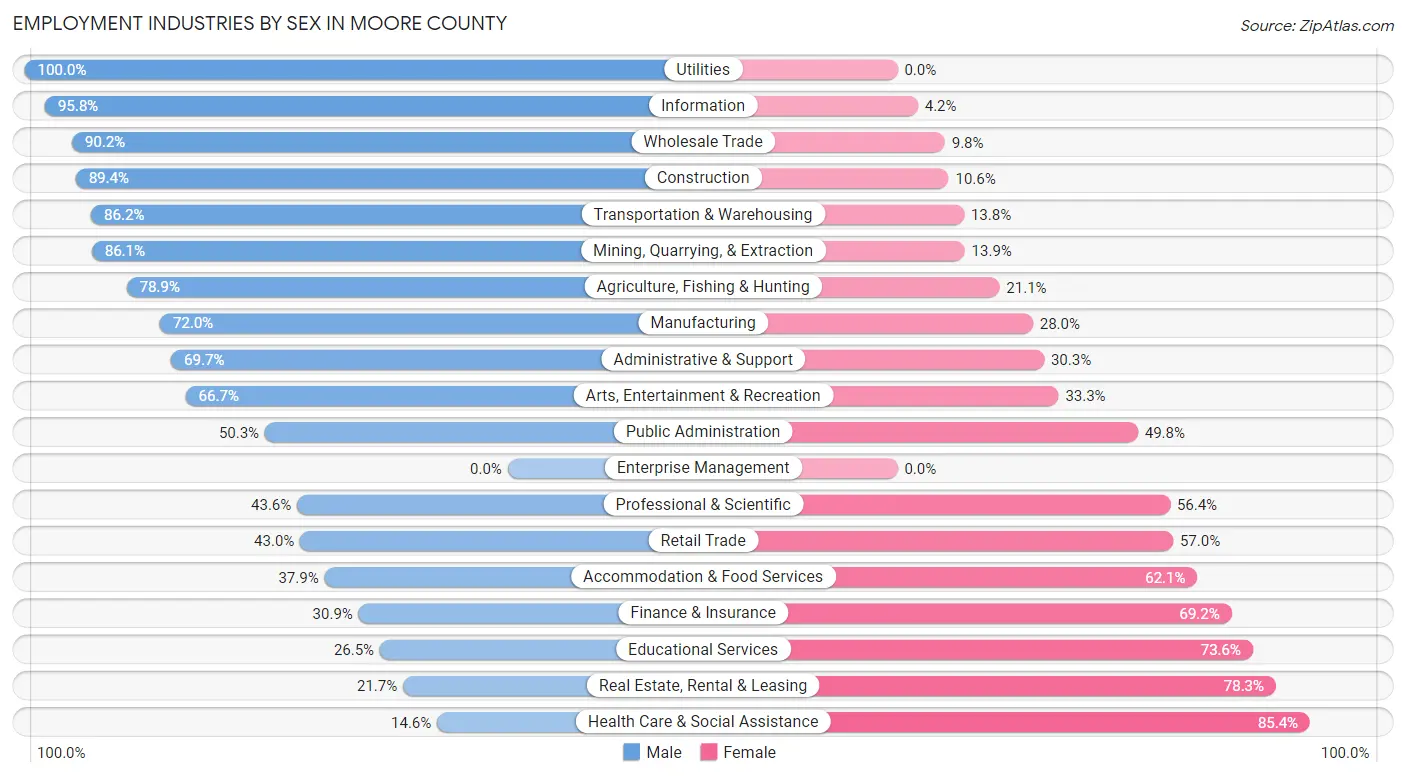
The major employment industries in Moore County include Manufacturing (2,598 | 26.8%), Agriculture, Fishing & Hunting (1,047 | 10.8%), Retail Trade (1,008 | 10.4%), Educational Services (794 | 8.2%), and Accommodation & Food Services (791 | 8.1%).
Employment Industries by Sex in Moore County
The Moore County industries that see more men than women are Utilities (100.0%), Information (95.8%), and Wholesale Trade (90.2%), whereas the industries that tend to have a higher number of women are Health Care & Social Assistance (85.4%), Real Estate, Rental & Leasing (78.3%), and Educational Services (73.6%).
| Industry | Male | Female |
| Agriculture, Fishing & Hunting | 826 (78.9%) | 221 (21.1%) |
| Mining, Quarrying, & Extraction | 136 (86.1%) | 22 (13.9%) |
| Construction | 566 (89.4%) | 67 (10.6%) |
| Manufacturing | 1,870 (72.0%) | 728 (28.0%) |
| Wholesale Trade | 92 (90.2%) | 10 (9.8%) |
| Retail Trade | 433 (43.0%) | 575 (57.0%) |
| Transportation & Warehousing | 363 (86.2%) | 58 (13.8%) |
| Utilities | 136 (100.0%) | 0 (0.0%) |
| Information | 91 (95.8%) | 4 (4.2%) |
| Finance & Insurance | 62 (30.8%) | 139 (69.2%) |
| Real Estate, Rental & Leasing | 13 (21.7%) | 47 (78.3%) |
| Professional & Scientific | 102 (43.6%) | 132 (56.4%) |
| Enterprise Management | 0 (0.0%) | 0 (0.0%) |
| Administrative & Support | 124 (69.7%) | 54 (30.3%) |
| Educational Services | 210 (26.5%) | 584 (73.6%) |
| Health Care & Social Assistance | 69 (14.6%) | 403 (85.4%) |
| Arts, Entertainment & Recreation | 10 (66.7%) | 5 (33.3%) |
| Accommodation & Food Services | 300 (37.9%) | 491 (62.1%) |
| Public Administration | 202 (50.2%) | 200 (49.7%) |
| Total | 5,919 (60.9%) | 3,794 (39.1%) |
Education in Moore County
School Enrollment in Moore County
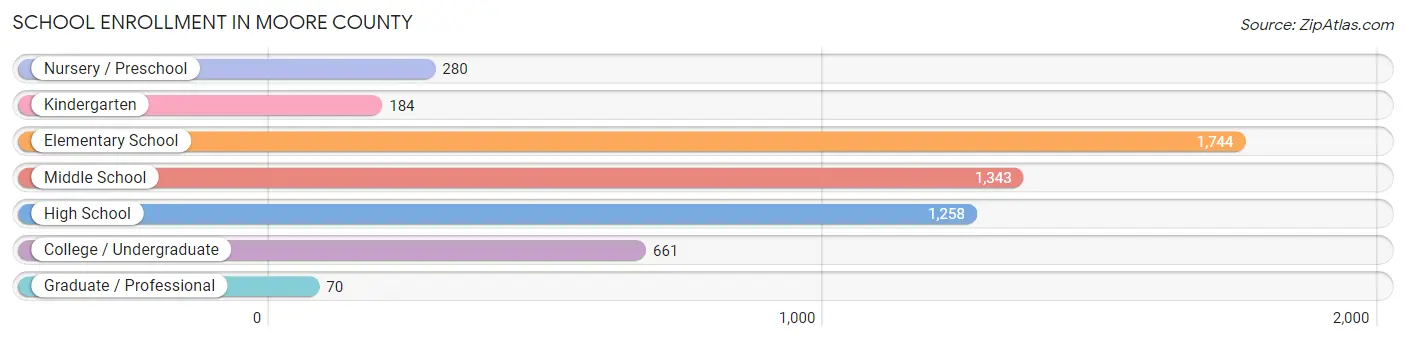
The most common levels of schooling among the 5,540 students in Moore County are elementary school (1,744 | 31.5%), middle school (1,343 | 24.2%), and high school (1,258 | 22.7%).
| School Level | # Students | % Students |
| Nursery / Preschool | 280 | 5.1% |
| Kindergarten | 184 | 3.3% |
| Elementary School | 1,744 | 31.5% |
| Middle School | 1,343 | 24.2% |
| High School | 1,258 | 22.7% |
| College / Undergraduate | 661 | 11.9% |
| Graduate / Professional | 70 | 1.3% |
| Total | 5,540 | 100.0% |
School Enrollment by Age by Funding Source in Moore County
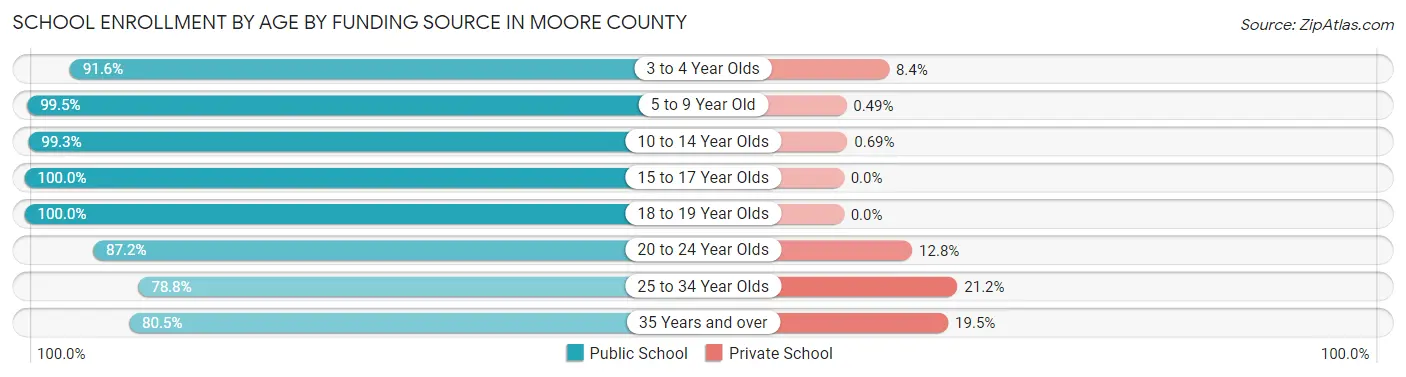
Out of a total of 5,540 students who are enrolled in schools in Moore County, 144 (2.6%) attend a private institution, while the remaining 5,396 (97.4%) are enrolled in public schools. The age group of 25 to 34 year olds has the highest likelihood of being enrolled in private schools, with 43 (21.2% in the age bracket) enrolled. Conversely, the age group of 15 to 17 year olds has the lowest likelihood of being enrolled in a private school, with 903 (100.0% in the age bracket) attending a public institution.
| Age Bracket | Public School | Private School |
| 3 to 4 Year Olds | 206 (91.6%) | 19 (8.4%) |
| 5 to 9 Year Old | 1,830 (99.5%) | 9 (0.5%) |
| 10 to 14 Year Olds | 1,730 (99.3%) | 12 (0.7%) |
| 15 to 17 Year Olds | 903 (100.0%) | 0 (0.0%) |
| 18 to 19 Year Olds | 236 (100.0%) | 0 (0.0%) |
| 20 to 24 Year Olds | 212 (87.2%) | 31 (12.8%) |
| 25 to 34 Year Olds | 160 (78.8%) | 43 (21.2%) |
| 35 Years and over | 120 (80.5%) | 29 (19.5%) |
| Total | 5,396 (97.4%) | 144 (2.6%) |
Educational Attainment by Field of Study in Moore County
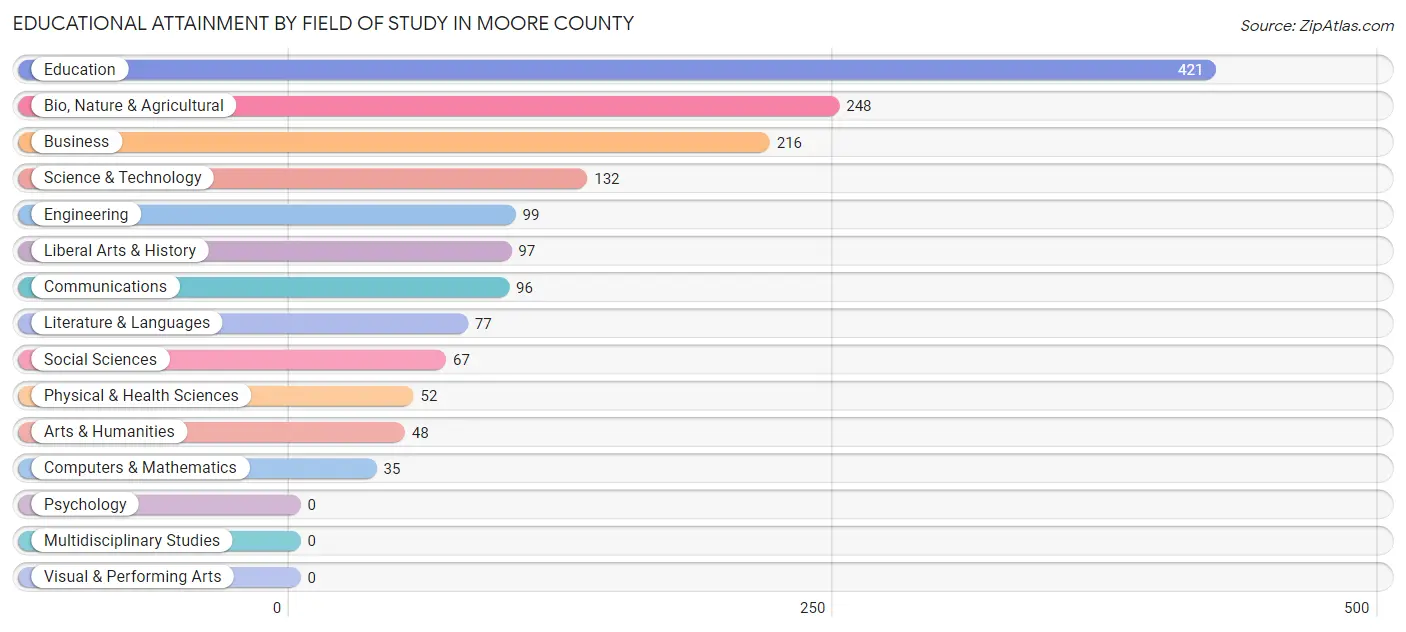
Education (421 | 26.5%), bio, nature & agricultural (248 | 15.6%), business (216 | 13.6%), science & technology (132 | 8.3%), and engineering (99 | 6.2%) are the most common fields of study among 1,588 individuals in Moore County who have obtained a bachelor's degree or higher.
| Field of Study | # Graduates | % Graduates |
| Computers & Mathematics | 35 | 2.2% |
| Bio, Nature & Agricultural | 248 | 15.6% |
| Physical & Health Sciences | 52 | 3.3% |
| Psychology | 0 | 0.0% |
| Social Sciences | 67 | 4.2% |
| Engineering | 99 | 6.2% |
| Multidisciplinary Studies | 0 | 0.0% |
| Science & Technology | 132 | 8.3% |
| Business | 216 | 13.6% |
| Education | 421 | 26.5% |
| Literature & Languages | 77 | 4.9% |
| Liberal Arts & History | 97 | 6.1% |
| Visual & Performing Arts | 0 | 0.0% |
| Communications | 96 | 6.0% |
| Arts & Humanities | 48 | 3.0% |
| Total | 1,588 | 100.0% |
Transportation & Commute in Moore County
Vehicle Availability by Sex in Moore County
The most prevalent vehicle ownership categories in Moore County are males with 2 vehicles (1,840, accounting for 31.4%) and females with 2 vehicles (1,208, making up 48.6%).
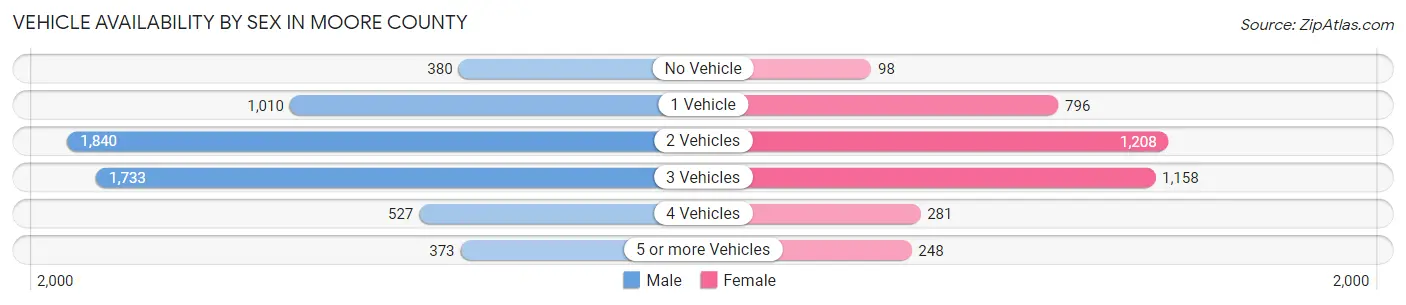
| Vehicles Available | Male | Female |
| No Vehicle | 380 (6.5%) | 98 (2.6%) |
| 1 Vehicle | 1,010 (17.2%) | 796 (21.0%) |
| 2 Vehicles | 1,840 (31.4%) | 1,208 (31.9%) |
| 3 Vehicles | 1,733 (29.6%) | 1,158 (30.6%) |
| 4 Vehicles | 527 (9.0%) | 281 (7.4%) |
| 5 or more Vehicles | 373 (6.4%) | 248 (6.6%) |
| Total | 5,863 (100.0%) | 3,789 (100.0%) |
Commute Time in Moore County
The most frequently occuring commute durations in Moore County are 5 to 9 minutes (2,353 commuters, 24.7%), 15 to 19 minutes (2,009 commuters, 21.1%), and 10 to 14 minutes (1,683 commuters, 17.7%).
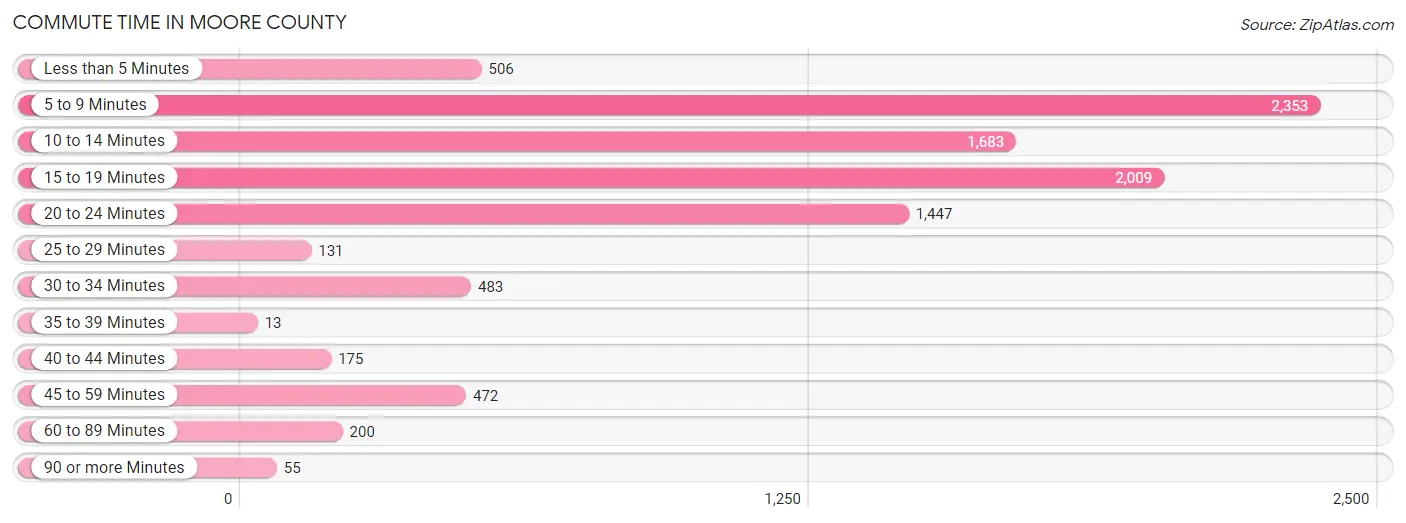
| Commute Time | # Commuters | % Commuters |
| Less than 5 Minutes | 506 | 5.3% |
| 5 to 9 Minutes | 2,353 | 24.7% |
| 10 to 14 Minutes | 1,683 | 17.7% |
| 15 to 19 Minutes | 2,009 | 21.1% |
| 20 to 24 Minutes | 1,447 | 15.2% |
| 25 to 29 Minutes | 131 | 1.4% |
| 30 to 34 Minutes | 483 | 5.1% |
| 35 to 39 Minutes | 13 | 0.1% |
| 40 to 44 Minutes | 175 | 1.8% |
| 45 to 59 Minutes | 472 | 5.0% |
| 60 to 89 Minutes | 200 | 2.1% |
| 90 or more Minutes | 55 | 0.6% |
Commute Time by Sex in Moore County
The most common commute times in Moore County are 5 to 9 minutes (1,406 commuters, 24.2%) for males and 5 to 9 minutes (947 commuters, 25.4%) for females.
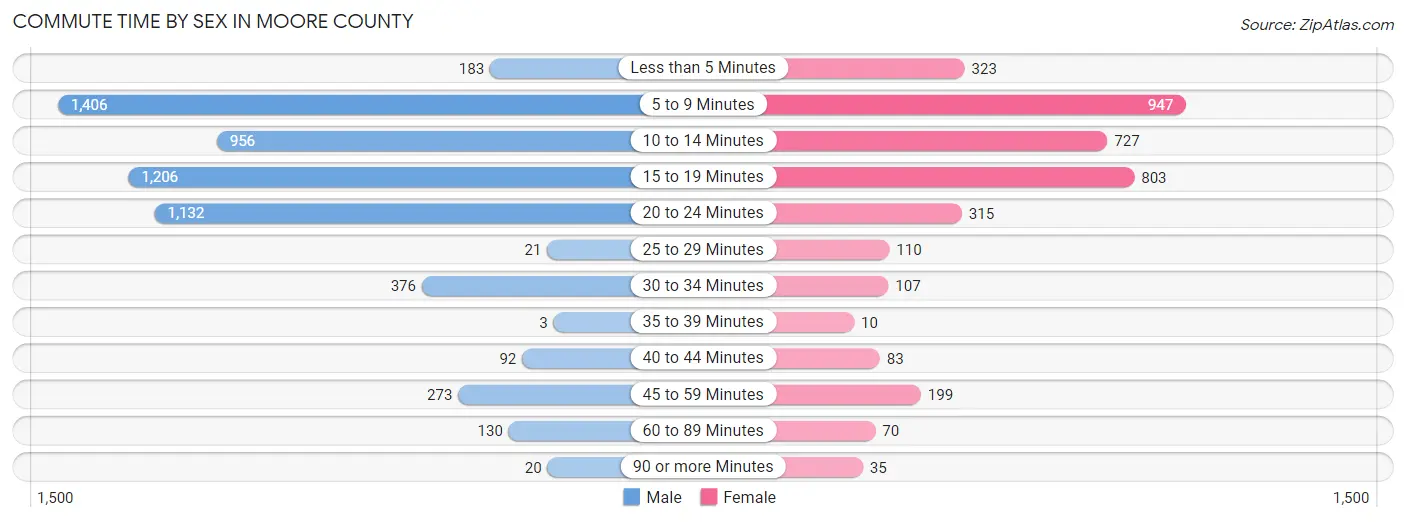
| Commute Time | Male | Female |
| Less than 5 Minutes | 183 (3.2%) | 323 (8.7%) |
| 5 to 9 Minutes | 1,406 (24.2%) | 947 (25.4%) |
| 10 to 14 Minutes | 956 (16.5%) | 727 (19.5%) |
| 15 to 19 Minutes | 1,206 (20.8%) | 803 (21.5%) |
| 20 to 24 Minutes | 1,132 (19.5%) | 315 (8.5%) |
| 25 to 29 Minutes | 21 (0.4%) | 110 (2.9%) |
| 30 to 34 Minutes | 376 (6.5%) | 107 (2.9%) |
| 35 to 39 Minutes | 3 (0.1%) | 10 (0.3%) |
| 40 to 44 Minutes | 92 (1.6%) | 83 (2.2%) |
| 45 to 59 Minutes | 273 (4.7%) | 199 (5.3%) |
| 60 to 89 Minutes | 130 (2.2%) | 70 (1.9%) |
| 90 or more Minutes | 20 (0.3%) | 35 (0.9%) |
Time of Departure to Work by Sex in Moore County
The most frequent times of departure to work in Moore County are 7:00 AM to 7:29 AM (1,032, 17.8%) for males and 7:00 AM to 7:29 AM (591, 15.9%) for females.
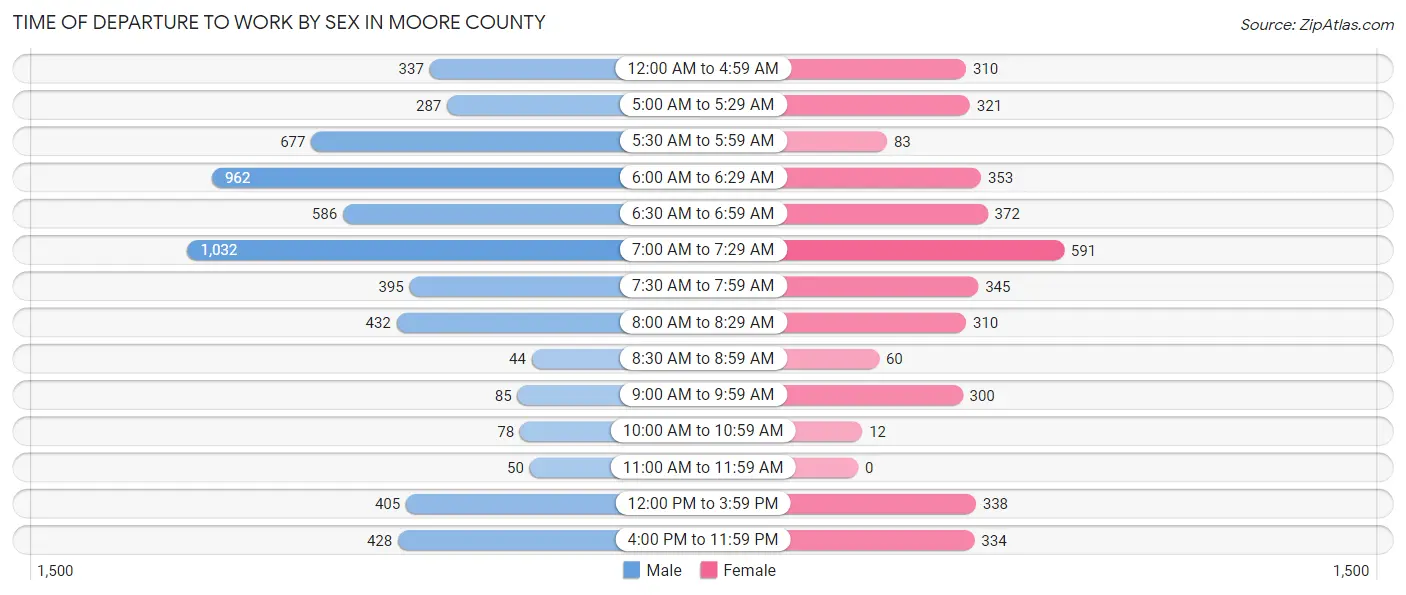
| Time of Departure | Male | Female |
| 12:00 AM to 4:59 AM | 337 (5.8%) | 310 (8.3%) |
| 5:00 AM to 5:29 AM | 287 (5.0%) | 321 (8.6%) |
| 5:30 AM to 5:59 AM | 677 (11.7%) | 83 (2.2%) |
| 6:00 AM to 6:29 AM | 962 (16.6%) | 353 (9.5%) |
| 6:30 AM to 6:59 AM | 586 (10.1%) | 372 (10.0%) |
| 7:00 AM to 7:29 AM | 1,032 (17.8%) | 591 (15.9%) |
| 7:30 AM to 7:59 AM | 395 (6.8%) | 345 (9.2%) |
| 8:00 AM to 8:29 AM | 432 (7.4%) | 310 (8.3%) |
| 8:30 AM to 8:59 AM | 44 (0.8%) | 60 (1.6%) |
| 9:00 AM to 9:59 AM | 85 (1.5%) | 300 (8.1%) |
| 10:00 AM to 10:59 AM | 78 (1.3%) | 12 (0.3%) |
| 11:00 AM to 11:59 AM | 50 (0.9%) | 0 (0.0%) |
| 12:00 PM to 3:59 PM | 405 (7.0%) | 338 (9.1%) |
| 4:00 PM to 11:59 PM | 428 (7.4%) | 334 (9.0%) |
| Total | 5,798 (100.0%) | 3,729 (100.0%) |
Housing Occupancy in Moore County
Occupancy by Ownership in Moore County
Of the total 6,989 dwellings in Moore County, owner-occupied units account for 4,537 (64.9%), while renter-occupied units make up 2,452 (35.1%).
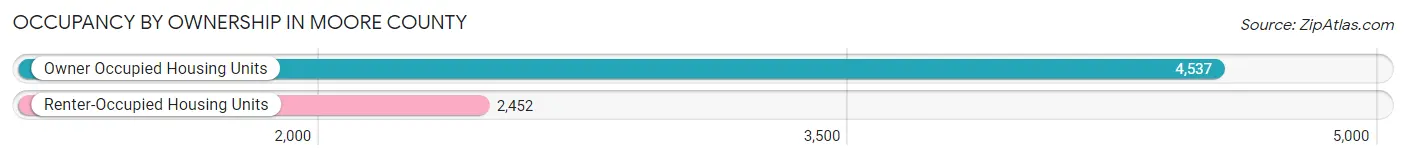
| Occupancy | # Housing Units | % Housing Units |
| Owner Occupied Housing Units | 4,537 | 64.9% |
| Renter-Occupied Housing Units | 2,452 | 35.1% |
| Total Occupied Housing Units | 6,989 | 100.0% |
Occupancy by Household Size in Moore County
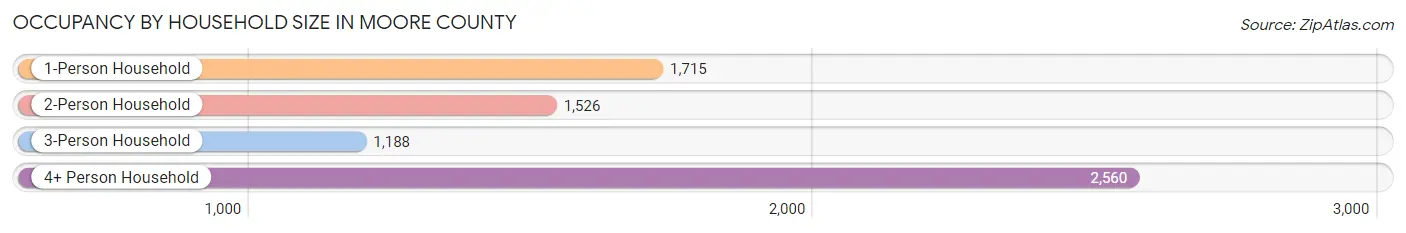
| Household Size | # Housing Units | % Housing Units |
| 1-Person Household | 1,715 | 24.5% |
| 2-Person Household | 1,526 | 21.8% |
| 3-Person Household | 1,188 | 17.0% |
| 4+ Person Household | 2,560 | 36.6% |
| Total Housing Units | 6,989 | 100.0% |
Occupancy by Ownership by Household Size in Moore County
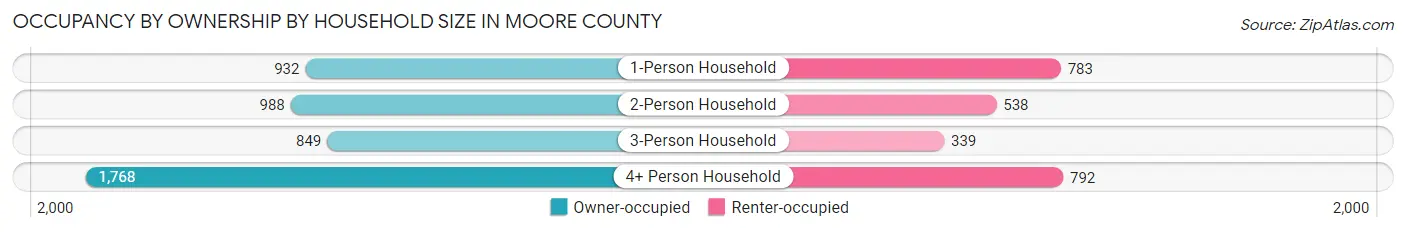
| Household Size | Owner-occupied | Renter-occupied |
| 1-Person Household | 932 (54.3%) | 783 (45.7%) |
| 2-Person Household | 988 (64.7%) | 538 (35.3%) |
| 3-Person Household | 849 (71.5%) | 339 (28.5%) |
| 4+ Person Household | 1,768 (69.1%) | 792 (30.9%) |
| Total Housing Units | 4,537 (64.9%) | 2,452 (35.1%) |
Occupancy by Educational Attainment in Moore County
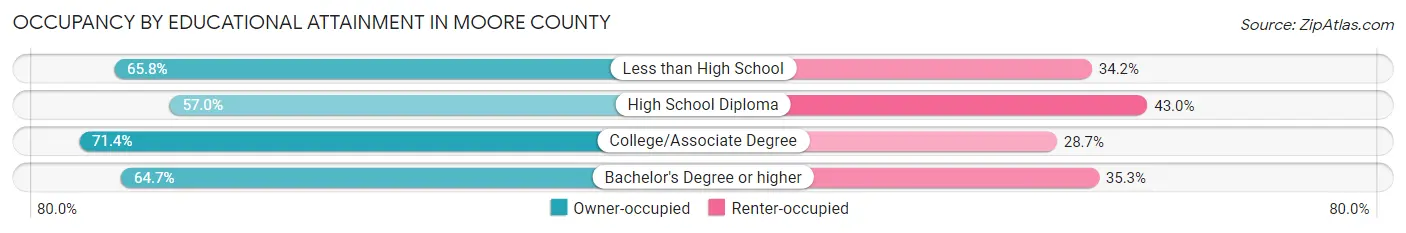
| Household Size | Owner-occupied | Renter-occupied |
| Less than High School | 1,400 (65.8%) | 728 (34.2%) |
| High School Diploma | 1,067 (57.0%) | 805 (43.0%) |
| College/Associate Degree | 1,462 (71.4%) | 587 (28.6%) |
| Bachelor's Degree or higher | 608 (64.7%) | 332 (35.3%) |
Occupancy by Age of Householder in Moore County
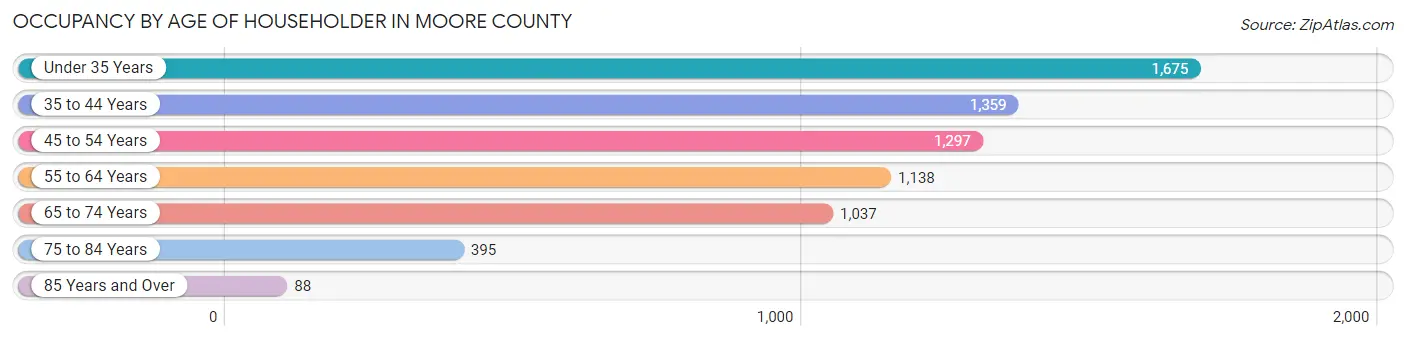
| Age Bracket | # Households | % Households |
| Under 35 Years | 1,675 | 24.0% |
| 35 to 44 Years | 1,359 | 19.4% |
| 45 to 54 Years | 1,297 | 18.6% |
| 55 to 64 Years | 1,138 | 16.3% |
| 65 to 74 Years | 1,037 | 14.8% |
| 75 to 84 Years | 395 | 5.7% |
| 85 Years and Over | 88 | 1.3% |
| Total | 6,989 | 100.0% |
Housing Finances in Moore County
Median Income by Occupancy in Moore County
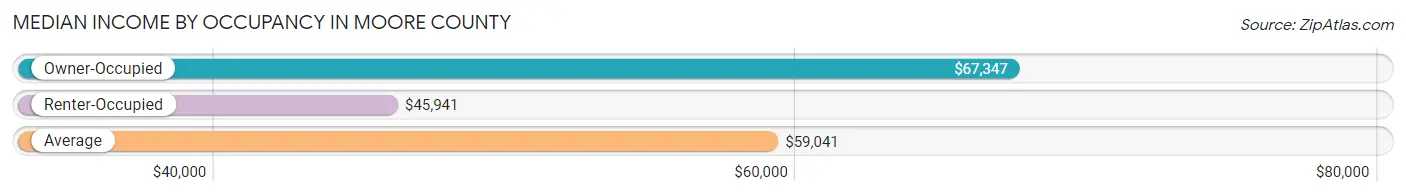
| Occupancy Type | # Households | Median Income |
| Owner-Occupied | 4,537 (64.9%) | $67,347 |
| Renter-Occupied | 2,452 (35.1%) | $45,941 |
| Average | 6,989 (100.0%) | $59,041 |
Occupancy by Householder Income Bracket in Moore County
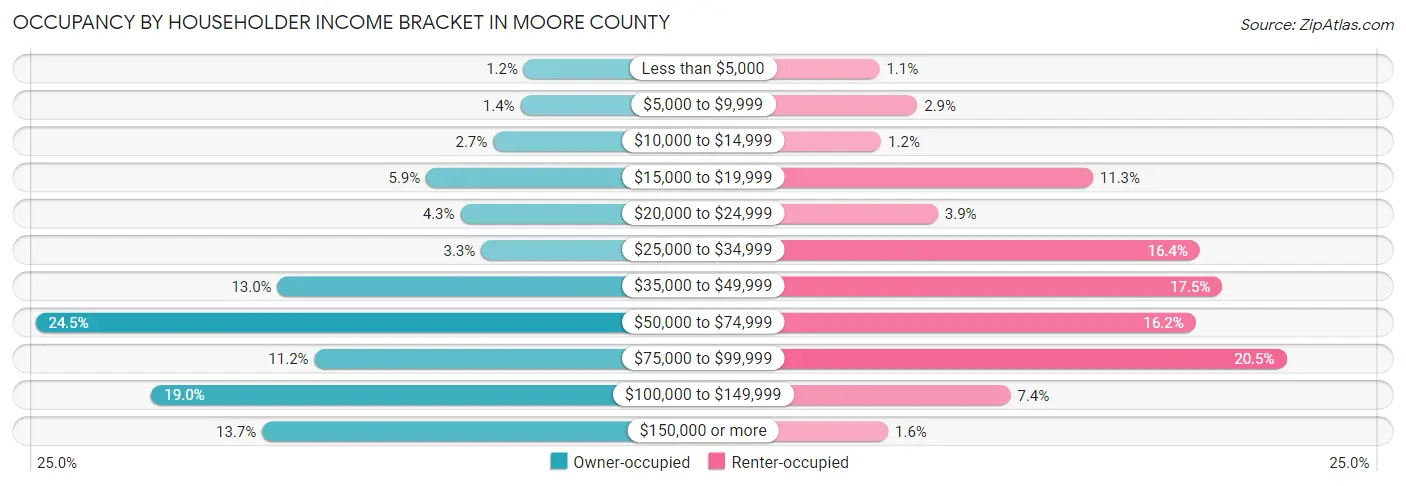
| Income Bracket | Owner-occupied | Renter-occupied |
| Less than $5,000 | 56 (1.2%) | 28 (1.1%) |
| $5,000 to $9,999 | 63 (1.4%) | 72 (2.9%) |
| $10,000 to $14,999 | 122 (2.7%) | 30 (1.2%) |
| $15,000 to $19,999 | 267 (5.9%) | 277 (11.3%) |
| $20,000 to $24,999 | 193 (4.3%) | 96 (3.9%) |
| $25,000 to $34,999 | 148 (3.3%) | 402 (16.4%) |
| $35,000 to $49,999 | 588 (13.0%) | 428 (17.5%) |
| $50,000 to $74,999 | 1,111 (24.5%) | 397 (16.2%) |
| $75,000 to $99,999 | 508 (11.2%) | 503 (20.5%) |
| $100,000 to $149,999 | 860 (19.0%) | 181 (7.4%) |
| $150,000 or more | 621 (13.7%) | 38 (1.5%) |
| Total | 4,537 (100.0%) | 2,452 (100.0%) |
Monthly Housing Cost Tiers in Moore County
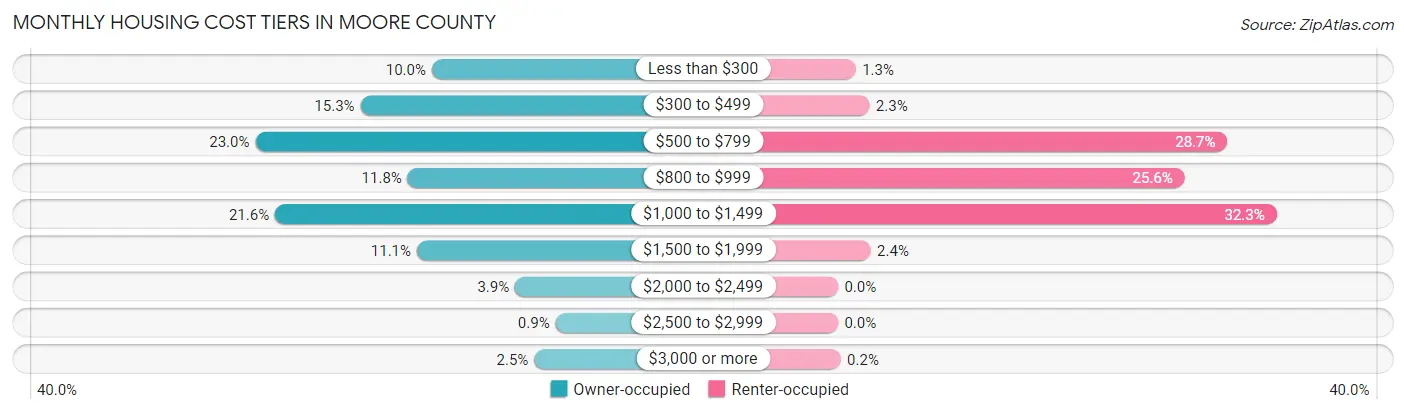
| Monthly Cost | Owner-occupied | Renter-occupied |
| Less than $300 | 454 (10.0%) | 32 (1.3%) |
| $300 to $499 | 693 (15.3%) | 57 (2.3%) |
| $500 to $799 | 1,044 (23.0%) | 704 (28.7%) |
| $800 to $999 | 535 (11.8%) | 627 (25.6%) |
| $1,000 to $1,499 | 978 (21.6%) | 793 (32.3%) |
| $1,500 to $1,999 | 504 (11.1%) | 59 (2.4%) |
| $2,000 to $2,499 | 176 (3.9%) | 0 (0.0%) |
| $2,500 to $2,999 | 41 (0.9%) | 0 (0.0%) |
| $3,000 or more | 112 (2.5%) | 5 (0.2%) |
| Total | 4,537 (100.0%) | 2,452 (100.0%) |
Physical Housing Characteristics in Moore County
Housing Structures in Moore County
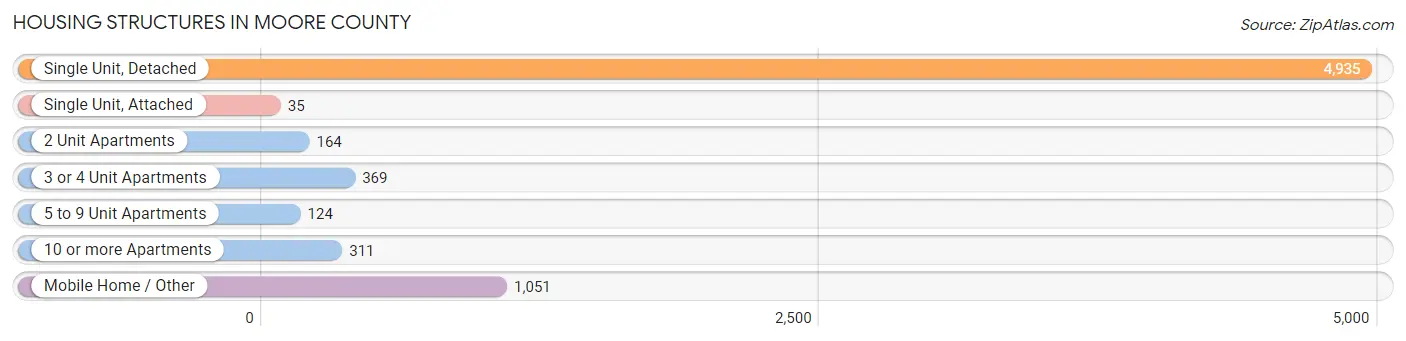
| Structure Type | # Housing Units | % Housing Units |
| Single Unit, Detached | 4,935 | 70.6% |
| Single Unit, Attached | 35 | 0.5% |
| 2 Unit Apartments | 164 | 2.4% |
| 3 or 4 Unit Apartments | 369 | 5.3% |
| 5 to 9 Unit Apartments | 124 | 1.8% |
| 10 or more Apartments | 311 | 4.4% |
| Mobile Home / Other | 1,051 | 15.0% |
| Total | 6,989 | 100.0% |
Housing Structures by Occupancy in Moore County
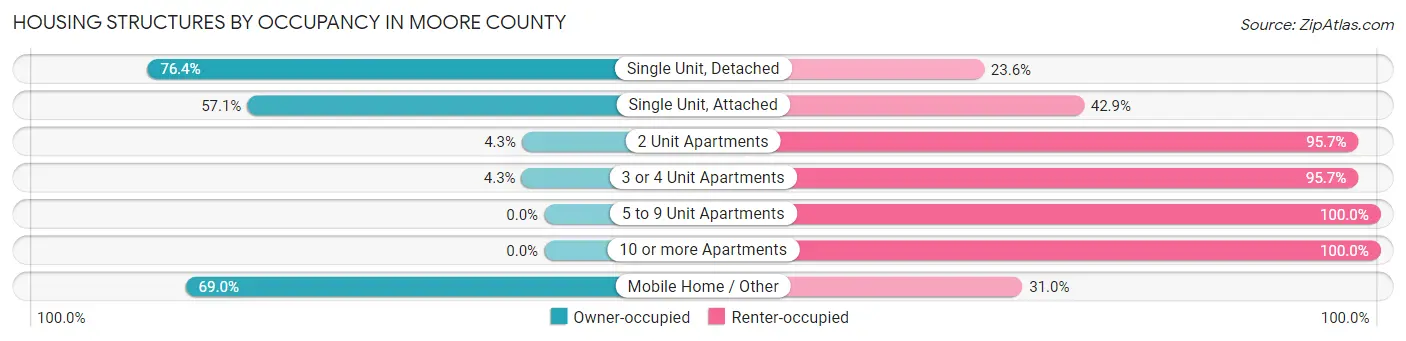
| Structure Type | Owner-occupied | Renter-occupied |
| Single Unit, Detached | 3,769 (76.4%) | 1,166 (23.6%) |
| Single Unit, Attached | 20 (57.1%) | 15 (42.9%) |
| 2 Unit Apartments | 7 (4.3%) | 157 (95.7%) |
| 3 or 4 Unit Apartments | 16 (4.3%) | 353 (95.7%) |
| 5 to 9 Unit Apartments | 0 (0.0%) | 124 (100.0%) |
| 10 or more Apartments | 0 (0.0%) | 311 (100.0%) |
| Mobile Home / Other | 725 (69.0%) | 326 (31.0%) |
| Total | 4,537 (64.9%) | 2,452 (35.1%) |
Housing Structures by Number of Rooms in Moore County
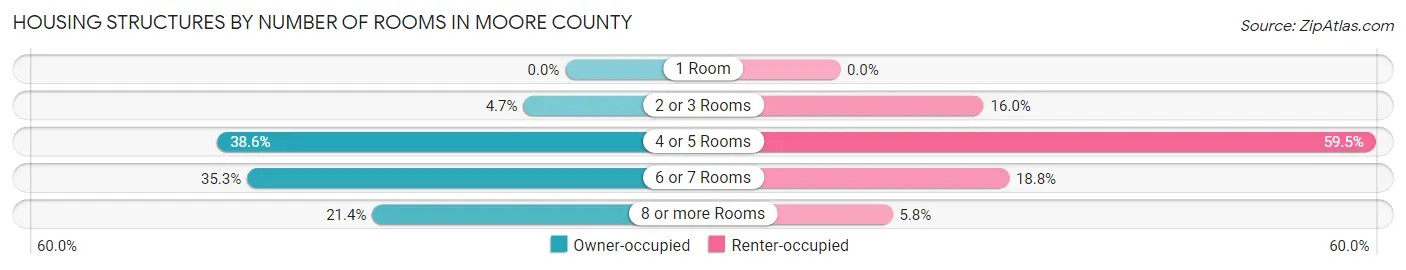
| Number of Rooms | Owner-occupied | Renter-occupied |
| 1 Room | 0 (0.0%) | 0 (0.0%) |
| 2 or 3 Rooms | 211 (4.6%) | 391 (16.0%) |
| 4 or 5 Rooms | 1,752 (38.6%) | 1,458 (59.5%) |
| 6 or 7 Rooms | 1,602 (35.3%) | 460 (18.8%) |
| 8 or more Rooms | 972 (21.4%) | 143 (5.8%) |
| Total | 4,537 (100.0%) | 2,452 (100.0%) |
Housing Structure by Heating Type in Moore County
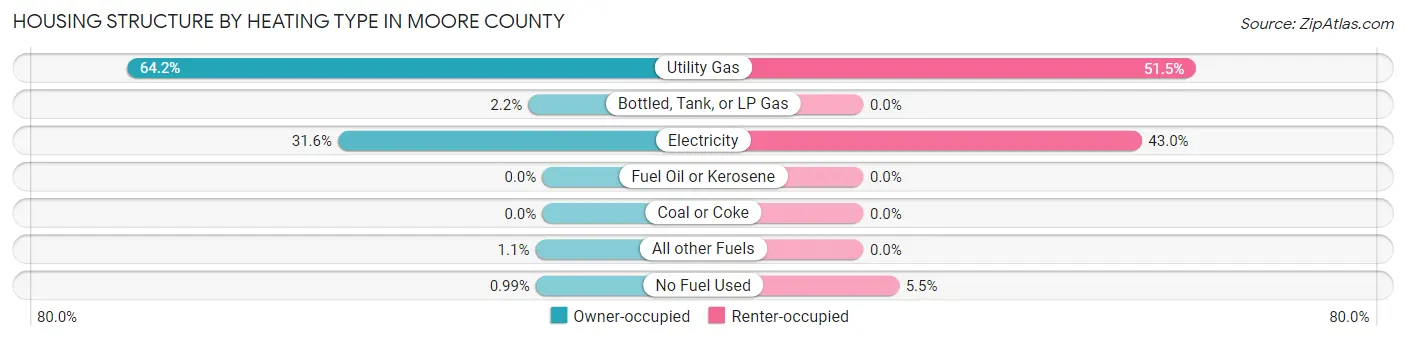
| Heating Type | Owner-occupied | Renter-occupied |
| Utility Gas | 2,912 (64.2%) | 1,262 (51.5%) |
| Bottled, Tank, or LP Gas | 99 (2.2%) | 0 (0.0%) |
| Electricity | 1,433 (31.6%) | 1,055 (43.0%) |
| Fuel Oil or Kerosene | 0 (0.0%) | 0 (0.0%) |
| Coal or Coke | 0 (0.0%) | 0 (0.0%) |
| All other Fuels | 48 (1.1%) | 0 (0.0%) |
| No Fuel Used | 45 (1.0%) | 135 (5.5%) |
| Total | 4,537 (100.0%) | 2,452 (100.0%) |
Household Vehicle Usage in Moore County
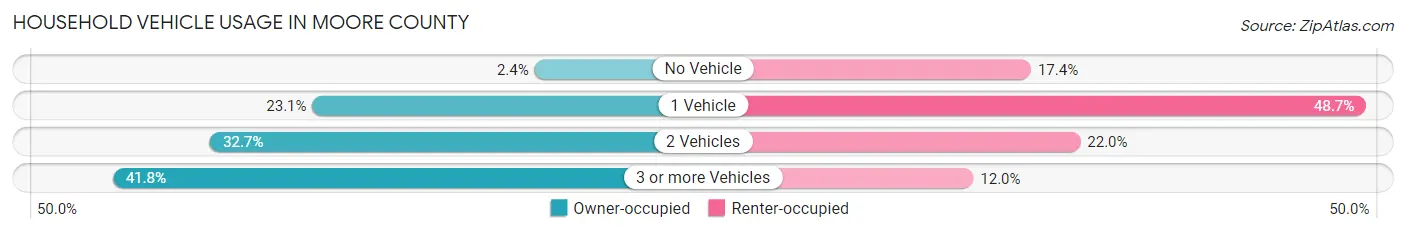
| Vehicles per Household | Owner-occupied | Renter-occupied |
| No Vehicle | 109 (2.4%) | 426 (17.4%) |
| 1 Vehicle | 1,050 (23.1%) | 1,193 (48.6%) |
| 2 Vehicles | 1,483 (32.7%) | 539 (22.0%) |
| 3 or more Vehicles | 1,895 (41.8%) | 294 (12.0%) |
| Total | 4,537 (100.0%) | 2,452 (100.0%) |
Real Estate & Mortgages in Moore County
Real Estate and Mortgage Overview in Moore County
| Characteristic | Without Mortgage | With Mortgage |
| Housing Units | 2,291 | 2,246 |
| Median Property Value | $87,600 | $155,200 |
| Median Household Income | $56,938 | $338 |
| Monthly Housing Costs | $507 | $100 |
| Real Estate Taxes | $1,192 | $56 |
Property Value by Mortgage Status in Moore County
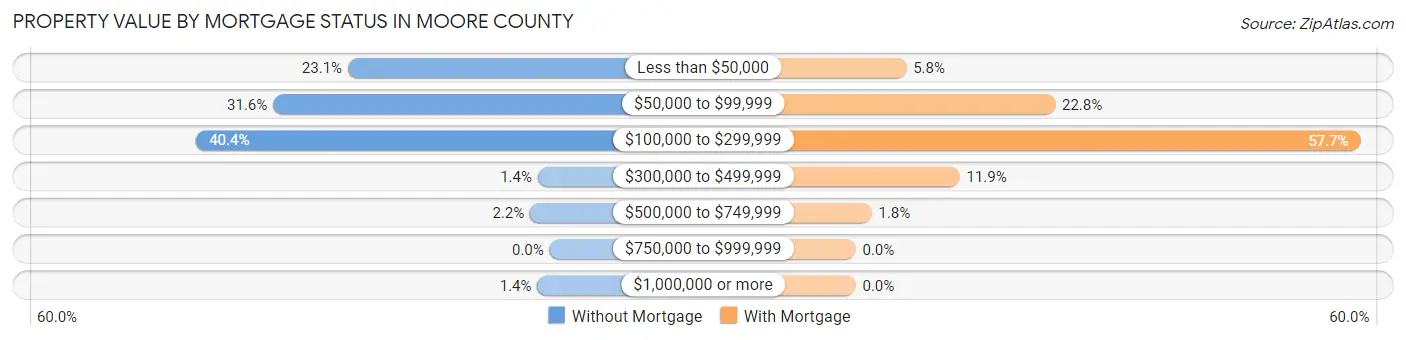
| Property Value | Without Mortgage | With Mortgage |
| Less than $50,000 | 528 (23.1%) | 130 (5.8%) |
| $50,000 to $99,999 | 724 (31.6%) | 512 (22.8%) |
| $100,000 to $299,999 | 925 (40.4%) | 1,296 (57.7%) |
| $300,000 to $499,999 | 31 (1.3%) | 267 (11.9%) |
| $500,000 to $749,999 | 51 (2.2%) | 41 (1.8%) |
| $750,000 to $999,999 | 0 (0.0%) | 0 (0.0%) |
| $1,000,000 or more | 32 (1.4%) | 0 (0.0%) |
| Total | 2,291 (100.0%) | 2,246 (100.0%) |
Household Income by Mortgage Status in Moore County
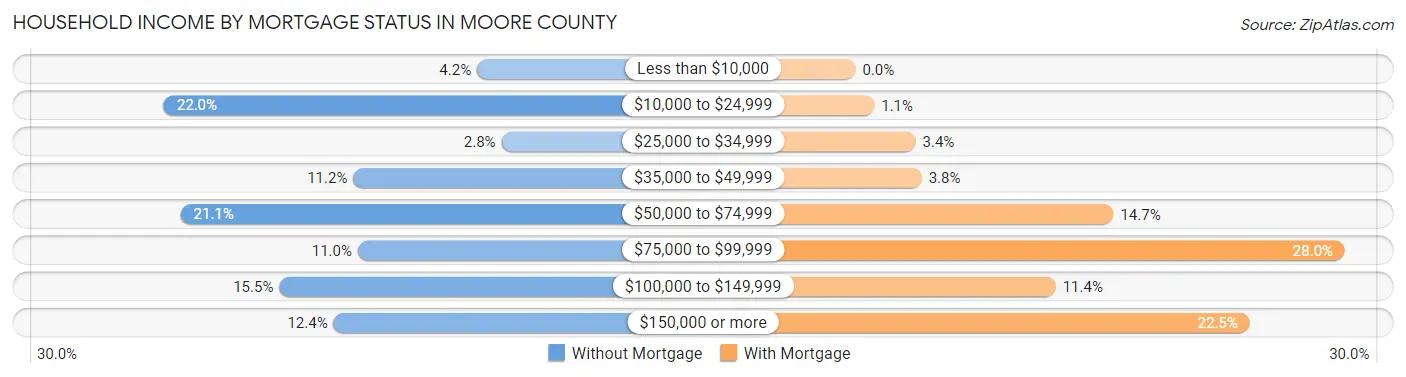
| Household Income | Without Mortgage | With Mortgage |
| Less than $10,000 | 95 (4.2%) | 0 (0.0%) |
| $10,000 to $24,999 | 505 (22.0%) | 24 (1.1%) |
| $25,000 to $34,999 | 63 (2.8%) | 77 (3.4%) |
| $35,000 to $49,999 | 257 (11.2%) | 85 (3.8%) |
| $50,000 to $74,999 | 483 (21.1%) | 331 (14.7%) |
| $75,000 to $99,999 | 251 (11.0%) | 628 (28.0%) |
| $100,000 to $149,999 | 354 (15.4%) | 257 (11.4%) |
| $150,000 or more | 283 (12.3%) | 506 (22.5%) |
| Total | 2,291 (100.0%) | 2,246 (100.0%) |
Property Value to Household Income Ratio in Moore County
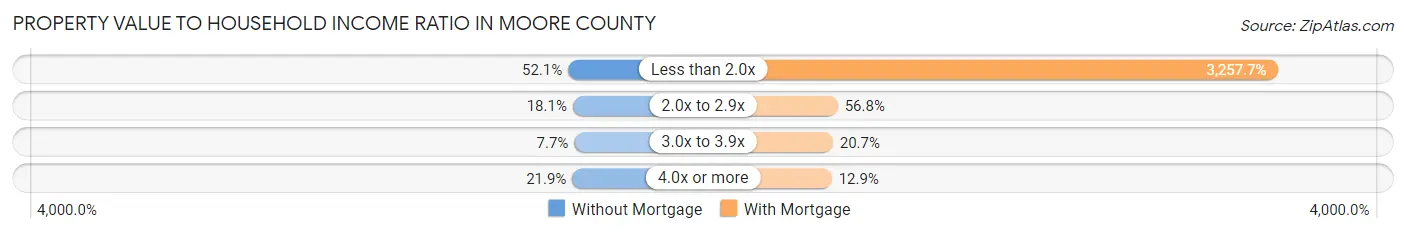
| Value-to-Income Ratio | Without Mortgage | With Mortgage |
| Less than 2.0x | 1,193 (52.1%) | 73,167 (3,257.7%) |
| 2.0x to 2.9x | 414 (18.1%) | 1,275 (56.8%) |
| 3.0x to 3.9x | 176 (7.7%) | 465 (20.7%) |
| 4.0x or more | 501 (21.9%) | 290 (12.9%) |
| Total | 2,291 (100.0%) | 2,246 (100.0%) |
Real Estate Taxes by Mortgage Status in Moore County
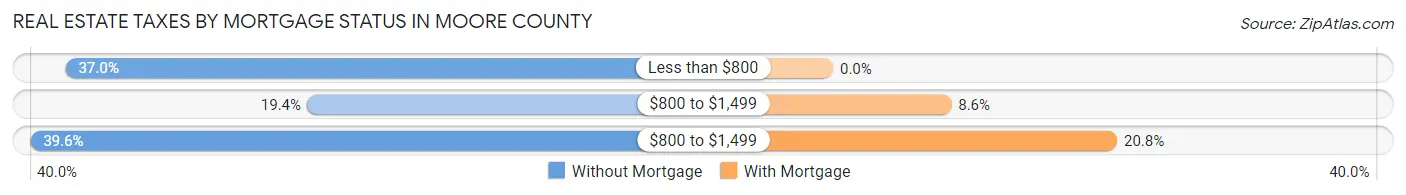
| Property Taxes | Without Mortgage | With Mortgage |
| Less than $800 | 848 (37.0%) | 0 (0.0%) |
| $800 to $1,499 | 444 (19.4%) | 194 (8.6%) |
| $800 to $1,499 | 907 (39.6%) | 466 (20.7%) |
| Total | 2,291 (100.0%) | 2,246 (100.0%) |
Health & Disability in Moore County
Health Insurance Coverage by Age in Moore County
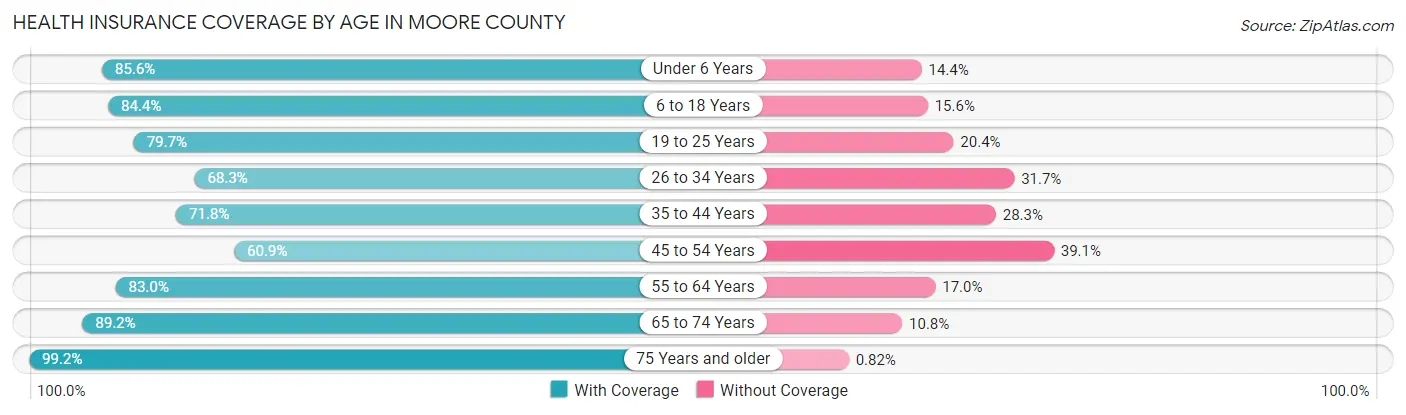
| Age Bracket | With Coverage | Without Coverage |
| Under 6 Years | 1,751 (85.6%) | 295 (14.4%) |
| 6 to 18 Years | 4,112 (84.4%) | 758 (15.6%) |
| 19 to 25 Years | 1,636 (79.6%) | 418 (20.3%) |
| 26 to 34 Years | 1,857 (68.3%) | 861 (31.7%) |
| 35 to 44 Years | 1,925 (71.8%) | 758 (28.2%) |
| 45 to 54 Years | 1,390 (60.9%) | 891 (39.1%) |
| 55 to 64 Years | 1,801 (83.0%) | 368 (17.0%) |
| 65 to 74 Years | 1,308 (89.2%) | 158 (10.8%) |
| 75 Years and older | 843 (99.2%) | 7 (0.8%) |
| Total | 16,623 (78.6%) | 4,514 (21.4%) |
Health Insurance Coverage by Citizenship Status in Moore County
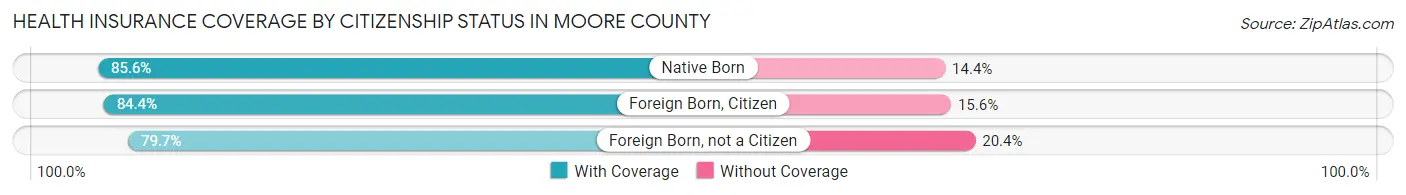
| Citizenship Status | With Coverage | Without Coverage |
| Native Born | 1,751 (85.6%) | 295 (14.4%) |
| Foreign Born, Citizen | 4,112 (84.4%) | 758 (15.6%) |
| Foreign Born, not a Citizen | 1,636 (79.6%) | 418 (20.3%) |
Health Insurance Coverage by Household Income in Moore County
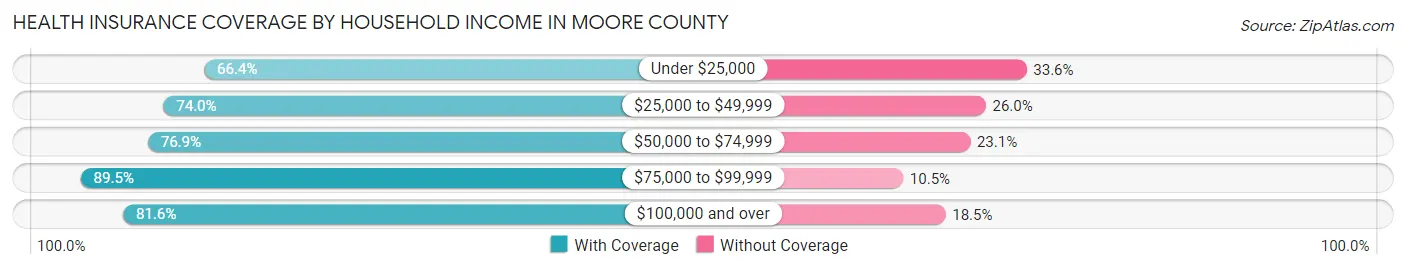
| Household Income | With Coverage | Without Coverage |
| Under $25,000 | 1,521 (66.4%) | 771 (33.6%) |
| $25,000 to $49,999 | 3,028 (74.0%) | 1,064 (26.0%) |
| $50,000 to $74,999 | 4,087 (76.9%) | 1,226 (23.1%) |
| $75,000 to $99,999 | 3,244 (89.5%) | 381 (10.5%) |
| $100,000 and over | 4,729 (81.6%) | 1,070 (18.4%) |
Public vs Private Health Insurance Coverage by Age in Moore County
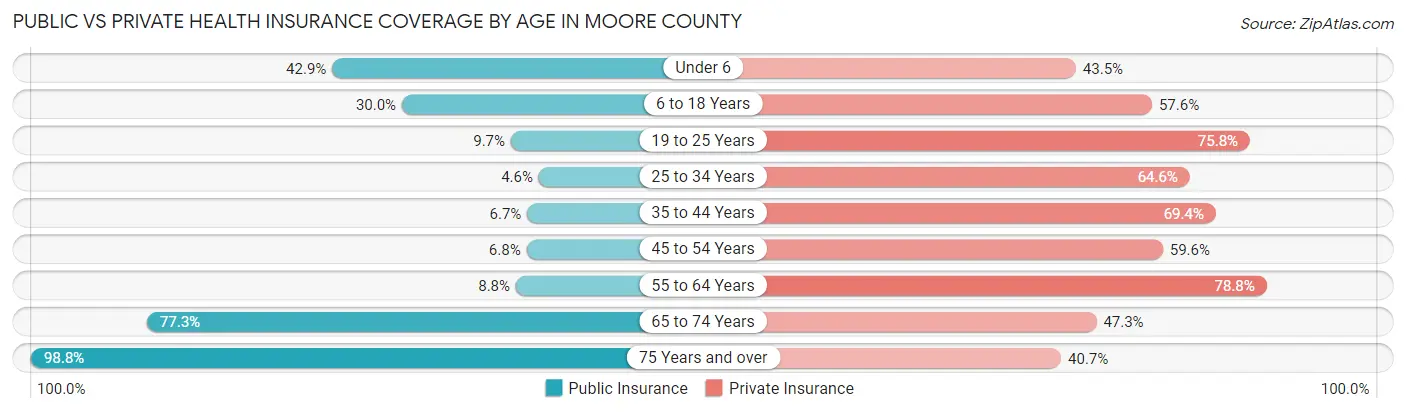
| Age Bracket | Public Insurance | Private Insurance |
| Under 6 | 878 (42.9%) | 889 (43.4%) |
| 6 to 18 Years | 1,459 (30.0%) | 2,804 (57.6%) |
| 19 to 25 Years | 200 (9.7%) | 1,556 (75.7%) |
| 25 to 34 Years | 124 (4.6%) | 1,755 (64.6%) |
| 35 to 44 Years | 180 (6.7%) | 1,862 (69.4%) |
| 45 to 54 Years | 156 (6.8%) | 1,359 (59.6%) |
| 55 to 64 Years | 191 (8.8%) | 1,710 (78.8%) |
| 65 to 74 Years | 1,133 (77.3%) | 693 (47.3%) |
| 75 Years and over | 840 (98.8%) | 346 (40.7%) |
| Total | 5,161 (24.4%) | 12,974 (61.4%) |
Disability Status by Sex by Age in Moore County
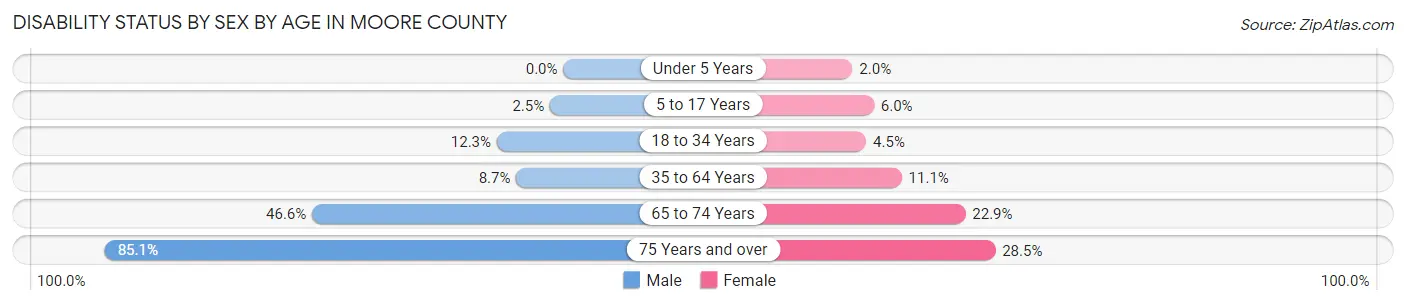
| Age Bracket | Male | Female |
| Under 5 Years | 0 (0.0%) | 20 (2.0%) |
| 5 to 17 Years | 63 (2.5%) | 131 (5.9%) |
| 18 to 34 Years | 319 (12.3%) | 110 (4.5%) |
| 35 to 64 Years | 337 (8.7%) | 364 (11.1%) |
| 65 to 74 Years | 332 (46.6%) | 173 (22.9%) |
| 75 Years and over | 326 (85.1%) | 133 (28.5%) |
Disability Class by Sex by Age in Moore County
Disability Class: Hearing Difficulty
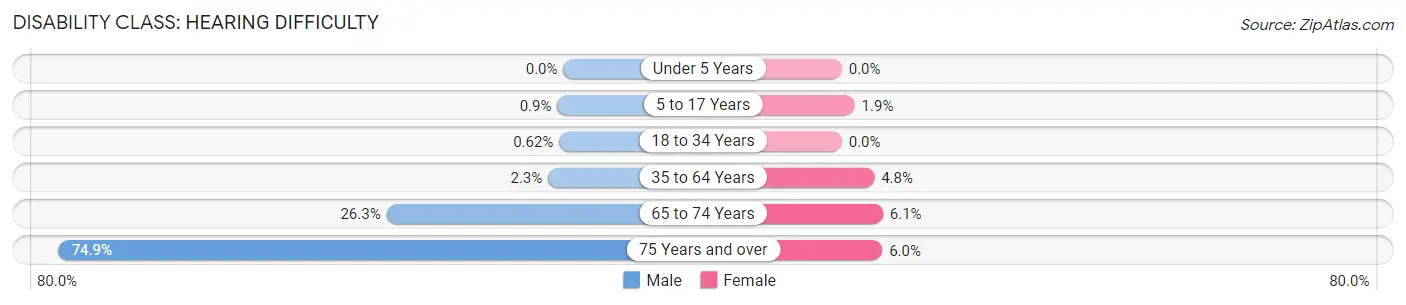
| Age Bracket | Male | Female |
| Under 5 Years | 0 (0.0%) | 0 (0.0%) |
| 5 to 17 Years | 23 (0.9%) | 42 (1.9%) |
| 18 to 34 Years | 16 (0.6%) | 0 (0.0%) |
| 35 to 64 Years | 87 (2.3%) | 158 (4.8%) |
| 65 to 74 Years | 187 (26.3%) | 46 (6.1%) |
| 75 Years and over | 287 (74.9%) | 28 (6.0%) |
Disability Class: Vision Difficulty
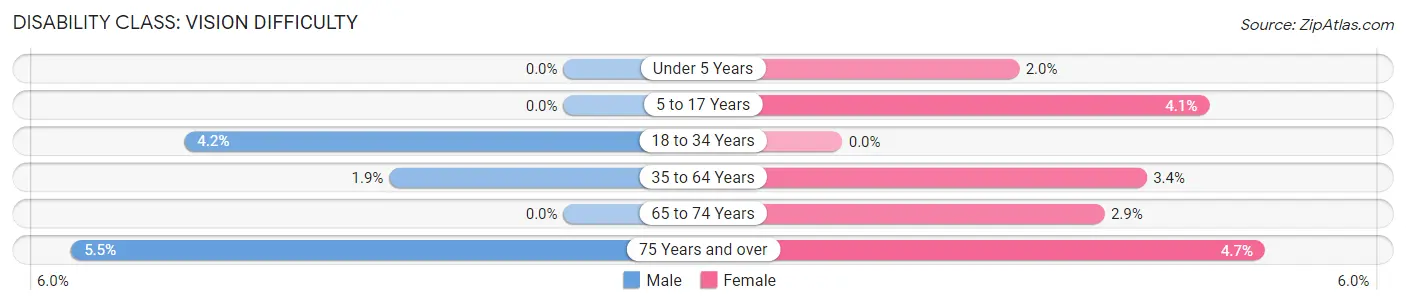
| Age Bracket | Male | Female |
| Under 5 Years | 0 (0.0%) | 20 (2.0%) |
| 5 to 17 Years | 0 (0.0%) | 90 (4.1%) |
| 18 to 34 Years | 109 (4.2%) | 0 (0.0%) |
| 35 to 64 Years | 75 (1.9%) | 111 (3.4%) |
| 65 to 74 Years | 0 (0.0%) | 22 (2.9%) |
| 75 Years and over | 21 (5.5%) | 22 (4.7%) |
Disability Class: Cognitive Difficulty
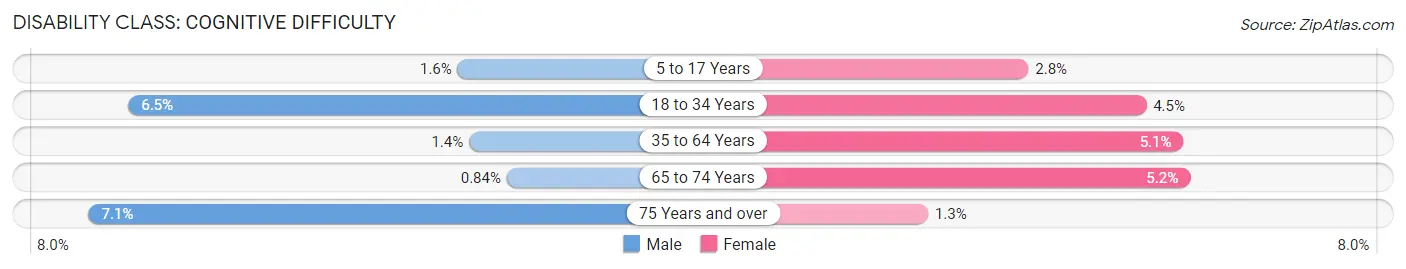
| Age Bracket | Male | Female |
| 5 to 17 Years | 40 (1.6%) | 61 (2.8%) |
| 18 to 34 Years | 167 (6.5%) | 110 (4.5%) |
| 35 to 64 Years | 54 (1.4%) | 166 (5.1%) |
| 65 to 74 Years | 6 (0.8%) | 39 (5.2%) |
| 75 Years and over | 27 (7.0%) | 6 (1.3%) |
Disability Class: Ambulatory Difficulty
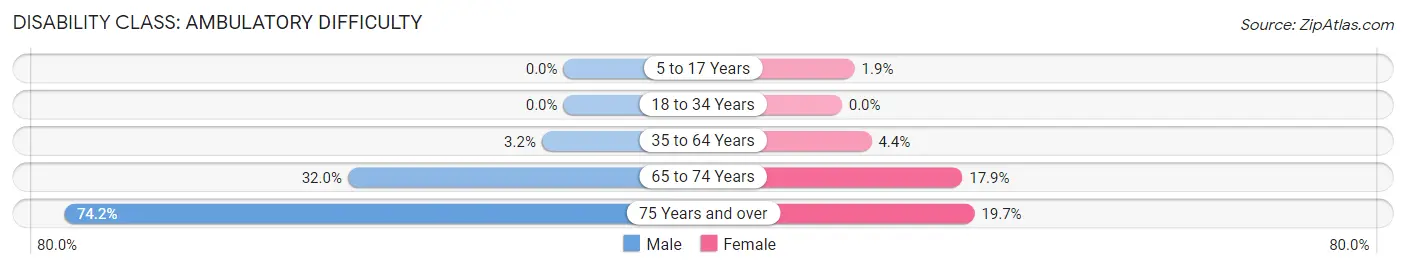
| Age Bracket | Male | Female |
| 5 to 17 Years | 0 (0.0%) | 42 (1.9%) |
| 18 to 34 Years | 0 (0.0%) | 0 (0.0%) |
| 35 to 64 Years | 124 (3.2%) | 144 (4.4%) |
| 65 to 74 Years | 228 (32.0%) | 135 (17.9%) |
| 75 Years and over | 284 (74.2%) | 92 (19.7%) |
Disability Class: Self-Care Difficulty
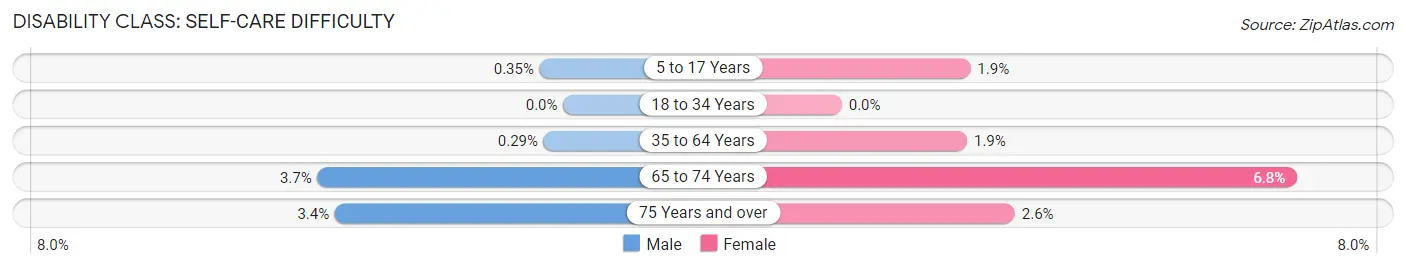
| Age Bracket | Male | Female |
| 5 to 17 Years | 9 (0.4%) | 42 (1.9%) |
| 18 to 34 Years | 0 (0.0%) | 0 (0.0%) |
| 35 to 64 Years | 11 (0.3%) | 61 (1.9%) |
| 65 to 74 Years | 26 (3.6%) | 51 (6.8%) |
| 75 Years and over | 13 (3.4%) | 12 (2.6%) |
Technology Access in Moore County
Computing Device Access in Moore County
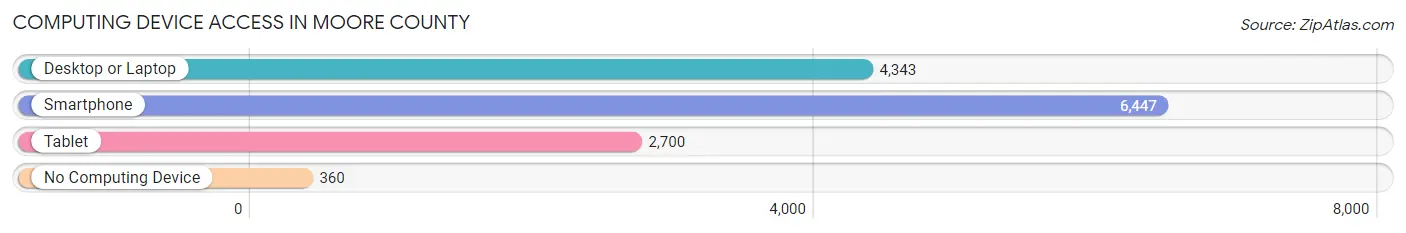
| Device Type | # Households | % Households |
| Desktop or Laptop | 4,343 | 62.1% |
| Smartphone | 6,447 | 92.2% |
| Tablet | 2,700 | 38.6% |
| No Computing Device | 360 | 5.1% |
| Total | 6,989 | 100.0% |
Internet Access in Moore County
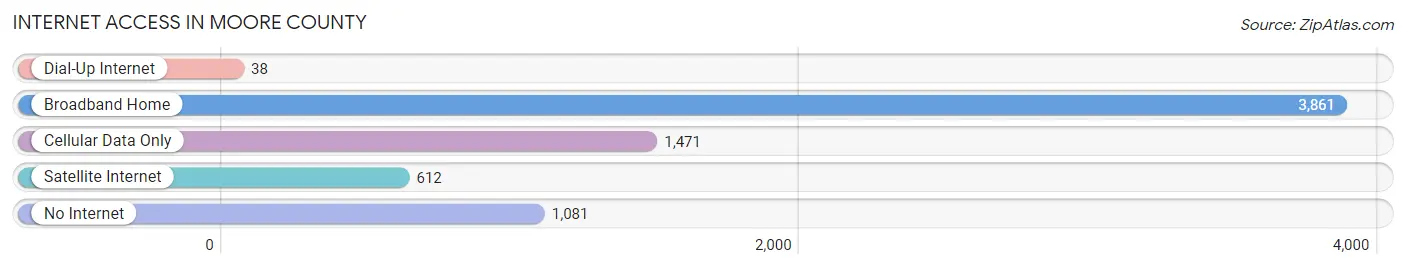
| Internet Type | # Households | % Households |
| Dial-Up Internet | 38 | 0.5% |
| Broadband Home | 3,861 | 55.2% |
| Cellular Data Only | 1,471 | 21.0% |
| Satellite Internet | 612 | 8.8% |
| No Internet | 1,081 | 15.5% |
| Total | 6,989 | 100.0% |
Moore County Summary
Introduction
Moore County is located in the Texas Panhandle, in the northern part of the state. It is bordered by Potter County to the north, Hutchinson County to the east, Hansford County to the south, and Sherman County to the west. The county seat is Dumas, and the largest city is Sunray. Moore County has a population of 21,904 people, according to the 2010 census.
History
Moore County was established in 1876, and was named for Edwin Ward Moore, a Confederate general and the first governor of Texas. The county was originally part of Bexar County, but was later divided into several smaller counties. The first settlers in the area were ranchers, who were attracted by the abundance of grasslands and water.
The first town in Moore County was Dumas, which was founded in 1891. The town was named after a local rancher, William Dumas. The town quickly grew, and by 1900, it had a population of 1,000 people.
In the early 1900s, the area began to attract farmers, who were drawn to the fertile soil and abundant water. The first cotton gin was built in Dumas in 1910, and the first school was established in 1911.
The Great Depression had a devastating effect on Moore County, as many of the farmers and ranchers were unable to make a living. The population of the county declined from a peak of 24,000 in 1930 to just over 17,000 in 1940.
Geography
Moore County is located in the Texas Panhandle, in the northern part of the state. It is bordered by Potter County to the north, Hutchinson County to the east, Hansford County to the south, and Sherman County to the west. The county covers an area of 1,072 square miles, and has a population density of 20 people per square mile.
The terrain of Moore County is mostly flat, with some rolling hills in the western part of the county. The county is located in the High Plains region of Texas, and is part of the Llano Estacado, or Staked Plains. The county is mostly covered in grasslands, with some areas of mesquite and juniper trees.
The climate of Moore County is semi-arid, with hot summers and mild winters. The average annual temperature is 64 degrees Fahrenheit, and the average annual precipitation is 17 inches.
Economy
The economy of Moore County is largely based on agriculture. The county is home to a number of large farms and ranches, which produce a variety of crops, including cotton, wheat, corn, and sorghum. The county is also home to several oil and gas fields, which provide jobs for many of the county’s residents.
In addition to agriculture and oil and gas, Moore County is home to several manufacturing companies, including a plastics plant and a food processing plant. The county is also home to several retail stores, restaurants, and other businesses.
Demographics
According to the 2010 census, Moore County has a population of 21,904 people. The population is spread out, with 49.3% male and 50.7% female. The median age is 34.7 years, and the median household income is $45,845.
The racial makeup of Moore County is 79.2% White, 0.7% African American, 0.7% Native American, 0.3% Asian, 0.1% Pacific Islander, 16.7% from other races, and 2.2% from two or more races. Hispanic or Latino of any race make up 33.2% of the population.
Conclusion
Moore County is located in the Texas Panhandle, in the northern part of the state. It is bordered by Potter County to the north, Hutchinson County to the east, Hansford County to the south, and Sherman County to the west. The county has a population of 21,904 people, according to the 2010 census. The economy of Moore County is largely based on agriculture, oil and gas, and manufacturing. The racial makeup of the county is 79.2% White, 0.7% African American, 0.7% Native American, 0.3% Asian, 0.1% Pacific Islander, 16.7% from other races, and 2.2% from two or more races. Hispanic or Latino of any race make up 33.2% of the population. Moore County is a diverse and vibrant community, with a rich history and a bright future.
Common Questions
What is Per Capita Income in Moore County?
Per Capita income in Moore County is $26,321.
What is the Median Family Income in Moore County?
Median Family Income in Moore County is $65,868.
What is the Median Household income in Moore County?
Median Household Income in Moore County is $59,041.
What is Income or Wage Gap in Moore County?
Income or Wage Gap in Moore County is 28.9%.
Women in Moore County earn 71.1 cents for every dollar earned by a man.
What is Family Income Deficit in Moore County?
Family Income Deficit in Moore County is $9,104.
Families that are below poverty line in Moore County earn $9,104 less on average than the poverty threshold level.
What is Inequality or Gini Index in Moore County?
Inequality or Gini Index in Moore County is 0.41.
What is the Total Population of Moore County?
Total Population of Moore County is 21,284.
What is the Total Male Population of Moore County?
Total Male Population of Moore County is 11,073.
What is the Total Female Population of Moore County?
Total Female Population of Moore County is 10,211.
What is the Ratio of Males per 100 Females in Moore County?
There are 108.44 Males per 100 Females in Moore County.
What is the Ratio of Females per 100 Males in Moore County?
There are 92.22 Females per 100 Males in Moore County.
What is the Median Population Age in Moore County?
Median Population Age in Moore County is 30.7 Years.
What is the Average Family Size in Moore County
Average Family Size in Moore County is 3.6 People.
What is the Average Household Size in Moore County
Average Household Size in Moore County is 3.0 People.
How Large is the Labor Force in Moore County?
There are 9,963 People in the Labor Forcein in Moore County.
What is the Percentage of People in the Labor Force in Moore County?
65.2% of People are in the Labor Force in Moore County.
What is the Unemployment Rate in Moore County?
Unemployment Rate in Moore County is 2.5%.