Montague County, TX Map & Demographics
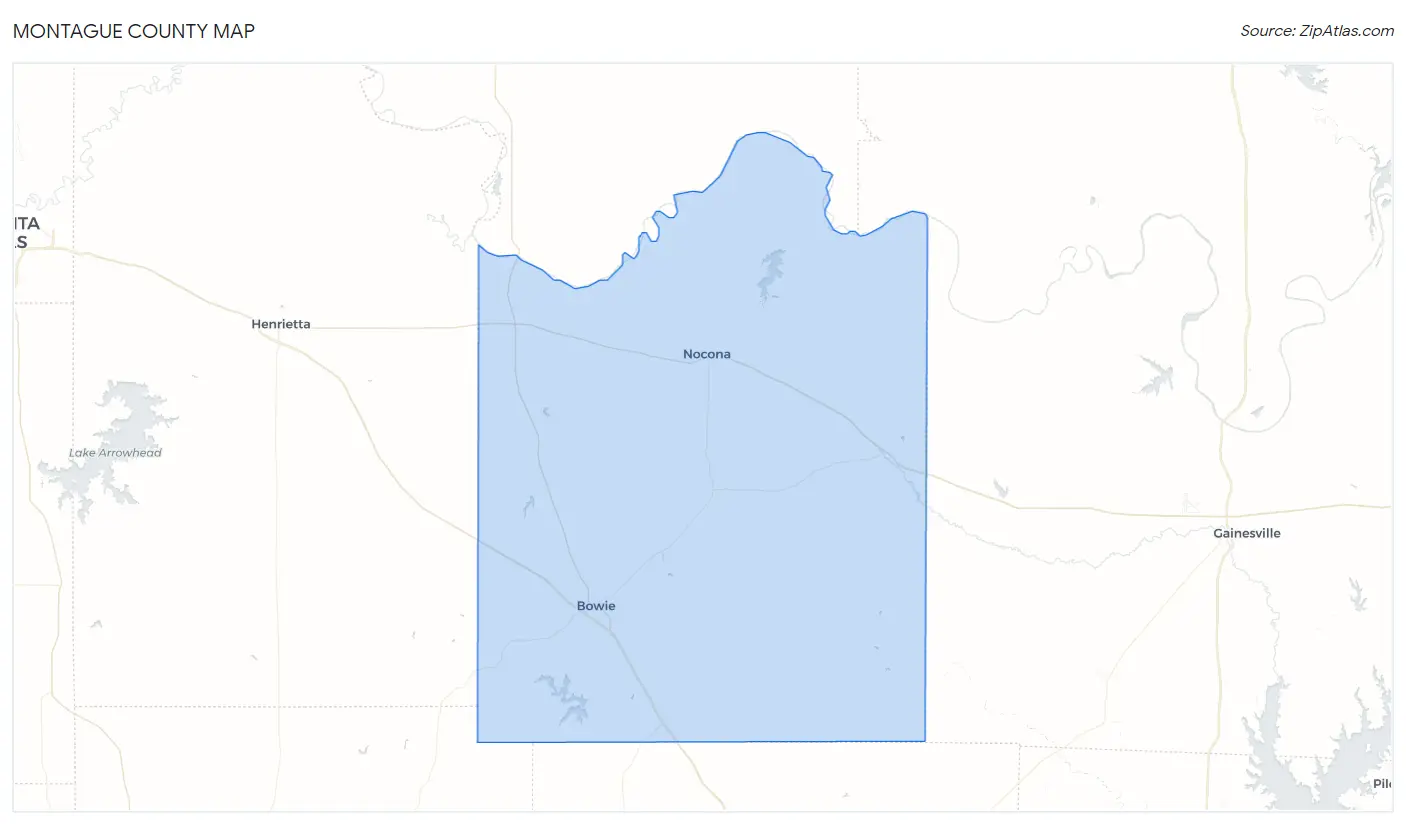
Montague County Map
Montague County Overview
$31,125
PER CAPITA INCOME
$79,818
AVG FAMILY INCOME
$63,336
AVG HOUSEHOLD INCOME
49.2%
WAGE / INCOME GAP [ % ]
50.8¢/ $1
WAGE / INCOME GAP [ $ ]
$13,028
FAMILY INCOME DEFICIT
0.42
INEQUALITY / GINI INDEX
20,197
TOTAL POPULATION
9,818
MALE POPULATION
10,379
FEMALE POPULATION
94.59
MALES / 100 FEMALES
105.71
FEMALES / 100 MALES
44.1
MEDIAN AGE
3.0
AVG FAMILY SIZE
2.5
AVG HOUSEHOLD SIZE
8,742
LABOR FORCE [ PEOPLE ]
54.4%
PERCENT IN LABOR FORCE
5.1%
UNEMPLOYMENT RATE
Montague County Area Codes
Income in Montague County
Income Overview in Montague County
Per Capita Income in Montague County is $31,125, while median incomes of families and households are $79,818 and $63,336 respectively.
| Characteristic | Number | Measure |
| Per Capita Income | 20,197 | $31,125 |
| Median Family Income | 5,421 | $79,818 |
| Mean Family Income | 5,421 | $92,012 |
| Median Household Income | 7,907 | $63,336 |
| Mean Household Income | 7,907 | $78,500 |
| Income Deficit | 5,421 | $13,028 |
| Wage / Income Gap (%) | 20,197 | 49.15% |
| Wage / Income Gap ($) | 20,197 | 50.85¢ per $1 |
| Gini / Inequality Index | 20,197 | 0.42 |
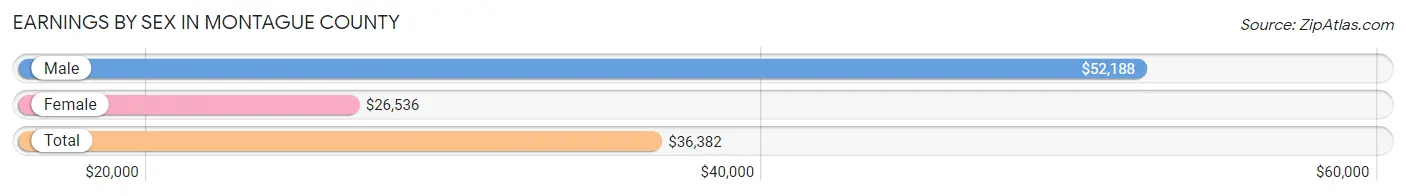
Earnings by Sex in Montague County
Average Earnings in Montague County are $36,382, $52,188 for men and $26,536 for women, a difference of 49.1%.
| Sex | Number | Average Earnings |
| Male | 5,056 (54.6%) | $52,188 |
| Female | 4,203 (45.4%) | $26,536 |
| Total | 9,259 (100.0%) | $36,382 |
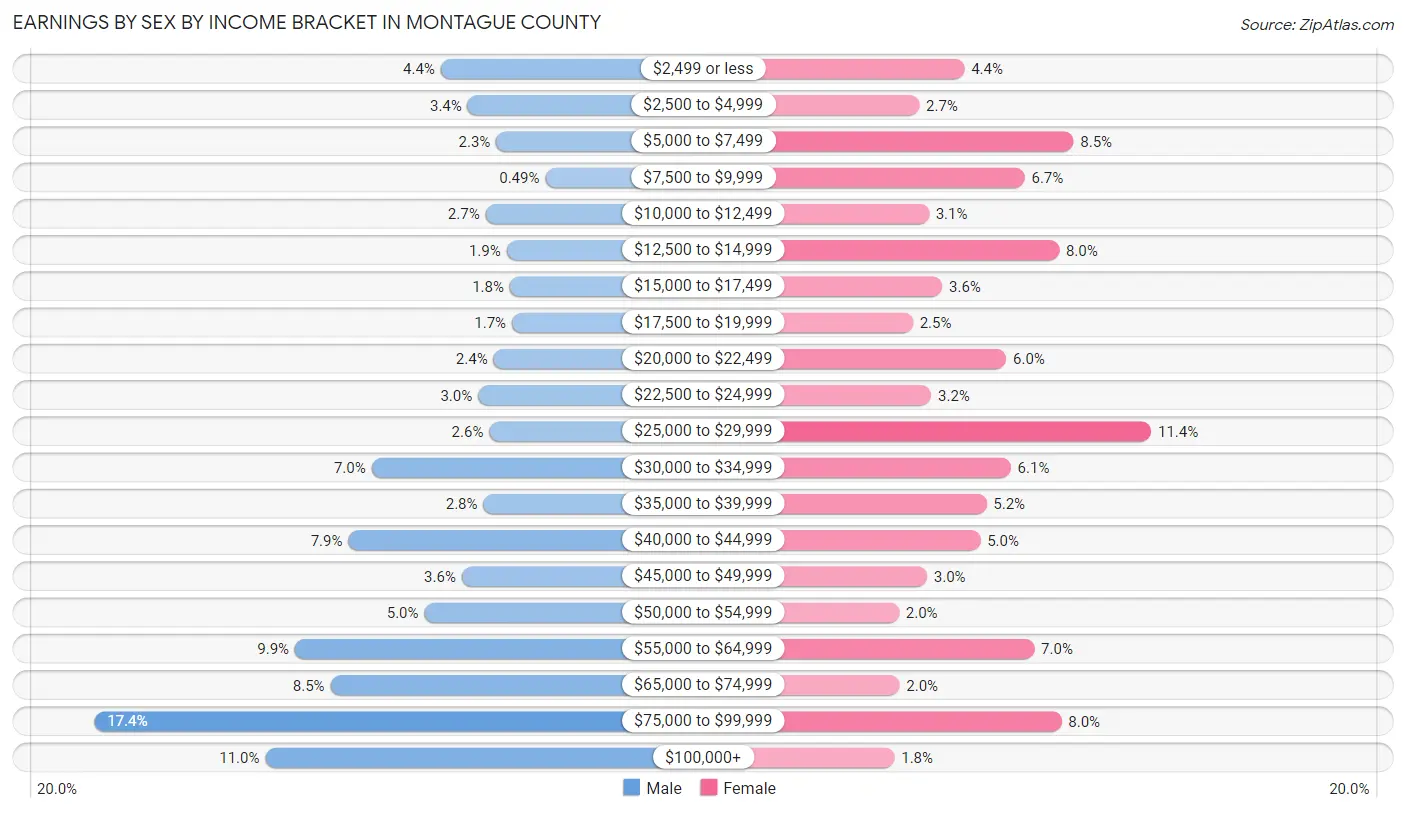
Earnings by Sex by Income Bracket in Montague County
The most common earnings brackets in Montague County are $75,000 to $99,999 for men (879 | 17.4%) and $25,000 to $29,999 for women (479 | 11.4%).
| Income | Male | Female |
| $2,499 or less | 223 (4.4%) | 185 (4.4%) |
| $2,500 to $4,999 | 172 (3.4%) | 114 (2.7%) |
| $5,000 to $7,499 | 118 (2.3%) | 357 (8.5%) |
| $7,500 to $9,999 | 25 (0.5%) | 280 (6.7%) |
| $10,000 to $12,499 | 138 (2.7%) | 129 (3.1%) |
| $12,500 to $14,999 | 98 (1.9%) | 334 (8.0%) |
| $15,000 to $17,499 | 92 (1.8%) | 150 (3.6%) |
| $17,500 to $19,999 | 88 (1.7%) | 104 (2.5%) |
| $20,000 to $22,499 | 123 (2.4%) | 251 (6.0%) |
| $22,500 to $24,999 | 152 (3.0%) | 133 (3.2%) |
| $25,000 to $29,999 | 131 (2.6%) | 479 (11.4%) |
| $30,000 to $34,999 | 354 (7.0%) | 258 (6.1%) |
| $35,000 to $39,999 | 142 (2.8%) | 220 (5.2%) |
| $40,000 to $44,999 | 398 (7.9%) | 210 (5.0%) |
| $45,000 to $49,999 | 183 (3.6%) | 126 (3.0%) |
| $50,000 to $54,999 | 254 (5.0%) | 82 (1.9%) |
| $55,000 to $64,999 | 499 (9.9%) | 295 (7.0%) |
| $65,000 to $74,999 | 432 (8.5%) | 83 (2.0%) |
| $75,000 to $99,999 | 879 (17.4%) | 338 (8.0%) |
| $100,000+ | 555 (11.0%) | 75 (1.8%) |
| Total | 5,056 (100.0%) | 4,203 (100.0%) |
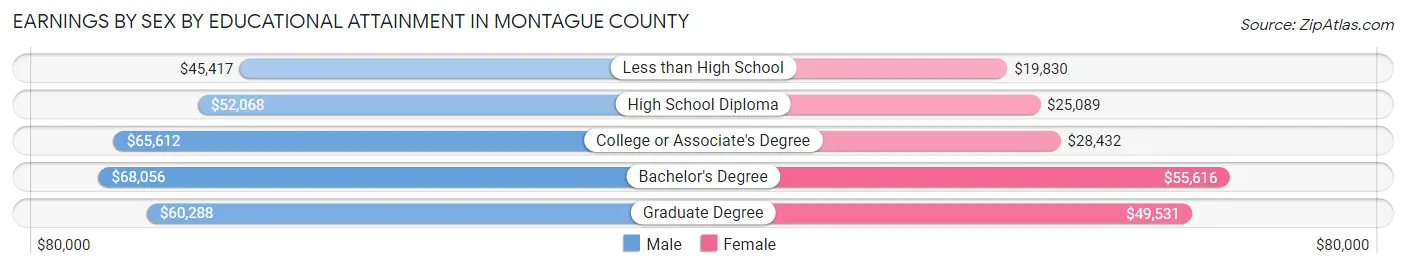
Earnings by Sex by Educational Attainment in Montague County
Average earnings in Montague County are $56,582 for men and $28,692 for women, a difference of 49.3%. Men with an educational attainment of bachelor's degree enjoy the highest average annual earnings of $68,056, while those with less than high school education earn the least with $45,417. Women with an educational attainment of bachelor's degree earn the most with the average annual earnings of $55,616, while those with less than high school education have the smallest earnings of $19,830.
| Educational Attainment | Male Income | Female Income |
| Less than High School | $45,417 | $19,830 |
| High School Diploma | $52,068 | $25,089 |
| College or Associate's Degree | $65,612 | $28,432 |
| Bachelor's Degree | $68,056 | $55,616 |
| Graduate Degree | $60,288 | $49,531 |
| Total | $56,582 | $28,692 |
Family Income in Montague County
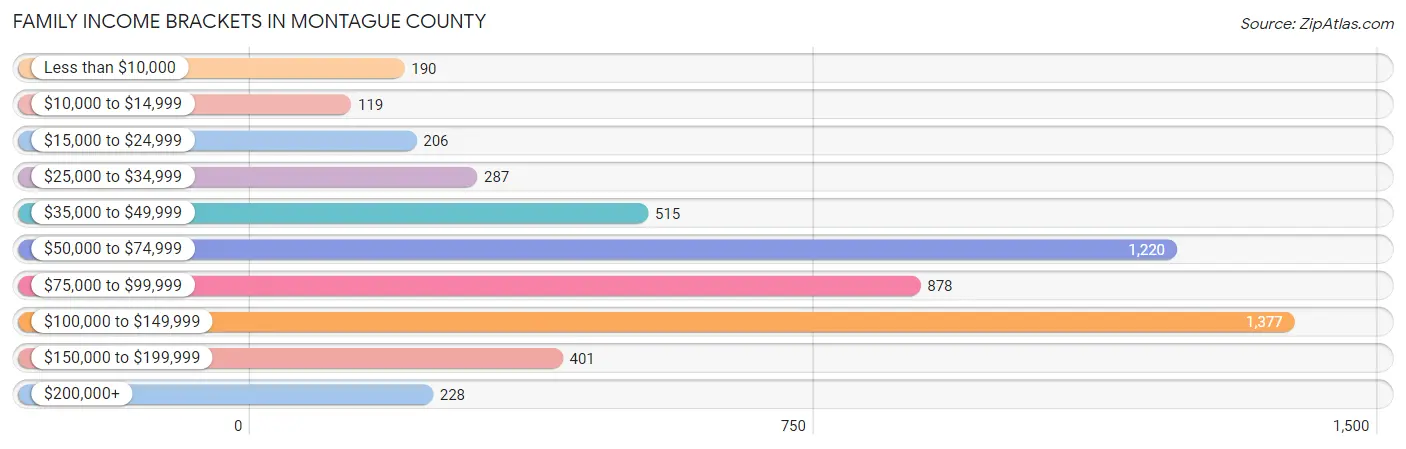
Family Income Brackets in Montague County
According to the Montague County family income data, there are 1,377 families falling into the $100,000 to $149,999 income range, which is the most common income bracket and makes up 25.4% of all families. Conversely, the $10,000 to $14,999 income bracket is the least frequent group with only 119 families (2.2%) belonging to this category.
| Income Bracket | # Families | % Families |
| Less than $10,000 | 190 | 3.5% |
| $10,000 to $14,999 | 119 | 2.2% |
| $15,000 to $24,999 | 206 | 3.8% |
| $25,000 to $34,999 | 287 | 5.3% |
| $35,000 to $49,999 | 515 | 9.5% |
| $50,000 to $74,999 | 1,220 | 22.5% |
| $75,000 to $99,999 | 878 | 16.2% |
| $100,000 to $149,999 | 1,377 | 25.4% |
| $150,000 to $199,999 | 401 | 7.4% |
| $200,000+ | 228 | 4.2% |
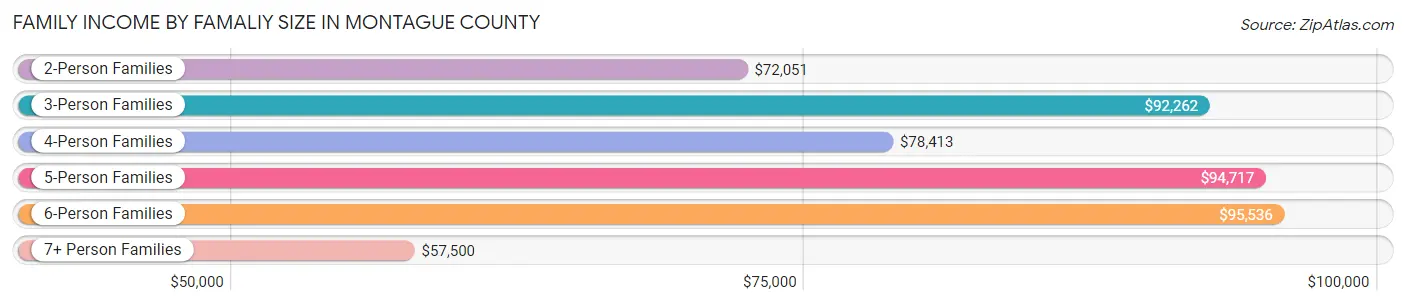
Family Income by Famaliy Size in Montague County
6-person families (103 | 1.9%) account for the highest median family income in Montague County with $95,536 per family, while 2-person families (2,697 | 49.7%) have the highest median income of $36,026 per family member.
| Income Bracket | # Families | Median Income |
| 2-Person Families | 2,697 (49.7%) | $72,051 |
| 3-Person Families | 1,180 (21.8%) | $92,262 |
| 4-Person Families | 941 (17.4%) | $78,413 |
| 5-Person Families | 472 (8.7%) | $94,717 |
| 6-Person Families | 103 (1.9%) | $95,536 |
| 7+ Person Families | 28 (0.5%) | $57,500 |
| Total | 5,421 (100.0%) | $79,818 |
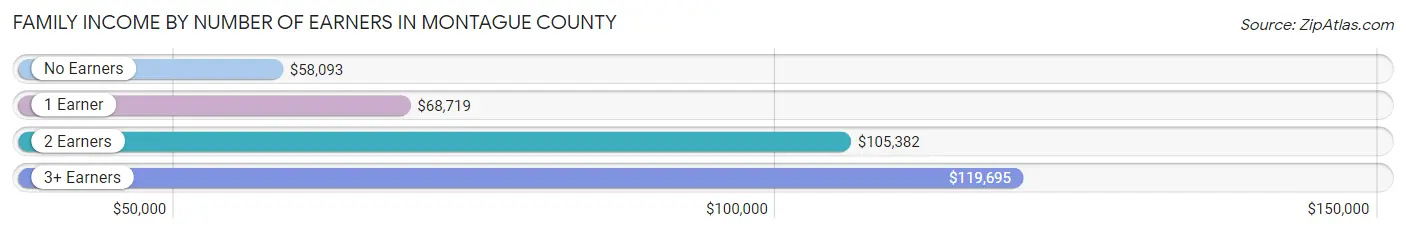
Family Income by Number of Earners in Montague County
The median family income in Montague County is $79,818, with families comprising 3+ earners (444) having the highest median family income of $119,695, while families with no earners (1,000) have the lowest median family income of $58,093, accounting for 8.2% and 18.4% of families, respectively.
| Number of Earners | # Families | Median Income |
| No Earners | 1,000 (18.4%) | $58,093 |
| 1 Earner | 2,112 (39.0%) | $68,719 |
| 2 Earners | 1,865 (34.4%) | $105,382 |
| 3+ Earners | 444 (8.2%) | $119,695 |
| Total | 5,421 (100.0%) | $79,818 |
Household Income in Montague County
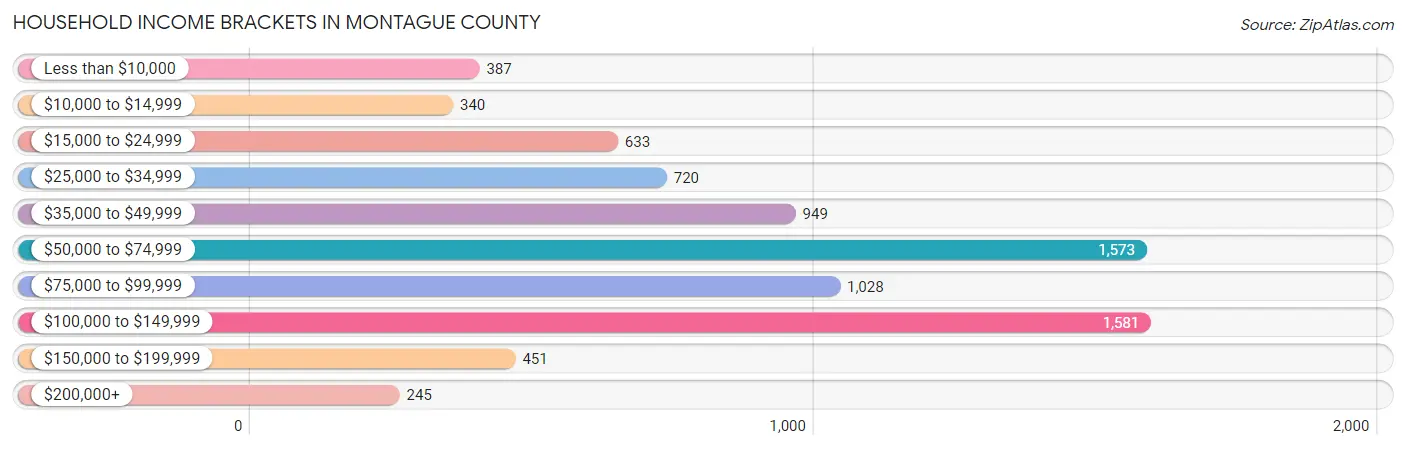
Household Income Brackets in Montague County
With 1,581 households falling in the category, the $100,000 to $149,999 income range is the most frequent in Montague County, accounting for 20.0% of all households. In contrast, only 245 households (3.1%) fall into the $200,000+ income bracket, making it the least populous group.
| Income Bracket | # Households | % Households |
| Less than $10,000 | 387 | 4.9% |
| $10,000 to $14,999 | 340 | 4.3% |
| $15,000 to $24,999 | 633 | 8.0% |
| $25,000 to $34,999 | 720 | 9.1% |
| $35,000 to $49,999 | 949 | 12.0% |
| $50,000 to $74,999 | 1,573 | 19.9% |
| $75,000 to $99,999 | 1,028 | 13.0% |
| $100,000 to $149,999 | 1,581 | 20.0% |
| $150,000 to $199,999 | 451 | 5.7% |
| $200,000+ | 245 | 3.1% |
Household Income by Householder Age in Montague County
The median household income in Montague County is $63,336, with the highest median household income of $76,599 found in the 25 to 44 years age bracket for the primary householder. A total of 1,881 households (23.8%) fall into this category. Meanwhile, the 65+ years age bracket for the primary householder has the lowest median household income of $53,292, with 2,659 households (33.6%) in this group.
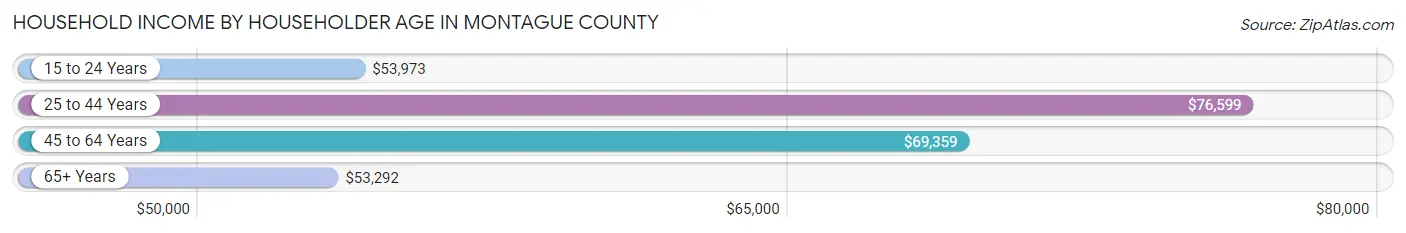
| Income Bracket | # Households | Median Income |
| 15 to 24 Years | 279 (3.5%) | $53,973 |
| 25 to 44 Years | 1,881 (23.8%) | $76,599 |
| 45 to 64 Years | 3,088 (39.1%) | $69,359 |
| 65+ Years | 2,659 (33.6%) | $53,292 |
| Total | 7,907 (100.0%) | $63,336 |
Poverty in Montague County
Income Below Poverty by Sex and Age in Montague County
With 12.5% poverty level for males and 13.4% for females among the residents of Montague County, 15 year old males and 15 year old females are the most vulnerable to poverty, with 65 males (41.7%) and 33 females (22.6%) in their respective age groups living below the poverty level.
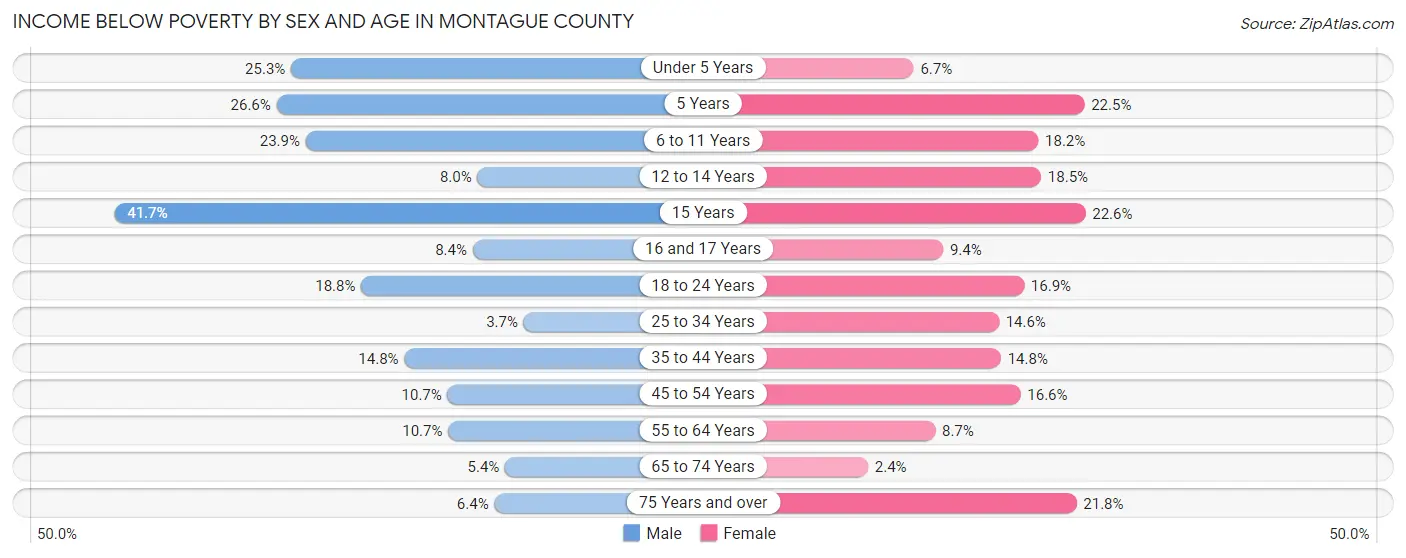
| Age Bracket | Male | Female |
| Under 5 Years | 120 (25.3%) | 38 (6.7%) |
| 5 Years | 29 (26.6%) | 9 (22.5%) |
| 6 to 11 Years | 211 (23.9%) | 174 (18.2%) |
| 12 to 14 Years | 25 (8.0%) | 80 (18.5%) |
| 15 Years | 65 (41.7%) | 33 (22.6%) |
| 16 and 17 Years | 20 (8.4%) | 20 (9.4%) |
| 18 to 24 Years | 132 (18.8%) | 120 (16.9%) |
| 25 to 34 Years | 37 (3.7%) | 160 (14.6%) |
| 35 to 44 Years | 165 (14.7%) | 158 (14.7%) |
| 45 to 54 Years | 139 (10.7%) | 200 (16.6%) |
| 55 to 64 Years | 147 (10.7%) | 135 (8.6%) |
| 65 to 74 Years | 62 (5.4%) | 30 (2.4%) |
| 75 Years and over | 52 (6.4%) | 212 (21.8%) |
| Total | 1,204 (12.5%) | 1,369 (13.4%) |
Income Above Poverty by Sex and Age in Montague County
According to the poverty statistics in Montague County, males aged 25 to 34 years and females aged 65 to 74 years are the age groups that are most secure financially, with 96.3% of males and 97.6% of females in these age groups living above the poverty line.
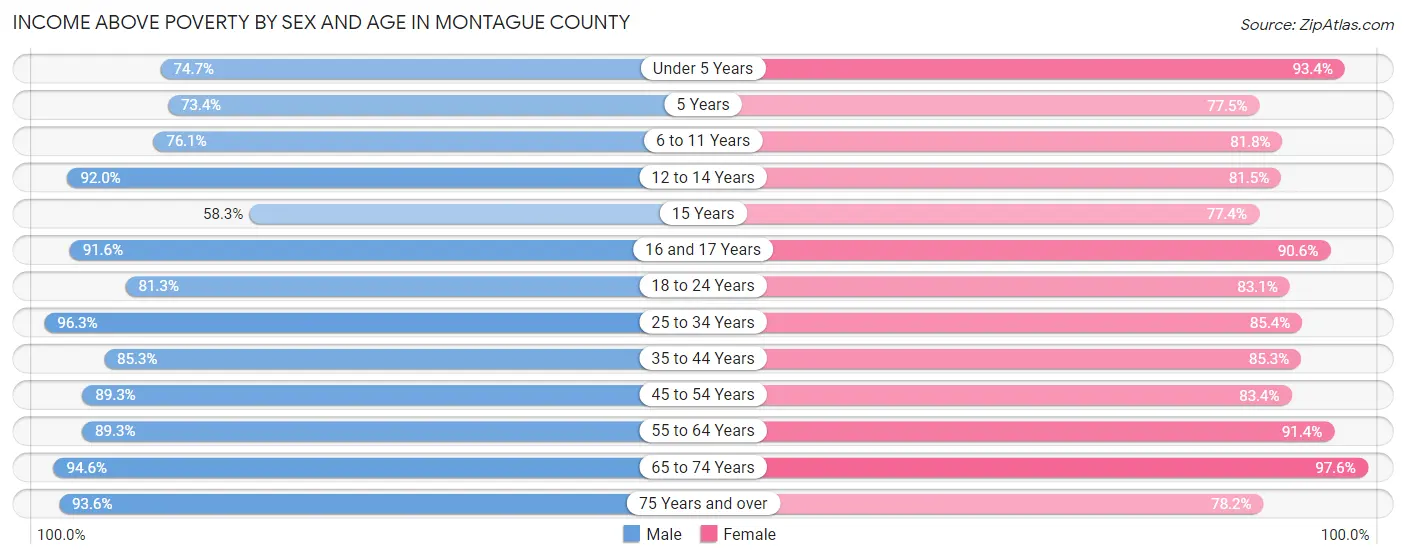
| Age Bracket | Male | Female |
| Under 5 Years | 355 (74.7%) | 533 (93.3%) |
| 5 Years | 80 (73.4%) | 31 (77.5%) |
| 6 to 11 Years | 672 (76.1%) | 781 (81.8%) |
| 12 to 14 Years | 289 (92.0%) | 353 (81.5%) |
| 15 Years | 91 (58.3%) | 113 (77.4%) |
| 16 and 17 Years | 218 (91.6%) | 193 (90.6%) |
| 18 to 24 Years | 572 (81.2%) | 590 (83.1%) |
| 25 to 34 Years | 971 (96.3%) | 939 (85.4%) |
| 35 to 44 Years | 954 (85.3%) | 913 (85.3%) |
| 45 to 54 Years | 1,155 (89.3%) | 1,007 (83.4%) |
| 55 to 64 Years | 1,229 (89.3%) | 1,426 (91.3%) |
| 65 to 74 Years | 1,087 (94.6%) | 1,212 (97.6%) |
| 75 Years and over | 762 (93.6%) | 762 (78.2%) |
| Total | 8,435 (87.5%) | 8,853 (86.6%) |
Income Below Poverty Among Married-Couple Families in Montague County
The poverty statistics for married-couple families in Montague County show that 3.5% or 152 of the total 4,400 families live below the poverty line. Families with 3 or 4 children have the highest poverty rate of 5.9%, comprising of 20 families. On the other hand, families with 5 or more children have the lowest poverty rate of 0.0%, which includes 0 families.
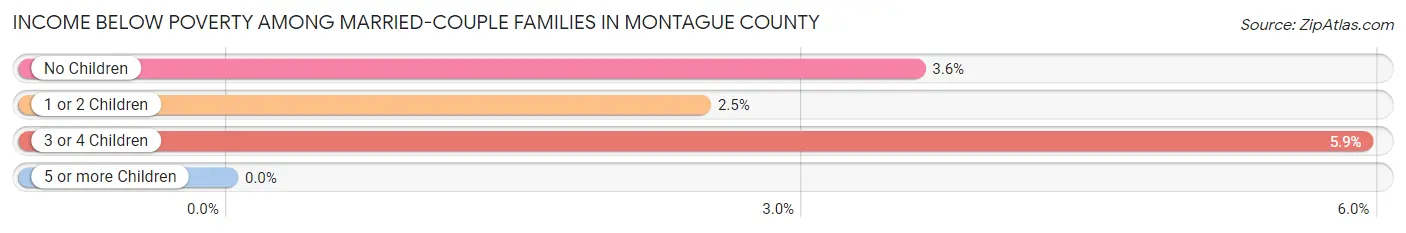
| Children | Above Poverty | Below Poverty |
| No Children | 2,767 (96.4%) | 103 (3.6%) |
| 1 or 2 Children | 1,147 (97.5%) | 29 (2.5%) |
| 3 or 4 Children | 317 (94.1%) | 20 (5.9%) |
| 5 or more Children | 17 (100.0%) | 0 (0.0%) |
| Total | 4,248 (96.6%) | 152 (3.5%) |
Income Below Poverty Among Single-Parent Households in Montague County
According to the poverty data in Montague County, 20.9% or 65 single-father households and 35.5% or 252 single-mother households are living below the poverty line. Among single-father households, those with 5 or more children have the highest poverty rate, with 4 households (100.0%) experiencing poverty. Likewise, among single-mother households, those with 3 or 4 children have the highest poverty rate, with 112 households (87.5%) falling below the poverty line.
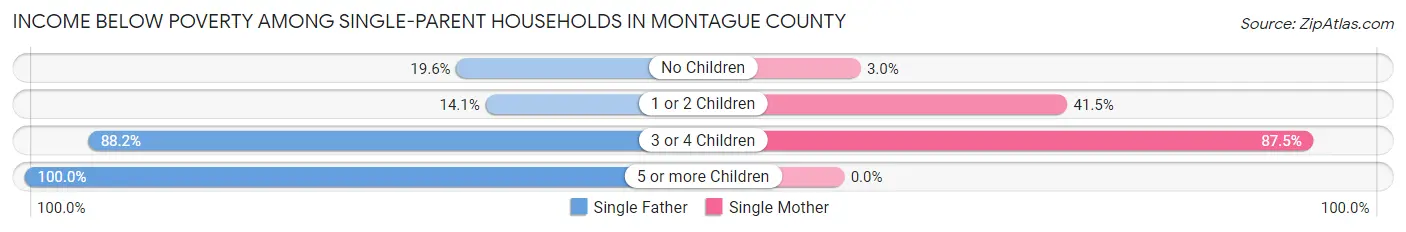
| Children | Single Father | Single Mother |
| No Children | 18 (19.6%) | 8 (3.0%) |
| 1 or 2 Children | 28 (14.1%) | 132 (41.5%) |
| 3 or 4 Children | 15 (88.2%) | 112 (87.5%) |
| 5 or more Children | 4 (100.0%) | 0 (0.0%) |
| Total | 65 (20.9%) | 252 (35.5%) |
Income Below Poverty Among Married-Couple vs Single-Parent Households in Montague County
The poverty data for Montague County shows that 152 of the married-couple family households (3.5%) and 317 of the single-parent households (31.0%) are living below the poverty level. Within the married-couple family households, those with 3 or 4 children have the highest poverty rate, with 20 households (5.9%) falling below the poverty line. Among the single-parent households, those with 5 or more children have the highest poverty rate, with 4 household (100.0%) living below poverty.
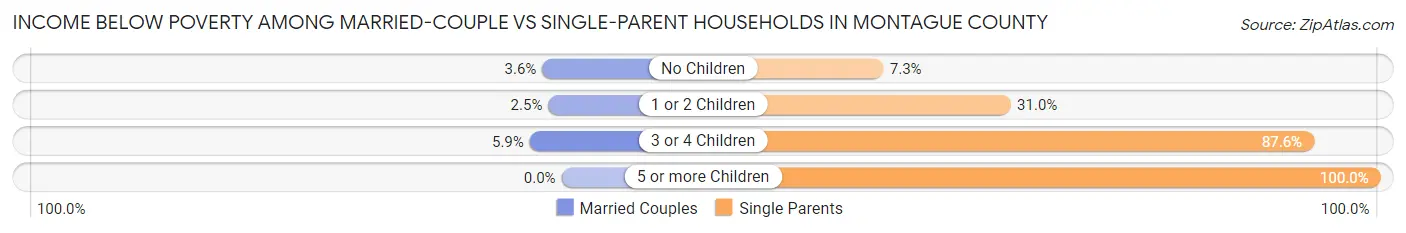
| Children | Married-Couple Families | Single-Parent Households |
| No Children | 103 (3.6%) | 26 (7.3%) |
| 1 or 2 Children | 29 (2.5%) | 160 (31.0%) |
| 3 or 4 Children | 20 (5.9%) | 127 (87.6%) |
| 5 or more Children | 0 (0.0%) | 4 (100.0%) |
| Total | 152 (3.5%) | 317 (31.0%) |
Race in Montague County
The most populous races in Montague County are White / Caucasian (18,501 | 91.6%), Hispanic or Latino (2,338 | 11.6%), and Two or more Races (853 | 4.2%).
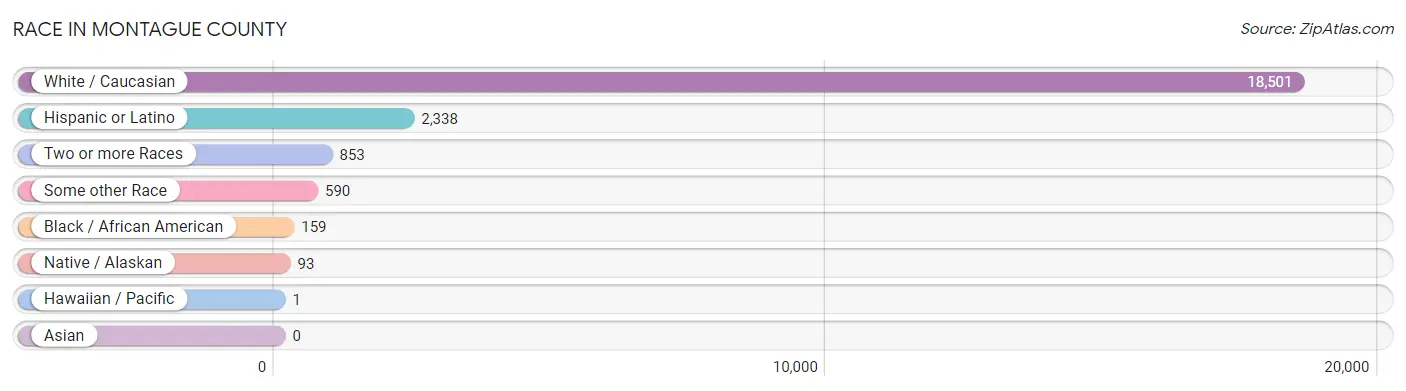
| Race | # Population | % Population |
| Asian | 0 | 0.0% |
| Black / African American | 159 | 0.8% |
| Hawaiian / Pacific | 1 | 0.0% |
| Hispanic or Latino | 2,338 | 11.6% |
| Native / Alaskan | 93 | 0.5% |
| White / Caucasian | 18,501 | 91.6% |
| Two or more Races | 853 | 4.2% |
| Some other Race | 590 | 2.9% |
| Total | 20,197 | 100.0% |
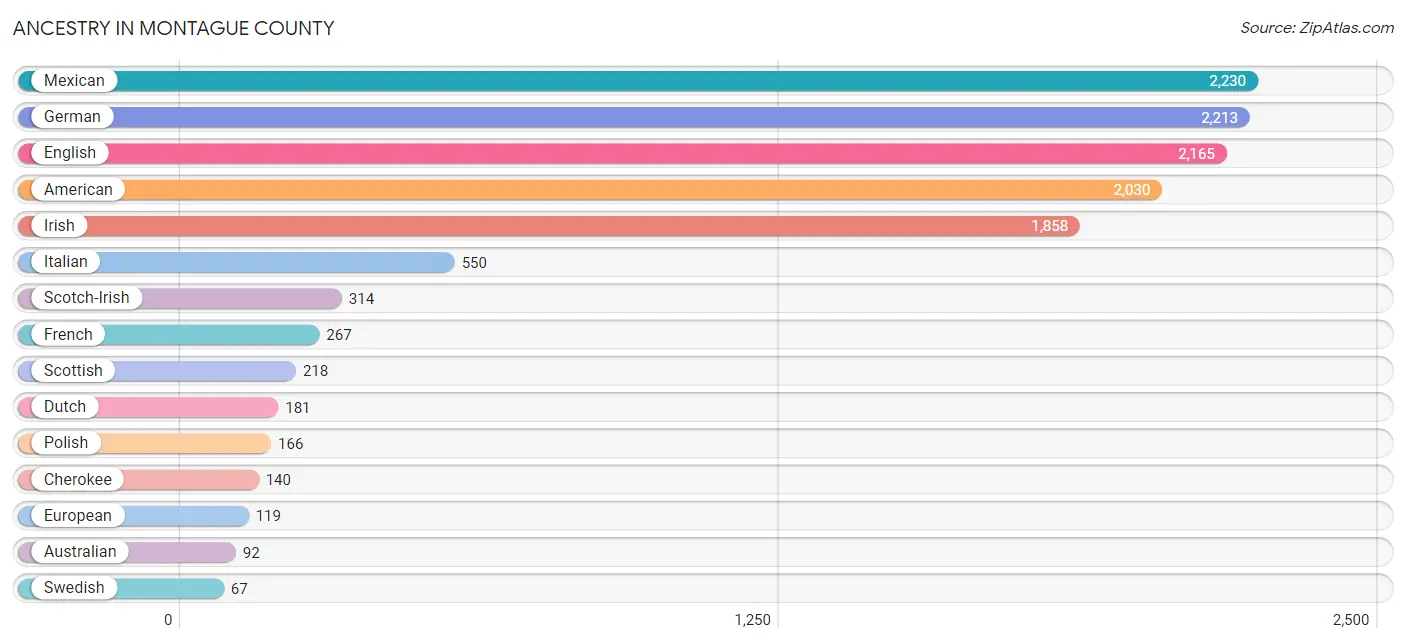
Ancestry in Montague County
The most populous ancestries reported in Montague County are Mexican (2,230 | 11.0%), German (2,213 | 11.0%), English (2,165 | 10.7%), American (2,030 | 10.1%), and Irish (1,858 | 9.2%), together accounting for 52.0% of all Montague County residents.
| Ancestry | # Population | % Population |
| American | 2,030 | 10.1% |
| Arab | 10 | 0.1% |
| Australian | 92 | 0.5% |
| Austrian | 3 | 0.0% |
| Blackfeet | 57 | 0.3% |
| British | 9 | 0.0% |
| Central American | 7 | 0.0% |
| Cherokee | 140 | 0.7% |
| Chickasaw | 14 | 0.1% |
| Choctaw | 31 | 0.2% |
| Croatian | 3 | 0.0% |
| Czech | 22 | 0.1% |
| Czechoslovakian | 42 | 0.2% |
| Danish | 5 | 0.0% |
| Dutch | 181 | 0.9% |
| Dutch West Indian | 12 | 0.1% |
| English | 2,165 | 10.7% |
| European | 119 | 0.6% |
| Finnish | 59 | 0.3% |
| French | 267 | 1.3% |
| French Canadian | 31 | 0.2% |
| German | 2,213 | 11.0% |
| Guamanian / Chamorro | 1 | 0.0% |
| Houma | 1 | 0.0% |
| Hungarian | 4 | 0.0% |
| Indian (Asian) | 32 | 0.2% |
| Irish | 1,858 | 9.2% |
| Italian | 550 | 2.7% |
| Malaysian | 5 | 0.0% |
| Mexican | 2,230 | 11.0% |
| Northern European | 17 | 0.1% |
| Norwegian | 45 | 0.2% |
| Paiute | 5 | 0.0% |
| Panamanian | 7 | 0.0% |
| Peruvian | 10 | 0.1% |
| Polish | 166 | 0.8% |
| Portuguese | 3 | 0.0% |
| Puerto Rican | 22 | 0.1% |
| Scandinavian | 4 | 0.0% |
| Scotch-Irish | 314 | 1.5% |
| Scottish | 218 | 1.1% |
| Sioux | 16 | 0.1% |
| Slovak | 4 | 0.0% |
| South American | 10 | 0.1% |
| Spaniard | 3 | 0.0% |
| Spanish | 2 | 0.0% |
| Swedish | 67 | 0.3% |
| Swiss | 8 | 0.0% |
| Welsh | 49 | 0.2% | View All 49 Rows |
Immigrants in Montague County
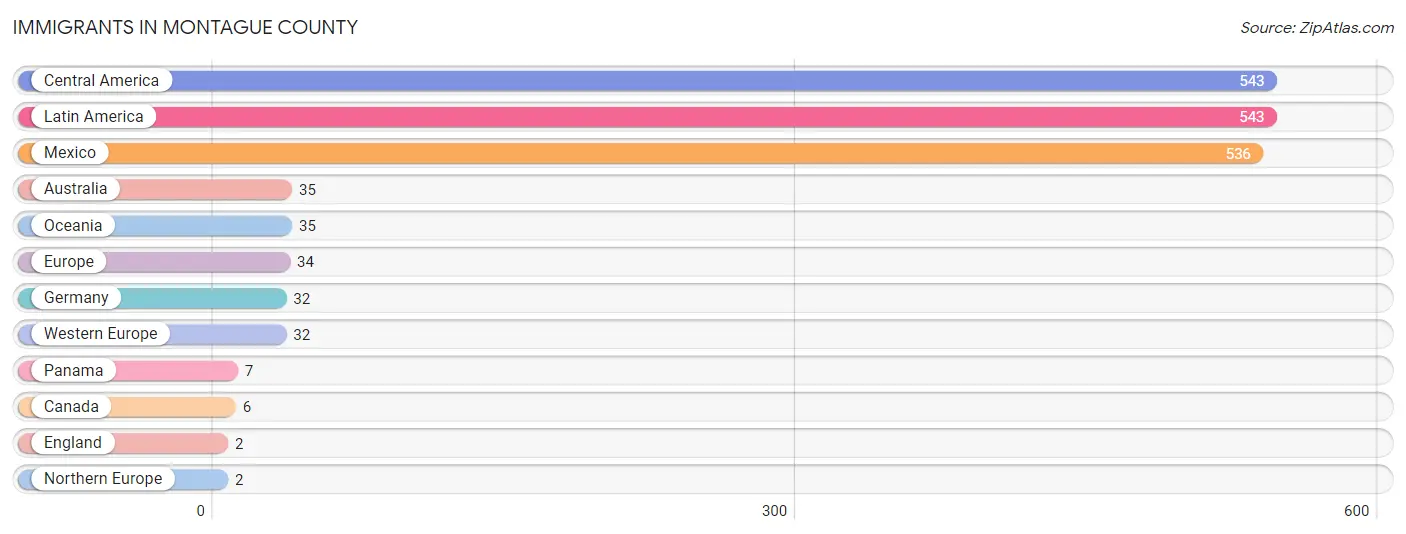
The most numerous immigrant groups reported in Montague County came from Central America (543 | 2.7%), Latin America (543 | 2.7%), Mexico (536 | 2.6%), Australia (35 | 0.2%), and Oceania (35 | 0.2%), together accounting for 8.4% of all Montague County residents.
| Immigration Origin | # Population | % Population |
| Australia | 35 | 0.2% |
| Canada | 6 | 0.0% |
| Central America | 543 | 2.7% |
| England | 2 | 0.0% |
| Europe | 34 | 0.2% |
| Germany | 32 | 0.2% |
| Latin America | 543 | 2.7% |
| Mexico | 536 | 2.6% |
| Northern Europe | 2 | 0.0% |
| Oceania | 35 | 0.2% |
| Panama | 7 | 0.0% |
| Western Europe | 32 | 0.2% | View All 12 Rows |
Sex and Age in Montague County
Sex and Age in Montague County
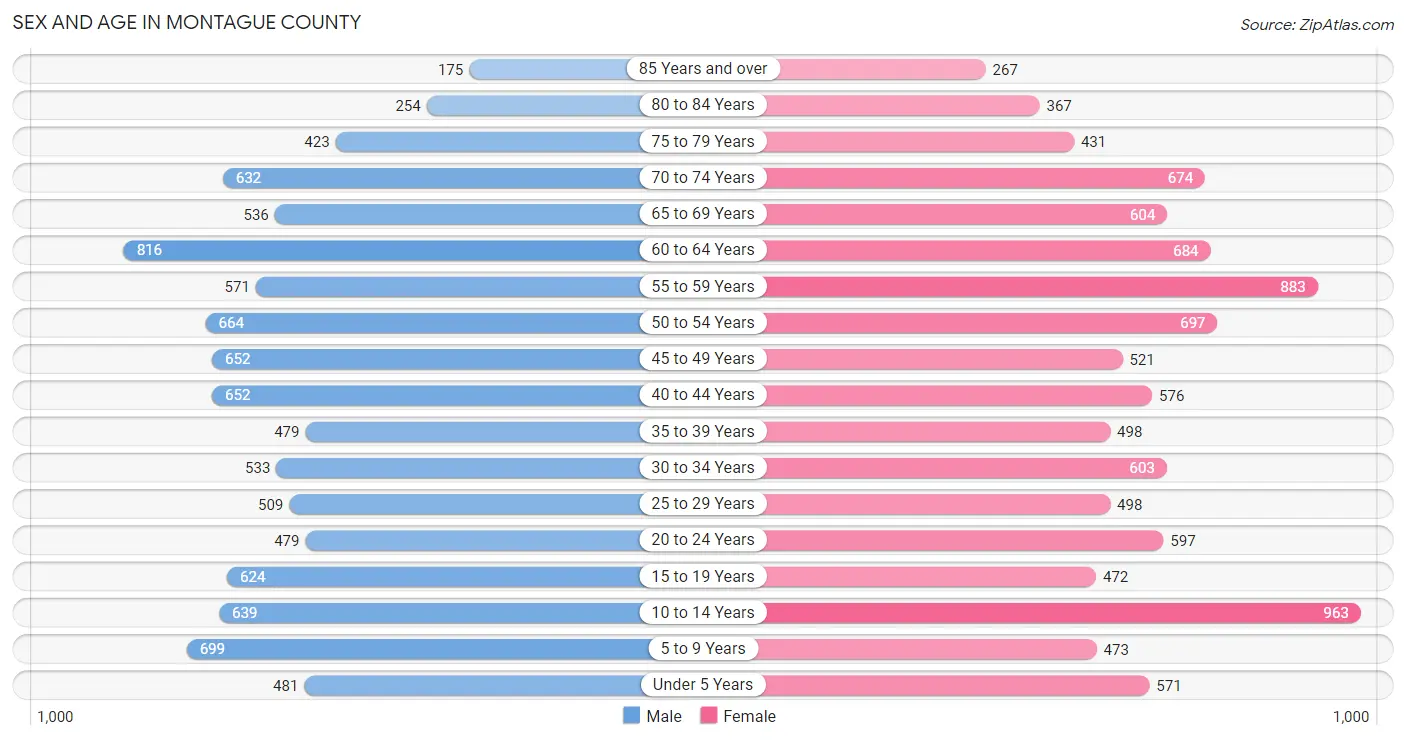
The most populous age groups in Montague County are 60 to 64 Years (816 | 8.3%) for men and 10 to 14 Years (963 | 9.3%) for women.
| Age Bracket | Male | Female |
| Under 5 Years | 481 (4.9%) | 571 (5.5%) |
| 5 to 9 Years | 699 (7.1%) | 473 (4.6%) |
| 10 to 14 Years | 639 (6.5%) | 963 (9.3%) |
| 15 to 19 Years | 624 (6.4%) | 472 (4.5%) |
| 20 to 24 Years | 479 (4.9%) | 597 (5.8%) |
| 25 to 29 Years | 509 (5.2%) | 498 (4.8%) |
| 30 to 34 Years | 533 (5.4%) | 603 (5.8%) |
| 35 to 39 Years | 479 (4.9%) | 498 (4.8%) |
| 40 to 44 Years | 652 (6.6%) | 576 (5.6%) |
| 45 to 49 Years | 652 (6.6%) | 521 (5.0%) |
| 50 to 54 Years | 664 (6.8%) | 697 (6.7%) |
| 55 to 59 Years | 571 (5.8%) | 883 (8.5%) |
| 60 to 64 Years | 816 (8.3%) | 684 (6.6%) |
| 65 to 69 Years | 536 (5.5%) | 604 (5.8%) |
| 70 to 74 Years | 632 (6.4%) | 674 (6.5%) |
| 75 to 79 Years | 423 (4.3%) | 431 (4.2%) |
| 80 to 84 Years | 254 (2.6%) | 367 (3.5%) |
| 85 Years and over | 175 (1.8%) | 267 (2.6%) |
| Total | 9,818 (100.0%) | 10,379 (100.0%) |
Families and Households in Montague County
Median Family Size in Montague County
The median family size in Montague County is 3.02 persons per family, with married-couple families (4,400 | 81.2%) accounting for the largest median family size of 3.03 persons per family. On the other hand, single male/father families (311 | 5.7%) represent the smallest median family size with 2.97 persons per family.

| Family Type | # Families | Family Size |
| Married-Couple | 4,400 (81.2%) | 3.03 |
| Single Male/Father | 311 (5.7%) | 2.97 |
| Single Female/Mother | 710 (13.1%) | 2.98 |
| Total Families | 5,421 (100.0%) | 3.02 |
Median Household Size in Montague County
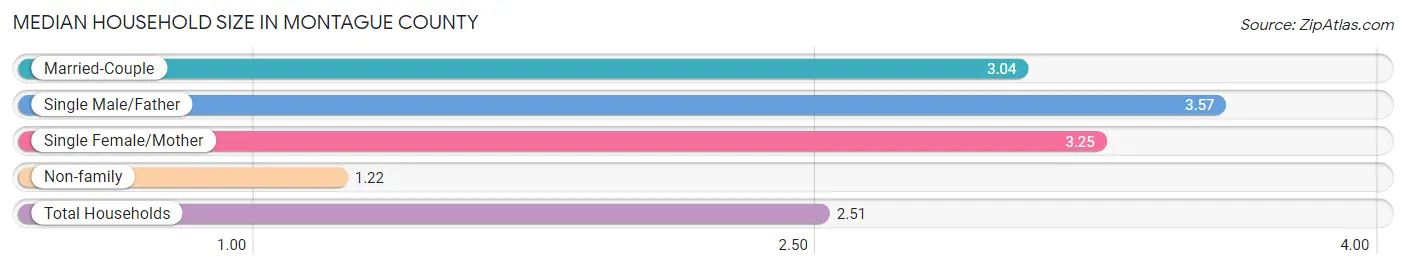
The median household size in Montague County is 2.51 persons per household, with single male/father households (311 | 3.9%) accounting for the largest median household size of 3.57 persons per household. non-family households (2,486 | 31.4%) represent the smallest median household size with 1.22 persons per household.
| Household Type | # Households | Household Size |
| Married-Couple | 4,400 (55.6%) | 3.04 |
| Single Male/Father | 311 (3.9%) | 3.57 |
| Single Female/Mother | 710 (9.0%) | 3.25 |
| Non-family | 2,486 (31.4%) | 1.22 |
| Total Households | 7,907 (100.0%) | 2.51 |
Household Size by Marriage Status in Montague County
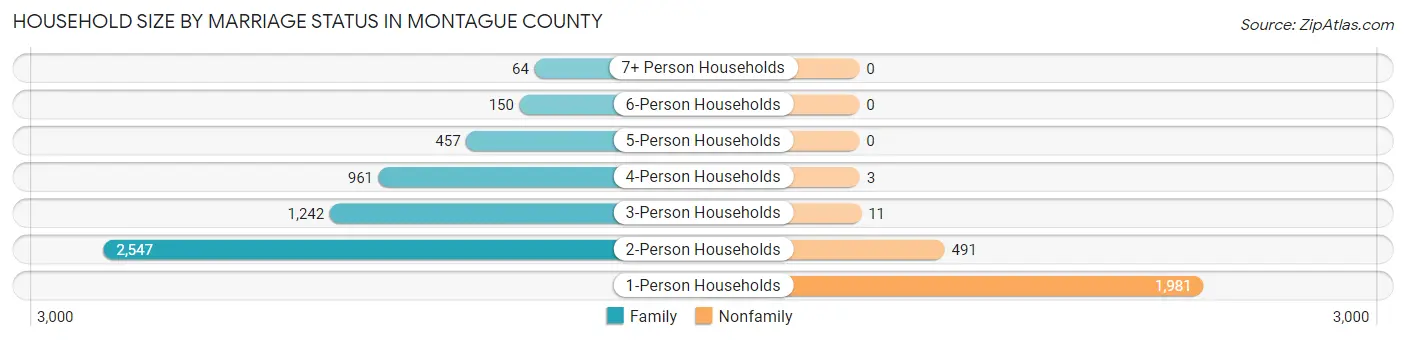
Out of a total of 7,907 households in Montague County, 5,421 (68.6%) are family households, while 2,486 (31.4%) are nonfamily households. The most numerous type of family households are 2-person households, comprising 2,547, and the most common type of nonfamily households are 1-person households, comprising 1,981.
| Household Size | Family Households | Nonfamily Households |
| 1-Person Households | - | 1,981 (25.1%) |
| 2-Person Households | 2,547 (32.2%) | 491 (6.2%) |
| 3-Person Households | 1,242 (15.7%) | 11 (0.1%) |
| 4-Person Households | 961 (12.1%) | 3 (0.0%) |
| 5-Person Households | 457 (5.8%) | 0 (0.0%) |
| 6-Person Households | 150 (1.9%) | 0 (0.0%) |
| 7+ Person Households | 64 (0.8%) | 0 (0.0%) |
| Total | 5,421 (68.6%) | 2,486 (31.4%) |
Female Fertility in Montague County
Fertility by Age in Montague County
Average fertility rate in Montague County is 50.0 births per 1,000 women. Women in the age bracket of 20 to 34 years have the highest fertility rate with 108.0 births per 1,000 women. Women in the age bracket of 20 to 34 years acount for 95.3% of all women with births.
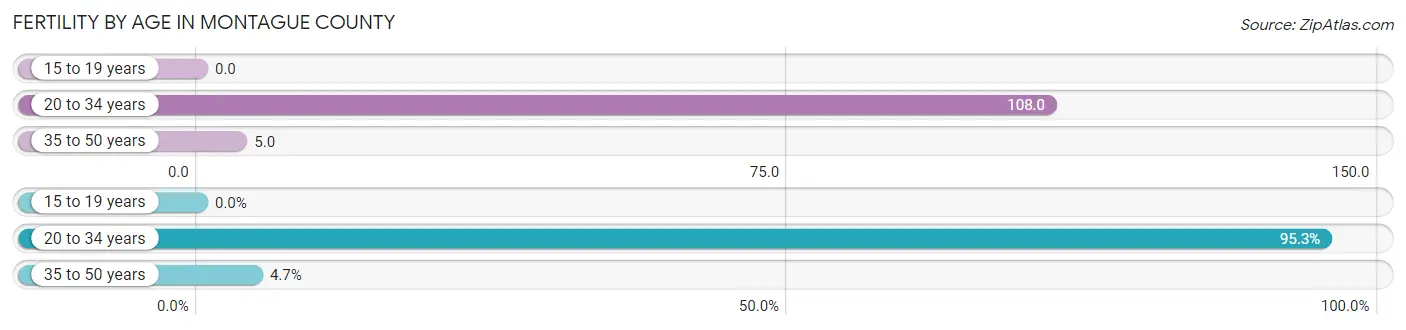
| Age Bracket | Women with Births | Births / 1,000 Women |
| 15 to 19 years | 0 (0.0%) | 0.0 |
| 20 to 34 years | 184 (95.3%) | 108.0 |
| 35 to 50 years | 9 (4.7%) | 5.0 |
| Total | 193 (100.0%) | 50.0 |
Fertility by Age by Marriage Status in Montague County
92.2% of women with births (193) in Montague County are married. The highest percentage of unmarried women with births falls into 20 to 34 years age bracket with 8.2% of them unmarried at the time of birth, while the lowest percentage of unmarried women with births belong to 35 to 50 years age bracket with 0.0% of them unmarried.
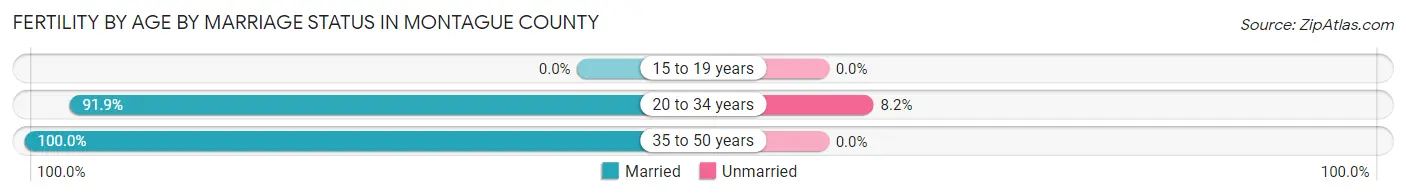
| Age Bracket | Married | Unmarried |
| 15 to 19 years | 0 (0.0%) | 0 (0.0%) |
| 20 to 34 years | 169 (91.8%) | 15 (8.2%) |
| 35 to 50 years | 9 (100.0%) | 0 (0.0%) |
| Total | 178 (92.2%) | 15 (7.8%) |
Fertility by Education in Montague County
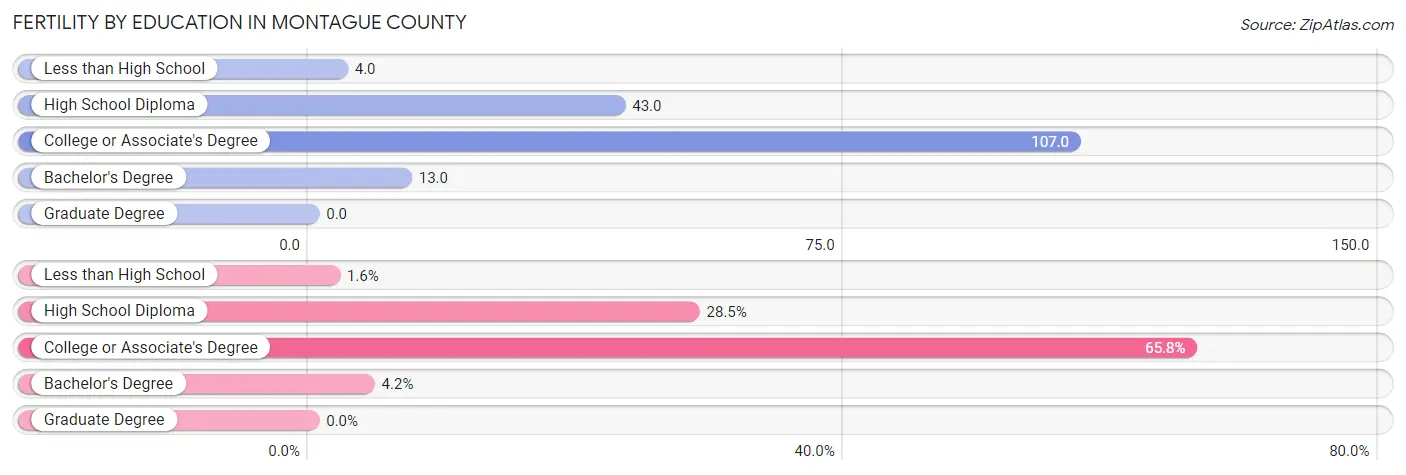
| Educational Attainment | Women with Births | Births / 1,000 Women |
| Less than High School | 3 (1.5%) | 4.0 |
| High School Diploma | 55 (28.5%) | 43.0 |
| College or Associate's Degree | 127 (65.8%) | 107.0 |
| Bachelor's Degree | 8 (4.2%) | 13.0 |
| Graduate Degree | 0 (0.0%) | 0.0 |
| Total | 193 (100.0%) | 50.0 |
Fertility by Education by Marriage Status in Montague County
7.8% of women with births in Montague County are unmarried. Women with the educational attainment of bachelor's degree are most likely to be married with 100.0% of them married at childbirth, while women with the educational attainment of less than high school are least likely to be married with 100.0% of them unmarried at childbirth.
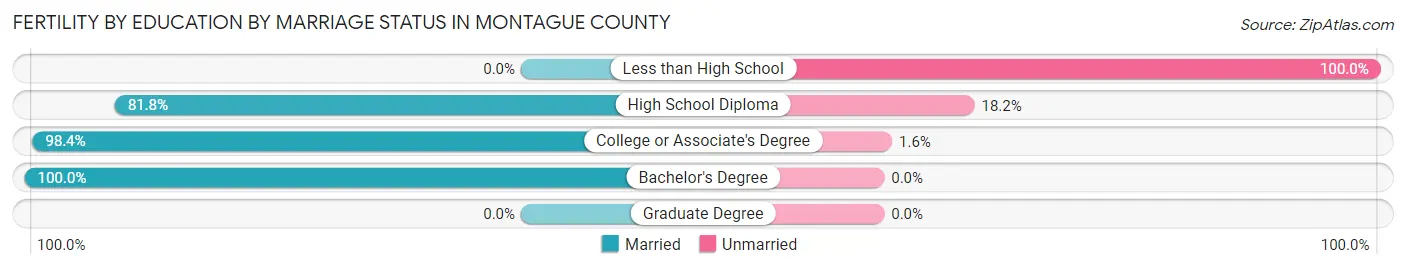
| Educational Attainment | Married | Unmarried |
| Less than High School | 0 (0.0%) | 3 (100.0%) |
| High School Diploma | 45 (81.8%) | 10 (18.2%) |
| College or Associate's Degree | 125 (98.4%) | 2 (1.6%) |
| Bachelor's Degree | 8 (100.0%) | 0 (0.0%) |
| Graduate Degree | 0 (0.0%) | 0 (0.0%) |
| Total | 178 (92.2%) | 15 (7.8%) |
Employment Characteristics in Montague County
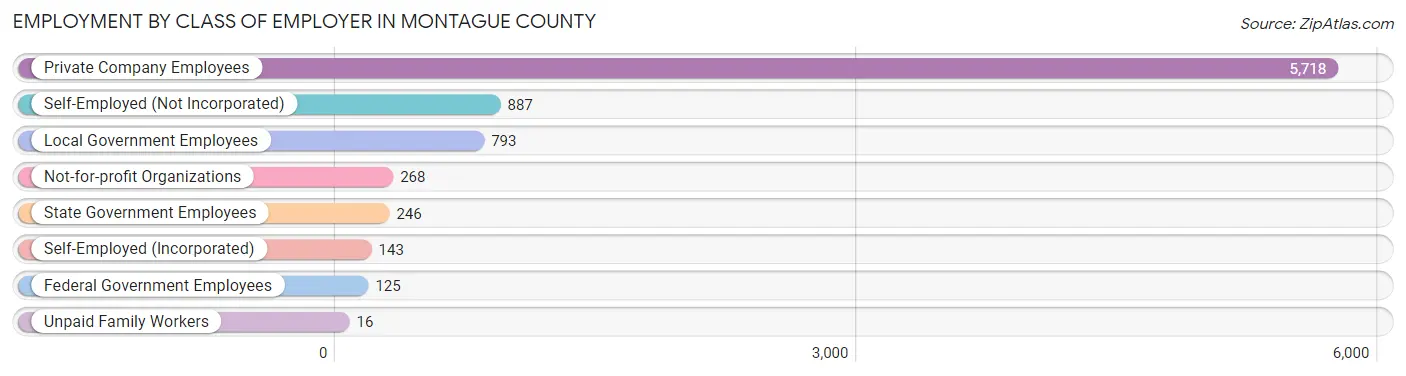
Employment by Class of Employer in Montague County
Among the 8,196 employed individuals in Montague County, private company employees (5,718 | 69.8%), self-employed (not incorporated) (887 | 10.8%), and local government employees (793 | 9.7%) make up the most common classes of employment.
| Employer Class | # Employees | % Employees |
| Private Company Employees | 5,718 | 69.8% |
| Self-Employed (Incorporated) | 143 | 1.7% |
| Self-Employed (Not Incorporated) | 887 | 10.8% |
| Not-for-profit Organizations | 268 | 3.3% |
| Local Government Employees | 793 | 9.7% |
| State Government Employees | 246 | 3.0% |
| Federal Government Employees | 125 | 1.5% |
| Unpaid Family Workers | 16 | 0.2% |
| Total | 8,196 | 100.0% |
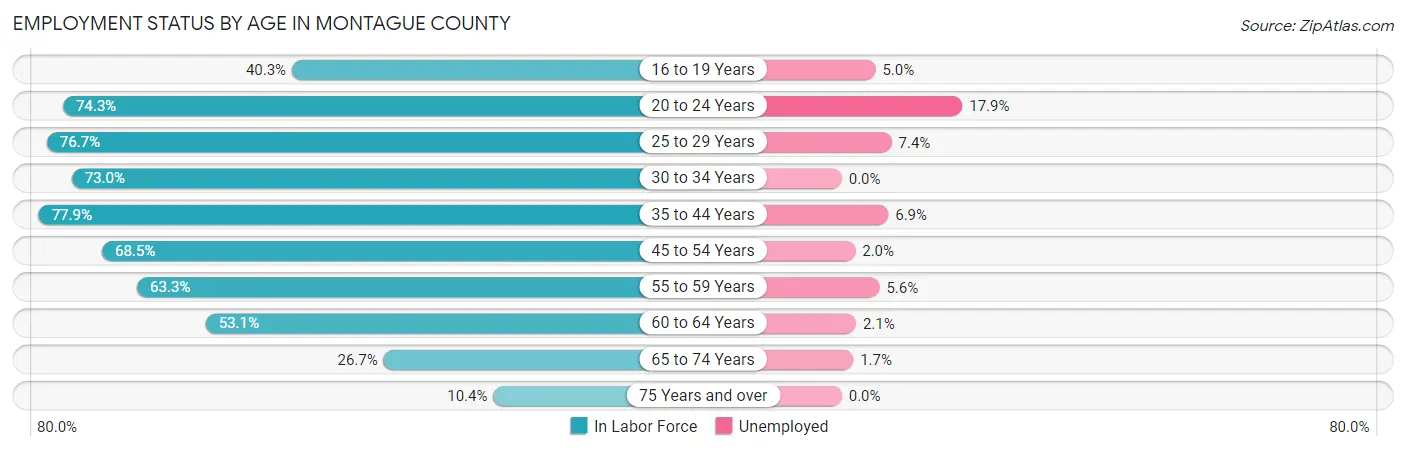
Employment Status by Age in Montague County
According to the labor force statistics for Montague County, out of the total population over 16 years of age (16,069), 54.4% or 8,742 individuals are in the labor force, with 5.1% or 446 of them unemployed. The age group with the highest labor force participation rate is 35 to 44 years, with 77.9% or 1,718 individuals in the labor force. Within the labor force, the 20 to 24 years age range has the highest percentage of unemployed individuals, with 17.9% or 143 of them being unemployed.
| Age Bracket | In Labor Force | Unemployed |
| 16 to 19 Years | 320 (40.3%) | 16 (5.0%) |
| 20 to 24 Years | 799 (74.3%) | 143 (17.9%) |
| 25 to 29 Years | 772 (76.7%) | 57 (7.4%) |
| 30 to 34 Years | 829 (73.0%) | 0 (0.0%) |
| 35 to 44 Years | 1,718 (77.9%) | 119 (6.9%) |
| 45 to 54 Years | 1,736 (68.5%) | 35 (2.0%) |
| 55 to 59 Years | 920 (63.3%) | 52 (5.6%) |
| 60 to 64 Years | 796 (53.1%) | 17 (2.1%) |
| 65 to 74 Years | 653 (26.7%) | 11 (1.7%) |
| 75 Years and over | 199 (10.4%) | 0 (0.0%) |
| Total | 8,742 (54.4%) | 446 (5.1%) |
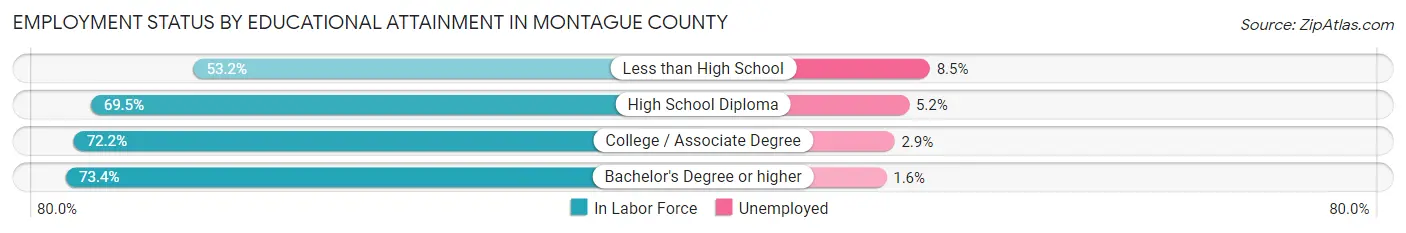
Employment Status by Educational Attainment in Montague County
According to labor force statistics for Montague County, 68.8% of individuals (6,767) out of the total population between 25 and 64 years of age (9,836) are in the labor force, with 4.1% or 277 of them being unemployed. The group with the highest labor force participation rate are those with the educational attainment of bachelor's degree or higher, with 73.4% or 1,150 individuals in the labor force. Within the labor force, individuals with less than high school education have the highest percentage of unemployment, with 8.5% or 58 of them being unemployed.
| Educational Attainment | In Labor Force | Unemployed |
| Less than High School | 680 (53.2%) | 109 (8.5%) |
| High School Diploma | 2,677 (69.5%) | 200 (5.2%) |
| College / Associate Degree | 2,266 (72.2%) | 91 (2.9%) |
| Bachelor's Degree or higher | 1,150 (73.4%) | 25 (1.6%) |
| Total | 6,767 (68.8%) | 403 (4.1%) |
Employment Occupations by Sex in Montague County
Management, Business, Science and Arts Occupations
The most common Management, Business, Science and Arts occupations in Montague County are Management (754 | 9.1%), Community & Social Service (594 | 7.2%), Health Diagnosing & Treating (434 | 5.2%), Education Instruction & Library (369 | 4.4%), and Health Technologists (227 | 2.7%).
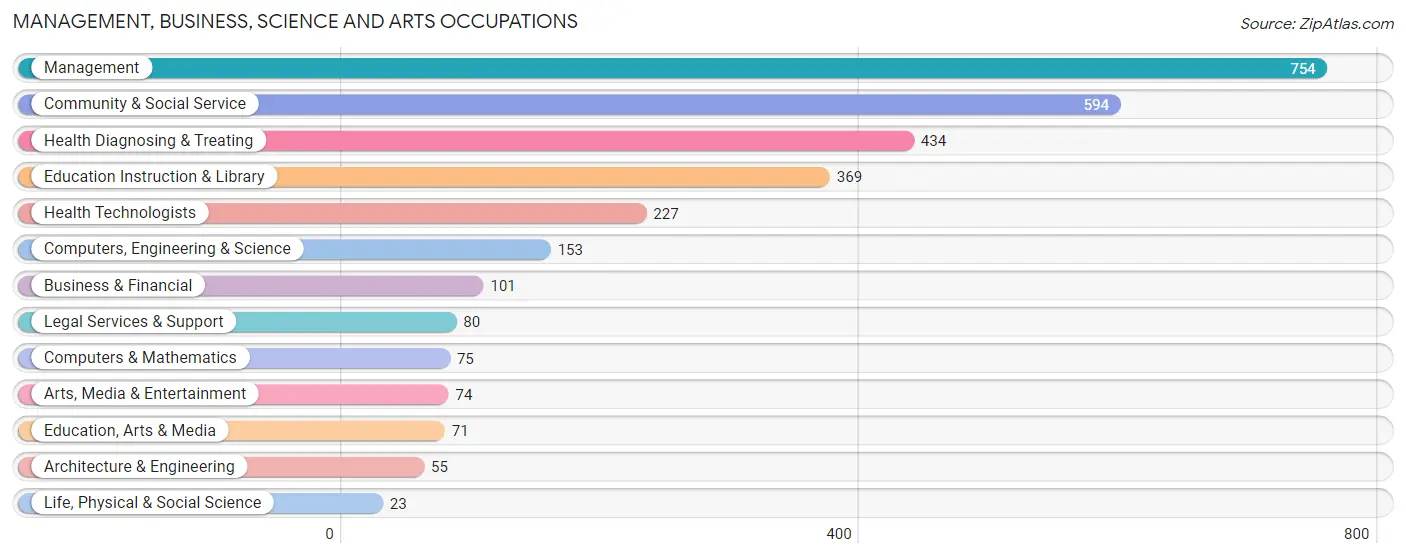
Management, Business, Science and Arts Occupations by Sex
Within the Management, Business, Science and Arts occupations in Montague County, the most male-oriented occupations are Computers & Mathematics (73.3%), Computers, Engineering & Science (62.7%), and Architecture & Engineering (60.0%), while the most female-oriented occupations are Legal Services & Support (93.8%), Health Diagnosing & Treating (86.4%), and Health Technologists (75.8%).
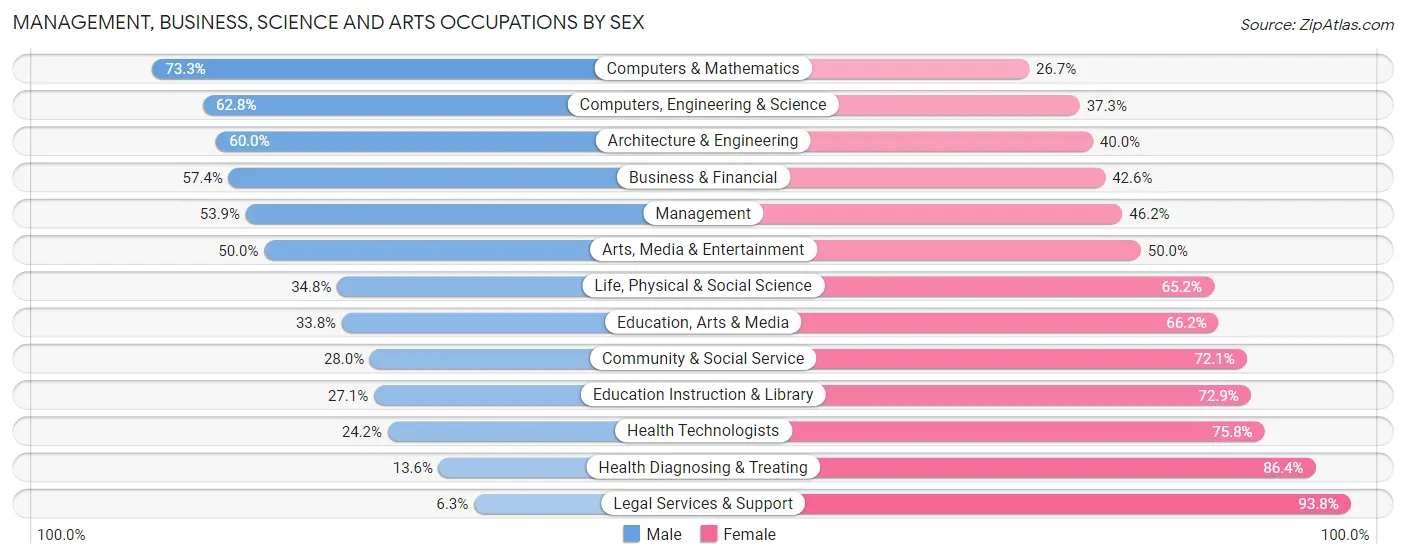
| Occupation | Male | Female |
| Management | 406 (53.8%) | 348 (46.2%) |
| Business & Financial | 58 (57.4%) | 43 (42.6%) |
| Computers, Engineering & Science | 96 (62.7%) | 57 (37.2%) |
| Computers & Mathematics | 55 (73.3%) | 20 (26.7%) |
| Architecture & Engineering | 33 (60.0%) | 22 (40.0%) |
| Life, Physical & Social Science | 8 (34.8%) | 15 (65.2%) |
| Community & Social Service | 166 (28.0%) | 428 (72.1%) |
| Education, Arts & Media | 24 (33.8%) | 47 (66.2%) |
| Legal Services & Support | 5 (6.2%) | 75 (93.8%) |
| Education Instruction & Library | 100 (27.1%) | 269 (72.9%) |
| Arts, Media & Entertainment | 37 (50.0%) | 37 (50.0%) |
| Health Diagnosing & Treating | 59 (13.6%) | 375 (86.4%) |
| Health Technologists | 55 (24.2%) | 172 (75.8%) |
| Total (Category) | 785 (38.6%) | 1,251 (61.4%) |
| Total (Overall) | 4,591 (55.4%) | 3,697 (44.6%) |
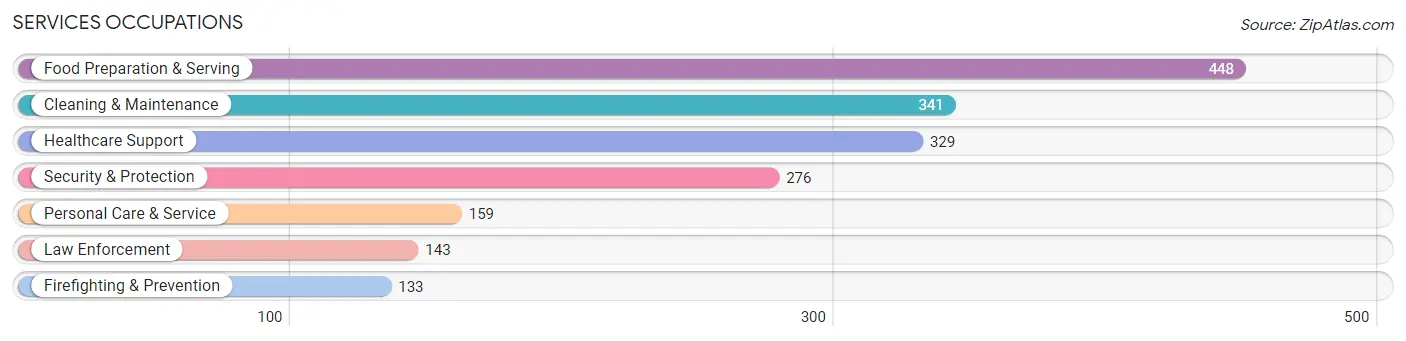
Services Occupations
The most common Services occupations in Montague County are Food Preparation & Serving (448 | 5.4%), Cleaning & Maintenance (341 | 4.1%), Healthcare Support (329 | 4.0%), Security & Protection (276 | 3.3%), and Personal Care & Service (159 | 1.9%).
Services Occupations by Sex
Within the Services occupations in Montague County, the most male-oriented occupations are Law Enforcement (92.3%), Security & Protection (90.2%), and Firefighting & Prevention (88.0%), while the most female-oriented occupations are Healthcare Support (95.4%), Personal Care & Service (79.2%), and Food Preparation & Serving (58.0%).
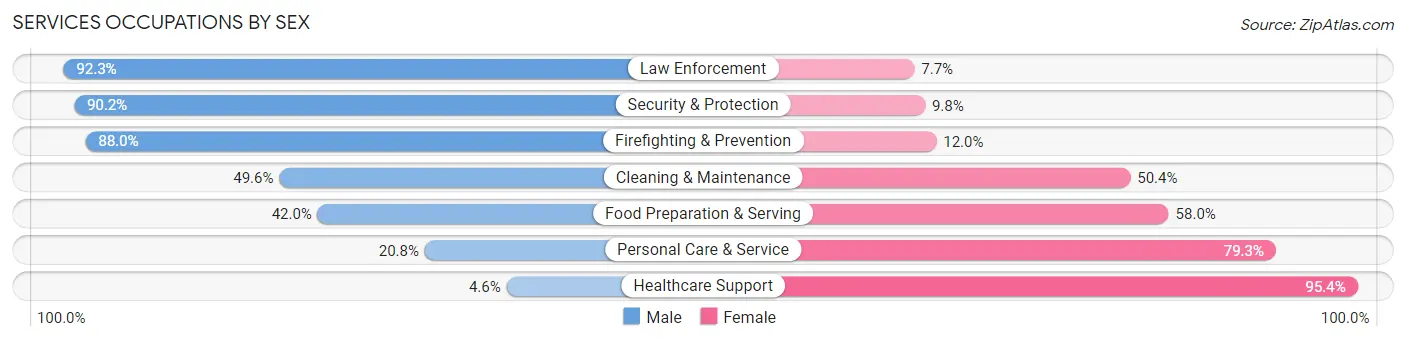
| Occupation | Male | Female |
| Healthcare Support | 15 (4.6%) | 314 (95.4%) |
| Security & Protection | 249 (90.2%) | 27 (9.8%) |
| Firefighting & Prevention | 117 (88.0%) | 16 (12.0%) |
| Law Enforcement | 132 (92.3%) | 11 (7.7%) |
| Food Preparation & Serving | 188 (42.0%) | 260 (58.0%) |
| Cleaning & Maintenance | 169 (49.6%) | 172 (50.4%) |
| Personal Care & Service | 33 (20.7%) | 126 (79.2%) |
| Total (Category) | 654 (42.1%) | 899 (57.9%) |
| Total (Overall) | 4,591 (55.4%) | 3,697 (44.6%) |
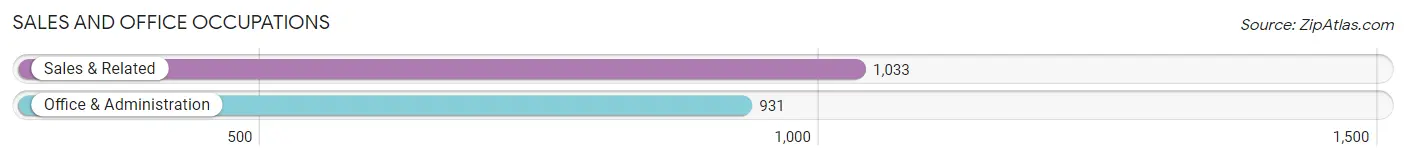
Sales and Office Occupations
The most common Sales and Office occupations in Montague County are Sales & Related (1,033 | 12.5%), and Office & Administration (931 | 11.2%).
Sales and Office Occupations by Sex
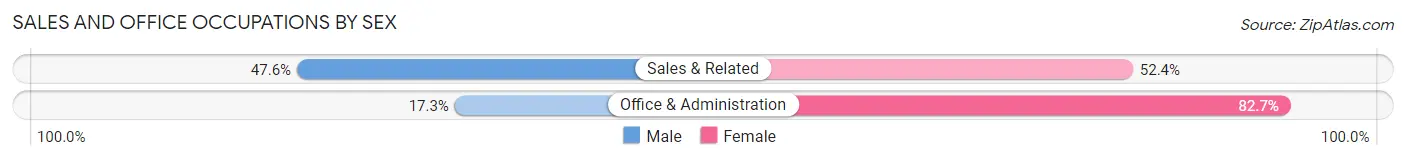
| Occupation | Male | Female |
| Sales & Related | 492 (47.6%) | 541 (52.4%) |
| Office & Administration | 161 (17.3%) | 770 (82.7%) |
| Total (Category) | 653 (33.3%) | 1,311 (66.7%) |
| Total (Overall) | 4,591 (55.4%) | 3,697 (44.6%) |
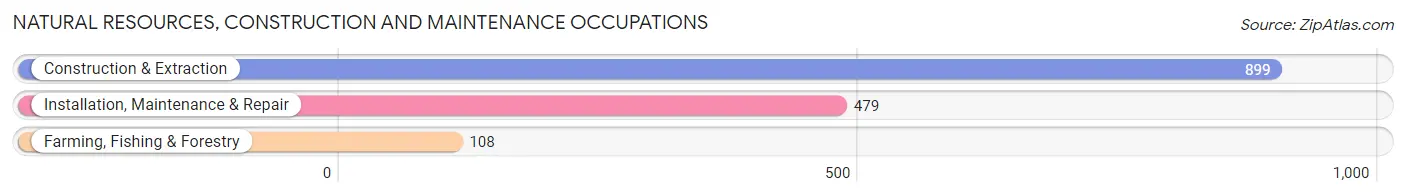
Natural Resources, Construction and Maintenance Occupations
The most common Natural Resources, Construction and Maintenance occupations in Montague County are Construction & Extraction (899 | 10.8%), Installation, Maintenance & Repair (479 | 5.8%), and Farming, Fishing & Forestry (108 | 1.3%).
Natural Resources, Construction and Maintenance Occupations by Sex
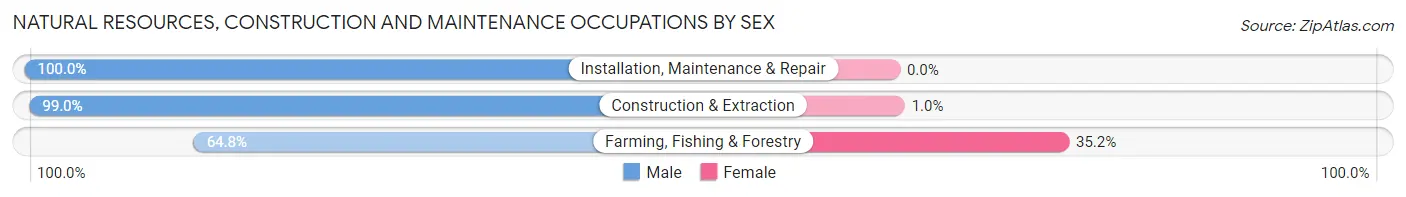
| Occupation | Male | Female |
| Farming, Fishing & Forestry | 70 (64.8%) | 38 (35.2%) |
| Construction & Extraction | 890 (99.0%) | 9 (1.0%) |
| Installation, Maintenance & Repair | 479 (100.0%) | 0 (0.0%) |
| Total (Category) | 1,439 (96.8%) | 47 (3.2%) |
| Total (Overall) | 4,591 (55.4%) | 3,697 (44.6%) |
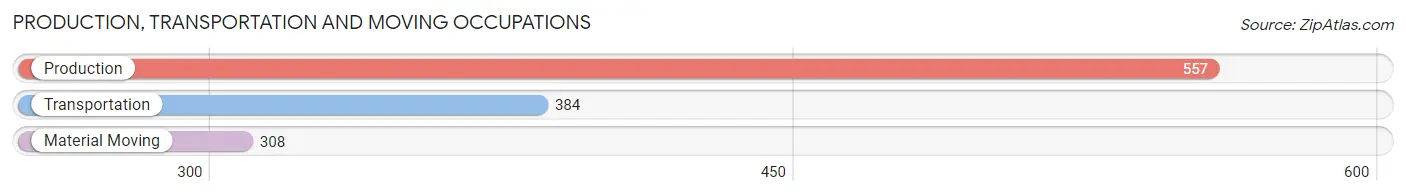
Production, Transportation and Moving Occupations
The most common Production, Transportation and Moving occupations in Montague County are Production (557 | 6.7%), Transportation (384 | 4.6%), and Material Moving (308 | 3.7%).
Production, Transportation and Moving Occupations by Sex
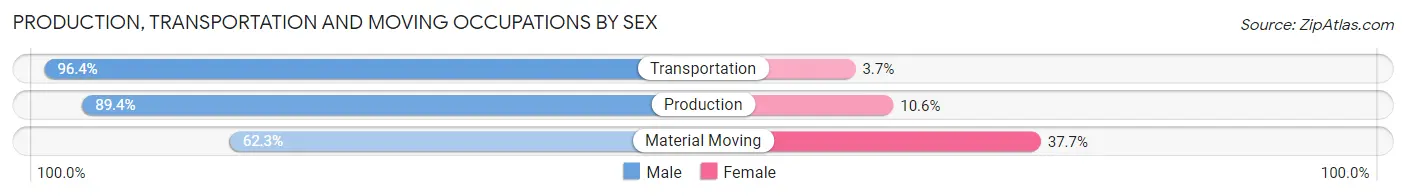
| Occupation | Male | Female |
| Production | 498 (89.4%) | 59 (10.6%) |
| Transportation | 370 (96.4%) | 14 (3.6%) |
| Material Moving | 192 (62.3%) | 116 (37.7%) |
| Total (Category) | 1,060 (84.9%) | 189 (15.1%) |
| Total (Overall) | 4,591 (55.4%) | 3,697 (44.6%) |
Employment Industries by Sex in Montague County
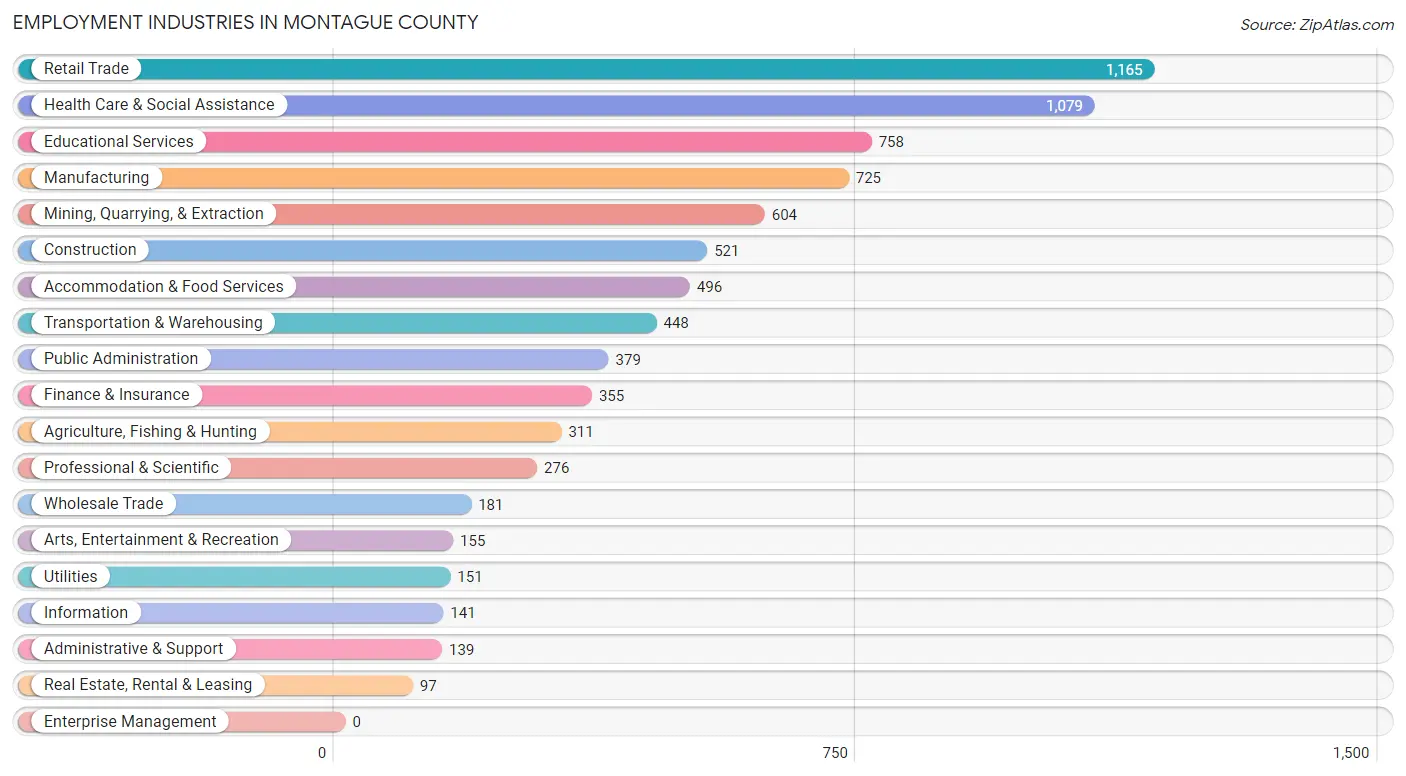
Employment Industries in Montague County
The major employment industries in Montague County include Retail Trade (1,165 | 14.1%), Health Care & Social Assistance (1,079 | 13.0%), Educational Services (758 | 9.1%), Manufacturing (725 | 8.7%), and Mining, Quarrying, & Extraction (604 | 7.3%).
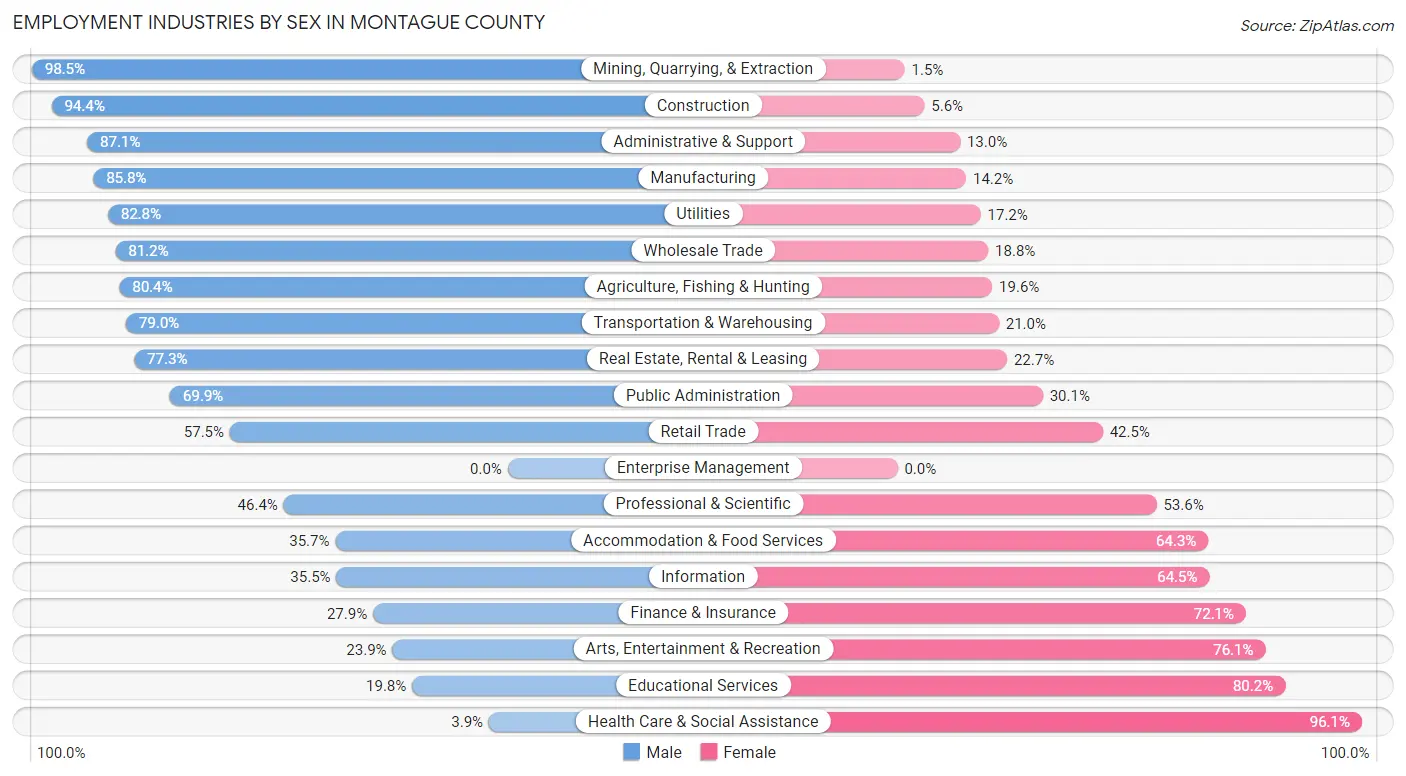
Employment Industries by Sex in Montague County
The Montague County industries that see more men than women are Mining, Quarrying, & Extraction (98.5%), Construction (94.4%), and Administrative & Support (87.1%), whereas the industries that tend to have a higher number of women are Health Care & Social Assistance (96.1%), Educational Services (80.2%), and Arts, Entertainment & Recreation (76.1%).
| Industry | Male | Female |
| Agriculture, Fishing & Hunting | 250 (80.4%) | 61 (19.6%) |
| Mining, Quarrying, & Extraction | 595 (98.5%) | 9 (1.5%) |
| Construction | 492 (94.4%) | 29 (5.6%) |
| Manufacturing | 622 (85.8%) | 103 (14.2%) |
| Wholesale Trade | 147 (81.2%) | 34 (18.8%) |
| Retail Trade | 670 (57.5%) | 495 (42.5%) |
| Transportation & Warehousing | 354 (79.0%) | 94 (21.0%) |
| Utilities | 125 (82.8%) | 26 (17.2%) |
| Information | 50 (35.5%) | 91 (64.5%) |
| Finance & Insurance | 99 (27.9%) | 256 (72.1%) |
| Real Estate, Rental & Leasing | 75 (77.3%) | 22 (22.7%) |
| Professional & Scientific | 128 (46.4%) | 148 (53.6%) |
| Enterprise Management | 0 (0.0%) | 0 (0.0%) |
| Administrative & Support | 121 (87.1%) | 18 (13.0%) |
| Educational Services | 150 (19.8%) | 608 (80.2%) |
| Health Care & Social Assistance | 42 (3.9%) | 1,037 (96.1%) |
| Arts, Entertainment & Recreation | 37 (23.9%) | 118 (76.1%) |
| Accommodation & Food Services | 177 (35.7%) | 319 (64.3%) |
| Public Administration | 265 (69.9%) | 114 (30.1%) |
| Total | 4,591 (55.4%) | 3,697 (44.6%) |
Education in Montague County
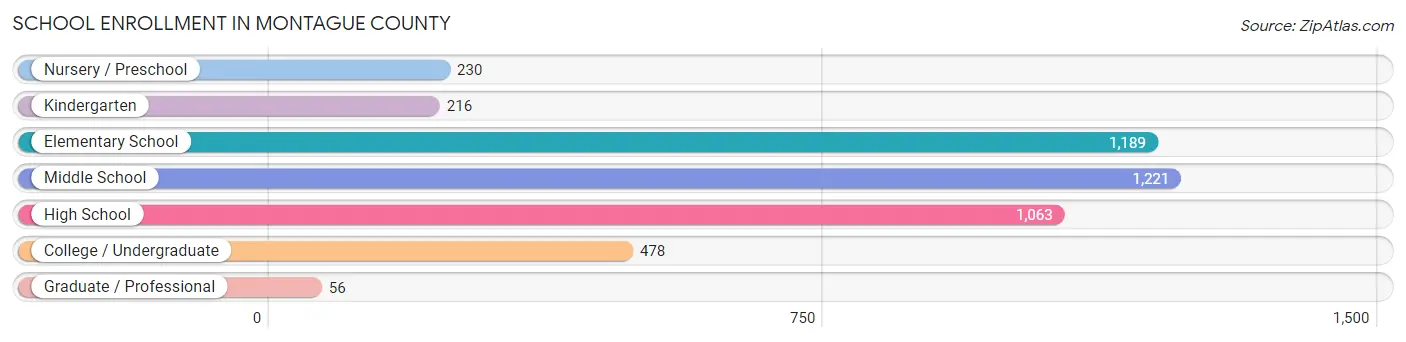
School Enrollment in Montague County
The most common levels of schooling among the 4,453 students in Montague County are middle school (1,221 | 27.4%), elementary school (1,189 | 26.7%), and high school (1,063 | 23.9%).
| School Level | # Students | % Students |
| Nursery / Preschool | 230 | 5.2% |
| Kindergarten | 216 | 4.9% |
| Elementary School | 1,189 | 26.7% |
| Middle School | 1,221 | 27.4% |
| High School | 1,063 | 23.9% |
| College / Undergraduate | 478 | 10.7% |
| Graduate / Professional | 56 | 1.3% |
| Total | 4,453 | 100.0% |
School Enrollment by Age by Funding Source in Montague County
Out of a total of 4,453 students who are enrolled in schools in Montague County, 454 (10.2%) attend a private institution, while the remaining 3,999 (89.8%) are enrolled in public schools. The age group of 25 to 34 year olds has the highest likelihood of being enrolled in private schools, with 99 (57.6% in the age bracket) enrolled. Conversely, the age group of 20 to 24 year olds has the lowest likelihood of being enrolled in a private school, with 153 (100.0% in the age bracket) attending a public institution.
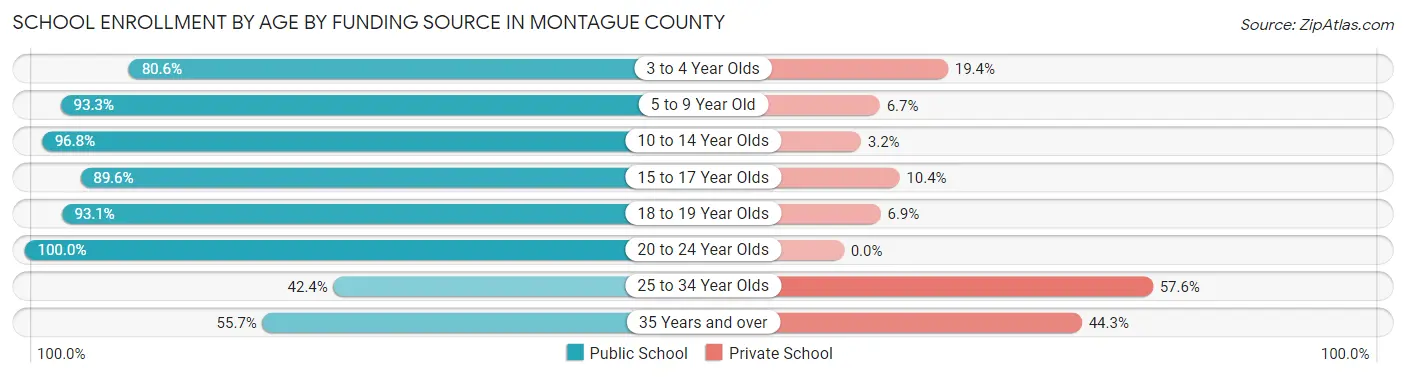
| Age Bracket | Public School | Private School |
| 3 to 4 Year Olds | 162 (80.6%) | 39 (19.4%) |
| 5 to 9 Year Old | 1,071 (93.3%) | 77 (6.7%) |
| 10 to 14 Year Olds | 1,542 (96.8%) | 51 (3.2%) |
| 15 to 17 Year Olds | 656 (89.6%) | 76 (10.4%) |
| 18 to 19 Year Olds | 217 (93.1%) | 16 (6.9%) |
| 20 to 24 Year Olds | 153 (100.0%) | 0 (0.0%) |
| 25 to 34 Year Olds | 73 (42.4%) | 99 (57.6%) |
| 35 Years and over | 123 (55.7%) | 98 (44.3%) |
| Total | 3,999 (89.8%) | 454 (10.2%) |
Educational Attainment by Field of Study in Montague County
Business (622 | 24.0%), education (578 | 22.4%), science & technology (340 | 13.2%), bio, nature & agricultural (156 | 6.0%), and arts & humanities (154 | 6.0%) are the most common fields of study among 2,586 individuals in Montague County who have obtained a bachelor's degree or higher.
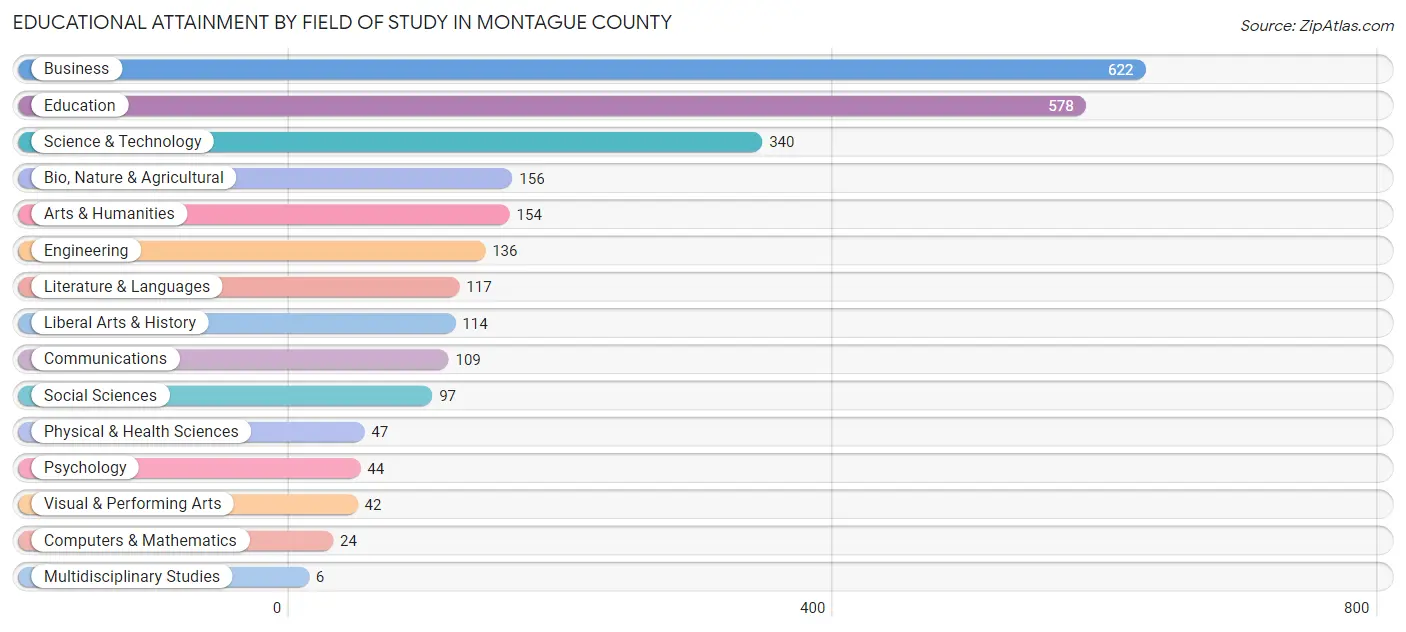
| Field of Study | # Graduates | % Graduates |
| Computers & Mathematics | 24 | 0.9% |
| Bio, Nature & Agricultural | 156 | 6.0% |
| Physical & Health Sciences | 47 | 1.8% |
| Psychology | 44 | 1.7% |
| Social Sciences | 97 | 3.7% |
| Engineering | 136 | 5.3% |
| Multidisciplinary Studies | 6 | 0.2% |
| Science & Technology | 340 | 13.2% |
| Business | 622 | 24.0% |
| Education | 578 | 22.4% |
| Literature & Languages | 117 | 4.5% |
| Liberal Arts & History | 114 | 4.4% |
| Visual & Performing Arts | 42 | 1.6% |
| Communications | 109 | 4.2% |
| Arts & Humanities | 154 | 6.0% |
| Total | 2,586 | 100.0% |
Transportation & Commute in Montague County
Vehicle Availability by Sex in Montague County
The most prevalent vehicle ownership categories in Montague County are males with 2 vehicles (1,969, accounting for 43.6%) and females with 2 vehicles (1,681, making up 53.6%).
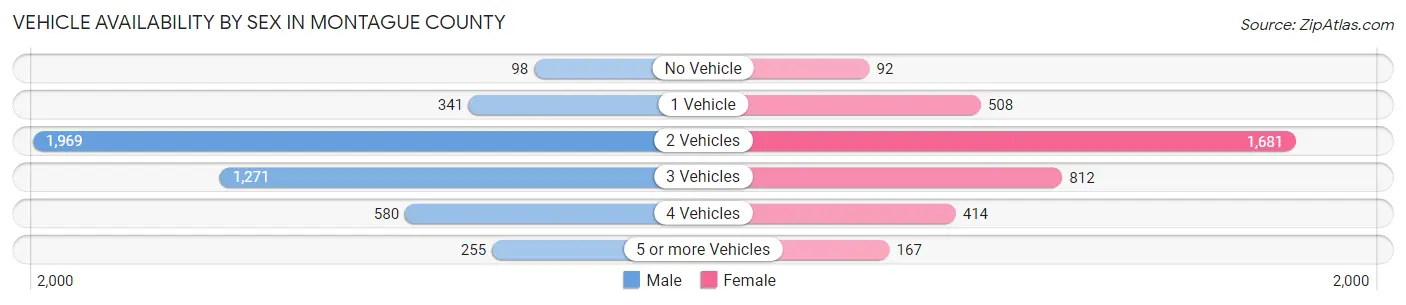
| Vehicles Available | Male | Female |
| No Vehicle | 98 (2.2%) | 92 (2.5%) |
| 1 Vehicle | 341 (7.5%) | 508 (13.8%) |
| 2 Vehicles | 1,969 (43.6%) | 1,681 (45.8%) |
| 3 Vehicles | 1,271 (28.2%) | 812 (22.1%) |
| 4 Vehicles | 580 (12.9%) | 414 (11.3%) |
| 5 or more Vehicles | 255 (5.7%) | 167 (4.5%) |
| Total | 4,514 (100.0%) | 3,674 (100.0%) |
Commute Time in Montague County
The most frequently occuring commute durations in Montague County are 5 to 9 minutes (1,294 commuters, 17.0%), 45 to 59 minutes (1,121 commuters, 14.7%), and 10 to 14 minutes (884 commuters, 11.6%).
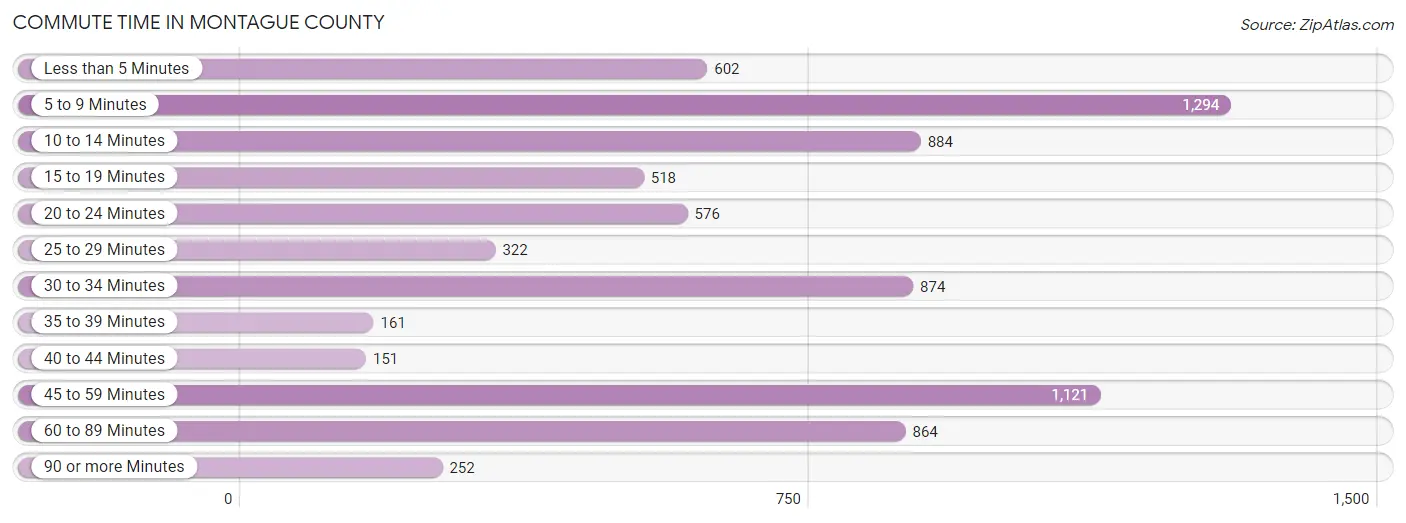
| Commute Time | # Commuters | % Commuters |
| Less than 5 Minutes | 602 | 7.9% |
| 5 to 9 Minutes | 1,294 | 17.0% |
| 10 to 14 Minutes | 884 | 11.6% |
| 15 to 19 Minutes | 518 | 6.8% |
| 20 to 24 Minutes | 576 | 7.6% |
| 25 to 29 Minutes | 322 | 4.2% |
| 30 to 34 Minutes | 874 | 11.5% |
| 35 to 39 Minutes | 161 | 2.1% |
| 40 to 44 Minutes | 151 | 2.0% |
| 45 to 59 Minutes | 1,121 | 14.7% |
| 60 to 89 Minutes | 864 | 11.3% |
| 90 or more Minutes | 252 | 3.3% |
Commute Time by Sex in Montague County
The most common commute times in Montague County are 45 to 59 minutes (665 commuters, 15.7%) for males and 5 to 9 minutes (771 commuters, 22.7%) for females.
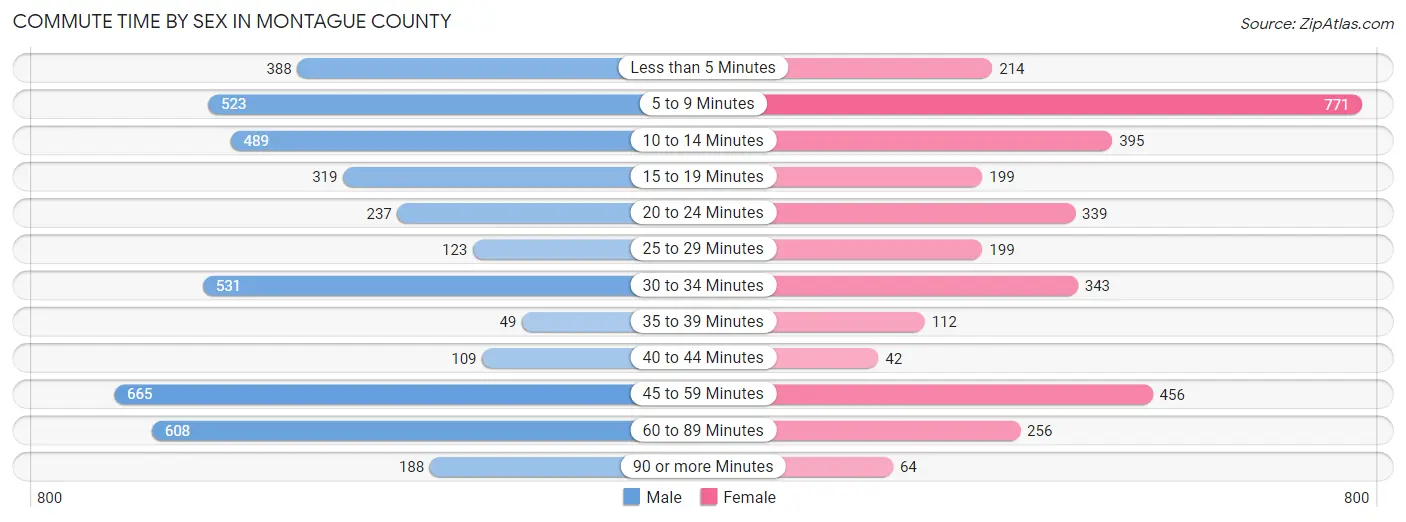
| Commute Time | Male | Female |
| Less than 5 Minutes | 388 (9.2%) | 214 (6.3%) |
| 5 to 9 Minutes | 523 (12.4%) | 771 (22.7%) |
| 10 to 14 Minutes | 489 (11.6%) | 395 (11.7%) |
| 15 to 19 Minutes | 319 (7.5%) | 199 (5.9%) |
| 20 to 24 Minutes | 237 (5.6%) | 339 (10.0%) |
| 25 to 29 Minutes | 123 (2.9%) | 199 (5.9%) |
| 30 to 34 Minutes | 531 (12.6%) | 343 (10.1%) |
| 35 to 39 Minutes | 49 (1.2%) | 112 (3.3%) |
| 40 to 44 Minutes | 109 (2.6%) | 42 (1.2%) |
| 45 to 59 Minutes | 665 (15.7%) | 456 (13.5%) |
| 60 to 89 Minutes | 608 (14.4%) | 256 (7.5%) |
| 90 or more Minutes | 188 (4.4%) | 64 (1.9%) |
Time of Departure to Work by Sex in Montague County
The most frequent times of departure to work in Montague County are 5:30 AM to 5:59 AM (686, 16.2%) for males and 7:00 AM to 7:29 AM (597, 17.6%) for females.
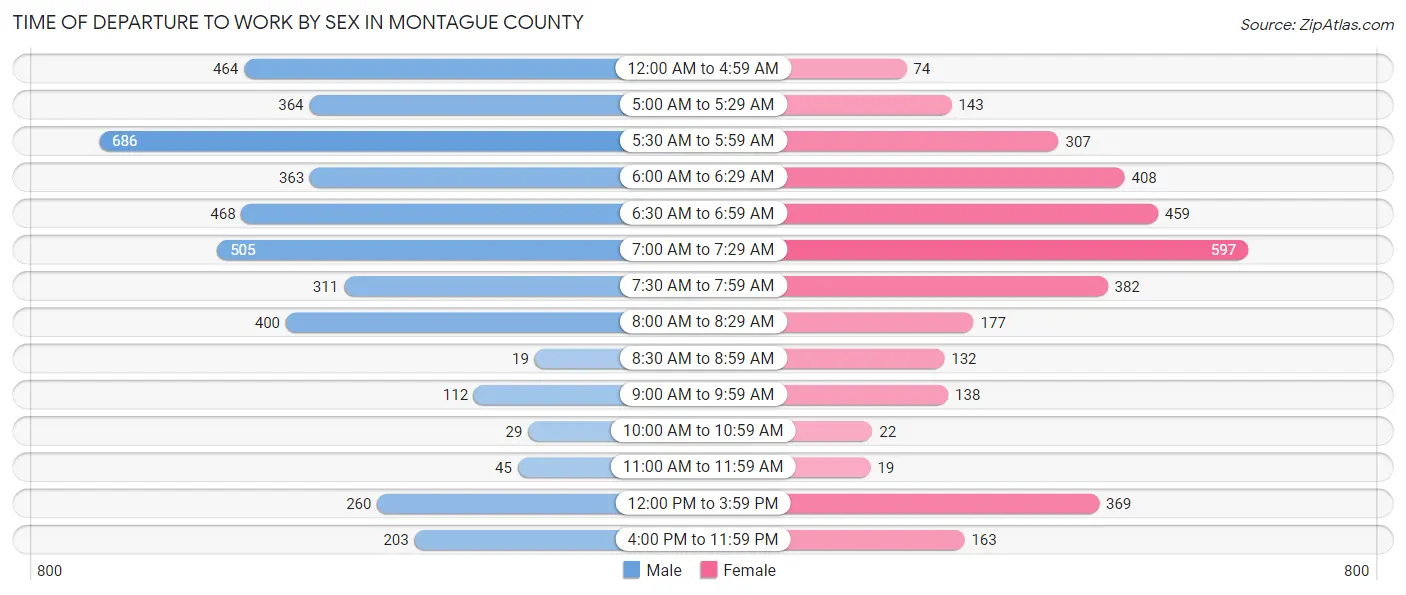
| Time of Departure | Male | Female |
| 12:00 AM to 4:59 AM | 464 (11.0%) | 74 (2.2%) |
| 5:00 AM to 5:29 AM | 364 (8.6%) | 143 (4.2%) |
| 5:30 AM to 5:59 AM | 686 (16.2%) | 307 (9.1%) |
| 6:00 AM to 6:29 AM | 363 (8.6%) | 408 (12.0%) |
| 6:30 AM to 6:59 AM | 468 (11.1%) | 459 (13.5%) |
| 7:00 AM to 7:29 AM | 505 (11.9%) | 597 (17.6%) |
| 7:30 AM to 7:59 AM | 311 (7.3%) | 382 (11.3%) |
| 8:00 AM to 8:29 AM | 400 (9.5%) | 177 (5.2%) |
| 8:30 AM to 8:59 AM | 19 (0.4%) | 132 (3.9%) |
| 9:00 AM to 9:59 AM | 112 (2.6%) | 138 (4.1%) |
| 10:00 AM to 10:59 AM | 29 (0.7%) | 22 (0.6%) |
| 11:00 AM to 11:59 AM | 45 (1.1%) | 19 (0.6%) |
| 12:00 PM to 3:59 PM | 260 (6.1%) | 369 (10.9%) |
| 4:00 PM to 11:59 PM | 203 (4.8%) | 163 (4.8%) |
| Total | 4,229 (100.0%) | 3,390 (100.0%) |
Housing Occupancy in Montague County
Occupancy by Ownership in Montague County
Of the total 7,907 dwellings in Montague County, owner-occupied units account for 6,301 (79.7%), while renter-occupied units make up 1,606 (20.3%).
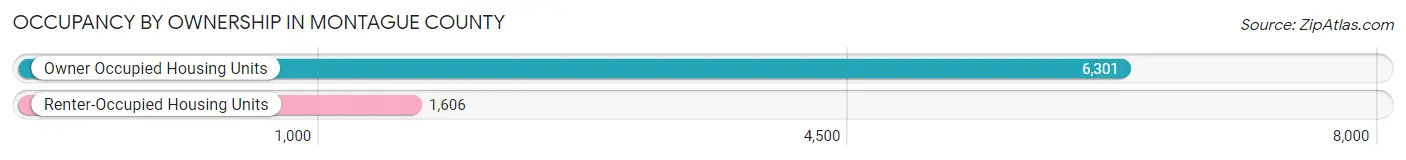
| Occupancy | # Housing Units | % Housing Units |
| Owner Occupied Housing Units | 6,301 | 79.7% |
| Renter-Occupied Housing Units | 1,606 | 20.3% |
| Total Occupied Housing Units | 7,907 | 100.0% |
Occupancy by Household Size in Montague County
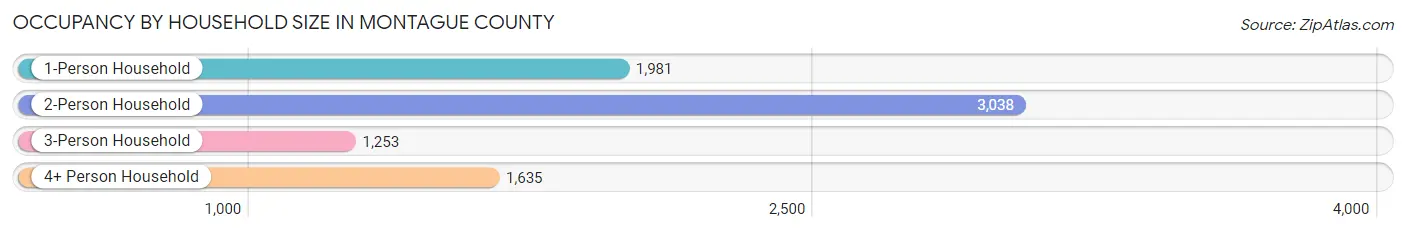
| Household Size | # Housing Units | % Housing Units |
| 1-Person Household | 1,981 | 25.1% |
| 2-Person Household | 3,038 | 38.4% |
| 3-Person Household | 1,253 | 15.9% |
| 4+ Person Household | 1,635 | 20.7% |
| Total Housing Units | 7,907 | 100.0% |
Occupancy by Ownership by Household Size in Montague County
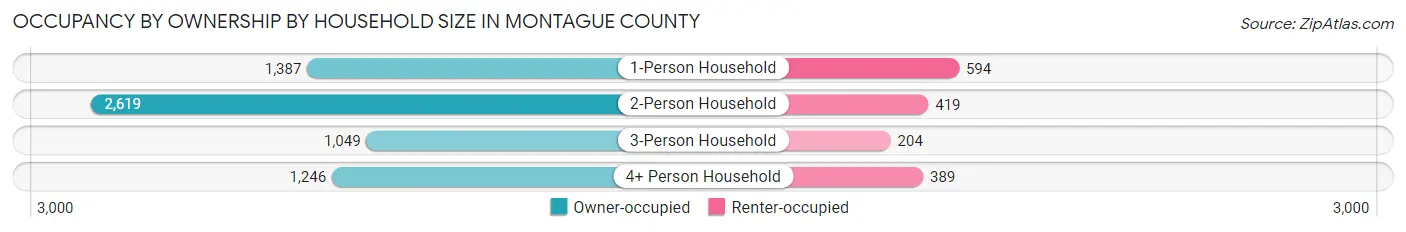
| Household Size | Owner-occupied | Renter-occupied |
| 1-Person Household | 1,387 (70.0%) | 594 (30.0%) |
| 2-Person Household | 2,619 (86.2%) | 419 (13.8%) |
| 3-Person Household | 1,049 (83.7%) | 204 (16.3%) |
| 4+ Person Household | 1,246 (76.2%) | 389 (23.8%) |
| Total Housing Units | 6,301 (79.7%) | 1,606 (20.3%) |
Occupancy by Educational Attainment in Montague County
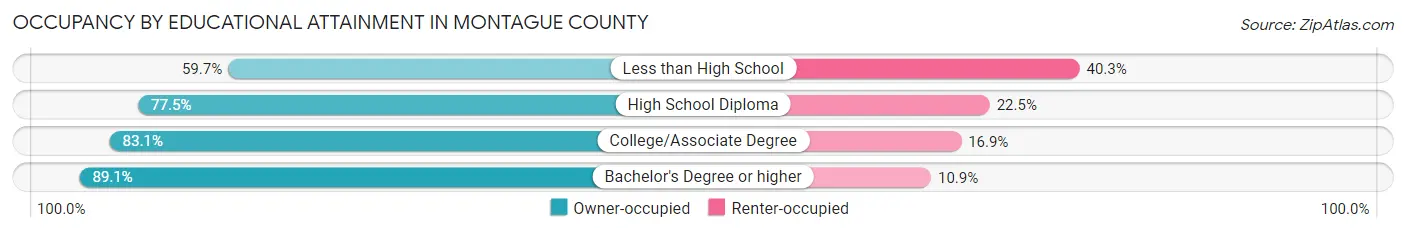
| Household Size | Owner-occupied | Renter-occupied |
| Less than High School | 444 (59.7%) | 300 (40.3%) |
| High School Diploma | 2,505 (77.5%) | 728 (22.5%) |
| College/Associate Degree | 2,091 (83.1%) | 424 (16.9%) |
| Bachelor's Degree or higher | 1,261 (89.1%) | 154 (10.9%) |
Occupancy by Age of Householder in Montague County
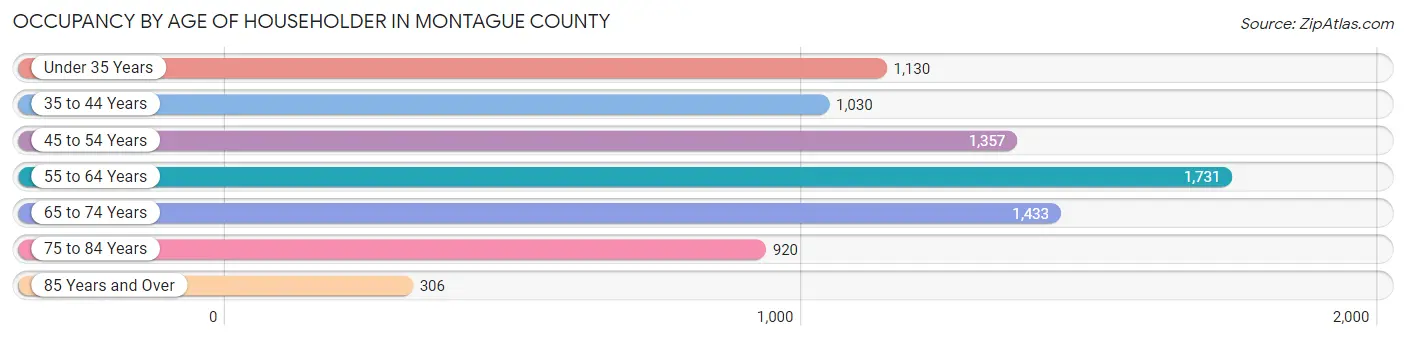
| Age Bracket | # Households | % Households |
| Under 35 Years | 1,130 | 14.3% |
| 35 to 44 Years | 1,030 | 13.0% |
| 45 to 54 Years | 1,357 | 17.2% |
| 55 to 64 Years | 1,731 | 21.9% |
| 65 to 74 Years | 1,433 | 18.1% |
| 75 to 84 Years | 920 | 11.6% |
| 85 Years and Over | 306 | 3.9% |
| Total | 7,907 | 100.0% |
Housing Finances in Montague County
Median Income by Occupancy in Montague County
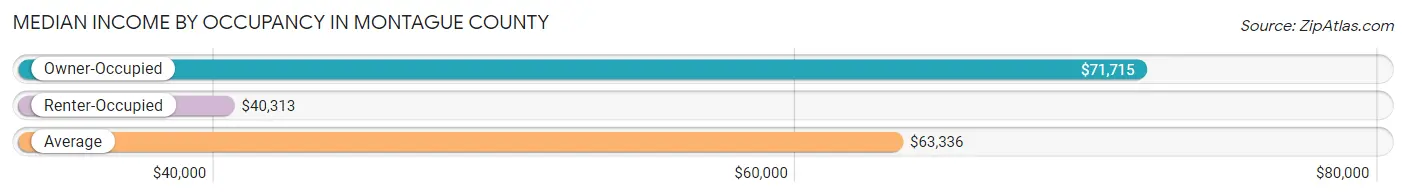
| Occupancy Type | # Households | Median Income |
| Owner-Occupied | 6,301 (79.7%) | $71,715 |
| Renter-Occupied | 1,606 (20.3%) | $40,313 |
| Average | 7,907 (100.0%) | $63,336 |
Occupancy by Householder Income Bracket in Montague County
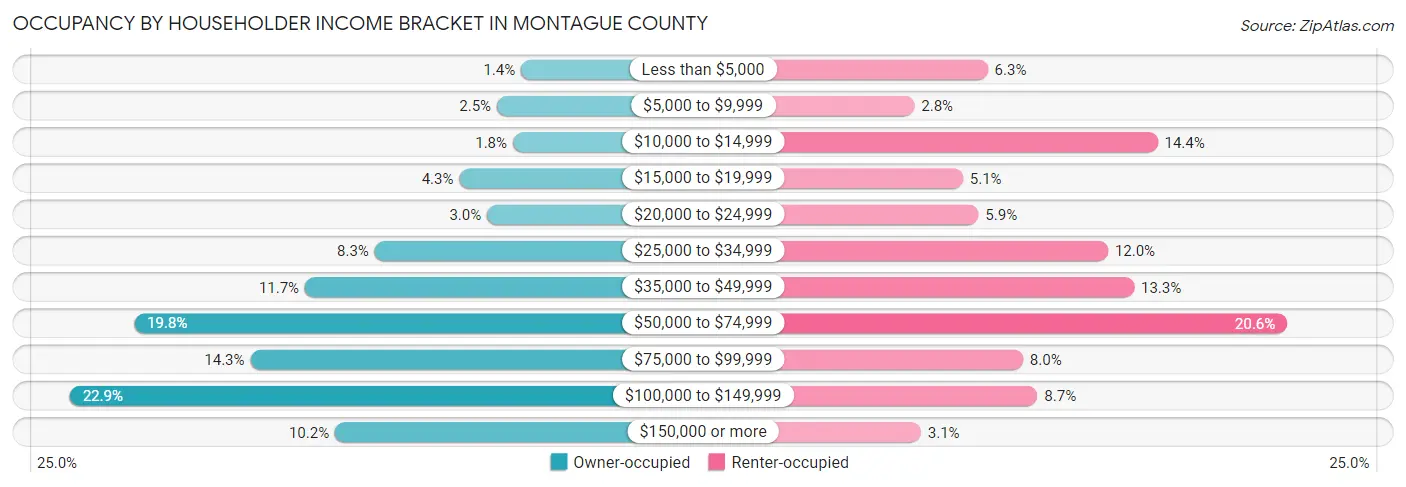
| Income Bracket | Owner-occupied | Renter-occupied |
| Less than $5,000 | 86 (1.4%) | 101 (6.3%) |
| $5,000 to $9,999 | 158 (2.5%) | 45 (2.8%) |
| $10,000 to $14,999 | 110 (1.8%) | 231 (14.4%) |
| $15,000 to $19,999 | 271 (4.3%) | 82 (5.1%) |
| $20,000 to $24,999 | 188 (3.0%) | 94 (5.9%) |
| $25,000 to $34,999 | 525 (8.3%) | 193 (12.0%) |
| $35,000 to $49,999 | 734 (11.7%) | 213 (13.3%) |
| $50,000 to $74,999 | 1,247 (19.8%) | 330 (20.5%) |
| $75,000 to $99,999 | 898 (14.2%) | 128 (8.0%) |
| $100,000 to $149,999 | 1,440 (22.9%) | 139 (8.7%) |
| $150,000 or more | 644 (10.2%) | 50 (3.1%) |
| Total | 6,301 (100.0%) | 1,606 (100.0%) |
Monthly Housing Cost Tiers in Montague County
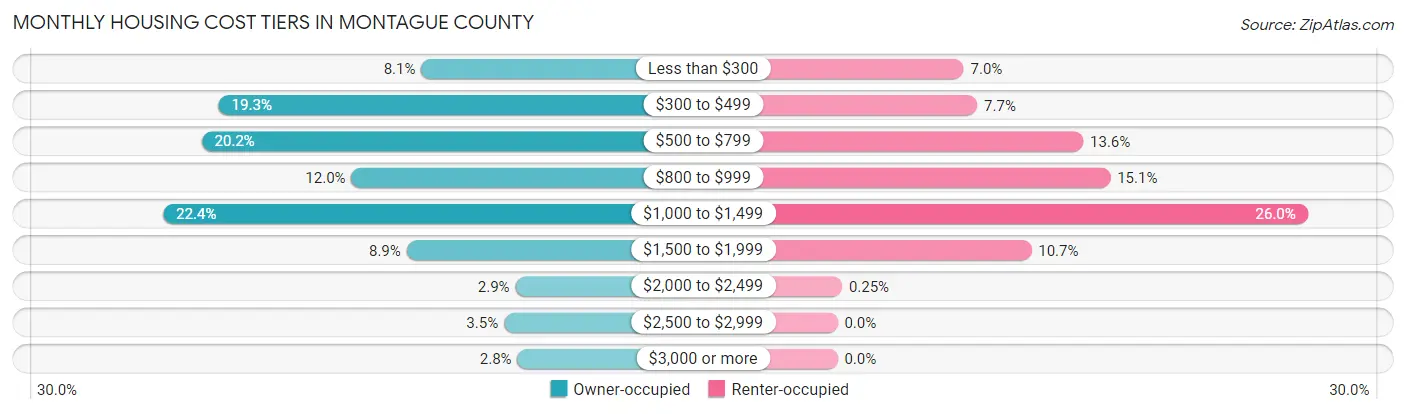
| Monthly Cost | Owner-occupied | Renter-occupied |
| Less than $300 | 510 (8.1%) | 112 (7.0%) |
| $300 to $499 | 1,215 (19.3%) | 124 (7.7%) |
| $500 to $799 | 1,275 (20.2%) | 218 (13.6%) |
| $800 to $999 | 753 (11.9%) | 242 (15.1%) |
| $1,000 to $1,499 | 1,408 (22.4%) | 417 (26.0%) |
| $1,500 to $1,999 | 561 (8.9%) | 172 (10.7%) |
| $2,000 to $2,499 | 182 (2.9%) | 4 (0.3%) |
| $2,500 to $2,999 | 222 (3.5%) | 0 (0.0%) |
| $3,000 or more | 175 (2.8%) | 0 (0.0%) |
| Total | 6,301 (100.0%) | 1,606 (100.0%) |
Physical Housing Characteristics in Montague County
Housing Structures in Montague County
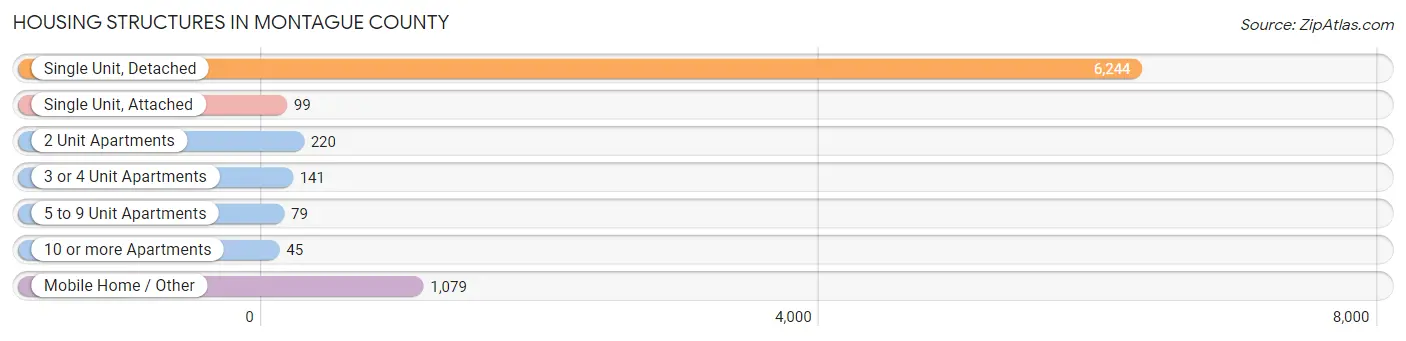
| Structure Type | # Housing Units | % Housing Units |
| Single Unit, Detached | 6,244 | 79.0% |
| Single Unit, Attached | 99 | 1.3% |
| 2 Unit Apartments | 220 | 2.8% |
| 3 or 4 Unit Apartments | 141 | 1.8% |
| 5 to 9 Unit Apartments | 79 | 1.0% |
| 10 or more Apartments | 45 | 0.6% |
| Mobile Home / Other | 1,079 | 13.7% |
| Total | 7,907 | 100.0% |
Housing Structures by Occupancy in Montague County
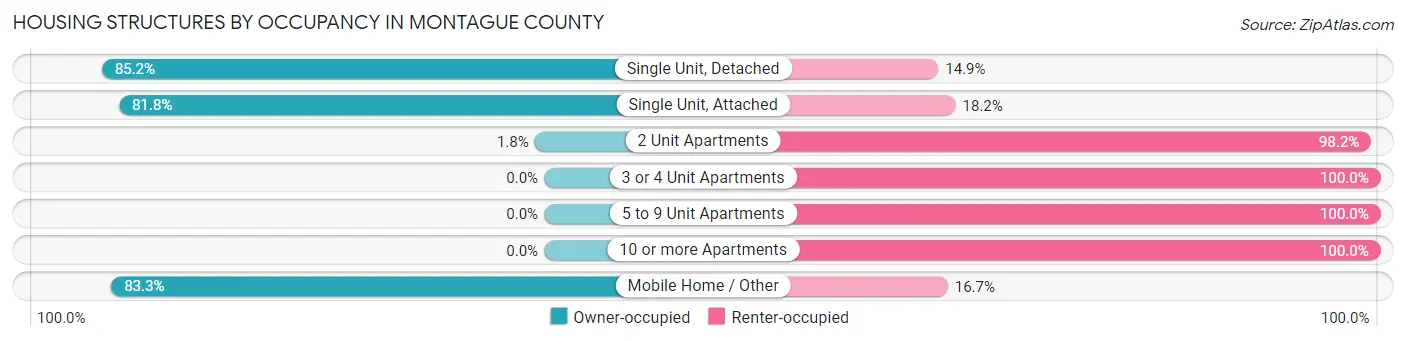
| Structure Type | Owner-occupied | Renter-occupied |
| Single Unit, Detached | 5,317 (85.2%) | 927 (14.8%) |
| Single Unit, Attached | 81 (81.8%) | 18 (18.2%) |
| 2 Unit Apartments | 4 (1.8%) | 216 (98.2%) |
| 3 or 4 Unit Apartments | 0 (0.0%) | 141 (100.0%) |
| 5 to 9 Unit Apartments | 0 (0.0%) | 79 (100.0%) |
| 10 or more Apartments | 0 (0.0%) | 45 (100.0%) |
| Mobile Home / Other | 899 (83.3%) | 180 (16.7%) |
| Total | 6,301 (79.7%) | 1,606 (20.3%) |
Housing Structures by Number of Rooms in Montague County
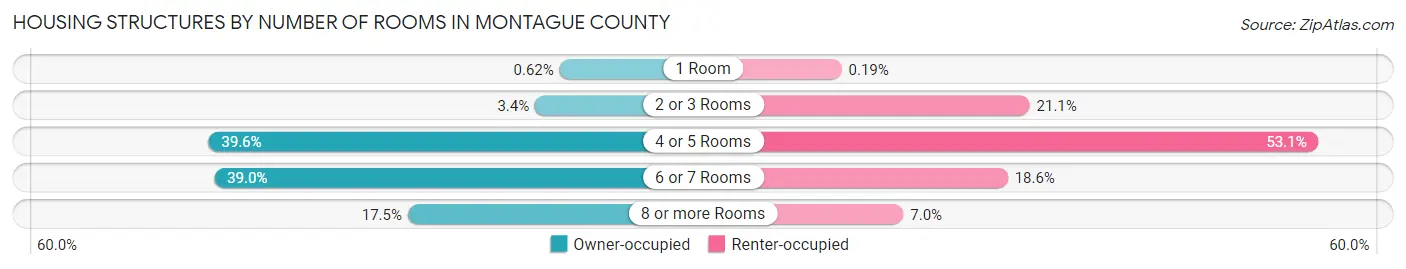
| Number of Rooms | Owner-occupied | Renter-occupied |
| 1 Room | 39 (0.6%) | 3 (0.2%) |
| 2 or 3 Rooms | 211 (3.4%) | 338 (21.0%) |
| 4 or 5 Rooms | 2,495 (39.6%) | 853 (53.1%) |
| 6 or 7 Rooms | 2,455 (39.0%) | 299 (18.6%) |
| 8 or more Rooms | 1,101 (17.5%) | 113 (7.0%) |
| Total | 6,301 (100.0%) | 1,606 (100.0%) |
Housing Structure by Heating Type in Montague County
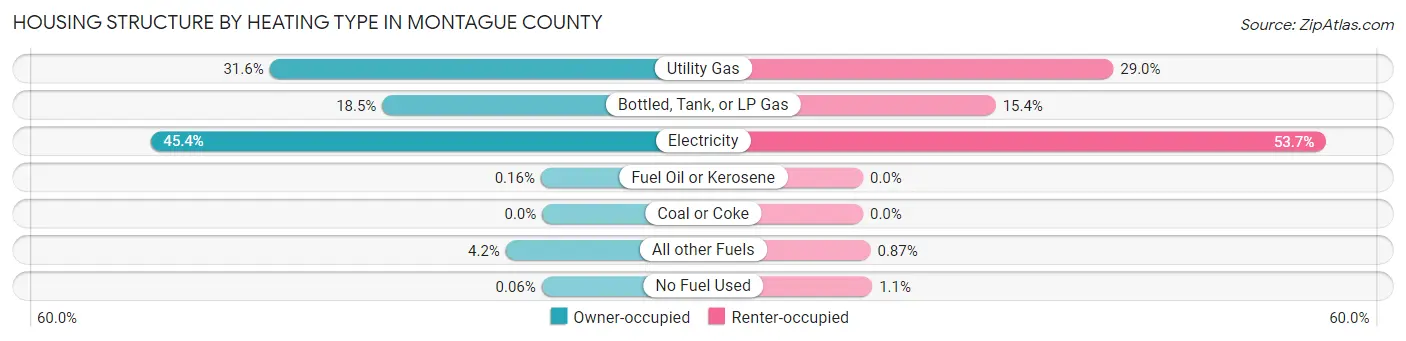
| Heating Type | Owner-occupied | Renter-occupied |
| Utility Gas | 1,992 (31.6%) | 466 (29.0%) |
| Bottled, Tank, or LP Gas | 1,168 (18.5%) | 247 (15.4%) |
| Electricity | 2,861 (45.4%) | 862 (53.7%) |
| Fuel Oil or Kerosene | 10 (0.2%) | 0 (0.0%) |
| Coal or Coke | 0 (0.0%) | 0 (0.0%) |
| All other Fuels | 266 (4.2%) | 14 (0.9%) |
| No Fuel Used | 4 (0.1%) | 17 (1.1%) |
| Total | 6,301 (100.0%) | 1,606 (100.0%) |
Household Vehicle Usage in Montague County
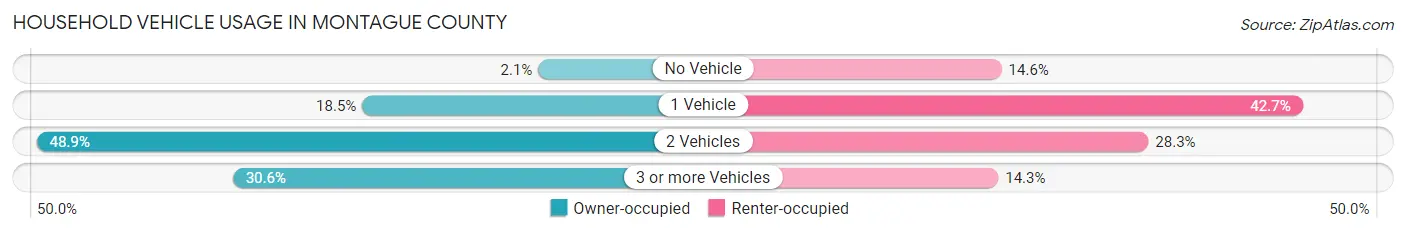
| Vehicles per Household | Owner-occupied | Renter-occupied |
| No Vehicle | 130 (2.1%) | 235 (14.6%) |
| 1 Vehicle | 1,165 (18.5%) | 686 (42.7%) |
| 2 Vehicles | 3,080 (48.9%) | 455 (28.3%) |
| 3 or more Vehicles | 1,926 (30.6%) | 230 (14.3%) |
| Total | 6,301 (100.0%) | 1,606 (100.0%) |
Real Estate & Mortgages in Montague County
Real Estate and Mortgage Overview in Montague County
| Characteristic | Without Mortgage | With Mortgage |
| Housing Units | 3,738 | 2,563 |
| Median Property Value | $153,800 | $193,600 |
| Median Household Income | $57,455 | $235 |
| Monthly Housing Costs | $533 | $175 |
| Real Estate Taxes | $1,528 | $59 |
Property Value by Mortgage Status in Montague County
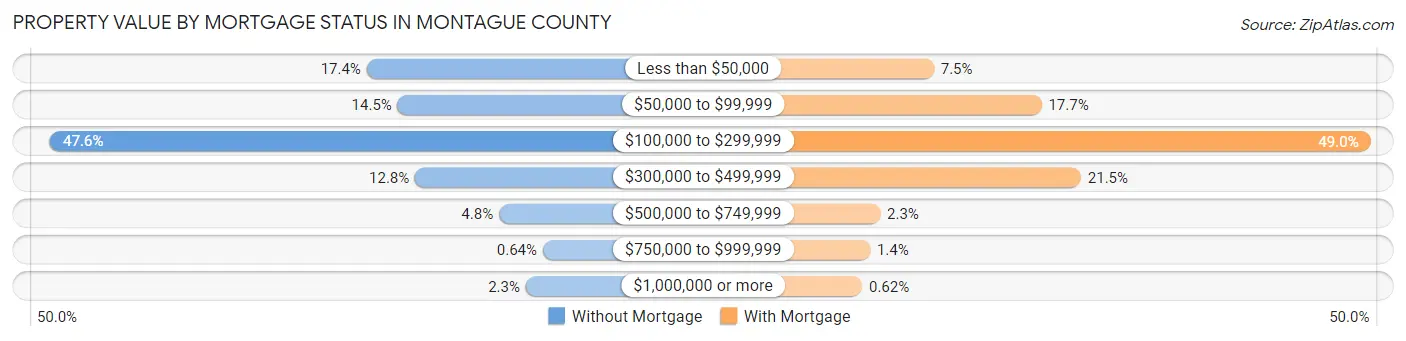
| Property Value | Without Mortgage | With Mortgage |
| Less than $50,000 | 651 (17.4%) | 191 (7.4%) |
| $50,000 to $99,999 | 541 (14.5%) | 454 (17.7%) |
| $100,000 to $299,999 | 1,778 (47.6%) | 1,257 (49.0%) |
| $300,000 to $499,999 | 479 (12.8%) | 550 (21.5%) |
| $500,000 to $749,999 | 180 (4.8%) | 60 (2.3%) |
| $750,000 to $999,999 | 24 (0.6%) | 35 (1.4%) |
| $1,000,000 or more | 85 (2.3%) | 16 (0.6%) |
| Total | 3,738 (100.0%) | 2,563 (100.0%) |
Household Income by Mortgage Status in Montague County
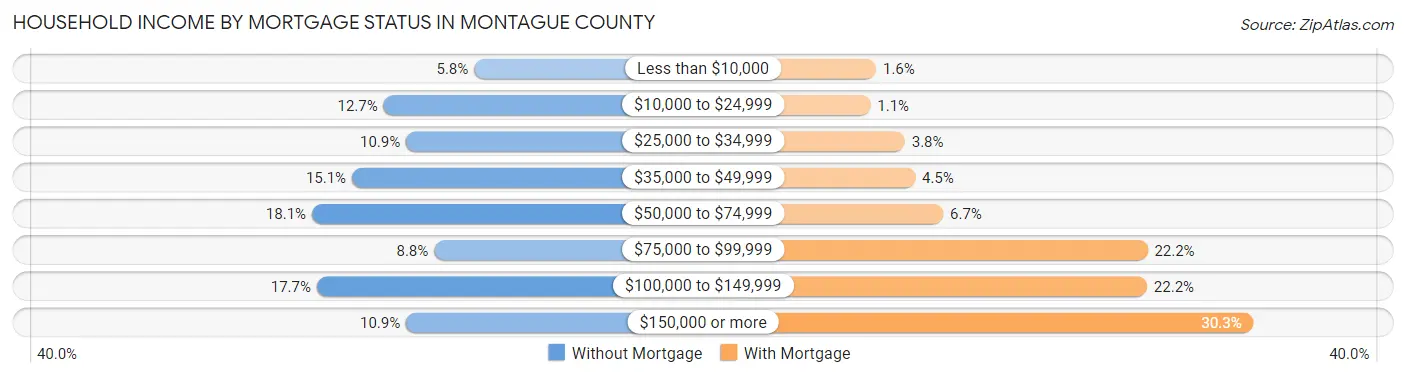
| Household Income | Without Mortgage | With Mortgage |
| Less than $10,000 | 215 (5.8%) | 40 (1.6%) |
| $10,000 to $24,999 | 473 (12.7%) | 29 (1.1%) |
| $25,000 to $34,999 | 409 (10.9%) | 96 (3.7%) |
| $35,000 to $49,999 | 563 (15.1%) | 116 (4.5%) |
| $50,000 to $74,999 | 677 (18.1%) | 171 (6.7%) |
| $75,000 to $99,999 | 329 (8.8%) | 570 (22.2%) |
| $100,000 to $149,999 | 663 (17.7%) | 569 (22.2%) |
| $150,000 or more | 409 (10.9%) | 777 (30.3%) |
| Total | 3,738 (100.0%) | 2,563 (100.0%) |
Property Value to Household Income Ratio in Montague County
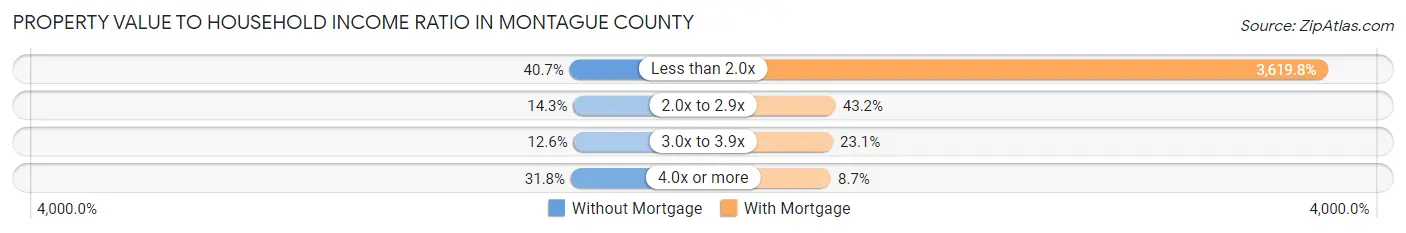
| Value-to-Income Ratio | Without Mortgage | With Mortgage |
| Less than 2.0x | 1,523 (40.7%) | 92,775 (3,619.8%) |
| 2.0x to 2.9x | 534 (14.3%) | 1,108 (43.2%) |
| 3.0x to 3.9x | 470 (12.6%) | 593 (23.1%) |
| 4.0x or more | 1,188 (31.8%) | 223 (8.7%) |
| Total | 3,738 (100.0%) | 2,563 (100.0%) |
Real Estate Taxes by Mortgage Status in Montague County
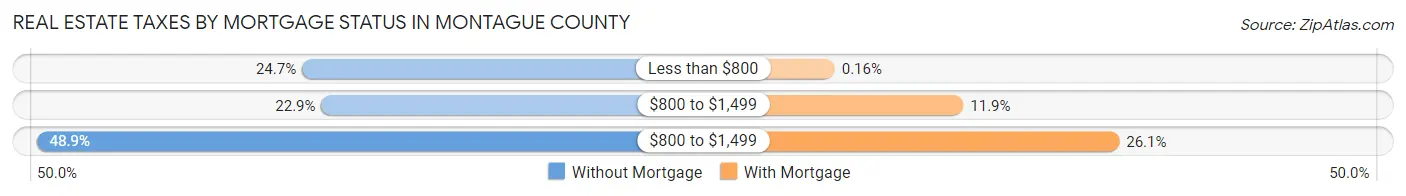
| Property Taxes | Without Mortgage | With Mortgage |
| Less than $800 | 922 (24.7%) | 4 (0.2%) |
| $800 to $1,499 | 856 (22.9%) | 305 (11.9%) |
| $800 to $1,499 | 1,828 (48.9%) | 670 (26.1%) |
| Total | 3,738 (100.0%) | 2,563 (100.0%) |
Health & Disability in Montague County
Health Insurance Coverage by Age in Montague County
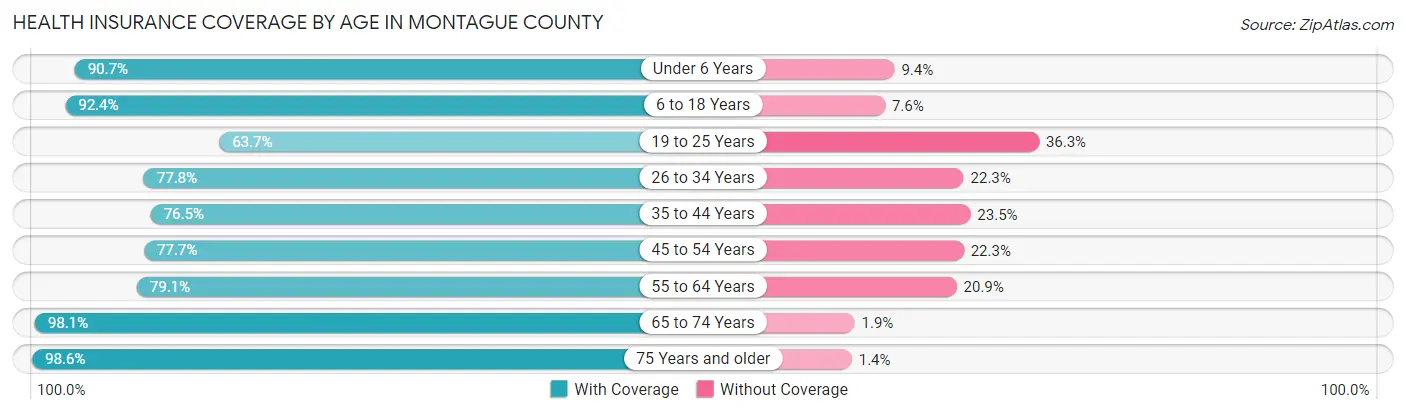
| Age Bracket | With Coverage | Without Coverage |
| Under 6 Years | 1,095 (90.6%) | 113 (9.3%) |
| 6 to 18 Years | 3,273 (92.4%) | 269 (7.6%) |
| 19 to 25 Years | 979 (63.7%) | 558 (36.3%) |
| 26 to 34 Years | 1,405 (77.7%) | 402 (22.3%) |
| 35 to 44 Years | 1,675 (76.5%) | 515 (23.5%) |
| 45 to 54 Years | 1,944 (77.7%) | 557 (22.3%) |
| 55 to 64 Years | 2,322 (79.1%) | 615 (20.9%) |
| 65 to 74 Years | 2,345 (98.1%) | 46 (1.9%) |
| 75 Years and older | 1,763 (98.6%) | 25 (1.4%) |
| Total | 16,801 (84.4%) | 3,100 (15.6%) |
Health Insurance Coverage by Citizenship Status in Montague County
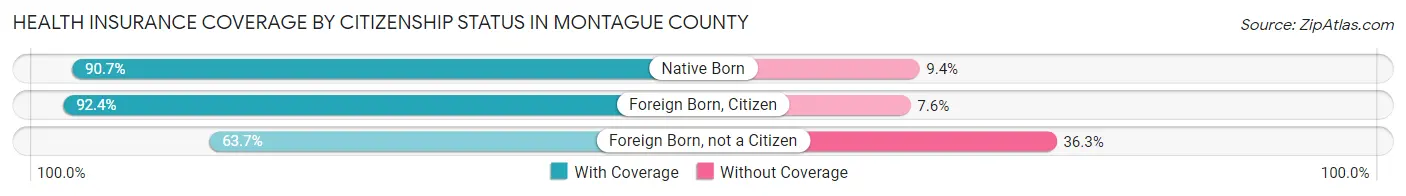
| Citizenship Status | With Coverage | Without Coverage |
| Native Born | 1,095 (90.6%) | 113 (9.3%) |
| Foreign Born, Citizen | 3,273 (92.4%) | 269 (7.6%) |
| Foreign Born, not a Citizen | 979 (63.7%) | 558 (36.3%) |
Health Insurance Coverage by Household Income in Montague County
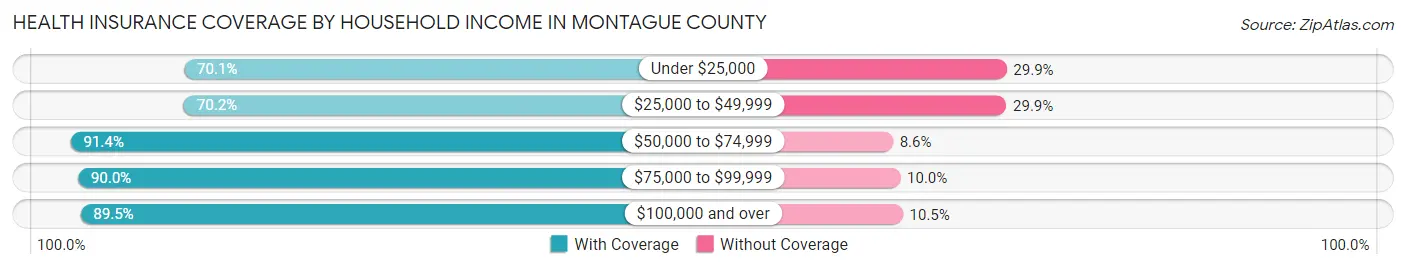
| Household Income | With Coverage | Without Coverage |
| Under $25,000 | 1,639 (70.1%) | 699 (29.9%) |
| $25,000 to $49,999 | 2,413 (70.2%) | 1,027 (29.8%) |
| $50,000 to $74,999 | 4,023 (91.4%) | 379 (8.6%) |
| $75,000 to $99,999 | 2,731 (90.0%) | 303 (10.0%) |
| $100,000 and over | 5,923 (89.5%) | 692 (10.5%) |
Public vs Private Health Insurance Coverage by Age in Montague County
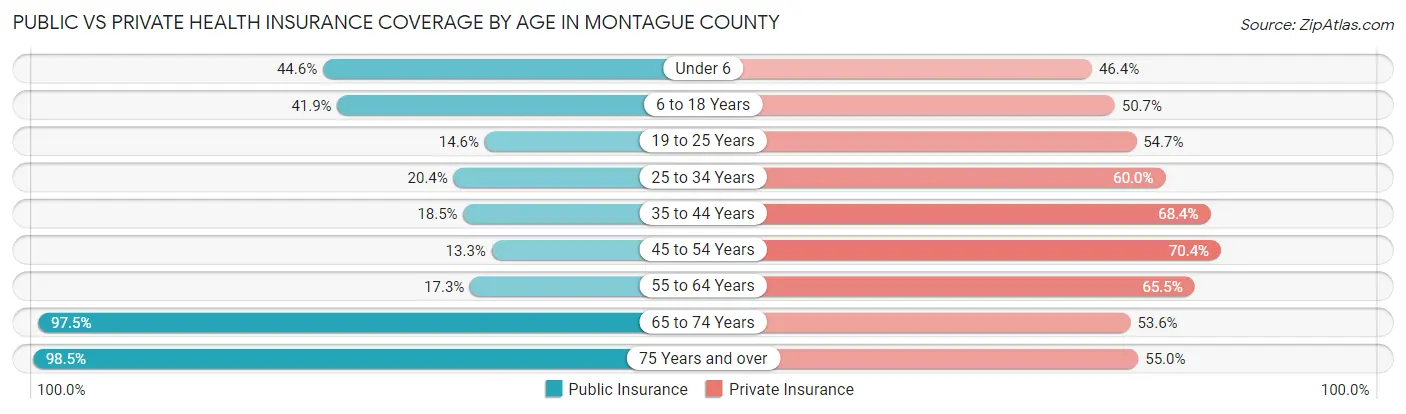
| Age Bracket | Public Insurance | Private Insurance |
| Under 6 | 539 (44.6%) | 561 (46.4%) |
| 6 to 18 Years | 1,485 (41.9%) | 1,795 (50.7%) |
| 19 to 25 Years | 224 (14.6%) | 840 (54.6%) |
| 25 to 34 Years | 368 (20.4%) | 1,085 (60.0%) |
| 35 to 44 Years | 406 (18.5%) | 1,498 (68.4%) |
| 45 to 54 Years | 333 (13.3%) | 1,760 (70.4%) |
| 55 to 64 Years | 508 (17.3%) | 1,923 (65.5%) |
| 65 to 74 Years | 2,331 (97.5%) | 1,281 (53.6%) |
| 75 Years and over | 1,761 (98.5%) | 984 (55.0%) |
| Total | 7,955 (40.0%) | 11,727 (58.9%) |
Disability Status by Sex by Age in Montague County
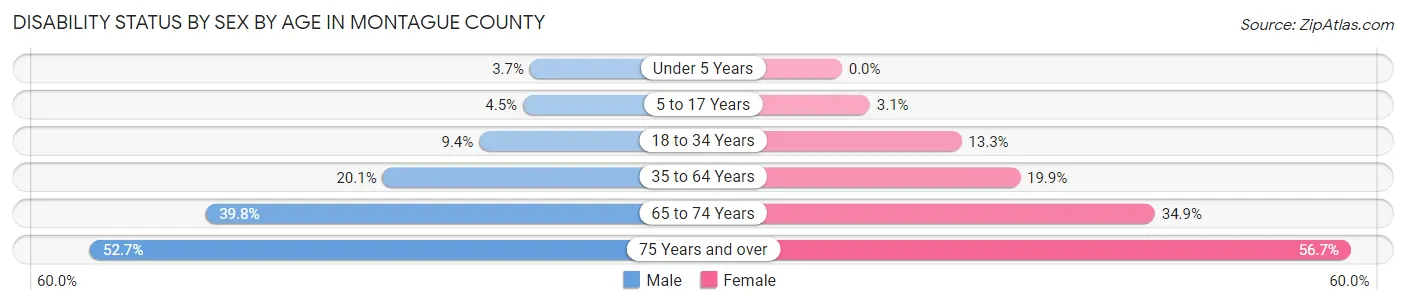
| Age Bracket | Male | Female |
| Under 5 Years | 18 (3.7%) | 0 (0.0%) |
| 5 to 17 Years | 78 (4.5%) | 56 (3.1%) |
| 18 to 34 Years | 160 (9.4%) | 241 (13.3%) |
| 35 to 64 Years | 763 (20.1%) | 762 (19.9%) |
| 65 to 74 Years | 457 (39.8%) | 433 (34.9%) |
| 75 Years and over | 429 (52.7%) | 552 (56.7%) |
Disability Class by Sex by Age in Montague County
Disability Class: Hearing Difficulty
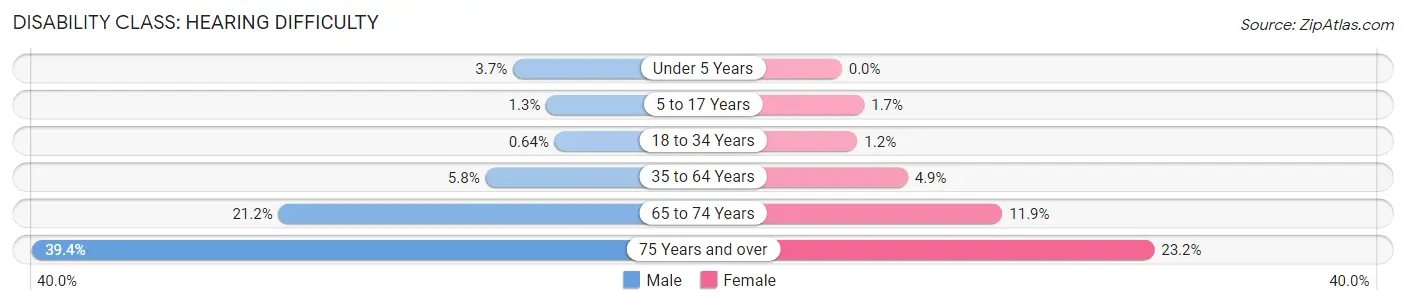
| Age Bracket | Male | Female |
| Under 5 Years | 18 (3.7%) | 0 (0.0%) |
| 5 to 17 Years | 22 (1.3%) | 30 (1.7%) |
| 18 to 34 Years | 11 (0.6%) | 21 (1.2%) |
| 35 to 64 Years | 219 (5.8%) | 188 (4.9%) |
| 65 to 74 Years | 243 (21.1%) | 148 (11.9%) |
| 75 Years and over | 321 (39.4%) | 226 (23.2%) |
Disability Class: Vision Difficulty
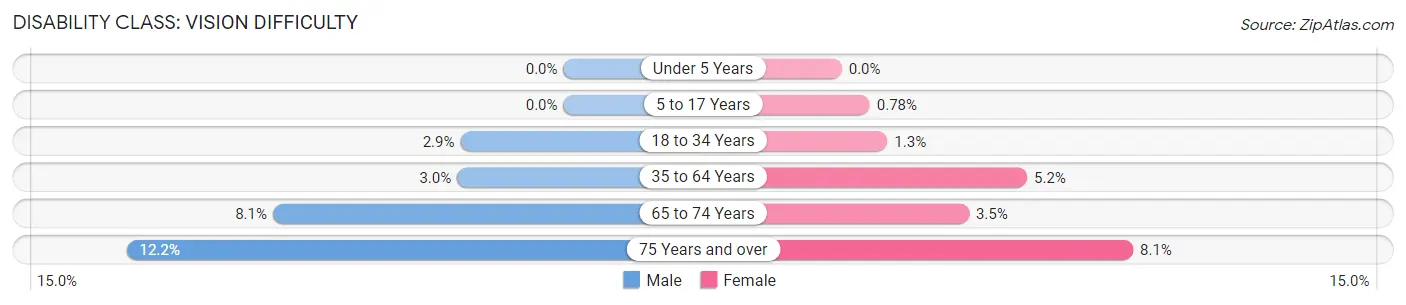
| Age Bracket | Male | Female |
| Under 5 Years | 0 (0.0%) | 0 (0.0%) |
| 5 to 17 Years | 0 (0.0%) | 14 (0.8%) |
| 18 to 34 Years | 49 (2.9%) | 23 (1.3%) |
| 35 to 64 Years | 112 (3.0%) | 198 (5.2%) |
| 65 to 74 Years | 93 (8.1%) | 44 (3.5%) |
| 75 Years and over | 99 (12.2%) | 79 (8.1%) |
Disability Class: Cognitive Difficulty
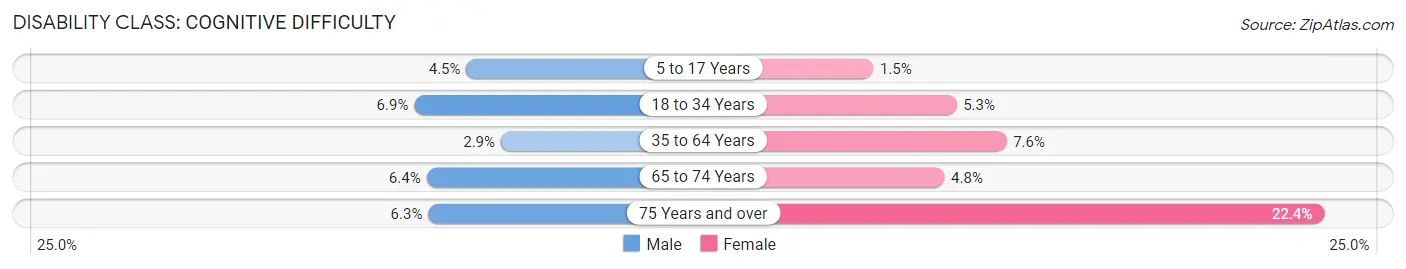
| Age Bracket | Male | Female |
| 5 to 17 Years | 78 (4.5%) | 26 (1.5%) |
| 18 to 34 Years | 118 (6.9%) | 96 (5.3%) |
| 35 to 64 Years | 110 (2.9%) | 293 (7.6%) |
| 65 to 74 Years | 73 (6.4%) | 59 (4.8%) |
| 75 Years and over | 51 (6.3%) | 218 (22.4%) |
Disability Class: Ambulatory Difficulty
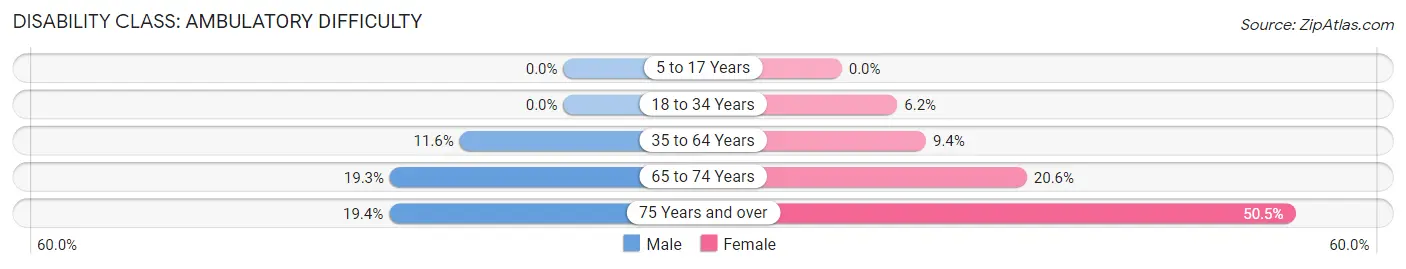
| Age Bracket | Male | Female |
| 5 to 17 Years | 0 (0.0%) | 0 (0.0%) |
| 18 to 34 Years | 0 (0.0%) | 112 (6.2%) |
| 35 to 64 Years | 438 (11.6%) | 360 (9.4%) |
| 65 to 74 Years | 222 (19.3%) | 256 (20.6%) |
| 75 Years and over | 158 (19.4%) | 492 (50.5%) |
Disability Class: Self-Care Difficulty
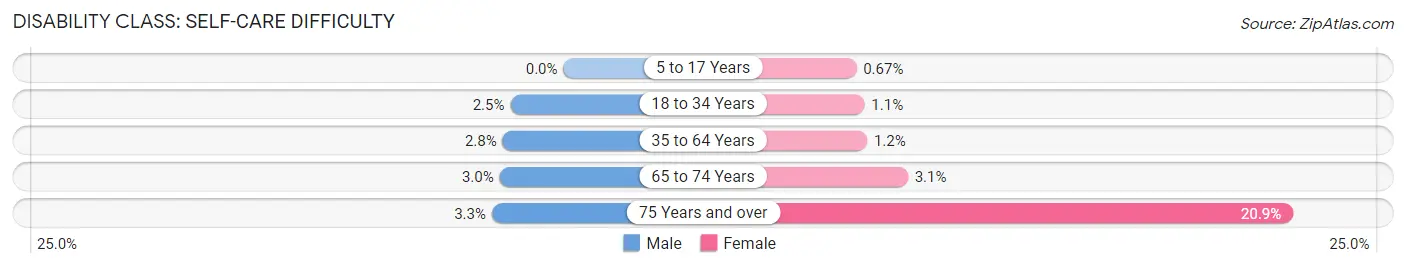
| Age Bracket | Male | Female |
| 5 to 17 Years | 0 (0.0%) | 12 (0.7%) |
| 18 to 34 Years | 42 (2.5%) | 19 (1.1%) |
| 35 to 64 Years | 107 (2.8%) | 45 (1.2%) |
| 65 to 74 Years | 34 (3.0%) | 38 (3.1%) |
| 75 Years and over | 27 (3.3%) | 204 (20.9%) |
Technology Access in Montague County
Computing Device Access in Montague County
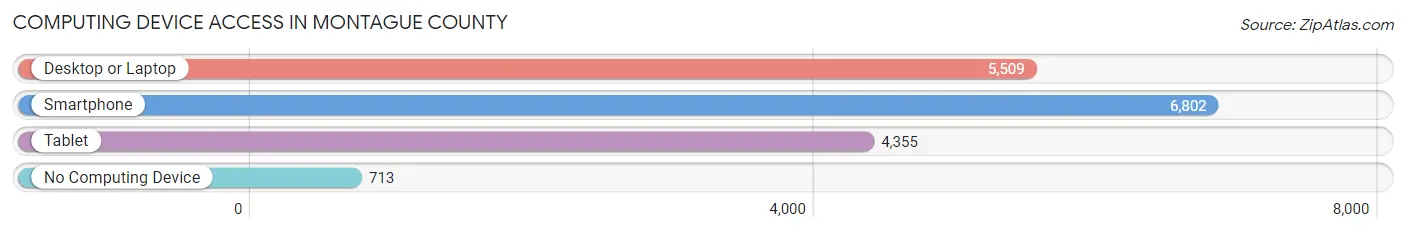
| Device Type | # Households | % Households |
| Desktop or Laptop | 5,509 | 69.7% |
| Smartphone | 6,802 | 86.0% |
| Tablet | 4,355 | 55.1% |
| No Computing Device | 713 | 9.0% |
| Total | 7,907 | 100.0% |
Internet Access in Montague County
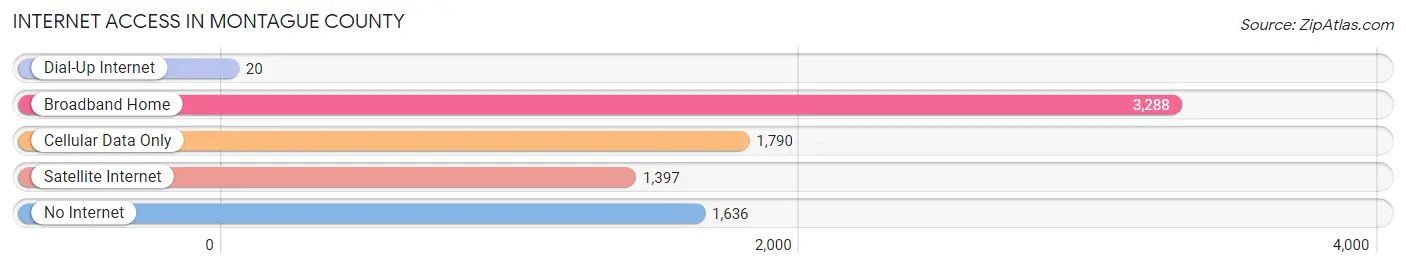
| Internet Type | # Households | % Households |
| Dial-Up Internet | 20 | 0.3% |
| Broadband Home | 3,288 | 41.6% |
| Cellular Data Only | 1,790 | 22.6% |
| Satellite Internet | 1,397 | 17.7% |
| No Internet | 1,636 | 20.7% |
| Total | 7,907 | 100.0% |
Montague County Summary
Montague County is located in the north-central region of Texas, and is part of the Texoma region. It is bordered by Cooke County to the north, Clay County to the east, Jack County to the south, and Wise County to the west. The county seat is Montague, and the largest city is Bowie. The county was established in 1857 and named for Daniel Montague, a surveyor and soldier in the Texas Revolution.
Geography
Montague County covers an area of 945 square miles, making it the second-largest county in Texas. The terrain is mostly flat, with rolling hills in the western part of the county. The county is drained by the Red River, which forms its northern border. The county is also home to several small lakes, including Lake Nocona, Lake Amon G. Carter, and Lake Monticello.
The climate of Montague County is semi-arid, with hot summers and mild winters. The average annual temperature is 64°F, and the average annual precipitation is 33 inches.
Demographics
As of the 2010 census, the population of Montague County was 19,719. The population density was 21 people per square mile. The racial makeup of the county was 87.3% White, 5.2% Black or African American, 0.7% Native American, 0.4% Asian, 4.7% from other races, and 1.6% from two or more races. Hispanic or Latino of any race were 11.2% of the population.
The median income for a household in the county was $37,945, and the median income for a family was $45,945. The per capita income for the county was $19,945. About 13.2% of families and 17.2% of the population were below the poverty line, including 22.2% of those under age 18 and 11.2% of those age 65 or over.
Economy
Agriculture is the main economic activity in Montague County. The county is home to several large farms, and the main crops are cotton, wheat, and hay. Livestock production is also important, with cattle, sheep, and goats being the main animals raised.
The county is also home to several manufacturing companies, including a steel mill, a paper mill, and a plastics plant. The county is also home to several oil and gas fields, and the oil and gas industry is a major contributor to the local economy.
The county is served by two airports, Montague County Airport and Bowie Municipal Airport. The county is also served by several highways, including Interstate 35, US Highway 82, and US Highway 287.
Conclusion
Montague County is a rural county located in the north-central region of Texas. It is home to a diverse population and a strong agricultural economy. The county is also home to several manufacturing companies and oil and gas fields, which contribute to the local economy. The county is served by two airports and several highways, making it easily accessible to the rest of the state.
Common Questions
What is Per Capita Income in Montague County?
Per Capita income in Montague County is $31,125.
What is the Median Family Income in Montague County?
Median Family Income in Montague County is $79,818.
What is the Median Household income in Montague County?
Median Household Income in Montague County is $63,336.
What is Income or Wage Gap in Montague County?
Income or Wage Gap in Montague County is 49.2%.
Women in Montague County earn 50.8 cents for every dollar earned by a man.
What is Family Income Deficit in Montague County?
Family Income Deficit in Montague County is $13,028.
Families that are below poverty line in Montague County earn $13,028 less on average than the poverty threshold level.
What is Inequality or Gini Index in Montague County?
Inequality or Gini Index in Montague County is 0.42.
What is the Total Population of Montague County?
Total Population of Montague County is 20,197.
What is the Total Male Population of Montague County?
Total Male Population of Montague County is 9,818.
What is the Total Female Population of Montague County?
Total Female Population of Montague County is 10,379.
What is the Ratio of Males per 100 Females in Montague County?
There are 94.59 Males per 100 Females in Montague County.
What is the Ratio of Females per 100 Males in Montague County?
There are 105.71 Females per 100 Males in Montague County.
What is the Median Population Age in Montague County?
Median Population Age in Montague County is 44.1 Years.
What is the Average Family Size in Montague County
Average Family Size in Montague County is 3.0 People.
What is the Average Household Size in Montague County
Average Household Size in Montague County is 2.5 People.
How Large is the Labor Force in Montague County?
There are 8,742 People in the Labor Forcein in Montague County.
What is the Percentage of People in the Labor Force in Montague County?
54.4% of People are in the Labor Force in Montague County.
What is the Unemployment Rate in Montague County?
Unemployment Rate in Montague County is 5.1%.