Mills County, TX Map & Demographics
Mills County Map
Mills County Overview
$37,010
PER CAPITA INCOME
$77,861
AVG FAMILY INCOME
$59,315
AVG HOUSEHOLD INCOME
1.5%
WAGE / INCOME GAP [ % ]
98.5¢/ $1
WAGE / INCOME GAP [ $ ]
0.47
INEQUALITY / GINI INDEX
4,501
TOTAL POPULATION
2,279
MALE POPULATION
2,222
FEMALE POPULATION
102.57
MALES / 100 FEMALES
97.50
FEMALES / 100 MALES
50.8
MEDIAN AGE
2.9
AVG FAMILY SIZE
2.4
AVG HOUSEHOLD SIZE
2,081
LABOR FORCE [ PEOPLE ]
54.7%
PERCENT IN LABOR FORCE
2.3%
UNEMPLOYMENT RATE
Mills County Area Codes
Income in Mills County
Income Overview in Mills County
Per Capita Income in Mills County is $37,010, while median incomes of families and households are $77,861 and $59,315 respectively.
| Characteristic | Number | Measure |
| Per Capita Income | 4,501 | $37,010 |
| Median Family Income | 1,285 | $77,861 |
| Mean Family Income | 1,285 | $107,244 |
| Median Household Income | 1,833 | $59,315 |
| Mean Household Income | 1,833 | $86,246 |
| Income Deficit | 1,285 | $0 |
| Wage / Income Gap (%) | 4,501 | 1.49% |
| Wage / Income Gap ($) | 4,501 | 98.51¢ per $1 |
| Gini / Inequality Index | 4,501 | 0.47 |
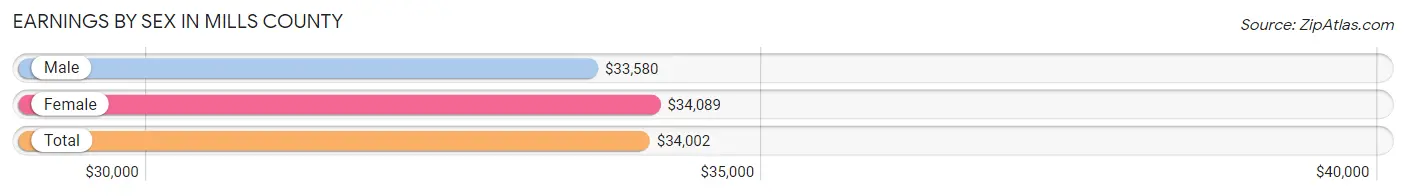
Earnings by Sex in Mills County
Average Earnings in Mills County are $34,002, $33,580 for men and $34,089 for women, a difference of 1.5%.
| Sex | Number | Average Earnings |
| Male | 1,175 (54.3%) | $33,580 |
| Female | 988 (45.7%) | $34,089 |
| Total | 2,163 (100.0%) | $34,002 |
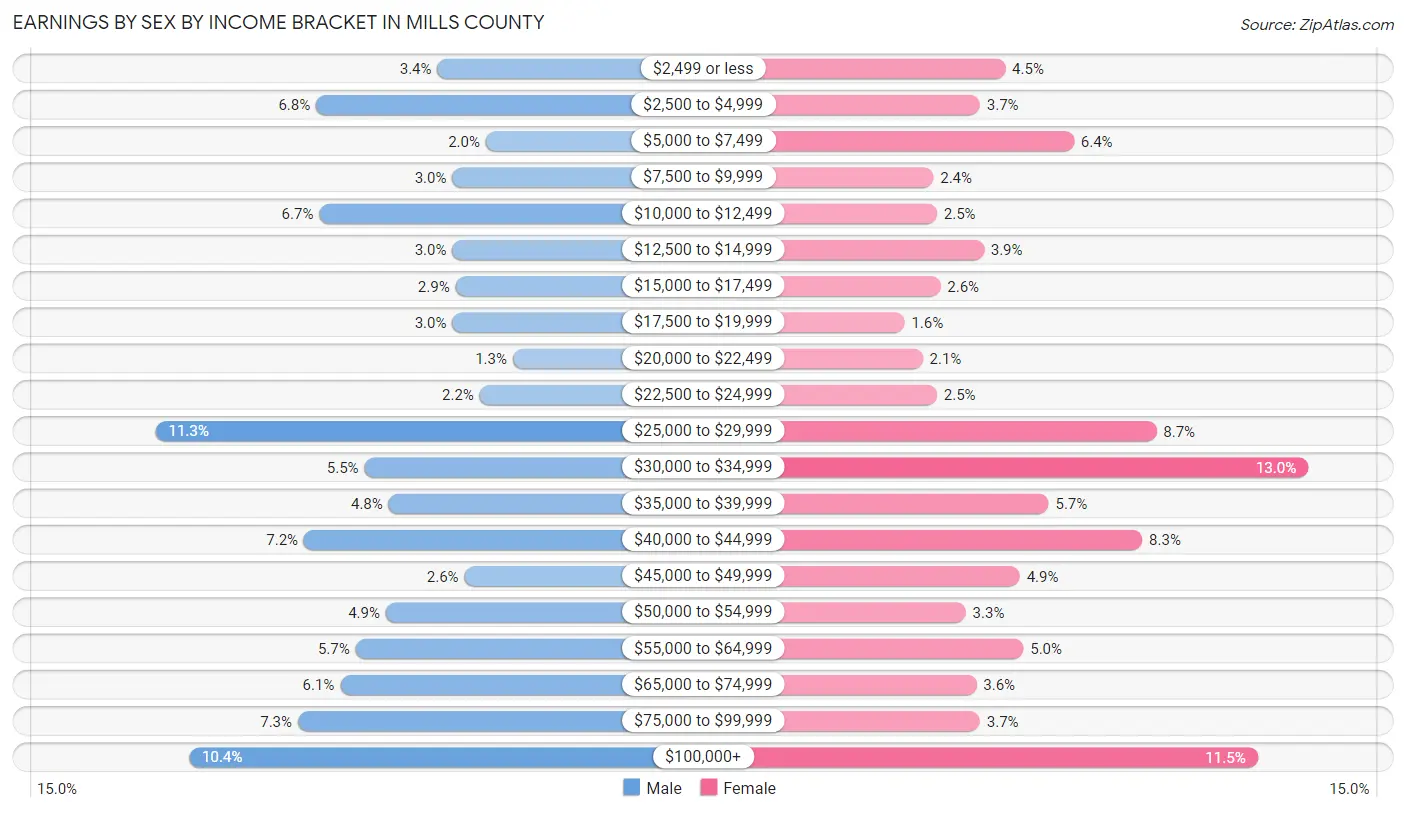
Earnings by Sex by Income Bracket in Mills County
The most common earnings brackets in Mills County are $25,000 to $29,999 for men (133 | 11.3%) and $30,000 to $34,999 for women (128 | 13.0%).
| Income | Male | Female |
| $2,499 or less | 40 (3.4%) | 44 (4.4%) |
| $2,500 to $4,999 | 80 (6.8%) | 37 (3.7%) |
| $5,000 to $7,499 | 24 (2.0%) | 63 (6.4%) |
| $7,500 to $9,999 | 35 (3.0%) | 24 (2.4%) |
| $10,000 to $12,499 | 79 (6.7%) | 25 (2.5%) |
| $12,500 to $14,999 | 35 (3.0%) | 38 (3.8%) |
| $15,000 to $17,499 | 34 (2.9%) | 26 (2.6%) |
| $17,500 to $19,999 | 35 (3.0%) | 16 (1.6%) |
| $20,000 to $22,499 | 15 (1.3%) | 21 (2.1%) |
| $22,500 to $24,999 | 26 (2.2%) | 25 (2.5%) |
| $25,000 to $29,999 | 133 (11.3%) | 86 (8.7%) |
| $30,000 to $34,999 | 64 (5.4%) | 128 (13.0%) |
| $35,000 to $39,999 | 56 (4.8%) | 56 (5.7%) |
| $40,000 to $44,999 | 84 (7.1%) | 82 (8.3%) |
| $45,000 to $49,999 | 31 (2.6%) | 48 (4.9%) |
| $50,000 to $54,999 | 57 (4.9%) | 33 (3.3%) |
| $55,000 to $64,999 | 67 (5.7%) | 49 (5.0%) |
| $65,000 to $74,999 | 72 (6.1%) | 36 (3.6%) |
| $75,000 to $99,999 | 86 (7.3%) | 37 (3.7%) |
| $100,000+ | 122 (10.4%) | 114 (11.5%) |
| Total | 1,175 (100.0%) | 988 (100.0%) |
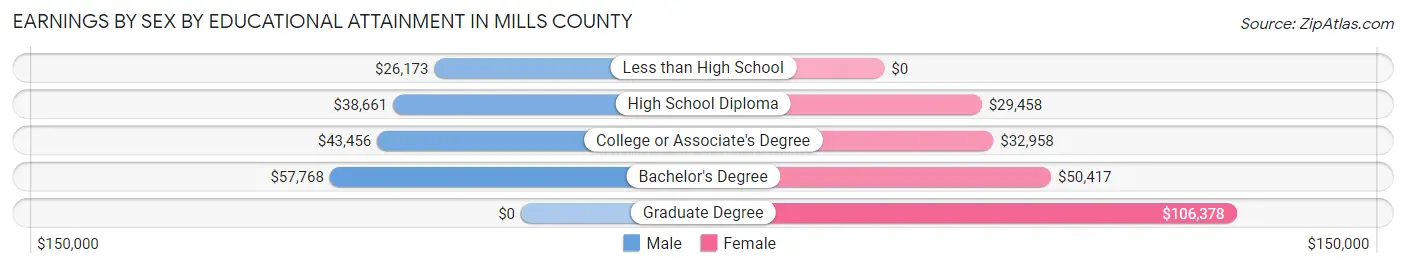
Earnings by Sex by Educational Attainment in Mills County
Average earnings in Mills County are $37,204 for men and $34,938 for women, a difference of 6.1%. Men with an educational attainment of bachelor's degree enjoy the highest average annual earnings of $57,768, while those with less than high school education earn the least with $26,173. Women with an educational attainment of graduate degree earn the most with the average annual earnings of $106,378, while those with high school diploma education have the smallest earnings of $29,458.
| Educational Attainment | Male Income | Female Income |
| Less than High School | $26,173 | $0 |
| High School Diploma | $38,661 | $29,458 |
| College or Associate's Degree | $43,456 | $32,958 |
| Bachelor's Degree | $57,768 | $50,417 |
| Graduate Degree | - | - |
| Total | $37,204 | $34,938 |
Family Income in Mills County
Family Income Brackets in Mills County
According to the Mills County family income data, there are 307 families falling into the $50,000 to $74,999 income range, which is the most common income bracket and makes up 23.9% of all families. Conversely, the less than $10,000 income bracket is the least frequent group with only 15 families (1.2%) belonging to this category.
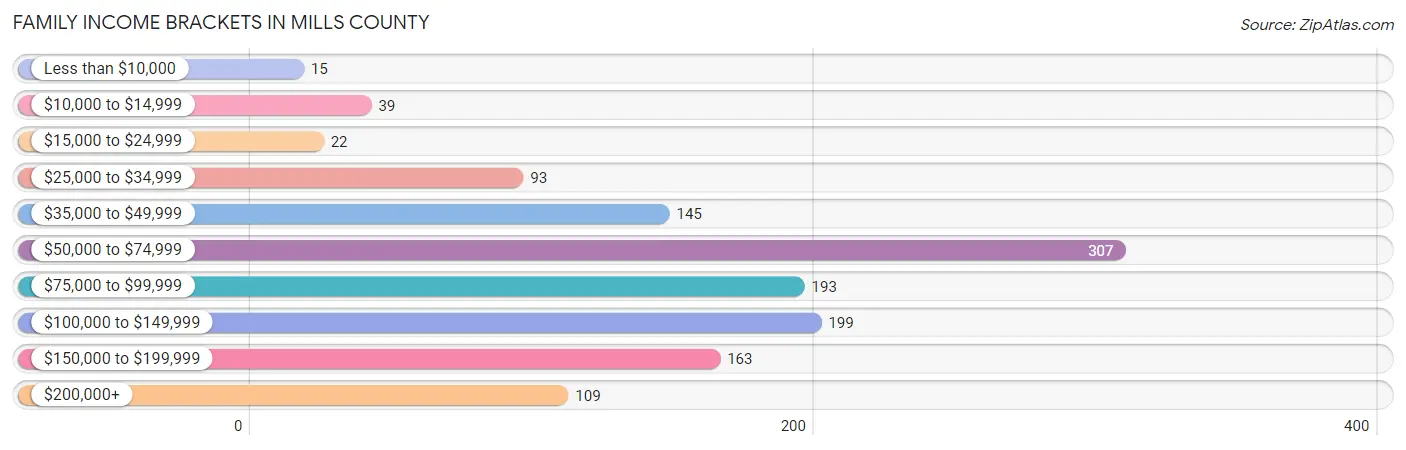
| Income Bracket | # Families | % Families |
| Less than $10,000 | 15 | 1.2% |
| $10,000 to $14,999 | 39 | 3.0% |
| $15,000 to $24,999 | 22 | 1.7% |
| $25,000 to $34,999 | 93 | 7.2% |
| $35,000 to $49,999 | 145 | 11.3% |
| $50,000 to $74,999 | 307 | 23.9% |
| $75,000 to $99,999 | 193 | 15.0% |
| $100,000 to $149,999 | 199 | 15.5% |
| $150,000 to $199,999 | 163 | 12.7% |
| $200,000+ | 109 | 8.5% |
Family Income by Famaliy Size in Mills County
6-person families (12 | 0.9%) account for the highest median family income in Mills County with $188,125 per family, while 2-person families (624 | 48.6%) have the highest median income of $32,216 per family member.
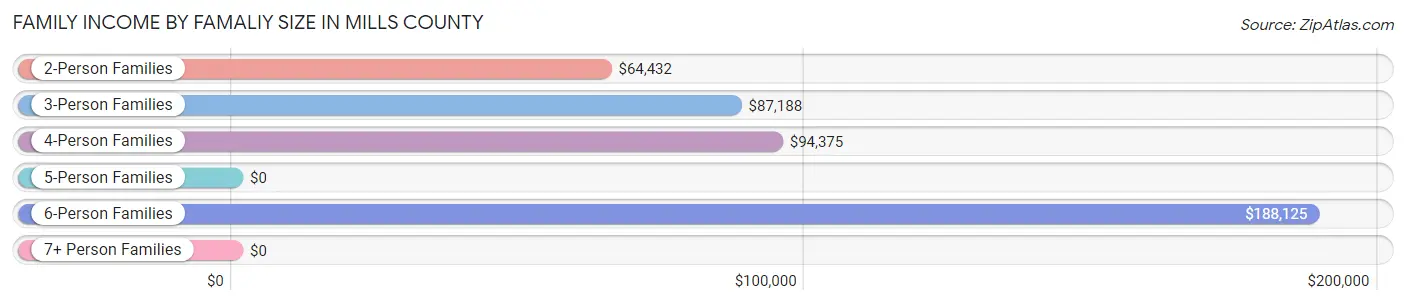
| Income Bracket | # Families | Median Income |
| 2-Person Families | 624 (48.6%) | $64,432 |
| 3-Person Families | 327 (25.5%) | $87,188 |
| 4-Person Families | 252 (19.6%) | $94,375 |
| 5-Person Families | 55 (4.3%) | $0 |
| 6-Person Families | 12 (0.9%) | $188,125 |
| 7+ Person Families | 15 (1.2%) | $0 |
| Total | 1,285 (100.0%) | $77,861 |
Family Income by Number of Earners in Mills County
The median family income in Mills County is $77,861, with families comprising 3+ earners (142) having the highest median family income of $170,049, while families with no earners (313) have the lowest median family income of $59,044, accounting for 11.1% and 24.4% of families, respectively.
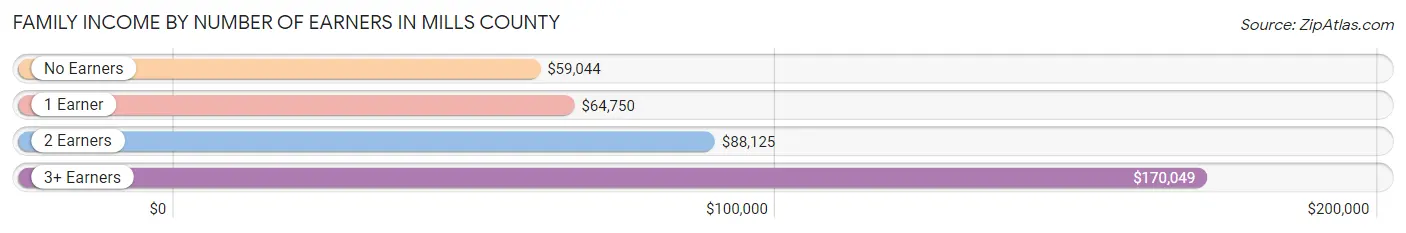
| Number of Earners | # Families | Median Income |
| No Earners | 313 (24.4%) | $59,044 |
| 1 Earner | 324 (25.2%) | $64,750 |
| 2 Earners | 506 (39.4%) | $88,125 |
| 3+ Earners | 142 (11.1%) | $170,049 |
| Total | 1,285 (100.0%) | $77,861 |
Household Income in Mills County
Household Income Brackets in Mills County
With 389 households falling in the category, the $50,000 to $74,999 income range is the most frequent in Mills County, accounting for 21.2% of all households. In contrast, only 73 households (4.0%) fall into the $10,000 to $14,999 income bracket, making it the least populous group.
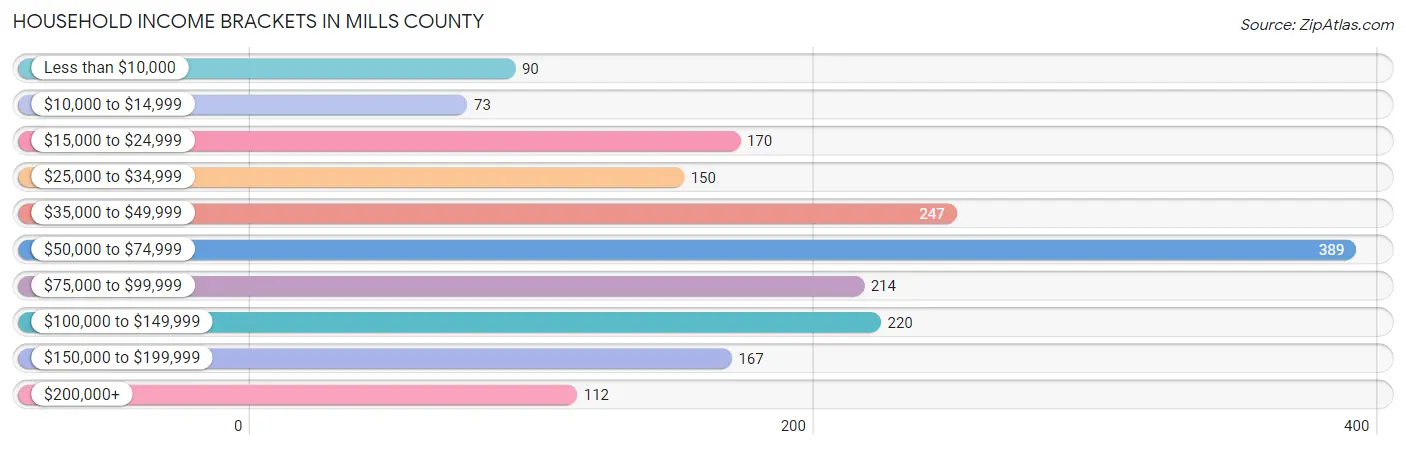
| Income Bracket | # Households | % Households |
| Less than $10,000 | 90 | 4.9% |
| $10,000 to $14,999 | 73 | 4.0% |
| $15,000 to $24,999 | 170 | 9.3% |
| $25,000 to $34,999 | 150 | 8.2% |
| $35,000 to $49,999 | 247 | 13.5% |
| $50,000 to $74,999 | 389 | 21.2% |
| $75,000 to $99,999 | 214 | 11.7% |
| $100,000 to $149,999 | 220 | 12.0% |
| $150,000 to $199,999 | 167 | 9.1% |
| $200,000+ | 112 | 6.1% |
Household Income by Householder Age in Mills County
The median household income in Mills County is $59,315, with the highest median household income of $74,250 found in the 15 to 24 years age bracket for the primary householder. A total of 17 households (0.9%) fall into this category. Meanwhile, the 65+ years age bracket for the primary householder has the lowest median household income of $50,682, with 766 households (41.8%) in this group.
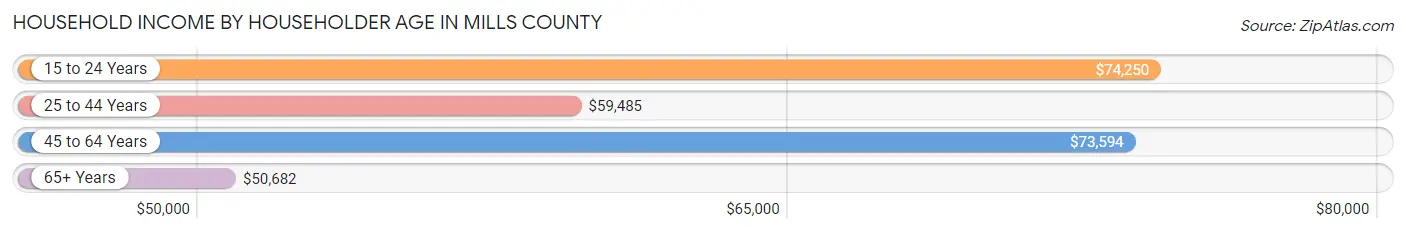
| Income Bracket | # Households | Median Income |
| 15 to 24 Years | 17 (0.9%) | $74,250 |
| 25 to 44 Years | 321 (17.5%) | $59,485 |
| 45 to 64 Years | 729 (39.8%) | $73,594 |
| 65+ Years | 766 (41.8%) | $50,682 |
| Total | 1,833 (100.0%) | $59,315 |
Poverty in Mills County
Income Below Poverty by Sex and Age in Mills County
With 5.8% poverty level for males and 8.0% for females among the residents of Mills County, under 5 year old males and 15 year old females are the most vulnerable to poverty, with 6 males (12.0%) and 12 females (27.3%) in their respective age groups living below the poverty level.
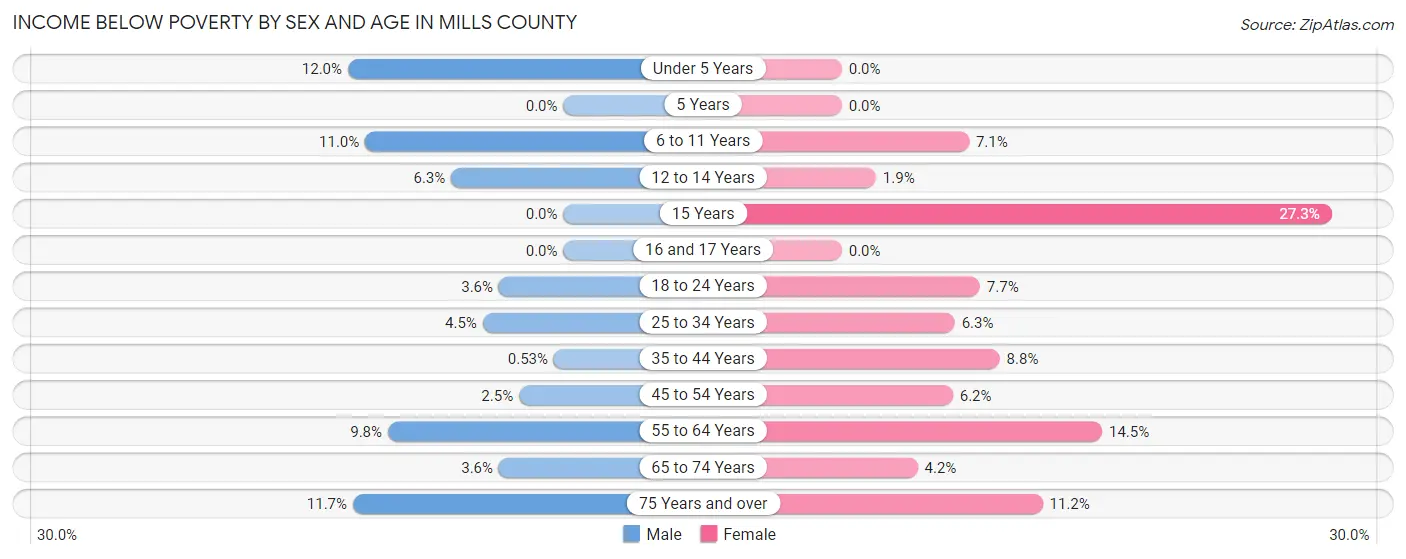
| Age Bracket | Male | Female |
| Under 5 Years | 6 (12.0%) | 0 (0.0%) |
| 5 Years | 0 (0.0%) | 0 (0.0%) |
| 6 to 11 Years | 18 (11.0%) | 8 (7.1%) |
| 12 to 14 Years | 5 (6.2%) | 2 (1.9%) |
| 15 Years | 0 (0.0%) | 12 (27.3%) |
| 16 and 17 Years | 0 (0.0%) | 0 (0.0%) |
| 18 to 24 Years | 6 (3.6%) | 7 (7.7%) |
| 25 to 34 Years | 8 (4.5%) | 9 (6.3%) |
| 35 to 44 Years | 1 (0.5%) | 21 (8.8%) |
| 45 to 54 Years | 9 (2.5%) | 23 (6.2%) |
| 55 to 64 Years | 34 (9.8%) | 40 (14.5%) |
| 65 to 74 Years | 11 (3.6%) | 13 (4.2%) |
| 75 Years and over | 30 (11.7%) | 34 (11.2%) |
| Total | 128 (5.8%) | 169 (8.0%) |
Income Above Poverty by Sex and Age in Mills County
According to the poverty statistics in Mills County, males aged 5 years and females aged under 5 years are the age groups that are most secure financially, with 100.0% of males and 100.0% of females in these age groups living above the poverty line.
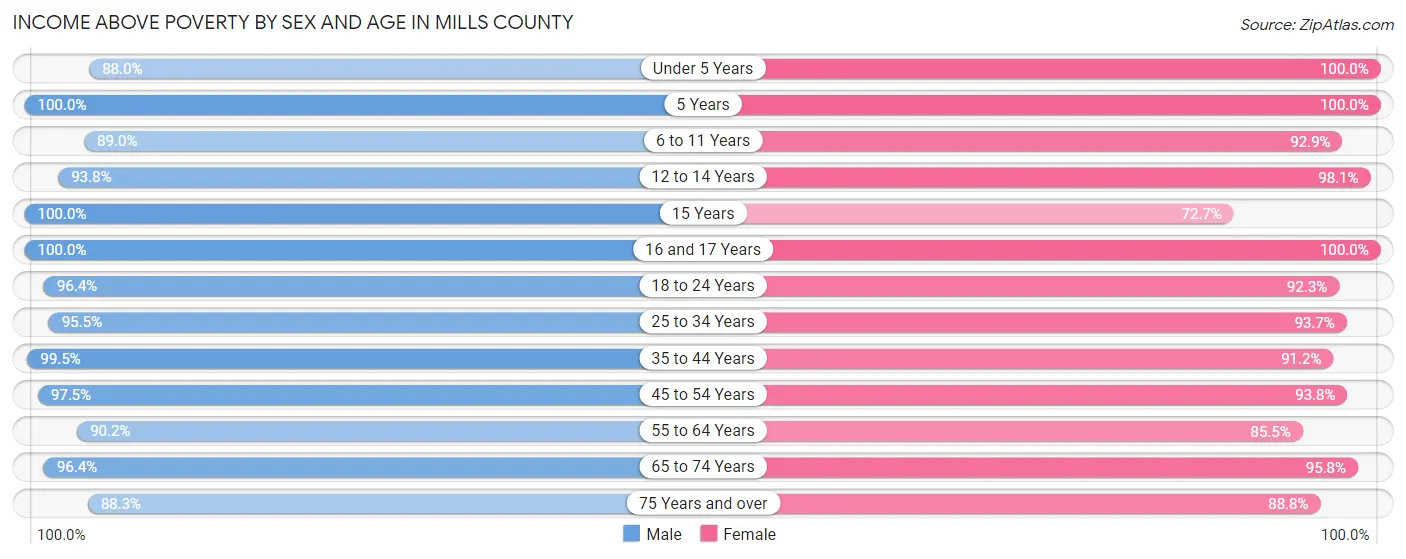
| Age Bracket | Male | Female |
| Under 5 Years | 44 (88.0%) | 46 (100.0%) |
| 5 Years | 27 (100.0%) | 4 (100.0%) |
| 6 to 11 Years | 145 (89.0%) | 105 (92.9%) |
| 12 to 14 Years | 75 (93.8%) | 103 (98.1%) |
| 15 Years | 11 (100.0%) | 32 (72.7%) |
| 16 and 17 Years | 69 (100.0%) | 67 (100.0%) |
| 18 to 24 Years | 161 (96.4%) | 84 (92.3%) |
| 25 to 34 Years | 170 (95.5%) | 134 (93.7%) |
| 35 to 44 Years | 187 (99.5%) | 218 (91.2%) |
| 45 to 54 Years | 355 (97.5%) | 349 (93.8%) |
| 55 to 64 Years | 314 (90.2%) | 236 (85.5%) |
| 65 to 74 Years | 295 (96.4%) | 295 (95.8%) |
| 75 Years and over | 226 (88.3%) | 270 (88.8%) |
| Total | 2,079 (94.2%) | 1,943 (92.0%) |
Income Below Poverty Among Married-Couple Families in Mills County
The poverty statistics for married-couple families in Mills County show that 3.6% or 37 of the total 1,027 families live below the poverty line. Families with no children have the highest poverty rate of 4.5%, comprising of 30 families. On the other hand, families with 3 or 4 children have the lowest poverty rate of 0.0%, which includes 0 families.
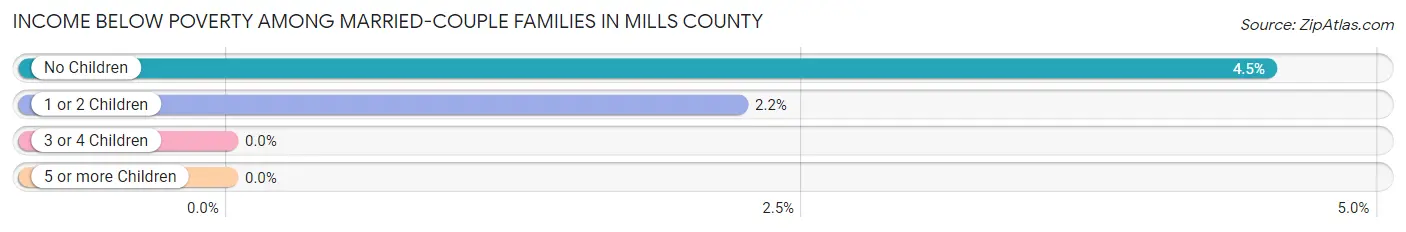
| Children | Above Poverty | Below Poverty |
| No Children | 634 (95.5%) | 30 (4.5%) |
| 1 or 2 Children | 308 (97.8%) | 7 (2.2%) |
| 3 or 4 Children | 42 (100.0%) | 0 (0.0%) |
| 5 or more Children | 6 (100.0%) | 0 (0.0%) |
| Total | 990 (96.4%) | 37 (3.6%) |
Income Below Poverty Among Single-Parent Households in Mills County
According to the poverty data in Mills County, 2.5% or 3 single-father households and 16.4% or 23 single-mother households are living below the poverty line. Among single-father households, those with no children have the highest poverty rate, with 3 households (9.7%) experiencing poverty. Likewise, among single-mother households, those with 3 or 4 children have the highest poverty rate, with 4 households (66.7%) falling below the poverty line.
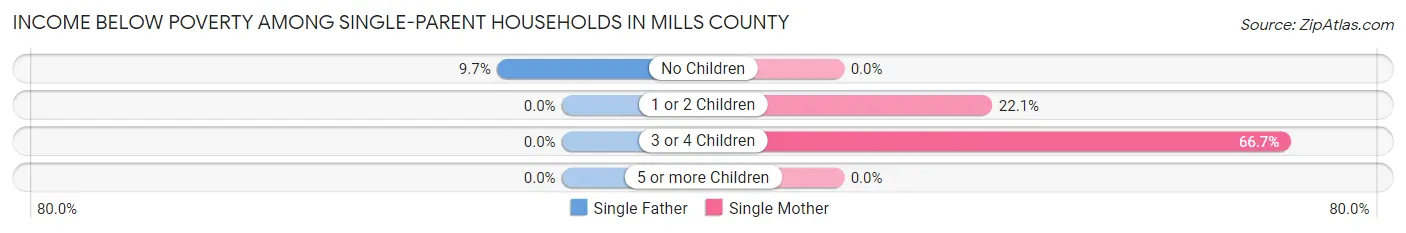
| Children | Single Father | Single Mother |
| No Children | 3 (9.7%) | 0 (0.0%) |
| 1 or 2 Children | 0 (0.0%) | 19 (22.1%) |
| 3 or 4 Children | 0 (0.0%) | 4 (66.7%) |
| 5 or more Children | 0 (0.0%) | 0 (0.0%) |
| Total | 3 (2.5%) | 23 (16.4%) |
Income Below Poverty Among Married-Couple vs Single-Parent Households in Mills County
The poverty data for Mills County shows that 37 of the married-couple family households (3.6%) and 26 of the single-parent households (10.1%) are living below the poverty level. Within the married-couple family households, those with no children have the highest poverty rate, with 30 households (4.5%) falling below the poverty line. Among the single-parent households, those with 1 or 2 children have the highest poverty rate, with 19 household (15.0%) living below poverty.
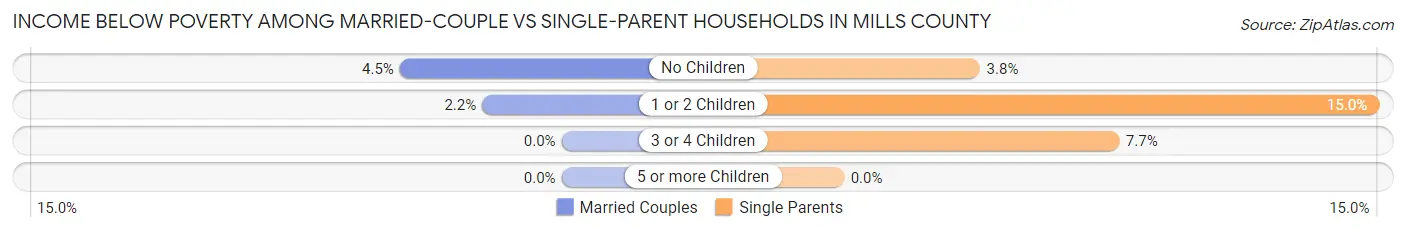
| Children | Married-Couple Families | Single-Parent Households |
| No Children | 30 (4.5%) | 3 (3.8%) |
| 1 or 2 Children | 7 (2.2%) | 19 (15.0%) |
| 3 or 4 Children | 0 (0.0%) | 4 (7.7%) |
| 5 or more Children | 0 (0.0%) | 0 (0.0%) |
| Total | 37 (3.6%) | 26 (10.1%) |
Race in Mills County
The most populous races in Mills County are White / Caucasian (3,649 | 81.1%), Hispanic or Latino (1,109 | 24.6%), and Two or more Races (635 | 14.1%).
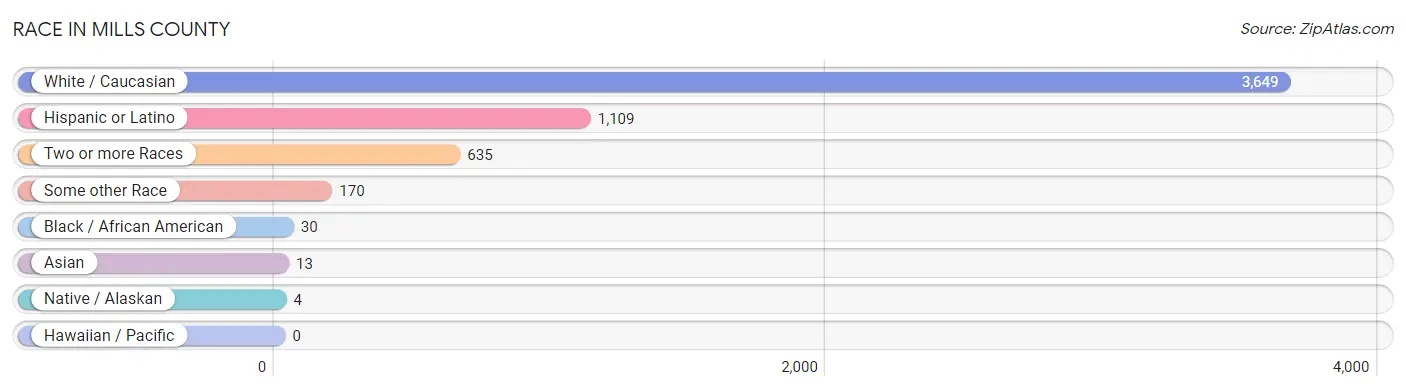
| Race | # Population | % Population |
| Asian | 13 | 0.3% |
| Black / African American | 30 | 0.7% |
| Hawaiian / Pacific | 0 | 0.0% |
| Hispanic or Latino | 1,109 | 24.6% |
| Native / Alaskan | 4 | 0.1% |
| White / Caucasian | 3,649 | 81.1% |
| Two or more Races | 635 | 14.1% |
| Some other Race | 170 | 3.8% |
| Total | 4,501 | 100.0% |
Ancestry in Mills County
The most populous ancestries reported in Mills County are Mexican (945 | 21.0%), German (649 | 14.4%), English (536 | 11.9%), Irish (386 | 8.6%), and European (344 | 7.6%), together accounting for 63.5% of all Mills County residents.
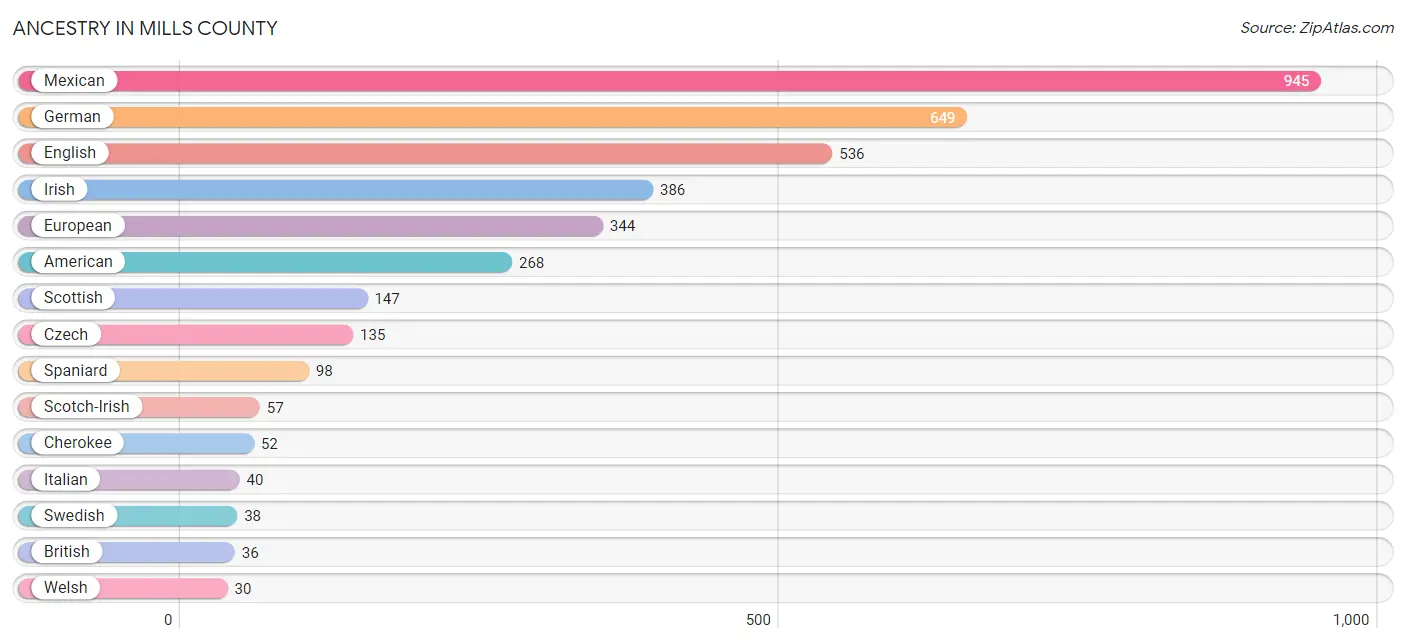
| Ancestry | # Population | % Population |
| American | 268 | 5.9% |
| Apache | 6 | 0.1% |
| British | 36 | 0.8% |
| Cherokee | 52 | 1.2% |
| Choctaw | 12 | 0.3% |
| Czech | 135 | 3.0% |
| Dutch | 29 | 0.6% |
| Dutch West Indian | 14 | 0.3% |
| Eastern European | 4 | 0.1% |
| English | 536 | 11.9% |
| European | 344 | 7.6% |
| French | 25 | 0.6% |
| German | 649 | 14.4% |
| Greek | 2 | 0.0% |
| Irish | 386 | 8.6% |
| Italian | 40 | 0.9% |
| Japanese | 5 | 0.1% |
| Laotian | 9 | 0.2% |
| Mexican | 945 | 21.0% |
| Polish | 17 | 0.4% |
| Scandinavian | 4 | 0.1% |
| Scotch-Irish | 57 | 1.3% |
| Scottish | 147 | 3.3% |
| South African | 13 | 0.3% |
| Spaniard | 98 | 2.2% |
| Sri Lankan | 1 | 0.0% |
| Subsaharan African | 17 | 0.4% |
| Swedish | 38 | 0.8% |
| Welsh | 30 | 0.7% | View All 29 Rows |
Immigrants in Mills County
The most numerous immigrant groups reported in Mills County came from Latin America (231 | 5.1%), Central America (225 | 5.0%), Mexico (225 | 5.0%), Africa (13 | 0.3%), and South Africa (13 | 0.3%), together accounting for 15.7% of all Mills County residents.
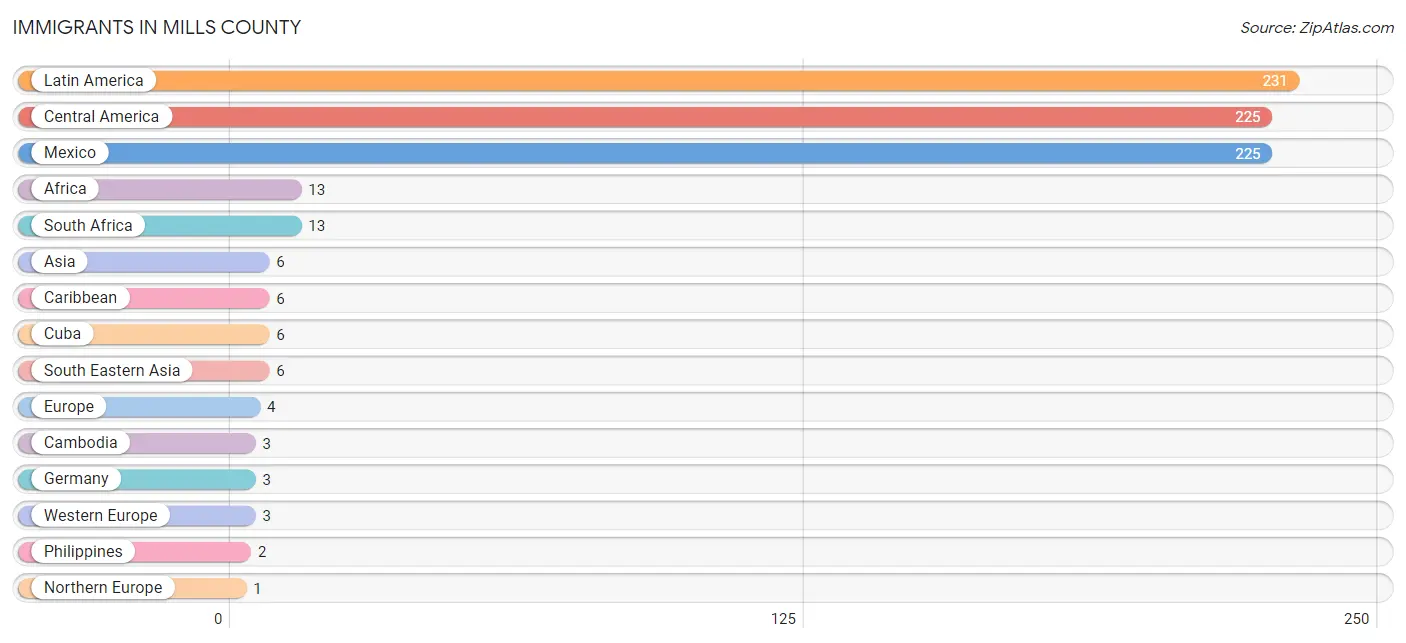
| Immigration Origin | # Population | % Population |
| Africa | 13 | 0.3% |
| Asia | 6 | 0.1% |
| Cambodia | 3 | 0.1% |
| Caribbean | 6 | 0.1% |
| Central America | 225 | 5.0% |
| Cuba | 6 | 0.1% |
| Europe | 4 | 0.1% |
| Germany | 3 | 0.1% |
| Latin America | 231 | 5.1% |
| Mexico | 225 | 5.0% |
| Northern Europe | 1 | 0.0% |
| Philippines | 2 | 0.0% |
| South Africa | 13 | 0.3% |
| South Eastern Asia | 6 | 0.1% |
| Sweden | 1 | 0.0% |
| Vietnam | 1 | 0.0% |
| Western Europe | 3 | 0.1% | View All 17 Rows |
Sex and Age in Mills County
Sex and Age in Mills County
The most populous age groups in Mills County are 50 to 54 Years (203 | 8.9%) for men and 50 to 54 Years (201 | 9.0%) for women.
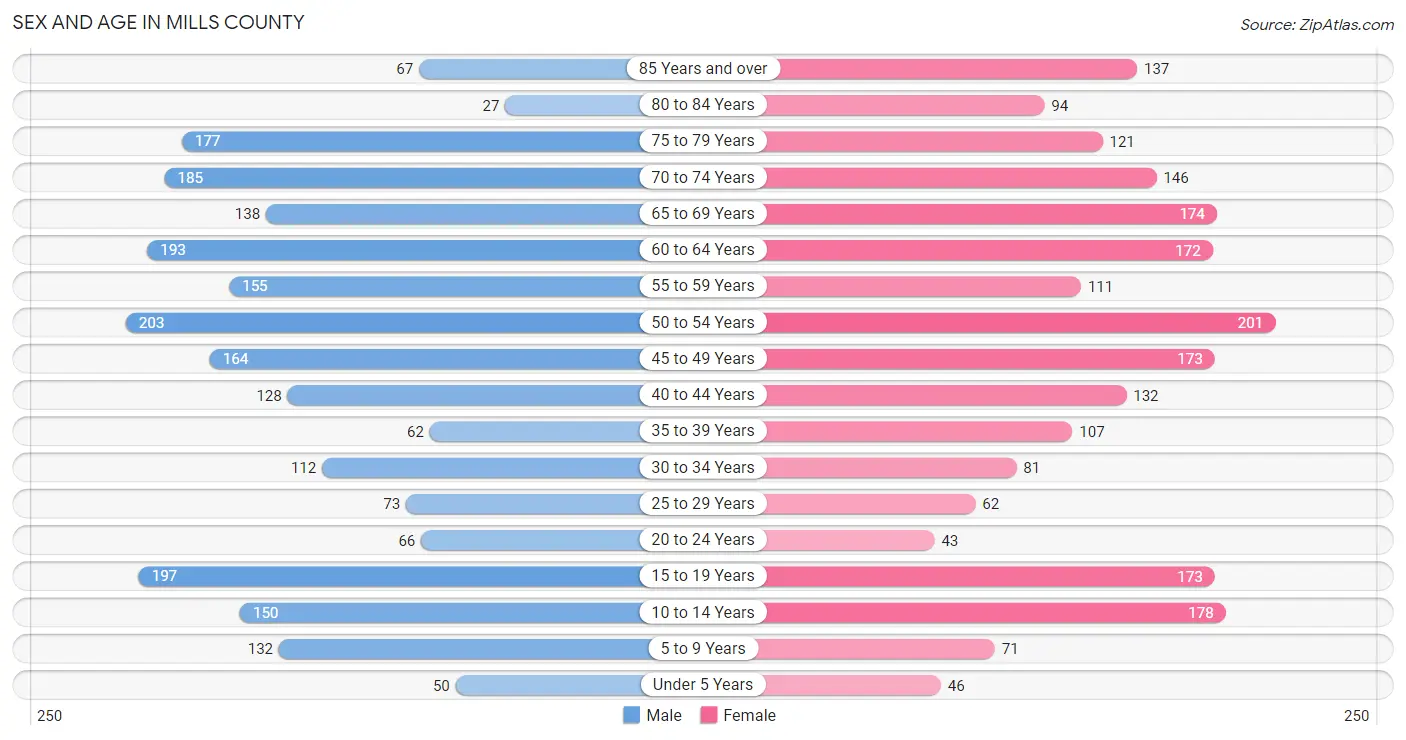
| Age Bracket | Male | Female |
| Under 5 Years | 50 (2.2%) | 46 (2.1%) |
| 5 to 9 Years | 132 (5.8%) | 71 (3.2%) |
| 10 to 14 Years | 150 (6.6%) | 178 (8.0%) |
| 15 to 19 Years | 197 (8.6%) | 173 (7.8%) |
| 20 to 24 Years | 66 (2.9%) | 43 (1.9%) |
| 25 to 29 Years | 73 (3.2%) | 62 (2.8%) |
| 30 to 34 Years | 112 (4.9%) | 81 (3.6%) |
| 35 to 39 Years | 62 (2.7%) | 107 (4.8%) |
| 40 to 44 Years | 128 (5.6%) | 132 (5.9%) |
| 45 to 49 Years | 164 (7.2%) | 173 (7.8%) |
| 50 to 54 Years | 203 (8.9%) | 201 (9.0%) |
| 55 to 59 Years | 155 (6.8%) | 111 (5.0%) |
| 60 to 64 Years | 193 (8.5%) | 172 (7.7%) |
| 65 to 69 Years | 138 (6.1%) | 174 (7.8%) |
| 70 to 74 Years | 185 (8.1%) | 146 (6.6%) |
| 75 to 79 Years | 177 (7.8%) | 121 (5.4%) |
| 80 to 84 Years | 27 (1.2%) | 94 (4.2%) |
| 85 Years and over | 67 (2.9%) | 137 (6.2%) |
| Total | 2,279 (100.0%) | 2,222 (100.0%) |
Families and Households in Mills County
Median Family Size in Mills County
The median family size in Mills County is 2.86 persons per family, with single male/father families (118 | 9.2%) accounting for the largest median family size of 3.28 persons per family. On the other hand, married-couple families (1,027 | 79.9%) represent the smallest median family size with 2.77 persons per family.
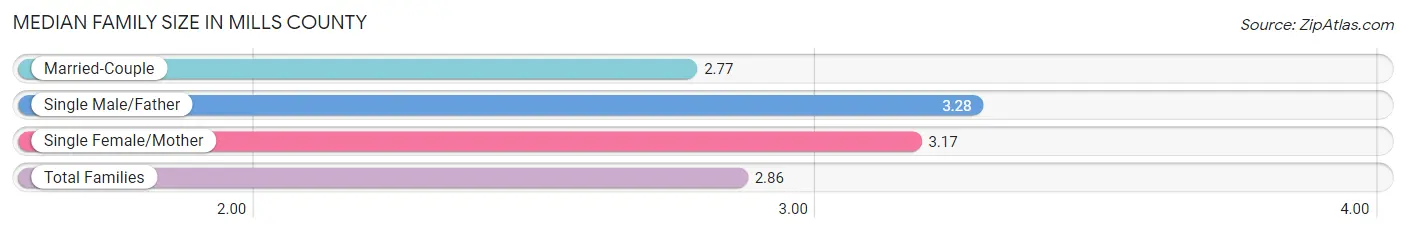
| Family Type | # Families | Family Size |
| Married-Couple | 1,027 (79.9%) | 2.77 |
| Single Male/Father | 118 (9.2%) | 3.28 |
| Single Female/Mother | 140 (10.9%) | 3.17 |
| Total Families | 1,285 (100.0%) | 2.86 |
Median Household Size in Mills County
The median household size in Mills County is 2.36 persons per household, with single female/mother households (140 | 7.6%) accounting for the largest median household size of 3.46 persons per household. non-family households (548 | 29.9%) represent the smallest median household size with 1.05 persons per household.
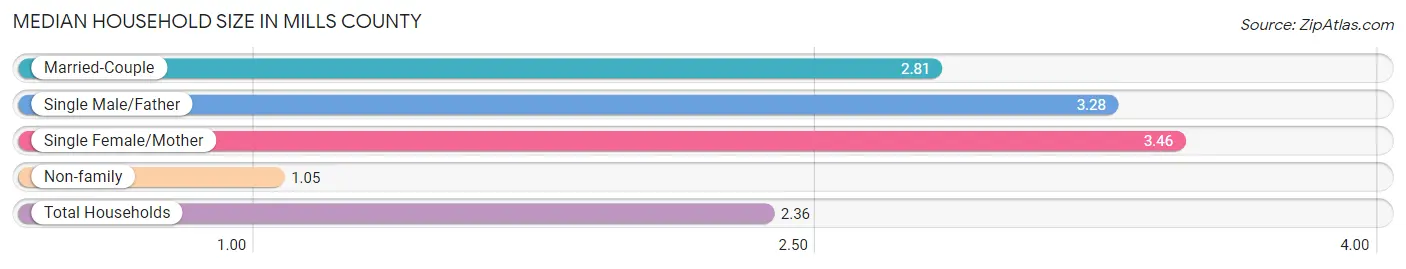
| Household Type | # Households | Household Size |
| Married-Couple | 1,027 (56.0%) | 2.81 |
| Single Male/Father | 118 (6.4%) | 3.28 |
| Single Female/Mother | 140 (7.6%) | 3.46 |
| Non-family | 548 (29.9%) | 1.05 |
| Total Households | 1,833 (100.0%) | 2.36 |
Household Size by Marriage Status in Mills County
Out of a total of 1,833 households in Mills County, 1,285 (70.1%) are family households, while 548 (29.9%) are nonfamily households. The most numerous type of family households are 2-person households, comprising 614, and the most common type of nonfamily households are 1-person households, comprising 529.
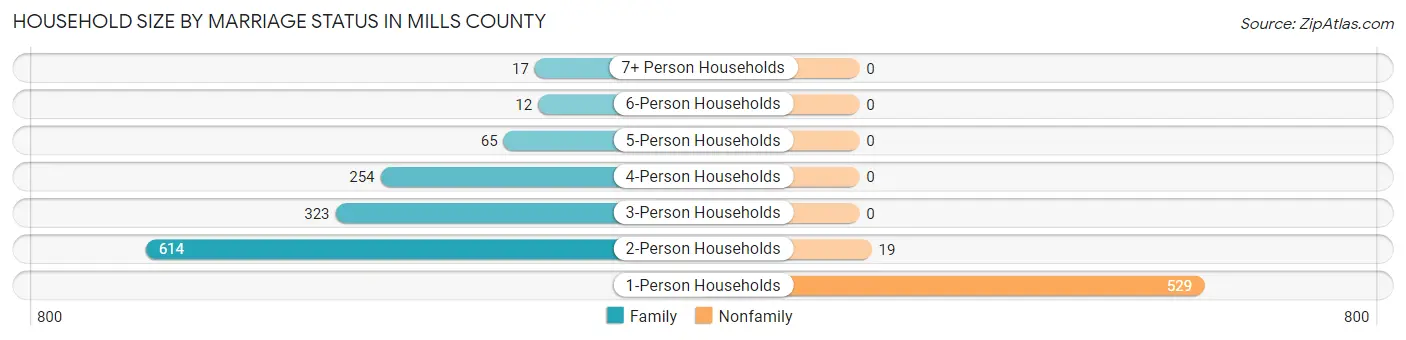
| Household Size | Family Households | Nonfamily Households |
| 1-Person Households | - | 529 (28.9%) |
| 2-Person Households | 614 (33.5%) | 19 (1.0%) |
| 3-Person Households | 323 (17.6%) | 0 (0.0%) |
| 4-Person Households | 254 (13.9%) | 0 (0.0%) |
| 5-Person Households | 65 (3.5%) | 0 (0.0%) |
| 6-Person Households | 12 (0.6%) | 0 (0.0%) |
| 7+ Person Households | 17 (0.9%) | 0 (0.0%) |
| Total | 1,285 (70.1%) | 548 (29.9%) |
Female Fertility in Mills County
Fertility by Age in Mills County
Average fertility rate in Mills County is 60.0 births per 1,000 women. Women in the age bracket of 20 to 34 years have the highest fertility rate with 194.0 births per 1,000 women. Women in the age bracket of 20 to 34 years acount for 73.5% of all women with births.
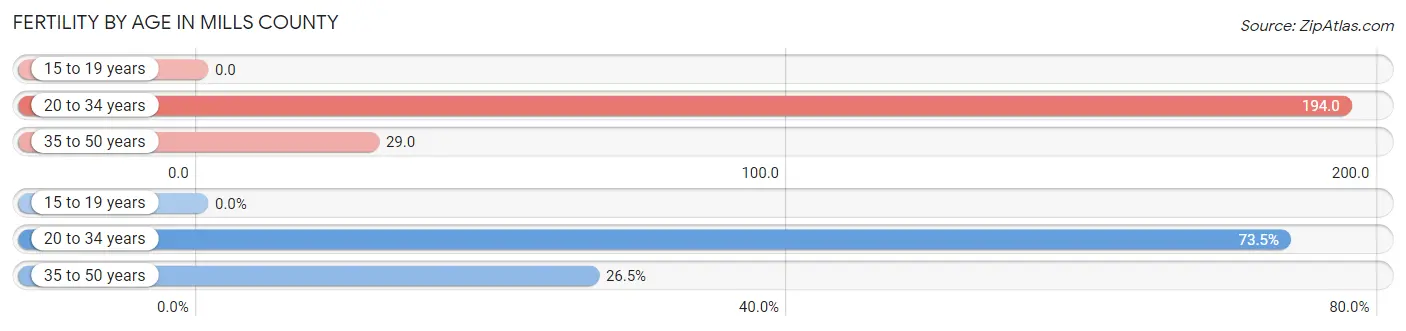
| Age Bracket | Women with Births | Births / 1,000 Women |
| 15 to 19 years | 0 (0.0%) | 0.0 |
| 20 to 34 years | 36 (73.5%) | 194.0 |
| 35 to 50 years | 13 (26.5%) | 29.0 |
| Total | 49 (100.0%) | 60.0 |
Fertility by Age by Marriage Status in Mills County
53.1% of women with births (49) in Mills County are married. The highest percentage of unmarried women with births falls into 20 to 34 years age bracket with 58.3% of them unmarried at the time of birth, while the lowest percentage of unmarried women with births belong to 35 to 50 years age bracket with 15.4% of them unmarried.
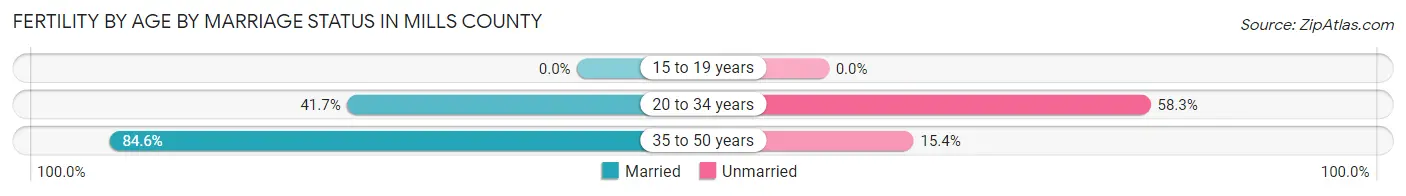
| Age Bracket | Married | Unmarried |
| 15 to 19 years | 0 (0.0%) | 0 (0.0%) |
| 20 to 34 years | 15 (41.7%) | 21 (58.3%) |
| 35 to 50 years | 11 (84.6%) | 2 (15.4%) |
| Total | 26 (53.1%) | 23 (46.9%) |
Fertility by Education in Mills County
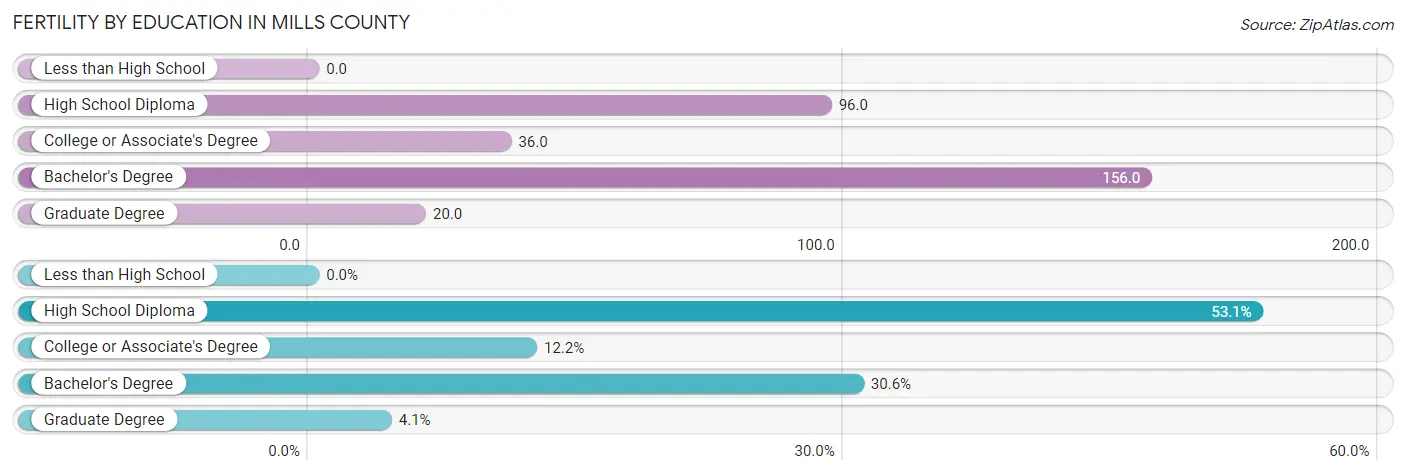
| Educational Attainment | Women with Births | Births / 1,000 Women |
| Less than High School | 0 (0.0%) | 0.0 |
| High School Diploma | 26 (53.1%) | 96.0 |
| College or Associate's Degree | 6 (12.2%) | 36.0 |
| Bachelor's Degree | 15 (30.6%) | 156.0 |
| Graduate Degree | 2 (4.1%) | 20.0 |
| Total | 49 (100.0%) | 60.0 |
Fertility by Education by Marriage Status in Mills County
46.9% of women with births in Mills County are unmarried. Women with the educational attainment of graduate degree are most likely to be married with 100.0% of them married at childbirth, while women with the educational attainment of college or associate's degree are least likely to be married with 100.0% of them unmarried at childbirth.
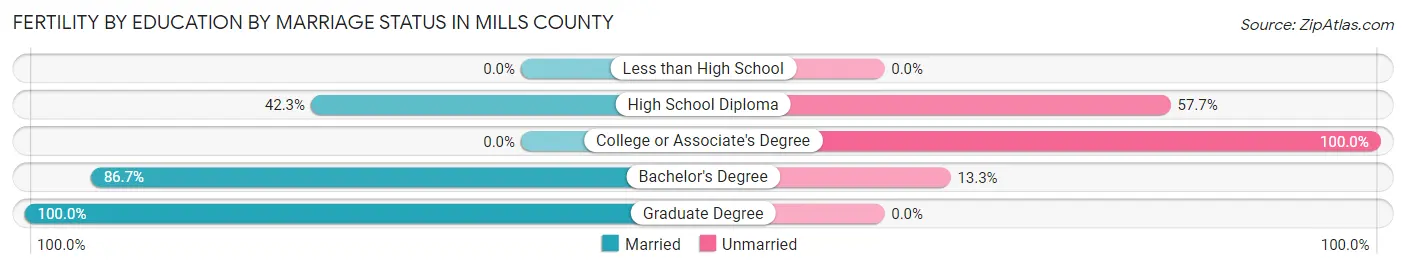
| Educational Attainment | Married | Unmarried |
| Less than High School | 0 (0.0%) | 0 (0.0%) |
| High School Diploma | 11 (42.3%) | 15 (57.7%) |
| College or Associate's Degree | 0 (0.0%) | 6 (100.0%) |
| Bachelor's Degree | 13 (86.7%) | 2 (13.3%) |
| Graduate Degree | 2 (100.0%) | 0 (0.0%) |
| Total | 26 (53.1%) | 23 (46.9%) |
Employment Characteristics in Mills County
Employment by Class of Employer in Mills County
Among the 2,012 employed individuals in Mills County, private company employees (1,155 | 57.4%), local government employees (277 | 13.8%), and self-employed (not incorporated) (254 | 12.6%) make up the most common classes of employment.
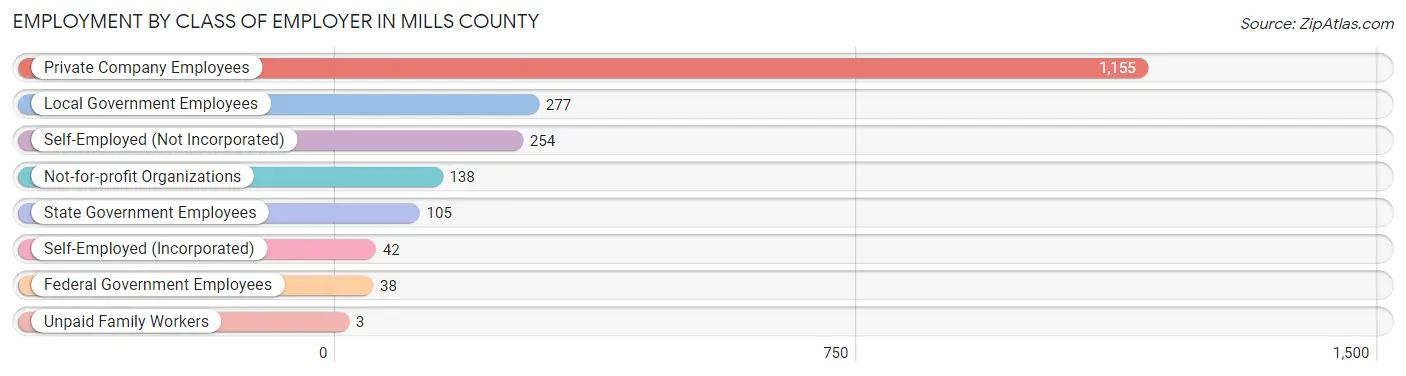
| Employer Class | # Employees | % Employees |
| Private Company Employees | 1,155 | 57.4% |
| Self-Employed (Incorporated) | 42 | 2.1% |
| Self-Employed (Not Incorporated) | 254 | 12.6% |
| Not-for-profit Organizations | 138 | 6.9% |
| Local Government Employees | 277 | 13.8% |
| State Government Employees | 105 | 5.2% |
| Federal Government Employees | 38 | 1.9% |
| Unpaid Family Workers | 3 | 0.2% |
| Total | 2,012 | 100.0% |
Employment Status by Age in Mills County
According to the labor force statistics for Mills County, out of the total population over 16 years of age (3,804), 54.7% or 2,081 individuals are in the labor force, with 2.3% or 48 of them unemployed. The age group with the highest labor force participation rate is 20 to 24 years, with 90.8% or 99 individuals in the labor force. Within the labor force, the 16 to 19 years age range has the highest percentage of unemployed individuals, with 22.4% or 26 of them being unemployed.
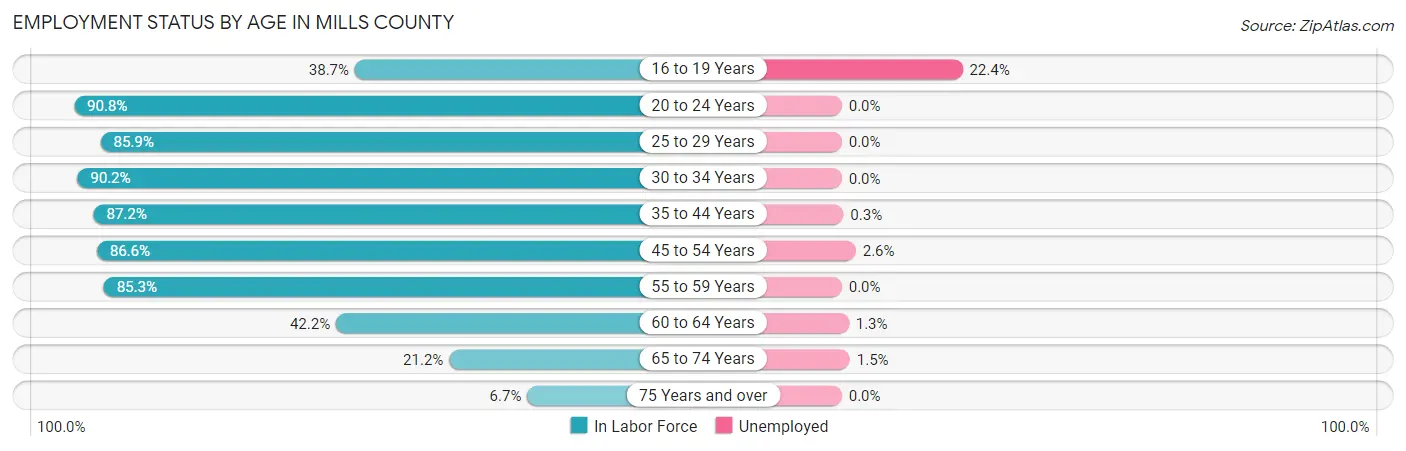
| Age Bracket | In Labor Force | Unemployed |
| 16 to 19 Years | 116 (38.7%) | 26 (22.4%) |
| 20 to 24 Years | 99 (90.8%) | 0 (0.0%) |
| 25 to 29 Years | 116 (85.9%) | 0 (0.0%) |
| 30 to 34 Years | 174 (90.2%) | 0 (0.0%) |
| 35 to 44 Years | 374 (87.2%) | 1 (0.3%) |
| 45 to 54 Years | 642 (86.6%) | 17 (2.6%) |
| 55 to 59 Years | 227 (85.3%) | 0 (0.0%) |
| 60 to 64 Years | 154 (42.2%) | 2 (1.3%) |
| 65 to 74 Years | 136 (21.2%) | 2 (1.5%) |
| 75 Years and over | 42 (6.7%) | 0 (0.0%) |
| Total | 2,081 (54.7%) | 48 (2.3%) |
Employment Status by Educational Attainment in Mills County
According to labor force statistics for Mills County, 79.2% of individuals (1,686) out of the total population between 25 and 64 years of age (2,129) are in the labor force, with 1.2% or 20 of them being unemployed. The group with the highest labor force participation rate are those with the educational attainment of high school diploma, with 84.0% or 630 individuals in the labor force. Within the labor force, individuals with high school diploma education have the highest percentage of unemployment, with 2.9% or 18 of them being unemployed.
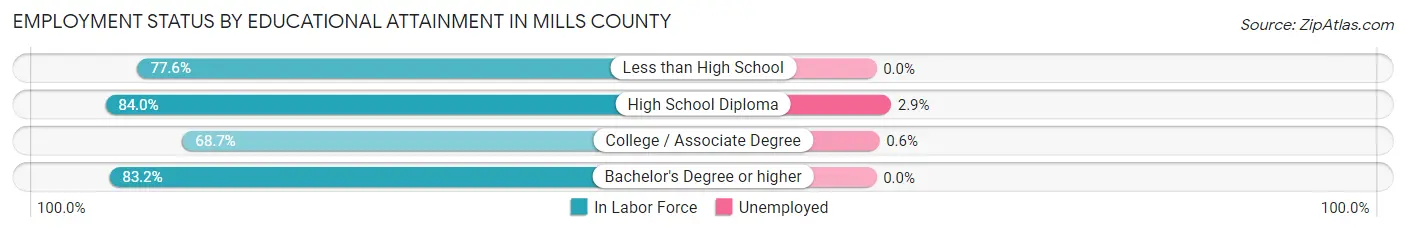
| Educational Attainment | In Labor Force | Unemployed |
| Less than High School | 211 (77.6%) | 0 (0.0%) |
| High School Diploma | 630 (84.0%) | 22 (2.9%) |
| College / Associate Degree | 355 (68.7%) | 3 (0.6%) |
| Bachelor's Degree or higher | 491 (83.2%) | 0 (0.0%) |
| Total | 1,686 (79.2%) | 26 (1.2%) |
Employment Occupations by Sex in Mills County
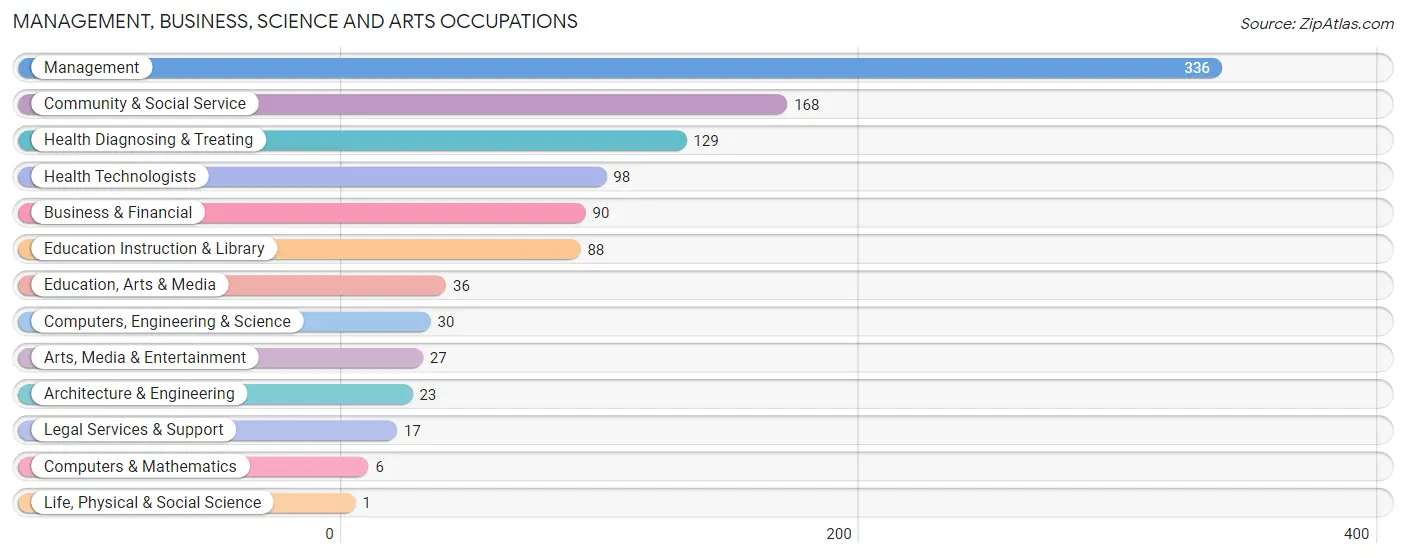
Management, Business, Science and Arts Occupations
The most common Management, Business, Science and Arts occupations in Mills County are Management (336 | 16.5%), Community & Social Service (168 | 8.3%), Health Diagnosing & Treating (129 | 6.4%), Health Technologists (98 | 4.8%), and Business & Financial (90 | 4.4%).
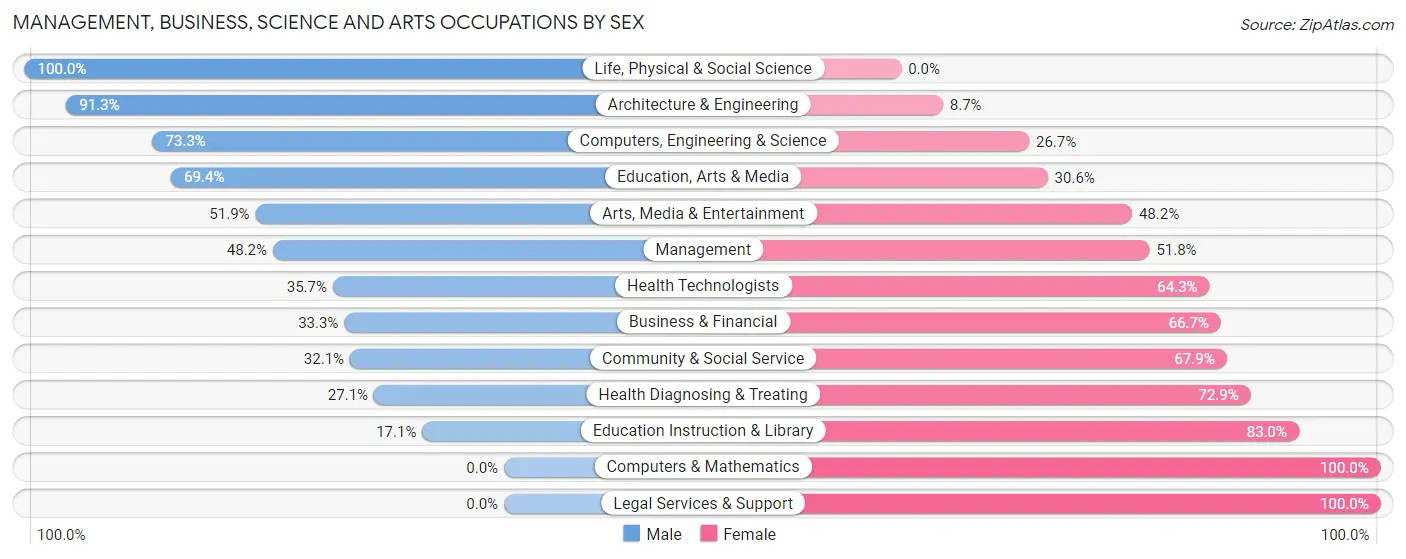
Management, Business, Science and Arts Occupations by Sex
Within the Management, Business, Science and Arts occupations in Mills County, the most male-oriented occupations are Life, Physical & Social Science (100.0%), Architecture & Engineering (91.3%), and Computers, Engineering & Science (73.3%), while the most female-oriented occupations are Computers & Mathematics (100.0%), Legal Services & Support (100.0%), and Education Instruction & Library (83.0%).
| Occupation | Male | Female |
| Management | 162 (48.2%) | 174 (51.8%) |
| Business & Financial | 30 (33.3%) | 60 (66.7%) |
| Computers, Engineering & Science | 22 (73.3%) | 8 (26.7%) |
| Computers & Mathematics | 0 (0.0%) | 6 (100.0%) |
| Architecture & Engineering | 21 (91.3%) | 2 (8.7%) |
| Life, Physical & Social Science | 1 (100.0%) | 0 (0.0%) |
| Community & Social Service | 54 (32.1%) | 114 (67.9%) |
| Education, Arts & Media | 25 (69.4%) | 11 (30.6%) |
| Legal Services & Support | 0 (0.0%) | 17 (100.0%) |
| Education Instruction & Library | 15 (17.1%) | 73 (83.0%) |
| Arts, Media & Entertainment | 14 (51.8%) | 13 (48.1%) |
| Health Diagnosing & Treating | 35 (27.1%) | 94 (72.9%) |
| Health Technologists | 35 (35.7%) | 63 (64.3%) |
| Total (Category) | 303 (40.2%) | 450 (59.8%) |
| Total (Overall) | 1,116 (54.9%) | 916 (45.1%) |
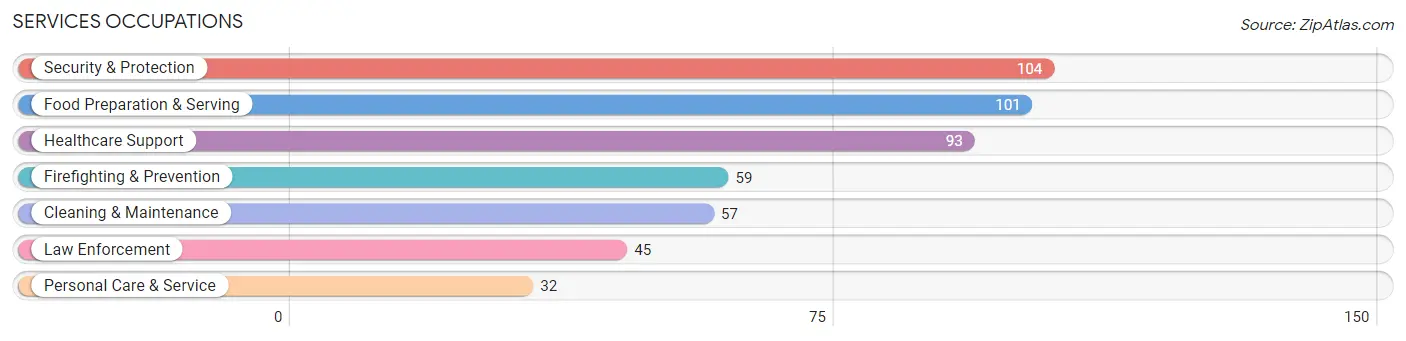
Services Occupations
The most common Services occupations in Mills County are Security & Protection (104 | 5.1%), Food Preparation & Serving (101 | 5.0%), Healthcare Support (93 | 4.6%), Firefighting & Prevention (59 | 2.9%), and Cleaning & Maintenance (57 | 2.8%).
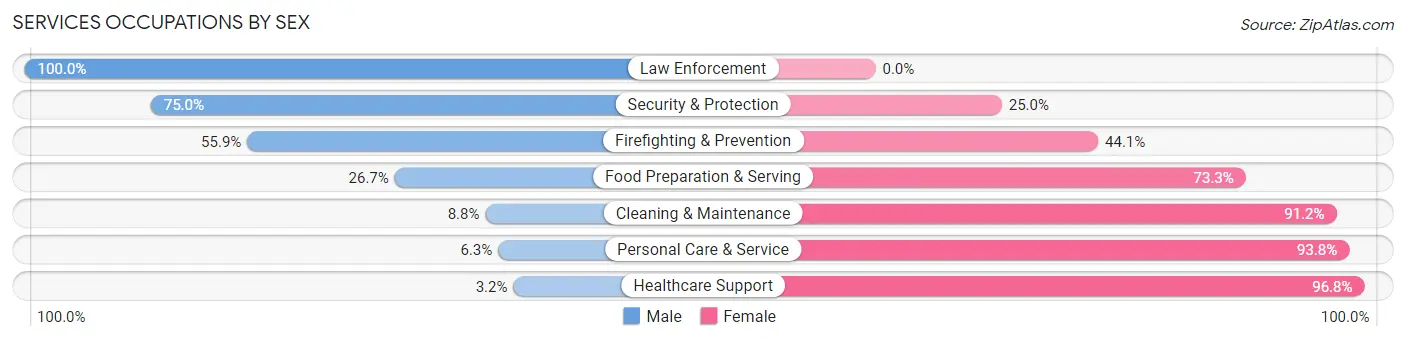
Services Occupations by Sex
Within the Services occupations in Mills County, the most male-oriented occupations are Law Enforcement (100.0%), Security & Protection (75.0%), and Firefighting & Prevention (55.9%), while the most female-oriented occupations are Healthcare Support (96.8%), Personal Care & Service (93.8%), and Cleaning & Maintenance (91.2%).
| Occupation | Male | Female |
| Healthcare Support | 3 (3.2%) | 90 (96.8%) |
| Security & Protection | 78 (75.0%) | 26 (25.0%) |
| Firefighting & Prevention | 33 (55.9%) | 26 (44.1%) |
| Law Enforcement | 45 (100.0%) | 0 (0.0%) |
| Food Preparation & Serving | 27 (26.7%) | 74 (73.3%) |
| Cleaning & Maintenance | 5 (8.8%) | 52 (91.2%) |
| Personal Care & Service | 2 (6.2%) | 30 (93.8%) |
| Total (Category) | 115 (29.7%) | 272 (70.3%) |
| Total (Overall) | 1,116 (54.9%) | 916 (45.1%) |
Sales and Office Occupations
The most common Sales and Office occupations in Mills County are Office & Administration (159 | 7.8%), and Sales & Related (141 | 6.9%).
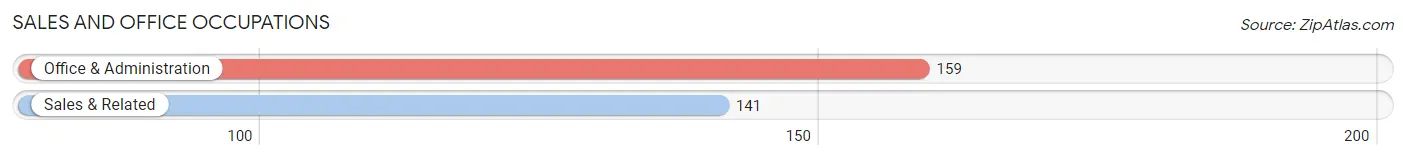
Sales and Office Occupations by Sex
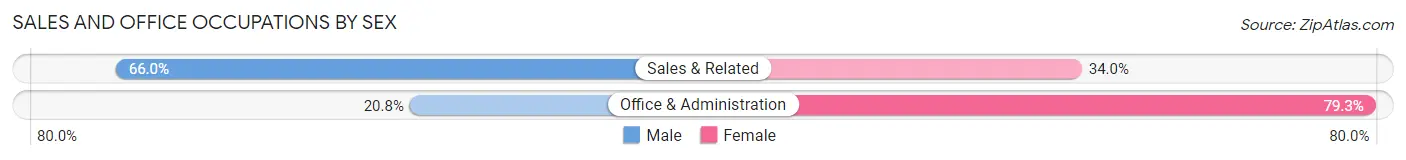
| Occupation | Male | Female |
| Sales & Related | 93 (66.0%) | 48 (34.0%) |
| Office & Administration | 33 (20.7%) | 126 (79.2%) |
| Total (Category) | 126 (42.0%) | 174 (58.0%) |
| Total (Overall) | 1,116 (54.9%) | 916 (45.1%) |
Natural Resources, Construction and Maintenance Occupations
The most common Natural Resources, Construction and Maintenance occupations in Mills County are Construction & Extraction (287 | 14.1%), Installation, Maintenance & Repair (63 | 3.1%), and Farming, Fishing & Forestry (31 | 1.5%).
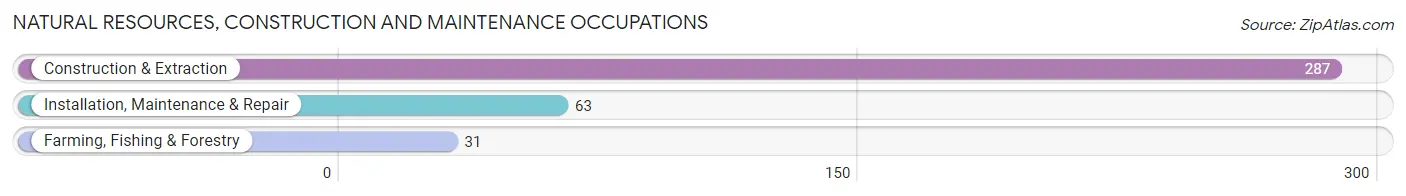
Natural Resources, Construction and Maintenance Occupations by Sex
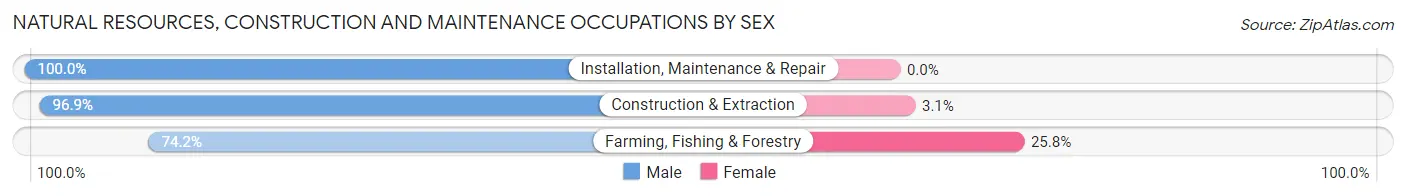
| Occupation | Male | Female |
| Farming, Fishing & Forestry | 23 (74.2%) | 8 (25.8%) |
| Construction & Extraction | 278 (96.9%) | 9 (3.1%) |
| Installation, Maintenance & Repair | 63 (100.0%) | 0 (0.0%) |
| Total (Category) | 364 (95.5%) | 17 (4.5%) |
| Total (Overall) | 1,116 (54.9%) | 916 (45.1%) |
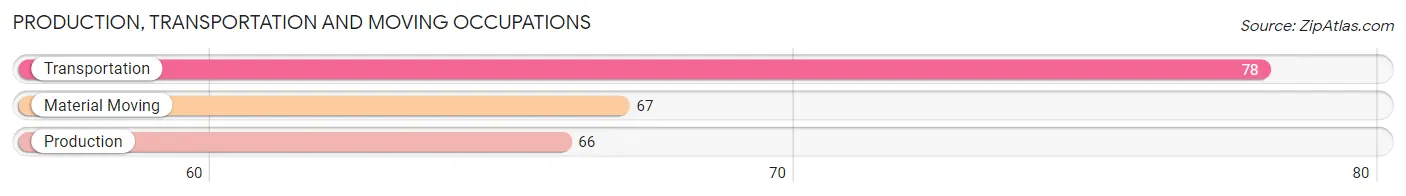
Production, Transportation and Moving Occupations
The most common Production, Transportation and Moving occupations in Mills County are Transportation (78 | 3.8%), Material Moving (67 | 3.3%), and Production (66 | 3.3%).
Production, Transportation and Moving Occupations by Sex
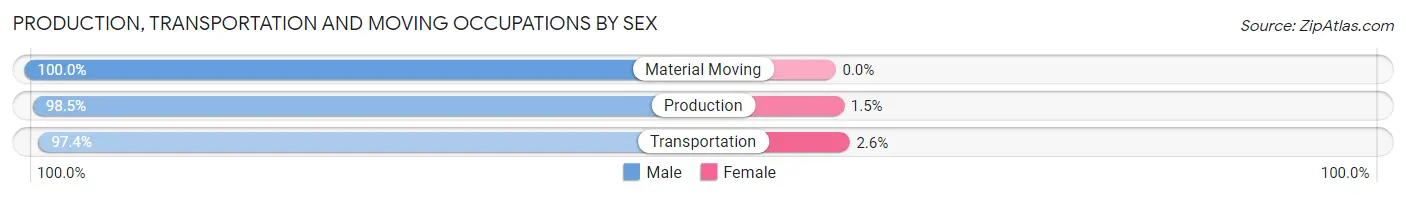
| Occupation | Male | Female |
| Production | 65 (98.5%) | 1 (1.5%) |
| Transportation | 76 (97.4%) | 2 (2.6%) |
| Material Moving | 67 (100.0%) | 0 (0.0%) |
| Total (Category) | 208 (98.6%) | 3 (1.4%) |
| Total (Overall) | 1,116 (54.9%) | 916 (45.1%) |
Employment Industries by Sex in Mills County
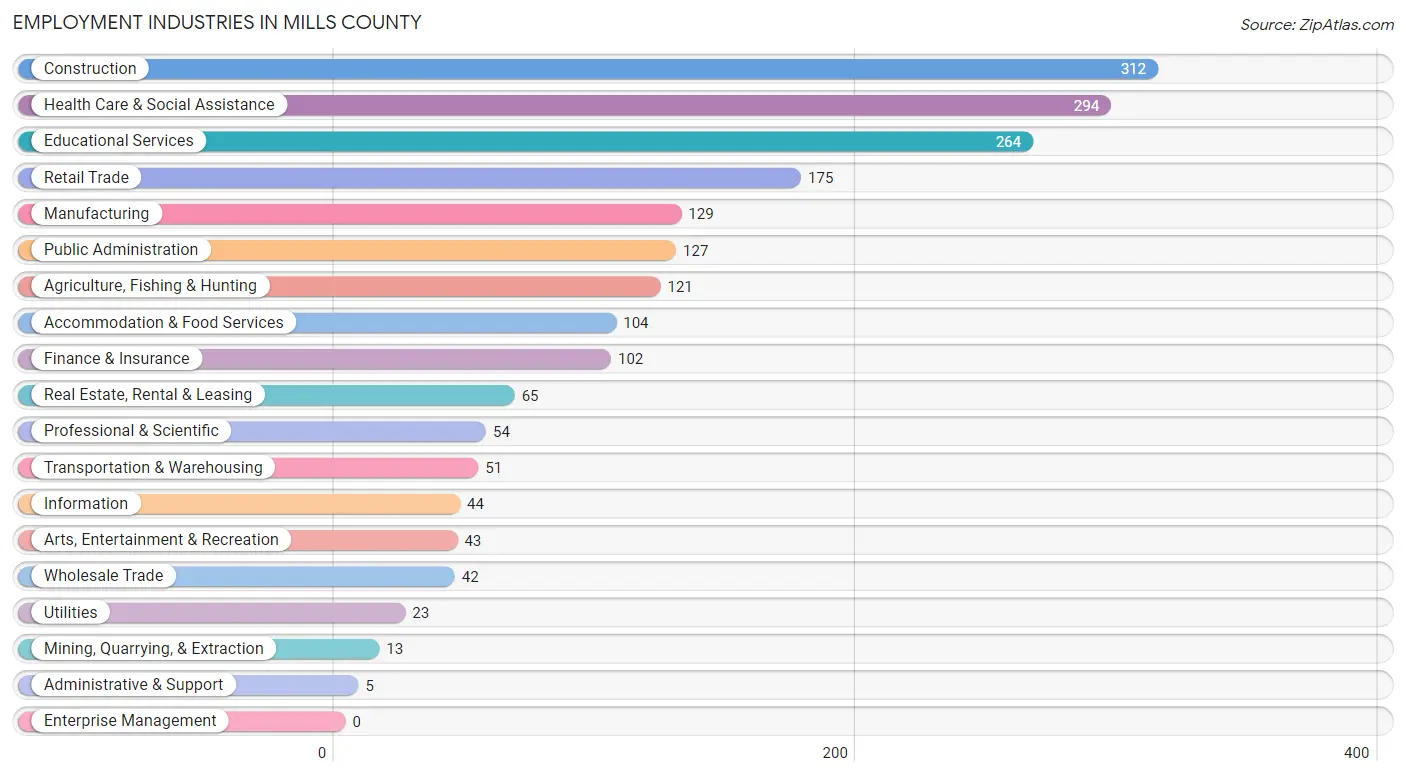
Employment Industries in Mills County
The major employment industries in Mills County include Construction (312 | 15.3%), Health Care & Social Assistance (294 | 14.5%), Educational Services (264 | 13.0%), Retail Trade (175 | 8.6%), and Manufacturing (129 | 6.4%).
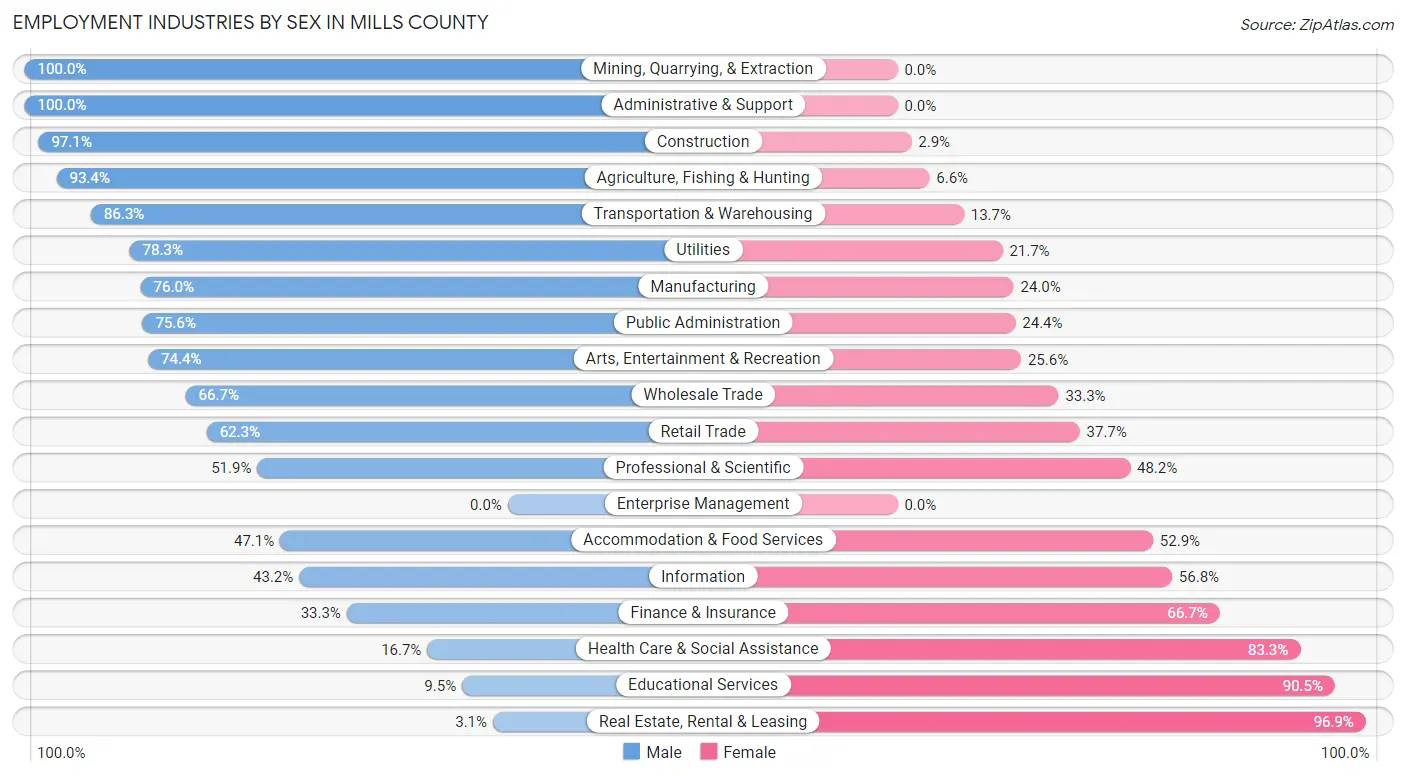
Employment Industries by Sex in Mills County
The Mills County industries that see more men than women are Mining, Quarrying, & Extraction (100.0%), Administrative & Support (100.0%), and Construction (97.1%), whereas the industries that tend to have a higher number of women are Real Estate, Rental & Leasing (96.9%), Educational Services (90.5%), and Health Care & Social Assistance (83.3%).
| Industry | Male | Female |
| Agriculture, Fishing & Hunting | 113 (93.4%) | 8 (6.6%) |
| Mining, Quarrying, & Extraction | 13 (100.0%) | 0 (0.0%) |
| Construction | 303 (97.1%) | 9 (2.9%) |
| Manufacturing | 98 (76.0%) | 31 (24.0%) |
| Wholesale Trade | 28 (66.7%) | 14 (33.3%) |
| Retail Trade | 109 (62.3%) | 66 (37.7%) |
| Transportation & Warehousing | 44 (86.3%) | 7 (13.7%) |
| Utilities | 18 (78.3%) | 5 (21.7%) |
| Information | 19 (43.2%) | 25 (56.8%) |
| Finance & Insurance | 34 (33.3%) | 68 (66.7%) |
| Real Estate, Rental & Leasing | 2 (3.1%) | 63 (96.9%) |
| Professional & Scientific | 28 (51.8%) | 26 (48.1%) |
| Enterprise Management | 0 (0.0%) | 0 (0.0%) |
| Administrative & Support | 5 (100.0%) | 0 (0.0%) |
| Educational Services | 25 (9.5%) | 239 (90.5%) |
| Health Care & Social Assistance | 49 (16.7%) | 245 (83.3%) |
| Arts, Entertainment & Recreation | 32 (74.4%) | 11 (25.6%) |
| Accommodation & Food Services | 49 (47.1%) | 55 (52.9%) |
| Public Administration | 96 (75.6%) | 31 (24.4%) |
| Total | 1,116 (54.9%) | 916 (45.1%) |
Education in Mills County
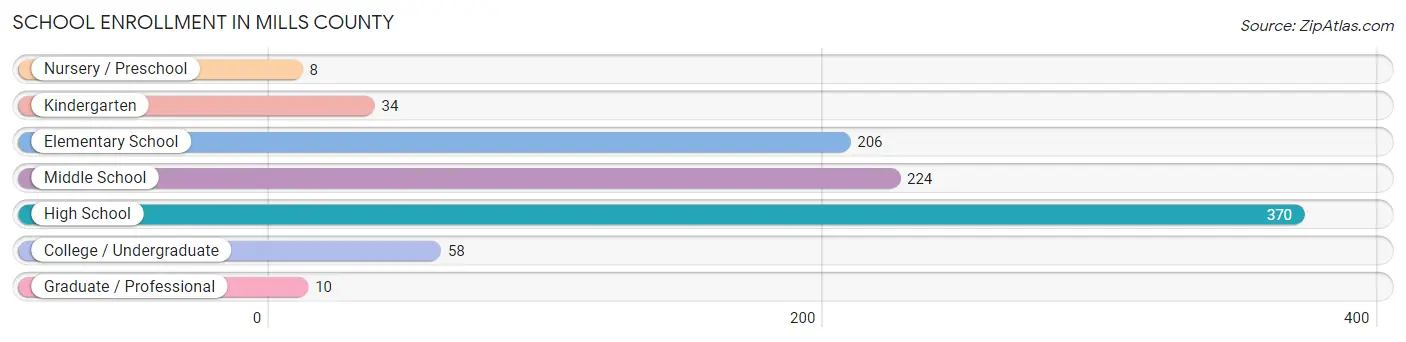
School Enrollment in Mills County
The most common levels of schooling among the 910 students in Mills County are high school (370 | 40.7%), middle school (224 | 24.6%), and elementary school (206 | 22.6%).
| School Level | # Students | % Students |
| Nursery / Preschool | 8 | 0.9% |
| Kindergarten | 34 | 3.7% |
| Elementary School | 206 | 22.6% |
| Middle School | 224 | 24.6% |
| High School | 370 | 40.7% |
| College / Undergraduate | 58 | 6.4% |
| Graduate / Professional | 10 | 1.1% |
| Total | 910 | 100.0% |
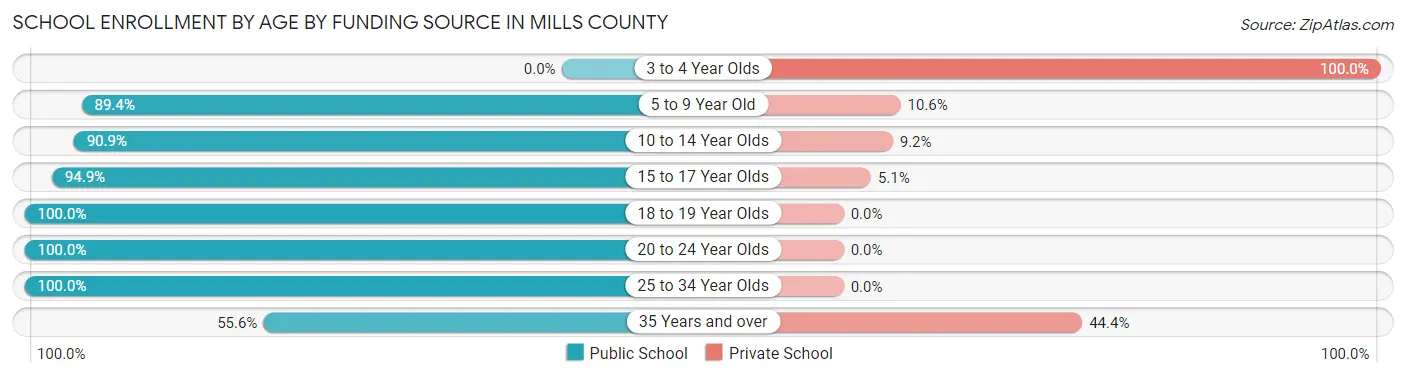
School Enrollment by Age by Funding Source in Mills County
Out of a total of 910 students who are enrolled in schools in Mills County, 73 (8.0%) attend a private institution, while the remaining 837 (92.0%) are enrolled in public schools. The age group of 3 to 4 year olds has the highest likelihood of being enrolled in private schools, with 3 (100.0% in the age bracket) enrolled. Conversely, the age group of 18 to 19 year olds has the lowest likelihood of being enrolled in a private school, with 111 (100.0% in the age bracket) attending a public institution.
| Age Bracket | Public School | Private School |
| 3 to 4 Year Olds | 0 (0.0%) | 3 (100.0%) |
| 5 to 9 Year Old | 177 (89.4%) | 21 (10.6%) |
| 10 to 14 Year Olds | 298 (90.8%) | 30 (9.1%) |
| 15 to 17 Year Olds | 205 (94.9%) | 11 (5.1%) |
| 18 to 19 Year Olds | 111 (100.0%) | 0 (0.0%) |
| 20 to 24 Year Olds | 14 (100.0%) | 0 (0.0%) |
| 25 to 34 Year Olds | 22 (100.0%) | 0 (0.0%) |
| 35 Years and over | 10 (55.6%) | 8 (44.4%) |
| Total | 837 (92.0%) | 73 (8.0%) |
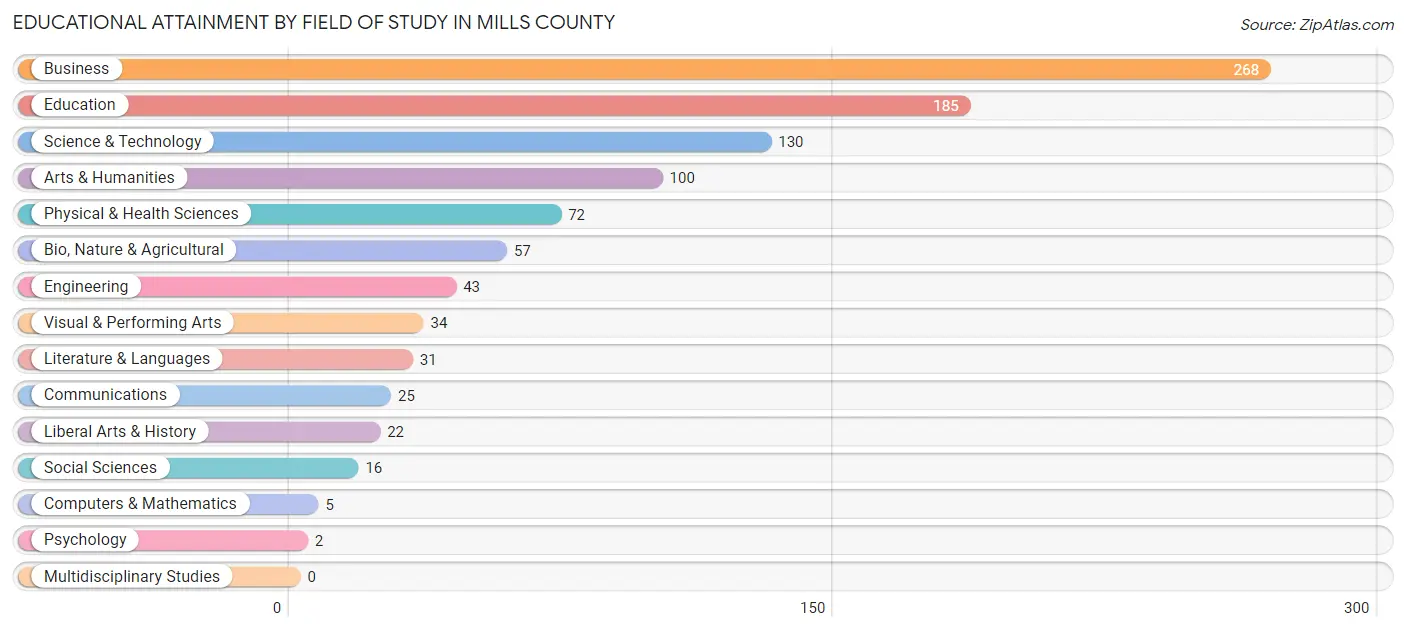
Educational Attainment by Field of Study in Mills County
Business (268 | 27.1%), education (185 | 18.7%), science & technology (130 | 13.1%), arts & humanities (100 | 10.1%), and physical & health sciences (72 | 7.3%) are the most common fields of study among 990 individuals in Mills County who have obtained a bachelor's degree or higher.
| Field of Study | # Graduates | % Graduates |
| Computers & Mathematics | 5 | 0.5% |
| Bio, Nature & Agricultural | 57 | 5.8% |
| Physical & Health Sciences | 72 | 7.3% |
| Psychology | 2 | 0.2% |
| Social Sciences | 16 | 1.6% |
| Engineering | 43 | 4.3% |
| Multidisciplinary Studies | 0 | 0.0% |
| Science & Technology | 130 | 13.1% |
| Business | 268 | 27.1% |
| Education | 185 | 18.7% |
| Literature & Languages | 31 | 3.1% |
| Liberal Arts & History | 22 | 2.2% |
| Visual & Performing Arts | 34 | 3.4% |
| Communications | 25 | 2.5% |
| Arts & Humanities | 100 | 10.1% |
| Total | 990 | 100.0% |
Transportation & Commute in Mills County
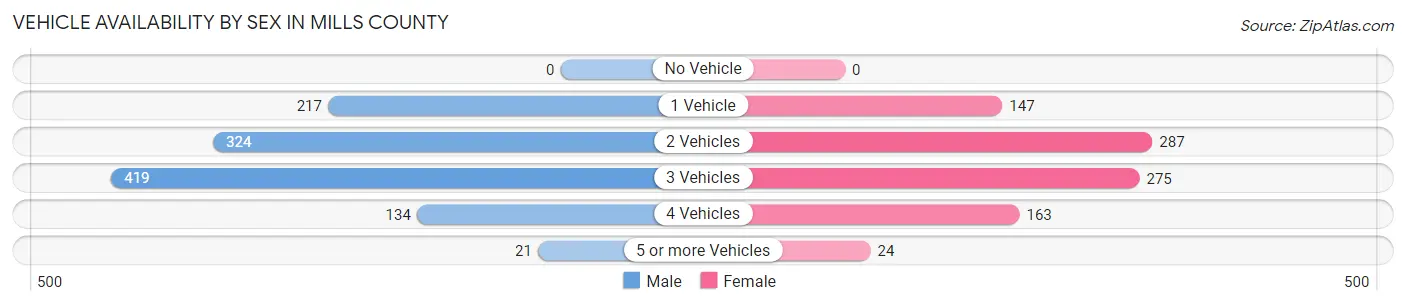
Vehicle Availability by Sex in Mills County
The most prevalent vehicle ownership categories in Mills County are males with 3 vehicles (419, accounting for 37.6%) and females with 3 vehicles (275, making up 46.8%).
| Vehicles Available | Male | Female |
| No Vehicle | 0 (0.0%) | 0 (0.0%) |
| 1 Vehicle | 217 (19.5%) | 147 (16.4%) |
| 2 Vehicles | 324 (29.1%) | 287 (32.0%) |
| 3 Vehicles | 419 (37.6%) | 275 (30.7%) |
| 4 Vehicles | 134 (12.0%) | 163 (18.2%) |
| 5 or more Vehicles | 21 (1.9%) | 24 (2.7%) |
| Total | 1,115 (100.0%) | 896 (100.0%) |
Commute Time in Mills County
The most frequently occuring commute durations in Mills County are 5 to 9 minutes (341 commuters, 18.1%), less than 5 minutes (338 commuters, 18.0%), and 10 to 14 minutes (298 commuters, 15.8%).
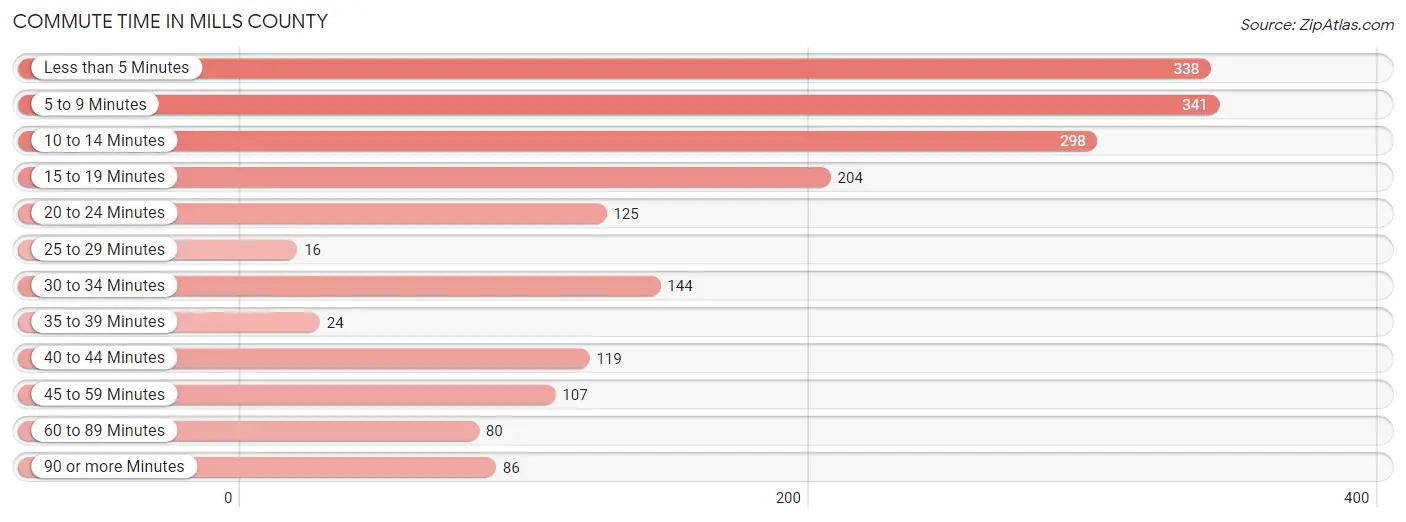
| Commute Time | # Commuters | % Commuters |
| Less than 5 Minutes | 338 | 18.0% |
| 5 to 9 Minutes | 341 | 18.1% |
| 10 to 14 Minutes | 298 | 15.8% |
| 15 to 19 Minutes | 204 | 10.8% |
| 20 to 24 Minutes | 125 | 6.6% |
| 25 to 29 Minutes | 16 | 0.9% |
| 30 to 34 Minutes | 144 | 7.6% |
| 35 to 39 Minutes | 24 | 1.3% |
| 40 to 44 Minutes | 119 | 6.3% |
| 45 to 59 Minutes | 107 | 5.7% |
| 60 to 89 Minutes | 80 | 4.3% |
| 90 or more Minutes | 86 | 4.6% |
Commute Time by Sex in Mills County
The most common commute times in Mills County are 5 to 9 minutes (187 commuters, 18.0%) for males and less than 5 minutes (177 commuters, 20.9%) for females.
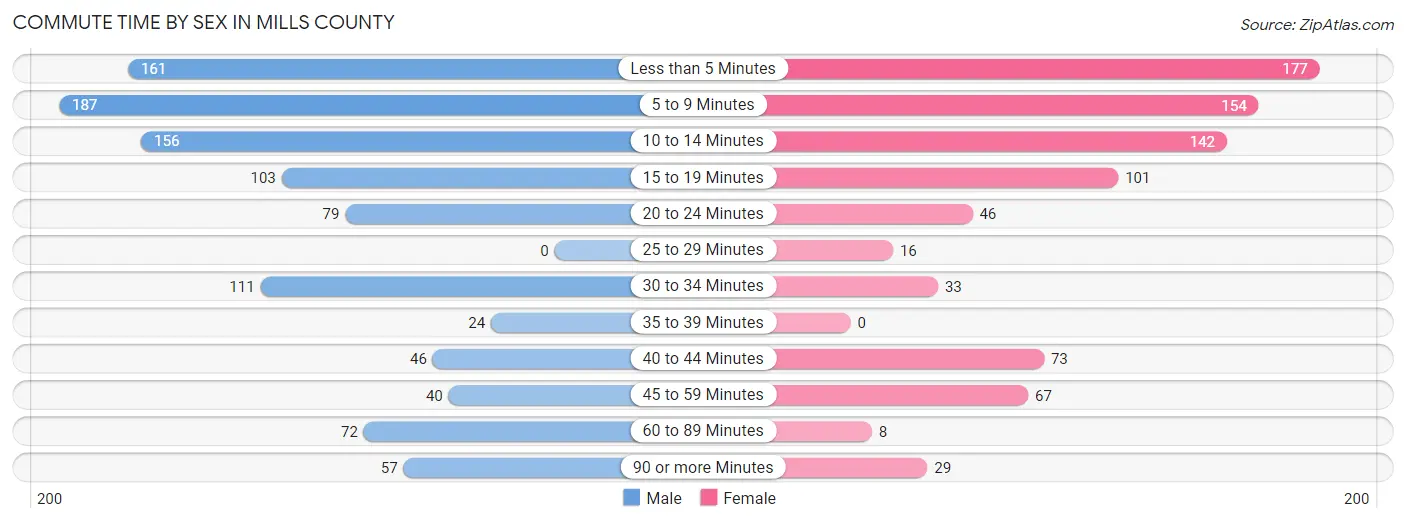
| Commute Time | Male | Female |
| Less than 5 Minutes | 161 (15.5%) | 177 (20.9%) |
| 5 to 9 Minutes | 187 (18.0%) | 154 (18.2%) |
| 10 to 14 Minutes | 156 (15.1%) | 142 (16.8%) |
| 15 to 19 Minutes | 103 (9.9%) | 101 (11.9%) |
| 20 to 24 Minutes | 79 (7.6%) | 46 (5.4%) |
| 25 to 29 Minutes | 0 (0.0%) | 16 (1.9%) |
| 30 to 34 Minutes | 111 (10.7%) | 33 (3.9%) |
| 35 to 39 Minutes | 24 (2.3%) | 0 (0.0%) |
| 40 to 44 Minutes | 46 (4.4%) | 73 (8.6%) |
| 45 to 59 Minutes | 40 (3.9%) | 67 (7.9%) |
| 60 to 89 Minutes | 72 (7.0%) | 8 (0.9%) |
| 90 or more Minutes | 57 (5.5%) | 29 (3.4%) |
Time of Departure to Work by Sex in Mills County
The most frequent times of departure to work in Mills County are 8:00 AM to 8:29 AM (235, 22.7%) for males and 7:30 AM to 7:59 AM (197, 23.3%) for females.
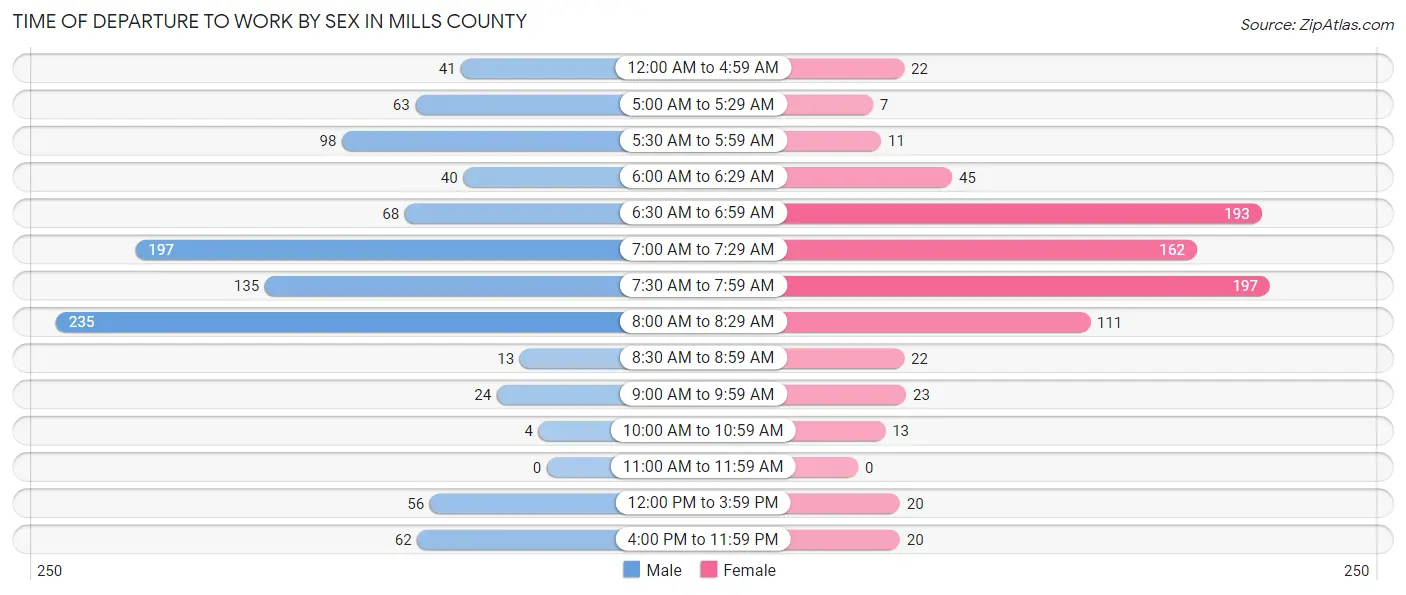
| Time of Departure | Male | Female |
| 12:00 AM to 4:59 AM | 41 (4.0%) | 22 (2.6%) |
| 5:00 AM to 5:29 AM | 63 (6.1%) | 7 (0.8%) |
| 5:30 AM to 5:59 AM | 98 (9.5%) | 11 (1.3%) |
| 6:00 AM to 6:29 AM | 40 (3.9%) | 45 (5.3%) |
| 6:30 AM to 6:59 AM | 68 (6.6%) | 193 (22.8%) |
| 7:00 AM to 7:29 AM | 197 (19.0%) | 162 (19.2%) |
| 7:30 AM to 7:59 AM | 135 (13.0%) | 197 (23.3%) |
| 8:00 AM to 8:29 AM | 235 (22.7%) | 111 (13.1%) |
| 8:30 AM to 8:59 AM | 13 (1.3%) | 22 (2.6%) |
| 9:00 AM to 9:59 AM | 24 (2.3%) | 23 (2.7%) |
| 10:00 AM to 10:59 AM | 4 (0.4%) | 13 (1.5%) |
| 11:00 AM to 11:59 AM | 0 (0.0%) | 0 (0.0%) |
| 12:00 PM to 3:59 PM | 56 (5.4%) | 20 (2.4%) |
| 4:00 PM to 11:59 PM | 62 (6.0%) | 20 (2.4%) |
| Total | 1,036 (100.0%) | 846 (100.0%) |
Housing Occupancy in Mills County
Occupancy by Ownership in Mills County
Of the total 1,833 dwellings in Mills County, owner-occupied units account for 1,561 (85.2%), while renter-occupied units make up 272 (14.8%).
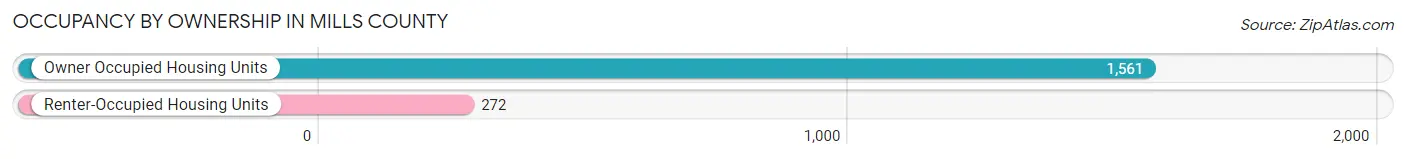
| Occupancy | # Housing Units | % Housing Units |
| Owner Occupied Housing Units | 1,561 | 85.2% |
| Renter-Occupied Housing Units | 272 | 14.8% |
| Total Occupied Housing Units | 1,833 | 100.0% |
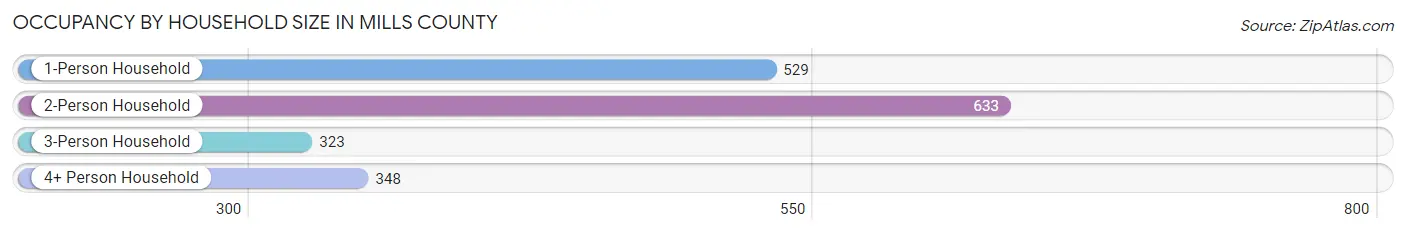
Occupancy by Household Size in Mills County
| Household Size | # Housing Units | % Housing Units |
| 1-Person Household | 529 | 28.9% |
| 2-Person Household | 633 | 34.5% |
| 3-Person Household | 323 | 17.6% |
| 4+ Person Household | 348 | 19.0% |
| Total Housing Units | 1,833 | 100.0% |
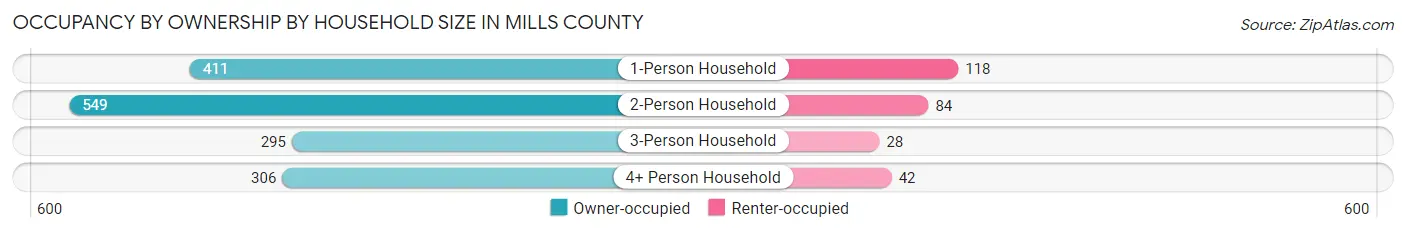
Occupancy by Ownership by Household Size in Mills County
| Household Size | Owner-occupied | Renter-occupied |
| 1-Person Household | 411 (77.7%) | 118 (22.3%) |
| 2-Person Household | 549 (86.7%) | 84 (13.3%) |
| 3-Person Household | 295 (91.3%) | 28 (8.7%) |
| 4+ Person Household | 306 (87.9%) | 42 (12.1%) |
| Total Housing Units | 1,561 (85.2%) | 272 (14.8%) |
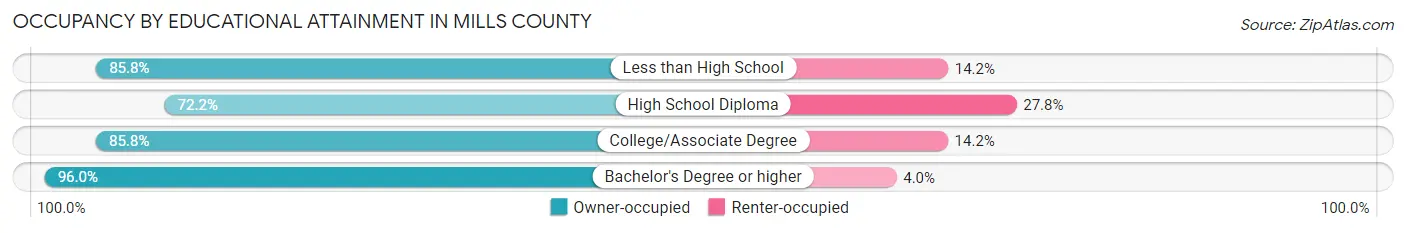
Occupancy by Educational Attainment in Mills County
| Household Size | Owner-occupied | Renter-occupied |
| Less than High School | 151 (85.8%) | 25 (14.2%) |
| High School Diploma | 390 (72.2%) | 150 (27.8%) |
| College/Associate Degree | 442 (85.8%) | 73 (14.2%) |
| Bachelor's Degree or higher | 578 (96.0%) | 24 (4.0%) |
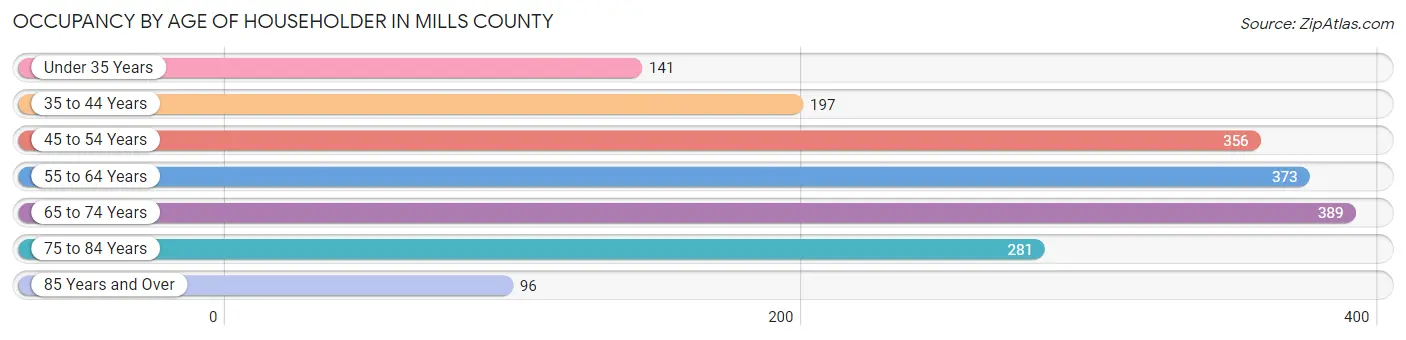
Occupancy by Age of Householder in Mills County
| Age Bracket | # Households | % Households |
| Under 35 Years | 141 | 7.7% |
| 35 to 44 Years | 197 | 10.7% |
| 45 to 54 Years | 356 | 19.4% |
| 55 to 64 Years | 373 | 20.3% |
| 65 to 74 Years | 389 | 21.2% |
| 75 to 84 Years | 281 | 15.3% |
| 85 Years and Over | 96 | 5.2% |
| Total | 1,833 | 100.0% |
Housing Finances in Mills County
Median Income by Occupancy in Mills County
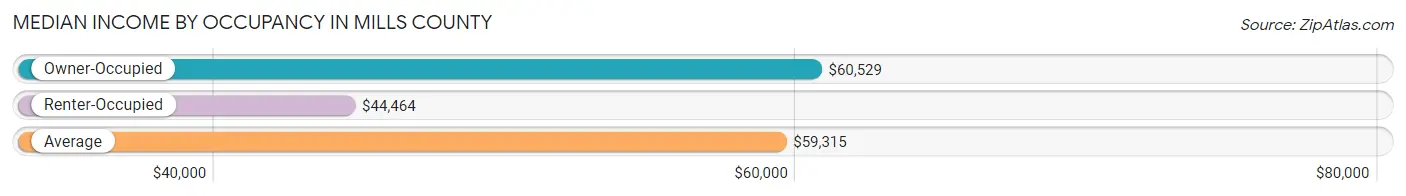
| Occupancy Type | # Households | Median Income |
| Owner-Occupied | 1,561 (85.2%) | $60,529 |
| Renter-Occupied | 272 (14.8%) | $44,464 |
| Average | 1,833 (100.0%) | $59,315 |
Occupancy by Householder Income Bracket in Mills County
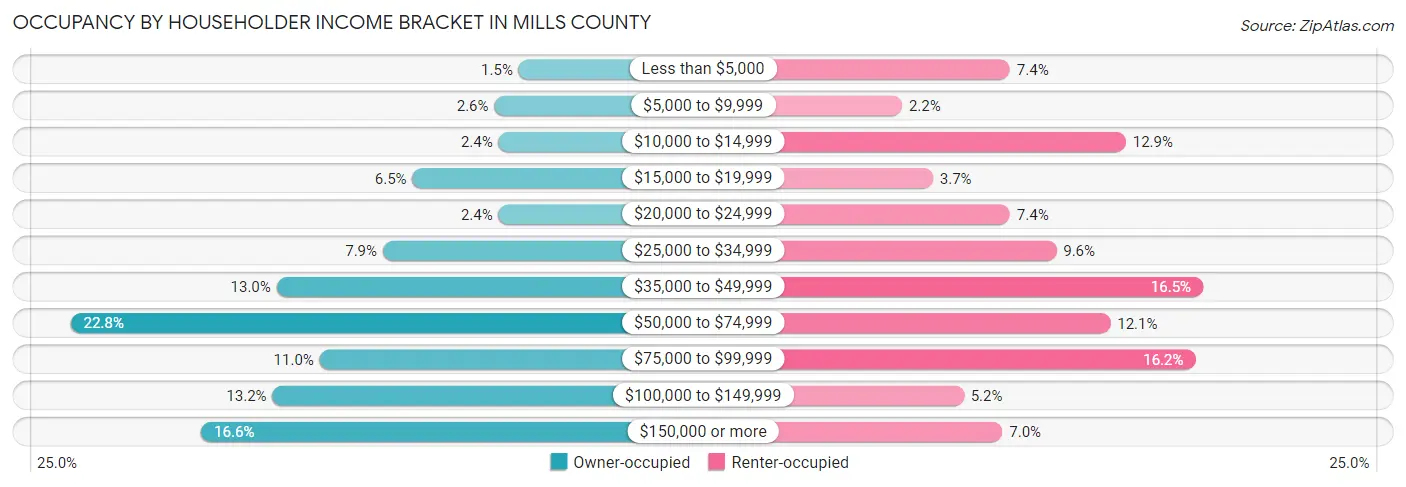
| Income Bracket | Owner-occupied | Renter-occupied |
| Less than $5,000 | 23 (1.5%) | 20 (7.3%) |
| $5,000 to $9,999 | 41 (2.6%) | 6 (2.2%) |
| $10,000 to $14,999 | 38 (2.4%) | 35 (12.9%) |
| $15,000 to $19,999 | 102 (6.5%) | 10 (3.7%) |
| $20,000 to $24,999 | 38 (2.4%) | 20 (7.3%) |
| $25,000 to $34,999 | 124 (7.9%) | 26 (9.6%) |
| $35,000 to $49,999 | 203 (13.0%) | 45 (16.5%) |
| $50,000 to $74,999 | 356 (22.8%) | 33 (12.1%) |
| $75,000 to $99,999 | 171 (11.0%) | 44 (16.2%) |
| $100,000 to $149,999 | 206 (13.2%) | 14 (5.1%) |
| $150,000 or more | 259 (16.6%) | 19 (7.0%) |
| Total | 1,561 (100.0%) | 272 (100.0%) |
Monthly Housing Cost Tiers in Mills County
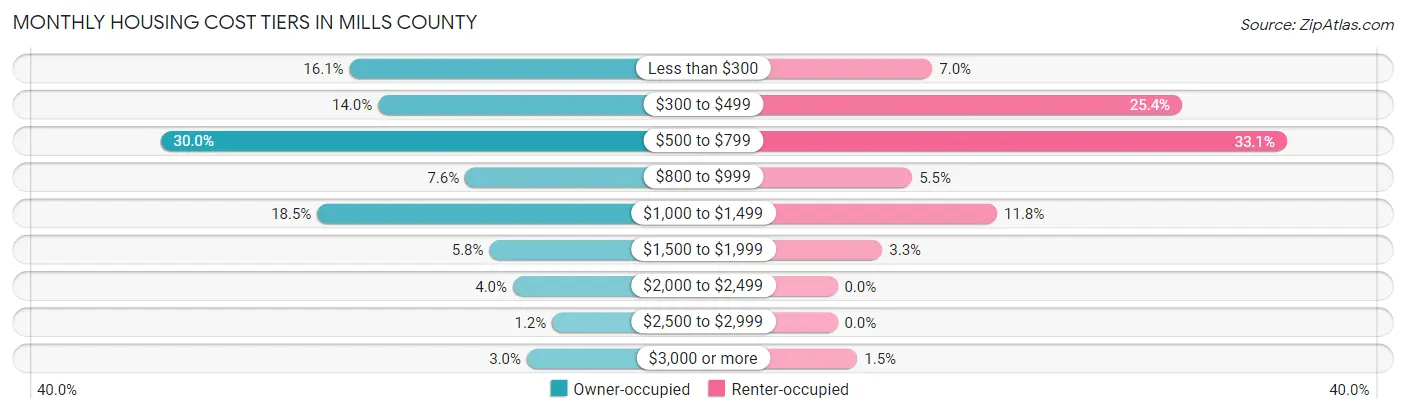
| Monthly Cost | Owner-occupied | Renter-occupied |
| Less than $300 | 251 (16.1%) | 19 (7.0%) |
| $300 to $499 | 218 (14.0%) | 69 (25.4%) |
| $500 to $799 | 468 (30.0%) | 90 (33.1%) |
| $800 to $999 | 118 (7.6%) | 15 (5.5%) |
| $1,000 to $1,499 | 288 (18.4%) | 32 (11.8%) |
| $1,500 to $1,999 | 90 (5.8%) | 9 (3.3%) |
| $2,000 to $2,499 | 63 (4.0%) | 0 (0.0%) |
| $2,500 to $2,999 | 18 (1.1%) | 0 (0.0%) |
| $3,000 or more | 47 (3.0%) | 4 (1.5%) |
| Total | 1,561 (100.0%) | 272 (100.0%) |
Physical Housing Characteristics in Mills County
Housing Structures in Mills County
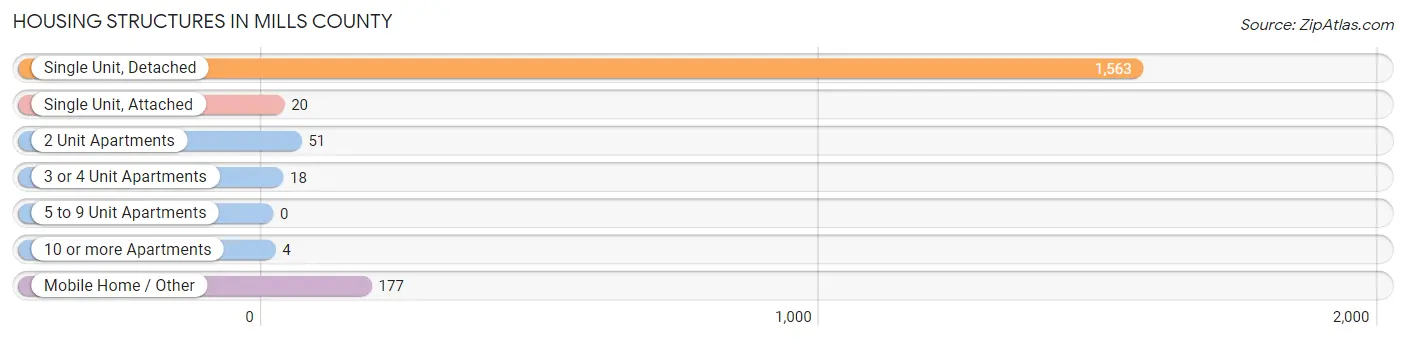
| Structure Type | # Housing Units | % Housing Units |
| Single Unit, Detached | 1,563 | 85.3% |
| Single Unit, Attached | 20 | 1.1% |
| 2 Unit Apartments | 51 | 2.8% |
| 3 or 4 Unit Apartments | 18 | 1.0% |
| 5 to 9 Unit Apartments | 0 | 0.0% |
| 10 or more Apartments | 4 | 0.2% |
| Mobile Home / Other | 177 | 9.7% |
| Total | 1,833 | 100.0% |
Housing Structures by Occupancy in Mills County
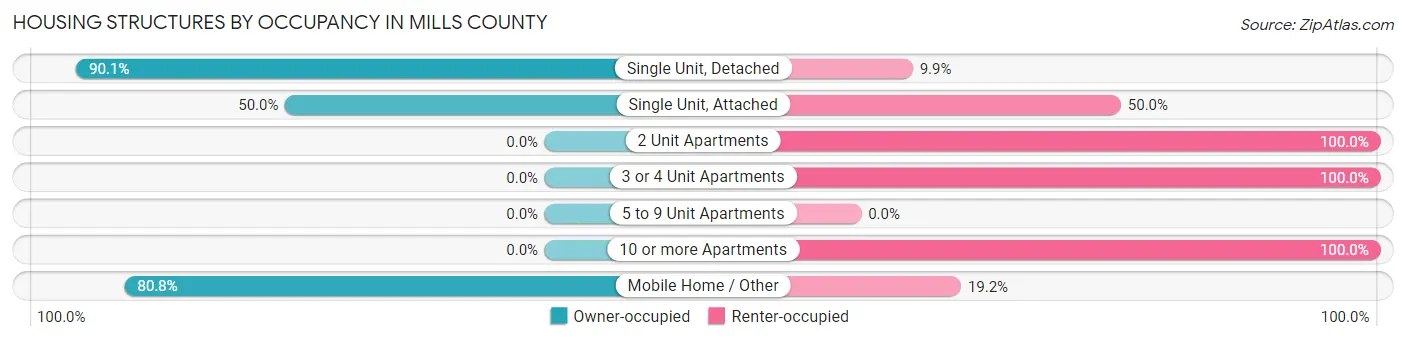
| Structure Type | Owner-occupied | Renter-occupied |
| Single Unit, Detached | 1,408 (90.1%) | 155 (9.9%) |
| Single Unit, Attached | 10 (50.0%) | 10 (50.0%) |
| 2 Unit Apartments | 0 (0.0%) | 51 (100.0%) |
| 3 or 4 Unit Apartments | 0 (0.0%) | 18 (100.0%) |
| 5 to 9 Unit Apartments | 0 (0.0%) | 0 (0.0%) |
| 10 or more Apartments | 0 (0.0%) | 4 (100.0%) |
| Mobile Home / Other | 143 (80.8%) | 34 (19.2%) |
| Total | 1,561 (85.2%) | 272 (14.8%) |
Housing Structures by Number of Rooms in Mills County
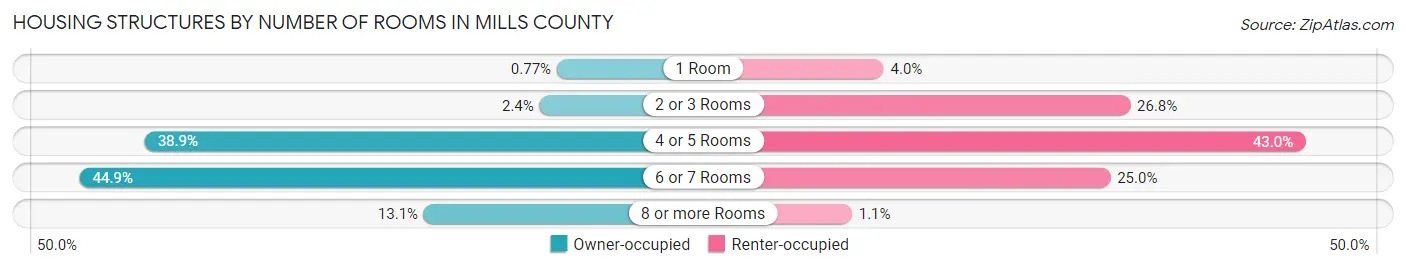
| Number of Rooms | Owner-occupied | Renter-occupied |
| 1 Room | 12 (0.8%) | 11 (4.0%) |
| 2 or 3 Rooms | 37 (2.4%) | 73 (26.8%) |
| 4 or 5 Rooms | 607 (38.9%) | 117 (43.0%) |
| 6 or 7 Rooms | 701 (44.9%) | 68 (25.0%) |
| 8 or more Rooms | 204 (13.1%) | 3 (1.1%) |
| Total | 1,561 (100.0%) | 272 (100.0%) |
Housing Structure by Heating Type in Mills County
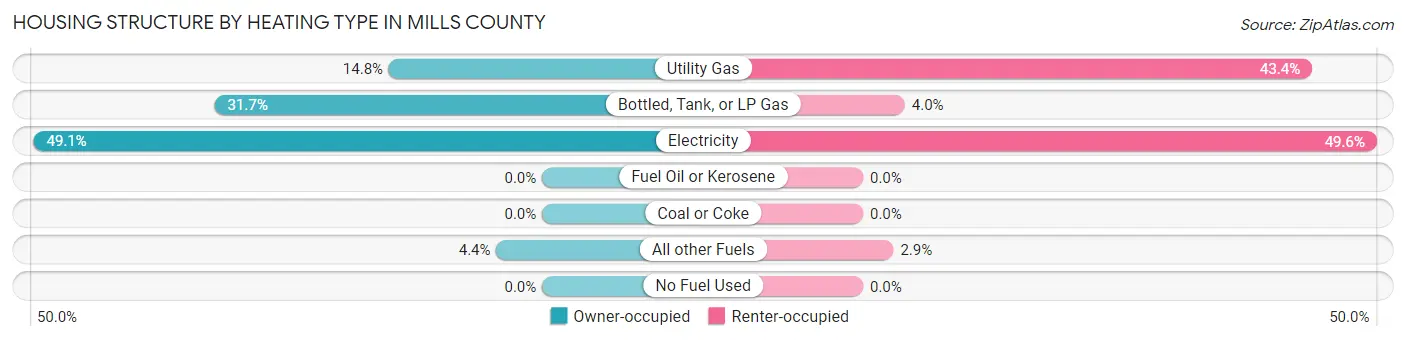
| Heating Type | Owner-occupied | Renter-occupied |
| Utility Gas | 231 (14.8%) | 118 (43.4%) |
| Bottled, Tank, or LP Gas | 494 (31.7%) | 11 (4.0%) |
| Electricity | 767 (49.1%) | 135 (49.6%) |
| Fuel Oil or Kerosene | 0 (0.0%) | 0 (0.0%) |
| Coal or Coke | 0 (0.0%) | 0 (0.0%) |
| All other Fuels | 69 (4.4%) | 8 (2.9%) |
| No Fuel Used | 0 (0.0%) | 0 (0.0%) |
| Total | 1,561 (100.0%) | 272 (100.0%) |
Household Vehicle Usage in Mills County
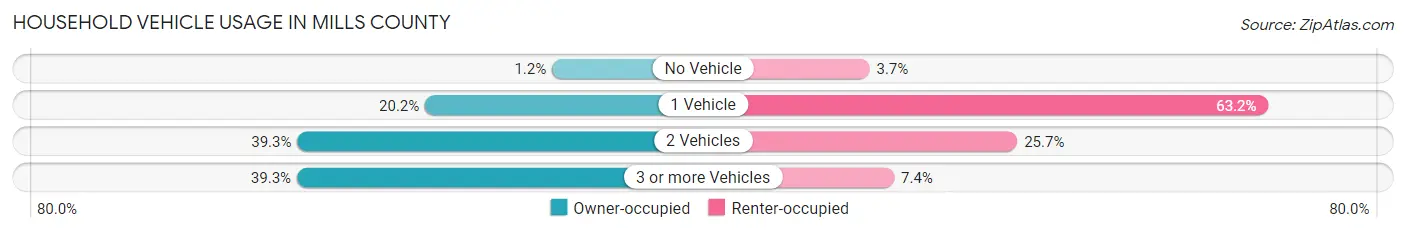
| Vehicles per Household | Owner-occupied | Renter-occupied |
| No Vehicle | 19 (1.2%) | 10 (3.7%) |
| 1 Vehicle | 315 (20.2%) | 172 (63.2%) |
| 2 Vehicles | 613 (39.3%) | 70 (25.7%) |
| 3 or more Vehicles | 614 (39.3%) | 20 (7.3%) |
| Total | 1,561 (100.0%) | 272 (100.0%) |
Real Estate & Mortgages in Mills County
Real Estate and Mortgage Overview in Mills County
| Characteristic | Without Mortgage | With Mortgage |
| Housing Units | 1,054 | 507 |
| Median Property Value | $195,800 | $165,900 |
| Median Household Income | $56,905 | $139 |
| Monthly Housing Costs | $527 | $42 |
| Real Estate Taxes | $1,482 | $5 |
Property Value by Mortgage Status in Mills County
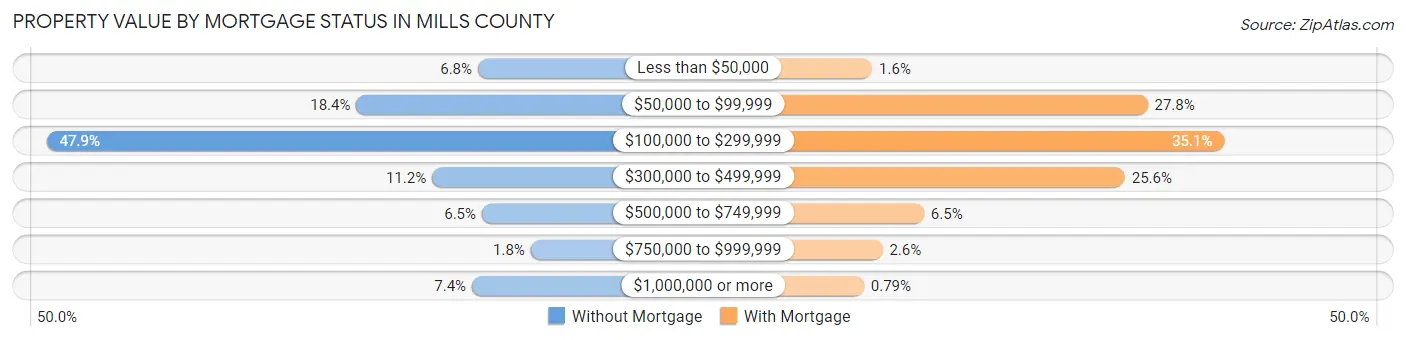
| Property Value | Without Mortgage | With Mortgage |
| Less than $50,000 | 72 (6.8%) | 8 (1.6%) |
| $50,000 to $99,999 | 194 (18.4%) | 141 (27.8%) |
| $100,000 to $299,999 | 505 (47.9%) | 178 (35.1%) |
| $300,000 to $499,999 | 118 (11.2%) | 130 (25.6%) |
| $500,000 to $749,999 | 68 (6.5%) | 33 (6.5%) |
| $750,000 to $999,999 | 19 (1.8%) | 13 (2.6%) |
| $1,000,000 or more | 78 (7.4%) | 4 (0.8%) |
| Total | 1,054 (100.0%) | 507 (100.0%) |
Household Income by Mortgage Status in Mills County
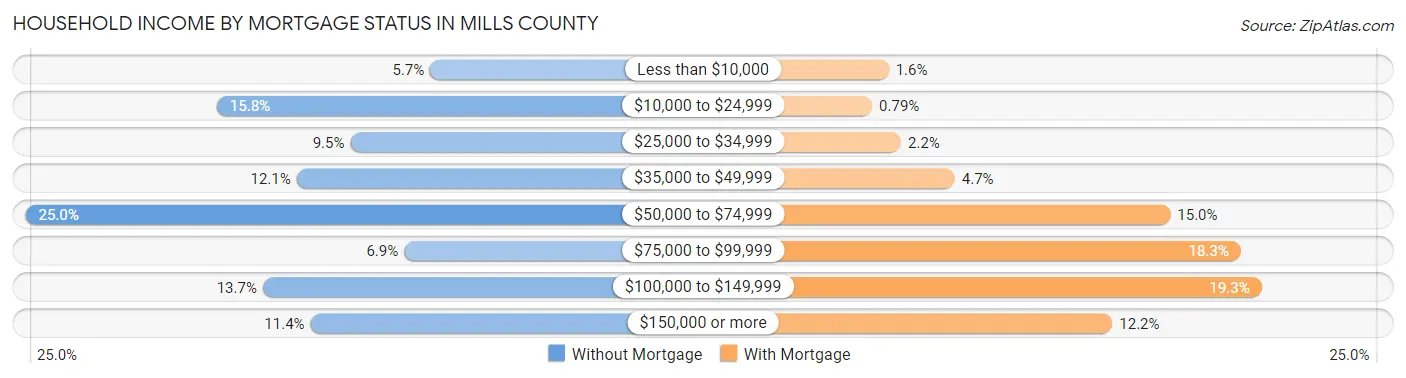
| Household Income | Without Mortgage | With Mortgage |
| Less than $10,000 | 60 (5.7%) | 8 (1.6%) |
| $10,000 to $24,999 | 167 (15.8%) | 4 (0.8%) |
| $25,000 to $34,999 | 100 (9.5%) | 11 (2.2%) |
| $35,000 to $49,999 | 127 (12.0%) | 24 (4.7%) |
| $50,000 to $74,999 | 263 (24.9%) | 76 (15.0%) |
| $75,000 to $99,999 | 73 (6.9%) | 93 (18.3%) |
| $100,000 to $149,999 | 144 (13.7%) | 98 (19.3%) |
| $150,000 or more | 120 (11.4%) | 62 (12.2%) |
| Total | 1,054 (100.0%) | 507 (100.0%) |
Property Value to Household Income Ratio in Mills County
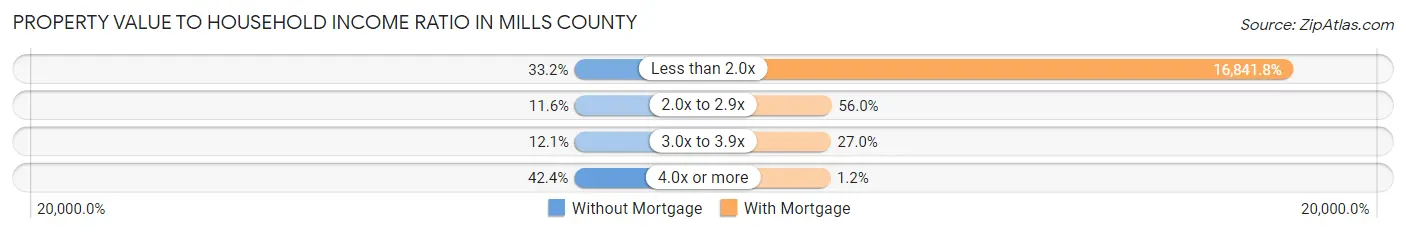
| Value-to-Income Ratio | Without Mortgage | With Mortgage |
| Less than 2.0x | 350 (33.2%) | 85,388 (16,841.8%) |
| 2.0x to 2.9x | 122 (11.6%) | 284 (56.0%) |
| 3.0x to 3.9x | 128 (12.1%) | 137 (27.0%) |
| 4.0x or more | 447 (42.4%) | 6 (1.2%) |
| Total | 1,054 (100.0%) | 507 (100.0%) |
Real Estate Taxes by Mortgage Status in Mills County
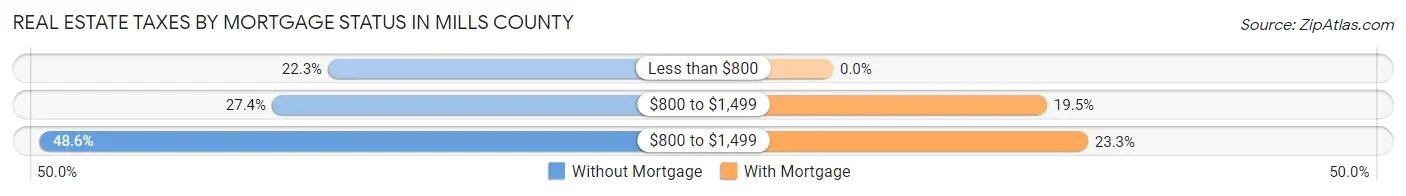
| Property Taxes | Without Mortgage | With Mortgage |
| Less than $800 | 235 (22.3%) | 0 (0.0%) |
| $800 to $1,499 | 289 (27.4%) | 99 (19.5%) |
| $800 to $1,499 | 512 (48.6%) | 118 (23.3%) |
| Total | 1,054 (100.0%) | 507 (100.0%) |
Health & Disability in Mills County
Health Insurance Coverage by Age in Mills County
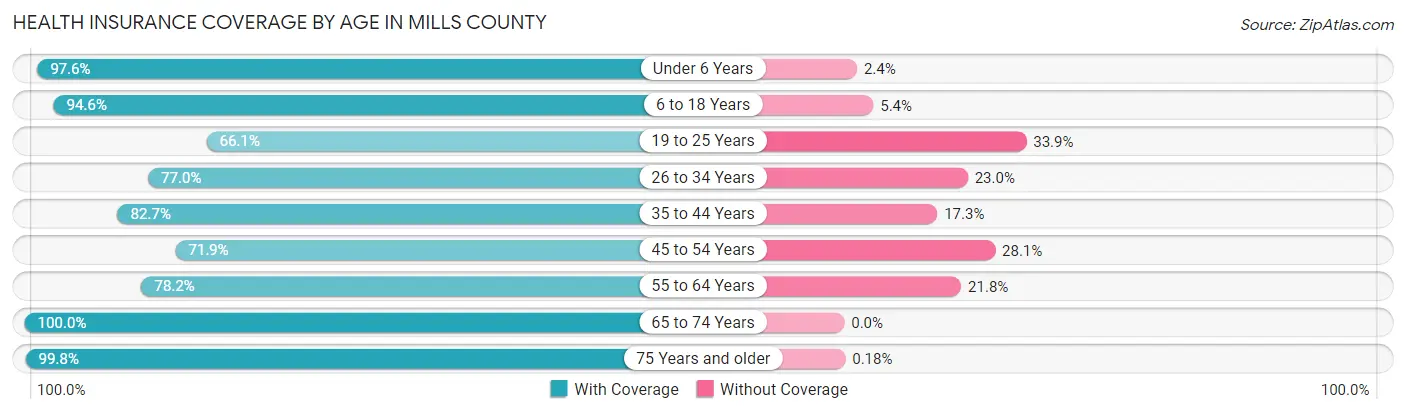
| Age Bracket | With Coverage | Without Coverage |
| Under 6 Years | 124 (97.6%) | 3 (2.4%) |
| 6 to 18 Years | 752 (94.6%) | 43 (5.4%) |
| 19 to 25 Years | 109 (66.1%) | 56 (33.9%) |
| 26 to 34 Years | 224 (77.0%) | 67 (23.0%) |
| 35 to 44 Years | 353 (82.7%) | 74 (17.3%) |
| 45 to 54 Years | 529 (71.9%) | 207 (28.1%) |
| 55 to 64 Years | 488 (78.2%) | 136 (21.8%) |
| 65 to 74 Years | 614 (100.0%) | 0 (0.0%) |
| 75 Years and older | 559 (99.8%) | 1 (0.2%) |
| Total | 3,752 (86.5%) | 587 (13.5%) |
Health Insurance Coverage by Citizenship Status in Mills County
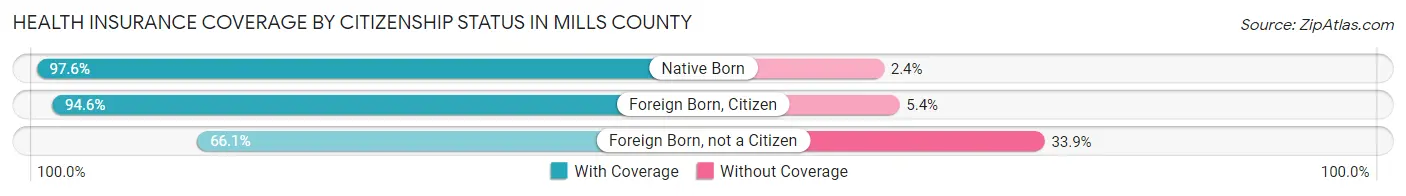
| Citizenship Status | With Coverage | Without Coverage |
| Native Born | 124 (97.6%) | 3 (2.4%) |
| Foreign Born, Citizen | 752 (94.6%) | 43 (5.4%) |
| Foreign Born, not a Citizen | 109 (66.1%) | 56 (33.9%) |
Health Insurance Coverage by Household Income in Mills County
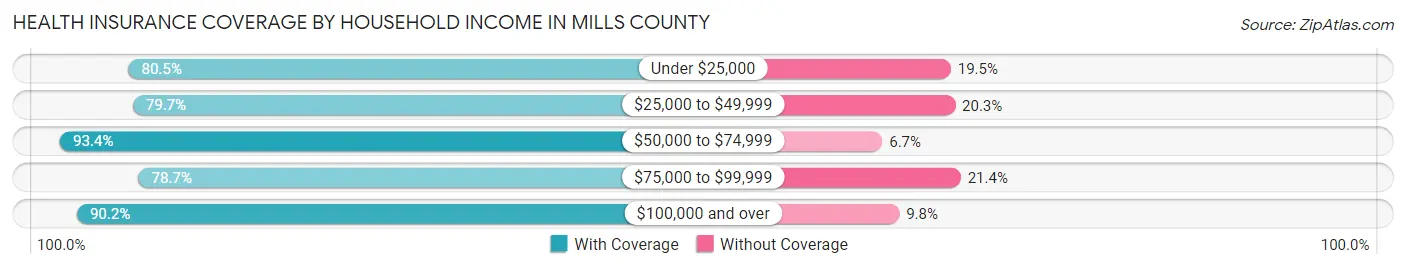
| Household Income | With Coverage | Without Coverage |
| Under $25,000 | 339 (80.5%) | 82 (19.5%) |
| $25,000 to $49,999 | 597 (79.7%) | 152 (20.3%) |
| $50,000 to $74,999 | 955 (93.3%) | 68 (6.7%) |
| $75,000 to $99,999 | 490 (78.6%) | 133 (21.3%) |
| $100,000 and over | 1,368 (90.2%) | 149 (9.8%) |
Public vs Private Health Insurance Coverage by Age in Mills County
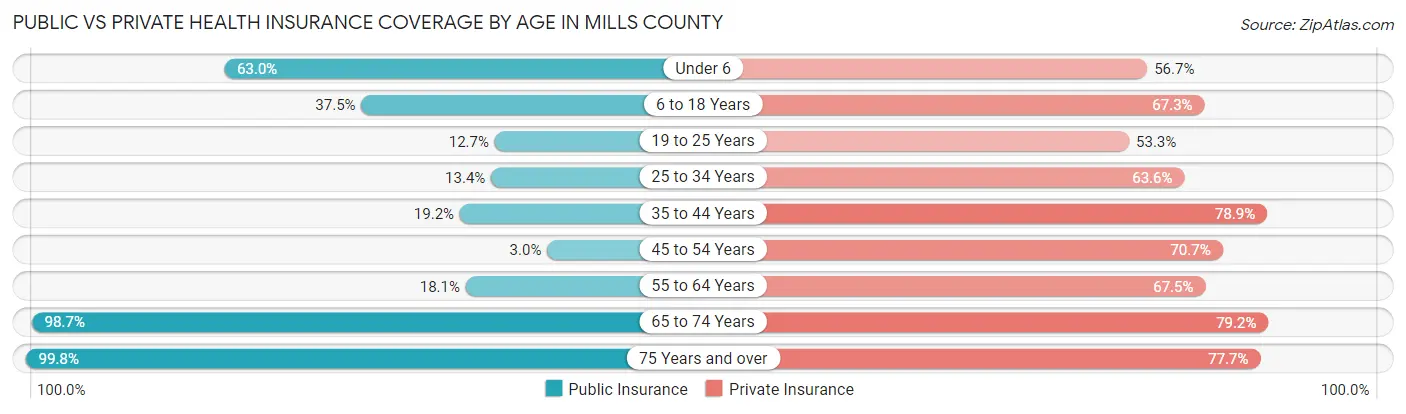
| Age Bracket | Public Insurance | Private Insurance |
| Under 6 | 80 (63.0%) | 72 (56.7%) |
| 6 to 18 Years | 298 (37.5%) | 535 (67.3%) |
| 19 to 25 Years | 21 (12.7%) | 88 (53.3%) |
| 25 to 34 Years | 39 (13.4%) | 185 (63.6%) |
| 35 to 44 Years | 82 (19.2%) | 337 (78.9%) |
| 45 to 54 Years | 22 (3.0%) | 520 (70.7%) |
| 55 to 64 Years | 113 (18.1%) | 421 (67.5%) |
| 65 to 74 Years | 606 (98.7%) | 486 (79.1%) |
| 75 Years and over | 559 (99.8%) | 435 (77.7%) |
| Total | 1,820 (41.9%) | 3,079 (71.0%) |
Disability Status by Sex by Age in Mills County
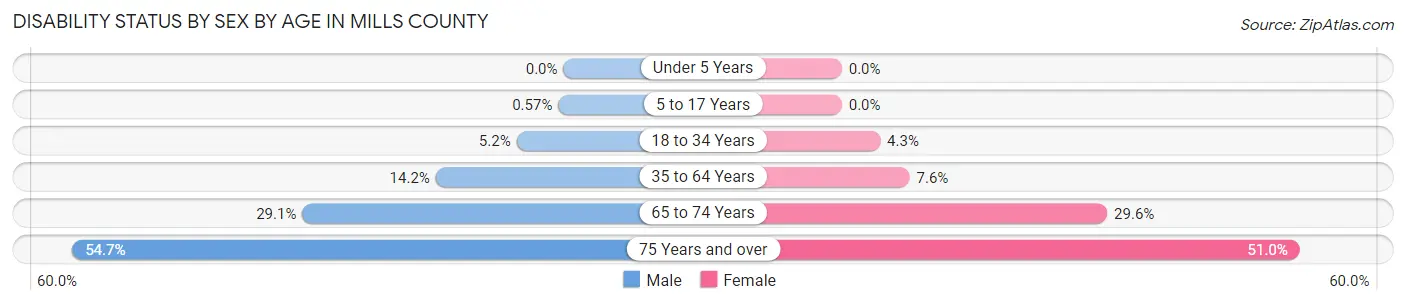
| Age Bracket | Male | Female |
| Under 5 Years | 0 (0.0%) | 0 (0.0%) |
| 5 to 17 Years | 2 (0.6%) | 0 (0.0%) |
| 18 to 34 Years | 18 (5.2%) | 10 (4.3%) |
| 35 to 64 Years | 128 (14.2%) | 67 (7.5%) |
| 65 to 74 Years | 89 (29.1%) | 91 (29.5%) |
| 75 Years and over | 140 (54.7%) | 155 (51.0%) |
Disability Class by Sex by Age in Mills County
Disability Class: Hearing Difficulty
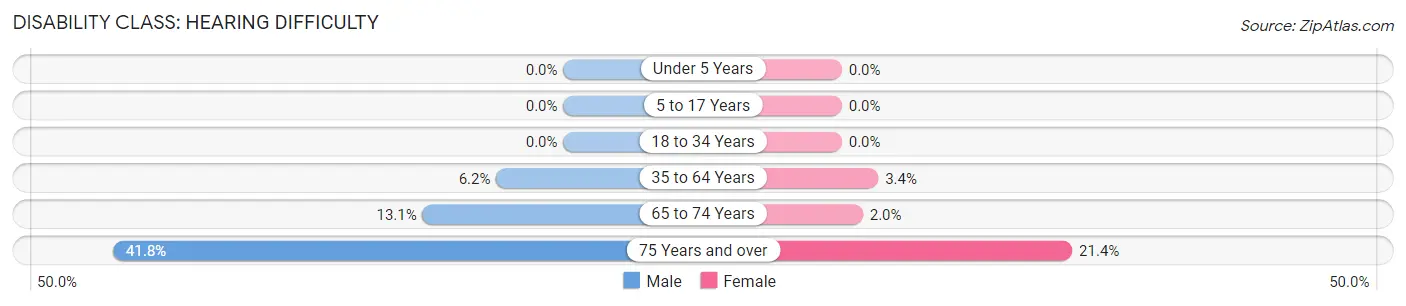
| Age Bracket | Male | Female |
| Under 5 Years | 0 (0.0%) | 0 (0.0%) |
| 5 to 17 Years | 0 (0.0%) | 0 (0.0%) |
| 18 to 34 Years | 0 (0.0%) | 0 (0.0%) |
| 35 to 64 Years | 56 (6.2%) | 30 (3.4%) |
| 65 to 74 Years | 40 (13.1%) | 6 (1.9%) |
| 75 Years and over | 107 (41.8%) | 65 (21.4%) |
Disability Class: Vision Difficulty
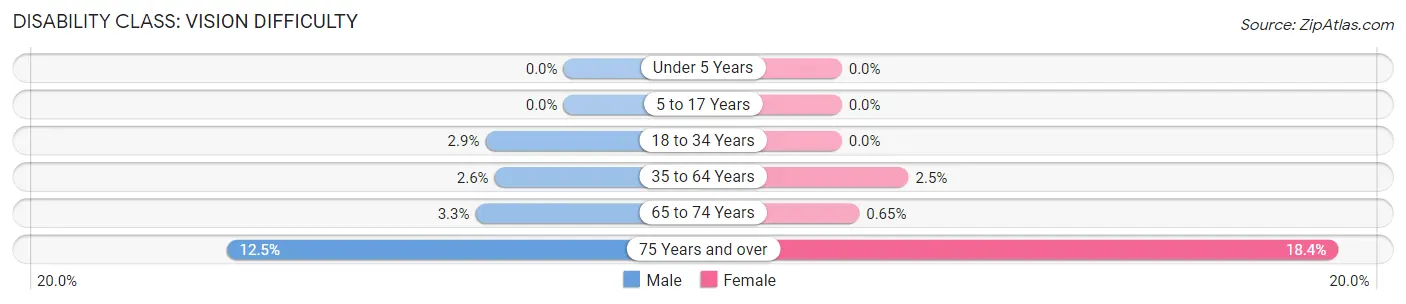
| Age Bracket | Male | Female |
| Under 5 Years | 0 (0.0%) | 0 (0.0%) |
| 5 to 17 Years | 0 (0.0%) | 0 (0.0%) |
| 18 to 34 Years | 10 (2.9%) | 0 (0.0%) |
| 35 to 64 Years | 23 (2.6%) | 22 (2.5%) |
| 65 to 74 Years | 10 (3.3%) | 2 (0.6%) |
| 75 Years and over | 32 (12.5%) | 56 (18.4%) |
Disability Class: Cognitive Difficulty
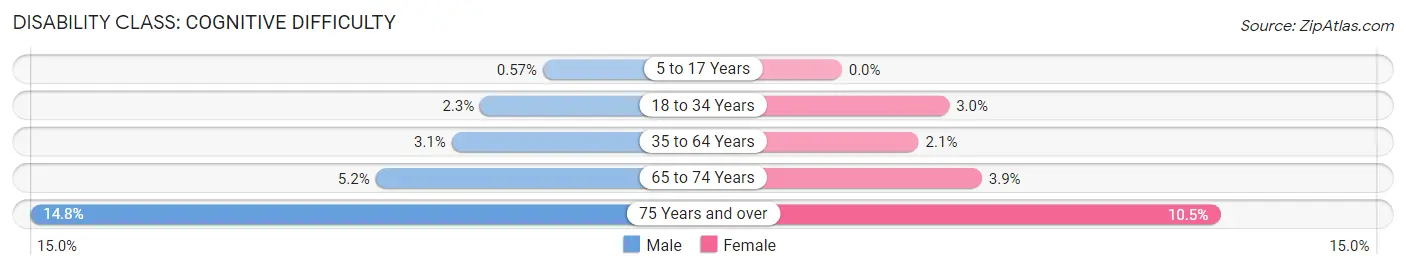
| Age Bracket | Male | Female |
| 5 to 17 Years | 2 (0.6%) | 0 (0.0%) |
| 18 to 34 Years | 8 (2.3%) | 7 (3.0%) |
| 35 to 64 Years | 28 (3.1%) | 19 (2.1%) |
| 65 to 74 Years | 16 (5.2%) | 12 (3.9%) |
| 75 Years and over | 38 (14.8%) | 32 (10.5%) |
Disability Class: Ambulatory Difficulty
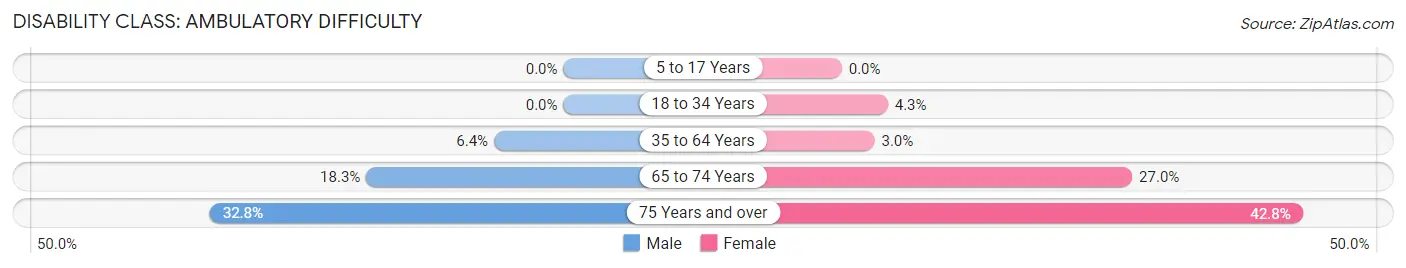
| Age Bracket | Male | Female |
| 5 to 17 Years | 0 (0.0%) | 0 (0.0%) |
| 18 to 34 Years | 0 (0.0%) | 10 (4.3%) |
| 35 to 64 Years | 58 (6.4%) | 27 (3.0%) |
| 65 to 74 Years | 56 (18.3%) | 83 (27.0%) |
| 75 Years and over | 84 (32.8%) | 130 (42.8%) |
Disability Class: Self-Care Difficulty
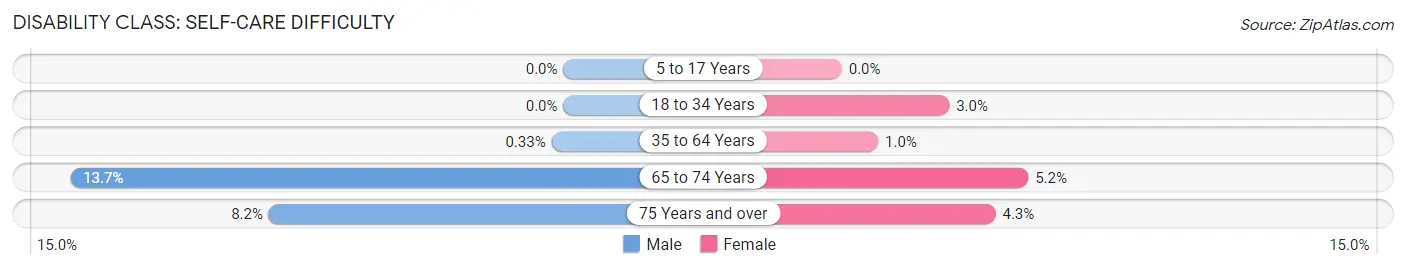
| Age Bracket | Male | Female |
| 5 to 17 Years | 0 (0.0%) | 0 (0.0%) |
| 18 to 34 Years | 0 (0.0%) | 7 (3.0%) |
| 35 to 64 Years | 3 (0.3%) | 9 (1.0%) |
| 65 to 74 Years | 42 (13.7%) | 16 (5.2%) |
| 75 Years and over | 21 (8.2%) | 13 (4.3%) |
Technology Access in Mills County
Computing Device Access in Mills County
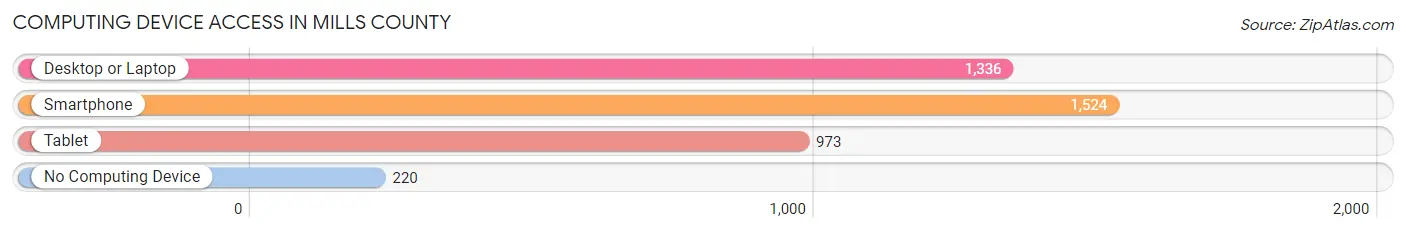
| Device Type | # Households | % Households |
| Desktop or Laptop | 1,336 | 72.9% |
| Smartphone | 1,524 | 83.1% |
| Tablet | 973 | 53.1% |
| No Computing Device | 220 | 12.0% |
| Total | 1,833 | 100.0% |
Internet Access in Mills County
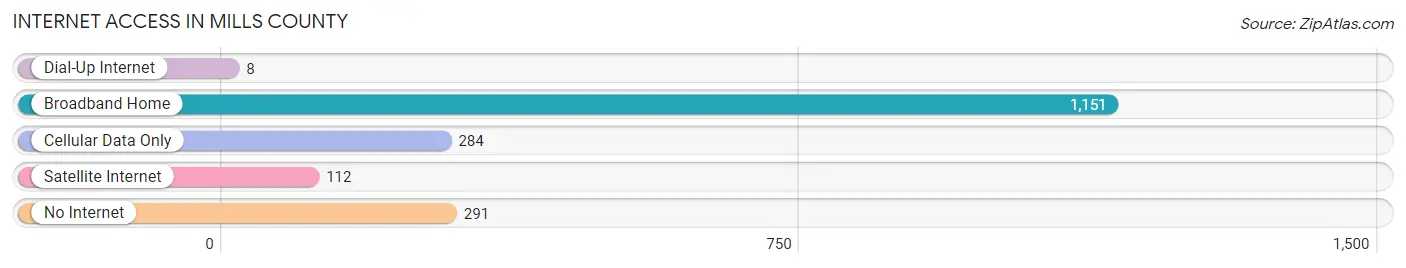
| Internet Type | # Households | % Households |
| Dial-Up Internet | 8 | 0.4% |
| Broadband Home | 1,151 | 62.8% |
| Cellular Data Only | 284 | 15.5% |
| Satellite Internet | 112 | 6.1% |
| No Internet | 291 | 15.9% |
| Total | 1,833 | 100.0% |
Mills County Summary
Mills County is located in Central Texas, in the heart of the Texas Hill Country. It is bordered by Brown, Comanche, Hamilton, Lampasas, San Saba, and Taylor Counties. The county seat is Goldthwaite, and the county is named for John T. Mills, a soldier in the Texas Revolution.
History
Mills County was established in 1887 from parts of Brown, Comanche, and Lampasas Counties. The county was named for John T. Mills, a soldier in the Texas Revolution. The first settlers in the area were ranchers, who were attracted to the area by the abundance of grass and water. The first town in the county was Goldthwaite, which was established in 1885.
The county was largely rural until the 1950s, when the population began to grow rapidly. This growth was due to the discovery of oil and gas in the area, as well as the construction of the Hamilton Dam on the Colorado River. The dam provided irrigation for the area, and allowed for the development of agriculture.
Geography
Mills County is located in Central Texas, in the heart of the Texas Hill Country. It is bordered by Brown, Comanche, Hamilton, Lampasas, San Saba, and Taylor Counties. The county covers an area of 890 square miles, and is mostly flat, with some rolling hills. The Colorado River runs through the county, and there are several small lakes and reservoirs.
The climate in Mills County is generally mild, with hot summers and mild winters. The average annual temperature is 68 degrees Fahrenheit, and the average annual precipitation is 33 inches.
Economy
The economy of Mills County is largely based on agriculture and oil and gas production. The county is home to several large ranches, and the main crops grown in the area are cotton, corn, wheat, and hay. The county is also home to several oil and gas fields, and the production of oil and gas is a major source of income for the county.
In addition to agriculture and oil and gas production, Mills County is home to several manufacturing companies. The county is home to several furniture factories, as well as a number of other manufacturing companies.
Demographics
As of the 2010 census, the population of Mills County was 4,936. The population is largely white (90.2%), with small percentages of African American (3.2%), Hispanic (3.7%), and Native American (0.7%) residents. The median household income in the county is $41,945, and the median home value is $90,000. The unemployment rate in the county is 4.2%.
Common Questions
What is Per Capita Income in Mills County?
Per Capita income in Mills County is $37,010.
What is the Median Family Income in Mills County?
Median Family Income in Mills County is $77,861.
What is the Median Household income in Mills County?
Median Household Income in Mills County is $59,315.
What is Income or Wage Gap in Mills County?
Income or Wage Gap in Mills County is 1.5%.
Women in Mills County earn 98.5 cents for every dollar earned by a man.
What is Inequality or Gini Index in Mills County?
Inequality or Gini Index in Mills County is 0.47.
What is the Total Population of Mills County?
Total Population of Mills County is 4,501.
What is the Total Male Population of Mills County?
Total Male Population of Mills County is 2,279.
What is the Total Female Population of Mills County?
Total Female Population of Mills County is 2,222.
What is the Ratio of Males per 100 Females in Mills County?
There are 102.57 Males per 100 Females in Mills County.
What is the Ratio of Females per 100 Males in Mills County?
There are 97.50 Females per 100 Males in Mills County.
What is the Median Population Age in Mills County?
Median Population Age in Mills County is 50.8 Years.
What is the Average Family Size in Mills County
Average Family Size in Mills County is 2.9 People.
What is the Average Household Size in Mills County
Average Household Size in Mills County is 2.4 People.
How Large is the Labor Force in Mills County?
There are 2,081 People in the Labor Forcein in Mills County.
What is the Percentage of People in the Labor Force in Mills County?
54.7% of People are in the Labor Force in Mills County.
What is the Unemployment Rate in Mills County?
Unemployment Rate in Mills County is 2.3%.