Milam County, TX Map & Demographics
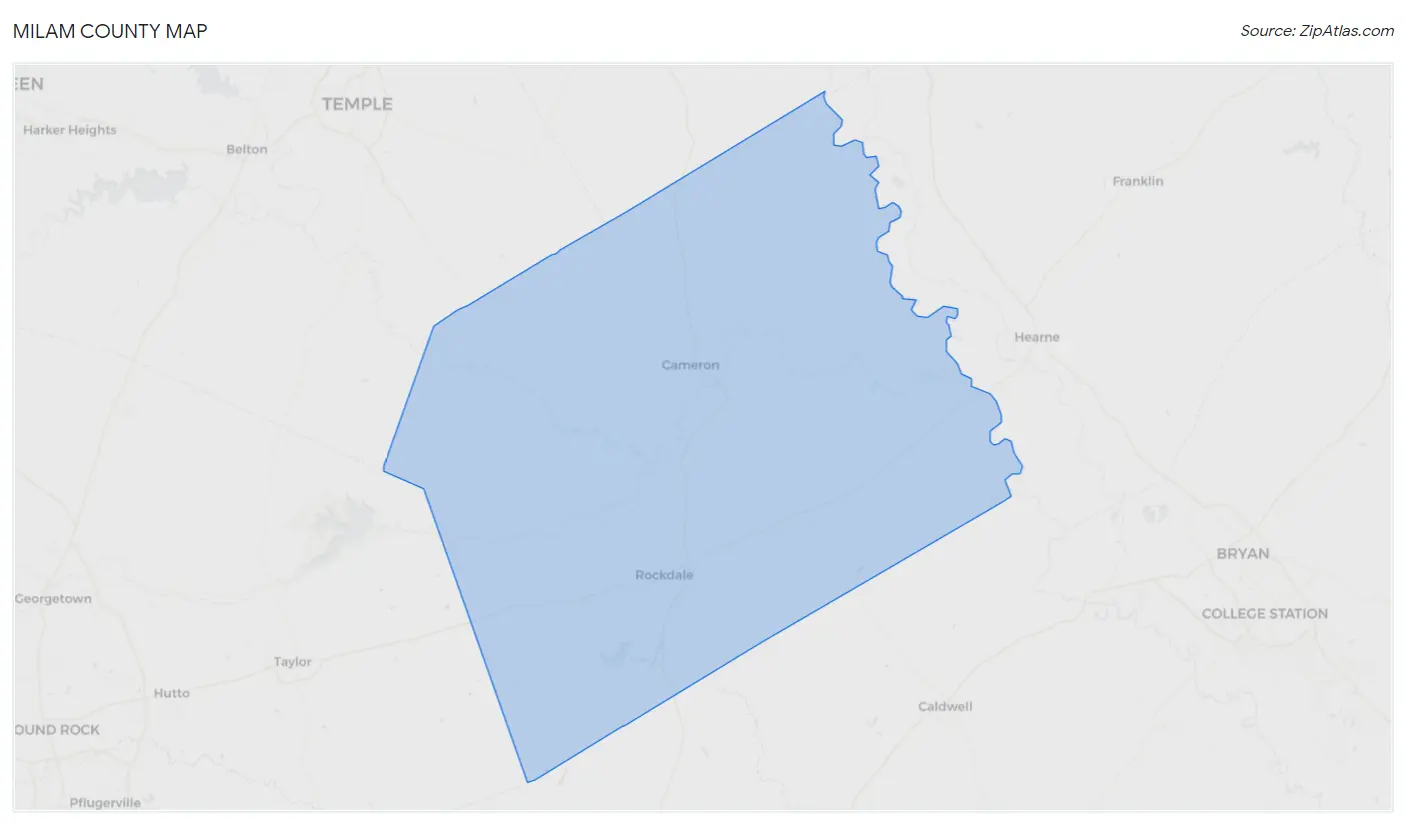
Milam County Map
Milam County Overview
$31,984
PER CAPITA INCOME
$72,069
AVG FAMILY INCOME
$56,985
AVG HOUSEHOLD INCOME
27.8%
WAGE / INCOME GAP [ % ]
72.2¢/ $1
WAGE / INCOME GAP [ $ ]
$10,969
FAMILY INCOME DEFICIT
0.47
INEQUALITY / GINI INDEX
25,080
TOTAL POPULATION
12,359
MALE POPULATION
12,721
FEMALE POPULATION
97.15
MALES / 100 FEMALES
102.93
FEMALES / 100 MALES
41.5
MEDIAN AGE
3.2
AVG FAMILY SIZE
2.5
AVG HOUSEHOLD SIZE
11,607
LABOR FORCE [ PEOPLE ]
58.2%
PERCENT IN LABOR FORCE
5.8%
UNEMPLOYMENT RATE
Income in Milam County
Income Overview in Milam County
Per Capita Income in Milam County is $31,984, while median incomes of families and households are $72,069 and $56,985 respectively.
| Characteristic | Number | Measure |
| Per Capita Income | 25,080 | $31,984 |
| Median Family Income | 6,490 | $72,069 |
| Mean Family Income | 6,490 | $96,119 |
| Median Household Income | 9,767 | $56,985 |
| Mean Household Income | 9,767 | $80,180 |
| Income Deficit | 6,490 | $10,969 |
| Wage / Income Gap (%) | 25,080 | 27.78% |
| Wage / Income Gap ($) | 25,080 | 72.22¢ per $1 |
| Gini / Inequality Index | 25,080 | 0.47 |
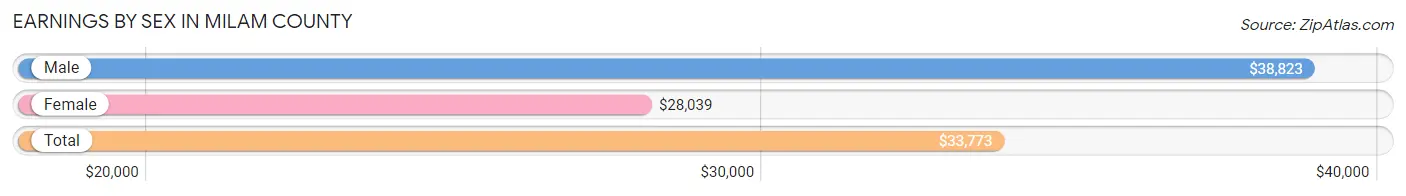
Earnings by Sex in Milam County
Average Earnings in Milam County are $33,773, $38,823 for men and $28,039 for women, a difference of 27.8%.
| Sex | Number | Average Earnings |
| Male | 6,373 (52.9%) | $38,823 |
| Female | 5,665 (47.1%) | $28,039 |
| Total | 12,038 (100.0%) | $33,773 |
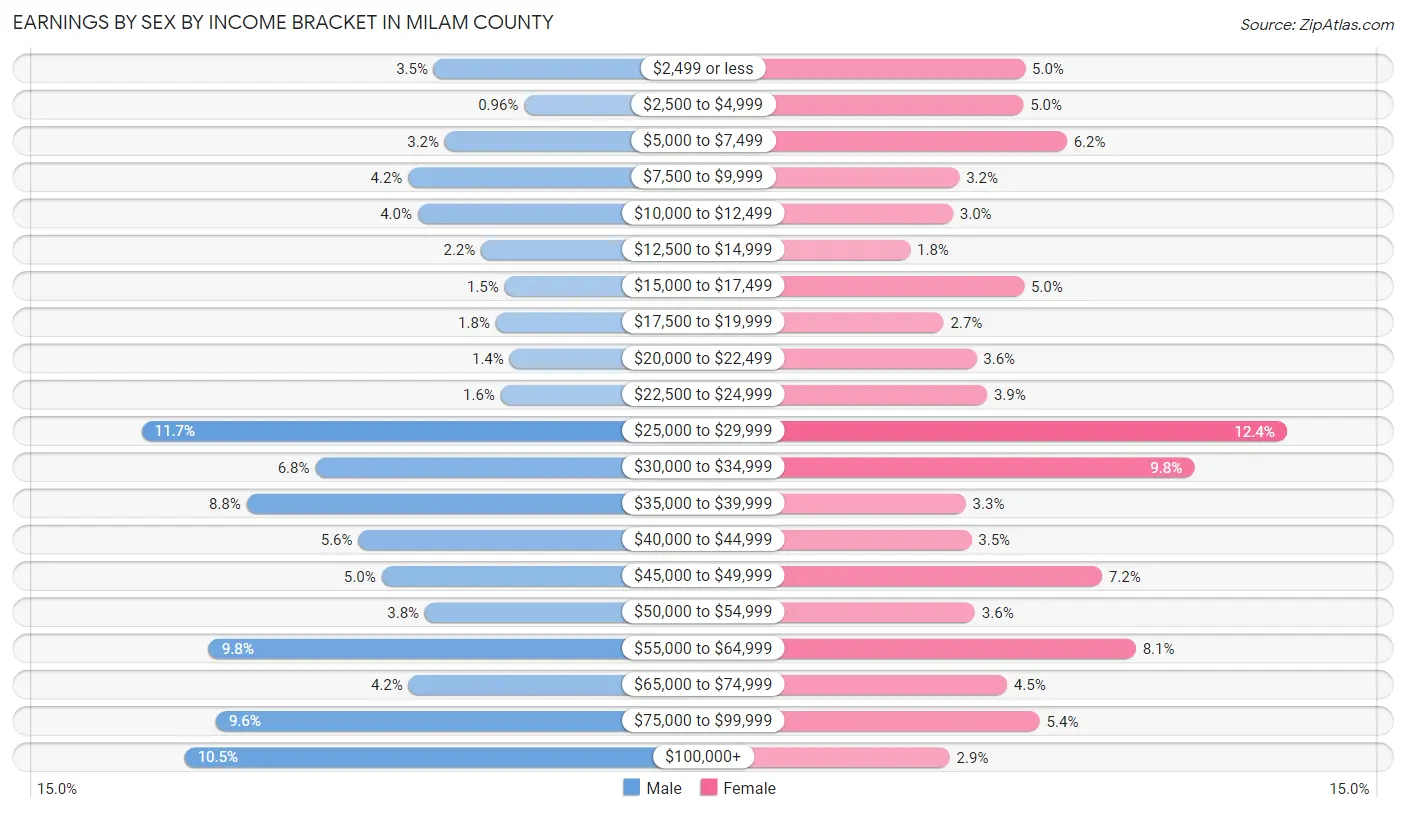
Earnings by Sex by Income Bracket in Milam County
The most common earnings brackets in Milam County are $25,000 to $29,999 for men (746 | 11.7%) and $25,000 to $29,999 for women (700 | 12.4%).
| Income | Male | Female |
| $2,499 or less | 223 (3.5%) | 284 (5.0%) |
| $2,500 to $4,999 | 61 (1.0%) | 281 (5.0%) |
| $5,000 to $7,499 | 203 (3.2%) | 350 (6.2%) |
| $7,500 to $9,999 | 269 (4.2%) | 179 (3.2%) |
| $10,000 to $12,499 | 252 (4.0%) | 169 (3.0%) |
| $12,500 to $14,999 | 138 (2.2%) | 101 (1.8%) |
| $15,000 to $17,499 | 96 (1.5%) | 282 (5.0%) |
| $17,500 to $19,999 | 112 (1.8%) | 154 (2.7%) |
| $20,000 to $22,499 | 87 (1.4%) | 206 (3.6%) |
| $22,500 to $24,999 | 103 (1.6%) | 223 (3.9%) |
| $25,000 to $29,999 | 746 (11.7%) | 700 (12.4%) |
| $30,000 to $34,999 | 435 (6.8%) | 553 (9.8%) |
| $35,000 to $39,999 | 558 (8.8%) | 189 (3.3%) |
| $40,000 to $44,999 | 358 (5.6%) | 198 (3.5%) |
| $45,000 to $49,999 | 317 (5.0%) | 406 (7.2%) |
| $50,000 to $54,999 | 239 (3.7%) | 204 (3.6%) |
| $55,000 to $64,999 | 626 (9.8%) | 460 (8.1%) |
| $65,000 to $74,999 | 268 (4.2%) | 255 (4.5%) |
| $75,000 to $99,999 | 613 (9.6%) | 307 (5.4%) |
| $100,000+ | 669 (10.5%) | 164 (2.9%) |
| Total | 6,373 (100.0%) | 5,665 (100.0%) |
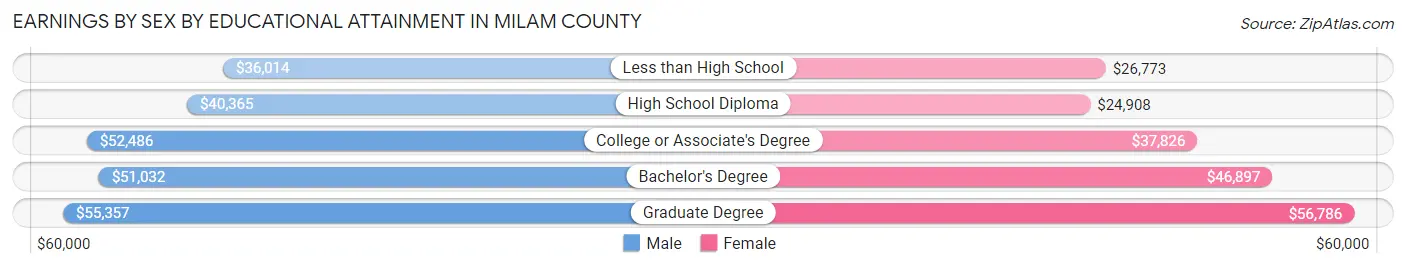
Earnings by Sex by Educational Attainment in Milam County
Average earnings in Milam County are $44,331 for men and $32,071 for women, a difference of 27.7%. Men with an educational attainment of graduate degree enjoy the highest average annual earnings of $55,357, while those with less than high school education earn the least with $36,014. Women with an educational attainment of graduate degree earn the most with the average annual earnings of $56,786, while those with high school diploma education have the smallest earnings of $24,908.
| Educational Attainment | Male Income | Female Income |
| Less than High School | $36,014 | $26,773 |
| High School Diploma | $40,365 | $24,908 |
| College or Associate's Degree | $52,486 | $37,826 |
| Bachelor's Degree | $51,032 | $46,897 |
| Graduate Degree | $55,357 | $56,786 |
| Total | $44,331 | $32,071 |
Family Income in Milam County
Family Income Brackets in Milam County
According to the Milam County family income data, there are 1,272 families falling into the $50,000 to $74,999 income range, which is the most common income bracket and makes up 19.6% of all families. Conversely, the $10,000 to $14,999 income bracket is the least frequent group with only 97 families (1.5%) belonging to this category.
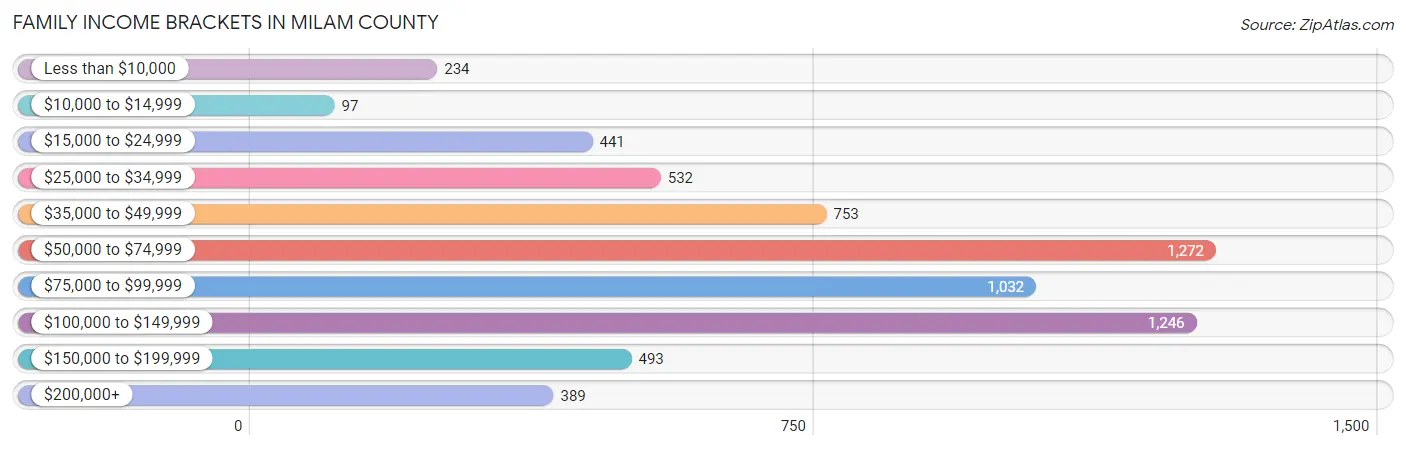
| Income Bracket | # Families | % Families |
| Less than $10,000 | 234 | 3.6% |
| $10,000 to $14,999 | 97 | 1.5% |
| $15,000 to $24,999 | 441 | 6.8% |
| $25,000 to $34,999 | 532 | 8.2% |
| $35,000 to $49,999 | 753 | 11.6% |
| $50,000 to $74,999 | 1,272 | 19.6% |
| $75,000 to $99,999 | 1,032 | 15.9% |
| $100,000 to $149,999 | 1,246 | 19.2% |
| $150,000 to $199,999 | 493 | 7.6% |
| $200,000+ | 389 | 6.0% |
Family Income by Famaliy Size in Milam County
4-person families (1,047 | 16.1%) account for the highest median family income in Milam County with $107,417 per family, while 2-person families (3,302 | 50.9%) have the highest median income of $32,110 per family member.
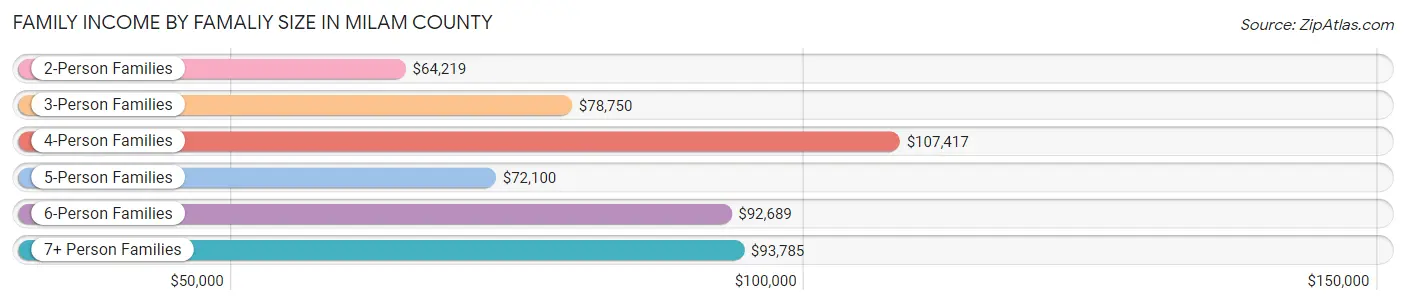
| Income Bracket | # Families | Median Income |
| 2-Person Families | 3,302 (50.9%) | $64,219 |
| 3-Person Families | 1,190 (18.3%) | $78,750 |
| 4-Person Families | 1,047 (16.1%) | $107,417 |
| 5-Person Families | 566 (8.7%) | $72,100 |
| 6-Person Families | 260 (4.0%) | $92,689 |
| 7+ Person Families | 125 (1.9%) | $93,785 |
| Total | 6,490 (100.0%) | $72,069 |
Family Income by Number of Earners in Milam County
The median family income in Milam County is $72,069, with families comprising 2 earners (2,419) having the highest median family income of $105,888, while families with no earners (1,249) have the lowest median family income of $40,707, accounting for 37.3% and 19.2% of families, respectively.
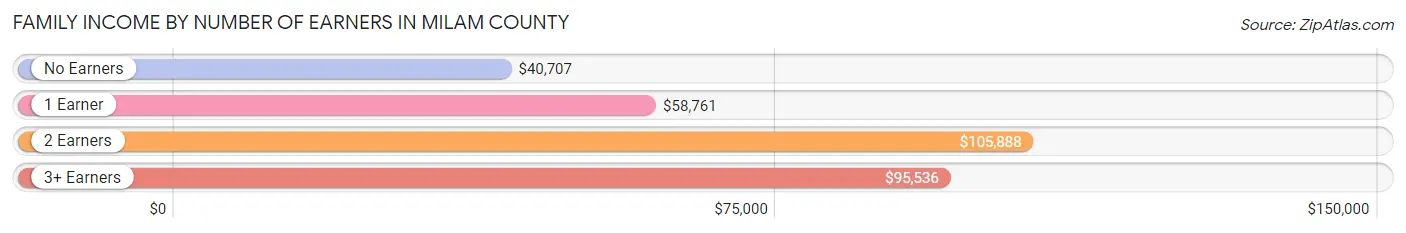
| Number of Earners | # Families | Median Income |
| No Earners | 1,249 (19.2%) | $40,707 |
| 1 Earner | 2,266 (34.9%) | $58,761 |
| 2 Earners | 2,419 (37.3%) | $105,888 |
| 3+ Earners | 556 (8.6%) | $95,536 |
| Total | 6,490 (100.0%) | $72,069 |
Household Income in Milam County
Household Income Brackets in Milam County
With 1,865 households falling in the category, the $50,000 to $74,999 income range is the most frequent in Milam County, accounting for 19.1% of all households. In contrast, only 410 households (4.2%) fall into the $200,000+ income bracket, making it the least populous group.
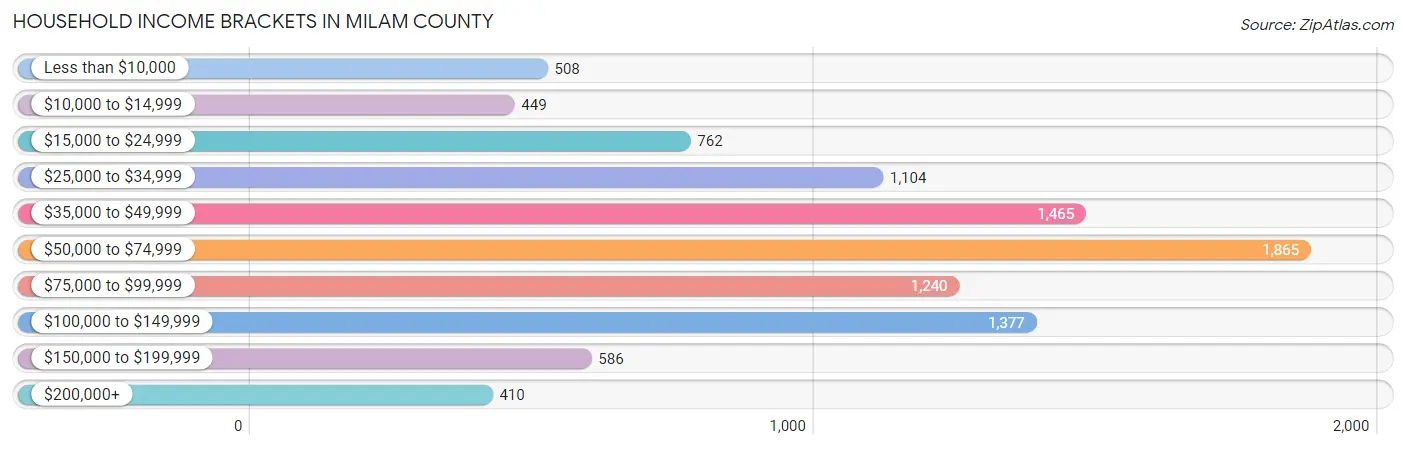
| Income Bracket | # Households | % Households |
| Less than $10,000 | 508 | 5.2% |
| $10,000 to $14,999 | 449 | 4.6% |
| $15,000 to $24,999 | 762 | 7.8% |
| $25,000 to $34,999 | 1,104 | 11.3% |
| $35,000 to $49,999 | 1,465 | 15.0% |
| $50,000 to $74,999 | 1,865 | 19.1% |
| $75,000 to $99,999 | 1,240 | 12.7% |
| $100,000 to $149,999 | 1,377 | 14.1% |
| $150,000 to $199,999 | 586 | 6.0% |
| $200,000+ | 410 | 4.2% |
Household Income by Householder Age in Milam County
The median household income in Milam County is $56,985, with the highest median household income of $65,823 found in the 45 to 64 years age bracket for the primary householder. A total of 3,813 households (39.0%) fall into this category. Meanwhile, the 15 to 24 years age bracket for the primary householder has the lowest median household income of $0, with 177 households (1.8%) in this group.
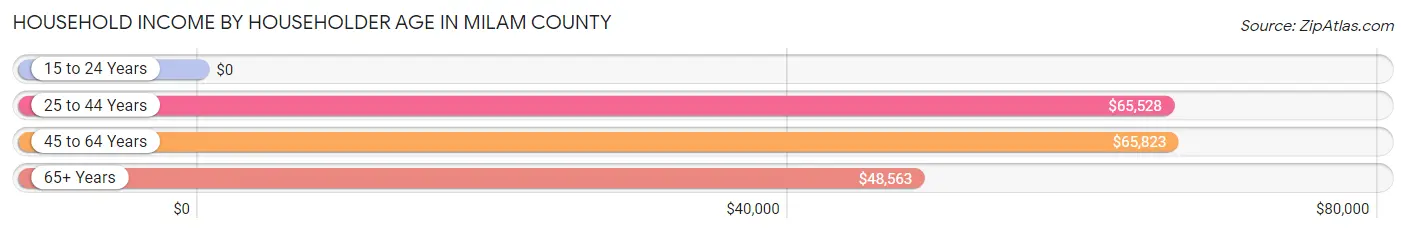
| Income Bracket | # Households | Median Income |
| 15 to 24 Years | 177 (1.8%) | $0 |
| 25 to 44 Years | 2,677 (27.4%) | $65,528 |
| 45 to 64 Years | 3,813 (39.0%) | $65,823 |
| 65+ Years | 3,100 (31.7%) | $48,563 |
| Total | 9,767 (100.0%) | $56,985 |
Poverty in Milam County
Income Below Poverty by Sex and Age in Milam County
With 12.7% poverty level for males and 15.8% for females among the residents of Milam County, 12 to 14 year old males and under 5 year old females are the most vulnerable to poverty, with 187 males (42.7%) and 267 females (33.2%) in their respective age groups living below the poverty level.
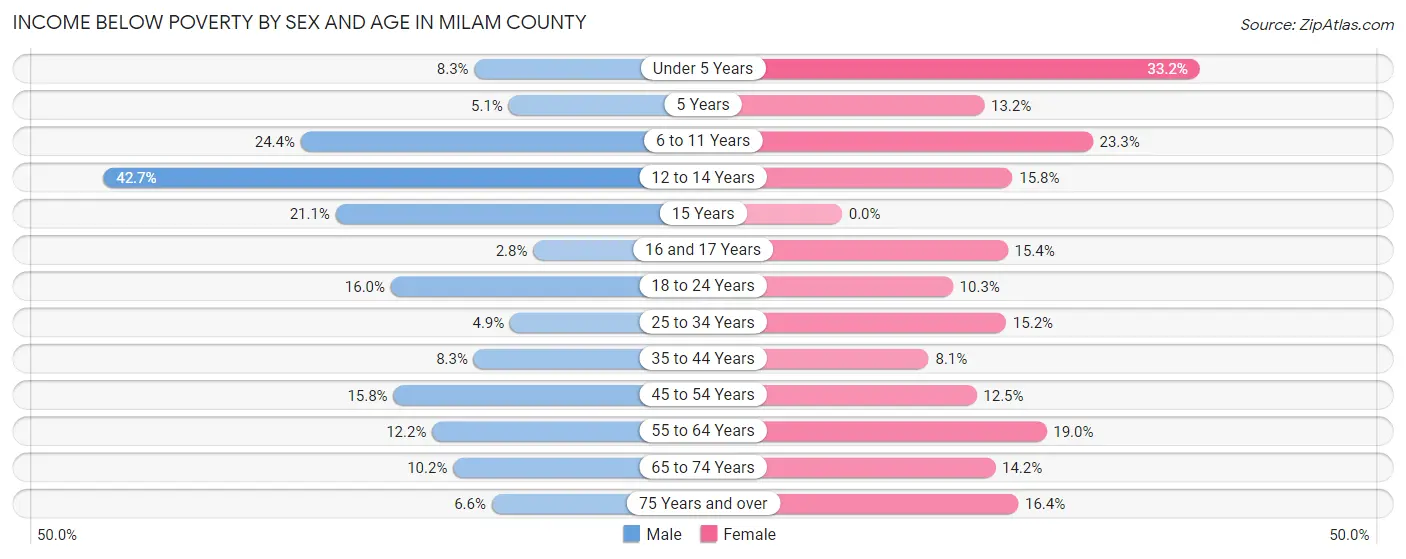
| Age Bracket | Male | Female |
| Under 5 Years | 49 (8.3%) | 267 (33.2%) |
| 5 Years | 14 (5.1%) | 26 (13.2%) |
| 6 to 11 Years | 241 (24.4%) | 228 (23.3%) |
| 12 to 14 Years | 187 (42.7%) | 76 (15.8%) |
| 15 Years | 30 (21.1%) | 0 (0.0%) |
| 16 and 17 Years | 10 (2.8%) | 54 (15.4%) |
| 18 to 24 Years | 179 (16.0%) | 98 (10.3%) |
| 25 to 34 Years | 61 (4.9%) | 194 (15.2%) |
| 35 to 44 Years | 112 (8.3%) | 114 (8.1%) |
| 45 to 54 Years | 240 (15.8%) | 186 (12.5%) |
| 55 to 64 Years | 210 (12.2%) | 327 (19.0%) |
| 65 to 74 Years | 152 (10.2%) | 212 (14.2%) |
| 75 Years and over | 58 (6.6%) | 180 (16.4%) |
| Total | 1,543 (12.7%) | 1,962 (15.8%) |
Income Above Poverty by Sex and Age in Milam County
According to the poverty statistics in Milam County, males aged 16 and 17 years and females aged 15 years are the age groups that are most secure financially, with 97.2% of males and 100.0% of females in these age groups living above the poverty line.
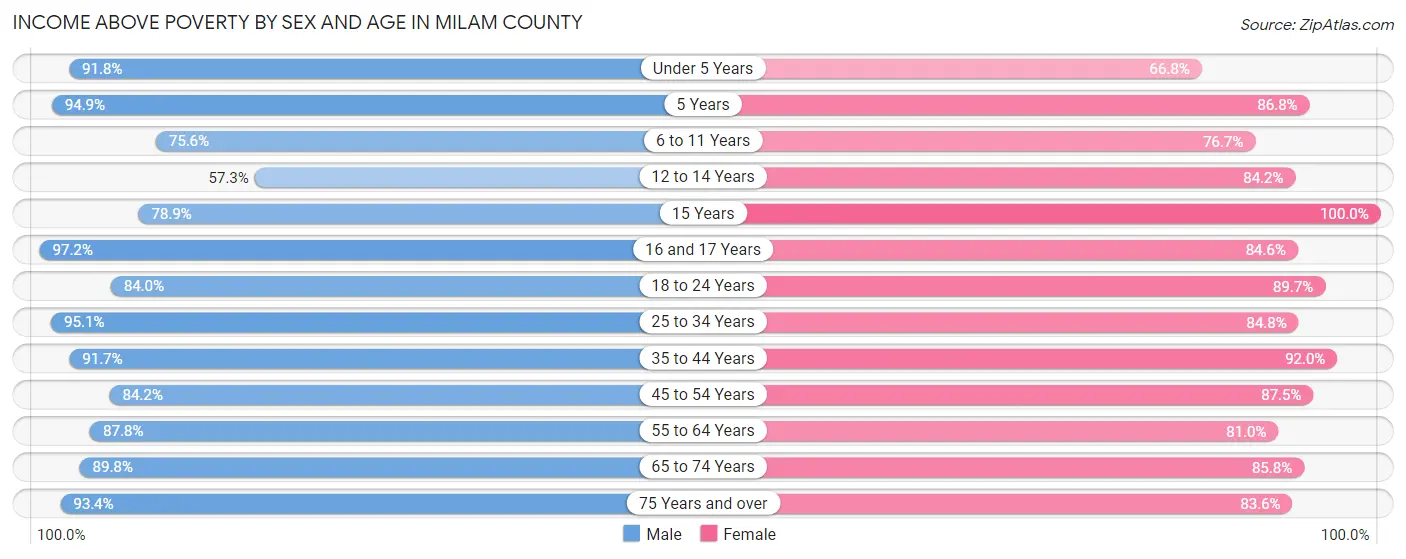
| Age Bracket | Male | Female |
| Under 5 Years | 545 (91.7%) | 537 (66.8%) |
| 5 Years | 262 (94.9%) | 171 (86.8%) |
| 6 to 11 Years | 748 (75.6%) | 752 (76.7%) |
| 12 to 14 Years | 251 (57.3%) | 404 (84.2%) |
| 15 Years | 112 (78.9%) | 192 (100.0%) |
| 16 and 17 Years | 349 (97.2%) | 297 (84.6%) |
| 18 to 24 Years | 939 (84.0%) | 854 (89.7%) |
| 25 to 34 Years | 1,174 (95.1%) | 1,080 (84.8%) |
| 35 to 44 Years | 1,236 (91.7%) | 1,303 (91.9%) |
| 45 to 54 Years | 1,282 (84.2%) | 1,303 (87.5%) |
| 55 to 64 Years | 1,516 (87.8%) | 1,396 (81.0%) |
| 65 to 74 Years | 1,336 (89.8%) | 1,279 (85.8%) |
| 75 Years and over | 815 (93.4%) | 920 (83.6%) |
| Total | 10,565 (87.3%) | 10,488 (84.2%) |
Income Below Poverty Among Married-Couple Families in Milam County
The poverty statistics for married-couple families in Milam County show that 6.0% or 291 of the total 4,874 families live below the poverty line. Families with 3 or 4 children have the highest poverty rate of 16.5%, comprising of 85 families. On the other hand, families with 1 or 2 children have the lowest poverty rate of 0.2%, which includes 2 families.
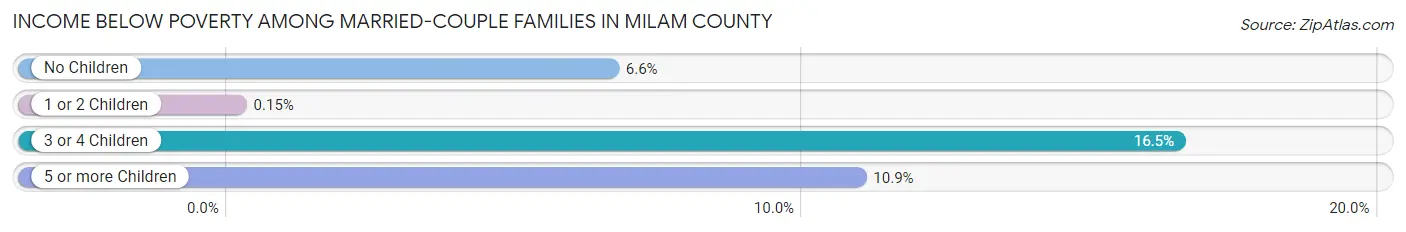
| Children | Above Poverty | Below Poverty |
| No Children | 2,774 (93.4%) | 197 (6.6%) |
| 1 or 2 Children | 1,322 (99.9%) | 2 (0.2%) |
| 3 or 4 Children | 430 (83.5%) | 85 (16.5%) |
| 5 or more Children | 57 (89.1%) | 7 (10.9%) |
| Total | 4,583 (94.0%) | 291 (6.0%) |
Income Below Poverty Among Single-Parent Households in Milam County
According to the poverty data in Milam County, 14.6% or 70 single-father households and 31.1% or 353 single-mother households are living below the poverty line. Among single-father households, those with 3 or 4 children have the highest poverty rate, with 5 households (38.5%) experiencing poverty. Likewise, among single-mother households, those with 1 or 2 children have the highest poverty rate, with 253 households (54.8%) falling below the poverty line.
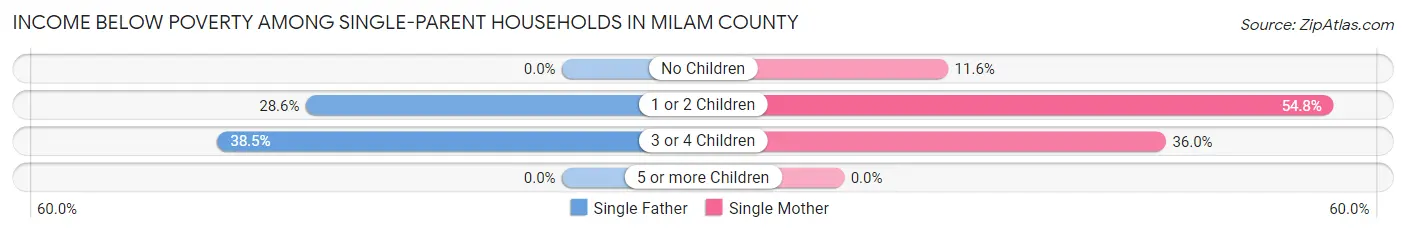
| Children | Single Father | Single Mother |
| No Children | 0 (0.0%) | 68 (11.6%) |
| 1 or 2 Children | 65 (28.6%) | 253 (54.8%) |
| 3 or 4 Children | 5 (38.5%) | 32 (36.0%) |
| 5 or more Children | 0 (0.0%) | 0 (0.0%) |
| Total | 70 (14.6%) | 353 (31.1%) |
Income Below Poverty Among Married-Couple vs Single-Parent Households in Milam County
The poverty data for Milam County shows that 291 of the married-couple family households (6.0%) and 423 of the single-parent households (26.2%) are living below the poverty level. Within the married-couple family households, those with 3 or 4 children have the highest poverty rate, with 85 households (16.5%) falling below the poverty line. Among the single-parent households, those with 1 or 2 children have the highest poverty rate, with 318 household (46.2%) living below poverty.
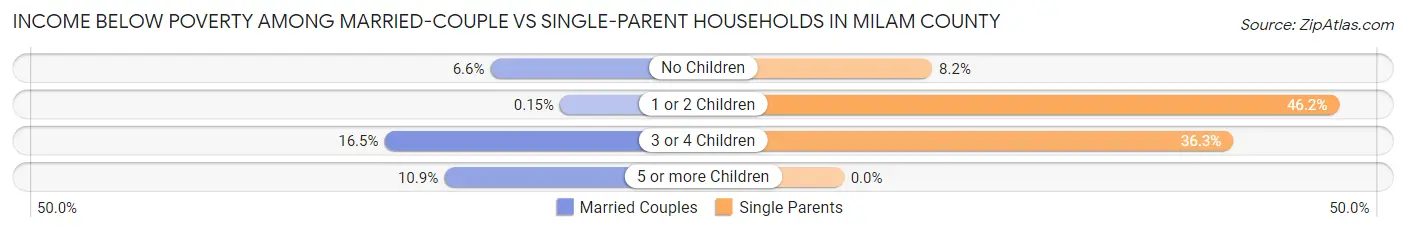
| Children | Married-Couple Families | Single-Parent Households |
| No Children | 197 (6.6%) | 68 (8.2%) |
| 1 or 2 Children | 2 (0.2%) | 318 (46.2%) |
| 3 or 4 Children | 85 (16.5%) | 37 (36.3%) |
| 5 or more Children | 7 (10.9%) | 0 (0.0%) |
| Total | 291 (6.0%) | 423 (26.2%) |
Race in Milam County
The most populous races in Milam County are White / Caucasian (18,807 | 75.0%), Hispanic or Latino (6,838 | 27.3%), and Black / African American (2,687 | 10.7%).
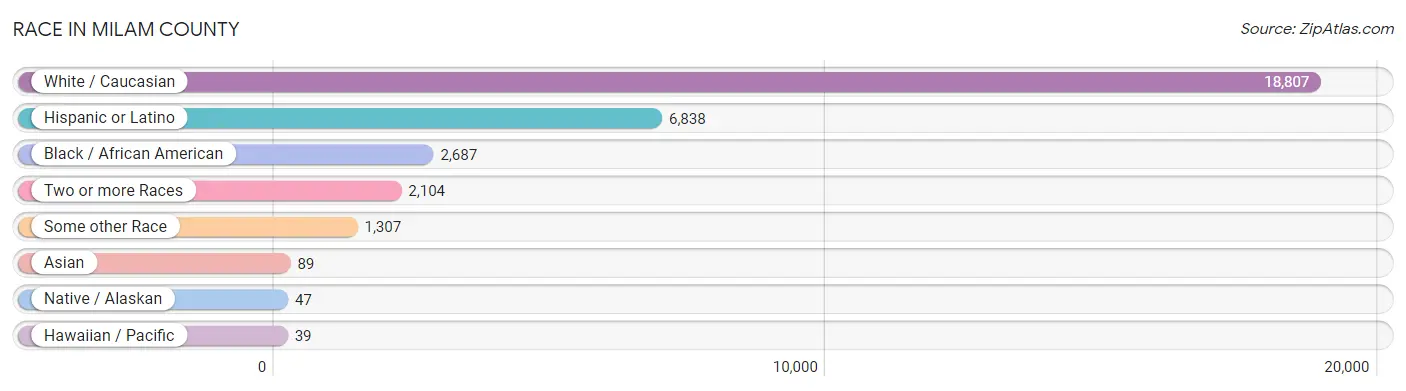
| Race | # Population | % Population |
| Asian | 89 | 0.4% |
| Black / African American | 2,687 | 10.7% |
| Hawaiian / Pacific | 39 | 0.2% |
| Hispanic or Latino | 6,838 | 27.3% |
| Native / Alaskan | 47 | 0.2% |
| White / Caucasian | 18,807 | 75.0% |
| Two or more Races | 2,104 | 8.4% |
| Some other Race | 1,307 | 5.2% |
| Total | 25,080 | 100.0% |
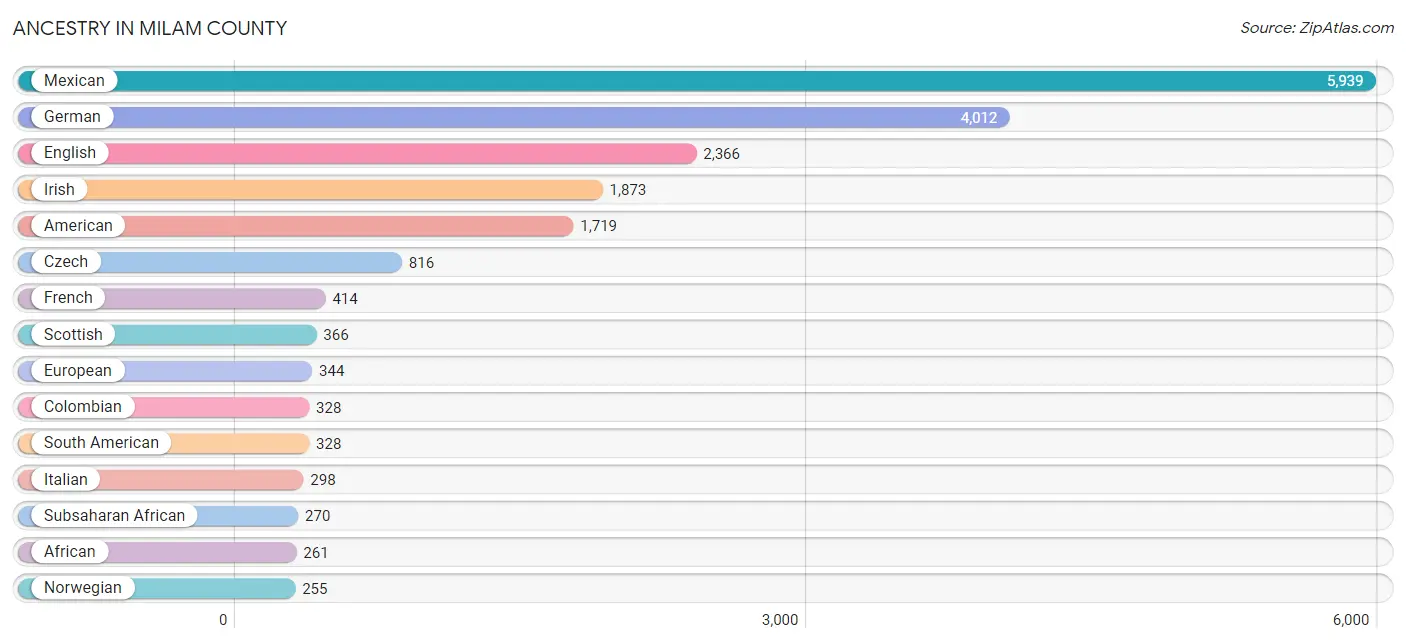
Ancestry in Milam County
The most populous ancestries reported in Milam County are Mexican (5,939 | 23.7%), German (4,012 | 16.0%), English (2,366 | 9.4%), Irish (1,873 | 7.5%), and American (1,719 | 6.9%), together accounting for 63.4% of all Milam County residents.
| Ancestry | # Population | % Population |
| African | 261 | 1.0% |
| American | 1,719 | 6.9% |
| Arab | 6 | 0.0% |
| Austrian | 26 | 0.1% |
| Bhutanese | 25 | 0.1% |
| British | 178 | 0.7% |
| Bulgarian | 24 | 0.1% |
| Cajun | 18 | 0.1% |
| Canadian | 56 | 0.2% |
| Central American | 169 | 0.7% |
| Central American Indian | 22 | 0.1% |
| Cherokee | 48 | 0.2% |
| Chippewa | 8 | 0.0% |
| Choctaw | 15 | 0.1% |
| Colombian | 328 | 1.3% |
| Czech | 816 | 3.3% |
| Czechoslovakian | 70 | 0.3% |
| Danish | 11 | 0.0% |
| Dutch | 82 | 0.3% |
| Dutch West Indian | 10 | 0.0% |
| English | 2,366 | 9.4% |
| European | 344 | 1.4% |
| Finnish | 16 | 0.1% |
| French | 414 | 1.7% |
| French Canadian | 72 | 0.3% |
| German | 4,012 | 16.0% |
| Greek | 6 | 0.0% |
| Guatemalan | 71 | 0.3% |
| Honduran | 13 | 0.1% |
| Hungarian | 22 | 0.1% |
| Indian (Asian) | 28 | 0.1% |
| Irish | 1,873 | 7.5% |
| Italian | 298 | 1.2% |
| Lebanese | 6 | 0.0% |
| Lithuanian | 62 | 0.3% |
| Mexican | 5,939 | 23.7% |
| Mexican American Indian | 38 | 0.2% |
| Native Hawaiian | 38 | 0.2% |
| Navajo | 22 | 0.1% |
| Northern European | 61 | 0.2% |
| Norwegian | 255 | 1.0% |
| Panamanian | 39 | 0.2% |
| Polish | 198 | 0.8% |
| Potawatomi | 110 | 0.4% |
| Puerto Rican | 187 | 0.7% |
| Romanian | 9 | 0.0% |
| Russian | 24 | 0.1% |
| Salvadoran | 46 | 0.2% |
| Scandinavian | 5 | 0.0% |
| Scotch-Irish | 215 | 0.9% |
| Scottish | 366 | 1.5% |
| Sioux | 8 | 0.0% |
| Slovene | 70 | 0.3% |
| South African | 9 | 0.0% |
| South American | 328 | 1.3% |
| Spanish | 35 | 0.1% |
| Sri Lankan | 46 | 0.2% |
| Subsaharan African | 270 | 1.1% |
| Swedish | 131 | 0.5% |
| Swiss | 44 | 0.2% |
| Ukrainian | 11 | 0.0% |
| Welsh | 24 | 0.1% | View All 62 Rows |
Immigrants in Milam County
The most numerous immigrant groups reported in Milam County came from Latin America (1,190 | 4.7%), Central America (1,030 | 4.1%), Mexico (938 | 3.7%), Colombia (160 | 0.6%), and South America (160 | 0.6%), together accounting for 13.9% of all Milam County residents.
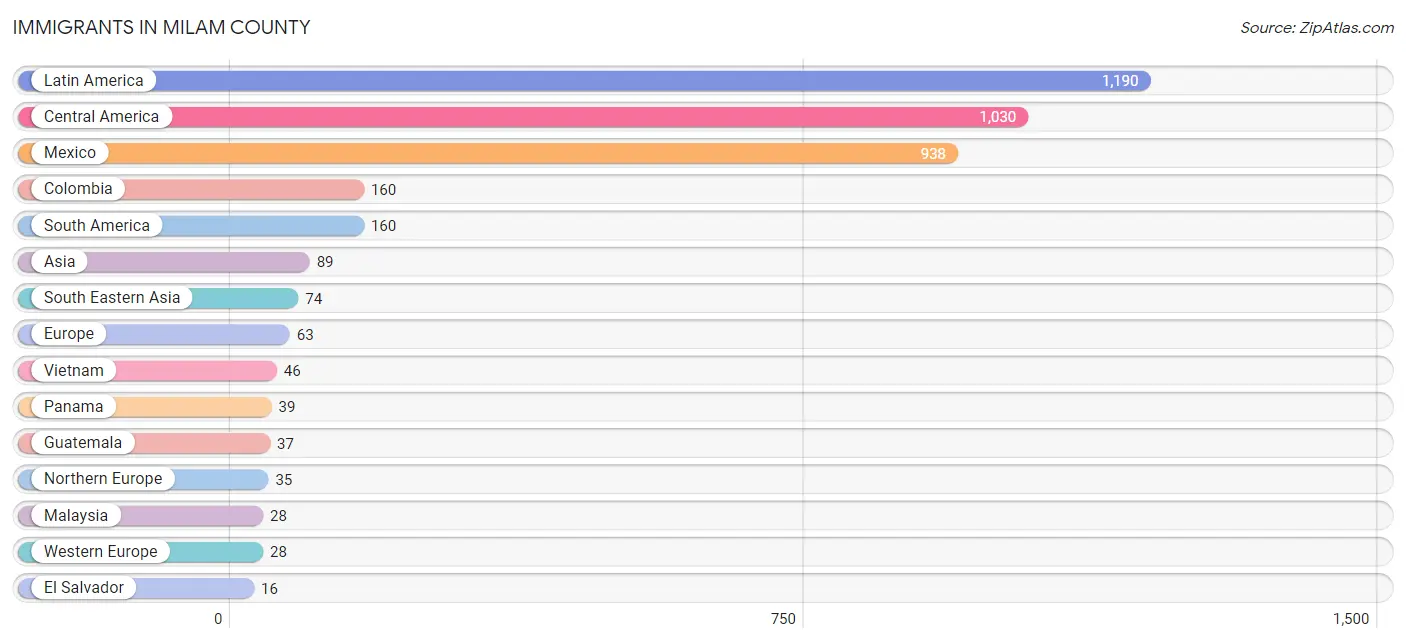
| Immigration Origin | # Population | % Population |
| Africa | 9 | 0.0% |
| Asia | 89 | 0.4% |
| Central America | 1,030 | 4.1% |
| Colombia | 160 | 0.6% |
| Eastern Asia | 15 | 0.1% |
| El Salvador | 16 | 0.1% |
| England | 5 | 0.0% |
| Europe | 63 | 0.3% |
| France | 12 | 0.1% |
| Germany | 16 | 0.1% |
| Guatemala | 37 | 0.2% |
| Japan | 15 | 0.1% |
| Latin America | 1,190 | 4.7% |
| Malaysia | 28 | 0.1% |
| Mexico | 938 | 3.7% |
| Northern Europe | 35 | 0.1% |
| Panama | 39 | 0.2% |
| South Africa | 9 | 0.0% |
| South America | 160 | 0.6% |
| South Eastern Asia | 74 | 0.3% |
| Vietnam | 46 | 0.2% |
| Western Europe | 28 | 0.1% | View All 22 Rows |
Sex and Age in Milam County
Sex and Age in Milam County
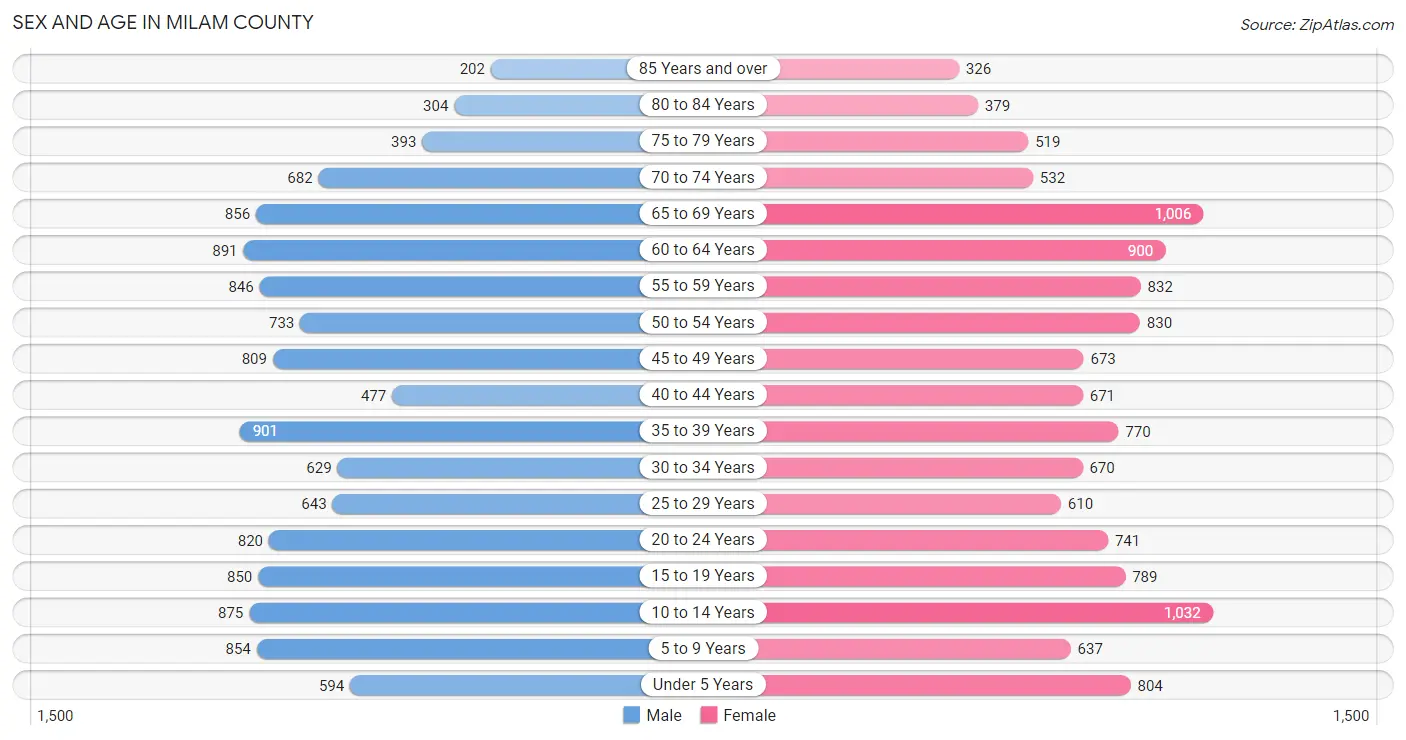
The most populous age groups in Milam County are 35 to 39 Years (901 | 7.3%) for men and 10 to 14 Years (1,032 | 8.1%) for women.
| Age Bracket | Male | Female |
| Under 5 Years | 594 (4.8%) | 804 (6.3%) |
| 5 to 9 Years | 854 (6.9%) | 637 (5.0%) |
| 10 to 14 Years | 875 (7.1%) | 1,032 (8.1%) |
| 15 to 19 Years | 850 (6.9%) | 789 (6.2%) |
| 20 to 24 Years | 820 (6.6%) | 741 (5.8%) |
| 25 to 29 Years | 643 (5.2%) | 610 (4.8%) |
| 30 to 34 Years | 629 (5.1%) | 670 (5.3%) |
| 35 to 39 Years | 901 (7.3%) | 770 (6.0%) |
| 40 to 44 Years | 477 (3.9%) | 671 (5.3%) |
| 45 to 49 Years | 809 (6.6%) | 673 (5.3%) |
| 50 to 54 Years | 733 (5.9%) | 830 (6.5%) |
| 55 to 59 Years | 846 (6.9%) | 832 (6.5%) |
| 60 to 64 Years | 891 (7.2%) | 900 (7.1%) |
| 65 to 69 Years | 856 (6.9%) | 1,006 (7.9%) |
| 70 to 74 Years | 682 (5.5%) | 532 (4.2%) |
| 75 to 79 Years | 393 (3.2%) | 519 (4.1%) |
| 80 to 84 Years | 304 (2.5%) | 379 (3.0%) |
| 85 Years and over | 202 (1.6%) | 326 (2.6%) |
| Total | 12,359 (100.0%) | 12,721 (100.0%) |
Families and Households in Milam County
Median Family Size in Milam County
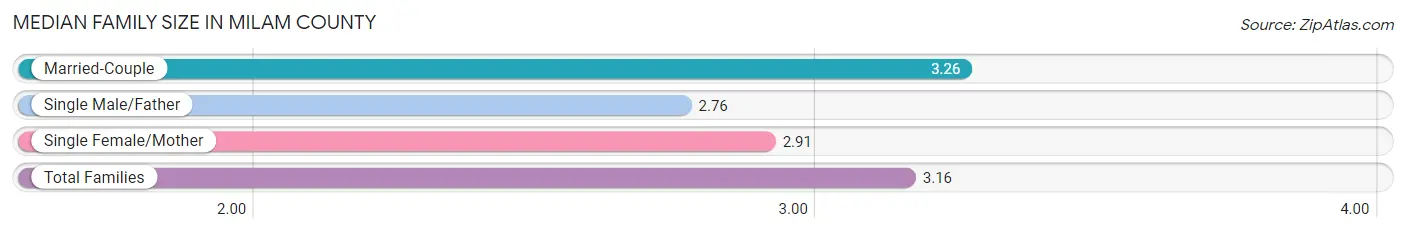
The median family size in Milam County is 3.16 persons per family, with married-couple families (4,874 | 75.1%) accounting for the largest median family size of 3.26 persons per family. On the other hand, single male/father families (480 | 7.4%) represent the smallest median family size with 2.76 persons per family.
| Family Type | # Families | Family Size |
| Married-Couple | 4,874 (75.1%) | 3.26 |
| Single Male/Father | 480 (7.4%) | 2.76 |
| Single Female/Mother | 1,136 (17.5%) | 2.91 |
| Total Families | 6,490 (100.0%) | 3.16 |
Median Household Size in Milam County
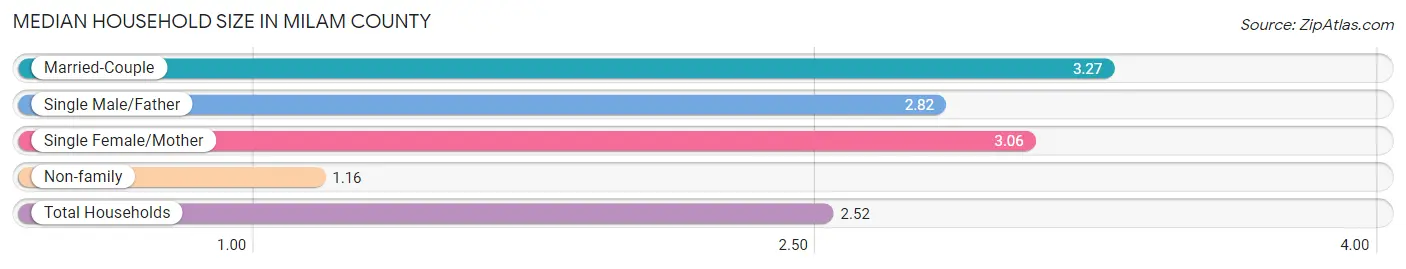
The median household size in Milam County is 2.52 persons per household, with married-couple households (4,874 | 49.9%) accounting for the largest median household size of 3.27 persons per household. non-family households (3,277 | 33.6%) represent the smallest median household size with 1.16 persons per household.
| Household Type | # Households | Household Size |
| Married-Couple | 4,874 (49.9%) | 3.27 |
| Single Male/Father | 480 (4.9%) | 2.82 |
| Single Female/Mother | 1,136 (11.6%) | 3.06 |
| Non-family | 3,277 (33.6%) | 1.16 |
| Total Households | 9,767 (100.0%) | 2.52 |
Household Size by Marriage Status in Milam County
Out of a total of 9,767 households in Milam County, 6,490 (66.4%) are family households, while 3,277 (33.6%) are nonfamily households. The most numerous type of family households are 2-person households, comprising 3,165, and the most common type of nonfamily households are 1-person households, comprising 2,845.
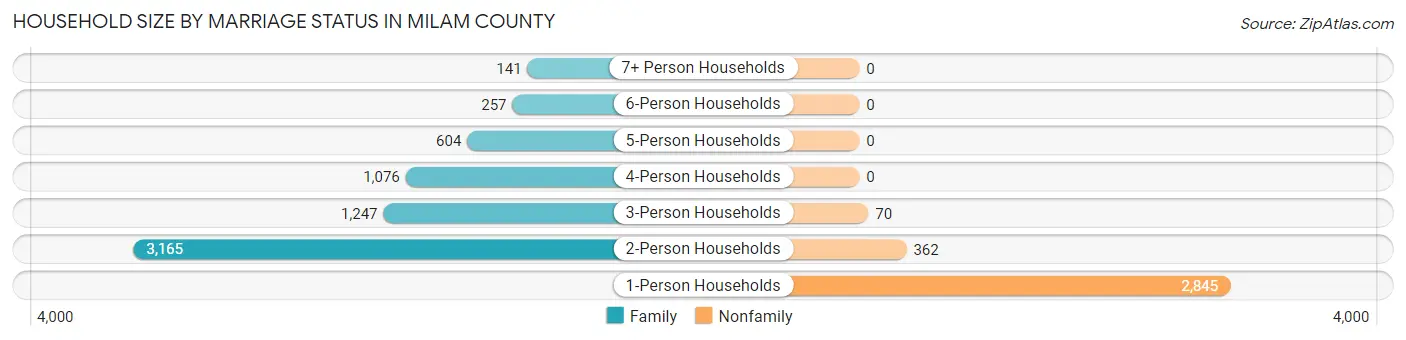
| Household Size | Family Households | Nonfamily Households |
| 1-Person Households | - | 2,845 (29.1%) |
| 2-Person Households | 3,165 (32.4%) | 362 (3.7%) |
| 3-Person Households | 1,247 (12.8%) | 70 (0.7%) |
| 4-Person Households | 1,076 (11.0%) | 0 (0.0%) |
| 5-Person Households | 604 (6.2%) | 0 (0.0%) |
| 6-Person Households | 257 (2.6%) | 0 (0.0%) |
| 7+ Person Households | 141 (1.4%) | 0 (0.0%) |
| Total | 6,490 (66.4%) | 3,277 (33.6%) |
Female Fertility in Milam County
Fertility by Age in Milam County
Average fertility rate in Milam County is 53.0 births per 1,000 women. Women in the age bracket of 20 to 34 years have the highest fertility rate with 126.0 births per 1,000 women. Women in the age bracket of 20 to 34 years acount for 92.7% of all women with births.
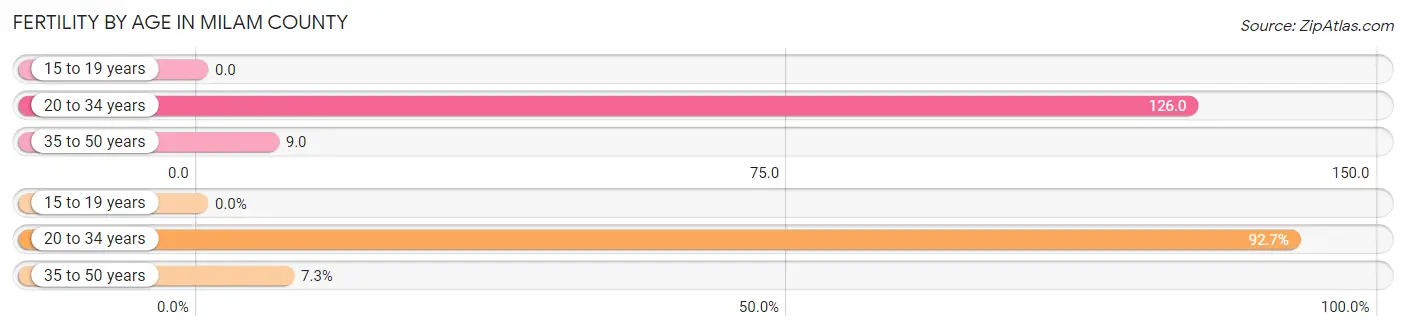
| Age Bracket | Women with Births | Births / 1,000 Women |
| 15 to 19 years | 0 (0.0%) | 0.0 |
| 20 to 34 years | 254 (92.7%) | 126.0 |
| 35 to 50 years | 20 (7.3%) | 9.0 |
| Total | 274 (100.0%) | 53.0 |
Fertility by Age by Marriage Status in Milam County
83.2% of women with births (274) in Milam County are married. The highest percentage of unmarried women with births falls into 20 to 34 years age bracket with 18.1% of them unmarried at the time of birth, while the lowest percentage of unmarried women with births belong to 35 to 50 years age bracket with 0.0% of them unmarried.
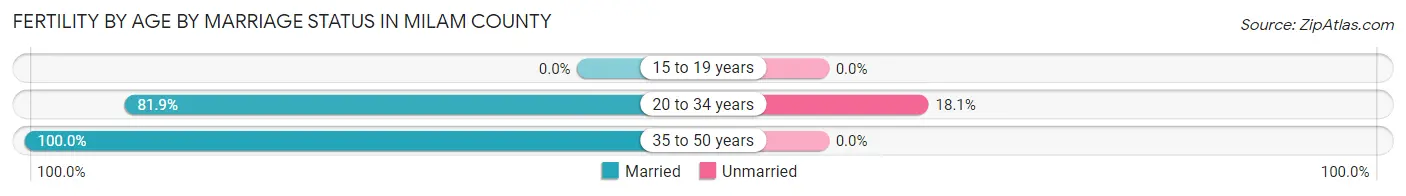
| Age Bracket | Married | Unmarried |
| 15 to 19 years | 0 (0.0%) | 0 (0.0%) |
| 20 to 34 years | 208 (81.9%) | 46 (18.1%) |
| 35 to 50 years | 20 (100.0%) | 0 (0.0%) |
| Total | 228 (83.2%) | 46 (16.8%) |
Fertility by Education in Milam County
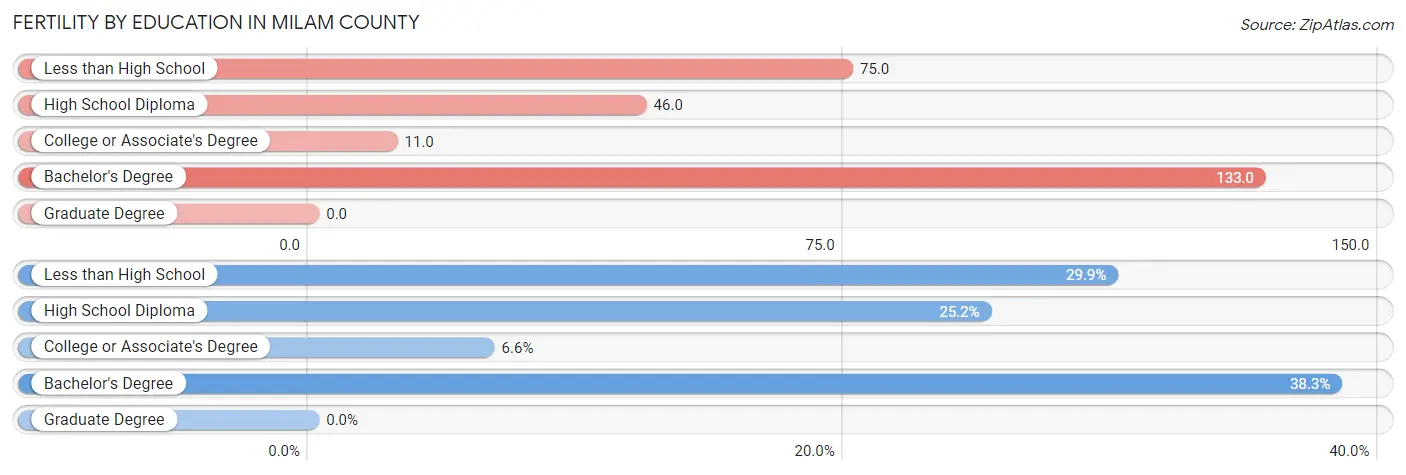
| Educational Attainment | Women with Births | Births / 1,000 Women |
| Less than High School | 82 (29.9%) | 75.0 |
| High School Diploma | 69 (25.2%) | 46.0 |
| College or Associate's Degree | 18 (6.6%) | 11.0 |
| Bachelor's Degree | 105 (38.3%) | 133.0 |
| Graduate Degree | 0 (0.0%) | 0.0 |
| Total | 274 (100.0%) | 53.0 |
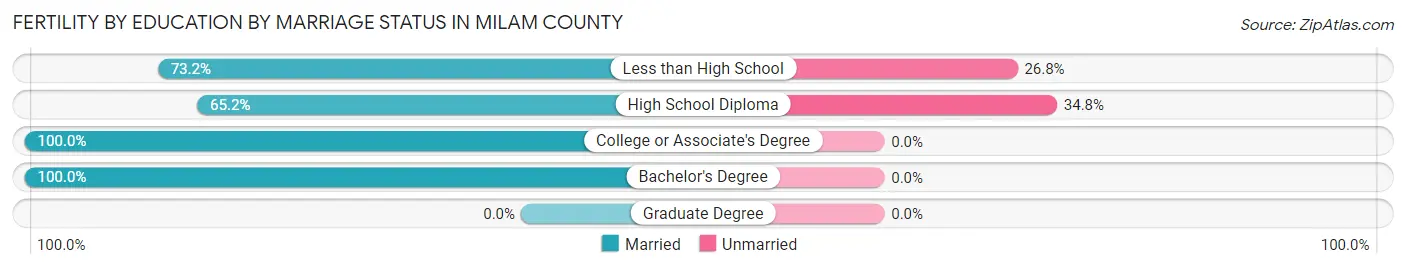
Fertility by Education by Marriage Status in Milam County
16.8% of women with births in Milam County are unmarried. Women with the educational attainment of college or associate's degree are most likely to be married with 100.0% of them married at childbirth, while women with the educational attainment of high school diploma are least likely to be married with 34.8% of them unmarried at childbirth.
| Educational Attainment | Married | Unmarried |
| Less than High School | 60 (73.2%) | 22 (26.8%) |
| High School Diploma | 45 (65.2%) | 24 (34.8%) |
| College or Associate's Degree | 18 (100.0%) | 0 (0.0%) |
| Bachelor's Degree | 105 (100.0%) | 0 (0.0%) |
| Graduate Degree | 0 (0.0%) | 0 (0.0%) |
| Total | 228 (83.2%) | 46 (16.8%) |
Employment Characteristics in Milam County
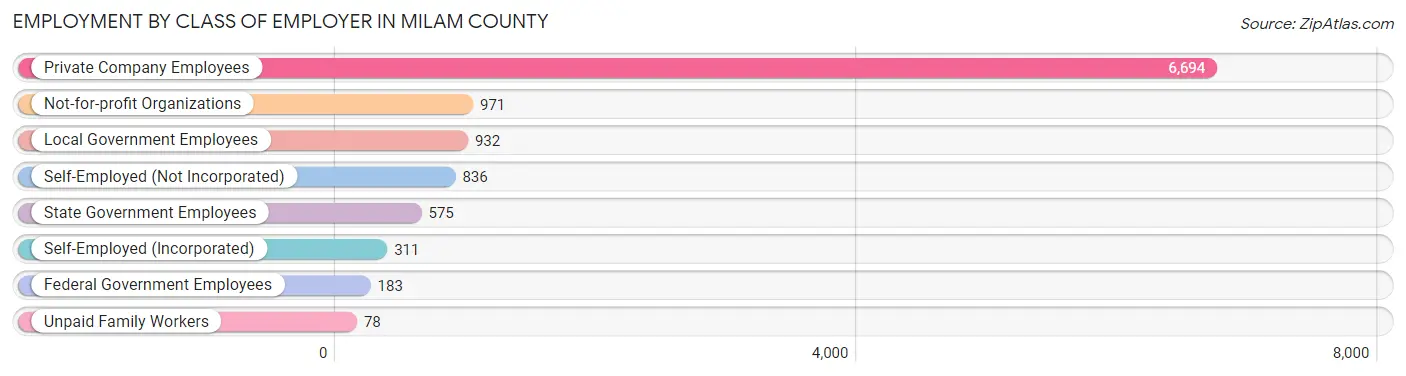
Employment by Class of Employer in Milam County
Among the 10,580 employed individuals in Milam County, private company employees (6,694 | 63.3%), not-for-profit organizations (971 | 9.2%), and local government employees (932 | 8.8%) make up the most common classes of employment.
| Employer Class | # Employees | % Employees |
| Private Company Employees | 6,694 | 63.3% |
| Self-Employed (Incorporated) | 311 | 2.9% |
| Self-Employed (Not Incorporated) | 836 | 7.9% |
| Not-for-profit Organizations | 971 | 9.2% |
| Local Government Employees | 932 | 8.8% |
| State Government Employees | 575 | 5.4% |
| Federal Government Employees | 183 | 1.7% |
| Unpaid Family Workers | 78 | 0.7% |
| Total | 10,580 | 100.0% |
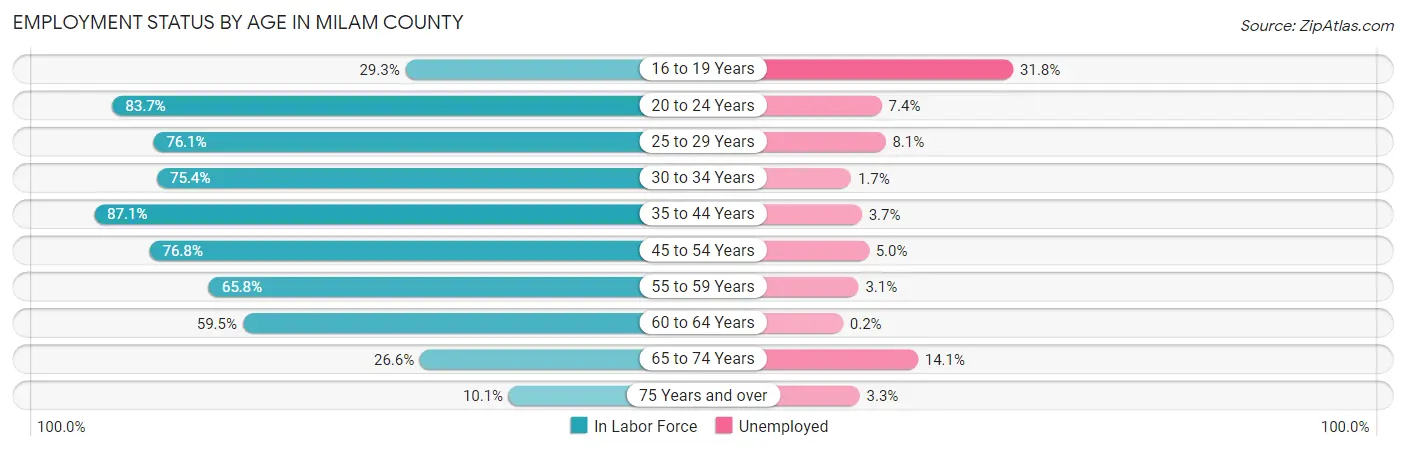
Employment Status by Age in Milam County
According to the labor force statistics for Milam County, out of the total population over 16 years of age (19,943), 58.2% or 11,607 individuals are in the labor force, with 5.8% or 673 of them unemployed. The age group with the highest labor force participation rate is 35 to 44 years, with 87.1% or 2,455 individuals in the labor force. Within the labor force, the 16 to 19 years age range has the highest percentage of unemployed individuals, with 31.8% or 121 of them being unemployed.
| Age Bracket | In Labor Force | Unemployed |
| 16 to 19 Years | 380 (29.3%) | 121 (31.8%) |
| 20 to 24 Years | 1,307 (83.7%) | 97 (7.4%) |
| 25 to 29 Years | 954 (76.1%) | 77 (8.1%) |
| 30 to 34 Years | 979 (75.4%) | 17 (1.7%) |
| 35 to 44 Years | 2,455 (87.1%) | 91 (3.7%) |
| 45 to 54 Years | 2,339 (76.8%) | 117 (5.0%) |
| 55 to 59 Years | 1,104 (65.8%) | 34 (3.1%) |
| 60 to 64 Years | 1,066 (59.5%) | 2 (0.2%) |
| 65 to 74 Years | 818 (26.6%) | 115 (14.1%) |
| 75 Years and over | 214 (10.1%) | 7 (3.3%) |
| Total | 11,607 (58.2%) | 673 (5.8%) |
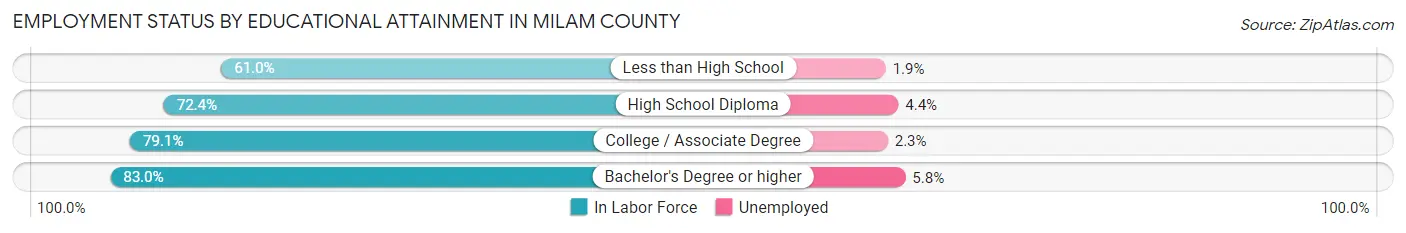
Employment Status by Educational Attainment in Milam County
According to labor force statistics for Milam County, 74.9% of individuals (8,902) out of the total population between 25 and 64 years of age (11,885) are in the labor force, with 3.8% or 338 of them being unemployed. The group with the highest labor force participation rate are those with the educational attainment of bachelor's degree or higher, with 83.0% or 1,908 individuals in the labor force. Within the labor force, individuals with bachelor's degree or higher education have the highest percentage of unemployment, with 5.8% or 111 of them being unemployed.
| Educational Attainment | In Labor Force | Unemployed |
| Less than High School | 964 (61.0%) | 30 (1.9%) |
| High School Diploma | 3,295 (72.4%) | 200 (4.4%) |
| College / Associate Degree | 2,732 (79.1%) | 79 (2.3%) |
| Bachelor's Degree or higher | 1,908 (83.0%) | 133 (5.8%) |
| Total | 8,902 (74.9%) | 452 (3.8%) |
Employment Occupations by Sex in Milam County
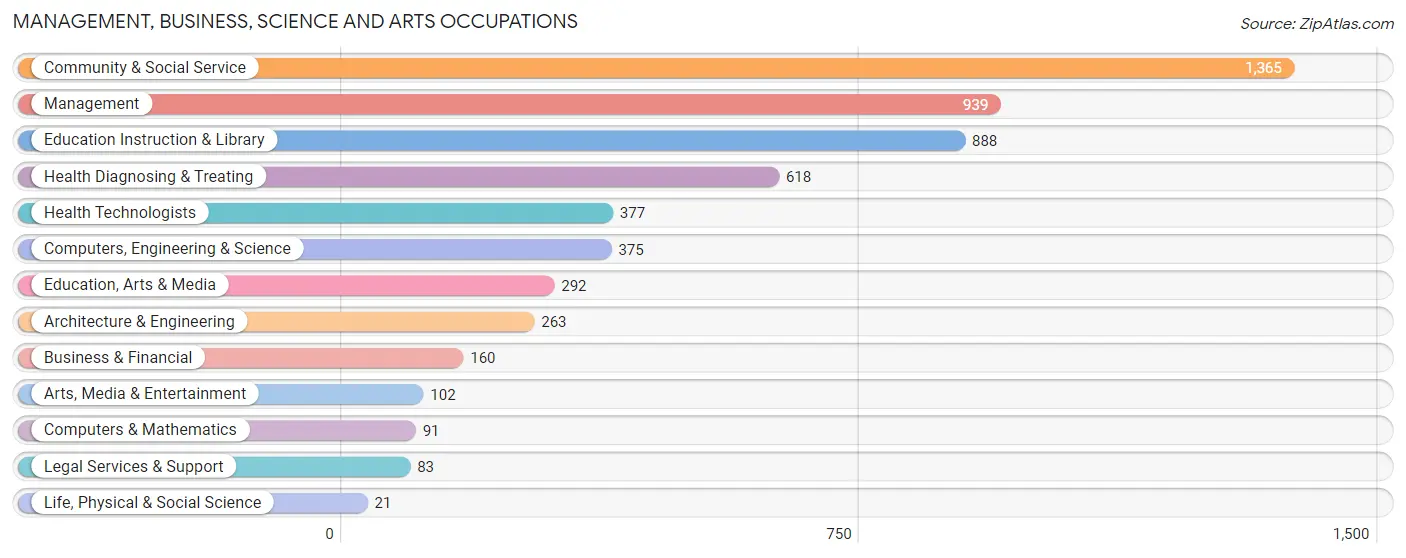
Management, Business, Science and Arts Occupations
The most common Management, Business, Science and Arts occupations in Milam County are Community & Social Service (1,365 | 12.5%), Management (939 | 8.6%), Education Instruction & Library (888 | 8.1%), Health Diagnosing & Treating (618 | 5.7%), and Health Technologists (377 | 3.5%).
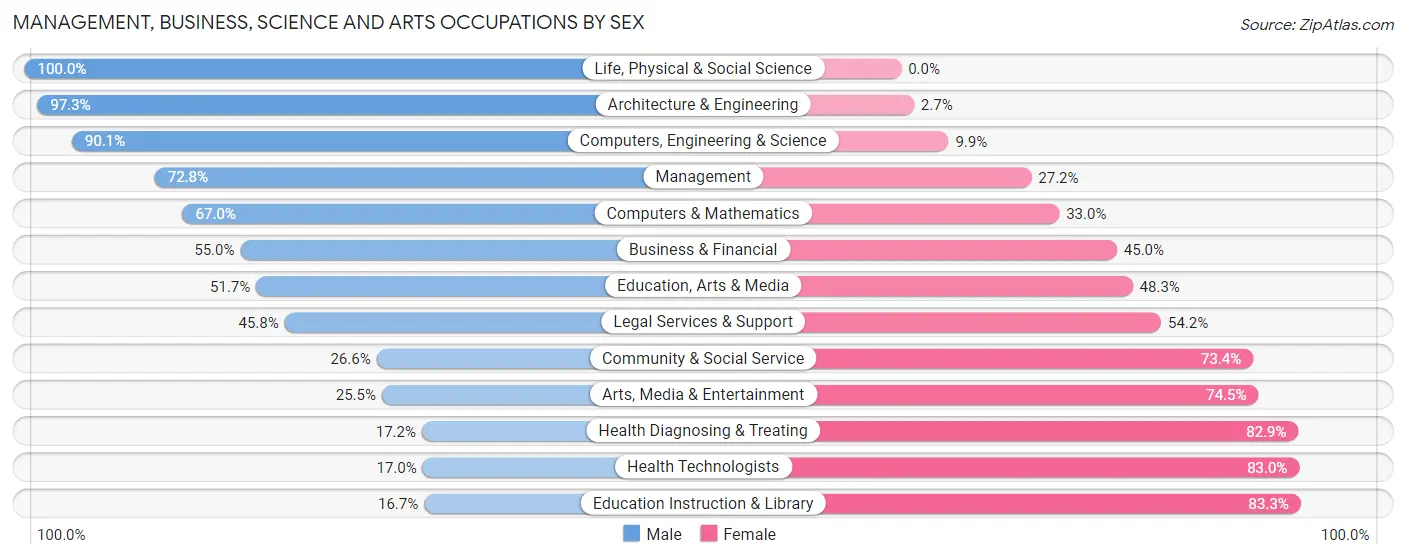
Management, Business, Science and Arts Occupations by Sex
Within the Management, Business, Science and Arts occupations in Milam County, the most male-oriented occupations are Life, Physical & Social Science (100.0%), Architecture & Engineering (97.3%), and Computers, Engineering & Science (90.1%), while the most female-oriented occupations are Education Instruction & Library (83.3%), Health Technologists (83.0%), and Health Diagnosing & Treating (82.9%).
| Occupation | Male | Female |
| Management | 684 (72.8%) | 255 (27.2%) |
| Business & Financial | 88 (55.0%) | 72 (45.0%) |
| Computers, Engineering & Science | 338 (90.1%) | 37 (9.9%) |
| Computers & Mathematics | 61 (67.0%) | 30 (33.0%) |
| Architecture & Engineering | 256 (97.3%) | 7 (2.7%) |
| Life, Physical & Social Science | 21 (100.0%) | 0 (0.0%) |
| Community & Social Service | 363 (26.6%) | 1,002 (73.4%) |
| Education, Arts & Media | 151 (51.7%) | 141 (48.3%) |
| Legal Services & Support | 38 (45.8%) | 45 (54.2%) |
| Education Instruction & Library | 148 (16.7%) | 740 (83.3%) |
| Arts, Media & Entertainment | 26 (25.5%) | 76 (74.5%) |
| Health Diagnosing & Treating | 106 (17.2%) | 512 (82.9%) |
| Health Technologists | 64 (17.0%) | 313 (83.0%) |
| Total (Category) | 1,579 (45.7%) | 1,878 (54.3%) |
| Total (Overall) | 5,911 (54.1%) | 5,018 (45.9%) |
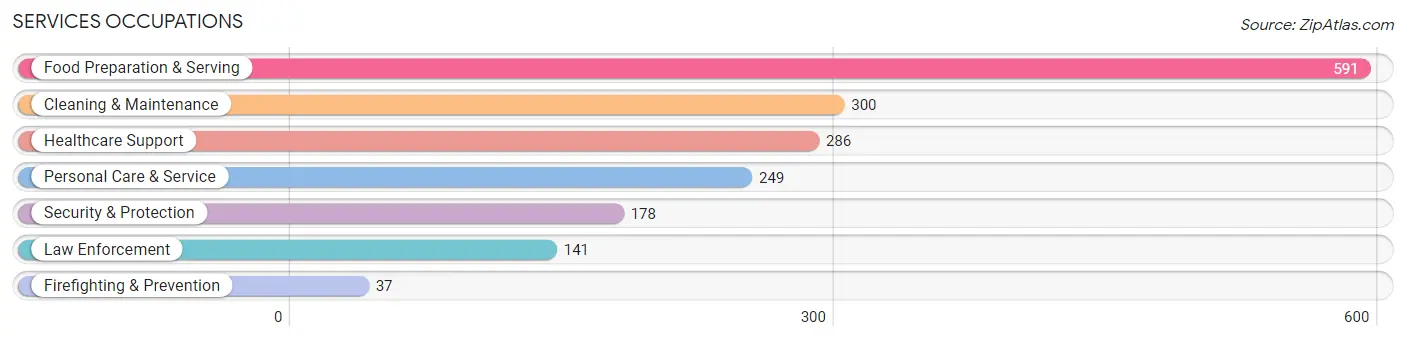
Services Occupations
The most common Services occupations in Milam County are Food Preparation & Serving (591 | 5.4%), Cleaning & Maintenance (300 | 2.7%), Healthcare Support (286 | 2.6%), Personal Care & Service (249 | 2.3%), and Security & Protection (178 | 1.6%).
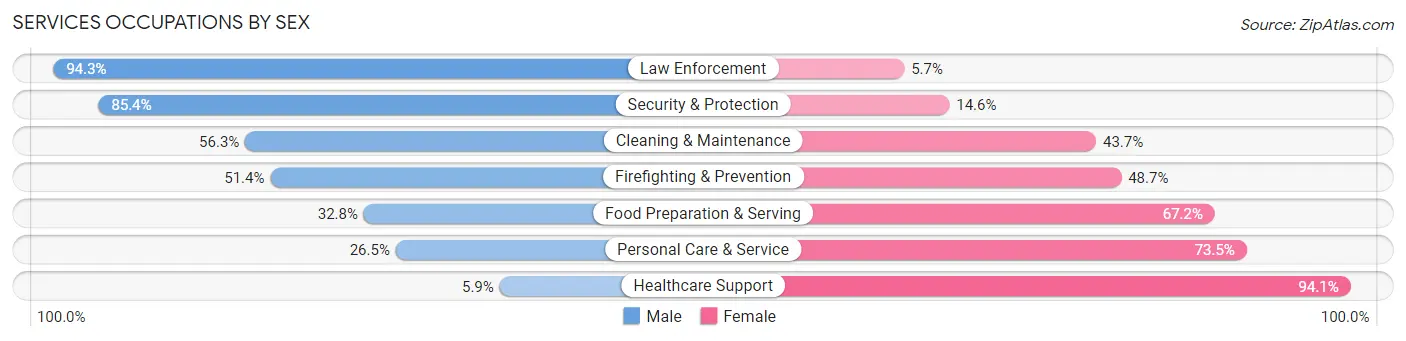
Services Occupations by Sex
Within the Services occupations in Milam County, the most male-oriented occupations are Law Enforcement (94.3%), Security & Protection (85.4%), and Cleaning & Maintenance (56.3%), while the most female-oriented occupations are Healthcare Support (94.1%), Personal Care & Service (73.5%), and Food Preparation & Serving (67.2%).
| Occupation | Male | Female |
| Healthcare Support | 17 (5.9%) | 269 (94.1%) |
| Security & Protection | 152 (85.4%) | 26 (14.6%) |
| Firefighting & Prevention | 19 (51.3%) | 18 (48.6%) |
| Law Enforcement | 133 (94.3%) | 8 (5.7%) |
| Food Preparation & Serving | 194 (32.8%) | 397 (67.2%) |
| Cleaning & Maintenance | 169 (56.3%) | 131 (43.7%) |
| Personal Care & Service | 66 (26.5%) | 183 (73.5%) |
| Total (Category) | 598 (37.3%) | 1,006 (62.7%) |
| Total (Overall) | 5,911 (54.1%) | 5,018 (45.9%) |
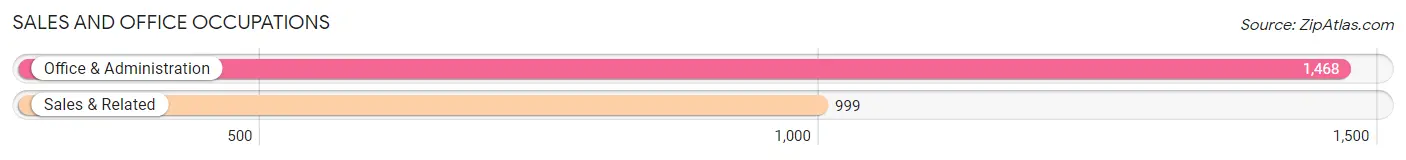
Sales and Office Occupations
The most common Sales and Office occupations in Milam County are Office & Administration (1,468 | 13.4%), and Sales & Related (999 | 9.1%).
Sales and Office Occupations by Sex

| Occupation | Male | Female |
| Sales & Related | 487 (48.7%) | 512 (51.2%) |
| Office & Administration | 165 (11.2%) | 1,303 (88.8%) |
| Total (Category) | 652 (26.4%) | 1,815 (73.6%) |
| Total (Overall) | 5,911 (54.1%) | 5,018 (45.9%) |
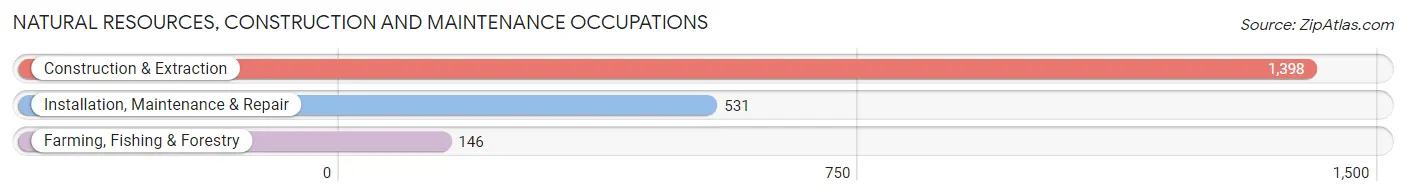
Natural Resources, Construction and Maintenance Occupations
The most common Natural Resources, Construction and Maintenance occupations in Milam County are Construction & Extraction (1,398 | 12.8%), Installation, Maintenance & Repair (531 | 4.9%), and Farming, Fishing & Forestry (146 | 1.3%).
Natural Resources, Construction and Maintenance Occupations by Sex
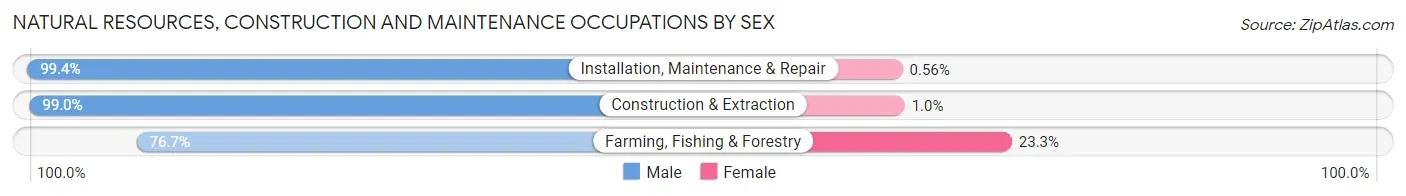
| Occupation | Male | Female |
| Farming, Fishing & Forestry | 112 (76.7%) | 34 (23.3%) |
| Construction & Extraction | 1,384 (99.0%) | 14 (1.0%) |
| Installation, Maintenance & Repair | 528 (99.4%) | 3 (0.6%) |
| Total (Category) | 2,024 (97.5%) | 51 (2.5%) |
| Total (Overall) | 5,911 (54.1%) | 5,018 (45.9%) |
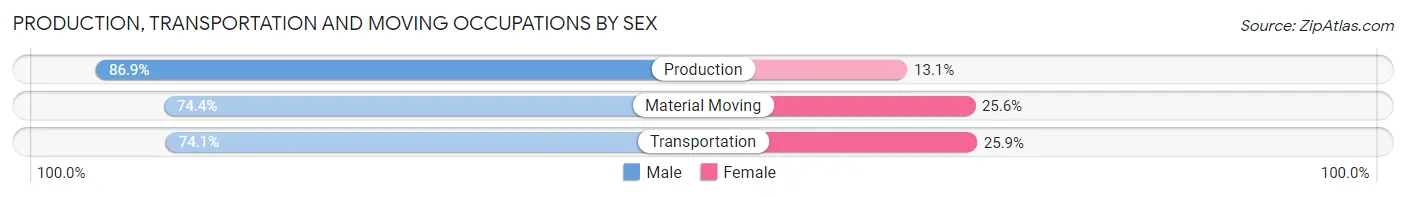
Production, Transportation and Moving Occupations
The most common Production, Transportation and Moving occupations in Milam County are Production (579 | 5.3%), Material Moving (477 | 4.4%), and Transportation (270 | 2.5%).
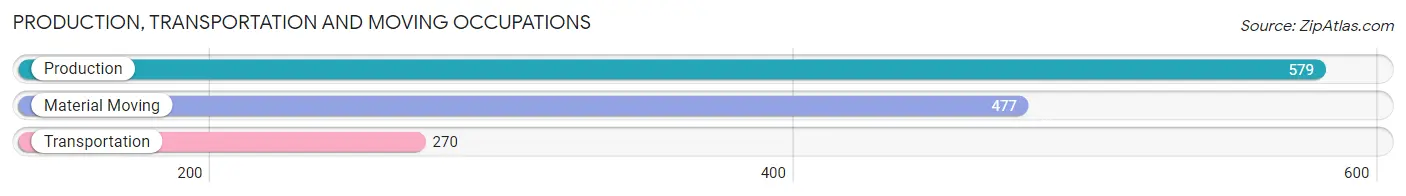
Production, Transportation and Moving Occupations by Sex
| Occupation | Male | Female |
| Production | 503 (86.9%) | 76 (13.1%) |
| Transportation | 200 (74.1%) | 70 (25.9%) |
| Material Moving | 355 (74.4%) | 122 (25.6%) |
| Total (Category) | 1,058 (79.8%) | 268 (20.2%) |
| Total (Overall) | 5,911 (54.1%) | 5,018 (45.9%) |
Employment Industries by Sex in Milam County
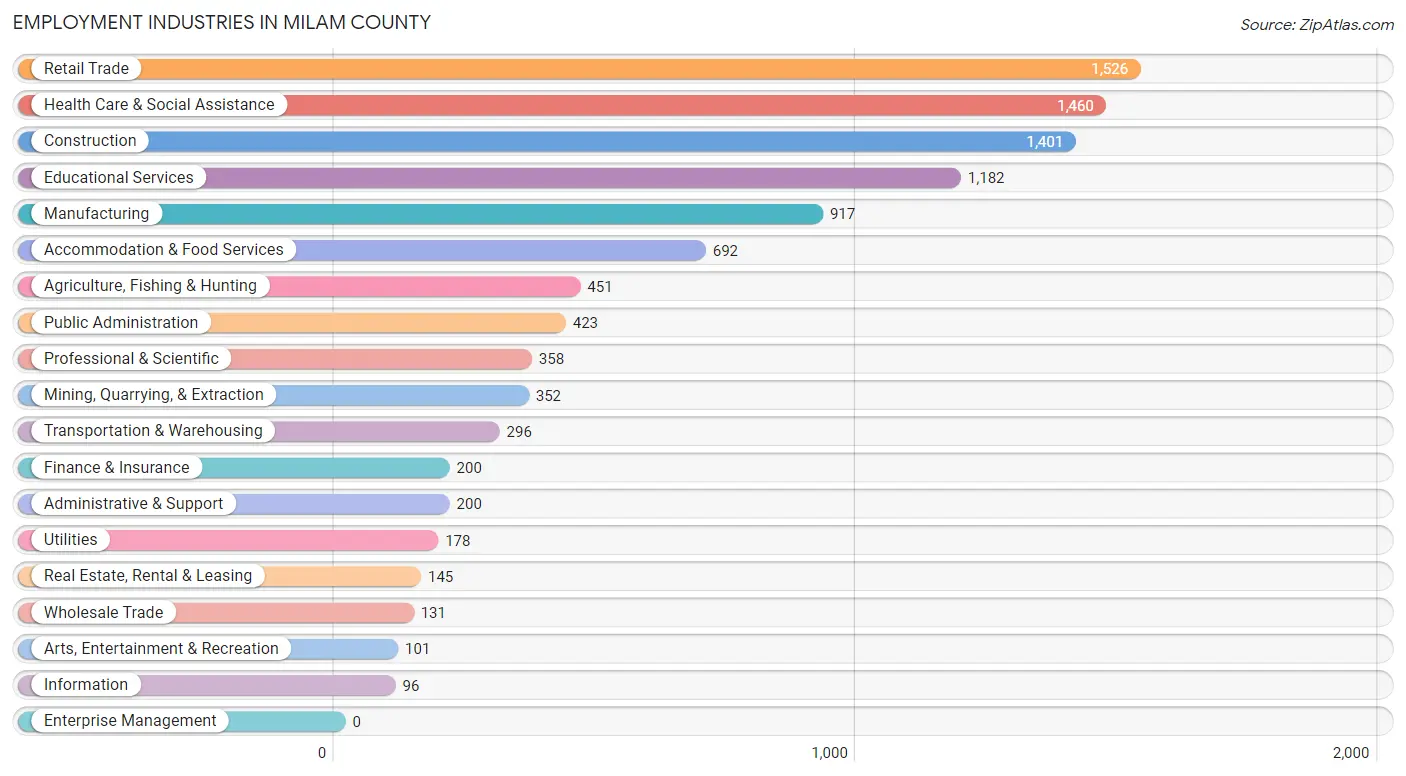
Employment Industries in Milam County
The major employment industries in Milam County include Retail Trade (1,526 | 14.0%), Health Care & Social Assistance (1,460 | 13.4%), Construction (1,401 | 12.8%), Educational Services (1,182 | 10.8%), and Manufacturing (917 | 8.4%).
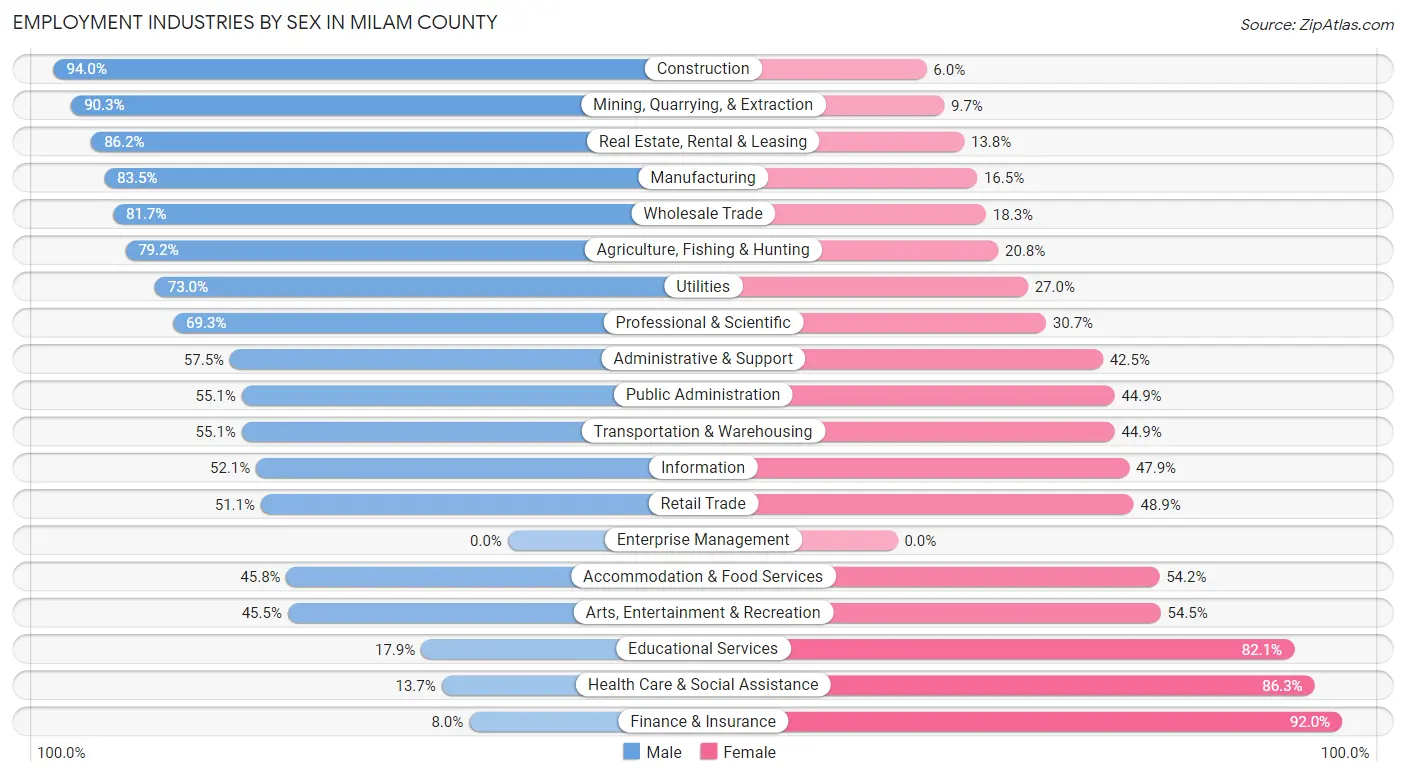
Employment Industries by Sex in Milam County
The Milam County industries that see more men than women are Construction (94.0%), Mining, Quarrying, & Extraction (90.3%), and Real Estate, Rental & Leasing (86.2%), whereas the industries that tend to have a higher number of women are Finance & Insurance (92.0%), Health Care & Social Assistance (86.3%), and Educational Services (82.1%).
| Industry | Male | Female |
| Agriculture, Fishing & Hunting | 357 (79.2%) | 94 (20.8%) |
| Mining, Quarrying, & Extraction | 318 (90.3%) | 34 (9.7%) |
| Construction | 1,317 (94.0%) | 84 (6.0%) |
| Manufacturing | 766 (83.5%) | 151 (16.5%) |
| Wholesale Trade | 107 (81.7%) | 24 (18.3%) |
| Retail Trade | 780 (51.1%) | 746 (48.9%) |
| Transportation & Warehousing | 163 (55.1%) | 133 (44.9%) |
| Utilities | 130 (73.0%) | 48 (27.0%) |
| Information | 50 (52.1%) | 46 (47.9%) |
| Finance & Insurance | 16 (8.0%) | 184 (92.0%) |
| Real Estate, Rental & Leasing | 125 (86.2%) | 20 (13.8%) |
| Professional & Scientific | 248 (69.3%) | 110 (30.7%) |
| Enterprise Management | 0 (0.0%) | 0 (0.0%) |
| Administrative & Support | 115 (57.5%) | 85 (42.5%) |
| Educational Services | 212 (17.9%) | 970 (82.1%) |
| Health Care & Social Assistance | 200 (13.7%) | 1,260 (86.3%) |
| Arts, Entertainment & Recreation | 46 (45.5%) | 55 (54.5%) |
| Accommodation & Food Services | 317 (45.8%) | 375 (54.2%) |
| Public Administration | 233 (55.1%) | 190 (44.9%) |
| Total | 5,911 (54.1%) | 5,018 (45.9%) |
Education in Milam County
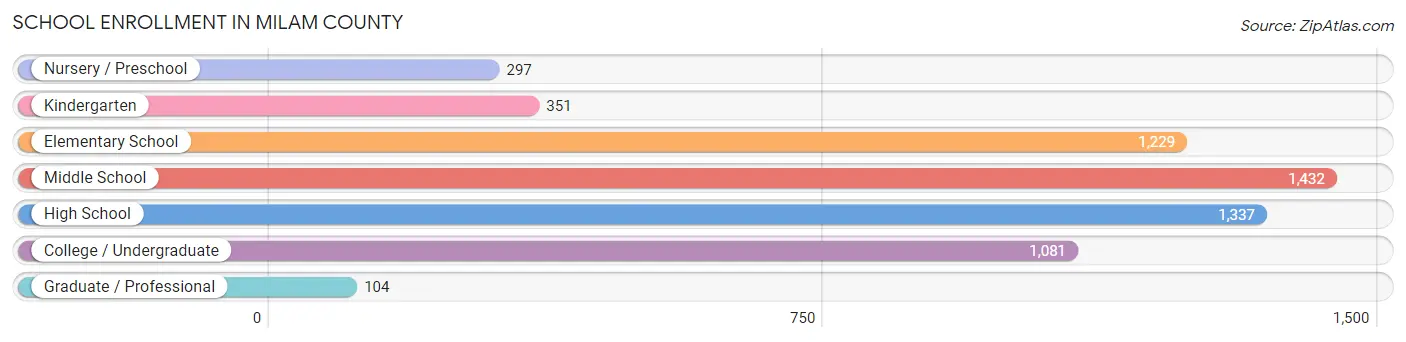
School Enrollment in Milam County
The most common levels of schooling among the 5,831 students in Milam County are middle school (1,432 | 24.6%), high school (1,337 | 22.9%), and elementary school (1,229 | 21.1%).
| School Level | # Students | % Students |
| Nursery / Preschool | 297 | 5.1% |
| Kindergarten | 351 | 6.0% |
| Elementary School | 1,229 | 21.1% |
| Middle School | 1,432 | 24.6% |
| High School | 1,337 | 22.9% |
| College / Undergraduate | 1,081 | 18.5% |
| Graduate / Professional | 104 | 1.8% |
| Total | 5,831 | 100.0% |
School Enrollment by Age by Funding Source in Milam County
Out of a total of 5,831 students who are enrolled in schools in Milam County, 746 (12.8%) attend a private institution, while the remaining 5,085 (87.2%) are enrolled in public schools. The age group of 20 to 24 year olds has the highest likelihood of being enrolled in private schools, with 254 (39.4% in the age bracket) enrolled. Conversely, the age group of 18 to 19 year olds has the lowest likelihood of being enrolled in a private school, with 328 (100.0% in the age bracket) attending a public institution.
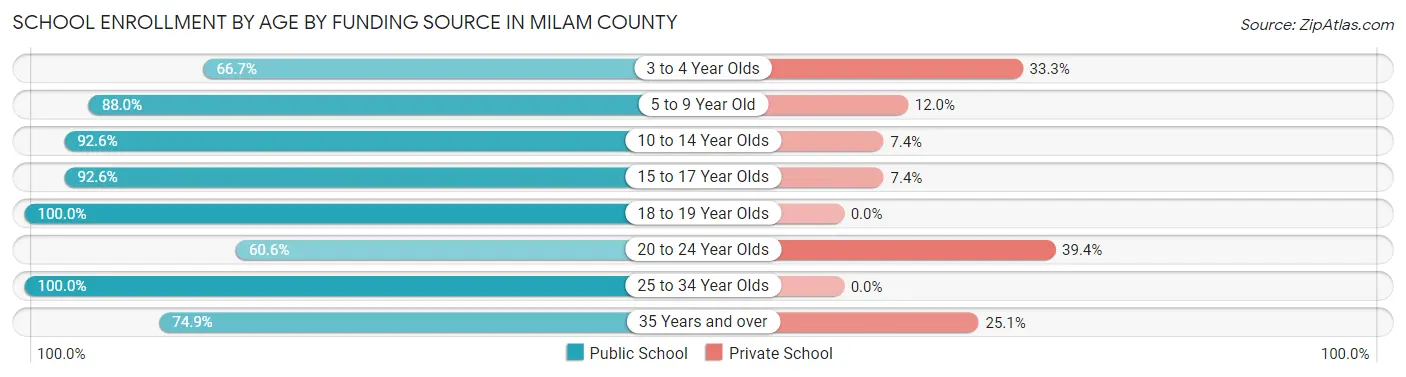
| Age Bracket | Public School | Private School |
| 3 to 4 Year Olds | 114 (66.7%) | 57 (33.3%) |
| 5 to 9 Year Old | 1,266 (88.0%) | 172 (12.0%) |
| 10 to 14 Year Olds | 1,730 (92.6%) | 138 (7.4%) |
| 15 to 17 Year Olds | 959 (92.6%) | 77 (7.4%) |
| 18 to 19 Year Olds | 328 (100.0%) | 0 (0.0%) |
| 20 to 24 Year Olds | 391 (60.6%) | 254 (39.4%) |
| 25 to 34 Year Olds | 142 (100.0%) | 0 (0.0%) |
| 35 Years and over | 152 (74.9%) | 51 (25.1%) |
| Total | 5,085 (87.2%) | 746 (12.8%) |
Educational Attainment by Field of Study in Milam County
Business (713 | 21.8%), education (634 | 19.4%), liberal arts & history (336 | 10.2%), bio, nature & agricultural (256 | 7.8%), and science & technology (209 | 6.4%) are the most common fields of study among 3,277 individuals in Milam County who have obtained a bachelor's degree or higher.
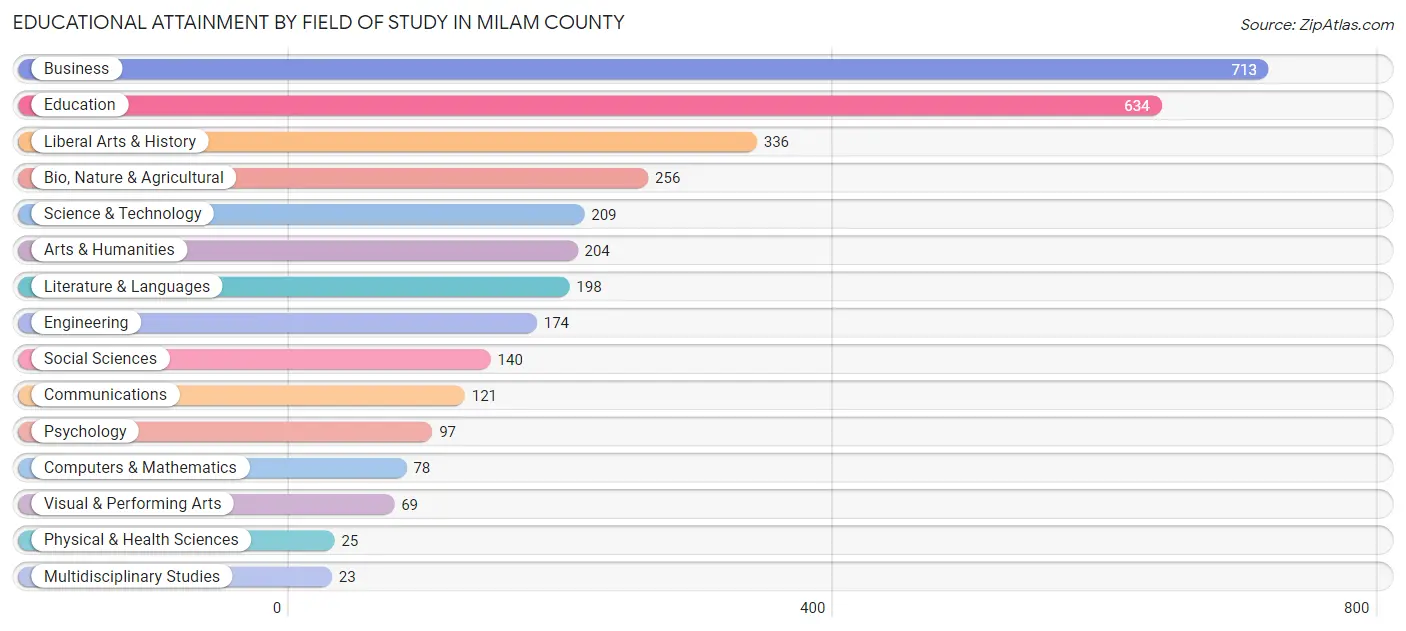
| Field of Study | # Graduates | % Graduates |
| Computers & Mathematics | 78 | 2.4% |
| Bio, Nature & Agricultural | 256 | 7.8% |
| Physical & Health Sciences | 25 | 0.8% |
| Psychology | 97 | 3.0% |
| Social Sciences | 140 | 4.3% |
| Engineering | 174 | 5.3% |
| Multidisciplinary Studies | 23 | 0.7% |
| Science & Technology | 209 | 6.4% |
| Business | 713 | 21.8% |
| Education | 634 | 19.4% |
| Literature & Languages | 198 | 6.0% |
| Liberal Arts & History | 336 | 10.2% |
| Visual & Performing Arts | 69 | 2.1% |
| Communications | 121 | 3.7% |
| Arts & Humanities | 204 | 6.2% |
| Total | 3,277 | 100.0% |
Transportation & Commute in Milam County
Vehicle Availability by Sex in Milam County
The most prevalent vehicle ownership categories in Milam County are males with 2 vehicles (2,344, accounting for 40.5%) and females with 2 vehicles (1,686, making up 48.9%).
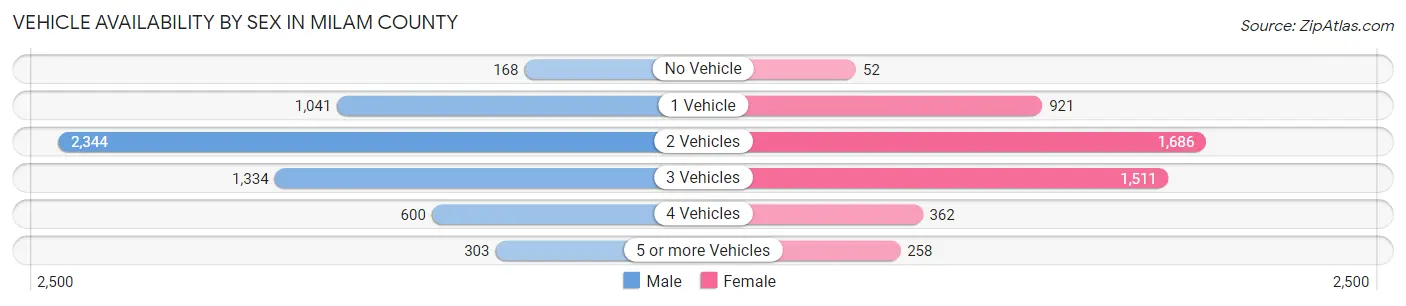
| Vehicles Available | Male | Female |
| No Vehicle | 168 (2.9%) | 52 (1.1%) |
| 1 Vehicle | 1,041 (18.0%) | 921 (19.2%) |
| 2 Vehicles | 2,344 (40.5%) | 1,686 (35.2%) |
| 3 Vehicles | 1,334 (23.0%) | 1,511 (31.5%) |
| 4 Vehicles | 600 (10.4%) | 362 (7.6%) |
| 5 or more Vehicles | 303 (5.2%) | 258 (5.4%) |
| Total | 5,790 (100.0%) | 4,790 (100.0%) |
Commute Time in Milam County
The most frequently occuring commute durations in Milam County are 5 to 9 minutes (1,302 commuters, 13.2%), 45 to 59 minutes (1,285 commuters, 13.1%), and 10 to 14 minutes (1,062 commuters, 10.8%).
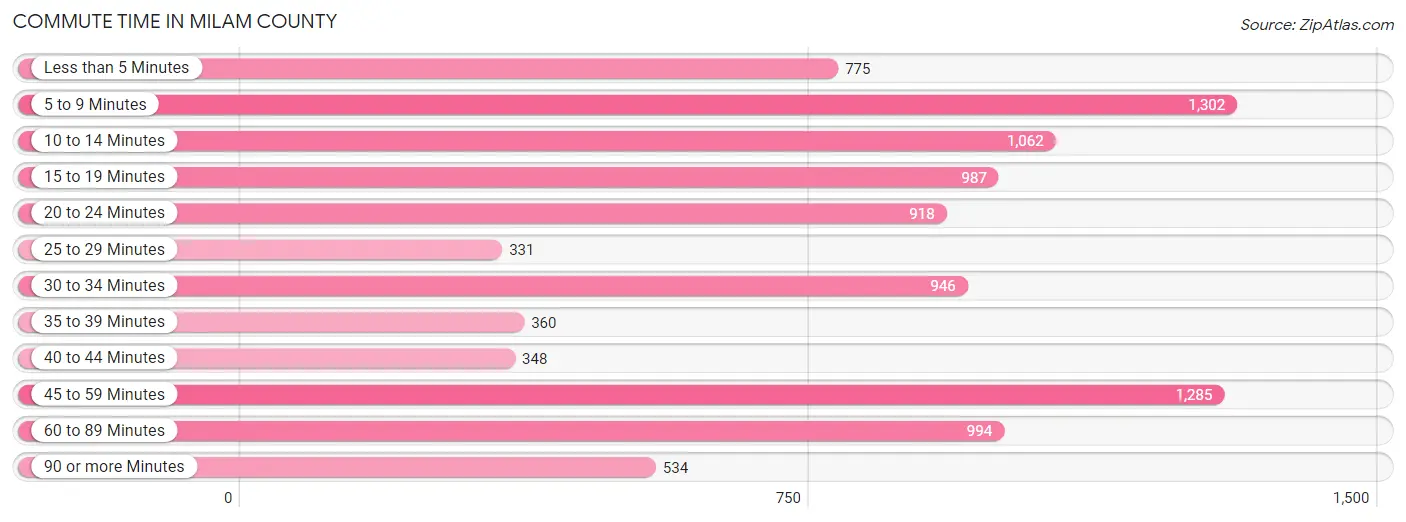
| Commute Time | # Commuters | % Commuters |
| Less than 5 Minutes | 775 | 7.9% |
| 5 to 9 Minutes | 1,302 | 13.2% |
| 10 to 14 Minutes | 1,062 | 10.8% |
| 15 to 19 Minutes | 987 | 10.0% |
| 20 to 24 Minutes | 918 | 9.3% |
| 25 to 29 Minutes | 331 | 3.4% |
| 30 to 34 Minutes | 946 | 9.6% |
| 35 to 39 Minutes | 360 | 3.7% |
| 40 to 44 Minutes | 348 | 3.5% |
| 45 to 59 Minutes | 1,285 | 13.1% |
| 60 to 89 Minutes | 994 | 10.1% |
| 90 or more Minutes | 534 | 5.4% |
Commute Time by Sex in Milam County
The most common commute times in Milam County are 5 to 9 minutes (762 commuters, 14.4%) for males and 15 to 19 minutes (667 commuters, 14.6%) for females.
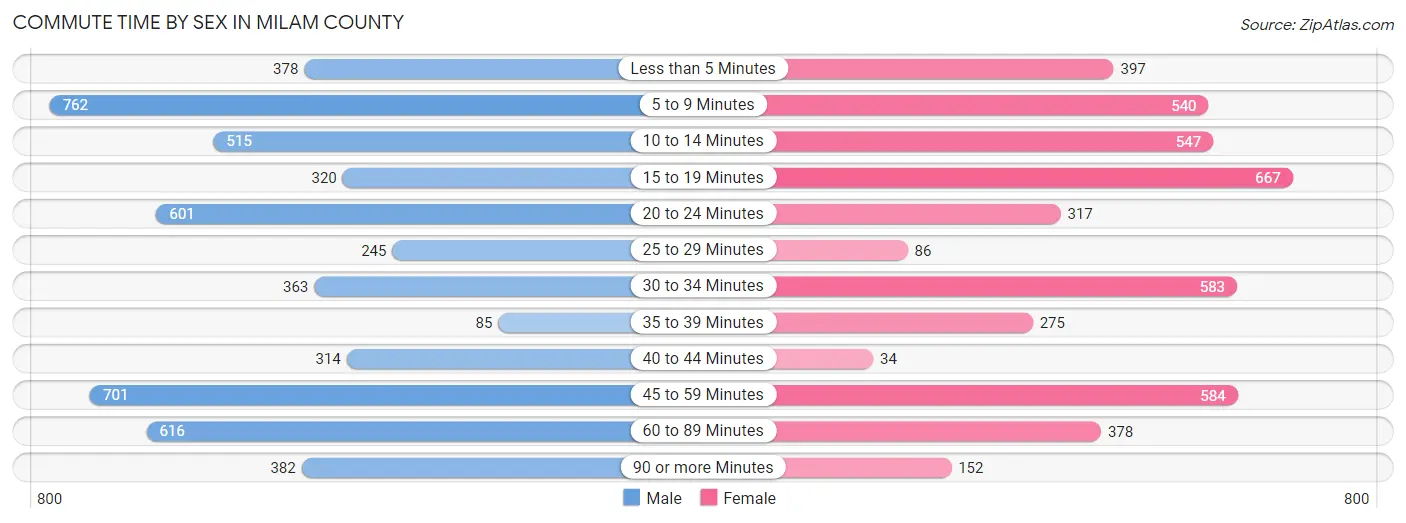
| Commute Time | Male | Female |
| Less than 5 Minutes | 378 (7.2%) | 397 (8.7%) |
| 5 to 9 Minutes | 762 (14.4%) | 540 (11.8%) |
| 10 to 14 Minutes | 515 (9.8%) | 547 (12.0%) |
| 15 to 19 Minutes | 320 (6.1%) | 667 (14.6%) |
| 20 to 24 Minutes | 601 (11.4%) | 317 (7.0%) |
| 25 to 29 Minutes | 245 (4.6%) | 86 (1.9%) |
| 30 to 34 Minutes | 363 (6.9%) | 583 (12.8%) |
| 35 to 39 Minutes | 85 (1.6%) | 275 (6.0%) |
| 40 to 44 Minutes | 314 (5.9%) | 34 (0.7%) |
| 45 to 59 Minutes | 701 (13.3%) | 584 (12.8%) |
| 60 to 89 Minutes | 616 (11.7%) | 378 (8.3%) |
| 90 or more Minutes | 382 (7.2%) | 152 (3.3%) |
Time of Departure to Work by Sex in Milam County
The most frequent times of departure to work in Milam County are 6:00 AM to 6:29 AM (1,052, 19.9%) for males and 7:00 AM to 7:29 AM (927, 20.3%) for females.
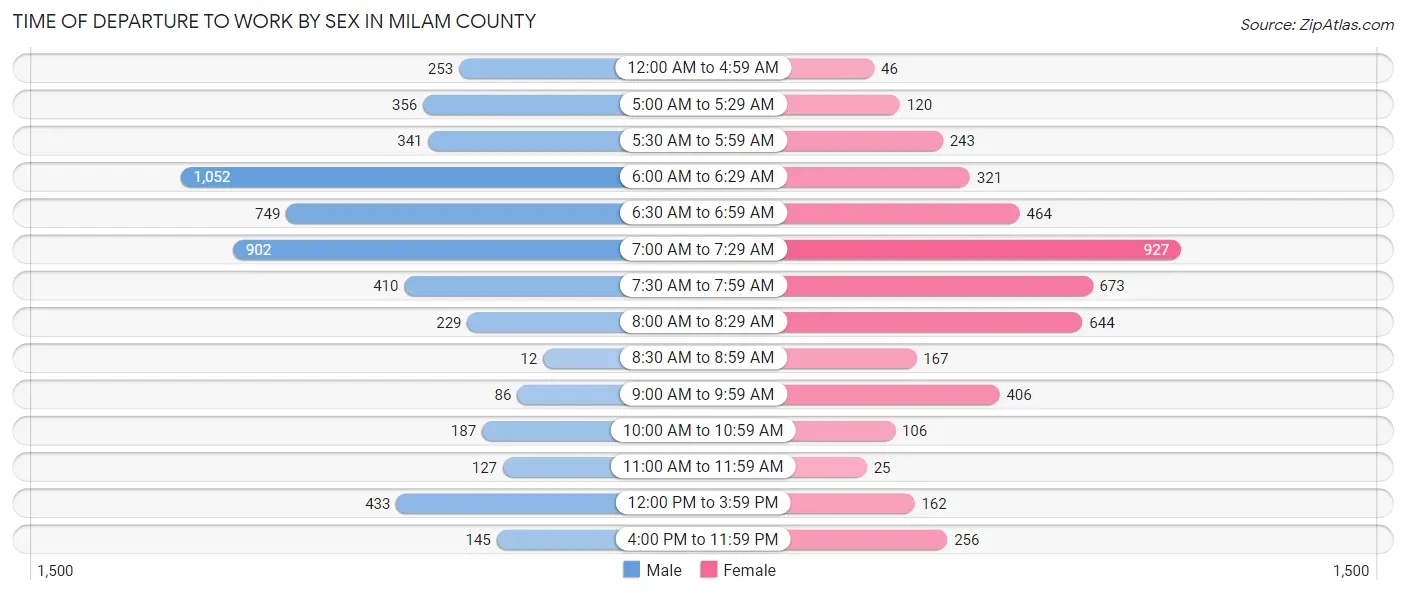
| Time of Departure | Male | Female |
| 12:00 AM to 4:59 AM | 253 (4.8%) | 46 (1.0%) |
| 5:00 AM to 5:29 AM | 356 (6.7%) | 120 (2.6%) |
| 5:30 AM to 5:59 AM | 341 (6.5%) | 243 (5.3%) |
| 6:00 AM to 6:29 AM | 1,052 (19.9%) | 321 (7.0%) |
| 6:30 AM to 6:59 AM | 749 (14.2%) | 464 (10.2%) |
| 7:00 AM to 7:29 AM | 902 (17.1%) | 927 (20.3%) |
| 7:30 AM to 7:59 AM | 410 (7.8%) | 673 (14.8%) |
| 8:00 AM to 8:29 AM | 229 (4.3%) | 644 (14.1%) |
| 8:30 AM to 8:59 AM | 12 (0.2%) | 167 (3.7%) |
| 9:00 AM to 9:59 AM | 86 (1.6%) | 406 (8.9%) |
| 10:00 AM to 10:59 AM | 187 (3.5%) | 106 (2.3%) |
| 11:00 AM to 11:59 AM | 127 (2.4%) | 25 (0.5%) |
| 12:00 PM to 3:59 PM | 433 (8.2%) | 162 (3.5%) |
| 4:00 PM to 11:59 PM | 145 (2.8%) | 256 (5.6%) |
| Total | 5,282 (100.0%) | 4,560 (100.0%) |
Housing Occupancy in Milam County
Occupancy by Ownership in Milam County
Of the total 9,767 dwellings in Milam County, owner-occupied units account for 7,448 (76.3%), while renter-occupied units make up 2,319 (23.7%).
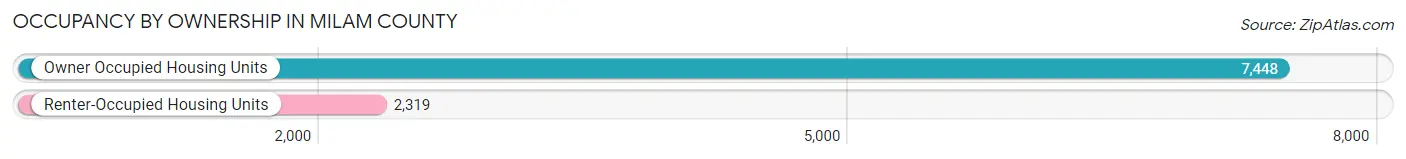
| Occupancy | # Housing Units | % Housing Units |
| Owner Occupied Housing Units | 7,448 | 76.3% |
| Renter-Occupied Housing Units | 2,319 | 23.7% |
| Total Occupied Housing Units | 9,767 | 100.0% |
Occupancy by Household Size in Milam County
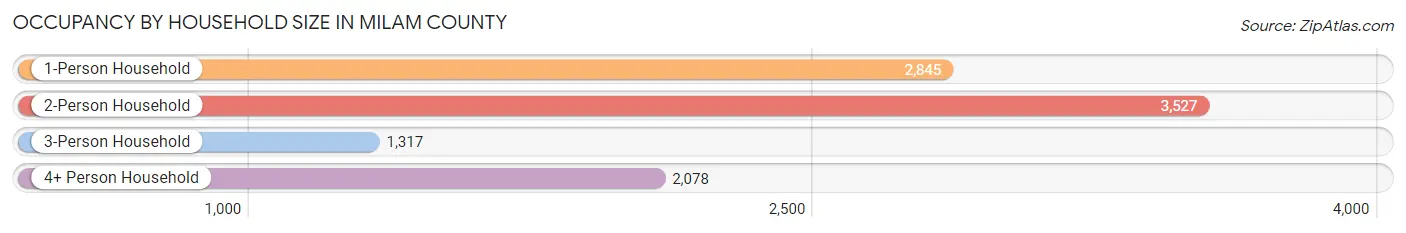
| Household Size | # Housing Units | % Housing Units |
| 1-Person Household | 2,845 | 29.1% |
| 2-Person Household | 3,527 | 36.1% |
| 3-Person Household | 1,317 | 13.5% |
| 4+ Person Household | 2,078 | 21.3% |
| Total Housing Units | 9,767 | 100.0% |
Occupancy by Ownership by Household Size in Milam County
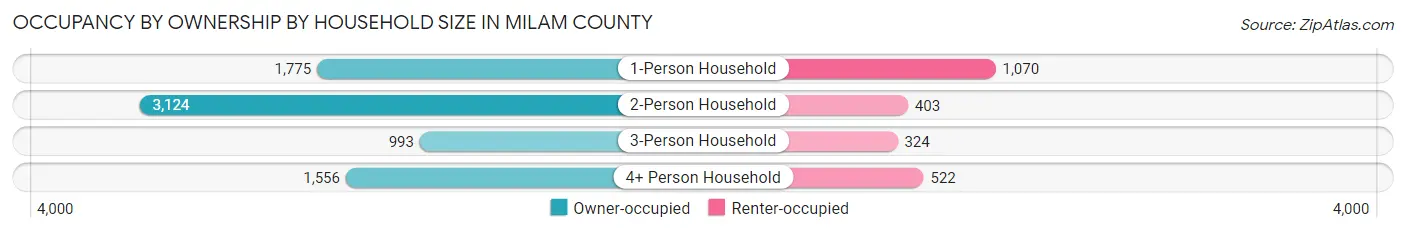
| Household Size | Owner-occupied | Renter-occupied |
| 1-Person Household | 1,775 (62.4%) | 1,070 (37.6%) |
| 2-Person Household | 3,124 (88.6%) | 403 (11.4%) |
| 3-Person Household | 993 (75.4%) | 324 (24.6%) |
| 4+ Person Household | 1,556 (74.9%) | 522 (25.1%) |
| Total Housing Units | 7,448 (76.3%) | 2,319 (23.7%) |
Occupancy by Educational Attainment in Milam County
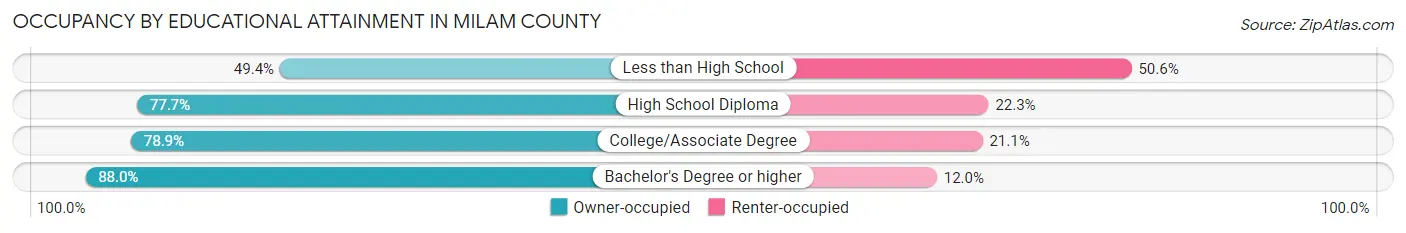
| Household Size | Owner-occupied | Renter-occupied |
| Less than High School | 634 (49.4%) | 650 (50.6%) |
| High School Diploma | 2,769 (77.7%) | 793 (22.3%) |
| College/Associate Degree | 2,479 (78.9%) | 662 (21.1%) |
| Bachelor's Degree or higher | 1,566 (88.0%) | 214 (12.0%) |
Occupancy by Age of Householder in Milam County
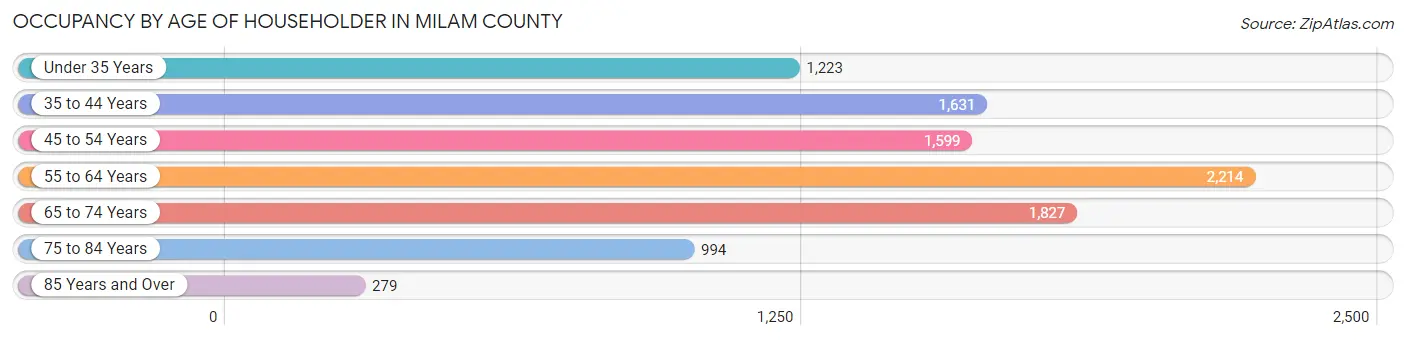
| Age Bracket | # Households | % Households |
| Under 35 Years | 1,223 | 12.5% |
| 35 to 44 Years | 1,631 | 16.7% |
| 45 to 54 Years | 1,599 | 16.4% |
| 55 to 64 Years | 2,214 | 22.7% |
| 65 to 74 Years | 1,827 | 18.7% |
| 75 to 84 Years | 994 | 10.2% |
| 85 Years and Over | 279 | 2.9% |
| Total | 9,767 | 100.0% |
Housing Finances in Milam County
Median Income by Occupancy in Milam County
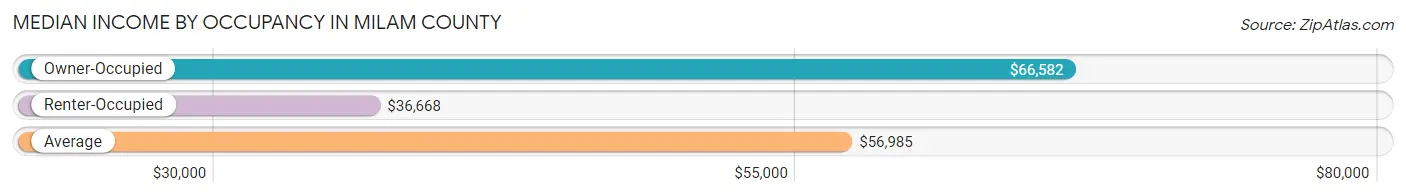
| Occupancy Type | # Households | Median Income |
| Owner-Occupied | 7,448 (76.3%) | $66,582 |
| Renter-Occupied | 2,319 (23.7%) | $36,668 |
| Average | 9,767 (100.0%) | $56,985 |
Occupancy by Householder Income Bracket in Milam County
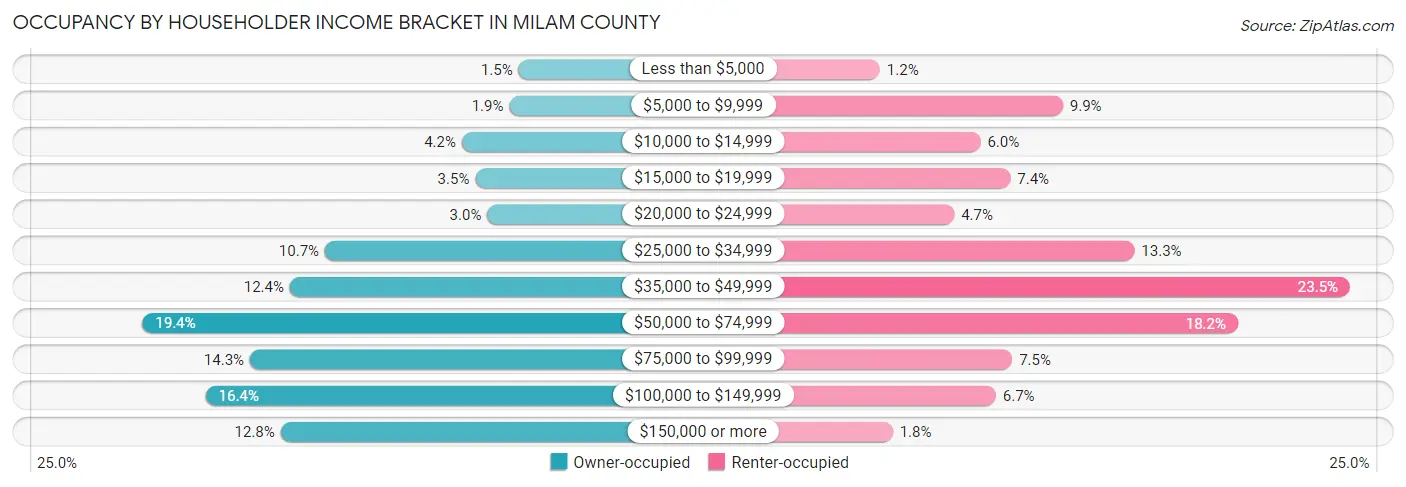
| Income Bracket | Owner-occupied | Renter-occupied |
| Less than $5,000 | 110 (1.5%) | 27 (1.2%) |
| $5,000 to $9,999 | 143 (1.9%) | 229 (9.9%) |
| $10,000 to $14,999 | 311 (4.2%) | 138 (5.9%) |
| $15,000 to $19,999 | 264 (3.5%) | 171 (7.4%) |
| $20,000 to $24,999 | 221 (3.0%) | 109 (4.7%) |
| $25,000 to $34,999 | 797 (10.7%) | 308 (13.3%) |
| $35,000 to $49,999 | 921 (12.4%) | 546 (23.5%) |
| $50,000 to $74,999 | 1,444 (19.4%) | 422 (18.2%) |
| $75,000 to $99,999 | 1,063 (14.3%) | 173 (7.5%) |
| $100,000 to $149,999 | 1,220 (16.4%) | 155 (6.7%) |
| $150,000 or more | 954 (12.8%) | 41 (1.8%) |
| Total | 7,448 (100.0%) | 2,319 (100.0%) |
Monthly Housing Cost Tiers in Milam County
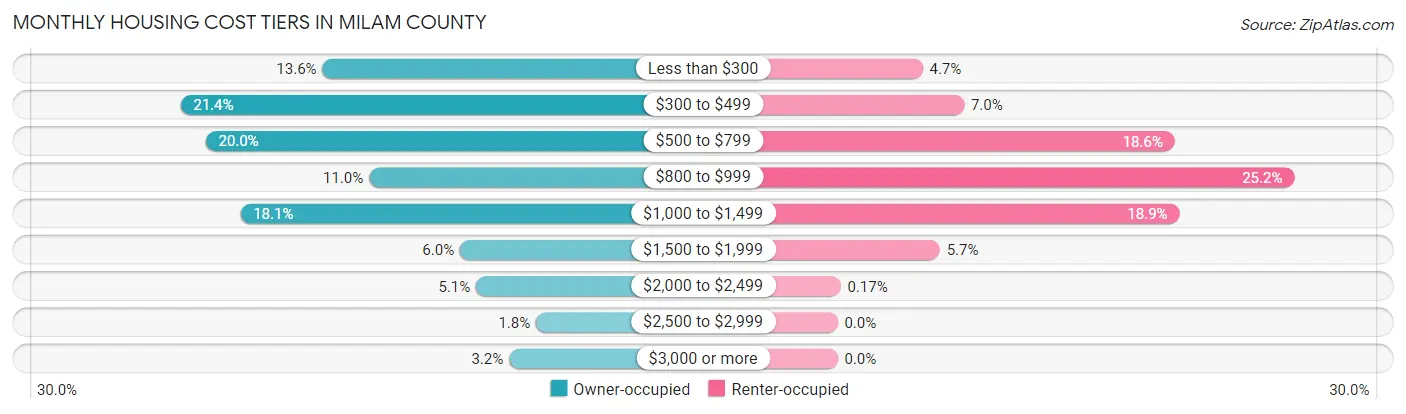
| Monthly Cost | Owner-occupied | Renter-occupied |
| Less than $300 | 1,009 (13.6%) | 109 (4.7%) |
| $300 to $499 | 1,594 (21.4%) | 162 (7.0%) |
| $500 to $799 | 1,490 (20.0%) | 432 (18.6%) |
| $800 to $999 | 817 (11.0%) | 585 (25.2%) |
| $1,000 to $1,499 | 1,347 (18.1%) | 438 (18.9%) |
| $1,500 to $1,999 | 443 (5.9%) | 131 (5.7%) |
| $2,000 to $2,499 | 377 (5.1%) | 4 (0.2%) |
| $2,500 to $2,999 | 130 (1.8%) | 0 (0.0%) |
| $3,000 or more | 241 (3.2%) | 0 (0.0%) |
| Total | 7,448 (100.0%) | 2,319 (100.0%) |
Physical Housing Characteristics in Milam County
Housing Structures in Milam County
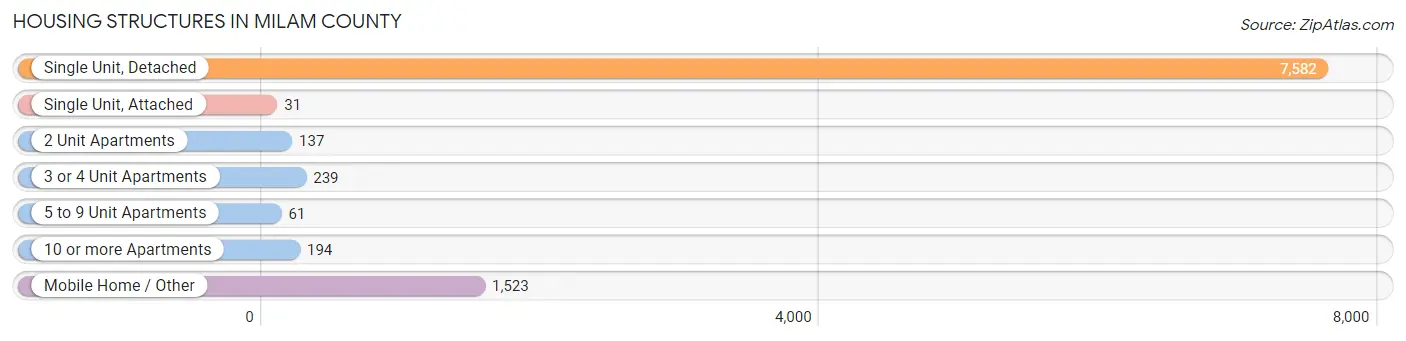
| Structure Type | # Housing Units | % Housing Units |
| Single Unit, Detached | 7,582 | 77.6% |
| Single Unit, Attached | 31 | 0.3% |
| 2 Unit Apartments | 137 | 1.4% |
| 3 or 4 Unit Apartments | 239 | 2.5% |
| 5 to 9 Unit Apartments | 61 | 0.6% |
| 10 or more Apartments | 194 | 2.0% |
| Mobile Home / Other | 1,523 | 15.6% |
| Total | 9,767 | 100.0% |
Housing Structures by Occupancy in Milam County
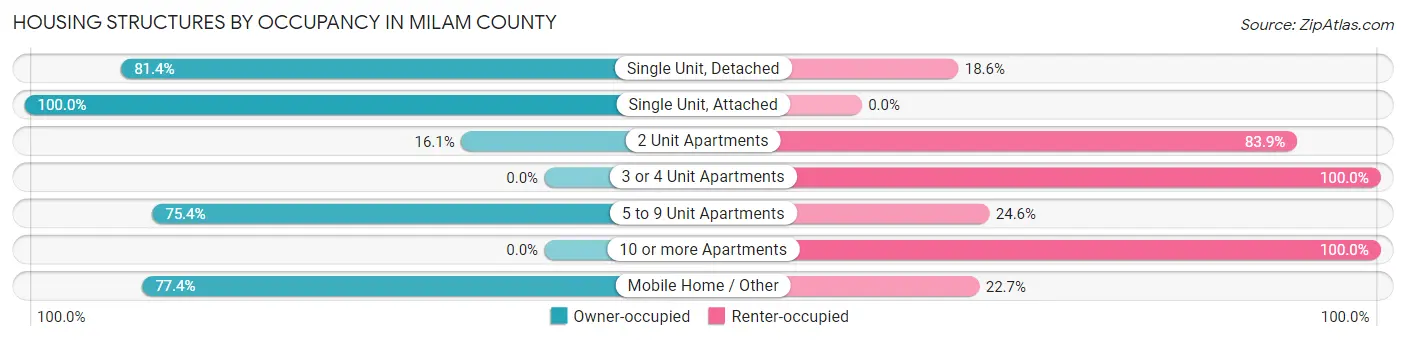
| Structure Type | Owner-occupied | Renter-occupied |
| Single Unit, Detached | 6,171 (81.4%) | 1,411 (18.6%) |
| Single Unit, Attached | 31 (100.0%) | 0 (0.0%) |
| 2 Unit Apartments | 22 (16.1%) | 115 (83.9%) |
| 3 or 4 Unit Apartments | 0 (0.0%) | 239 (100.0%) |
| 5 to 9 Unit Apartments | 46 (75.4%) | 15 (24.6%) |
| 10 or more Apartments | 0 (0.0%) | 194 (100.0%) |
| Mobile Home / Other | 1,178 (77.3%) | 345 (22.7%) |
| Total | 7,448 (76.3%) | 2,319 (23.7%) |
Housing Structures by Number of Rooms in Milam County
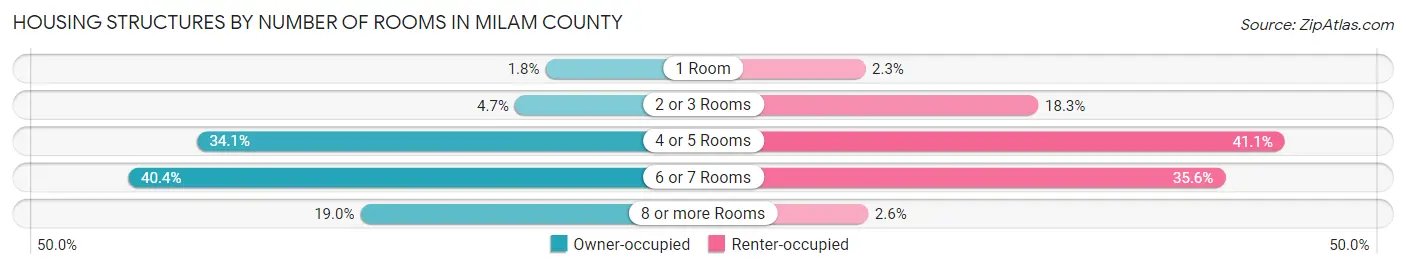
| Number of Rooms | Owner-occupied | Renter-occupied |
| 1 Room | 137 (1.8%) | 54 (2.3%) |
| 2 or 3 Rooms | 348 (4.7%) | 425 (18.3%) |
| 4 or 5 Rooms | 2,540 (34.1%) | 954 (41.1%) |
| 6 or 7 Rooms | 3,011 (40.4%) | 826 (35.6%) |
| 8 or more Rooms | 1,412 (19.0%) | 60 (2.6%) |
| Total | 7,448 (100.0%) | 2,319 (100.0%) |
Housing Structure by Heating Type in Milam County
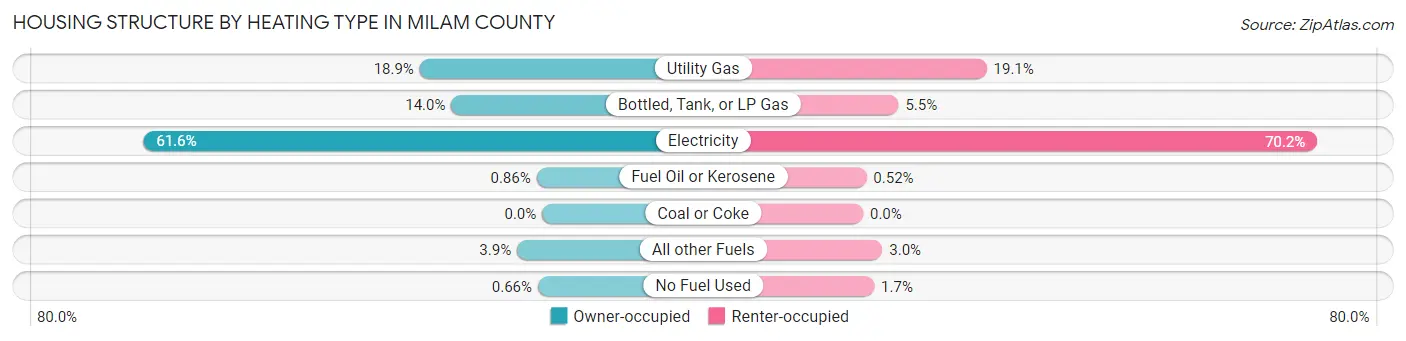
| Heating Type | Owner-occupied | Renter-occupied |
| Utility Gas | 1,409 (18.9%) | 443 (19.1%) |
| Bottled, Tank, or LP Gas | 1,046 (14.0%) | 127 (5.5%) |
| Electricity | 4,591 (61.6%) | 1,628 (70.2%) |
| Fuel Oil or Kerosene | 64 (0.9%) | 12 (0.5%) |
| Coal or Coke | 0 (0.0%) | 0 (0.0%) |
| All other Fuels | 289 (3.9%) | 69 (3.0%) |
| No Fuel Used | 49 (0.7%) | 40 (1.7%) |
| Total | 7,448 (100.0%) | 2,319 (100.0%) |
Household Vehicle Usage in Milam County
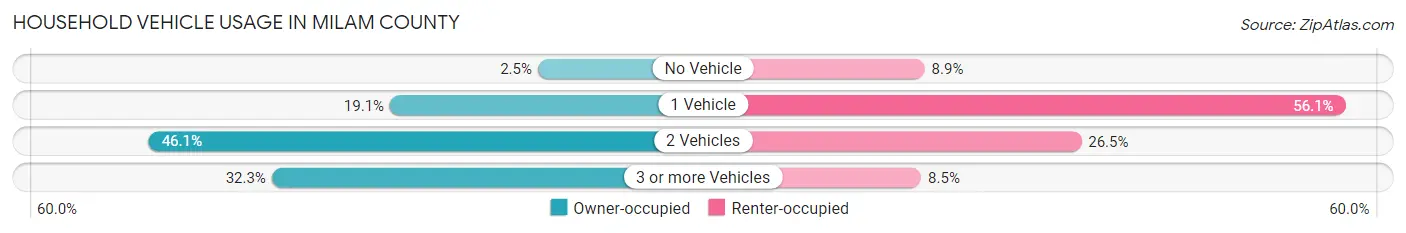
| Vehicles per Household | Owner-occupied | Renter-occupied |
| No Vehicle | 187 (2.5%) | 207 (8.9%) |
| 1 Vehicle | 1,421 (19.1%) | 1,300 (56.1%) |
| 2 Vehicles | 3,433 (46.1%) | 614 (26.5%) |
| 3 or more Vehicles | 2,407 (32.3%) | 198 (8.5%) |
| Total | 7,448 (100.0%) | 2,319 (100.0%) |
Real Estate & Mortgages in Milam County
Real Estate and Mortgage Overview in Milam County
| Characteristic | Without Mortgage | With Mortgage |
| Housing Units | 4,657 | 2,791 |
| Median Property Value | $119,600 | $199,300 |
| Median Household Income | $54,792 | $550 |
| Monthly Housing Costs | $467 | $241 |
| Real Estate Taxes | $1,317 | $69 |
Property Value by Mortgage Status in Milam County
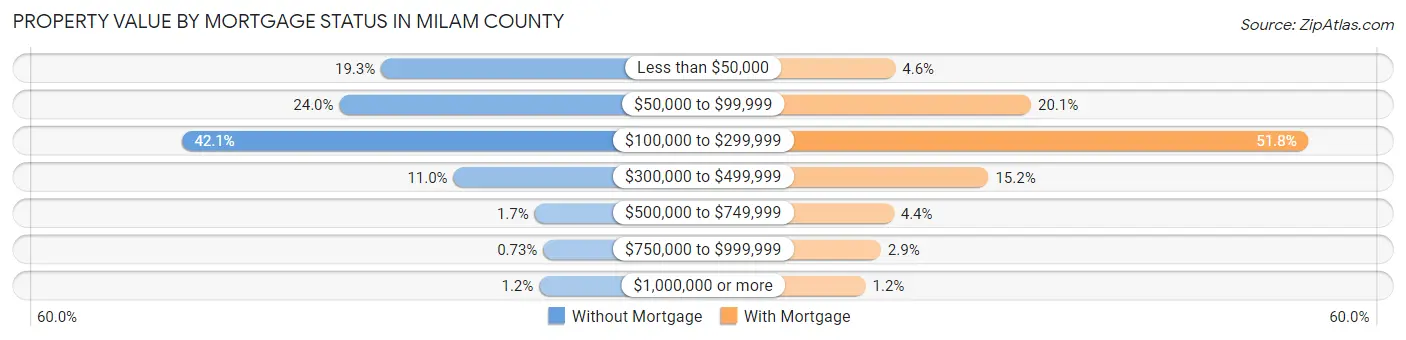
| Property Value | Without Mortgage | With Mortgage |
| Less than $50,000 | 897 (19.3%) | 127 (4.5%) |
| $50,000 to $99,999 | 1,119 (24.0%) | 560 (20.1%) |
| $100,000 to $299,999 | 1,959 (42.1%) | 1,445 (51.8%) |
| $300,000 to $499,999 | 512 (11.0%) | 424 (15.2%) |
| $500,000 to $749,999 | 80 (1.7%) | 122 (4.4%) |
| $750,000 to $999,999 | 34 (0.7%) | 81 (2.9%) |
| $1,000,000 or more | 56 (1.2%) | 32 (1.1%) |
| Total | 4,657 (100.0%) | 2,791 (100.0%) |
Household Income by Mortgage Status in Milam County
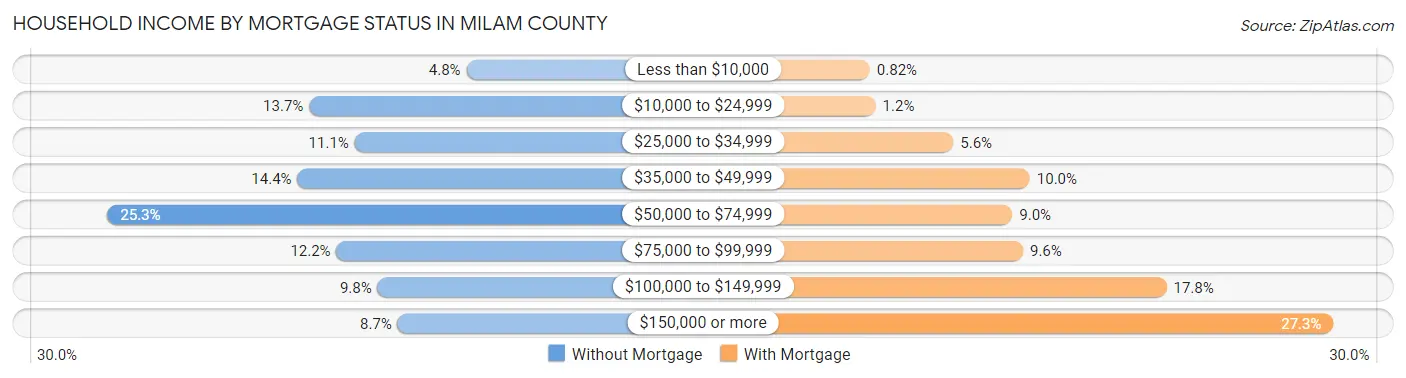
| Household Income | Without Mortgage | With Mortgage |
| Less than $10,000 | 221 (4.8%) | 23 (0.8%) |
| $10,000 to $24,999 | 640 (13.7%) | 32 (1.1%) |
| $25,000 to $34,999 | 519 (11.1%) | 156 (5.6%) |
| $35,000 to $49,999 | 671 (14.4%) | 278 (10.0%) |
| $50,000 to $74,999 | 1,177 (25.3%) | 250 (9.0%) |
| $75,000 to $99,999 | 567 (12.2%) | 267 (9.6%) |
| $100,000 to $149,999 | 458 (9.8%) | 496 (17.8%) |
| $150,000 or more | 404 (8.7%) | 762 (27.3%) |
| Total | 4,657 (100.0%) | 2,791 (100.0%) |
Property Value to Household Income Ratio in Milam County
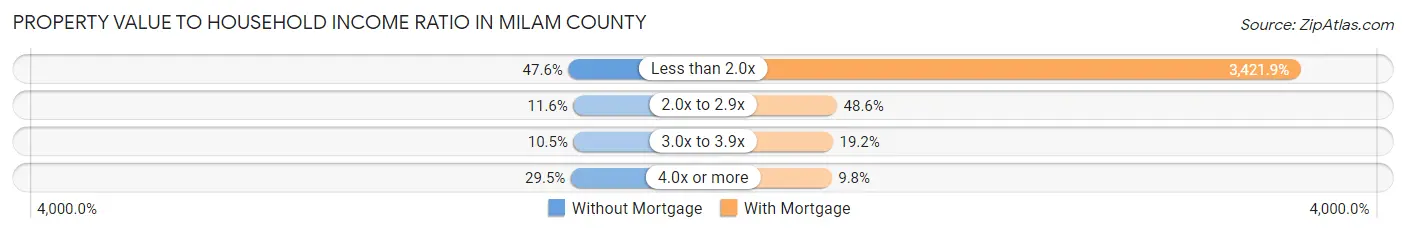
| Value-to-Income Ratio | Without Mortgage | With Mortgage |
| Less than 2.0x | 2,215 (47.6%) | 95,505 (3,421.9%) |
| 2.0x to 2.9x | 540 (11.6%) | 1,356 (48.6%) |
| 3.0x to 3.9x | 489 (10.5%) | 537 (19.2%) |
| 4.0x or more | 1,374 (29.5%) | 272 (9.8%) |
| Total | 4,657 (100.0%) | 2,791 (100.0%) |
Real Estate Taxes by Mortgage Status in Milam County
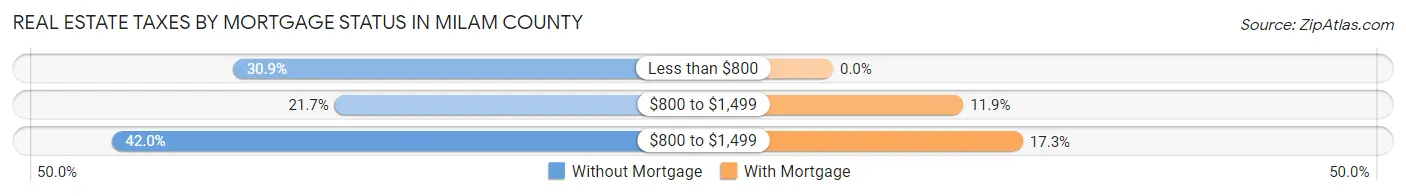
| Property Taxes | Without Mortgage | With Mortgage |
| Less than $800 | 1,439 (30.9%) | 0 (0.0%) |
| $800 to $1,499 | 1,010 (21.7%) | 332 (11.9%) |
| $800 to $1,499 | 1,955 (42.0%) | 484 (17.3%) |
| Total | 4,657 (100.0%) | 2,791 (100.0%) |
Health & Disability in Milam County
Health Insurance Coverage by Age in Milam County
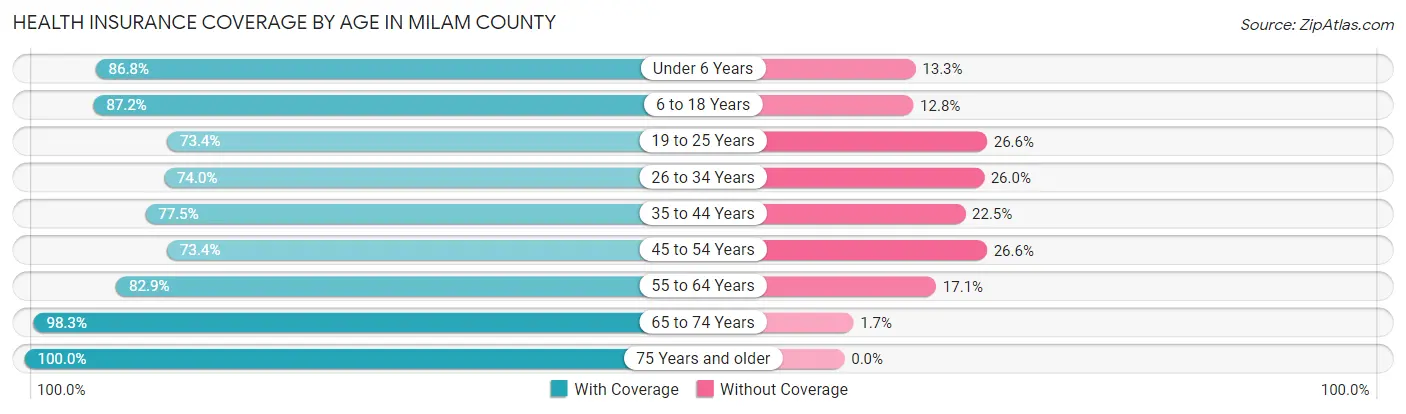
| Age Bracket | With Coverage | Without Coverage |
| Under 6 Years | 1,623 (86.8%) | 248 (13.3%) |
| 6 to 18 Years | 3,674 (87.2%) | 541 (12.8%) |
| 19 to 25 Years | 1,541 (73.4%) | 558 (26.6%) |
| 26 to 34 Years | 1,634 (74.0%) | 574 (26.0%) |
| 35 to 44 Years | 2,142 (77.5%) | 623 (22.5%) |
| 45 to 54 Years | 2,204 (73.4%) | 797 (26.6%) |
| 55 to 64 Years | 2,860 (82.9%) | 589 (17.1%) |
| 65 to 74 Years | 2,929 (98.3%) | 50 (1.7%) |
| 75 Years and older | 1,973 (100.0%) | 0 (0.0%) |
| Total | 20,580 (83.8%) | 3,980 (16.2%) |
Health Insurance Coverage by Citizenship Status in Milam County
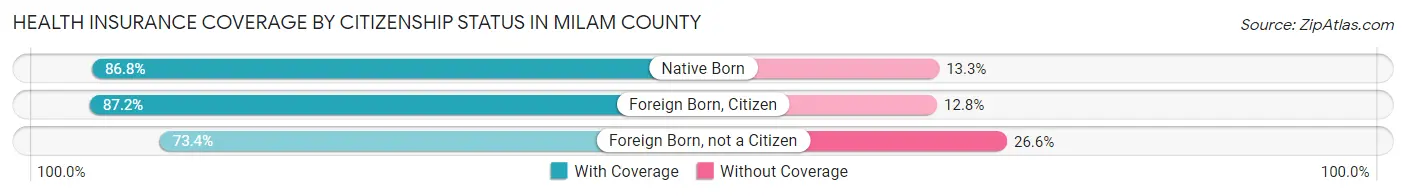
| Citizenship Status | With Coverage | Without Coverage |
| Native Born | 1,623 (86.8%) | 248 (13.3%) |
| Foreign Born, Citizen | 3,674 (87.2%) | 541 (12.8%) |
| Foreign Born, not a Citizen | 1,541 (73.4%) | 558 (26.6%) |
Health Insurance Coverage by Household Income in Milam County
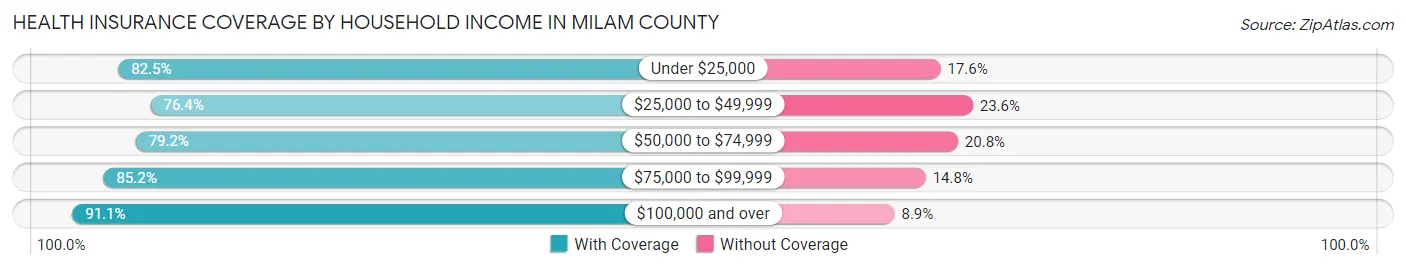
| Household Income | With Coverage | Without Coverage |
| Under $25,000 | 2,711 (82.5%) | 577 (17.5%) |
| $25,000 to $49,999 | 3,881 (76.4%) | 1,199 (23.6%) |
| $50,000 to $74,999 | 3,396 (79.2%) | 893 (20.8%) |
| $75,000 to $99,999 | 3,595 (85.2%) | 624 (14.8%) |
| $100,000 and over | 6,997 (91.1%) | 687 (8.9%) |
Public vs Private Health Insurance Coverage by Age in Milam County
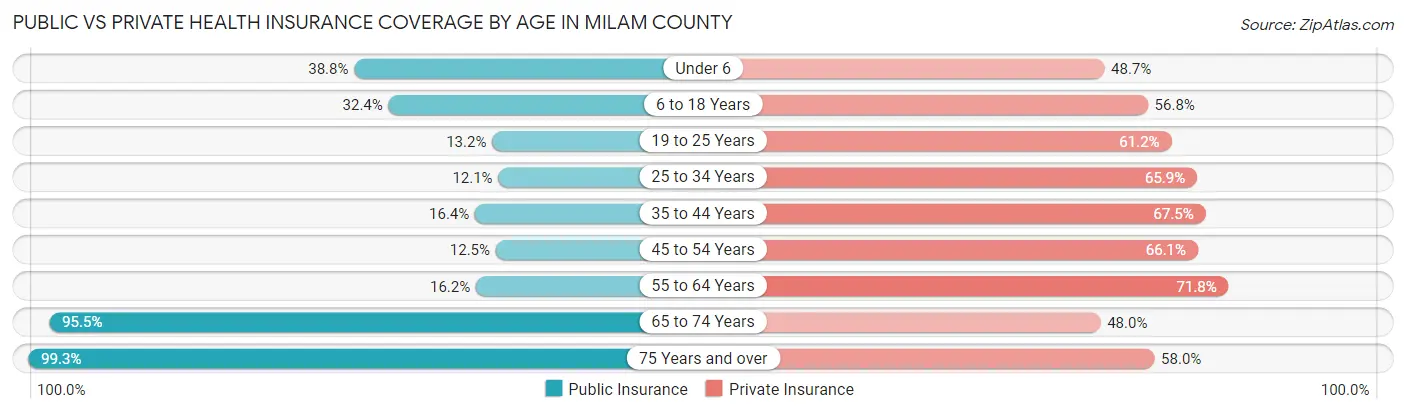
| Age Bracket | Public Insurance | Private Insurance |
| Under 6 | 726 (38.8%) | 911 (48.7%) |
| 6 to 18 Years | 1,367 (32.4%) | 2,393 (56.8%) |
| 19 to 25 Years | 277 (13.2%) | 1,284 (61.2%) |
| 25 to 34 Years | 266 (12.0%) | 1,456 (65.9%) |
| 35 to 44 Years | 453 (16.4%) | 1,867 (67.5%) |
| 45 to 54 Years | 376 (12.5%) | 1,983 (66.1%) |
| 55 to 64 Years | 559 (16.2%) | 2,476 (71.8%) |
| 65 to 74 Years | 2,844 (95.5%) | 1,429 (48.0%) |
| 75 Years and over | 1,960 (99.3%) | 1,144 (58.0%) |
| Total | 8,828 (35.9%) | 14,943 (60.8%) |
Disability Status by Sex by Age in Milam County
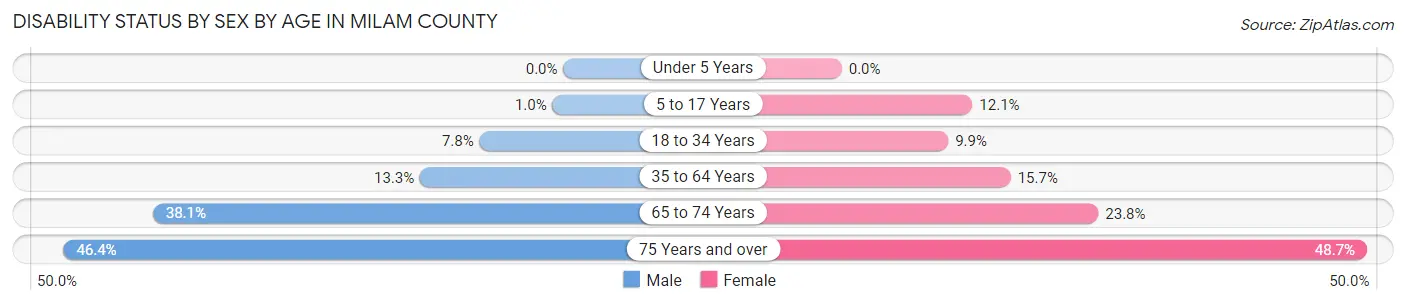
| Age Bracket | Male | Female |
| Under 5 Years | 0 (0.0%) | 0 (0.0%) |
| 5 to 17 Years | 22 (1.0%) | 268 (12.1%) |
| 18 to 34 Years | 183 (7.8%) | 220 (9.9%) |
| 35 to 64 Years | 610 (13.3%) | 726 (15.7%) |
| 65 to 74 Years | 567 (38.1%) | 355 (23.8%) |
| 75 Years and over | 405 (46.4%) | 536 (48.7%) |
Disability Class by Sex by Age in Milam County
Disability Class: Hearing Difficulty
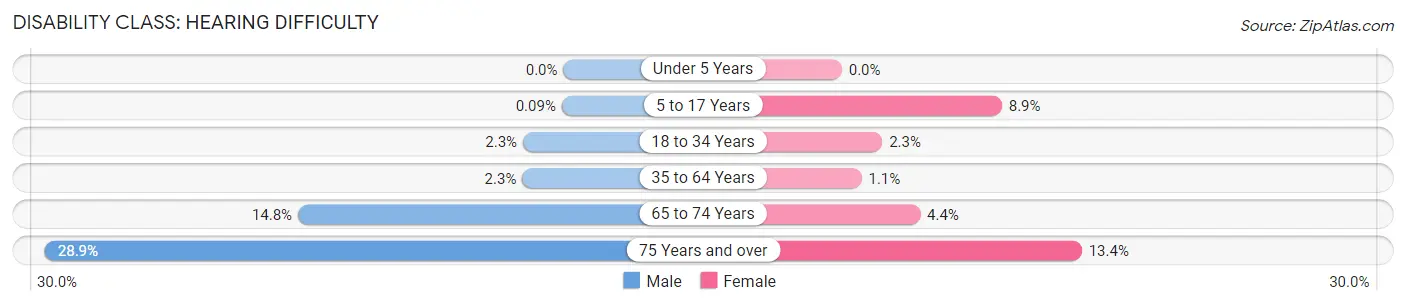
| Age Bracket | Male | Female |
| Under 5 Years | 0 (0.0%) | 0 (0.0%) |
| 5 to 17 Years | 2 (0.1%) | 197 (8.9%) |
| 18 to 34 Years | 53 (2.2%) | 50 (2.2%) |
| 35 to 64 Years | 105 (2.3%) | 51 (1.1%) |
| 65 to 74 Years | 220 (14.8%) | 65 (4.4%) |
| 75 Years and over | 252 (28.9%) | 147 (13.4%) |
Disability Class: Vision Difficulty
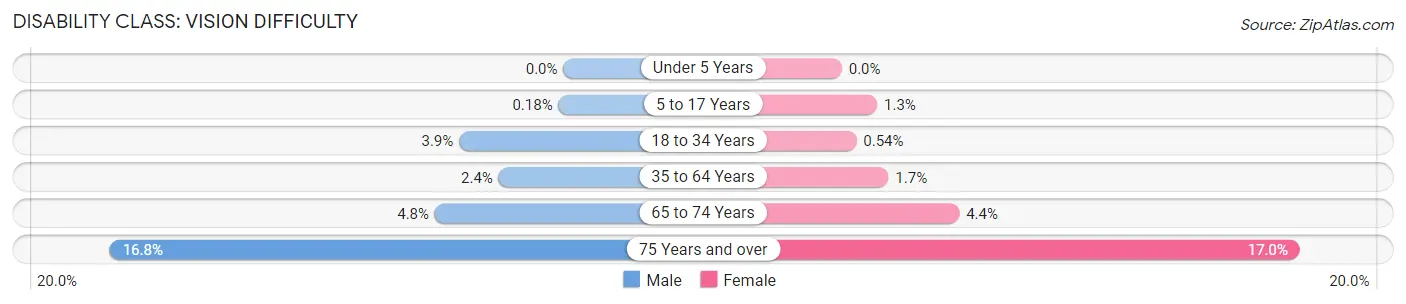
| Age Bracket | Male | Female |
| Under 5 Years | 0 (0.0%) | 0 (0.0%) |
| 5 to 17 Years | 4 (0.2%) | 29 (1.3%) |
| 18 to 34 Years | 91 (3.9%) | 12 (0.5%) |
| 35 to 64 Years | 110 (2.4%) | 80 (1.7%) |
| 65 to 74 Years | 71 (4.8%) | 65 (4.4%) |
| 75 Years and over | 147 (16.8%) | 187 (17.0%) |
Disability Class: Cognitive Difficulty
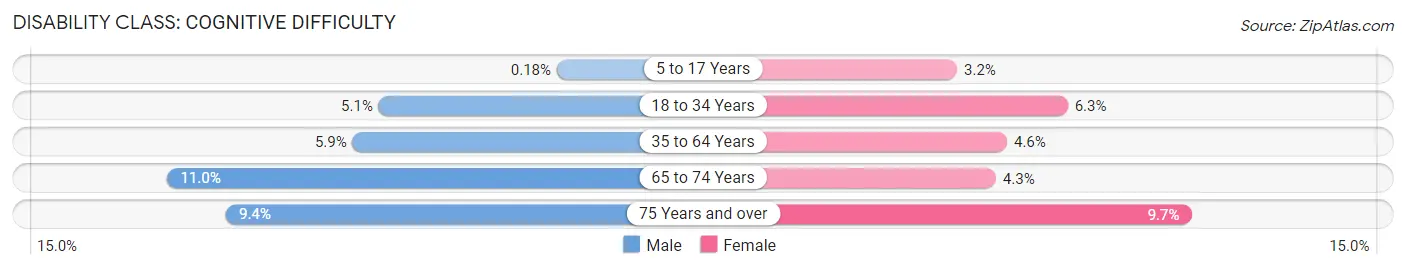
| Age Bracket | Male | Female |
| 5 to 17 Years | 4 (0.2%) | 71 (3.2%) |
| 18 to 34 Years | 121 (5.1%) | 140 (6.3%) |
| 35 to 64 Years | 269 (5.9%) | 213 (4.6%) |
| 65 to 74 Years | 164 (11.0%) | 64 (4.3%) |
| 75 Years and over | 82 (9.4%) | 107 (9.7%) |
Disability Class: Ambulatory Difficulty
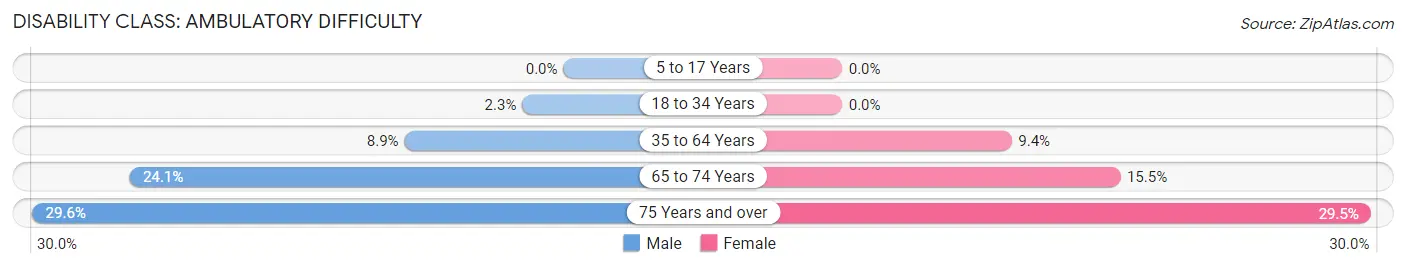
| Age Bracket | Male | Female |
| 5 to 17 Years | 0 (0.0%) | 0 (0.0%) |
| 18 to 34 Years | 54 (2.3%) | 0 (0.0%) |
| 35 to 64 Years | 406 (8.8%) | 437 (9.4%) |
| 65 to 74 Years | 359 (24.1%) | 231 (15.5%) |
| 75 Years and over | 258 (29.5%) | 324 (29.4%) |
Disability Class: Self-Care Difficulty
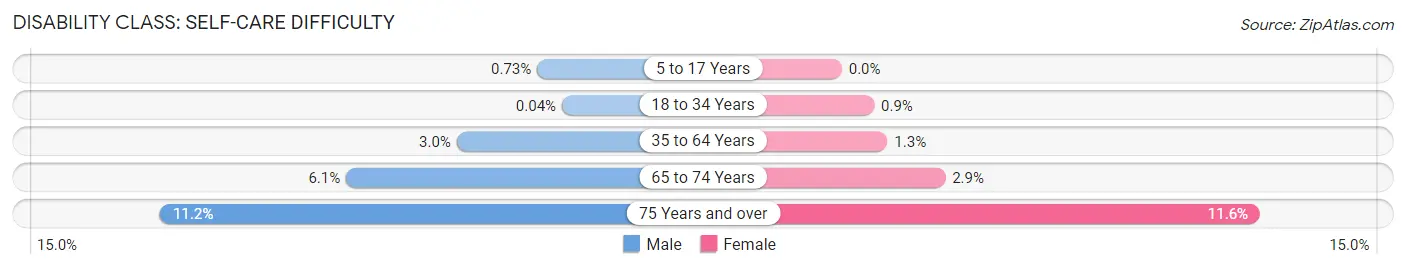
| Age Bracket | Male | Female |
| 5 to 17 Years | 16 (0.7%) | 0 (0.0%) |
| 18 to 34 Years | 1 (0.0%) | 20 (0.9%) |
| 35 to 64 Years | 136 (3.0%) | 59 (1.3%) |
| 65 to 74 Years | 90 (6.0%) | 43 (2.9%) |
| 75 Years and over | 98 (11.2%) | 128 (11.6%) |
Technology Access in Milam County
Computing Device Access in Milam County
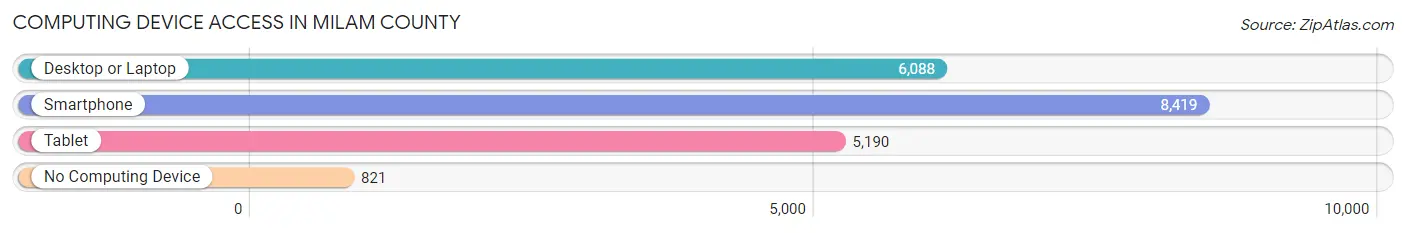
| Device Type | # Households | % Households |
| Desktop or Laptop | 6,088 | 62.3% |
| Smartphone | 8,419 | 86.2% |
| Tablet | 5,190 | 53.1% |
| No Computing Device | 821 | 8.4% |
| Total | 9,767 | 100.0% |
Internet Access in Milam County
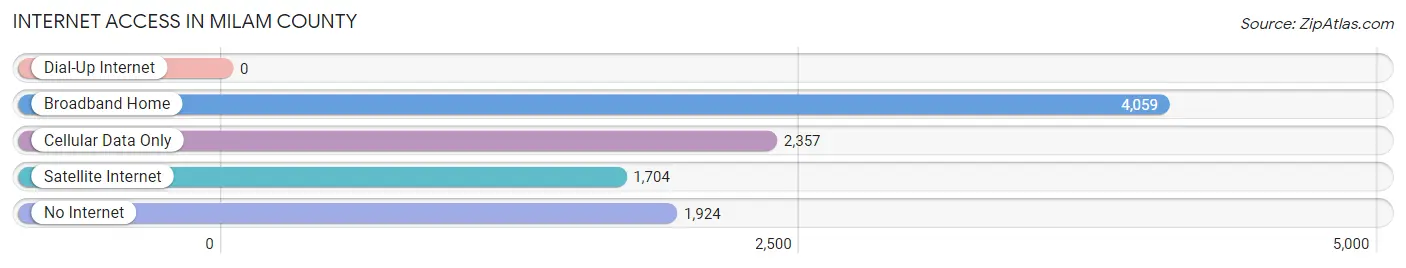
| Internet Type | # Households | % Households |
| Dial-Up Internet | 0 | 0.0% |
| Broadband Home | 4,059 | 41.6% |
| Cellular Data Only | 2,357 | 24.1% |
| Satellite Internet | 1,704 | 17.4% |
| No Internet | 1,924 | 19.7% |
| Total | 9,767 | 100.0% |
Milam County Summary
Milam County is located in the Central Texas region of the state of Texas. It is bordered by Bell County to the north, Robertson County to the east, Burleson County to the south, and Lee and Williamson counties to the west. The county seat is Cameron, and the largest city is Rockdale. The county was named for Benjamin Rush Milam, an early settler and soldier in the Texas Revolution.
Geography
Milam County covers an area of 1,022 square miles, making it the 48th largest county in Texas. The terrain is mostly flat, with some rolling hills in the western part of the county. The county is drained by the Little River, which flows through the center of the county. The county is also home to several small lakes, including Lake Limestone, Lake Granger, and Lake Somerville.
The climate of Milam County is generally hot and humid in the summer, and mild to cool in the winter. The average annual temperature is around 68°F, and the average annual precipitation is around 37 inches.
Demographics
As of the 2010 census, Milam County had a population of 24,757. The racial makeup of the county was 79.2% White, 14.3% Hispanic or Latino, 8.2% African American, 0.7% Native American, 0.4% Asian, and 2.2% from other races. The median household income was $41,945, and the median family income was $50,945.
Economy
The economy of Milam County is largely based on agriculture and manufacturing. The county is home to several large farms, which produce cotton, corn, wheat, and other crops. The county is also home to several manufacturing plants, which produce a variety of products, including furniture, clothing, and electronics.
The county is also home to several oil and gas fields, which provide jobs for many of the county's residents. The county is also home to several retail stores, restaurants, and other businesses.
Education
Milam County is served by the Milam County Independent School District, which operates several elementary, middle, and high schools. The county is also home to several private schools, including the Milam County Christian Academy and the Milam County Academy. The county is also home to several higher education institutions, including the University of Mary Hardin-Baylor, Texas A&M University-Central Texas, and Central Texas College.
Conclusion
Milam County is a rural county located in the Central Texas region of the state of Texas. The county is home to several large farms, manufacturing plants, and oil and gas fields, which provide jobs for many of the county's residents. The county is also home to several schools, both public and private, as well as several higher education institutions. Milam County is a great place to live, work, and raise a family.
Common Questions
What is Per Capita Income in Milam County?
Per Capita income in Milam County is $31,984.
What is the Median Family Income in Milam County?
Median Family Income in Milam County is $72,069.
What is the Median Household income in Milam County?
Median Household Income in Milam County is $56,985.
What is Income or Wage Gap in Milam County?
Income or Wage Gap in Milam County is 27.8%.
Women in Milam County earn 72.2 cents for every dollar earned by a man.
What is Family Income Deficit in Milam County?
Family Income Deficit in Milam County is $10,969.
Families that are below poverty line in Milam County earn $10,969 less on average than the poverty threshold level.
What is Inequality or Gini Index in Milam County?
Inequality or Gini Index in Milam County is 0.47.
What is the Total Population of Milam County?
Total Population of Milam County is 25,080.
What is the Total Male Population of Milam County?
Total Male Population of Milam County is 12,359.
What is the Total Female Population of Milam County?
Total Female Population of Milam County is 12,721.
What is the Ratio of Males per 100 Females in Milam County?
There are 97.15 Males per 100 Females in Milam County.
What is the Ratio of Females per 100 Males in Milam County?
There are 102.93 Females per 100 Males in Milam County.
What is the Median Population Age in Milam County?
Median Population Age in Milam County is 41.5 Years.
What is the Average Family Size in Milam County
Average Family Size in Milam County is 3.2 People.
What is the Average Household Size in Milam County
Average Household Size in Milam County is 2.5 People.
How Large is the Labor Force in Milam County?
There are 11,607 People in the Labor Forcein in Milam County.
What is the Percentage of People in the Labor Force in Milam County?
58.2% of People are in the Labor Force in Milam County.
What is the Unemployment Rate in Milam County?
Unemployment Rate in Milam County is 5.8%.