Menard County, TX Map & Demographics
Menard County Map
Menard County Overview
$31,983
PER CAPITA INCOME
$80,588
AVG FAMILY INCOME
$40,945
AVG HOUSEHOLD INCOME
40.0%
WAGE / INCOME GAP [ % ]
60.0¢/ $1
WAGE / INCOME GAP [ $ ]
0.52
INEQUALITY / GINI INDEX
1,964
TOTAL POPULATION
986
MALE POPULATION
978
FEMALE POPULATION
100.82
MALES / 100 FEMALES
99.19
FEMALES / 100 MALES
59.4
MEDIAN AGE
3.2
AVG FAMILY SIZE
2.1
AVG HOUSEHOLD SIZE
861
LABOR FORCE [ PEOPLE ]
52.3%
PERCENT IN LABOR FORCE
14.3%
UNEMPLOYMENT RATE
Menard County Area Codes
Income in Menard County
Income Overview in Menard County
Per Capita Income in Menard County is $31,983, while median incomes of families and households are $80,588 and $40,945 respectively.
| Characteristic | Number | Measure |
| Per Capita Income | 1,964 | $31,983 |
| Median Family Income | 420 | $80,588 |
| Mean Family Income | 420 | $103,208 |
| Median Household Income | 905 | $40,945 |
| Mean Household Income | 905 | $63,484 |
| Income Deficit | 420 | $0 |
| Wage / Income Gap (%) | 1,964 | 40.01% |
| Wage / Income Gap ($) | 1,964 | 59.99¢ per $1 |
| Gini / Inequality Index | 1,964 | 0.52 |
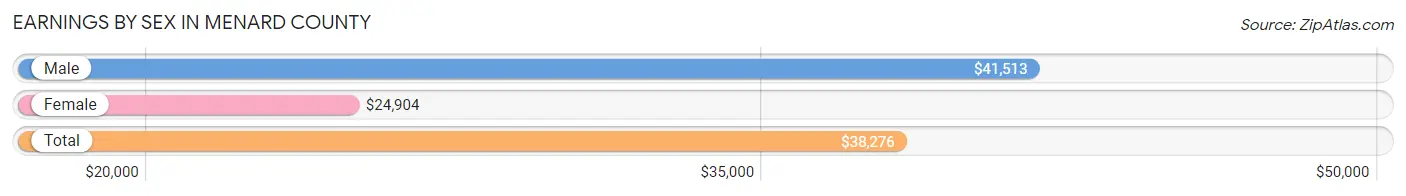
Earnings by Sex in Menard County
Average Earnings in Menard County are $38,276, $41,513 for men and $24,904 for women, a difference of 40.0%.
| Sex | Number | Average Earnings |
| Male | 464 (57.3%) | $41,513 |
| Female | 346 (42.7%) | $24,904 |
| Total | 810 (100.0%) | $38,276 |
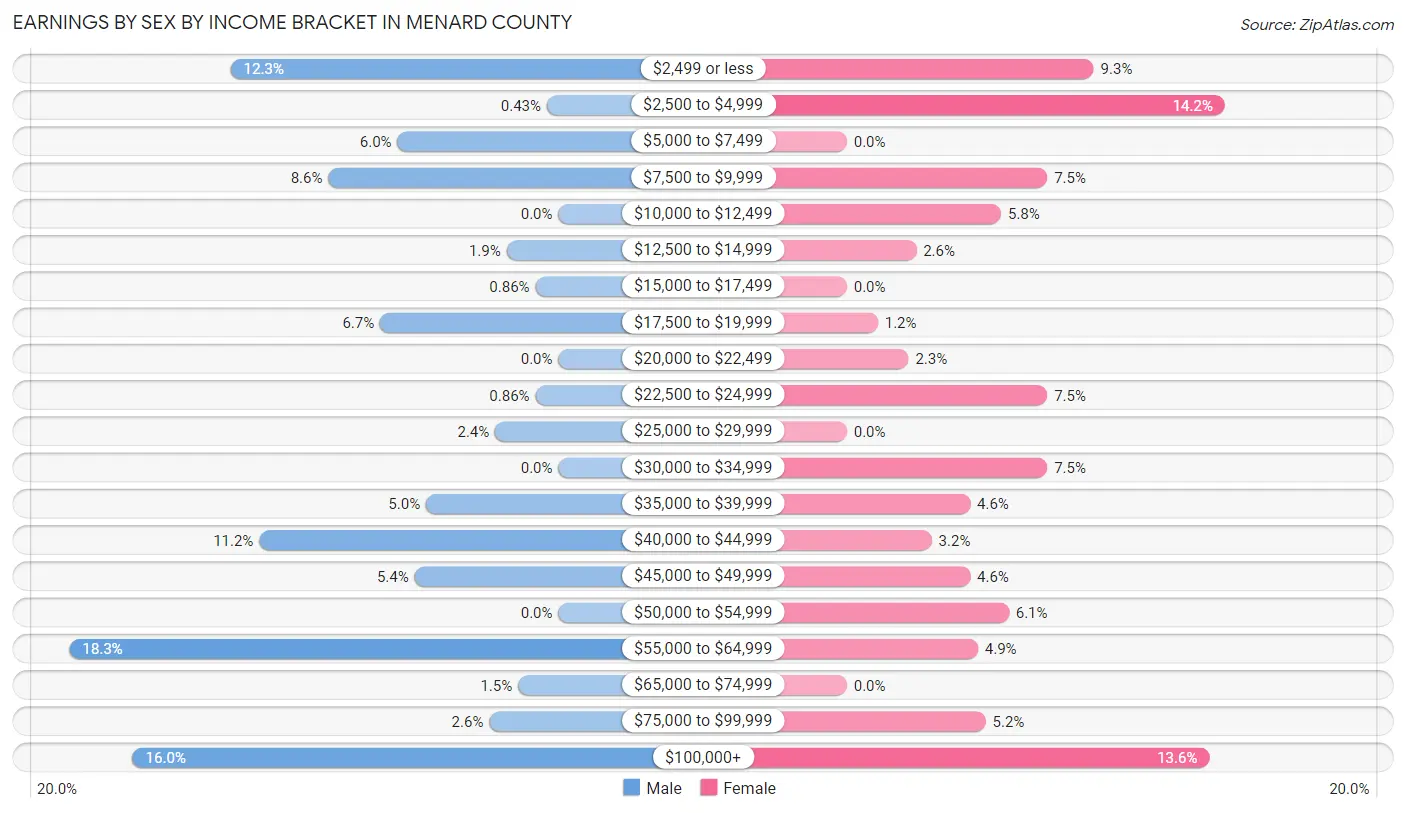
Earnings by Sex by Income Bracket in Menard County
The most common earnings brackets in Menard County are $55,000 to $64,999 for men (85 | 18.3%) and $2,500 to $4,999 for women (49 | 14.2%).
| Income | Male | Female |
| $2,499 or less | 57 (12.3%) | 32 (9.2%) |
| $2,500 to $4,999 | 2 (0.4%) | 49 (14.2%) |
| $5,000 to $7,499 | 28 (6.0%) | 0 (0.0%) |
| $7,500 to $9,999 | 40 (8.6%) | 26 (7.5%) |
| $10,000 to $12,499 | 0 (0.0%) | 20 (5.8%) |
| $12,500 to $14,999 | 9 (1.9%) | 9 (2.6%) |
| $15,000 to $17,499 | 4 (0.9%) | 0 (0.0%) |
| $17,500 to $19,999 | 31 (6.7%) | 4 (1.2%) |
| $20,000 to $22,499 | 0 (0.0%) | 8 (2.3%) |
| $22,500 to $24,999 | 4 (0.9%) | 26 (7.5%) |
| $25,000 to $29,999 | 11 (2.4%) | 0 (0.0%) |
| $30,000 to $34,999 | 0 (0.0%) | 26 (7.5%) |
| $35,000 to $39,999 | 23 (5.0%) | 16 (4.6%) |
| $40,000 to $44,999 | 52 (11.2%) | 11 (3.2%) |
| $45,000 to $49,999 | 25 (5.4%) | 16 (4.6%) |
| $50,000 to $54,999 | 0 (0.0%) | 21 (6.1%) |
| $55,000 to $64,999 | 85 (18.3%) | 17 (4.9%) |
| $65,000 to $74,999 | 7 (1.5%) | 0 (0.0%) |
| $75,000 to $99,999 | 12 (2.6%) | 18 (5.2%) |
| $100,000+ | 74 (16.0%) | 47 (13.6%) |
| Total | 464 (100.0%) | 346 (100.0%) |
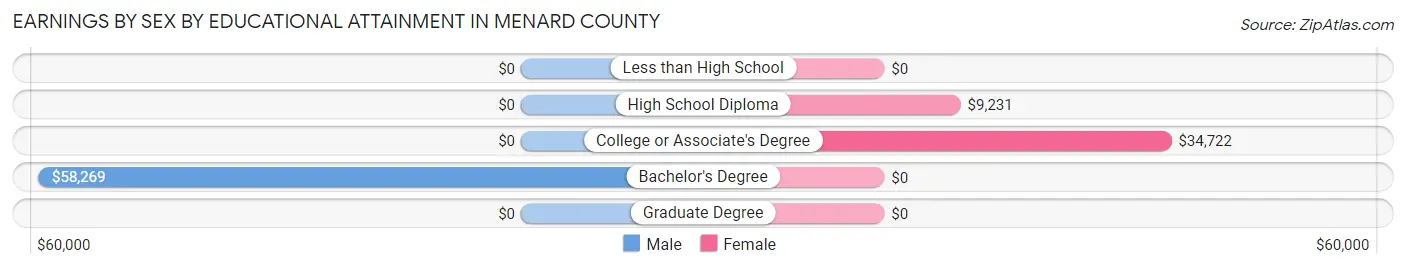
Earnings by Sex by Educational Attainment in Menard County
Average earnings in Menard County are $41,941 for men and $37,578 for women, a difference of 10.4%. Men with an educational attainment of bachelor's degree enjoy the highest average annual earnings of $58,269, while those with bachelor's degree education earn the least with $58,269. Women with an educational attainment of college or associate's degree earn the most with the average annual earnings of $34,722, while those with high school diploma education have the smallest earnings of $9,231.
| Educational Attainment | Male Income | Female Income |
| Less than High School | - | - |
| High School Diploma | - | - |
| College or Associate's Degree | - | - |
| Bachelor's Degree | $58,269 | $0 |
| Graduate Degree | - | - |
| Total | $41,941 | $37,578 |
Family Income in Menard County
Family Income Brackets in Menard County
According to the Menard County family income data, there are 89 families falling into the $75,000 to $99,999 income range, which is the most common income bracket and makes up 21.2% of all families.
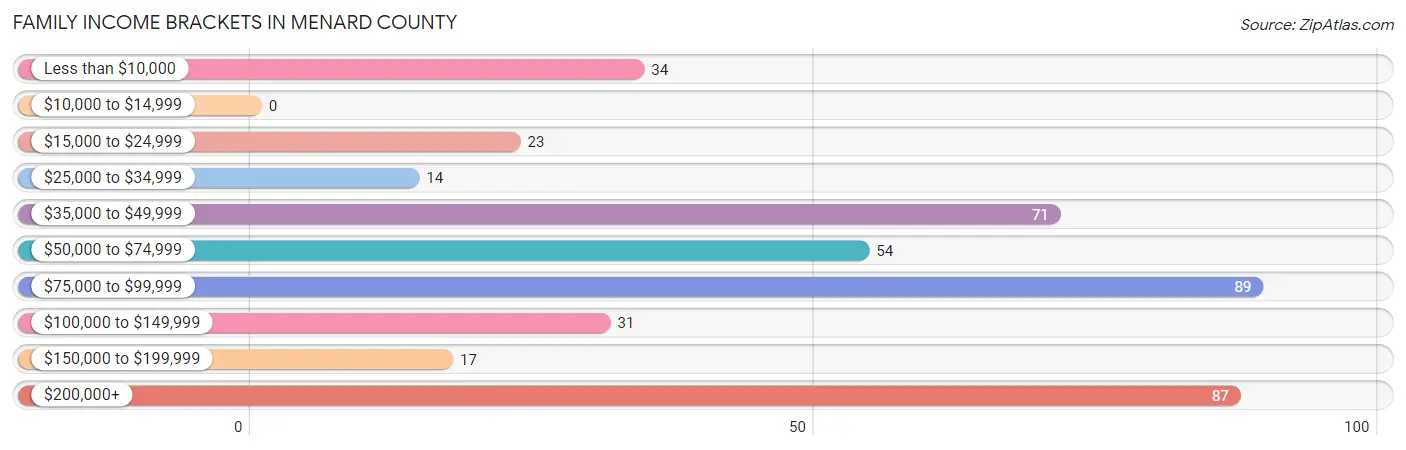
| Income Bracket | # Families | % Families |
| Less than $10,000 | 34 | 8.1% |
| $10,000 to $14,999 | 0 | 0.0% |
| $15,000 to $24,999 | 23 | 5.5% |
| $25,000 to $34,999 | 14 | 3.3% |
| $35,000 to $49,999 | 71 | 16.9% |
| $50,000 to $74,999 | 54 | 12.9% |
| $75,000 to $99,999 | 89 | 21.2% |
| $100,000 to $149,999 | 31 | 7.4% |
| $150,000 to $199,999 | 17 | 4.0% |
| $200,000+ | 87 | 20.7% |
Family Income by Famaliy Size in Menard County
6-person families (43 | 10.2%) account for the highest median family income in Menard County with $118,750 per family, while 2-person families (299 | 71.2%) have the highest median income of $39,188 per family member.
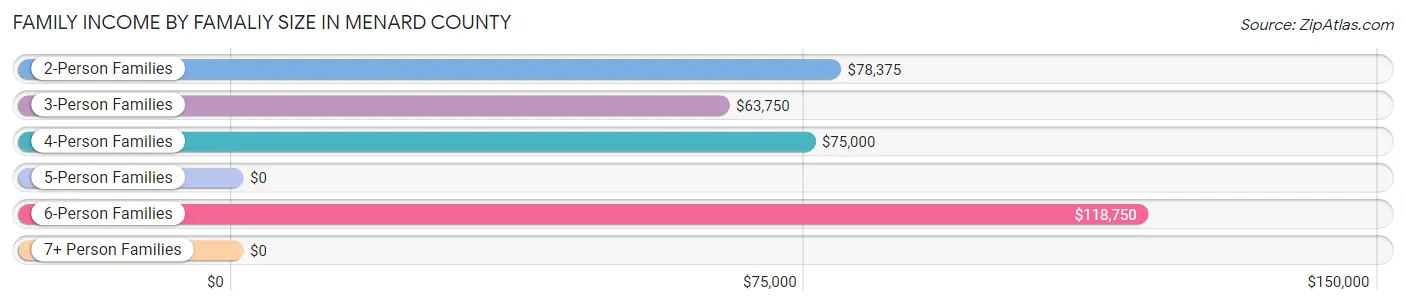
| Income Bracket | # Families | Median Income |
| 2-Person Families | 299 (71.2%) | $78,375 |
| 3-Person Families | 56 (13.3%) | $63,750 |
| 4-Person Families | 22 (5.2%) | $75,000 |
| 5-Person Families | 0 (0.0%) | $0 |
| 6-Person Families | 43 (10.2%) | $118,750 |
| 7+ Person Families | 0 (0.0%) | $0 |
| Total | 420 (100.0%) | $80,588 |
Family Income by Number of Earners in Menard County
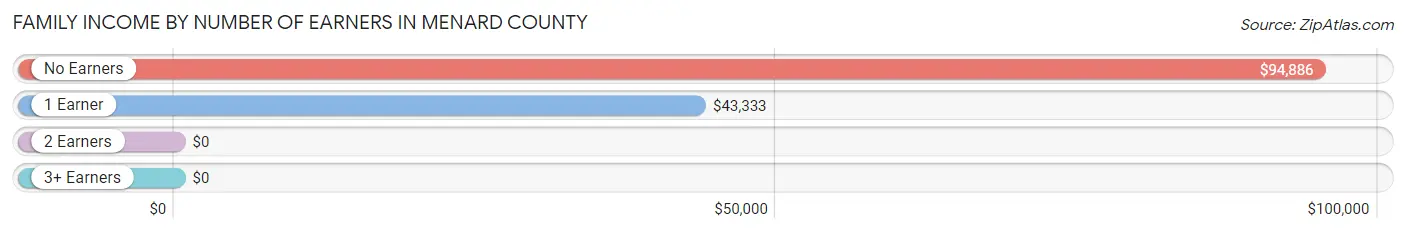
| Number of Earners | # Families | Median Income |
| No Earners | 85 (20.2%) | $94,886 |
| 1 Earner | 182 (43.3%) | $43,333 |
| 2 Earners | 137 (32.6%) | $0 |
| 3+ Earners | 16 (3.8%) | $0 |
| Total | 420 (100.0%) | $80,588 |
Household Income in Menard County
Household Income Brackets in Menard County
With 158 households falling in the category, the $35,000 to $49,999 income range is the most frequent in Menard County, accounting for 17.5% of all households. In contrast, only 17 households (1.9%) fall into the $150,000 to $199,999 income bracket, making it the least populous group.
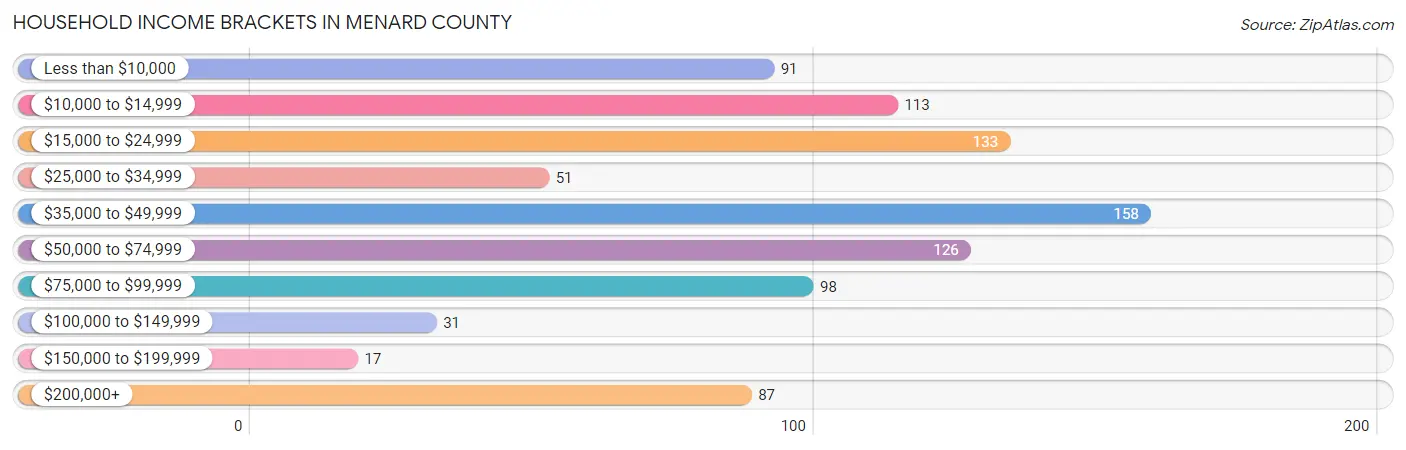
| Income Bracket | # Households | % Households |
| Less than $10,000 | 91 | 10.1% |
| $10,000 to $14,999 | 113 | 12.5% |
| $15,000 to $24,999 | 133 | 14.7% |
| $25,000 to $34,999 | 51 | 5.6% |
| $35,000 to $49,999 | 158 | 17.5% |
| $50,000 to $74,999 | 126 | 13.9% |
| $75,000 to $99,999 | 98 | 10.8% |
| $100,000 to $149,999 | 31 | 3.4% |
| $150,000 to $199,999 | 17 | 1.9% |
| $200,000+ | 87 | 9.6% |
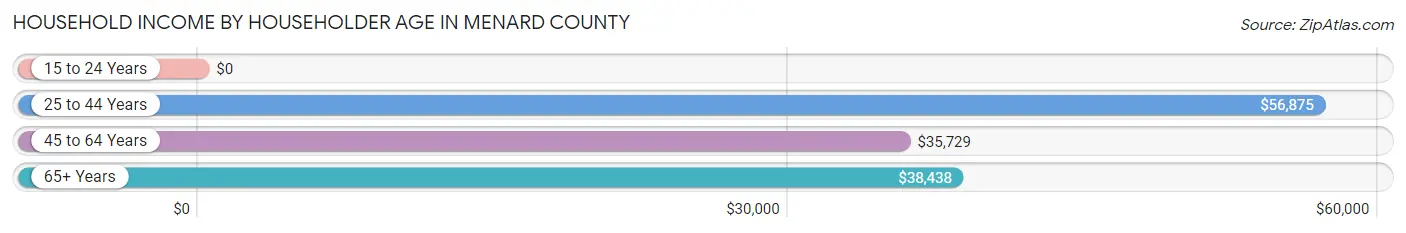
Household Income by Householder Age in Menard County
The median household income in Menard County is $40,945, with the highest median household income of $56,875 found in the 25 to 44 years age bracket for the primary householder. A total of 152 households (16.8%) fall into this category. Meanwhile, the 15 to 24 years age bracket for the primary householder has the lowest median household income of $0, with 18 households (2.0%) in this group.
| Income Bracket | # Households | Median Income |
| 15 to 24 Years | 18 (2.0%) | $0 |
| 25 to 44 Years | 152 (16.8%) | $56,875 |
| 45 to 64 Years | 277 (30.6%) | $35,729 |
| 65+ Years | 458 (50.6%) | $38,438 |
| Total | 905 (100.0%) | $40,945 |
Poverty in Menard County
Income Below Poverty by Sex and Age in Menard County
With 12.9% poverty level for males and 32.1% for females among the residents of Menard County, 18 to 24 year old males and 55 to 64 year old females are the most vulnerable to poverty, with 9 males (100.0%) and 135 females (60.3%) in their respective age groups living below the poverty level.
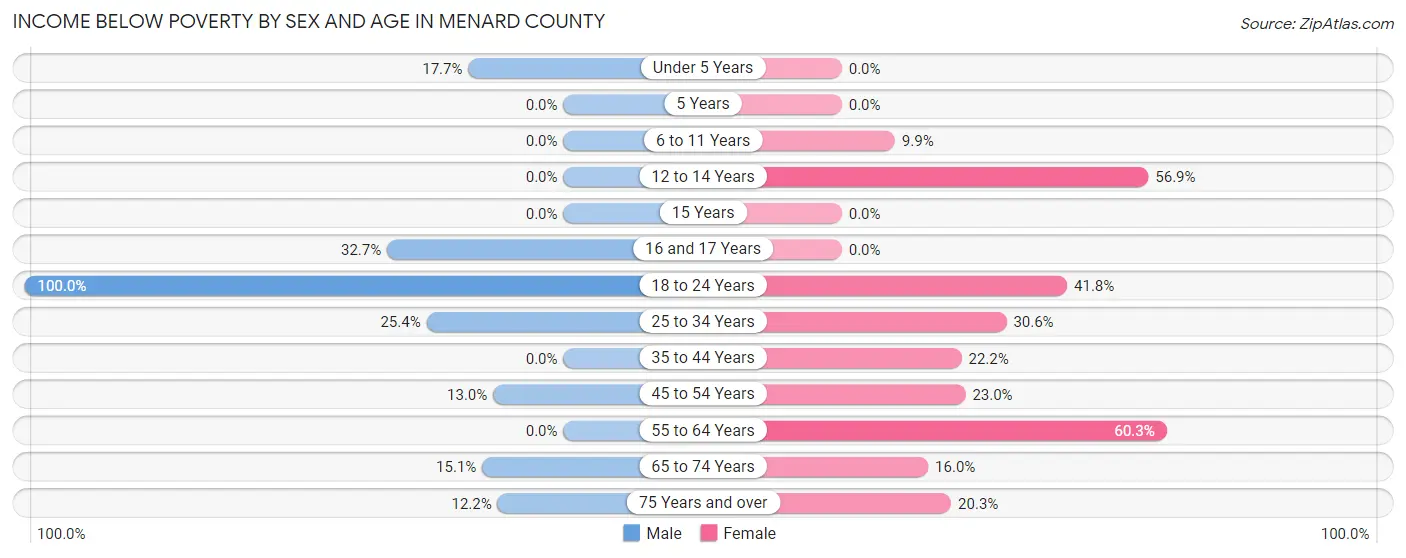
| Age Bracket | Male | Female |
| Under 5 Years | 12 (17.6%) | 0 (0.0%) |
| 5 Years | 0 (0.0%) | 0 (0.0%) |
| 6 to 11 Years | 0 (0.0%) | 7 (9.9%) |
| 12 to 14 Years | 0 (0.0%) | 33 (56.9%) |
| 15 Years | 0 (0.0%) | 0 (0.0%) |
| 16 and 17 Years | 18 (32.7%) | 0 (0.0%) |
| 18 to 24 Years | 9 (100.0%) | 23 (41.8%) |
| 25 to 34 Years | 32 (25.4%) | 11 (30.6%) |
| 35 to 44 Years | 0 (0.0%) | 8 (22.2%) |
| 45 to 54 Years | 9 (13.0%) | 28 (23.0%) |
| 55 to 64 Years | 0 (0.0%) | 135 (60.3%) |
| 65 to 74 Years | 22 (15.1%) | 21 (16.0%) |
| 75 Years and over | 22 (12.2%) | 41 (20.3%) |
| Total | 124 (12.9%) | 307 (32.1%) |
Income Above Poverty by Sex and Age in Menard County
According to the poverty statistics in Menard County, males aged 5 years and females aged under 5 years are the age groups that are most secure financially, with 100.0% of males and 100.0% of females in these age groups living above the poverty line.
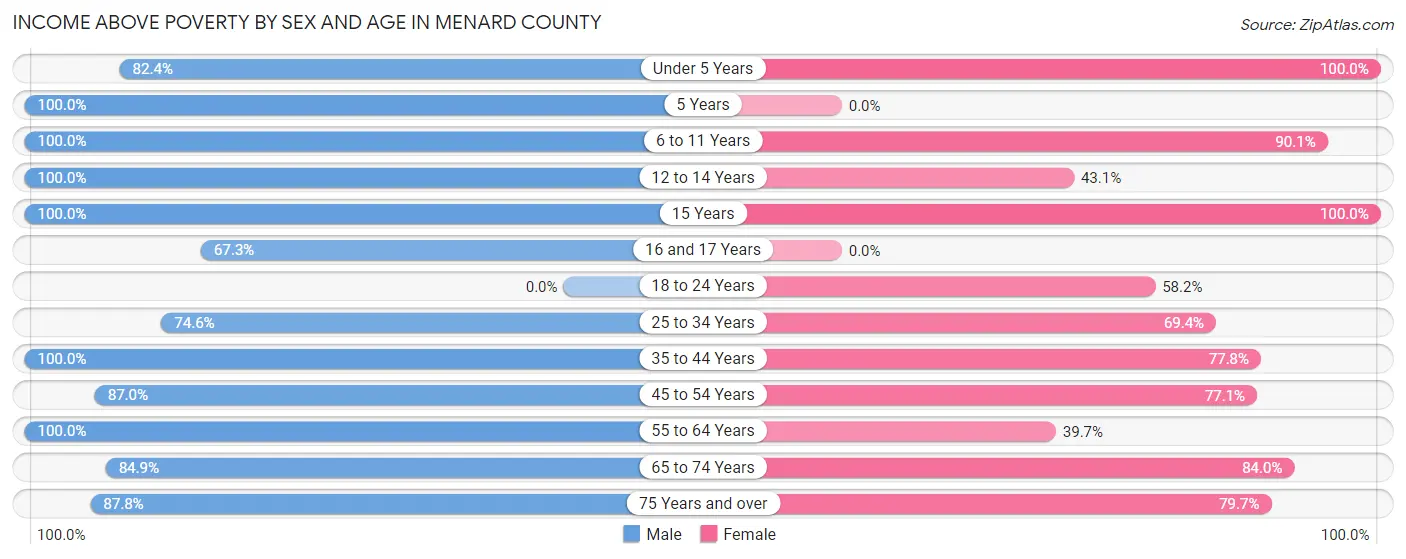
| Age Bracket | Male | Female |
| Under 5 Years | 56 (82.4%) | 8 (100.0%) |
| 5 Years | 13 (100.0%) | 0 (0.0%) |
| 6 to 11 Years | 39 (100.0%) | 64 (90.1%) |
| 12 to 14 Years | 18 (100.0%) | 25 (43.1%) |
| 15 Years | 30 (100.0%) | 13 (100.0%) |
| 16 and 17 Years | 37 (67.3%) | 0 (0.0%) |
| 18 to 24 Years | 0 (0.0%) | 32 (58.2%) |
| 25 to 34 Years | 94 (74.6%) | 25 (69.4%) |
| 35 to 44 Years | 72 (100.0%) | 28 (77.8%) |
| 45 to 54 Years | 60 (87.0%) | 94 (77.0%) |
| 55 to 64 Years | 136 (100.0%) | 89 (39.7%) |
| 65 to 74 Years | 124 (84.9%) | 110 (84.0%) |
| 75 Years and over | 158 (87.8%) | 161 (79.7%) |
| Total | 837 (87.1%) | 649 (67.9%) |
Income Below Poverty Among Married-Couple Families in Menard County
The poverty statistics for married-couple families in Menard County show that 2.2% or 7 of the total 323 families live below the poverty line. Families with no children have the highest poverty rate of 2.7%, comprising of 7 families. On the other hand, families with 1 or 2 children have the lowest poverty rate of 0.0%, which includes 0 families.
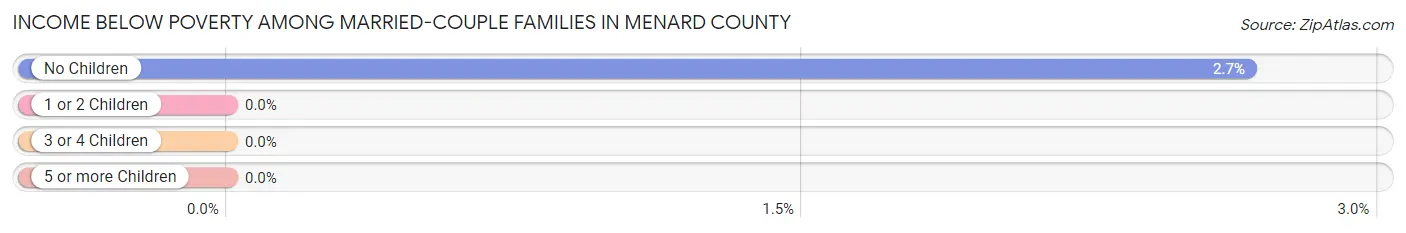
| Children | Above Poverty | Below Poverty |
| No Children | 256 (97.3%) | 7 (2.7%) |
| 1 or 2 Children | 51 (100.0%) | 0 (0.0%) |
| 3 or 4 Children | 9 (100.0%) | 0 (0.0%) |
| 5 or more Children | 0 (0.0%) | 0 (0.0%) |
| Total | 316 (97.8%) | 7 (2.2%) |
Income Below Poverty Among Single-Parent Households in Menard County
According to the poverty data in Menard County, 63.2% or 36 single-father households and 35.0% or 14 single-mother households are living below the poverty line. Among single-father households, those with 1 or 2 children have the highest poverty rate, with 27 households (100.0%) experiencing poverty. Likewise, among single-mother households, those with no children have the highest poverty rate, with 10 households (100.0%) falling below the poverty line.
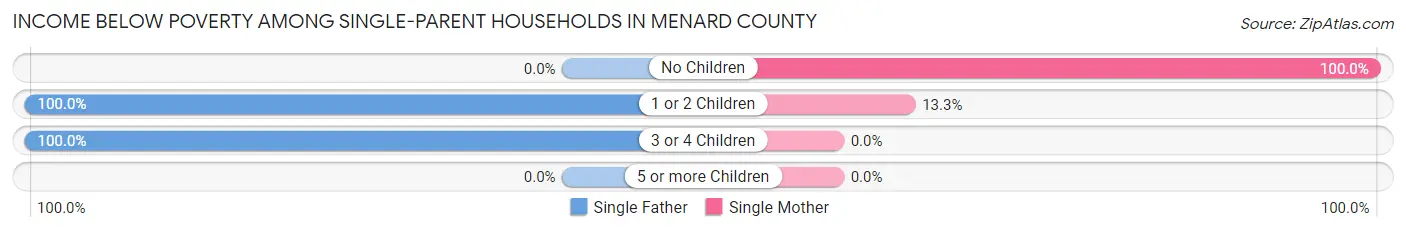
| Children | Single Father | Single Mother |
| No Children | 0 (0.0%) | 10 (100.0%) |
| 1 or 2 Children | 27 (100.0%) | 4 (13.3%) |
| 3 or 4 Children | 9 (100.0%) | 0 (0.0%) |
| 5 or more Children | 0 (0.0%) | 0 (0.0%) |
| Total | 36 (63.2%) | 14 (35.0%) |
Income Below Poverty Among Married-Couple vs Single-Parent Households in Menard County
The poverty data for Menard County shows that 7 of the married-couple family households (2.2%) and 50 of the single-parent households (51.5%) are living below the poverty level. Within the married-couple family households, those with no children have the highest poverty rate, with 7 households (2.7%) falling below the poverty line. Among the single-parent households, those with 3 or 4 children have the highest poverty rate, with 9 household (100.0%) living below poverty.
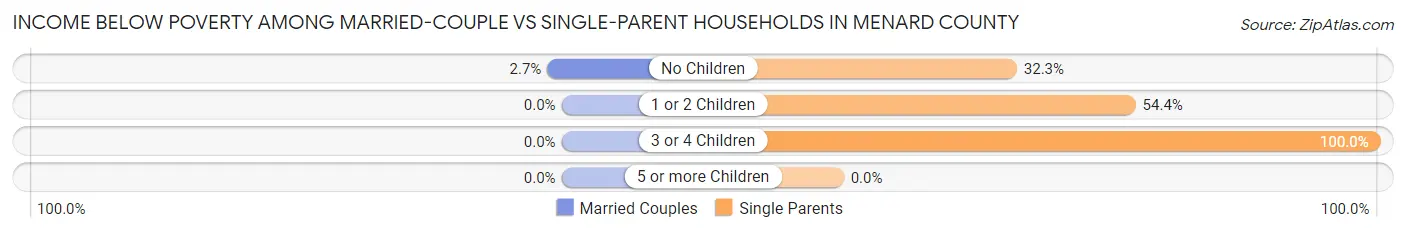
| Children | Married-Couple Families | Single-Parent Households |
| No Children | 7 (2.7%) | 10 (32.3%) |
| 1 or 2 Children | 0 (0.0%) | 31 (54.4%) |
| 3 or 4 Children | 0 (0.0%) | 9 (100.0%) |
| 5 or more Children | 0 (0.0%) | 0 (0.0%) |
| Total | 7 (2.2%) | 50 (51.5%) |
Race in Menard County
The most populous races in Menard County are White / Caucasian (1,608 | 81.9%), Hispanic or Latino (672 | 34.2%), and Two or more Races (252 | 12.8%).
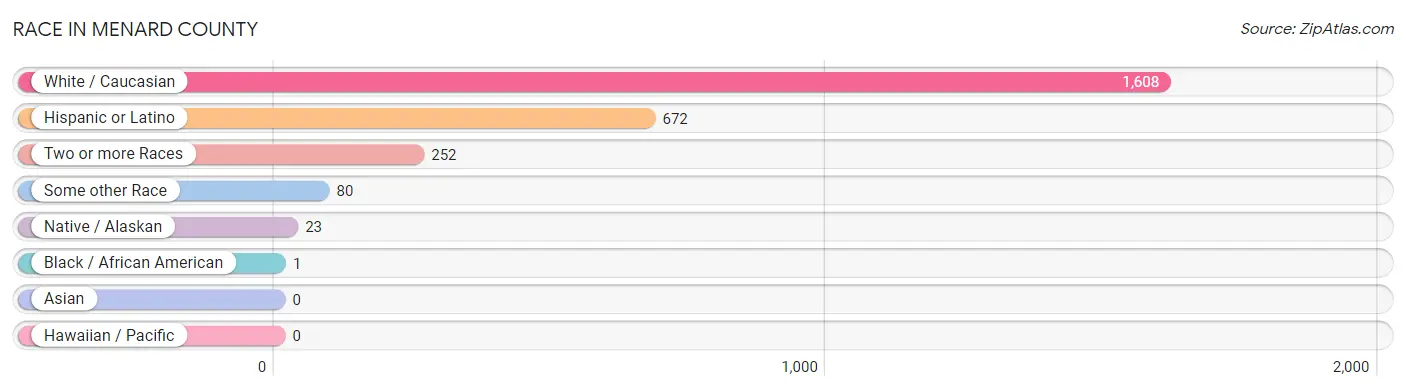
| Race | # Population | % Population |
| Asian | 0 | 0.0% |
| Black / African American | 1 | 0.1% |
| Hawaiian / Pacific | 0 | 0.0% |
| Hispanic or Latino | 672 | 34.2% |
| Native / Alaskan | 23 | 1.2% |
| White / Caucasian | 1,608 | 81.9% |
| Two or more Races | 252 | 12.8% |
| Some other Race | 80 | 4.1% |
| Total | 1,964 | 100.0% |
Ancestry in Menard County
The most populous ancestries reported in Menard County are Mexican (619 | 31.5%), German (394 | 20.1%), English (275 | 14.0%), Irish (228 | 11.6%), and Scotch-Irish (59 | 3.0%), together accounting for 80.2% of all Menard County residents.
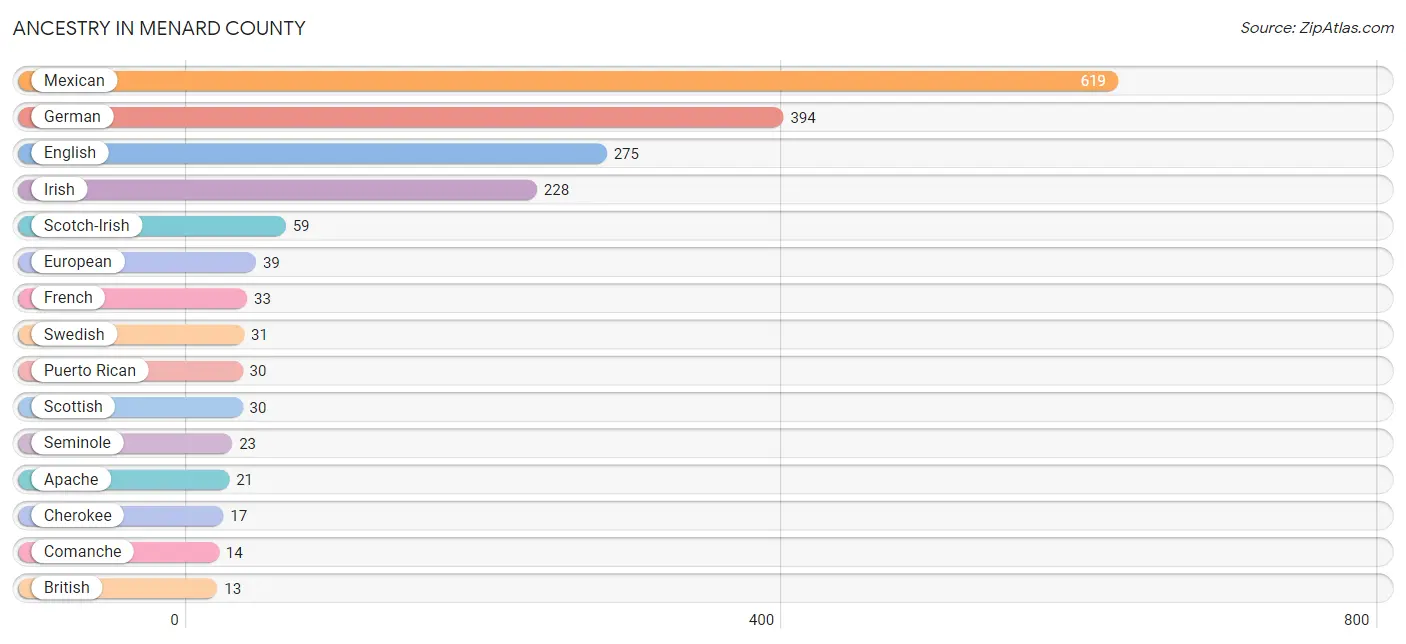
| Ancestry | # Population | % Population |
| American | 5 | 0.3% |
| Apache | 21 | 1.1% |
| British | 13 | 0.7% |
| Central American | 4 | 0.2% |
| Cherokee | 17 | 0.9% |
| Comanche | 14 | 0.7% |
| Czech | 9 | 0.5% |
| Dutch | 9 | 0.5% |
| English | 275 | 14.0% |
| European | 39 | 2.0% |
| French | 33 | 1.7% |
| German | 394 | 20.1% |
| Guatemalan | 4 | 0.2% |
| Irish | 228 | 11.6% |
| Mexican | 619 | 31.5% |
| Puerto Rican | 30 | 1.5% |
| Scandinavian | 4 | 0.2% |
| Scotch-Irish | 59 | 3.0% |
| Scottish | 30 | 1.5% |
| Seminole | 23 | 1.2% |
| Swedish | 31 | 1.6% |
| Ukrainian | 12 | 0.6% | View All 22 Rows |
Immigrants in Menard County
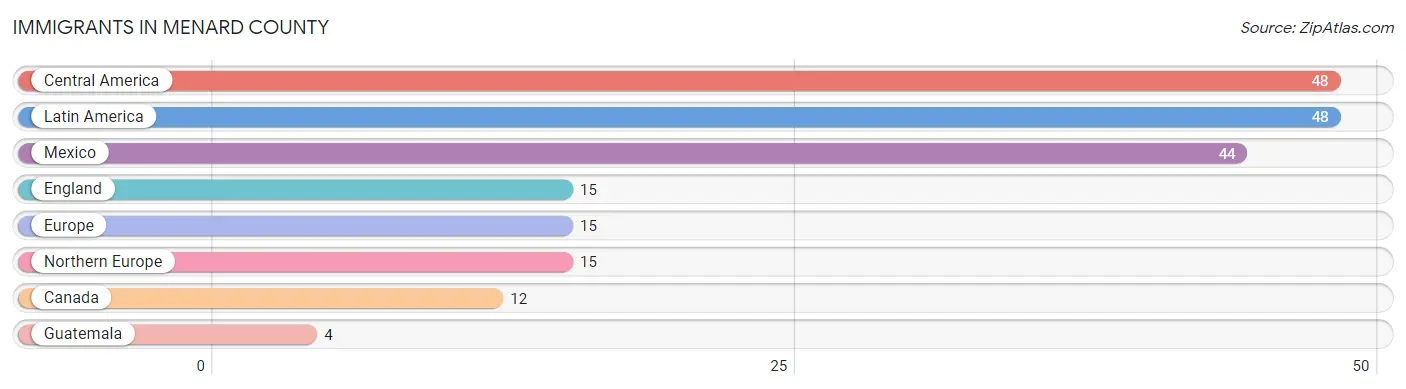
The most numerous immigrant groups reported in Menard County came from Central America (48 | 2.4%), Latin America (48 | 2.4%), Mexico (44 | 2.2%), England (15 | 0.8%), and Europe (15 | 0.8%), together accounting for 8.6% of all Menard County residents.
| Immigration Origin | # Population | % Population |
| Canada | 12 | 0.6% |
| Central America | 48 | 2.4% |
| England | 15 | 0.8% |
| Europe | 15 | 0.8% |
| Guatemala | 4 | 0.2% |
| Latin America | 48 | 2.4% |
| Mexico | 44 | 2.2% |
| Northern Europe | 15 | 0.8% | View All 8 Rows |
Sex and Age in Menard County
Sex and Age in Menard County
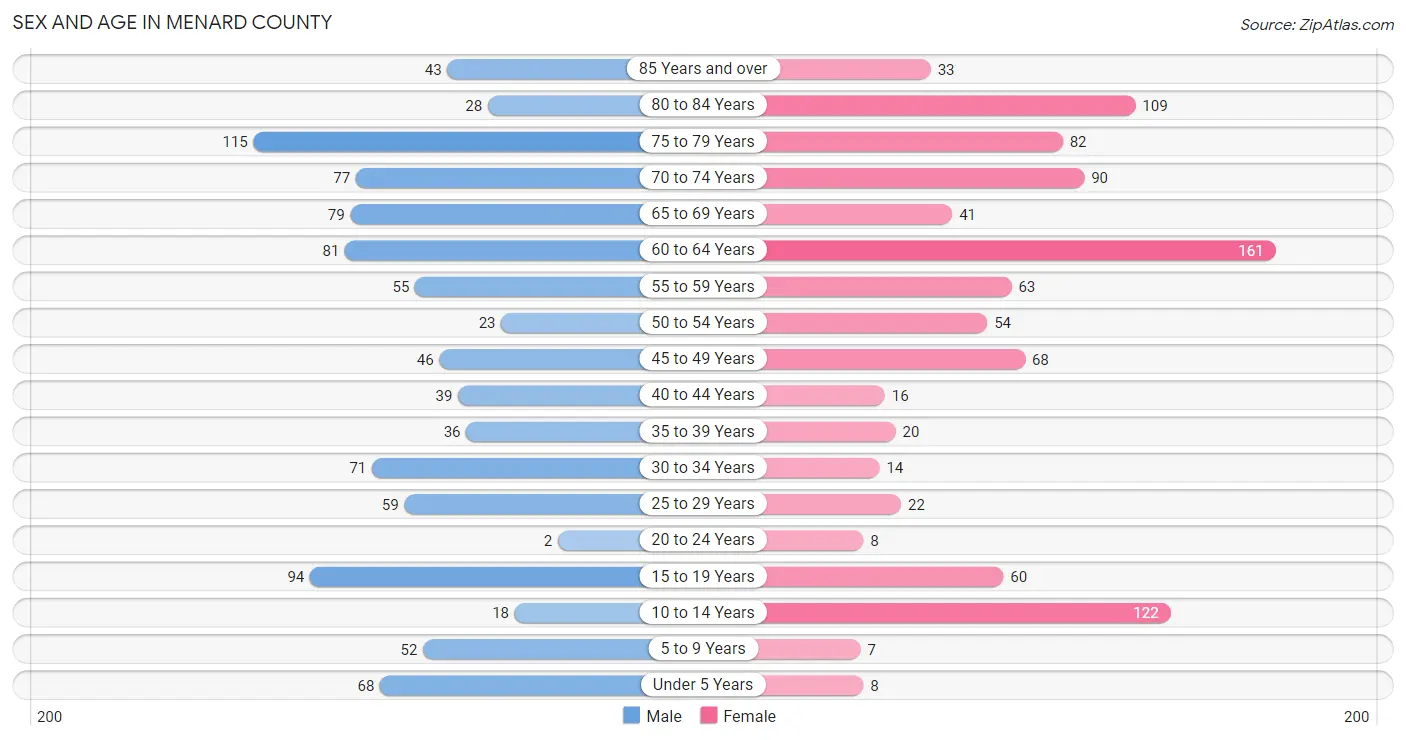
The most populous age groups in Menard County are 75 to 79 Years (115 | 11.7%) for men and 60 to 64 Years (161 | 16.5%) for women.
| Age Bracket | Male | Female |
| Under 5 Years | 68 (6.9%) | 8 (0.8%) |
| 5 to 9 Years | 52 (5.3%) | 7 (0.7%) |
| 10 to 14 Years | 18 (1.8%) | 122 (12.5%) |
| 15 to 19 Years | 94 (9.5%) | 60 (6.1%) |
| 20 to 24 Years | 2 (0.2%) | 8 (0.8%) |
| 25 to 29 Years | 59 (6.0%) | 22 (2.2%) |
| 30 to 34 Years | 71 (7.2%) | 14 (1.4%) |
| 35 to 39 Years | 36 (3.6%) | 20 (2.0%) |
| 40 to 44 Years | 39 (4.0%) | 16 (1.6%) |
| 45 to 49 Years | 46 (4.7%) | 68 (7.0%) |
| 50 to 54 Years | 23 (2.3%) | 54 (5.5%) |
| 55 to 59 Years | 55 (5.6%) | 63 (6.4%) |
| 60 to 64 Years | 81 (8.2%) | 161 (16.5%) |
| 65 to 69 Years | 79 (8.0%) | 41 (4.2%) |
| 70 to 74 Years | 77 (7.8%) | 90 (9.2%) |
| 75 to 79 Years | 115 (11.7%) | 82 (8.4%) |
| 80 to 84 Years | 28 (2.8%) | 109 (11.2%) |
| 85 Years and over | 43 (4.4%) | 33 (3.4%) |
| Total | 986 (100.0%) | 978 (100.0%) |
Families and Households in Menard County
Median Family Size in Menard County
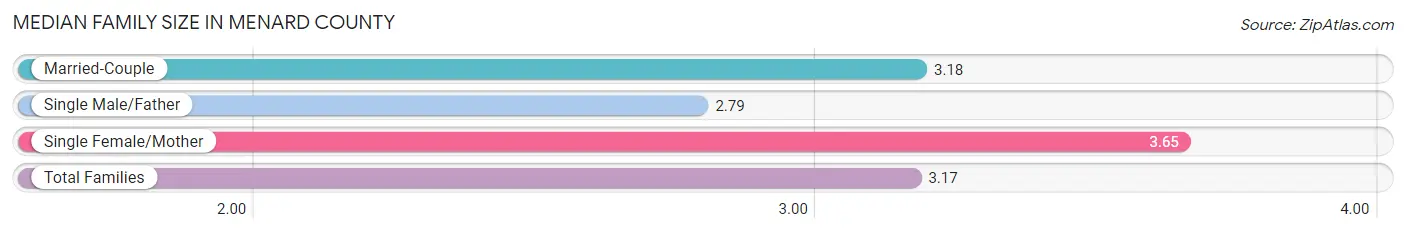
The median family size in Menard County is 3.17 persons per family, with single female/mother families (40 | 9.5%) accounting for the largest median family size of 3.65 persons per family. On the other hand, single male/father families (57 | 13.6%) represent the smallest median family size with 2.79 persons per family.
| Family Type | # Families | Family Size |
| Married-Couple | 323 (76.9%) | 3.18 |
| Single Male/Father | 57 (13.6%) | 2.79 |
| Single Female/Mother | 40 (9.5%) | 3.65 |
| Total Families | 420 (100.0%) | 3.17 |
Median Household Size in Menard County
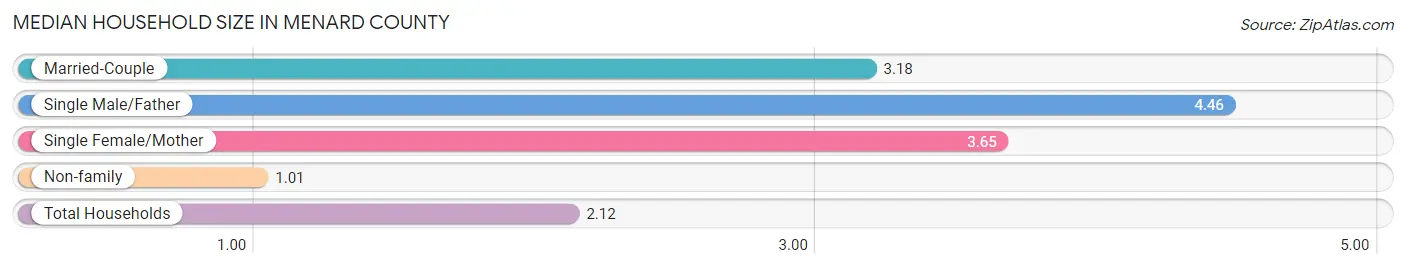
The median household size in Menard County is 2.12 persons per household, with single male/father households (57 | 6.3%) accounting for the largest median household size of 4.46 persons per household. non-family households (485 | 53.6%) represent the smallest median household size with 1.01 persons per household.
| Household Type | # Households | Household Size |
| Married-Couple | 323 (35.7%) | 3.18 |
| Single Male/Father | 57 (6.3%) | 4.46 |
| Single Female/Mother | 40 (4.4%) | 3.65 |
| Non-family | 485 (53.6%) | 1.01 |
| Total Households | 905 (100.0%) | 2.12 |
Household Size by Marriage Status in Menard County
Out of a total of 905 households in Menard County, 420 (46.4%) are family households, while 485 (53.6%) are nonfamily households. The most numerous type of family households are 2-person households, comprising 272, and the most common type of nonfamily households are 1-person households, comprising 479.
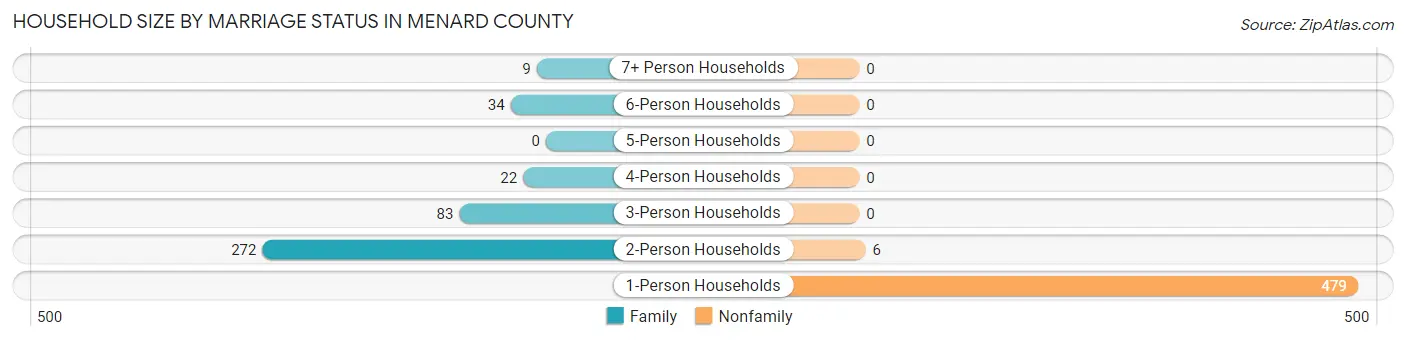
| Household Size | Family Households | Nonfamily Households |
| 1-Person Households | - | 479 (52.9%) |
| 2-Person Households | 272 (30.1%) | 6 (0.7%) |
| 3-Person Households | 83 (9.2%) | 0 (0.0%) |
| 4-Person Households | 22 (2.4%) | 0 (0.0%) |
| 5-Person Households | 0 (0.0%) | 0 (0.0%) |
| 6-Person Households | 34 (3.8%) | 0 (0.0%) |
| 7+ Person Households | 9 (1.0%) | 0 (0.0%) |
| Total | 420 (46.4%) | 485 (53.6%) |
Female Fertility in Menard County
Fertility by Age in Menard County
| Age Bracket | Women with Births | Births / 1,000 Women |
| 15 to 19 years | 0 (0.0%) | 0.0 |
| 20 to 34 years | 0 (0.0%) | 0.0 |
| 35 to 50 years | 0 (0.0%) | 0.0 |
| Total | 0 (0.0%) | 0.0 |
Fertility by Age by Marriage Status in Menard County
| Age Bracket | Married | Unmarried |
| 15 to 19 years | 0 (0.0%) | 0 (0.0%) |
| 20 to 34 years | 0 (0.0%) | 0 (0.0%) |
| 35 to 50 years | 0 (0.0%) | 0 (0.0%) |
| Total | 0 (0.0%) | 0 (0.0%) |
Fertility by Education in Menard County
| Educational Attainment | Women with Births | Births / 1,000 Women |
| Less than High School | 0 (0.0%) | 0.0 |
| High School Diploma | 0 (0.0%) | 0.0 |
| College or Associate's Degree | 0 (0.0%) | 0.0 |
| Bachelor's Degree | 0 (0.0%) | 0.0 |
| Graduate Degree | 0 (0.0%) | 0.0 |
| Total | 0 (0.0%) | 0.0 |
Fertility by Education by Marriage Status in Menard County
| Educational Attainment | Married | Unmarried |
| Less than High School | 0 (0.0%) | 0 (0.0%) |
| High School Diploma | 0 (0.0%) | 0 (0.0%) |
| College or Associate's Degree | 0 (0.0%) | 0 (0.0%) |
| Bachelor's Degree | 0 (0.0%) | 0 (0.0%) |
| Graduate Degree | 0 (0.0%) | 0 (0.0%) |
| Total | 0 (0.0%) | 0 (0.0%) |
Employment Characteristics in Menard County
Employment by Class of Employer in Menard County
Among the 671 employed individuals in Menard County, private company employees (400 | 59.6%), self-employed (not incorporated) (88 | 13.1%), and local government employees (86 | 12.8%) make up the most common classes of employment.
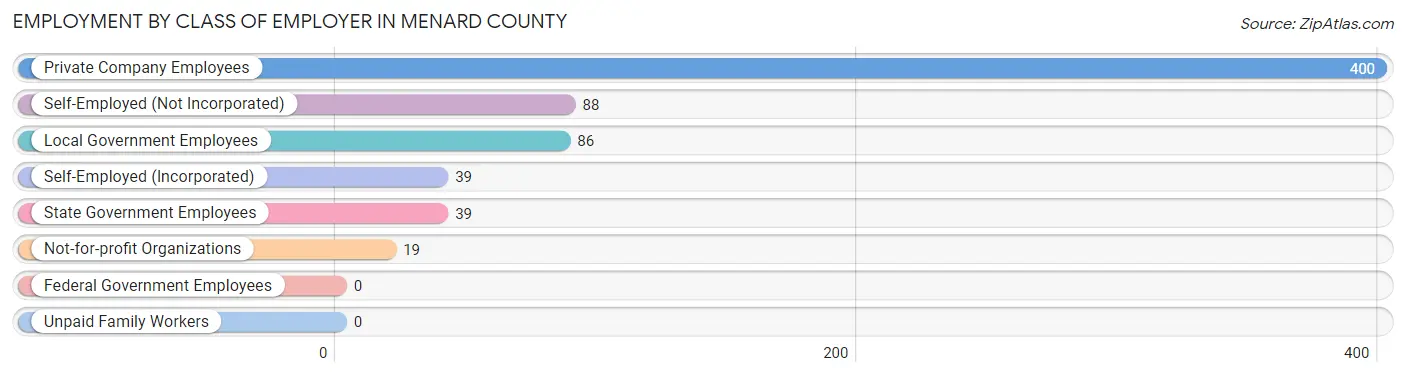
| Employer Class | # Employees | % Employees |
| Private Company Employees | 400 | 59.6% |
| Self-Employed (Incorporated) | 39 | 5.8% |
| Self-Employed (Not Incorporated) | 88 | 13.1% |
| Not-for-profit Organizations | 19 | 2.8% |
| Local Government Employees | 86 | 12.8% |
| State Government Employees | 39 | 5.8% |
| Federal Government Employees | 0 | 0.0% |
| Unpaid Family Workers | 0 | 0.0% |
| Total | 671 | 100.0% |
Employment Status by Age in Menard County
According to the labor force statistics for Menard County, out of the total population over 16 years of age (1,646), 52.3% or 861 individuals are in the labor force, with 14.3% or 123 of them unemployed. The age group with the highest labor force participation rate is 25 to 29 years, with 100.0% or 81 individuals in the labor force. Within the labor force, the 60 to 64 years age range has the highest percentage of unemployed individuals, with 44.7% or 76 of them being unemployed.
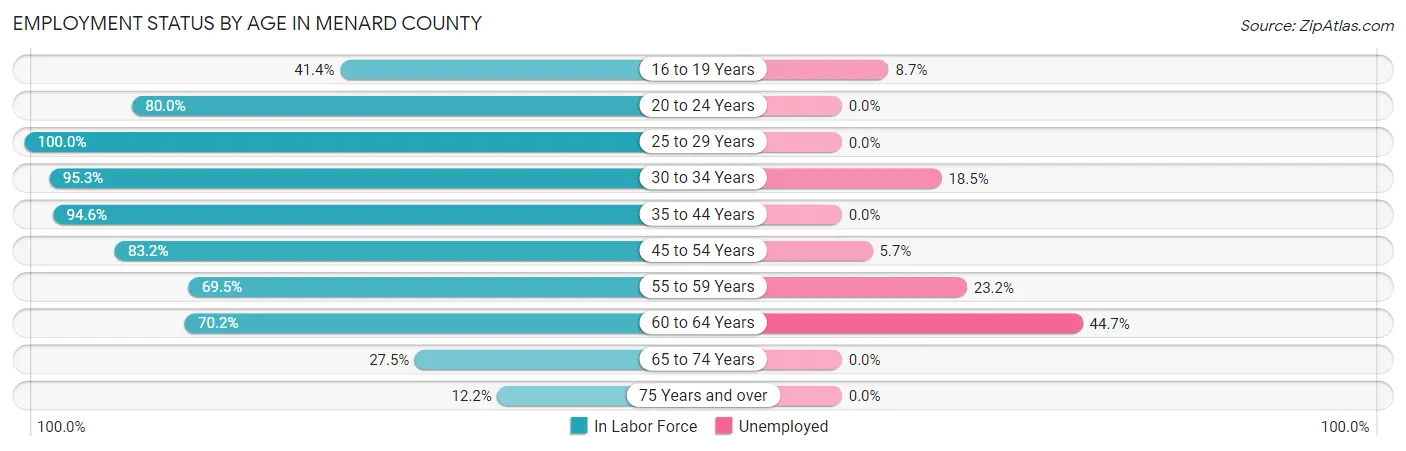
| Age Bracket | In Labor Force | Unemployed |
| 16 to 19 Years | 46 (41.4%) | 4 (8.7%) |
| 20 to 24 Years | 8 (80.0%) | 0 (0.0%) |
| 25 to 29 Years | 81 (100.0%) | 0 (0.0%) |
| 30 to 34 Years | 81 (95.3%) | 15 (18.5%) |
| 35 to 44 Years | 105 (94.6%) | 0 (0.0%) |
| 45 to 54 Years | 159 (83.2%) | 9 (5.7%) |
| 55 to 59 Years | 82 (69.5%) | 19 (23.2%) |
| 60 to 64 Years | 170 (70.2%) | 76 (44.7%) |
| 65 to 74 Years | 79 (27.5%) | 0 (0.0%) |
| 75 Years and over | 50 (12.2%) | 0 (0.0%) |
| Total | 861 (52.3%) | 123 (14.3%) |
Employment Status by Educational Attainment in Menard County
According to labor force statistics for Menard County, 81.9% of individuals (678) out of the total population between 25 and 64 years of age (828) are in the labor force, with 17.6% or 119 of them being unemployed. The group with the highest labor force participation rate are those with the educational attainment of bachelor's degree or higher, with 100.0% or 215 individuals in the labor force. Within the labor force, individuals with less than high school education have the highest percentage of unemployment, with 76.8% or 76 of them being unemployed.
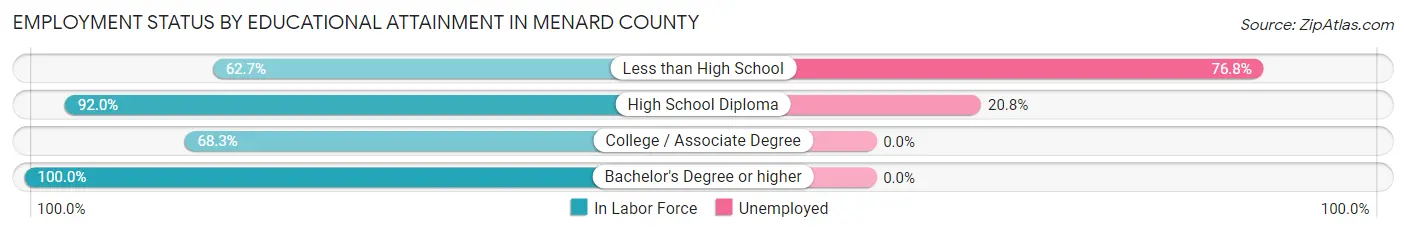
| Educational Attainment | In Labor Force | Unemployed |
| Less than High School | 99 (62.7%) | 121 (76.8%) |
| High School Diploma | 207 (92.0%) | 47 (20.8%) |
| College / Associate Degree | 157 (68.3%) | 0 (0.0%) |
| Bachelor's Degree or higher | 215 (100.0%) | 0 (0.0%) |
| Total | 678 (81.9%) | 146 (17.6%) |
Employment Occupations by Sex in Menard County
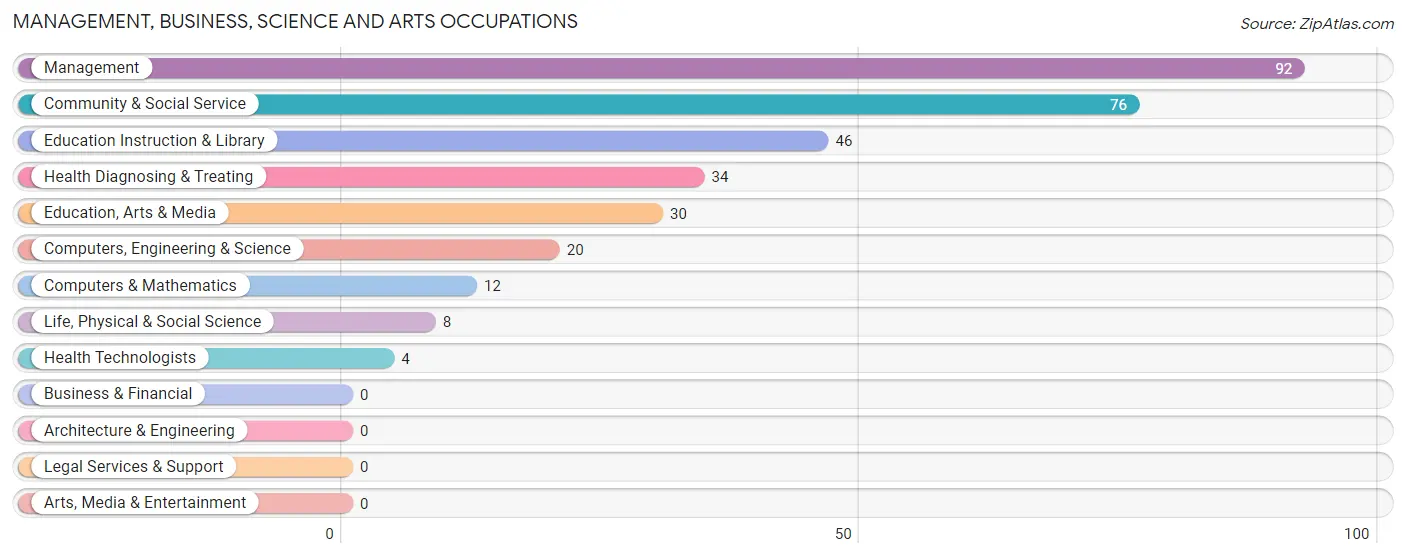
Management, Business, Science and Arts Occupations
The most common Management, Business, Science and Arts occupations in Menard County are Management (92 | 12.5%), Community & Social Service (76 | 10.3%), Education Instruction & Library (46 | 6.2%), Health Diagnosing & Treating (34 | 4.6%), and Education, Arts & Media (30 | 4.1%).
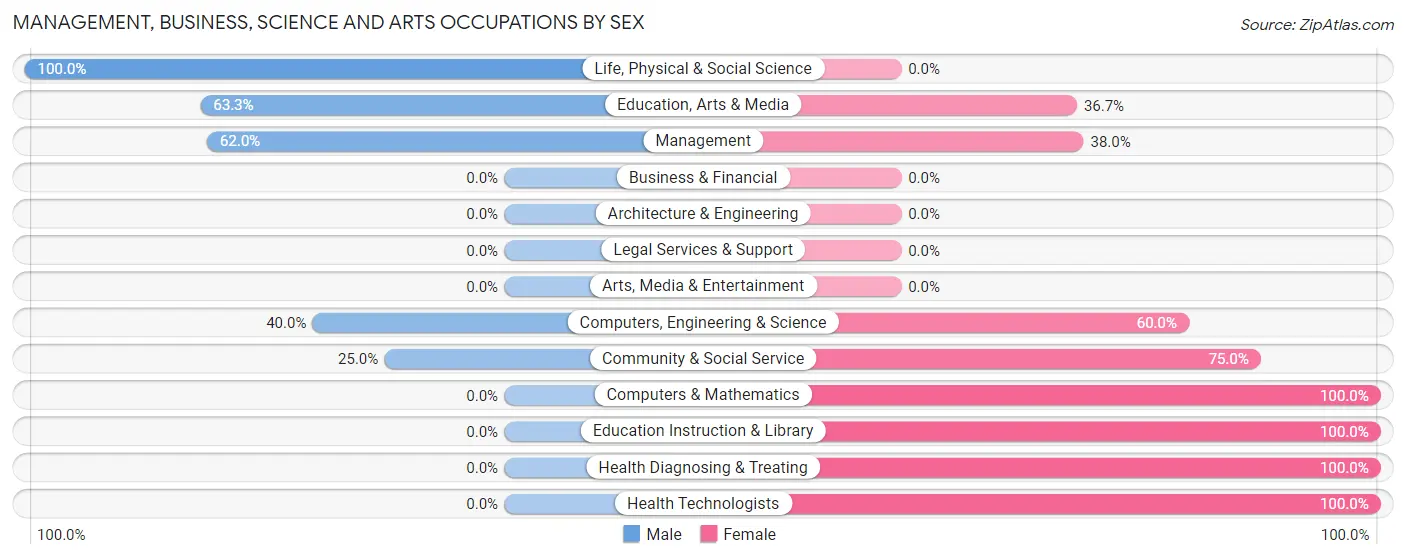
Management, Business, Science and Arts Occupations by Sex
Within the Management, Business, Science and Arts occupations in Menard County, the most male-oriented occupations are Life, Physical & Social Science (100.0%), Education, Arts & Media (63.3%), and Management (62.0%), while the most female-oriented occupations are Computers & Mathematics (100.0%), Education Instruction & Library (100.0%), and Health Diagnosing & Treating (100.0%).
| Occupation | Male | Female |
| Management | 57 (62.0%) | 35 (38.0%) |
| Business & Financial | 0 (0.0%) | 0 (0.0%) |
| Computers, Engineering & Science | 8 (40.0%) | 12 (60.0%) |
| Computers & Mathematics | 0 (0.0%) | 12 (100.0%) |
| Architecture & Engineering | 0 (0.0%) | 0 (0.0%) |
| Life, Physical & Social Science | 8 (100.0%) | 0 (0.0%) |
| Community & Social Service | 19 (25.0%) | 57 (75.0%) |
| Education, Arts & Media | 19 (63.3%) | 11 (36.7%) |
| Legal Services & Support | 0 (0.0%) | 0 (0.0%) |
| Education Instruction & Library | 0 (0.0%) | 46 (100.0%) |
| Arts, Media & Entertainment | 0 (0.0%) | 0 (0.0%) |
| Health Diagnosing & Treating | 0 (0.0%) | 34 (100.0%) |
| Health Technologists | 0 (0.0%) | 4 (100.0%) |
| Total (Category) | 84 (37.8%) | 138 (62.2%) |
| Total (Overall) | 406 (55.0%) | 332 (45.0%) |
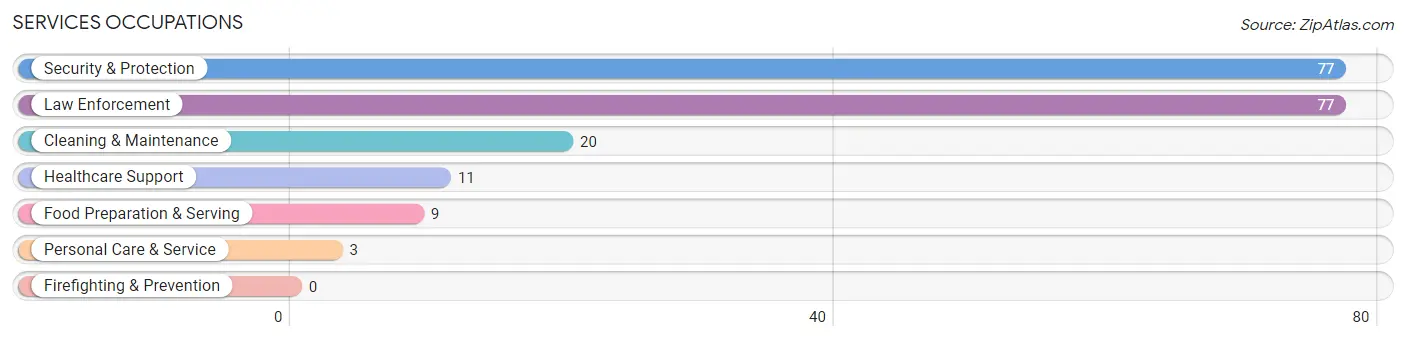
Services Occupations
The most common Services occupations in Menard County are Security & Protection (77 | 10.4%), Law Enforcement (77 | 10.4%), Cleaning & Maintenance (20 | 2.7%), Healthcare Support (11 | 1.5%), and Food Preparation & Serving (9 | 1.2%).
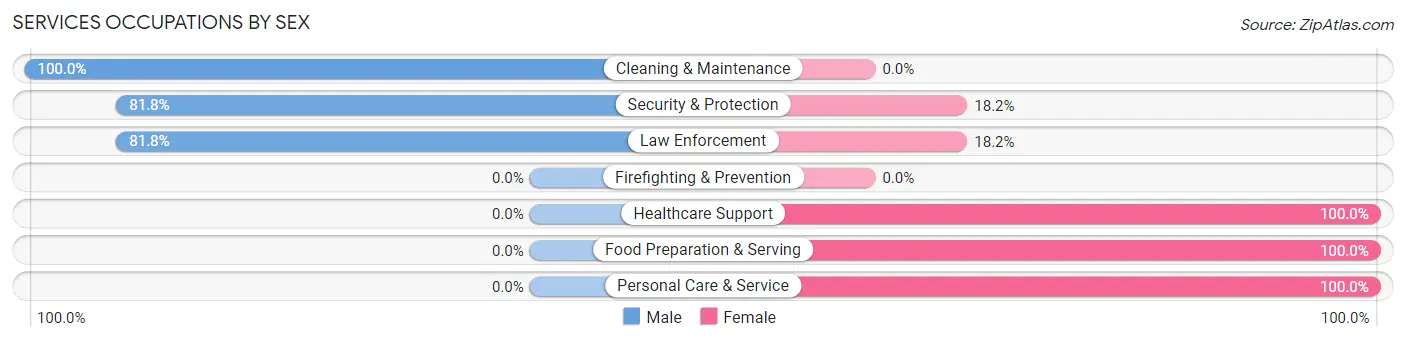
Services Occupations by Sex
Within the Services occupations in Menard County, the most male-oriented occupations are Cleaning & Maintenance (100.0%), Security & Protection (81.8%), and Law Enforcement (81.8%), while the most female-oriented occupations are Healthcare Support (100.0%), Food Preparation & Serving (100.0%), and Personal Care & Service (100.0%).
| Occupation | Male | Female |
| Healthcare Support | 0 (0.0%) | 11 (100.0%) |
| Security & Protection | 63 (81.8%) | 14 (18.2%) |
| Firefighting & Prevention | 0 (0.0%) | 0 (0.0%) |
| Law Enforcement | 63 (81.8%) | 14 (18.2%) |
| Food Preparation & Serving | 0 (0.0%) | 9 (100.0%) |
| Cleaning & Maintenance | 20 (100.0%) | 0 (0.0%) |
| Personal Care & Service | 0 (0.0%) | 3 (100.0%) |
| Total (Category) | 83 (69.2%) | 37 (30.8%) |
| Total (Overall) | 406 (55.0%) | 332 (45.0%) |
Sales and Office Occupations
The most common Sales and Office occupations in Menard County are Sales & Related (83 | 11.3%), and Office & Administration (74 | 10.0%).

Sales and Office Occupations by Sex
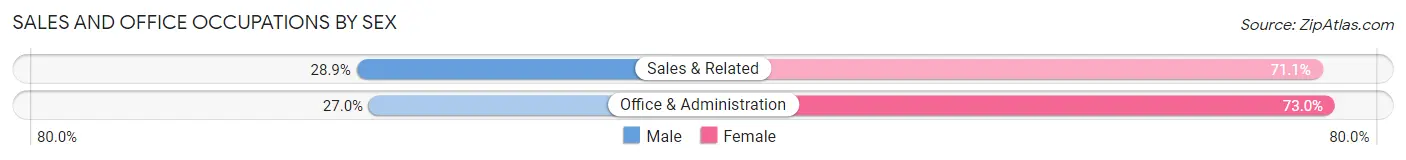
| Occupation | Male | Female |
| Sales & Related | 24 (28.9%) | 59 (71.1%) |
| Office & Administration | 20 (27.0%) | 54 (73.0%) |
| Total (Category) | 44 (28.0%) | 113 (72.0%) |
| Total (Overall) | 406 (55.0%) | 332 (45.0%) |
Natural Resources, Construction and Maintenance Occupations
The most common Natural Resources, Construction and Maintenance occupations in Menard County are Construction & Extraction (81 | 11.0%), Installation, Maintenance & Repair (11 | 1.5%), and Farming, Fishing & Forestry (2 | 0.3%).
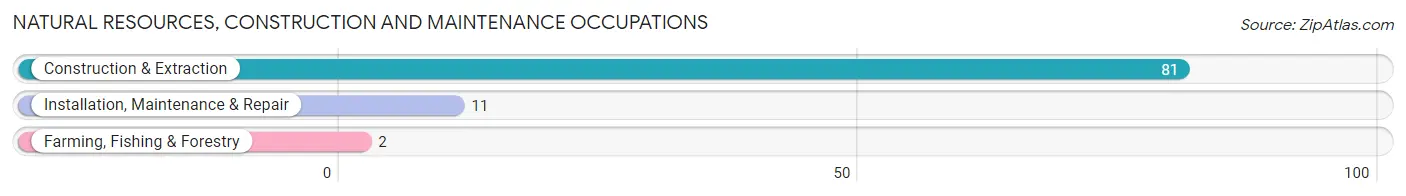
Natural Resources, Construction and Maintenance Occupations by Sex

| Occupation | Male | Female |
| Farming, Fishing & Forestry | 2 (100.0%) | 0 (0.0%) |
| Construction & Extraction | 55 (67.9%) | 26 (32.1%) |
| Installation, Maintenance & Repair | 11 (100.0%) | 0 (0.0%) |
| Total (Category) | 68 (72.3%) | 26 (27.7%) |
| Total (Overall) | 406 (55.0%) | 332 (45.0%) |
Production, Transportation and Moving Occupations
The most common Production, Transportation and Moving occupations in Menard County are Transportation (114 | 15.4%), Production (21 | 2.9%), and Material Moving (10 | 1.4%).
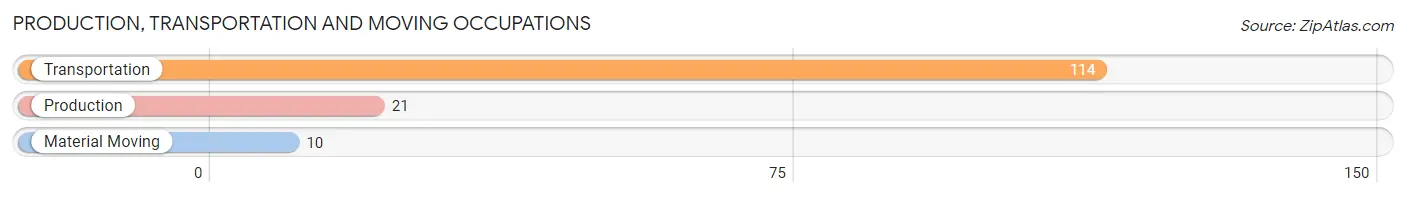
Production, Transportation and Moving Occupations by Sex
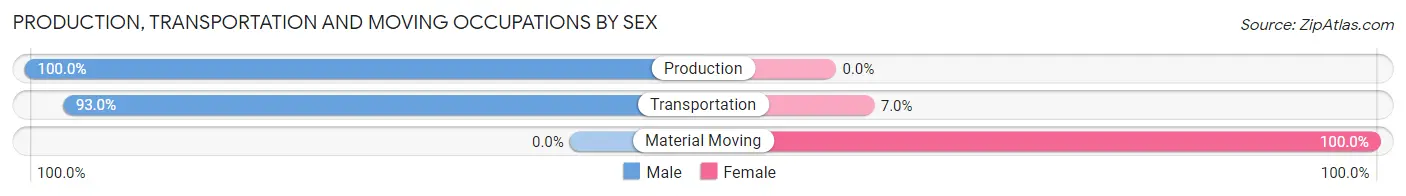
| Occupation | Male | Female |
| Production | 21 (100.0%) | 0 (0.0%) |
| Transportation | 106 (93.0%) | 8 (7.0%) |
| Material Moving | 0 (0.0%) | 10 (100.0%) |
| Total (Category) | 127 (87.6%) | 18 (12.4%) |
| Total (Overall) | 406 (55.0%) | 332 (45.0%) |
Employment Industries by Sex in Menard County
Employment Industries in Menard County
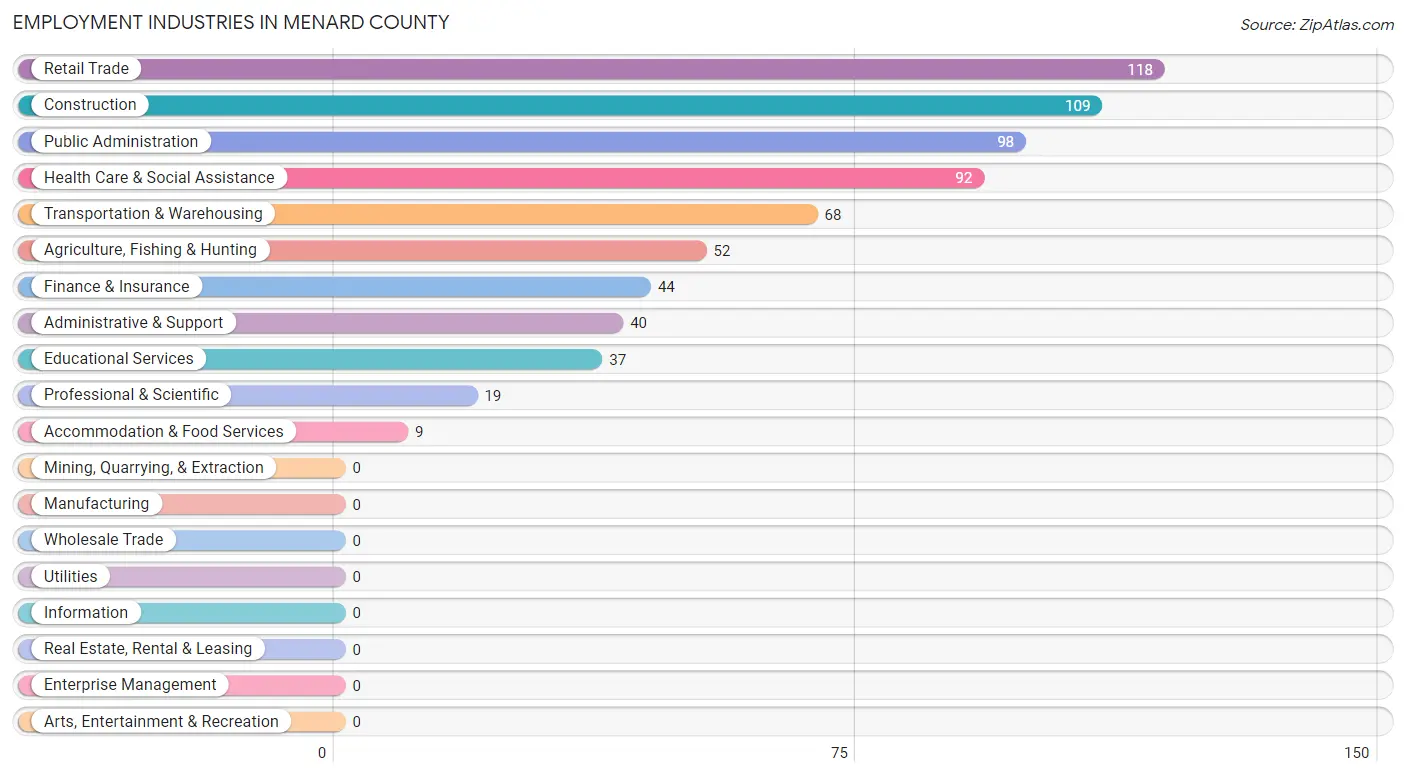
The major employment industries in Menard County include Retail Trade (118 | 16.0%), Construction (109 | 14.8%), Public Administration (98 | 13.3%), Health Care & Social Assistance (92 | 12.5%), and Transportation & Warehousing (68 | 9.2%).
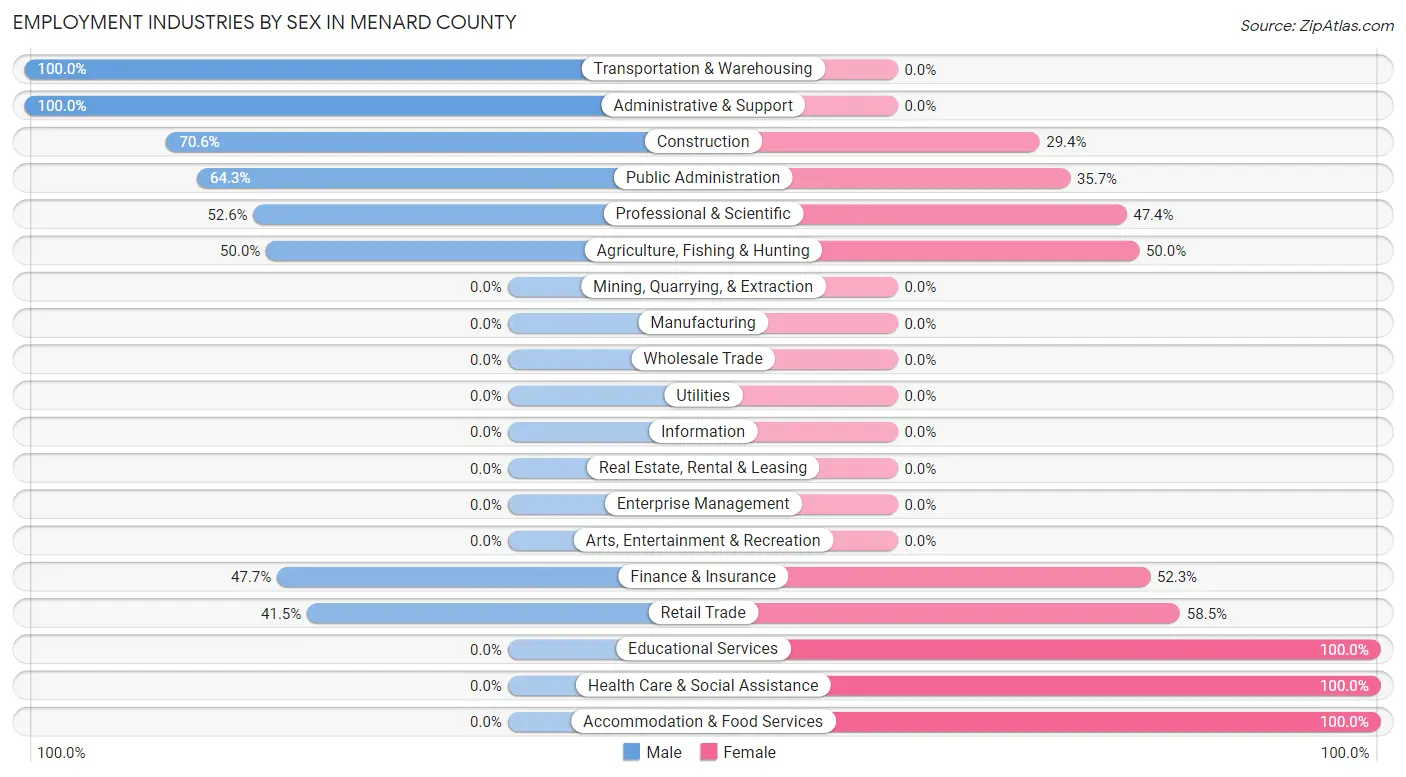
Employment Industries by Sex in Menard County
The Menard County industries that see more men than women are Transportation & Warehousing (100.0%), Administrative & Support (100.0%), and Construction (70.6%), whereas the industries that tend to have a higher number of women are Educational Services (100.0%), Health Care & Social Assistance (100.0%), and Accommodation & Food Services (100.0%).
| Industry | Male | Female |
| Agriculture, Fishing & Hunting | 26 (50.0%) | 26 (50.0%) |
| Mining, Quarrying, & Extraction | 0 (0.0%) | 0 (0.0%) |
| Construction | 77 (70.6%) | 32 (29.4%) |
| Manufacturing | 0 (0.0%) | 0 (0.0%) |
| Wholesale Trade | 0 (0.0%) | 0 (0.0%) |
| Retail Trade | 49 (41.5%) | 69 (58.5%) |
| Transportation & Warehousing | 68 (100.0%) | 0 (0.0%) |
| Utilities | 0 (0.0%) | 0 (0.0%) |
| Information | 0 (0.0%) | 0 (0.0%) |
| Finance & Insurance | 21 (47.7%) | 23 (52.3%) |
| Real Estate, Rental & Leasing | 0 (0.0%) | 0 (0.0%) |
| Professional & Scientific | 10 (52.6%) | 9 (47.4%) |
| Enterprise Management | 0 (0.0%) | 0 (0.0%) |
| Administrative & Support | 40 (100.0%) | 0 (0.0%) |
| Educational Services | 0 (0.0%) | 37 (100.0%) |
| Health Care & Social Assistance | 0 (0.0%) | 92 (100.0%) |
| Arts, Entertainment & Recreation | 0 (0.0%) | 0 (0.0%) |
| Accommodation & Food Services | 0 (0.0%) | 9 (100.0%) |
| Public Administration | 63 (64.3%) | 35 (35.7%) |
| Total | 406 (55.0%) | 332 (45.0%) |
Education in Menard County
School Enrollment in Menard County
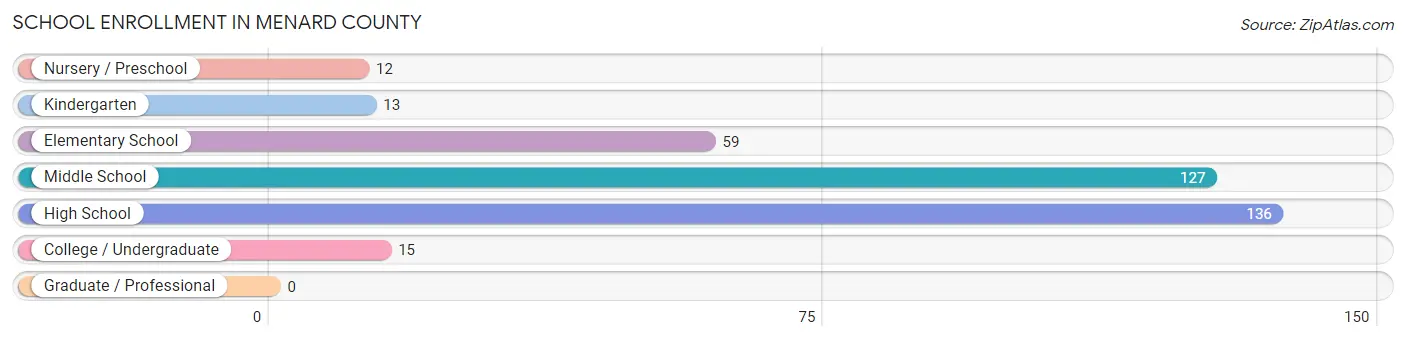
The most common levels of schooling among the 362 students in Menard County are high school (136 | 37.6%), middle school (127 | 35.1%), and elementary school (59 | 16.3%).
| School Level | # Students | % Students |
| Nursery / Preschool | 12 | 3.3% |
| Kindergarten | 13 | 3.6% |
| Elementary School | 59 | 16.3% |
| Middle School | 127 | 35.1% |
| High School | 136 | 37.6% |
| College / Undergraduate | 15 | 4.1% |
| Graduate / Professional | 0 | 0.0% |
| Total | 362 | 100.0% |
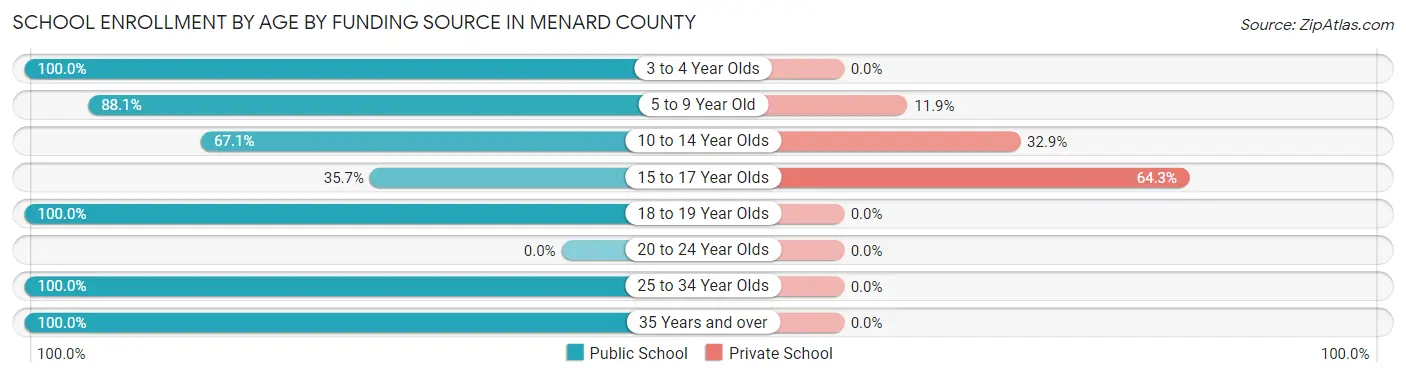
School Enrollment by Age by Funding Source in Menard County
Out of a total of 362 students who are enrolled in schools in Menard County, 116 (32.0%) attend a private institution, while the remaining 246 (68.0%) are enrolled in public schools. The age group of 15 to 17 year olds has the highest likelihood of being enrolled in private schools, with 63 (64.3% in the age bracket) enrolled. Conversely, the age group of 3 to 4 year olds has the lowest likelihood of being enrolled in a private school, with 12 (100.0% in the age bracket) attending a public institution.
| Age Bracket | Public School | Private School |
| 3 to 4 Year Olds | 12 (100.0%) | 0 (0.0%) |
| 5 to 9 Year Old | 52 (88.1%) | 7 (11.9%) |
| 10 to 14 Year Olds | 94 (67.1%) | 46 (32.9%) |
| 15 to 17 Year Olds | 35 (35.7%) | 63 (64.3%) |
| 18 to 19 Year Olds | 38 (100.0%) | 0 (0.0%) |
| 20 to 24 Year Olds | 0 (0.0%) | 0 (0.0%) |
| 25 to 34 Year Olds | 11 (100.0%) | 0 (0.0%) |
| 35 Years and over | 4 (100.0%) | 0 (0.0%) |
| Total | 246 (68.0%) | 116 (32.0%) |
Educational Attainment by Field of Study in Menard County
Education (84 | 22.5%), business (58 | 15.5%), bio, nature & agricultural (55 | 14.7%), arts & humanities (52 | 13.9%), and computers & mathematics (33 | 8.8%) are the most common fields of study among 373 individuals in Menard County who have obtained a bachelor's degree or higher.
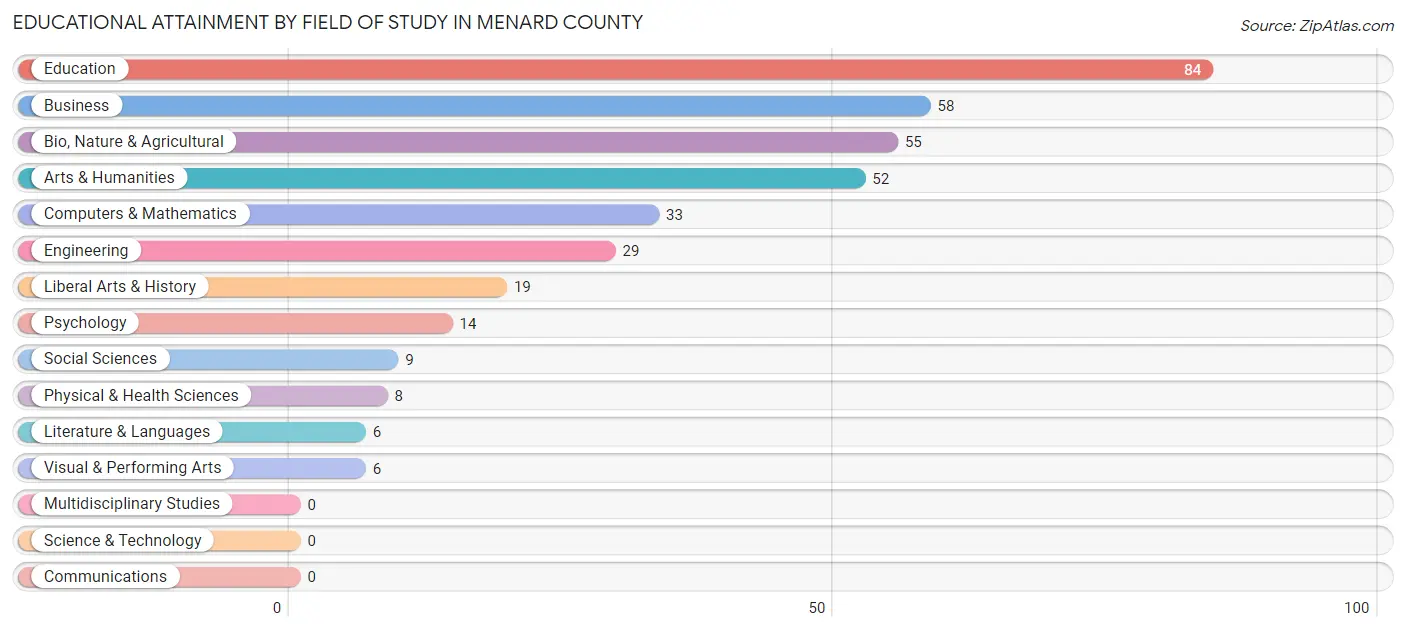
| Field of Study | # Graduates | % Graduates |
| Computers & Mathematics | 33 | 8.8% |
| Bio, Nature & Agricultural | 55 | 14.7% |
| Physical & Health Sciences | 8 | 2.1% |
| Psychology | 14 | 3.7% |
| Social Sciences | 9 | 2.4% |
| Engineering | 29 | 7.8% |
| Multidisciplinary Studies | 0 | 0.0% |
| Science & Technology | 0 | 0.0% |
| Business | 58 | 15.5% |
| Education | 84 | 22.5% |
| Literature & Languages | 6 | 1.6% |
| Liberal Arts & History | 19 | 5.1% |
| Visual & Performing Arts | 6 | 1.6% |
| Communications | 0 | 0.0% |
| Arts & Humanities | 52 | 13.9% |
| Total | 373 | 100.0% |
Transportation & Commute in Menard County
Vehicle Availability by Sex in Menard County
The most prevalent vehicle ownership categories in Menard County are males with 2 vehicles (217, accounting for 58.2%) and females with 2 vehicles (143, making up 72.8%).
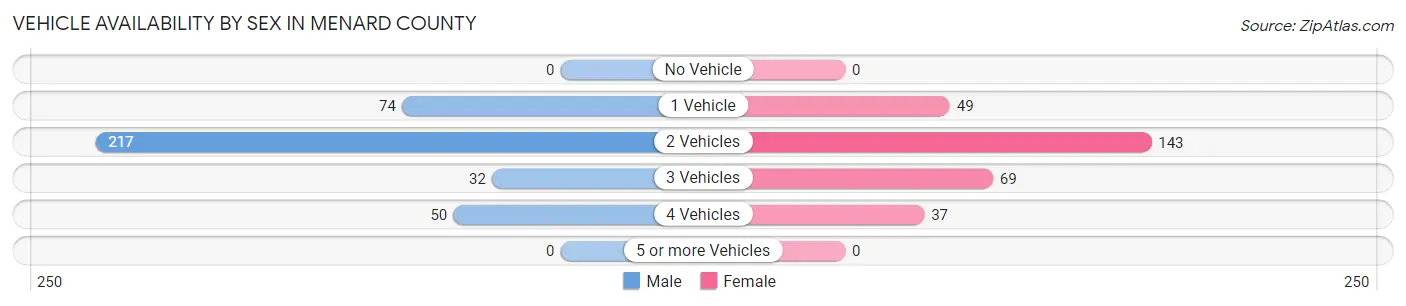
| Vehicles Available | Male | Female |
| No Vehicle | 0 (0.0%) | 0 (0.0%) |
| 1 Vehicle | 74 (19.8%) | 49 (16.4%) |
| 2 Vehicles | 217 (58.2%) | 143 (48.0%) |
| 3 Vehicles | 32 (8.6%) | 69 (23.2%) |
| 4 Vehicles | 50 (13.4%) | 37 (12.4%) |
| 5 or more Vehicles | 0 (0.0%) | 0 (0.0%) |
| Total | 373 (100.0%) | 298 (100.0%) |
Commute Time in Menard County
The most frequently occuring commute durations in Menard County are less than 5 minutes (161 commuters, 27.0%), 5 to 9 minutes (146 commuters, 24.5%), and 20 to 24 minutes (93 commuters, 15.6%).
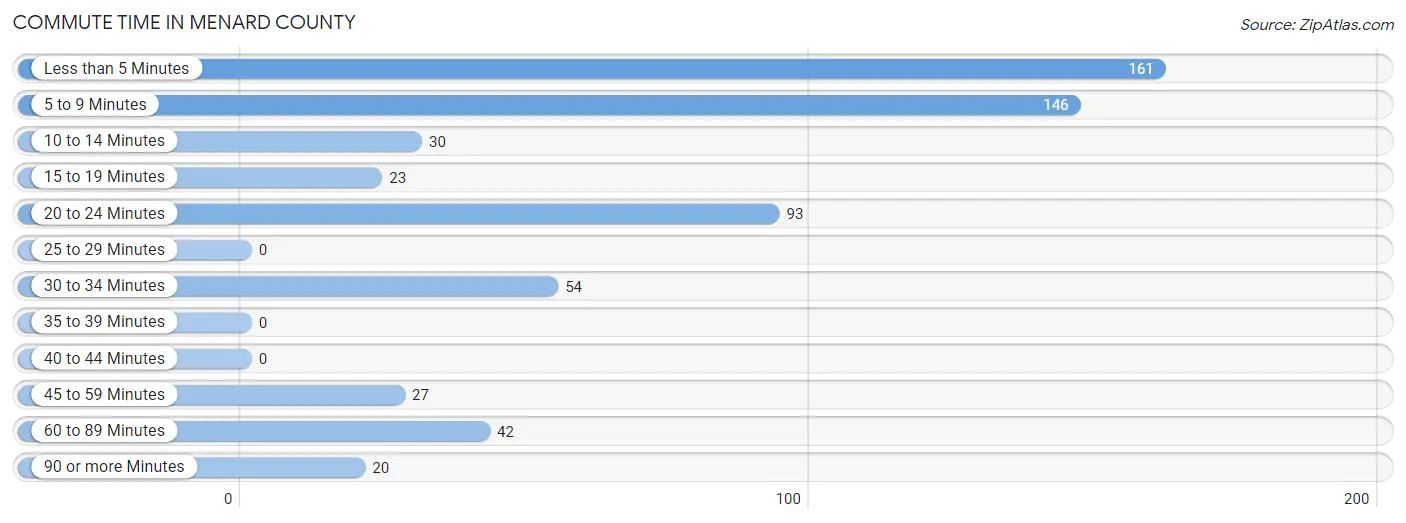
| Commute Time | # Commuters | % Commuters |
| Less than 5 Minutes | 161 | 27.0% |
| 5 to 9 Minutes | 146 | 24.5% |
| 10 to 14 Minutes | 30 | 5.0% |
| 15 to 19 Minutes | 23 | 3.9% |
| 20 to 24 Minutes | 93 | 15.6% |
| 25 to 29 Minutes | 0 | 0.0% |
| 30 to 34 Minutes | 54 | 9.1% |
| 35 to 39 Minutes | 0 | 0.0% |
| 40 to 44 Minutes | 0 | 0.0% |
| 45 to 59 Minutes | 27 | 4.5% |
| 60 to 89 Minutes | 42 | 7.0% |
| 90 or more Minutes | 20 | 3.4% |
Commute Time by Sex in Menard County
The most common commute times in Menard County are 5 to 9 minutes (111 commuters, 32.0%) for males and less than 5 minutes (87 commuters, 34.9%) for females.
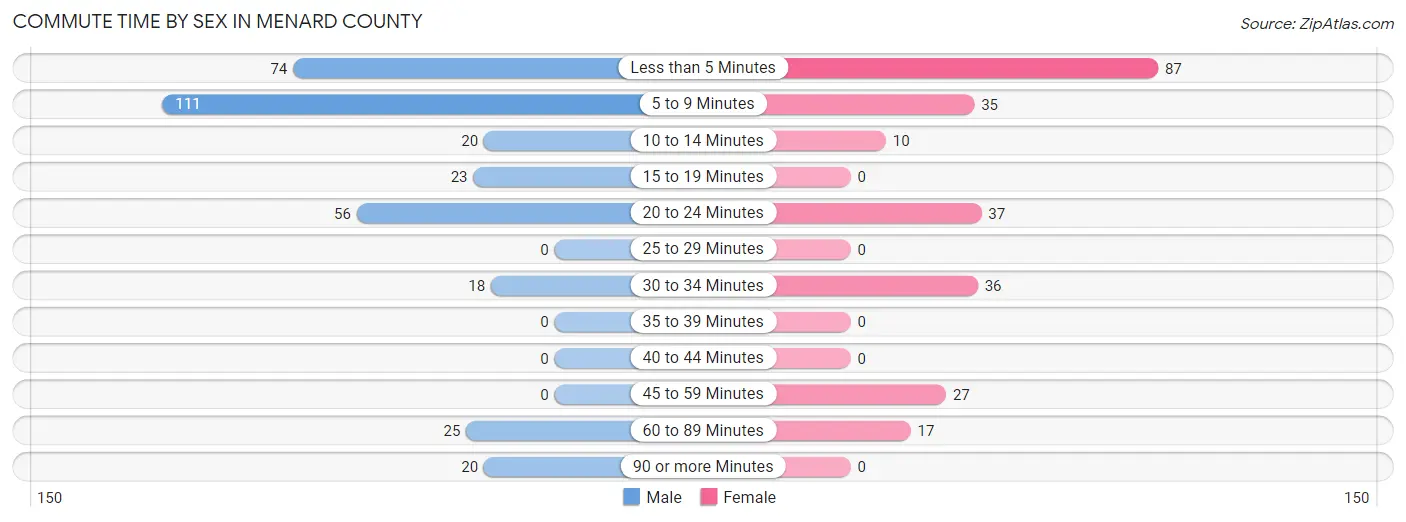
| Commute Time | Male | Female |
| Less than 5 Minutes | 74 (21.3%) | 87 (34.9%) |
| 5 to 9 Minutes | 111 (32.0%) | 35 (14.1%) |
| 10 to 14 Minutes | 20 (5.8%) | 10 (4.0%) |
| 15 to 19 Minutes | 23 (6.6%) | 0 (0.0%) |
| 20 to 24 Minutes | 56 (16.1%) | 37 (14.9%) |
| 25 to 29 Minutes | 0 (0.0%) | 0 (0.0%) |
| 30 to 34 Minutes | 18 (5.2%) | 36 (14.5%) |
| 35 to 39 Minutes | 0 (0.0%) | 0 (0.0%) |
| 40 to 44 Minutes | 0 (0.0%) | 0 (0.0%) |
| 45 to 59 Minutes | 0 (0.0%) | 27 (10.8%) |
| 60 to 89 Minutes | 25 (7.2%) | 17 (6.8%) |
| 90 or more Minutes | 20 (5.8%) | 0 (0.0%) |
Time of Departure to Work by Sex in Menard County
The most frequent times of departure to work in Menard County are 8:00 AM to 8:29 AM (113, 32.6%) for males and 7:30 AM to 7:59 AM (60, 24.1%) for females.
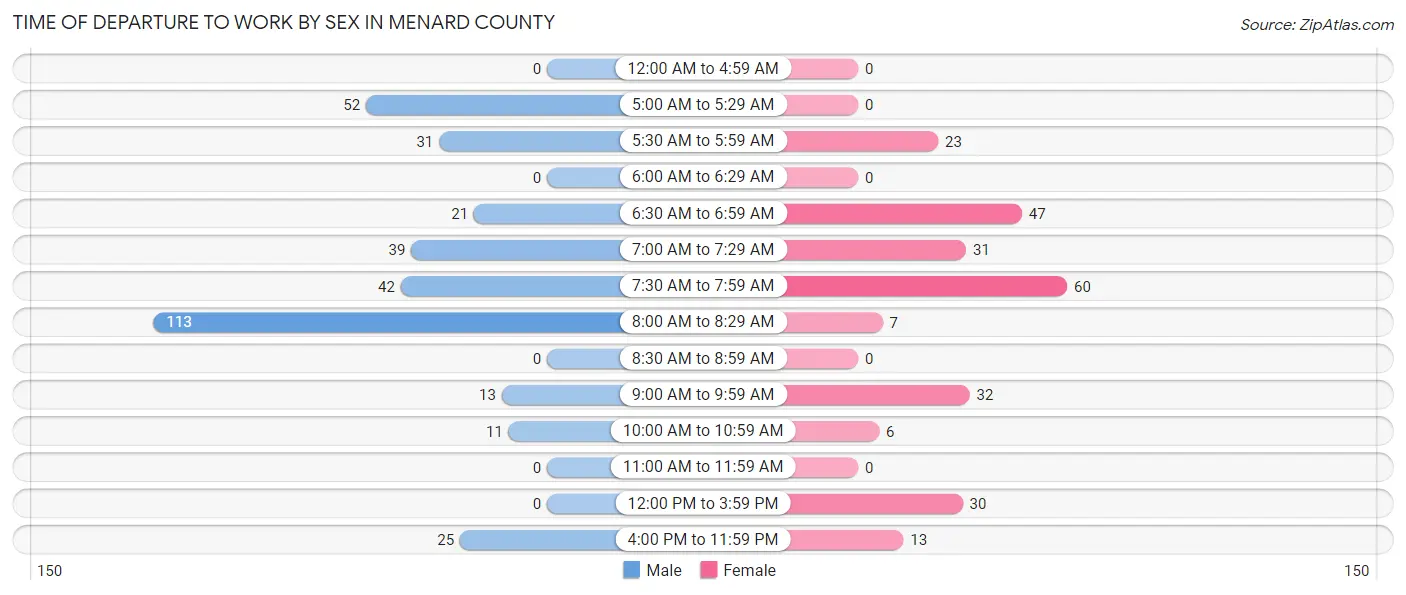
| Time of Departure | Male | Female |
| 12:00 AM to 4:59 AM | 0 (0.0%) | 0 (0.0%) |
| 5:00 AM to 5:29 AM | 52 (15.0%) | 0 (0.0%) |
| 5:30 AM to 5:59 AM | 31 (8.9%) | 23 (9.2%) |
| 6:00 AM to 6:29 AM | 0 (0.0%) | 0 (0.0%) |
| 6:30 AM to 6:59 AM | 21 (6.0%) | 47 (18.9%) |
| 7:00 AM to 7:29 AM | 39 (11.2%) | 31 (12.4%) |
| 7:30 AM to 7:59 AM | 42 (12.1%) | 60 (24.1%) |
| 8:00 AM to 8:29 AM | 113 (32.6%) | 7 (2.8%) |
| 8:30 AM to 8:59 AM | 0 (0.0%) | 0 (0.0%) |
| 9:00 AM to 9:59 AM | 13 (3.7%) | 32 (12.9%) |
| 10:00 AM to 10:59 AM | 11 (3.2%) | 6 (2.4%) |
| 11:00 AM to 11:59 AM | 0 (0.0%) | 0 (0.0%) |
| 12:00 PM to 3:59 PM | 0 (0.0%) | 30 (12.0%) |
| 4:00 PM to 11:59 PM | 25 (7.2%) | 13 (5.2%) |
| Total | 347 (100.0%) | 249 (100.0%) |
Housing Occupancy in Menard County
Occupancy by Ownership in Menard County
Of the total 905 dwellings in Menard County, owner-occupied units account for 683 (75.5%), while renter-occupied units make up 222 (24.5%).
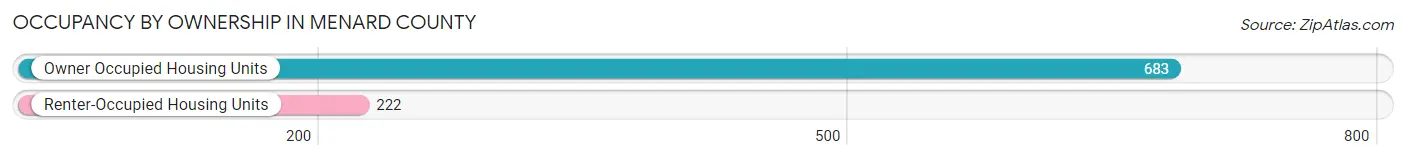
| Occupancy | # Housing Units | % Housing Units |
| Owner Occupied Housing Units | 683 | 75.5% |
| Renter-Occupied Housing Units | 222 | 24.5% |
| Total Occupied Housing Units | 905 | 100.0% |
Occupancy by Household Size in Menard County
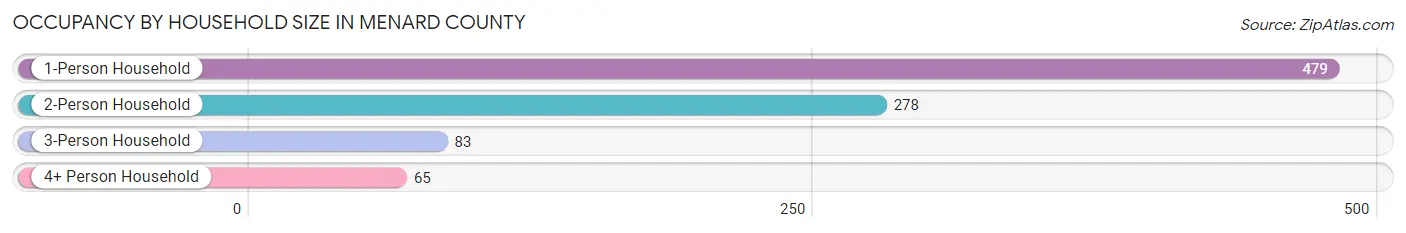
| Household Size | # Housing Units | % Housing Units |
| 1-Person Household | 479 | 52.9% |
| 2-Person Household | 278 | 30.7% |
| 3-Person Household | 83 | 9.2% |
| 4+ Person Household | 65 | 7.2% |
| Total Housing Units | 905 | 100.0% |
Occupancy by Ownership by Household Size in Menard County
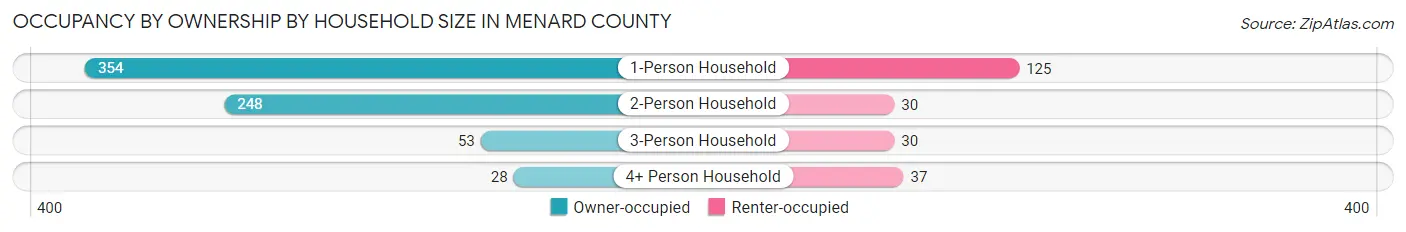
| Household Size | Owner-occupied | Renter-occupied |
| 1-Person Household | 354 (73.9%) | 125 (26.1%) |
| 2-Person Household | 248 (89.2%) | 30 (10.8%) |
| 3-Person Household | 53 (63.9%) | 30 (36.1%) |
| 4+ Person Household | 28 (43.1%) | 37 (56.9%) |
| Total Housing Units | 683 (75.5%) | 222 (24.5%) |
Occupancy by Educational Attainment in Menard County
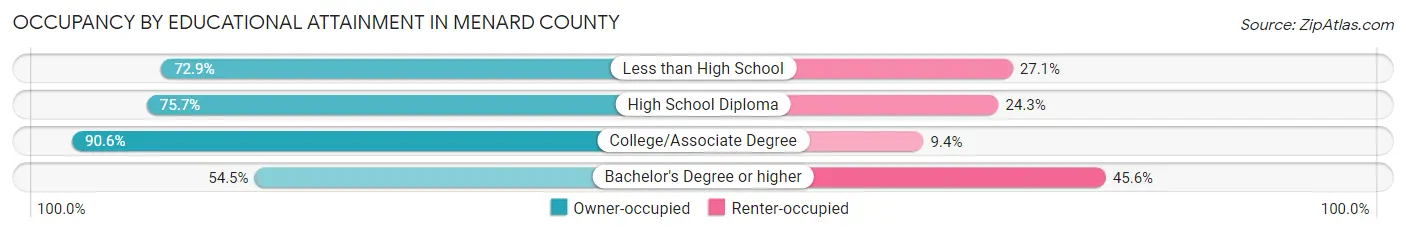
| Household Size | Owner-occupied | Renter-occupied |
| Less than High School | 113 (72.9%) | 42 (27.1%) |
| High School Diploma | 206 (75.7%) | 66 (24.3%) |
| College/Associate Degree | 260 (90.6%) | 27 (9.4%) |
| Bachelor's Degree or higher | 104 (54.4%) | 87 (45.6%) |
Occupancy by Age of Householder in Menard County
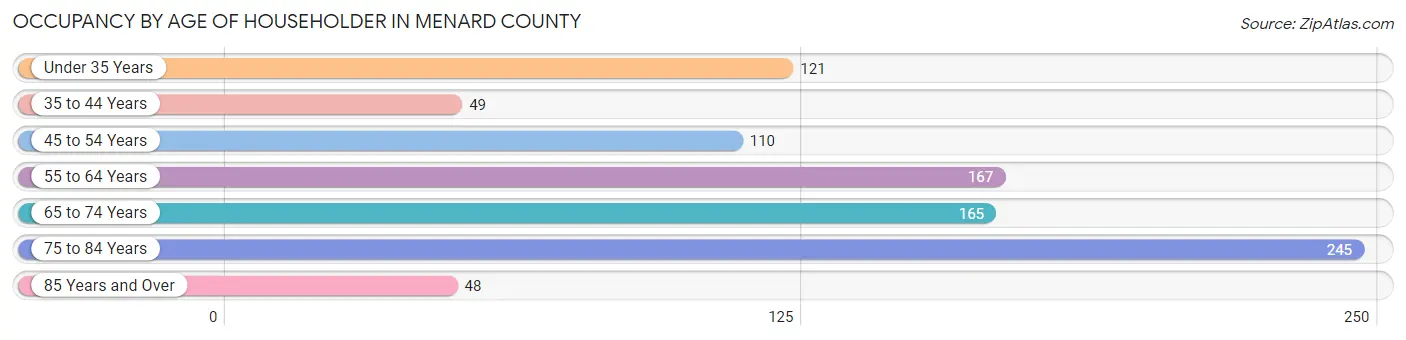
| Age Bracket | # Households | % Households |
| Under 35 Years | 121 | 13.4% |
| 35 to 44 Years | 49 | 5.4% |
| 45 to 54 Years | 110 | 12.1% |
| 55 to 64 Years | 167 | 18.4% |
| 65 to 74 Years | 165 | 18.2% |
| 75 to 84 Years | 245 | 27.1% |
| 85 Years and Over | 48 | 5.3% |
| Total | 905 | 100.0% |
Housing Finances in Menard County
Median Income by Occupancy in Menard County
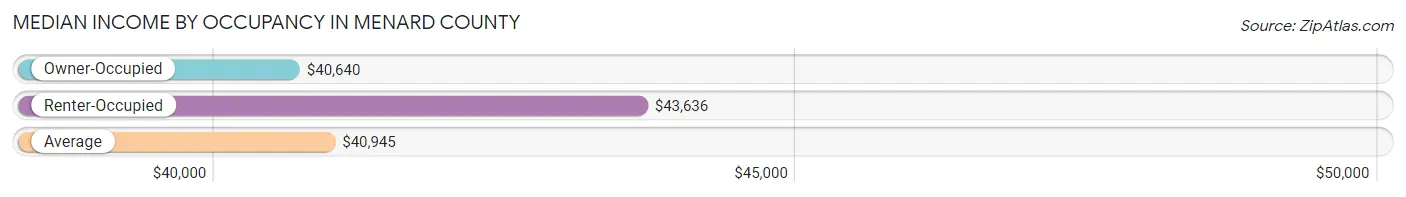
| Occupancy Type | # Households | Median Income |
| Owner-Occupied | 683 (75.5%) | $40,640 |
| Renter-Occupied | 222 (24.5%) | $43,636 |
| Average | 905 (100.0%) | $40,945 |
Occupancy by Householder Income Bracket in Menard County
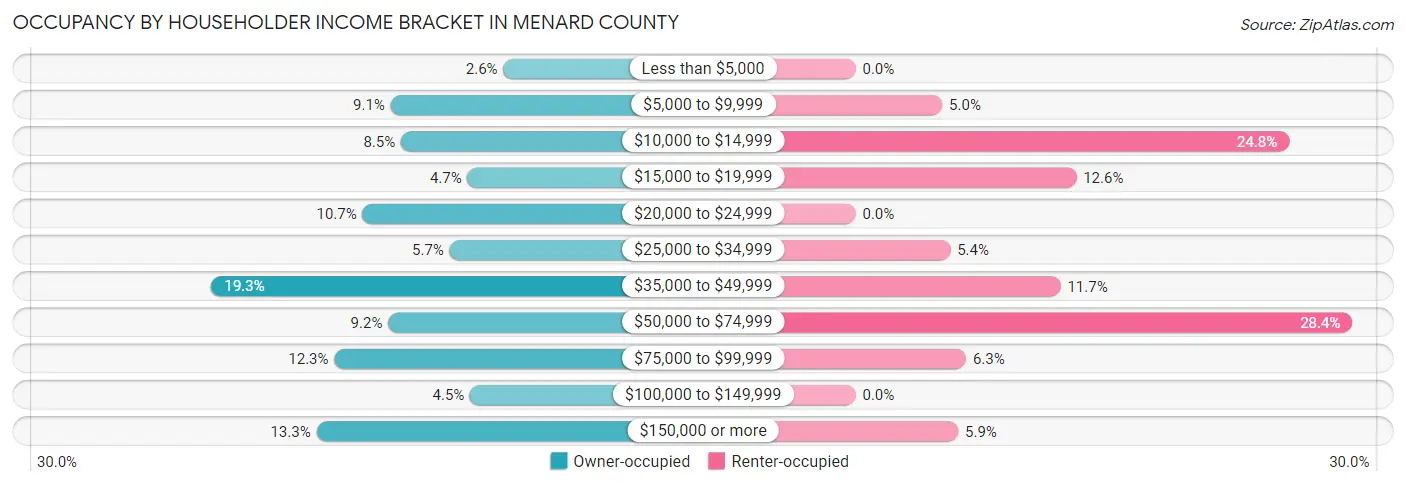
| Income Bracket | Owner-occupied | Renter-occupied |
| Less than $5,000 | 18 (2.6%) | 0 (0.0%) |
| $5,000 to $9,999 | 62 (9.1%) | 11 (5.0%) |
| $10,000 to $14,999 | 58 (8.5%) | 55 (24.8%) |
| $15,000 to $19,999 | 32 (4.7%) | 28 (12.6%) |
| $20,000 to $24,999 | 73 (10.7%) | 0 (0.0%) |
| $25,000 to $34,999 | 39 (5.7%) | 12 (5.4%) |
| $35,000 to $49,999 | 132 (19.3%) | 26 (11.7%) |
| $50,000 to $74,999 | 63 (9.2%) | 63 (28.4%) |
| $75,000 to $99,999 | 84 (12.3%) | 14 (6.3%) |
| $100,000 to $149,999 | 31 (4.5%) | 0 (0.0%) |
| $150,000 or more | 91 (13.3%) | 13 (5.9%) |
| Total | 683 (100.0%) | 222 (100.0%) |
Monthly Housing Cost Tiers in Menard County
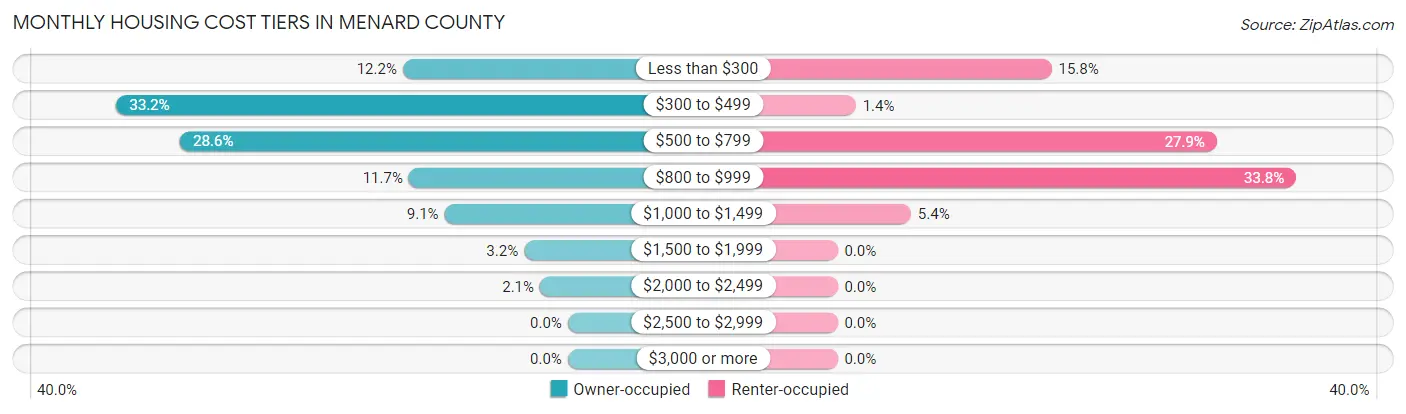
| Monthly Cost | Owner-occupied | Renter-occupied |
| Less than $300 | 83 (12.1%) | 35 (15.8%) |
| $300 to $499 | 227 (33.2%) | 3 (1.3%) |
| $500 to $799 | 195 (28.5%) | 62 (27.9%) |
| $800 to $999 | 80 (11.7%) | 75 (33.8%) |
| $1,000 to $1,499 | 62 (9.1%) | 12 (5.4%) |
| $1,500 to $1,999 | 22 (3.2%) | 0 (0.0%) |
| $2,000 to $2,499 | 14 (2.1%) | 0 (0.0%) |
| $2,500 to $2,999 | 0 (0.0%) | 0 (0.0%) |
| $3,000 or more | 0 (0.0%) | 0 (0.0%) |
| Total | 683 (100.0%) | 222 (100.0%) |
Physical Housing Characteristics in Menard County
Housing Structures in Menard County
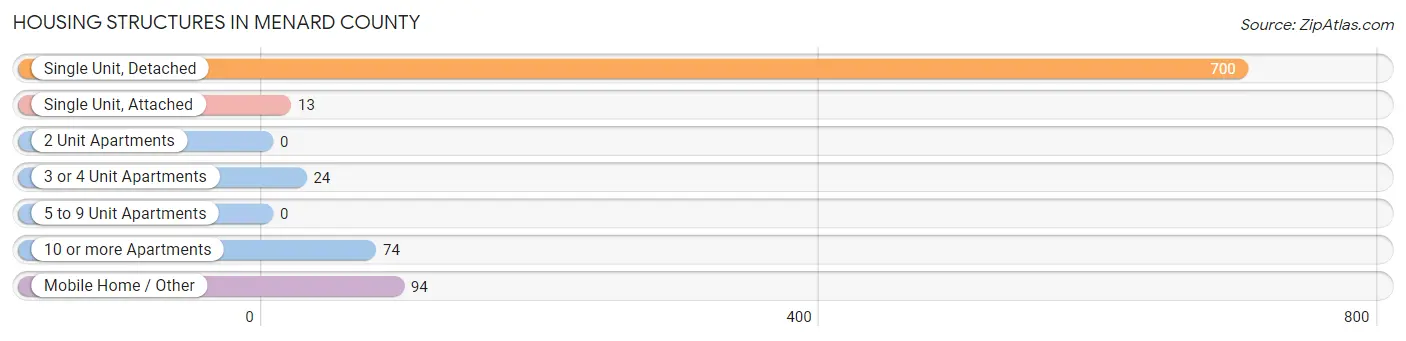
| Structure Type | # Housing Units | % Housing Units |
| Single Unit, Detached | 700 | 77.3% |
| Single Unit, Attached | 13 | 1.4% |
| 2 Unit Apartments | 0 | 0.0% |
| 3 or 4 Unit Apartments | 24 | 2.6% |
| 5 to 9 Unit Apartments | 0 | 0.0% |
| 10 or more Apartments | 74 | 8.2% |
| Mobile Home / Other | 94 | 10.4% |
| Total | 905 | 100.0% |
Housing Structures by Occupancy in Menard County
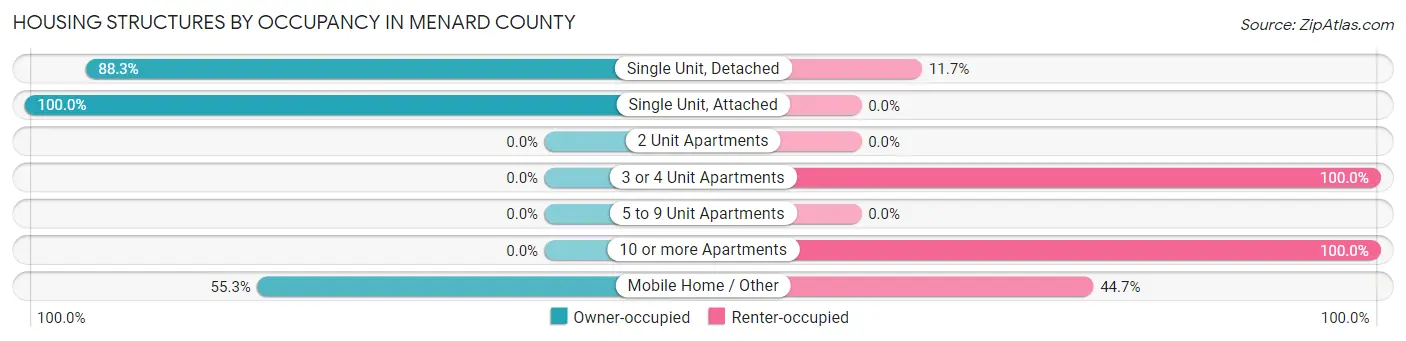
| Structure Type | Owner-occupied | Renter-occupied |
| Single Unit, Detached | 618 (88.3%) | 82 (11.7%) |
| Single Unit, Attached | 13 (100.0%) | 0 (0.0%) |
| 2 Unit Apartments | 0 (0.0%) | 0 (0.0%) |
| 3 or 4 Unit Apartments | 0 (0.0%) | 24 (100.0%) |
| 5 to 9 Unit Apartments | 0 (0.0%) | 0 (0.0%) |
| 10 or more Apartments | 0 (0.0%) | 74 (100.0%) |
| Mobile Home / Other | 52 (55.3%) | 42 (44.7%) |
| Total | 683 (75.5%) | 222 (24.5%) |
Housing Structures by Number of Rooms in Menard County
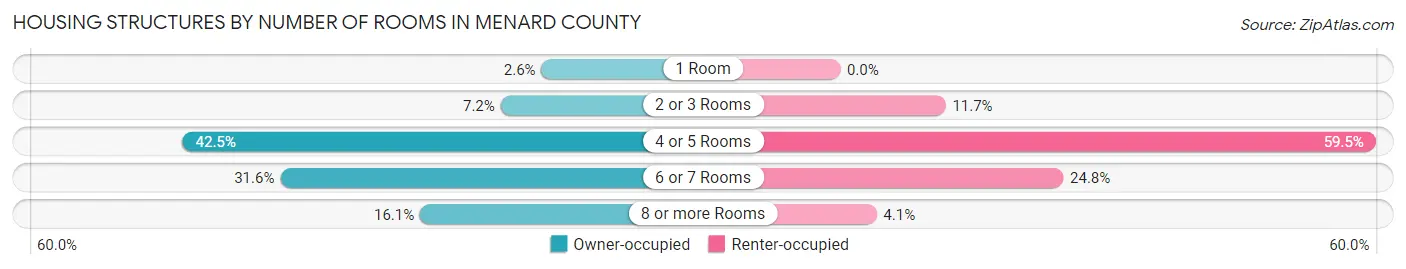
| Number of Rooms | Owner-occupied | Renter-occupied |
| 1 Room | 18 (2.6%) | 0 (0.0%) |
| 2 or 3 Rooms | 49 (7.2%) | 26 (11.7%) |
| 4 or 5 Rooms | 290 (42.5%) | 132 (59.5%) |
| 6 or 7 Rooms | 216 (31.6%) | 55 (24.8%) |
| 8 or more Rooms | 110 (16.1%) | 9 (4.1%) |
| Total | 683 (100.0%) | 222 (100.0%) |
Housing Structure by Heating Type in Menard County
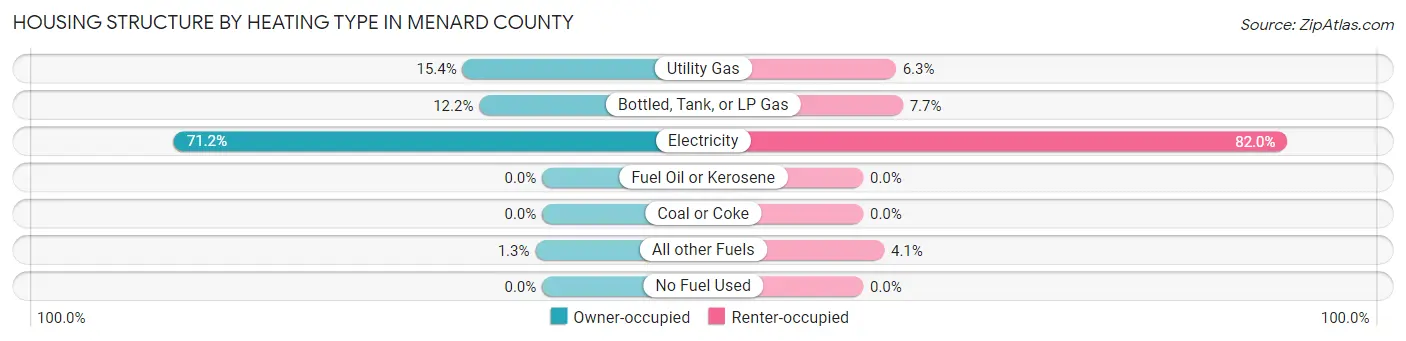
| Heating Type | Owner-occupied | Renter-occupied |
| Utility Gas | 105 (15.4%) | 14 (6.3%) |
| Bottled, Tank, or LP Gas | 83 (12.1%) | 17 (7.7%) |
| Electricity | 486 (71.2%) | 182 (82.0%) |
| Fuel Oil or Kerosene | 0 (0.0%) | 0 (0.0%) |
| Coal or Coke | 0 (0.0%) | 0 (0.0%) |
| All other Fuels | 9 (1.3%) | 9 (4.1%) |
| No Fuel Used | 0 (0.0%) | 0 (0.0%) |
| Total | 683 (100.0%) | 222 (100.0%) |
Household Vehicle Usage in Menard County
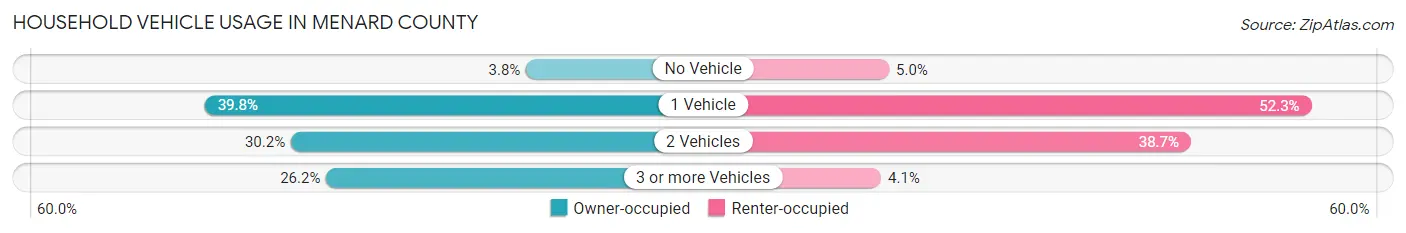
| Vehicles per Household | Owner-occupied | Renter-occupied |
| No Vehicle | 26 (3.8%) | 11 (5.0%) |
| 1 Vehicle | 272 (39.8%) | 116 (52.2%) |
| 2 Vehicles | 206 (30.2%) | 86 (38.7%) |
| 3 or more Vehicles | 179 (26.2%) | 9 (4.1%) |
| Total | 683 (100.0%) | 222 (100.0%) |
Real Estate & Mortgages in Menard County
Real Estate and Mortgage Overview in Menard County
| Characteristic | Without Mortgage | With Mortgage |
| Housing Units | 529 | 154 |
| Median Property Value | $82,800 | $99,100 |
| Median Household Income | $40,042 | $14 |
| Monthly Housing Costs | $449 | $0 |
| Real Estate Taxes | $1,522 | $0 |
Property Value by Mortgage Status in Menard County
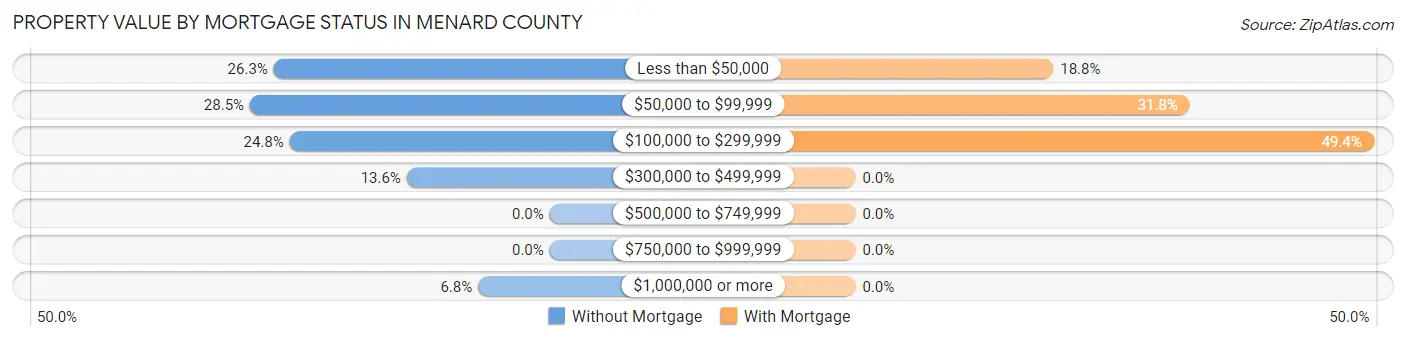
| Property Value | Without Mortgage | With Mortgage |
| Less than $50,000 | 139 (26.3%) | 29 (18.8%) |
| $50,000 to $99,999 | 151 (28.5%) | 49 (31.8%) |
| $100,000 to $299,999 | 131 (24.8%) | 76 (49.3%) |
| $300,000 to $499,999 | 72 (13.6%) | 0 (0.0%) |
| $500,000 to $749,999 | 0 (0.0%) | 0 (0.0%) |
| $750,000 to $999,999 | 0 (0.0%) | 0 (0.0%) |
| $1,000,000 or more | 36 (6.8%) | 0 (0.0%) |
| Total | 529 (100.0%) | 154 (100.0%) |
Household Income by Mortgage Status in Menard County
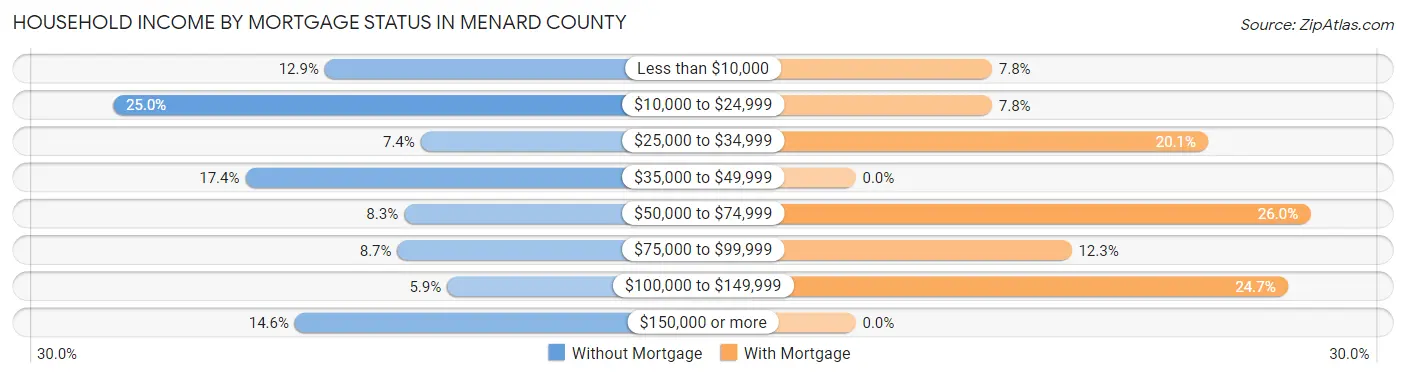
| Household Income | Without Mortgage | With Mortgage |
| Less than $10,000 | 68 (12.9%) | 12 (7.8%) |
| $10,000 to $24,999 | 132 (24.9%) | 12 (7.8%) |
| $25,000 to $34,999 | 39 (7.4%) | 31 (20.1%) |
| $35,000 to $49,999 | 92 (17.4%) | 0 (0.0%) |
| $50,000 to $74,999 | 44 (8.3%) | 40 (26.0%) |
| $75,000 to $99,999 | 46 (8.7%) | 19 (12.3%) |
| $100,000 to $149,999 | 31 (5.9%) | 38 (24.7%) |
| $150,000 or more | 77 (14.6%) | 0 (0.0%) |
| Total | 529 (100.0%) | 154 (100.0%) |
Property Value to Household Income Ratio in Menard County
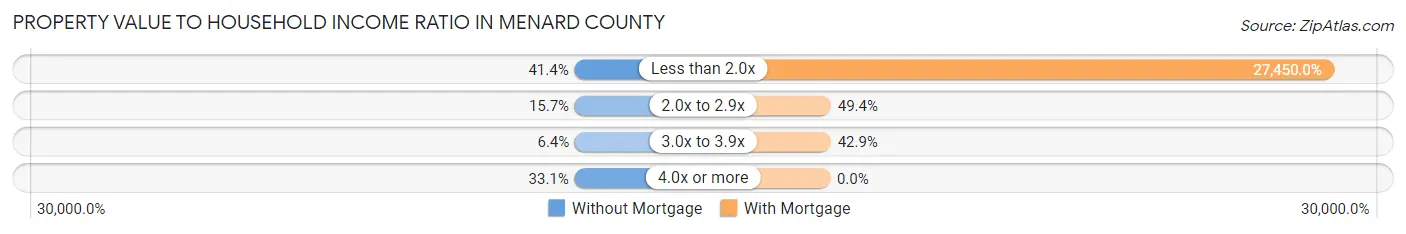
| Value-to-Income Ratio | Without Mortgage | With Mortgage |
| Less than 2.0x | 219 (41.4%) | 42,273 (27,450.0%) |
| 2.0x to 2.9x | 83 (15.7%) | 76 (49.3%) |
| 3.0x to 3.9x | 34 (6.4%) | 66 (42.9%) |
| 4.0x or more | 175 (33.1%) | 0 (0.0%) |
| Total | 529 (100.0%) | 154 (100.0%) |
Real Estate Taxes by Mortgage Status in Menard County
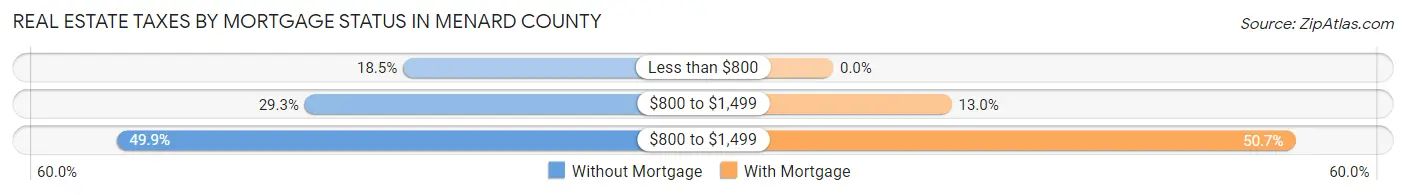
| Property Taxes | Without Mortgage | With Mortgage |
| Less than $800 | 98 (18.5%) | 0 (0.0%) |
| $800 to $1,499 | 155 (29.3%) | 20 (13.0%) |
| $800 to $1,499 | 264 (49.9%) | 78 (50.6%) |
| Total | 529 (100.0%) | 154 (100.0%) |
Health & Disability in Menard County
Health Insurance Coverage by Age in Menard County
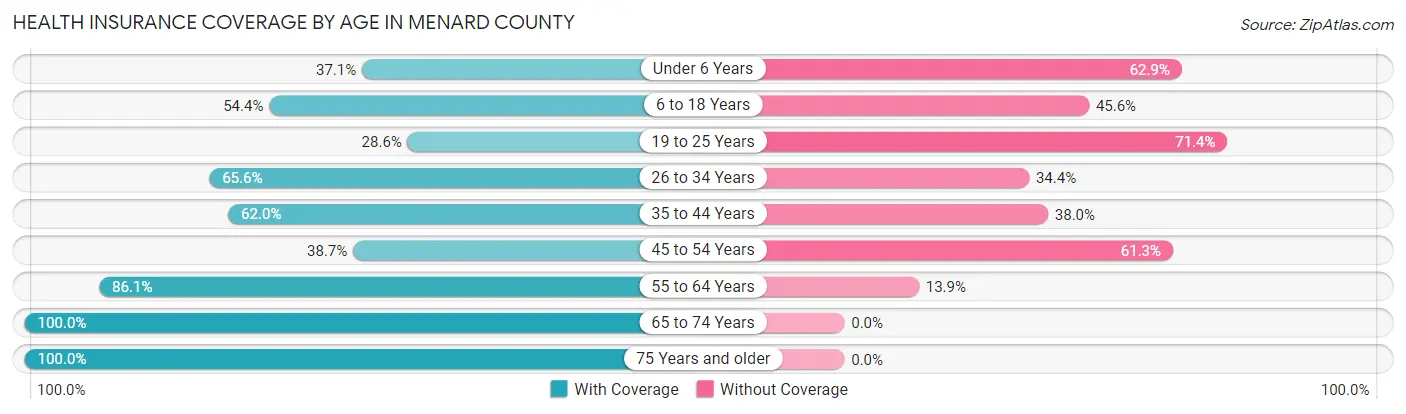
| Age Bracket | With Coverage | Without Coverage |
| Under 6 Years | 33 (37.1%) | 56 (62.9%) |
| 6 to 18 Years | 180 (54.4%) | 151 (45.6%) |
| 19 to 25 Years | 8 (28.6%) | 20 (71.4%) |
| 26 to 34 Years | 99 (65.6%) | 52 (34.4%) |
| 35 to 44 Years | 67 (62.0%) | 41 (38.0%) |
| 45 to 54 Years | 74 (38.7%) | 117 (61.3%) |
| 55 to 64 Years | 310 (86.1%) | 50 (13.9%) |
| 65 to 74 Years | 277 (100.0%) | 0 (0.0%) |
| 75 Years and older | 382 (100.0%) | 0 (0.0%) |
| Total | 1,430 (74.6%) | 487 (25.4%) |
Health Insurance Coverage by Citizenship Status in Menard County
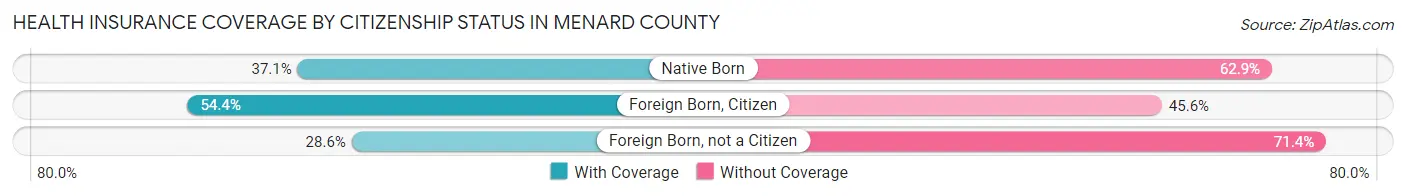
| Citizenship Status | With Coverage | Without Coverage |
| Native Born | 33 (37.1%) | 56 (62.9%) |
| Foreign Born, Citizen | 180 (54.4%) | 151 (45.6%) |
| Foreign Born, not a Citizen | 8 (28.6%) | 20 (71.4%) |
Health Insurance Coverage by Household Income in Menard County
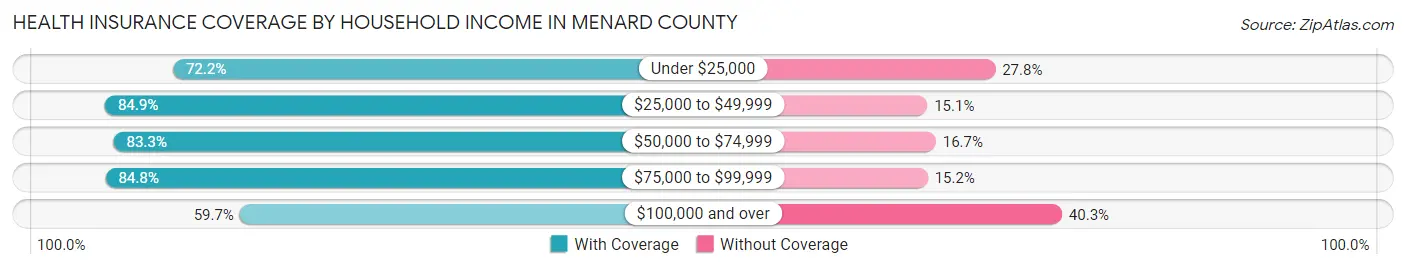
| Household Income | With Coverage | Without Coverage |
| Under $25,000 | 327 (72.2%) | 126 (27.8%) |
| $25,000 to $49,999 | 355 (84.9%) | 63 (15.1%) |
| $50,000 to $74,999 | 190 (83.3%) | 38 (16.7%) |
| $75,000 to $99,999 | 235 (84.8%) | 42 (15.2%) |
| $100,000 and over | 323 (59.7%) | 218 (40.3%) |
Public vs Private Health Insurance Coverage by Age in Menard County
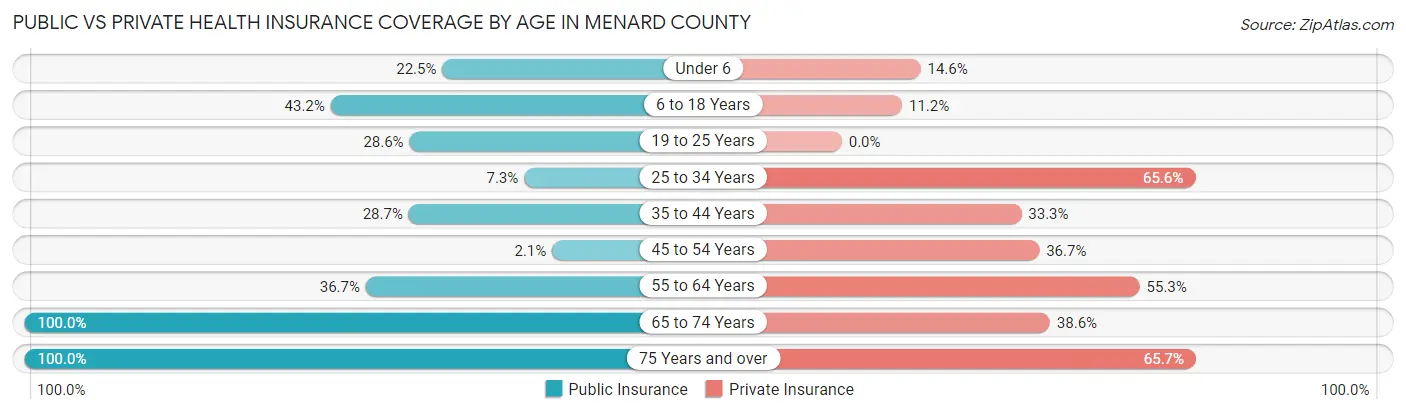
| Age Bracket | Public Insurance | Private Insurance |
| Under 6 | 20 (22.5%) | 13 (14.6%) |
| 6 to 18 Years | 143 (43.2%) | 37 (11.2%) |
| 19 to 25 Years | 8 (28.6%) | 0 (0.0%) |
| 25 to 34 Years | 11 (7.3%) | 99 (65.6%) |
| 35 to 44 Years | 31 (28.7%) | 36 (33.3%) |
| 45 to 54 Years | 4 (2.1%) | 70 (36.6%) |
| 55 to 64 Years | 132 (36.7%) | 199 (55.3%) |
| 65 to 74 Years | 277 (100.0%) | 107 (38.6%) |
| 75 Years and over | 382 (100.0%) | 251 (65.7%) |
| Total | 1,008 (52.6%) | 812 (42.4%) |
Disability Status by Sex by Age in Menard County
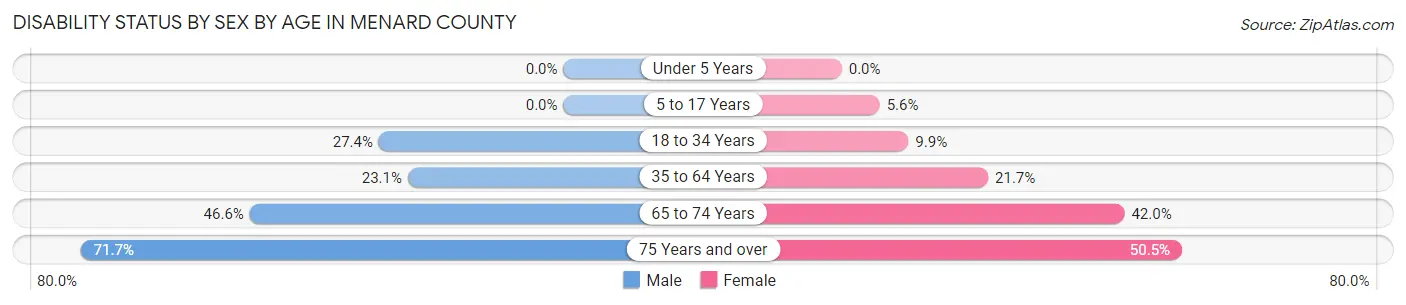
| Age Bracket | Male | Female |
| Under 5 Years | 0 (0.0%) | 0 (0.0%) |
| 5 to 17 Years | 0 (0.0%) | 8 (5.6%) |
| 18 to 34 Years | 37 (27.4%) | 9 (9.9%) |
| 35 to 64 Years | 64 (23.1%) | 83 (21.7%) |
| 65 to 74 Years | 68 (46.6%) | 55 (42.0%) |
| 75 Years and over | 129 (71.7%) | 102 (50.5%) |
Disability Class by Sex by Age in Menard County
Disability Class: Hearing Difficulty
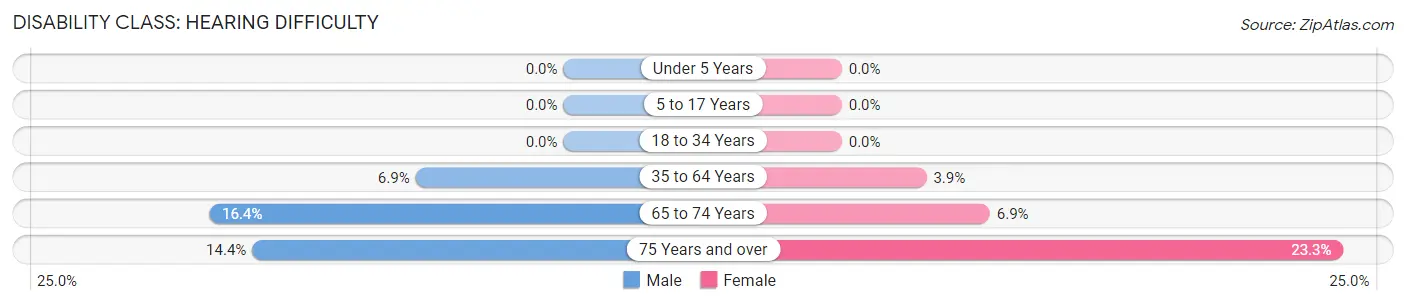
| Age Bracket | Male | Female |
| Under 5 Years | 0 (0.0%) | 0 (0.0%) |
| 5 to 17 Years | 0 (0.0%) | 0 (0.0%) |
| 18 to 34 Years | 0 (0.0%) | 0 (0.0%) |
| 35 to 64 Years | 19 (6.9%) | 15 (3.9%) |
| 65 to 74 Years | 24 (16.4%) | 9 (6.9%) |
| 75 Years and over | 26 (14.4%) | 47 (23.3%) |
Disability Class: Vision Difficulty
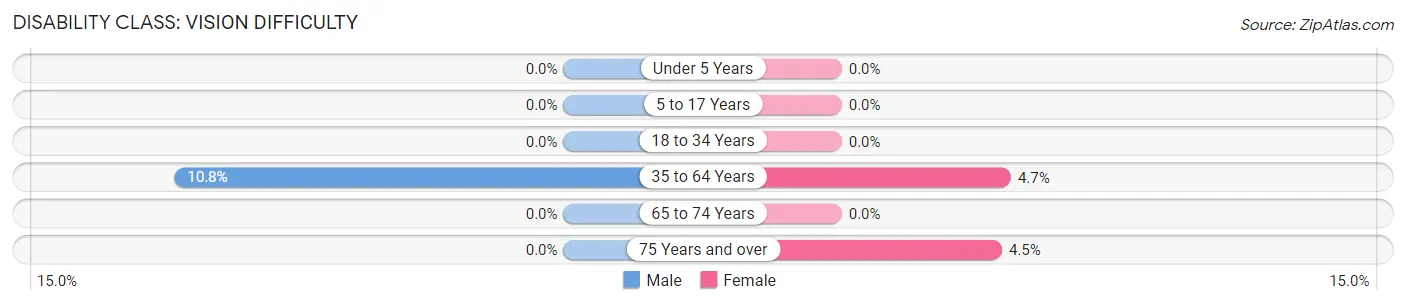
| Age Bracket | Male | Female |
| Under 5 Years | 0 (0.0%) | 0 (0.0%) |
| 5 to 17 Years | 0 (0.0%) | 0 (0.0%) |
| 18 to 34 Years | 0 (0.0%) | 0 (0.0%) |
| 35 to 64 Years | 30 (10.8%) | 18 (4.7%) |
| 65 to 74 Years | 0 (0.0%) | 0 (0.0%) |
| 75 Years and over | 0 (0.0%) | 9 (4.5%) |
Disability Class: Cognitive Difficulty
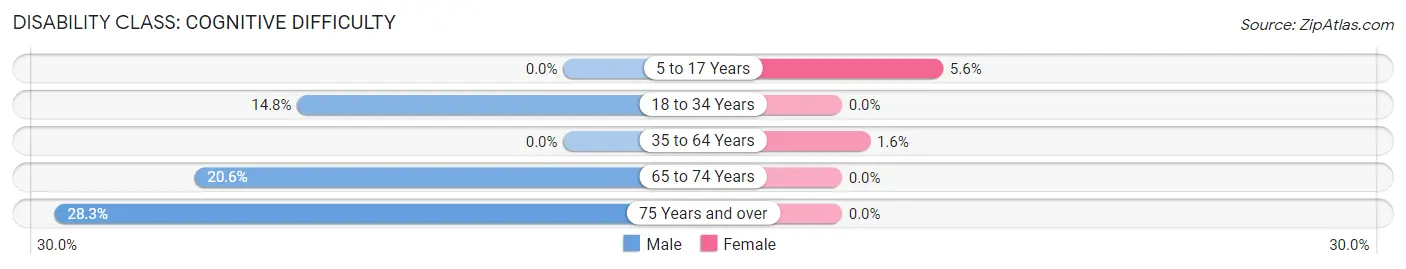
| Age Bracket | Male | Female |
| 5 to 17 Years | 0 (0.0%) | 8 (5.6%) |
| 18 to 34 Years | 20 (14.8%) | 0 (0.0%) |
| 35 to 64 Years | 0 (0.0%) | 6 (1.6%) |
| 65 to 74 Years | 30 (20.5%) | 0 (0.0%) |
| 75 Years and over | 51 (28.3%) | 0 (0.0%) |
Disability Class: Ambulatory Difficulty
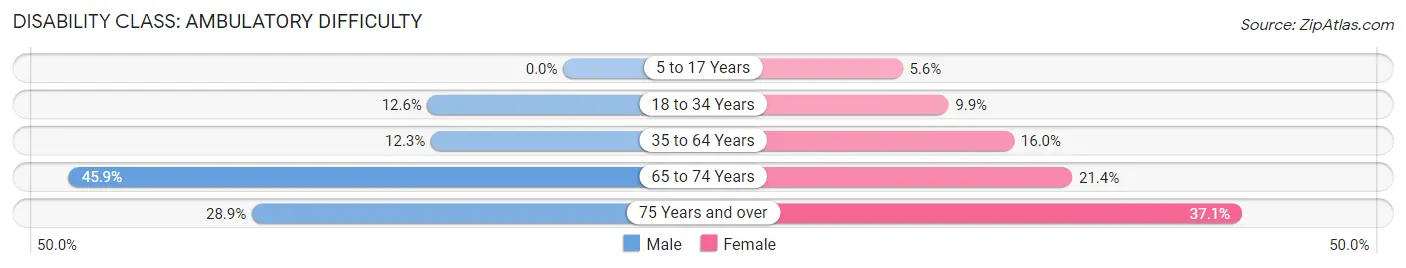
| Age Bracket | Male | Female |
| 5 to 17 Years | 0 (0.0%) | 8 (5.6%) |
| 18 to 34 Years | 17 (12.6%) | 9 (9.9%) |
| 35 to 64 Years | 34 (12.3%) | 61 (16.0%) |
| 65 to 74 Years | 67 (45.9%) | 28 (21.4%) |
| 75 Years and over | 52 (28.9%) | 75 (37.1%) |
Disability Class: Self-Care Difficulty
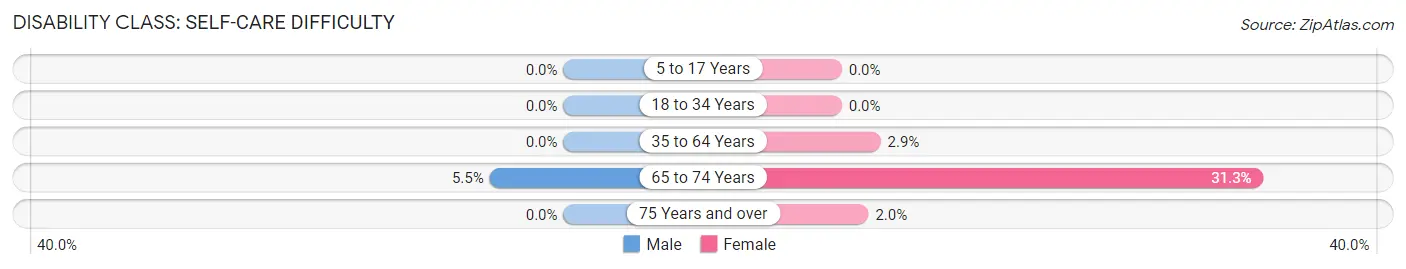
| Age Bracket | Male | Female |
| 5 to 17 Years | 0 (0.0%) | 0 (0.0%) |
| 18 to 34 Years | 0 (0.0%) | 0 (0.0%) |
| 35 to 64 Years | 0 (0.0%) | 11 (2.9%) |
| 65 to 74 Years | 8 (5.5%) | 41 (31.3%) |
| 75 Years and over | 0 (0.0%) | 4 (2.0%) |
Technology Access in Menard County
Computing Device Access in Menard County
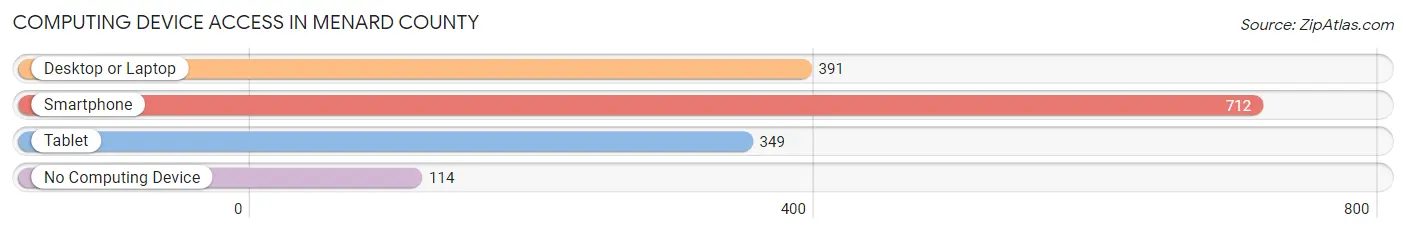
| Device Type | # Households | % Households |
| Desktop or Laptop | 391 | 43.2% |
| Smartphone | 712 | 78.7% |
| Tablet | 349 | 38.6% |
| No Computing Device | 114 | 12.6% |
| Total | 905 | 100.0% |
Internet Access in Menard County
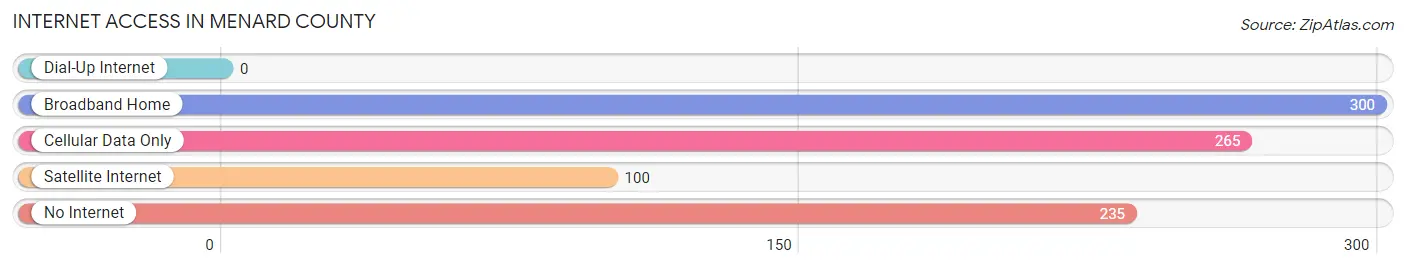
| Internet Type | # Households | % Households |
| Dial-Up Internet | 0 | 0.0% |
| Broadband Home | 300 | 33.2% |
| Cellular Data Only | 265 | 29.3% |
| Satellite Internet | 100 | 11.1% |
| No Internet | 235 | 26.0% |
| Total | 905 | 100.0% |
Menard County Summary
Menard County is located in the heart of Texas, in the Edwards Plateau region of the state. It is bordered by Mason County to the north, Kimble County to the east, Sutton County to the south, and Schleicher County to the west. The county seat is Menard, and the county is named for Michel Branamour Menard, the founder of Galveston.
Geography
Menard County covers an area of 919 square miles, with a population of 2,072 people as of the 2010 census. The terrain is mostly flat, with some rolling hills in the western part of the county. The San Saba River runs through the county, and there are several creeks and streams. The county is mostly covered in grassland, with some areas of oak and juniper trees.
Economy
The economy of Menard County is largely based on agriculture and ranching. The county is home to several large ranches, including the historic Fort McKavett Ranch. Cattle, sheep, and goats are the main livestock raised in the county. Other agricultural products include hay, wheat, oats, and corn.
The county also has a small manufacturing sector, with several small businesses producing furniture, clothing, and other goods. There is also a small tourism industry, with visitors coming to the county to hunt, fish, and explore the area's natural beauty.
Demographics
As of the 2010 census, Menard County had a population of 2,072 people. The racial makeup of the county was 94.3% White, 0.3% African American, 0.3% Native American, 0.2% Asian, 0.1% Pacific Islander, 3.3% from other races, and 1.4% from two or more races. Hispanic or Latino of any race were 8.2% of the population.
The median income for a household in the county was $31,250, and the median income for a family was $37,500. The per capita income for the county was $17,845. About 16.2% of families and 19.2% of the population were below the poverty line, including 25.2% of those under age 18 and 14.2% of those age 65 or over.
Conclusion
Menard County is a rural county in the heart of Texas, with a population of just over 2,000 people. The economy is largely based on agriculture and ranching, with some small manufacturing and tourism industries. The population is mostly white, with a small percentage of other races and ethnicities. The median income for a household is slightly below the state average, and the poverty rate is higher than the state average.
Common Questions
What is Per Capita Income in Menard County?
Per Capita income in Menard County is $31,983.
What is the Median Family Income in Menard County?
Median Family Income in Menard County is $80,588.
What is the Median Household income in Menard County?
Median Household Income in Menard County is $40,945.
What is Income or Wage Gap in Menard County?
Income or Wage Gap in Menard County is 40.0%.
Women in Menard County earn 60.0 cents for every dollar earned by a man.
What is Inequality or Gini Index in Menard County?
Inequality or Gini Index in Menard County is 0.52.
What is the Total Population of Menard County?
Total Population of Menard County is 1,964.
What is the Total Male Population of Menard County?
Total Male Population of Menard County is 986.
What is the Total Female Population of Menard County?
Total Female Population of Menard County is 978.
What is the Ratio of Males per 100 Females in Menard County?
There are 100.82 Males per 100 Females in Menard County.
What is the Ratio of Females per 100 Males in Menard County?
There are 99.19 Females per 100 Males in Menard County.
What is the Median Population Age in Menard County?
Median Population Age in Menard County is 59.4 Years.
What is the Average Family Size in Menard County
Average Family Size in Menard County is 3.2 People.
What is the Average Household Size in Menard County
Average Household Size in Menard County is 2.1 People.
How Large is the Labor Force in Menard County?
There are 861 People in the Labor Forcein in Menard County.
What is the Percentage of People in the Labor Force in Menard County?
52.3% of People are in the Labor Force in Menard County.
What is the Unemployment Rate in Menard County?
Unemployment Rate in Menard County is 14.3%.