Medina County, TX Map & Demographics
Medina County Map
Medina County Overview
$31,516
PER CAPITA INCOME
$88,954
AVG FAMILY INCOME
$73,060
AVG HOUSEHOLD INCOME
28.5%
WAGE / INCOME GAP [ % ]
71.5¢/ $1
WAGE / INCOME GAP [ $ ]
$12,563
FAMILY INCOME DEFICIT
0.42
INEQUALITY / GINI INDEX
51,432
TOTAL POPULATION
26,705
MALE POPULATION
24,727
FEMALE POPULATION
108.00
MALES / 100 FEMALES
92.59
FEMALES / 100 MALES
39.4
MEDIAN AGE
3.3
AVG FAMILY SIZE
2.8
AVG HOUSEHOLD SIZE
22,926
LABOR FORCE [ PEOPLE ]
55.8%
PERCENT IN LABOR FORCE
2.4%
UNEMPLOYMENT RATE
Medina County Area Codes
Income in Medina County
Income Overview in Medina County
Per Capita Income in Medina County is $31,516, while median incomes of families and households are $88,954 and $73,060 respectively.
| Characteristic | Number | Measure |
| Per Capita Income | 51,432 | $31,516 |
| Median Family Income | 13,206 | $88,954 |
| Mean Family Income | 13,206 | $104,639 |
| Median Household Income | 17,296 | $73,060 |
| Mean Household Income | 17,296 | $91,847 |
| Income Deficit | 13,206 | $12,563 |
| Wage / Income Gap (%) | 51,432 | 28.46% |
| Wage / Income Gap ($) | 51,432 | 71.54¢ per $1 |
| Gini / Inequality Index | 51,432 | 0.42 |
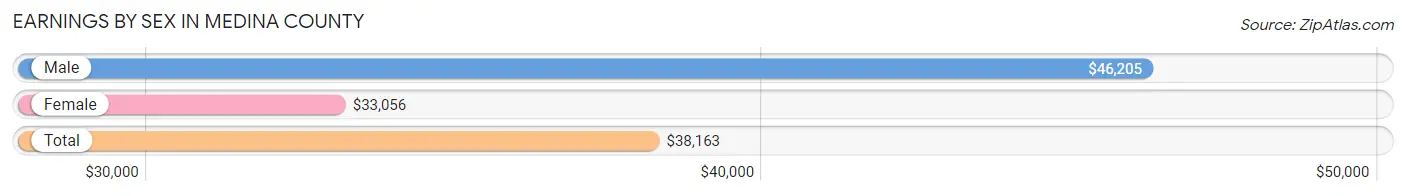
Earnings by Sex in Medina County
Average Earnings in Medina County are $38,163, $46,205 for men and $33,056 for women, a difference of 28.5%.
| Sex | Number | Average Earnings |
| Male | 12,961 (54.0%) | $46,205 |
| Female | 11,056 (46.0%) | $33,056 |
| Total | 24,017 (100.0%) | $38,163 |
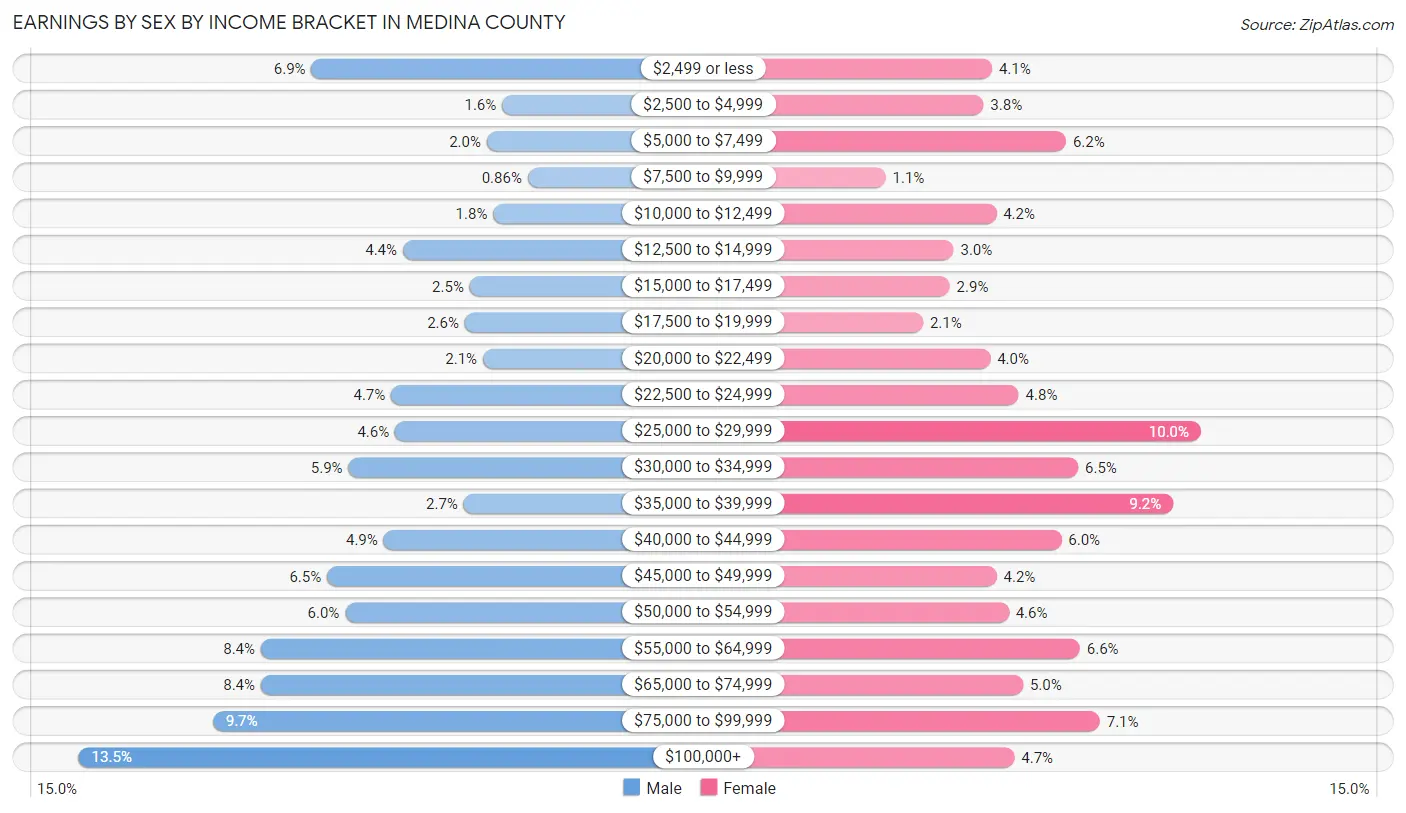
Earnings by Sex by Income Bracket in Medina County
The most common earnings brackets in Medina County are $100,000+ for men (1,747 | 13.5%) and $25,000 to $29,999 for women (1,100 | 10.0%).
| Income | Male | Female |
| $2,499 or less | 899 (6.9%) | 451 (4.1%) |
| $2,500 to $4,999 | 205 (1.6%) | 425 (3.8%) |
| $5,000 to $7,499 | 260 (2.0%) | 681 (6.2%) |
| $7,500 to $9,999 | 112 (0.9%) | 121 (1.1%) |
| $10,000 to $12,499 | 237 (1.8%) | 464 (4.2%) |
| $12,500 to $14,999 | 567 (4.4%) | 332 (3.0%) |
| $15,000 to $17,499 | 323 (2.5%) | 319 (2.9%) |
| $17,500 to $19,999 | 341 (2.6%) | 237 (2.1%) |
| $20,000 to $22,499 | 275 (2.1%) | 446 (4.0%) |
| $22,500 to $24,999 | 609 (4.7%) | 534 (4.8%) |
| $25,000 to $29,999 | 595 (4.6%) | 1,100 (10.0%) |
| $30,000 to $34,999 | 765 (5.9%) | 719 (6.5%) |
| $35,000 to $39,999 | 345 (2.7%) | 1,014 (9.2%) |
| $40,000 to $44,999 | 637 (4.9%) | 667 (6.0%) |
| $45,000 to $49,999 | 842 (6.5%) | 465 (4.2%) |
| $50,000 to $54,999 | 776 (6.0%) | 503 (4.5%) |
| $55,000 to $64,999 | 1,083 (8.4%) | 724 (6.6%) |
| $65,000 to $74,999 | 1,084 (8.4%) | 547 (5.0%) |
| $75,000 to $99,999 | 1,259 (9.7%) | 786 (7.1%) |
| $100,000+ | 1,747 (13.5%) | 521 (4.7%) |
| Total | 12,961 (100.0%) | 11,056 (100.0%) |
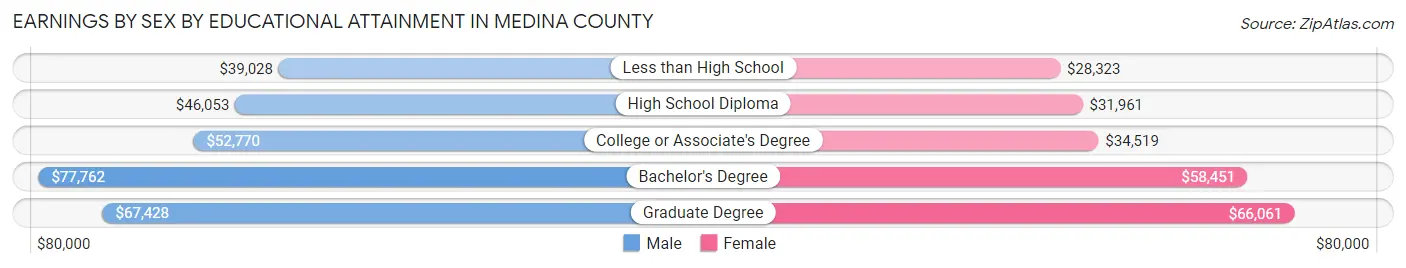
Earnings by Sex by Educational Attainment in Medina County
Average earnings in Medina County are $50,505 for men and $36,599 for women, a difference of 27.5%. Men with an educational attainment of bachelor's degree enjoy the highest average annual earnings of $77,762, while those with less than high school education earn the least with $39,028. Women with an educational attainment of graduate degree earn the most with the average annual earnings of $66,061, while those with less than high school education have the smallest earnings of $28,323.
| Educational Attainment | Male Income | Female Income |
| Less than High School | $39,028 | $28,323 |
| High School Diploma | $46,053 | $31,961 |
| College or Associate's Degree | $52,770 | $34,519 |
| Bachelor's Degree | $77,762 | $58,451 |
| Graduate Degree | $67,428 | $66,061 |
| Total | $50,505 | $36,599 |
Family Income in Medina County
Family Income Brackets in Medina County
According to the Medina County family income data, there are 3,249 families falling into the $100,000 to $149,999 income range, which is the most common income bracket and makes up 24.6% of all families. Conversely, the $10,000 to $14,999 income bracket is the least frequent group with only 238 families (1.8%) belonging to this category.
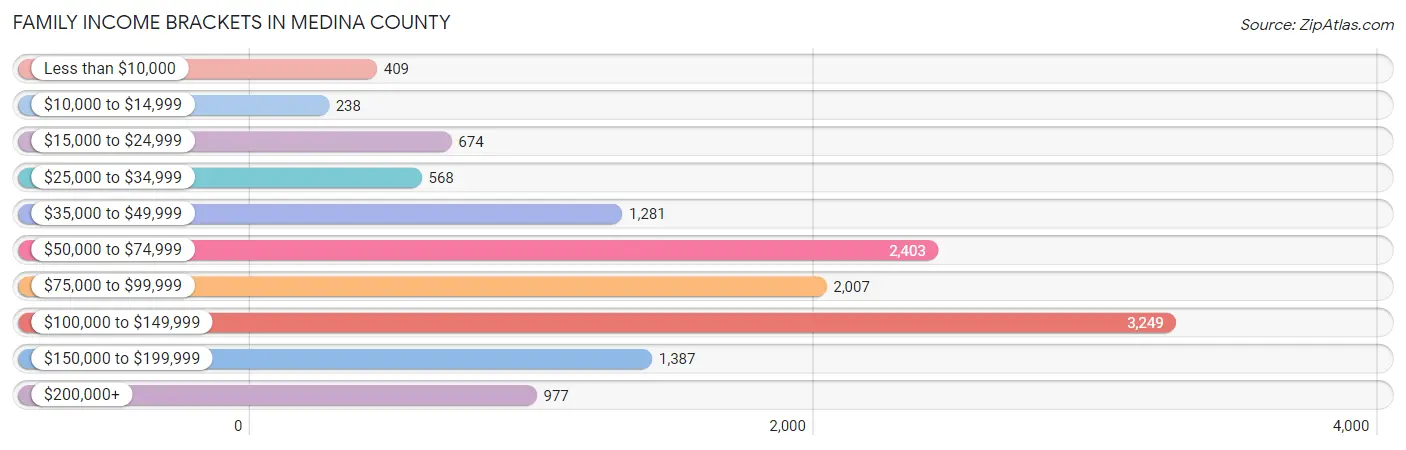
| Income Bracket | # Families | % Families |
| Less than $10,000 | 409 | 3.1% |
| $10,000 to $14,999 | 238 | 1.8% |
| $15,000 to $24,999 | 674 | 5.1% |
| $25,000 to $34,999 | 568 | 4.3% |
| $35,000 to $49,999 | 1,281 | 9.7% |
| $50,000 to $74,999 | 2,403 | 18.2% |
| $75,000 to $99,999 | 2,007 | 15.2% |
| $100,000 to $149,999 | 3,249 | 24.6% |
| $150,000 to $199,999 | 1,387 | 10.5% |
| $200,000+ | 977 | 7.4% |
Family Income by Famaliy Size in Medina County
6-person families (498 | 3.8%) account for the highest median family income in Medina County with $111,769 per family, while 2-person families (6,122 | 46.4%) have the highest median income of $37,726 per family member.
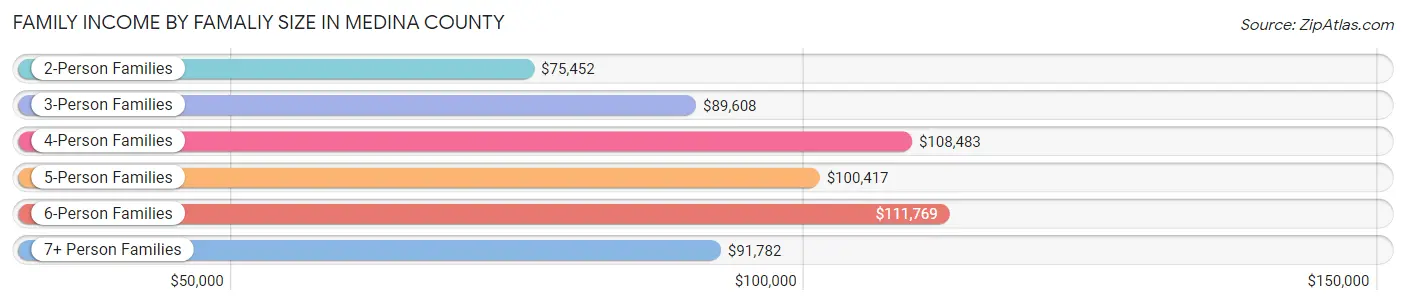
| Income Bracket | # Families | Median Income |
| 2-Person Families | 6,122 (46.4%) | $75,452 |
| 3-Person Families | 2,958 (22.4%) | $89,608 |
| 4-Person Families | 2,110 (16.0%) | $108,483 |
| 5-Person Families | 1,274 (9.7%) | $100,417 |
| 6-Person Families | 498 (3.8%) | $111,769 |
| 7+ Person Families | 244 (1.8%) | $91,782 |
| Total | 13,206 (100.0%) | $88,954 |
Family Income by Number of Earners in Medina County
The median family income in Medina County is $88,954, with families comprising 3+ earners (1,537) having the highest median family income of $141,074, while families with no earners (2,582) have the lowest median family income of $56,042, accounting for 11.6% and 19.6% of families, respectively.
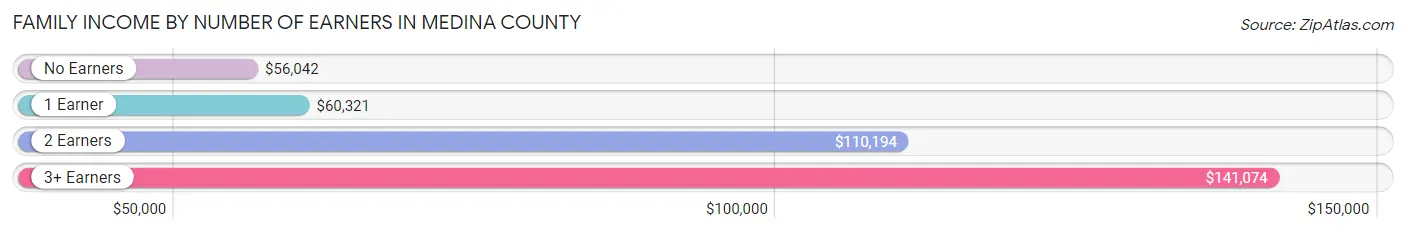
| Number of Earners | # Families | Median Income |
| No Earners | 2,582 (19.6%) | $56,042 |
| 1 Earner | 3,666 (27.8%) | $60,321 |
| 2 Earners | 5,421 (41.0%) | $110,194 |
| 3+ Earners | 1,537 (11.6%) | $141,074 |
| Total | 13,206 (100.0%) | $88,954 |
Household Income in Medina County
Household Income Brackets in Medina County
With 3,771 households falling in the category, the $50,000 to $74,999 income range is the most frequent in Medina County, accounting for 21.8% of all households. In contrast, only 623 households (3.6%) fall into the $10,000 to $14,999 income bracket, making it the least populous group.
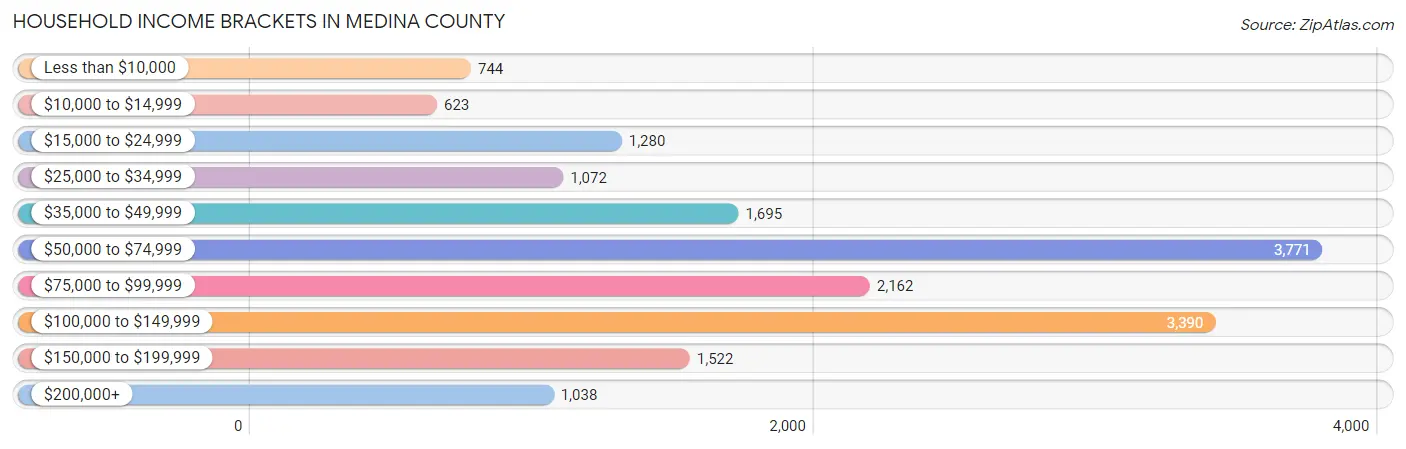
| Income Bracket | # Households | % Households |
| Less than $10,000 | 744 | 4.3% |
| $10,000 to $14,999 | 623 | 3.6% |
| $15,000 to $24,999 | 1,280 | 7.4% |
| $25,000 to $34,999 | 1,072 | 6.2% |
| $35,000 to $49,999 | 1,695 | 9.8% |
| $50,000 to $74,999 | 3,771 | 21.8% |
| $75,000 to $99,999 | 2,162 | 12.5% |
| $100,000 to $149,999 | 3,390 | 19.6% |
| $150,000 to $199,999 | 1,522 | 8.8% |
| $200,000+ | 1,038 | 6.0% |
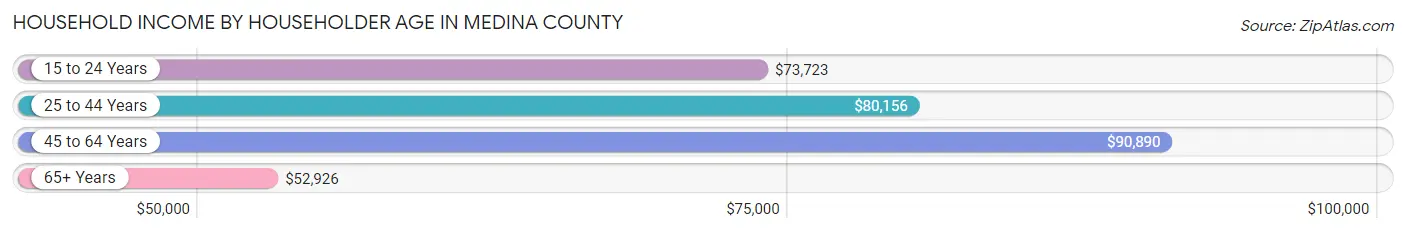
Household Income by Householder Age in Medina County
The median household income in Medina County is $73,060, with the highest median household income of $90,890 found in the 45 to 64 years age bracket for the primary householder. A total of 7,002 households (40.5%) fall into this category. Meanwhile, the 65+ years age bracket for the primary householder has the lowest median household income of $52,926, with 5,332 households (30.8%) in this group.
| Income Bracket | # Households | Median Income |
| 15 to 24 Years | 373 (2.2%) | $73,723 |
| 25 to 44 Years | 4,589 (26.5%) | $80,156 |
| 45 to 64 Years | 7,002 (40.5%) | $90,890 |
| 65+ Years | 5,332 (30.8%) | $52,926 |
| Total | 17,296 (100.0%) | $73,060 |
Poverty in Medina County
Income Below Poverty by Sex and Age in Medina County
With 9.7% poverty level for males and 10.8% for females among the residents of Medina County, 5 year old males and 12 to 14 year old females are the most vulnerable to poverty, with 88 males (38.1%) and 247 females (22.8%) in their respective age groups living below the poverty level.
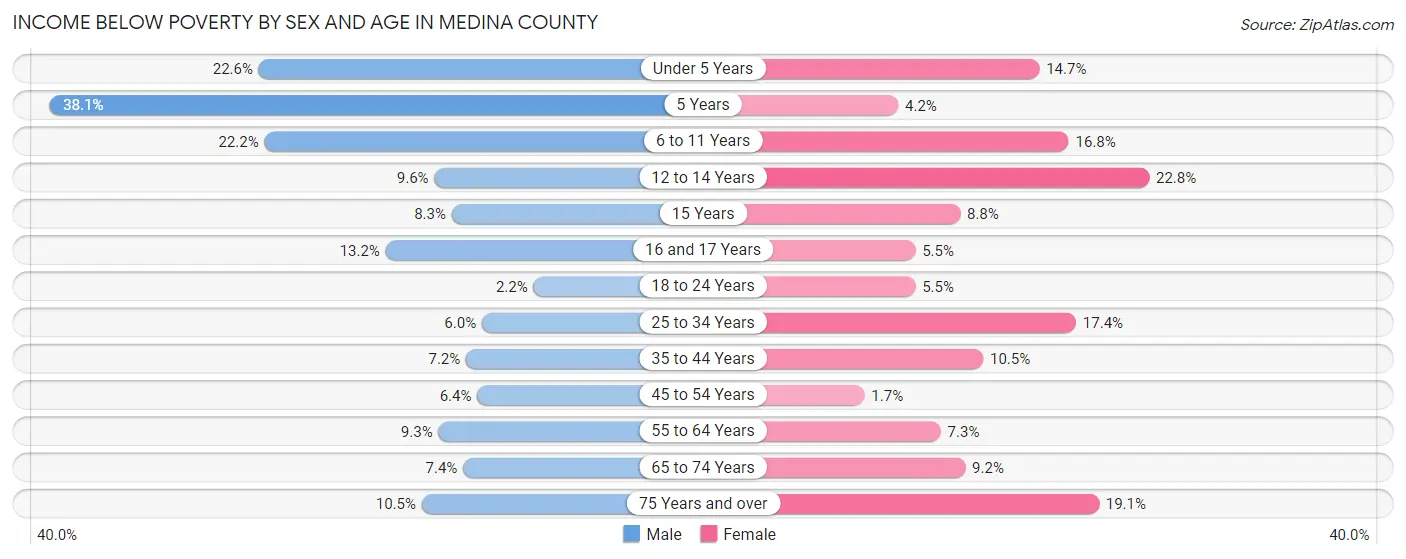
| Age Bracket | Male | Female |
| Under 5 Years | 331 (22.6%) | 209 (14.7%) |
| 5 Years | 88 (38.1%) | 14 (4.2%) |
| 6 to 11 Years | 464 (22.2%) | 304 (16.8%) |
| 12 to 14 Years | 94 (9.6%) | 247 (22.8%) |
| 15 Years | 37 (8.3%) | 31 (8.8%) |
| 16 and 17 Years | 84 (13.2%) | 38 (5.4%) |
| 18 to 24 Years | 54 (2.2%) | 110 (5.4%) |
| 25 to 34 Years | 160 (6.0%) | 500 (17.4%) |
| 35 to 44 Years | 205 (7.2%) | 303 (10.5%) |
| 45 to 54 Years | 211 (6.4%) | 53 (1.7%) |
| 55 to 64 Years | 325 (9.3%) | 250 (7.3%) |
| 65 to 74 Years | 193 (7.4%) | 238 (9.2%) |
| 75 Years and over | 152 (10.5%) | 350 (19.1%) |
| Total | 2,398 (9.7%) | 2,647 (10.8%) |
Income Above Poverty by Sex and Age in Medina County
According to the poverty statistics in Medina County, males aged 18 to 24 years and females aged 45 to 54 years are the age groups that are most secure financially, with 97.8% of males and 98.3% of females in these age groups living above the poverty line.
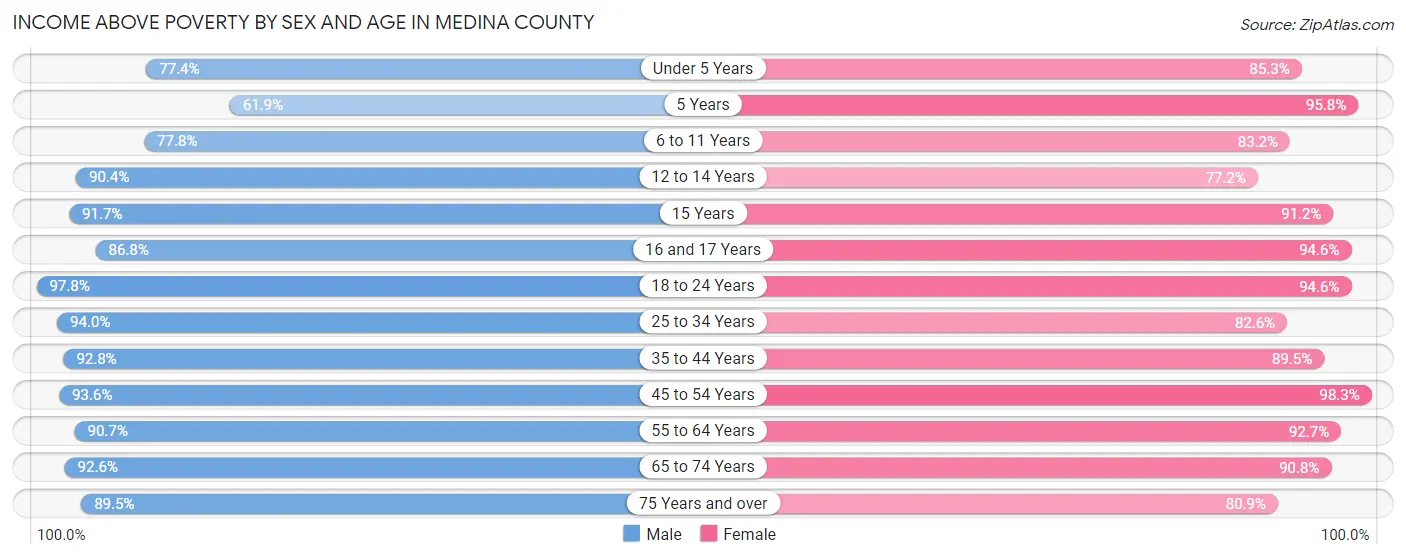
| Age Bracket | Male | Female |
| Under 5 Years | 1,133 (77.4%) | 1,217 (85.3%) |
| 5 Years | 143 (61.9%) | 321 (95.8%) |
| 6 to 11 Years | 1,627 (77.8%) | 1,501 (83.2%) |
| 12 to 14 Years | 888 (90.4%) | 836 (77.2%) |
| 15 Years | 410 (91.7%) | 322 (91.2%) |
| 16 and 17 Years | 553 (86.8%) | 659 (94.6%) |
| 18 to 24 Years | 2,391 (97.8%) | 1,908 (94.6%) |
| 25 to 34 Years | 2,487 (94.0%) | 2,377 (82.6%) |
| 35 to 44 Years | 2,635 (92.8%) | 2,585 (89.5%) |
| 45 to 54 Years | 3,089 (93.6%) | 3,101 (98.3%) |
| 55 to 64 Years | 3,182 (90.7%) | 3,155 (92.7%) |
| 65 to 74 Years | 2,401 (92.6%) | 2,359 (90.8%) |
| 75 Years and over | 1,294 (89.5%) | 1,484 (80.9%) |
| Total | 22,233 (90.3%) | 21,825 (89.2%) |
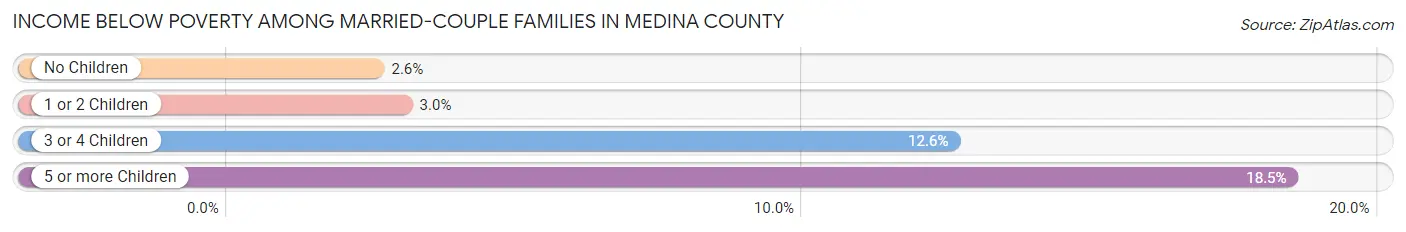
Income Below Poverty Among Married-Couple Families in Medina County
The poverty statistics for married-couple families in Medina County show that 3.7% or 387 of the total 10,577 families live below the poverty line. Families with 5 or more children have the highest poverty rate of 18.5%, comprising of 12 families. On the other hand, families with no children have the lowest poverty rate of 2.5%, which includes 157 families.
| Children | Above Poverty | Below Poverty |
| No Children | 6,000 (97.5%) | 157 (2.5%) |
| 1 or 2 Children | 3,351 (97.0%) | 105 (3.0%) |
| 3 or 4 Children | 786 (87.4%) | 113 (12.6%) |
| 5 or more Children | 53 (81.5%) | 12 (18.5%) |
| Total | 10,190 (96.3%) | 387 (3.7%) |
Income Below Poverty Among Single-Parent Households in Medina County
According to the poverty data in Medina County, 18.0% or 158 single-father households and 25.1% or 439 single-mother households are living below the poverty line. Among single-father households, those with 1 or 2 children have the highest poverty rate, with 158 households (39.9%) experiencing poverty. Likewise, among single-mother households, those with 3 or 4 children have the highest poverty rate, with 215 households (74.1%) falling below the poverty line.
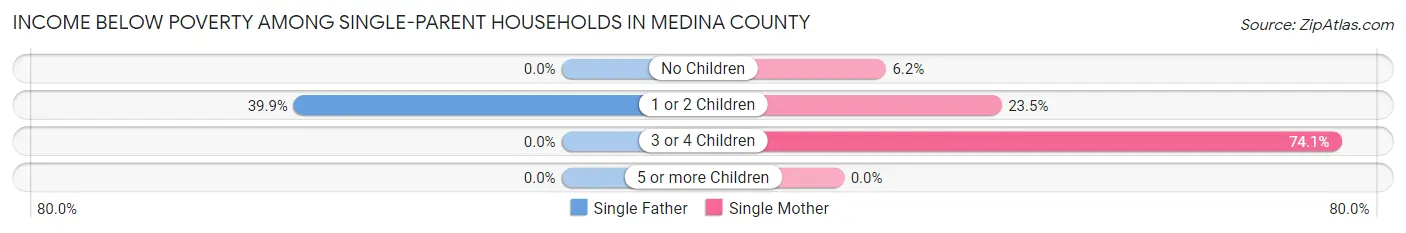
| Children | Single Father | Single Mother |
| No Children | 0 (0.0%) | 43 (6.2%) |
| 1 or 2 Children | 158 (39.9%) | 181 (23.5%) |
| 3 or 4 Children | 0 (0.0%) | 215 (74.1%) |
| 5 or more Children | 0 (0.0%) | 0 (0.0%) |
| Total | 158 (18.0%) | 439 (25.1%) |
Income Below Poverty Among Married-Couple vs Single-Parent Households in Medina County
The poverty data for Medina County shows that 387 of the married-couple family households (3.7%) and 597 of the single-parent households (22.7%) are living below the poverty level. Within the married-couple family households, those with 5 or more children have the highest poverty rate, with 12 households (18.5%) falling below the poverty line. Among the single-parent households, those with 3 or 4 children have the highest poverty rate, with 215 household (62.5%) living below poverty.
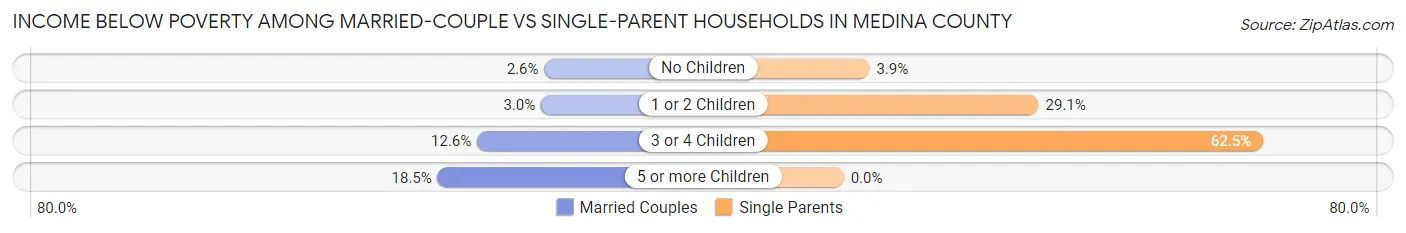
| Children | Married-Couple Families | Single-Parent Households |
| No Children | 157 (2.5%) | 43 (3.8%) |
| 1 or 2 Children | 105 (3.0%) | 339 (29.0%) |
| 3 or 4 Children | 113 (12.6%) | 215 (62.5%) |
| 5 or more Children | 12 (18.5%) | 0 (0.0%) |
| Total | 387 (3.7%) | 597 (22.7%) |
Race in Medina County
The most populous races in Medina County are White / Caucasian (35,904 | 69.8%), Hispanic or Latino (27,313 | 53.1%), and Two or more Races (10,062 | 19.6%).
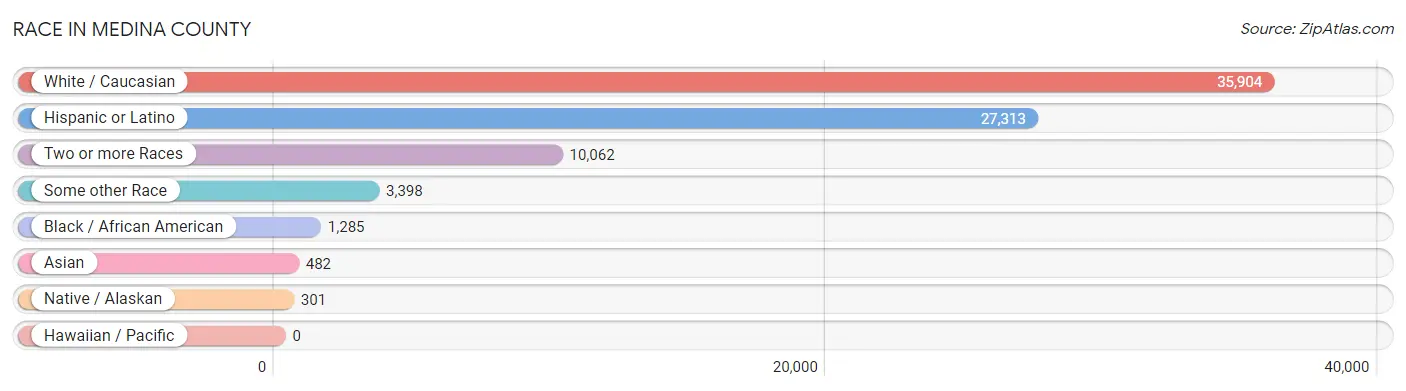
| Race | # Population | % Population |
| Asian | 482 | 0.9% |
| Black / African American | 1,285 | 2.5% |
| Hawaiian / Pacific | 0 | 0.0% |
| Hispanic or Latino | 27,313 | 53.1% |
| Native / Alaskan | 301 | 0.6% |
| White / Caucasian | 35,904 | 69.8% |
| Two or more Races | 10,062 | 19.6% |
| Some other Race | 3,398 | 6.6% |
| Total | 51,432 | 100.0% |
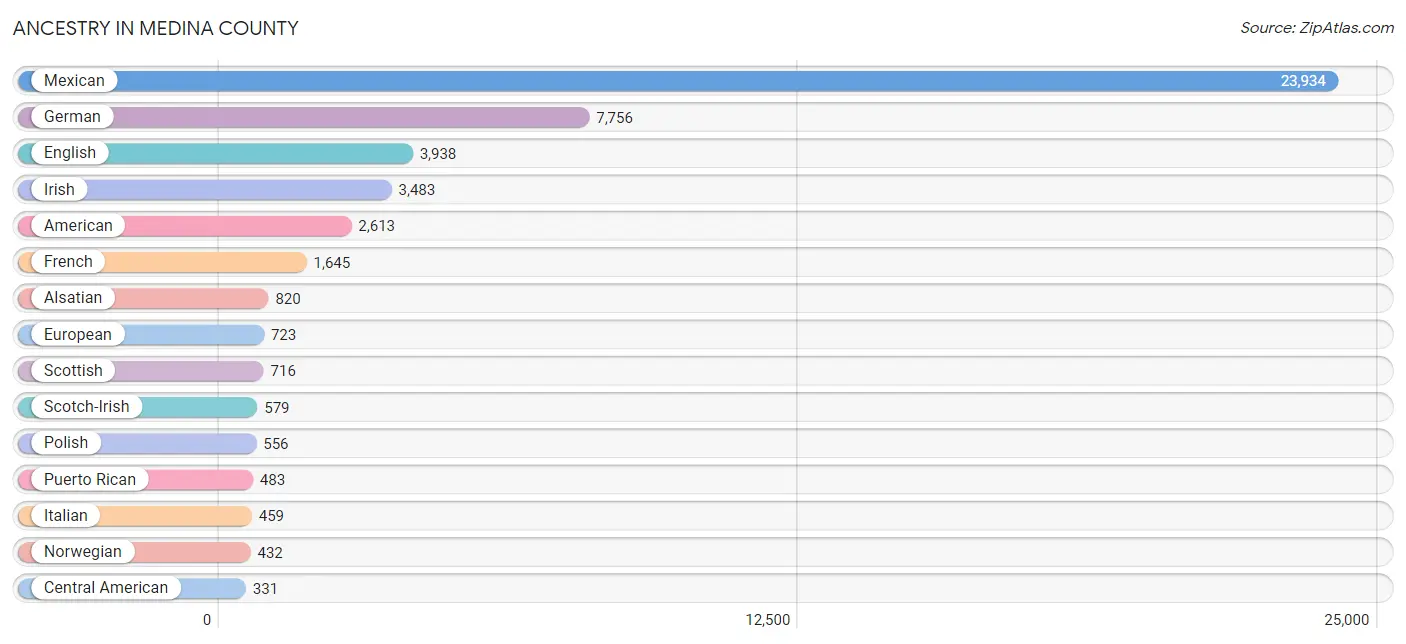
Ancestry in Medina County
The most populous ancestries reported in Medina County are Mexican (23,934 | 46.5%), German (7,756 | 15.1%), English (3,938 | 7.7%), Irish (3,483 | 6.8%), and American (2,613 | 5.1%), together accounting for 81.1% of all Medina County residents.
| Ancestry | # Population | % Population |
| African | 87 | 0.2% |
| Alsatian | 820 | 1.6% |
| American | 2,613 | 5.1% |
| Apache | 3 | 0.0% |
| Arab | 4 | 0.0% |
| Australian | 52 | 0.1% |
| Austrian | 12 | 0.0% |
| Basque | 3 | 0.0% |
| Belgian | 313 | 0.6% |
| Bhutanese | 82 | 0.2% |
| Blackfeet | 45 | 0.1% |
| Brazilian | 19 | 0.0% |
| British | 205 | 0.4% |
| Burmese | 39 | 0.1% |
| Canadian | 47 | 0.1% |
| Celtic | 8 | 0.0% |
| Central American | 331 | 0.6% |
| Cherokee | 250 | 0.5% |
| Chickasaw | 6 | 0.0% |
| Chippewa | 3 | 0.0% |
| Choctaw | 17 | 0.0% |
| Colombian | 174 | 0.3% |
| Creek | 152 | 0.3% |
| Croatian | 42 | 0.1% |
| Cuban | 42 | 0.1% |
| Czech | 228 | 0.4% |
| Czechoslovakian | 88 | 0.2% |
| Danish | 12 | 0.0% |
| Dominican | 40 | 0.1% |
| Dutch | 215 | 0.4% |
| Eastern European | 22 | 0.0% |
| English | 3,938 | 7.7% |
| European | 723 | 1.4% |
| French | 1,645 | 3.2% |
| French Canadian | 83 | 0.2% |
| German | 7,756 | 15.1% |
| Guatemalan | 102 | 0.2% |
| Haitian | 20 | 0.0% |
| Honduran | 98 | 0.2% |
| Hungarian | 8 | 0.0% |
| Indian (Asian) | 180 | 0.4% |
| Indonesian | 5 | 0.0% |
| Iranian | 3 | 0.0% |
| Irish | 3,483 | 6.8% |
| Iroquois | 7 | 0.0% |
| Italian | 459 | 0.9% |
| Kiowa | 8 | 0.0% |
| Korean | 215 | 0.4% |
| Lebanese | 4 | 0.0% |
| Lithuanian | 59 | 0.1% |
| Mexican | 23,934 | 46.5% |
| Mexican American Indian | 7 | 0.0% |
| Native Hawaiian | 20 | 0.0% |
| Nicaraguan | 5 | 0.0% |
| Nigerian | 4 | 0.0% |
| Northern European | 35 | 0.1% |
| Norwegian | 432 | 0.8% |
| Panamanian | 22 | 0.0% |
| Peruvian | 68 | 0.1% |
| Polish | 556 | 1.1% |
| Portuguese | 60 | 0.1% |
| Puerto Rican | 483 | 0.9% |
| Russian | 116 | 0.2% |
| Salvadoran | 104 | 0.2% |
| Scandinavian | 117 | 0.2% |
| Scotch-Irish | 579 | 1.1% |
| Scottish | 716 | 1.4% |
| Sioux | 25 | 0.1% |
| Slovene | 3 | 0.0% |
| South American | 242 | 0.5% |
| Spaniard | 23 | 0.0% |
| Spanish | 201 | 0.4% |
| Sri Lankan | 25 | 0.1% |
| Subsaharan African | 91 | 0.2% |
| Swedish | 240 | 0.5% |
| Swiss | 28 | 0.1% |
| Thai | 146 | 0.3% |
| Turkish | 22 | 0.0% |
| Ukrainian | 30 | 0.1% |
| Welsh | 157 | 0.3% | View All 80 Rows |
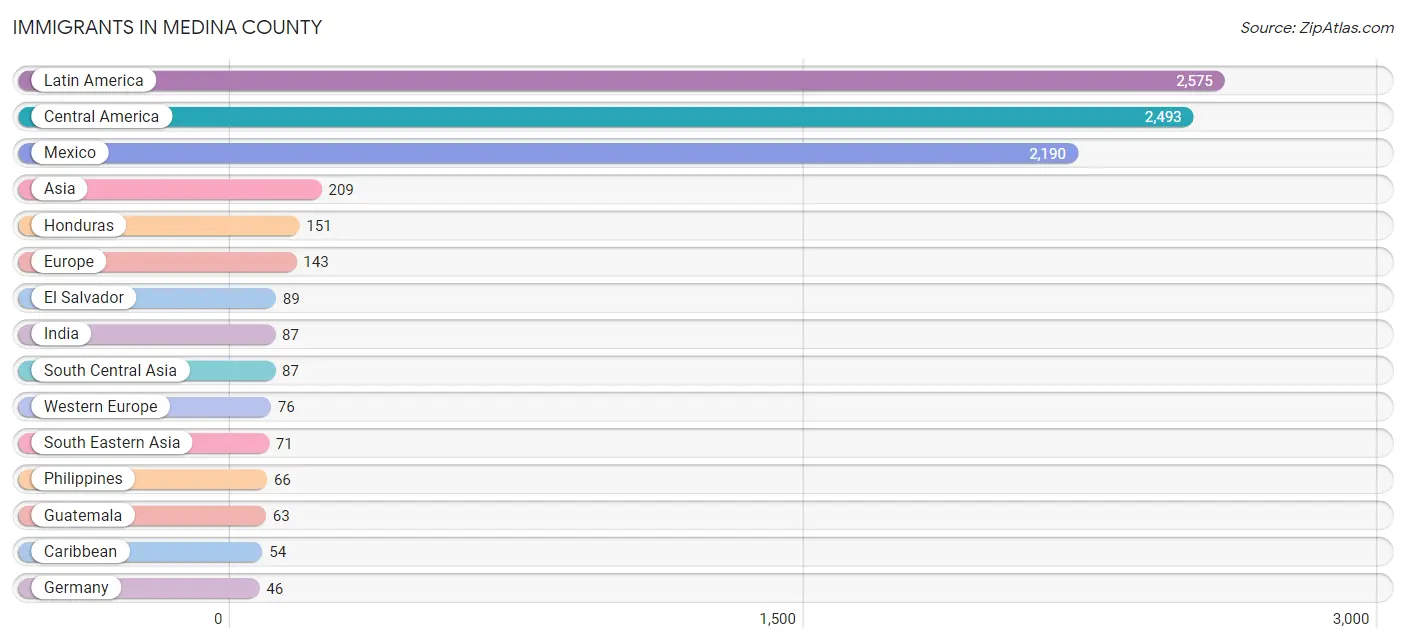
Immigrants in Medina County
The most numerous immigrant groups reported in Medina County came from Latin America (2,575 | 5.0%), Central America (2,493 | 4.9%), Mexico (2,190 | 4.3%), Asia (209 | 0.4%), and Honduras (151 | 0.3%), together accounting for 14.8% of all Medina County residents.
| Immigration Origin | # Population | % Population |
| Asia | 209 | 0.4% |
| Australia | 11 | 0.0% |
| Brazil | 28 | 0.1% |
| Canada | 21 | 0.0% |
| Caribbean | 54 | 0.1% |
| Central America | 2,493 | 4.9% |
| China | 11 | 0.0% |
| Cuba | 14 | 0.0% |
| Dominican Republic | 40 | 0.1% |
| Eastern Asia | 29 | 0.1% |
| El Salvador | 89 | 0.2% |
| England | 3 | 0.0% |
| Europe | 143 | 0.3% |
| France | 26 | 0.1% |
| Germany | 46 | 0.1% |
| Guatemala | 63 | 0.1% |
| Honduras | 151 | 0.3% |
| India | 87 | 0.2% |
| Japan | 8 | 0.0% |
| Korea | 10 | 0.0% |
| Latin America | 2,575 | 5.0% |
| Mexico | 2,190 | 4.3% |
| Netherlands | 4 | 0.0% |
| Northern Europe | 25 | 0.1% |
| Oceania | 11 | 0.0% |
| Philippines | 66 | 0.1% |
| Scotland | 3 | 0.0% |
| South America | 28 | 0.1% |
| South Central Asia | 87 | 0.2% |
| South Eastern Asia | 71 | 0.1% |
| Southern Europe | 42 | 0.1% |
| Spain | 42 | 0.1% |
| Sweden | 3 | 0.0% |
| Turkey | 22 | 0.0% |
| Western Asia | 22 | 0.0% |
| Western Europe | 76 | 0.2% | View All 36 Rows |
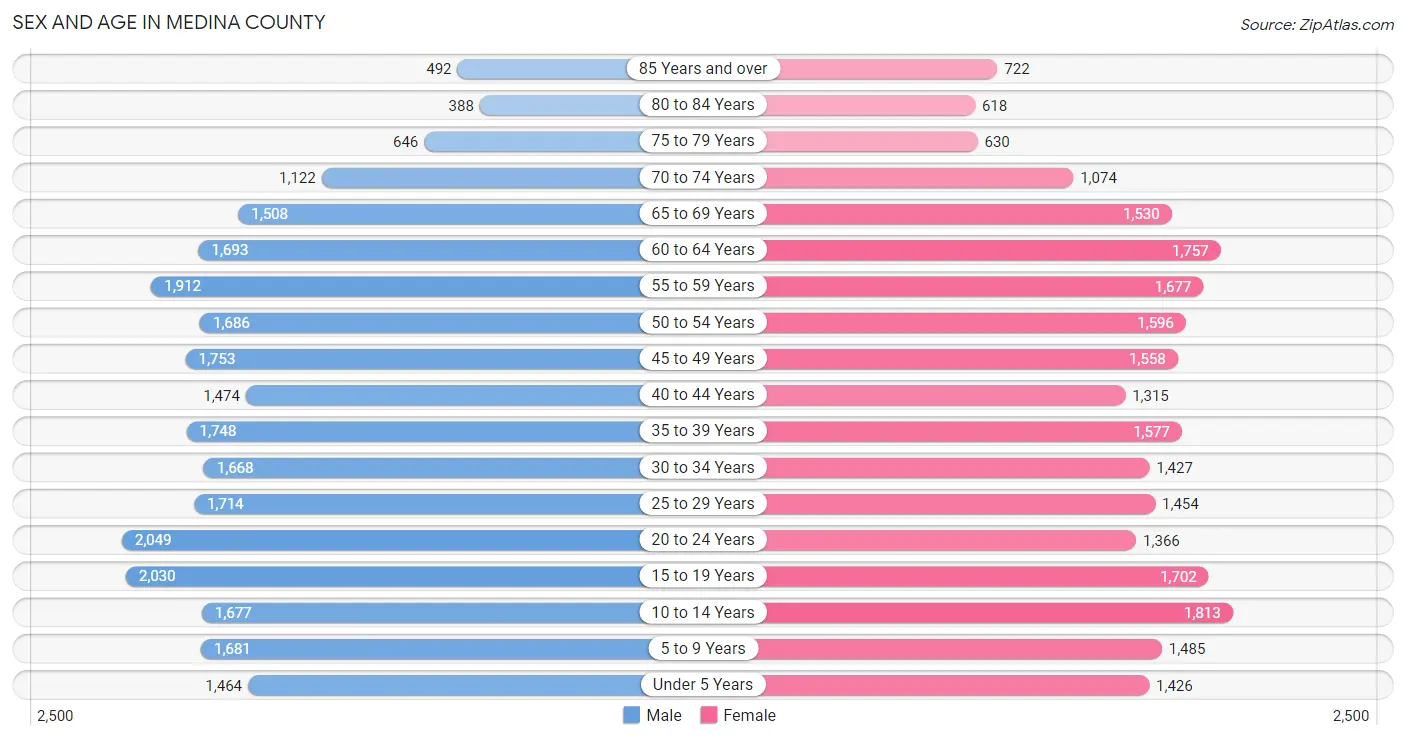
Sex and Age in Medina County
Sex and Age in Medina County
The most populous age groups in Medina County are 20 to 24 Years (2,049 | 7.7%) for men and 10 to 14 Years (1,813 | 7.3%) for women.
| Age Bracket | Male | Female |
| Under 5 Years | 1,464 (5.5%) | 1,426 (5.8%) |
| 5 to 9 Years | 1,681 (6.3%) | 1,485 (6.0%) |
| 10 to 14 Years | 1,677 (6.3%) | 1,813 (7.3%) |
| 15 to 19 Years | 2,030 (7.6%) | 1,702 (6.9%) |
| 20 to 24 Years | 2,049 (7.7%) | 1,366 (5.5%) |
| 25 to 29 Years | 1,714 (6.4%) | 1,454 (5.9%) |
| 30 to 34 Years | 1,668 (6.2%) | 1,427 (5.8%) |
| 35 to 39 Years | 1,748 (6.6%) | 1,577 (6.4%) |
| 40 to 44 Years | 1,474 (5.5%) | 1,315 (5.3%) |
| 45 to 49 Years | 1,753 (6.6%) | 1,558 (6.3%) |
| 50 to 54 Years | 1,686 (6.3%) | 1,596 (6.5%) |
| 55 to 59 Years | 1,912 (7.2%) | 1,677 (6.8%) |
| 60 to 64 Years | 1,693 (6.3%) | 1,757 (7.1%) |
| 65 to 69 Years | 1,508 (5.7%) | 1,530 (6.2%) |
| 70 to 74 Years | 1,122 (4.2%) | 1,074 (4.3%) |
| 75 to 79 Years | 646 (2.4%) | 630 (2.5%) |
| 80 to 84 Years | 388 (1.5%) | 618 (2.5%) |
| 85 Years and over | 492 (1.8%) | 722 (2.9%) |
| Total | 26,705 (100.0%) | 24,727 (100.0%) |
Families and Households in Medina County
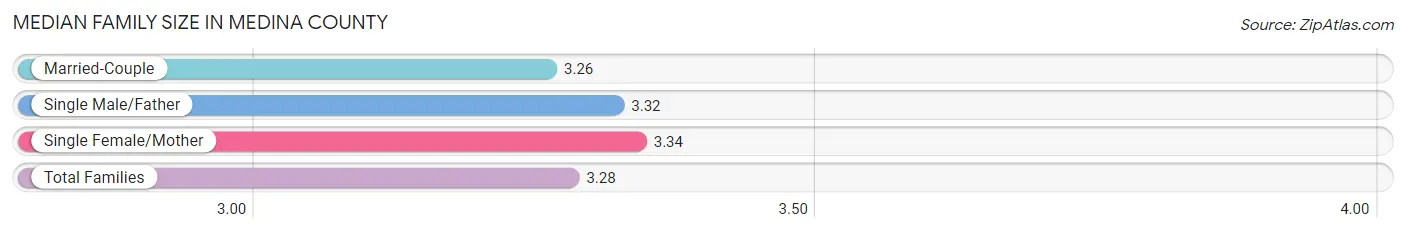
Median Family Size in Medina County
The median family size in Medina County is 3.28 persons per family, with single female/mother families (1,751 | 13.3%) accounting for the largest median family size of 3.34 persons per family. On the other hand, married-couple families (10,577 | 80.1%) represent the smallest median family size with 3.26 persons per family.
| Family Type | # Families | Family Size |
| Married-Couple | 10,577 (80.1%) | 3.26 |
| Single Male/Father | 878 (6.7%) | 3.32 |
| Single Female/Mother | 1,751 (13.3%) | 3.34 |
| Total Families | 13,206 (100.0%) | 3.28 |
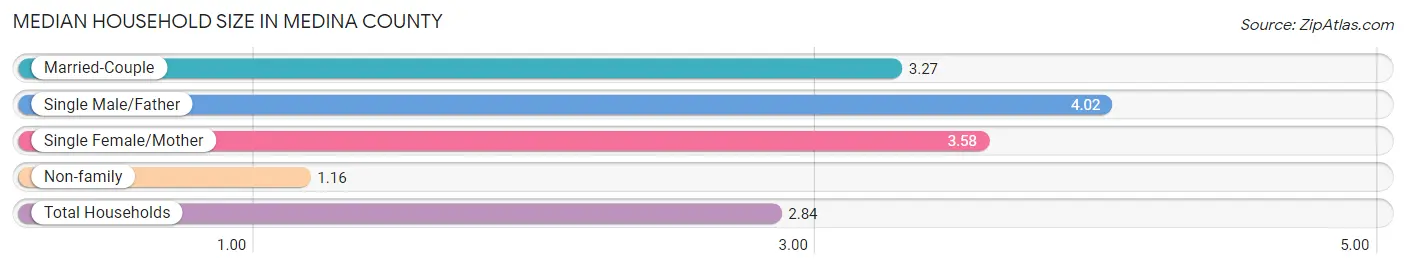
Median Household Size in Medina County
The median household size in Medina County is 2.84 persons per household, with single male/father households (878 | 5.1%) accounting for the largest median household size of 4.02 persons per household. non-family households (4,090 | 23.6%) represent the smallest median household size with 1.16 persons per household.
| Household Type | # Households | Household Size |
| Married-Couple | 10,577 (61.2%) | 3.27 |
| Single Male/Father | 878 (5.1%) | 4.02 |
| Single Female/Mother | 1,751 (10.1%) | 3.58 |
| Non-family | 4,090 (23.6%) | 1.16 |
| Total Households | 17,296 (100.0%) | 2.84 |
Household Size by Marriage Status in Medina County
Out of a total of 17,296 households in Medina County, 13,206 (76.3%) are family households, while 4,090 (23.6%) are nonfamily households. The most numerous type of family households are 2-person households, comprising 5,808, and the most common type of nonfamily households are 1-person households, comprising 3,473.
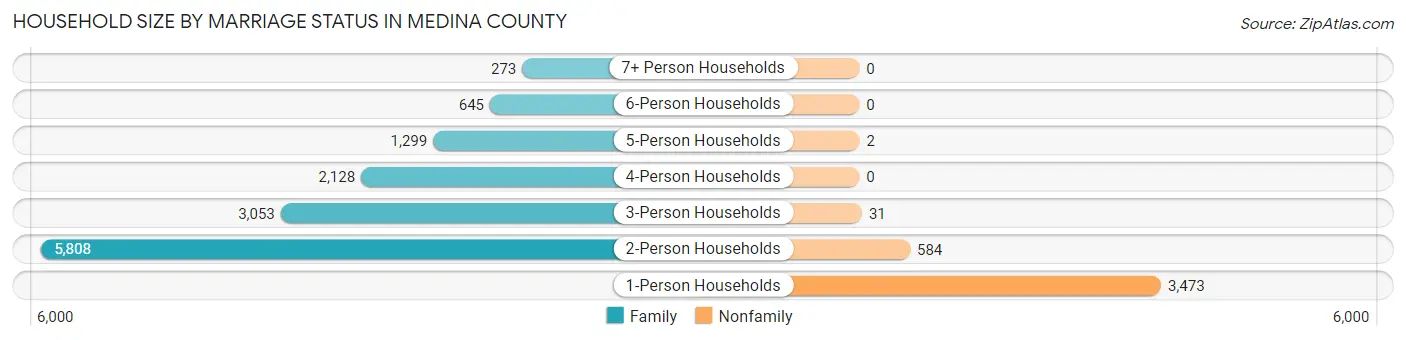
| Household Size | Family Households | Nonfamily Households |
| 1-Person Households | - | 3,473 (20.1%) |
| 2-Person Households | 5,808 (33.6%) | 584 (3.4%) |
| 3-Person Households | 3,053 (17.6%) | 31 (0.2%) |
| 4-Person Households | 2,128 (12.3%) | 0 (0.0%) |
| 5-Person Households | 1,299 (7.5%) | 2 (0.0%) |
| 6-Person Households | 645 (3.7%) | 0 (0.0%) |
| 7+ Person Households | 273 (1.6%) | 0 (0.0%) |
| Total | 13,206 (76.3%) | 4,090 (23.6%) |
Female Fertility in Medina County
Fertility by Age in Medina County
Average fertility rate in Medina County is 73.0 births per 1,000 women. Women in the age bracket of 20 to 34 years have the highest fertility rate with 149.0 births per 1,000 women. Women in the age bracket of 20 to 34 years acount for 80.2% of all women with births.
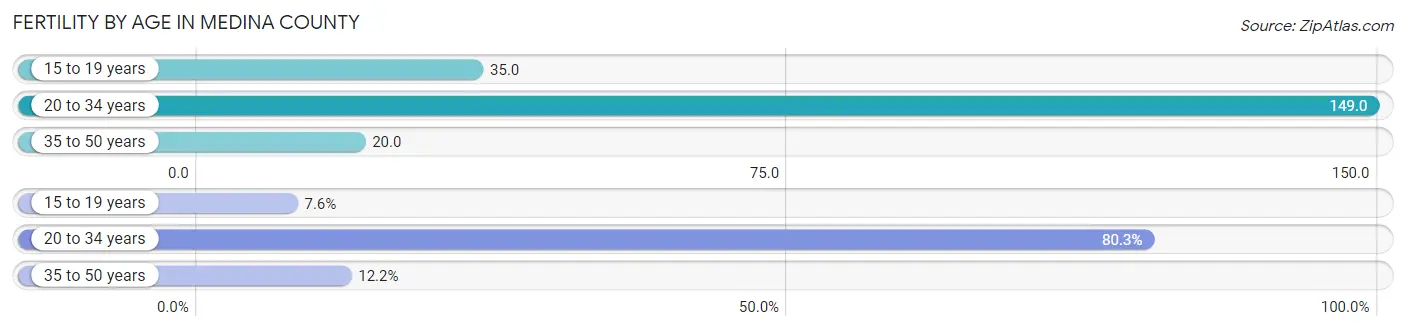
| Age Bracket | Women with Births | Births / 1,000 Women |
| 15 to 19 years | 60 (7.6%) | 35.0 |
| 20 to 34 years | 634 (80.2%) | 149.0 |
| 35 to 50 years | 96 (12.1%) | 20.0 |
| Total | 790 (100.0%) | 73.0 |
Fertility by Age by Marriage Status in Medina County
75.7% of women with births (790) in Medina County are married. The highest percentage of unmarried women with births falls into 15 to 19 years age bracket with 100.0% of them unmarried at the time of birth, while the lowest percentage of unmarried women with births belong to 35 to 50 years age bracket with 7.3% of them unmarried.
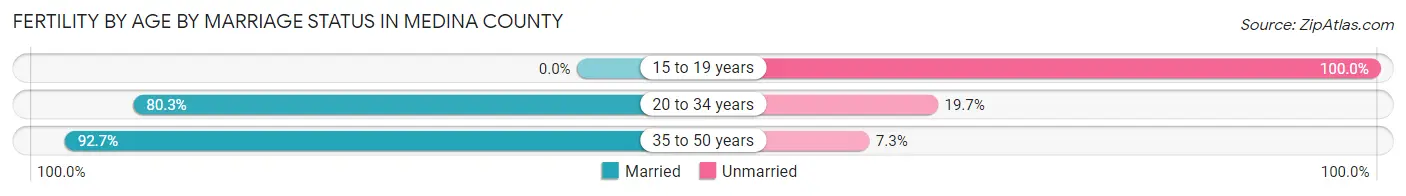
| Age Bracket | Married | Unmarried |
| 15 to 19 years | 0 (0.0%) | 60 (100.0%) |
| 20 to 34 years | 509 (80.3%) | 125 (19.7%) |
| 35 to 50 years | 89 (92.7%) | 7 (7.3%) |
| Total | 598 (75.7%) | 192 (24.3%) |
Fertility by Education in Medina County
Average fertility rate in Medina County is 73.0 births per 1,000 women. Women with the education attainment of bachelor's degree have the highest fertility rate of 145.0 births per 1,000 women, while women with the education attainment of graduate degree have the lowest fertility at 17.0 births per 1,000 women. Women with the education attainment of college or associate's degree represent 31.8% of all women with births.
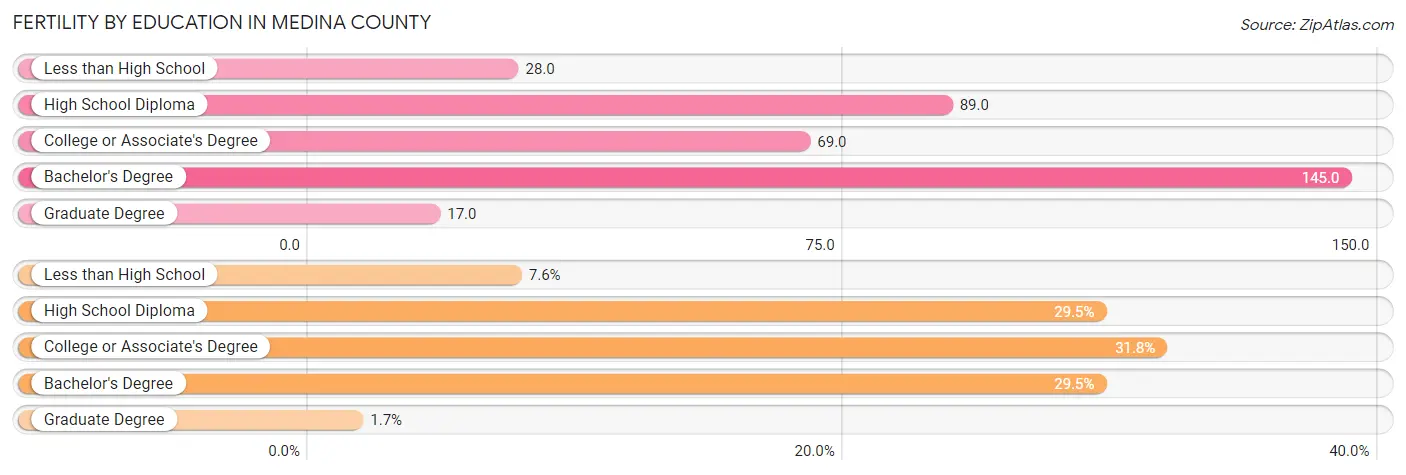
| Educational Attainment | Women with Births | Births / 1,000 Women |
| Less than High School | 60 (7.6%) | 28.0 |
| High School Diploma | 233 (29.5%) | 89.0 |
| College or Associate's Degree | 251 (31.8%) | 69.0 |
| Bachelor's Degree | 233 (29.5%) | 145.0 |
| Graduate Degree | 13 (1.7%) | 17.0 |
| Total | 790 (100.0%) | 73.0 |
Fertility by Education by Marriage Status in Medina County
24.3% of women with births in Medina County are unmarried. Women with the educational attainment of graduate degree are most likely to be married with 100.0% of them married at childbirth, while women with the educational attainment of less than high school are least likely to be married with 100.0% of them unmarried at childbirth.
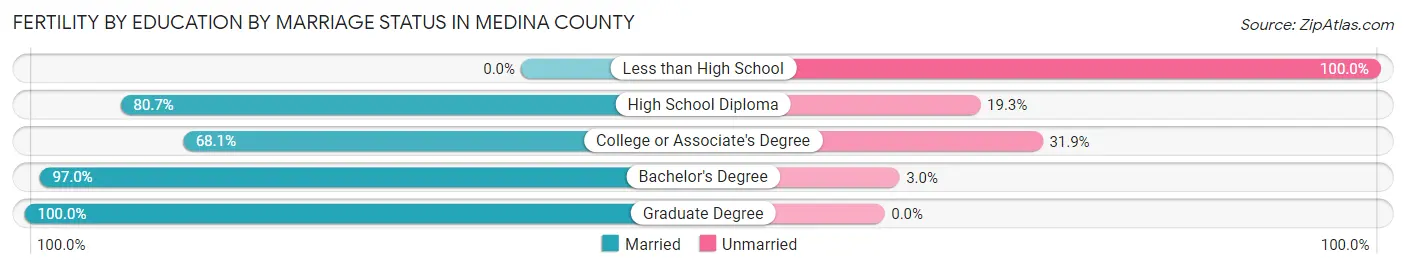
| Educational Attainment | Married | Unmarried |
| Less than High School | 0 (0.0%) | 60 (100.0%) |
| High School Diploma | 188 (80.7%) | 45 (19.3%) |
| College or Associate's Degree | 171 (68.1%) | 80 (31.9%) |
| Bachelor's Degree | 226 (97.0%) | 7 (3.0%) |
| Graduate Degree | 13 (100.0%) | 0 (0.0%) |
| Total | 598 (75.7%) | 192 (24.3%) |
Employment Characteristics in Medina County
Employment by Class of Employer in Medina County
Among the 21,776 employed individuals in Medina County, private company employees (13,544 | 62.2%), local government employees (2,247 | 10.3%), and self-employed (not incorporated) (1,997 | 9.2%) make up the most common classes of employment.
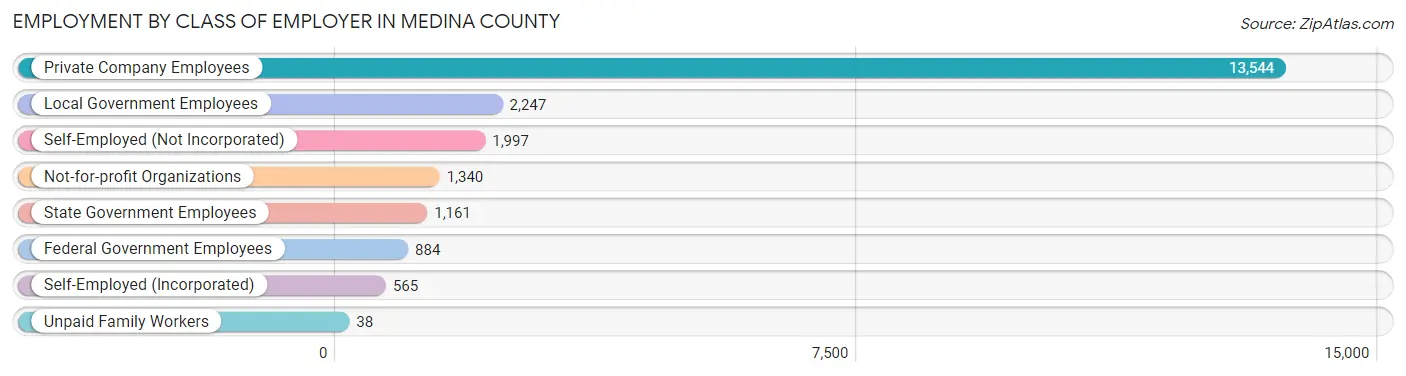
| Employer Class | # Employees | % Employees |
| Private Company Employees | 13,544 | 62.2% |
| Self-Employed (Incorporated) | 565 | 2.6% |
| Self-Employed (Not Incorporated) | 1,997 | 9.2% |
| Not-for-profit Organizations | 1,340 | 6.1% |
| Local Government Employees | 2,247 | 10.3% |
| State Government Employees | 1,161 | 5.3% |
| Federal Government Employees | 884 | 4.1% |
| Unpaid Family Workers | 38 | 0.2% |
| Total | 21,776 | 100.0% |
Employment Status by Age in Medina County
According to the labor force statistics for Medina County, out of the total population over 16 years of age (41,086), 55.8% or 22,926 individuals are in the labor force, with 2.4% or 550 of them unemployed. The age group with the highest labor force participation rate is 35 to 44 years, with 79.7% or 4,873 individuals in the labor force. Within the labor force, the 16 to 19 years age range has the highest percentage of unemployed individuals, with 11.4% or 102 of them being unemployed.
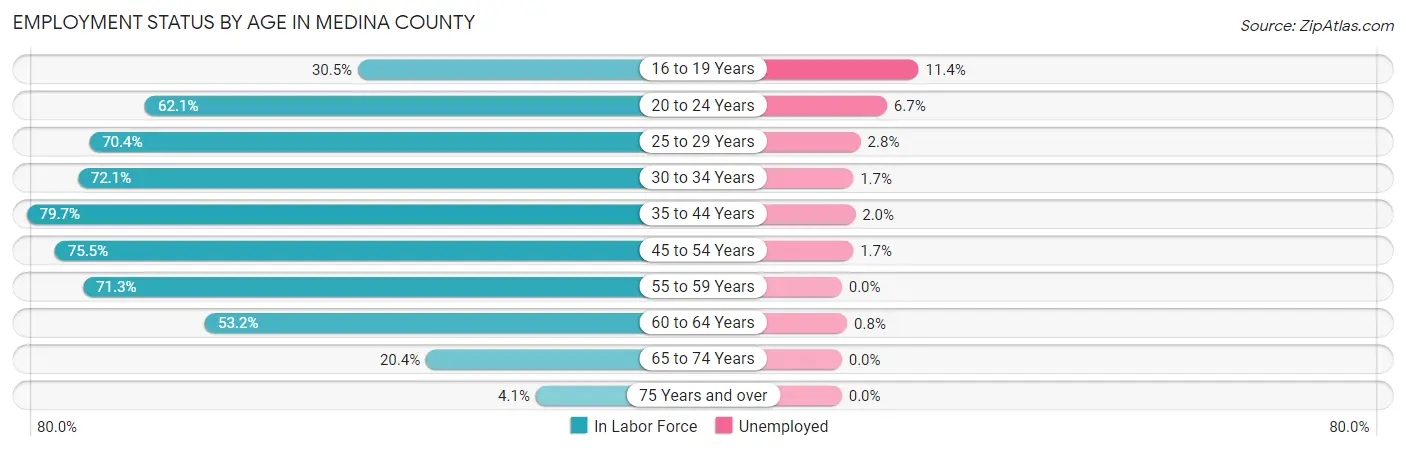
| Age Bracket | In Labor Force | Unemployed |
| 16 to 19 Years | 894 (30.5%) | 102 (11.4%) |
| 20 to 24 Years | 2,121 (62.1%) | 142 (6.7%) |
| 25 to 29 Years | 2,230 (70.4%) | 62 (2.8%) |
| 30 to 34 Years | 2,231 (72.1%) | 38 (1.7%) |
| 35 to 44 Years | 4,873 (79.7%) | 97 (2.0%) |
| 45 to 54 Years | 4,978 (75.5%) | 85 (1.7%) |
| 55 to 59 Years | 2,559 (71.3%) | 0 (0.0%) |
| 60 to 64 Years | 1,835 (53.2%) | 15 (0.8%) |
| 65 to 74 Years | 1,068 (20.4%) | 0 (0.0%) |
| 75 Years and over | 143 (4.1%) | 0 (0.0%) |
| Total | 22,926 (55.8%) | 550 (2.4%) |
Employment Status by Educational Attainment in Medina County
According to labor force statistics for Medina County, 71.9% of individuals (18,700) out of the total population between 25 and 64 years of age (26,009) are in the labor force, with 1.6% or 299 of them being unemployed. The group with the highest labor force participation rate are those with the educational attainment of bachelor's degree or higher, with 83.9% or 4,971 individuals in the labor force. Within the labor force, individuals with high school diploma education have the highest percentage of unemployment, with 2.5% or 142 of them being unemployed.
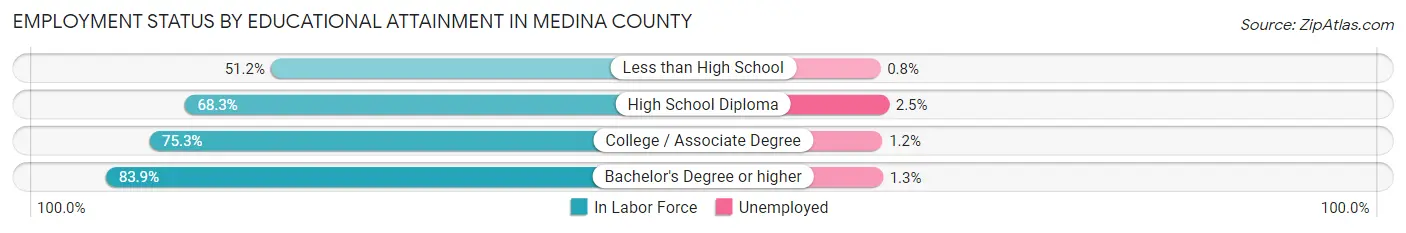
| Educational Attainment | In Labor Force | Unemployed |
| Less than High School | 1,699 (51.2%) | 27 (0.8%) |
| High School Diploma | 5,688 (68.3%) | 208 (2.5%) |
| College / Associate Degree | 6,353 (75.3%) | 101 (1.2%) |
| Bachelor's Degree or higher | 4,971 (83.9%) | 77 (1.3%) |
| Total | 18,700 (71.9%) | 416 (1.6%) |
Employment Occupations by Sex in Medina County
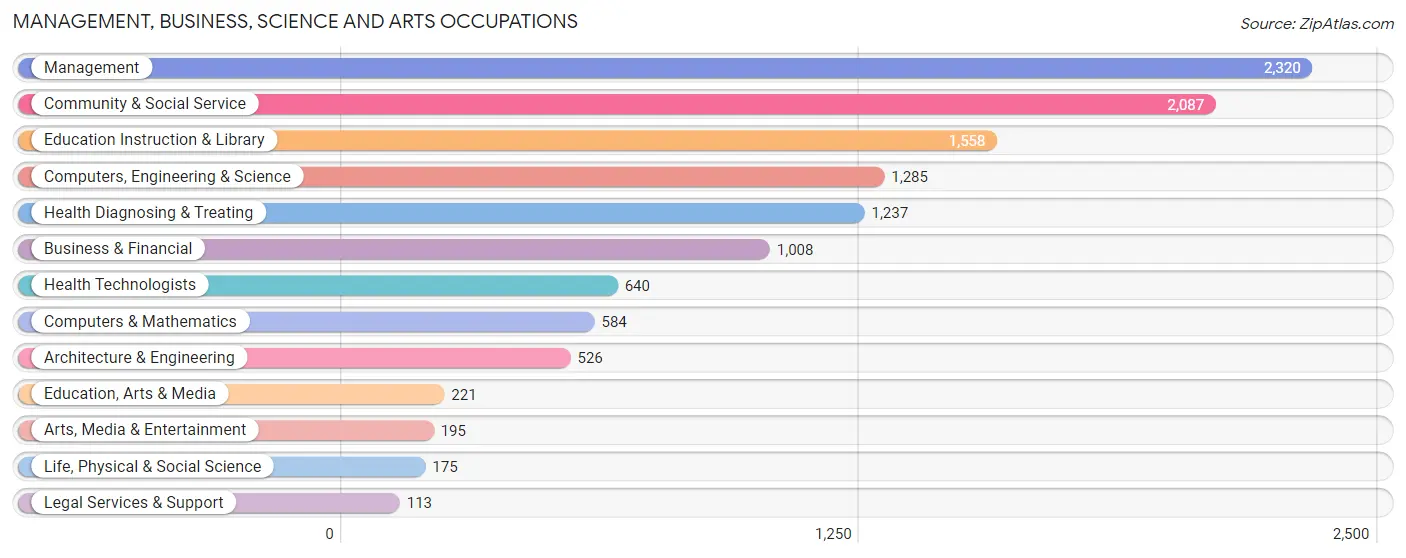
Management, Business, Science and Arts Occupations
The most common Management, Business, Science and Arts occupations in Medina County are Management (2,320 | 10.4%), Community & Social Service (2,087 | 9.4%), Education Instruction & Library (1,558 | 7.0%), Computers, Engineering & Science (1,285 | 5.8%), and Health Diagnosing & Treating (1,237 | 5.6%).
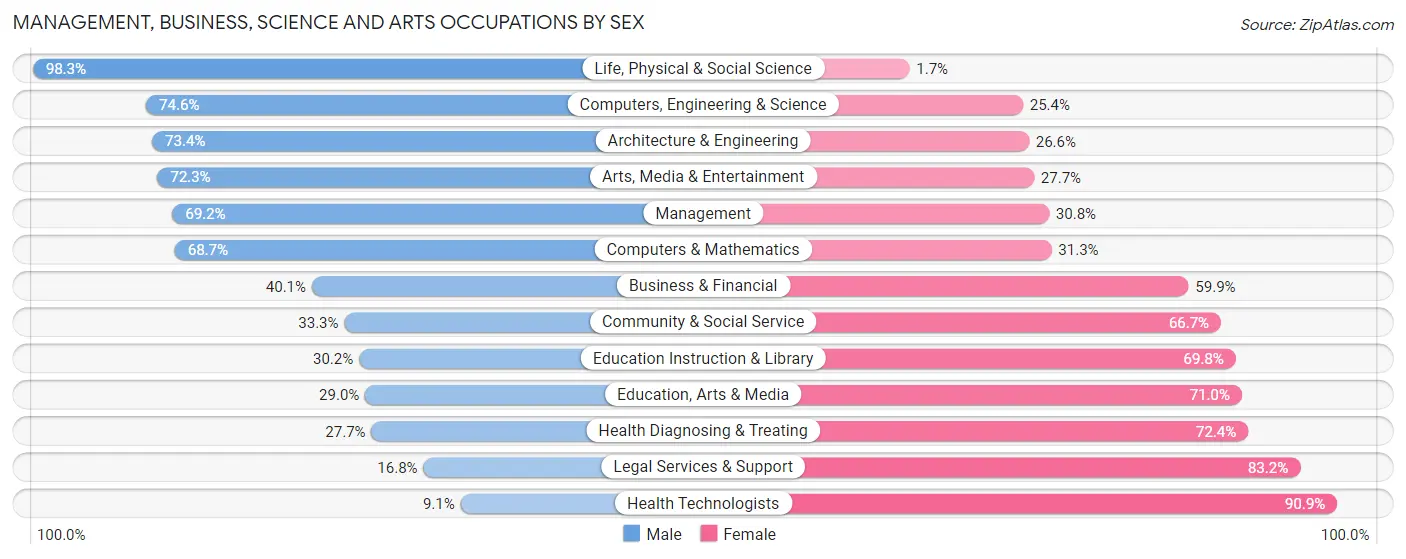
Management, Business, Science and Arts Occupations by Sex
Within the Management, Business, Science and Arts occupations in Medina County, the most male-oriented occupations are Life, Physical & Social Science (98.3%), Computers, Engineering & Science (74.6%), and Architecture & Engineering (73.4%), while the most female-oriented occupations are Health Technologists (90.9%), Legal Services & Support (83.2%), and Health Diagnosing & Treating (72.4%).
| Occupation | Male | Female |
| Management | 1,605 (69.2%) | 715 (30.8%) |
| Business & Financial | 404 (40.1%) | 604 (59.9%) |
| Computers, Engineering & Science | 959 (74.6%) | 326 (25.4%) |
| Computers & Mathematics | 401 (68.7%) | 183 (31.3%) |
| Architecture & Engineering | 386 (73.4%) | 140 (26.6%) |
| Life, Physical & Social Science | 172 (98.3%) | 3 (1.7%) |
| Community & Social Service | 695 (33.3%) | 1,392 (66.7%) |
| Education, Arts & Media | 64 (29.0%) | 157 (71.0%) |
| Legal Services & Support | 19 (16.8%) | 94 (83.2%) |
| Education Instruction & Library | 471 (30.2%) | 1,087 (69.8%) |
| Arts, Media & Entertainment | 141 (72.3%) | 54 (27.7%) |
| Health Diagnosing & Treating | 342 (27.7%) | 895 (72.4%) |
| Health Technologists | 58 (9.1%) | 582 (90.9%) |
| Total (Category) | 4,005 (50.5%) | 3,932 (49.5%) |
| Total (Overall) | 12,128 (54.4%) | 10,161 (45.6%) |
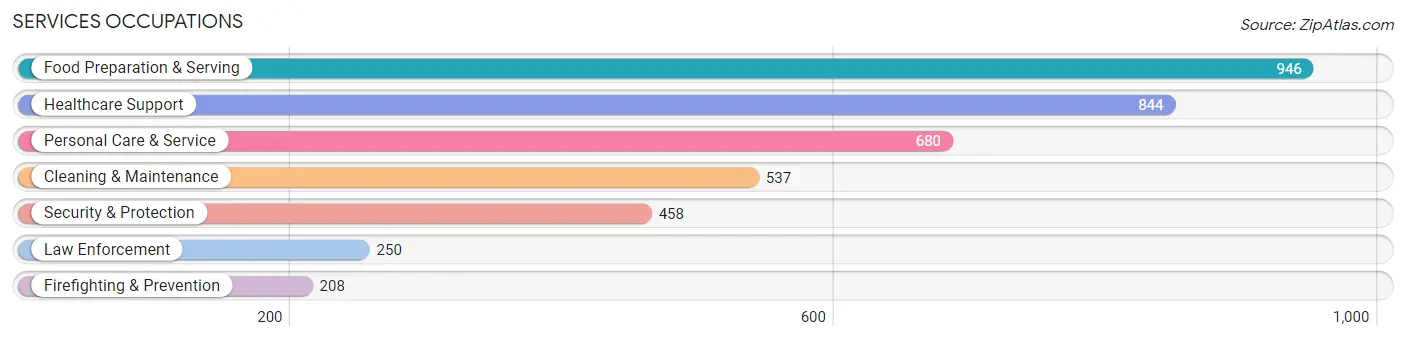
Services Occupations
The most common Services occupations in Medina County are Food Preparation & Serving (946 | 4.2%), Healthcare Support (844 | 3.8%), Personal Care & Service (680 | 3.0%), Cleaning & Maintenance (537 | 2.4%), and Security & Protection (458 | 2.1%).
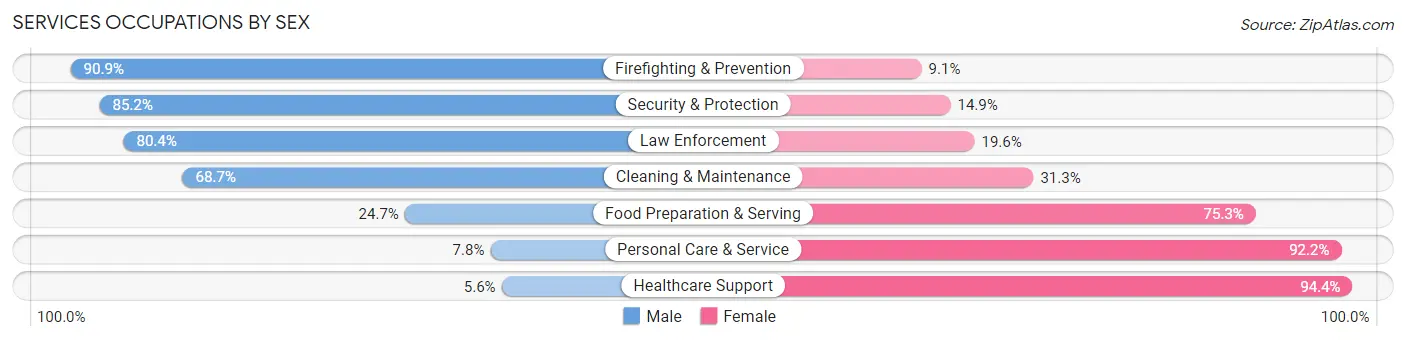
Services Occupations by Sex
Within the Services occupations in Medina County, the most male-oriented occupations are Firefighting & Prevention (90.9%), Security & Protection (85.2%), and Law Enforcement (80.4%), while the most female-oriented occupations are Healthcare Support (94.4%), Personal Care & Service (92.2%), and Food Preparation & Serving (75.3%).
| Occupation | Male | Female |
| Healthcare Support | 47 (5.6%) | 797 (94.4%) |
| Security & Protection | 390 (85.2%) | 68 (14.8%) |
| Firefighting & Prevention | 189 (90.9%) | 19 (9.1%) |
| Law Enforcement | 201 (80.4%) | 49 (19.6%) |
| Food Preparation & Serving | 234 (24.7%) | 712 (75.3%) |
| Cleaning & Maintenance | 369 (68.7%) | 168 (31.3%) |
| Personal Care & Service | 53 (7.8%) | 627 (92.2%) |
| Total (Category) | 1,093 (31.5%) | 2,372 (68.5%) |
| Total (Overall) | 12,128 (54.4%) | 10,161 (45.6%) |
Sales and Office Occupations
The most common Sales and Office occupations in Medina County are Office & Administration (2,662 | 11.9%), and Sales & Related (2,209 | 9.9%).

Sales and Office Occupations by Sex

| Occupation | Male | Female |
| Sales & Related | 1,196 (54.1%) | 1,013 (45.9%) |
| Office & Administration | 485 (18.2%) | 2,177 (81.8%) |
| Total (Category) | 1,681 (34.5%) | 3,190 (65.5%) |
| Total (Overall) | 12,128 (54.4%) | 10,161 (45.6%) |
Natural Resources, Construction and Maintenance Occupations
The most common Natural Resources, Construction and Maintenance occupations in Medina County are Construction & Extraction (1,658 | 7.4%), Installation, Maintenance & Repair (1,386 | 6.2%), and Farming, Fishing & Forestry (99 | 0.4%).
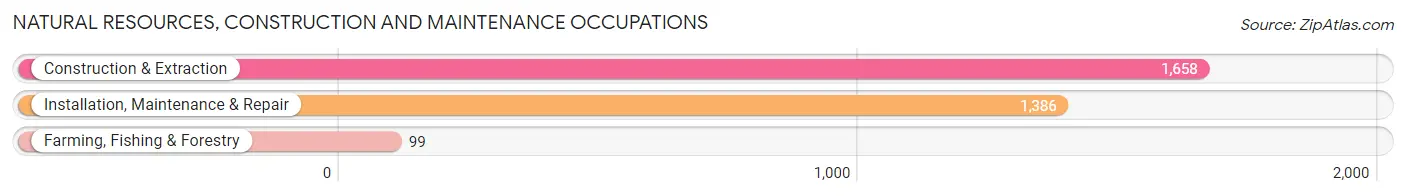
Natural Resources, Construction and Maintenance Occupations by Sex
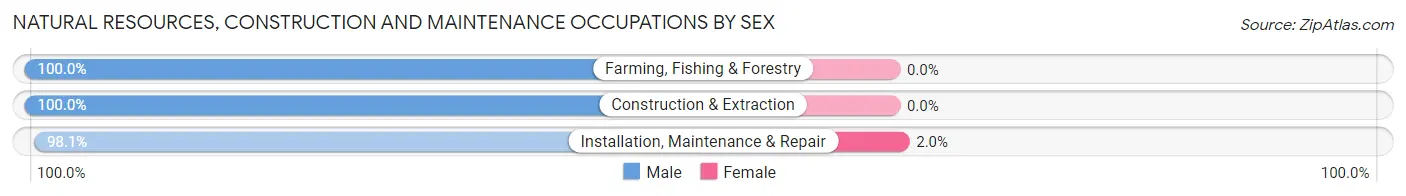
| Occupation | Male | Female |
| Farming, Fishing & Forestry | 99 (100.0%) | 0 (0.0%) |
| Construction & Extraction | 1,658 (100.0%) | 0 (0.0%) |
| Installation, Maintenance & Repair | 1,359 (98.1%) | 27 (1.9%) |
| Total (Category) | 3,116 (99.1%) | 27 (0.9%) |
| Total (Overall) | 12,128 (54.4%) | 10,161 (45.6%) |
Production, Transportation and Moving Occupations
The most common Production, Transportation and Moving occupations in Medina County are Production (1,206 | 5.4%), Material Moving (877 | 3.9%), and Transportation (790 | 3.5%).
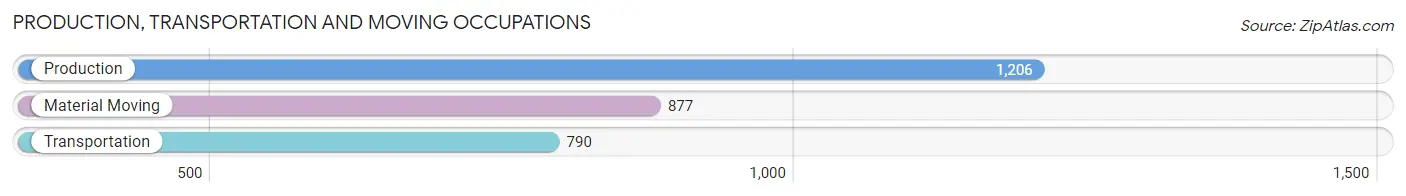
Production, Transportation and Moving Occupations by Sex
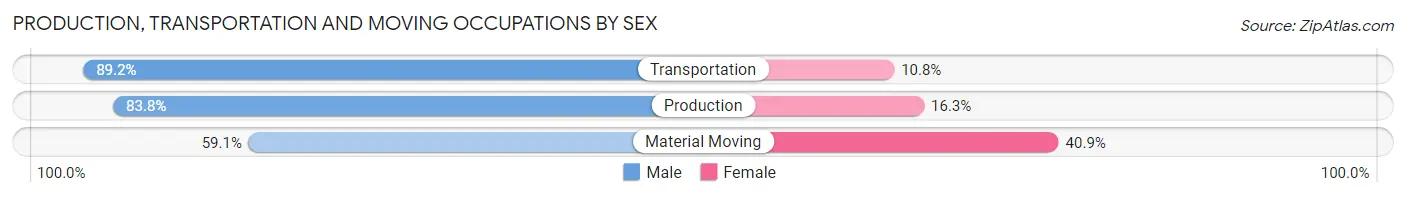
| Occupation | Male | Female |
| Production | 1,010 (83.8%) | 196 (16.3%) |
| Transportation | 705 (89.2%) | 85 (10.8%) |
| Material Moving | 518 (59.1%) | 359 (40.9%) |
| Total (Category) | 2,233 (77.7%) | 640 (22.3%) |
| Total (Overall) | 12,128 (54.4%) | 10,161 (45.6%) |
Employment Industries by Sex in Medina County
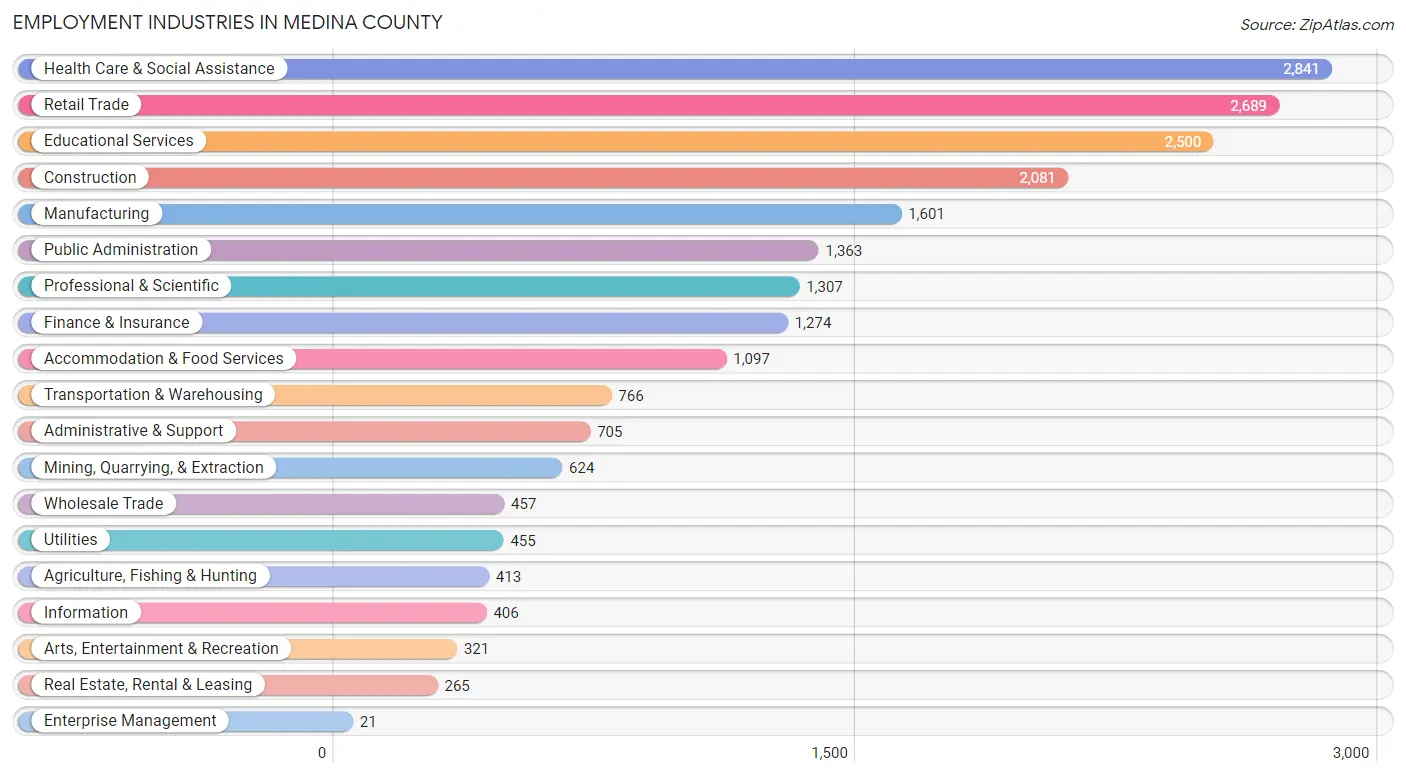
Employment Industries in Medina County
The major employment industries in Medina County include Health Care & Social Assistance (2,841 | 12.8%), Retail Trade (2,689 | 12.1%), Educational Services (2,500 | 11.2%), Construction (2,081 | 9.3%), and Manufacturing (1,601 | 7.2%).
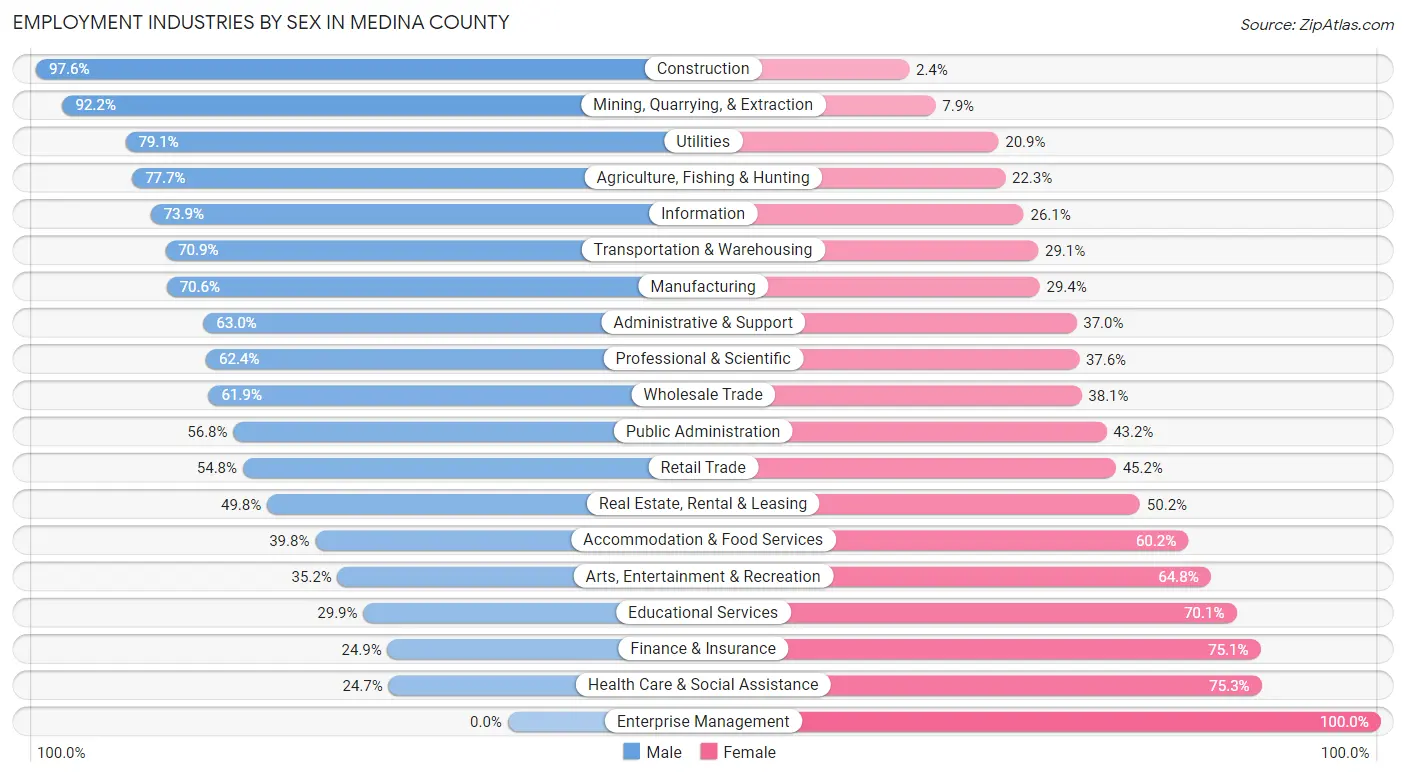
Employment Industries by Sex in Medina County
The Medina County industries that see more men than women are Construction (97.6%), Mining, Quarrying, & Extraction (92.1%), and Utilities (79.1%), whereas the industries that tend to have a higher number of women are Enterprise Management (100.0%), Health Care & Social Assistance (75.3%), and Finance & Insurance (75.1%).
| Industry | Male | Female |
| Agriculture, Fishing & Hunting | 321 (77.7%) | 92 (22.3%) |
| Mining, Quarrying, & Extraction | 575 (92.1%) | 49 (7.9%) |
| Construction | 2,031 (97.6%) | 50 (2.4%) |
| Manufacturing | 1,130 (70.6%) | 471 (29.4%) |
| Wholesale Trade | 283 (61.9%) | 174 (38.1%) |
| Retail Trade | 1,474 (54.8%) | 1,215 (45.2%) |
| Transportation & Warehousing | 543 (70.9%) | 223 (29.1%) |
| Utilities | 360 (79.1%) | 95 (20.9%) |
| Information | 300 (73.9%) | 106 (26.1%) |
| Finance & Insurance | 317 (24.9%) | 957 (75.1%) |
| Real Estate, Rental & Leasing | 132 (49.8%) | 133 (50.2%) |
| Professional & Scientific | 816 (62.4%) | 491 (37.6%) |
| Enterprise Management | 0 (0.0%) | 21 (100.0%) |
| Administrative & Support | 444 (63.0%) | 261 (37.0%) |
| Educational Services | 747 (29.9%) | 1,753 (70.1%) |
| Health Care & Social Assistance | 701 (24.7%) | 2,140 (75.3%) |
| Arts, Entertainment & Recreation | 113 (35.2%) | 208 (64.8%) |
| Accommodation & Food Services | 437 (39.8%) | 660 (60.2%) |
| Public Administration | 774 (56.8%) | 589 (43.2%) |
| Total | 12,128 (54.4%) | 10,161 (45.6%) |
Education in Medina County
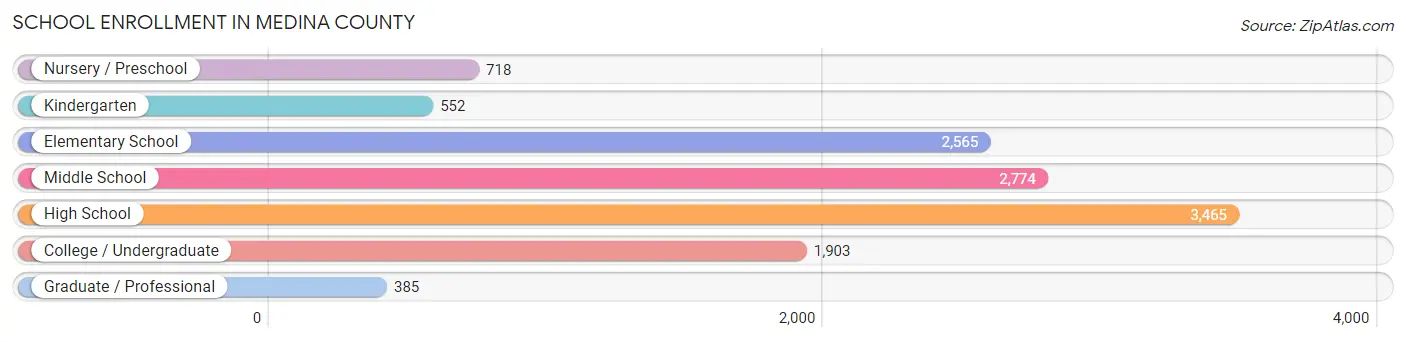
School Enrollment in Medina County
The most common levels of schooling among the 12,362 students in Medina County are high school (3,465 | 28.0%), middle school (2,774 | 22.4%), and elementary school (2,565 | 20.7%).
| School Level | # Students | % Students |
| Nursery / Preschool | 718 | 5.8% |
| Kindergarten | 552 | 4.5% |
| Elementary School | 2,565 | 20.7% |
| Middle School | 2,774 | 22.4% |
| High School | 3,465 | 28.0% |
| College / Undergraduate | 1,903 | 15.4% |
| Graduate / Professional | 385 | 3.1% |
| Total | 12,362 | 100.0% |
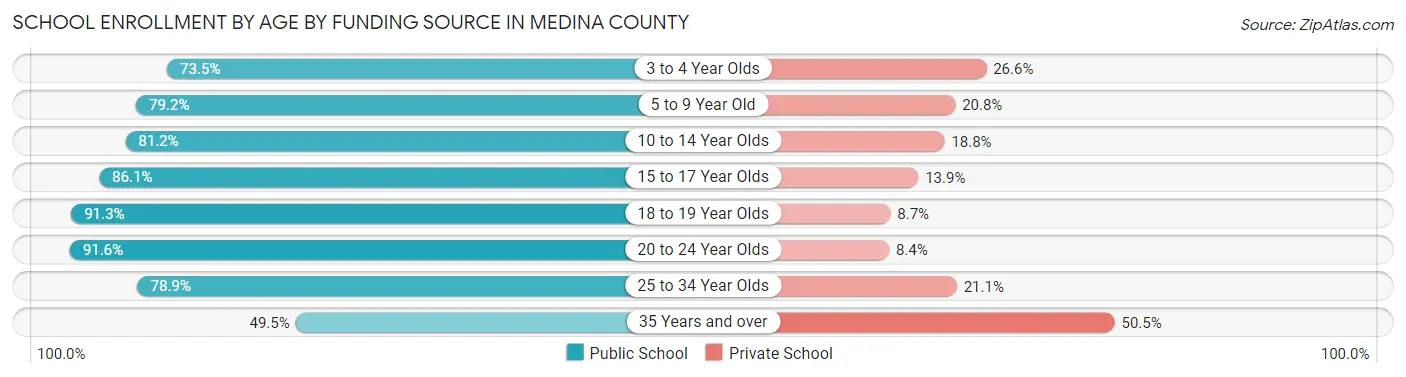
School Enrollment by Age by Funding Source in Medina County
Out of a total of 12,362 students who are enrolled in schools in Medina County, 2,299 (18.6%) attend a private institution, while the remaining 10,063 (81.4%) are enrolled in public schools. The age group of 35 years and over has the highest likelihood of being enrolled in private schools, with 276 (50.5% in the age bracket) enrolled. Conversely, the age group of 20 to 24 year olds has the lowest likelihood of being enrolled in a private school, with 976 (91.6% in the age bracket) attending a public institution.
| Age Bracket | Public School | Private School |
| 3 to 4 Year Olds | 415 (73.5%) | 150 (26.6%) |
| 5 to 9 Year Old | 2,384 (79.2%) | 625 (20.8%) |
| 10 to 14 Year Olds | 2,787 (81.2%) | 644 (18.8%) |
| 15 to 17 Year Olds | 1,816 (86.1%) | 293 (13.9%) |
| 18 to 19 Year Olds | 925 (91.3%) | 88 (8.7%) |
| 20 to 24 Year Olds | 976 (91.6%) | 90 (8.4%) |
| 25 to 34 Year Olds | 491 (78.9%) | 131 (21.1%) |
| 35 Years and over | 271 (49.5%) | 276 (50.5%) |
| Total | 10,063 (81.4%) | 2,299 (18.6%) |
Educational Attainment by Field of Study in Medina County
Business (1,781 | 21.7%), education (1,596 | 19.5%), science & technology (1,006 | 12.3%), bio, nature & agricultural (821 | 10.0%), and liberal arts & history (625 | 7.6%) are the most common fields of study among 8,203 individuals in Medina County who have obtained a bachelor's degree or higher.
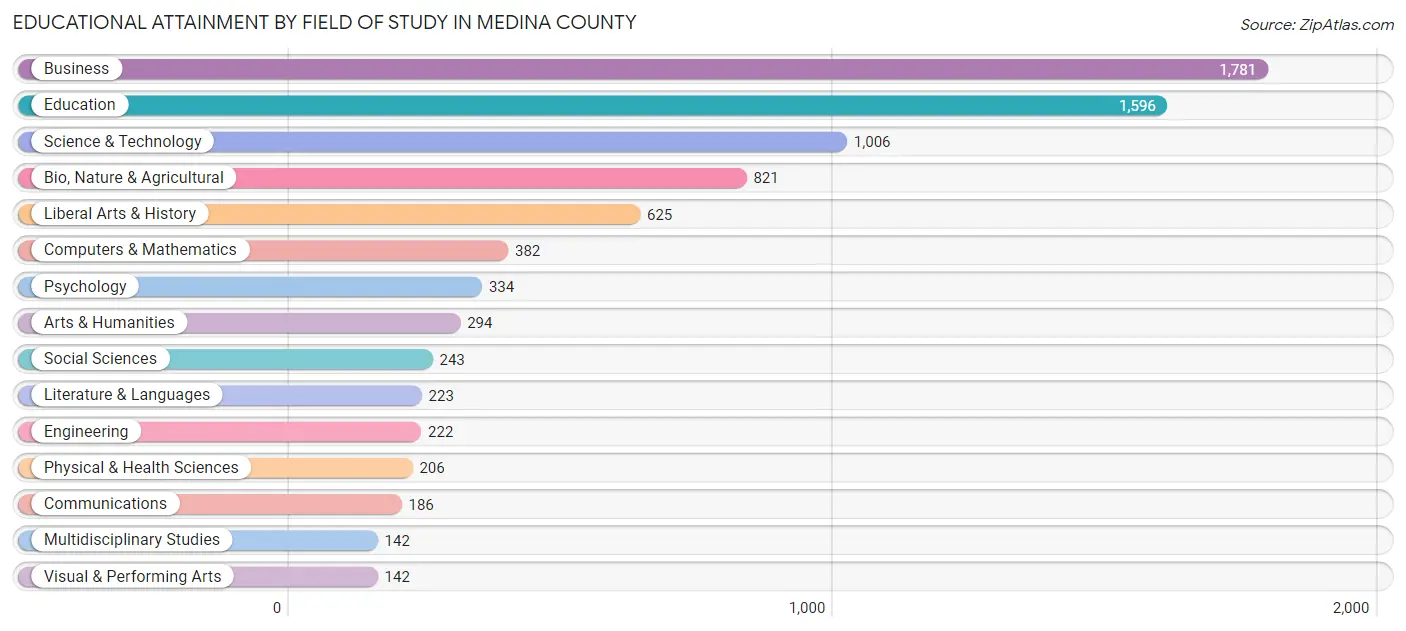
| Field of Study | # Graduates | % Graduates |
| Computers & Mathematics | 382 | 4.7% |
| Bio, Nature & Agricultural | 821 | 10.0% |
| Physical & Health Sciences | 206 | 2.5% |
| Psychology | 334 | 4.1% |
| Social Sciences | 243 | 3.0% |
| Engineering | 222 | 2.7% |
| Multidisciplinary Studies | 142 | 1.7% |
| Science & Technology | 1,006 | 12.3% |
| Business | 1,781 | 21.7% |
| Education | 1,596 | 19.5% |
| Literature & Languages | 223 | 2.7% |
| Liberal Arts & History | 625 | 7.6% |
| Visual & Performing Arts | 142 | 1.7% |
| Communications | 186 | 2.3% |
| Arts & Humanities | 294 | 3.6% |
| Total | 8,203 | 100.0% |
Transportation & Commute in Medina County
Vehicle Availability by Sex in Medina County
The most prevalent vehicle ownership categories in Medina County are males with 2 vehicles (4,572, accounting for 38.0%) and females with 2 vehicles (3,210, making up 47.0%).
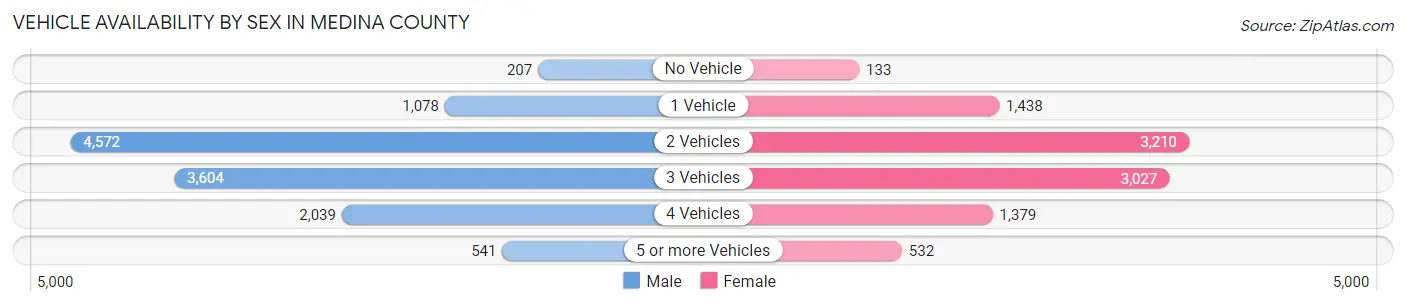
| Vehicles Available | Male | Female |
| No Vehicle | 207 (1.7%) | 133 (1.4%) |
| 1 Vehicle | 1,078 (8.9%) | 1,438 (14.8%) |
| 2 Vehicles | 4,572 (38.0%) | 3,210 (33.0%) |
| 3 Vehicles | 3,604 (29.9%) | 3,027 (31.1%) |
| 4 Vehicles | 2,039 (16.9%) | 1,379 (14.2%) |
| 5 or more Vehicles | 541 (4.5%) | 532 (5.5%) |
| Total | 12,041 (100.0%) | 9,719 (100.0%) |
Commute Time in Medina County
The most frequently occuring commute durations in Medina County are 5 to 9 minutes (2,776 commuters, 14.1%), 30 to 34 minutes (2,597 commuters, 13.1%), and 45 to 59 minutes (2,456 commuters, 12.4%).
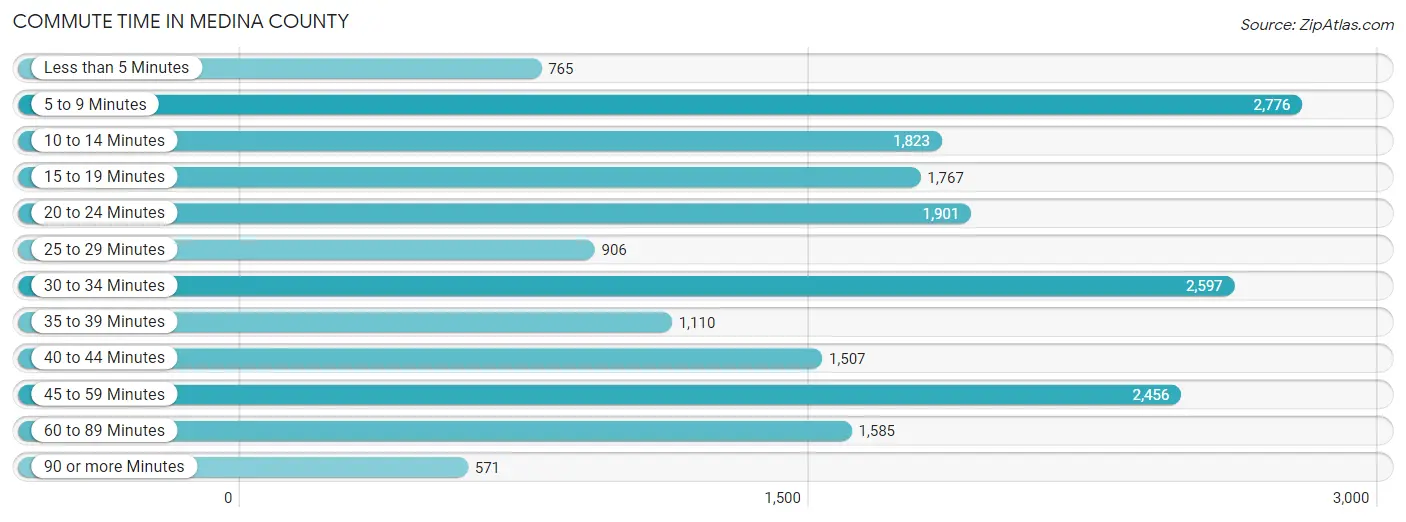
| Commute Time | # Commuters | % Commuters |
| Less than 5 Minutes | 765 | 3.9% |
| 5 to 9 Minutes | 2,776 | 14.1% |
| 10 to 14 Minutes | 1,823 | 9.2% |
| 15 to 19 Minutes | 1,767 | 8.9% |
| 20 to 24 Minutes | 1,901 | 9.6% |
| 25 to 29 Minutes | 906 | 4.6% |
| 30 to 34 Minutes | 2,597 | 13.1% |
| 35 to 39 Minutes | 1,110 | 5.6% |
| 40 to 44 Minutes | 1,507 | 7.6% |
| 45 to 59 Minutes | 2,456 | 12.4% |
| 60 to 89 Minutes | 1,585 | 8.0% |
| 90 or more Minutes | 571 | 2.9% |
Commute Time by Sex in Medina County
The most common commute times in Medina County are 30 to 34 minutes (1,865 commuters, 16.8%) for males and 5 to 9 minutes (1,464 commuters, 16.9%) for females.
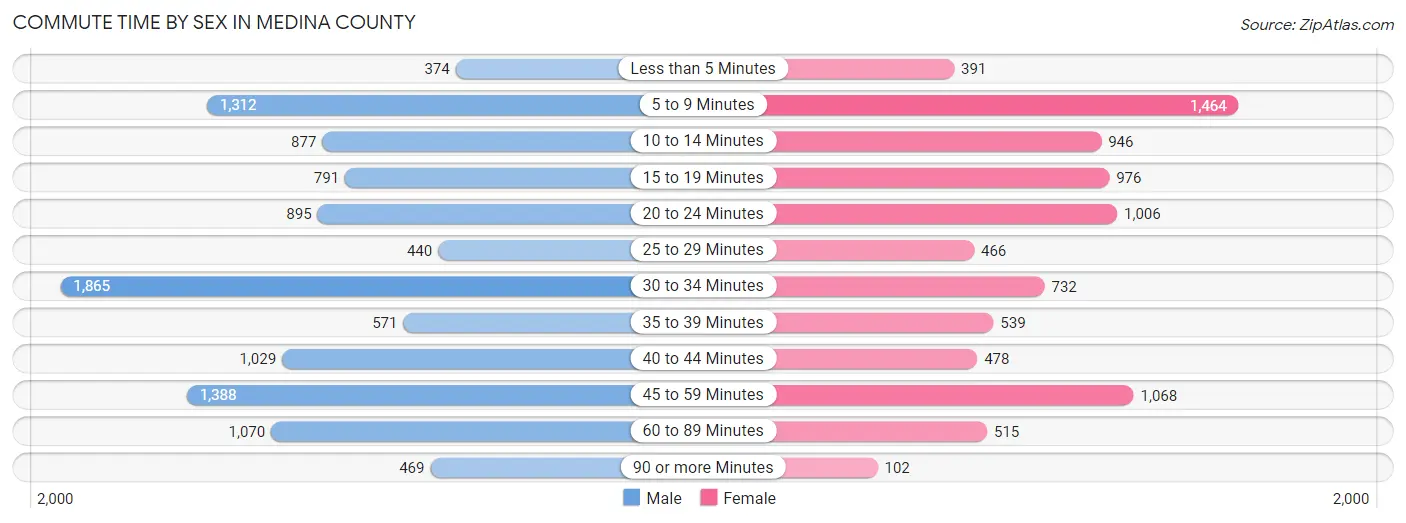
| Commute Time | Male | Female |
| Less than 5 Minutes | 374 (3.4%) | 391 (4.5%) |
| 5 to 9 Minutes | 1,312 (11.8%) | 1,464 (16.9%) |
| 10 to 14 Minutes | 877 (7.9%) | 946 (10.9%) |
| 15 to 19 Minutes | 791 (7.1%) | 976 (11.2%) |
| 20 to 24 Minutes | 895 (8.1%) | 1,006 (11.6%) |
| 25 to 29 Minutes | 440 (4.0%) | 466 (5.4%) |
| 30 to 34 Minutes | 1,865 (16.8%) | 732 (8.4%) |
| 35 to 39 Minutes | 571 (5.1%) | 539 (6.2%) |
| 40 to 44 Minutes | 1,029 (9.3%) | 478 (5.5%) |
| 45 to 59 Minutes | 1,388 (12.5%) | 1,068 (12.3%) |
| 60 to 89 Minutes | 1,070 (9.7%) | 515 (5.9%) |
| 90 or more Minutes | 469 (4.2%) | 102 (1.2%) |
Time of Departure to Work by Sex in Medina County
The most frequent times of departure to work in Medina County are 6:00 AM to 6:29 AM (1,833, 16.5%) for males and 7:30 AM to 7:59 AM (1,399, 16.1%) for females.
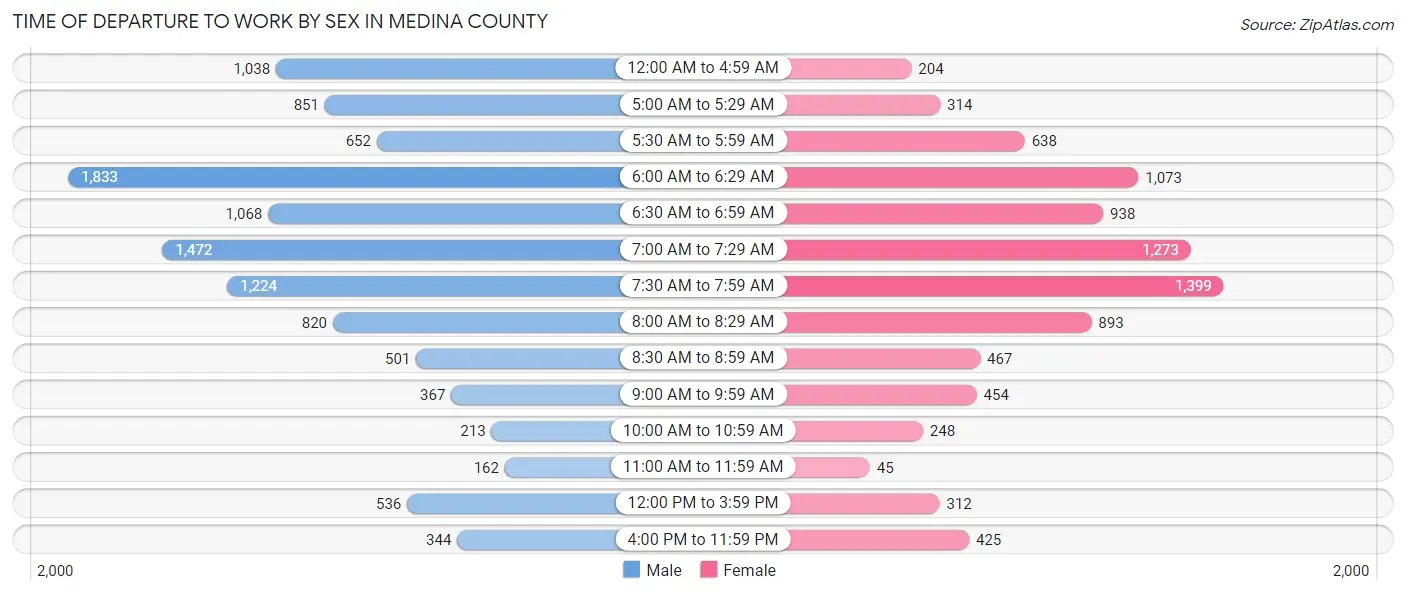
| Time of Departure | Male | Female |
| 12:00 AM to 4:59 AM | 1,038 (9.4%) | 204 (2.4%) |
| 5:00 AM to 5:29 AM | 851 (7.7%) | 314 (3.6%) |
| 5:30 AM to 5:59 AM | 652 (5.9%) | 638 (7.3%) |
| 6:00 AM to 6:29 AM | 1,833 (16.5%) | 1,073 (12.4%) |
| 6:30 AM to 6:59 AM | 1,068 (9.6%) | 938 (10.8%) |
| 7:00 AM to 7:29 AM | 1,472 (13.3%) | 1,273 (14.7%) |
| 7:30 AM to 7:59 AM | 1,224 (11.1%) | 1,399 (16.1%) |
| 8:00 AM to 8:29 AM | 820 (7.4%) | 893 (10.3%) |
| 8:30 AM to 8:59 AM | 501 (4.5%) | 467 (5.4%) |
| 9:00 AM to 9:59 AM | 367 (3.3%) | 454 (5.2%) |
| 10:00 AM to 10:59 AM | 213 (1.9%) | 248 (2.9%) |
| 11:00 AM to 11:59 AM | 162 (1.5%) | 45 (0.5%) |
| 12:00 PM to 3:59 PM | 536 (4.8%) | 312 (3.6%) |
| 4:00 PM to 11:59 PM | 344 (3.1%) | 425 (4.9%) |
| Total | 11,081 (100.0%) | 8,683 (100.0%) |
Housing Occupancy in Medina County
Occupancy by Ownership in Medina County
Of the total 17,296 dwellings in Medina County, owner-occupied units account for 14,194 (82.1%), while renter-occupied units make up 3,102 (17.9%).
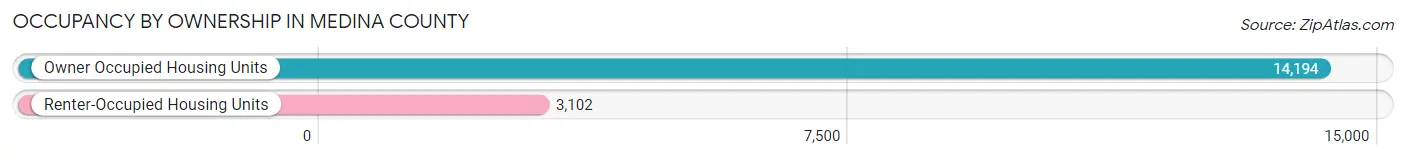
| Occupancy | # Housing Units | % Housing Units |
| Owner Occupied Housing Units | 14,194 | 82.1% |
| Renter-Occupied Housing Units | 3,102 | 17.9% |
| Total Occupied Housing Units | 17,296 | 100.0% |
Occupancy by Household Size in Medina County
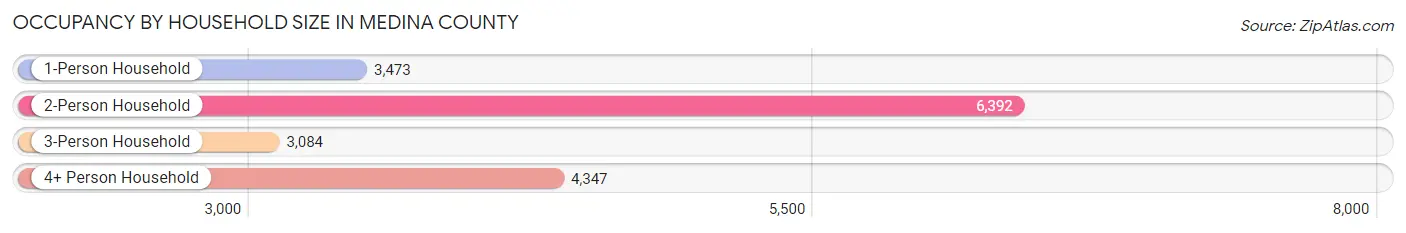
| Household Size | # Housing Units | % Housing Units |
| 1-Person Household | 3,473 | 20.1% |
| 2-Person Household | 6,392 | 37.0% |
| 3-Person Household | 3,084 | 17.8% |
| 4+ Person Household | 4,347 | 25.1% |
| Total Housing Units | 17,296 | 100.0% |
Occupancy by Ownership by Household Size in Medina County
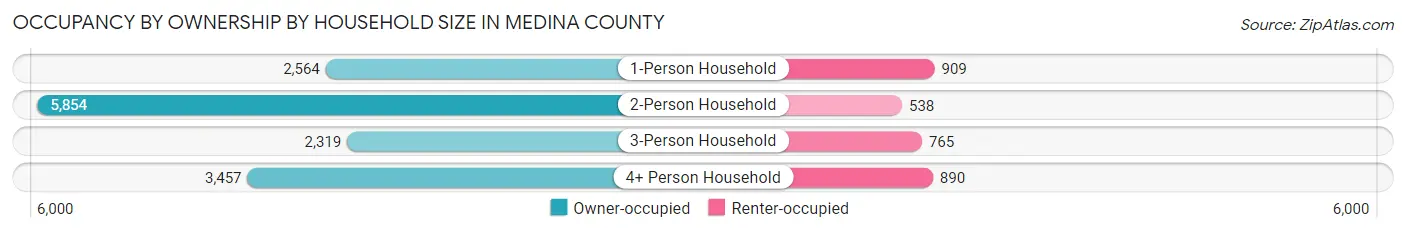
| Household Size | Owner-occupied | Renter-occupied |
| 1-Person Household | 2,564 (73.8%) | 909 (26.2%) |
| 2-Person Household | 5,854 (91.6%) | 538 (8.4%) |
| 3-Person Household | 2,319 (75.2%) | 765 (24.8%) |
| 4+ Person Household | 3,457 (79.5%) | 890 (20.5%) |
| Total Housing Units | 14,194 (82.1%) | 3,102 (17.9%) |
Occupancy by Educational Attainment in Medina County
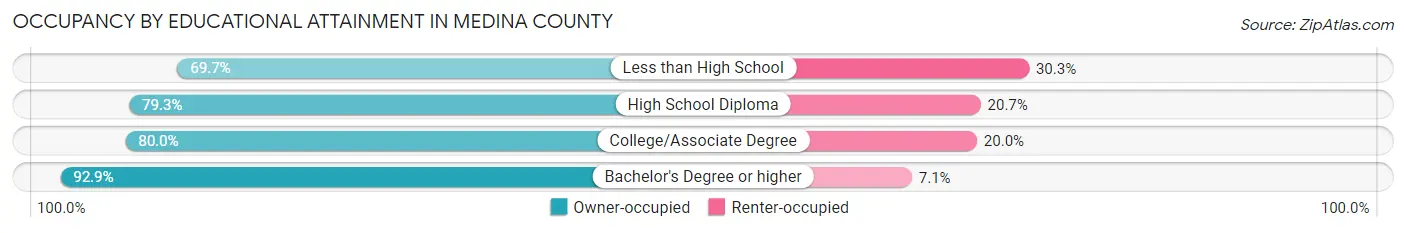
| Household Size | Owner-occupied | Renter-occupied |
| Less than High School | 1,477 (69.7%) | 642 (30.3%) |
| High School Diploma | 3,637 (79.3%) | 950 (20.7%) |
| College/Associate Degree | 4,722 (80.0%) | 1,178 (20.0%) |
| Bachelor's Degree or higher | 4,358 (92.9%) | 332 (7.1%) |
Occupancy by Age of Householder in Medina County
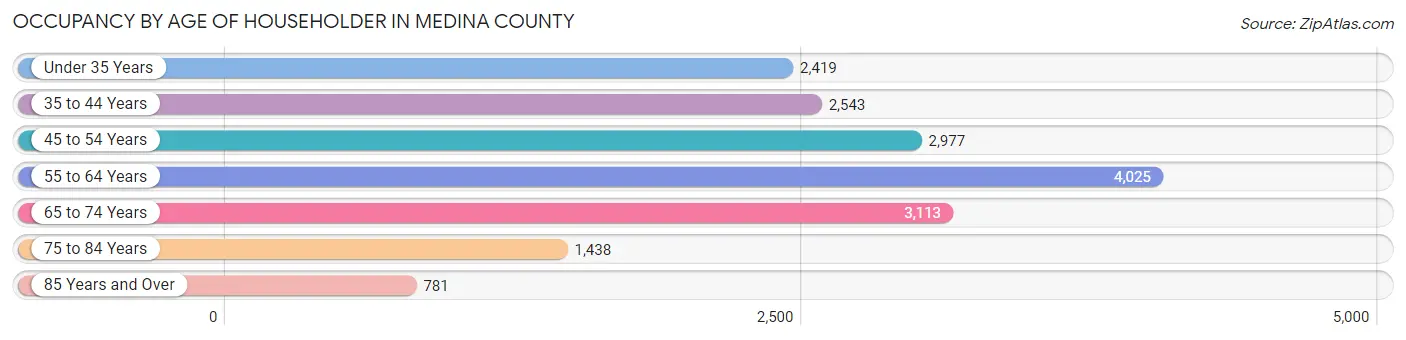
| Age Bracket | # Households | % Households |
| Under 35 Years | 2,419 | 14.0% |
| 35 to 44 Years | 2,543 | 14.7% |
| 45 to 54 Years | 2,977 | 17.2% |
| 55 to 64 Years | 4,025 | 23.3% |
| 65 to 74 Years | 3,113 | 18.0% |
| 75 to 84 Years | 1,438 | 8.3% |
| 85 Years and Over | 781 | 4.5% |
| Total | 17,296 | 100.0% |
Housing Finances in Medina County
Median Income by Occupancy in Medina County
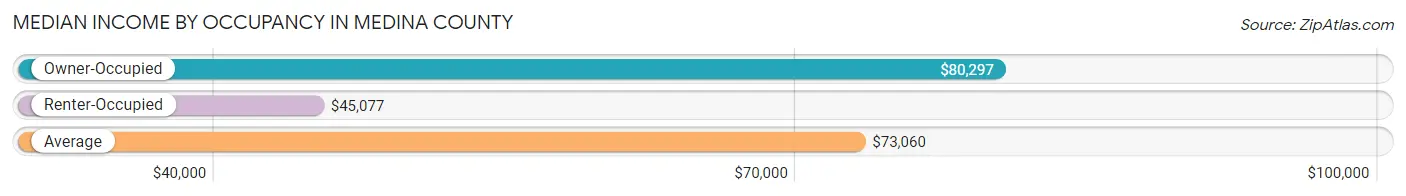
| Occupancy Type | # Households | Median Income |
| Owner-Occupied | 14,194 (82.1%) | $80,297 |
| Renter-Occupied | 3,102 (17.9%) | $45,077 |
| Average | 17,296 (100.0%) | $73,060 |
Occupancy by Householder Income Bracket in Medina County
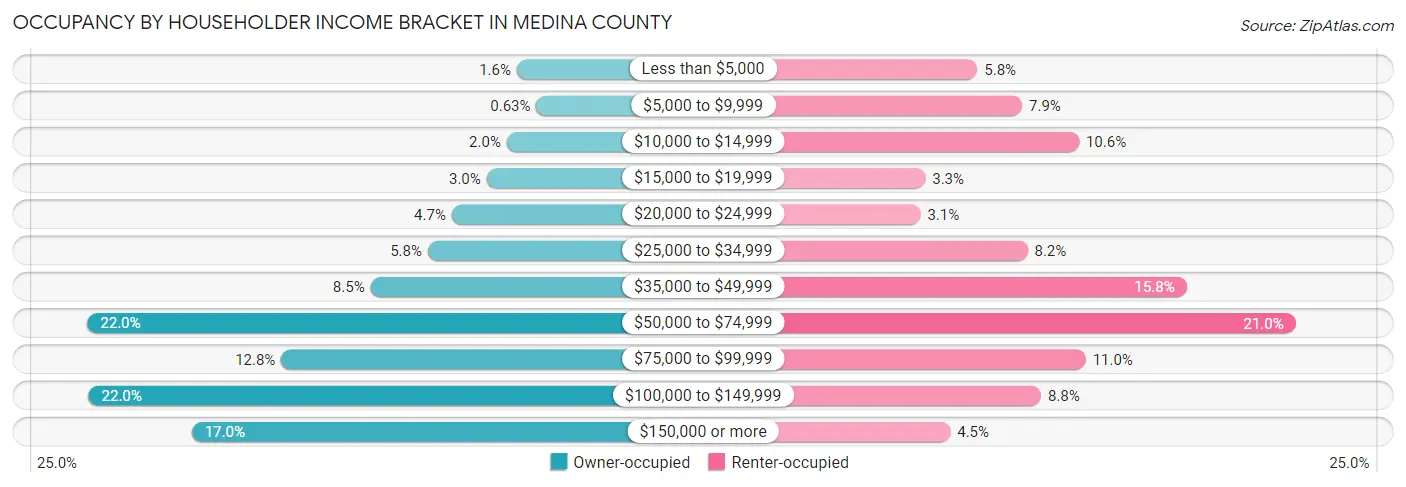
| Income Bracket | Owner-occupied | Renter-occupied |
| Less than $5,000 | 222 (1.6%) | 180 (5.8%) |
| $5,000 to $9,999 | 90 (0.6%) | 246 (7.9%) |
| $10,000 to $14,999 | 290 (2.0%) | 330 (10.6%) |
| $15,000 to $19,999 | 426 (3.0%) | 103 (3.3%) |
| $20,000 to $24,999 | 661 (4.7%) | 96 (3.1%) |
| $25,000 to $34,999 | 823 (5.8%) | 254 (8.2%) |
| $35,000 to $49,999 | 1,211 (8.5%) | 489 (15.8%) |
| $50,000 to $74,999 | 3,124 (22.0%) | 650 (20.9%) |
| $75,000 to $99,999 | 1,814 (12.8%) | 340 (11.0%) |
| $100,000 to $149,999 | 3,115 (22.0%) | 274 (8.8%) |
| $150,000 or more | 2,418 (17.0%) | 140 (4.5%) |
| Total | 14,194 (100.0%) | 3,102 (100.0%) |
Monthly Housing Cost Tiers in Medina County
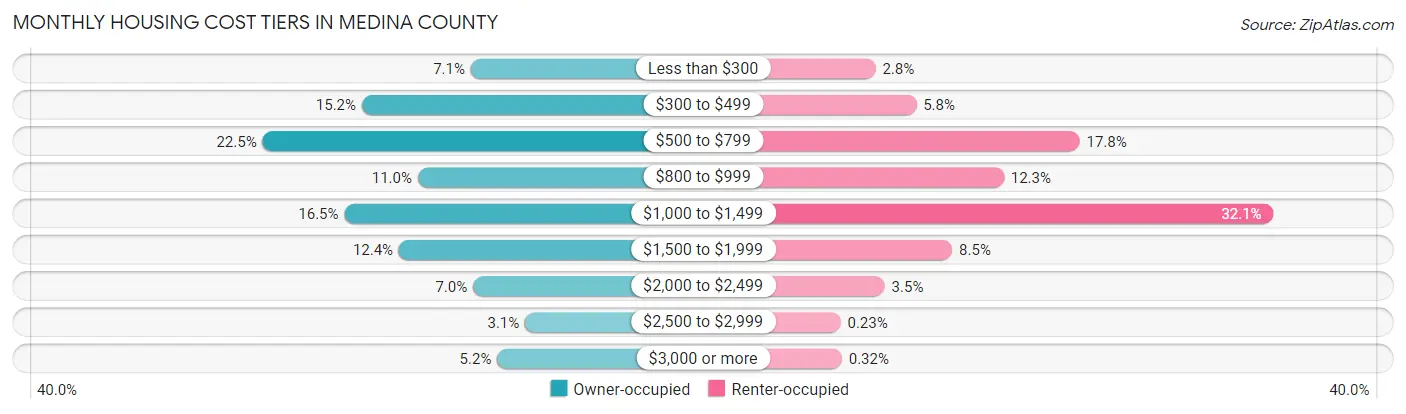
| Monthly Cost | Owner-occupied | Renter-occupied |
| Less than $300 | 1,014 (7.1%) | 87 (2.8%) |
| $300 to $499 | 2,152 (15.2%) | 180 (5.8%) |
| $500 to $799 | 3,191 (22.5%) | 553 (17.8%) |
| $800 to $999 | 1,567 (11.0%) | 380 (12.2%) |
| $1,000 to $1,499 | 2,335 (16.5%) | 996 (32.1%) |
| $1,500 to $1,999 | 1,764 (12.4%) | 262 (8.5%) |
| $2,000 to $2,499 | 989 (7.0%) | 108 (3.5%) |
| $2,500 to $2,999 | 445 (3.1%) | 7 (0.2%) |
| $3,000 or more | 737 (5.2%) | 10 (0.3%) |
| Total | 14,194 (100.0%) | 3,102 (100.0%) |
Physical Housing Characteristics in Medina County
Housing Structures in Medina County
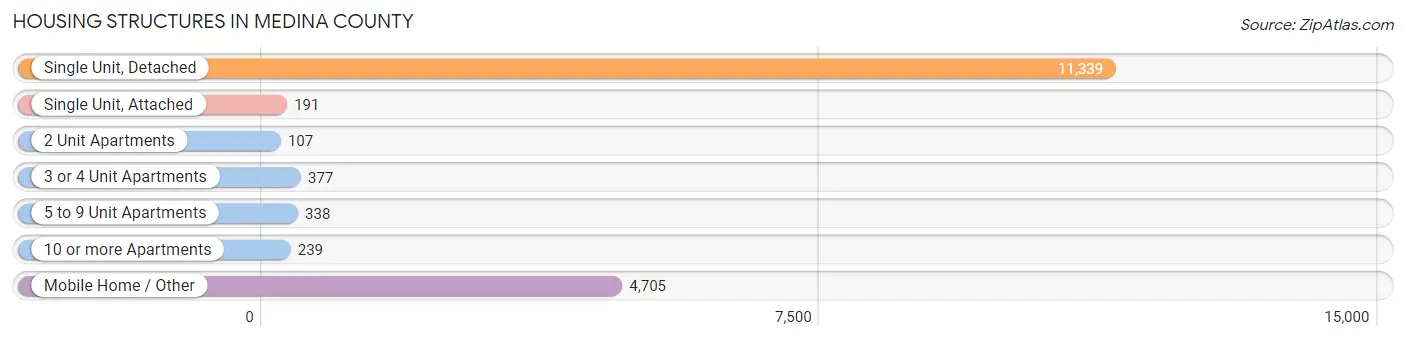
| Structure Type | # Housing Units | % Housing Units |
| Single Unit, Detached | 11,339 | 65.6% |
| Single Unit, Attached | 191 | 1.1% |
| 2 Unit Apartments | 107 | 0.6% |
| 3 or 4 Unit Apartments | 377 | 2.2% |
| 5 to 9 Unit Apartments | 338 | 1.9% |
| 10 or more Apartments | 239 | 1.4% |
| Mobile Home / Other | 4,705 | 27.2% |
| Total | 17,296 | 100.0% |
Housing Structures by Occupancy in Medina County
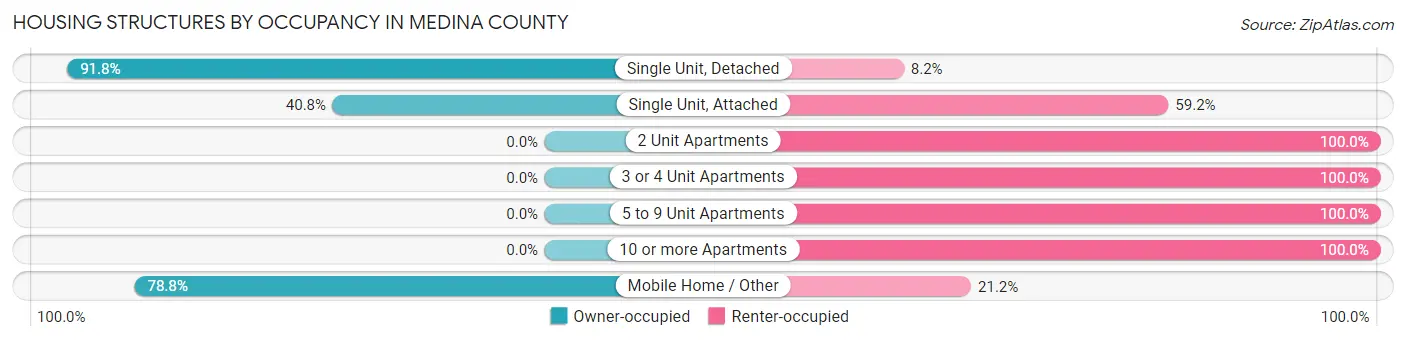
| Structure Type | Owner-occupied | Renter-occupied |
| Single Unit, Detached | 10,407 (91.8%) | 932 (8.2%) |
| Single Unit, Attached | 78 (40.8%) | 113 (59.2%) |
| 2 Unit Apartments | 0 (0.0%) | 107 (100.0%) |
| 3 or 4 Unit Apartments | 0 (0.0%) | 377 (100.0%) |
| 5 to 9 Unit Apartments | 0 (0.0%) | 338 (100.0%) |
| 10 or more Apartments | 0 (0.0%) | 239 (100.0%) |
| Mobile Home / Other | 3,709 (78.8%) | 996 (21.2%) |
| Total | 14,194 (82.1%) | 3,102 (17.9%) |
Housing Structures by Number of Rooms in Medina County
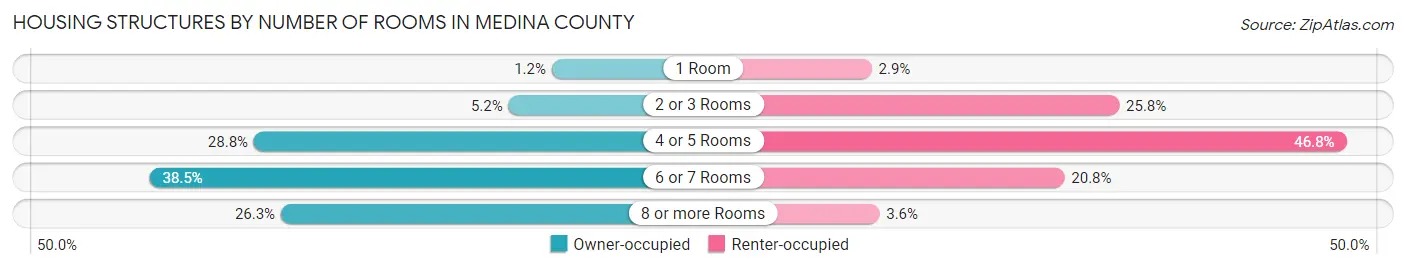
| Number of Rooms | Owner-occupied | Renter-occupied |
| 1 Room | 176 (1.2%) | 91 (2.9%) |
| 2 or 3 Rooms | 744 (5.2%) | 801 (25.8%) |
| 4 or 5 Rooms | 4,086 (28.8%) | 1,453 (46.8%) |
| 6 or 7 Rooms | 5,457 (38.5%) | 644 (20.8%) |
| 8 or more Rooms | 3,731 (26.3%) | 113 (3.6%) |
| Total | 14,194 (100.0%) | 3,102 (100.0%) |
Housing Structure by Heating Type in Medina County
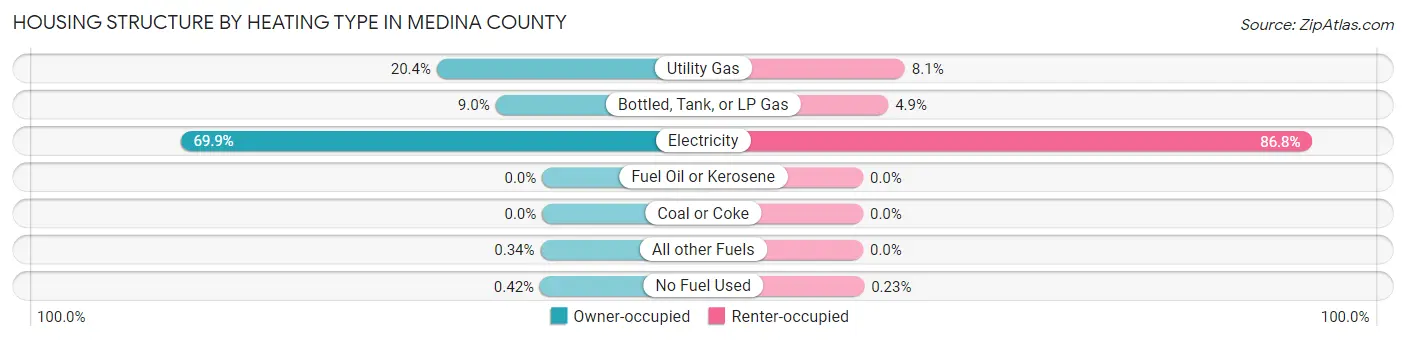
| Heating Type | Owner-occupied | Renter-occupied |
| Utility Gas | 2,889 (20.3%) | 251 (8.1%) |
| Bottled, Tank, or LP Gas | 1,279 (9.0%) | 151 (4.9%) |
| Electricity | 9,919 (69.9%) | 2,693 (86.8%) |
| Fuel Oil or Kerosene | 0 (0.0%) | 0 (0.0%) |
| Coal or Coke | 0 (0.0%) | 0 (0.0%) |
| All other Fuels | 48 (0.3%) | 0 (0.0%) |
| No Fuel Used | 59 (0.4%) | 7 (0.2%) |
| Total | 14,194 (100.0%) | 3,102 (100.0%) |
Household Vehicle Usage in Medina County
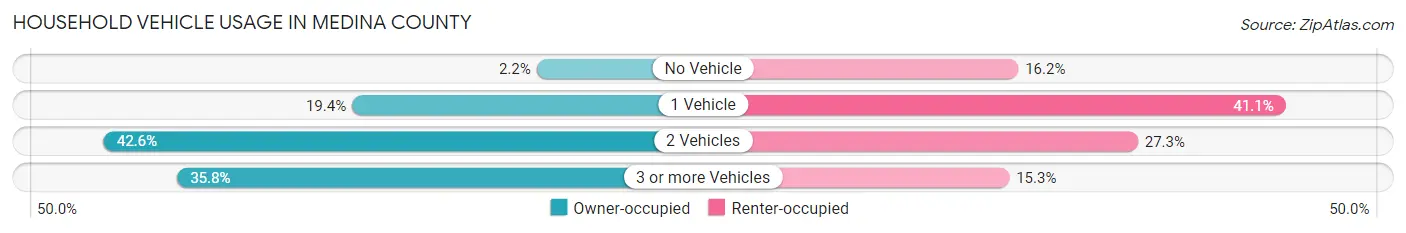
| Vehicles per Household | Owner-occupied | Renter-occupied |
| No Vehicle | 313 (2.2%) | 502 (16.2%) |
| 1 Vehicle | 2,759 (19.4%) | 1,276 (41.1%) |
| 2 Vehicles | 6,047 (42.6%) | 848 (27.3%) |
| 3 or more Vehicles | 5,075 (35.7%) | 476 (15.3%) |
| Total | 14,194 (100.0%) | 3,102 (100.0%) |
Real Estate & Mortgages in Medina County
Real Estate and Mortgage Overview in Medina County
| Characteristic | Without Mortgage | With Mortgage |
| Housing Units | 7,875 | 6,319 |
| Median Property Value | $154,800 | $227,400 |
| Median Household Income | $66,262 | $1,512 |
| Monthly Housing Costs | $575 | $737 |
| Real Estate Taxes | $1,939 | $378 |
Property Value by Mortgage Status in Medina County
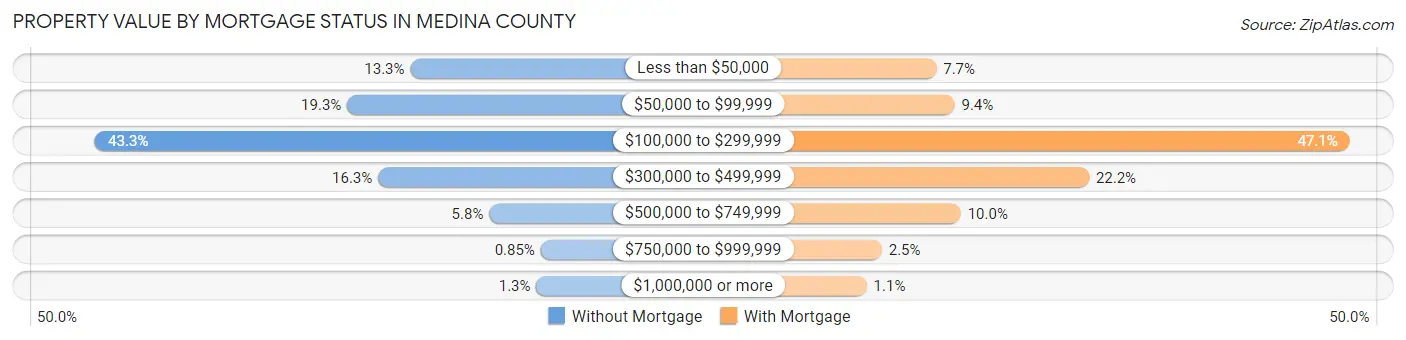
| Property Value | Without Mortgage | With Mortgage |
| Less than $50,000 | 1,044 (13.3%) | 486 (7.7%) |
| $50,000 to $99,999 | 1,518 (19.3%) | 596 (9.4%) |
| $100,000 to $299,999 | 3,408 (43.3%) | 2,974 (47.1%) |
| $300,000 to $499,999 | 1,286 (16.3%) | 1,405 (22.2%) |
| $500,000 to $749,999 | 453 (5.8%) | 633 (10.0%) |
| $750,000 to $999,999 | 67 (0.9%) | 158 (2.5%) |
| $1,000,000 or more | 99 (1.3%) | 67 (1.1%) |
| Total | 7,875 (100.0%) | 6,319 (100.0%) |
Household Income by Mortgage Status in Medina County
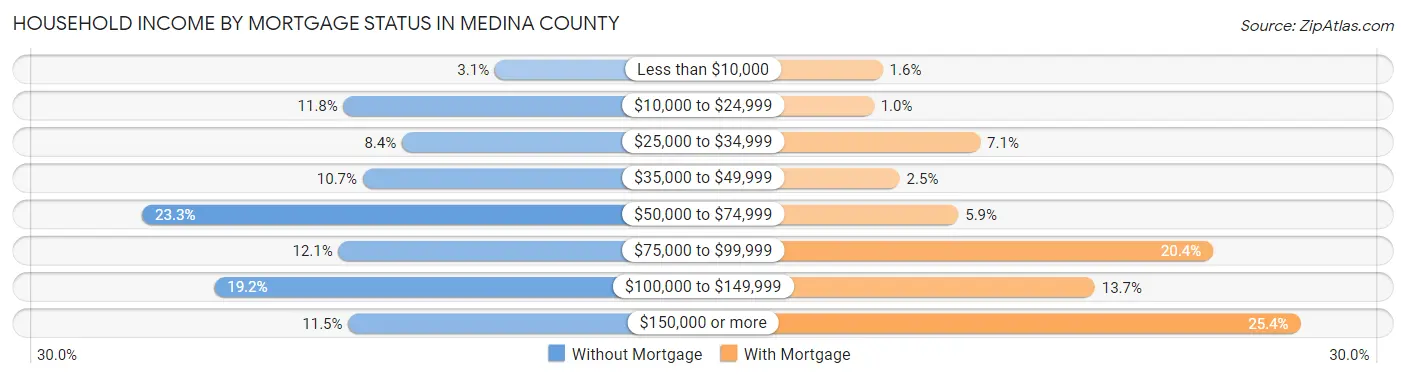
| Household Income | Without Mortgage | With Mortgage |
| Less than $10,000 | 246 (3.1%) | 98 (1.5%) |
| $10,000 to $24,999 | 927 (11.8%) | 66 (1.0%) |
| $25,000 to $34,999 | 664 (8.4%) | 450 (7.1%) |
| $35,000 to $49,999 | 840 (10.7%) | 159 (2.5%) |
| $50,000 to $74,999 | 1,833 (23.3%) | 371 (5.9%) |
| $75,000 to $99,999 | 950 (12.1%) | 1,291 (20.4%) |
| $100,000 to $149,999 | 1,509 (19.2%) | 864 (13.7%) |
| $150,000 or more | 906 (11.5%) | 1,606 (25.4%) |
| Total | 7,875 (100.0%) | 6,319 (100.0%) |
Property Value to Household Income Ratio in Medina County
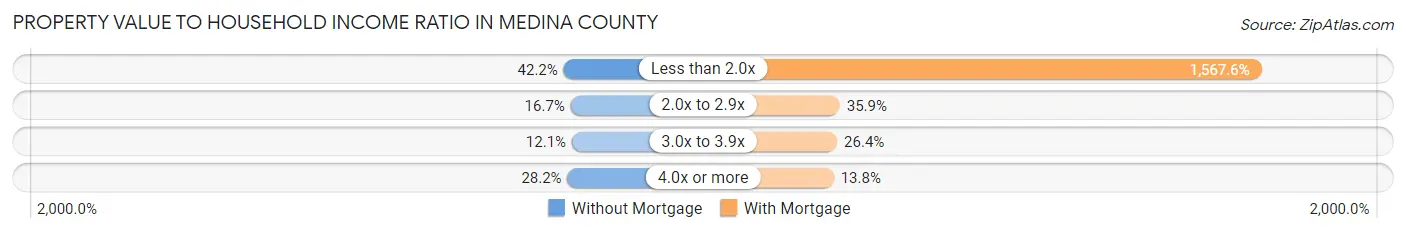
| Value-to-Income Ratio | Without Mortgage | With Mortgage |
| Less than 2.0x | 3,320 (42.2%) | 99,057 (1,567.6%) |
| 2.0x to 2.9x | 1,312 (16.7%) | 2,269 (35.9%) |
| 3.0x to 3.9x | 955 (12.1%) | 1,667 (26.4%) |
| 4.0x or more | 2,221 (28.2%) | 871 (13.8%) |
| Total | 7,875 (100.0%) | 6,319 (100.0%) |
Real Estate Taxes by Mortgage Status in Medina County
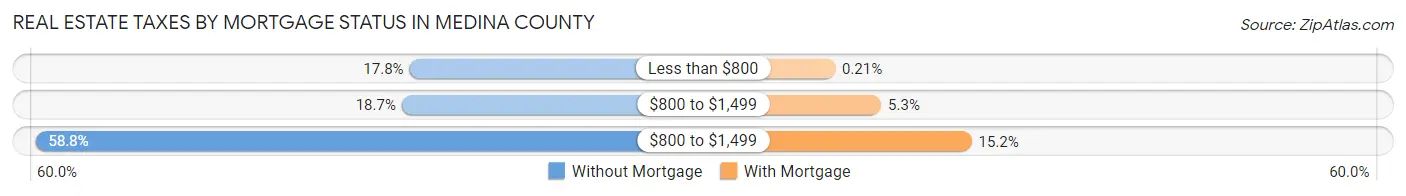
| Property Taxes | Without Mortgage | With Mortgage |
| Less than $800 | 1,404 (17.8%) | 13 (0.2%) |
| $800 to $1,499 | 1,470 (18.7%) | 333 (5.3%) |
| $800 to $1,499 | 4,632 (58.8%) | 959 (15.2%) |
| Total | 7,875 (100.0%) | 6,319 (100.0%) |
Health & Disability in Medina County
Health Insurance Coverage by Age in Medina County
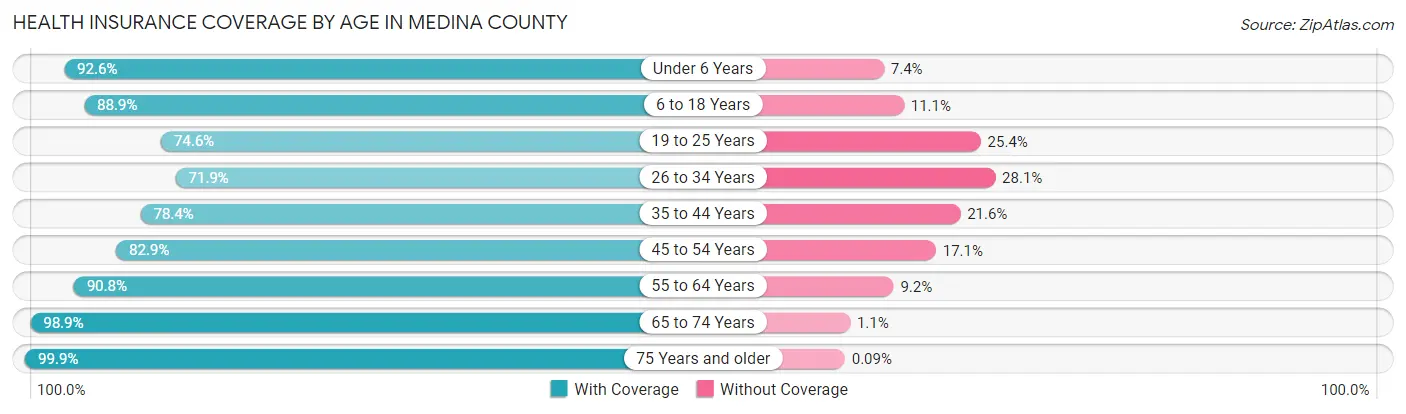
| Age Bracket | With Coverage | Without Coverage |
| Under 6 Years | 3,201 (92.6%) | 255 (7.4%) |
| 6 to 18 Years | 7,928 (88.9%) | 989 (11.1%) |
| 19 to 25 Years | 3,129 (74.6%) | 1,067 (25.4%) |
| 26 to 34 Years | 3,638 (71.9%) | 1,424 (28.1%) |
| 35 to 44 Years | 4,490 (78.4%) | 1,238 (21.6%) |
| 45 to 54 Years | 5,291 (82.9%) | 1,089 (17.1%) |
| 55 to 64 Years | 6,278 (90.8%) | 634 (9.2%) |
| 65 to 74 Years | 5,136 (98.9%) | 55 (1.1%) |
| 75 Years and older | 3,277 (99.9%) | 3 (0.1%) |
| Total | 42,368 (86.3%) | 6,754 (13.8%) |
Health Insurance Coverage by Citizenship Status in Medina County
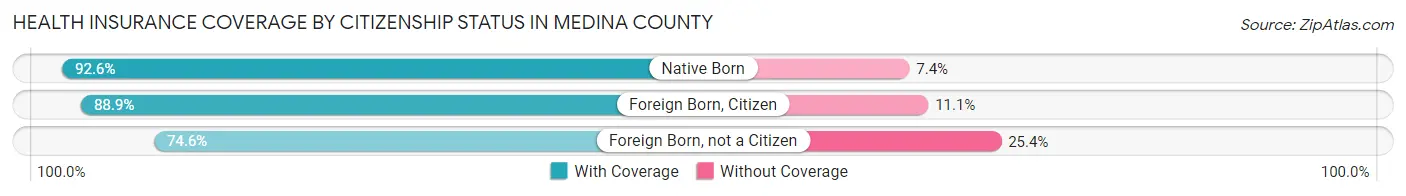
| Citizenship Status | With Coverage | Without Coverage |
| Native Born | 3,201 (92.6%) | 255 (7.4%) |
| Foreign Born, Citizen | 7,928 (88.9%) | 989 (11.1%) |
| Foreign Born, not a Citizen | 3,129 (74.6%) | 1,067 (25.4%) |
Health Insurance Coverage by Household Income in Medina County
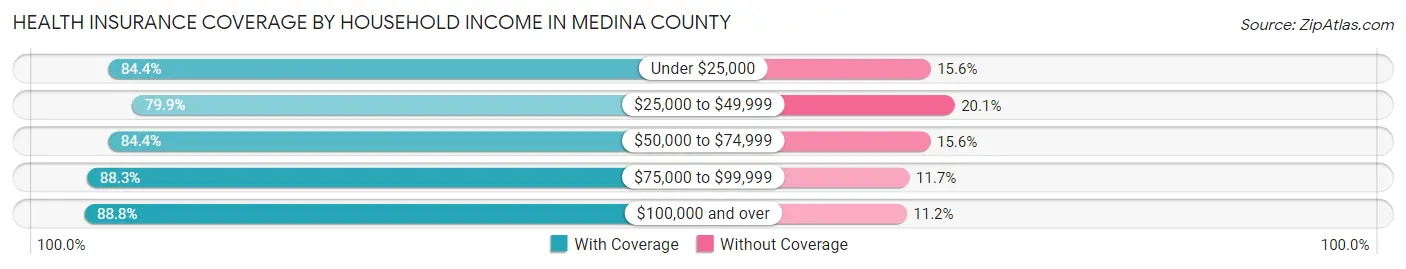
| Household Income | With Coverage | Without Coverage |
| Under $25,000 | 4,668 (84.4%) | 865 (15.6%) |
| $25,000 to $49,999 | 5,020 (79.9%) | 1,265 (20.1%) |
| $50,000 to $74,999 | 7,861 (84.4%) | 1,453 (15.6%) |
| $75,000 to $99,999 | 5,416 (88.3%) | 716 (11.7%) |
| $100,000 and over | 19,295 (88.8%) | 2,425 (11.2%) |
Public vs Private Health Insurance Coverage by Age in Medina County
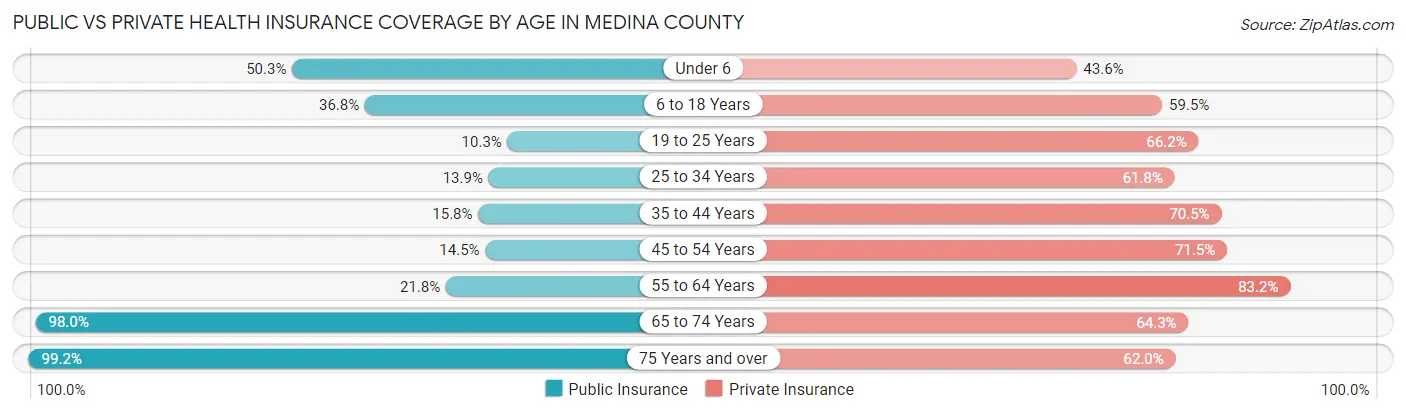
| Age Bracket | Public Insurance | Private Insurance |
| Under 6 | 1,739 (50.3%) | 1,505 (43.5%) |
| 6 to 18 Years | 3,282 (36.8%) | 5,302 (59.5%) |
| 19 to 25 Years | 434 (10.3%) | 2,778 (66.2%) |
| 25 to 34 Years | 701 (13.9%) | 3,128 (61.8%) |
| 35 to 44 Years | 904 (15.8%) | 4,036 (70.5%) |
| 45 to 54 Years | 923 (14.5%) | 4,564 (71.5%) |
| 55 to 64 Years | 1,505 (21.8%) | 5,753 (83.2%) |
| 65 to 74 Years | 5,085 (98.0%) | 3,340 (64.3%) |
| 75 Years and over | 3,255 (99.2%) | 2,032 (62.0%) |
| Total | 17,828 (36.3%) | 32,438 (66.0%) |
Disability Status by Sex by Age in Medina County
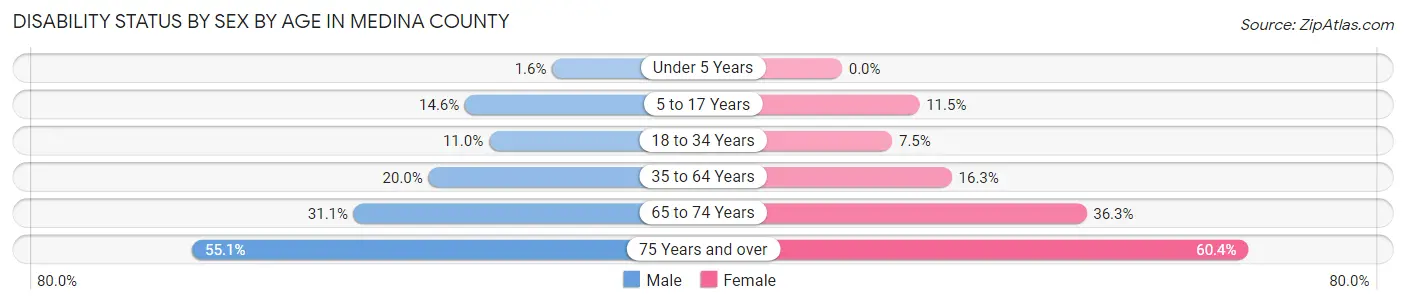
| Age Bracket | Male | Female |
| Under 5 Years | 24 (1.6%) | 0 (0.0%) |
| 5 to 17 Years | 648 (14.6%) | 500 (11.5%) |
| 18 to 34 Years | 558 (11.0%) | 365 (7.5%) |
| 35 to 64 Years | 1,916 (20.0%) | 1,541 (16.3%) |
| 65 to 74 Years | 807 (31.1%) | 943 (36.3%) |
| 75 Years and over | 797 (55.1%) | 1,107 (60.4%) |
Disability Class by Sex by Age in Medina County
Disability Class: Hearing Difficulty
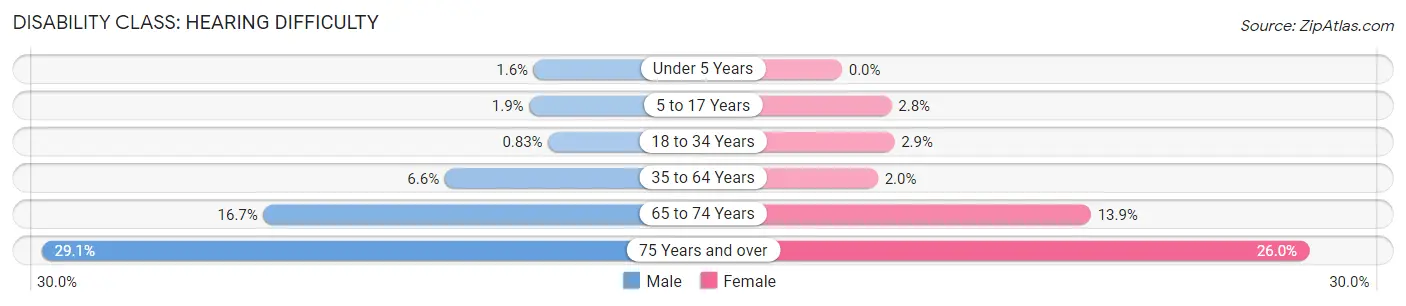
| Age Bracket | Male | Female |
| Under 5 Years | 24 (1.6%) | 0 (0.0%) |
| 5 to 17 Years | 84 (1.9%) | 120 (2.8%) |
| 18 to 34 Years | 42 (0.8%) | 143 (2.9%) |
| 35 to 64 Years | 631 (6.6%) | 189 (2.0%) |
| 65 to 74 Years | 433 (16.7%) | 360 (13.9%) |
| 75 Years and over | 420 (29.0%) | 477 (26.0%) |
Disability Class: Vision Difficulty
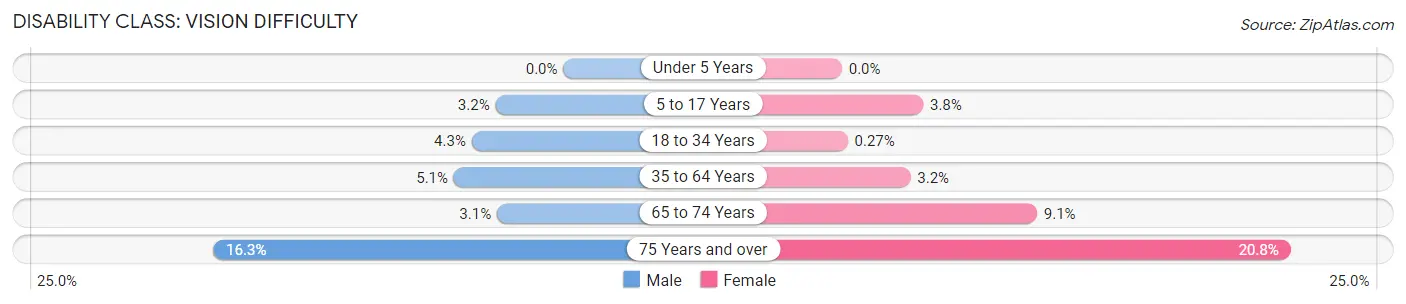
| Age Bracket | Male | Female |
| Under 5 Years | 0 (0.0%) | 0 (0.0%) |
| 5 to 17 Years | 140 (3.2%) | 164 (3.8%) |
| 18 to 34 Years | 215 (4.3%) | 13 (0.3%) |
| 35 to 64 Years | 486 (5.1%) | 300 (3.2%) |
| 65 to 74 Years | 80 (3.1%) | 235 (9.0%) |
| 75 Years and over | 235 (16.3%) | 382 (20.8%) |
Disability Class: Cognitive Difficulty
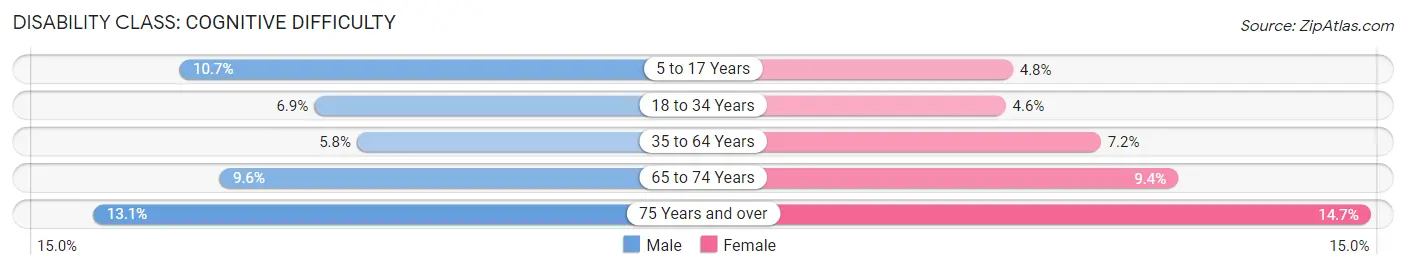
| Age Bracket | Male | Female |
| 5 to 17 Years | 474 (10.7%) | 207 (4.8%) |
| 18 to 34 Years | 351 (6.9%) | 223 (4.6%) |
| 35 to 64 Years | 550 (5.8%) | 681 (7.2%) |
| 65 to 74 Years | 248 (9.6%) | 243 (9.4%) |
| 75 Years and over | 189 (13.1%) | 270 (14.7%) |
Disability Class: Ambulatory Difficulty
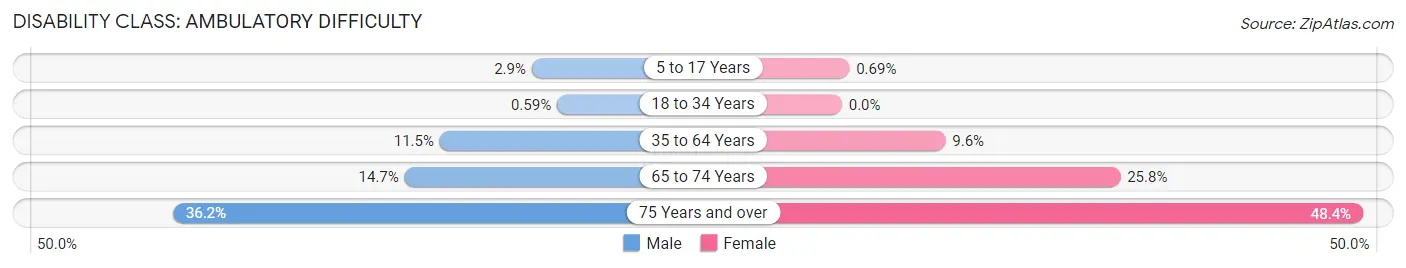
| Age Bracket | Male | Female |
| 5 to 17 Years | 130 (2.9%) | 30 (0.7%) |
| 18 to 34 Years | 30 (0.6%) | 0 (0.0%) |
| 35 to 64 Years | 1,098 (11.5%) | 908 (9.6%) |
| 65 to 74 Years | 382 (14.7%) | 671 (25.8%) |
| 75 Years and over | 524 (36.2%) | 887 (48.4%) |
Disability Class: Self-Care Difficulty
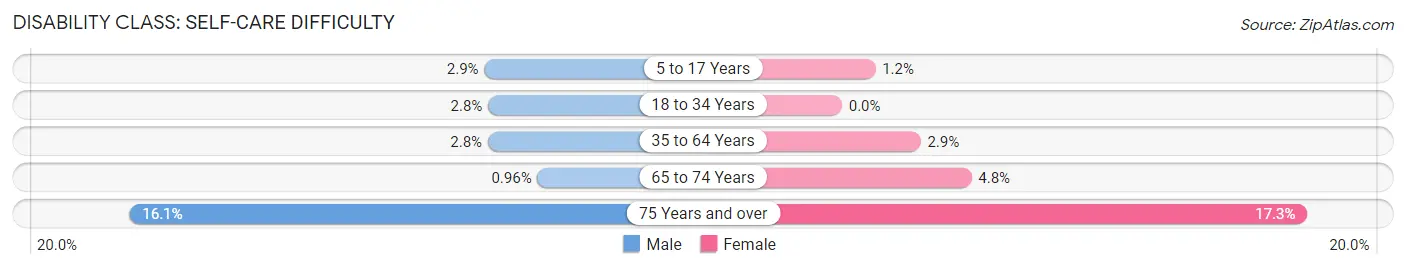
| Age Bracket | Male | Female |
| 5 to 17 Years | 130 (2.9%) | 54 (1.2%) |
| 18 to 34 Years | 141 (2.8%) | 0 (0.0%) |
| 35 to 64 Years | 268 (2.8%) | 276 (2.9%) |
| 65 to 74 Years | 25 (1.0%) | 125 (4.8%) |
| 75 Years and over | 233 (16.1%) | 317 (17.3%) |
Technology Access in Medina County
Computing Device Access in Medina County
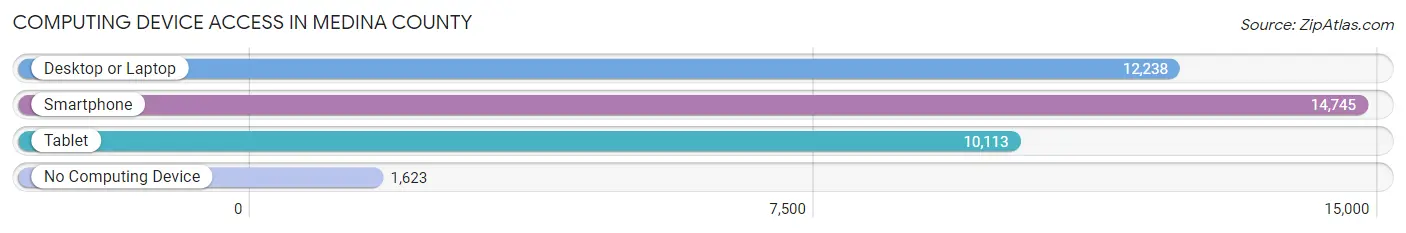
| Device Type | # Households | % Households |
| Desktop or Laptop | 12,238 | 70.8% |
| Smartphone | 14,745 | 85.3% |
| Tablet | 10,113 | 58.5% |
| No Computing Device | 1,623 | 9.4% |
| Total | 17,296 | 100.0% |
Internet Access in Medina County
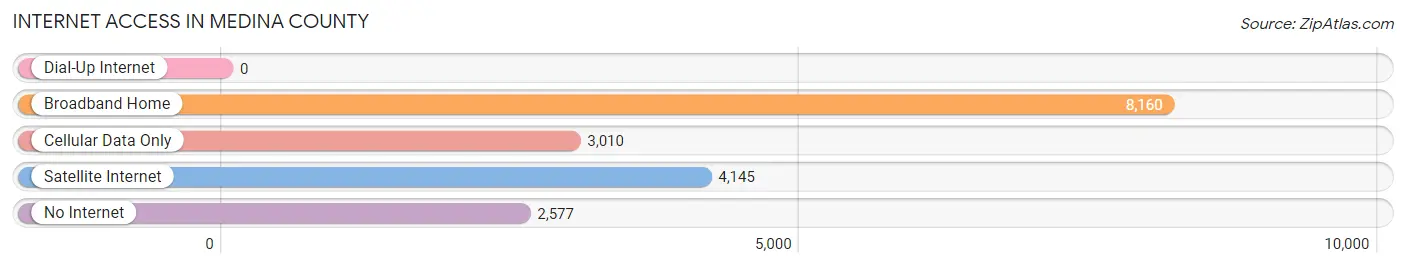
| Internet Type | # Households | % Households |
| Dial-Up Internet | 0 | 0.0% |
| Broadband Home | 8,160 | 47.2% |
| Cellular Data Only | 3,010 | 17.4% |
| Satellite Internet | 4,145 | 24.0% |
| No Internet | 2,577 | 14.9% |
| Total | 17,296 | 100.0% |
Medina County Summary
Medina County is located in the south-central region of Texas, and is part of the San Antonio-New Braunfels Metropolitan Statistical Area. The county is bordered by Bandera, Uvalde, Real, and Kerr counties. The county seat is Hondo, and the largest city is Castroville. As of the 2010 census, the population of Medina County was 46,006.
Geography
Medina County is located in the Edwards Plateau region of Texas, and is characterized by rolling hills and canyons. The county is drained by the Medina River, which flows through the county from west to east. The county is also home to several creeks, including the Hondo Creek, which flows through the county from north to south. The county is home to several state parks, including the Hill Country State Natural Area, the Medina River Natural Area, and the Government Canyon State Natural Area.
The climate of Medina County is characterized by hot summers and mild winters. The average annual temperature is 68°F, and the average annual precipitation is 28 inches.
Economy
The economy of Medina County is largely based on agriculture and tourism. The county is home to several large ranches, and is a major producer of beef, sheep, and goats. The county is also home to several wineries, and is a popular destination for wine-tasting tours.
Tourism is also an important part of the county's economy. The county is home to several state parks, and is a popular destination for outdoor recreation. The county is also home to several historic sites, including the Medina County Courthouse and the Medina County Museum.
Demographics
As of the 2010 census, the population of Medina County was 46,006. The racial makeup of the county was 79.2% White, 0.7% African American, 0.7% Native American, 0.4% Asian, 0.1% Pacific Islander, 16.7% from other races, and 2.3% from two or more races. Hispanic or Latino of any race were 44.2% of the population.
The median income for a household in the county was $41,945, and the median income for a family was $48,945. The per capita income for the county was $19,945. About 16.2% of families and 19.7% of the population were below the poverty line, including 25.3% of those under age 18 and 14.2% of those age 65 or over.
Conclusion
Medina County is a rural county located in the south-central region of Texas. The county is characterized by rolling hills and canyons, and is home to several state parks. The economy of the county is largely based on agriculture and tourism, and the county is a major producer of beef, sheep, and goats. As of the 2010 census, the population of Medina County was 46,006, and the median income for a household was $41,945.
Common Questions
What is Per Capita Income in Medina County?
Per Capita income in Medina County is $31,516.
What is the Median Family Income in Medina County?
Median Family Income in Medina County is $88,954.
What is the Median Household income in Medina County?
Median Household Income in Medina County is $73,060.
What is Income or Wage Gap in Medina County?
Income or Wage Gap in Medina County is 28.5%.
Women in Medina County earn 71.5 cents for every dollar earned by a man.
What is Family Income Deficit in Medina County?
Family Income Deficit in Medina County is $12,563.
Families that are below poverty line in Medina County earn $12,563 less on average than the poverty threshold level.
What is Inequality or Gini Index in Medina County?
Inequality or Gini Index in Medina County is 0.42.
What is the Total Population of Medina County?
Total Population of Medina County is 51,432.
What is the Total Male Population of Medina County?
Total Male Population of Medina County is 26,705.
What is the Total Female Population of Medina County?
Total Female Population of Medina County is 24,727.
What is the Ratio of Males per 100 Females in Medina County?
There are 108.00 Males per 100 Females in Medina County.
What is the Ratio of Females per 100 Males in Medina County?
There are 92.59 Females per 100 Males in Medina County.
What is the Median Population Age in Medina County?
Median Population Age in Medina County is 39.4 Years.
What is the Average Family Size in Medina County
Average Family Size in Medina County is 3.3 People.
What is the Average Household Size in Medina County
Average Household Size in Medina County is 2.8 People.
How Large is the Labor Force in Medina County?
There are 22,926 People in the Labor Forcein in Medina County.
What is the Percentage of People in the Labor Force in Medina County?
55.8% of People are in the Labor Force in Medina County.
What is the Unemployment Rate in Medina County?
Unemployment Rate in Medina County is 2.4%.