McMullen County, TX Map & Demographics
McMullen County Map
McMullen County Overview
$27,029
PER CAPITA INCOME
$66,406
AVG FAMILY INCOME
$60,313
AVG HOUSEHOLD INCOME
65.5%
WAGE / INCOME GAP [ % ]
34.5¢/ $1
WAGE / INCOME GAP [ $ ]
0.50
INEQUALITY / GINI INDEX
670
TOTAL POPULATION
296
MALE POPULATION
374
FEMALE POPULATION
79.14
MALES / 100 FEMALES
126.35
FEMALES / 100 MALES
36.5
MEDIAN AGE
4.0
AVG FAMILY SIZE
3.3
AVG HOUSEHOLD SIZE
253
LABOR FORCE [ PEOPLE ]
55.1%
PERCENT IN LABOR FORCE
2.4%
UNEMPLOYMENT RATE
McMullen County Area Codes
Income in McMullen County
Income Overview in McMullen County
Per Capita Income in McMullen County is $27,029, while median incomes of families and households are $66,406 and $60,313 respectively.
| Characteristic | Number | Measure |
| Per Capita Income | 670 | $27,029 |
| Median Family Income | 155 | $66,406 |
| Mean Family Income | 155 | $86,013 |
| Median Household Income | 202 | $60,313 |
| Mean Household Income | 202 | $80,275 |
| Income Deficit | 155 | $0 |
| Wage / Income Gap (%) | 670 | 65.46% |
| Wage / Income Gap ($) | 670 | 34.54¢ per $1 |
| Gini / Inequality Index | 670 | 0.50 |
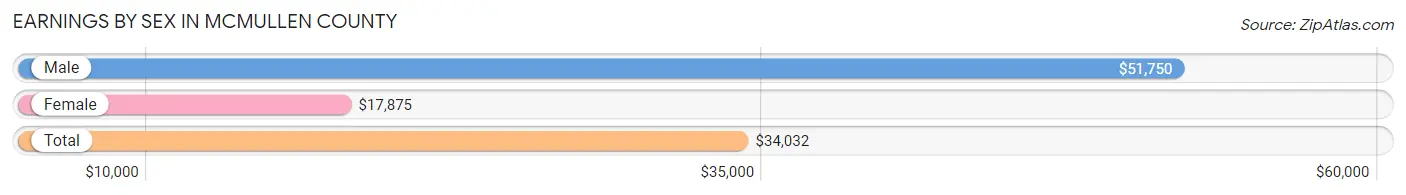
Earnings by Sex in McMullen County
Average Earnings in McMullen County are $34,032, $51,750 for men and $17,875 for women, a difference of 65.5%.
| Sex | Number | Average Earnings |
| Male | 171 (63.3%) | $51,750 |
| Female | 99 (36.7%) | $17,875 |
| Total | 270 (100.0%) | $34,032 |
Earnings by Sex by Income Bracket in McMullen County
The most common earnings brackets in McMullen County are $100,000+ for men (31 | 18.1%) and $30,000 to $34,999 for women (21 | 21.2%).

| Income | Male | Female |
| $2,499 or less | 8 (4.7%) | 8 (8.1%) |
| $2,500 to $4,999 | 0 (0.0%) | 6 (6.1%) |
| $5,000 to $7,499 | 0 (0.0%) | 2 (2.0%) |
| $7,500 to $9,999 | 3 (1.8%) | 6 (6.1%) |
| $10,000 to $12,499 | 0 (0.0%) | 3 (3.0%) |
| $12,500 to $14,999 | 6 (3.5%) | 20 (20.2%) |
| $15,000 to $17,499 | 7 (4.1%) | 3 (3.0%) |
| $17,500 to $19,999 | 0 (0.0%) | 10 (10.1%) |
| $20,000 to $22,499 | 10 (5.9%) | 0 (0.0%) |
| $22,500 to $24,999 | 6 (3.5%) | 3 (3.0%) |
| $25,000 to $29,999 | 5 (2.9%) | 5 (5.1%) |
| $30,000 to $34,999 | 15 (8.8%) | 21 (21.2%) |
| $35,000 to $39,999 | 0 (0.0%) | 0 (0.0%) |
| $40,000 to $44,999 | 6 (3.5%) | 10 (10.1%) |
| $45,000 to $49,999 | 16 (9.4%) | 0 (0.0%) |
| $50,000 to $54,999 | 23 (13.5%) | 0 (0.0%) |
| $55,000 to $64,999 | 20 (11.7%) | 2 (2.0%) |
| $65,000 to $74,999 | 0 (0.0%) | 0 (0.0%) |
| $75,000 to $99,999 | 15 (8.8%) | 0 (0.0%) |
| $100,000+ | 31 (18.1%) | 0 (0.0%) |
| Total | 171 (100.0%) | 99 (100.0%) |
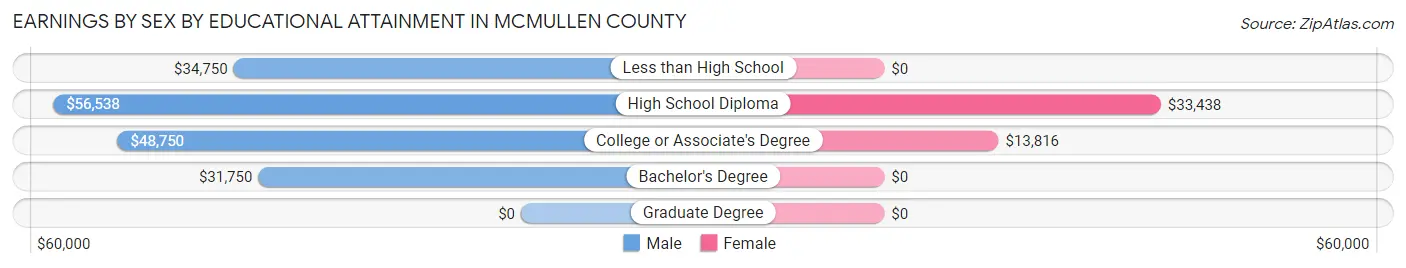
Earnings by Sex by Educational Attainment in McMullen County
| Educational Attainment | Male Income | Female Income |
| Less than High School | $34,750 | $0 |
| High School Diploma | $56,538 | $33,438 |
| College or Associate's Degree | $48,750 | $13,816 |
| Bachelor's Degree | $31,750 | $0 |
| Graduate Degree | - | - |
| Total | $53,403 | $0 |
Family Income in McMullen County
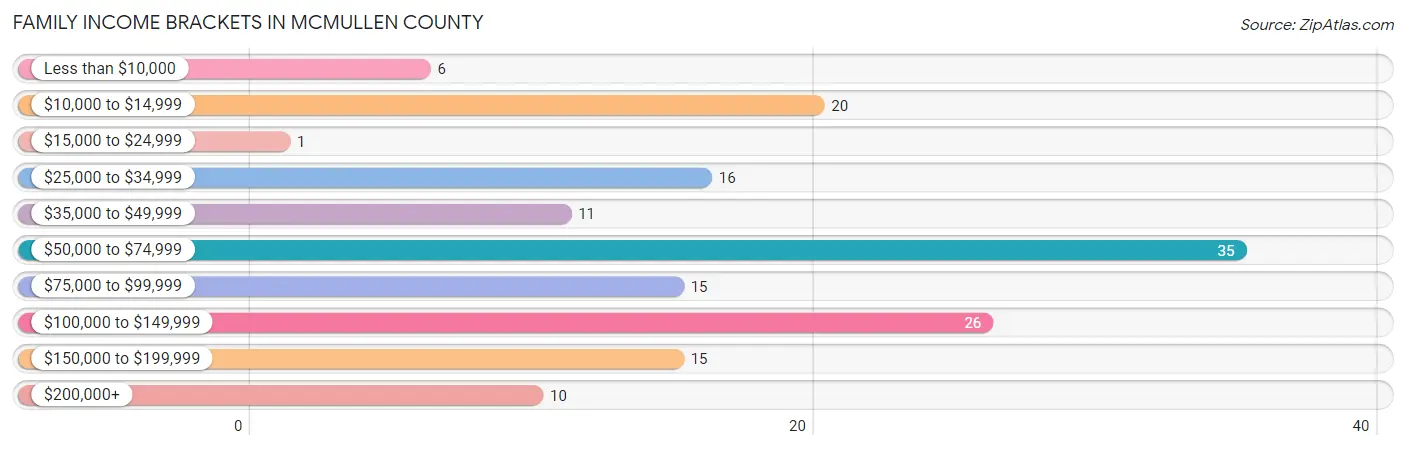
Family Income Brackets in McMullen County
According to the McMullen County family income data, there are 35 families falling into the $50,000 to $74,999 income range, which is the most common income bracket and makes up 22.6% of all families. Conversely, the $15,000 to $24,999 income bracket is the least frequent group with only 1 families (0.6%) belonging to this category.
| Income Bracket | # Families | % Families |
| Less than $10,000 | 6 | 3.9% |
| $10,000 to $14,999 | 20 | 12.9% |
| $15,000 to $24,999 | 1 | 0.6% |
| $25,000 to $34,999 | 16 | 10.3% |
| $35,000 to $49,999 | 11 | 7.1% |
| $50,000 to $74,999 | 35 | 22.6% |
| $75,000 to $99,999 | 15 | 9.7% |
| $100,000 to $149,999 | 26 | 16.8% |
| $150,000 to $199,999 | 15 | 9.7% |
| $200,000+ | 10 | 6.5% |
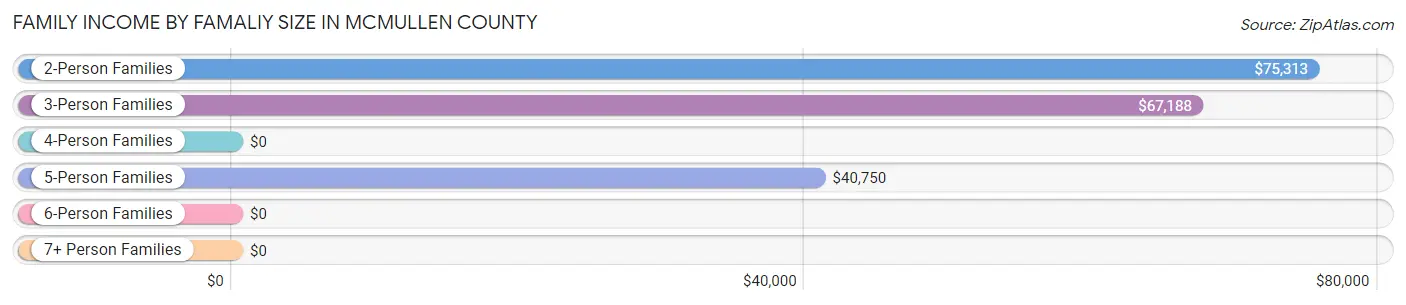
Family Income by Famaliy Size in McMullen County
2-person families (63 | 40.6%) account for the highest median family income in McMullen County with $75,313 per family, while 2-person families (63 | 40.6%) have the highest median income of $37,656 per family member.
| Income Bracket | # Families | Median Income |
| 2-Person Families | 63 (40.6%) | $75,313 |
| 3-Person Families | 64 (41.3%) | $67,188 |
| 4-Person Families | 6 (3.9%) | $0 |
| 5-Person Families | 13 (8.4%) | $40,750 |
| 6-Person Families | 2 (1.3%) | $0 |
| 7+ Person Families | 7 (4.5%) | $0 |
| Total | 155 (100.0%) | $66,406 |
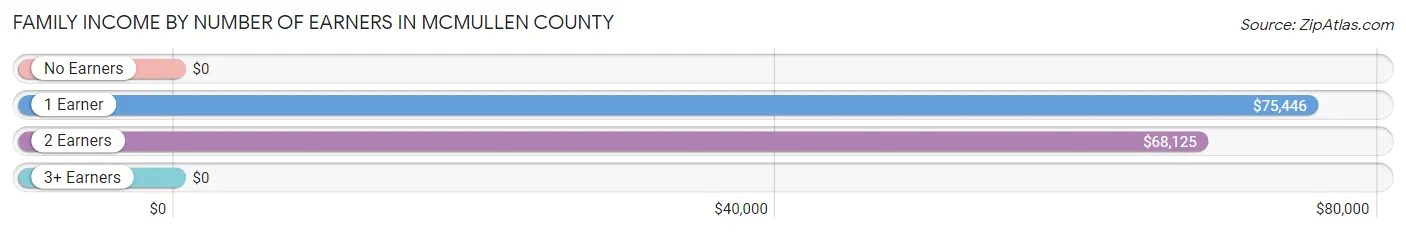
Family Income by Number of Earners in McMullen County
| Number of Earners | # Families | Median Income |
| No Earners | 19 (12.3%) | $0 |
| 1 Earner | 75 (48.4%) | $75,446 |
| 2 Earners | 46 (29.7%) | $68,125 |
| 3+ Earners | 15 (9.7%) | $0 |
| Total | 155 (100.0%) | $66,406 |
Household Income in McMullen County
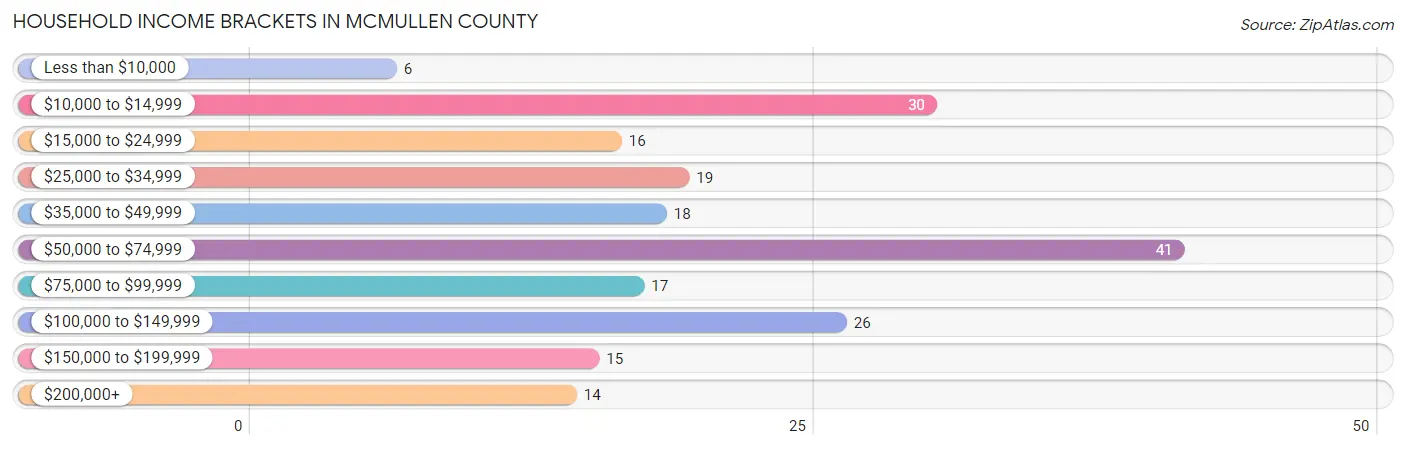
Household Income Brackets in McMullen County
With 41 households falling in the category, the $50,000 to $74,999 income range is the most frequent in McMullen County, accounting for 20.3% of all households. In contrast, only 6 households (3.0%) fall into the less than $10,000 income bracket, making it the least populous group.
| Income Bracket | # Households | % Households |
| Less than $10,000 | 6 | 3.0% |
| $10,000 to $14,999 | 30 | 14.9% |
| $15,000 to $24,999 | 16 | 7.9% |
| $25,000 to $34,999 | 19 | 9.4% |
| $35,000 to $49,999 | 18 | 8.9% |
| $50,000 to $74,999 | 41 | 20.3% |
| $75,000 to $99,999 | 17 | 8.4% |
| $100,000 to $149,999 | 26 | 12.9% |
| $150,000 to $199,999 | 15 | 7.4% |
| $200,000+ | 14 | 6.9% |
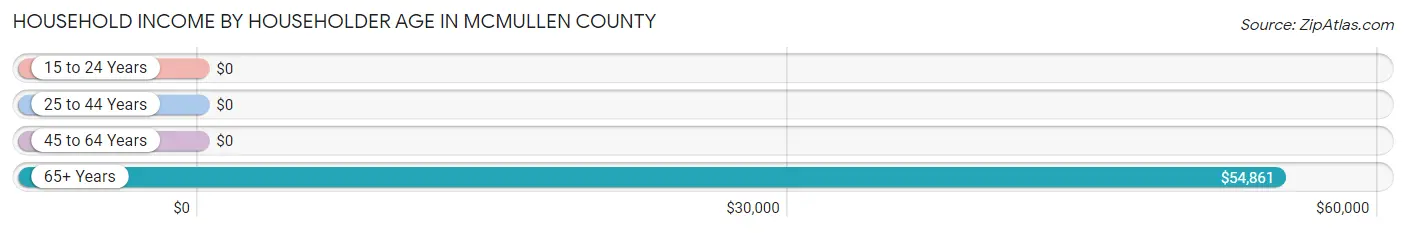
Household Income by Householder Age in McMullen County
The median household income in McMullen County is $60,313, with the highest median household income of $54,861 found in the 65+ years age bracket for the primary householder. A total of 91 households (45.1%) fall into this category.
| Income Bracket | # Households | Median Income |
| 15 to 24 Years | 0 (0.0%) | $0 |
| 25 to 44 Years | 48 (23.8%) | $0 |
| 45 to 64 Years | 63 (31.2%) | $0 |
| 65+ Years | 91 (45.1%) | $54,861 |
| Total | 202 (100.0%) | $60,313 |
Poverty in McMullen County
Income Below Poverty by Sex and Age in McMullen County
With 15.9% poverty level for males and 14.2% for females among the residents of McMullen County, 5 year old males and 75 year old and over females are the most vulnerable to poverty, with 4 males (100.0%) and 10 females (41.7%) in their respective age groups living below the poverty level.
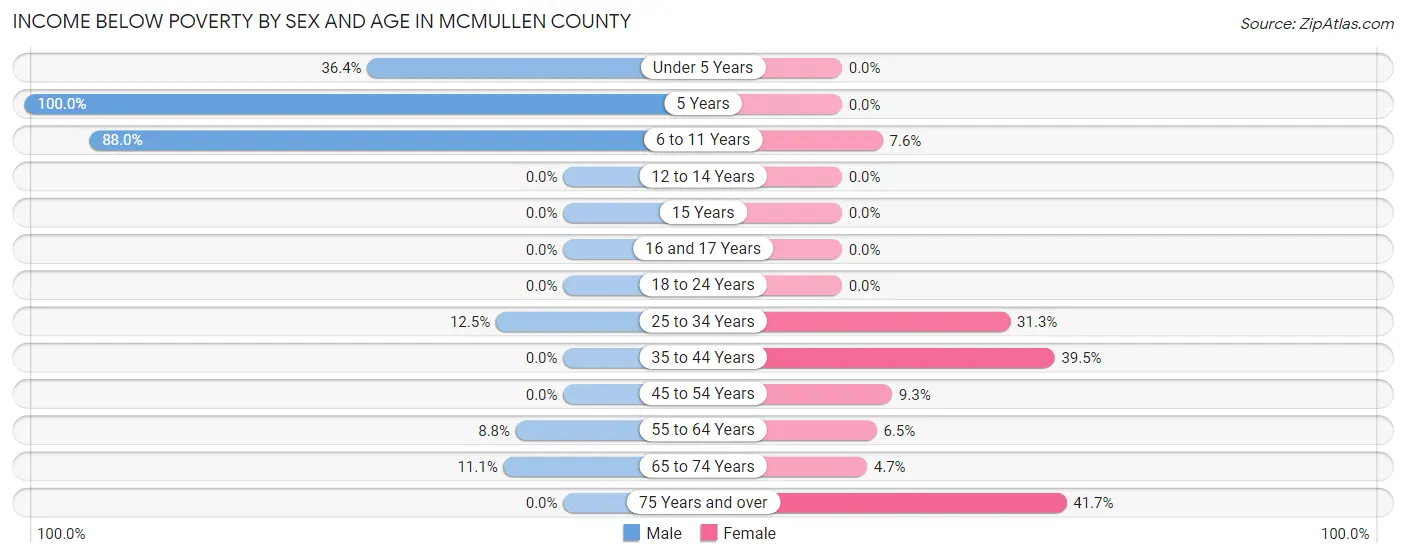
| Age Bracket | Male | Female |
| Under 5 Years | 8 (36.4%) | 0 (0.0%) |
| 5 Years | 4 (100.0%) | 0 (0.0%) |
| 6 to 11 Years | 22 (88.0%) | 5 (7.6%) |
| 12 to 14 Years | 0 (0.0%) | 0 (0.0%) |
| 15 Years | 0 (0.0%) | 0 (0.0%) |
| 16 and 17 Years | 0 (0.0%) | 0 (0.0%) |
| 18 to 24 Years | 0 (0.0%) | 0 (0.0%) |
| 25 to 34 Years | 5 (12.5%) | 15 (31.2%) |
| 35 to 44 Years | 0 (0.0%) | 15 (39.5%) |
| 45 to 54 Years | 0 (0.0%) | 4 (9.3%) |
| 55 to 64 Years | 3 (8.8%) | 2 (6.5%) |
| 65 to 74 Years | 5 (11.1%) | 2 (4.6%) |
| 75 Years and over | 0 (0.0%) | 10 (41.7%) |
| Total | 47 (15.9%) | 53 (14.2%) |
Income Above Poverty by Sex and Age in McMullen County
According to the poverty statistics in McMullen County, males aged 12 to 14 years and females aged under 5 years are the age groups that are most secure financially, with 100.0% of males and 100.0% of females in these age groups living above the poverty line.
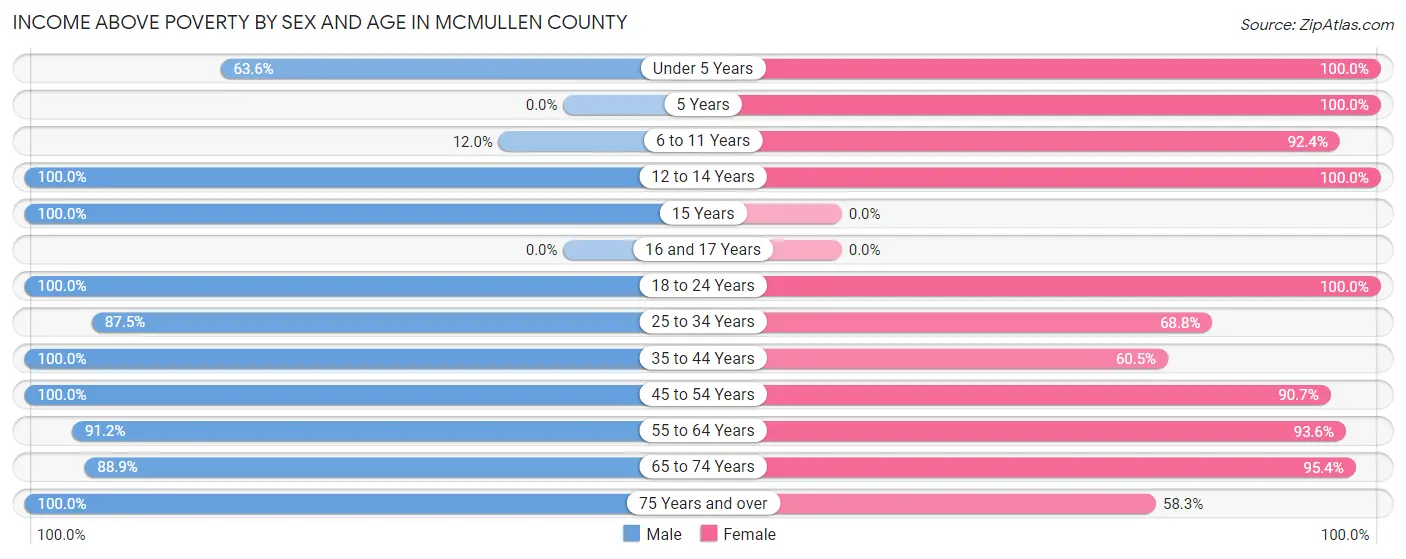
| Age Bracket | Male | Female |
| Under 5 Years | 14 (63.6%) | 28 (100.0%) |
| 5 Years | 0 (0.0%) | 12 (100.0%) |
| 6 to 11 Years | 3 (12.0%) | 61 (92.4%) |
| 12 to 14 Years | 16 (100.0%) | 30 (100.0%) |
| 15 Years | 8 (100.0%) | 0 (0.0%) |
| 16 and 17 Years | 0 (0.0%) | 0 (0.0%) |
| 18 to 24 Years | 16 (100.0%) | 11 (100.0%) |
| 25 to 34 Years | 35 (87.5%) | 33 (68.8%) |
| 35 to 44 Years | 44 (100.0%) | 23 (60.5%) |
| 45 to 54 Years | 26 (100.0%) | 39 (90.7%) |
| 55 to 64 Years | 31 (91.2%) | 29 (93.5%) |
| 65 to 74 Years | 40 (88.9%) | 41 (95.4%) |
| 75 Years and over | 16 (100.0%) | 14 (58.3%) |
| Total | 249 (84.1%) | 321 (85.8%) |
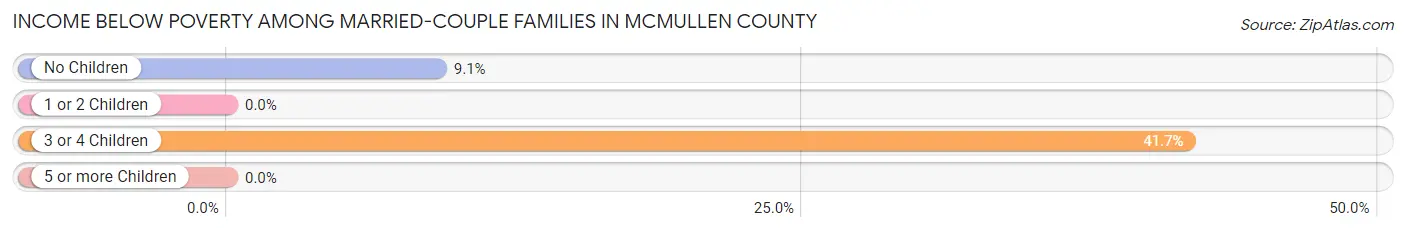
Income Below Poverty Among Married-Couple Families in McMullen County
The poverty statistics for married-couple families in McMullen County show that 10.3% or 12 of the total 117 families live below the poverty line. Families with 3 or 4 children have the highest poverty rate of 41.7%, comprising of 5 families. On the other hand, families with 1 or 2 children have the lowest poverty rate of 0.0%, which includes 0 families.
| Children | Above Poverty | Below Poverty |
| No Children | 70 (90.9%) | 7 (9.1%) |
| 1 or 2 Children | 28 (100.0%) | 0 (0.0%) |
| 3 or 4 Children | 7 (58.3%) | 5 (41.7%) |
| 5 or more Children | 0 (0.0%) | 0 (0.0%) |
| Total | 105 (89.7%) | 12 (10.3%) |
Income Below Poverty Among Single-Parent Households in McMullen County
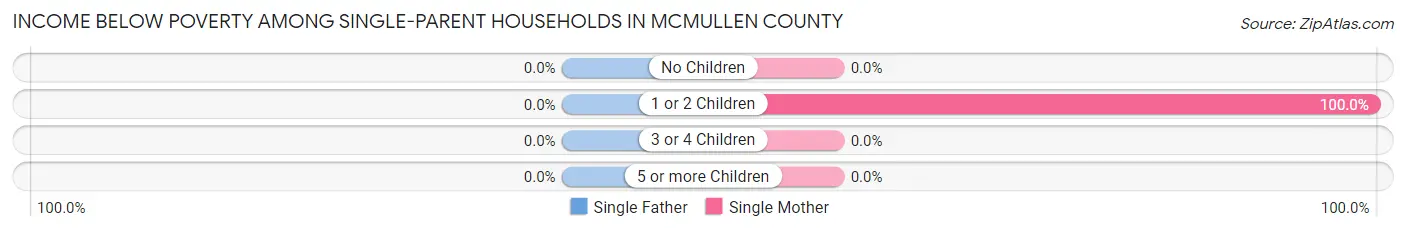
| Children | Single Father | Single Mother |
| No Children | 0 (0.0%) | 0 (0.0%) |
| 1 or 2 Children | 0 (0.0%) | 19 (100.0%) |
| 3 or 4 Children | 0 (0.0%) | 0 (0.0%) |
| 5 or more Children | 0 (0.0%) | 0 (0.0%) |
| Total | 0 (0.0%) | 19 (63.3%) |
Income Below Poverty Among Married-Couple vs Single-Parent Households in McMullen County
The poverty data for McMullen County shows that 12 of the married-couple family households (10.3%) and 19 of the single-parent households (50.0%) are living below the poverty level. Within the married-couple family households, those with 3 or 4 children have the highest poverty rate, with 5 households (41.7%) falling below the poverty line. Among the single-parent households, those with 1 or 2 children have the highest poverty rate, with 19 household (76.0%) living below poverty.
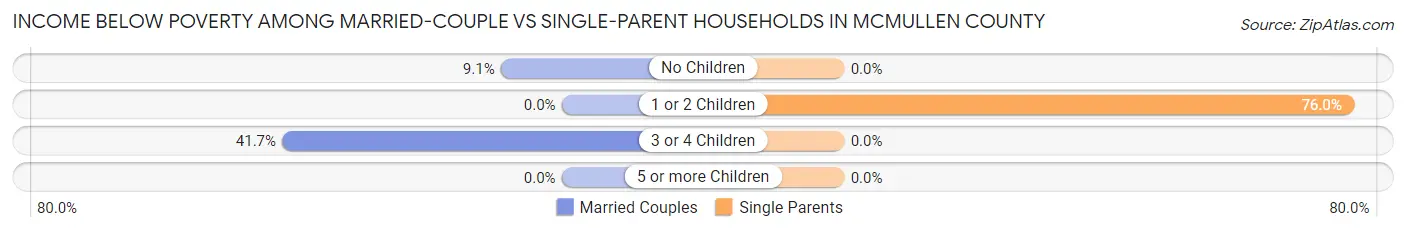
| Children | Married-Couple Families | Single-Parent Households |
| No Children | 7 (9.1%) | 0 (0.0%) |
| 1 or 2 Children | 0 (0.0%) | 19 (76.0%) |
| 3 or 4 Children | 5 (41.7%) | 0 (0.0%) |
| 5 or more Children | 0 (0.0%) | 0 (0.0%) |
| Total | 12 (10.3%) | 19 (50.0%) |
Race in McMullen County
The most populous races in McMullen County are White / Caucasian (524 | 78.2%), Hispanic or Latino (403 | 60.2%), and Two or more Races (117 | 17.5%).
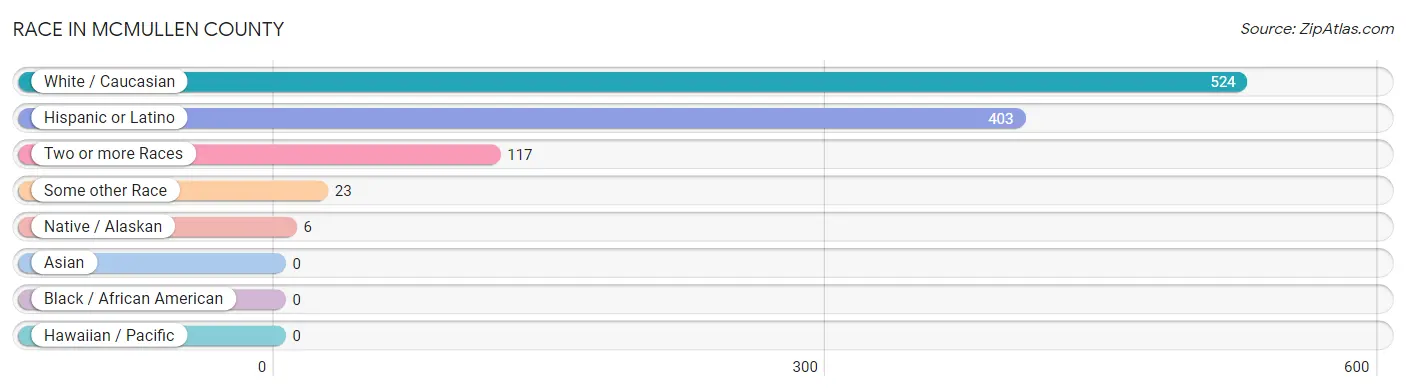
| Race | # Population | % Population |
| Asian | 0 | 0.0% |
| Black / African American | 0 | 0.0% |
| Hawaiian / Pacific | 0 | 0.0% |
| Hispanic or Latino | 403 | 60.2% |
| Native / Alaskan | 6 | 0.9% |
| White / Caucasian | 524 | 78.2% |
| Two or more Races | 117 | 17.5% |
| Some other Race | 23 | 3.4% |
| Total | 670 | 100.0% |
Ancestry in McMullen County
The most populous ancestries reported in McMullen County are Mexican (348 | 51.9%), Irish (126 | 18.8%), German (86 | 12.8%), Spanish (55 | 8.2%), and English (52 | 7.8%), together accounting for 99.6% of all McMullen County residents.
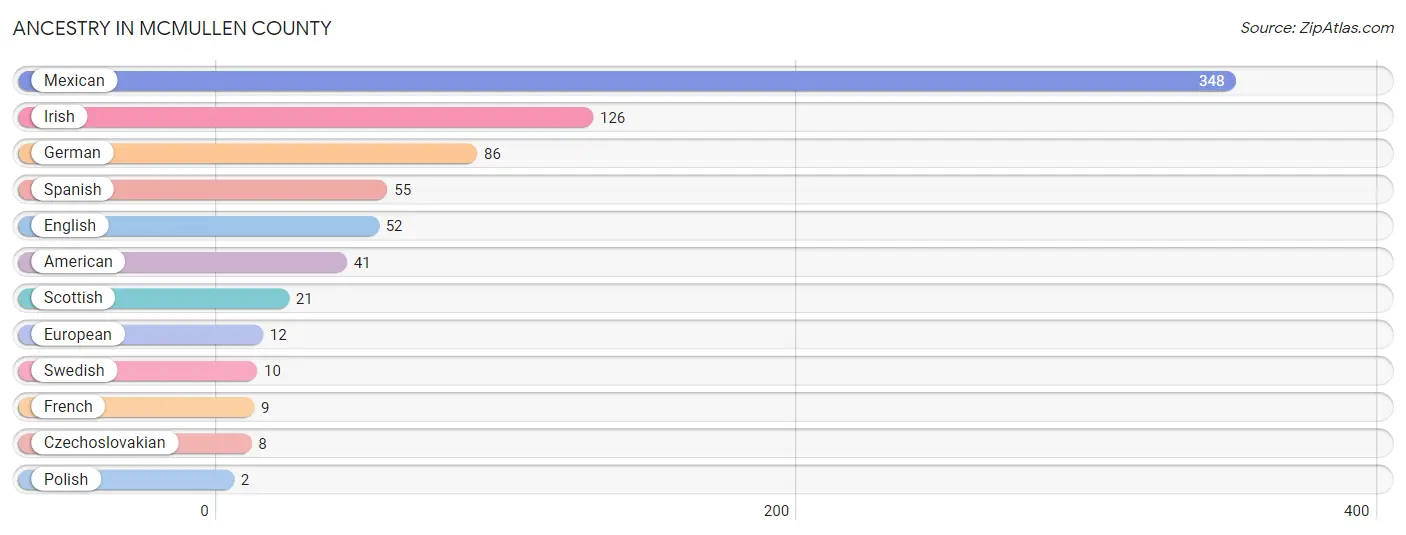
| Ancestry | # Population | % Population |
| American | 41 | 6.1% |
| Czechoslovakian | 8 | 1.2% |
| English | 52 | 7.8% |
| European | 12 | 1.8% |
| French | 9 | 1.3% |
| German | 86 | 12.8% |
| Irish | 126 | 18.8% |
| Mexican | 348 | 51.9% |
| Polish | 2 | 0.3% |
| Scottish | 21 | 3.1% |
| Spanish | 55 | 8.2% |
| Swedish | 10 | 1.5% | View All 12 Rows |
Immigrants in McMullen County
The most numerous immigrant groups reported in McMullen County came from Central America (28 | 4.2%), Latin America (28 | 4.2%), Mexico (28 | 4.2%), Europe (3 | 0.4%), and Germany (3 | 0.4%), together accounting for 13.4% of all McMullen County residents.
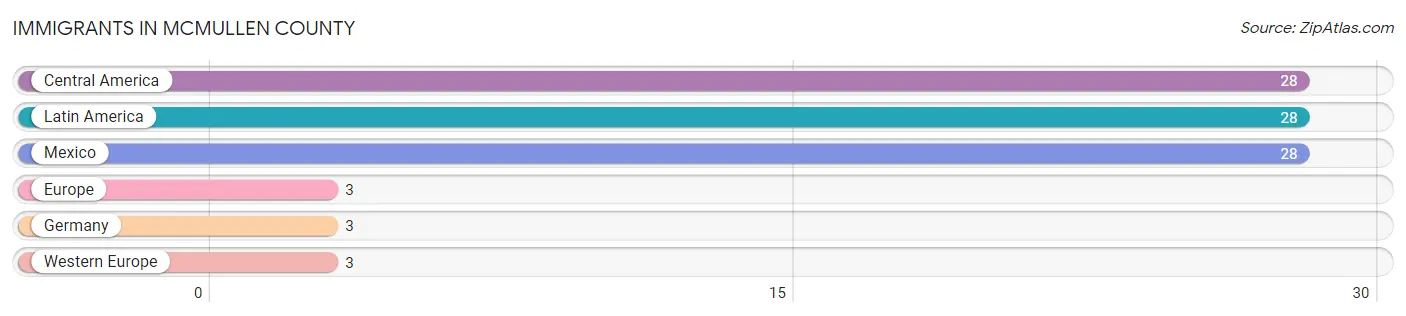
| Immigration Origin | # Population | % Population |
| Central America | 28 | 4.2% |
| Europe | 3 | 0.4% |
| Germany | 3 | 0.4% |
| Latin America | 28 | 4.2% |
| Mexico | 28 | 4.2% |
| Western Europe | 3 | 0.4% | View All 6 Rows |
Sex and Age in McMullen County
Sex and Age in McMullen County
The most populous age groups in McMullen County are 30 to 34 Years (39 | 13.2%) for men and 5 to 9 Years (57 | 15.2%) for women.
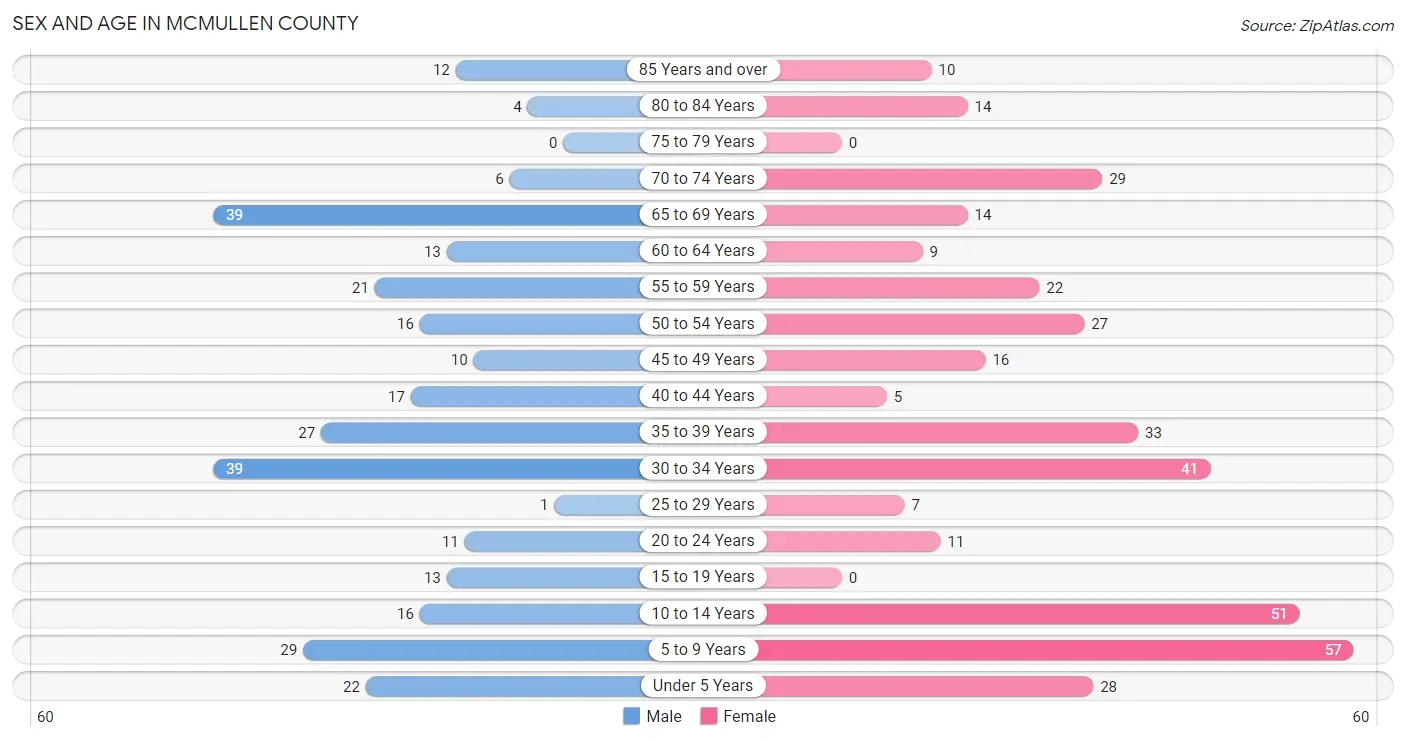
| Age Bracket | Male | Female |
| Under 5 Years | 22 (7.4%) | 28 (7.5%) |
| 5 to 9 Years | 29 (9.8%) | 57 (15.2%) |
| 10 to 14 Years | 16 (5.4%) | 51 (13.6%) |
| 15 to 19 Years | 13 (4.4%) | 0 (0.0%) |
| 20 to 24 Years | 11 (3.7%) | 11 (2.9%) |
| 25 to 29 Years | 1 (0.3%) | 7 (1.9%) |
| 30 to 34 Years | 39 (13.2%) | 41 (11.0%) |
| 35 to 39 Years | 27 (9.1%) | 33 (8.8%) |
| 40 to 44 Years | 17 (5.7%) | 5 (1.3%) |
| 45 to 49 Years | 10 (3.4%) | 16 (4.3%) |
| 50 to 54 Years | 16 (5.4%) | 27 (7.2%) |
| 55 to 59 Years | 21 (7.1%) | 22 (5.9%) |
| 60 to 64 Years | 13 (4.4%) | 9 (2.4%) |
| 65 to 69 Years | 39 (13.2%) | 14 (3.7%) |
| 70 to 74 Years | 6 (2.0%) | 29 (7.7%) |
| 75 to 79 Years | 0 (0.0%) | 0 (0.0%) |
| 80 to 84 Years | 4 (1.3%) | 14 (3.7%) |
| 85 Years and over | 12 (4.1%) | 10 (2.7%) |
| Total | 296 (100.0%) | 374 (100.0%) |
Families and Households in McMullen County
Median Family Size in McMullen County
The median family size in McMullen County is 3.99 persons per family, with single female/mother families (30 | 19.4%) accounting for the largest median family size of 5.4 persons per family. On the other hand, married-couple families (117 | 75.5%) represent the smallest median family size with 3.55 persons per family.
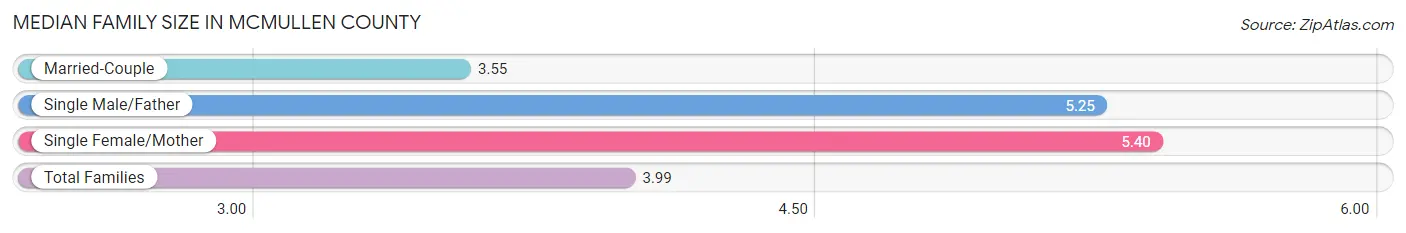
| Family Type | # Families | Family Size |
| Married-Couple | 117 (75.5%) | 3.55 |
| Single Male/Father | 8 (5.2%) | 5.25 |
| Single Female/Mother | 30 (19.4%) | 5.40 |
| Total Families | 155 (100.0%) | 3.99 |
Median Household Size in McMullen County
The median household size in McMullen County is 3.32 persons per household, with single female/mother households (30 | 14.8%) accounting for the largest median household size of 5.4 persons per household. non-family households (47 | 23.3%) represent the smallest median household size with 1.02 persons per household.
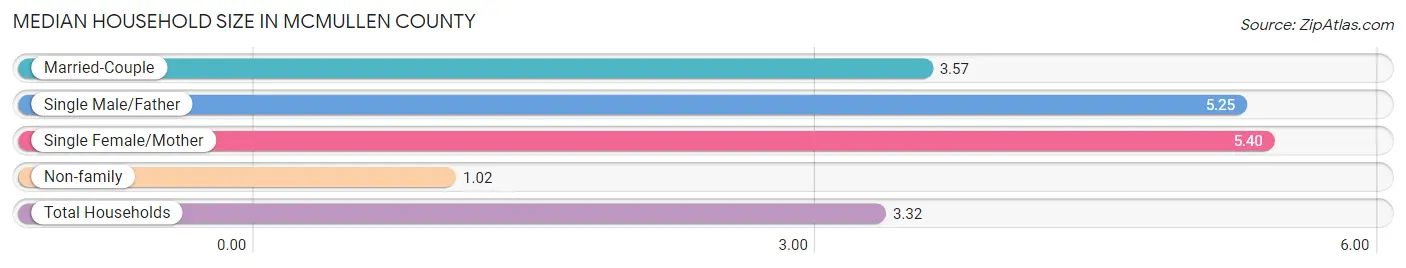
| Household Type | # Households | Household Size |
| Married-Couple | 117 (57.9%) | 3.57 |
| Single Male/Father | 8 (4.0%) | 5.25 |
| Single Female/Mother | 30 (14.8%) | 5.40 |
| Non-family | 47 (23.3%) | 1.02 |
| Total Households | 202 (100.0%) | 3.32 |
Household Size by Marriage Status in McMullen County
Out of a total of 202 households in McMullen County, 155 (76.7%) are family households, while 47 (23.3%) are nonfamily households. The most numerous type of family households are 3-person households, comprising 70, and the most common type of nonfamily households are 1-person households, comprising 46.
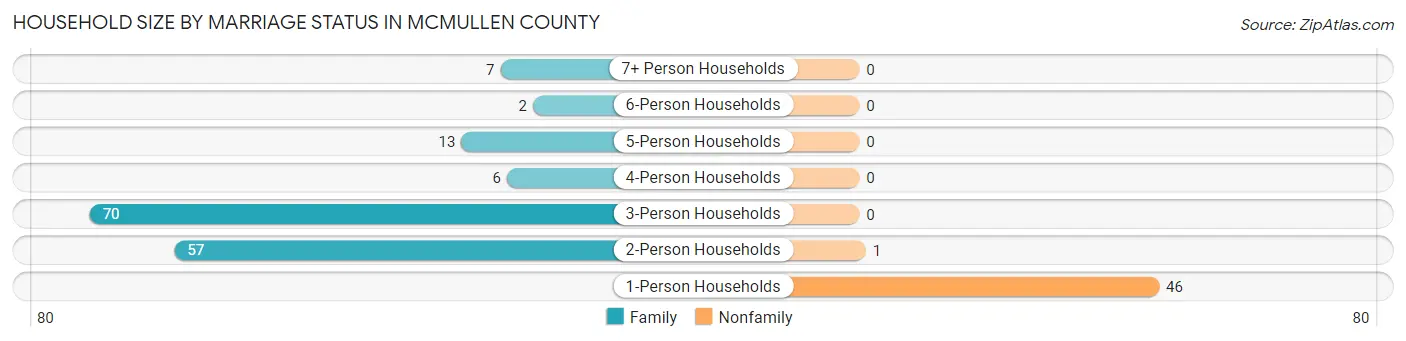
| Household Size | Family Households | Nonfamily Households |
| 1-Person Households | - | 46 (22.8%) |
| 2-Person Households | 57 (28.2%) | 1 (0.5%) |
| 3-Person Households | 70 (34.6%) | 0 (0.0%) |
| 4-Person Households | 6 (3.0%) | 0 (0.0%) |
| 5-Person Households | 13 (6.4%) | 0 (0.0%) |
| 6-Person Households | 2 (1.0%) | 0 (0.0%) |
| 7+ Person Households | 7 (3.5%) | 0 (0.0%) |
| Total | 155 (76.7%) | 47 (23.3%) |
Female Fertility in McMullen County
Fertility by Age in McMullen County
Average fertility rate in McMullen County is 138.0 births per 1,000 women. Women in the age bracket of 20 to 34 years have the highest fertility rate with 271.0 births per 1,000 women. Women in the age bracket of 20 to 34 years acount for 100.0% of all women with births.
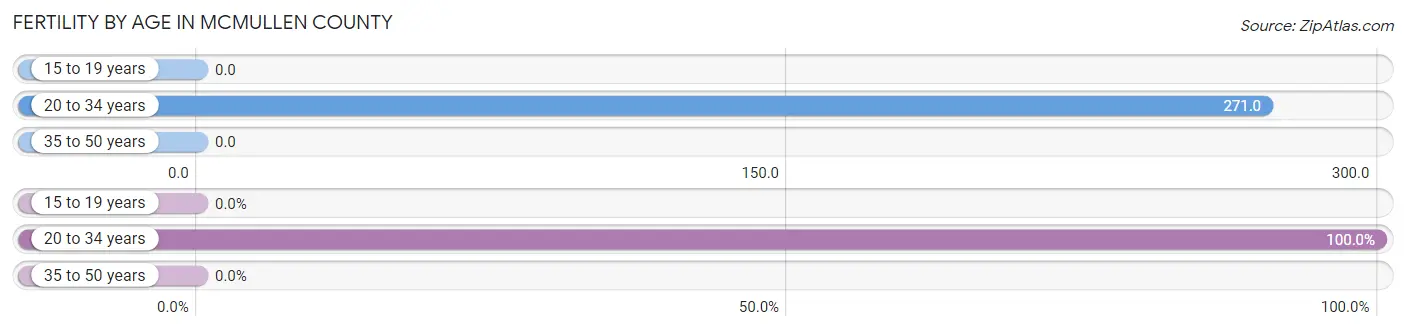
| Age Bracket | Women with Births | Births / 1,000 Women |
| 15 to 19 years | 0 (0.0%) | 0.0 |
| 20 to 34 years | 16 (100.0%) | 271.0 |
| 35 to 50 years | 0 (0.0%) | 0.0 |
| Total | 16 (100.0%) | 138.0 |
Fertility by Age by Marriage Status in McMullen County
31.2% of women with births (16) in McMullen County are married. The highest percentage of unmarried women with births falls into 20 to 34 years age bracket with 68.8% of them unmarried at the time of birth, while the lowest percentage of unmarried women with births belong to 20 to 34 years age bracket with 68.8% of them unmarried.
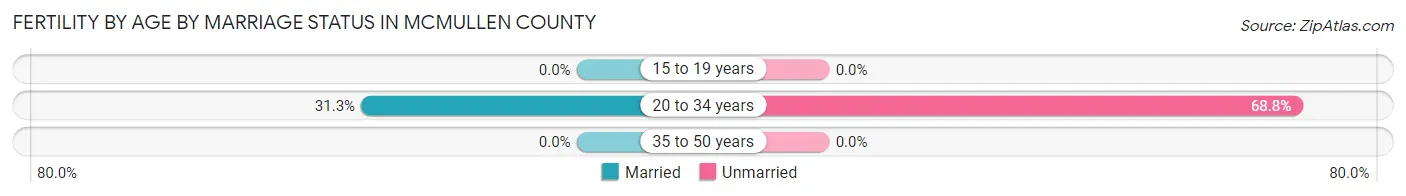
| Age Bracket | Married | Unmarried |
| 15 to 19 years | 0 (0.0%) | 0 (0.0%) |
| 20 to 34 years | 5 (31.2%) | 11 (68.8%) |
| 35 to 50 years | 0 (0.0%) | 0 (0.0%) |
| Total | 5 (31.2%) | 11 (68.8%) |
Fertility by Education in McMullen County
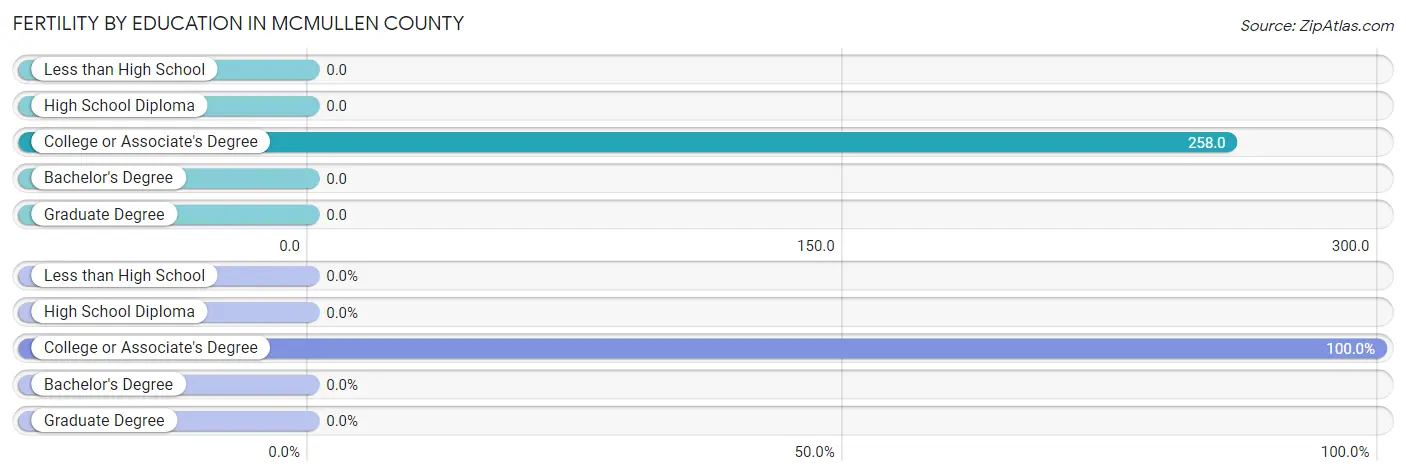
| Educational Attainment | Women with Births | Births / 1,000 Women |
| Less than High School | 0 (0.0%) | 0.0 |
| High School Diploma | 0 (0.0%) | 0.0 |
| College or Associate's Degree | 16 (100.0%) | 258.0 |
| Bachelor's Degree | 0 (0.0%) | 0.0 |
| Graduate Degree | 0 (0.0%) | 0.0 |
| Total | 16 (100.0%) | 138.0 |
Fertility by Education by Marriage Status in McMullen County
68.8% of women with births in McMullen County are unmarried. Women with the educational attainment of college or associate's degree are most likely to be married with 31.2% of them married at childbirth, while women with the educational attainment of college or associate's degree are least likely to be married with 68.8% of them unmarried at childbirth.
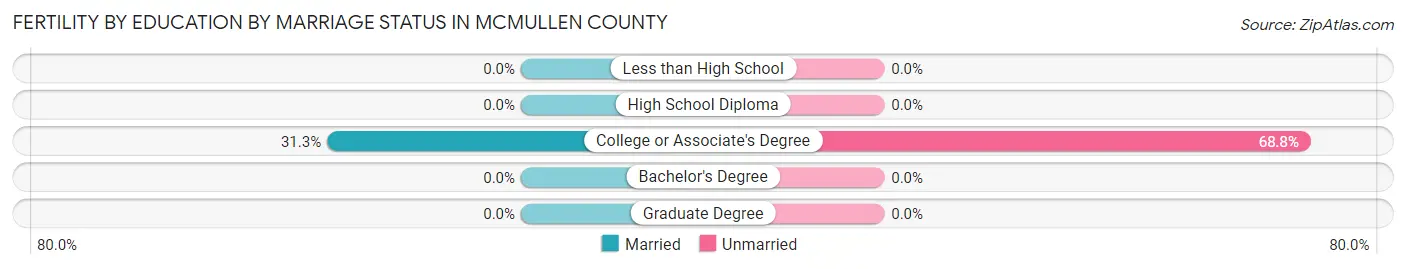
| Educational Attainment | Married | Unmarried |
| Less than High School | 0 (0.0%) | 0 (0.0%) |
| High School Diploma | 0 (0.0%) | 0 (0.0%) |
| College or Associate's Degree | 5 (31.2%) | 11 (68.8%) |
| Bachelor's Degree | 0 (0.0%) | 0 (0.0%) |
| Graduate Degree | 0 (0.0%) | 0 (0.0%) |
| Total | 5 (31.2%) | 11 (68.8%) |
Employment Characteristics in McMullen County
Employment by Class of Employer in McMullen County
Among the 247 employed individuals in McMullen County, private company employees (125 | 50.6%), local government employees (66 | 26.7%), and self-employed (not incorporated) (47 | 19.0%) make up the most common classes of employment.
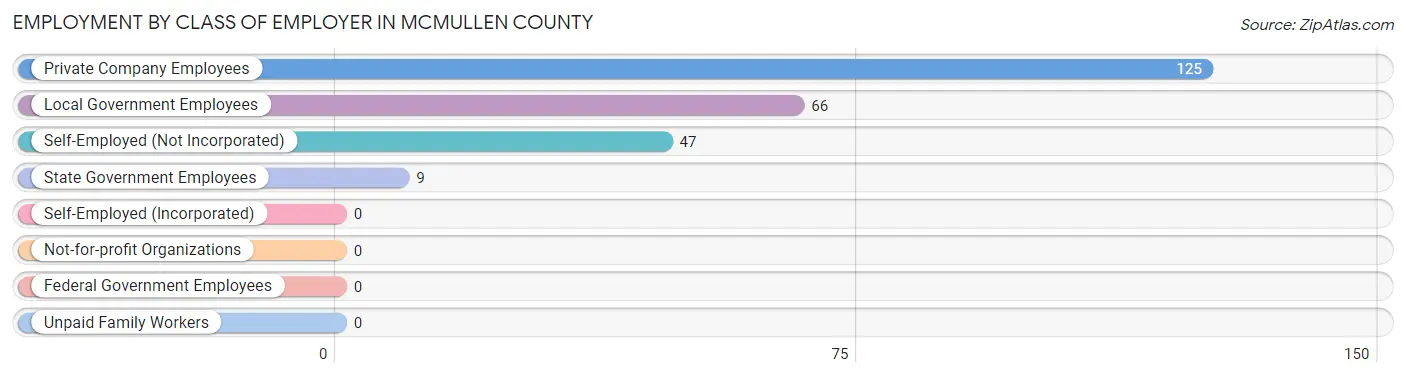
| Employer Class | # Employees | % Employees |
| Private Company Employees | 125 | 50.6% |
| Self-Employed (Incorporated) | 0 | 0.0% |
| Self-Employed (Not Incorporated) | 47 | 19.0% |
| Not-for-profit Organizations | 0 | 0.0% |
| Local Government Employees | 66 | 26.7% |
| State Government Employees | 9 | 3.6% |
| Federal Government Employees | 0 | 0.0% |
| Unpaid Family Workers | 0 | 0.0% |
| Total | 247 | 100.0% |
Employment Status by Age in McMullen County
According to the labor force statistics for McMullen County, out of the total population over 16 years of age (459), 55.1% or 253 individuals are in the labor force, with 2.4% or 6 of them unemployed. The age group with the highest labor force participation rate is 16 to 19 years, with 100.0% or 5 individuals in the labor force. Within the labor force, the 20 to 24 years age range has the highest percentage of unemployed individuals, with 27.3% or 6 of them being unemployed.
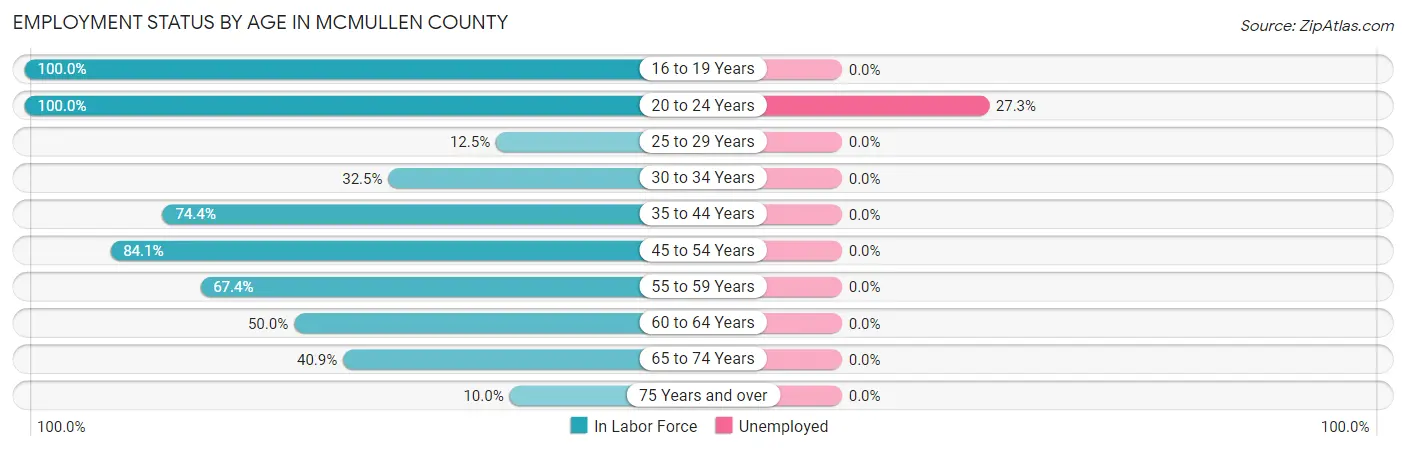
| Age Bracket | In Labor Force | Unemployed |
| 16 to 19 Years | 5 (100.0%) | 0 (0.0%) |
| 20 to 24 Years | 22 (100.0%) | 6 (27.3%) |
| 25 to 29 Years | 1 (12.5%) | 0 (0.0%) |
| 30 to 34 Years | 26 (32.5%) | 0 (0.0%) |
| 35 to 44 Years | 61 (74.4%) | 0 (0.0%) |
| 45 to 54 Years | 58 (84.1%) | 0 (0.0%) |
| 55 to 59 Years | 29 (67.4%) | 0 (0.0%) |
| 60 to 64 Years | 11 (50.0%) | 0 (0.0%) |
| 65 to 74 Years | 36 (40.9%) | 0 (0.0%) |
| 75 Years and over | 4 (10.0%) | 0 (0.0%) |
| Total | 253 (55.1%) | 6 (2.4%) |
Employment Status by Educational Attainment in McMullen County
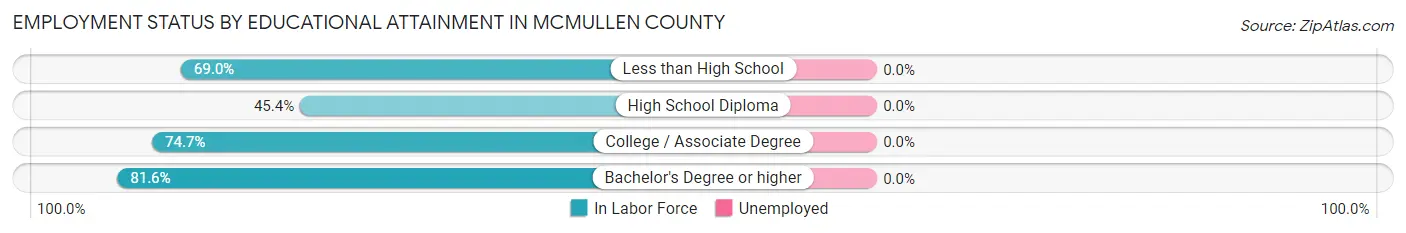
| Educational Attainment | In Labor Force | Unemployed |
| Less than High School | 29 (69.0%) | 0 (0.0%) |
| High School Diploma | 64 (45.4%) | 0 (0.0%) |
| College / Associate Degree | 62 (74.7%) | 0 (0.0%) |
| Bachelor's Degree or higher | 31 (81.6%) | 0 (0.0%) |
| Total | 186 (61.2%) | 0 (0.0%) |
Employment Occupations by Sex in McMullen County
Management, Business, Science and Arts Occupations
The most common Management, Business, Science and Arts occupations in McMullen County are Management (57 | 23.1%), Community & Social Service (27 | 10.9%), Education Instruction & Library (20 | 8.1%), Legal Services & Support (7 | 2.8%), and Computers, Engineering & Science (5 | 2.0%).
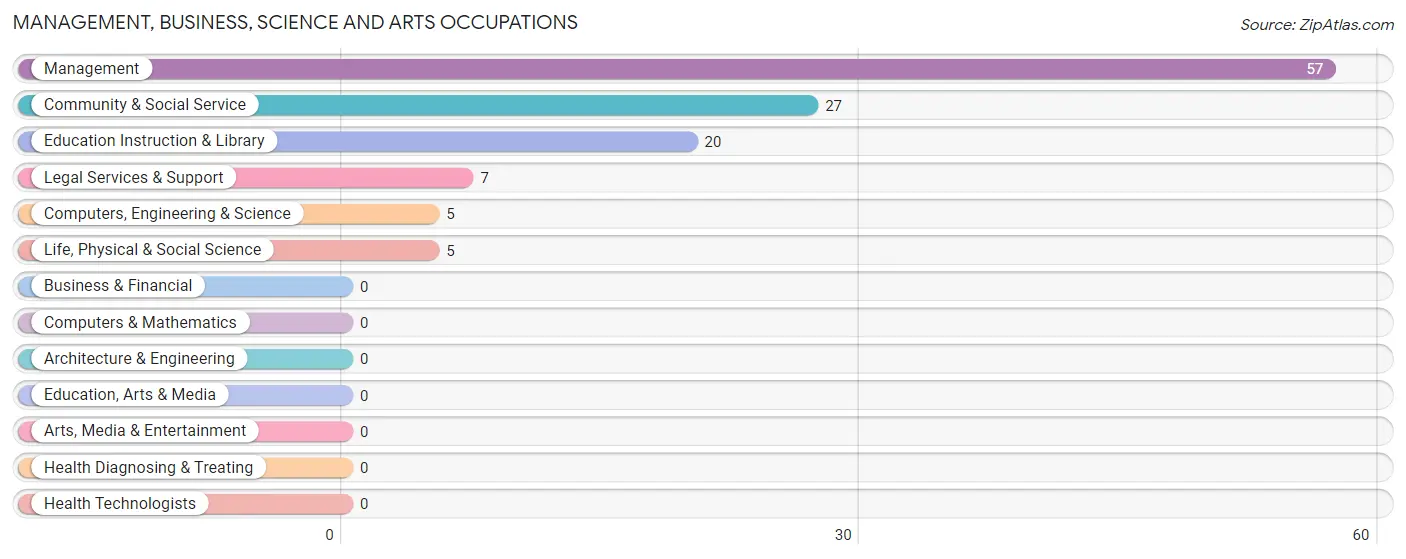
Management, Business, Science and Arts Occupations by Sex
Within the Management, Business, Science and Arts occupations in McMullen County, the most male-oriented occupations are Management (100.0%), Computers, Engineering & Science (100.0%), and Life, Physical & Social Science (100.0%), while the most female-oriented occupations are Legal Services & Support (100.0%), Community & Social Service (85.2%), and Education Instruction & Library (80.0%).
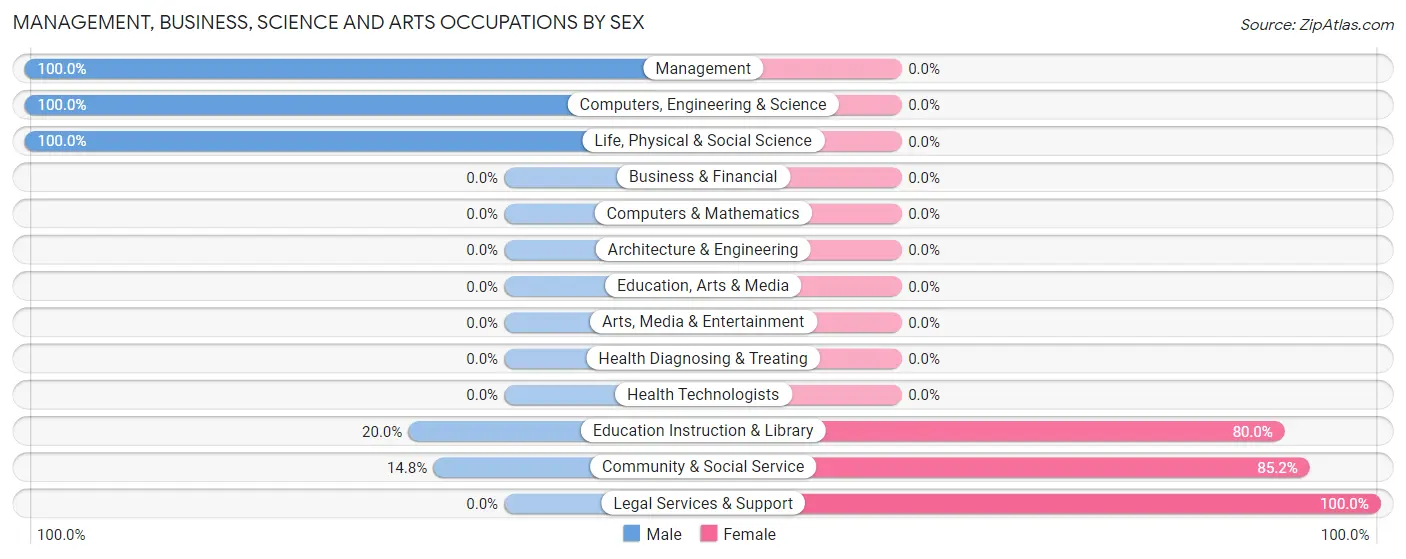
| Occupation | Male | Female |
| Management | 57 (100.0%) | 0 (0.0%) |
| Business & Financial | 0 (0.0%) | 0 (0.0%) |
| Computers, Engineering & Science | 5 (100.0%) | 0 (0.0%) |
| Computers & Mathematics | 0 (0.0%) | 0 (0.0%) |
| Architecture & Engineering | 0 (0.0%) | 0 (0.0%) |
| Life, Physical & Social Science | 5 (100.0%) | 0 (0.0%) |
| Community & Social Service | 4 (14.8%) | 23 (85.2%) |
| Education, Arts & Media | 0 (0.0%) | 0 (0.0%) |
| Legal Services & Support | 0 (0.0%) | 7 (100.0%) |
| Education Instruction & Library | 4 (20.0%) | 16 (80.0%) |
| Arts, Media & Entertainment | 0 (0.0%) | 0 (0.0%) |
| Health Diagnosing & Treating | 0 (0.0%) | 0 (0.0%) |
| Health Technologists | 0 (0.0%) | 0 (0.0%) |
| Total (Category) | 66 (74.2%) | 23 (25.8%) |
| Total (Overall) | 155 (62.7%) | 92 (37.2%) |
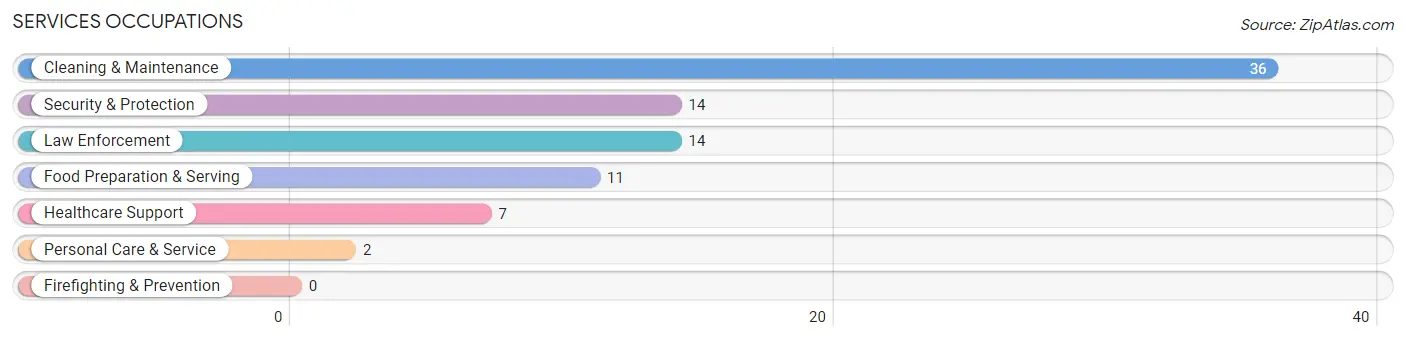
Services Occupations
The most common Services occupations in McMullen County are Cleaning & Maintenance (36 | 14.6%), Security & Protection (14 | 5.7%), Law Enforcement (14 | 5.7%), Food Preparation & Serving (11 | 4.4%), and Healthcare Support (7 | 2.8%).
Services Occupations by Sex
Within the Services occupations in McMullen County, the most male-oriented occupations are Security & Protection (100.0%), Law Enforcement (100.0%), and Food Preparation & Serving (45.5%), while the most female-oriented occupations are Healthcare Support (100.0%), Personal Care & Service (100.0%), and Cleaning & Maintenance (91.7%).
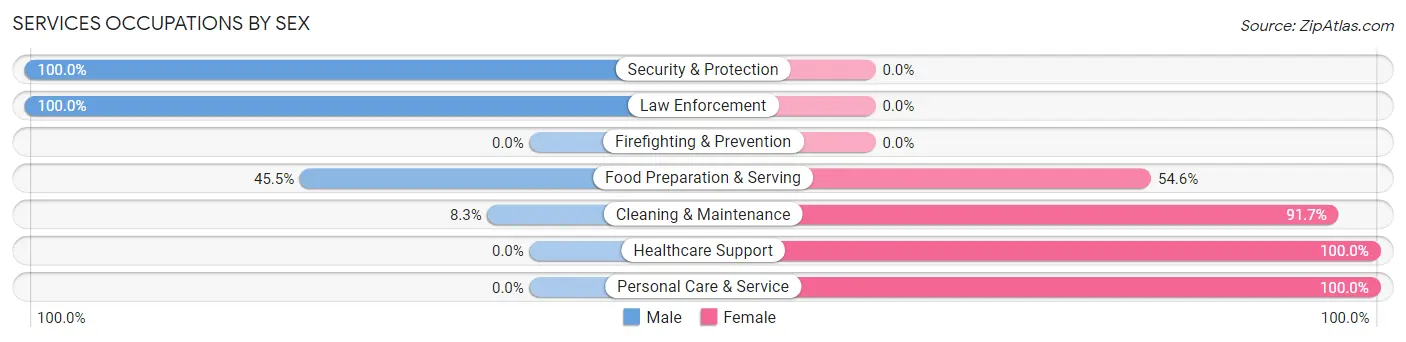
| Occupation | Male | Female |
| Healthcare Support | 0 (0.0%) | 7 (100.0%) |
| Security & Protection | 14 (100.0%) | 0 (0.0%) |
| Firefighting & Prevention | 0 (0.0%) | 0 (0.0%) |
| Law Enforcement | 14 (100.0%) | 0 (0.0%) |
| Food Preparation & Serving | 5 (45.5%) | 6 (54.5%) |
| Cleaning & Maintenance | 3 (8.3%) | 33 (91.7%) |
| Personal Care & Service | 0 (0.0%) | 2 (100.0%) |
| Total (Category) | 22 (31.4%) | 48 (68.6%) |
| Total (Overall) | 155 (62.7%) | 92 (37.2%) |
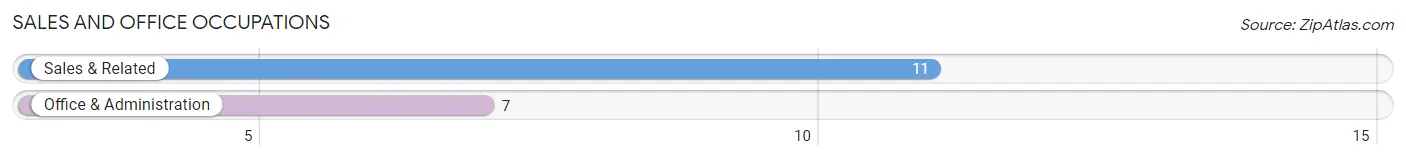
Sales and Office Occupations
The most common Sales and Office occupations in McMullen County are Sales & Related (11 | 4.4%), and Office & Administration (7 | 2.8%).
Sales and Office Occupations by Sex
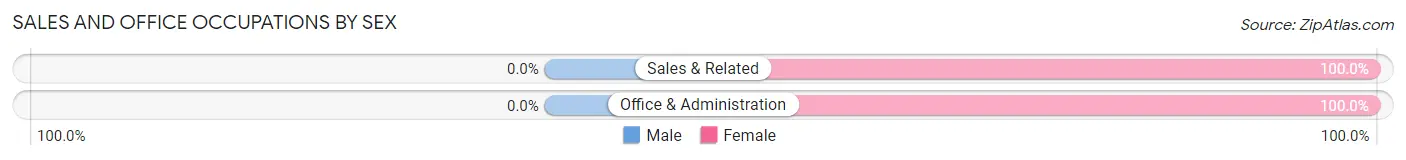
| Occupation | Male | Female |
| Sales & Related | 0 (0.0%) | 11 (100.0%) |
| Office & Administration | 0 (0.0%) | 7 (100.0%) |
| Total (Category) | 0 (0.0%) | 18 (100.0%) |
| Total (Overall) | 155 (62.7%) | 92 (37.2%) |
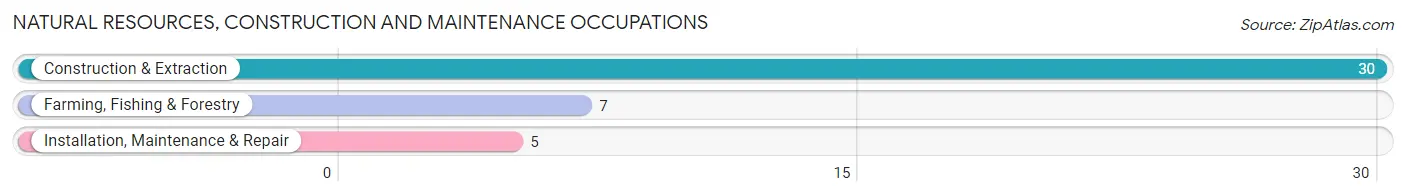
Natural Resources, Construction and Maintenance Occupations
The most common Natural Resources, Construction and Maintenance occupations in McMullen County are Construction & Extraction (30 | 12.1%), Farming, Fishing & Forestry (7 | 2.8%), and Installation, Maintenance & Repair (5 | 2.0%).
Natural Resources, Construction and Maintenance Occupations by Sex
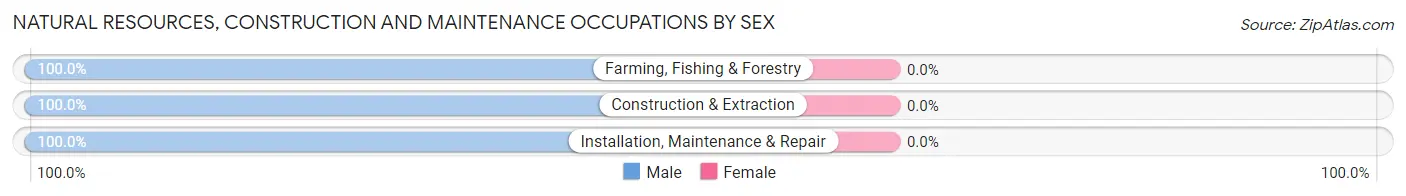
| Occupation | Male | Female |
| Farming, Fishing & Forestry | 7 (100.0%) | 0 (0.0%) |
| Construction & Extraction | 30 (100.0%) | 0 (0.0%) |
| Installation, Maintenance & Repair | 5 (100.0%) | 0 (0.0%) |
| Total (Category) | 42 (100.0%) | 0 (0.0%) |
| Total (Overall) | 155 (62.7%) | 92 (37.2%) |
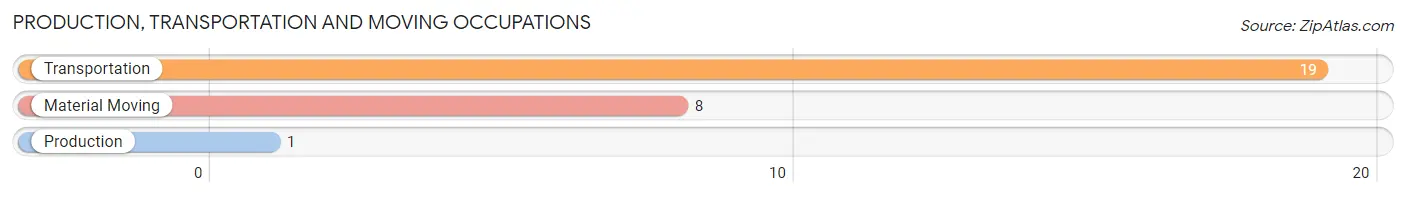
Production, Transportation and Moving Occupations
The most common Production, Transportation and Moving occupations in McMullen County are Transportation (19 | 7.7%), Material Moving (8 | 3.2%), and Production (1 | 0.4%).
Production, Transportation and Moving Occupations by Sex
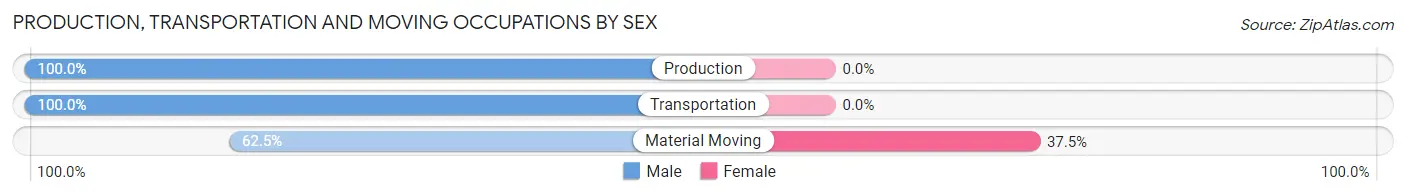
| Occupation | Male | Female |
| Production | 1 (100.0%) | 0 (0.0%) |
| Transportation | 19 (100.0%) | 0 (0.0%) |
| Material Moving | 5 (62.5%) | 3 (37.5%) |
| Total (Category) | 25 (89.3%) | 3 (10.7%) |
| Total (Overall) | 155 (62.7%) | 92 (37.2%) |
Employment Industries by Sex in McMullen County
Employment Industries in McMullen County
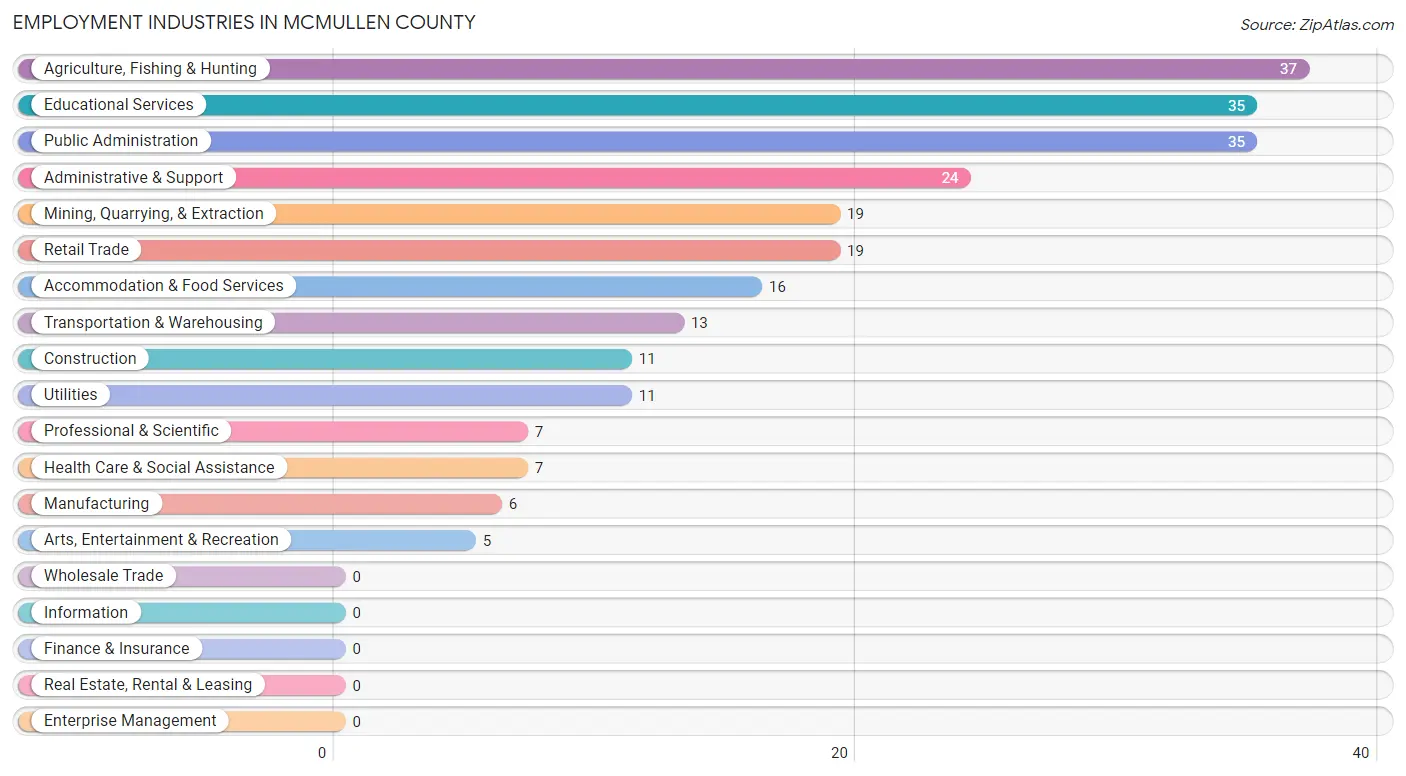
The major employment industries in McMullen County include Agriculture, Fishing & Hunting (37 | 15.0%), Educational Services (35 | 14.2%), Public Administration (35 | 14.2%), Administrative & Support (24 | 9.7%), and Mining, Quarrying, & Extraction (19 | 7.7%).
Employment Industries by Sex in McMullen County
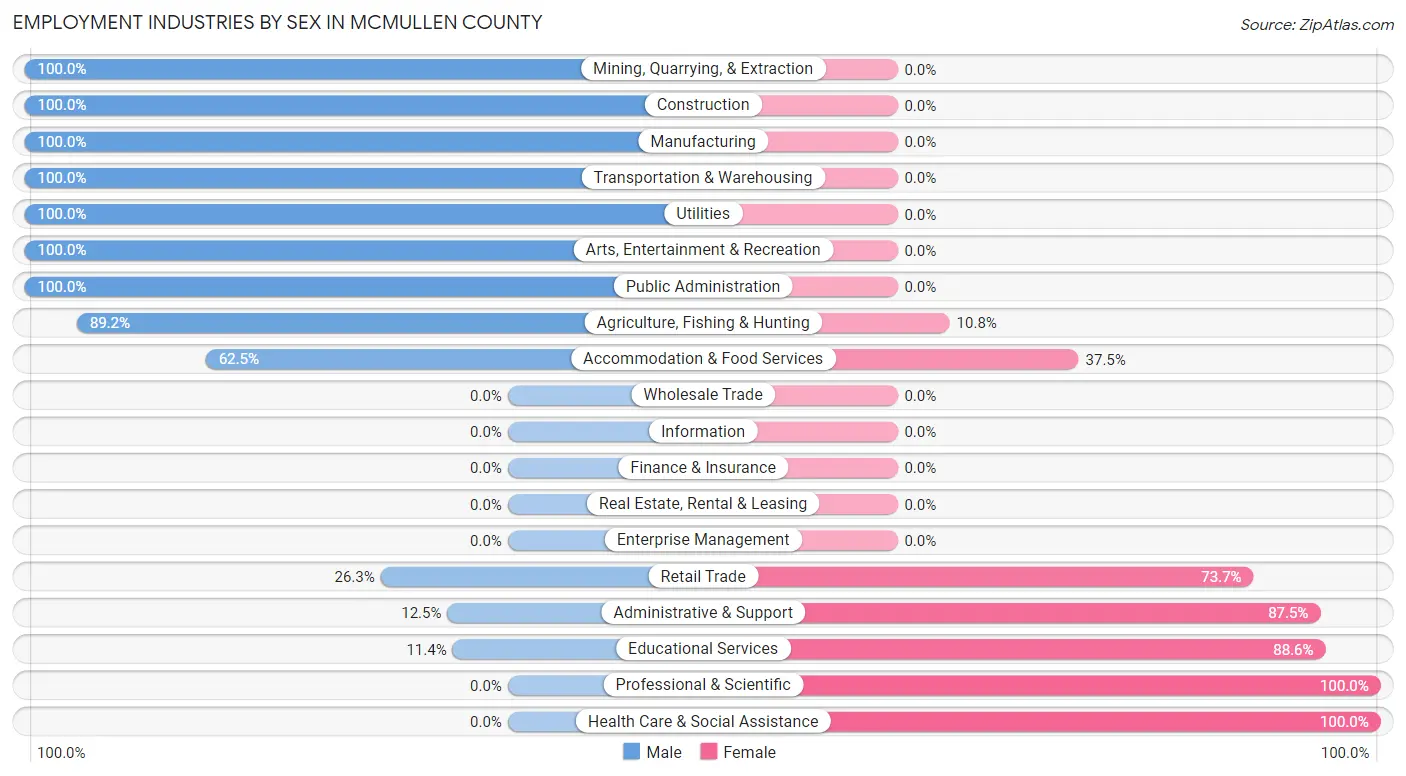
The McMullen County industries that see more men than women are Mining, Quarrying, & Extraction (100.0%), Construction (100.0%), and Manufacturing (100.0%), whereas the industries that tend to have a higher number of women are Professional & Scientific (100.0%), Health Care & Social Assistance (100.0%), and Educational Services (88.6%).
| Industry | Male | Female |
| Agriculture, Fishing & Hunting | 33 (89.2%) | 4 (10.8%) |
| Mining, Quarrying, & Extraction | 19 (100.0%) | 0 (0.0%) |
| Construction | 11 (100.0%) | 0 (0.0%) |
| Manufacturing | 6 (100.0%) | 0 (0.0%) |
| Wholesale Trade | 0 (0.0%) | 0 (0.0%) |
| Retail Trade | 5 (26.3%) | 14 (73.7%) |
| Transportation & Warehousing | 13 (100.0%) | 0 (0.0%) |
| Utilities | 11 (100.0%) | 0 (0.0%) |
| Information | 0 (0.0%) | 0 (0.0%) |
| Finance & Insurance | 0 (0.0%) | 0 (0.0%) |
| Real Estate, Rental & Leasing | 0 (0.0%) | 0 (0.0%) |
| Professional & Scientific | 0 (0.0%) | 7 (100.0%) |
| Enterprise Management | 0 (0.0%) | 0 (0.0%) |
| Administrative & Support | 3 (12.5%) | 21 (87.5%) |
| Educational Services | 4 (11.4%) | 31 (88.6%) |
| Health Care & Social Assistance | 0 (0.0%) | 7 (100.0%) |
| Arts, Entertainment & Recreation | 5 (100.0%) | 0 (0.0%) |
| Accommodation & Food Services | 10 (62.5%) | 6 (37.5%) |
| Public Administration | 35 (100.0%) | 0 (0.0%) |
| Total | 155 (62.7%) | 92 (37.2%) |
Education in McMullen County
School Enrollment in McMullen County
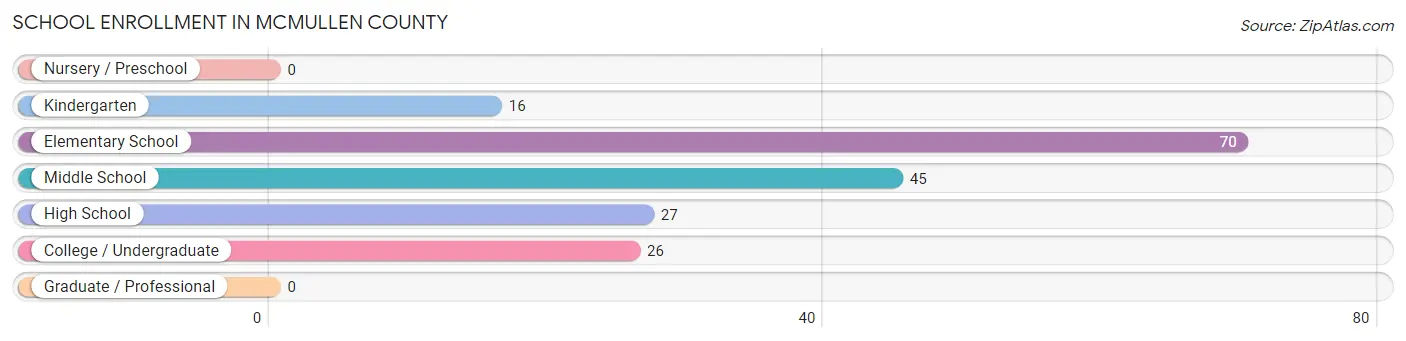
The most common levels of schooling among the 184 students in McMullen County are elementary school (70 | 38.0%), middle school (45 | 24.5%), and high school (27 | 14.7%).
| School Level | # Students | % Students |
| Nursery / Preschool | 0 | 0.0% |
| Kindergarten | 16 | 8.7% |
| Elementary School | 70 | 38.0% |
| Middle School | 45 | 24.5% |
| High School | 27 | 14.7% |
| College / Undergraduate | 26 | 14.1% |
| Graduate / Professional | 0 | 0.0% |
| Total | 184 | 100.0% |
School Enrollment by Age by Funding Source in McMullen County
Out of a total of 184 students who are enrolled in schools in McMullen County, 5 (2.7%) attend a private institution, while the remaining 179 (97.3%) are enrolled in public schools. The age group of 20 to 24 year olds has the highest likelihood of being enrolled in private schools, with 5 (45.5% in the age bracket) enrolled. Conversely, the age group of 5 to 9 year old has the lowest likelihood of being enrolled in a private school, with 86 (100.0% in the age bracket) attending a public institution.
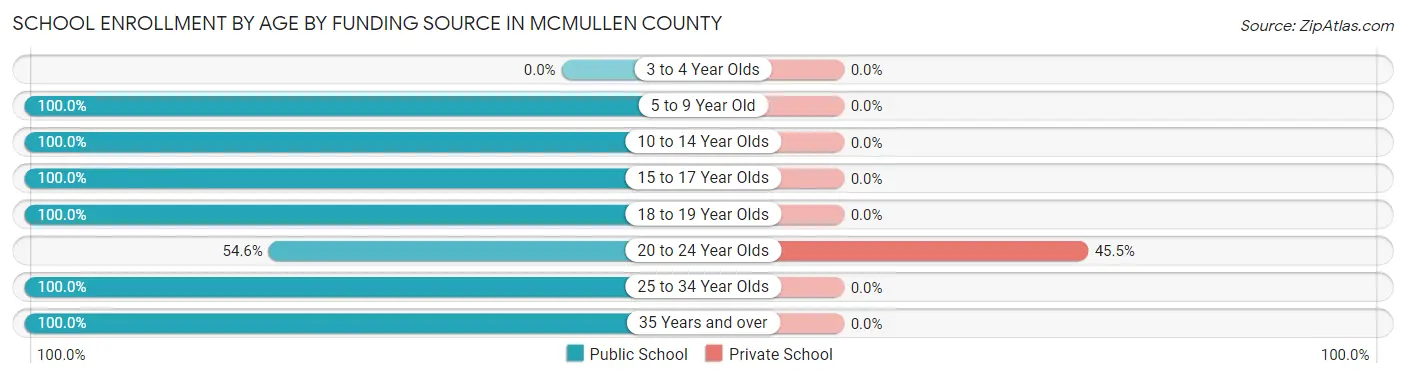
| Age Bracket | Public School | Private School |
| 3 to 4 Year Olds | 0 (0.0%) | 0 (0.0%) |
| 5 to 9 Year Old | 86 (100.0%) | 0 (0.0%) |
| 10 to 14 Year Olds | 59 (100.0%) | 0 (0.0%) |
| 15 to 17 Year Olds | 8 (100.0%) | 0 (0.0%) |
| 18 to 19 Year Olds | 5 (100.0%) | 0 (0.0%) |
| 20 to 24 Year Olds | 6 (54.5%) | 5 (45.5%) |
| 25 to 34 Year Olds | 11 (100.0%) | 0 (0.0%) |
| 35 Years and over | 4 (100.0%) | 0 (0.0%) |
| Total | 179 (97.3%) | 5 (2.7%) |
Educational Attainment by Field of Study in McMullen County
Science & technology (15 | 22.1%), business (12 | 17.6%), education (12 | 17.6%), communications (10 | 14.7%), and visual & performing arts (5 | 7.3%) are the most common fields of study among 68 individuals in McMullen County who have obtained a bachelor's degree or higher.
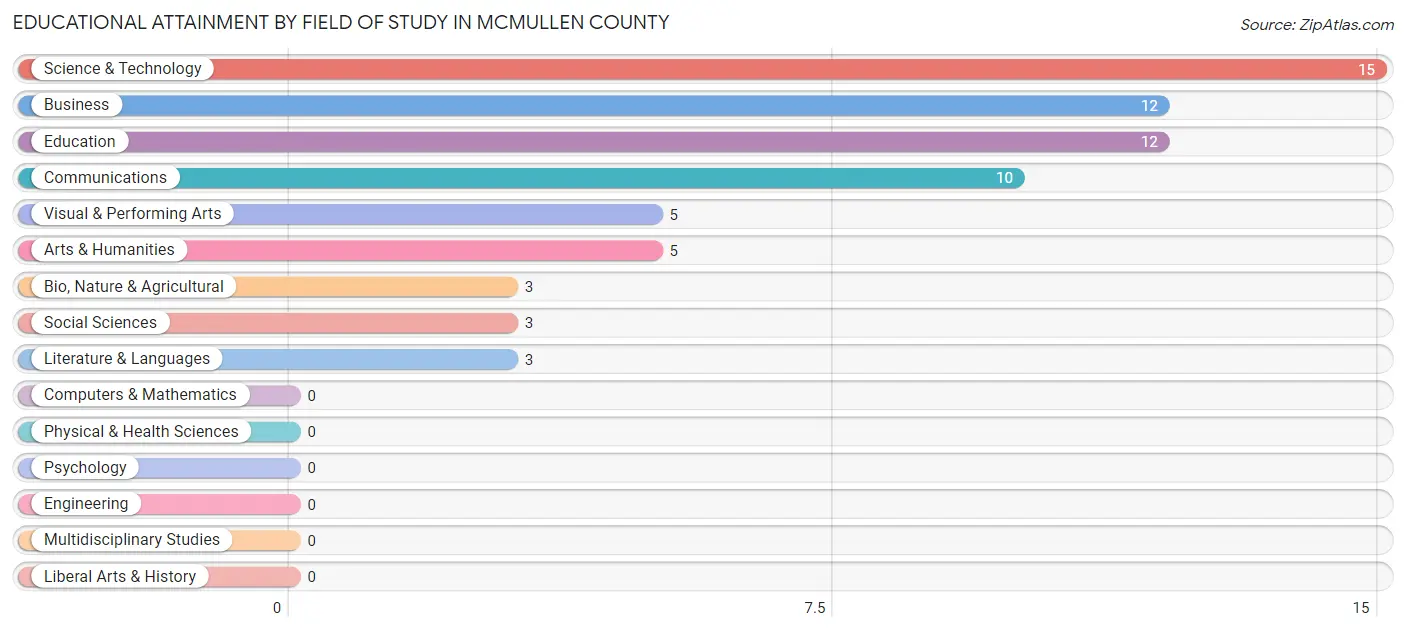
| Field of Study | # Graduates | % Graduates |
| Computers & Mathematics | 0 | 0.0% |
| Bio, Nature & Agricultural | 3 | 4.4% |
| Physical & Health Sciences | 0 | 0.0% |
| Psychology | 0 | 0.0% |
| Social Sciences | 3 | 4.4% |
| Engineering | 0 | 0.0% |
| Multidisciplinary Studies | 0 | 0.0% |
| Science & Technology | 15 | 22.1% |
| Business | 12 | 17.6% |
| Education | 12 | 17.6% |
| Literature & Languages | 3 | 4.4% |
| Liberal Arts & History | 0 | 0.0% |
| Visual & Performing Arts | 5 | 7.3% |
| Communications | 10 | 14.7% |
| Arts & Humanities | 5 | 7.3% |
| Total | 68 | 100.0% |
Transportation & Commute in McMullen County
Vehicle Availability by Sex in McMullen County
The most prevalent vehicle ownership categories in McMullen County are males with 3 vehicles (55, accounting for 35.5%) and females with 3 vehicles (28, making up 59.8%).
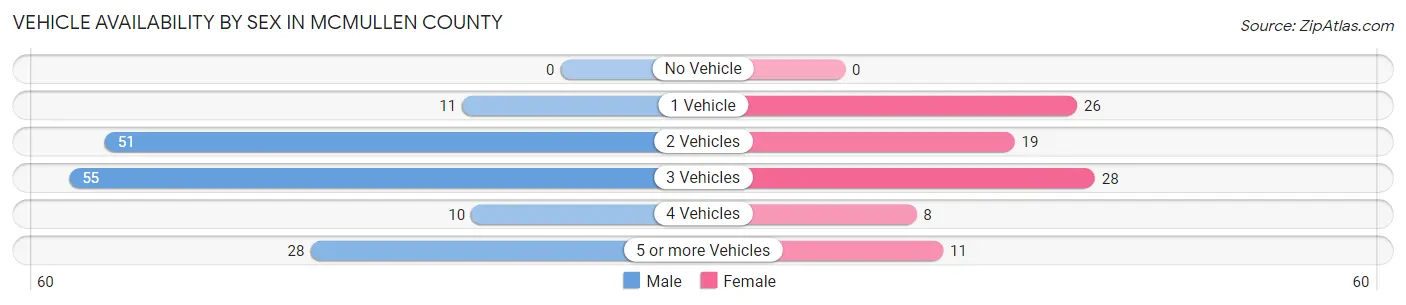
| Vehicles Available | Male | Female |
| No Vehicle | 0 (0.0%) | 0 (0.0%) |
| 1 Vehicle | 11 (7.1%) | 26 (28.3%) |
| 2 Vehicles | 51 (32.9%) | 19 (20.6%) |
| 3 Vehicles | 55 (35.5%) | 28 (30.4%) |
| 4 Vehicles | 10 (6.5%) | 8 (8.7%) |
| 5 or more Vehicles | 28 (18.1%) | 11 (12.0%) |
| Total | 155 (100.0%) | 92 (100.0%) |
Commute Time in McMullen County
The most frequently occuring commute durations in McMullen County are 5 to 9 minutes (39 commuters, 19.2%), less than 5 minutes (37 commuters, 18.2%), and 30 to 34 minutes (24 commuters, 11.8%).
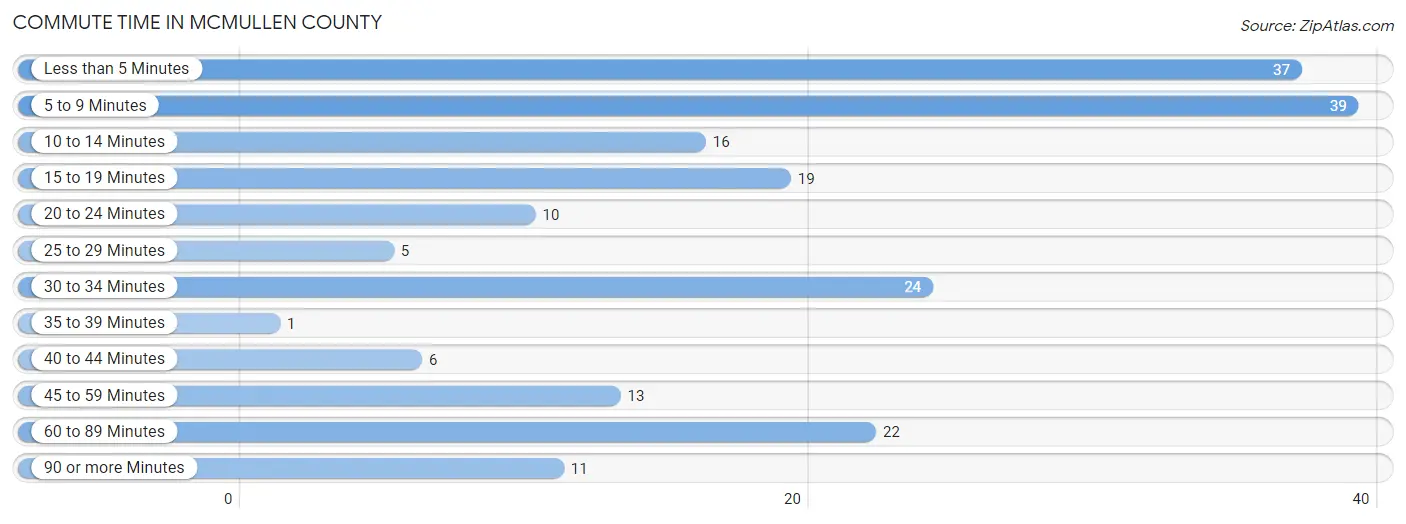
| Commute Time | # Commuters | % Commuters |
| Less than 5 Minutes | 37 | 18.2% |
| 5 to 9 Minutes | 39 | 19.2% |
| 10 to 14 Minutes | 16 | 7.9% |
| 15 to 19 Minutes | 19 | 9.4% |
| 20 to 24 Minutes | 10 | 4.9% |
| 25 to 29 Minutes | 5 | 2.5% |
| 30 to 34 Minutes | 24 | 11.8% |
| 35 to 39 Minutes | 1 | 0.5% |
| 40 to 44 Minutes | 6 | 3.0% |
| 45 to 59 Minutes | 13 | 6.4% |
| 60 to 89 Minutes | 22 | 10.8% |
| 90 or more Minutes | 11 | 5.4% |
Commute Time by Sex in McMullen County
The most common commute times in McMullen County are less than 5 minutes (34 commuters, 25.0%) for males and 5 to 9 minutes (29 commuters, 43.3%) for females.
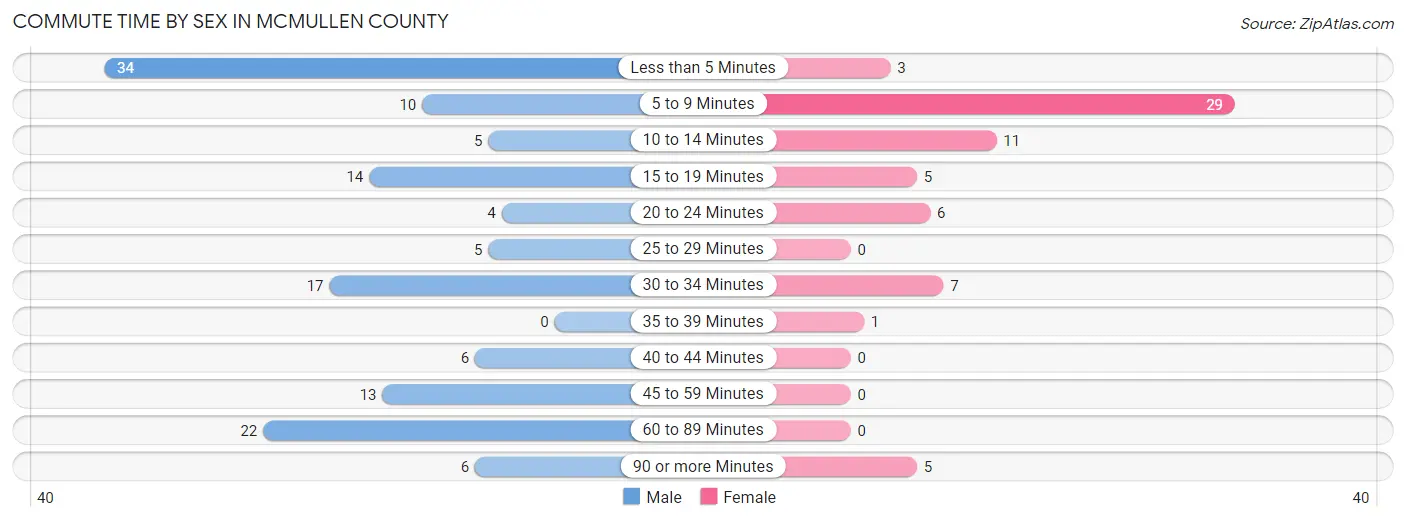
| Commute Time | Male | Female |
| Less than 5 Minutes | 34 (25.0%) | 3 (4.5%) |
| 5 to 9 Minutes | 10 (7.3%) | 29 (43.3%) |
| 10 to 14 Minutes | 5 (3.7%) | 11 (16.4%) |
| 15 to 19 Minutes | 14 (10.3%) | 5 (7.5%) |
| 20 to 24 Minutes | 4 (2.9%) | 6 (9.0%) |
| 25 to 29 Minutes | 5 (3.7%) | 0 (0.0%) |
| 30 to 34 Minutes | 17 (12.5%) | 7 (10.4%) |
| 35 to 39 Minutes | 0 (0.0%) | 1 (1.5%) |
| 40 to 44 Minutes | 6 (4.4%) | 0 (0.0%) |
| 45 to 59 Minutes | 13 (9.6%) | 0 (0.0%) |
| 60 to 89 Minutes | 22 (16.2%) | 0 (0.0%) |
| 90 or more Minutes | 6 (4.4%) | 5 (7.5%) |
Time of Departure to Work by Sex in McMullen County
The most frequent times of departure to work in McMullen County are 8:00 AM to 8:29 AM (25, 18.4%) for males and 7:30 AM to 7:59 AM (17, 25.4%) for females.
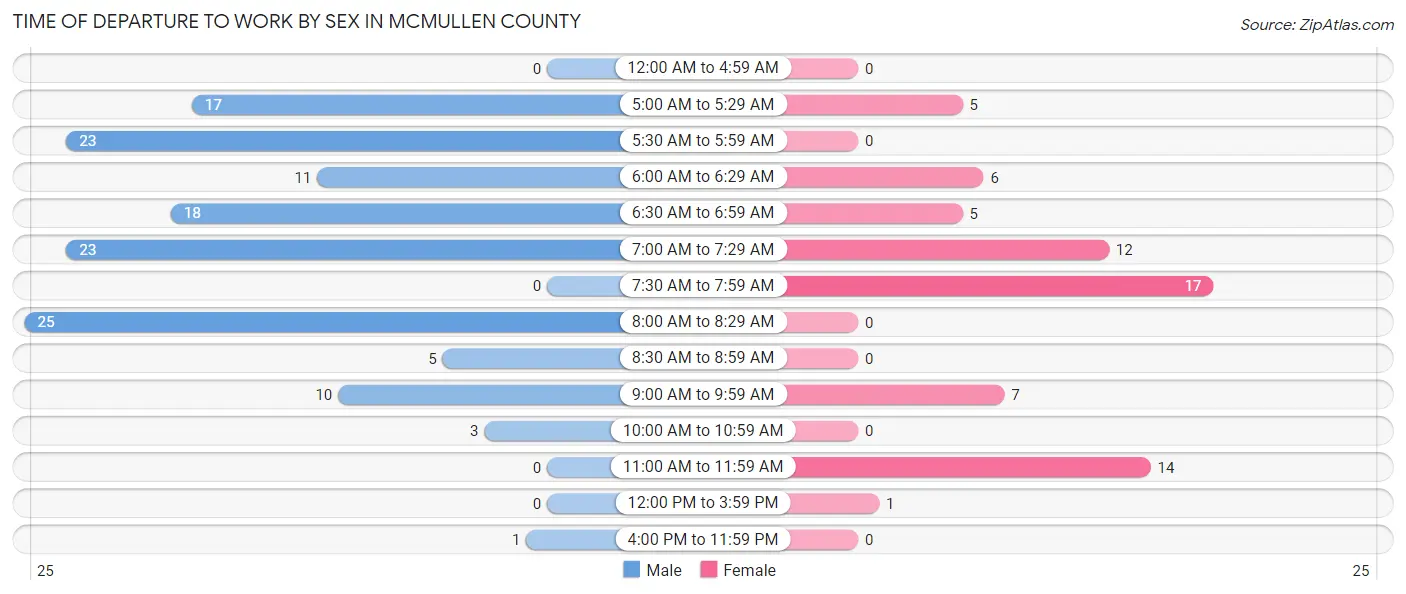
| Time of Departure | Male | Female |
| 12:00 AM to 4:59 AM | 0 (0.0%) | 0 (0.0%) |
| 5:00 AM to 5:29 AM | 17 (12.5%) | 5 (7.5%) |
| 5:30 AM to 5:59 AM | 23 (16.9%) | 0 (0.0%) |
| 6:00 AM to 6:29 AM | 11 (8.1%) | 6 (9.0%) |
| 6:30 AM to 6:59 AM | 18 (13.2%) | 5 (7.5%) |
| 7:00 AM to 7:29 AM | 23 (16.9%) | 12 (17.9%) |
| 7:30 AM to 7:59 AM | 0 (0.0%) | 17 (25.4%) |
| 8:00 AM to 8:29 AM | 25 (18.4%) | 0 (0.0%) |
| 8:30 AM to 8:59 AM | 5 (3.7%) | 0 (0.0%) |
| 9:00 AM to 9:59 AM | 10 (7.3%) | 7 (10.4%) |
| 10:00 AM to 10:59 AM | 3 (2.2%) | 0 (0.0%) |
| 11:00 AM to 11:59 AM | 0 (0.0%) | 14 (20.9%) |
| 12:00 PM to 3:59 PM | 0 (0.0%) | 1 (1.5%) |
| 4:00 PM to 11:59 PM | 1 (0.7%) | 0 (0.0%) |
| Total | 136 (100.0%) | 67 (100.0%) |
Housing Occupancy in McMullen County
Occupancy by Ownership in McMullen County
Of the total 202 dwellings in McMullen County, owner-occupied units account for 174 (86.1%), while renter-occupied units make up 28 (13.9%).
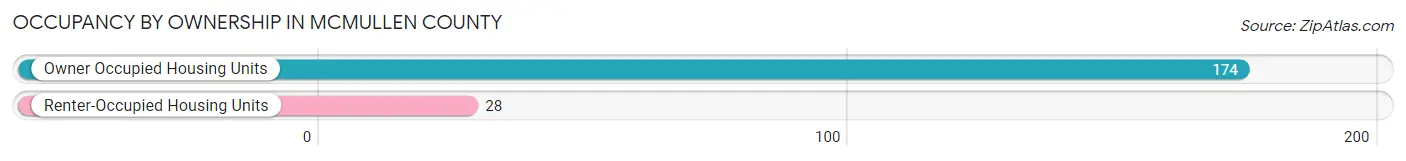
| Occupancy | # Housing Units | % Housing Units |
| Owner Occupied Housing Units | 174 | 86.1% |
| Renter-Occupied Housing Units | 28 | 13.9% |
| Total Occupied Housing Units | 202 | 100.0% |
Occupancy by Household Size in McMullen County
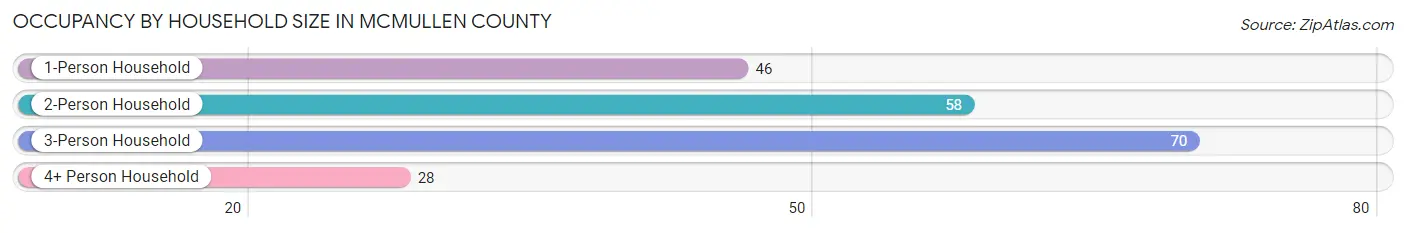
| Household Size | # Housing Units | % Housing Units |
| 1-Person Household | 46 | 22.8% |
| 2-Person Household | 58 | 28.7% |
| 3-Person Household | 70 | 34.6% |
| 4+ Person Household | 28 | 13.9% |
| Total Housing Units | 202 | 100.0% |
Occupancy by Ownership by Household Size in McMullen County
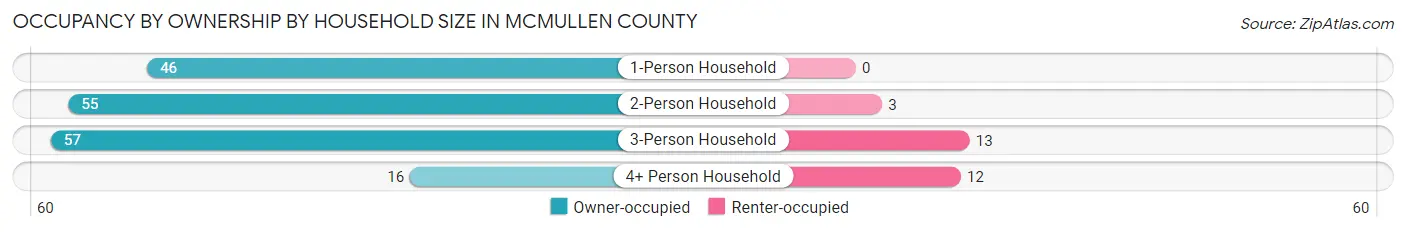
| Household Size | Owner-occupied | Renter-occupied |
| 1-Person Household | 46 (100.0%) | 0 (0.0%) |
| 2-Person Household | 55 (94.8%) | 3 (5.2%) |
| 3-Person Household | 57 (81.4%) | 13 (18.6%) |
| 4+ Person Household | 16 (57.1%) | 12 (42.9%) |
| Total Housing Units | 174 (86.1%) | 28 (13.9%) |
Occupancy by Educational Attainment in McMullen County
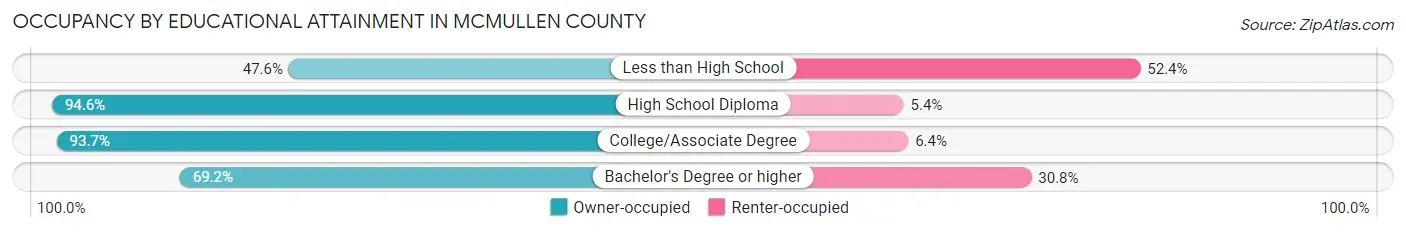
| Household Size | Owner-occupied | Renter-occupied |
| Less than High School | 10 (47.6%) | 11 (52.4%) |
| High School Diploma | 87 (94.6%) | 5 (5.4%) |
| College/Associate Degree | 59 (93.6%) | 4 (6.4%) |
| Bachelor's Degree or higher | 18 (69.2%) | 8 (30.8%) |
Occupancy by Age of Householder in McMullen County
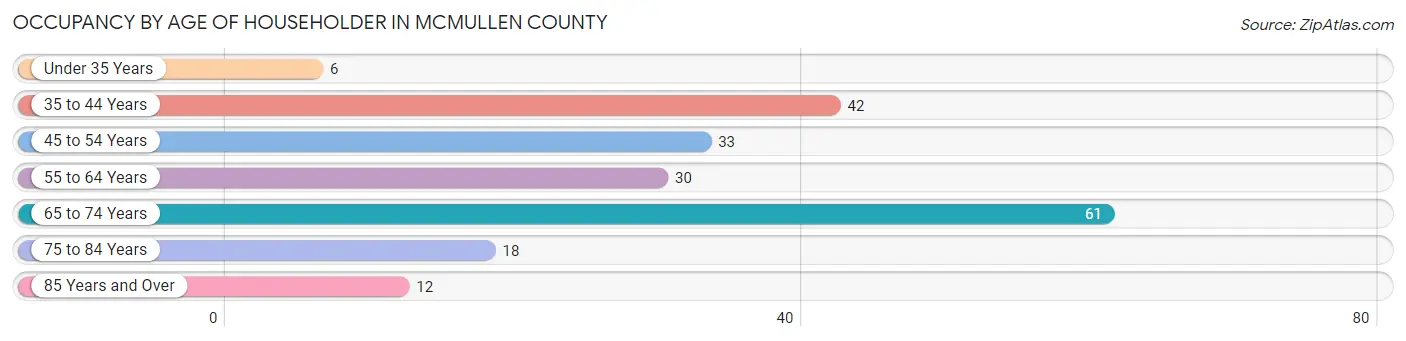
| Age Bracket | # Households | % Households |
| Under 35 Years | 6 | 3.0% |
| 35 to 44 Years | 42 | 20.8% |
| 45 to 54 Years | 33 | 16.3% |
| 55 to 64 Years | 30 | 14.8% |
| 65 to 74 Years | 61 | 30.2% |
| 75 to 84 Years | 18 | 8.9% |
| 85 Years and Over | 12 | 5.9% |
| Total | 202 | 100.0% |
Housing Finances in McMullen County
Median Income by Occupancy in McMullen County
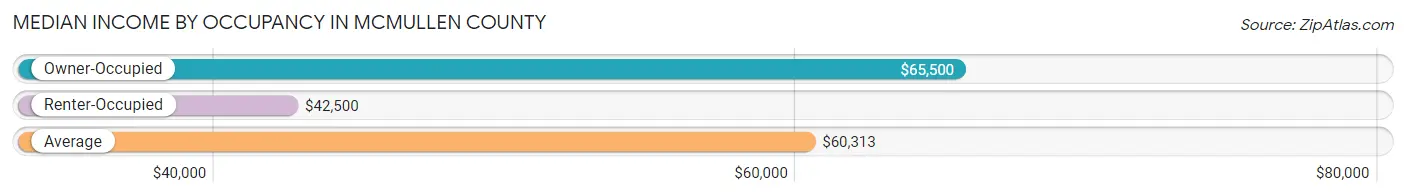
| Occupancy Type | # Households | Median Income |
| Owner-Occupied | 174 (86.1%) | $65,500 |
| Renter-Occupied | 28 (13.9%) | $42,500 |
| Average | 202 (100.0%) | $60,313 |
Occupancy by Householder Income Bracket in McMullen County
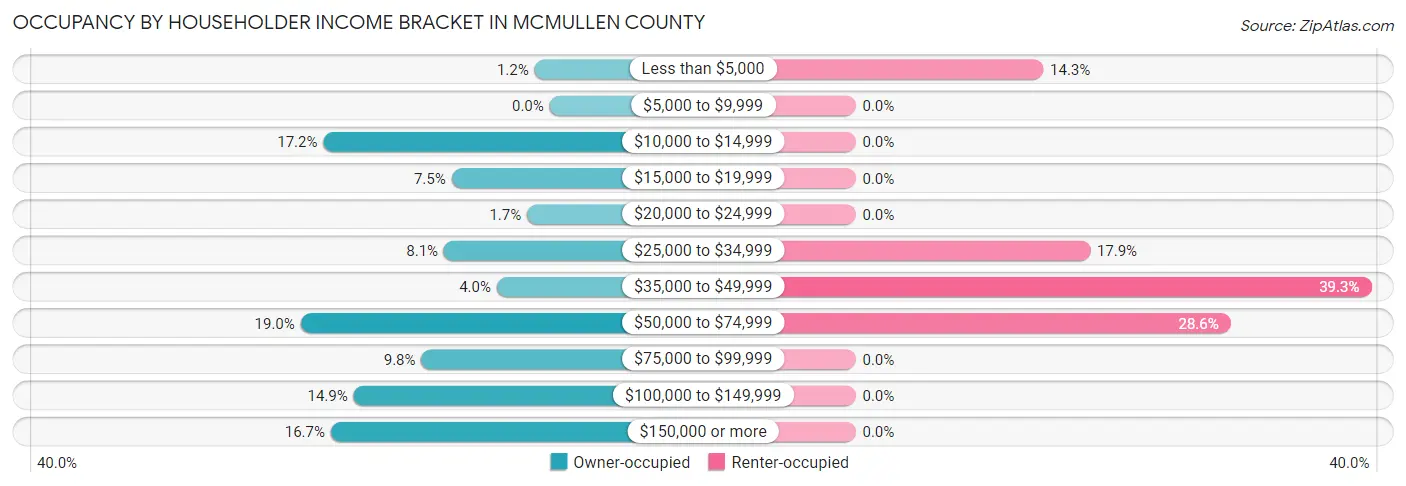
| Income Bracket | Owner-occupied | Renter-occupied |
| Less than $5,000 | 2 (1.1%) | 4 (14.3%) |
| $5,000 to $9,999 | 0 (0.0%) | 0 (0.0%) |
| $10,000 to $14,999 | 30 (17.2%) | 0 (0.0%) |
| $15,000 to $19,999 | 13 (7.5%) | 0 (0.0%) |
| $20,000 to $24,999 | 3 (1.7%) | 0 (0.0%) |
| $25,000 to $34,999 | 14 (8.1%) | 5 (17.9%) |
| $35,000 to $49,999 | 7 (4.0%) | 11 (39.3%) |
| $50,000 to $74,999 | 33 (19.0%) | 8 (28.6%) |
| $75,000 to $99,999 | 17 (9.8%) | 0 (0.0%) |
| $100,000 to $149,999 | 26 (14.9%) | 0 (0.0%) |
| $150,000 or more | 29 (16.7%) | 0 (0.0%) |
| Total | 174 (100.0%) | 28 (100.0%) |
Monthly Housing Cost Tiers in McMullen County
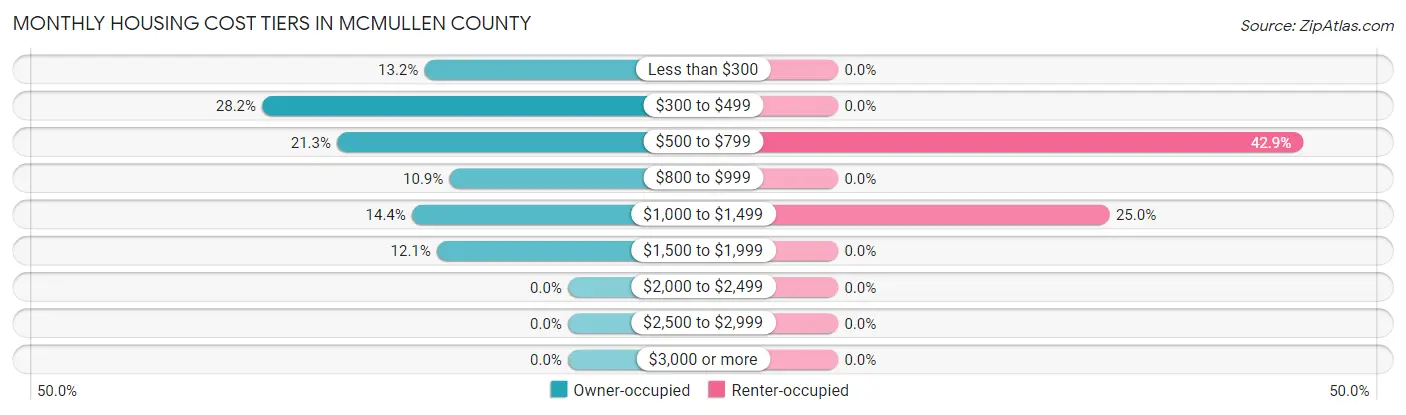
| Monthly Cost | Owner-occupied | Renter-occupied |
| Less than $300 | 23 (13.2%) | 0 (0.0%) |
| $300 to $499 | 49 (28.2%) | 0 (0.0%) |
| $500 to $799 | 37 (21.3%) | 12 (42.9%) |
| $800 to $999 | 19 (10.9%) | 0 (0.0%) |
| $1,000 to $1,499 | 25 (14.4%) | 7 (25.0%) |
| $1,500 to $1,999 | 21 (12.1%) | 0 (0.0%) |
| $2,000 to $2,499 | 0 (0.0%) | 0 (0.0%) |
| $2,500 to $2,999 | 0 (0.0%) | 0 (0.0%) |
| $3,000 or more | 0 (0.0%) | 0 (0.0%) |
| Total | 174 (100.0%) | 28 (100.0%) |
Physical Housing Characteristics in McMullen County
Housing Structures in McMullen County
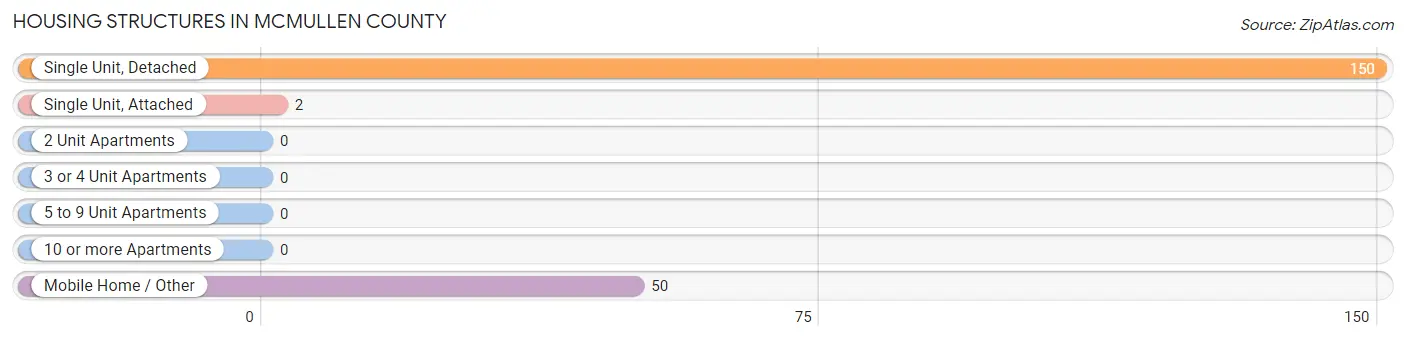
| Structure Type | # Housing Units | % Housing Units |
| Single Unit, Detached | 150 | 74.3% |
| Single Unit, Attached | 2 | 1.0% |
| 2 Unit Apartments | 0 | 0.0% |
| 3 or 4 Unit Apartments | 0 | 0.0% |
| 5 to 9 Unit Apartments | 0 | 0.0% |
| 10 or more Apartments | 0 | 0.0% |
| Mobile Home / Other | 50 | 24.7% |
| Total | 202 | 100.0% |
Housing Structures by Occupancy in McMullen County
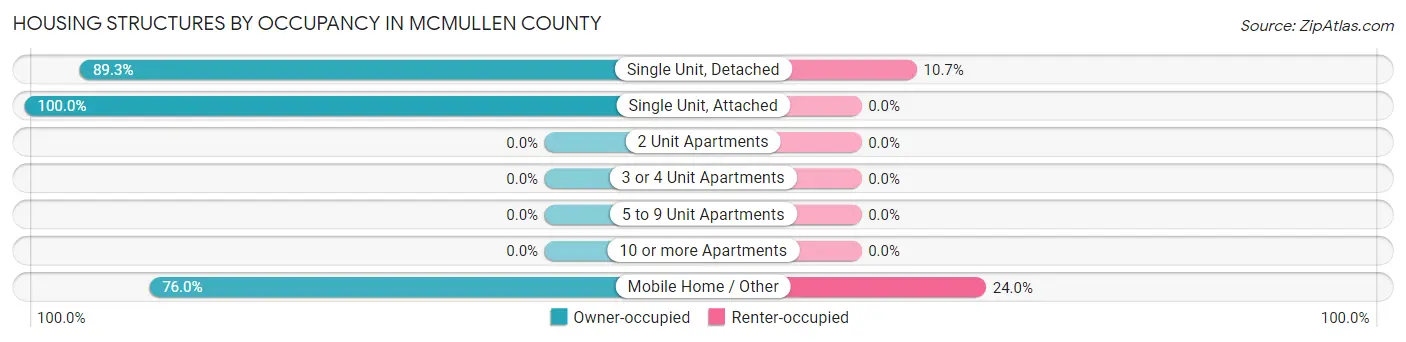
| Structure Type | Owner-occupied | Renter-occupied |
| Single Unit, Detached | 134 (89.3%) | 16 (10.7%) |
| Single Unit, Attached | 2 (100.0%) | 0 (0.0%) |
| 2 Unit Apartments | 0 (0.0%) | 0 (0.0%) |
| 3 or 4 Unit Apartments | 0 (0.0%) | 0 (0.0%) |
| 5 to 9 Unit Apartments | 0 (0.0%) | 0 (0.0%) |
| 10 or more Apartments | 0 (0.0%) | 0 (0.0%) |
| Mobile Home / Other | 38 (76.0%) | 12 (24.0%) |
| Total | 174 (86.1%) | 28 (13.9%) |
Housing Structures by Number of Rooms in McMullen County
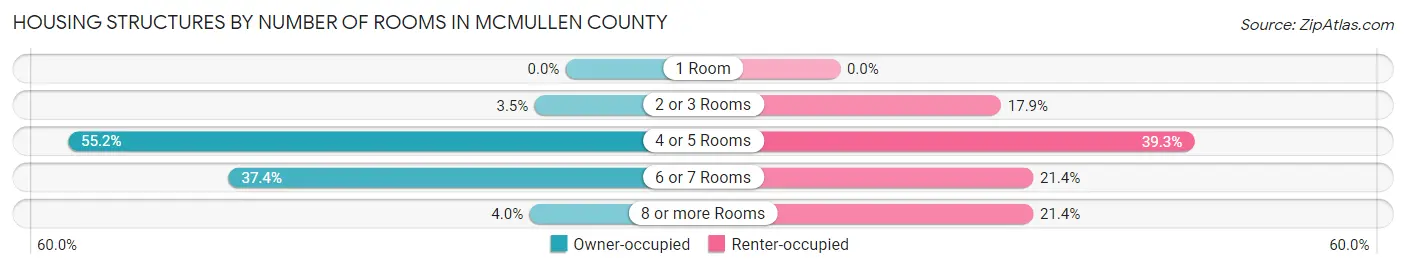
| Number of Rooms | Owner-occupied | Renter-occupied |
| 1 Room | 0 (0.0%) | 0 (0.0%) |
| 2 or 3 Rooms | 6 (3.5%) | 5 (17.9%) |
| 4 or 5 Rooms | 96 (55.2%) | 11 (39.3%) |
| 6 or 7 Rooms | 65 (37.4%) | 6 (21.4%) |
| 8 or more Rooms | 7 (4.0%) | 6 (21.4%) |
| Total | 174 (100.0%) | 28 (100.0%) |
Housing Structure by Heating Type in McMullen County
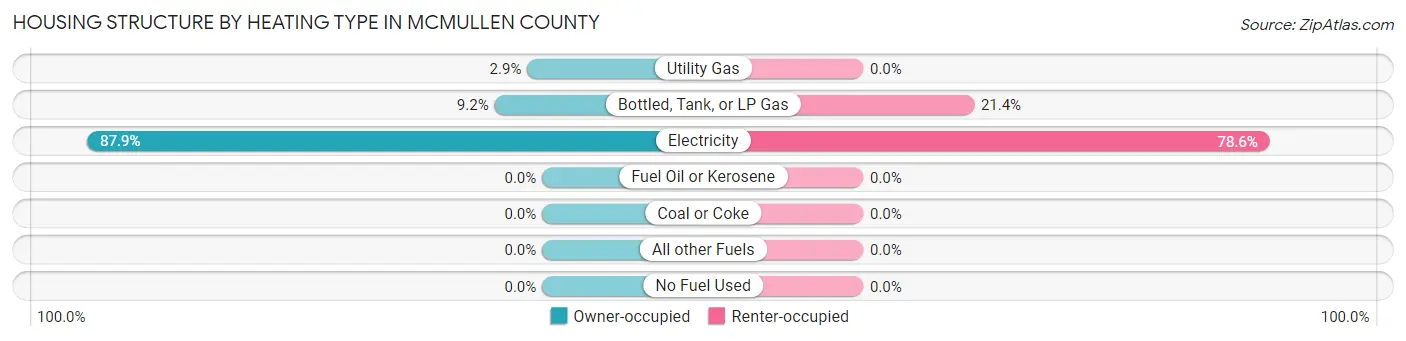
| Heating Type | Owner-occupied | Renter-occupied |
| Utility Gas | 5 (2.9%) | 0 (0.0%) |
| Bottled, Tank, or LP Gas | 16 (9.2%) | 6 (21.4%) |
| Electricity | 153 (87.9%) | 22 (78.6%) |
| Fuel Oil or Kerosene | 0 (0.0%) | 0 (0.0%) |
| Coal or Coke | 0 (0.0%) | 0 (0.0%) |
| All other Fuels | 0 (0.0%) | 0 (0.0%) |
| No Fuel Used | 0 (0.0%) | 0 (0.0%) |
| Total | 174 (100.0%) | 28 (100.0%) |
Household Vehicle Usage in McMullen County
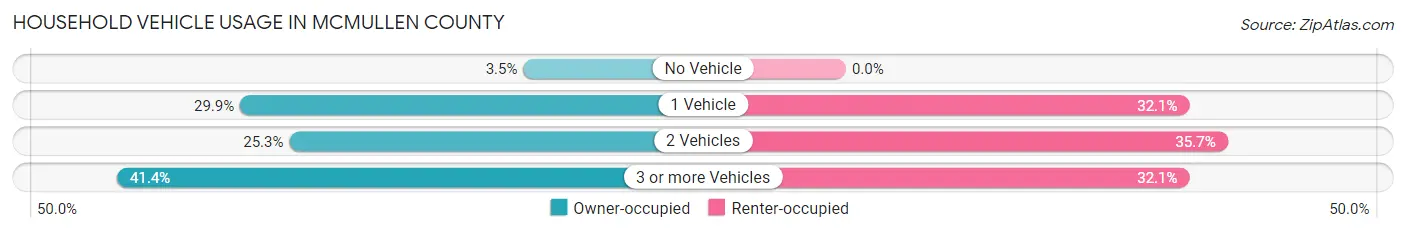
| Vehicles per Household | Owner-occupied | Renter-occupied |
| No Vehicle | 6 (3.5%) | 0 (0.0%) |
| 1 Vehicle | 52 (29.9%) | 9 (32.1%) |
| 2 Vehicles | 44 (25.3%) | 10 (35.7%) |
| 3 or more Vehicles | 72 (41.4%) | 9 (32.1%) |
| Total | 174 (100.0%) | 28 (100.0%) |
Real Estate & Mortgages in McMullen County
Real Estate and Mortgage Overview in McMullen County
| Characteristic | Without Mortgage | With Mortgage |
| Housing Units | 131 | 43 |
| Median Property Value | $103,300 | $0 |
| Median Household Income | $54,583 | $13 |
| Monthly Housing Costs | $480 | $0 |
| Real Estate Taxes | $1,790 | $7 |
Property Value by Mortgage Status in McMullen County
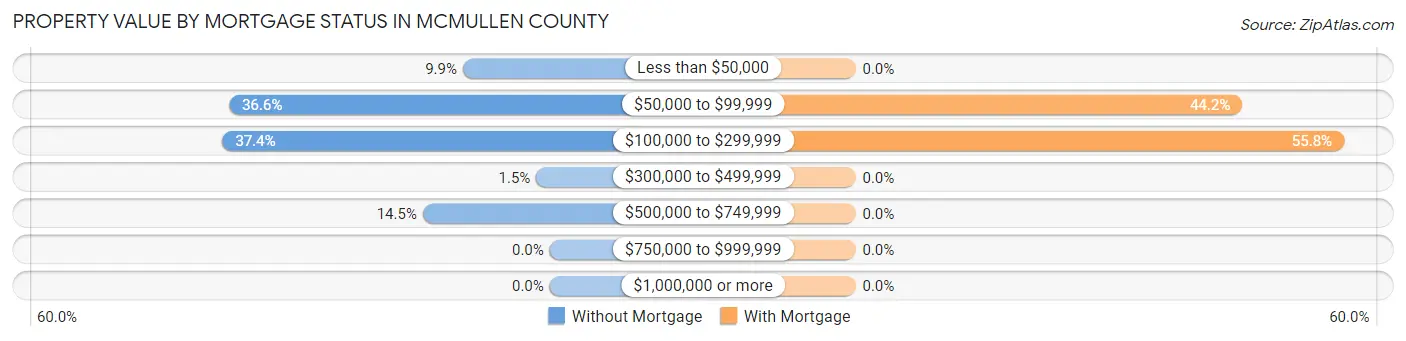
| Property Value | Without Mortgage | With Mortgage |
| Less than $50,000 | 13 (9.9%) | 0 (0.0%) |
| $50,000 to $99,999 | 48 (36.6%) | 19 (44.2%) |
| $100,000 to $299,999 | 49 (37.4%) | 24 (55.8%) |
| $300,000 to $499,999 | 2 (1.5%) | 0 (0.0%) |
| $500,000 to $749,999 | 19 (14.5%) | 0 (0.0%) |
| $750,000 to $999,999 | 0 (0.0%) | 0 (0.0%) |
| $1,000,000 or more | 0 (0.0%) | 0 (0.0%) |
| Total | 131 (100.0%) | 43 (100.0%) |
Household Income by Mortgage Status in McMullen County
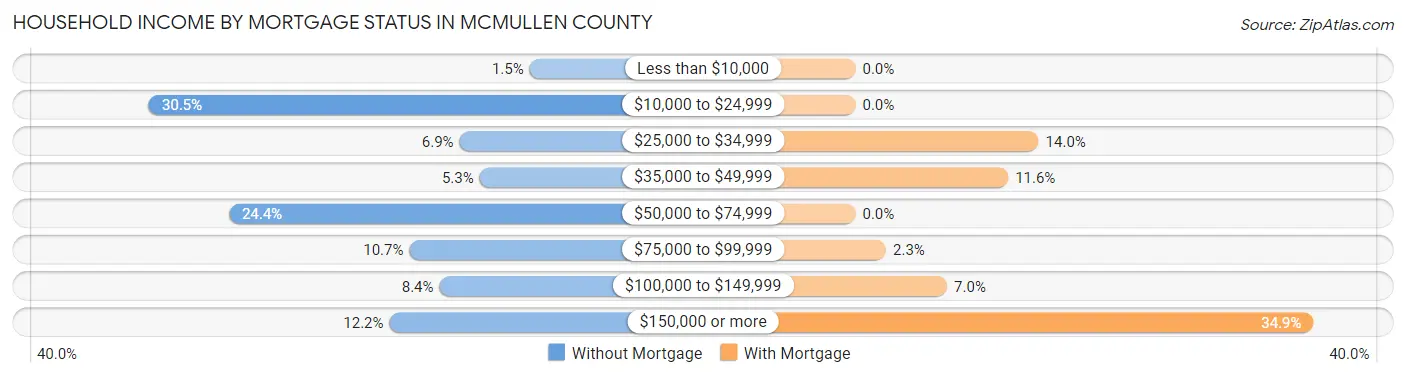
| Household Income | Without Mortgage | With Mortgage |
| Less than $10,000 | 2 (1.5%) | 0 (0.0%) |
| $10,000 to $24,999 | 40 (30.5%) | 0 (0.0%) |
| $25,000 to $34,999 | 9 (6.9%) | 6 (14.0%) |
| $35,000 to $49,999 | 7 (5.3%) | 5 (11.6%) |
| $50,000 to $74,999 | 32 (24.4%) | 0 (0.0%) |
| $75,000 to $99,999 | 14 (10.7%) | 1 (2.3%) |
| $100,000 to $149,999 | 11 (8.4%) | 3 (7.0%) |
| $150,000 or more | 16 (12.2%) | 15 (34.9%) |
| Total | 131 (100.0%) | 43 (100.0%) |
Property Value to Household Income Ratio in McMullen County
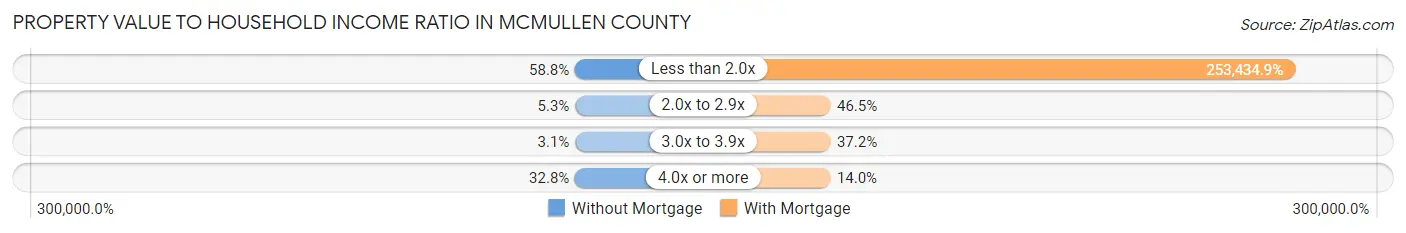
| Value-to-Income Ratio | Without Mortgage | With Mortgage |
| Less than 2.0x | 77 (58.8%) | 108,977 (253,434.9%) |
| 2.0x to 2.9x | 7 (5.3%) | 20 (46.5%) |
| 3.0x to 3.9x | 4 (3.0%) | 16 (37.2%) |
| 4.0x or more | 43 (32.8%) | 6 (14.0%) |
| Total | 131 (100.0%) | 43 (100.0%) |
Real Estate Taxes by Mortgage Status in McMullen County
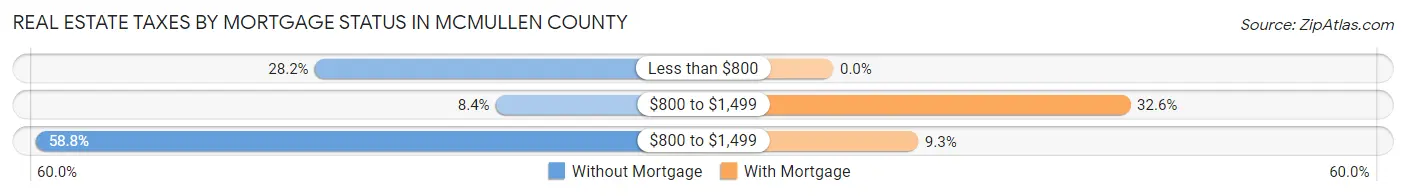
| Property Taxes | Without Mortgage | With Mortgage |
| Less than $800 | 37 (28.2%) | 0 (0.0%) |
| $800 to $1,499 | 11 (8.4%) | 14 (32.6%) |
| $800 to $1,499 | 77 (58.8%) | 4 (9.3%) |
| Total | 131 (100.0%) | 43 (100.0%) |
Health & Disability in McMullen County
Health Insurance Coverage by Age in McMullen County
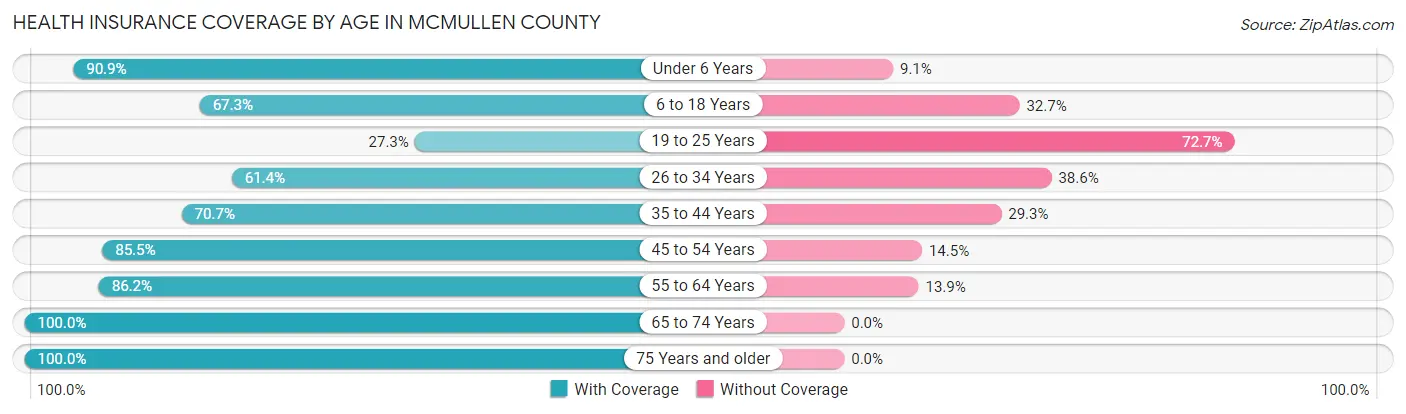
| Age Bracket | With Coverage | Without Coverage |
| Under 6 Years | 60 (90.9%) | 6 (9.1%) |
| 6 to 18 Years | 101 (67.3%) | 49 (32.7%) |
| 19 to 25 Years | 6 (27.3%) | 16 (72.7%) |
| 26 to 34 Years | 54 (61.4%) | 34 (38.6%) |
| 35 to 44 Years | 58 (70.7%) | 24 (29.3%) |
| 45 to 54 Years | 59 (85.5%) | 10 (14.5%) |
| 55 to 64 Years | 56 (86.2%) | 9 (13.9%) |
| 65 to 74 Years | 88 (100.0%) | 0 (0.0%) |
| 75 Years and older | 40 (100.0%) | 0 (0.0%) |
| Total | 522 (77.9%) | 148 (22.1%) |
Health Insurance Coverage by Citizenship Status in McMullen County
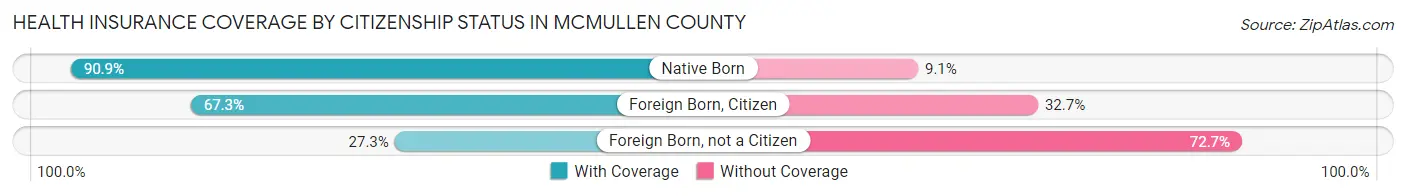
| Citizenship Status | With Coverage | Without Coverage |
| Native Born | 60 (90.9%) | 6 (9.1%) |
| Foreign Born, Citizen | 101 (67.3%) | 49 (32.7%) |
| Foreign Born, not a Citizen | 6 (27.3%) | 16 (72.7%) |
Health Insurance Coverage by Household Income in McMullen County
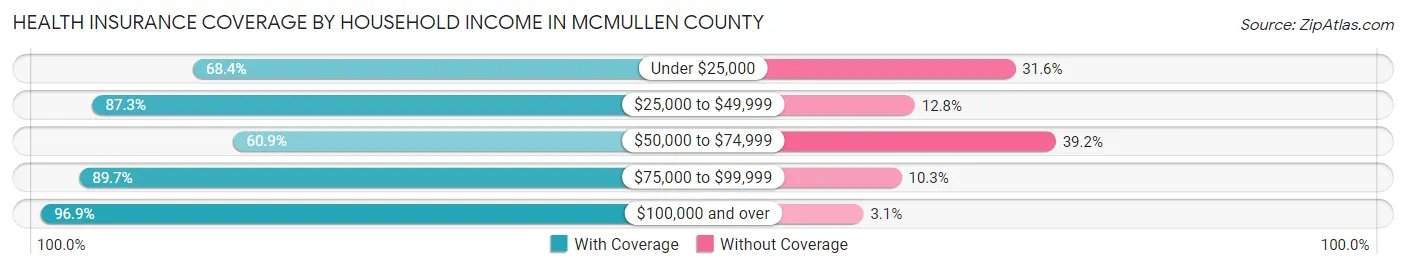
| Household Income | With Coverage | Without Coverage |
| Under $25,000 | 65 (68.4%) | 30 (31.6%) |
| $25,000 to $49,999 | 89 (87.3%) | 13 (12.8%) |
| $50,000 to $74,999 | 143 (60.9%) | 92 (39.2%) |
| $75,000 to $99,999 | 70 (89.7%) | 8 (10.3%) |
| $100,000 and over | 155 (96.9%) | 5 (3.1%) |
Public vs Private Health Insurance Coverage by Age in McMullen County
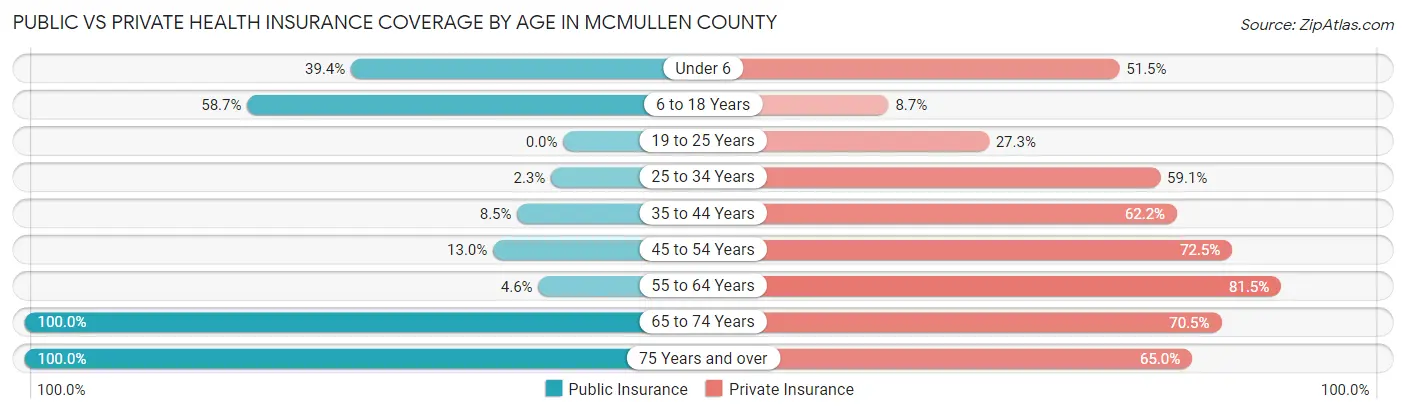
| Age Bracket | Public Insurance | Private Insurance |
| Under 6 | 26 (39.4%) | 34 (51.5%) |
| 6 to 18 Years | 88 (58.7%) | 13 (8.7%) |
| 19 to 25 Years | 0 (0.0%) | 6 (27.3%) |
| 25 to 34 Years | 2 (2.3%) | 52 (59.1%) |
| 35 to 44 Years | 7 (8.5%) | 51 (62.2%) |
| 45 to 54 Years | 9 (13.0%) | 50 (72.5%) |
| 55 to 64 Years | 3 (4.6%) | 53 (81.5%) |
| 65 to 74 Years | 88 (100.0%) | 62 (70.5%) |
| 75 Years and over | 40 (100.0%) | 26 (65.0%) |
| Total | 263 (39.3%) | 347 (51.8%) |
Disability Status by Sex by Age in McMullen County
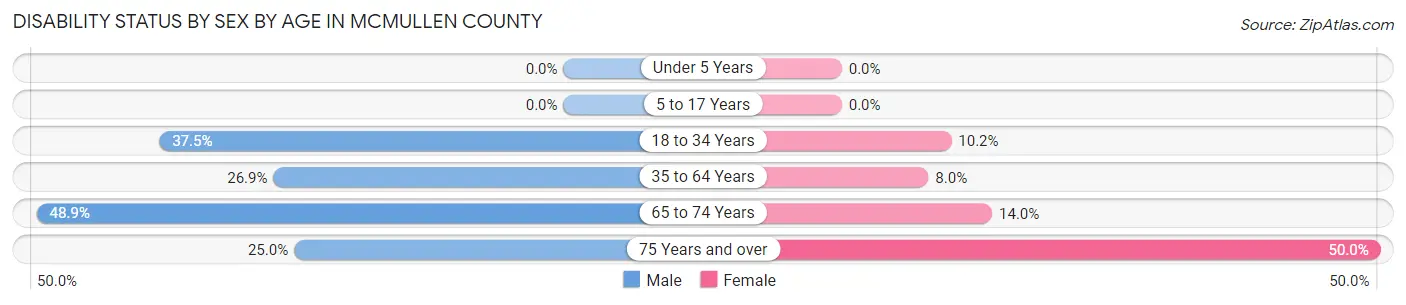
| Age Bracket | Male | Female |
| Under 5 Years | 0 (0.0%) | 0 (0.0%) |
| 5 to 17 Years | 0 (0.0%) | 0 (0.0%) |
| 18 to 34 Years | 21 (37.5%) | 6 (10.2%) |
| 35 to 64 Years | 28 (26.9%) | 9 (8.0%) |
| 65 to 74 Years | 22 (48.9%) | 6 (14.0%) |
| 75 Years and over | 4 (25.0%) | 12 (50.0%) |
Disability Class by Sex by Age in McMullen County
Disability Class: Hearing Difficulty
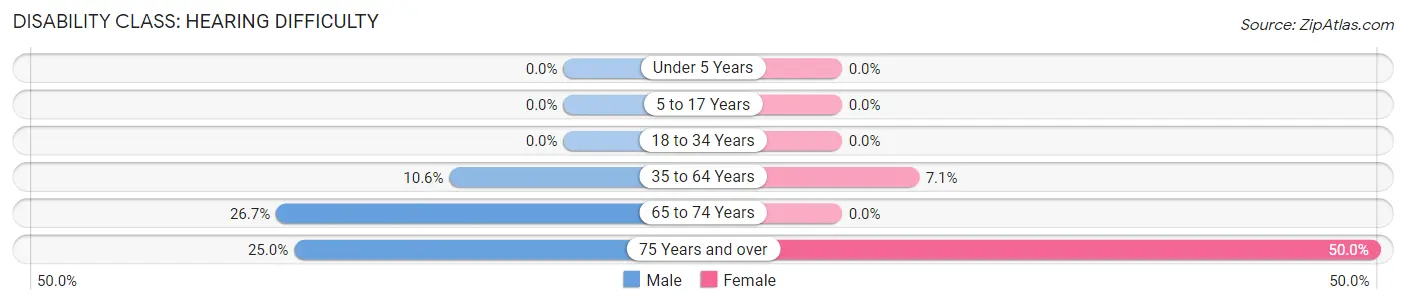
| Age Bracket | Male | Female |
| Under 5 Years | 0 (0.0%) | 0 (0.0%) |
| 5 to 17 Years | 0 (0.0%) | 0 (0.0%) |
| 18 to 34 Years | 0 (0.0%) | 0 (0.0%) |
| 35 to 64 Years | 11 (10.6%) | 8 (7.1%) |
| 65 to 74 Years | 12 (26.7%) | 0 (0.0%) |
| 75 Years and over | 4 (25.0%) | 12 (50.0%) |
Disability Class: Vision Difficulty
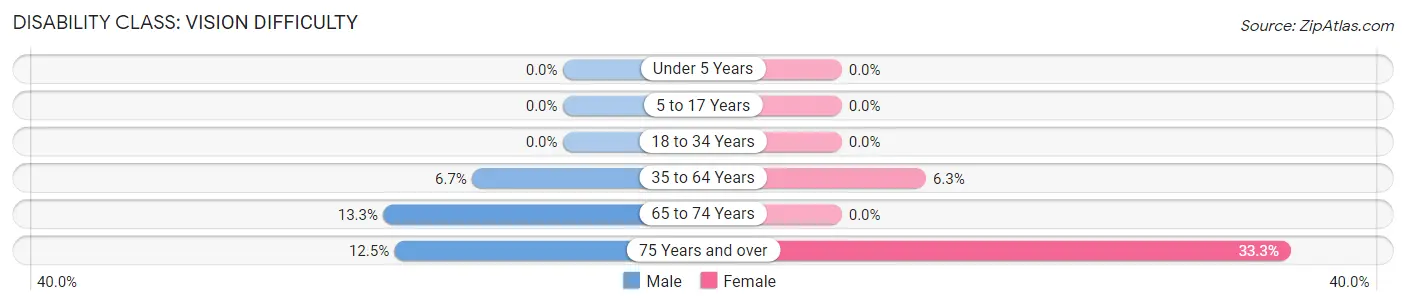
| Age Bracket | Male | Female |
| Under 5 Years | 0 (0.0%) | 0 (0.0%) |
| 5 to 17 Years | 0 (0.0%) | 0 (0.0%) |
| 18 to 34 Years | 0 (0.0%) | 0 (0.0%) |
| 35 to 64 Years | 7 (6.7%) | 7 (6.2%) |
| 65 to 74 Years | 6 (13.3%) | 0 (0.0%) |
| 75 Years and over | 2 (12.5%) | 8 (33.3%) |
Disability Class: Cognitive Difficulty
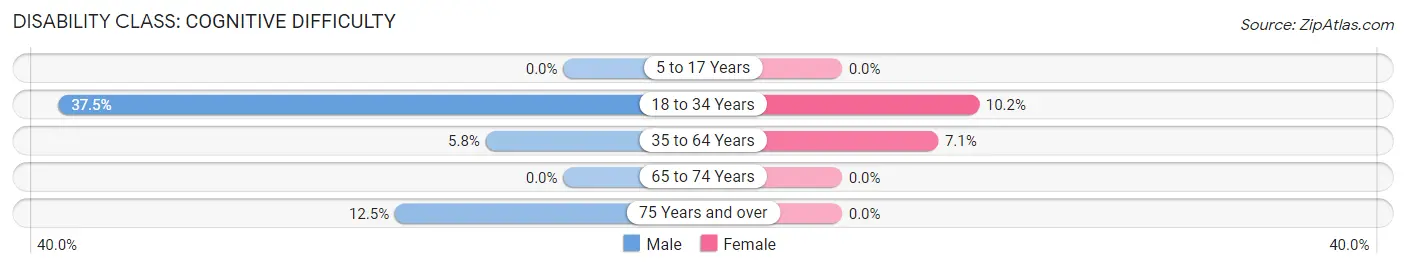
| Age Bracket | Male | Female |
| 5 to 17 Years | 0 (0.0%) | 0 (0.0%) |
| 18 to 34 Years | 21 (37.5%) | 6 (10.2%) |
| 35 to 64 Years | 6 (5.8%) | 8 (7.1%) |
| 65 to 74 Years | 0 (0.0%) | 0 (0.0%) |
| 75 Years and over | 2 (12.5%) | 0 (0.0%) |
Disability Class: Ambulatory Difficulty
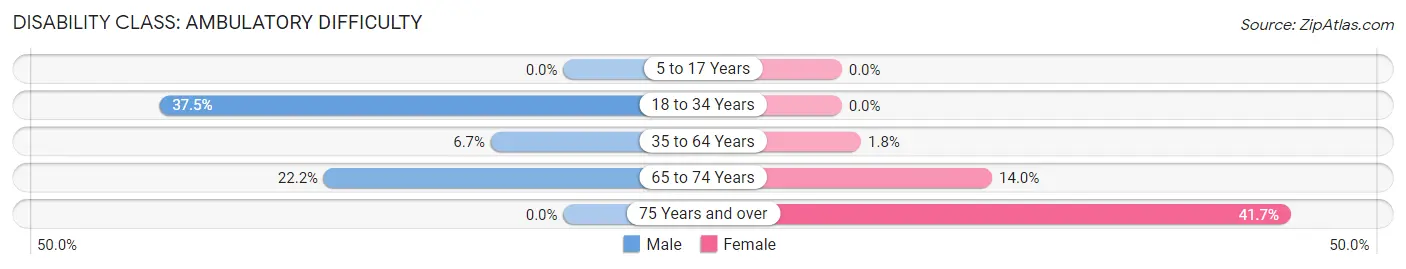
| Age Bracket | Male | Female |
| 5 to 17 Years | 0 (0.0%) | 0 (0.0%) |
| 18 to 34 Years | 21 (37.5%) | 0 (0.0%) |
| 35 to 64 Years | 7 (6.7%) | 2 (1.8%) |
| 65 to 74 Years | 10 (22.2%) | 6 (14.0%) |
| 75 Years and over | 0 (0.0%) | 10 (41.7%) |
Disability Class: Self-Care Difficulty
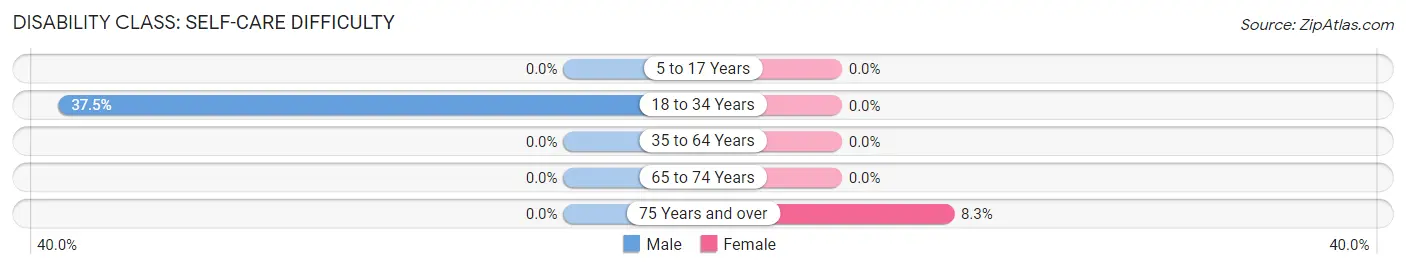
| Age Bracket | Male | Female |
| 5 to 17 Years | 0 (0.0%) | 0 (0.0%) |
| 18 to 34 Years | 21 (37.5%) | 0 (0.0%) |
| 35 to 64 Years | 0 (0.0%) | 0 (0.0%) |
| 65 to 74 Years | 0 (0.0%) | 0 (0.0%) |
| 75 Years and over | 0 (0.0%) | 2 (8.3%) |
Technology Access in McMullen County
Computing Device Access in McMullen County
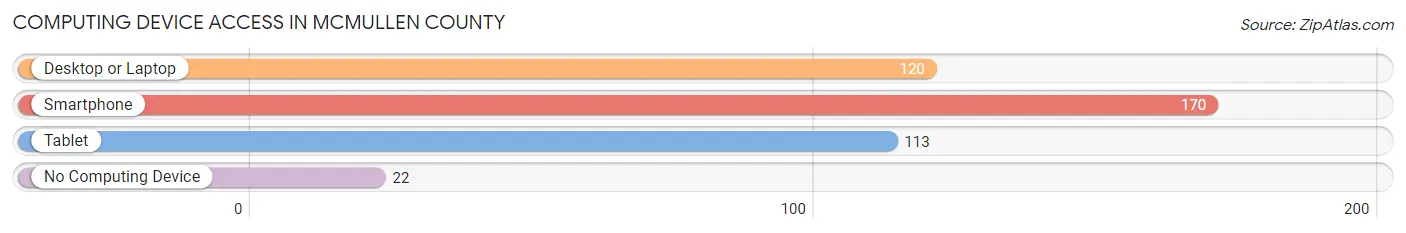
| Device Type | # Households | % Households |
| Desktop or Laptop | 120 | 59.4% |
| Smartphone | 170 | 84.2% |
| Tablet | 113 | 55.9% |
| No Computing Device | 22 | 10.9% |
| Total | 202 | 100.0% |
Internet Access in McMullen County
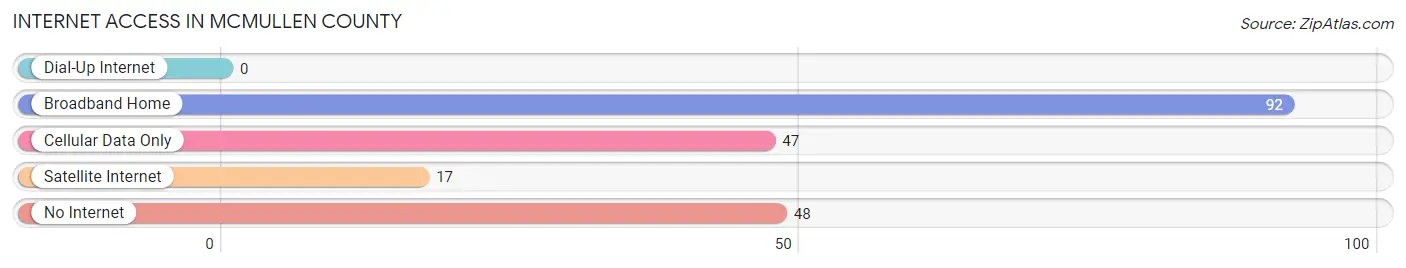
| Internet Type | # Households | % Households |
| Dial-Up Internet | 0 | 0.0% |
| Broadband Home | 92 | 45.5% |
| Cellular Data Only | 47 | 23.3% |
| Satellite Internet | 17 | 8.4% |
| No Internet | 48 | 23.8% |
| Total | 202 | 100.0% |
McMullen County Summary
Mcmullen County is located in the south-central region of Texas, and is part of the Eagle Ford Shale region. The county is bordered by Atascosa County to the north, Live Oak County to the east, La Salle County to the south, and Webb County to the west. The county seat is Tilden, and the largest city is Calliham. The county was created in 1858 and is named for John McMullen, an early settler in the area.
Geography
Mcmullen County covers an area of 1,072 square miles, making it the second-largest county in Texas. The terrain is mostly flat, with some rolling hills in the western part of the county. The county is drained by the Nueces River, which forms the western boundary of the county. The climate is semi-arid, with hot summers and mild winters. The average annual precipitation is 22 inches.
The county is home to several state parks, including Choke Canyon State Park, Lake Corpus Christi State Park, and Lake Tawakoni State Park. The county also contains several wildlife management areas, including the Choke Canyon Wildlife Management Area, the Lake Corpus Christi Wildlife Management Area, and the Lake Tawakoni Wildlife Management Area.
Demographics
As of the 2010 census, the population of Mcmullen County was 707, making it the second-least populous county in Texas. The population density was 0.7 people per square mile. The racial makeup of the county was 81.3% White, 0.3% African American, 0.2% Native American, 0.1% Asian, 0.1% Pacific Islander, 16.7% from other races, and 1.3% from two or more races. Hispanic or Latino of any race were 37.3% of the population.
The median income for a household in the county was $30,938, and the median income for a family was $35,938. The per capita income for the county was $14,938. About 18.3% of families and 22.3% of the population were below the poverty line, including 28.3% of those under age 18 and 16.3% of those age 65 or over.
Economy
Mcmullen County’s economy is largely based on agriculture and oil and gas production. The county is home to several large ranches, and the main crops grown in the county are cotton, corn, sorghum, and wheat. The county is also home to several oil and gas fields, and the Eagle Ford Shale region is a major source of oil and gas production in the county.
The county is also home to several businesses, including a lumber mill, a feed mill, and a meat processing plant. The county is served by two airports, the Tilden Municipal Airport and the Calliham Municipal Airport.
Conclusion
Mcmullen County is a rural county located in the south-central region of Texas. The county is home to several state parks and wildlife management areas, and the economy is largely based on agriculture and oil and gas production. The population of the county is small, but diverse, with a median income that is slightly below the state average. The county is served by two airports, and is home to several businesses.
Common Questions
What is Per Capita Income in McMullen County?
Per Capita income in McMullen County is $27,029.
What is the Median Family Income in McMullen County?
Median Family Income in McMullen County is $66,406.
What is the Median Household income in McMullen County?
Median Household Income in McMullen County is $60,313.
What is Income or Wage Gap in McMullen County?
Income or Wage Gap in McMullen County is 65.5%.
Women in McMullen County earn 34.5 cents for every dollar earned by a man.
What is Inequality or Gini Index in McMullen County?
Inequality or Gini Index in McMullen County is 0.50.
What is the Total Population of McMullen County?
Total Population of McMullen County is 670.
What is the Total Male Population of McMullen County?
Total Male Population of McMullen County is 296.
What is the Total Female Population of McMullen County?
Total Female Population of McMullen County is 374.
What is the Ratio of Males per 100 Females in McMullen County?
There are 79.14 Males per 100 Females in McMullen County.
What is the Ratio of Females per 100 Males in McMullen County?
There are 126.35 Females per 100 Males in McMullen County.
What is the Median Population Age in McMullen County?
Median Population Age in McMullen County is 36.5 Years.
What is the Average Family Size in McMullen County
Average Family Size in McMullen County is 4.0 People.
What is the Average Household Size in McMullen County
Average Household Size in McMullen County is 3.3 People.
How Large is the Labor Force in McMullen County?
There are 253 People in the Labor Forcein in McMullen County.
What is the Percentage of People in the Labor Force in McMullen County?
55.1% of People are in the Labor Force in McMullen County.
What is the Unemployment Rate in McMullen County?
Unemployment Rate in McMullen County is 2.4%.