McCulloch County, TX Map & Demographics
McCulloch County Map
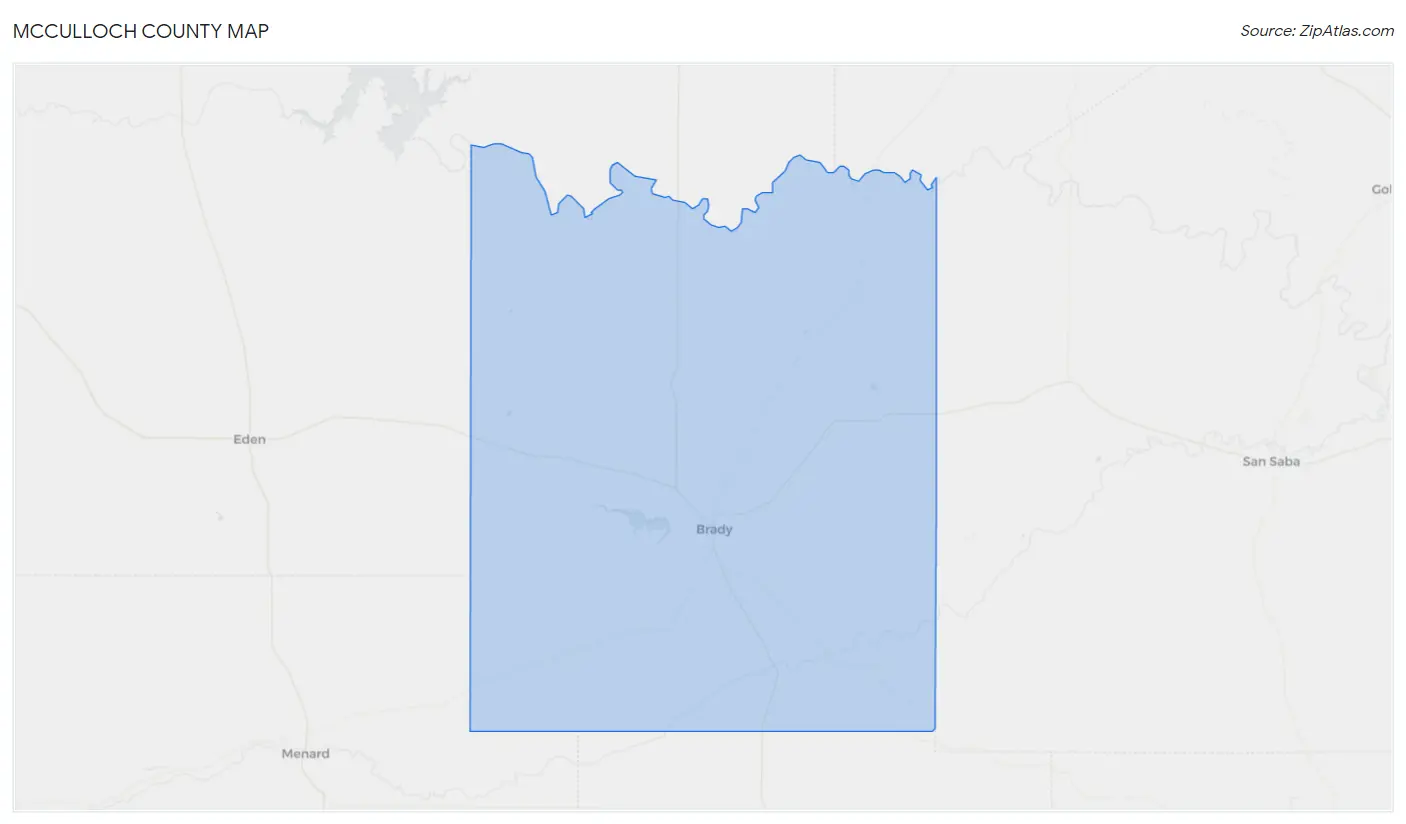
McCulloch County Overview
$29,514
PER CAPITA INCOME
$66,438
AVG FAMILY INCOME
$53,214
AVG HOUSEHOLD INCOME
29.9%
WAGE / INCOME GAP [ % ]
70.1¢/ $1
WAGE / INCOME GAP [ $ ]
0.43
INEQUALITY / GINI INDEX
7,638
TOTAL POPULATION
3,917
MALE POPULATION
3,721
FEMALE POPULATION
105.27
MALES / 100 FEMALES
95.00
FEMALES / 100 MALES
44.4
MEDIAN AGE
3.0
AVG FAMILY SIZE
2.4
AVG HOUSEHOLD SIZE
3,598
LABOR FORCE [ PEOPLE ]
58.6%
PERCENT IN LABOR FORCE
8.7%
UNEMPLOYMENT RATE
McCulloch County Area Codes
Income in McCulloch County
Income Overview in McCulloch County
Per Capita Income in McCulloch County is $29,514, while median incomes of families and households are $66,438 and $53,214 respectively.
| Characteristic | Number | Measure |
| Per Capita Income | 7,638 | $29,514 |
| Median Family Income | 1,976 | $66,438 |
| Mean Family Income | 1,976 | $80,950 |
| Median Household Income | 3,186 | $53,214 |
| Mean Household Income | 3,186 | $68,736 |
| Income Deficit | 1,976 | $0 |
| Wage / Income Gap (%) | 7,638 | 29.90% |
| Wage / Income Gap ($) | 7,638 | 70.10¢ per $1 |
| Gini / Inequality Index | 7,638 | 0.43 |
Earnings by Sex in McCulloch County
Average Earnings in McCulloch County are $32,041, $37,619 for men and $26,370 for women, a difference of 29.9%.
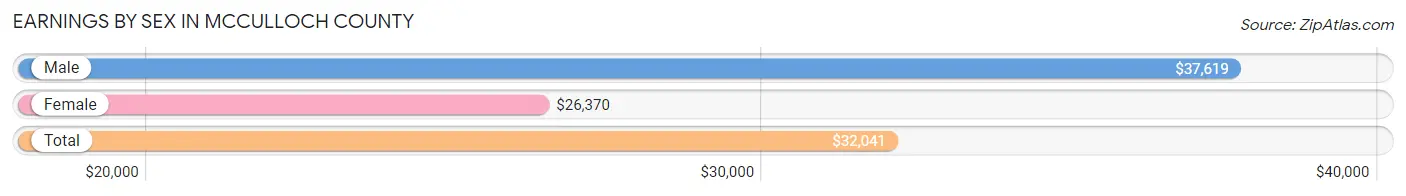
| Sex | Number | Average Earnings |
| Male | 1,944 (51.4%) | $37,619 |
| Female | 1,839 (48.6%) | $26,370 |
| Total | 3,783 (100.0%) | $32,041 |
Earnings by Sex by Income Bracket in McCulloch County
The most common earnings brackets in McCulloch County are $65,000 to $74,999 for men (259 | 13.3%) and $40,000 to $44,999 for women (239 | 13.0%).
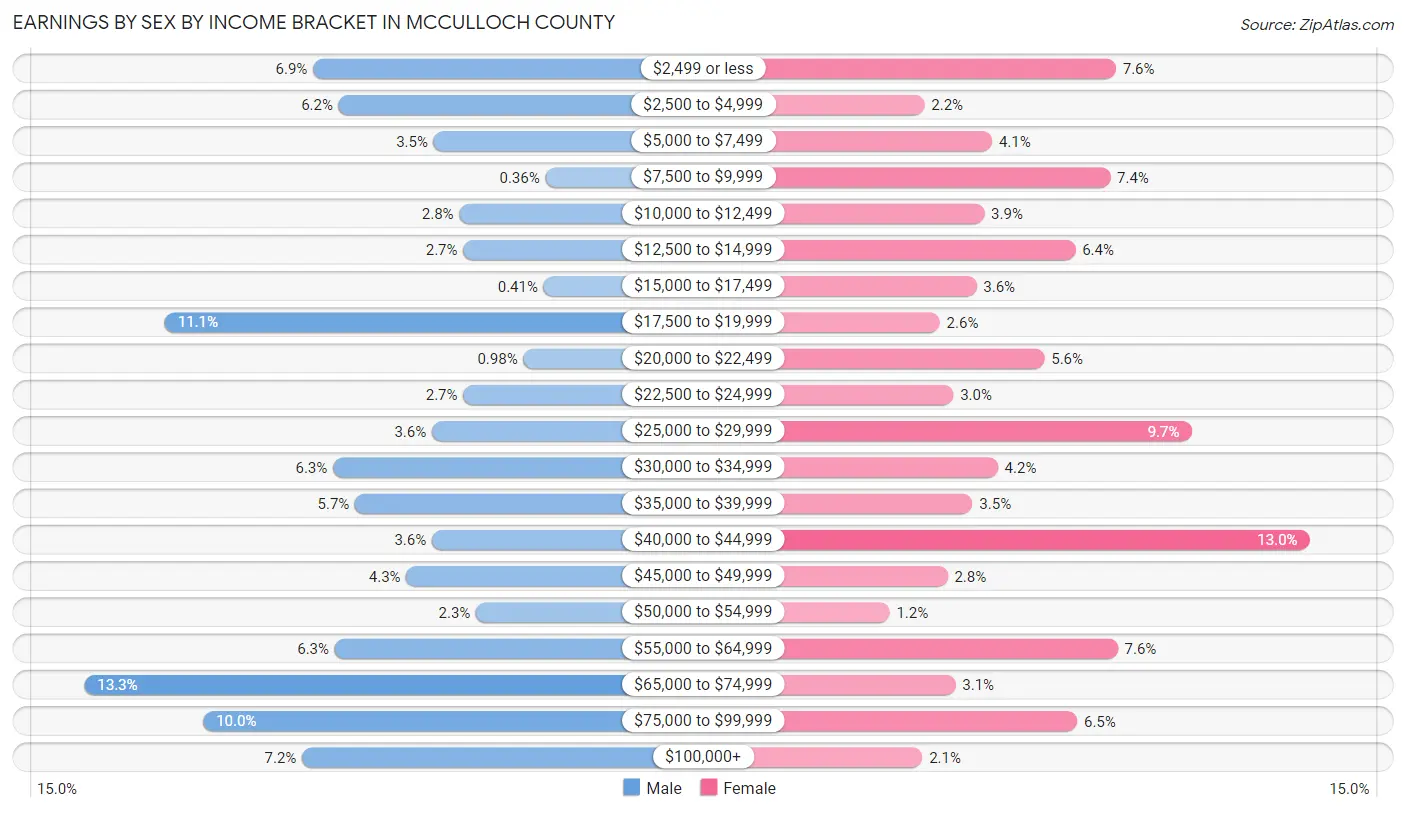
| Income | Male | Female |
| $2,499 or less | 134 (6.9%) | 139 (7.6%) |
| $2,500 to $4,999 | 120 (6.2%) | 40 (2.2%) |
| $5,000 to $7,499 | 68 (3.5%) | 75 (4.1%) |
| $7,500 to $9,999 | 7 (0.4%) | 136 (7.4%) |
| $10,000 to $12,499 | 54 (2.8%) | 71 (3.9%) |
| $12,500 to $14,999 | 52 (2.7%) | 118 (6.4%) |
| $15,000 to $17,499 | 8 (0.4%) | 67 (3.6%) |
| $17,500 to $19,999 | 215 (11.1%) | 48 (2.6%) |
| $20,000 to $22,499 | 19 (1.0%) | 102 (5.6%) |
| $22,500 to $24,999 | 52 (2.7%) | 55 (3.0%) |
| $25,000 to $29,999 | 69 (3.5%) | 178 (9.7%) |
| $30,000 to $34,999 | 123 (6.3%) | 78 (4.2%) |
| $35,000 to $39,999 | 111 (5.7%) | 65 (3.5%) |
| $40,000 to $44,999 | 69 (3.5%) | 239 (13.0%) |
| $45,000 to $49,999 | 83 (4.3%) | 52 (2.8%) |
| $50,000 to $54,999 | 45 (2.3%) | 22 (1.2%) |
| $55,000 to $64,999 | 122 (6.3%) | 140 (7.6%) |
| $65,000 to $74,999 | 259 (13.3%) | 56 (3.0%) |
| $75,000 to $99,999 | 194 (10.0%) | 119 (6.5%) |
| $100,000+ | 140 (7.2%) | 39 (2.1%) |
| Total | 1,944 (100.0%) | 1,839 (100.0%) |
Earnings by Sex by Educational Attainment in McCulloch County
Average earnings in McCulloch County are $45,482 for men and $29,764 for women, a difference of 34.6%. Men with an educational attainment of bachelor's degree enjoy the highest average annual earnings of $69,323, while those with high school diploma education earn the least with $34,461. Women with an educational attainment of bachelor's degree earn the most with the average annual earnings of $55,365, while those with less than high school education have the smallest earnings of $14,730.
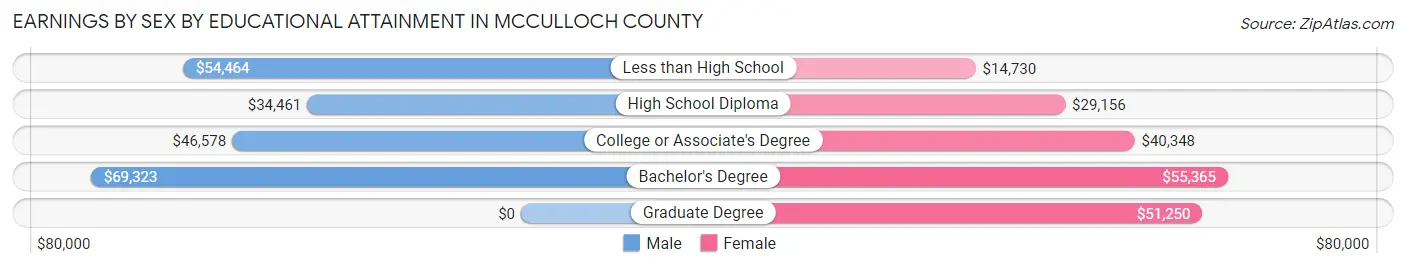
| Educational Attainment | Male Income | Female Income |
| Less than High School | $54,464 | $14,730 |
| High School Diploma | $34,461 | $29,156 |
| College or Associate's Degree | $46,578 | $40,348 |
| Bachelor's Degree | $69,323 | $55,365 |
| Graduate Degree | - | - |
| Total | $45,482 | $29,764 |
Family Income in McCulloch County
Family Income Brackets in McCulloch County
According to the McCulloch County family income data, there are 385 families falling into the $75,000 to $99,999 income range, which is the most common income bracket and makes up 19.5% of all families. Conversely, the $10,000 to $14,999 income bracket is the least frequent group with only 40 families (2.0%) belonging to this category.
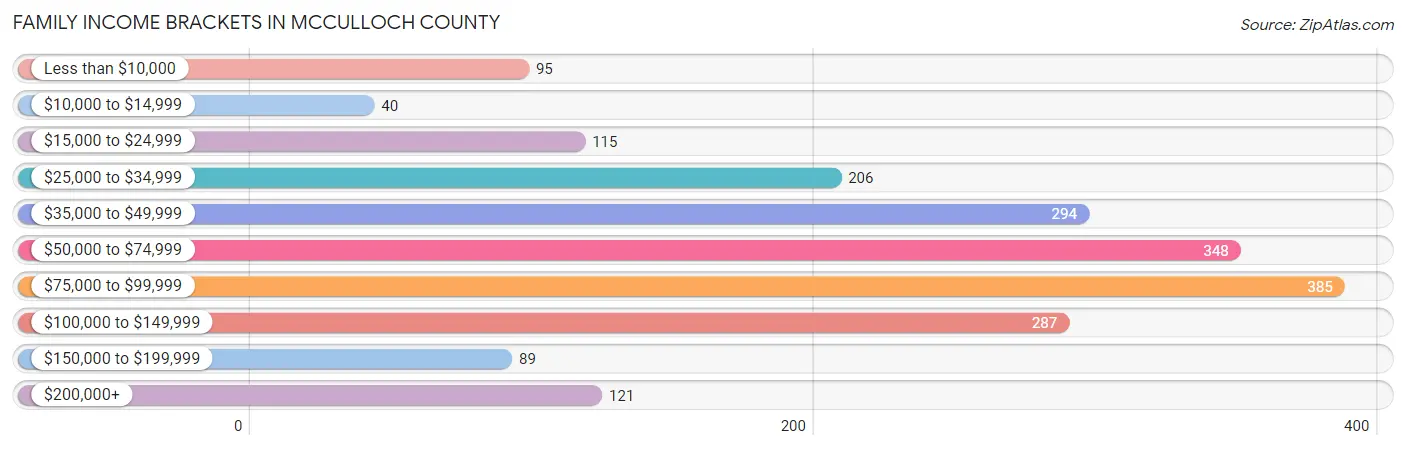
| Income Bracket | # Families | % Families |
| Less than $10,000 | 95 | 4.8% |
| $10,000 to $14,999 | 40 | 2.0% |
| $15,000 to $24,999 | 115 | 5.8% |
| $25,000 to $34,999 | 206 | 10.4% |
| $35,000 to $49,999 | 294 | 14.9% |
| $50,000 to $74,999 | 348 | 17.6% |
| $75,000 to $99,999 | 385 | 19.5% |
| $100,000 to $149,999 | 287 | 14.5% |
| $150,000 to $199,999 | 89 | 4.5% |
| $200,000+ | 121 | 6.1% |
Family Income by Famaliy Size in McCulloch County
4-person families (287 | 14.5%) account for the highest median family income in McCulloch County with $82,149 per family, while 2-person families (1,215 | 61.5%) have the highest median income of $25,261 per family member.
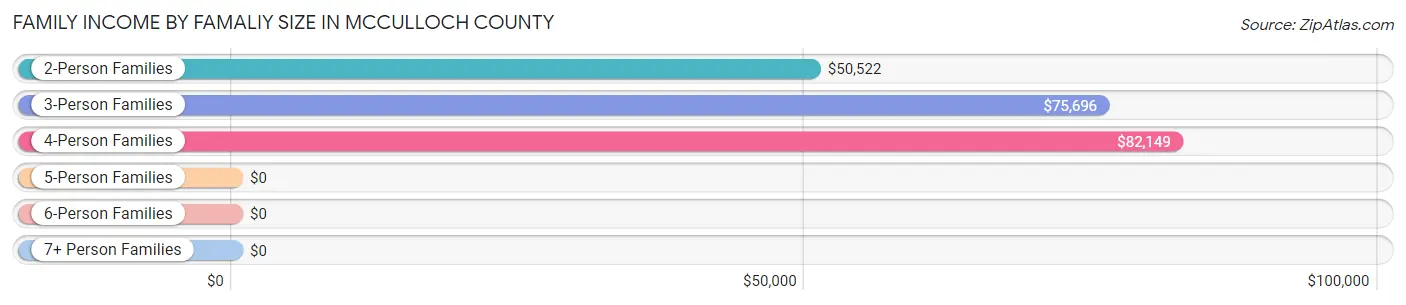
| Income Bracket | # Families | Median Income |
| 2-Person Families | 1,215 (61.5%) | $50,522 |
| 3-Person Families | 354 (17.9%) | $75,696 |
| 4-Person Families | 287 (14.5%) | $82,149 |
| 5-Person Families | 68 (3.4%) | $0 |
| 6-Person Families | 52 (2.6%) | $0 |
| 7+ Person Families | 0 (0.0%) | $0 |
| Total | 1,976 (100.0%) | $66,438 |
Family Income by Number of Earners in McCulloch County
The median family income in McCulloch County is $66,438, with families comprising 3+ earners (116) having the highest median family income of $98,750, while families with no earners (330) have the lowest median family income of $35,057, accounting for 5.9% and 16.7% of families, respectively.
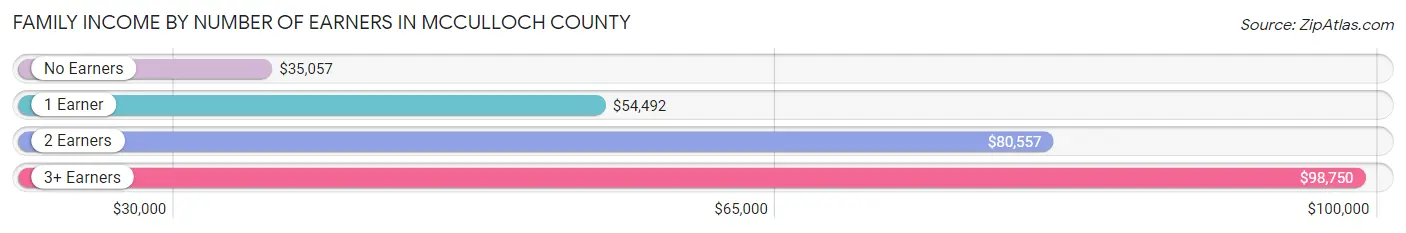
| Number of Earners | # Families | Median Income |
| No Earners | 330 (16.7%) | $35,057 |
| 1 Earner | 701 (35.5%) | $54,492 |
| 2 Earners | 829 (41.9%) | $80,557 |
| 3+ Earners | 116 (5.9%) | $98,750 |
| Total | 1,976 (100.0%) | $66,438 |
Household Income in McCulloch County
Household Income Brackets in McCulloch County
With 624 households falling in the category, the $50,000 to $74,999 income range is the most frequent in McCulloch County, accounting for 19.6% of all households. In contrast, only 99 households (3.1%) fall into the $10,000 to $14,999 income bracket, making it the least populous group.
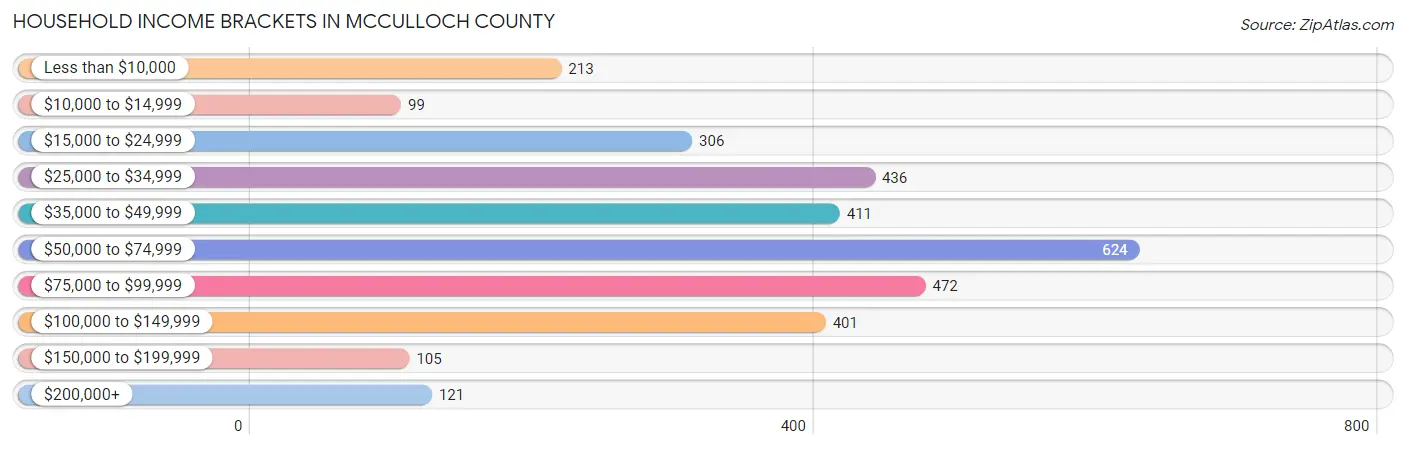
| Income Bracket | # Households | % Households |
| Less than $10,000 | 213 | 6.7% |
| $10,000 to $14,999 | 99 | 3.1% |
| $15,000 to $24,999 | 306 | 9.6% |
| $25,000 to $34,999 | 436 | 13.7% |
| $35,000 to $49,999 | 411 | 12.9% |
| $50,000 to $74,999 | 624 | 19.6% |
| $75,000 to $99,999 | 472 | 14.8% |
| $100,000 to $149,999 | 401 | 12.6% |
| $150,000 to $199,999 | 105 | 3.3% |
| $200,000+ | 121 | 3.8% |
Household Income by Householder Age in McCulloch County
The median household income in McCulloch County is $53,214, with the highest median household income of $67,070 found in the 25 to 44 years age bracket for the primary householder. A total of 718 households (22.5%) fall into this category. Meanwhile, the 65+ years age bracket for the primary householder has the lowest median household income of $35,483, with 1,150 households (36.1%) in this group.
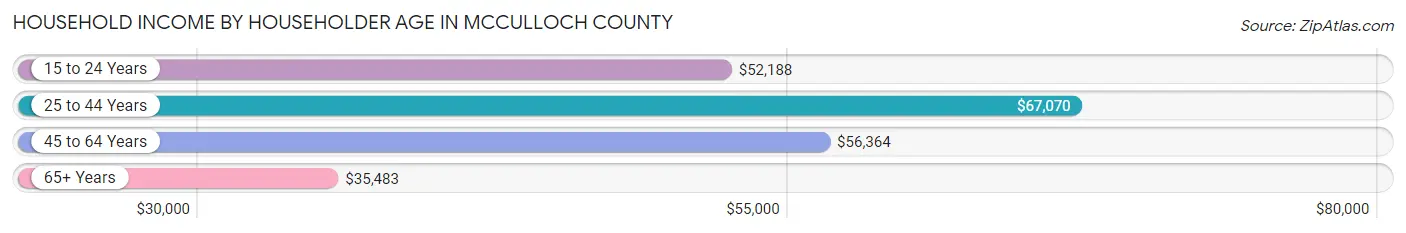
| Income Bracket | # Households | Median Income |
| 15 to 24 Years | 80 (2.5%) | $52,188 |
| 25 to 44 Years | 718 (22.5%) | $67,070 |
| 45 to 64 Years | 1,238 (38.9%) | $56,364 |
| 65+ Years | 1,150 (36.1%) | $35,483 |
| Total | 3,186 (100.0%) | $53,214 |
Poverty in McCulloch County
Income Below Poverty by Sex and Age in McCulloch County
With 11.1% poverty level for males and 16.0% for females among the residents of McCulloch County, 25 to 34 year old males and 12 to 14 year old females are the most vulnerable to poverty, with 111 males (27.3%) and 37 females (39.8%) in their respective age groups living below the poverty level.
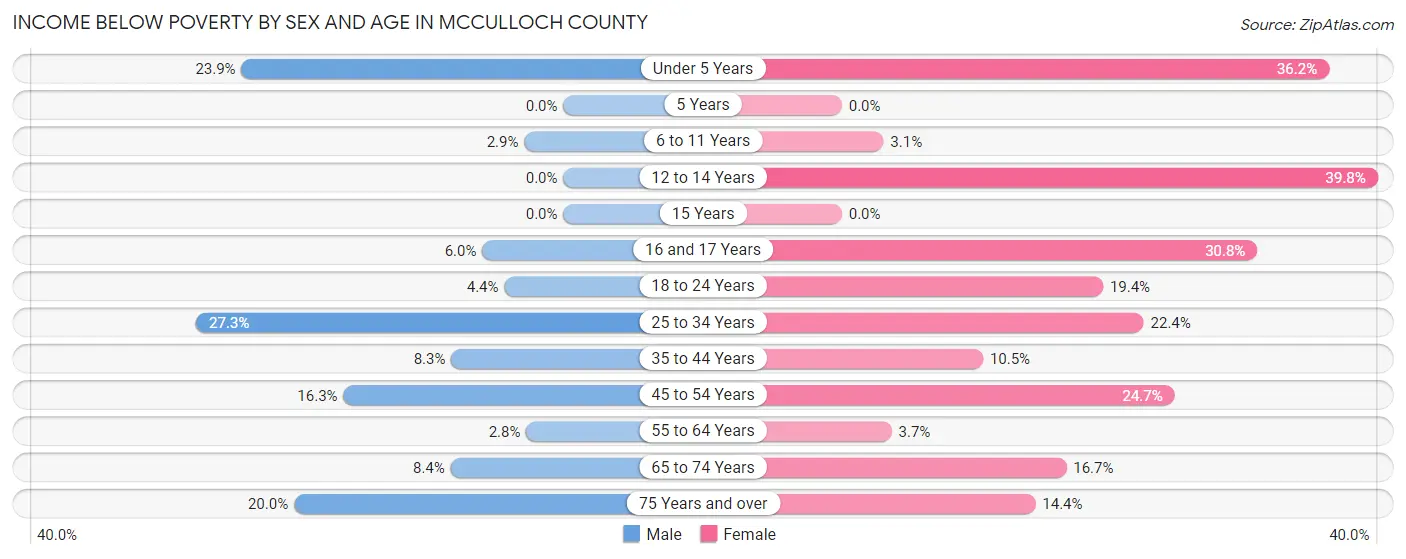
| Age Bracket | Male | Female |
| Under 5 Years | 65 (23.9%) | 51 (36.2%) |
| 5 Years | 0 (0.0%) | 0 (0.0%) |
| 6 to 11 Years | 6 (2.9%) | 11 (3.1%) |
| 12 to 14 Years | 0 (0.0%) | 37 (39.8%) |
| 15 Years | 0 (0.0%) | 0 (0.0%) |
| 16 and 17 Years | 5 (6.0%) | 33 (30.8%) |
| 18 to 24 Years | 13 (4.4%) | 51 (19.4%) |
| 25 to 34 Years | 111 (27.3%) | 78 (22.4%) |
| 35 to 44 Years | 38 (8.3%) | 39 (10.5%) |
| 45 to 54 Years | 73 (16.3%) | 125 (24.7%) |
| 55 to 64 Years | 15 (2.8%) | 20 (3.7%) |
| 65 to 74 Years | 41 (8.4%) | 85 (16.7%) |
| 75 Years and over | 57 (20.0%) | 51 (14.4%) |
| Total | 424 (11.1%) | 581 (16.0%) |
Income Above Poverty by Sex and Age in McCulloch County
According to the poverty statistics in McCulloch County, males aged 5 years and females aged 5 years are the age groups that are most secure financially, with 100.0% of males and 100.0% of females in these age groups living above the poverty line.
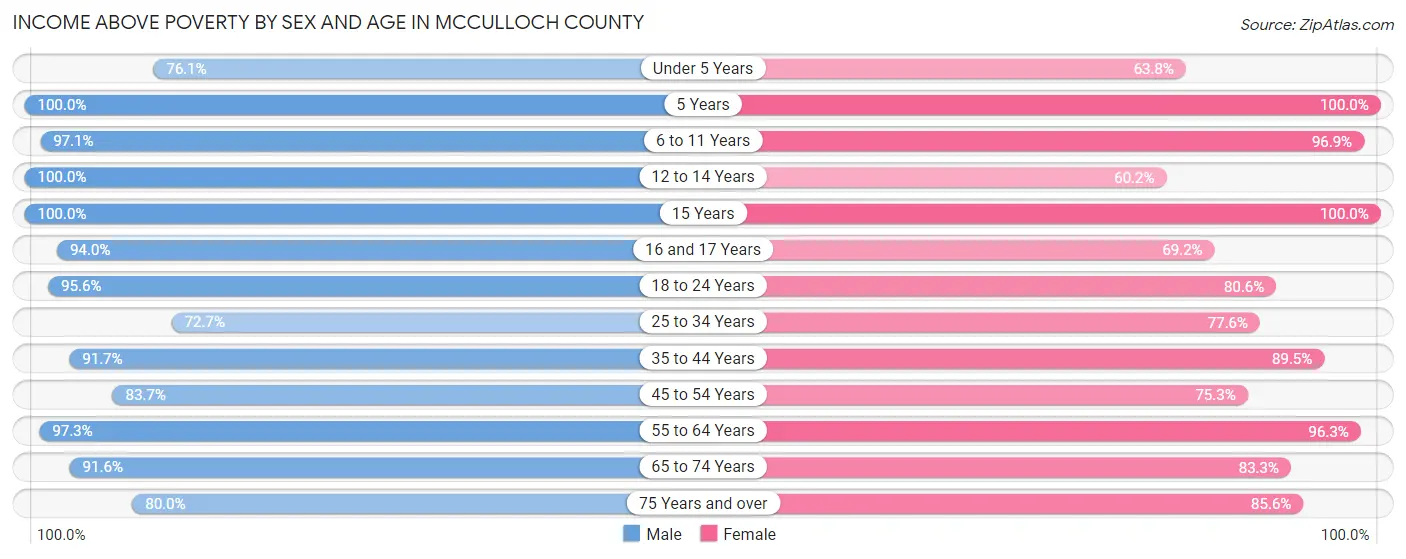
| Age Bracket | Male | Female |
| Under 5 Years | 207 (76.1%) | 90 (63.8%) |
| 5 Years | 57 (100.0%) | 17 (100.0%) |
| 6 to 11 Years | 201 (97.1%) | 345 (96.9%) |
| 12 to 14 Years | 267 (100.0%) | 56 (60.2%) |
| 15 Years | 23 (100.0%) | 18 (100.0%) |
| 16 and 17 Years | 78 (94.0%) | 74 (69.2%) |
| 18 to 24 Years | 284 (95.6%) | 212 (80.6%) |
| 25 to 34 Years | 296 (72.7%) | 270 (77.6%) |
| 35 to 44 Years | 419 (91.7%) | 333 (89.5%) |
| 45 to 54 Years | 374 (83.7%) | 381 (75.3%) |
| 55 to 64 Years | 531 (97.3%) | 520 (96.3%) |
| 65 to 74 Years | 449 (91.6%) | 425 (83.3%) |
| 75 Years and over | 228 (80.0%) | 304 (85.6%) |
| Total | 3,414 (88.9%) | 3,045 (84.0%) |
Income Below Poverty Among Married-Couple Families in McCulloch County
The poverty statistics for married-couple families in McCulloch County show that 6.4% or 90 of the total 1,403 families live below the poverty line. Families with 1 or 2 children have the highest poverty rate of 11.8%, comprising of 49 families. On the other hand, families with 3 or 4 children have the lowest poverty rate of 0.0%, which includes 0 families.
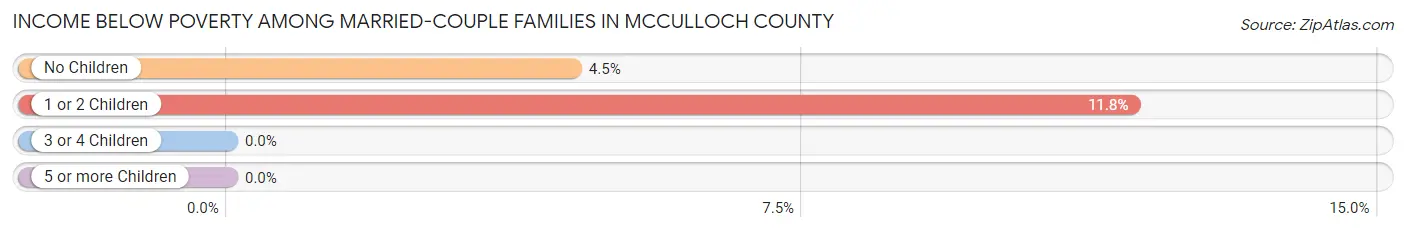
| Children | Above Poverty | Below Poverty |
| No Children | 873 (95.5%) | 41 (4.5%) |
| 1 or 2 Children | 367 (88.2%) | 49 (11.8%) |
| 3 or 4 Children | 73 (100.0%) | 0 (0.0%) |
| 5 or more Children | 0 (0.0%) | 0 (0.0%) |
| Total | 1,313 (93.6%) | 90 (6.4%) |
Income Below Poverty Among Single-Parent Households in McCulloch County
According to the poverty data in McCulloch County, 39.5% or 88 single-father households and 14.6% or 51 single-mother households are living below the poverty line. Among single-father households, those with 1 or 2 children have the highest poverty rate, with 74 households (71.2%) experiencing poverty. Likewise, among single-mother households, those with 1 or 2 children have the highest poverty rate, with 29 households (15.5%) falling below the poverty line.
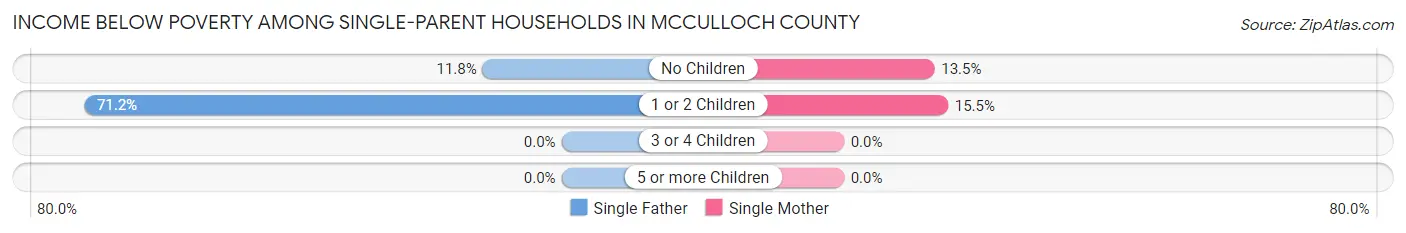
| Children | Single Father | Single Mother |
| No Children | 14 (11.8%) | 22 (13.5%) |
| 1 or 2 Children | 74 (71.2%) | 29 (15.5%) |
| 3 or 4 Children | 0 (0.0%) | 0 (0.0%) |
| 5 or more Children | 0 (0.0%) | 0 (0.0%) |
| Total | 88 (39.5%) | 51 (14.6%) |
Income Below Poverty Among Married-Couple vs Single-Parent Households in McCulloch County
The poverty data for McCulloch County shows that 90 of the married-couple family households (6.4%) and 139 of the single-parent households (24.3%) are living below the poverty level. Within the married-couple family households, those with 1 or 2 children have the highest poverty rate, with 49 households (11.8%) falling below the poverty line. Among the single-parent households, those with 1 or 2 children have the highest poverty rate, with 103 household (35.4%) living below poverty.
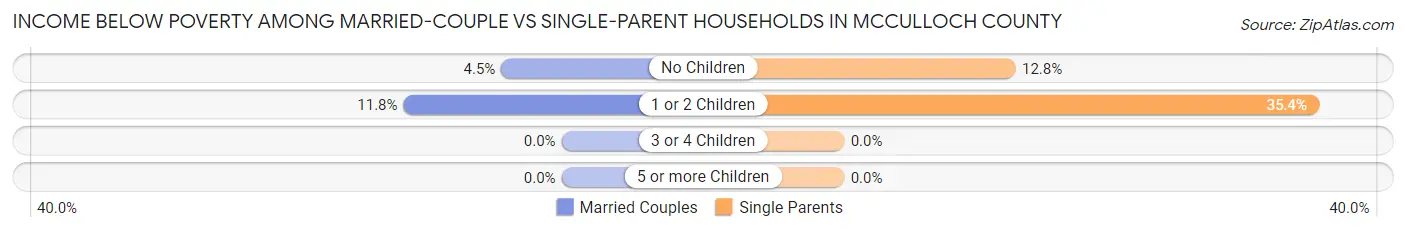
| Children | Married-Couple Families | Single-Parent Households |
| No Children | 41 (4.5%) | 36 (12.8%) |
| 1 or 2 Children | 49 (11.8%) | 103 (35.4%) |
| 3 or 4 Children | 0 (0.0%) | 0 (0.0%) |
| 5 or more Children | 0 (0.0%) | 0 (0.0%) |
| Total | 90 (6.4%) | 139 (24.3%) |
Race in McCulloch County
The most populous races in McCulloch County are White / Caucasian (5,837 | 76.4%), Hispanic or Latino (2,513 | 32.9%), and Two or more Races (1,280 | 16.8%).
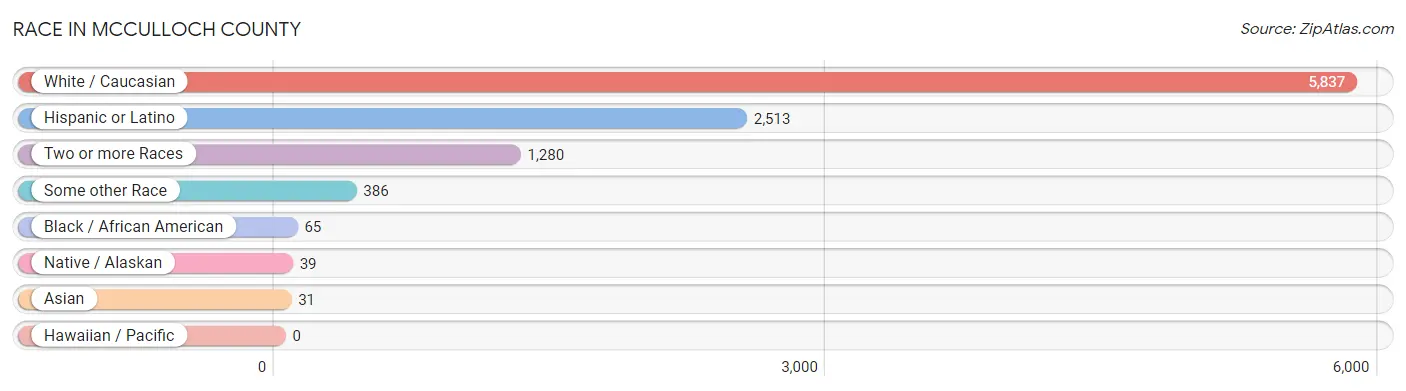
| Race | # Population | % Population |
| Asian | 31 | 0.4% |
| Black / African American | 65 | 0.9% |
| Hawaiian / Pacific | 0 | 0.0% |
| Hispanic or Latino | 2,513 | 32.9% |
| Native / Alaskan | 39 | 0.5% |
| White / Caucasian | 5,837 | 76.4% |
| Two or more Races | 1,280 | 16.8% |
| Some other Race | 386 | 5.1% |
| Total | 7,638 | 100.0% |
Ancestry in McCulloch County
The most populous ancestries reported in McCulloch County are Mexican (2,288 | 30.0%), German (1,359 | 17.8%), Irish (685 | 9.0%), English (495 | 6.5%), and American (453 | 5.9%), together accounting for 69.1% of all McCulloch County residents.
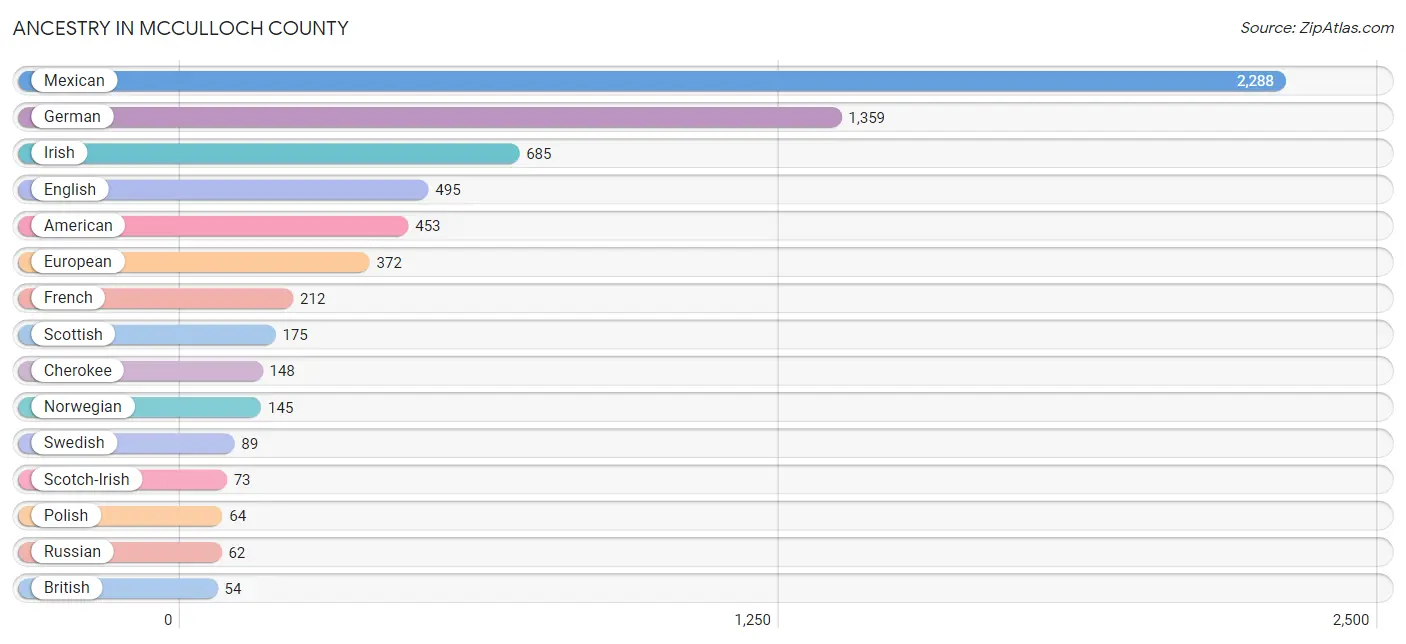
| Ancestry | # Population | % Population |
| African | 6 | 0.1% |
| American | 453 | 5.9% |
| Apache | 3 | 0.0% |
| Armenian | 5 | 0.1% |
| British | 54 | 0.7% |
| Canadian | 8 | 0.1% |
| Cherokee | 148 | 1.9% |
| Choctaw | 19 | 0.3% |
| Comanche | 3 | 0.0% |
| Czech | 22 | 0.3% |
| Czechoslovakian | 2 | 0.0% |
| Dutch | 31 | 0.4% |
| Dutch West Indian | 5 | 0.1% |
| English | 495 | 6.5% |
| European | 372 | 4.9% |
| French | 212 | 2.8% |
| French Canadian | 10 | 0.1% |
| German | 1,359 | 17.8% |
| Indian (Asian) | 8 | 0.1% |
| Irish | 685 | 9.0% |
| Italian | 20 | 0.3% |
| Korean | 22 | 0.3% |
| Mexican | 2,288 | 30.0% |
| Mexican American Indian | 3 | 0.0% |
| Northern European | 10 | 0.1% |
| Norwegian | 145 | 1.9% |
| Polish | 64 | 0.8% |
| Russian | 62 | 0.8% |
| Scotch-Irish | 73 | 1.0% |
| Scottish | 175 | 2.3% |
| Sioux | 32 | 0.4% |
| Slovak | 13 | 0.2% |
| Spaniard | 18 | 0.2% |
| Subsaharan African | 6 | 0.1% |
| Swedish | 89 | 1.2% |
| Swiss | 11 | 0.1% |
| Thai | 12 | 0.2% |
| Welsh | 54 | 0.7% | View All 38 Rows |
Immigrants in McCulloch County
The most numerous immigrant groups reported in McCulloch County came from Central America (368 | 4.8%), Latin America (368 | 4.8%), Mexico (311 | 4.1%), El Salvador (57 | 0.7%), and Europe (29 | 0.4%), together accounting for 14.8% of all McCulloch County residents.
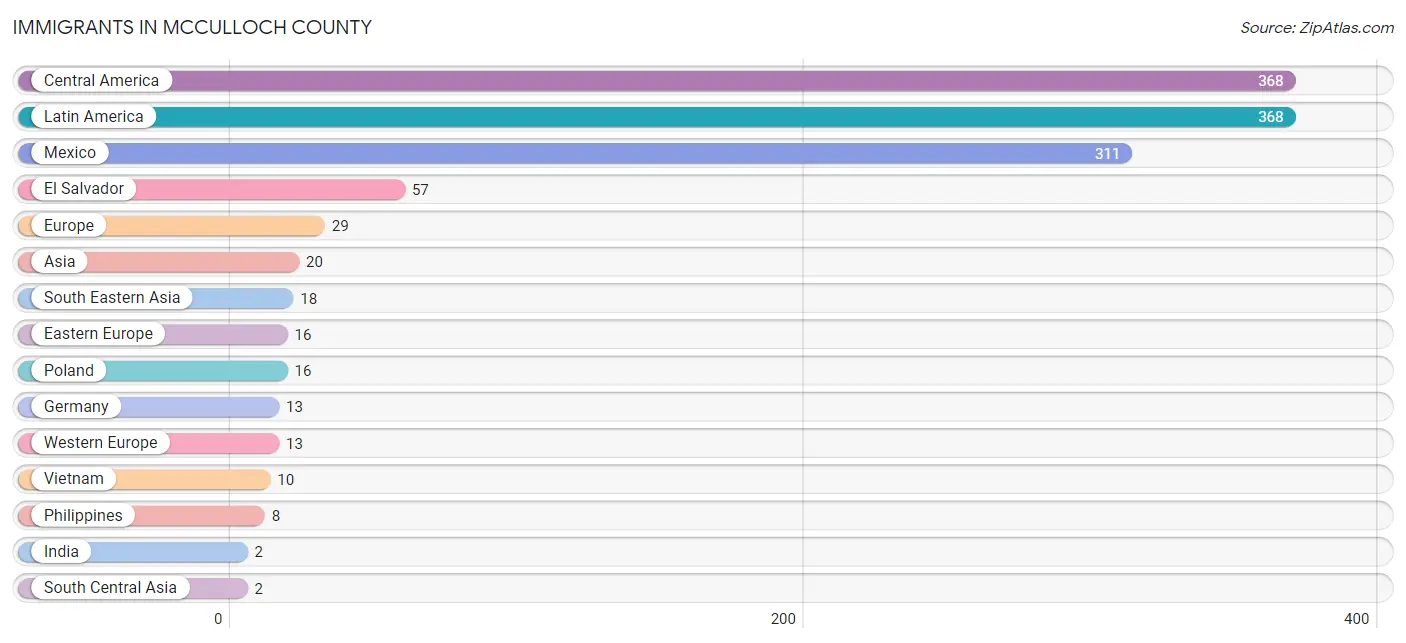
| Immigration Origin | # Population | % Population |
| Asia | 20 | 0.3% |
| Central America | 368 | 4.8% |
| Eastern Europe | 16 | 0.2% |
| El Salvador | 57 | 0.7% |
| Europe | 29 | 0.4% |
| Germany | 13 | 0.2% |
| India | 2 | 0.0% |
| Latin America | 368 | 4.8% |
| Mexico | 311 | 4.1% |
| Philippines | 8 | 0.1% |
| Poland | 16 | 0.2% |
| South Central Asia | 2 | 0.0% |
| South Eastern Asia | 18 | 0.2% |
| Vietnam | 10 | 0.1% |
| Western Europe | 13 | 0.2% | View All 15 Rows |
Sex and Age in McCulloch County
Sex and Age in McCulloch County
The most populous age groups in McCulloch County are 10 to 14 Years (347 | 8.9%) for men and 5 to 9 Years (319 | 8.6%) for women.
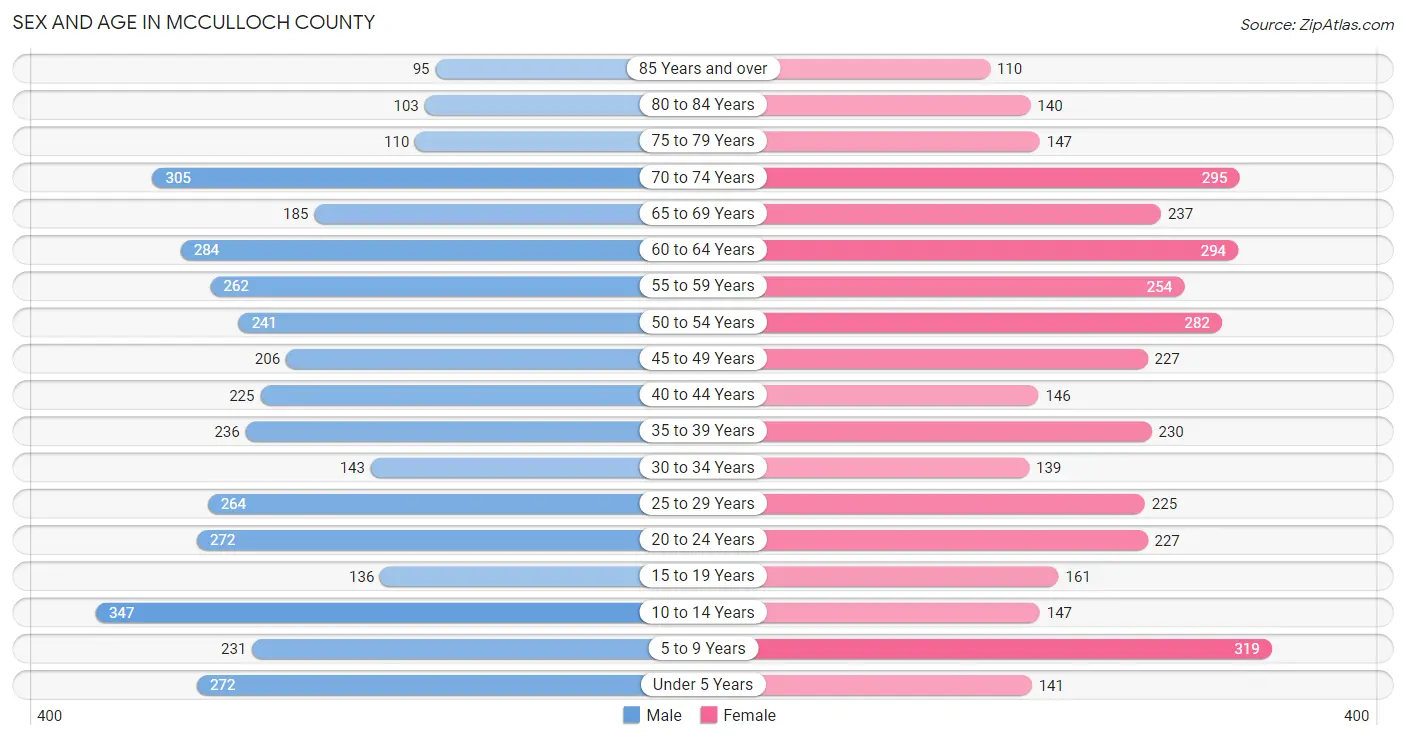
| Age Bracket | Male | Female |
| Under 5 Years | 272 (6.9%) | 141 (3.8%) |
| 5 to 9 Years | 231 (5.9%) | 319 (8.6%) |
| 10 to 14 Years | 347 (8.9%) | 147 (4.0%) |
| 15 to 19 Years | 136 (3.5%) | 161 (4.3%) |
| 20 to 24 Years | 272 (6.9%) | 227 (6.1%) |
| 25 to 29 Years | 264 (6.7%) | 225 (6.0%) |
| 30 to 34 Years | 143 (3.6%) | 139 (3.7%) |
| 35 to 39 Years | 236 (6.0%) | 230 (6.2%) |
| 40 to 44 Years | 225 (5.7%) | 146 (3.9%) |
| 45 to 49 Years | 206 (5.3%) | 227 (6.1%) |
| 50 to 54 Years | 241 (6.1%) | 282 (7.6%) |
| 55 to 59 Years | 262 (6.7%) | 254 (6.8%) |
| 60 to 64 Years | 284 (7.2%) | 294 (7.9%) |
| 65 to 69 Years | 185 (4.7%) | 237 (6.4%) |
| 70 to 74 Years | 305 (7.8%) | 295 (7.9%) |
| 75 to 79 Years | 110 (2.8%) | 147 (4.0%) |
| 80 to 84 Years | 103 (2.6%) | 140 (3.8%) |
| 85 Years and over | 95 (2.4%) | 110 (3.0%) |
| Total | 3,917 (100.0%) | 3,721 (100.0%) |
Families and Households in McCulloch County
Median Family Size in McCulloch County
The median family size in McCulloch County is 2.98 persons per family, with single female/mother families (350 | 17.7%) accounting for the largest median family size of 3.14 persons per family. On the other hand, single male/father families (223 | 11.3%) represent the smallest median family size with 2.03 persons per family.
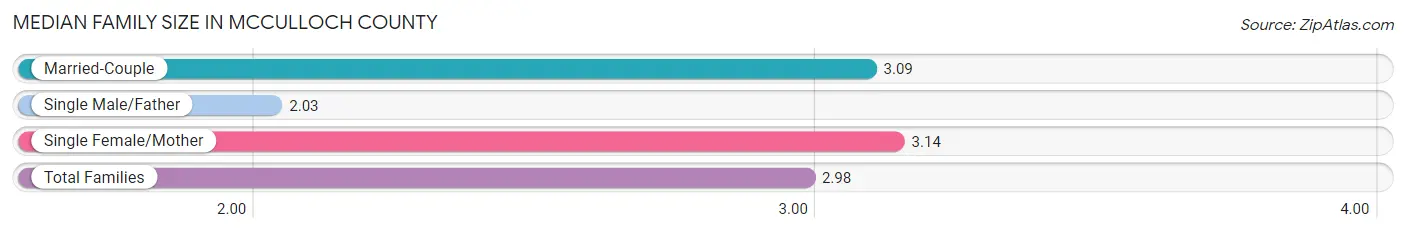
| Family Type | # Families | Family Size |
| Married-Couple | 1,403 (71.0%) | 3.09 |
| Single Male/Father | 223 (11.3%) | 2.03 |
| Single Female/Mother | 350 (17.7%) | 3.14 |
| Total Families | 1,976 (100.0%) | 2.98 |
Median Household Size in McCulloch County
The median household size in McCulloch County is 2.35 persons per household, with single female/mother households (350 | 11.0%) accounting for the largest median household size of 3.17 persons per household. non-family households (1,210 | 38.0%) represent the smallest median household size with 1.18 persons per household.
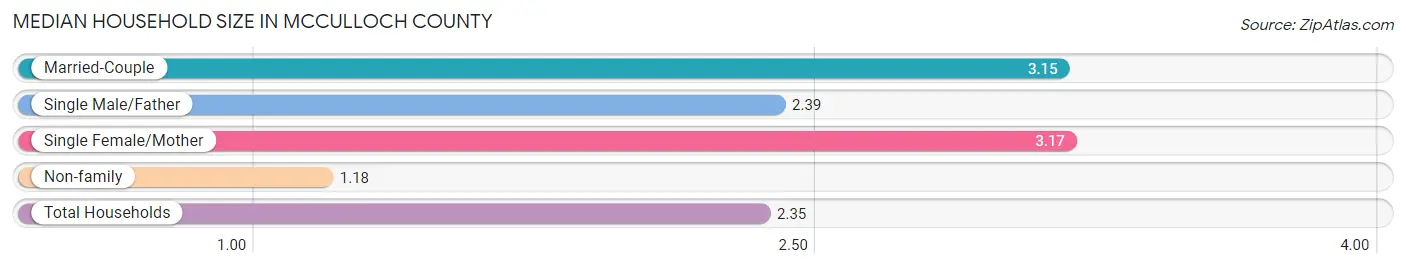
| Household Type | # Households | Household Size |
| Married-Couple | 1,403 (44.0%) | 3.15 |
| Single Male/Father | 223 (7.0%) | 2.39 |
| Single Female/Mother | 350 (11.0%) | 3.17 |
| Non-family | 1,210 (38.0%) | 1.18 |
| Total Households | 3,186 (100.0%) | 2.35 |
Household Size by Marriage Status in McCulloch County
Out of a total of 3,186 households in McCulloch County, 1,976 (62.0%) are family households, while 1,210 (38.0%) are nonfamily households. The most numerous type of family households are 2-person households, comprising 1,105, and the most common type of nonfamily households are 1-person households, comprising 1,059.
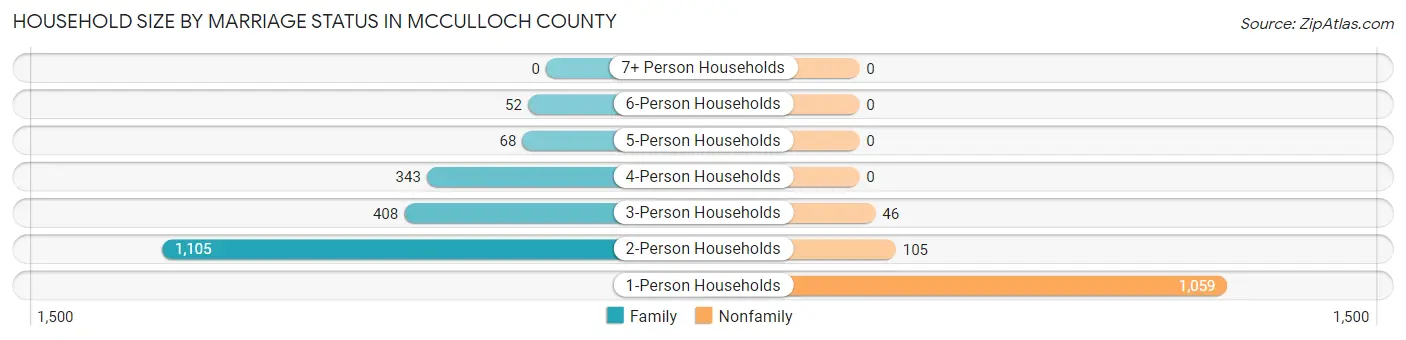
| Household Size | Family Households | Nonfamily Households |
| 1-Person Households | - | 1,059 (33.2%) |
| 2-Person Households | 1,105 (34.7%) | 105 (3.3%) |
| 3-Person Households | 408 (12.8%) | 46 (1.4%) |
| 4-Person Households | 343 (10.8%) | 0 (0.0%) |
| 5-Person Households | 68 (2.1%) | 0 (0.0%) |
| 6-Person Households | 52 (1.6%) | 0 (0.0%) |
| 7+ Person Households | 0 (0.0%) | 0 (0.0%) |
| Total | 1,976 (62.0%) | 1,210 (38.0%) |
Female Fertility in McCulloch County
Fertility by Age in McCulloch County
Average fertility rate in McCulloch County is 59.0 births per 1,000 women. Women in the age bracket of 20 to 34 years have the highest fertility rate with 135.0 births per 1,000 women. Women in the age bracket of 20 to 34 years acount for 93.0% of all women with births.
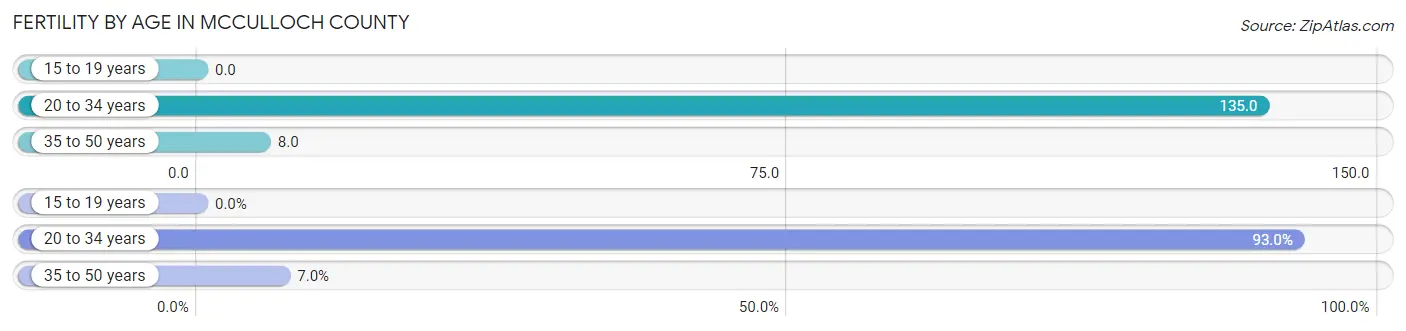
| Age Bracket | Women with Births | Births / 1,000 Women |
| 15 to 19 years | 0 (0.0%) | 0.0 |
| 20 to 34 years | 80 (93.0%) | 135.0 |
| 35 to 50 years | 6 (7.0%) | 8.0 |
| Total | 86 (100.0%) | 59.0 |
Fertility by Age by Marriage Status in McCulloch County
51.2% of women with births (86) in McCulloch County are married. The highest percentage of unmarried women with births falls into 20 to 34 years age bracket with 52.5% of them unmarried at the time of birth, while the lowest percentage of unmarried women with births belong to 35 to 50 years age bracket with 0.0% of them unmarried.
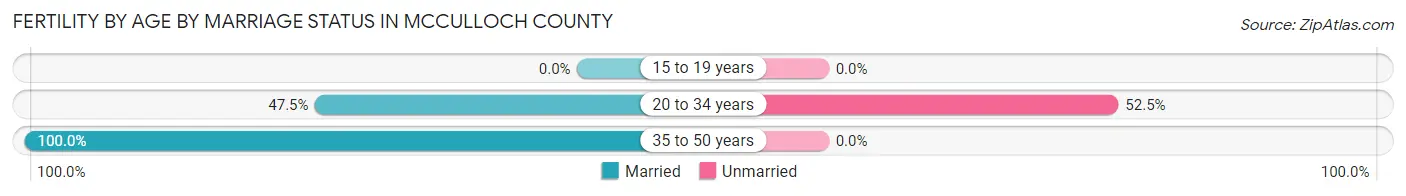
| Age Bracket | Married | Unmarried |
| 15 to 19 years | 0 (0.0%) | 0 (0.0%) |
| 20 to 34 years | 38 (47.5%) | 42 (52.5%) |
| 35 to 50 years | 6 (100.0%) | 0 (0.0%) |
| Total | 44 (51.2%) | 42 (48.8%) |
Fertility by Education in McCulloch County
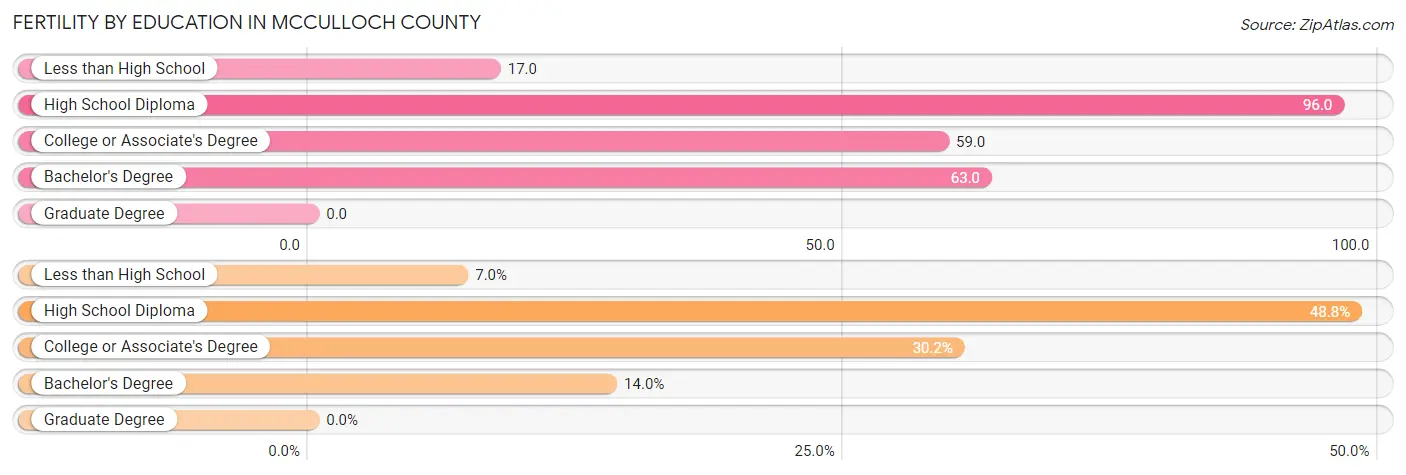
| Educational Attainment | Women with Births | Births / 1,000 Women |
| Less than High School | 6 (7.0%) | 17.0 |
| High School Diploma | 42 (48.8%) | 96.0 |
| College or Associate's Degree | 26 (30.2%) | 59.0 |
| Bachelor's Degree | 12 (14.0%) | 63.0 |
| Graduate Degree | 0 (0.0%) | 0.0 |
| Total | 86 (100.0%) | 59.0 |
Fertility by Education by Marriage Status in McCulloch County
48.8% of women with births in McCulloch County are unmarried. Women with the educational attainment of less than high school are most likely to be married with 100.0% of them married at childbirth, while women with the educational attainment of college or associate's degree are least likely to be married with 96.2% of them unmarried at childbirth.
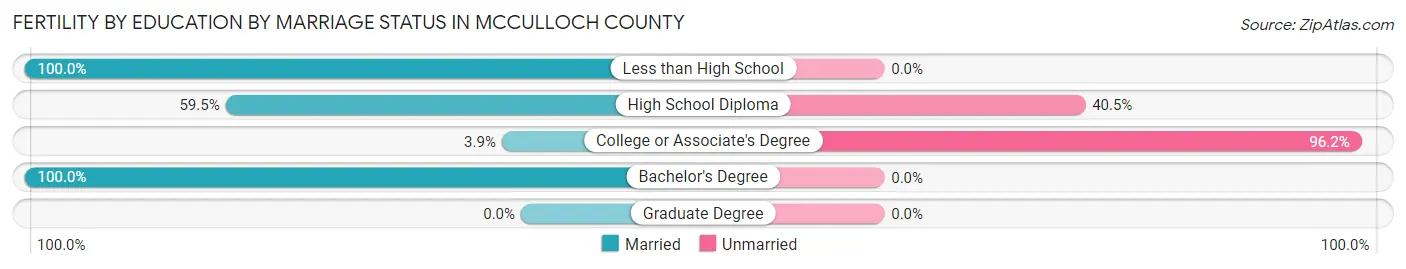
| Educational Attainment | Married | Unmarried |
| Less than High School | 6 (100.0%) | 0 (0.0%) |
| High School Diploma | 25 (59.5%) | 17 (40.5%) |
| College or Associate's Degree | 1 (3.8%) | 25 (96.2%) |
| Bachelor's Degree | 12 (100.0%) | 0 (0.0%) |
| Graduate Degree | 0 (0.0%) | 0 (0.0%) |
| Total | 44 (51.2%) | 42 (48.8%) |
Employment Characteristics in McCulloch County
Employment by Class of Employer in McCulloch County
Among the 3,189 employed individuals in McCulloch County, private company employees (1,879 | 58.9%), local government employees (412 | 12.9%), and self-employed (not incorporated) (399 | 12.5%) make up the most common classes of employment.
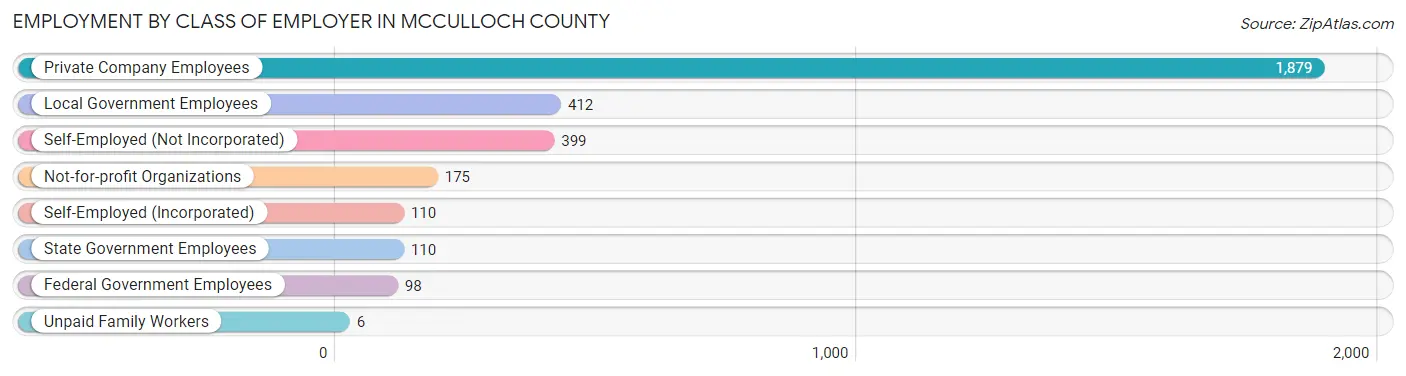
| Employer Class | # Employees | % Employees |
| Private Company Employees | 1,879 | 58.9% |
| Self-Employed (Incorporated) | 110 | 3.5% |
| Self-Employed (Not Incorporated) | 399 | 12.5% |
| Not-for-profit Organizations | 175 | 5.5% |
| Local Government Employees | 412 | 12.9% |
| State Government Employees | 110 | 3.5% |
| Federal Government Employees | 98 | 3.1% |
| Unpaid Family Workers | 6 | 0.2% |
| Total | 3,189 | 100.0% |
Employment Status by Age in McCulloch County
According to the labor force statistics for McCulloch County, out of the total population over 16 years of age (6,140), 58.6% or 3,598 individuals are in the labor force, with 8.7% or 313 of them unemployed. The age group with the highest labor force participation rate is 25 to 29 years, with 85.5% or 418 individuals in the labor force. Within the labor force, the 60 to 64 years age range has the highest percentage of unemployed individuals, with 21.1% or 97 of them being unemployed.
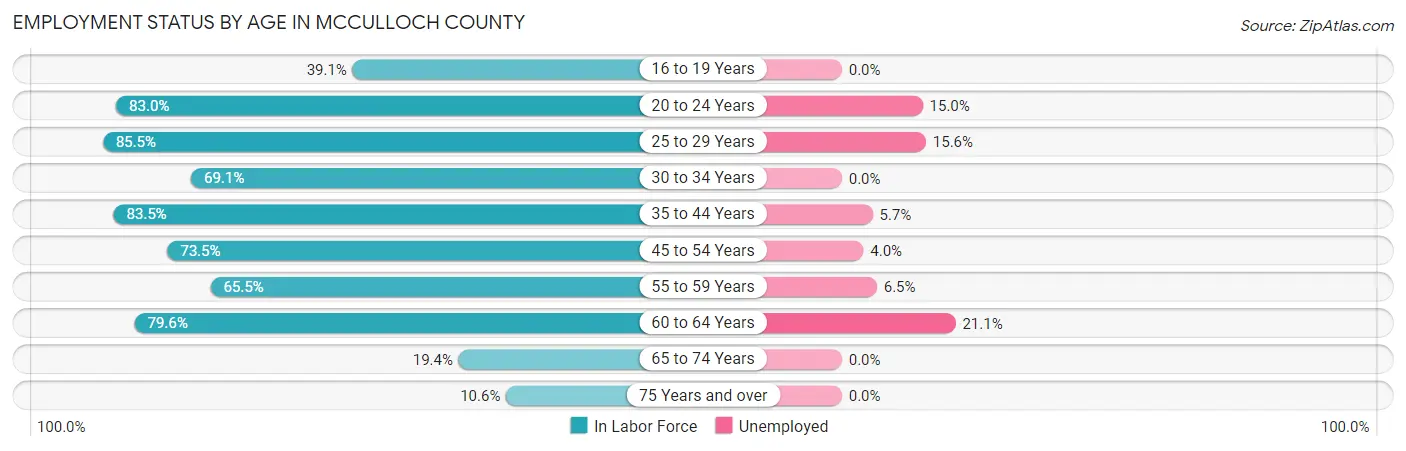
| Age Bracket | In Labor Force | Unemployed |
| 16 to 19 Years | 100 (39.1%) | 0 (0.0%) |
| 20 to 24 Years | 414 (83.0%) | 62 (15.0%) |
| 25 to 29 Years | 418 (85.5%) | 65 (15.6%) |
| 30 to 34 Years | 195 (69.1%) | 0 (0.0%) |
| 35 to 44 Years | 699 (83.5%) | 40 (5.7%) |
| 45 to 54 Years | 703 (73.5%) | 28 (4.0%) |
| 55 to 59 Years | 338 (65.5%) | 22 (6.5%) |
| 60 to 64 Years | 460 (79.6%) | 97 (21.1%) |
| 65 to 74 Years | 198 (19.4%) | 0 (0.0%) |
| 75 Years and over | 75 (10.6%) | 0 (0.0%) |
| Total | 3,598 (58.6%) | 313 (8.7%) |
Employment Status by Educational Attainment in McCulloch County
According to labor force statistics for McCulloch County, 76.9% of individuals (2,813) out of the total population between 25 and 64 years of age (3,658) are in the labor force, with 9.0% or 253 of them being unemployed. The group with the highest labor force participation rate are those with the educational attainment of bachelor's degree or higher, with 81.6% or 542 individuals in the labor force. Within the labor force, individuals with less than high school education have the highest percentage of unemployment, with 17.3% or 85 of them being unemployed.
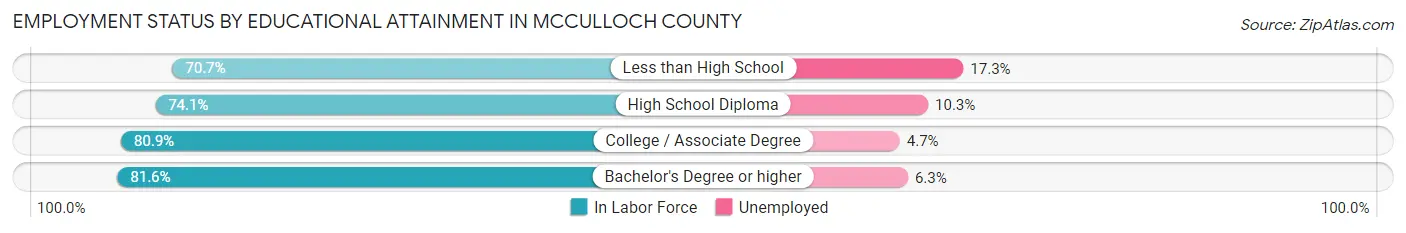
| Educational Attainment | In Labor Force | Unemployed |
| Less than High School | 492 (70.7%) | 120 (17.3%) |
| High School Diploma | 883 (74.1%) | 123 (10.3%) |
| College / Associate Degree | 896 (80.9%) | 52 (4.7%) |
| Bachelor's Degree or higher | 542 (81.6%) | 42 (6.3%) |
| Total | 2,813 (76.9%) | 329 (9.0%) |
Employment Occupations by Sex in McCulloch County
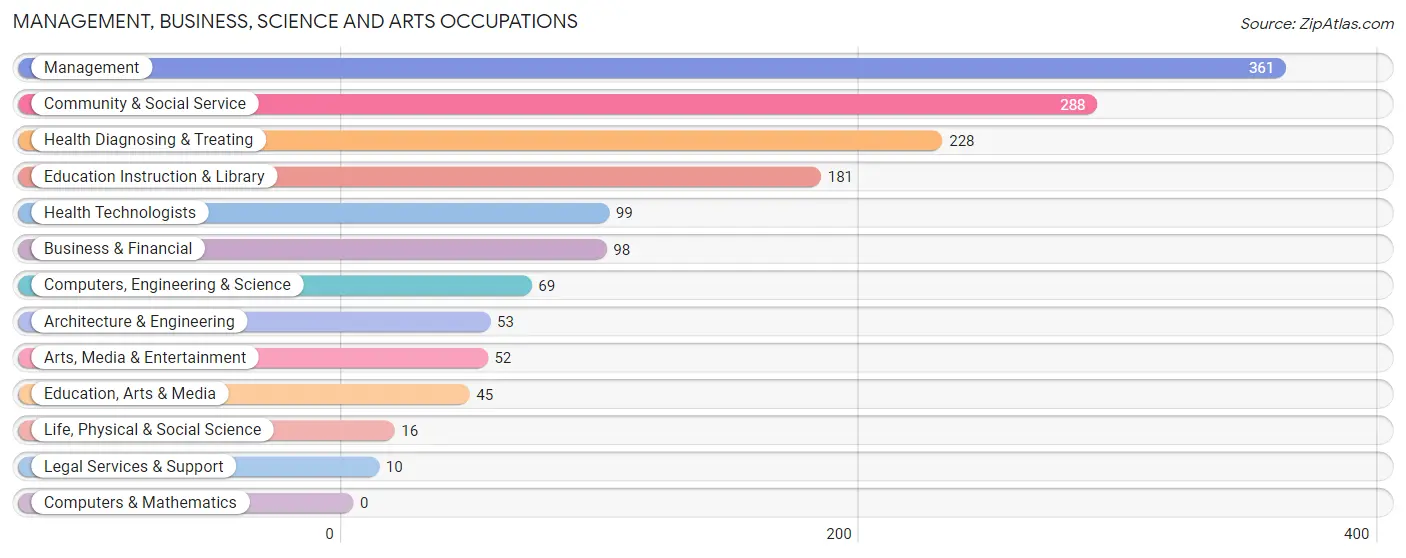
Management, Business, Science and Arts Occupations
The most common Management, Business, Science and Arts occupations in McCulloch County are Management (361 | 11.0%), Community & Social Service (288 | 8.8%), Health Diagnosing & Treating (228 | 6.9%), Education Instruction & Library (181 | 5.5%), and Health Technologists (99 | 3.0%).
Management, Business, Science and Arts Occupations by Sex
Within the Management, Business, Science and Arts occupations in McCulloch County, the most male-oriented occupations are Computers, Engineering & Science (100.0%), Architecture & Engineering (100.0%), and Life, Physical & Social Science (100.0%), while the most female-oriented occupations are Health Technologists (100.0%), Health Diagnosing & Treating (97.8%), and Education Instruction & Library (85.1%).
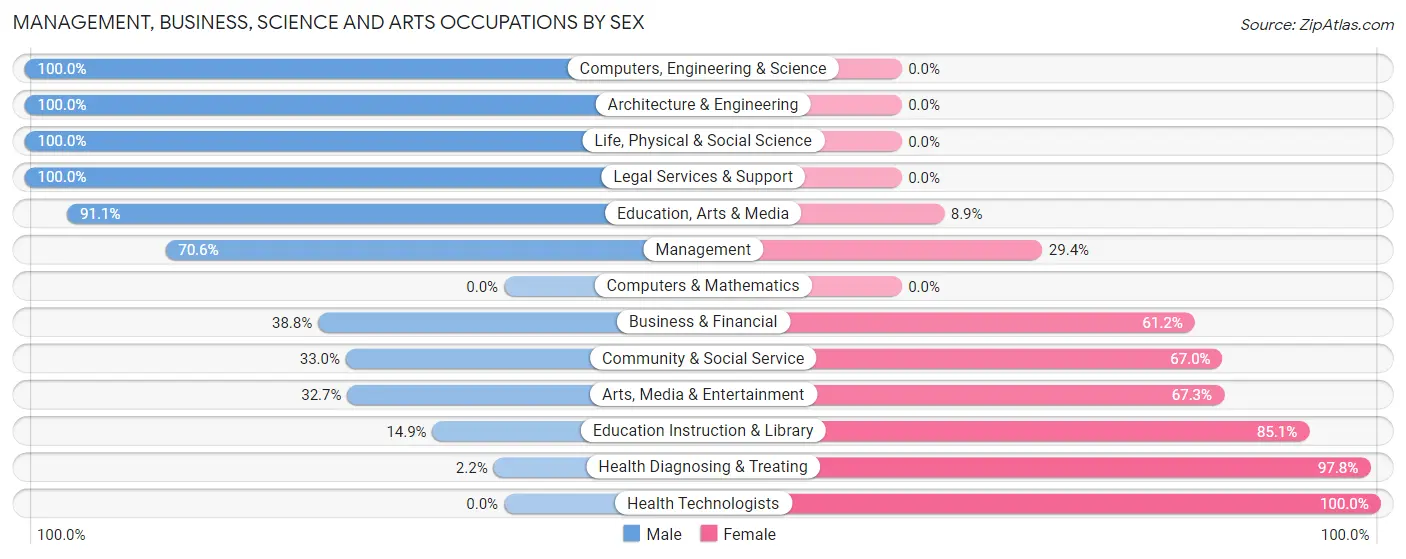
| Occupation | Male | Female |
| Management | 255 (70.6%) | 106 (29.4%) |
| Business & Financial | 38 (38.8%) | 60 (61.2%) |
| Computers, Engineering & Science | 69 (100.0%) | 0 (0.0%) |
| Computers & Mathematics | 0 (0.0%) | 0 (0.0%) |
| Architecture & Engineering | 53 (100.0%) | 0 (0.0%) |
| Life, Physical & Social Science | 16 (100.0%) | 0 (0.0%) |
| Community & Social Service | 95 (33.0%) | 193 (67.0%) |
| Education, Arts & Media | 41 (91.1%) | 4 (8.9%) |
| Legal Services & Support | 10 (100.0%) | 0 (0.0%) |
| Education Instruction & Library | 27 (14.9%) | 154 (85.1%) |
| Arts, Media & Entertainment | 17 (32.7%) | 35 (67.3%) |
| Health Diagnosing & Treating | 5 (2.2%) | 223 (97.8%) |
| Health Technologists | 0 (0.0%) | 99 (100.0%) |
| Total (Category) | 462 (44.3%) | 582 (55.7%) |
| Total (Overall) | 1,595 (48.5%) | 1,691 (51.5%) |
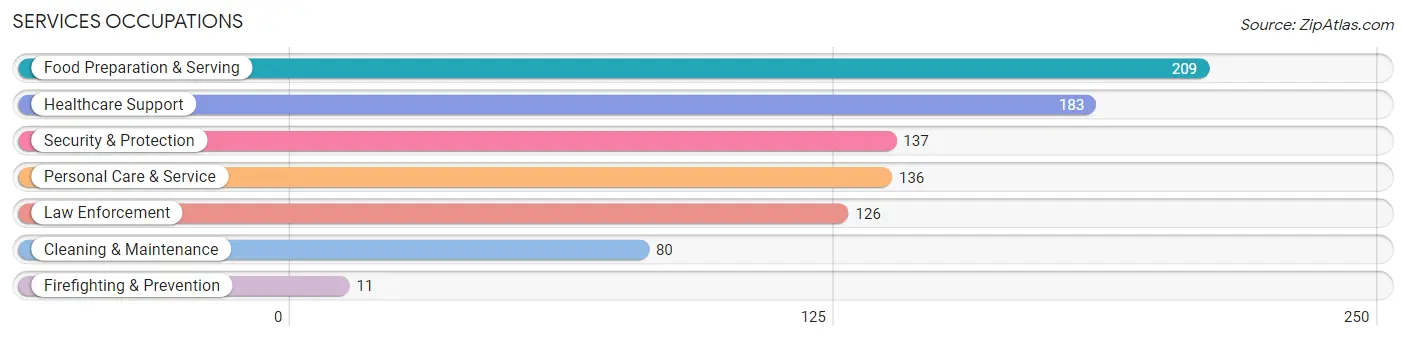
Services Occupations
The most common Services occupations in McCulloch County are Food Preparation & Serving (209 | 6.4%), Healthcare Support (183 | 5.6%), Security & Protection (137 | 4.2%), Personal Care & Service (136 | 4.1%), and Law Enforcement (126 | 3.8%).
Services Occupations by Sex
Within the Services occupations in McCulloch County, the most male-oriented occupations are Law Enforcement (79.4%), Security & Protection (73.0%), and Cleaning & Maintenance (57.5%), while the most female-oriented occupations are Firefighting & Prevention (100.0%), Healthcare Support (89.6%), and Food Preparation & Serving (86.1%).
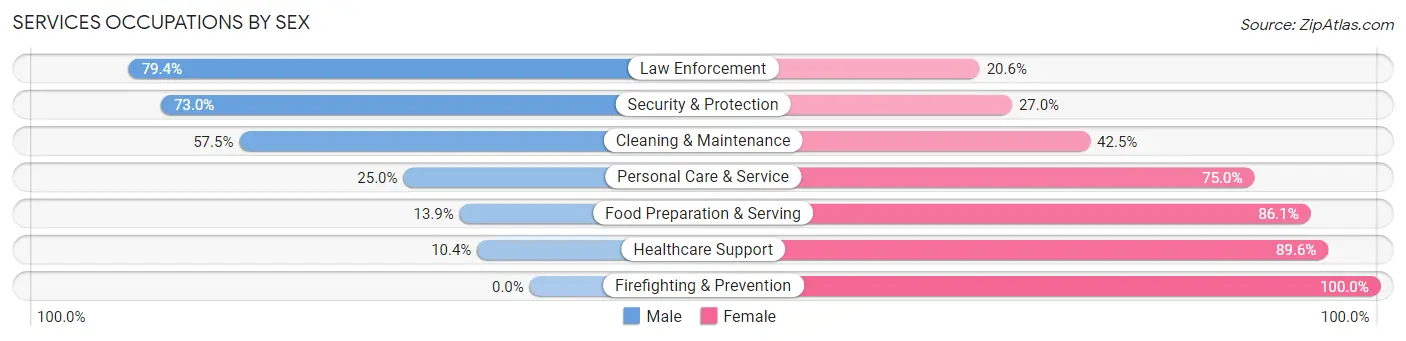
| Occupation | Male | Female |
| Healthcare Support | 19 (10.4%) | 164 (89.6%) |
| Security & Protection | 100 (73.0%) | 37 (27.0%) |
| Firefighting & Prevention | 0 (0.0%) | 11 (100.0%) |
| Law Enforcement | 100 (79.4%) | 26 (20.6%) |
| Food Preparation & Serving | 29 (13.9%) | 180 (86.1%) |
| Cleaning & Maintenance | 46 (57.5%) | 34 (42.5%) |
| Personal Care & Service | 34 (25.0%) | 102 (75.0%) |
| Total (Category) | 228 (30.6%) | 517 (69.4%) |
| Total (Overall) | 1,595 (48.5%) | 1,691 (51.5%) |
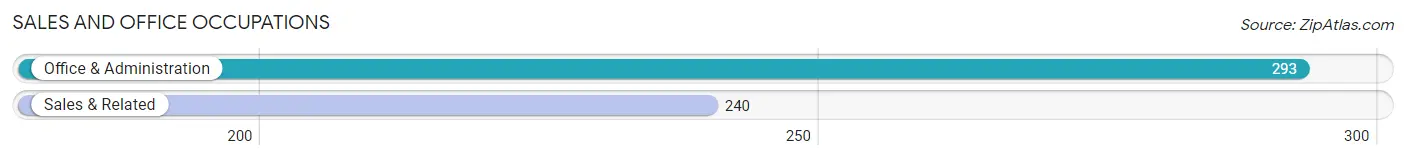
Sales and Office Occupations
The most common Sales and Office occupations in McCulloch County are Office & Administration (293 | 8.9%), and Sales & Related (240 | 7.3%).
Sales and Office Occupations by Sex
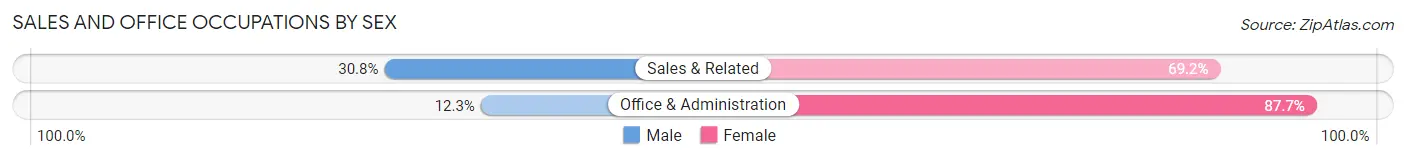
| Occupation | Male | Female |
| Sales & Related | 74 (30.8%) | 166 (69.2%) |
| Office & Administration | 36 (12.3%) | 257 (87.7%) |
| Total (Category) | 110 (20.6%) | 423 (79.4%) |
| Total (Overall) | 1,595 (48.5%) | 1,691 (51.5%) |
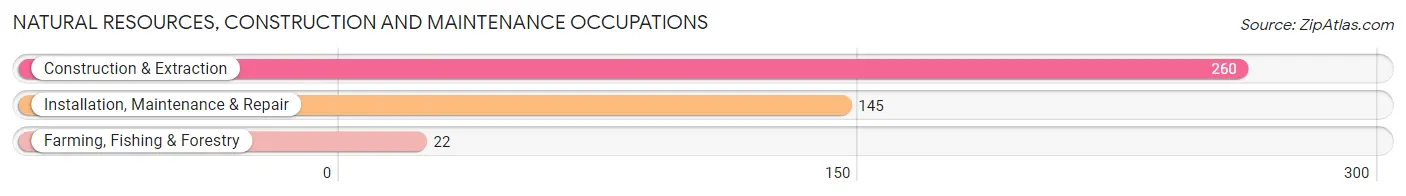
Natural Resources, Construction and Maintenance Occupations
The most common Natural Resources, Construction and Maintenance occupations in McCulloch County are Construction & Extraction (260 | 7.9%), Installation, Maintenance & Repair (145 | 4.4%), and Farming, Fishing & Forestry (22 | 0.7%).
Natural Resources, Construction and Maintenance Occupations by Sex
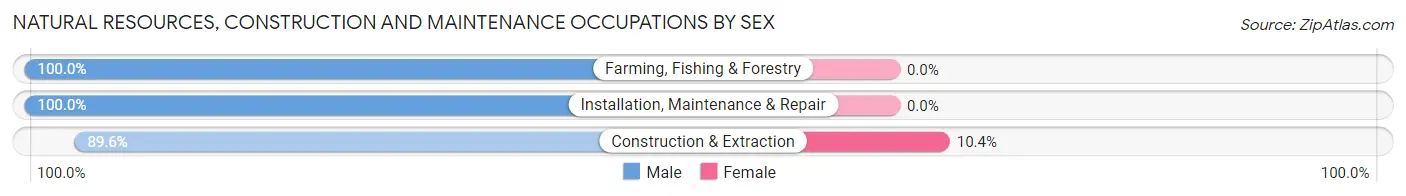
| Occupation | Male | Female |
| Farming, Fishing & Forestry | 22 (100.0%) | 0 (0.0%) |
| Construction & Extraction | 233 (89.6%) | 27 (10.4%) |
| Installation, Maintenance & Repair | 145 (100.0%) | 0 (0.0%) |
| Total (Category) | 400 (93.7%) | 27 (6.3%) |
| Total (Overall) | 1,595 (48.5%) | 1,691 (51.5%) |
Production, Transportation and Moving Occupations
The most common Production, Transportation and Moving occupations in McCulloch County are Production (227 | 6.9%), Transportation (192 | 5.8%), and Material Moving (118 | 3.6%).
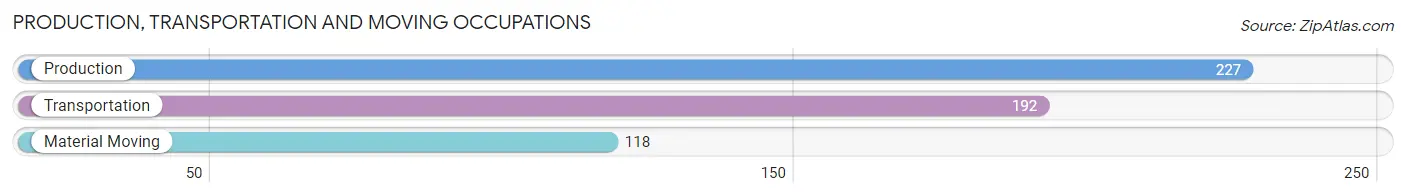
Production, Transportation and Moving Occupations by Sex
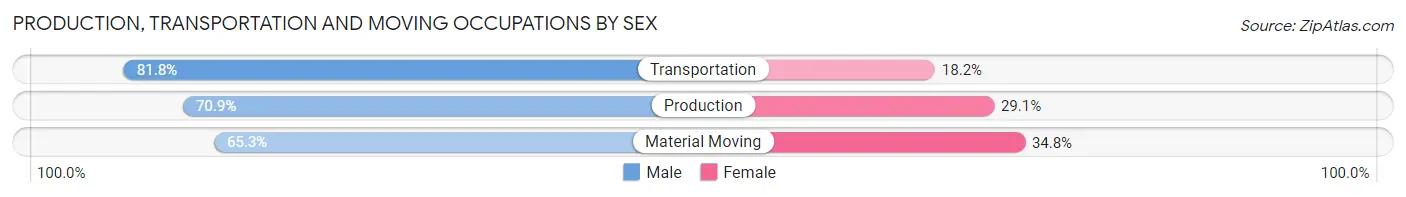
| Occupation | Male | Female |
| Production | 161 (70.9%) | 66 (29.1%) |
| Transportation | 157 (81.8%) | 35 (18.2%) |
| Material Moving | 77 (65.2%) | 41 (34.7%) |
| Total (Category) | 395 (73.6%) | 142 (26.4%) |
| Total (Overall) | 1,595 (48.5%) | 1,691 (51.5%) |
Employment Industries by Sex in McCulloch County
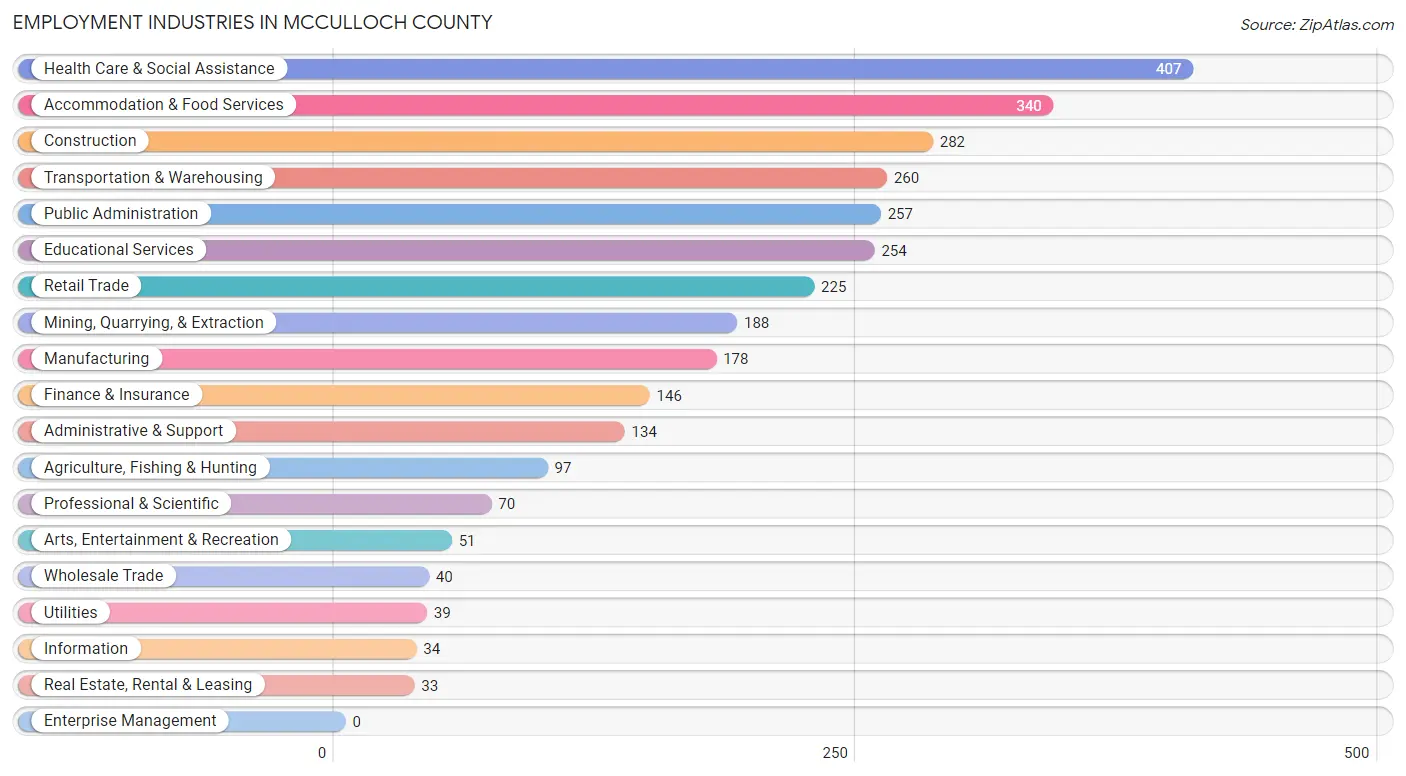
Employment Industries in McCulloch County
The major employment industries in McCulloch County include Health Care & Social Assistance (407 | 12.4%), Accommodation & Food Services (340 | 10.3%), Construction (282 | 8.6%), Transportation & Warehousing (260 | 7.9%), and Public Administration (257 | 7.8%).
Employment Industries by Sex in McCulloch County
The McCulloch County industries that see more men than women are Agriculture, Fishing & Hunting (97.9%), Construction (95.0%), and Mining, Quarrying, & Extraction (89.9%), whereas the industries that tend to have a higher number of women are Information (100.0%), Health Care & Social Assistance (91.1%), and Accommodation & Food Services (81.8%).
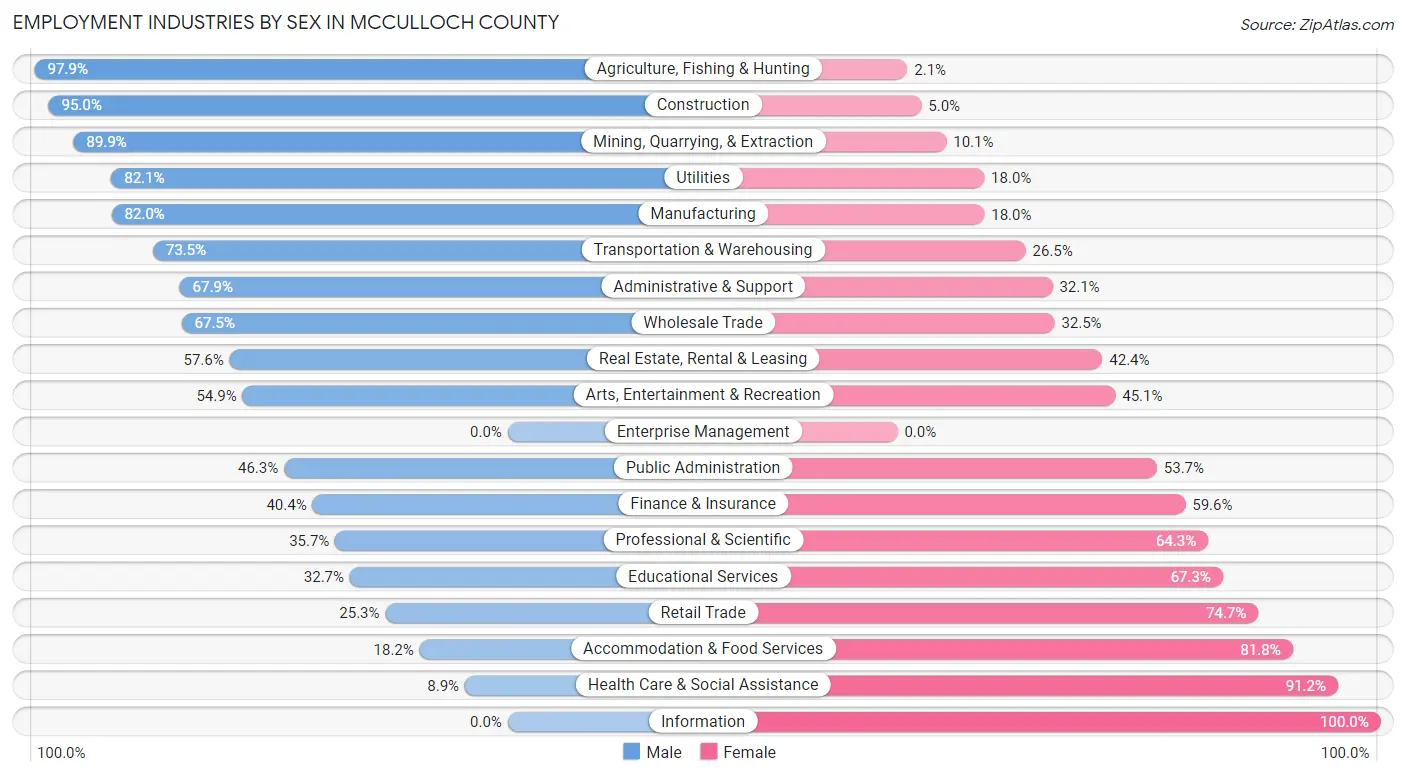
| Industry | Male | Female |
| Agriculture, Fishing & Hunting | 95 (97.9%) | 2 (2.1%) |
| Mining, Quarrying, & Extraction | 169 (89.9%) | 19 (10.1%) |
| Construction | 268 (95.0%) | 14 (5.0%) |
| Manufacturing | 146 (82.0%) | 32 (18.0%) |
| Wholesale Trade | 27 (67.5%) | 13 (32.5%) |
| Retail Trade | 57 (25.3%) | 168 (74.7%) |
| Transportation & Warehousing | 191 (73.5%) | 69 (26.5%) |
| Utilities | 32 (82.1%) | 7 (17.9%) |
| Information | 0 (0.0%) | 34 (100.0%) |
| Finance & Insurance | 59 (40.4%) | 87 (59.6%) |
| Real Estate, Rental & Leasing | 19 (57.6%) | 14 (42.4%) |
| Professional & Scientific | 25 (35.7%) | 45 (64.3%) |
| Enterprise Management | 0 (0.0%) | 0 (0.0%) |
| Administrative & Support | 91 (67.9%) | 43 (32.1%) |
| Educational Services | 83 (32.7%) | 171 (67.3%) |
| Health Care & Social Assistance | 36 (8.8%) | 371 (91.1%) |
| Arts, Entertainment & Recreation | 28 (54.9%) | 23 (45.1%) |
| Accommodation & Food Services | 62 (18.2%) | 278 (81.8%) |
| Public Administration | 119 (46.3%) | 138 (53.7%) |
| Total | 1,595 (48.5%) | 1,691 (51.5%) |
Education in McCulloch County
School Enrollment in McCulloch County
The most common levels of schooling among the 1,536 students in McCulloch County are elementary school (506 | 32.9%), high school (430 | 28.0%), and middle school (248 | 16.2%).
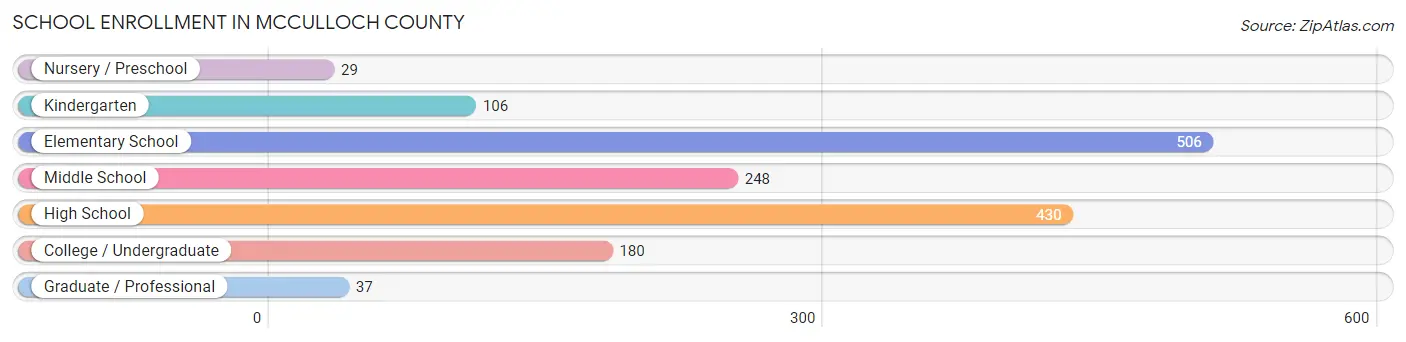
| School Level | # Students | % Students |
| Nursery / Preschool | 29 | 1.9% |
| Kindergarten | 106 | 6.9% |
| Elementary School | 506 | 32.9% |
| Middle School | 248 | 16.2% |
| High School | 430 | 28.0% |
| College / Undergraduate | 180 | 11.7% |
| Graduate / Professional | 37 | 2.4% |
| Total | 1,536 | 100.0% |
School Enrollment by Age by Funding Source in McCulloch County
Out of a total of 1,536 students who are enrolled in schools in McCulloch County, 135 (8.8%) attend a private institution, while the remaining 1,401 (91.2%) are enrolled in public schools. The age group of 3 to 4 year olds has the highest likelihood of being enrolled in private schools, with 29 (100.0% in the age bracket) enrolled. Conversely, the age group of 15 to 17 year olds has the lowest likelihood of being enrolled in a private school, with 231 (100.0% in the age bracket) attending a public institution.
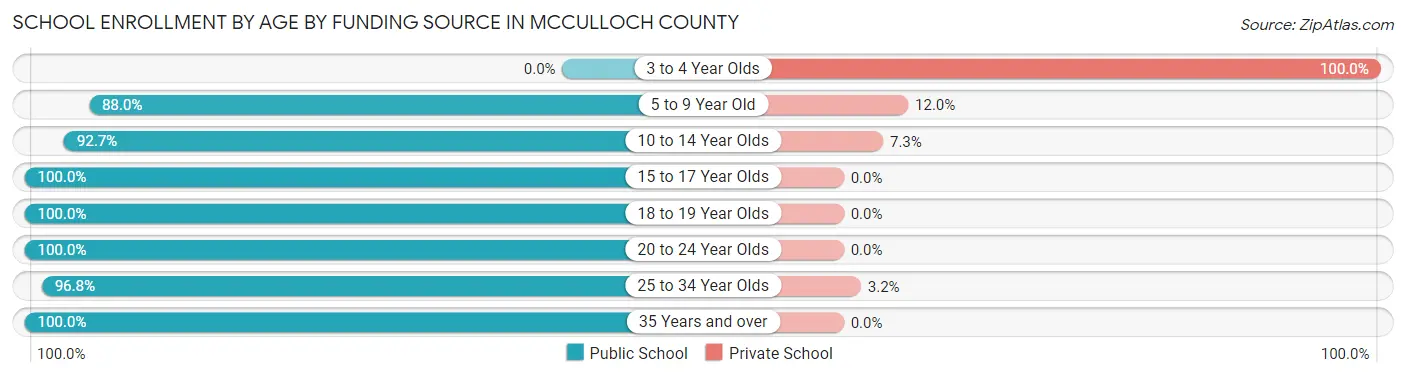
| Age Bracket | Public School | Private School |
| 3 to 4 Year Olds | 0 (0.0%) | 29 (100.0%) |
| 5 to 9 Year Old | 484 (88.0%) | 66 (12.0%) |
| 10 to 14 Year Olds | 455 (92.7%) | 36 (7.3%) |
| 15 to 17 Year Olds | 231 (100.0%) | 0 (0.0%) |
| 18 to 19 Year Olds | 18 (100.0%) | 0 (0.0%) |
| 20 to 24 Year Olds | 68 (100.0%) | 0 (0.0%) |
| 25 to 34 Year Olds | 121 (96.8%) | 4 (3.2%) |
| 35 Years and over | 24 (100.0%) | 0 (0.0%) |
| Total | 1,401 (91.2%) | 135 (8.8%) |
Educational Attainment by Field of Study in McCulloch County
Education (268 | 25.7%), business (227 | 21.8%), science & technology (107 | 10.3%), bio, nature & agricultural (102 | 9.8%), and physical & health sciences (79 | 7.6%) are the most common fields of study among 1,043 individuals in McCulloch County who have obtained a bachelor's degree or higher.
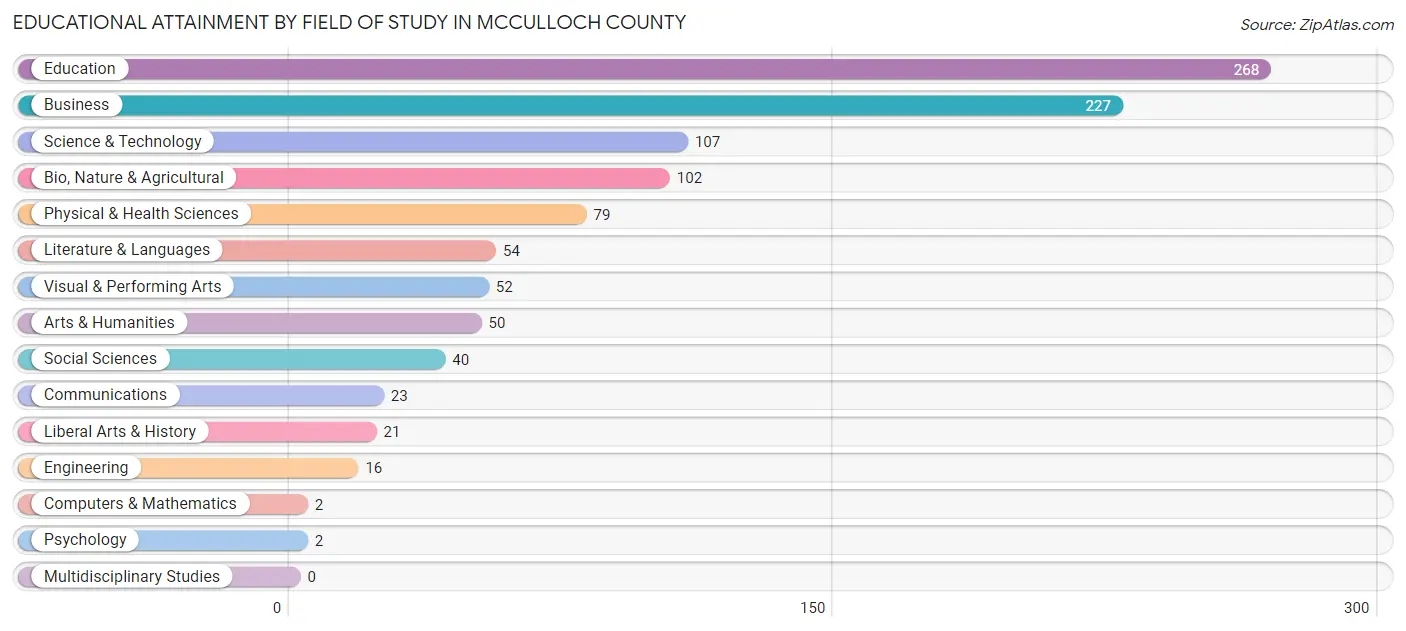
| Field of Study | # Graduates | % Graduates |
| Computers & Mathematics | 2 | 0.2% |
| Bio, Nature & Agricultural | 102 | 9.8% |
| Physical & Health Sciences | 79 | 7.6% |
| Psychology | 2 | 0.2% |
| Social Sciences | 40 | 3.8% |
| Engineering | 16 | 1.5% |
| Multidisciplinary Studies | 0 | 0.0% |
| Science & Technology | 107 | 10.3% |
| Business | 227 | 21.8% |
| Education | 268 | 25.7% |
| Literature & Languages | 54 | 5.2% |
| Liberal Arts & History | 21 | 2.0% |
| Visual & Performing Arts | 52 | 5.0% |
| Communications | 23 | 2.2% |
| Arts & Humanities | 50 | 4.8% |
| Total | 1,043 | 100.0% |
Transportation & Commute in McCulloch County
Vehicle Availability by Sex in McCulloch County
The most prevalent vehicle ownership categories in McCulloch County are males with 2 vehicles (715, accounting for 46.6%) and females with 2 vehicles (618, making up 43.2%).
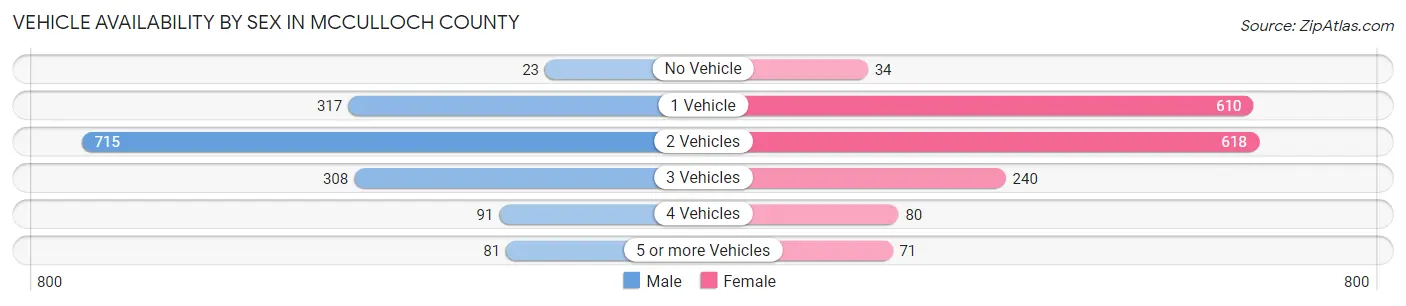
| Vehicles Available | Male | Female |
| No Vehicle | 23 (1.5%) | 34 (2.1%) |
| 1 Vehicle | 317 (20.6%) | 610 (36.9%) |
| 2 Vehicles | 715 (46.6%) | 618 (37.4%) |
| 3 Vehicles | 308 (20.1%) | 240 (14.5%) |
| 4 Vehicles | 91 (5.9%) | 80 (4.8%) |
| 5 or more Vehicles | 81 (5.3%) | 71 (4.3%) |
| Total | 1,535 (100.0%) | 1,653 (100.0%) |
Commute Time in McCulloch County
The most frequently occuring commute durations in McCulloch County are 5 to 9 minutes (902 commuters, 30.7%), less than 5 minutes (478 commuters, 16.3%), and 10 to 14 minutes (393 commuters, 13.4%).
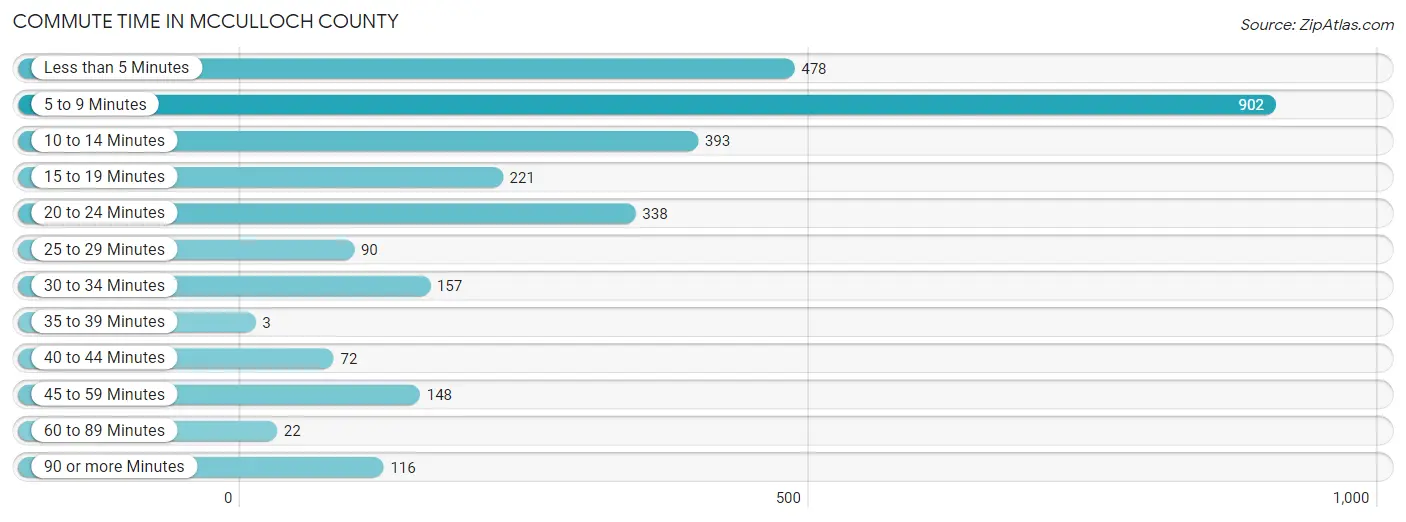
| Commute Time | # Commuters | % Commuters |
| Less than 5 Minutes | 478 | 16.3% |
| 5 to 9 Minutes | 902 | 30.7% |
| 10 to 14 Minutes | 393 | 13.4% |
| 15 to 19 Minutes | 221 | 7.5% |
| 20 to 24 Minutes | 338 | 11.5% |
| 25 to 29 Minutes | 90 | 3.1% |
| 30 to 34 Minutes | 157 | 5.3% |
| 35 to 39 Minutes | 3 | 0.1% |
| 40 to 44 Minutes | 72 | 2.5% |
| 45 to 59 Minutes | 148 | 5.0% |
| 60 to 89 Minutes | 22 | 0.7% |
| 90 or more Minutes | 116 | 4.0% |
Commute Time by Sex in McCulloch County
The most common commute times in McCulloch County are 5 to 9 minutes (329 commuters, 21.9%) for males and 5 to 9 minutes (573 commuters, 39.8%) for females.
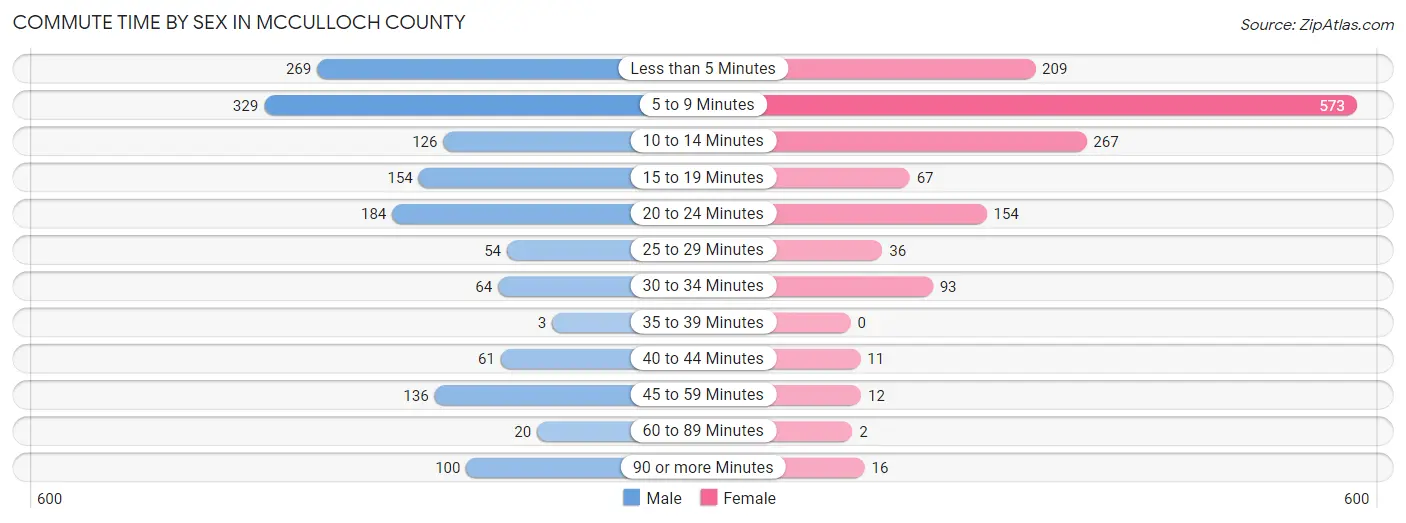
| Commute Time | Male | Female |
| Less than 5 Minutes | 269 (17.9%) | 209 (14.5%) |
| 5 to 9 Minutes | 329 (21.9%) | 573 (39.8%) |
| 10 to 14 Minutes | 126 (8.4%) | 267 (18.5%) |
| 15 to 19 Minutes | 154 (10.3%) | 67 (4.6%) |
| 20 to 24 Minutes | 184 (12.3%) | 154 (10.7%) |
| 25 to 29 Minutes | 54 (3.6%) | 36 (2.5%) |
| 30 to 34 Minutes | 64 (4.3%) | 93 (6.5%) |
| 35 to 39 Minutes | 3 (0.2%) | 0 (0.0%) |
| 40 to 44 Minutes | 61 (4.1%) | 11 (0.8%) |
| 45 to 59 Minutes | 136 (9.1%) | 12 (0.8%) |
| 60 to 89 Minutes | 20 (1.3%) | 2 (0.1%) |
| 90 or more Minutes | 100 (6.7%) | 16 (1.1%) |
Time of Departure to Work by Sex in McCulloch County
The most frequent times of departure to work in McCulloch County are 6:00 AM to 6:29 AM (401, 26.7%) for males and 7:30 AM to 7:59 AM (382, 26.5%) for females.
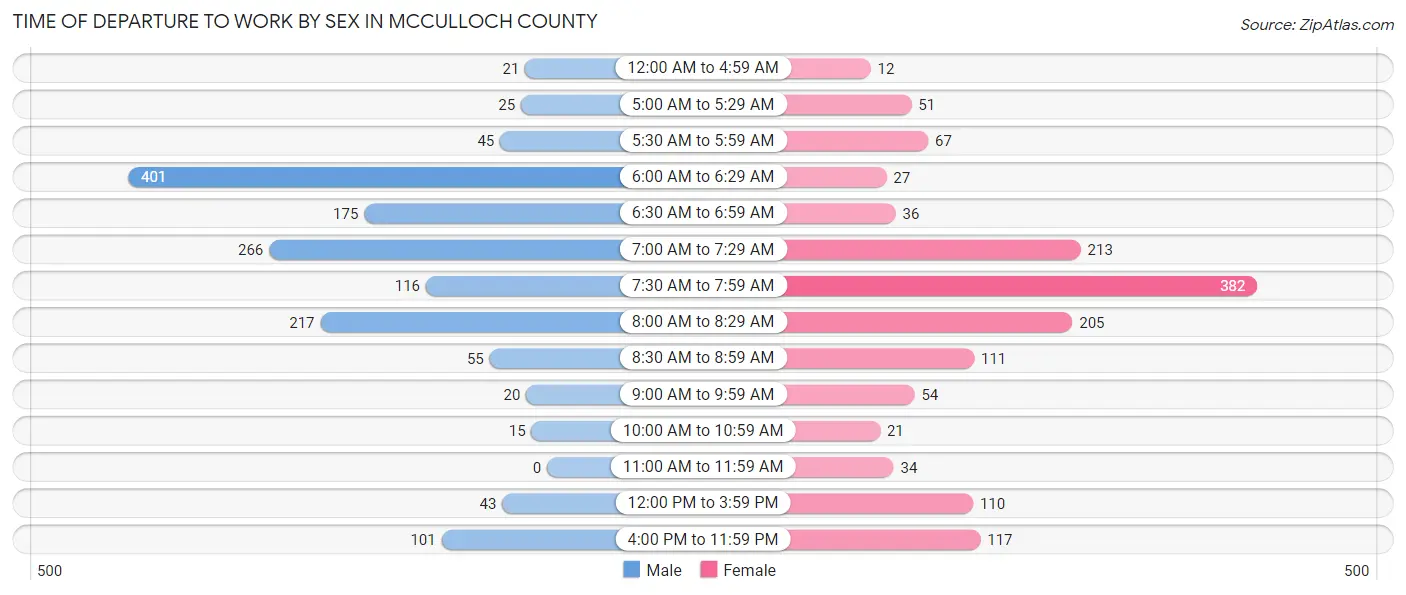
| Time of Departure | Male | Female |
| 12:00 AM to 4:59 AM | 21 (1.4%) | 12 (0.8%) |
| 5:00 AM to 5:29 AM | 25 (1.7%) | 51 (3.5%) |
| 5:30 AM to 5:59 AM | 45 (3.0%) | 67 (4.6%) |
| 6:00 AM to 6:29 AM | 401 (26.7%) | 27 (1.9%) |
| 6:30 AM to 6:59 AM | 175 (11.7%) | 36 (2.5%) |
| 7:00 AM to 7:29 AM | 266 (17.7%) | 213 (14.8%) |
| 7:30 AM to 7:59 AM | 116 (7.7%) | 382 (26.5%) |
| 8:00 AM to 8:29 AM | 217 (14.5%) | 205 (14.2%) |
| 8:30 AM to 8:59 AM | 55 (3.7%) | 111 (7.7%) |
| 9:00 AM to 9:59 AM | 20 (1.3%) | 54 (3.7%) |
| 10:00 AM to 10:59 AM | 15 (1.0%) | 21 (1.5%) |
| 11:00 AM to 11:59 AM | 0 (0.0%) | 34 (2.4%) |
| 12:00 PM to 3:59 PM | 43 (2.9%) | 110 (7.6%) |
| 4:00 PM to 11:59 PM | 101 (6.7%) | 117 (8.1%) |
| Total | 1,500 (100.0%) | 1,440 (100.0%) |
Housing Occupancy in McCulloch County
Occupancy by Ownership in McCulloch County
Of the total 3,186 dwellings in McCulloch County, owner-occupied units account for 2,229 (70.0%), while renter-occupied units make up 957 (30.0%).
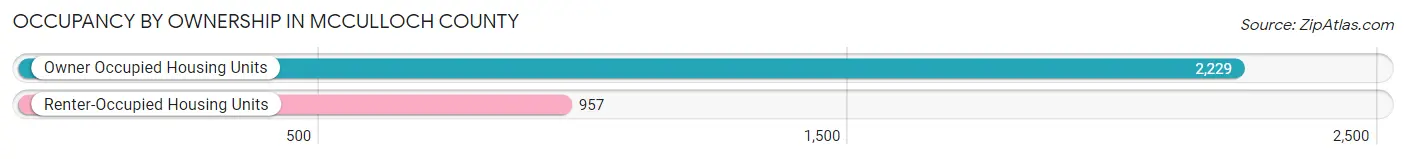
| Occupancy | # Housing Units | % Housing Units |
| Owner Occupied Housing Units | 2,229 | 70.0% |
| Renter-Occupied Housing Units | 957 | 30.0% |
| Total Occupied Housing Units | 3,186 | 100.0% |
Occupancy by Household Size in McCulloch County
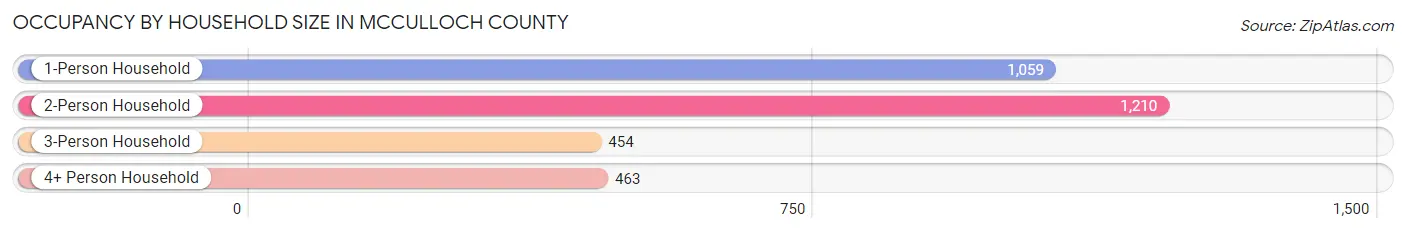
| Household Size | # Housing Units | % Housing Units |
| 1-Person Household | 1,059 | 33.2% |
| 2-Person Household | 1,210 | 38.0% |
| 3-Person Household | 454 | 14.2% |
| 4+ Person Household | 463 | 14.5% |
| Total Housing Units | 3,186 | 100.0% |
Occupancy by Ownership by Household Size in McCulloch County
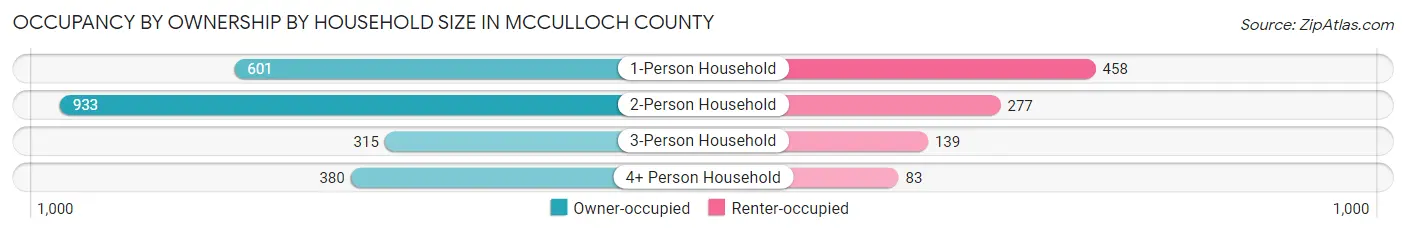
| Household Size | Owner-occupied | Renter-occupied |
| 1-Person Household | 601 (56.8%) | 458 (43.2%) |
| 2-Person Household | 933 (77.1%) | 277 (22.9%) |
| 3-Person Household | 315 (69.4%) | 139 (30.6%) |
| 4+ Person Household | 380 (82.1%) | 83 (17.9%) |
| Total Housing Units | 2,229 (70.0%) | 957 (30.0%) |
Occupancy by Educational Attainment in McCulloch County
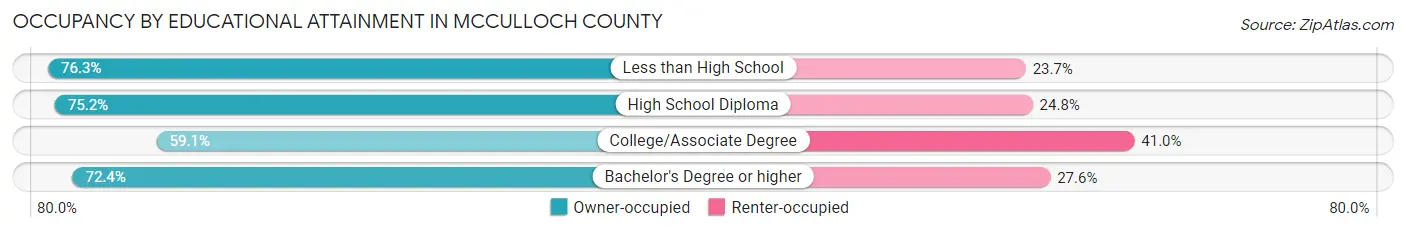
| Household Size | Owner-occupied | Renter-occupied |
| Less than High School | 505 (76.3%) | 157 (23.7%) |
| High School Diploma | 636 (75.2%) | 210 (24.8%) |
| College/Associate Degree | 561 (59.1%) | 389 (40.9%) |
| Bachelor's Degree or higher | 527 (72.4%) | 201 (27.6%) |
Occupancy by Age of Householder in McCulloch County
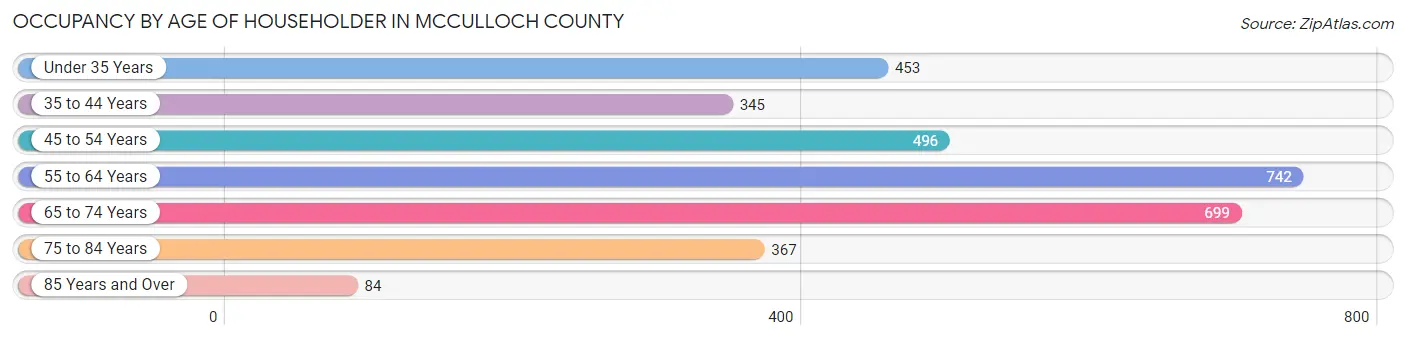
| Age Bracket | # Households | % Households |
| Under 35 Years | 453 | 14.2% |
| 35 to 44 Years | 345 | 10.8% |
| 45 to 54 Years | 496 | 15.6% |
| 55 to 64 Years | 742 | 23.3% |
| 65 to 74 Years | 699 | 21.9% |
| 75 to 84 Years | 367 | 11.5% |
| 85 Years and Over | 84 | 2.6% |
| Total | 3,186 | 100.0% |
Housing Finances in McCulloch County
Median Income by Occupancy in McCulloch County
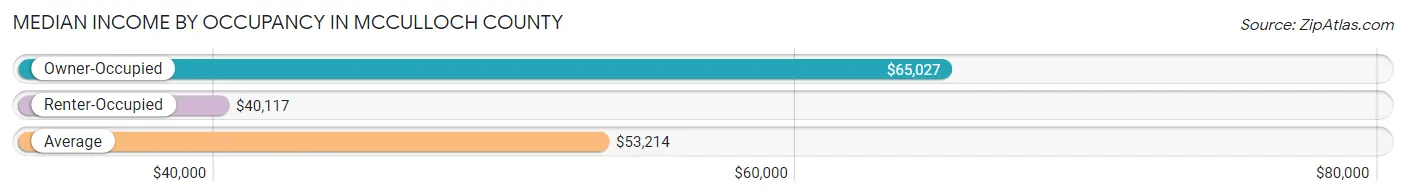
| Occupancy Type | # Households | Median Income |
| Owner-Occupied | 2,229 (70.0%) | $65,027 |
| Renter-Occupied | 957 (30.0%) | $40,117 |
| Average | 3,186 (100.0%) | $53,214 |
Occupancy by Householder Income Bracket in McCulloch County
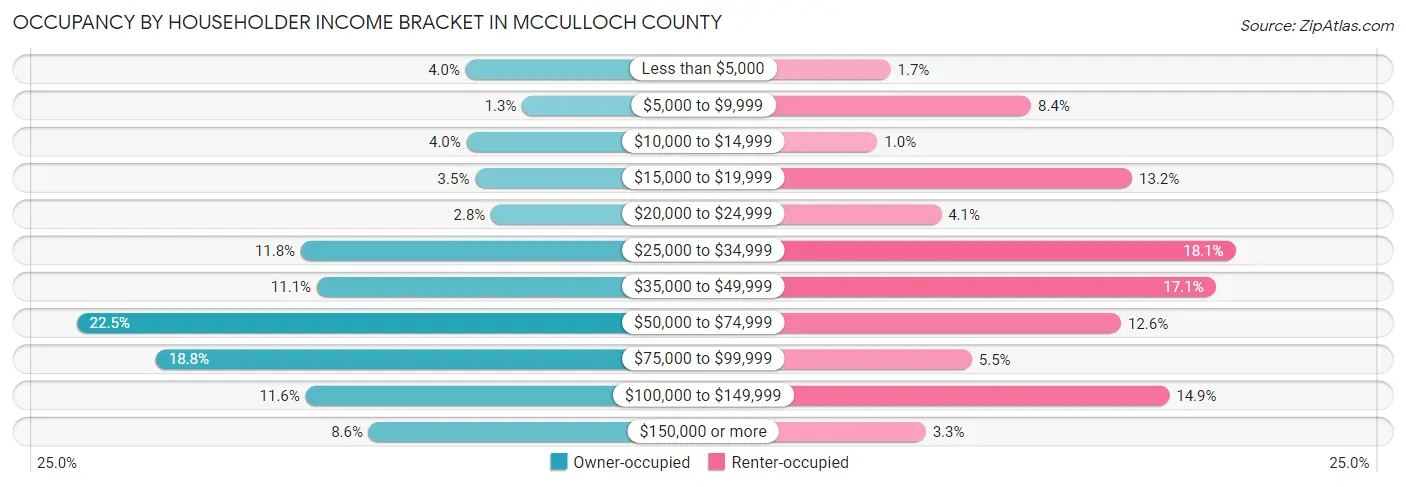
| Income Bracket | Owner-occupied | Renter-occupied |
| Less than $5,000 | 89 (4.0%) | 16 (1.7%) |
| $5,000 to $9,999 | 29 (1.3%) | 80 (8.4%) |
| $10,000 to $14,999 | 88 (4.0%) | 10 (1.0%) |
| $15,000 to $19,999 | 79 (3.5%) | 126 (13.2%) |
| $20,000 to $24,999 | 62 (2.8%) | 39 (4.1%) |
| $25,000 to $34,999 | 264 (11.8%) | 173 (18.1%) |
| $35,000 to $49,999 | 247 (11.1%) | 164 (17.1%) |
| $50,000 to $74,999 | 502 (22.5%) | 121 (12.6%) |
| $75,000 to $99,999 | 418 (18.8%) | 53 (5.5%) |
| $100,000 to $149,999 | 259 (11.6%) | 143 (14.9%) |
| $150,000 or more | 192 (8.6%) | 32 (3.3%) |
| Total | 2,229 (100.0%) | 957 (100.0%) |
Monthly Housing Cost Tiers in McCulloch County
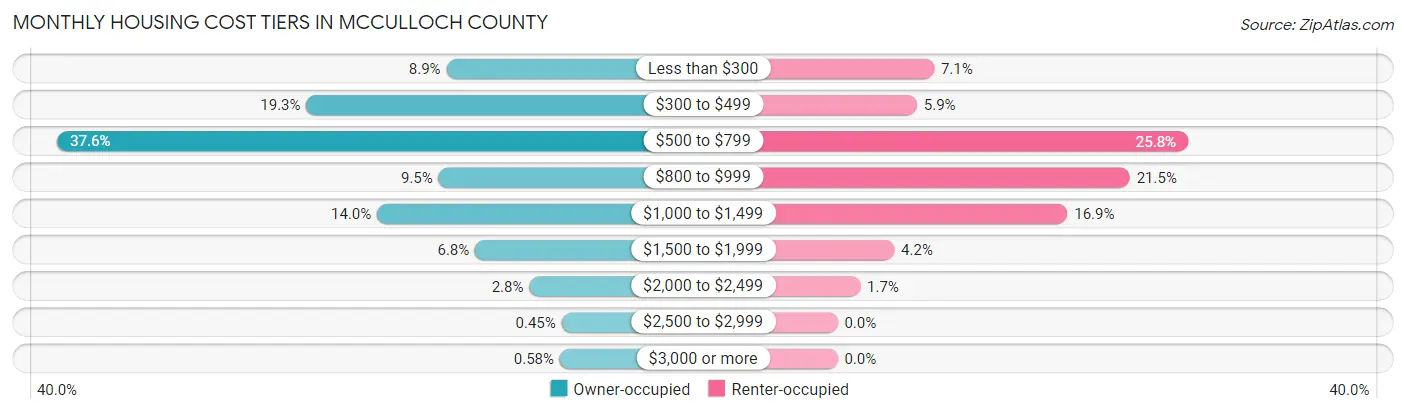
| Monthly Cost | Owner-occupied | Renter-occupied |
| Less than $300 | 199 (8.9%) | 68 (7.1%) |
| $300 to $499 | 429 (19.3%) | 56 (5.9%) |
| $500 to $799 | 838 (37.6%) | 247 (25.8%) |
| $800 to $999 | 212 (9.5%) | 206 (21.5%) |
| $1,000 to $1,499 | 313 (14.0%) | 162 (16.9%) |
| $1,500 to $1,999 | 152 (6.8%) | 40 (4.2%) |
| $2,000 to $2,499 | 63 (2.8%) | 16 (1.7%) |
| $2,500 to $2,999 | 10 (0.4%) | 0 (0.0%) |
| $3,000 or more | 13 (0.6%) | 0 (0.0%) |
| Total | 2,229 (100.0%) | 957 (100.0%) |
Physical Housing Characteristics in McCulloch County
Housing Structures in McCulloch County
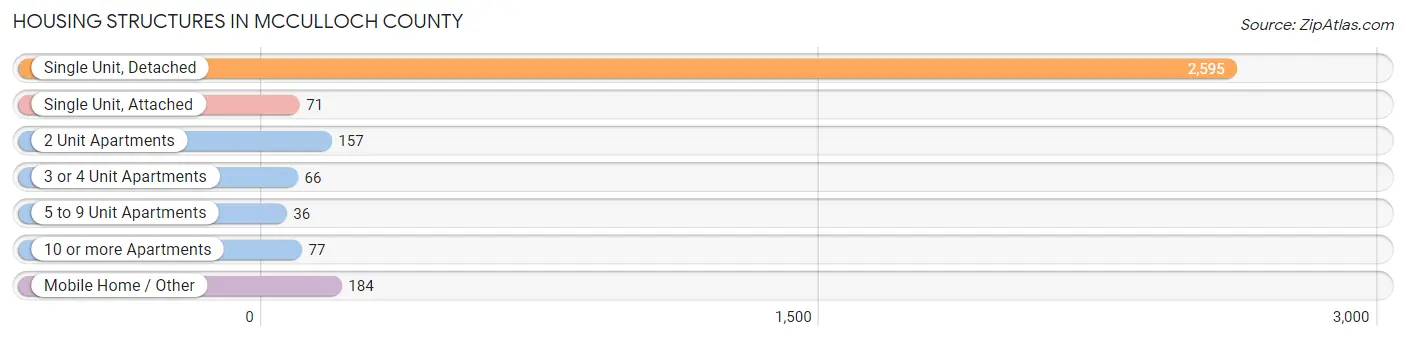
| Structure Type | # Housing Units | % Housing Units |
| Single Unit, Detached | 2,595 | 81.5% |
| Single Unit, Attached | 71 | 2.2% |
| 2 Unit Apartments | 157 | 4.9% |
| 3 or 4 Unit Apartments | 66 | 2.1% |
| 5 to 9 Unit Apartments | 36 | 1.1% |
| 10 or more Apartments | 77 | 2.4% |
| Mobile Home / Other | 184 | 5.8% |
| Total | 3,186 | 100.0% |
Housing Structures by Occupancy in McCulloch County
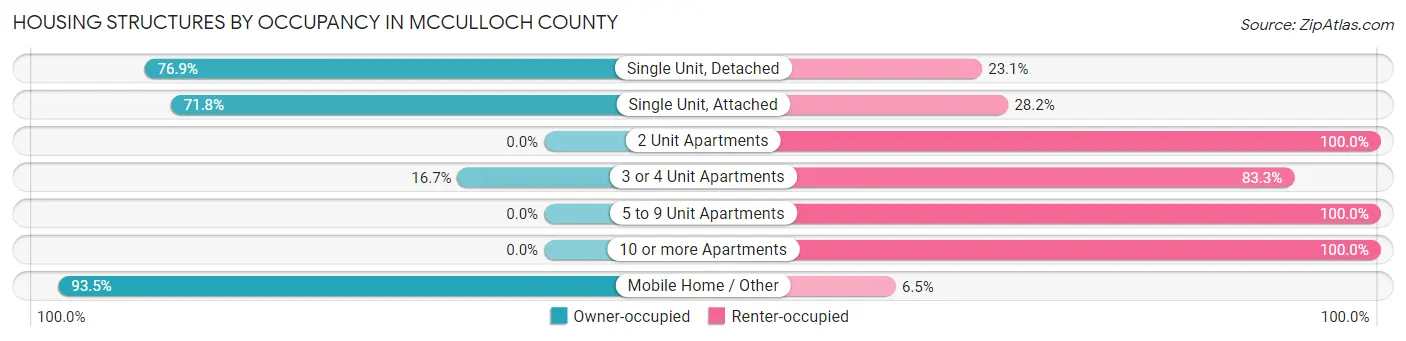
| Structure Type | Owner-occupied | Renter-occupied |
| Single Unit, Detached | 1,995 (76.9%) | 600 (23.1%) |
| Single Unit, Attached | 51 (71.8%) | 20 (28.2%) |
| 2 Unit Apartments | 0 (0.0%) | 157 (100.0%) |
| 3 or 4 Unit Apartments | 11 (16.7%) | 55 (83.3%) |
| 5 to 9 Unit Apartments | 0 (0.0%) | 36 (100.0%) |
| 10 or more Apartments | 0 (0.0%) | 77 (100.0%) |
| Mobile Home / Other | 172 (93.5%) | 12 (6.5%) |
| Total | 2,229 (70.0%) | 957 (30.0%) |
Housing Structures by Number of Rooms in McCulloch County
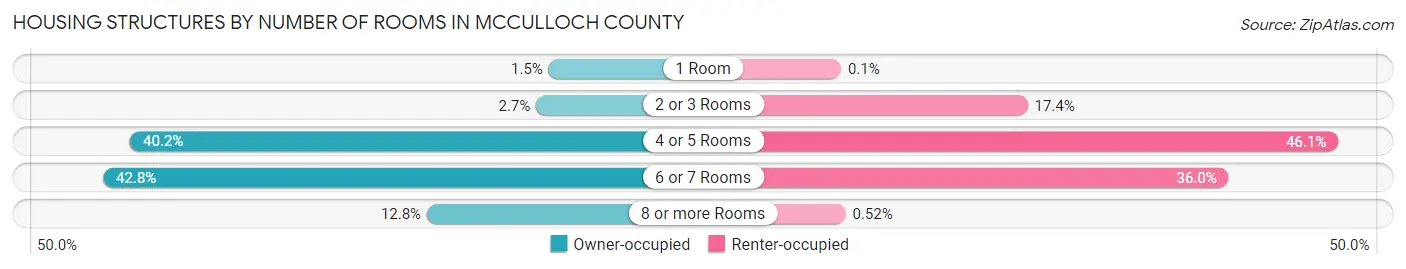
| Number of Rooms | Owner-occupied | Renter-occupied |
| 1 Room | 34 (1.5%) | 1 (0.1%) |
| 2 or 3 Rooms | 60 (2.7%) | 166 (17.3%) |
| 4 or 5 Rooms | 897 (40.2%) | 441 (46.1%) |
| 6 or 7 Rooms | 953 (42.7%) | 344 (35.9%) |
| 8 or more Rooms | 285 (12.8%) | 5 (0.5%) |
| Total | 2,229 (100.0%) | 957 (100.0%) |
Housing Structure by Heating Type in McCulloch County
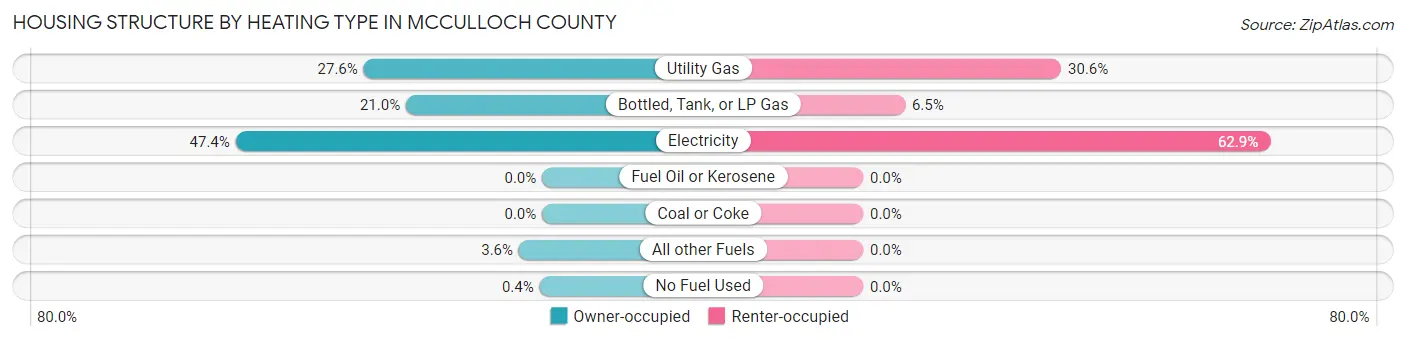
| Heating Type | Owner-occupied | Renter-occupied |
| Utility Gas | 615 (27.6%) | 293 (30.6%) |
| Bottled, Tank, or LP Gas | 469 (21.0%) | 62 (6.5%) |
| Electricity | 1,056 (47.4%) | 602 (62.9%) |
| Fuel Oil or Kerosene | 0 (0.0%) | 0 (0.0%) |
| Coal or Coke | 0 (0.0%) | 0 (0.0%) |
| All other Fuels | 80 (3.6%) | 0 (0.0%) |
| No Fuel Used | 9 (0.4%) | 0 (0.0%) |
| Total | 2,229 (100.0%) | 957 (100.0%) |
Household Vehicle Usage in McCulloch County
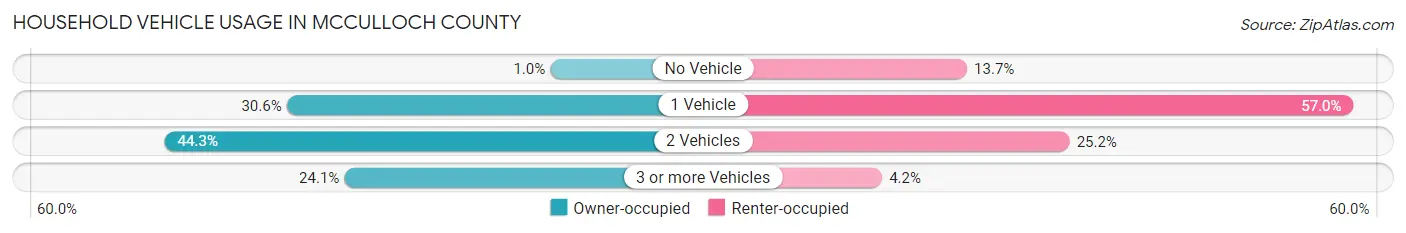
| Vehicles per Household | Owner-occupied | Renter-occupied |
| No Vehicle | 23 (1.0%) | 131 (13.7%) |
| 1 Vehicle | 681 (30.5%) | 545 (57.0%) |
| 2 Vehicles | 988 (44.3%) | 241 (25.2%) |
| 3 or more Vehicles | 537 (24.1%) | 40 (4.2%) |
| Total | 2,229 (100.0%) | 957 (100.0%) |
Real Estate & Mortgages in McCulloch County
Real Estate and Mortgage Overview in McCulloch County
| Characteristic | Without Mortgage | With Mortgage |
| Housing Units | 1,433 | 796 |
| Median Property Value | $88,100 | $112,100 |
| Median Household Income | $54,156 | $69 |
| Monthly Housing Costs | $543 | $8 |
| Real Estate Taxes | $1,086 | $17 |
Property Value by Mortgage Status in McCulloch County
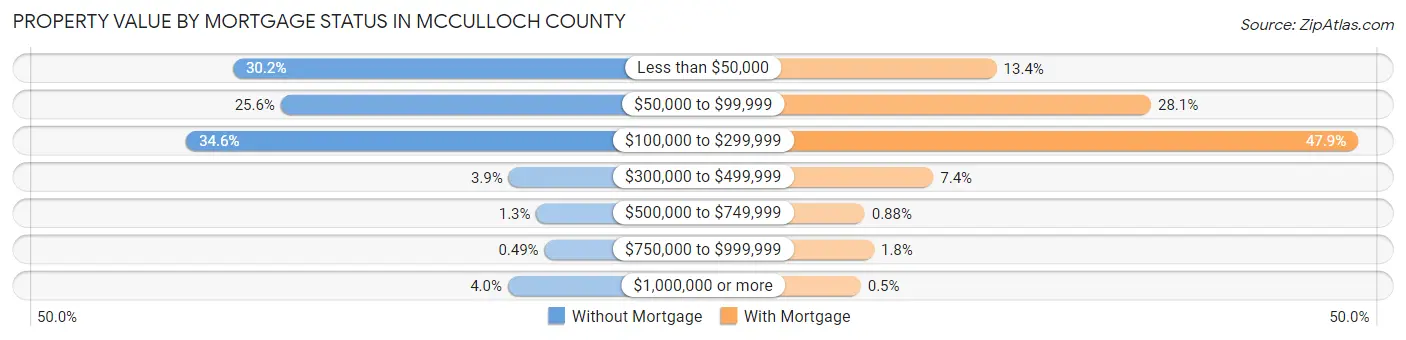
| Property Value | Without Mortgage | With Mortgage |
| Less than $50,000 | 432 (30.1%) | 107 (13.4%) |
| $50,000 to $99,999 | 367 (25.6%) | 224 (28.1%) |
| $100,000 to $299,999 | 496 (34.6%) | 381 (47.9%) |
| $300,000 to $499,999 | 56 (3.9%) | 59 (7.4%) |
| $500,000 to $749,999 | 18 (1.3%) | 7 (0.9%) |
| $750,000 to $999,999 | 7 (0.5%) | 14 (1.8%) |
| $1,000,000 or more | 57 (4.0%) | 4 (0.5%) |
| Total | 1,433 (100.0%) | 796 (100.0%) |
Household Income by Mortgage Status in McCulloch County
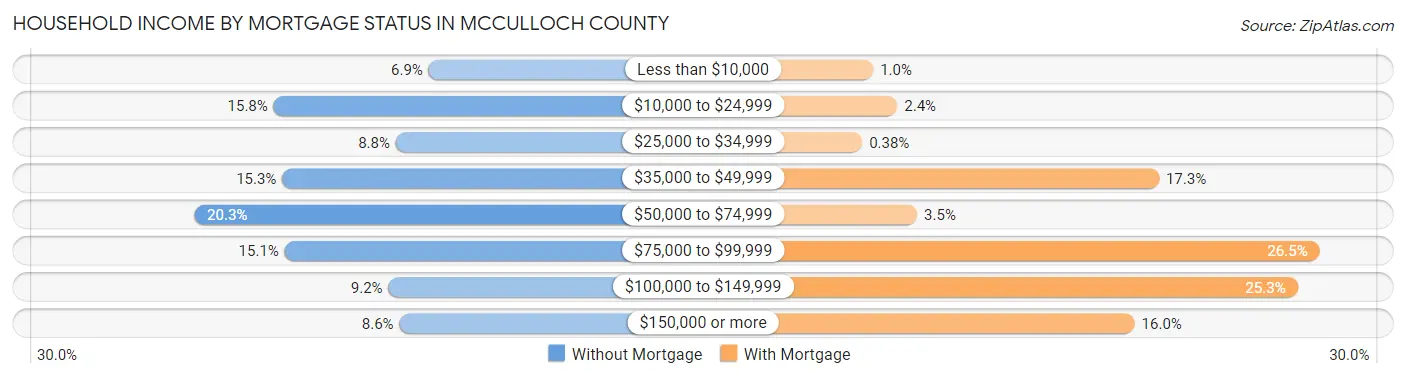
| Household Income | Without Mortgage | With Mortgage |
| Less than $10,000 | 99 (6.9%) | 8 (1.0%) |
| $10,000 to $24,999 | 226 (15.8%) | 19 (2.4%) |
| $25,000 to $34,999 | 126 (8.8%) | 3 (0.4%) |
| $35,000 to $49,999 | 219 (15.3%) | 138 (17.3%) |
| $50,000 to $74,999 | 291 (20.3%) | 28 (3.5%) |
| $75,000 to $99,999 | 217 (15.1%) | 211 (26.5%) |
| $100,000 to $149,999 | 132 (9.2%) | 201 (25.3%) |
| $150,000 or more | 123 (8.6%) | 127 (16.0%) |
| Total | 1,433 (100.0%) | 796 (100.0%) |
Property Value to Household Income Ratio in McCulloch County
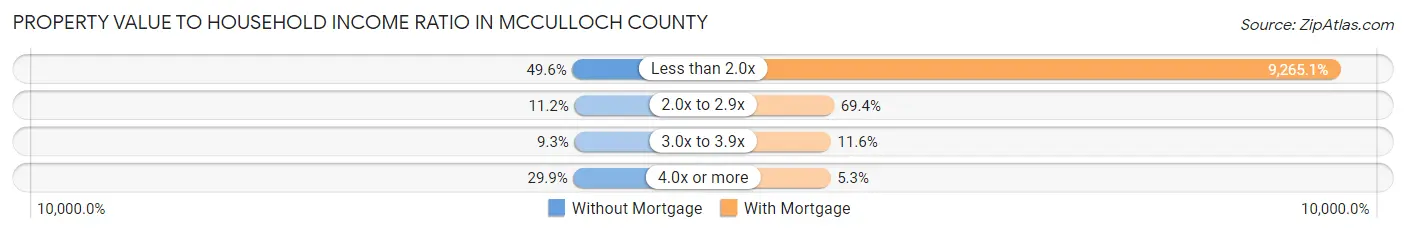
| Value-to-Income Ratio | Without Mortgage | With Mortgage |
| Less than 2.0x | 711 (49.6%) | 73,750 (9,265.1%) |
| 2.0x to 2.9x | 161 (11.2%) | 552 (69.4%) |
| 3.0x to 3.9x | 133 (9.3%) | 92 (11.6%) |
| 4.0x or more | 428 (29.9%) | 42 (5.3%) |
| Total | 1,433 (100.0%) | 796 (100.0%) |
Real Estate Taxes by Mortgage Status in McCulloch County
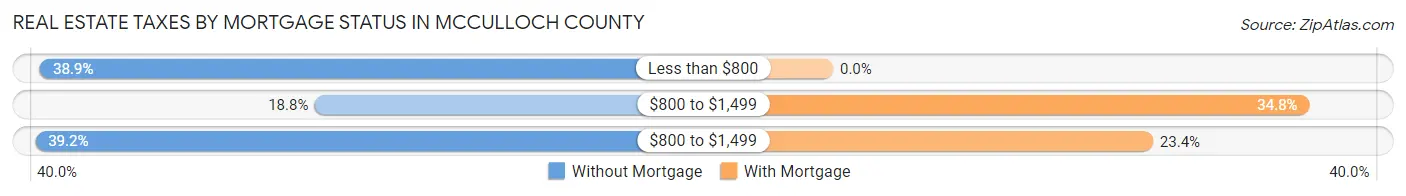
| Property Taxes | Without Mortgage | With Mortgage |
| Less than $800 | 557 (38.9%) | 0 (0.0%) |
| $800 to $1,499 | 270 (18.8%) | 277 (34.8%) |
| $800 to $1,499 | 562 (39.2%) | 186 (23.4%) |
| Total | 1,433 (100.0%) | 796 (100.0%) |
Health & Disability in McCulloch County
Health Insurance Coverage by Age in McCulloch County
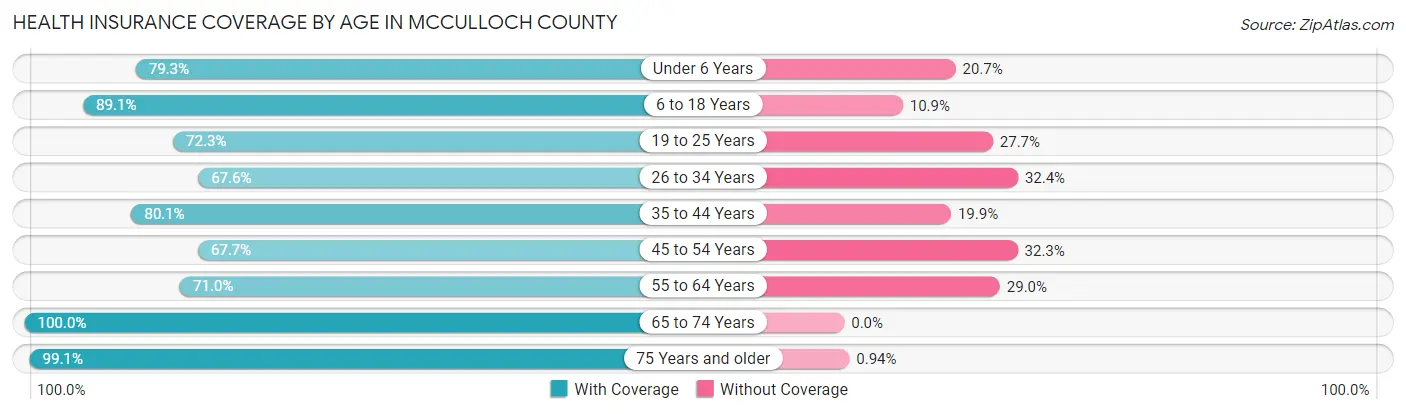
| Age Bracket | With Coverage | Without Coverage |
| Under 6 Years | 386 (79.3%) | 101 (20.7%) |
| 6 to 18 Years | 1,094 (89.1%) | 134 (10.9%) |
| 19 to 25 Years | 402 (72.3%) | 154 (27.7%) |
| 26 to 34 Years | 495 (67.6%) | 237 (32.4%) |
| 35 to 44 Years | 664 (80.1%) | 165 (19.9%) |
| 45 to 54 Years | 645 (67.7%) | 308 (32.3%) |
| 55 to 64 Years | 771 (71.0%) | 315 (29.0%) |
| 65 to 74 Years | 1,000 (100.0%) | 0 (0.0%) |
| 75 Years and older | 634 (99.1%) | 6 (0.9%) |
| Total | 6,091 (81.1%) | 1,420 (18.9%) |
Health Insurance Coverage by Citizenship Status in McCulloch County
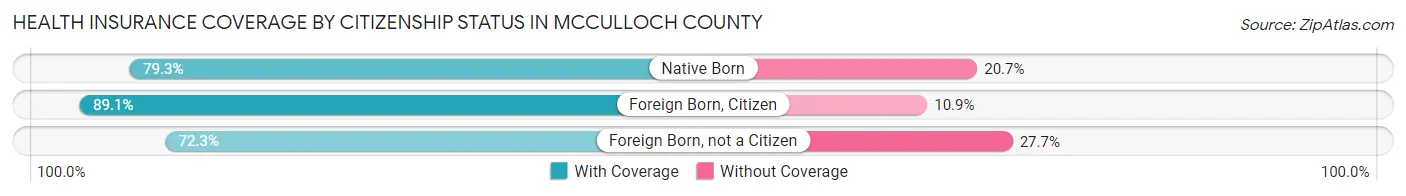
| Citizenship Status | With Coverage | Without Coverage |
| Native Born | 386 (79.3%) | 101 (20.7%) |
| Foreign Born, Citizen | 1,094 (89.1%) | 134 (10.9%) |
| Foreign Born, not a Citizen | 402 (72.3%) | 154 (27.7%) |
Health Insurance Coverage by Household Income in McCulloch County
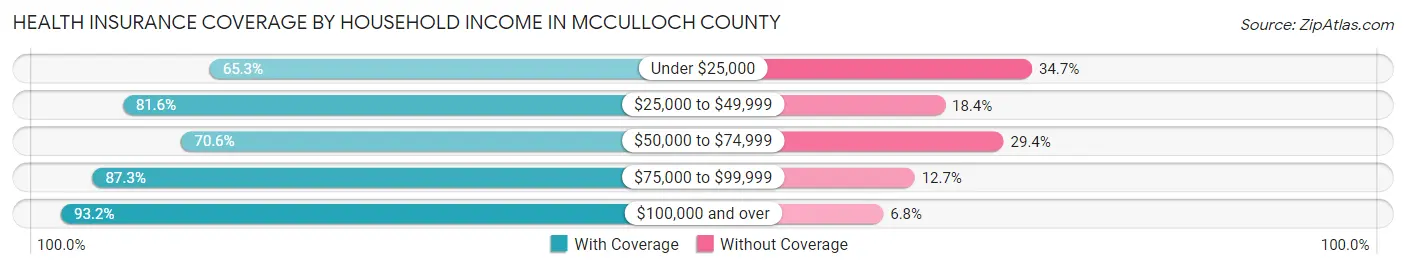
| Household Income | With Coverage | Without Coverage |
| Under $25,000 | 615 (65.3%) | 327 (34.7%) |
| $25,000 to $49,999 | 1,446 (81.6%) | 326 (18.4%) |
| $50,000 to $74,999 | 1,096 (70.6%) | 456 (29.4%) |
| $75,000 to $99,999 | 1,304 (87.3%) | 190 (12.7%) |
| $100,000 and over | 1,620 (93.2%) | 119 (6.8%) |
Public vs Private Health Insurance Coverage by Age in McCulloch County
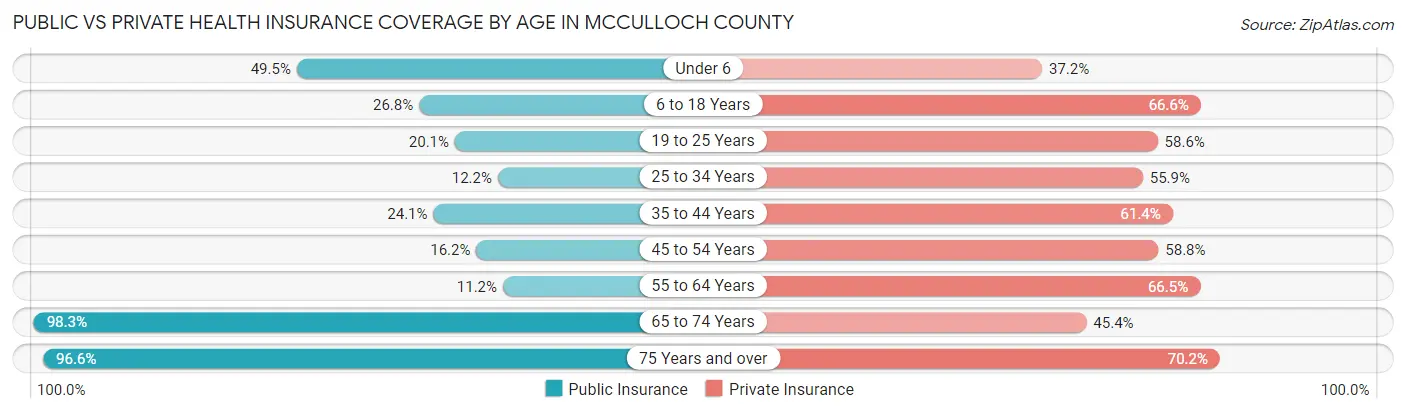
| Age Bracket | Public Insurance | Private Insurance |
| Under 6 | 241 (49.5%) | 181 (37.2%) |
| 6 to 18 Years | 329 (26.8%) | 818 (66.6%) |
| 19 to 25 Years | 112 (20.1%) | 326 (58.6%) |
| 25 to 34 Years | 89 (12.2%) | 409 (55.9%) |
| 35 to 44 Years | 200 (24.1%) | 509 (61.4%) |
| 45 to 54 Years | 154 (16.2%) | 560 (58.8%) |
| 55 to 64 Years | 122 (11.2%) | 722 (66.5%) |
| 65 to 74 Years | 983 (98.3%) | 454 (45.4%) |
| 75 Years and over | 618 (96.6%) | 449 (70.2%) |
| Total | 2,848 (37.9%) | 4,428 (59.0%) |
Disability Status by Sex by Age in McCulloch County
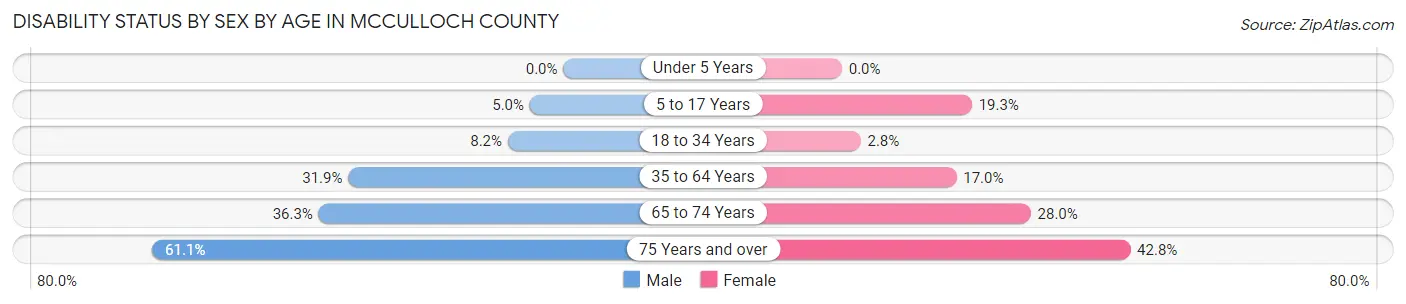
| Age Bracket | Male | Female |
| Under 5 Years | 0 (0.0%) | 0 (0.0%) |
| 5 to 17 Years | 34 (5.0%) | 114 (19.3%) |
| 18 to 34 Years | 58 (8.2%) | 17 (2.8%) |
| 35 to 64 Years | 463 (31.9%) | 241 (17.0%) |
| 65 to 74 Years | 178 (36.3%) | 143 (28.0%) |
| 75 Years and over | 174 (61.1%) | 152 (42.8%) |
Disability Class by Sex by Age in McCulloch County
Disability Class: Hearing Difficulty
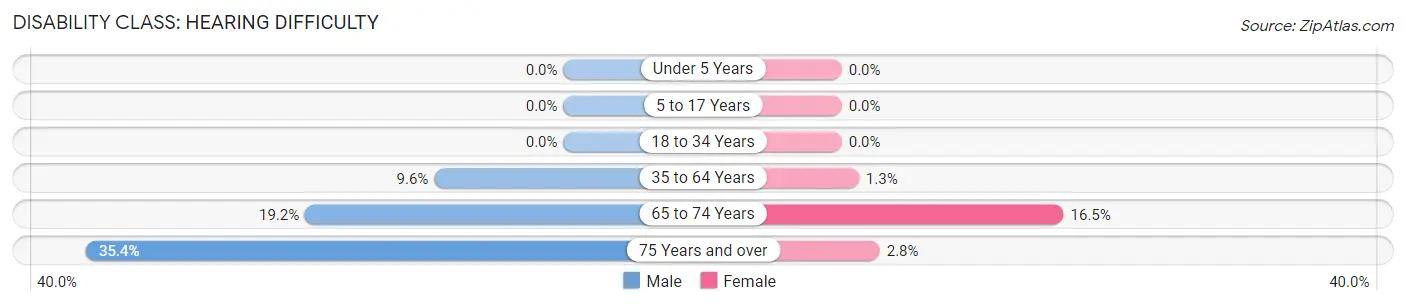
| Age Bracket | Male | Female |
| Under 5 Years | 0 (0.0%) | 0 (0.0%) |
| 5 to 17 Years | 0 (0.0%) | 0 (0.0%) |
| 18 to 34 Years | 0 (0.0%) | 0 (0.0%) |
| 35 to 64 Years | 139 (9.6%) | 18 (1.3%) |
| 65 to 74 Years | 94 (19.2%) | 84 (16.5%) |
| 75 Years and over | 101 (35.4%) | 10 (2.8%) |
Disability Class: Vision Difficulty
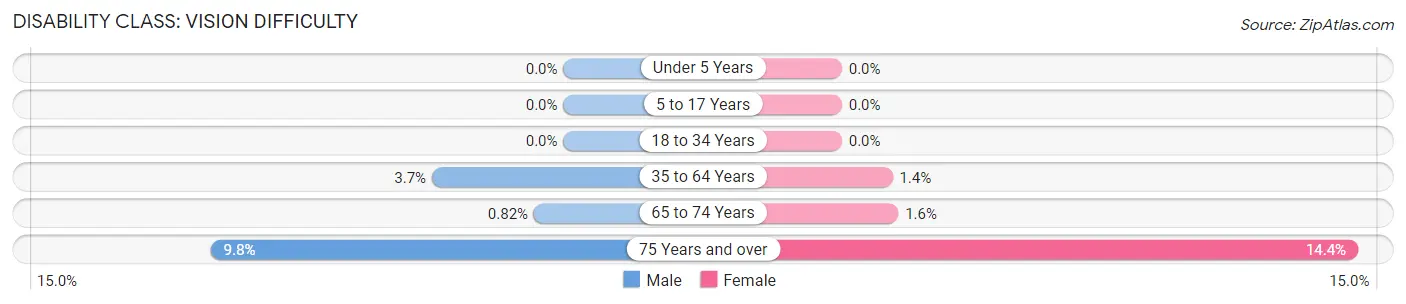
| Age Bracket | Male | Female |
| Under 5 Years | 0 (0.0%) | 0 (0.0%) |
| 5 to 17 Years | 0 (0.0%) | 0 (0.0%) |
| 18 to 34 Years | 0 (0.0%) | 0 (0.0%) |
| 35 to 64 Years | 53 (3.7%) | 20 (1.4%) |
| 65 to 74 Years | 4 (0.8%) | 8 (1.6%) |
| 75 Years and over | 28 (9.8%) | 51 (14.4%) |
Disability Class: Cognitive Difficulty
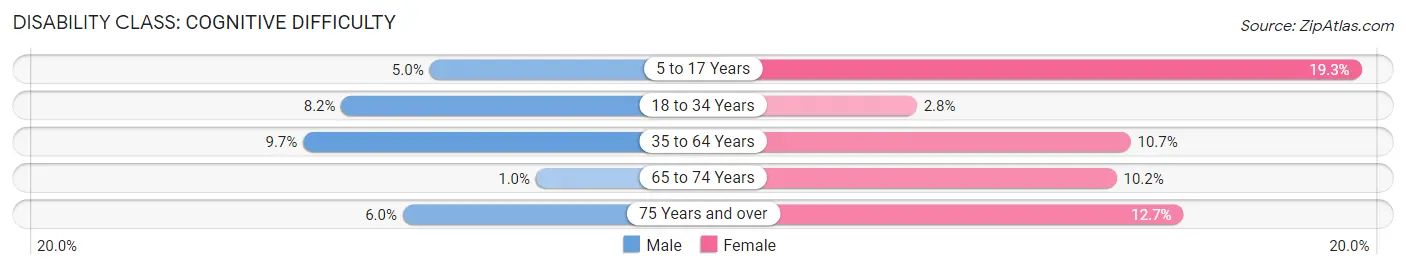
| Age Bracket | Male | Female |
| 5 to 17 Years | 34 (5.0%) | 114 (19.3%) |
| 18 to 34 Years | 58 (8.2%) | 17 (2.8%) |
| 35 to 64 Years | 140 (9.7%) | 152 (10.7%) |
| 65 to 74 Years | 5 (1.0%) | 52 (10.2%) |
| 75 Years and over | 17 (6.0%) | 45 (12.7%) |
Disability Class: Ambulatory Difficulty
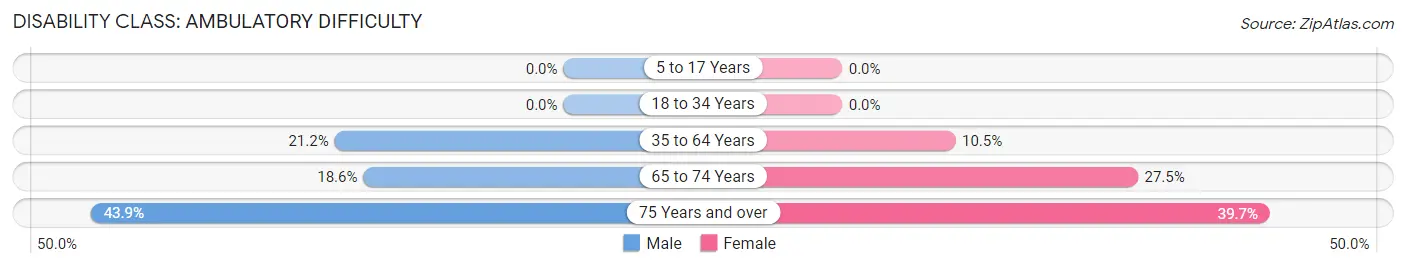
| Age Bracket | Male | Female |
| 5 to 17 Years | 0 (0.0%) | 0 (0.0%) |
| 18 to 34 Years | 0 (0.0%) | 0 (0.0%) |
| 35 to 64 Years | 308 (21.2%) | 149 (10.5%) |
| 65 to 74 Years | 91 (18.6%) | 140 (27.5%) |
| 75 Years and over | 125 (43.9%) | 141 (39.7%) |
Disability Class: Self-Care Difficulty
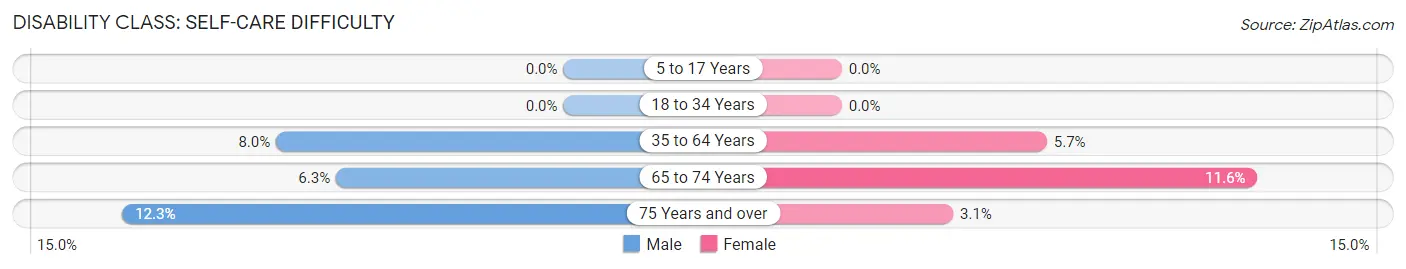
| Age Bracket | Male | Female |
| 5 to 17 Years | 0 (0.0%) | 0 (0.0%) |
| 18 to 34 Years | 0 (0.0%) | 0 (0.0%) |
| 35 to 64 Years | 116 (8.0%) | 81 (5.7%) |
| 65 to 74 Years | 31 (6.3%) | 59 (11.6%) |
| 75 Years and over | 35 (12.3%) | 11 (3.1%) |
Technology Access in McCulloch County
Computing Device Access in McCulloch County
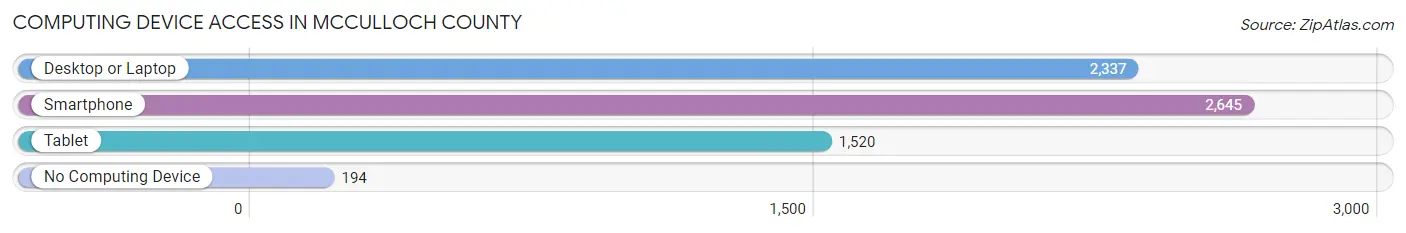
| Device Type | # Households | % Households |
| Desktop or Laptop | 2,337 | 73.4% |
| Smartphone | 2,645 | 83.0% |
| Tablet | 1,520 | 47.7% |
| No Computing Device | 194 | 6.1% |
| Total | 3,186 | 100.0% |
Internet Access in McCulloch County
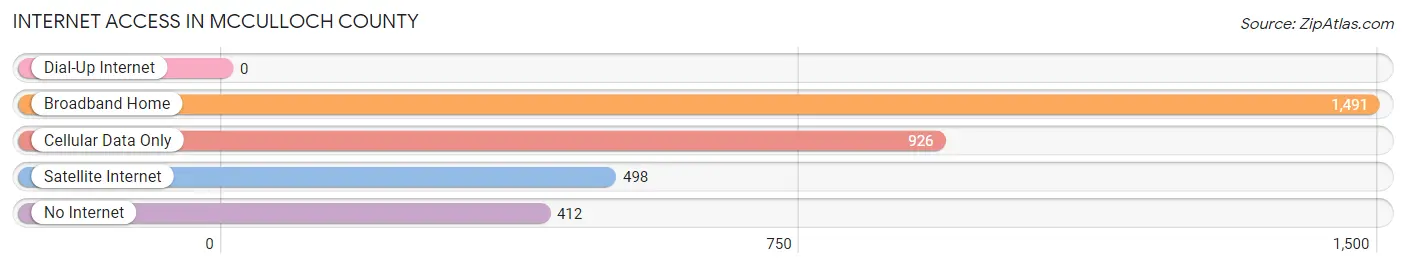
| Internet Type | # Households | % Households |
| Dial-Up Internet | 0 | 0.0% |
| Broadband Home | 1,491 | 46.8% |
| Cellular Data Only | 926 | 29.1% |
| Satellite Internet | 498 | 15.6% |
| No Internet | 412 | 12.9% |
| Total | 3,186 | 100.0% |
McCulloch County Summary
Mcculloch County is located in the state of Texas, in the United States of America. It is located in the Central region of the state and is bordered by Brown, Coleman, Concho, Mason, and San Saba counties. The county seat is Brady, and the largest city is Brady. As of the 2010 census, the population was 8,283.
Geography
Mcculloch County is located in the Central region of Texas, and is bordered by Brown, Coleman, Concho, Mason, and San Saba counties. The county has a total area of 902 square miles, of which 899 square miles is land and 3 square miles is water. The terrain is mostly flat, with some rolling hills in the western part of the county. The county is drained by the Colorado River, which forms its western boundary.
The climate of Mcculloch County is generally semi-arid, with hot summers and mild winters. The average annual temperature is 68°F, and the average annual precipitation is 22 inches.
History
Mcculloch County was established in 1856, and was named for Benjamin McCulloch, a Texas Ranger and Confederate general. The county was originally part of Bexar County, and was later divided into several smaller counties.
The county was largely rural until the early 20th century, when oil was discovered in the area. This led to an economic boom, and the population of the county grew rapidly. The county seat, Brady, was established in 1909.
Economy
The economy of Mcculloch County is largely based on agriculture and oil production. The county is home to several large ranches, and the main crops grown in the area are cotton, corn, and wheat.
Oil production is also an important part of the economy. The county is home to several oil fields, and the production of oil and gas has been a major source of income for the county since the early 20th century.
Demographics
As of the 2010 census, the population of Mcculloch County was 8,283. The racial makeup of the county was 79.3% White, 15.2% Hispanic or Latino, 2.2% African American, 0.7% Native American, 0.3% Asian, 0.1% Pacific Islander, and 2.4% from other races.
The median household income in the county was $37,945, and the median family income was $45,938. The per capita income was $19,845. About 16.2% of the population was below the poverty line.
Conclusion
Mcculloch County is located in the Central region of Texas, and is bordered by Brown, Coleman, Concho, Mason, and San Saba counties. The county has a total area of 902 square miles, and the terrain is mostly flat, with some rolling hills in the western part of the county. The economy of Mcculloch County is largely based on agriculture and oil production, and the population of the county was 8,283 as of the 2010 census. The median household income in the county was $37,945, and the per capita income was $19,845.
Common Questions
What is Per Capita Income in McCulloch County?
Per Capita income in McCulloch County is $29,514.
What is the Median Family Income in McCulloch County?
Median Family Income in McCulloch County is $66,438.
What is the Median Household income in McCulloch County?
Median Household Income in McCulloch County is $53,214.
What is Income or Wage Gap in McCulloch County?
Income or Wage Gap in McCulloch County is 29.9%.
Women in McCulloch County earn 70.1 cents for every dollar earned by a man.
What is Inequality or Gini Index in McCulloch County?
Inequality or Gini Index in McCulloch County is 0.43.
What is the Total Population of McCulloch County?
Total Population of McCulloch County is 7,638.
What is the Total Male Population of McCulloch County?
Total Male Population of McCulloch County is 3,917.
What is the Total Female Population of McCulloch County?
Total Female Population of McCulloch County is 3,721.
What is the Ratio of Males per 100 Females in McCulloch County?
There are 105.27 Males per 100 Females in McCulloch County.
What is the Ratio of Females per 100 Males in McCulloch County?
There are 95.00 Females per 100 Males in McCulloch County.
What is the Median Population Age in McCulloch County?
Median Population Age in McCulloch County is 44.4 Years.
What is the Average Family Size in McCulloch County
Average Family Size in McCulloch County is 3.0 People.
What is the Average Household Size in McCulloch County
Average Household Size in McCulloch County is 2.4 People.
How Large is the Labor Force in McCulloch County?
There are 3,598 People in the Labor Forcein in McCulloch County.
What is the Percentage of People in the Labor Force in McCulloch County?
58.6% of People are in the Labor Force in McCulloch County.
What is the Unemployment Rate in McCulloch County?
Unemployment Rate in McCulloch County is 8.7%.