Matagorda County, TX Map & Demographics
Matagorda County Map
Matagorda County Overview
$29,001
PER CAPITA INCOME
$69,689
AVG FAMILY INCOME
$56,412
AVG HOUSEHOLD INCOME
44.2%
WAGE / INCOME GAP [ % ]
55.8¢/ $1
WAGE / INCOME GAP [ $ ]
$12,013
FAMILY INCOME DEFICIT
0.47
INEQUALITY / GINI INDEX
36,251
TOTAL POPULATION
18,259
MALE POPULATION
17,992
FEMALE POPULATION
101.48
MALES / 100 FEMALES
98.54
FEMALES / 100 MALES
37.1
MEDIAN AGE
3.2
AVG FAMILY SIZE
2.5
AVG HOUSEHOLD SIZE
15,984
LABOR FORCE [ PEOPLE ]
57.2%
PERCENT IN LABOR FORCE
6.7%
UNEMPLOYMENT RATE
Income in Matagorda County
Income Overview in Matagorda County
Per Capita Income in Matagorda County is $29,001, while median incomes of families and households are $69,689 and $56,412 respectively.
| Characteristic | Number | Measure |
| Per Capita Income | 36,251 | $29,001 |
| Median Family Income | 9,653 | $69,689 |
| Mean Family Income | 9,653 | $83,921 |
| Median Household Income | 14,073 | $56,412 |
| Mean Household Income | 14,073 | $73,260 |
| Income Deficit | 9,653 | $12,013 |
| Wage / Income Gap (%) | 36,251 | 44.15% |
| Wage / Income Gap ($) | 36,251 | 55.85¢ per $1 |
| Gini / Inequality Index | 36,251 | 0.47 |
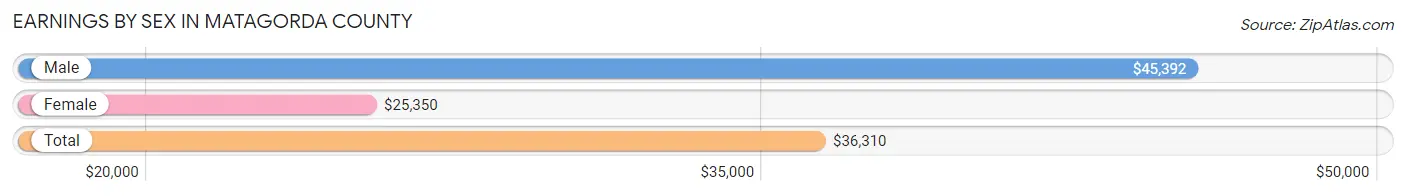
Earnings by Sex in Matagorda County
Average Earnings in Matagorda County are $36,310, $45,392 for men and $25,350 for women, a difference of 44.2%.
| Sex | Number | Average Earnings |
| Male | 9,583 (57.4%) | $45,392 |
| Female | 7,103 (42.6%) | $25,350 |
| Total | 16,686 (100.0%) | $36,310 |
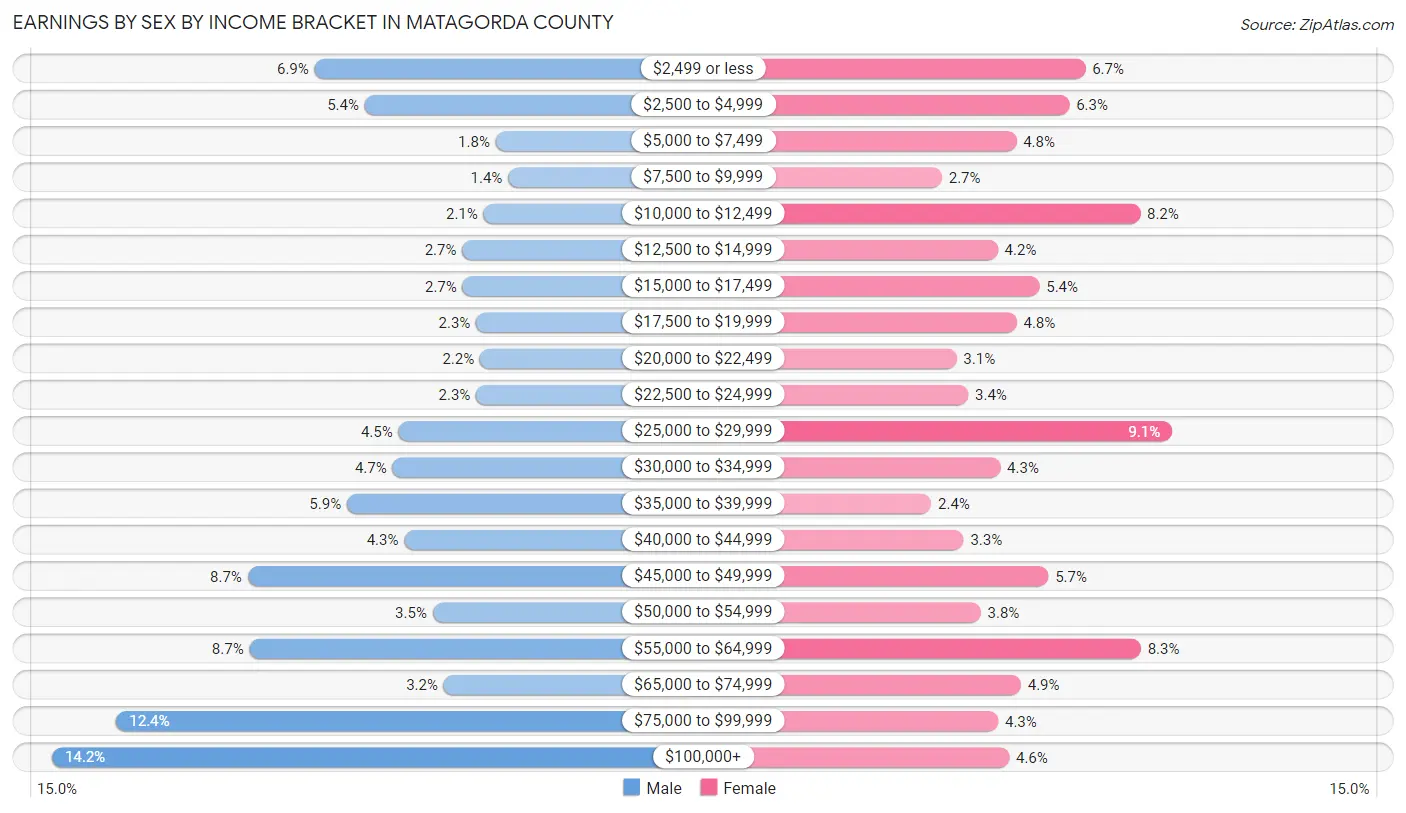
Earnings by Sex by Income Bracket in Matagorda County
The most common earnings brackets in Matagorda County are $100,000+ for men (1,364 | 14.2%) and $25,000 to $29,999 for women (649 | 9.1%).
| Income | Male | Female |
| $2,499 or less | 656 (6.9%) | 476 (6.7%) |
| $2,500 to $4,999 | 521 (5.4%) | 444 (6.2%) |
| $5,000 to $7,499 | 169 (1.8%) | 338 (4.8%) |
| $7,500 to $9,999 | 135 (1.4%) | 190 (2.7%) |
| $10,000 to $12,499 | 201 (2.1%) | 585 (8.2%) |
| $12,500 to $14,999 | 259 (2.7%) | 301 (4.2%) |
| $15,000 to $17,499 | 258 (2.7%) | 384 (5.4%) |
| $17,500 to $19,999 | 221 (2.3%) | 339 (4.8%) |
| $20,000 to $22,499 | 211 (2.2%) | 219 (3.1%) |
| $22,500 to $24,999 | 221 (2.3%) | 242 (3.4%) |
| $25,000 to $29,999 | 430 (4.5%) | 649 (9.1%) |
| $30,000 to $34,999 | 447 (4.7%) | 306 (4.3%) |
| $35,000 to $39,999 | 569 (5.9%) | 168 (2.4%) |
| $40,000 to $44,999 | 415 (4.3%) | 233 (3.3%) |
| $45,000 to $49,999 | 837 (8.7%) | 402 (5.7%) |
| $50,000 to $54,999 | 338 (3.5%) | 267 (3.8%) |
| $55,000 to $64,999 | 832 (8.7%) | 587 (8.3%) |
| $65,000 to $74,999 | 309 (3.2%) | 347 (4.9%) |
| $75,000 to $99,999 | 1,190 (12.4%) | 302 (4.3%) |
| $100,000+ | 1,364 (14.2%) | 324 (4.6%) |
| Total | 9,583 (100.0%) | 7,103 (100.0%) |
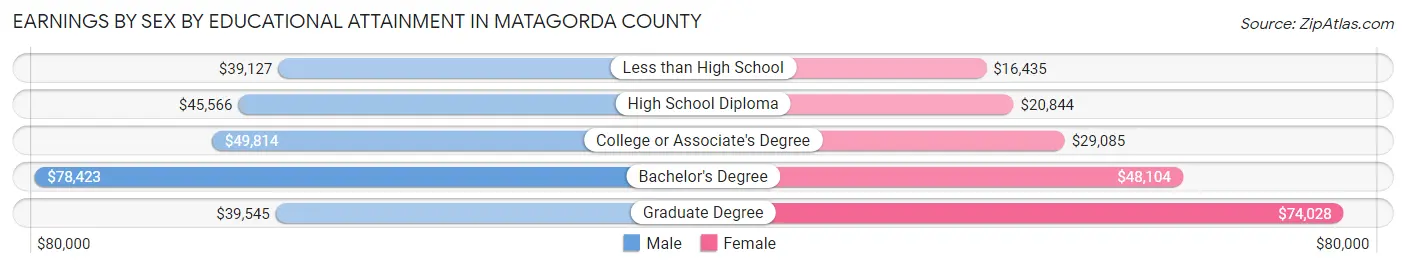
Earnings by Sex by Educational Attainment in Matagorda County
Average earnings in Matagorda County are $48,292 for men and $28,732 for women, a difference of 40.5%. Men with an educational attainment of bachelor's degree enjoy the highest average annual earnings of $78,423, while those with less than high school education earn the least with $39,127. Women with an educational attainment of graduate degree earn the most with the average annual earnings of $74,028, while those with less than high school education have the smallest earnings of $16,435.
| Educational Attainment | Male Income | Female Income |
| Less than High School | $39,127 | $16,435 |
| High School Diploma | $45,566 | $20,844 |
| College or Associate's Degree | $49,814 | $29,085 |
| Bachelor's Degree | $78,423 | $48,104 |
| Graduate Degree | $39,545 | $74,028 |
| Total | $48,292 | $28,732 |
Family Income in Matagorda County
Family Income Brackets in Matagorda County
According to the Matagorda County family income data, there are 1,844 families falling into the $100,000 to $149,999 income range, which is the most common income bracket and makes up 19.1% of all families. Conversely, the $200,000+ income bracket is the least frequent group with only 473 families (4.9%) belonging to this category.
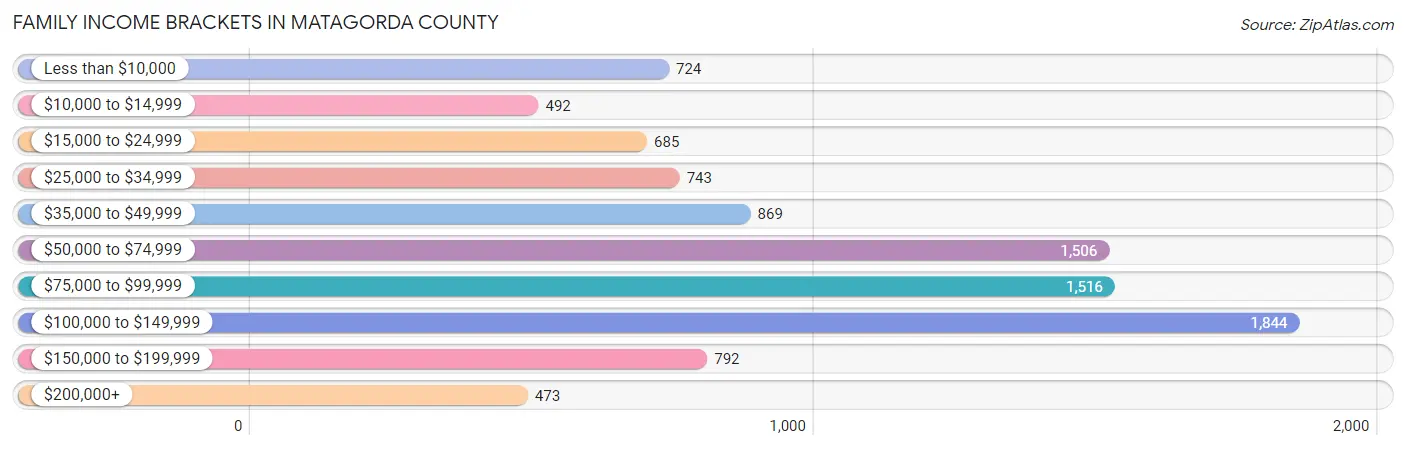
| Income Bracket | # Families | % Families |
| Less than $10,000 | 724 | 7.5% |
| $10,000 to $14,999 | 492 | 5.1% |
| $15,000 to $24,999 | 685 | 7.1% |
| $25,000 to $34,999 | 743 | 7.7% |
| $35,000 to $49,999 | 869 | 9.0% |
| $50,000 to $74,999 | 1,506 | 15.6% |
| $75,000 to $99,999 | 1,516 | 15.7% |
| $100,000 to $149,999 | 1,844 | 19.1% |
| $150,000 to $199,999 | 792 | 8.2% |
| $200,000+ | 473 | 4.9% |
Family Income by Famaliy Size in Matagorda County
4-person families (1,642 | 17.0%) account for the highest median family income in Matagorda County with $95,419 per family, while 2-person families (4,851 | 50.2%) have the highest median income of $32,686 per family member.
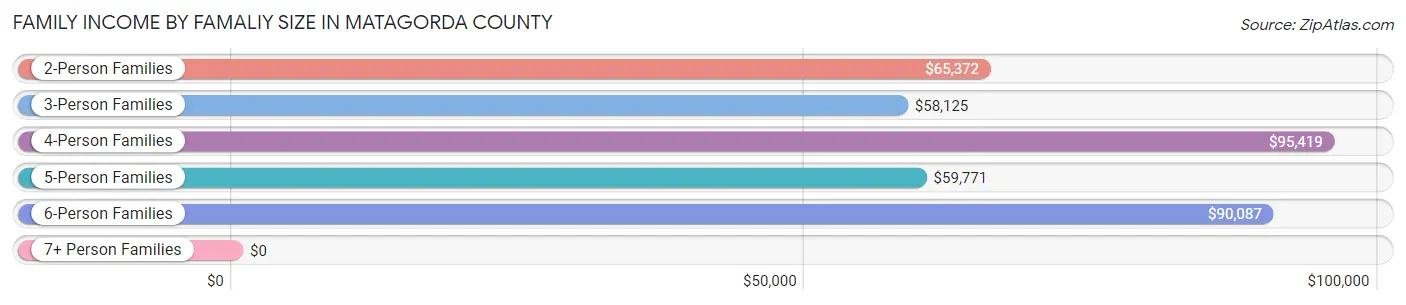
| Income Bracket | # Families | Median Income |
| 2-Person Families | 4,851 (50.2%) | $65,372 |
| 3-Person Families | 1,803 (18.7%) | $58,125 |
| 4-Person Families | 1,642 (17.0%) | $95,419 |
| 5-Person Families | 841 (8.7%) | $59,771 |
| 6-Person Families | 335 (3.5%) | $90,087 |
| 7+ Person Families | 181 (1.9%) | $0 |
| Total | 9,653 (100.0%) | $69,689 |
Family Income by Number of Earners in Matagorda County
The median family income in Matagorda County is $69,689, with families comprising 3+ earners (756) having the highest median family income of $121,439, while families with no earners (1,578) have the lowest median family income of $36,823, accounting for 7.8% and 16.4% of families, respectively.
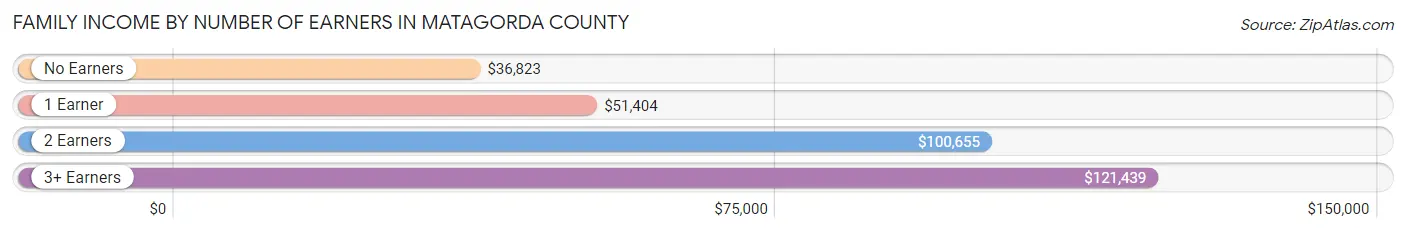
| Number of Earners | # Families | Median Income |
| No Earners | 1,578 (16.4%) | $36,823 |
| 1 Earner | 4,182 (43.3%) | $51,404 |
| 2 Earners | 3,137 (32.5%) | $100,655 |
| 3+ Earners | 756 (7.8%) | $121,439 |
| Total | 9,653 (100.0%) | $69,689 |
Household Income in Matagorda County
Household Income Brackets in Matagorda County
With 2,336 households falling in the category, the $50,000 to $74,999 income range is the most frequent in Matagorda County, accounting for 16.6% of all households. In contrast, only 633 households (4.5%) fall into the $200,000+ income bracket, making it the least populous group.
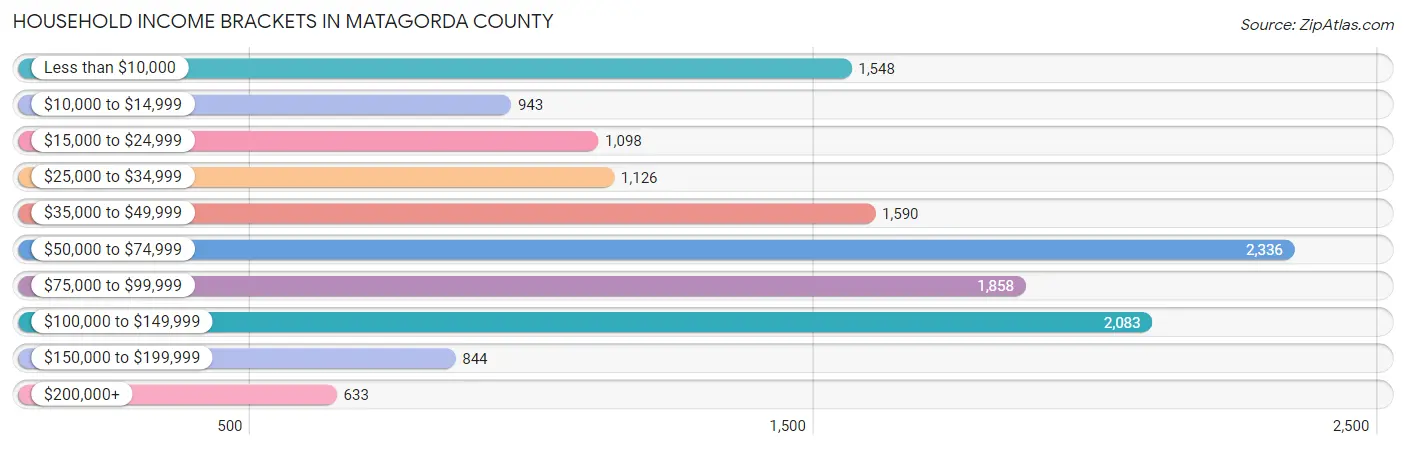
| Income Bracket | # Households | % Households |
| Less than $10,000 | 1,548 | 11.0% |
| $10,000 to $14,999 | 943 | 6.7% |
| $15,000 to $24,999 | 1,098 | 7.8% |
| $25,000 to $34,999 | 1,126 | 8.0% |
| $35,000 to $49,999 | 1,590 | 11.3% |
| $50,000 to $74,999 | 2,336 | 16.6% |
| $75,000 to $99,999 | 1,858 | 13.2% |
| $100,000 to $149,999 | 2,083 | 14.8% |
| $150,000 to $199,999 | 844 | 6.0% |
| $200,000+ | 633 | 4.5% |
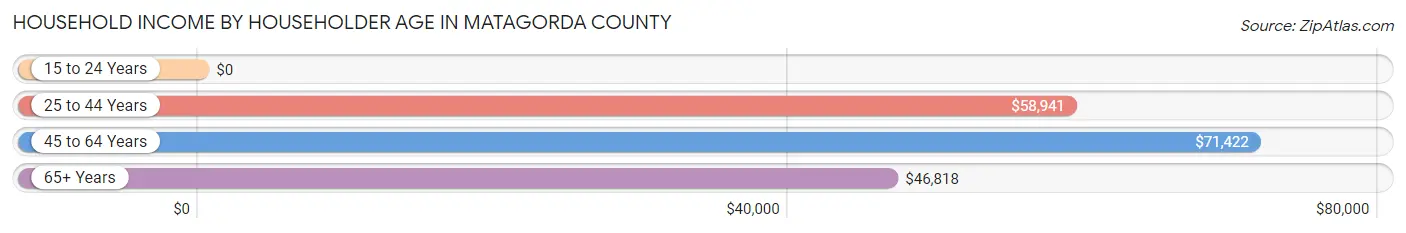
Household Income by Householder Age in Matagorda County
The median household income in Matagorda County is $56,412, with the highest median household income of $71,422 found in the 45 to 64 years age bracket for the primary householder. A total of 5,079 households (36.1%) fall into this category. Meanwhile, the 15 to 24 years age bracket for the primary householder has the lowest median household income of $0, with 465 households (3.3%) in this group.
| Income Bracket | # Households | Median Income |
| 15 to 24 Years | 465 (3.3%) | $0 |
| 25 to 44 Years | 4,513 (32.1%) | $58,941 |
| 45 to 64 Years | 5,079 (36.1%) | $71,422 |
| 65+ Years | 4,016 (28.5%) | $46,818 |
| Total | 14,073 (100.0%) | $56,412 |
Poverty in Matagorda County
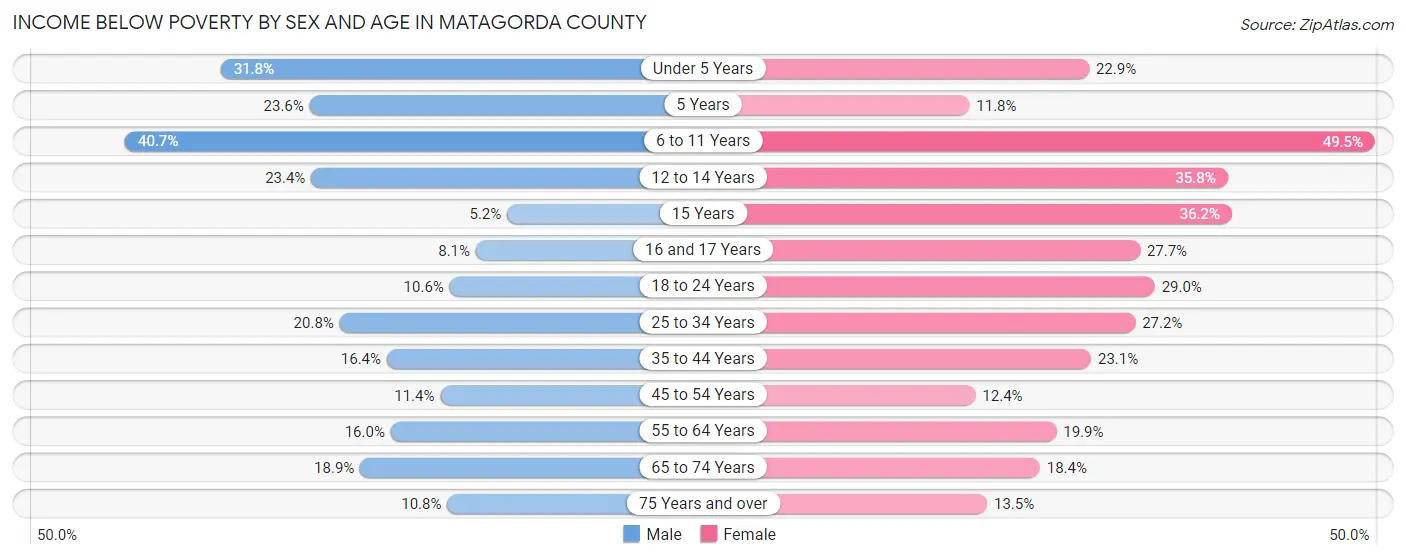
Income Below Poverty by Sex and Age in Matagorda County
With 19.2% poverty level for males and 24.4% for females among the residents of Matagorda County, 6 to 11 year old males and 6 to 11 year old females are the most vulnerable to poverty, with 665 males (40.7%) and 772 females (49.5%) in their respective age groups living below the poverty level.
| Age Bracket | Male | Female |
| Under 5 Years | 411 (31.8%) | 315 (22.9%) |
| 5 Years | 77 (23.5%) | 9 (11.8%) |
| 6 to 11 Years | 665 (40.7%) | 772 (49.5%) |
| 12 to 14 Years | 176 (23.4%) | 311 (35.8%) |
| 15 Years | 12 (5.2%) | 38 (36.2%) |
| 16 and 17 Years | 38 (8.1%) | 163 (27.7%) |
| 18 to 24 Years | 174 (10.5%) | 415 (29.0%) |
| 25 to 34 Years | 499 (20.8%) | 571 (27.2%) |
| 35 to 44 Years | 335 (16.4%) | 525 (23.1%) |
| 45 to 54 Years | 218 (11.4%) | 233 (12.4%) |
| 55 to 64 Years | 377 (16.0%) | 477 (19.9%) |
| 65 to 74 Years | 358 (18.9%) | 335 (18.4%) |
| 75 Years and over | 117 (10.8%) | 177 (13.5%) |
| Total | 3,457 (19.2%) | 4,341 (24.4%) |
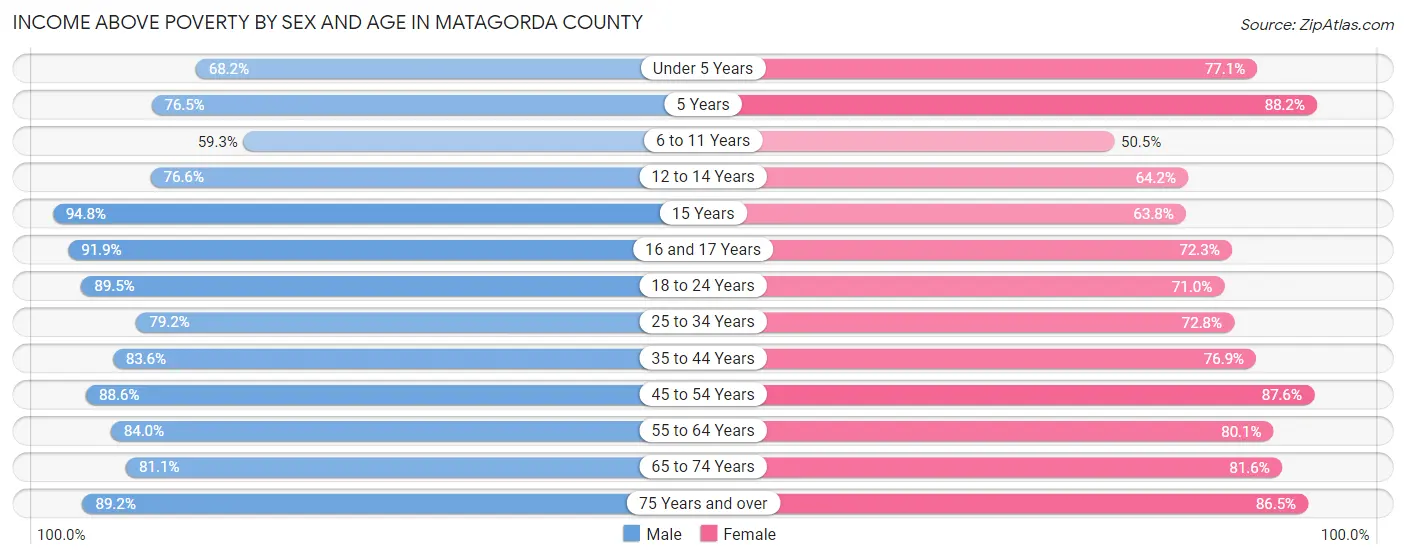
Income Above Poverty by Sex and Age in Matagorda County
According to the poverty statistics in Matagorda County, males aged 15 years and females aged 5 years are the age groups that are most secure financially, with 94.8% of males and 88.2% of females in these age groups living above the poverty line.
| Age Bracket | Male | Female |
| Under 5 Years | 882 (68.2%) | 1,058 (77.1%) |
| 5 Years | 250 (76.4%) | 67 (88.2%) |
| 6 to 11 Years | 970 (59.3%) | 789 (50.5%) |
| 12 to 14 Years | 576 (76.6%) | 558 (64.2%) |
| 15 Years | 218 (94.8%) | 67 (63.8%) |
| 16 and 17 Years | 430 (91.9%) | 426 (72.3%) |
| 18 to 24 Years | 1,475 (89.4%) | 1,014 (71.0%) |
| 25 to 34 Years | 1,905 (79.2%) | 1,526 (72.8%) |
| 35 to 44 Years | 1,710 (83.6%) | 1,745 (76.9%) |
| 45 to 54 Years | 1,691 (88.6%) | 1,646 (87.6%) |
| 55 to 64 Years | 1,977 (84.0%) | 1,919 (80.1%) |
| 65 to 74 Years | 1,540 (81.1%) | 1,488 (81.6%) |
| 75 Years and over | 969 (89.2%) | 1,136 (86.5%) |
| Total | 14,593 (80.8%) | 13,439 (75.6%) |
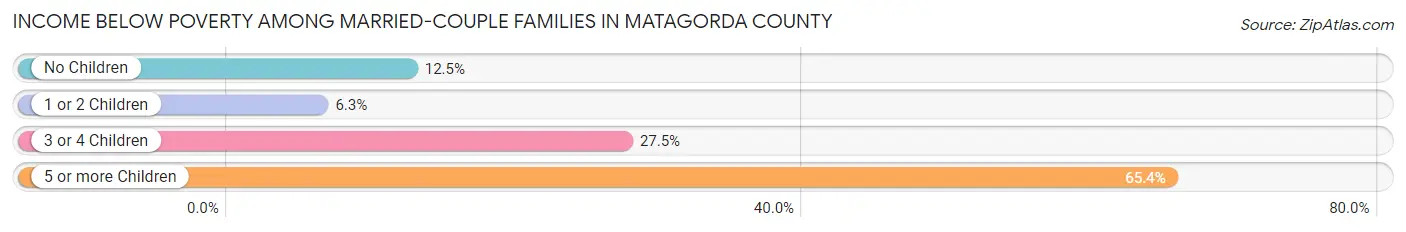
Income Below Poverty Among Married-Couple Families in Matagorda County
The poverty statistics for married-couple families in Matagorda County show that 12.6% or 877 of the total 6,942 families live below the poverty line. Families with 5 or more children have the highest poverty rate of 65.4%, comprising of 53 families. On the other hand, families with 1 or 2 children have the lowest poverty rate of 6.3%, which includes 122 families.
| Children | Above Poverty | Below Poverty |
| No Children | 3,808 (87.5%) | 545 (12.5%) |
| 1 or 2 Children | 1,815 (93.7%) | 122 (6.3%) |
| 3 or 4 Children | 414 (72.5%) | 157 (27.5%) |
| 5 or more Children | 28 (34.6%) | 53 (65.4%) |
| Total | 6,065 (87.4%) | 877 (12.6%) |
Income Below Poverty Among Single-Parent Households in Matagorda County
According to the poverty data in Matagorda County, 15.3% or 134 single-father households and 43.5% or 798 single-mother households are living below the poverty line. Among single-father households, those with 3 or 4 children have the highest poverty rate, with 79 households (37.3%) experiencing poverty. Likewise, among single-mother households, those with 5 or more children have the highest poverty rate, with 39 households (100.0%) falling below the poverty line.
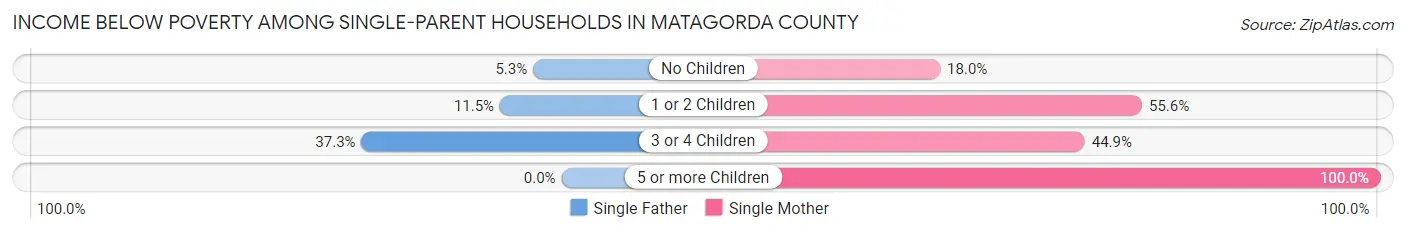
| Children | Single Father | Single Mother |
| No Children | 18 (5.3%) | 101 (18.0%) |
| 1 or 2 Children | 37 (11.5%) | 539 (55.6%) |
| 3 or 4 Children | 79 (37.3%) | 119 (44.9%) |
| 5 or more Children | 0 (0.0%) | 39 (100.0%) |
| Total | 134 (15.3%) | 798 (43.5%) |
Income Below Poverty Among Married-Couple vs Single-Parent Households in Matagorda County
The poverty data for Matagorda County shows that 877 of the married-couple family households (12.6%) and 932 of the single-parent households (34.4%) are living below the poverty level. Within the married-couple family households, those with 5 or more children have the highest poverty rate, with 53 households (65.4%) falling below the poverty line. Among the single-parent households, those with 5 or more children have the highest poverty rate, with 39 household (100.0%) living below poverty.
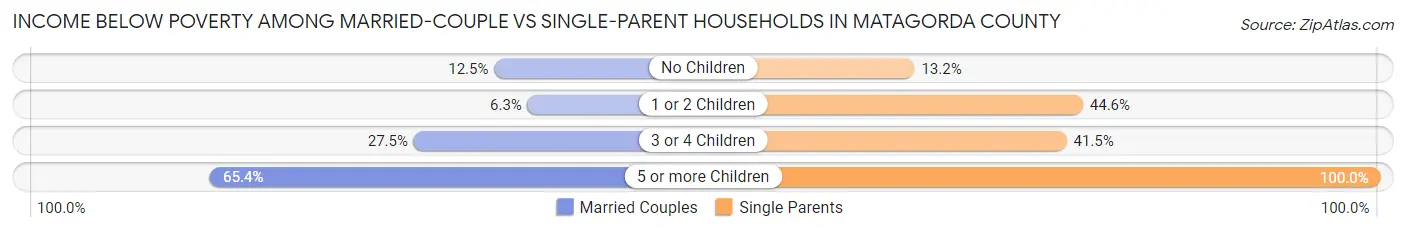
| Children | Married-Couple Families | Single-Parent Households |
| No Children | 545 (12.5%) | 119 (13.2%) |
| 1 or 2 Children | 122 (6.3%) | 576 (44.6%) |
| 3 or 4 Children | 157 (27.5%) | 198 (41.5%) |
| 5 or more Children | 53 (65.4%) | 39 (100.0%) |
| Total | 877 (12.6%) | 932 (34.4%) |
Race in Matagorda County
The most populous races in Matagorda County are White / Caucasian (20,954 | 57.8%), Hispanic or Latino (16,025 | 44.2%), and Some other Race (6,637 | 18.3%).
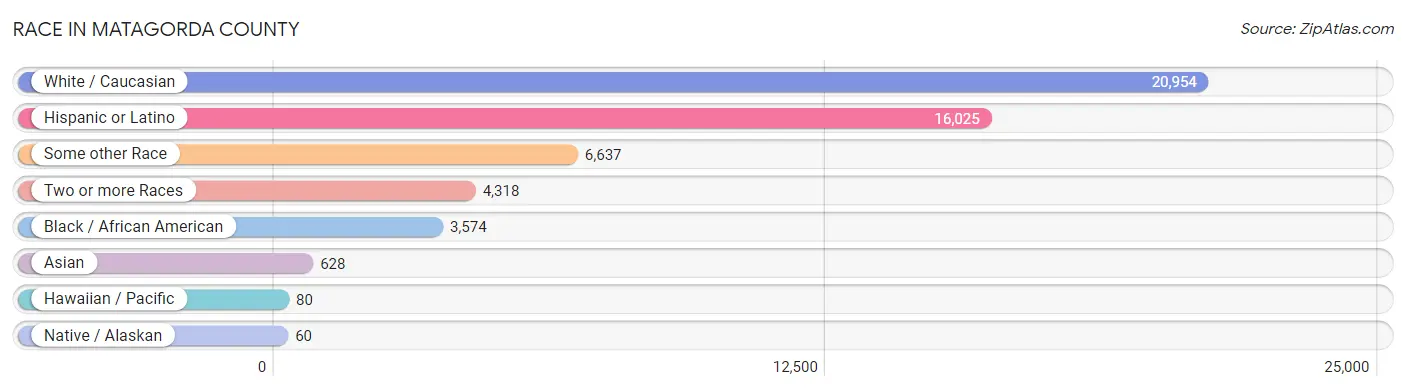
| Race | # Population | % Population |
| Asian | 628 | 1.7% |
| Black / African American | 3,574 | 9.9% |
| Hawaiian / Pacific | 80 | 0.2% |
| Hispanic or Latino | 16,025 | 44.2% |
| Native / Alaskan | 60 | 0.2% |
| White / Caucasian | 20,954 | 57.8% |
| Two or more Races | 4,318 | 11.9% |
| Some other Race | 6,637 | 18.3% |
| Total | 36,251 | 100.0% |
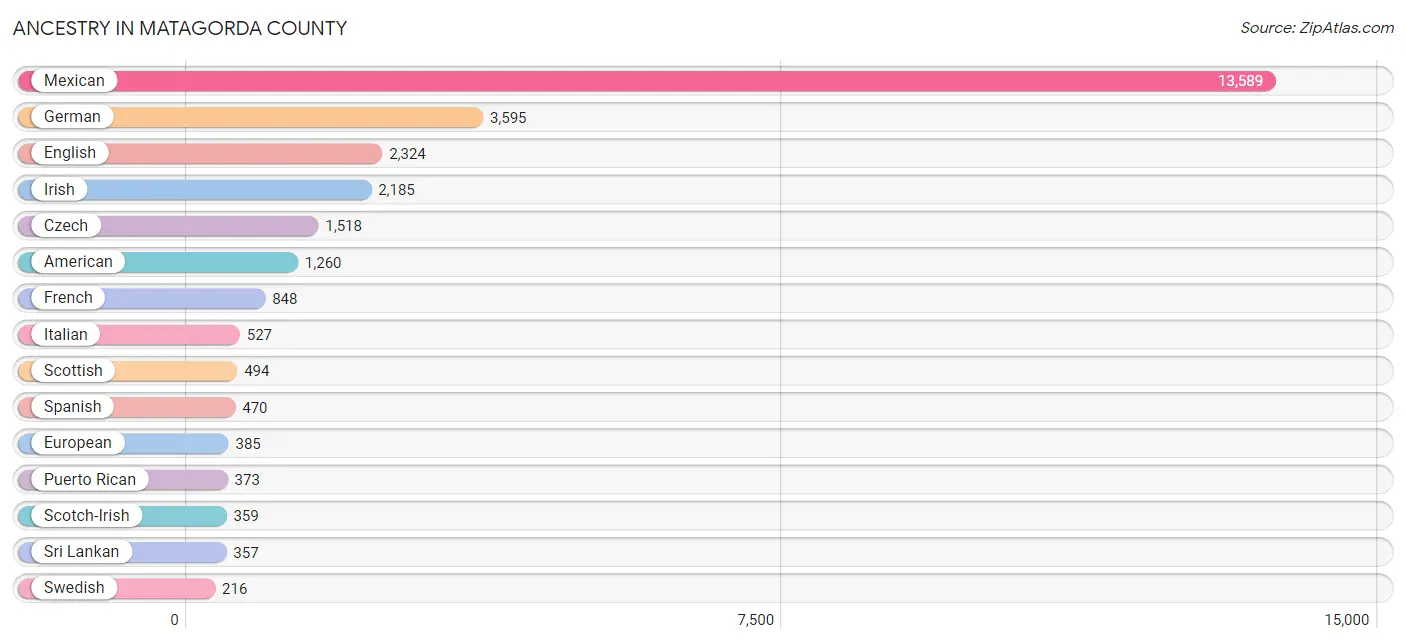
Ancestry in Matagorda County
The most populous ancestries reported in Matagorda County are Mexican (13,589 | 37.5%), German (3,595 | 9.9%), English (2,324 | 6.4%), Irish (2,185 | 6.0%), and Czech (1,518 | 4.2%), together accounting for 64.0% of all Matagorda County residents.
| Ancestry | # Population | % Population |
| African | 13 | 0.0% |
| American | 1,260 | 3.5% |
| Arab | 24 | 0.1% |
| Argentinean | 48 | 0.1% |
| Austrian | 50 | 0.1% |
| Bhutanese | 8 | 0.0% |
| British | 68 | 0.2% |
| Burmese | 15 | 0.0% |
| Cajun | 15 | 0.0% |
| Central American | 157 | 0.4% |
| Cherokee | 79 | 0.2% |
| Choctaw | 36 | 0.1% |
| Costa Rican | 13 | 0.0% |
| Cuban | 15 | 0.0% |
| Czech | 1,518 | 4.2% |
| Czechoslovakian | 4 | 0.0% |
| Danish | 130 | 0.4% |
| Dutch | 122 | 0.3% |
| Eastern European | 6 | 0.0% |
| English | 2,324 | 6.4% |
| European | 385 | 1.1% |
| Filipino | 55 | 0.2% |
| Finnish | 67 | 0.2% |
| French | 848 | 2.3% |
| French Canadian | 60 | 0.2% |
| German | 3,595 | 9.9% |
| Greek | 71 | 0.2% |
| Guamanian / Chamorro | 11 | 0.0% |
| Honduran | 17 | 0.1% |
| Icelander | 3 | 0.0% |
| Irish | 2,185 | 6.0% |
| Italian | 527 | 1.5% |
| Korean | 94 | 0.3% |
| Latvian | 103 | 0.3% |
| Lebanese | 12 | 0.0% |
| Mexican | 13,589 | 37.5% |
| Mexican American Indian | 85 | 0.2% |
| Native Hawaiian | 69 | 0.2% |
| Nigerian | 27 | 0.1% |
| Northern European | 51 | 0.1% |
| Norwegian | 53 | 0.2% |
| Panamanian | 30 | 0.1% |
| Polish | 170 | 0.5% |
| Puerto Rican | 373 | 1.0% |
| Salvadoran | 97 | 0.3% |
| Scandinavian | 31 | 0.1% |
| Scotch-Irish | 359 | 1.0% |
| Scottish | 494 | 1.4% |
| South African | 66 | 0.2% |
| South American | 64 | 0.2% |
| South American Indian | 16 | 0.0% |
| Spaniard | 124 | 0.3% |
| Spanish | 470 | 1.3% |
| Sri Lankan | 357 | 1.0% |
| Subsaharan African | 162 | 0.4% |
| Swedish | 216 | 0.6% |
| Syrian | 7 | 0.0% |
| Thai | 10 | 0.0% |
| Ukrainian | 8 | 0.0% |
| Venezuelan | 16 | 0.0% |
| Welsh | 66 | 0.2% | View All 61 Rows |
Immigrants in Matagorda County
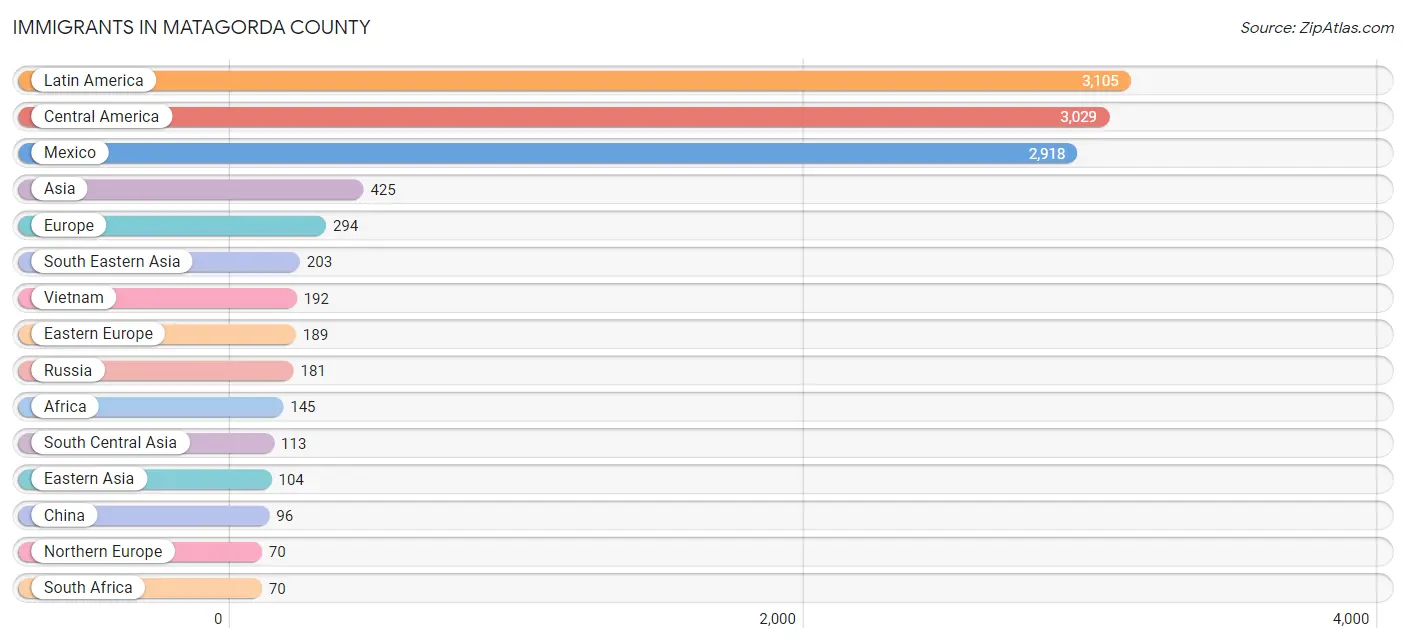
The most numerous immigrant groups reported in Matagorda County came from Latin America (3,105 | 8.6%), Central America (3,029 | 8.4%), Mexico (2,918 | 8.1%), Asia (425 | 1.2%), and Europe (294 | 0.8%), together accounting for 27.0% of all Matagorda County residents.
| Immigration Origin | # Population | % Population |
| Africa | 145 | 0.4% |
| Argentina | 41 | 0.1% |
| Asia | 425 | 1.2% |
| Cameroon | 56 | 0.2% |
| Caribbean | 9 | 0.0% |
| Central America | 3,029 | 8.4% |
| China | 96 | 0.3% |
| Costa Rica | 13 | 0.0% |
| Cuba | 9 | 0.0% |
| Eastern Asia | 104 | 0.3% |
| Eastern Europe | 189 | 0.5% |
| El Salvador | 47 | 0.1% |
| Europe | 294 | 0.8% |
| Germany | 6 | 0.0% |
| Guatemala | 4 | 0.0% |
| Honduras | 17 | 0.1% |
| India | 50 | 0.1% |
| Italy | 29 | 0.1% |
| Japan | 8 | 0.0% |
| Jordan | 5 | 0.0% |
| Latin America | 3,105 | 8.6% |
| Mexico | 2,918 | 8.1% |
| Middle Africa | 56 | 0.2% |
| Nigeria | 19 | 0.1% |
| Northern Europe | 70 | 0.2% |
| Norway | 20 | 0.1% |
| Pakistan | 63 | 0.2% |
| Panama | 30 | 0.1% |
| Philippines | 11 | 0.0% |
| Poland | 8 | 0.0% |
| Russia | 181 | 0.5% |
| South Africa | 70 | 0.2% |
| South America | 67 | 0.2% |
| South Central Asia | 113 | 0.3% |
| South Eastern Asia | 203 | 0.6% |
| Southern Europe | 29 | 0.1% |
| Taiwan | 55 | 0.2% |
| Venezuela | 26 | 0.1% |
| Vietnam | 192 | 0.5% |
| Western Africa | 19 | 0.1% |
| Western Asia | 5 | 0.0% |
| Western Europe | 6 | 0.0% | View All 42 Rows |
Sex and Age in Matagorda County
Sex and Age in Matagorda County
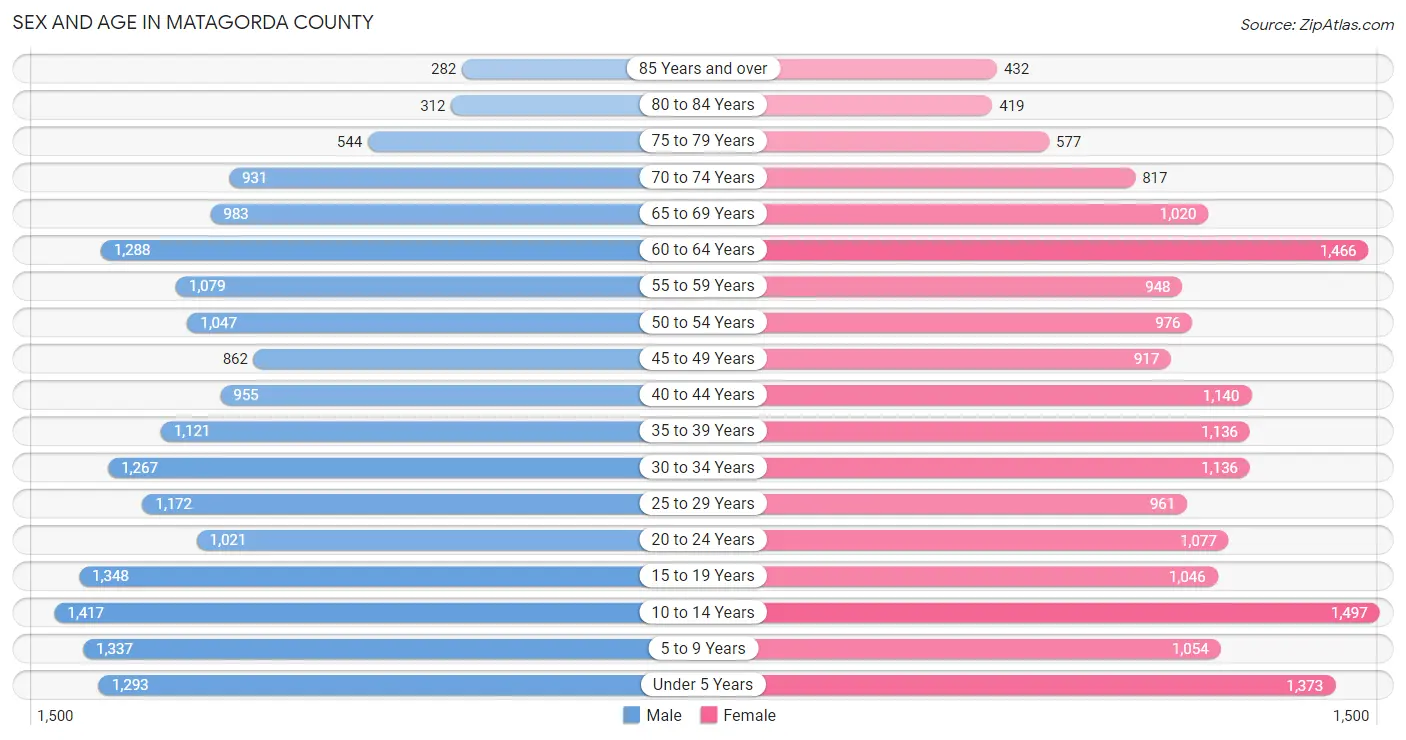
The most populous age groups in Matagorda County are 10 to 14 Years (1,417 | 7.8%) for men and 10 to 14 Years (1,497 | 8.3%) for women.
| Age Bracket | Male | Female |
| Under 5 Years | 1,293 (7.1%) | 1,373 (7.6%) |
| 5 to 9 Years | 1,337 (7.3%) | 1,054 (5.9%) |
| 10 to 14 Years | 1,417 (7.8%) | 1,497 (8.3%) |
| 15 to 19 Years | 1,348 (7.4%) | 1,046 (5.8%) |
| 20 to 24 Years | 1,021 (5.6%) | 1,077 (6.0%) |
| 25 to 29 Years | 1,172 (6.4%) | 961 (5.3%) |
| 30 to 34 Years | 1,267 (6.9%) | 1,136 (6.3%) |
| 35 to 39 Years | 1,121 (6.1%) | 1,136 (6.3%) |
| 40 to 44 Years | 955 (5.2%) | 1,140 (6.3%) |
| 45 to 49 Years | 862 (4.7%) | 917 (5.1%) |
| 50 to 54 Years | 1,047 (5.7%) | 976 (5.4%) |
| 55 to 59 Years | 1,079 (5.9%) | 948 (5.3%) |
| 60 to 64 Years | 1,288 (7.0%) | 1,466 (8.2%) |
| 65 to 69 Years | 983 (5.4%) | 1,020 (5.7%) |
| 70 to 74 Years | 931 (5.1%) | 817 (4.5%) |
| 75 to 79 Years | 544 (3.0%) | 577 (3.2%) |
| 80 to 84 Years | 312 (1.7%) | 419 (2.3%) |
| 85 Years and over | 282 (1.5%) | 432 (2.4%) |
| Total | 18,259 (100.0%) | 17,992 (100.0%) |
Families and Households in Matagorda County
Median Family Size in Matagorda County
The median family size in Matagorda County is 3.17 persons per family, with married-couple families (6,942 | 71.9%) accounting for the largest median family size of 3.21 persons per family. On the other hand, single male/father families (875 | 9.1%) represent the smallest median family size with 2.86 persons per family.

| Family Type | # Families | Family Size |
| Married-Couple | 6,942 (71.9%) | 3.21 |
| Single Male/Father | 875 (9.1%) | 2.86 |
| Single Female/Mother | 1,836 (19.0%) | 3.18 |
| Total Families | 9,653 (100.0%) | 3.17 |
Median Household Size in Matagorda County
The median household size in Matagorda County is 2.55 persons per household, with single female/mother households (1,836 | 13.1%) accounting for the largest median household size of 3.4 persons per household. non-family households (4,420 | 31.4%) represent the smallest median household size with 1.06 persons per household.

| Household Type | # Households | Household Size |
| Married-Couple | 6,942 (49.3%) | 3.22 |
| Single Male/Father | 875 (6.2%) | 3.04 |
| Single Female/Mother | 1,836 (13.1%) | 3.40 |
| Non-family | 4,420 (31.4%) | 1.06 |
| Total Households | 14,073 (100.0%) | 2.55 |
Household Size by Marriage Status in Matagorda County
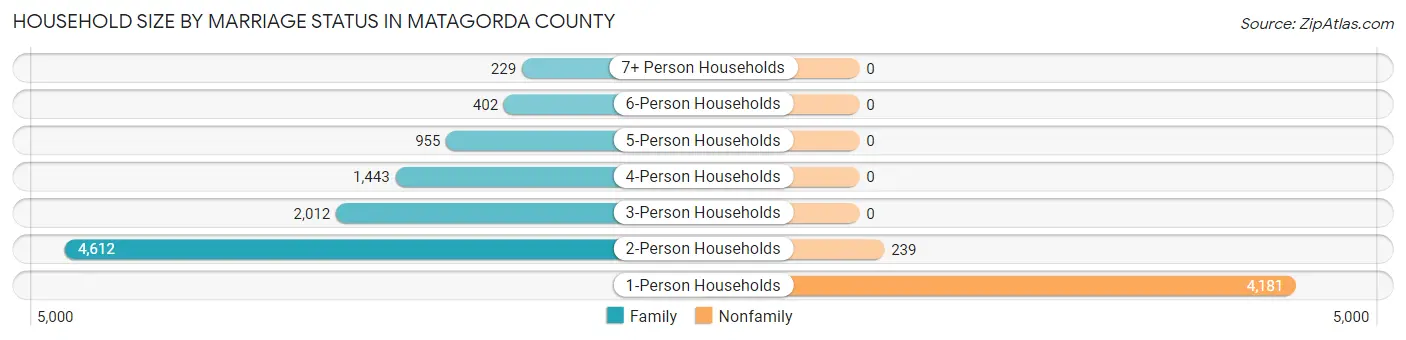
Out of a total of 14,073 households in Matagorda County, 9,653 (68.6%) are family households, while 4,420 (31.4%) are nonfamily households. The most numerous type of family households are 2-person households, comprising 4,612, and the most common type of nonfamily households are 1-person households, comprising 4,181.
| Household Size | Family Households | Nonfamily Households |
| 1-Person Households | - | 4,181 (29.7%) |
| 2-Person Households | 4,612 (32.8%) | 239 (1.7%) |
| 3-Person Households | 2,012 (14.3%) | 0 (0.0%) |
| 4-Person Households | 1,443 (10.2%) | 0 (0.0%) |
| 5-Person Households | 955 (6.8%) | 0 (0.0%) |
| 6-Person Households | 402 (2.9%) | 0 (0.0%) |
| 7+ Person Households | 229 (1.6%) | 0 (0.0%) |
| Total | 9,653 (68.6%) | 4,420 (31.4%) |
Female Fertility in Matagorda County
Fertility by Age in Matagorda County
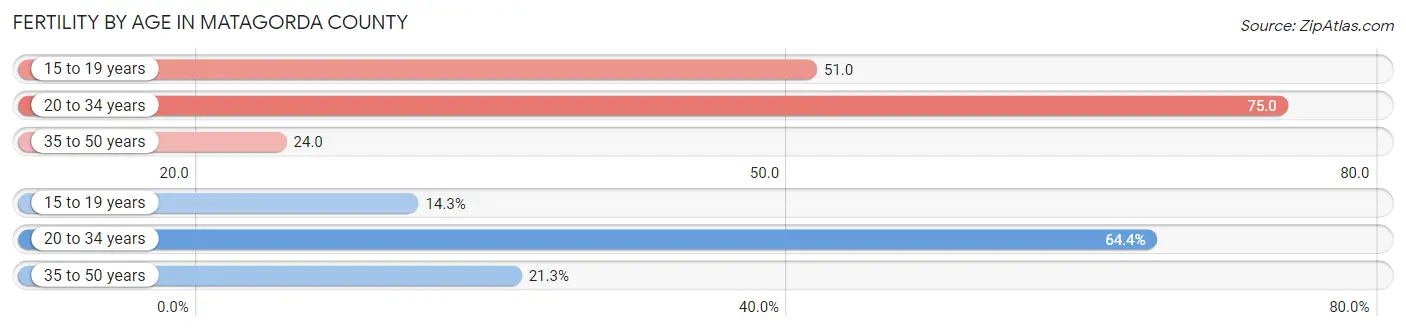
Average fertility rate in Matagorda County is 49.0 births per 1,000 women. Women in the age bracket of 20 to 34 years have the highest fertility rate with 75.0 births per 1,000 women. Women in the age bracket of 20 to 34 years acount for 64.4% of all women with births.
| Age Bracket | Women with Births | Births / 1,000 Women |
| 15 to 19 years | 53 (14.3%) | 51.0 |
| 20 to 34 years | 239 (64.4%) | 75.0 |
| 35 to 50 years | 79 (21.3%) | 24.0 |
| Total | 371 (100.0%) | 49.0 |
Fertility by Age by Marriage Status in Matagorda County
50.9% of women with births (371) in Matagorda County are married. The highest percentage of unmarried women with births falls into 15 to 19 years age bracket with 100.0% of them unmarried at the time of birth, while the lowest percentage of unmarried women with births belong to 35 to 50 years age bracket with 36.7% of them unmarried.
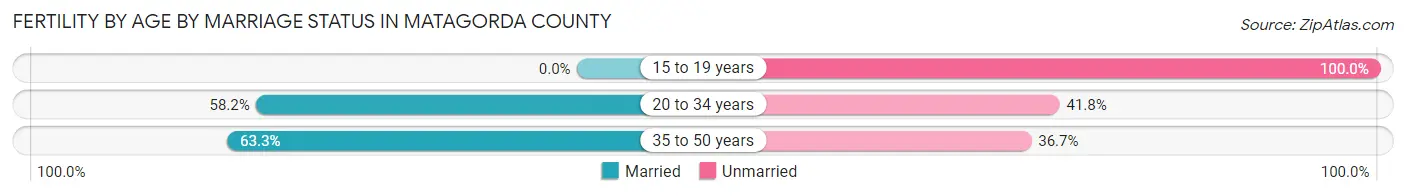
| Age Bracket | Married | Unmarried |
| 15 to 19 years | 0 (0.0%) | 53 (100.0%) |
| 20 to 34 years | 139 (58.2%) | 100 (41.8%) |
| 35 to 50 years | 50 (63.3%) | 29 (36.7%) |
| Total | 189 (50.9%) | 182 (49.1%) |
Fertility by Education in Matagorda County
Average fertility rate in Matagorda County is 49.0 births per 1,000 women. Women with the education attainment of bachelor's degree have the highest fertility rate of 90.0 births per 1,000 women, while women with the education attainment of college or associate's degree have the lowest fertility at 25.0 births per 1,000 women. Women with the education attainment of high school diploma represent 33.2% of all women with births.
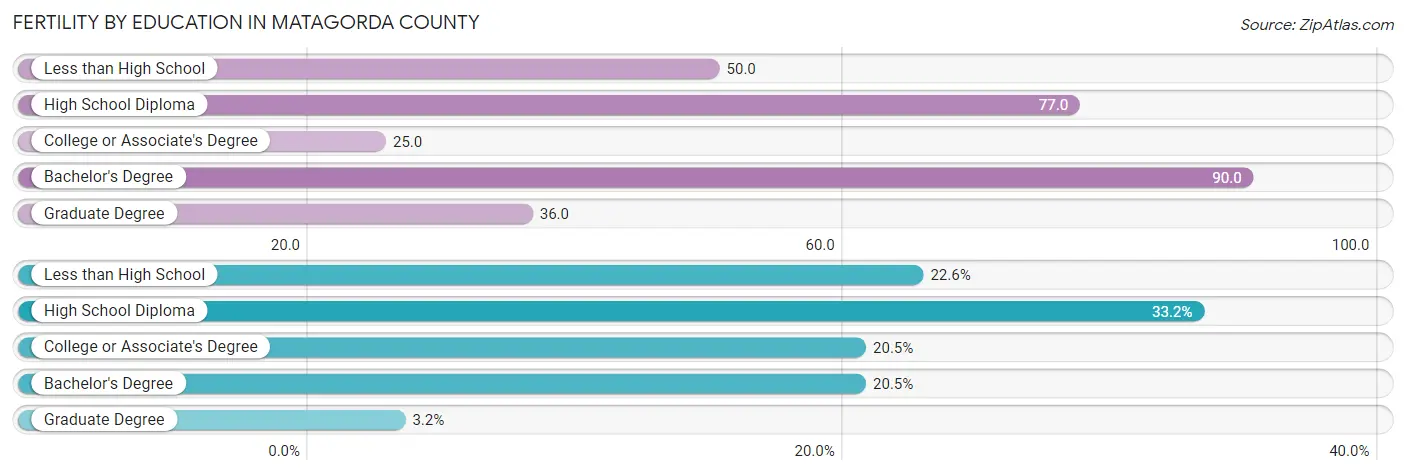
| Educational Attainment | Women with Births | Births / 1,000 Women |
| Less than High School | 84 (22.6%) | 50.0 |
| High School Diploma | 123 (33.2%) | 77.0 |
| College or Associate's Degree | 76 (20.5%) | 25.0 |
| Bachelor's Degree | 76 (20.5%) | 90.0 |
| Graduate Degree | 12 (3.2%) | 36.0 |
| Total | 371 (100.0%) | 49.0 |
Fertility by Education by Marriage Status in Matagorda County
49.1% of women with births in Matagorda County are unmarried. Women with the educational attainment of bachelor's degree are most likely to be married with 100.0% of them married at childbirth, while women with the educational attainment of less than high school are least likely to be married with 100.0% of them unmarried at childbirth.
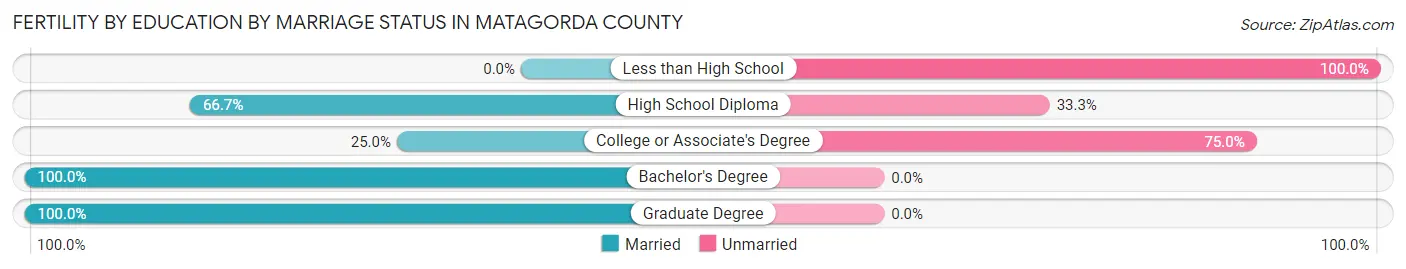
| Educational Attainment | Married | Unmarried |
| Less than High School | 0 (0.0%) | 84 (100.0%) |
| High School Diploma | 82 (66.7%) | 41 (33.3%) |
| College or Associate's Degree | 19 (25.0%) | 57 (75.0%) |
| Bachelor's Degree | 76 (100.0%) | 0 (0.0%) |
| Graduate Degree | 12 (100.0%) | 0 (0.0%) |
| Total | 189 (50.9%) | 182 (49.1%) |
Employment Characteristics in Matagorda County
Employment by Class of Employer in Matagorda County
Among the 14,742 employed individuals in Matagorda County, private company employees (10,414 | 70.6%), not-for-profit organizations (1,210 | 8.2%), and local government employees (1,173 | 8.0%) make up the most common classes of employment.
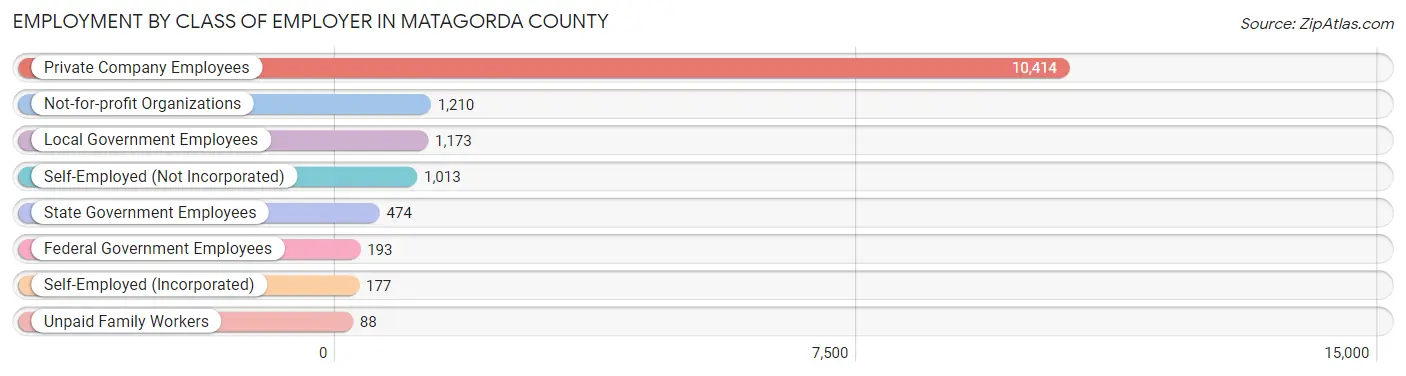
| Employer Class | # Employees | % Employees |
| Private Company Employees | 10,414 | 70.6% |
| Self-Employed (Incorporated) | 177 | 1.2% |
| Self-Employed (Not Incorporated) | 1,013 | 6.9% |
| Not-for-profit Organizations | 1,210 | 8.2% |
| Local Government Employees | 1,173 | 8.0% |
| State Government Employees | 474 | 3.2% |
| Federal Government Employees | 193 | 1.3% |
| Unpaid Family Workers | 88 | 0.6% |
| Total | 14,742 | 100.0% |
Employment Status by Age in Matagorda County
According to the labor force statistics for Matagorda County, out of the total population over 16 years of age (27,944), 57.2% or 15,984 individuals are in the labor force, with 6.7% or 1,071 of them unemployed. The age group with the highest labor force participation rate is 30 to 34 years, with 81.9% or 1,968 individuals in the labor force. Within the labor force, the 60 to 64 years age range has the highest percentage of unemployed individuals, with 11.1% or 159 of them being unemployed.
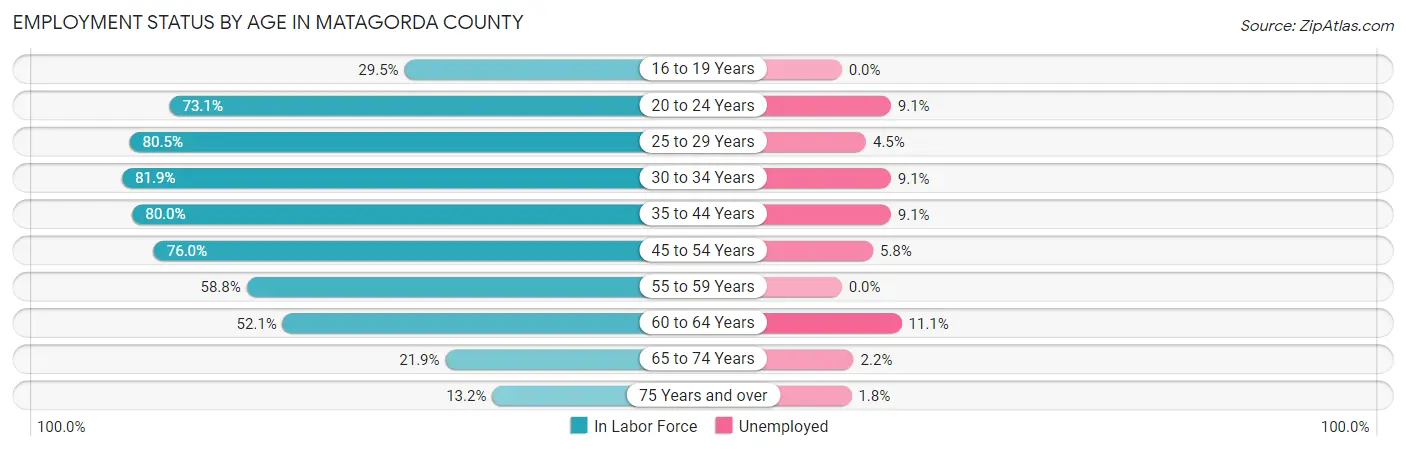
| Age Bracket | In Labor Force | Unemployed |
| 16 to 19 Years | 607 (29.5%) | 0 (0.0%) |
| 20 to 24 Years | 1,534 (73.1%) | 140 (9.1%) |
| 25 to 29 Years | 1,717 (80.5%) | 77 (4.5%) |
| 30 to 34 Years | 1,968 (81.9%) | 179 (9.1%) |
| 35 to 44 Years | 3,482 (80.0%) | 317 (9.1%) |
| 45 to 54 Years | 2,890 (76.0%) | 168 (5.8%) |
| 55 to 59 Years | 1,192 (58.8%) | 0 (0.0%) |
| 60 to 64 Years | 1,435 (52.1%) | 159 (11.1%) |
| 65 to 74 Years | 821 (21.9%) | 18 (2.2%) |
| 75 Years and over | 339 (13.2%) | 6 (1.8%) |
| Total | 15,984 (57.2%) | 1,071 (6.7%) |
Employment Status by Educational Attainment in Matagorda County
According to labor force statistics for Matagorda County, 72.6% of individuals (12,684) out of the total population between 25 and 64 years of age (17,471) are in the labor force, with 7.1% or 901 of them being unemployed. The group with the highest labor force participation rate are those with the educational attainment of bachelor's degree or higher, with 80.2% or 2,837 individuals in the labor force. Within the labor force, individuals with less than high school education have the highest percentage of unemployment, with 8.2% or 154 of them being unemployed.
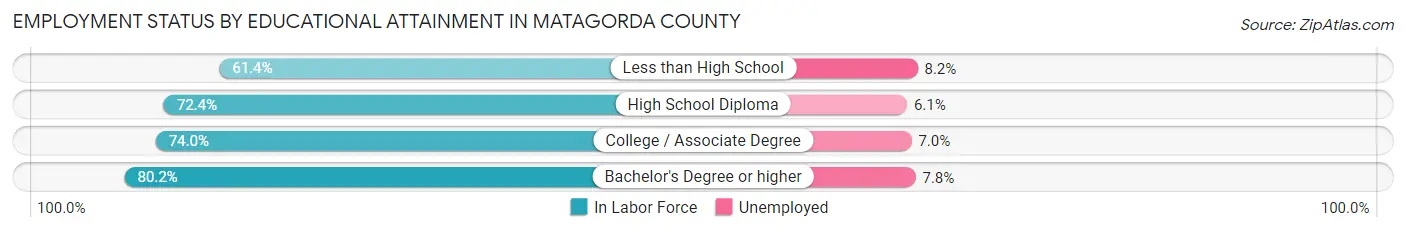
| Educational Attainment | In Labor Force | Unemployed |
| Less than High School | 1,873 (61.4%) | 250 (8.2%) |
| High School Diploma | 3,451 (72.4%) | 291 (6.1%) |
| College / Associate Degree | 4,527 (74.0%) | 428 (7.0%) |
| Bachelor's Degree or higher | 2,837 (80.2%) | 276 (7.8%) |
| Total | 12,684 (72.6%) | 1,240 (7.1%) |
Employment Occupations by Sex in Matagorda County
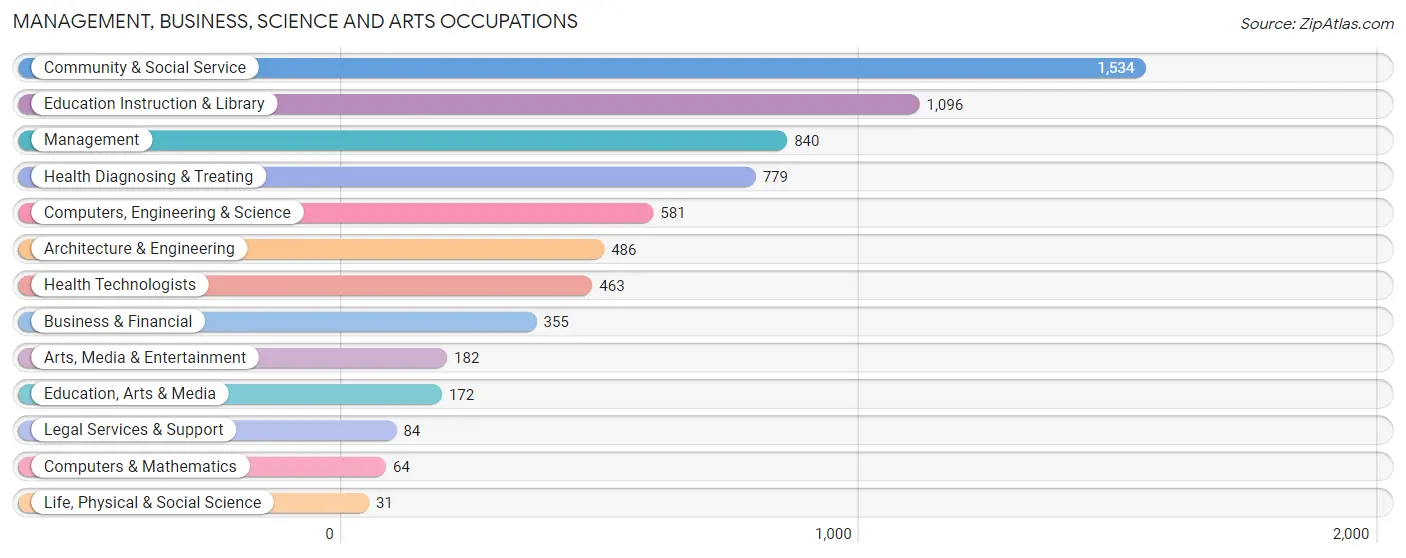
Management, Business, Science and Arts Occupations
The most common Management, Business, Science and Arts occupations in Matagorda County are Community & Social Service (1,534 | 10.3%), Education Instruction & Library (1,096 | 7.4%), Management (840 | 5.7%), Health Diagnosing & Treating (779 | 5.2%), and Computers, Engineering & Science (581 | 3.9%).
Management, Business, Science and Arts Occupations by Sex
Within the Management, Business, Science and Arts occupations in Matagorda County, the most male-oriented occupations are Computers & Mathematics (100.0%), Life, Physical & Social Science (93.5%), and Computers, Engineering & Science (81.8%), while the most female-oriented occupations are Health Technologists (95.0%), Health Diagnosing & Treating (90.9%), and Education Instruction & Library (76.1%).
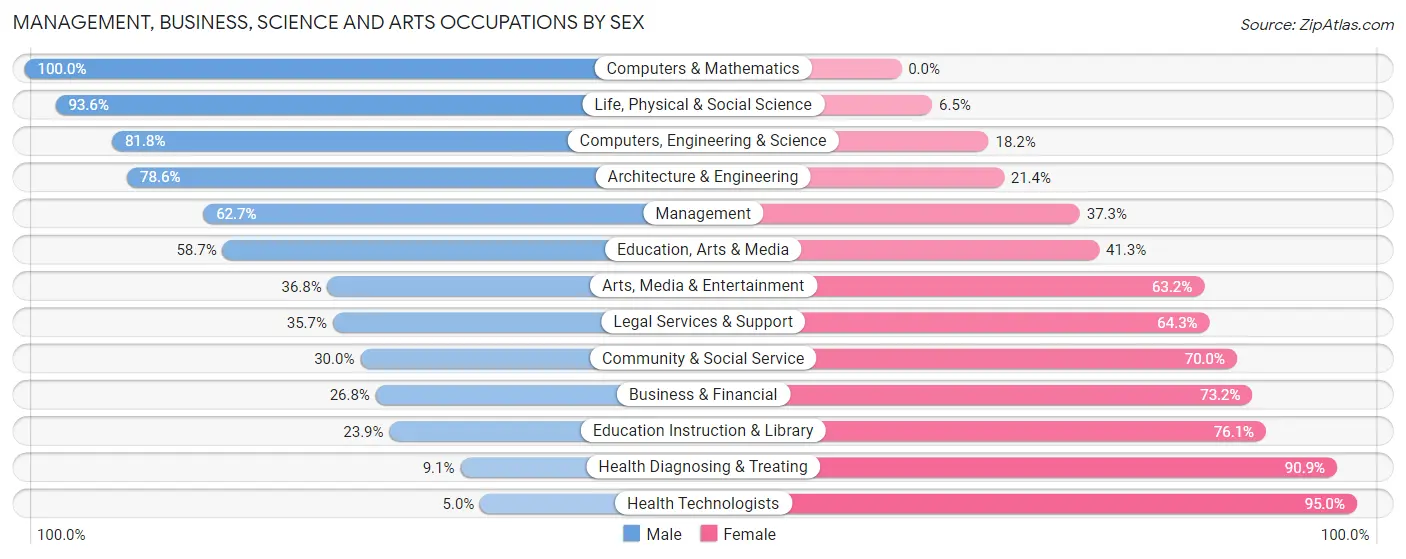
| Occupation | Male | Female |
| Management | 527 (62.7%) | 313 (37.3%) |
| Business & Financial | 95 (26.8%) | 260 (73.2%) |
| Computers, Engineering & Science | 475 (81.8%) | 106 (18.2%) |
| Computers & Mathematics | 64 (100.0%) | 0 (0.0%) |
| Architecture & Engineering | 382 (78.6%) | 104 (21.4%) |
| Life, Physical & Social Science | 29 (93.5%) | 2 (6.5%) |
| Community & Social Service | 460 (30.0%) | 1,074 (70.0%) |
| Education, Arts & Media | 101 (58.7%) | 71 (41.3%) |
| Legal Services & Support | 30 (35.7%) | 54 (64.3%) |
| Education Instruction & Library | 262 (23.9%) | 834 (76.1%) |
| Arts, Media & Entertainment | 67 (36.8%) | 115 (63.2%) |
| Health Diagnosing & Treating | 71 (9.1%) | 708 (90.9%) |
| Health Technologists | 23 (5.0%) | 440 (95.0%) |
| Total (Category) | 1,628 (39.8%) | 2,461 (60.2%) |
| Total (Overall) | 8,740 (58.9%) | 6,105 (41.1%) |
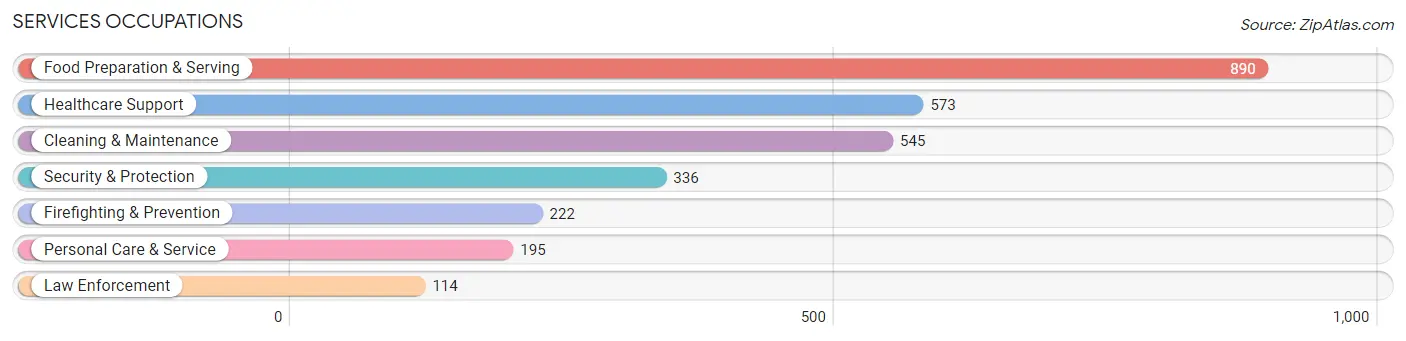
Services Occupations
The most common Services occupations in Matagorda County are Food Preparation & Serving (890 | 6.0%), Healthcare Support (573 | 3.9%), Cleaning & Maintenance (545 | 3.7%), Security & Protection (336 | 2.3%), and Firefighting & Prevention (222 | 1.5%).
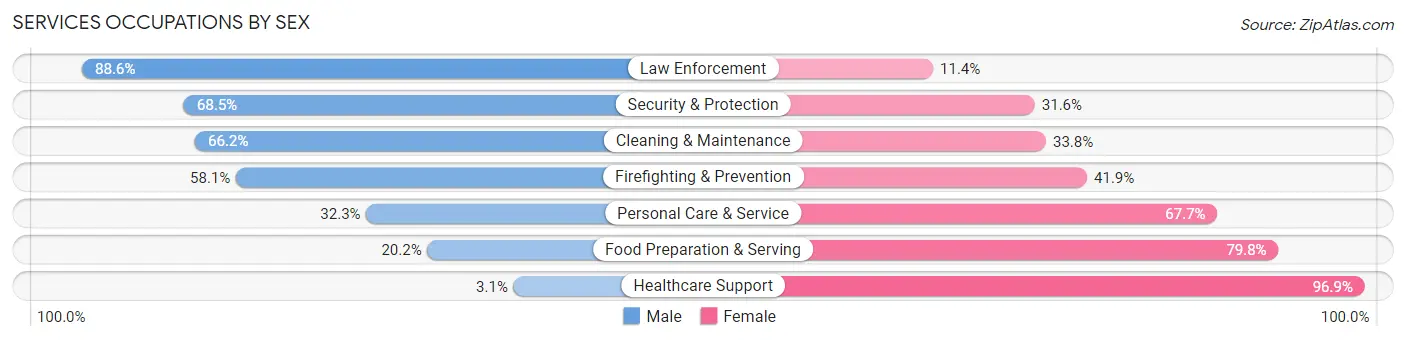
Services Occupations by Sex
Within the Services occupations in Matagorda County, the most male-oriented occupations are Law Enforcement (88.6%), Security & Protection (68.4%), and Cleaning & Maintenance (66.2%), while the most female-oriented occupations are Healthcare Support (96.9%), Food Preparation & Serving (79.8%), and Personal Care & Service (67.7%).
| Occupation | Male | Female |
| Healthcare Support | 18 (3.1%) | 555 (96.9%) |
| Security & Protection | 230 (68.4%) | 106 (31.6%) |
| Firefighting & Prevention | 129 (58.1%) | 93 (41.9%) |
| Law Enforcement | 101 (88.6%) | 13 (11.4%) |
| Food Preparation & Serving | 180 (20.2%) | 710 (79.8%) |
| Cleaning & Maintenance | 361 (66.2%) | 184 (33.8%) |
| Personal Care & Service | 63 (32.3%) | 132 (67.7%) |
| Total (Category) | 852 (33.6%) | 1,687 (66.4%) |
| Total (Overall) | 8,740 (58.9%) | 6,105 (41.1%) |
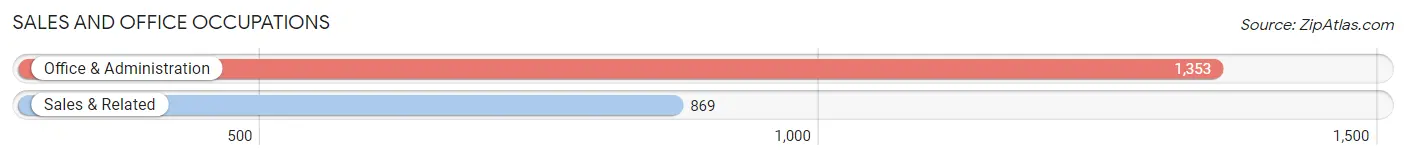
Sales and Office Occupations
The most common Sales and Office occupations in Matagorda County are Office & Administration (1,353 | 9.1%), and Sales & Related (869 | 5.9%).
Sales and Office Occupations by Sex

| Occupation | Male | Female |
| Sales & Related | 513 (59.0%) | 356 (41.0%) |
| Office & Administration | 189 (14.0%) | 1,164 (86.0%) |
| Total (Category) | 702 (31.6%) | 1,520 (68.4%) |
| Total (Overall) | 8,740 (58.9%) | 6,105 (41.1%) |
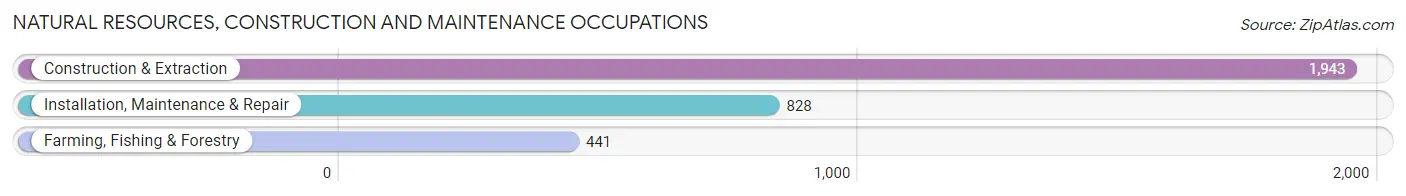
Natural Resources, Construction and Maintenance Occupations
The most common Natural Resources, Construction and Maintenance occupations in Matagorda County are Construction & Extraction (1,943 | 13.1%), Installation, Maintenance & Repair (828 | 5.6%), and Farming, Fishing & Forestry (441 | 3.0%).
Natural Resources, Construction and Maintenance Occupations by Sex
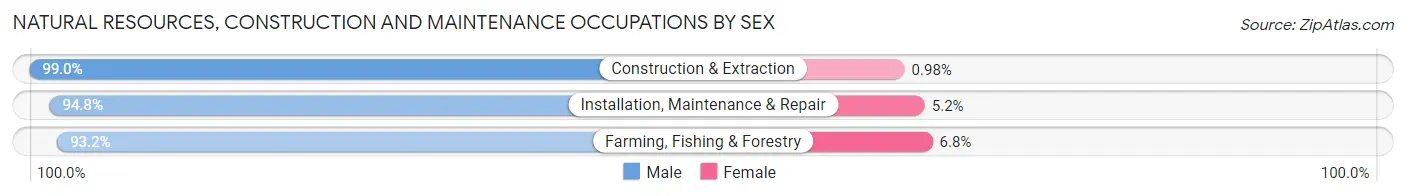
| Occupation | Male | Female |
| Farming, Fishing & Forestry | 411 (93.2%) | 30 (6.8%) |
| Construction & Extraction | 1,924 (99.0%) | 19 (1.0%) |
| Installation, Maintenance & Repair | 785 (94.8%) | 43 (5.2%) |
| Total (Category) | 3,120 (97.1%) | 92 (2.9%) |
| Total (Overall) | 8,740 (58.9%) | 6,105 (41.1%) |
Production, Transportation and Moving Occupations
The most common Production, Transportation and Moving occupations in Matagorda County are Production (1,408 | 9.5%), Material Moving (755 | 5.1%), and Transportation (620 | 4.2%).
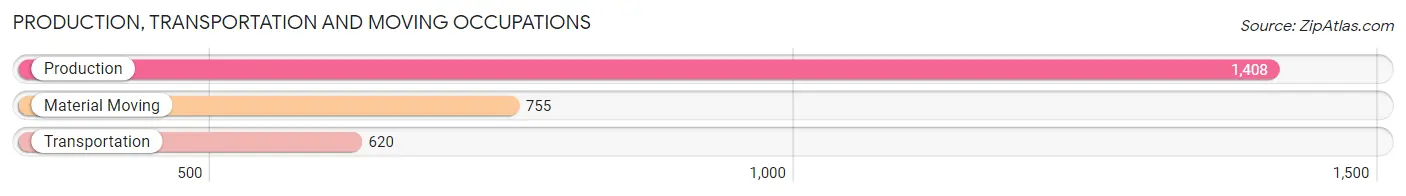
Production, Transportation and Moving Occupations by Sex

| Occupation | Male | Female |
| Production | 1,320 (93.8%) | 88 (6.2%) |
| Transportation | 454 (73.2%) | 166 (26.8%) |
| Material Moving | 664 (87.9%) | 91 (12.0%) |
| Total (Category) | 2,438 (87.6%) | 345 (12.4%) |
| Total (Overall) | 8,740 (58.9%) | 6,105 (41.1%) |
Employment Industries by Sex in Matagorda County
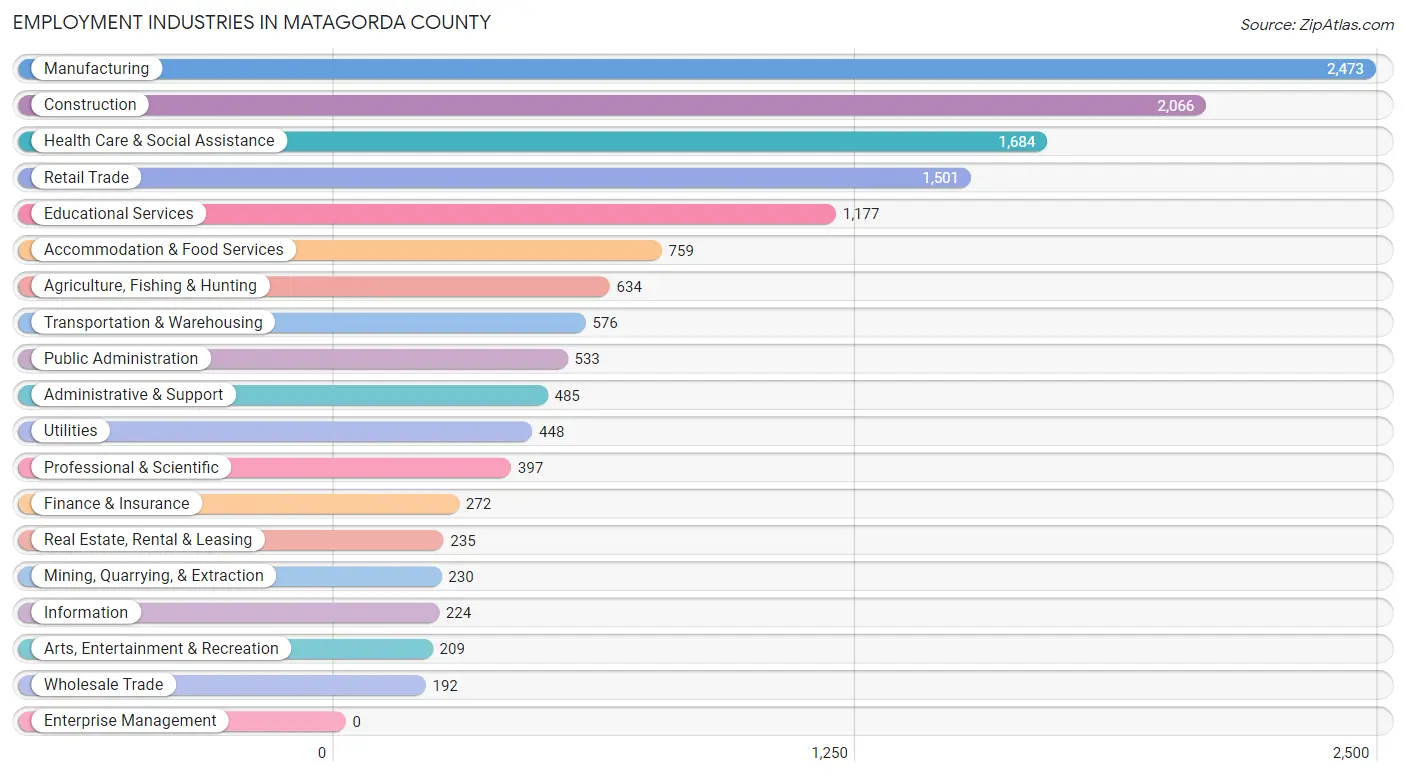
Employment Industries in Matagorda County
The major employment industries in Matagorda County include Manufacturing (2,473 | 16.7%), Construction (2,066 | 13.9%), Health Care & Social Assistance (1,684 | 11.3%), Retail Trade (1,501 | 10.1%), and Educational Services (1,177 | 7.9%).
Employment Industries by Sex in Matagorda County
The Matagorda County industries that see more men than women are Agriculture, Fishing & Hunting (99.7%), Transportation & Warehousing (94.6%), and Construction (91.3%), whereas the industries that tend to have a higher number of women are Health Care & Social Assistance (85.0%), Accommodation & Food Services (84.3%), and Educational Services (78.2%).
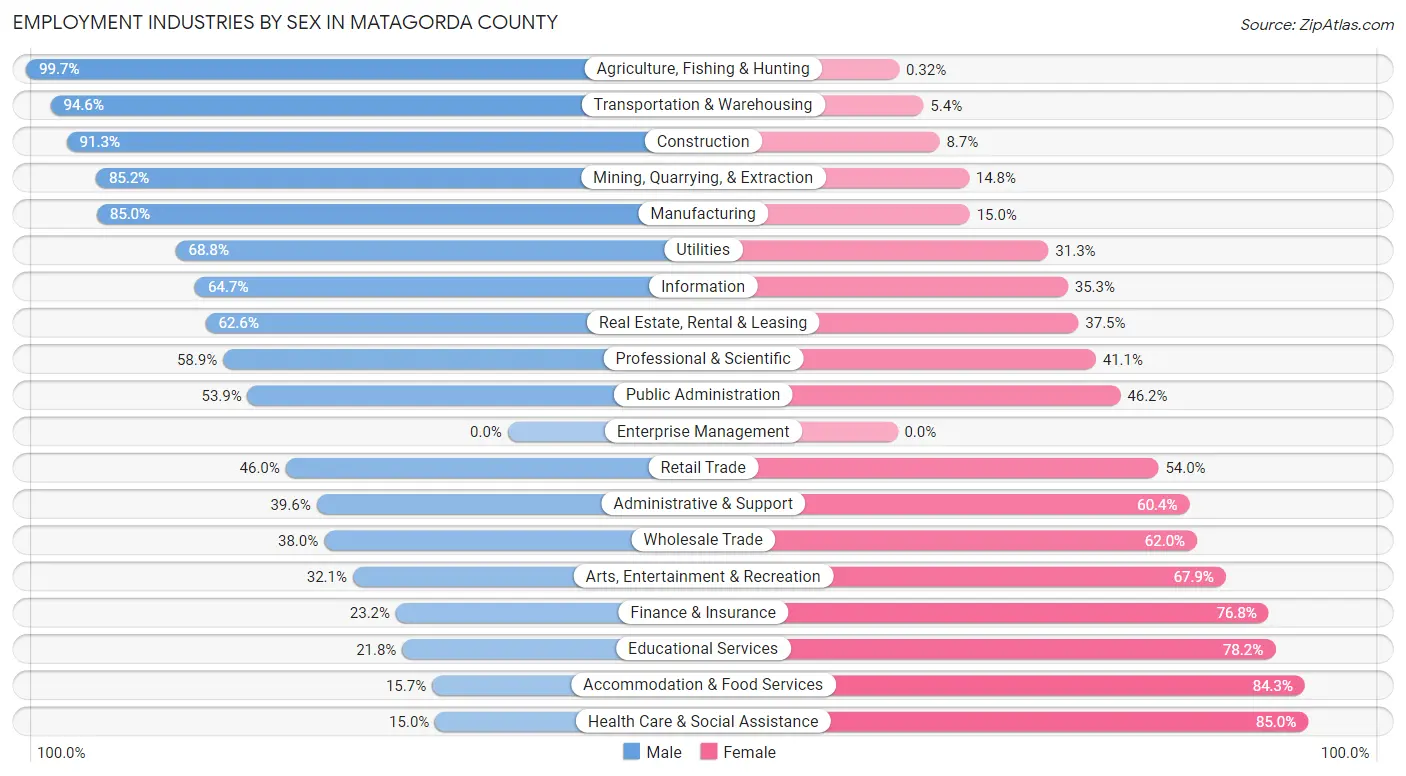
| Industry | Male | Female |
| Agriculture, Fishing & Hunting | 632 (99.7%) | 2 (0.3%) |
| Mining, Quarrying, & Extraction | 196 (85.2%) | 34 (14.8%) |
| Construction | 1,886 (91.3%) | 180 (8.7%) |
| Manufacturing | 2,103 (85.0%) | 370 (15.0%) |
| Wholesale Trade | 73 (38.0%) | 119 (62.0%) |
| Retail Trade | 690 (46.0%) | 811 (54.0%) |
| Transportation & Warehousing | 545 (94.6%) | 31 (5.4%) |
| Utilities | 308 (68.8%) | 140 (31.2%) |
| Information | 145 (64.7%) | 79 (35.3%) |
| Finance & Insurance | 63 (23.2%) | 209 (76.8%) |
| Real Estate, Rental & Leasing | 147 (62.5%) | 88 (37.4%) |
| Professional & Scientific | 234 (58.9%) | 163 (41.1%) |
| Enterprise Management | 0 (0.0%) | 0 (0.0%) |
| Administrative & Support | 192 (39.6%) | 293 (60.4%) |
| Educational Services | 257 (21.8%) | 920 (78.2%) |
| Health Care & Social Assistance | 253 (15.0%) | 1,431 (85.0%) |
| Arts, Entertainment & Recreation | 67 (32.1%) | 142 (67.9%) |
| Accommodation & Food Services | 119 (15.7%) | 640 (84.3%) |
| Public Administration | 287 (53.8%) | 246 (46.2%) |
| Total | 8,740 (58.9%) | 6,105 (41.1%) |
Education in Matagorda County
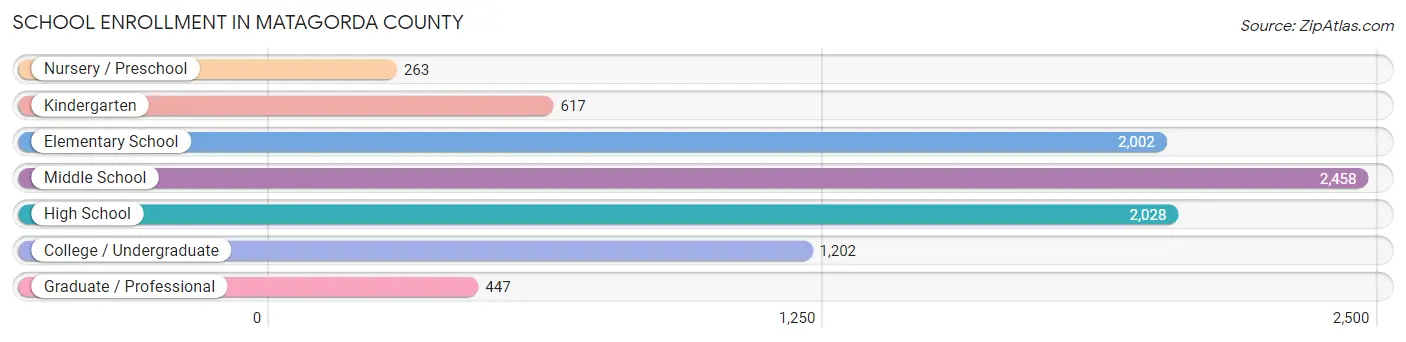
School Enrollment in Matagorda County
The most common levels of schooling among the 9,017 students in Matagorda County are middle school (2,458 | 27.3%), high school (2,028 | 22.5%), and elementary school (2,002 | 22.2%).
| School Level | # Students | % Students |
| Nursery / Preschool | 263 | 2.9% |
| Kindergarten | 617 | 6.8% |
| Elementary School | 2,002 | 22.2% |
| Middle School | 2,458 | 27.3% |
| High School | 2,028 | 22.5% |
| College / Undergraduate | 1,202 | 13.3% |
| Graduate / Professional | 447 | 5.0% |
| Total | 9,017 | 100.0% |
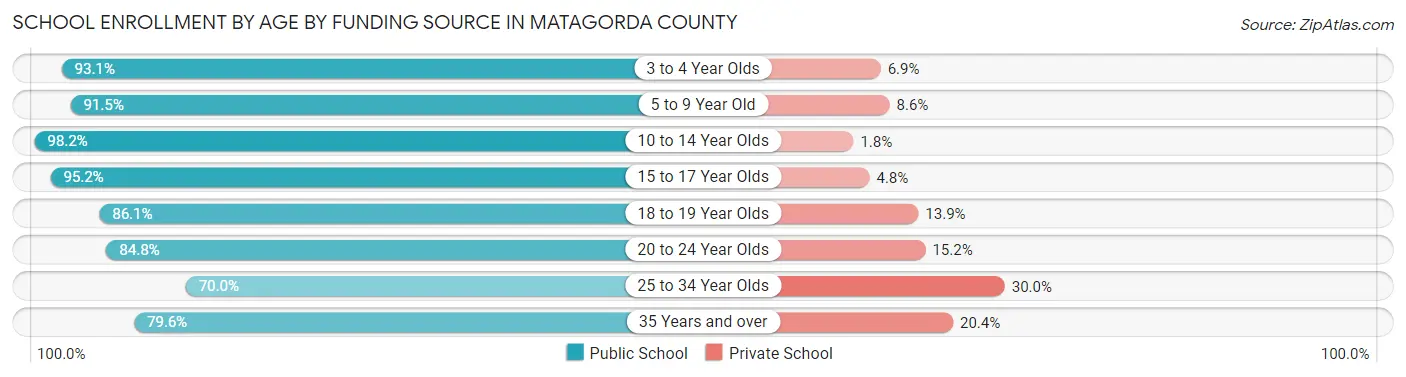
School Enrollment by Age by Funding Source in Matagorda County
Out of a total of 9,017 students who are enrolled in schools in Matagorda County, 757 (8.4%) attend a private institution, while the remaining 8,260 (91.6%) are enrolled in public schools. The age group of 25 to 34 year olds has the highest likelihood of being enrolled in private schools, with 148 (30.0% in the age bracket) enrolled. Conversely, the age group of 10 to 14 year olds has the lowest likelihood of being enrolled in a private school, with 2,836 (98.2% in the age bracket) attending a public institution.
| Age Bracket | Public School | Private School |
| 3 to 4 Year Olds | 324 (93.1%) | 24 (6.9%) |
| 5 to 9 Year Old | 2,087 (91.4%) | 195 (8.6%) |
| 10 to 14 Year Olds | 2,836 (98.2%) | 53 (1.8%) |
| 15 to 17 Year Olds | 1,264 (95.2%) | 64 (4.8%) |
| 18 to 19 Year Olds | 575 (86.1%) | 93 (13.9%) |
| 20 to 24 Year Olds | 356 (84.8%) | 64 (15.2%) |
| 25 to 34 Year Olds | 345 (70.0%) | 148 (30.0%) |
| 35 Years and over | 469 (79.6%) | 120 (20.4%) |
| Total | 8,260 (91.6%) | 757 (8.4%) |
Educational Attainment by Field of Study in Matagorda County
Education (957 | 17.7%), business (909 | 16.8%), engineering (711 | 13.2%), science & technology (591 | 11.0%), and bio, nature & agricultural (526 | 9.7%) are the most common fields of study among 5,399 individuals in Matagorda County who have obtained a bachelor's degree or higher.
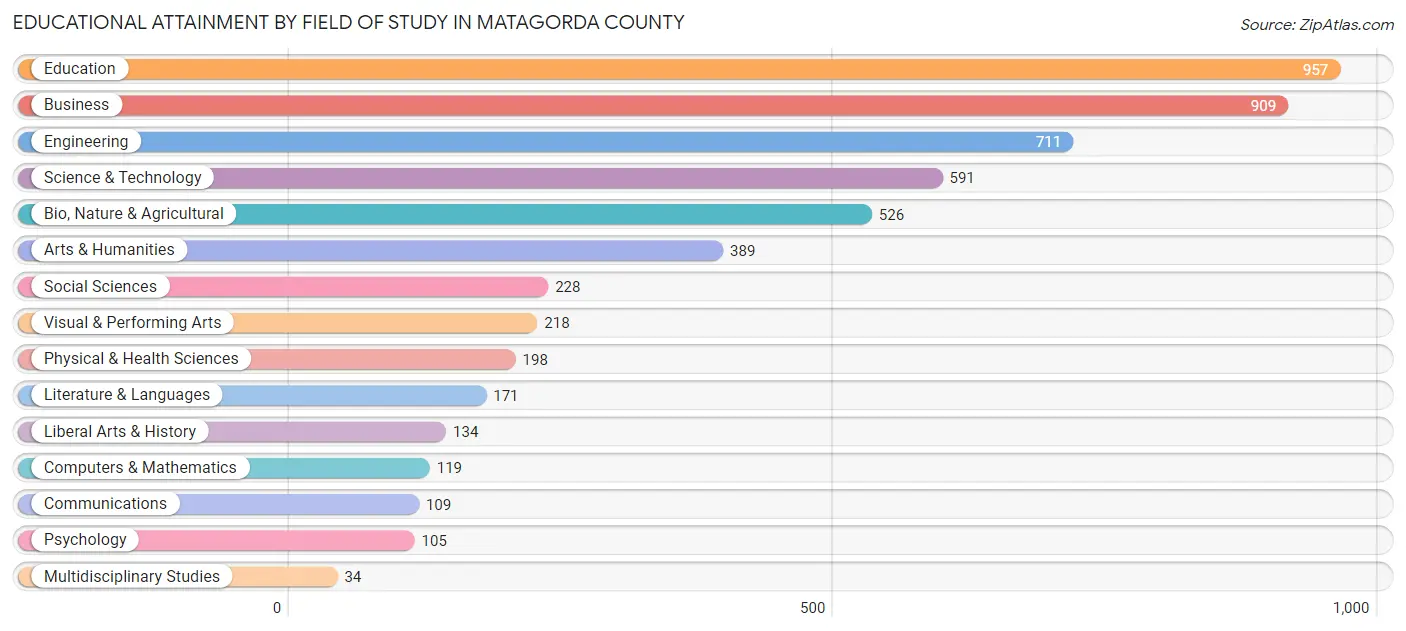
| Field of Study | # Graduates | % Graduates |
| Computers & Mathematics | 119 | 2.2% |
| Bio, Nature & Agricultural | 526 | 9.7% |
| Physical & Health Sciences | 198 | 3.7% |
| Psychology | 105 | 1.9% |
| Social Sciences | 228 | 4.2% |
| Engineering | 711 | 13.2% |
| Multidisciplinary Studies | 34 | 0.6% |
| Science & Technology | 591 | 11.0% |
| Business | 909 | 16.8% |
| Education | 957 | 17.7% |
| Literature & Languages | 171 | 3.2% |
| Liberal Arts & History | 134 | 2.5% |
| Visual & Performing Arts | 218 | 4.0% |
| Communications | 109 | 2.0% |
| Arts & Humanities | 389 | 7.2% |
| Total | 5,399 | 100.0% |
Transportation & Commute in Matagorda County
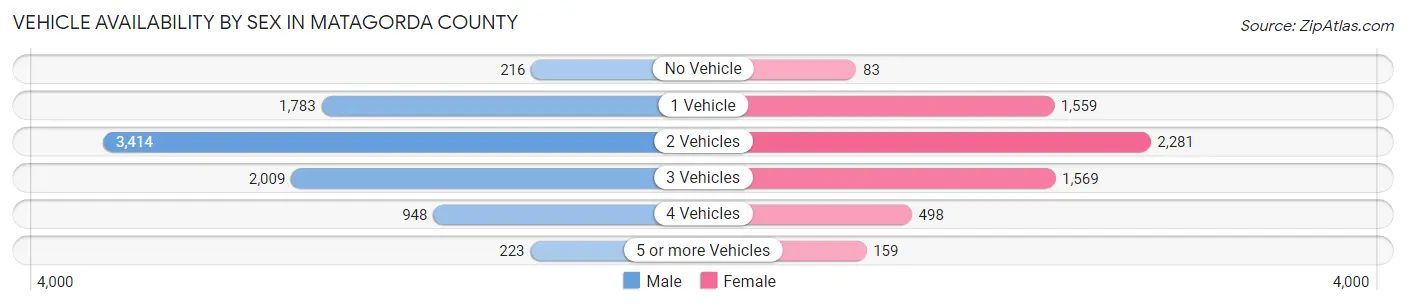
Vehicle Availability by Sex in Matagorda County
The most prevalent vehicle ownership categories in Matagorda County are males with 2 vehicles (3,414, accounting for 39.7%) and females with 2 vehicles (2,281, making up 55.5%).
| Vehicles Available | Male | Female |
| No Vehicle | 216 (2.5%) | 83 (1.3%) |
| 1 Vehicle | 1,783 (20.7%) | 1,559 (25.4%) |
| 2 Vehicles | 3,414 (39.7%) | 2,281 (37.1%) |
| 3 Vehicles | 2,009 (23.4%) | 1,569 (25.5%) |
| 4 Vehicles | 948 (11.0%) | 498 (8.1%) |
| 5 or more Vehicles | 223 (2.6%) | 159 (2.6%) |
| Total | 8,593 (100.0%) | 6,149 (100.0%) |
Commute Time in Matagorda County
The most frequently occuring commute durations in Matagorda County are 5 to 9 minutes (2,465 commuters, 17.2%), 10 to 14 minutes (2,210 commuters, 15.4%), and 15 to 19 minutes (1,837 commuters, 12.8%).
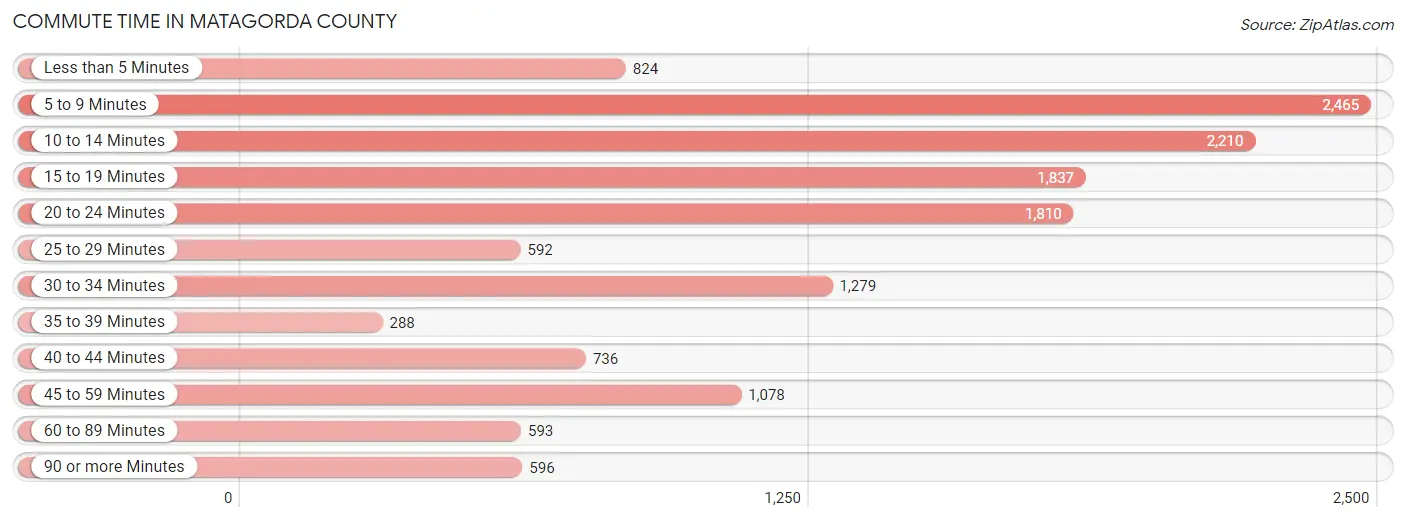
| Commute Time | # Commuters | % Commuters |
| Less than 5 Minutes | 824 | 5.8% |
| 5 to 9 Minutes | 2,465 | 17.2% |
| 10 to 14 Minutes | 2,210 | 15.4% |
| 15 to 19 Minutes | 1,837 | 12.8% |
| 20 to 24 Minutes | 1,810 | 12.7% |
| 25 to 29 Minutes | 592 | 4.1% |
| 30 to 34 Minutes | 1,279 | 8.9% |
| 35 to 39 Minutes | 288 | 2.0% |
| 40 to 44 Minutes | 736 | 5.1% |
| 45 to 59 Minutes | 1,078 | 7.5% |
| 60 to 89 Minutes | 593 | 4.1% |
| 90 or more Minutes | 596 | 4.2% |
Commute Time by Sex in Matagorda County
The most common commute times in Matagorda County are 20 to 24 minutes (1,400 commuters, 16.7%) for males and 5 to 9 minutes (1,731 commuters, 29.2%) for females.
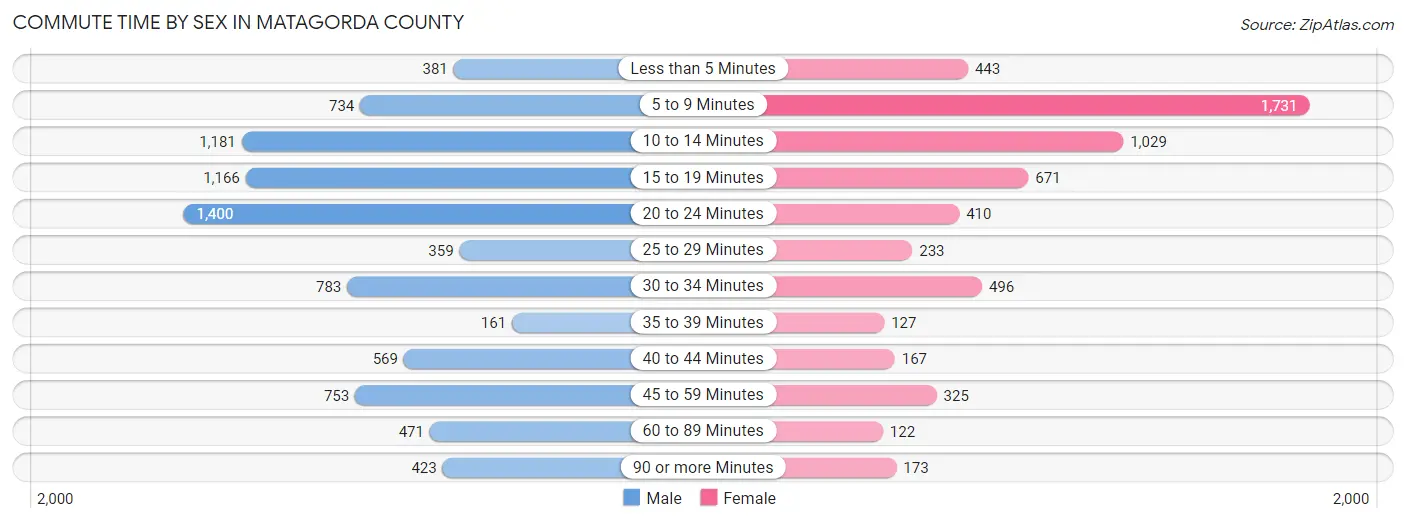
| Commute Time | Male | Female |
| Less than 5 Minutes | 381 (4.5%) | 443 (7.5%) |
| 5 to 9 Minutes | 734 (8.8%) | 1,731 (29.2%) |
| 10 to 14 Minutes | 1,181 (14.1%) | 1,029 (17.4%) |
| 15 to 19 Minutes | 1,166 (13.9%) | 671 (11.3%) |
| 20 to 24 Minutes | 1,400 (16.7%) | 410 (6.9%) |
| 25 to 29 Minutes | 359 (4.3%) | 233 (3.9%) |
| 30 to 34 Minutes | 783 (9.3%) | 496 (8.4%) |
| 35 to 39 Minutes | 161 (1.9%) | 127 (2.1%) |
| 40 to 44 Minutes | 569 (6.8%) | 167 (2.8%) |
| 45 to 59 Minutes | 753 (9.0%) | 325 (5.5%) |
| 60 to 89 Minutes | 471 (5.6%) | 122 (2.1%) |
| 90 or more Minutes | 423 (5.1%) | 173 (2.9%) |
Time of Departure to Work by Sex in Matagorda County
The most frequent times of departure to work in Matagorda County are 12:00 AM to 4:59 AM (1,391, 16.6%) for males and 7:00 AM to 7:29 AM (1,186, 20.0%) for females.
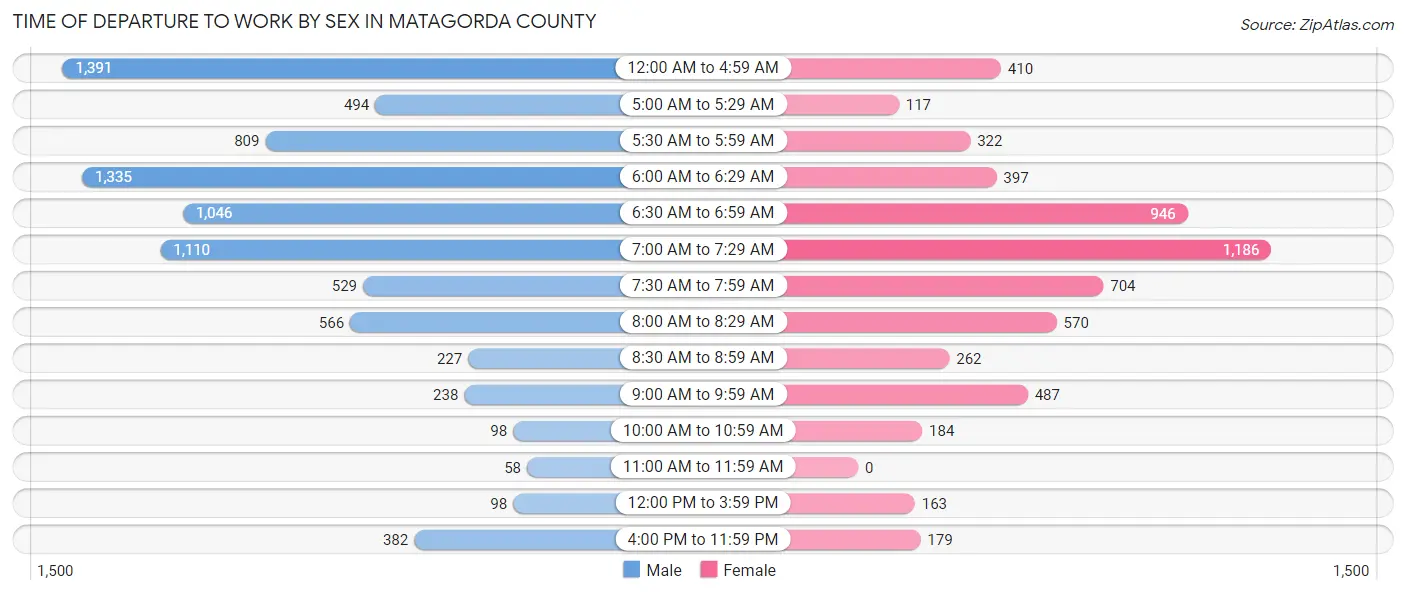
| Time of Departure | Male | Female |
| 12:00 AM to 4:59 AM | 1,391 (16.6%) | 410 (6.9%) |
| 5:00 AM to 5:29 AM | 494 (5.9%) | 117 (2.0%) |
| 5:30 AM to 5:59 AM | 809 (9.7%) | 322 (5.4%) |
| 6:00 AM to 6:29 AM | 1,335 (15.9%) | 397 (6.7%) |
| 6:30 AM to 6:59 AM | 1,046 (12.5%) | 946 (16.0%) |
| 7:00 AM to 7:29 AM | 1,110 (13.2%) | 1,186 (20.0%) |
| 7:30 AM to 7:59 AM | 529 (6.3%) | 704 (11.9%) |
| 8:00 AM to 8:29 AM | 566 (6.8%) | 570 (9.6%) |
| 8:30 AM to 8:59 AM | 227 (2.7%) | 262 (4.4%) |
| 9:00 AM to 9:59 AM | 238 (2.8%) | 487 (8.2%) |
| 10:00 AM to 10:59 AM | 98 (1.2%) | 184 (3.1%) |
| 11:00 AM to 11:59 AM | 58 (0.7%) | 0 (0.0%) |
| 12:00 PM to 3:59 PM | 98 (1.2%) | 163 (2.8%) |
| 4:00 PM to 11:59 PM | 382 (4.6%) | 179 (3.0%) |
| Total | 8,381 (100.0%) | 5,927 (100.0%) |
Housing Occupancy in Matagorda County
Occupancy by Ownership in Matagorda County
Of the total 14,073 dwellings in Matagorda County, owner-occupied units account for 9,766 (69.4%), while renter-occupied units make up 4,307 (30.6%).
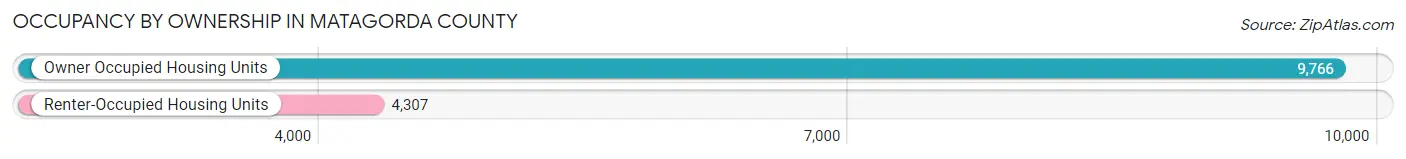
| Occupancy | # Housing Units | % Housing Units |
| Owner Occupied Housing Units | 9,766 | 69.4% |
| Renter-Occupied Housing Units | 4,307 | 30.6% |
| Total Occupied Housing Units | 14,073 | 100.0% |
Occupancy by Household Size in Matagorda County

| Household Size | # Housing Units | % Housing Units |
| 1-Person Household | 4,181 | 29.7% |
| 2-Person Household | 4,851 | 34.5% |
| 3-Person Household | 2,012 | 14.3% |
| 4+ Person Household | 3,029 | 21.5% |
| Total Housing Units | 14,073 | 100.0% |
Occupancy by Ownership by Household Size in Matagorda County

| Household Size | Owner-occupied | Renter-occupied |
| 1-Person Household | 2,305 (55.1%) | 1,876 (44.9%) |
| 2-Person Household | 3,974 (81.9%) | 877 (18.1%) |
| 3-Person Household | 1,239 (61.6%) | 773 (38.4%) |
| 4+ Person Household | 2,248 (74.2%) | 781 (25.8%) |
| Total Housing Units | 9,766 (69.4%) | 4,307 (30.6%) |
Occupancy by Educational Attainment in Matagorda County
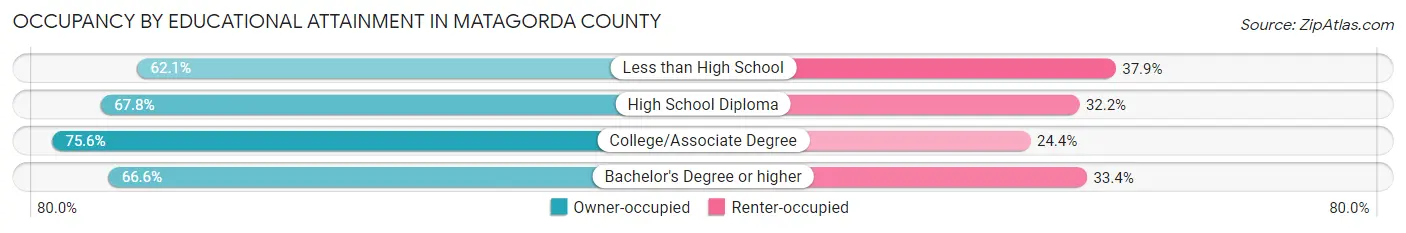
| Household Size | Owner-occupied | Renter-occupied |
| Less than High School | 1,404 (62.1%) | 858 (37.9%) |
| High School Diploma | 2,476 (67.8%) | 1,174 (32.2%) |
| College/Associate Degree | 3,779 (75.6%) | 1,220 (24.4%) |
| Bachelor's Degree or higher | 2,107 (66.6%) | 1,055 (33.4%) |
Occupancy by Age of Householder in Matagorda County
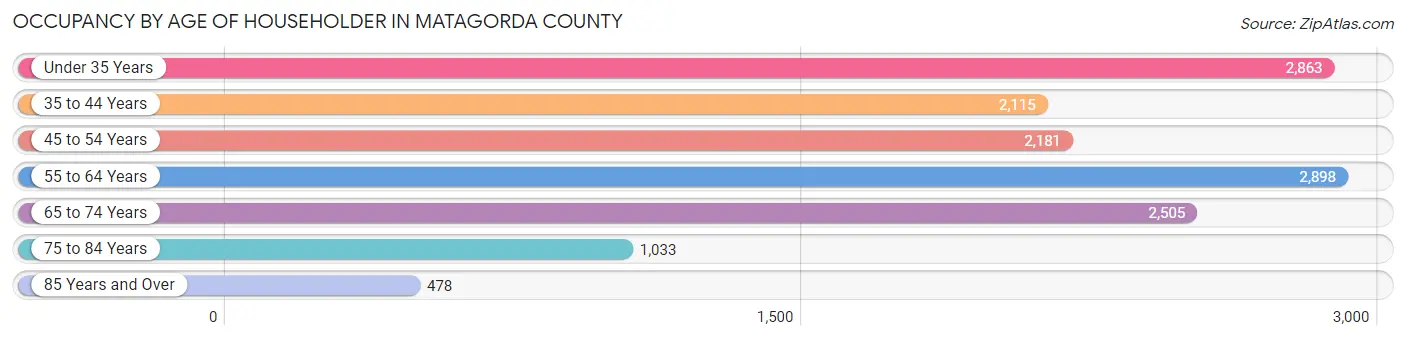
| Age Bracket | # Households | % Households |
| Under 35 Years | 2,863 | 20.3% |
| 35 to 44 Years | 2,115 | 15.0% |
| 45 to 54 Years | 2,181 | 15.5% |
| 55 to 64 Years | 2,898 | 20.6% |
| 65 to 74 Years | 2,505 | 17.8% |
| 75 to 84 Years | 1,033 | 7.3% |
| 85 Years and Over | 478 | 3.4% |
| Total | 14,073 | 100.0% |
Housing Finances in Matagorda County
Median Income by Occupancy in Matagorda County
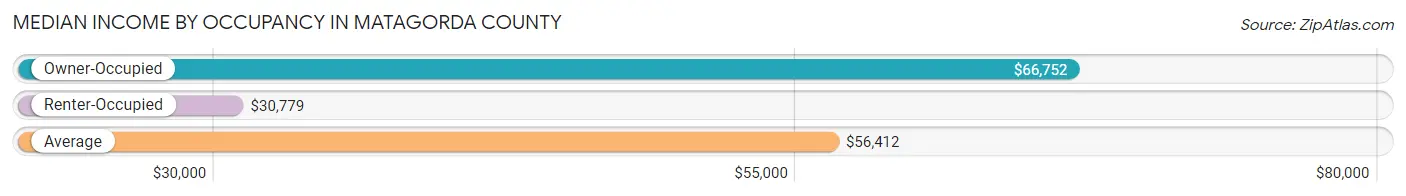
| Occupancy Type | # Households | Median Income |
| Owner-Occupied | 9,766 (69.4%) | $66,752 |
| Renter-Occupied | 4,307 (30.6%) | $30,779 |
| Average | 14,073 (100.0%) | $56,412 |
Occupancy by Householder Income Bracket in Matagorda County
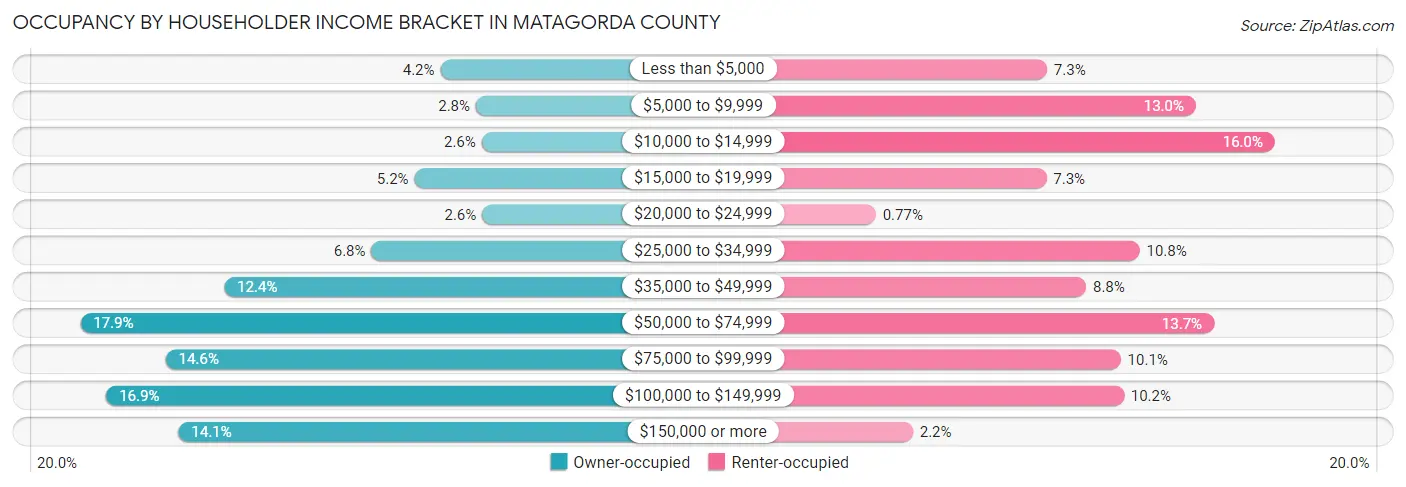
| Income Bracket | Owner-occupied | Renter-occupied |
| Less than $5,000 | 406 (4.2%) | 314 (7.3%) |
| $5,000 to $9,999 | 274 (2.8%) | 558 (13.0%) |
| $10,000 to $14,999 | 253 (2.6%) | 688 (16.0%) |
| $15,000 to $19,999 | 503 (5.1%) | 313 (7.3%) |
| $20,000 to $24,999 | 251 (2.6%) | 33 (0.8%) |
| $25,000 to $34,999 | 663 (6.8%) | 466 (10.8%) |
| $35,000 to $49,999 | 1,211 (12.4%) | 378 (8.8%) |
| $50,000 to $74,999 | 1,746 (17.9%) | 588 (13.7%) |
| $75,000 to $99,999 | 1,429 (14.6%) | 435 (10.1%) |
| $100,000 to $149,999 | 1,649 (16.9%) | 440 (10.2%) |
| $150,000 or more | 1,381 (14.1%) | 94 (2.2%) |
| Total | 9,766 (100.0%) | 4,307 (100.0%) |
Monthly Housing Cost Tiers in Matagorda County
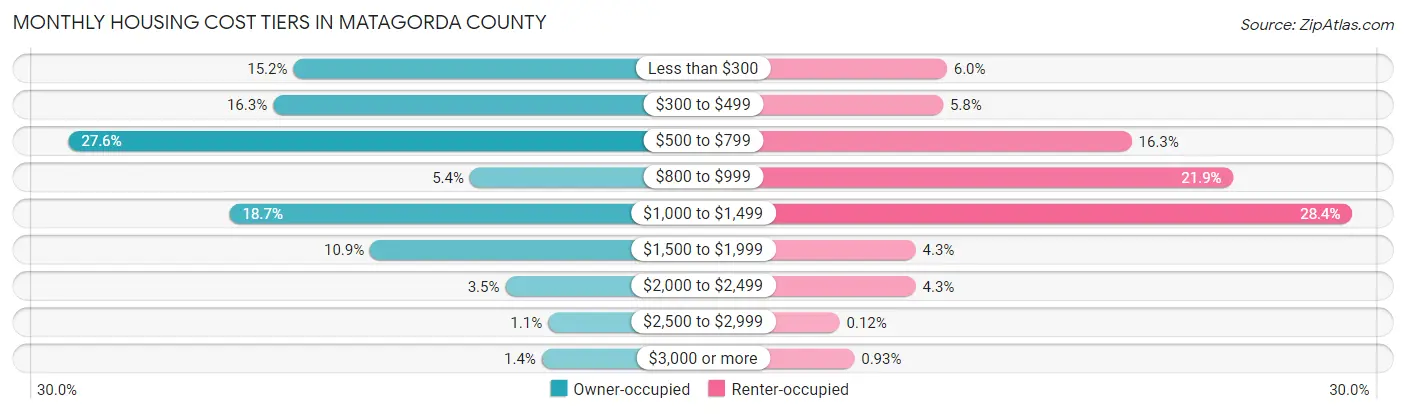
| Monthly Cost | Owner-occupied | Renter-occupied |
| Less than $300 | 1,481 (15.2%) | 260 (6.0%) |
| $300 to $499 | 1,590 (16.3%) | 251 (5.8%) |
| $500 to $799 | 2,693 (27.6%) | 700 (16.3%) |
| $800 to $999 | 528 (5.4%) | 942 (21.9%) |
| $1,000 to $1,499 | 1,824 (18.7%) | 1,225 (28.4%) |
| $1,500 to $1,999 | 1,066 (10.9%) | 186 (4.3%) |
| $2,000 to $2,499 | 337 (3.5%) | 186 (4.3%) |
| $2,500 to $2,999 | 106 (1.1%) | 5 (0.1%) |
| $3,000 or more | 141 (1.4%) | 40 (0.9%) |
| Total | 9,766 (100.0%) | 4,307 (100.0%) |
Physical Housing Characteristics in Matagorda County
Housing Structures in Matagorda County
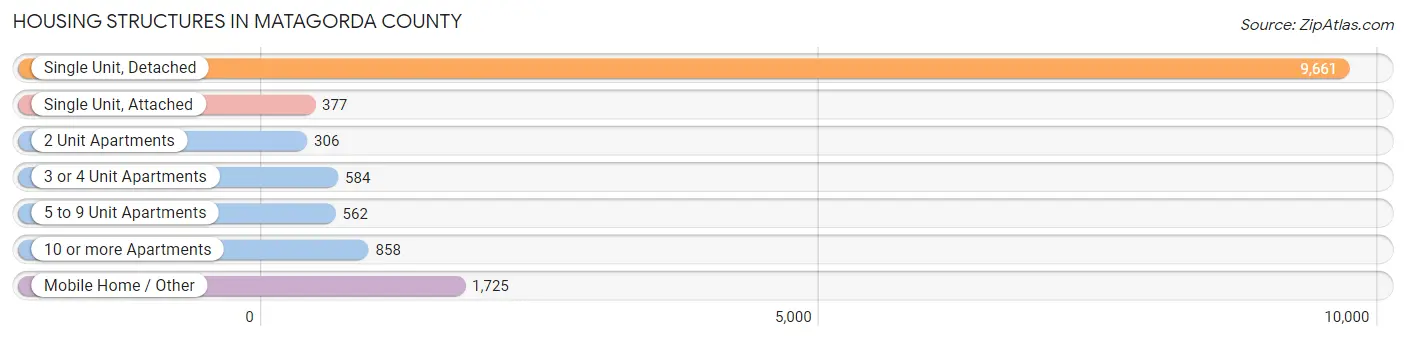
| Structure Type | # Housing Units | % Housing Units |
| Single Unit, Detached | 9,661 | 68.6% |
| Single Unit, Attached | 377 | 2.7% |
| 2 Unit Apartments | 306 | 2.2% |
| 3 or 4 Unit Apartments | 584 | 4.2% |
| 5 to 9 Unit Apartments | 562 | 4.0% |
| 10 or more Apartments | 858 | 6.1% |
| Mobile Home / Other | 1,725 | 12.3% |
| Total | 14,073 | 100.0% |
Housing Structures by Occupancy in Matagorda County
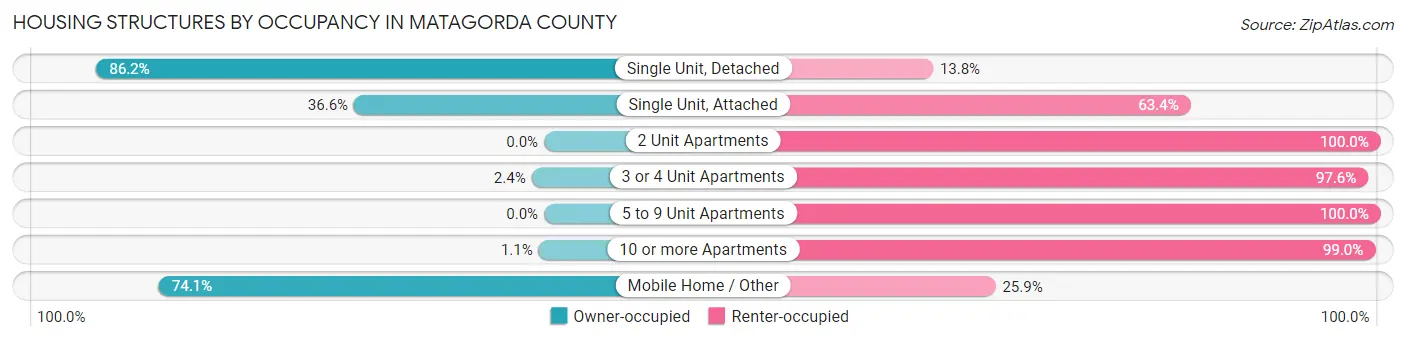
| Structure Type | Owner-occupied | Renter-occupied |
| Single Unit, Detached | 8,326 (86.2%) | 1,335 (13.8%) |
| Single Unit, Attached | 138 (36.6%) | 239 (63.4%) |
| 2 Unit Apartments | 0 (0.0%) | 306 (100.0%) |
| 3 or 4 Unit Apartments | 14 (2.4%) | 570 (97.6%) |
| 5 to 9 Unit Apartments | 0 (0.0%) | 562 (100.0%) |
| 10 or more Apartments | 9 (1.1%) | 849 (99.0%) |
| Mobile Home / Other | 1,279 (74.1%) | 446 (25.9%) |
| Total | 9,766 (69.4%) | 4,307 (30.6%) |
Housing Structures by Number of Rooms in Matagorda County
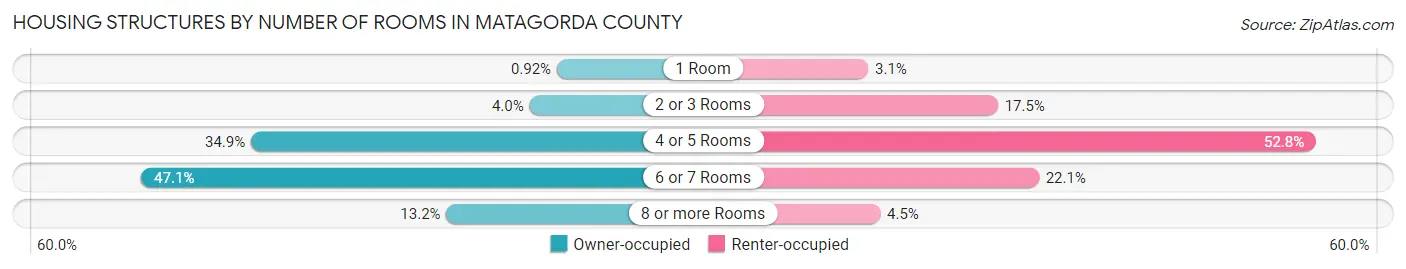
| Number of Rooms | Owner-occupied | Renter-occupied |
| 1 Room | 90 (0.9%) | 135 (3.1%) |
| 2 or 3 Rooms | 387 (4.0%) | 754 (17.5%) |
| 4 or 5 Rooms | 3,405 (34.9%) | 2,276 (52.8%) |
| 6 or 7 Rooms | 4,596 (47.1%) | 950 (22.1%) |
| 8 or more Rooms | 1,288 (13.2%) | 192 (4.5%) |
| Total | 9,766 (100.0%) | 4,307 (100.0%) |
Housing Structure by Heating Type in Matagorda County

| Heating Type | Owner-occupied | Renter-occupied |
| Utility Gas | 2,903 (29.7%) | 751 (17.4%) |
| Bottled, Tank, or LP Gas | 582 (6.0%) | 100 (2.3%) |
| Electricity | 5,886 (60.3%) | 3,345 (77.7%) |
| Fuel Oil or Kerosene | 88 (0.9%) | 0 (0.0%) |
| Coal or Coke | 0 (0.0%) | 0 (0.0%) |
| All other Fuels | 120 (1.2%) | 0 (0.0%) |
| No Fuel Used | 187 (1.9%) | 111 (2.6%) |
| Total | 9,766 (100.0%) | 4,307 (100.0%) |
Household Vehicle Usage in Matagorda County
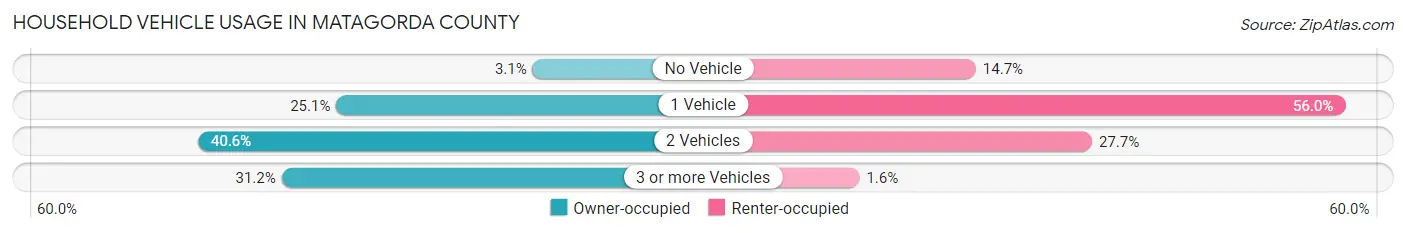
| Vehicles per Household | Owner-occupied | Renter-occupied |
| No Vehicle | 303 (3.1%) | 632 (14.7%) |
| 1 Vehicle | 2,450 (25.1%) | 2,413 (56.0%) |
| 2 Vehicles | 3,964 (40.6%) | 1,192 (27.7%) |
| 3 or more Vehicles | 3,049 (31.2%) | 70 (1.6%) |
| Total | 9,766 (100.0%) | 4,307 (100.0%) |
Real Estate & Mortgages in Matagorda County
Real Estate and Mortgage Overview in Matagorda County
| Characteristic | Without Mortgage | With Mortgage |
| Housing Units | 6,524 | 3,242 |
| Median Property Value | $146,000 | $167,800 |
| Median Household Income | $57,419 | $553 |
| Monthly Housing Costs | $517 | $141 |
| Real Estate Taxes | $1,764 | $91 |
Property Value by Mortgage Status in Matagorda County
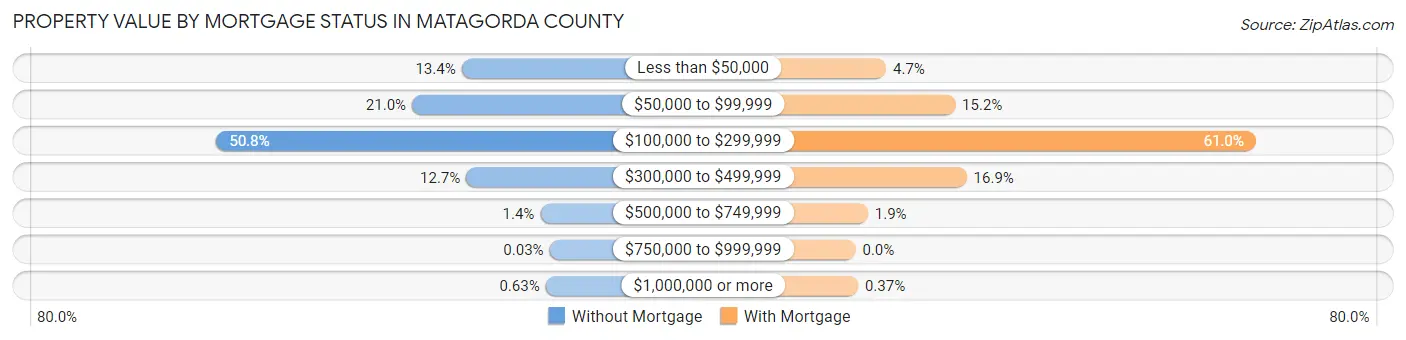
| Property Value | Without Mortgage | With Mortgage |
| Less than $50,000 | 876 (13.4%) | 151 (4.7%) |
| $50,000 to $99,999 | 1,369 (21.0%) | 492 (15.2%) |
| $100,000 to $299,999 | 3,313 (50.8%) | 1,977 (61.0%) |
| $300,000 to $499,999 | 830 (12.7%) | 549 (16.9%) |
| $500,000 to $749,999 | 93 (1.4%) | 61 (1.9%) |
| $750,000 to $999,999 | 2 (0.0%) | 0 (0.0%) |
| $1,000,000 or more | 41 (0.6%) | 12 (0.4%) |
| Total | 6,524 (100.0%) | 3,242 (100.0%) |
Household Income by Mortgage Status in Matagorda County
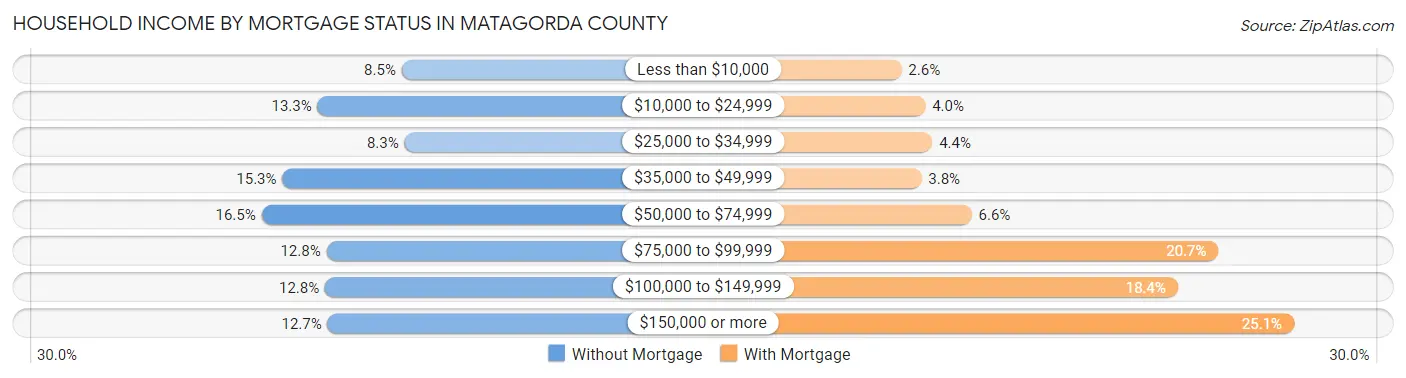
| Household Income | Without Mortgage | With Mortgage |
| Less than $10,000 | 551 (8.5%) | 85 (2.6%) |
| $10,000 to $24,999 | 865 (13.3%) | 129 (4.0%) |
| $25,000 to $34,999 | 541 (8.3%) | 142 (4.4%) |
| $35,000 to $49,999 | 996 (15.3%) | 122 (3.8%) |
| $50,000 to $74,999 | 1,074 (16.5%) | 215 (6.6%) |
| $75,000 to $99,999 | 832 (12.8%) | 672 (20.7%) |
| $100,000 to $149,999 | 837 (12.8%) | 597 (18.4%) |
| $150,000 or more | 828 (12.7%) | 812 (25.1%) |
| Total | 6,524 (100.0%) | 3,242 (100.0%) |
Property Value to Household Income Ratio in Matagorda County
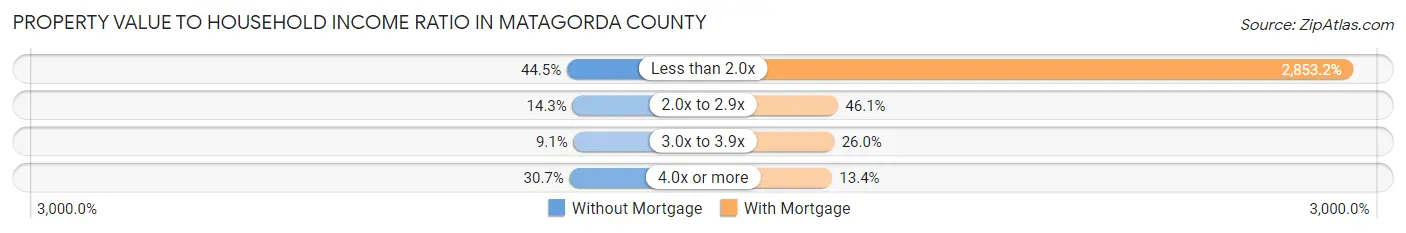
| Value-to-Income Ratio | Without Mortgage | With Mortgage |
| Less than 2.0x | 2,902 (44.5%) | 92,500 (2,853.2%) |
| 2.0x to 2.9x | 935 (14.3%) | 1,494 (46.1%) |
| 3.0x to 3.9x | 595 (9.1%) | 843 (26.0%) |
| 4.0x or more | 2,001 (30.7%) | 435 (13.4%) |
| Total | 6,524 (100.0%) | 3,242 (100.0%) |
Real Estate Taxes by Mortgage Status in Matagorda County
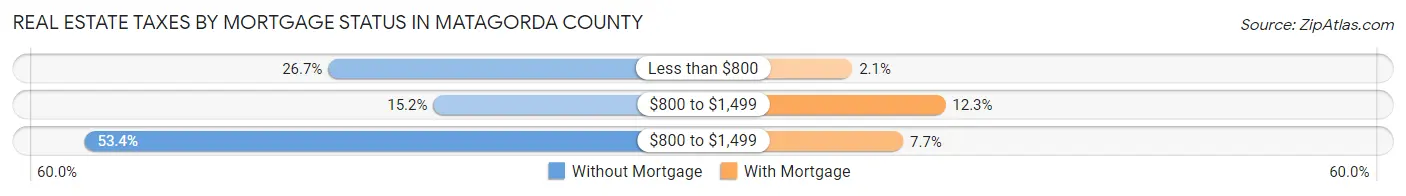
| Property Taxes | Without Mortgage | With Mortgage |
| Less than $800 | 1,744 (26.7%) | 68 (2.1%) |
| $800 to $1,499 | 992 (15.2%) | 399 (12.3%) |
| $800 to $1,499 | 3,486 (53.4%) | 249 (7.7%) |
| Total | 6,524 (100.0%) | 3,242 (100.0%) |
Health & Disability in Matagorda County
Health Insurance Coverage by Age in Matagorda County
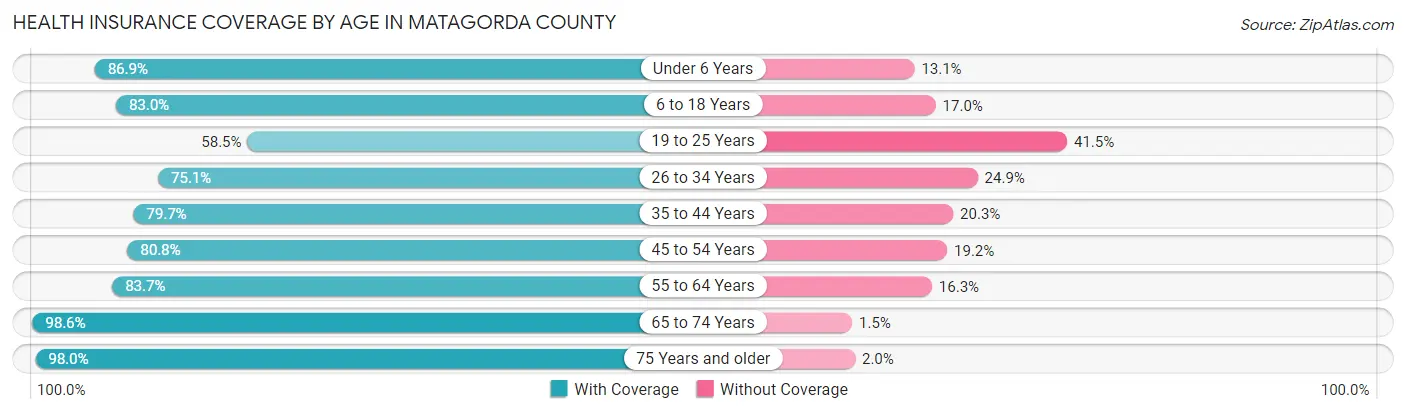
| Age Bracket | With Coverage | Without Coverage |
| Under 6 Years | 2,679 (86.9%) | 403 (13.1%) |
| 6 to 18 Years | 5,739 (83.0%) | 1,179 (17.0%) |
| 19 to 25 Years | 1,514 (58.5%) | 1,076 (41.5%) |
| 26 to 34 Years | 3,209 (75.1%) | 1,062 (24.9%) |
| 35 to 44 Years | 3,439 (79.7%) | 876 (20.3%) |
| 45 to 54 Years | 3,062 (80.8%) | 726 (19.2%) |
| 55 to 64 Years | 3,974 (83.7%) | 776 (16.3%) |
| 65 to 74 Years | 3,667 (98.6%) | 54 (1.5%) |
| 75 Years and older | 2,351 (98.0%) | 48 (2.0%) |
| Total | 29,634 (82.7%) | 6,200 (17.3%) |
Health Insurance Coverage by Citizenship Status in Matagorda County

| Citizenship Status | With Coverage | Without Coverage |
| Native Born | 2,679 (86.9%) | 403 (13.1%) |
| Foreign Born, Citizen | 5,739 (83.0%) | 1,179 (17.0%) |
| Foreign Born, not a Citizen | 1,514 (58.5%) | 1,076 (41.5%) |
Health Insurance Coverage by Household Income in Matagorda County
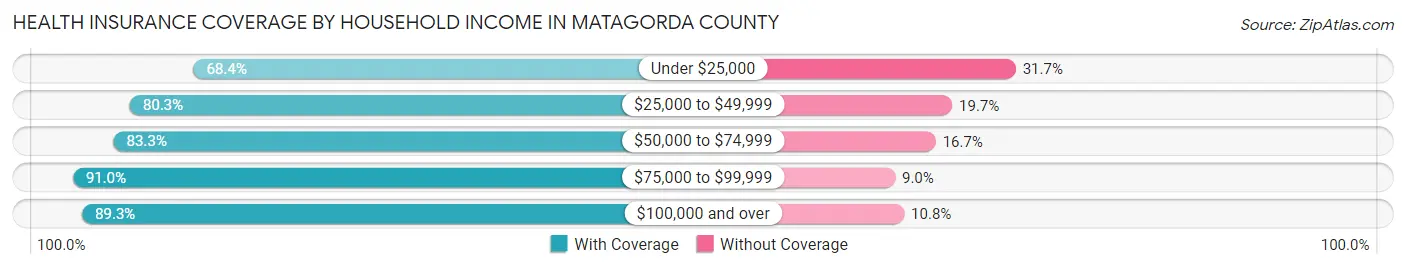
| Household Income | With Coverage | Without Coverage |
| Under $25,000 | 5,043 (68.3%) | 2,335 (31.7%) |
| $25,000 to $49,999 | 4,702 (80.3%) | 1,156 (19.7%) |
| $50,000 to $74,999 | 5,219 (83.3%) | 1,043 (16.7%) |
| $75,000 to $99,999 | 4,958 (91.0%) | 493 (9.0%) |
| $100,000 and over | 9,699 (89.2%) | 1,168 (10.7%) |
Public vs Private Health Insurance Coverage by Age in Matagorda County
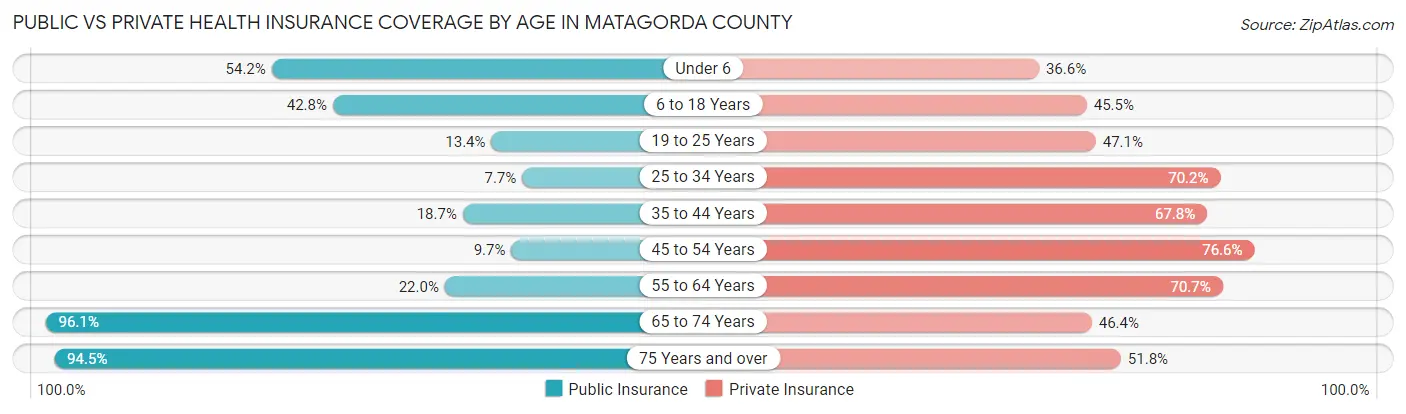
| Age Bracket | Public Insurance | Private Insurance |
| Under 6 | 1,669 (54.1%) | 1,128 (36.6%) |
| 6 to 18 Years | 2,961 (42.8%) | 3,146 (45.5%) |
| 19 to 25 Years | 346 (13.4%) | 1,221 (47.1%) |
| 25 to 34 Years | 327 (7.7%) | 3,000 (70.2%) |
| 35 to 44 Years | 806 (18.7%) | 2,925 (67.8%) |
| 45 to 54 Years | 366 (9.7%) | 2,900 (76.6%) |
| 55 to 64 Years | 1,046 (22.0%) | 3,357 (70.7%) |
| 65 to 74 Years | 3,576 (96.1%) | 1,727 (46.4%) |
| 75 Years and over | 2,268 (94.5%) | 1,243 (51.8%) |
| Total | 13,365 (37.3%) | 20,647 (57.6%) |
Disability Status by Sex by Age in Matagorda County
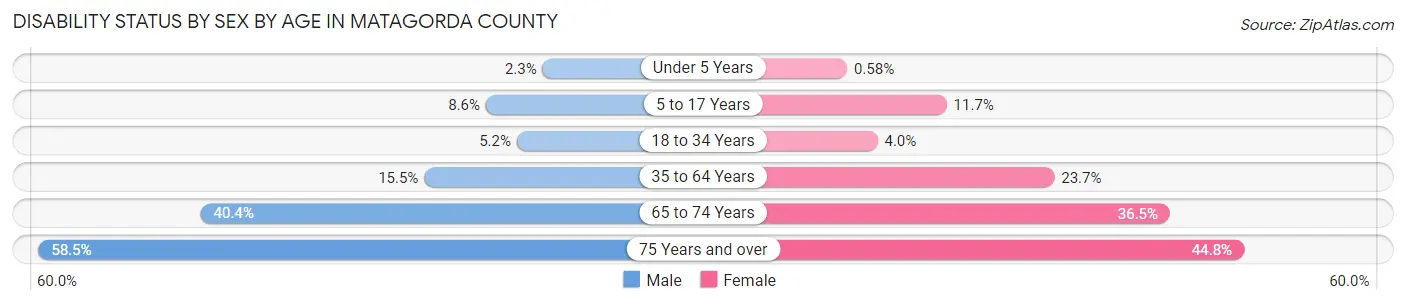
| Age Bracket | Male | Female |
| Under 5 Years | 30 (2.3%) | 8 (0.6%) |
| 5 to 17 Years | 298 (8.6%) | 379 (11.7%) |
| 18 to 34 Years | 210 (5.2%) | 137 (4.0%) |
| 35 to 64 Years | 978 (15.5%) | 1,549 (23.7%) |
| 65 to 74 Years | 767 (40.4%) | 666 (36.5%) |
| 75 Years and over | 635 (58.5%) | 588 (44.8%) |
Disability Class by Sex by Age in Matagorda County
Disability Class: Hearing Difficulty
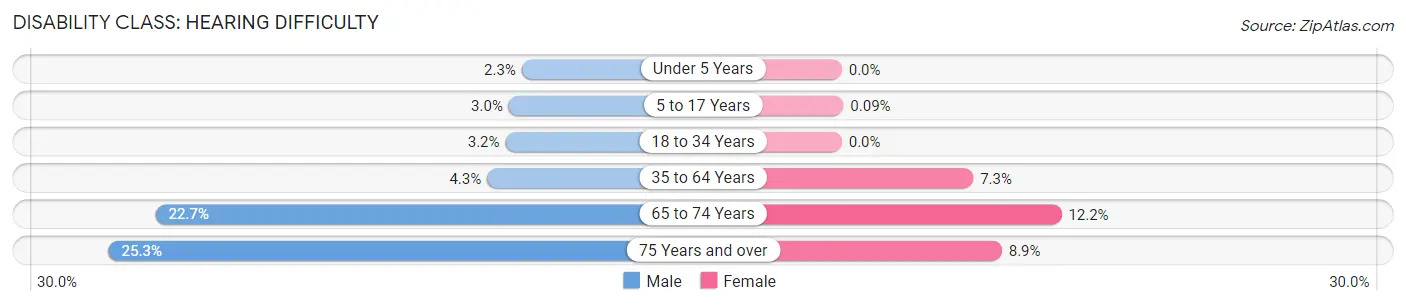
| Age Bracket | Male | Female |
| Under 5 Years | 30 (2.3%) | 0 (0.0%) |
| 5 to 17 Years | 105 (3.0%) | 3 (0.1%) |
| 18 to 34 Years | 131 (3.2%) | 0 (0.0%) |
| 35 to 64 Years | 268 (4.3%) | 479 (7.3%) |
| 65 to 74 Years | 431 (22.7%) | 223 (12.2%) |
| 75 Years and over | 275 (25.3%) | 117 (8.9%) |
Disability Class: Vision Difficulty
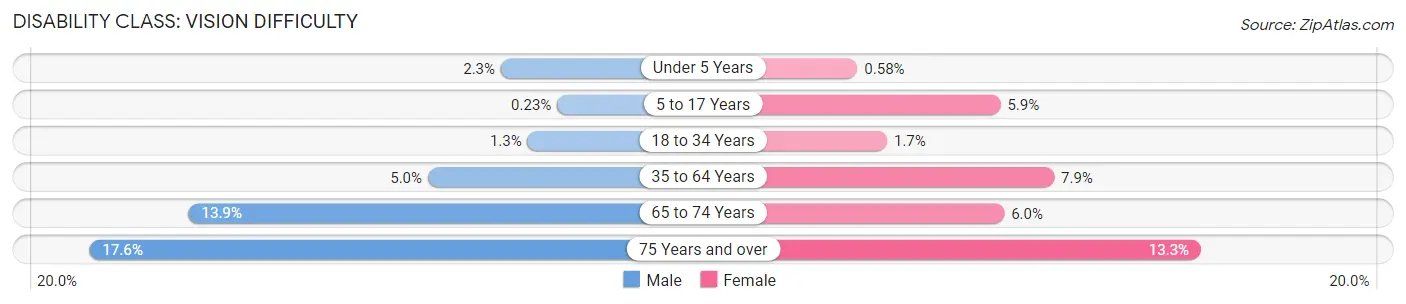
| Age Bracket | Male | Female |
| Under 5 Years | 30 (2.3%) | 8 (0.6%) |
| 5 to 17 Years | 8 (0.2%) | 191 (5.9%) |
| 18 to 34 Years | 54 (1.3%) | 58 (1.7%) |
| 35 to 64 Years | 317 (5.0%) | 516 (7.9%) |
| 65 to 74 Years | 264 (13.9%) | 110 (6.0%) |
| 75 Years and over | 191 (17.6%) | 175 (13.3%) |
Disability Class: Cognitive Difficulty
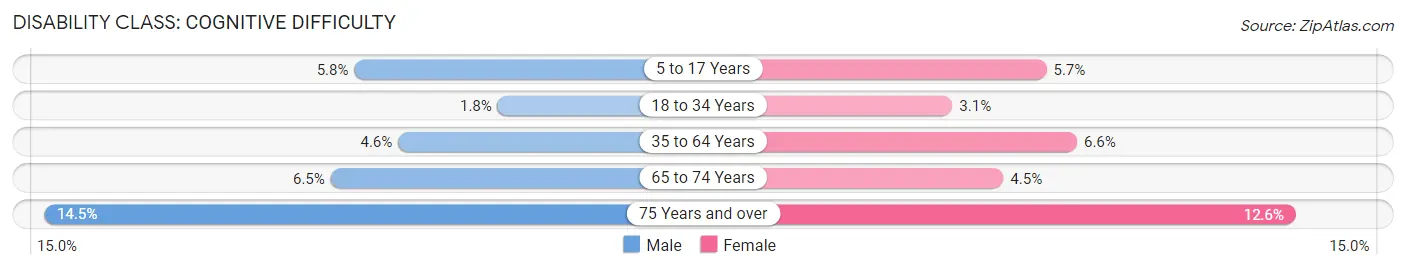
| Age Bracket | Male | Female |
| 5 to 17 Years | 201 (5.8%) | 185 (5.7%) |
| 18 to 34 Years | 74 (1.8%) | 106 (3.1%) |
| 35 to 64 Years | 290 (4.6%) | 429 (6.6%) |
| 65 to 74 Years | 123 (6.5%) | 82 (4.5%) |
| 75 Years and over | 157 (14.5%) | 166 (12.6%) |
Disability Class: Ambulatory Difficulty
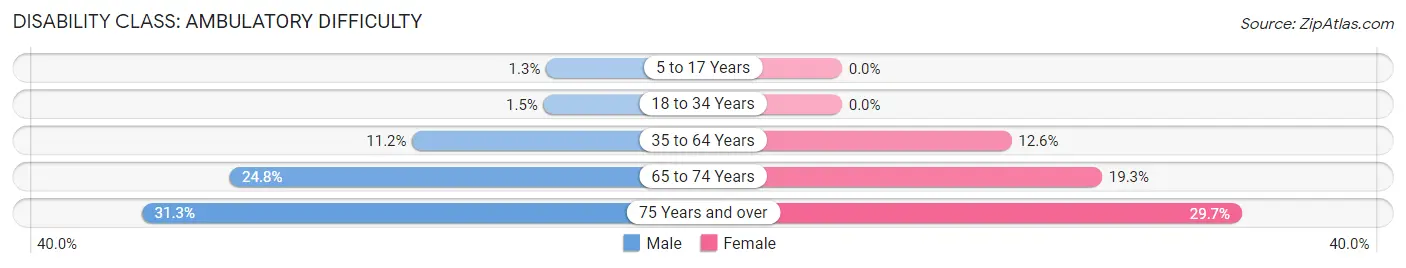
| Age Bracket | Male | Female |
| 5 to 17 Years | 44 (1.3%) | 0 (0.0%) |
| 18 to 34 Years | 59 (1.5%) | 0 (0.0%) |
| 35 to 64 Years | 707 (11.2%) | 824 (12.6%) |
| 65 to 74 Years | 471 (24.8%) | 352 (19.3%) |
| 75 Years and over | 340 (31.3%) | 390 (29.7%) |
Disability Class: Self-Care Difficulty
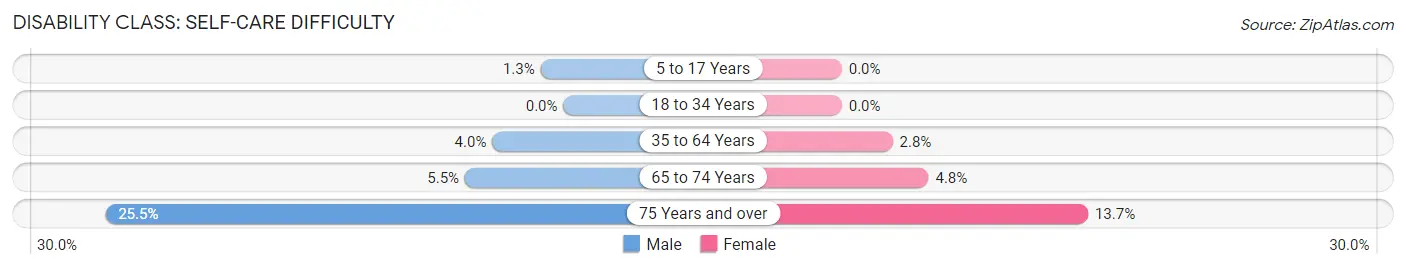
| Age Bracket | Male | Female |
| 5 to 17 Years | 44 (1.3%) | 0 (0.0%) |
| 18 to 34 Years | 0 (0.0%) | 0 (0.0%) |
| 35 to 64 Years | 250 (4.0%) | 185 (2.8%) |
| 65 to 74 Years | 104 (5.5%) | 88 (4.8%) |
| 75 Years and over | 277 (25.5%) | 180 (13.7%) |
Technology Access in Matagorda County
Computing Device Access in Matagorda County
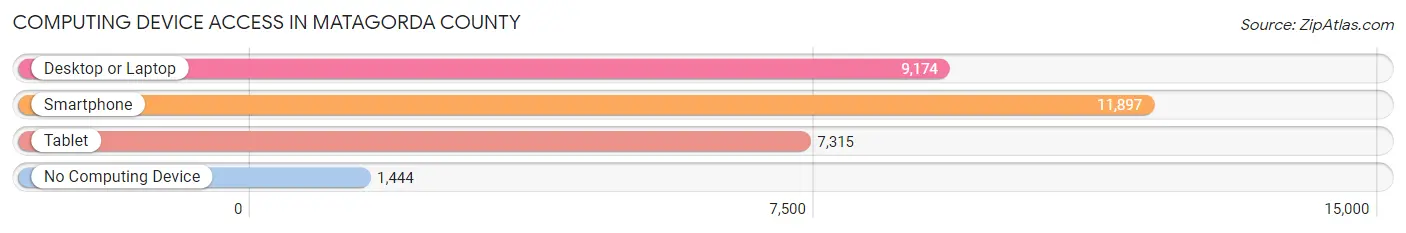
| Device Type | # Households | % Households |
| Desktop or Laptop | 9,174 | 65.2% |
| Smartphone | 11,897 | 84.5% |
| Tablet | 7,315 | 52.0% |
| No Computing Device | 1,444 | 10.3% |
| Total | 14,073 | 100.0% |
Internet Access in Matagorda County
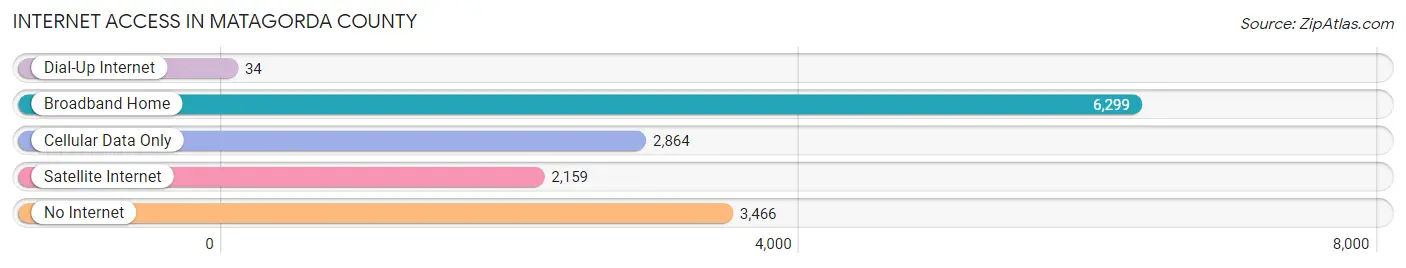
| Internet Type | # Households | % Households |
| Dial-Up Internet | 34 | 0.2% |
| Broadband Home | 6,299 | 44.8% |
| Cellular Data Only | 2,864 | 20.3% |
| Satellite Internet | 2,159 | 15.3% |
| No Internet | 3,466 | 24.6% |
| Total | 14,073 | 100.0% |
Matagorda County Summary
Matagorda County is located in the southeastern part of Texas, along the Gulf Coast. It is bordered by Brazoria County to the north, Wharton County to the east, Jackson County to the south, and Calhoun County to the west. The county seat is Bay City, and the largest city is Palacios. The county has a total area of 1,072 square miles, of which 945 square miles is land and 127 square miles is water.
Matagorda County was established in 1836 and is named for the Matagorda Bay, which is located along the Gulf Coast. The county was originally part of Austin's Colony, and was later part of the Republic of Texas. The county was organized in 1837, and the first county seat was located in Matagorda. In 1846, the county seat was moved to Bay City.
The population of Matagorda County was estimated to be 33,845 in 2019. The population has grown steadily since 2000, when it was estimated to be 28,845. The population is spread out across the county, with the largest cities being Bay City (population 17,945) and Palacios (population 5,845).
The economy of Matagorda County is largely based on agriculture and oil and gas production. The county is home to several large agricultural operations, including rice, cotton, and cattle. The county is also home to several oil and gas production facilities, including the Phillips 66 refinery in Bay City. The county also has a thriving tourism industry, with several popular beaches and fishing spots.
Matagorda County has a humid subtropical climate, with hot summers and mild winters. The average annual temperature is 71 degrees Fahrenheit, and the average annual precipitation is 44 inches.
Matagorda County is served by several school districts, including the Matagorda Independent School District, Palacios Independent School District, and Bay City Independent School District. The county is also home to several higher education institutions, including Wharton County Junior College and Texas A&M University-Matagorda County.
Matagorda County is a great place to live, work, and play. The county has a rich history, a thriving economy, and a beautiful natural environment. With its close proximity to the Gulf Coast, Matagorda County is a great place to call home.
Common Questions
What is Per Capita Income in Matagorda County?
Per Capita income in Matagorda County is $29,001.
What is the Median Family Income in Matagorda County?
Median Family Income in Matagorda County is $69,689.
What is the Median Household income in Matagorda County?
Median Household Income in Matagorda County is $56,412.
What is Income or Wage Gap in Matagorda County?
Income or Wage Gap in Matagorda County is 44.2%.
Women in Matagorda County earn 55.8 cents for every dollar earned by a man.
What is Family Income Deficit in Matagorda County?
Family Income Deficit in Matagorda County is $12,013.
Families that are below poverty line in Matagorda County earn $12,013 less on average than the poverty threshold level.
What is Inequality or Gini Index in Matagorda County?
Inequality or Gini Index in Matagorda County is 0.47.
What is the Total Population of Matagorda County?
Total Population of Matagorda County is 36,251.
What is the Total Male Population of Matagorda County?
Total Male Population of Matagorda County is 18,259.
What is the Total Female Population of Matagorda County?
Total Female Population of Matagorda County is 17,992.
What is the Ratio of Males per 100 Females in Matagorda County?
There are 101.48 Males per 100 Females in Matagorda County.
What is the Ratio of Females per 100 Males in Matagorda County?
There are 98.54 Females per 100 Males in Matagorda County.
What is the Median Population Age in Matagorda County?
Median Population Age in Matagorda County is 37.1 Years.
What is the Average Family Size in Matagorda County
Average Family Size in Matagorda County is 3.2 People.
What is the Average Household Size in Matagorda County
Average Household Size in Matagorda County is 2.5 People.
How Large is the Labor Force in Matagorda County?
There are 15,984 People in the Labor Forcein in Matagorda County.
What is the Percentage of People in the Labor Force in Matagorda County?
57.2% of People are in the Labor Force in Matagorda County.
What is the Unemployment Rate in Matagorda County?
Unemployment Rate in Matagorda County is 6.7%.