Mason County, TX Map & Demographics
Mason County Overview
$36,235
PER CAPITA INCOME
$96,193
AVG FAMILY INCOME
$77,583
AVG HOUSEHOLD INCOME
12.7%
WAGE / INCOME GAP [ % ]
87.3¢/ $1
WAGE / INCOME GAP [ $ ]
0.46
INEQUALITY / GINI INDEX
3,959
TOTAL POPULATION
1,977
MALE POPULATION
1,982
FEMALE POPULATION
99.75
MALES / 100 FEMALES
100.25
FEMALES / 100 MALES
48.2
MEDIAN AGE
3.2
AVG FAMILY SIZE
2.6
AVG HOUSEHOLD SIZE
1,677
LABOR FORCE [ PEOPLE ]
52.7%
PERCENT IN LABOR FORCE
2.8%
UNEMPLOYMENT RATE
Mason County Area Codes
Income in Mason County
Income Overview in Mason County
Per Capita Income in Mason County is $36,235, while median incomes of families and households are $96,193 and $77,583 respectively.
| Characteristic | Number | Measure |
| Per Capita Income | 3,959 | $36,235 |
| Median Family Income | 1,117 | $96,193 |
| Mean Family Income | 1,117 | $111,453 |
| Median Household Income | 1,519 | $77,583 |
| Mean Household Income | 1,519 | $93,741 |
| Income Deficit | 1,117 | $0 |
| Wage / Income Gap (%) | 3,959 | 12.68% |
| Wage / Income Gap ($) | 3,959 | 87.32¢ per $1 |
| Gini / Inequality Index | 3,959 | 0.46 |
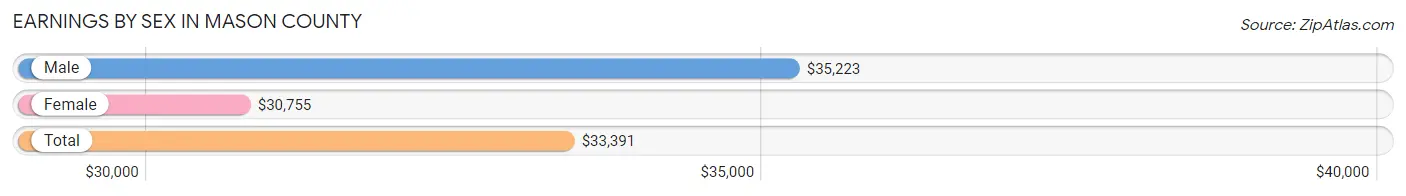
Earnings by Sex in Mason County
Average Earnings in Mason County are $33,391, $35,223 for men and $30,755 for women, a difference of 12.7%.
| Sex | Number | Average Earnings |
| Male | 907 (48.9%) | $35,223 |
| Female | 949 (51.1%) | $30,755 |
| Total | 1,856 (100.0%) | $33,391 |
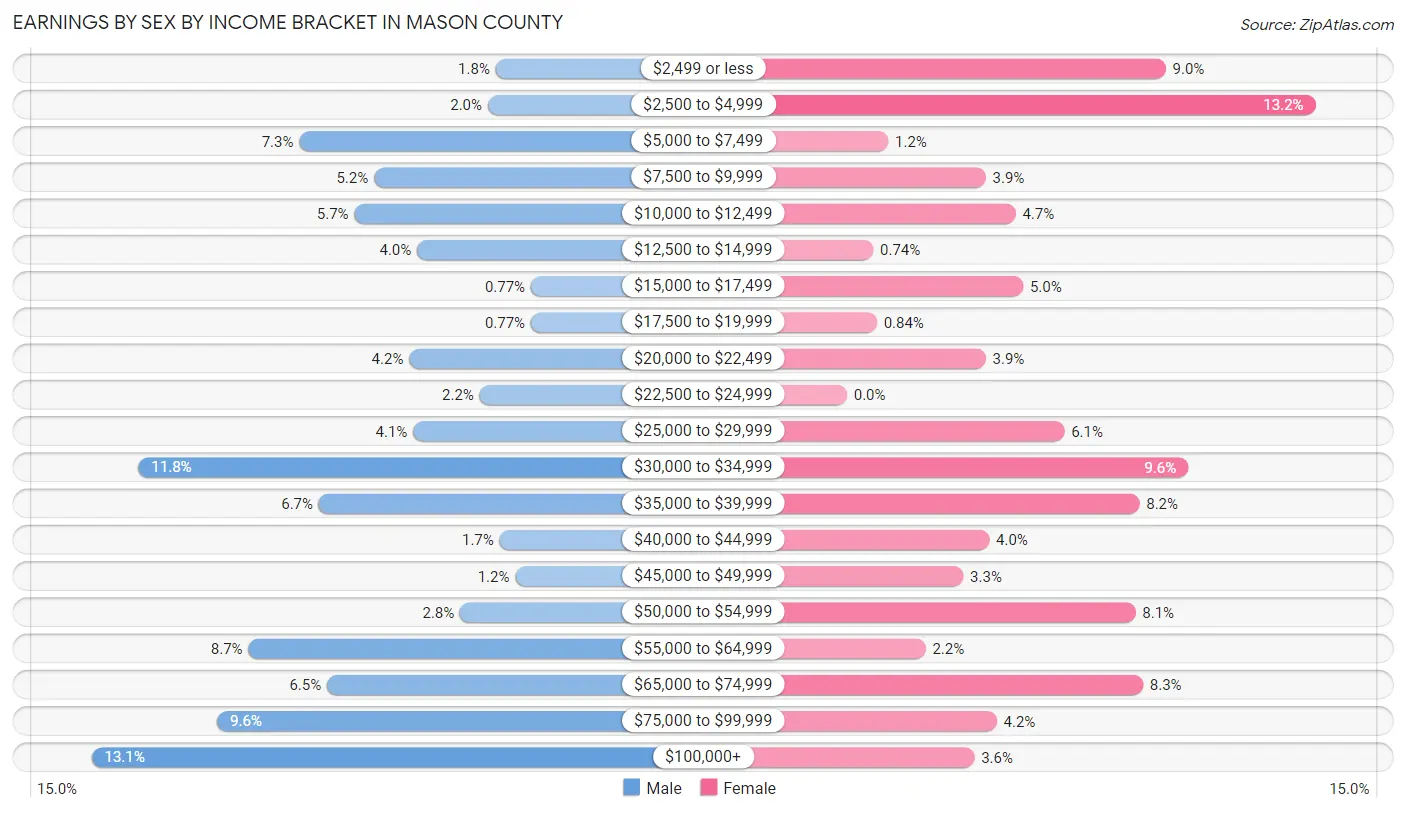
Earnings by Sex by Income Bracket in Mason County
The most common earnings brackets in Mason County are $100,000+ for men (119 | 13.1%) and $2,500 to $4,999 for women (125 | 13.2%).
| Income | Male | Female |
| $2,499 or less | 16 (1.8%) | 85 (9.0%) |
| $2,500 to $4,999 | 18 (2.0%) | 125 (13.2%) |
| $5,000 to $7,499 | 66 (7.3%) | 11 (1.2%) |
| $7,500 to $9,999 | 47 (5.2%) | 37 (3.9%) |
| $10,000 to $12,499 | 52 (5.7%) | 45 (4.7%) |
| $12,500 to $14,999 | 36 (4.0%) | 7 (0.7%) |
| $15,000 to $17,499 | 7 (0.8%) | 47 (5.0%) |
| $17,500 to $19,999 | 7 (0.8%) | 8 (0.8%) |
| $20,000 to $22,499 | 38 (4.2%) | 37 (3.9%) |
| $22,500 to $24,999 | 20 (2.2%) | 0 (0.0%) |
| $25,000 to $29,999 | 37 (4.1%) | 58 (6.1%) |
| $30,000 to $34,999 | 107 (11.8%) | 91 (9.6%) |
| $35,000 to $39,999 | 61 (6.7%) | 78 (8.2%) |
| $40,000 to $44,999 | 15 (1.7%) | 38 (4.0%) |
| $45,000 to $49,999 | 11 (1.2%) | 31 (3.3%) |
| $50,000 to $54,999 | 25 (2.8%) | 77 (8.1%) |
| $55,000 to $64,999 | 79 (8.7%) | 21 (2.2%) |
| $65,000 to $74,999 | 59 (6.5%) | 79 (8.3%) |
| $75,000 to $99,999 | 87 (9.6%) | 40 (4.2%) |
| $100,000+ | 119 (13.1%) | 34 (3.6%) |
| Total | 907 (100.0%) | 949 (100.0%) |
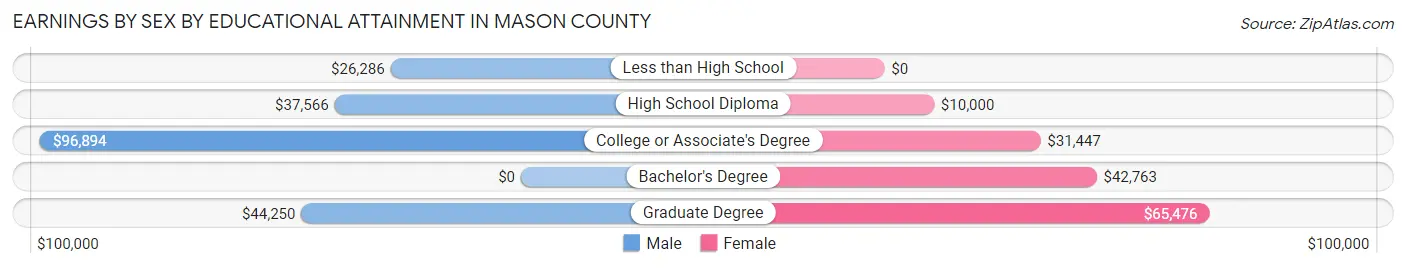
Earnings by Sex by Educational Attainment in Mason County
Average earnings in Mason County are $44,833 for men and $34,942 for women, a difference of 22.1%. Men with an educational attainment of college or associate's degree enjoy the highest average annual earnings of $96,894, while those with less than high school education earn the least with $26,286. Women with an educational attainment of graduate degree earn the most with the average annual earnings of $65,476, while those with high school diploma education have the smallest earnings of $10,000.
| Educational Attainment | Male Income | Female Income |
| Less than High School | $26,286 | $0 |
| High School Diploma | $37,566 | $10,000 |
| College or Associate's Degree | $96,894 | $31,447 |
| Bachelor's Degree | - | - |
| Graduate Degree | $44,250 | $65,476 |
| Total | $44,833 | $34,942 |
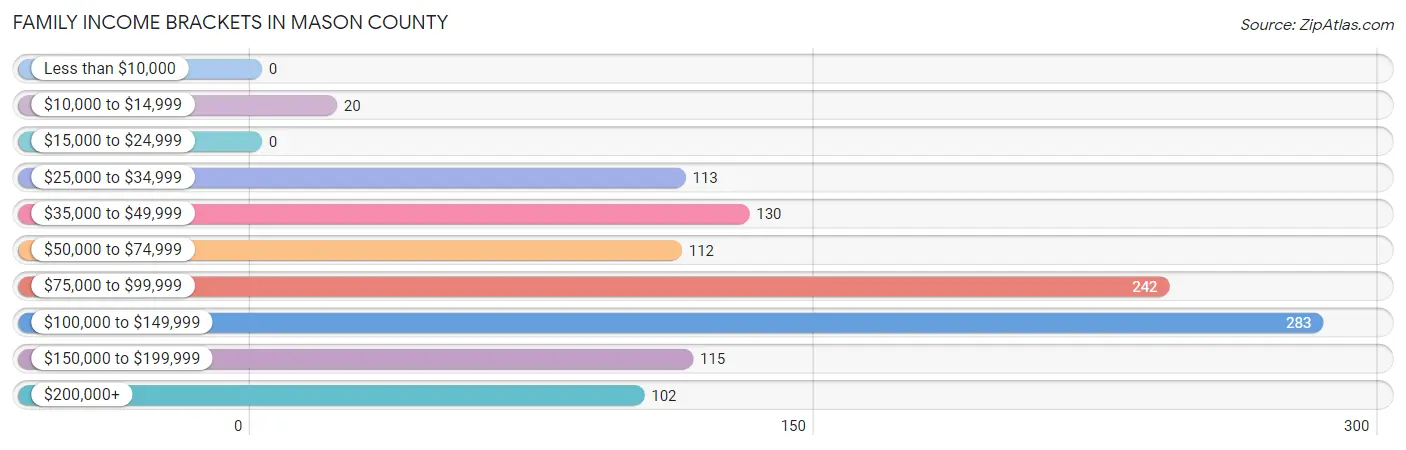
Family Income in Mason County
Family Income Brackets in Mason County
According to the Mason County family income data, there are 283 families falling into the $100,000 to $149,999 income range, which is the most common income bracket and makes up 25.3% of all families.
| Income Bracket | # Families | % Families |
| Less than $10,000 | 0 | 0.0% |
| $10,000 to $14,999 | 20 | 1.8% |
| $15,000 to $24,999 | 0 | 0.0% |
| $25,000 to $34,999 | 113 | 10.1% |
| $35,000 to $49,999 | 130 | 11.6% |
| $50,000 to $74,999 | 112 | 10.0% |
| $75,000 to $99,999 | 242 | 21.7% |
| $100,000 to $149,999 | 283 | 25.3% |
| $150,000 to $199,999 | 115 | 10.3% |
| $200,000+ | 102 | 9.1% |
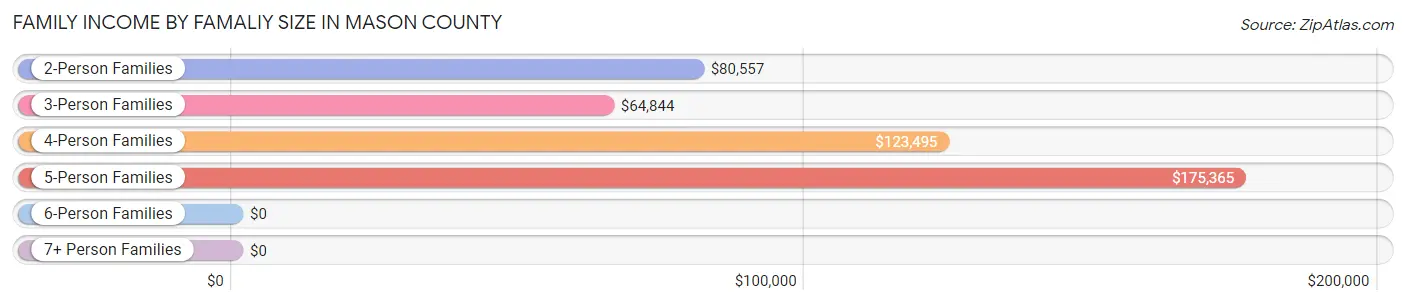
Family Income by Famaliy Size in Mason County
5-person families (124 | 11.1%) account for the highest median family income in Mason County with $175,365 per family, while 2-person families (617 | 55.2%) have the highest median income of $40,278 per family member.
| Income Bracket | # Families | Median Income |
| 2-Person Families | 617 (55.2%) | $80,557 |
| 3-Person Families | 149 (13.3%) | $64,844 |
| 4-Person Families | 197 (17.6%) | $123,495 |
| 5-Person Families | 124 (11.1%) | $175,365 |
| 6-Person Families | 30 (2.7%) | $0 |
| 7+ Person Families | 0 (0.0%) | $0 |
| Total | 1,117 (100.0%) | $96,193 |
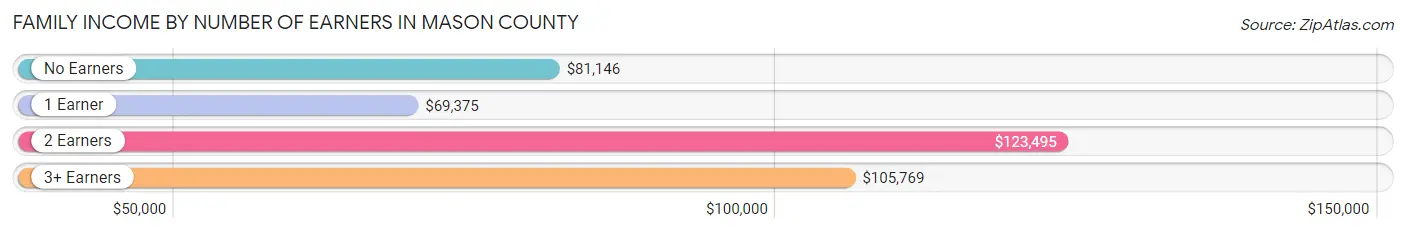
Family Income by Number of Earners in Mason County
The median family income in Mason County is $96,193, with families comprising 2 earners (549) having the highest median family income of $123,495, while families with 1 earner (314) have the lowest median family income of $69,375, accounting for 49.1% and 28.1% of families, respectively.
| Number of Earners | # Families | Median Income |
| No Earners | 204 (18.3%) | $81,146 |
| 1 Earner | 314 (28.1%) | $69,375 |
| 2 Earners | 549 (49.1%) | $123,495 |
| 3+ Earners | 50 (4.5%) | $105,769 |
| Total | 1,117 (100.0%) | $96,193 |
Household Income in Mason County
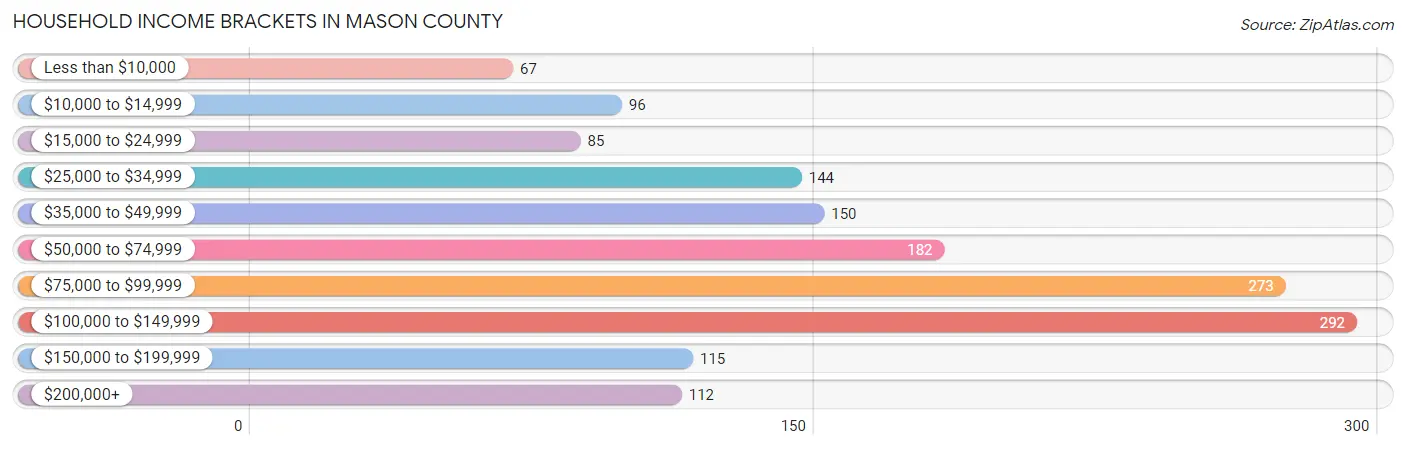
Household Income Brackets in Mason County
With 292 households falling in the category, the $100,000 to $149,999 income range is the most frequent in Mason County, accounting for 19.2% of all households. In contrast, only 67 households (4.4%) fall into the less than $10,000 income bracket, making it the least populous group.
| Income Bracket | # Households | % Households |
| Less than $10,000 | 67 | 4.4% |
| $10,000 to $14,999 | 96 | 6.3% |
| $15,000 to $24,999 | 85 | 5.6% |
| $25,000 to $34,999 | 144 | 9.5% |
| $35,000 to $49,999 | 150 | 9.9% |
| $50,000 to $74,999 | 182 | 12.0% |
| $75,000 to $99,999 | 273 | 18.0% |
| $100,000 to $149,999 | 292 | 19.2% |
| $150,000 to $199,999 | 115 | 7.6% |
| $200,000+ | 112 | 7.4% |
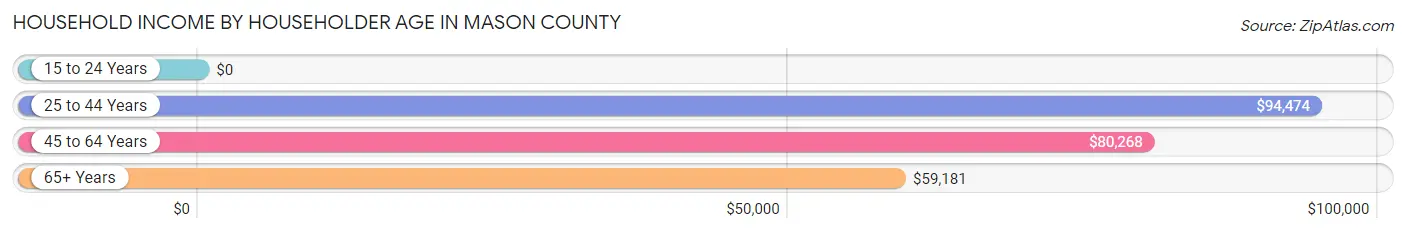
Household Income by Householder Age in Mason County
The median household income in Mason County is $77,583, with the highest median household income of $94,474 found in the 25 to 44 years age bracket for the primary householder. A total of 398 households (26.2%) fall into this category. Meanwhile, the 15 to 24 years age bracket for the primary householder has the lowest median household income of $0, with 18 households (1.2%) in this group.
| Income Bracket | # Households | Median Income |
| 15 to 24 Years | 18 (1.2%) | $0 |
| 25 to 44 Years | 398 (26.2%) | $94,474 |
| 45 to 64 Years | 404 (26.6%) | $80,268 |
| 65+ Years | 699 (46.0%) | $59,181 |
| Total | 1,519 (100.0%) | $77,583 |
Poverty in Mason County
Income Below Poverty by Sex and Age in Mason County
With 4.6% poverty level for males and 5.3% for females among the residents of Mason County, 18 to 24 year old males and 45 to 54 year old females are the most vulnerable to poverty, with 31 males (19.1%) and 29 females (16.4%) in their respective age groups living below the poverty level.
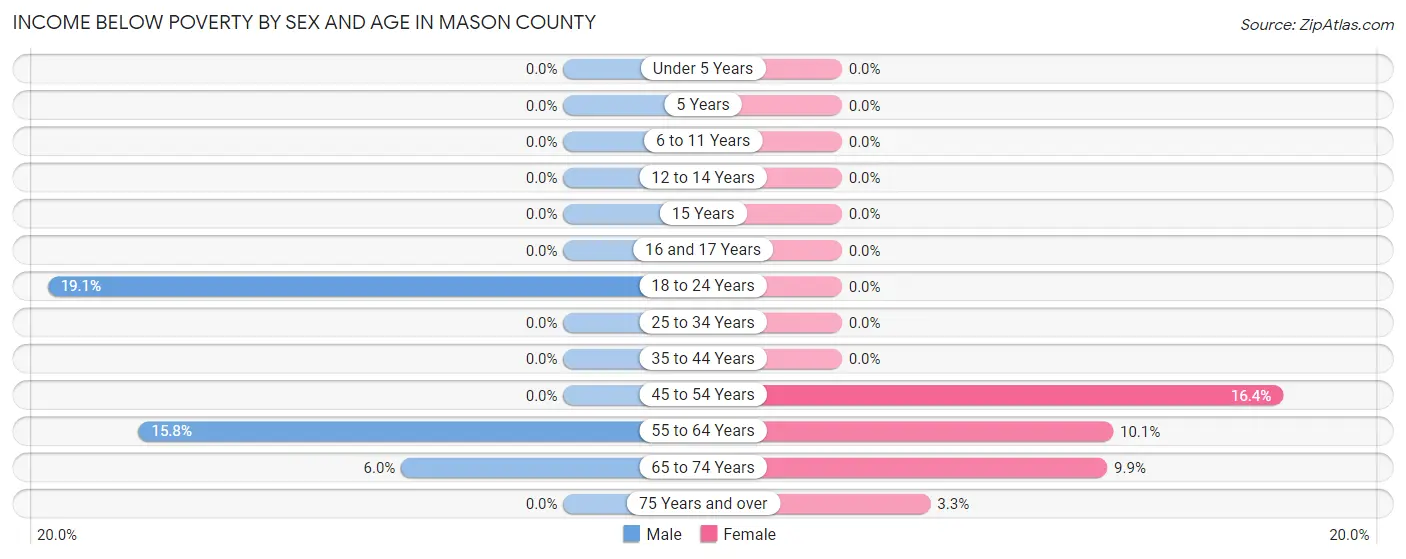
| Age Bracket | Male | Female |
| Under 5 Years | 0 (0.0%) | 0 (0.0%) |
| 5 Years | 0 (0.0%) | 0 (0.0%) |
| 6 to 11 Years | 0 (0.0%) | 0 (0.0%) |
| 12 to 14 Years | 0 (0.0%) | 0 (0.0%) |
| 15 Years | 0 (0.0%) | 0 (0.0%) |
| 16 and 17 Years | 0 (0.0%) | 0 (0.0%) |
| 18 to 24 Years | 31 (19.1%) | 0 (0.0%) |
| 25 to 34 Years | 0 (0.0%) | 0 (0.0%) |
| 35 to 44 Years | 0 (0.0%) | 0 (0.0%) |
| 45 to 54 Years | 0 (0.0%) | 29 (16.4%) |
| 55 to 64 Years | 38 (15.8%) | 29 (10.1%) |
| 65 to 74 Years | 21 (6.0%) | 39 (9.9%) |
| 75 Years and over | 0 (0.0%) | 8 (3.3%) |
| Total | 90 (4.6%) | 105 (5.3%) |
Income Above Poverty by Sex and Age in Mason County
According to the poverty statistics in Mason County, males aged under 5 years and females aged under 5 years are the age groups that are most secure financially, with 100.0% of males and 100.0% of females in these age groups living above the poverty line.
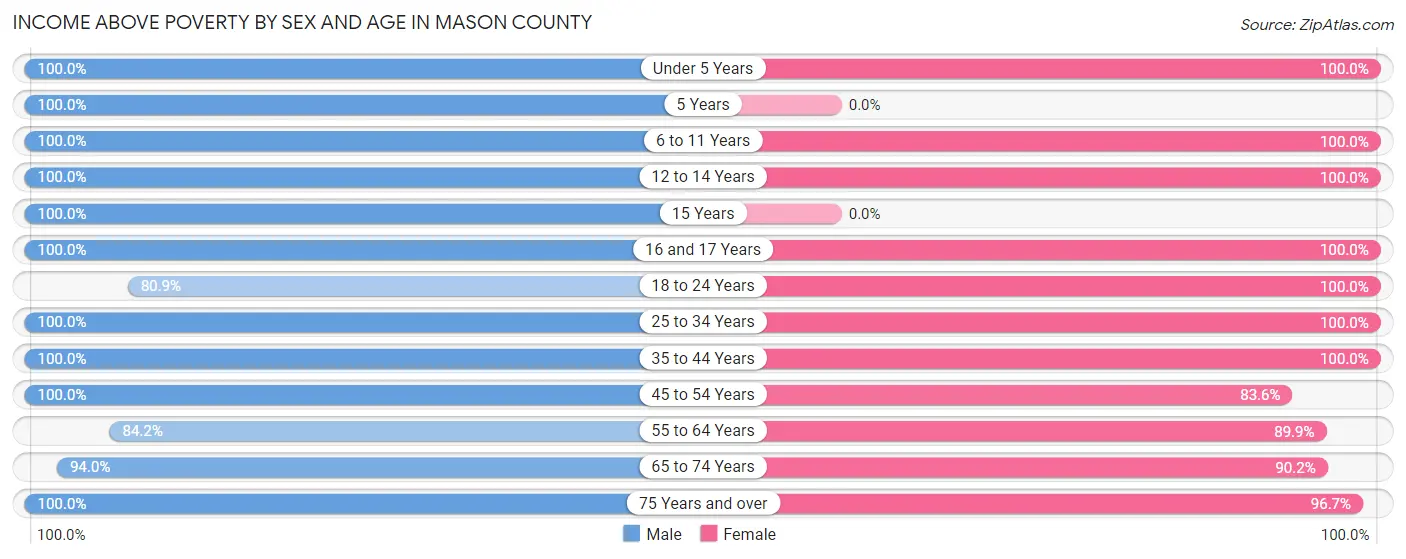
| Age Bracket | Male | Female |
| Under 5 Years | 225 (100.0%) | 115 (100.0%) |
| 5 Years | 26 (100.0%) | 0 (0.0%) |
| 6 to 11 Years | 150 (100.0%) | 178 (100.0%) |
| 12 to 14 Years | 43 (100.0%) | 23 (100.0%) |
| 15 Years | 17 (100.0%) | 0 (0.0%) |
| 16 and 17 Years | 20 (100.0%) | 87 (100.0%) |
| 18 to 24 Years | 131 (80.9%) | 142 (100.0%) |
| 25 to 34 Years | 199 (100.0%) | 124 (100.0%) |
| 35 to 44 Years | 196 (100.0%) | 209 (100.0%) |
| 45 to 54 Years | 93 (100.0%) | 148 (83.6%) |
| 55 to 64 Years | 203 (84.2%) | 259 (89.9%) |
| 65 to 74 Years | 328 (94.0%) | 357 (90.1%) |
| 75 Years and over | 247 (100.0%) | 235 (96.7%) |
| Total | 1,878 (95.4%) | 1,877 (94.7%) |
Income Below Poverty Among Married-Couple Families in Mason County
The poverty statistics for married-couple families in Mason County show that 1.4% or 14 of the total 1,002 families live below the poverty line. Families with no children have the highest poverty rate of 2.1%, comprising of 14 families. On the other hand, families with 1 or 2 children have the lowest poverty rate of 0.0%, which includes 0 families.
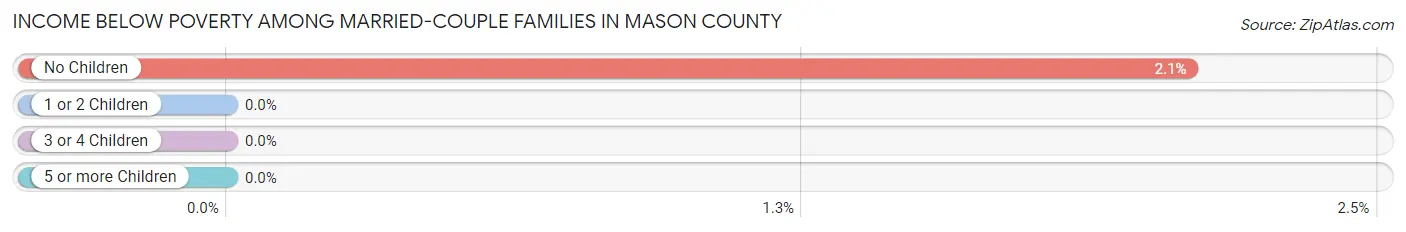
| Children | Above Poverty | Below Poverty |
| No Children | 656 (97.9%) | 14 (2.1%) |
| 1 or 2 Children | 188 (100.0%) | 0 (0.0%) |
| 3 or 4 Children | 144 (100.0%) | 0 (0.0%) |
| 5 or more Children | 0 (0.0%) | 0 (0.0%) |
| Total | 988 (98.6%) | 14 (1.4%) |
Income Below Poverty Among Single-Parent Households in Mason County
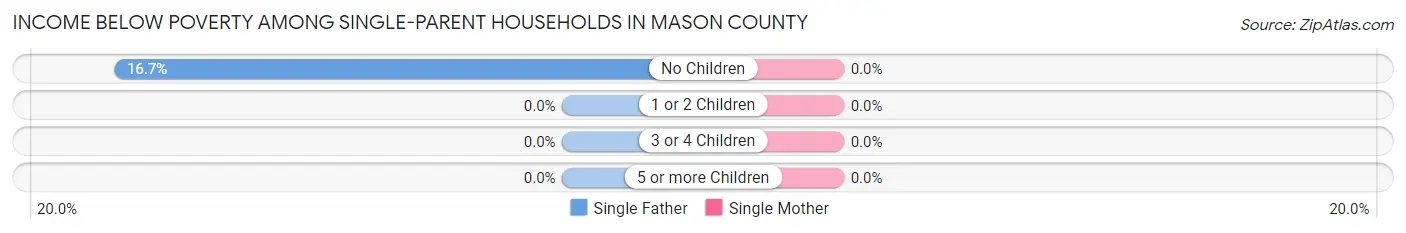
| Children | Single Father | Single Mother |
| No Children | 6 (16.7%) | 0 (0.0%) |
| 1 or 2 Children | 0 (0.0%) | 0 (0.0%) |
| 3 or 4 Children | 0 (0.0%) | 0 (0.0%) |
| 5 or more Children | 0 (0.0%) | 0 (0.0%) |
| Total | 6 (16.7%) | 0 (0.0%) |
Income Below Poverty Among Married-Couple vs Single-Parent Households in Mason County
The poverty data for Mason County shows that 14 of the married-couple family households (1.4%) and 6 of the single-parent households (5.2%) are living below the poverty level. Within the married-couple family households, those with no children have the highest poverty rate, with 14 households (2.1%) falling below the poverty line. Among the single-parent households, those with no children have the highest poverty rate, with 6 household (7.9%) living below poverty.
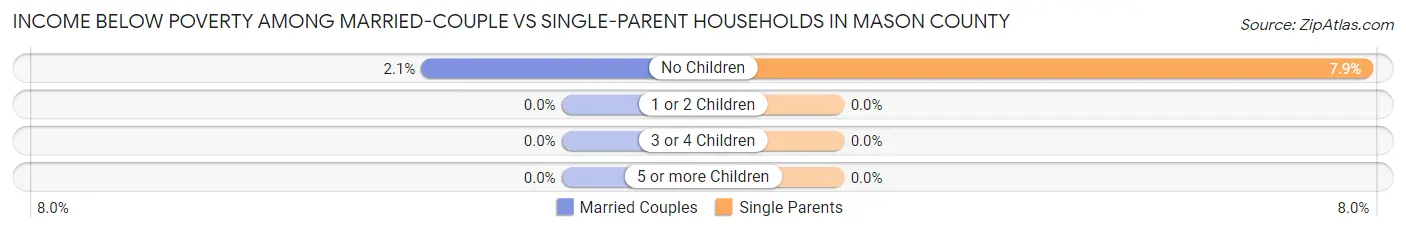
| Children | Married-Couple Families | Single-Parent Households |
| No Children | 14 (2.1%) | 6 (7.9%) |
| 1 or 2 Children | 0 (0.0%) | 0 (0.0%) |
| 3 or 4 Children | 0 (0.0%) | 0 (0.0%) |
| 5 or more Children | 0 (0.0%) | 0 (0.0%) |
| Total | 14 (1.4%) | 6 (5.2%) |
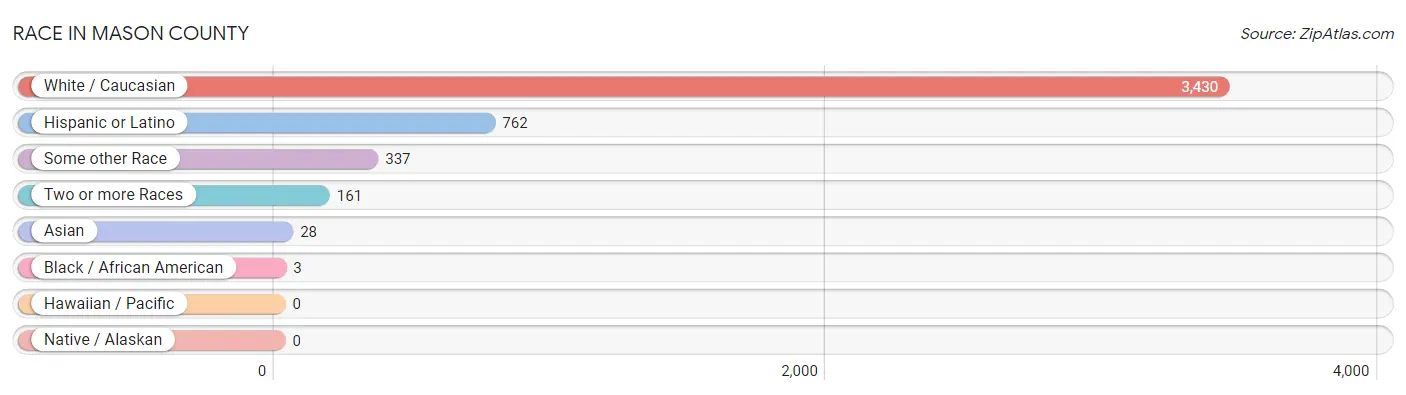
Race in Mason County
The most populous races in Mason County are White / Caucasian (3,430 | 86.6%), Hispanic or Latino (762 | 19.3%), and Some other Race (337 | 8.5%).
| Race | # Population | % Population |
| Asian | 28 | 0.7% |
| Black / African American | 3 | 0.1% |
| Hawaiian / Pacific | 0 | 0.0% |
| Hispanic or Latino | 762 | 19.3% |
| Native / Alaskan | 0 | 0.0% |
| White / Caucasian | 3,430 | 86.6% |
| Two or more Races | 161 | 4.1% |
| Some other Race | 337 | 8.5% |
| Total | 3,959 | 100.0% |
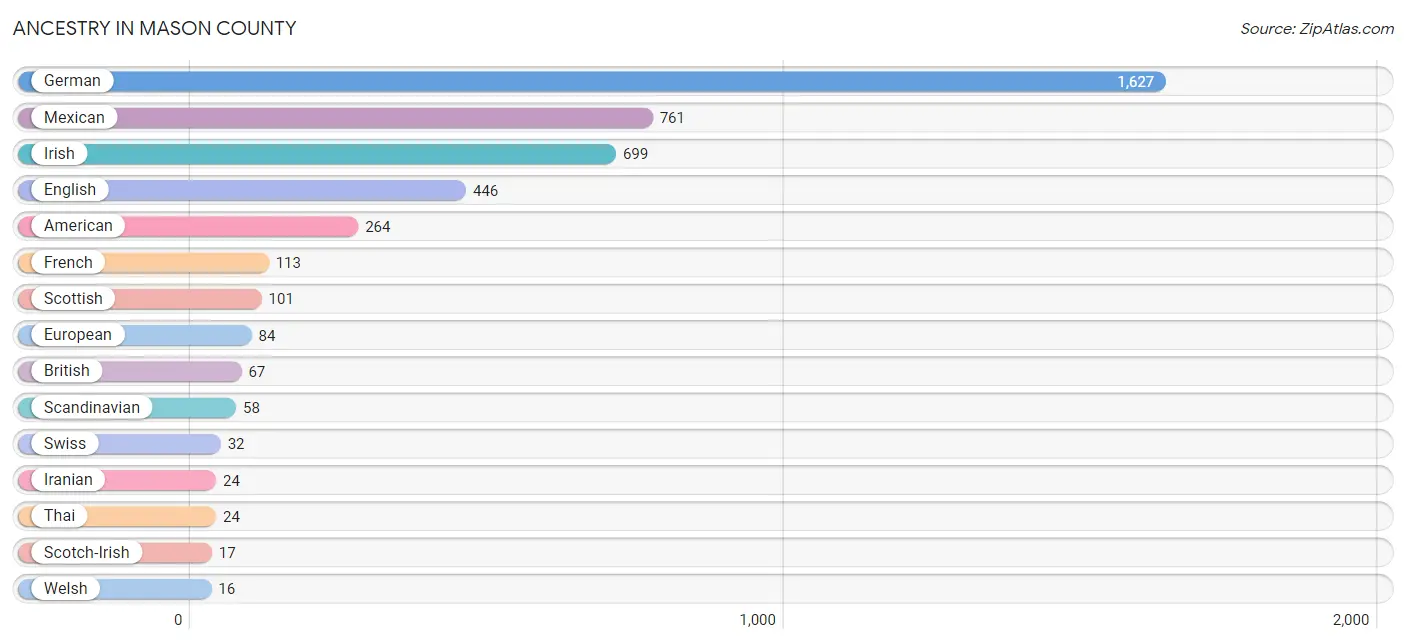
Ancestry in Mason County
The most populous ancestries reported in Mason County are German (1,627 | 41.1%), Mexican (761 | 19.2%), Irish (699 | 17.7%), English (446 | 11.3%), and American (264 | 6.7%), together accounting for 95.9% of all Mason County residents.
| Ancestry | # Population | % Population |
| American | 264 | 6.7% |
| Apache | 7 | 0.2% |
| Austrian | 15 | 0.4% |
| British | 67 | 1.7% |
| Central American | 1 | 0.0% |
| Czech | 11 | 0.3% |
| Danish | 3 | 0.1% |
| Dutch West Indian | 14 | 0.4% |
| English | 446 | 11.3% |
| European | 84 | 2.1% |
| Finnish | 4 | 0.1% |
| French | 113 | 2.9% |
| German | 1,627 | 41.1% |
| Honduran | 1 | 0.0% |
| Iranian | 24 | 0.6% |
| Irish | 699 | 17.7% |
| Korean | 4 | 0.1% |
| Mexican | 761 | 19.2% |
| Polish | 11 | 0.3% |
| Scandinavian | 58 | 1.5% |
| Scotch-Irish | 17 | 0.4% |
| Scottish | 101 | 2.5% |
| Swedish | 10 | 0.3% |
| Swiss | 32 | 0.8% |
| Thai | 24 | 0.6% |
| Ukrainian | 5 | 0.1% |
| Welsh | 16 | 0.4% | View All 27 Rows |
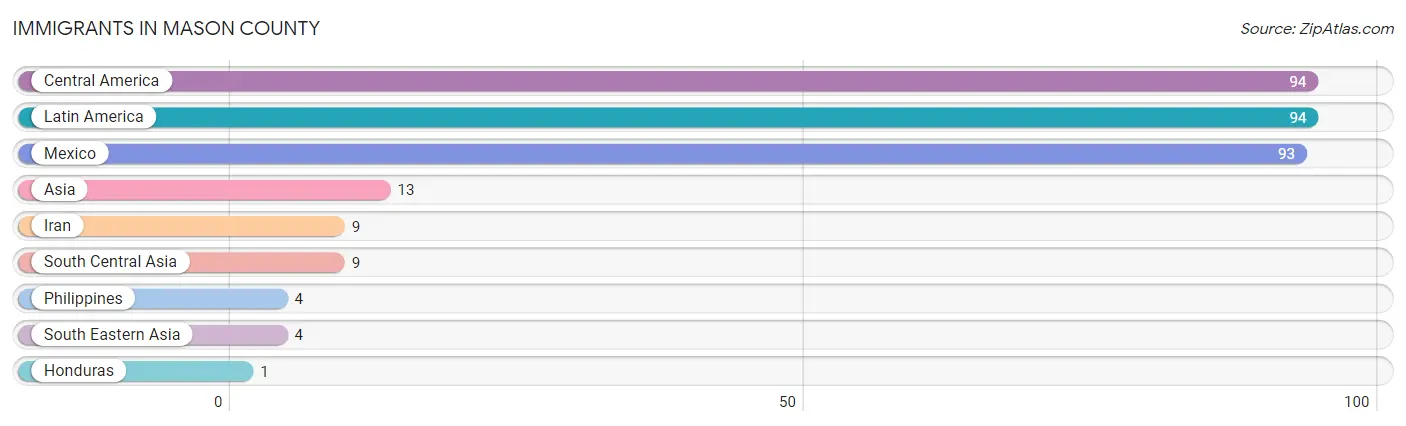
Immigrants in Mason County
The most numerous immigrant groups reported in Mason County came from Central America (94 | 2.4%), Latin America (94 | 2.4%), Mexico (93 | 2.4%), Asia (13 | 0.3%), and Iran (9 | 0.2%), together accounting for 7.6% of all Mason County residents.
| Immigration Origin | # Population | % Population |
| Asia | 13 | 0.3% |
| Central America | 94 | 2.4% |
| Honduras | 1 | 0.0% |
| Iran | 9 | 0.2% |
| Latin America | 94 | 2.4% |
| Mexico | 93 | 2.4% |
| Philippines | 4 | 0.1% |
| South Central Asia | 9 | 0.2% |
| South Eastern Asia | 4 | 0.1% | View All 9 Rows |
Sex and Age in Mason County
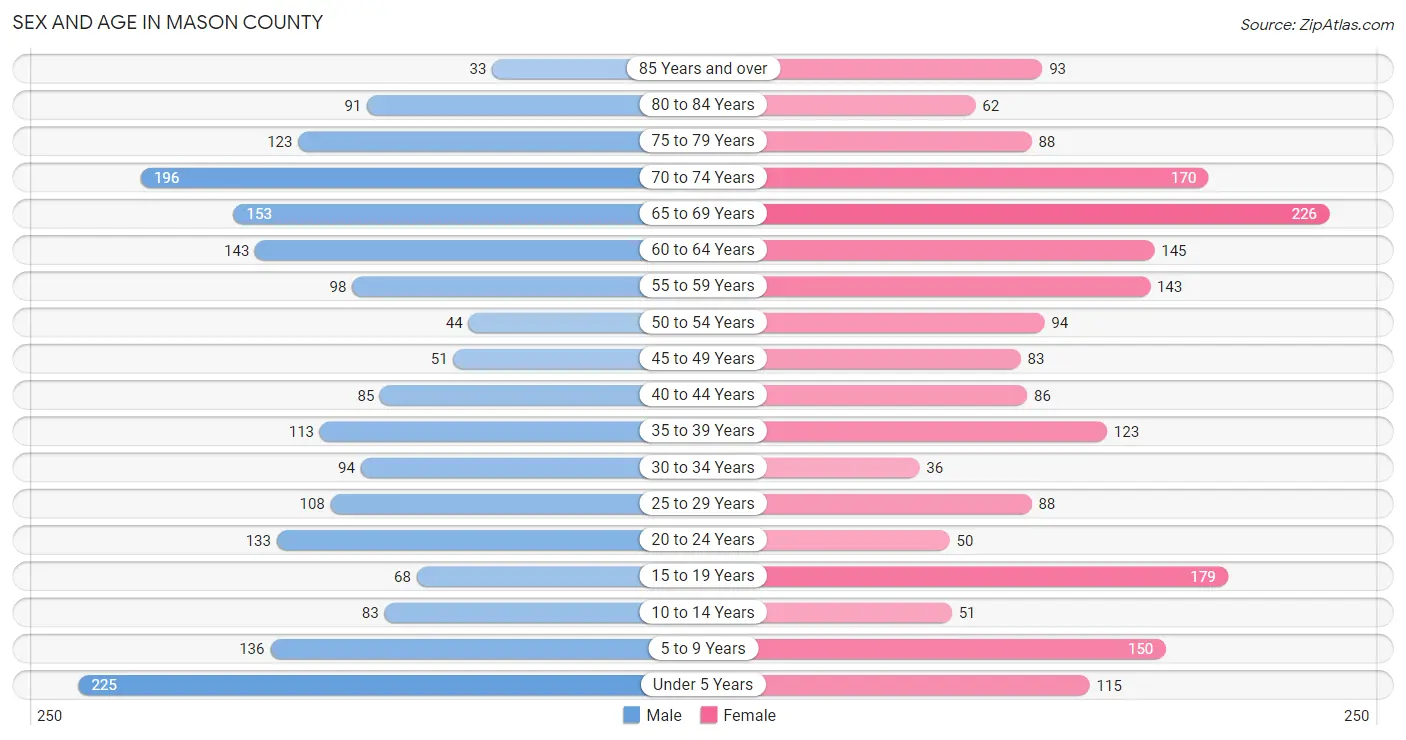
Sex and Age in Mason County
The most populous age groups in Mason County are Under 5 Years (225 | 11.4%) for men and 65 to 69 Years (226 | 11.4%) for women.
| Age Bracket | Male | Female |
| Under 5 Years | 225 (11.4%) | 115 (5.8%) |
| 5 to 9 Years | 136 (6.9%) | 150 (7.6%) |
| 10 to 14 Years | 83 (4.2%) | 51 (2.6%) |
| 15 to 19 Years | 68 (3.4%) | 179 (9.0%) |
| 20 to 24 Years | 133 (6.7%) | 50 (2.5%) |
| 25 to 29 Years | 108 (5.5%) | 88 (4.4%) |
| 30 to 34 Years | 94 (4.8%) | 36 (1.8%) |
| 35 to 39 Years | 113 (5.7%) | 123 (6.2%) |
| 40 to 44 Years | 85 (4.3%) | 86 (4.3%) |
| 45 to 49 Years | 51 (2.6%) | 83 (4.2%) |
| 50 to 54 Years | 44 (2.2%) | 94 (4.7%) |
| 55 to 59 Years | 98 (5.0%) | 143 (7.2%) |
| 60 to 64 Years | 143 (7.2%) | 145 (7.3%) |
| 65 to 69 Years | 153 (7.7%) | 226 (11.4%) |
| 70 to 74 Years | 196 (9.9%) | 170 (8.6%) |
| 75 to 79 Years | 123 (6.2%) | 88 (4.4%) |
| 80 to 84 Years | 91 (4.6%) | 62 (3.1%) |
| 85 Years and over | 33 (1.7%) | 93 (4.7%) |
| Total | 1,977 (100.0%) | 1,982 (100.0%) |
Families and Households in Mason County
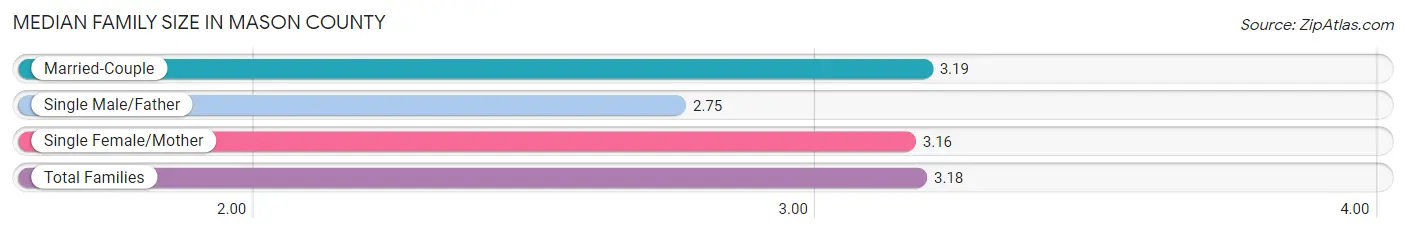
Median Family Size in Mason County
The median family size in Mason County is 3.18 persons per family, with married-couple families (1,002 | 89.7%) accounting for the largest median family size of 3.19 persons per family. On the other hand, single male/father families (36 | 3.2%) represent the smallest median family size with 2.75 persons per family.
| Family Type | # Families | Family Size |
| Married-Couple | 1,002 (89.7%) | 3.19 |
| Single Male/Father | 36 (3.2%) | 2.75 |
| Single Female/Mother | 79 (7.1%) | 3.16 |
| Total Families | 1,117 (100.0%) | 3.18 |
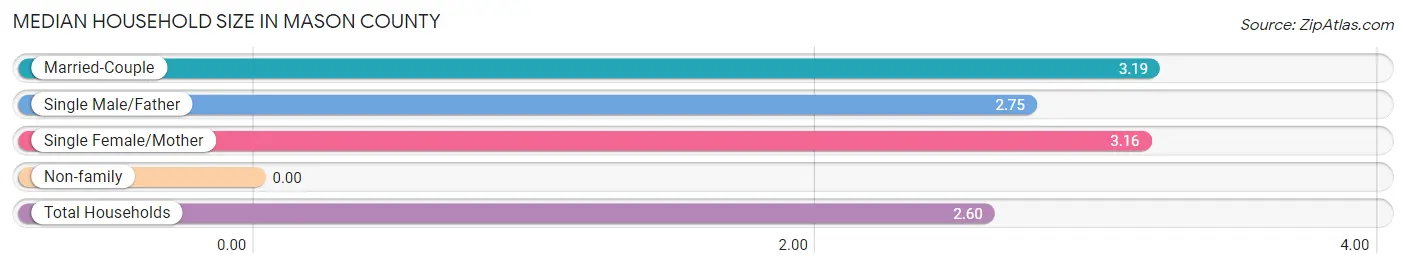
Median Household Size in Mason County
| Household Type | # Households | Household Size |
| Married-Couple | 1,002 (66.0%) | 3.19 |
| Single Male/Father | 36 (2.4%) | 2.75 |
| Single Female/Mother | 79 (5.2%) | 3.16 |
| Non-family | 402 (26.5%) | - |
| Total Households | 1,519 (100.0%) | 2.60 |
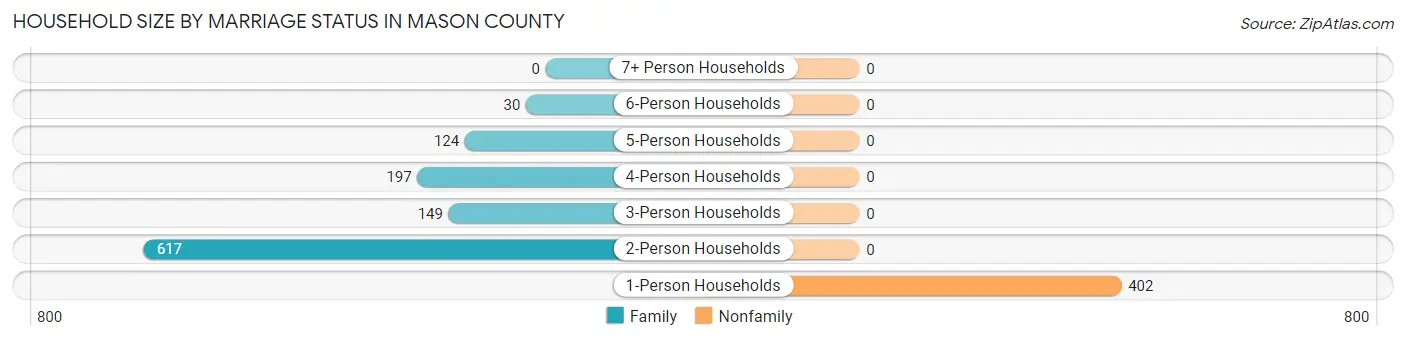
Household Size by Marriage Status in Mason County
Out of a total of 1,519 households in Mason County, 1,117 (73.5%) are family households, while 402 (26.5%) are nonfamily households. The most numerous type of family households are 2-person households, comprising 617, and the most common type of nonfamily households are 1-person households, comprising 402.
| Household Size | Family Households | Nonfamily Households |
| 1-Person Households | - | 402 (26.5%) |
| 2-Person Households | 617 (40.6%) | 0 (0.0%) |
| 3-Person Households | 149 (9.8%) | 0 (0.0%) |
| 4-Person Households | 197 (13.0%) | 0 (0.0%) |
| 5-Person Households | 124 (8.2%) | 0 (0.0%) |
| 6-Person Households | 30 (2.0%) | 0 (0.0%) |
| 7+ Person Households | 0 (0.0%) | 0 (0.0%) |
| Total | 1,117 (73.5%) | 402 (26.5%) |
Female Fertility in Mason County
Fertility by Age in Mason County
| Age Bracket | Women with Births | Births / 1,000 Women |
| 15 to 19 years | 0 (0.0%) | 0.0 |
| 20 to 34 years | 0 (0.0%) | 0.0 |
| 35 to 50 years | 0 (0.0%) | 0.0 |
| Total | 0 (0.0%) | 0.0 |
Fertility by Age by Marriage Status in Mason County
| Age Bracket | Married | Unmarried |
| 15 to 19 years | 0 (0.0%) | 0 (0.0%) |
| 20 to 34 years | 0 (0.0%) | 0 (0.0%) |
| 35 to 50 years | 0 (0.0%) | 0 (0.0%) |
| Total | 0 (0.0%) | 0 (0.0%) |
Fertility by Education in Mason County
| Educational Attainment | Women with Births | Births / 1,000 Women |
| Less than High School | 0 (0.0%) | 0.0 |
| High School Diploma | 0 (0.0%) | 0.0 |
| College or Associate's Degree | 0 (0.0%) | 0.0 |
| Bachelor's Degree | 0 (0.0%) | 0.0 |
| Graduate Degree | 0 (0.0%) | 0.0 |
| Total | 0 (0.0%) | 0.0 |
Fertility by Education by Marriage Status in Mason County
| Educational Attainment | Married | Unmarried |
| Less than High School | 0 (0.0%) | 0 (0.0%) |
| High School Diploma | 0 (0.0%) | 0 (0.0%) |
| College or Associate's Degree | 0 (0.0%) | 0 (0.0%) |
| Bachelor's Degree | 0 (0.0%) | 0 (0.0%) |
| Graduate Degree | 0 (0.0%) | 0 (0.0%) |
| Total | 0 (0.0%) | 0 (0.0%) |
Employment Characteristics in Mason County
Employment by Class of Employer in Mason County
Among the 1,629 employed individuals in Mason County, private company employees (820 | 50.3%), local government employees (271 | 16.6%), and self-employed (not incorporated) (206 | 12.7%) make up the most common classes of employment.
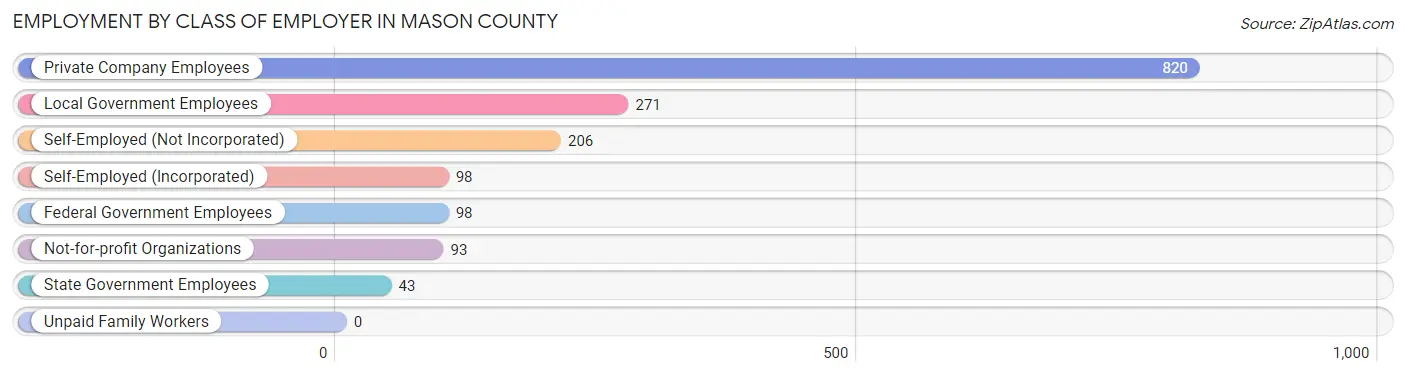
| Employer Class | # Employees | % Employees |
| Private Company Employees | 820 | 50.3% |
| Self-Employed (Incorporated) | 98 | 6.0% |
| Self-Employed (Not Incorporated) | 206 | 12.7% |
| Not-for-profit Organizations | 93 | 5.7% |
| Local Government Employees | 271 | 16.6% |
| State Government Employees | 43 | 2.6% |
| Federal Government Employees | 98 | 6.0% |
| Unpaid Family Workers | 0 | 0.0% |
| Total | 1,629 | 100.0% |
Employment Status by Age in Mason County
According to the labor force statistics for Mason County, out of the total population over 16 years of age (3,182), 52.7% or 1,677 individuals are in the labor force, with 2.8% or 47 of them unemployed. The age group with the highest labor force participation rate is 45 to 54 years, with 99.3% or 270 individuals in the labor force. Within the labor force, the 45 to 54 years age range has the highest percentage of unemployed individuals, with 6.7% or 18 of them being unemployed.
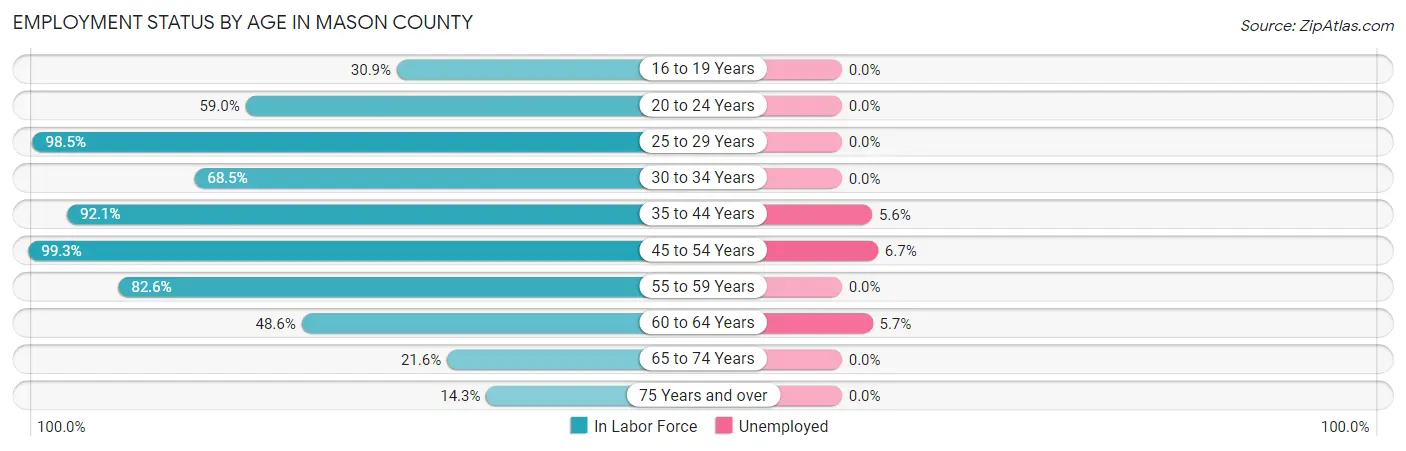
| Age Bracket | In Labor Force | Unemployed |
| 16 to 19 Years | 71 (30.9%) | 0 (0.0%) |
| 20 to 24 Years | 108 (59.0%) | 0 (0.0%) |
| 25 to 29 Years | 193 (98.5%) | 0 (0.0%) |
| 30 to 34 Years | 89 (68.5%) | 0 (0.0%) |
| 35 to 44 Years | 375 (92.1%) | 21 (5.6%) |
| 45 to 54 Years | 270 (99.3%) | 18 (6.7%) |
| 55 to 59 Years | 199 (82.6%) | 0 (0.0%) |
| 60 to 64 Years | 140 (48.6%) | 8 (5.7%) |
| 65 to 74 Years | 161 (21.6%) | 0 (0.0%) |
| 75 Years and over | 70 (14.3%) | 0 (0.0%) |
| Total | 1,677 (52.7%) | 47 (2.8%) |
Employment Status by Educational Attainment in Mason County
According to labor force statistics for Mason County, 82.5% of individuals (1,266) out of the total population between 25 and 64 years of age (1,534) are in the labor force, with 3.7% or 47 of them being unemployed. The group with the highest labor force participation rate are those with the educational attainment of bachelor's degree or higher, with 90.3% or 622 individuals in the labor force. Within the labor force, individuals with college / associate degree education have the highest percentage of unemployment, with 7.0% or 21 of them being unemployed.
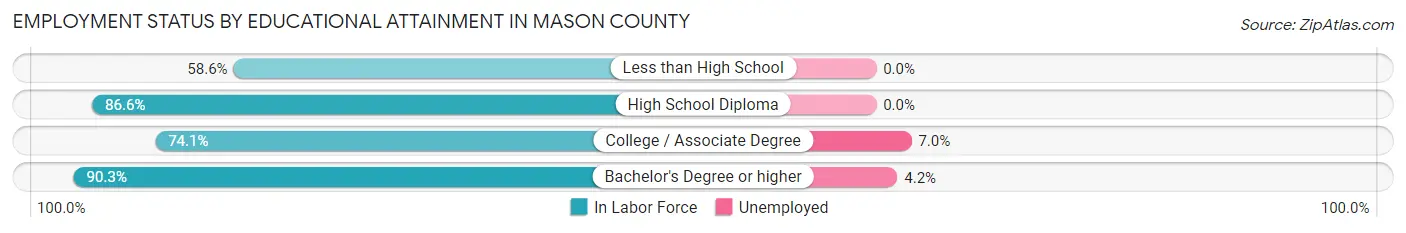
| Educational Attainment | In Labor Force | Unemployed |
| Less than High School | 78 (58.6%) | 0 (0.0%) |
| High School Diploma | 265 (86.6%) | 0 (0.0%) |
| College / Associate Degree | 301 (74.1%) | 28 (7.0%) |
| Bachelor's Degree or higher | 622 (90.3%) | 29 (4.2%) |
| Total | 1,266 (82.5%) | 57 (3.7%) |
Employment Occupations by Sex in Mason County
Management, Business, Science and Arts Occupations
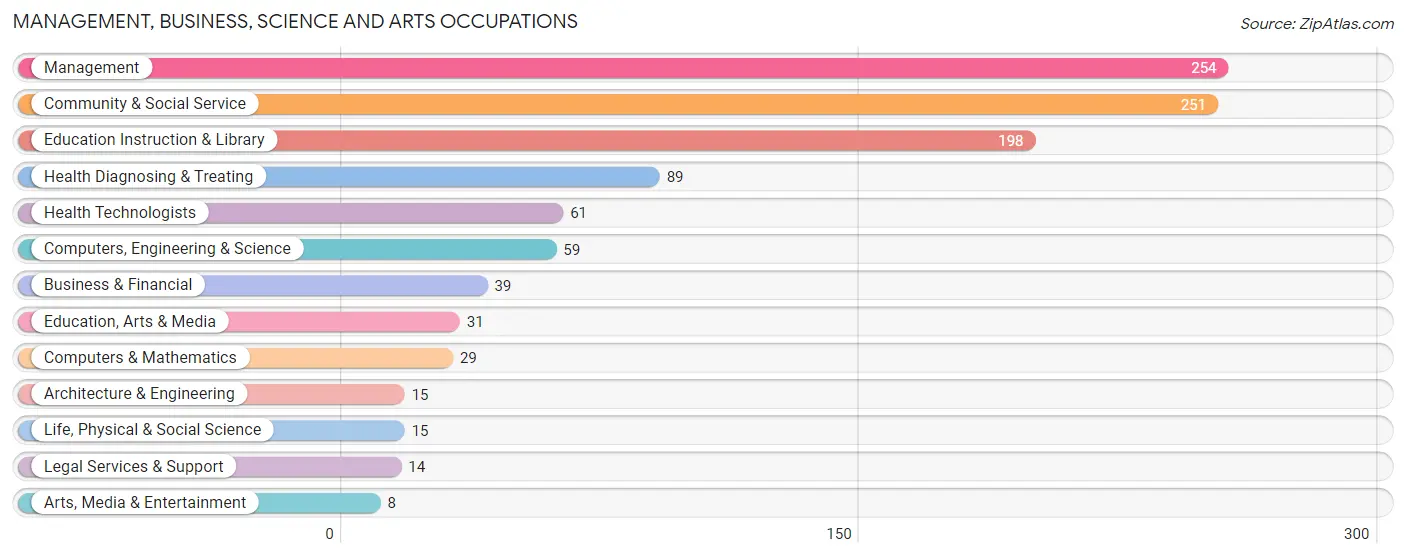
The most common Management, Business, Science and Arts occupations in Mason County are Management (254 | 15.6%), Community & Social Service (251 | 15.4%), Education Instruction & Library (198 | 12.1%), Health Diagnosing & Treating (89 | 5.5%), and Health Technologists (61 | 3.7%).
Management, Business, Science and Arts Occupations by Sex
Within the Management, Business, Science and Arts occupations in Mason County, the most male-oriented occupations are Architecture & Engineering (100.0%), Legal Services & Support (100.0%), and Computers, Engineering & Science (89.8%), while the most female-oriented occupations are Arts, Media & Entertainment (100.0%), Health Diagnosing & Treating (100.0%), and Health Technologists (100.0%).
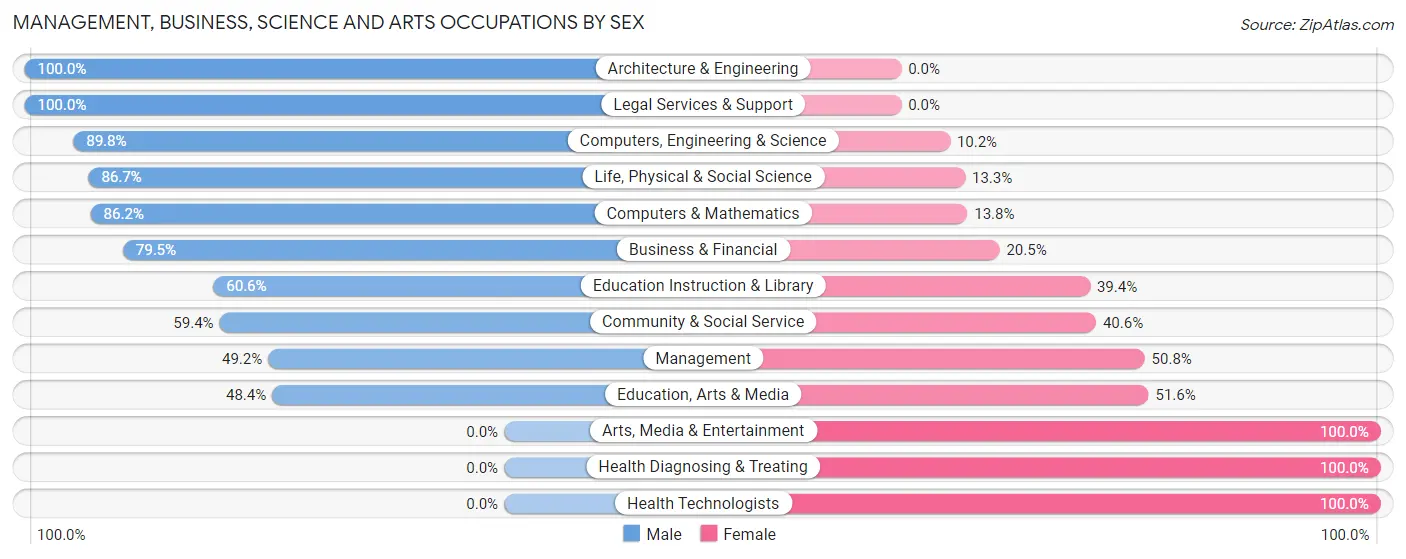
| Occupation | Male | Female |
| Management | 125 (49.2%) | 129 (50.8%) |
| Business & Financial | 31 (79.5%) | 8 (20.5%) |
| Computers, Engineering & Science | 53 (89.8%) | 6 (10.2%) |
| Computers & Mathematics | 25 (86.2%) | 4 (13.8%) |
| Architecture & Engineering | 15 (100.0%) | 0 (0.0%) |
| Life, Physical & Social Science | 13 (86.7%) | 2 (13.3%) |
| Community & Social Service | 149 (59.4%) | 102 (40.6%) |
| Education, Arts & Media | 15 (48.4%) | 16 (51.6%) |
| Legal Services & Support | 14 (100.0%) | 0 (0.0%) |
| Education Instruction & Library | 120 (60.6%) | 78 (39.4%) |
| Arts, Media & Entertainment | 0 (0.0%) | 8 (100.0%) |
| Health Diagnosing & Treating | 0 (0.0%) | 89 (100.0%) |
| Health Technologists | 0 (0.0%) | 61 (100.0%) |
| Total (Category) | 358 (51.7%) | 334 (48.3%) |
| Total (Overall) | 827 (50.8%) | 802 (49.2%) |
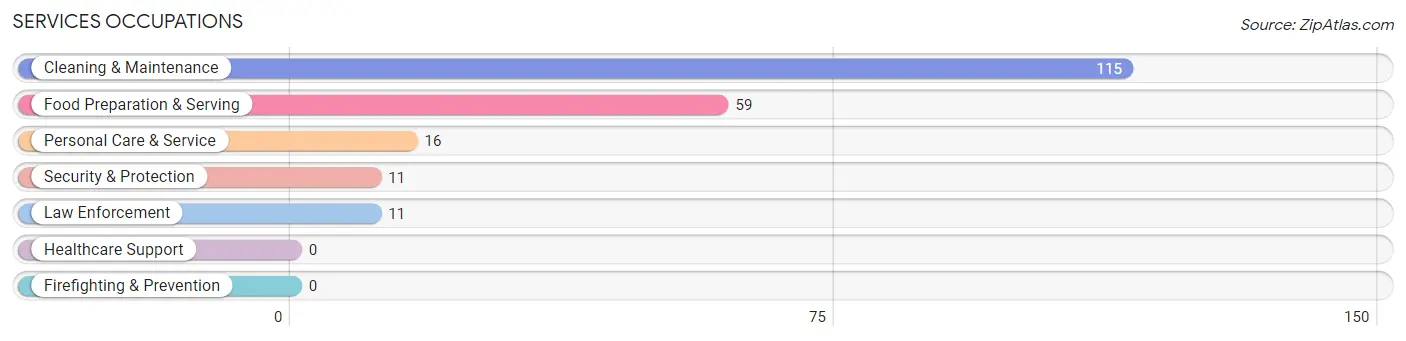
Services Occupations
The most common Services occupations in Mason County are Cleaning & Maintenance (115 | 7.1%), Food Preparation & Serving (59 | 3.6%), Personal Care & Service (16 | 1.0%), Security & Protection (11 | 0.7%), and Law Enforcement (11 | 0.7%).
Services Occupations by Sex
Within the Services occupations in Mason County, the most male-oriented occupations are Security & Protection (100.0%), Law Enforcement (100.0%), and Personal Care & Service (68.8%), while the most female-oriented occupations are Cleaning & Maintenance (53.9%), Food Preparation & Serving (40.7%), and Personal Care & Service (31.2%).
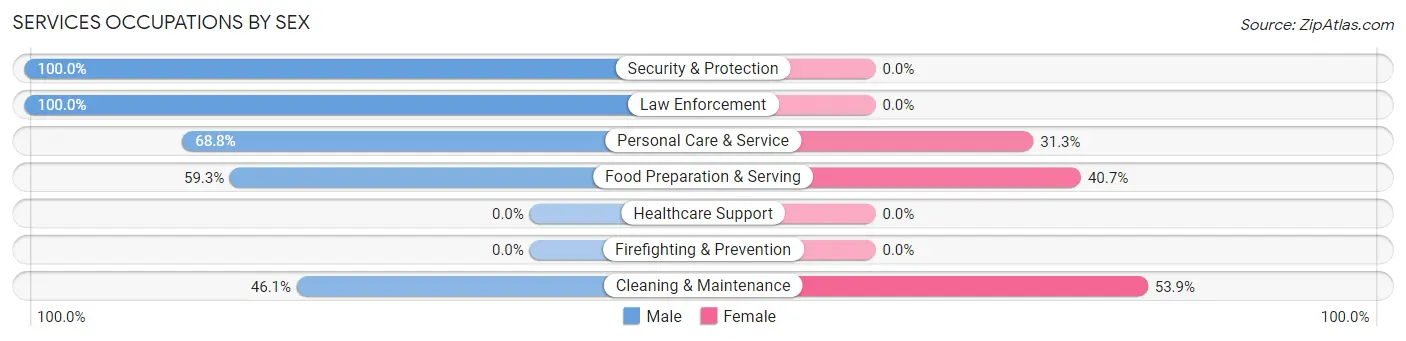
| Occupation | Male | Female |
| Healthcare Support | 0 (0.0%) | 0 (0.0%) |
| Security & Protection | 11 (100.0%) | 0 (0.0%) |
| Firefighting & Prevention | 0 (0.0%) | 0 (0.0%) |
| Law Enforcement | 11 (100.0%) | 0 (0.0%) |
| Food Preparation & Serving | 35 (59.3%) | 24 (40.7%) |
| Cleaning & Maintenance | 53 (46.1%) | 62 (53.9%) |
| Personal Care & Service | 11 (68.8%) | 5 (31.2%) |
| Total (Category) | 110 (54.7%) | 91 (45.3%) |
| Total (Overall) | 827 (50.8%) | 802 (49.2%) |
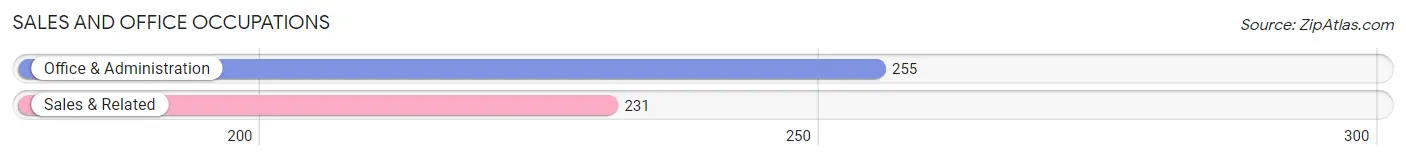
Sales and Office Occupations
The most common Sales and Office occupations in Mason County are Office & Administration (255 | 15.7%), and Sales & Related (231 | 14.2%).
Sales and Office Occupations by Sex
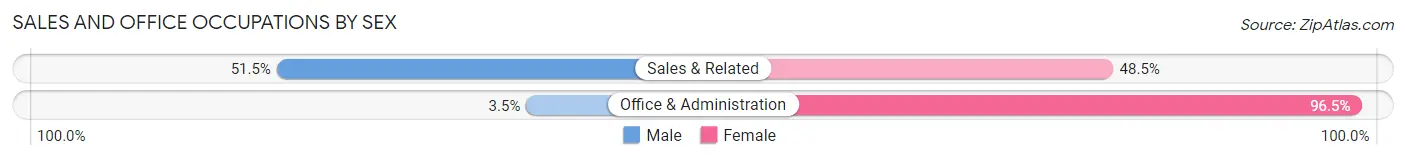
| Occupation | Male | Female |
| Sales & Related | 119 (51.5%) | 112 (48.5%) |
| Office & Administration | 9 (3.5%) | 246 (96.5%) |
| Total (Category) | 128 (26.3%) | 358 (73.7%) |
| Total (Overall) | 827 (50.8%) | 802 (49.2%) |
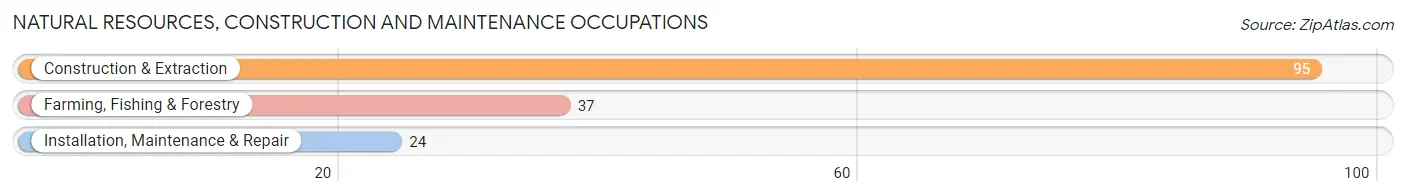
Natural Resources, Construction and Maintenance Occupations
The most common Natural Resources, Construction and Maintenance occupations in Mason County are Construction & Extraction (95 | 5.8%), Farming, Fishing & Forestry (37 | 2.3%), and Installation, Maintenance & Repair (24 | 1.5%).
Natural Resources, Construction and Maintenance Occupations by Sex
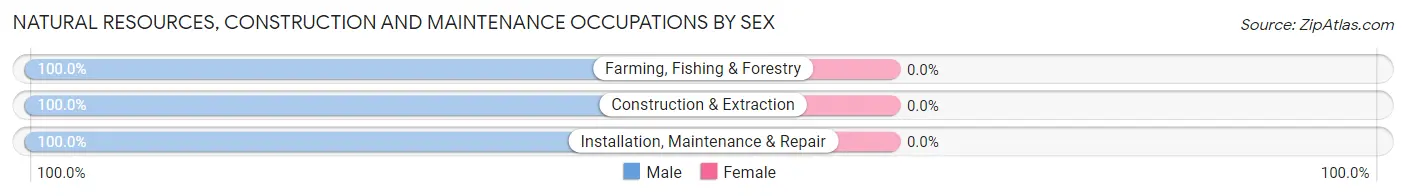
| Occupation | Male | Female |
| Farming, Fishing & Forestry | 37 (100.0%) | 0 (0.0%) |
| Construction & Extraction | 95 (100.0%) | 0 (0.0%) |
| Installation, Maintenance & Repair | 24 (100.0%) | 0 (0.0%) |
| Total (Category) | 156 (100.0%) | 0 (0.0%) |
| Total (Overall) | 827 (50.8%) | 802 (49.2%) |
Production, Transportation and Moving Occupations
The most common Production, Transportation and Moving occupations in Mason County are Material Moving (49 | 3.0%), and Transportation (45 | 2.8%).
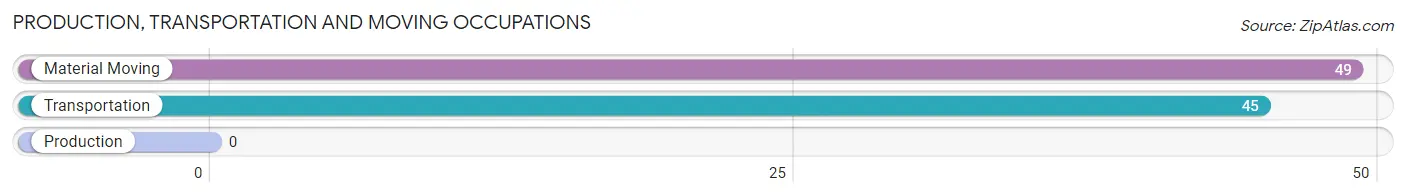
Production, Transportation and Moving Occupations by Sex
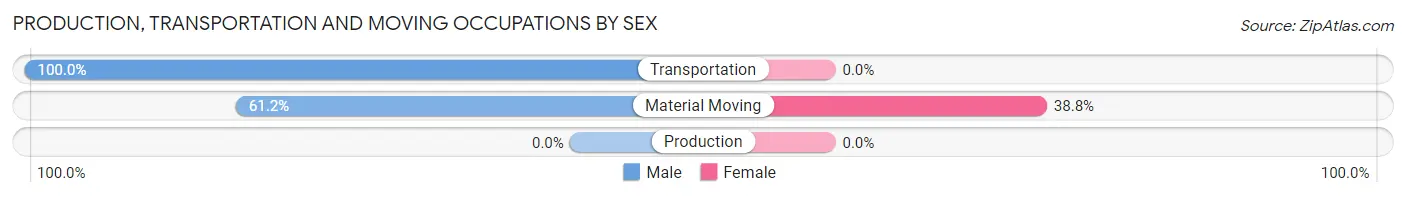
| Occupation | Male | Female |
| Production | 0 (0.0%) | 0 (0.0%) |
| Transportation | 45 (100.0%) | 0 (0.0%) |
| Material Moving | 30 (61.2%) | 19 (38.8%) |
| Total (Category) | 75 (79.8%) | 19 (20.2%) |
| Total (Overall) | 827 (50.8%) | 802 (49.2%) |
Employment Industries by Sex in Mason County
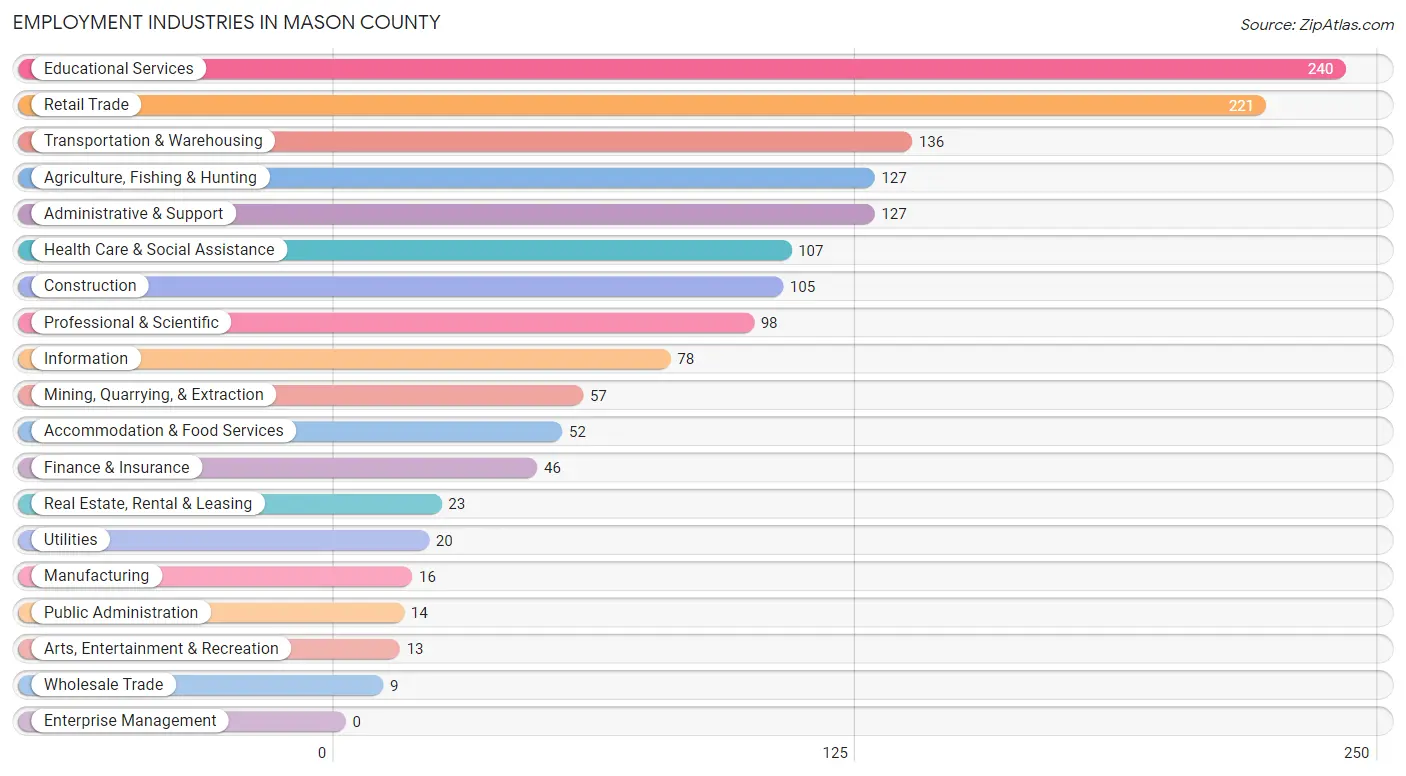
Employment Industries in Mason County
The major employment industries in Mason County include Educational Services (240 | 14.7%), Retail Trade (221 | 13.6%), Transportation & Warehousing (136 | 8.4%), Agriculture, Fishing & Hunting (127 | 7.8%), and Administrative & Support (127 | 7.8%).
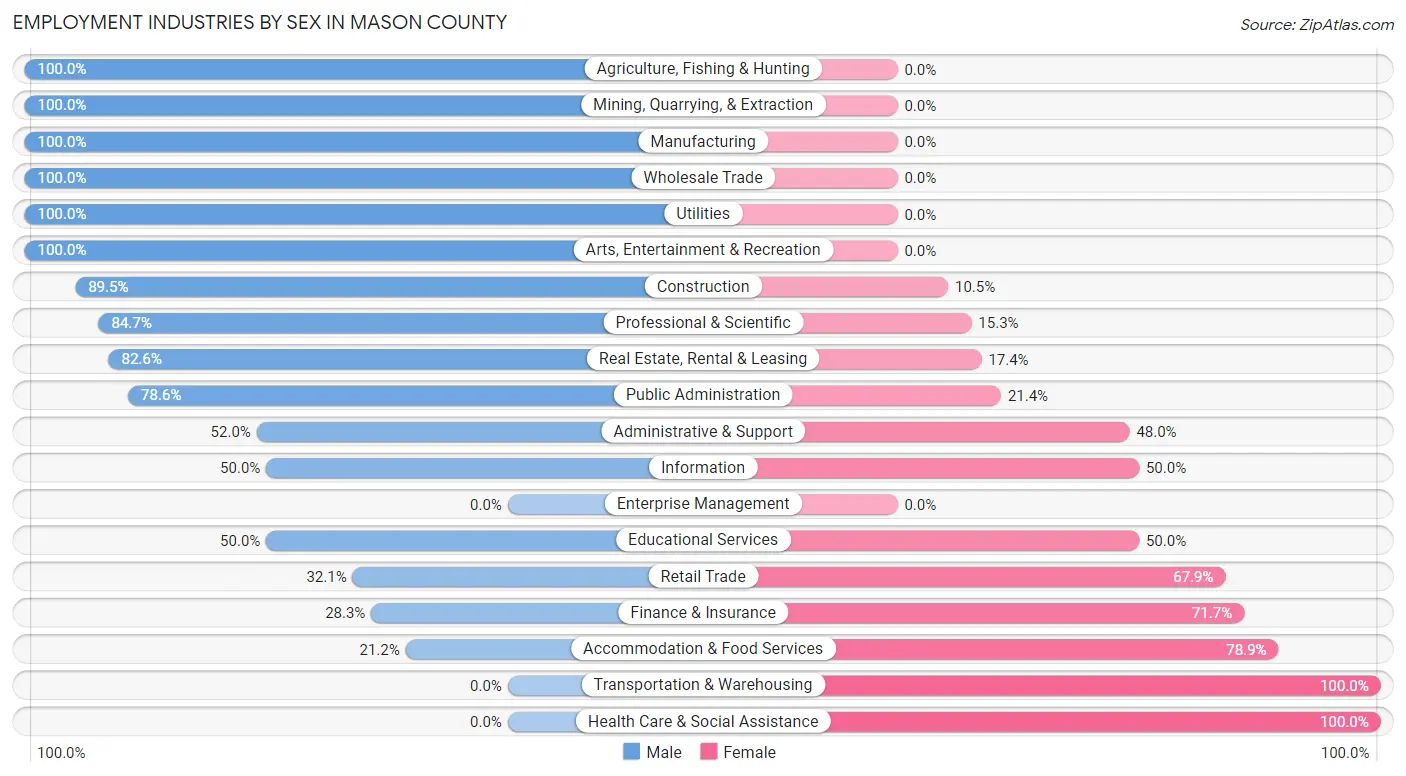
Employment Industries by Sex in Mason County
The Mason County industries that see more men than women are Agriculture, Fishing & Hunting (100.0%), Mining, Quarrying, & Extraction (100.0%), and Manufacturing (100.0%), whereas the industries that tend to have a higher number of women are Transportation & Warehousing (100.0%), Health Care & Social Assistance (100.0%), and Accommodation & Food Services (78.8%).
| Industry | Male | Female |
| Agriculture, Fishing & Hunting | 127 (100.0%) | 0 (0.0%) |
| Mining, Quarrying, & Extraction | 57 (100.0%) | 0 (0.0%) |
| Construction | 94 (89.5%) | 11 (10.5%) |
| Manufacturing | 16 (100.0%) | 0 (0.0%) |
| Wholesale Trade | 9 (100.0%) | 0 (0.0%) |
| Retail Trade | 71 (32.1%) | 150 (67.9%) |
| Transportation & Warehousing | 0 (0.0%) | 136 (100.0%) |
| Utilities | 20 (100.0%) | 0 (0.0%) |
| Information | 39 (50.0%) | 39 (50.0%) |
| Finance & Insurance | 13 (28.3%) | 33 (71.7%) |
| Real Estate, Rental & Leasing | 19 (82.6%) | 4 (17.4%) |
| Professional & Scientific | 83 (84.7%) | 15 (15.3%) |
| Enterprise Management | 0 (0.0%) | 0 (0.0%) |
| Administrative & Support | 66 (52.0%) | 61 (48.0%) |
| Educational Services | 120 (50.0%) | 120 (50.0%) |
| Health Care & Social Assistance | 0 (0.0%) | 107 (100.0%) |
| Arts, Entertainment & Recreation | 13 (100.0%) | 0 (0.0%) |
| Accommodation & Food Services | 11 (21.1%) | 41 (78.8%) |
| Public Administration | 11 (78.6%) | 3 (21.4%) |
| Total | 827 (50.8%) | 802 (49.2%) |
Education in Mason County
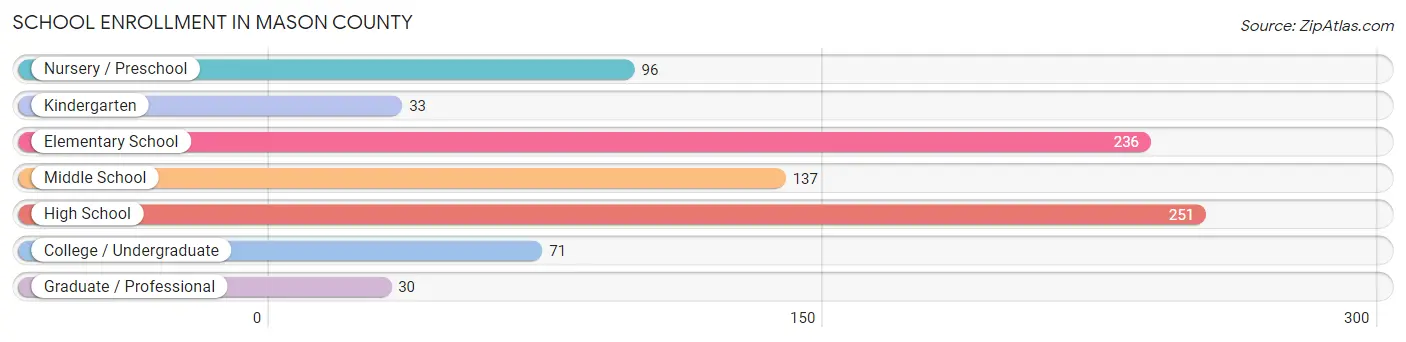
School Enrollment in Mason County
The most common levels of schooling among the 854 students in Mason County are high school (251 | 29.4%), elementary school (236 | 27.6%), and middle school (137 | 16.0%).
| School Level | # Students | % Students |
| Nursery / Preschool | 96 | 11.2% |
| Kindergarten | 33 | 3.9% |
| Elementary School | 236 | 27.6% |
| Middle School | 137 | 16.0% |
| High School | 251 | 29.4% |
| College / Undergraduate | 71 | 8.3% |
| Graduate / Professional | 30 | 3.5% |
| Total | 854 | 100.0% |
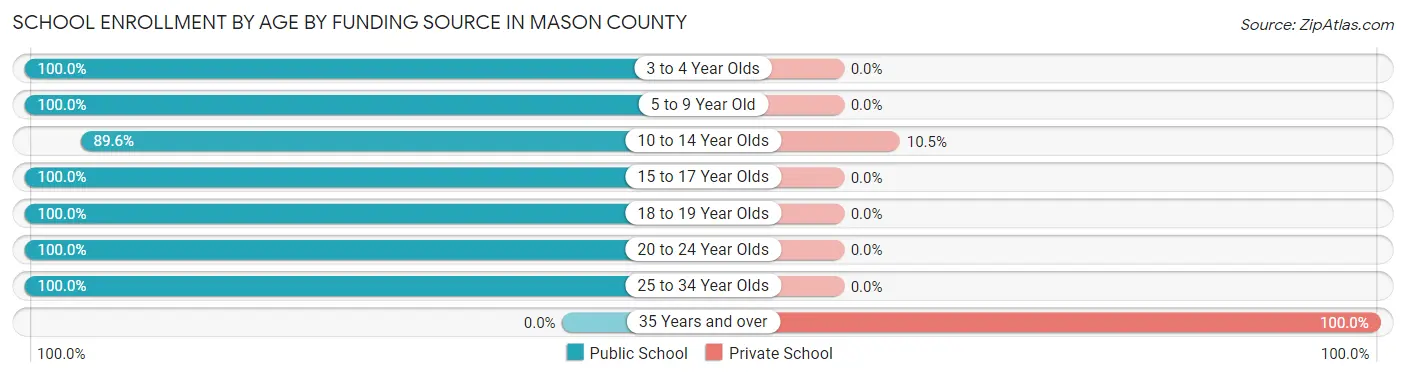
School Enrollment by Age by Funding Source in Mason County
Out of a total of 854 students who are enrolled in schools in Mason County, 19 (2.2%) attend a private institution, while the remaining 835 (97.8%) are enrolled in public schools. The age group of 35 years and over has the highest likelihood of being enrolled in private schools, with 5 (100.0% in the age bracket) enrolled. Conversely, the age group of 3 to 4 year olds has the lowest likelihood of being enrolled in a private school, with 89 (100.0% in the age bracket) attending a public institution.
| Age Bracket | Public School | Private School |
| 3 to 4 Year Olds | 89 (100.0%) | 0 (0.0%) |
| 5 to 9 Year Old | 286 (100.0%) | 0 (0.0%) |
| 10 to 14 Year Olds | 120 (89.5%) | 14 (10.4%) |
| 15 to 17 Year Olds | 124 (100.0%) | 0 (0.0%) |
| 18 to 19 Year Olds | 122 (100.0%) | 0 (0.0%) |
| 20 to 24 Year Olds | 69 (100.0%) | 0 (0.0%) |
| 25 to 34 Year Olds | 25 (100.0%) | 0 (0.0%) |
| 35 Years and over | 0 (0.0%) | 5 (100.0%) |
| Total | 835 (97.8%) | 19 (2.2%) |
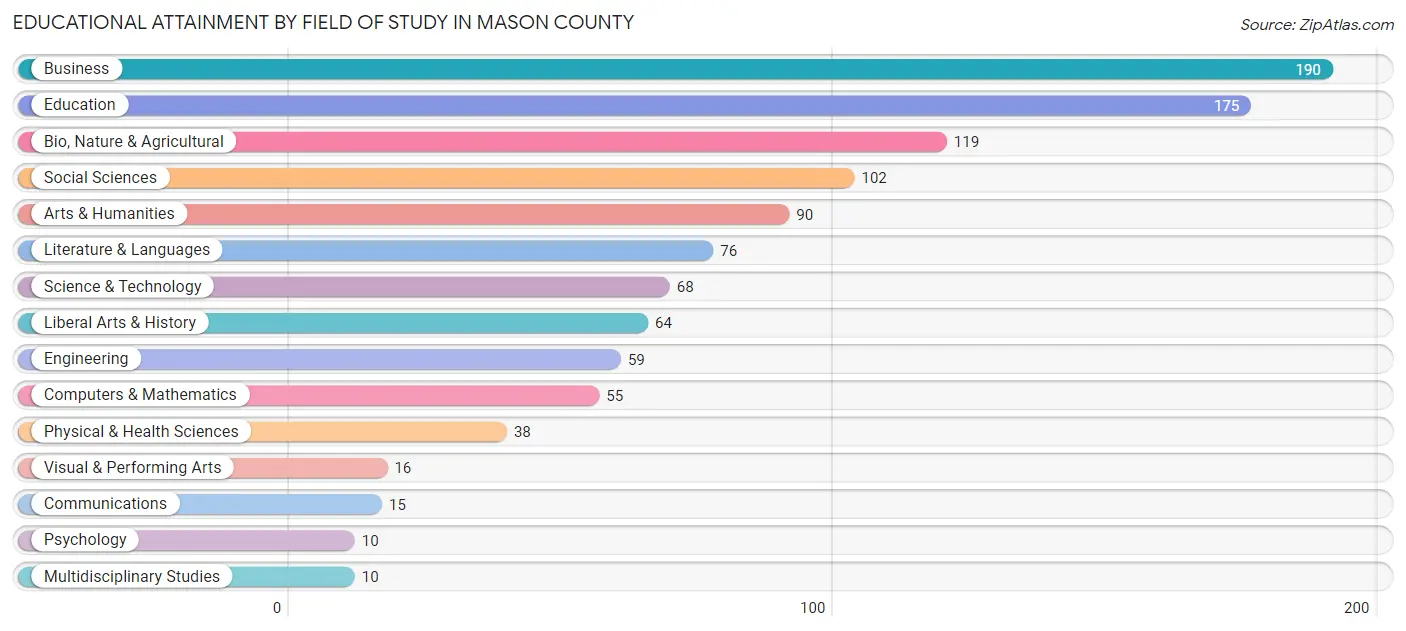
Educational Attainment by Field of Study in Mason County
Business (190 | 17.5%), education (175 | 16.1%), bio, nature & agricultural (119 | 11.0%), social sciences (102 | 9.4%), and arts & humanities (90 | 8.3%) are the most common fields of study among 1,087 individuals in Mason County who have obtained a bachelor's degree or higher.
| Field of Study | # Graduates | % Graduates |
| Computers & Mathematics | 55 | 5.1% |
| Bio, Nature & Agricultural | 119 | 11.0% |
| Physical & Health Sciences | 38 | 3.5% |
| Psychology | 10 | 0.9% |
| Social Sciences | 102 | 9.4% |
| Engineering | 59 | 5.4% |
| Multidisciplinary Studies | 10 | 0.9% |
| Science & Technology | 68 | 6.3% |
| Business | 190 | 17.5% |
| Education | 175 | 16.1% |
| Literature & Languages | 76 | 7.0% |
| Liberal Arts & History | 64 | 5.9% |
| Visual & Performing Arts | 16 | 1.5% |
| Communications | 15 | 1.4% |
| Arts & Humanities | 90 | 8.3% |
| Total | 1,087 | 100.0% |
Transportation & Commute in Mason County
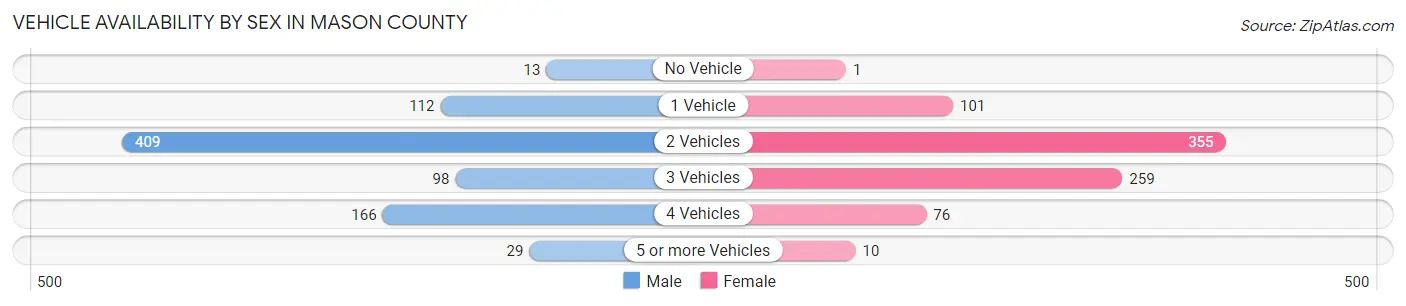
Vehicle Availability by Sex in Mason County
The most prevalent vehicle ownership categories in Mason County are males with 2 vehicles (409, accounting for 49.5%) and females with 2 vehicles (355, making up 51.0%).
| Vehicles Available | Male | Female |
| No Vehicle | 13 (1.6%) | 1 (0.1%) |
| 1 Vehicle | 112 (13.5%) | 101 (12.6%) |
| 2 Vehicles | 409 (49.5%) | 355 (44.3%) |
| 3 Vehicles | 98 (11.8%) | 259 (32.3%) |
| 4 Vehicles | 166 (20.1%) | 76 (9.5%) |
| 5 or more Vehicles | 29 (3.5%) | 10 (1.3%) |
| Total | 827 (100.0%) | 802 (100.0%) |
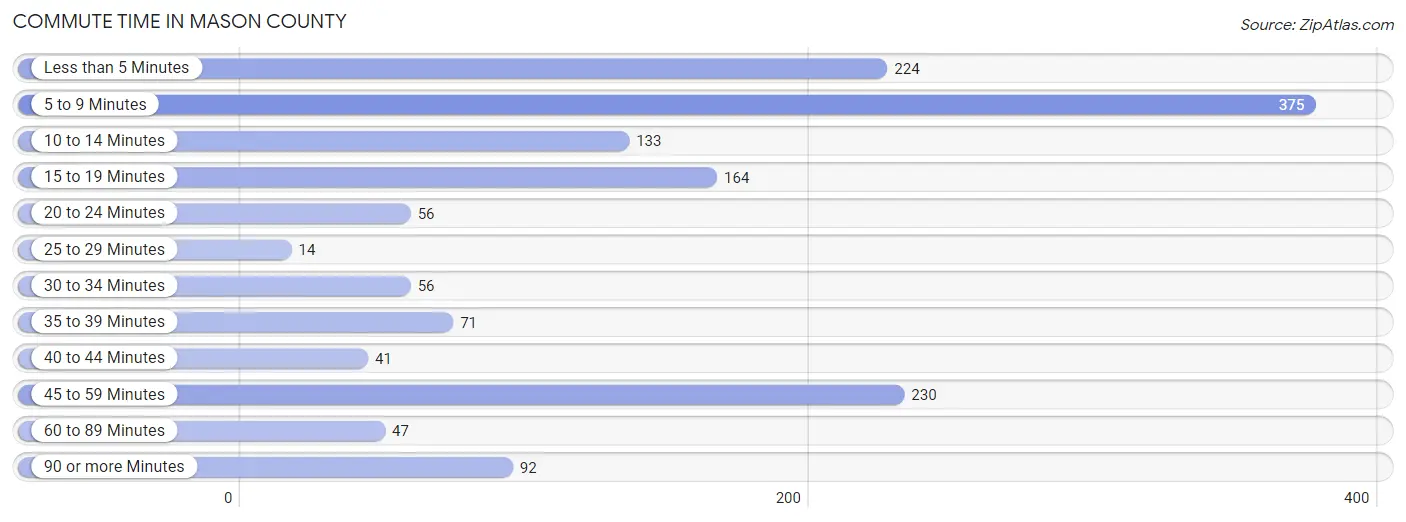
Commute Time in Mason County
The most frequently occuring commute durations in Mason County are 5 to 9 minutes (375 commuters, 24.9%), 45 to 59 minutes (230 commuters, 15.3%), and less than 5 minutes (224 commuters, 14.9%).
| Commute Time | # Commuters | % Commuters |
| Less than 5 Minutes | 224 | 14.9% |
| 5 to 9 Minutes | 375 | 24.9% |
| 10 to 14 Minutes | 133 | 8.8% |
| 15 to 19 Minutes | 164 | 10.9% |
| 20 to 24 Minutes | 56 | 3.7% |
| 25 to 29 Minutes | 14 | 0.9% |
| 30 to 34 Minutes | 56 | 3.7% |
| 35 to 39 Minutes | 71 | 4.7% |
| 40 to 44 Minutes | 41 | 2.7% |
| 45 to 59 Minutes | 230 | 15.3% |
| 60 to 89 Minutes | 47 | 3.1% |
| 90 or more Minutes | 92 | 6.1% |
Commute Time by Sex in Mason County
The most common commute times in Mason County are 5 to 9 minutes (147 commuters, 19.5%) for males and 5 to 9 minutes (228 commuters, 30.4%) for females.
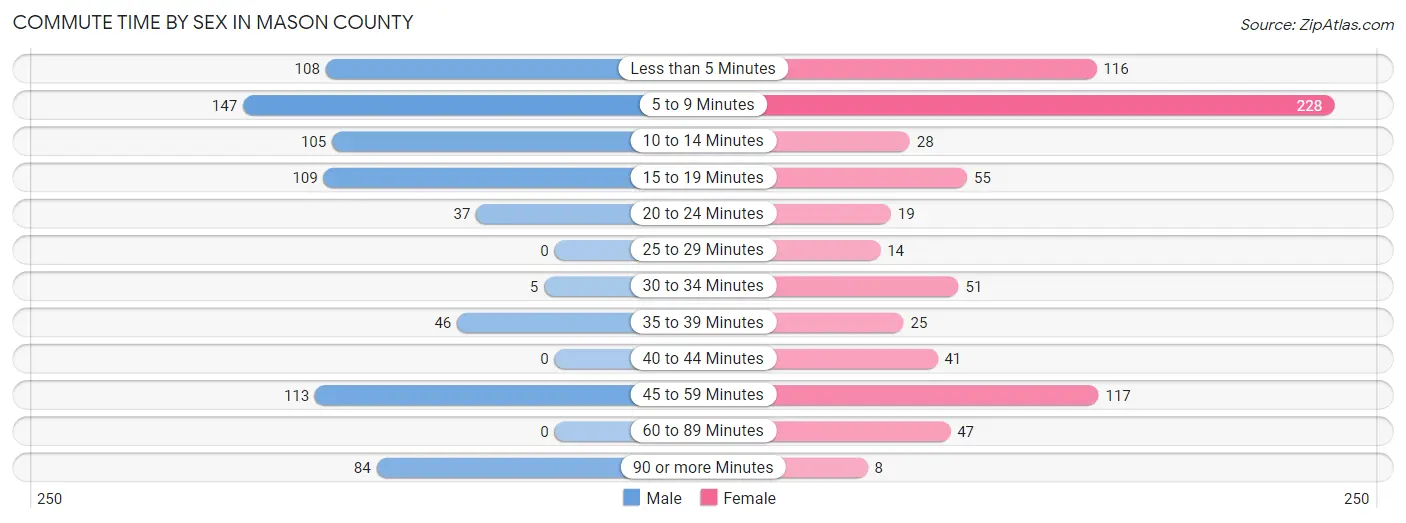
| Commute Time | Male | Female |
| Less than 5 Minutes | 108 (14.3%) | 116 (15.5%) |
| 5 to 9 Minutes | 147 (19.5%) | 228 (30.4%) |
| 10 to 14 Minutes | 105 (13.9%) | 28 (3.7%) |
| 15 to 19 Minutes | 109 (14.5%) | 55 (7.3%) |
| 20 to 24 Minutes | 37 (4.9%) | 19 (2.5%) |
| 25 to 29 Minutes | 0 (0.0%) | 14 (1.9%) |
| 30 to 34 Minutes | 5 (0.7%) | 51 (6.8%) |
| 35 to 39 Minutes | 46 (6.1%) | 25 (3.3%) |
| 40 to 44 Minutes | 0 (0.0%) | 41 (5.5%) |
| 45 to 59 Minutes | 113 (15.0%) | 117 (15.6%) |
| 60 to 89 Minutes | 0 (0.0%) | 47 (6.3%) |
| 90 or more Minutes | 84 (11.1%) | 8 (1.1%) |
Time of Departure to Work by Sex in Mason County
The most frequent times of departure to work in Mason County are 7:00 AM to 7:29 AM (182, 24.1%) for males and 7:30 AM to 7:59 AM (164, 21.9%) for females.
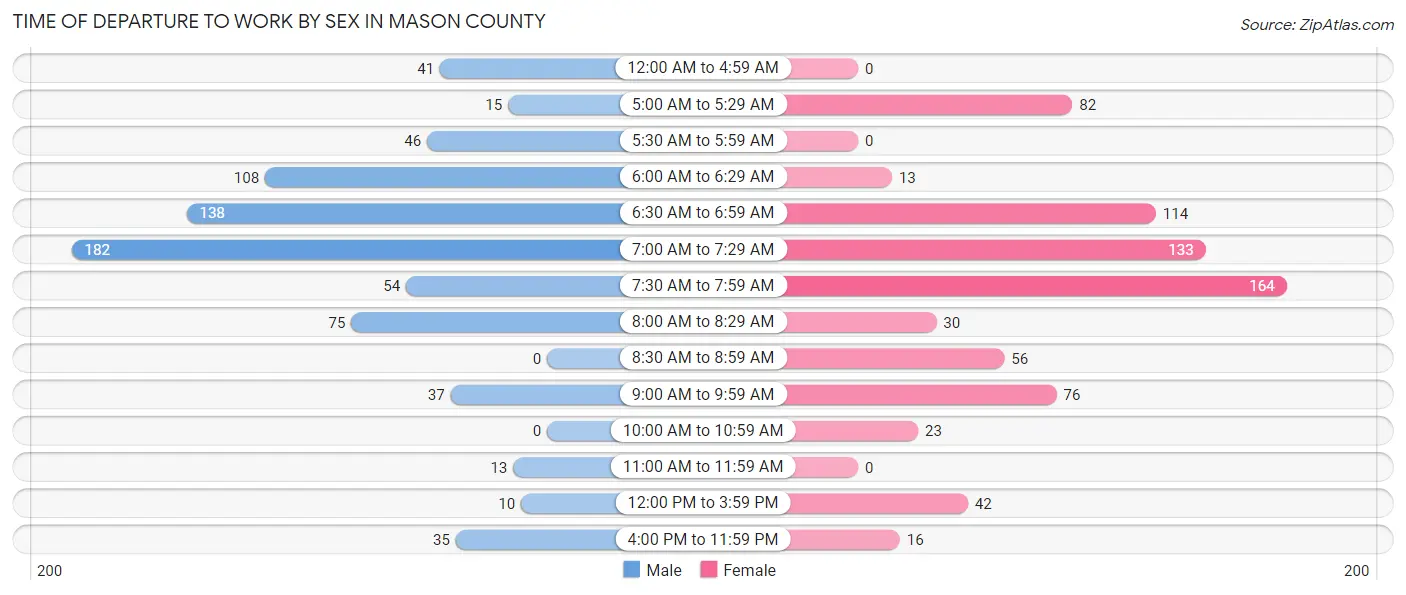
| Time of Departure | Male | Female |
| 12:00 AM to 4:59 AM | 41 (5.4%) | 0 (0.0%) |
| 5:00 AM to 5:29 AM | 15 (2.0%) | 82 (11.0%) |
| 5:30 AM to 5:59 AM | 46 (6.1%) | 0 (0.0%) |
| 6:00 AM to 6:29 AM | 108 (14.3%) | 13 (1.7%) |
| 6:30 AM to 6:59 AM | 138 (18.3%) | 114 (15.2%) |
| 7:00 AM to 7:29 AM | 182 (24.1%) | 133 (17.8%) |
| 7:30 AM to 7:59 AM | 54 (7.2%) | 164 (21.9%) |
| 8:00 AM to 8:29 AM | 75 (10.0%) | 30 (4.0%) |
| 8:30 AM to 8:59 AM | 0 (0.0%) | 56 (7.5%) |
| 9:00 AM to 9:59 AM | 37 (4.9%) | 76 (10.2%) |
| 10:00 AM to 10:59 AM | 0 (0.0%) | 23 (3.1%) |
| 11:00 AM to 11:59 AM | 13 (1.7%) | 0 (0.0%) |
| 12:00 PM to 3:59 PM | 10 (1.3%) | 42 (5.6%) |
| 4:00 PM to 11:59 PM | 35 (4.6%) | 16 (2.1%) |
| Total | 754 (100.0%) | 749 (100.0%) |
Housing Occupancy in Mason County
Occupancy by Ownership in Mason County
Of the total 1,519 dwellings in Mason County, owner-occupied units account for 1,216 (80.0%), while renter-occupied units make up 303 (20.0%).
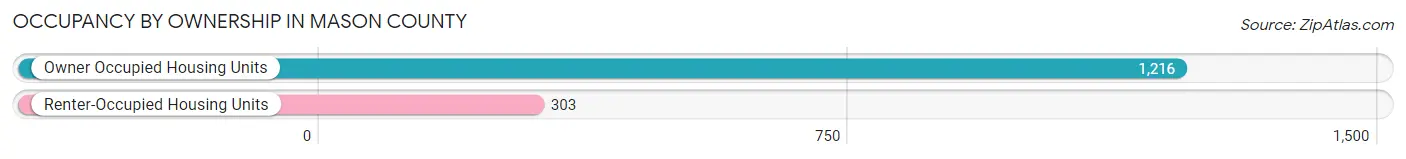
| Occupancy | # Housing Units | % Housing Units |
| Owner Occupied Housing Units | 1,216 | 80.0% |
| Renter-Occupied Housing Units | 303 | 20.0% |
| Total Occupied Housing Units | 1,519 | 100.0% |
Occupancy by Household Size in Mason County
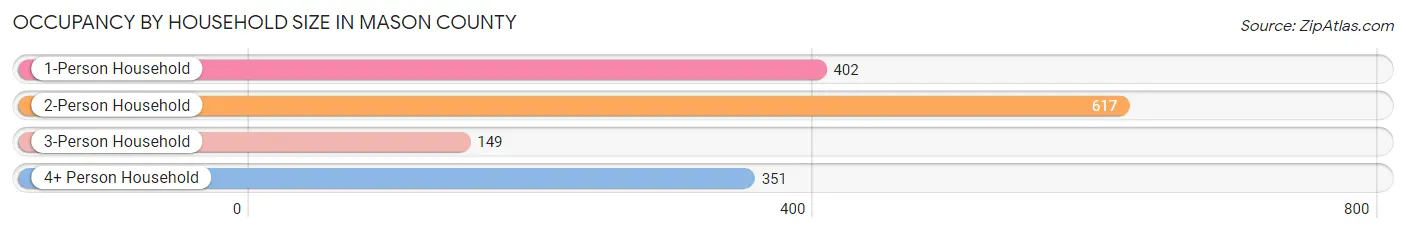
| Household Size | # Housing Units | % Housing Units |
| 1-Person Household | 402 | 26.5% |
| 2-Person Household | 617 | 40.6% |
| 3-Person Household | 149 | 9.8% |
| 4+ Person Household | 351 | 23.1% |
| Total Housing Units | 1,519 | 100.0% |
Occupancy by Ownership by Household Size in Mason County
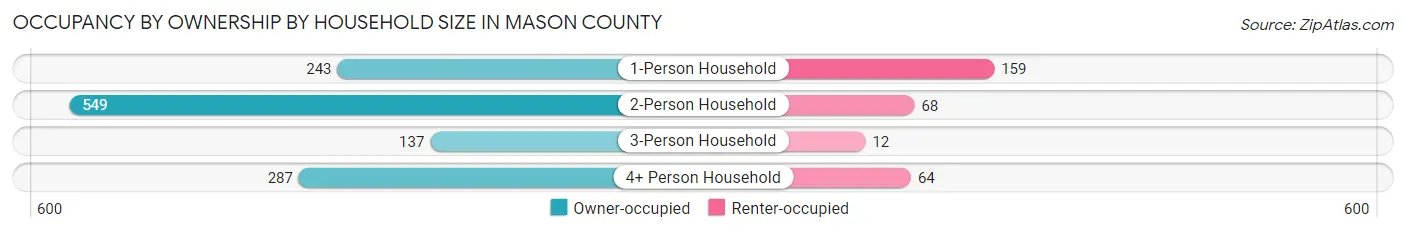
| Household Size | Owner-occupied | Renter-occupied |
| 1-Person Household | 243 (60.5%) | 159 (39.6%) |
| 2-Person Household | 549 (89.0%) | 68 (11.0%) |
| 3-Person Household | 137 (91.9%) | 12 (8.1%) |
| 4+ Person Household | 287 (81.8%) | 64 (18.2%) |
| Total Housing Units | 1,216 (80.0%) | 303 (20.0%) |
Occupancy by Educational Attainment in Mason County
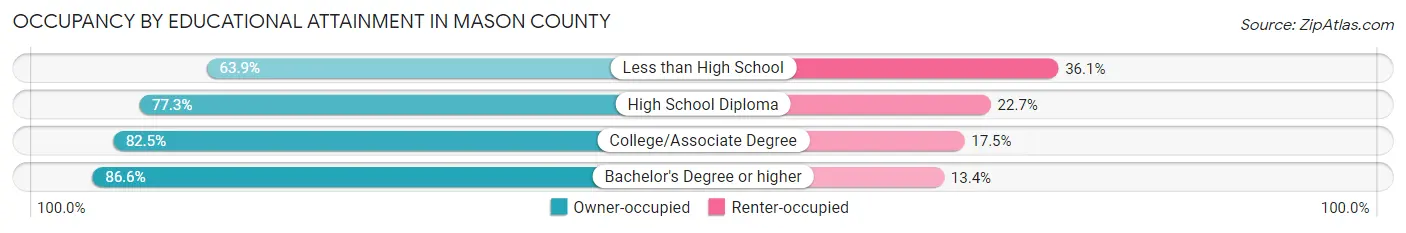
| Household Size | Owner-occupied | Renter-occupied |
| Less than High School | 154 (63.9%) | 87 (36.1%) |
| High School Diploma | 252 (77.3%) | 74 (22.7%) |
| College/Associate Degree | 288 (82.5%) | 61 (17.5%) |
| Bachelor's Degree or higher | 522 (86.6%) | 81 (13.4%) |
Occupancy by Age of Householder in Mason County
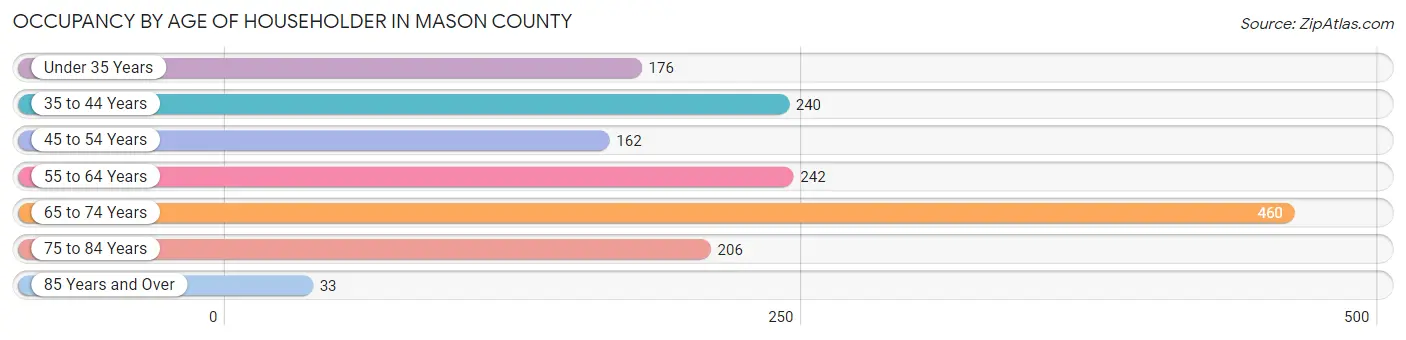
| Age Bracket | # Households | % Households |
| Under 35 Years | 176 | 11.6% |
| 35 to 44 Years | 240 | 15.8% |
| 45 to 54 Years | 162 | 10.7% |
| 55 to 64 Years | 242 | 15.9% |
| 65 to 74 Years | 460 | 30.3% |
| 75 to 84 Years | 206 | 13.6% |
| 85 Years and Over | 33 | 2.2% |
| Total | 1,519 | 100.0% |
Housing Finances in Mason County
Median Income by Occupancy in Mason County
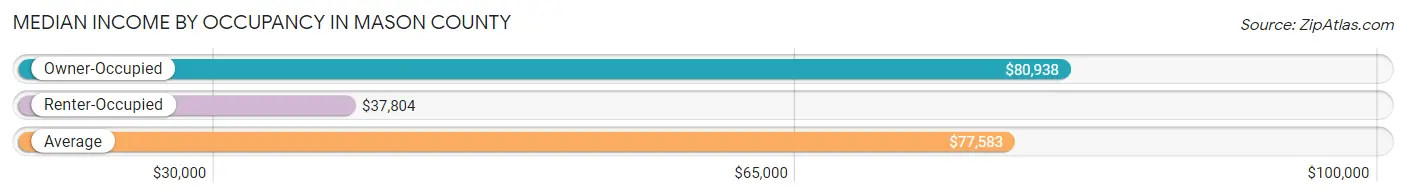
| Occupancy Type | # Households | Median Income |
| Owner-Occupied | 1,216 (80.0%) | $80,938 |
| Renter-Occupied | 303 (20.0%) | $37,804 |
| Average | 1,519 (100.0%) | $77,583 |
Occupancy by Householder Income Bracket in Mason County
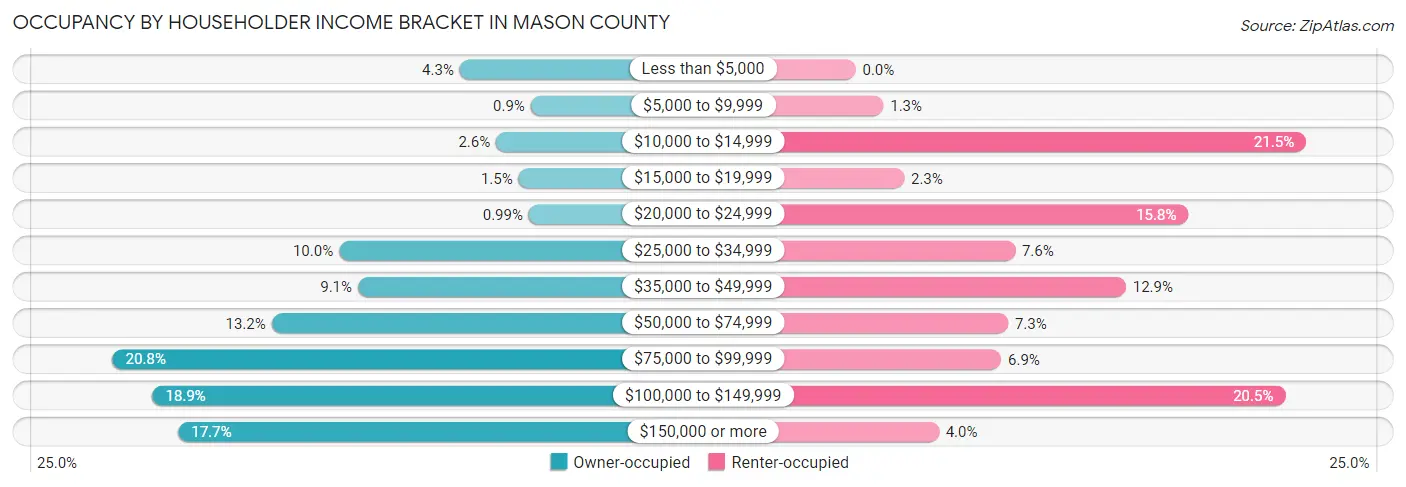
| Income Bracket | Owner-occupied | Renter-occupied |
| Less than $5,000 | 52 (4.3%) | 0 (0.0%) |
| $5,000 to $9,999 | 11 (0.9%) | 4 (1.3%) |
| $10,000 to $14,999 | 31 (2.5%) | 65 (21.4%) |
| $15,000 to $19,999 | 18 (1.5%) | 7 (2.3%) |
| $20,000 to $24,999 | 12 (1.0%) | 48 (15.8%) |
| $25,000 to $34,999 | 122 (10.0%) | 23 (7.6%) |
| $35,000 to $49,999 | 111 (9.1%) | 39 (12.9%) |
| $50,000 to $74,999 | 161 (13.2%) | 22 (7.3%) |
| $75,000 to $99,999 | 253 (20.8%) | 21 (6.9%) |
| $100,000 to $149,999 | 230 (18.9%) | 62 (20.5%) |
| $150,000 or more | 215 (17.7%) | 12 (4.0%) |
| Total | 1,216 (100.0%) | 303 (100.0%) |
Monthly Housing Cost Tiers in Mason County
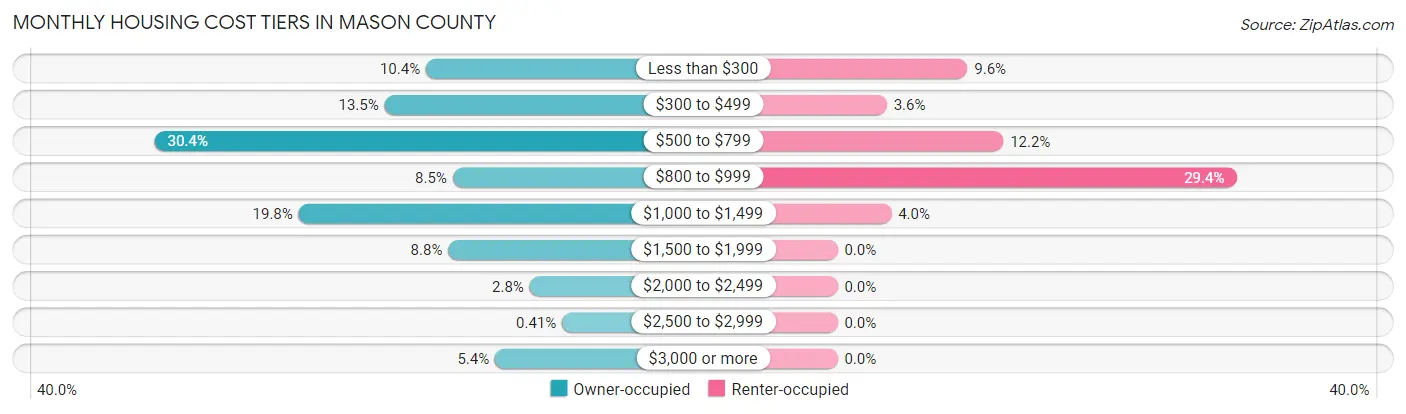
| Monthly Cost | Owner-occupied | Renter-occupied |
| Less than $300 | 127 (10.4%) | 29 (9.6%) |
| $300 to $499 | 164 (13.5%) | 11 (3.6%) |
| $500 to $799 | 370 (30.4%) | 37 (12.2%) |
| $800 to $999 | 103 (8.5%) | 89 (29.4%) |
| $1,000 to $1,499 | 241 (19.8%) | 12 (4.0%) |
| $1,500 to $1,999 | 107 (8.8%) | 0 (0.0%) |
| $2,000 to $2,499 | 34 (2.8%) | 0 (0.0%) |
| $2,500 to $2,999 | 5 (0.4%) | 0 (0.0%) |
| $3,000 or more | 65 (5.3%) | 0 (0.0%) |
| Total | 1,216 (100.0%) | 303 (100.0%) |
Physical Housing Characteristics in Mason County
Housing Structures in Mason County
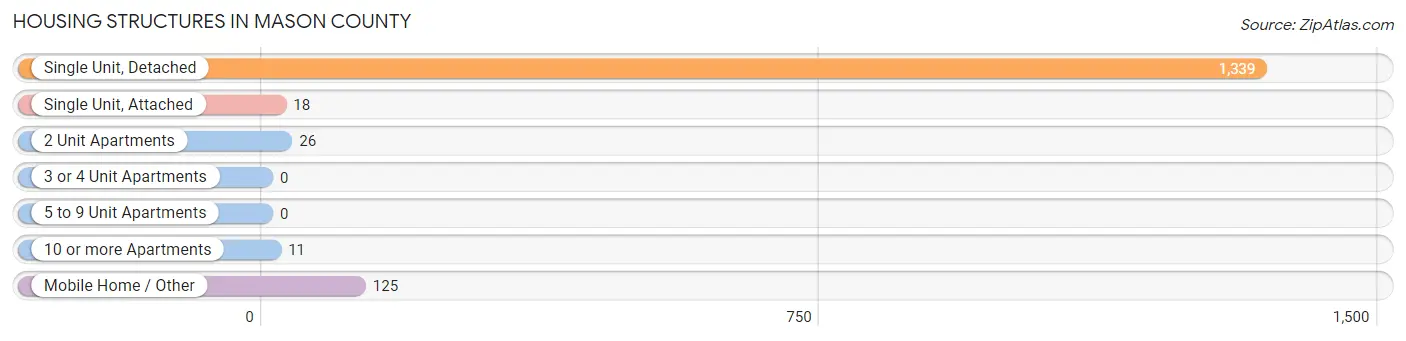
| Structure Type | # Housing Units | % Housing Units |
| Single Unit, Detached | 1,339 | 88.1% |
| Single Unit, Attached | 18 | 1.2% |
| 2 Unit Apartments | 26 | 1.7% |
| 3 or 4 Unit Apartments | 0 | 0.0% |
| 5 to 9 Unit Apartments | 0 | 0.0% |
| 10 or more Apartments | 11 | 0.7% |
| Mobile Home / Other | 125 | 8.2% |
| Total | 1,519 | 100.0% |
Housing Structures by Occupancy in Mason County
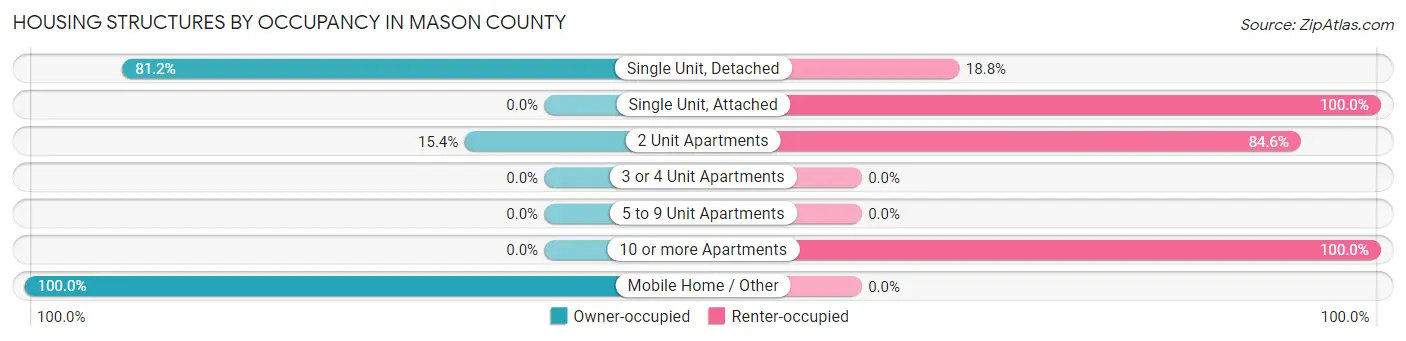
| Structure Type | Owner-occupied | Renter-occupied |
| Single Unit, Detached | 1,087 (81.2%) | 252 (18.8%) |
| Single Unit, Attached | 0 (0.0%) | 18 (100.0%) |
| 2 Unit Apartments | 4 (15.4%) | 22 (84.6%) |
| 3 or 4 Unit Apartments | 0 (0.0%) | 0 (0.0%) |
| 5 to 9 Unit Apartments | 0 (0.0%) | 0 (0.0%) |
| 10 or more Apartments | 0 (0.0%) | 11 (100.0%) |
| Mobile Home / Other | 125 (100.0%) | 0 (0.0%) |
| Total | 1,216 (80.0%) | 303 (20.0%) |
Housing Structures by Number of Rooms in Mason County
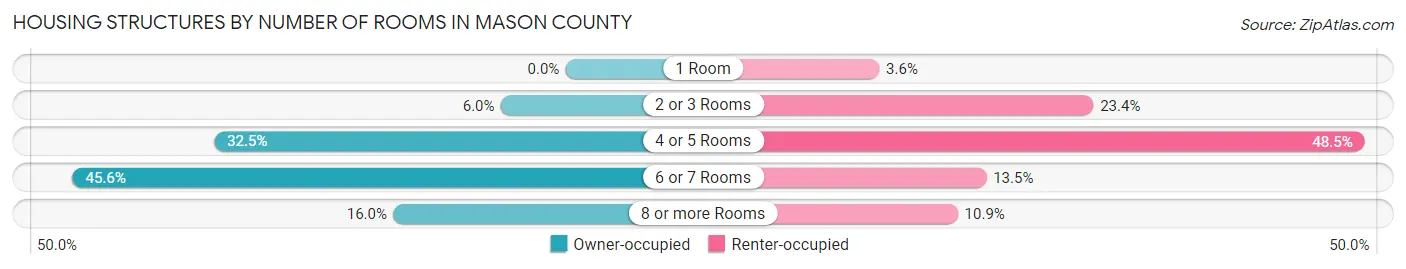
| Number of Rooms | Owner-occupied | Renter-occupied |
| 1 Room | 0 (0.0%) | 11 (3.6%) |
| 2 or 3 Rooms | 73 (6.0%) | 71 (23.4%) |
| 4 or 5 Rooms | 395 (32.5%) | 147 (48.5%) |
| 6 or 7 Rooms | 554 (45.6%) | 41 (13.5%) |
| 8 or more Rooms | 194 (16.0%) | 33 (10.9%) |
| Total | 1,216 (100.0%) | 303 (100.0%) |
Housing Structure by Heating Type in Mason County
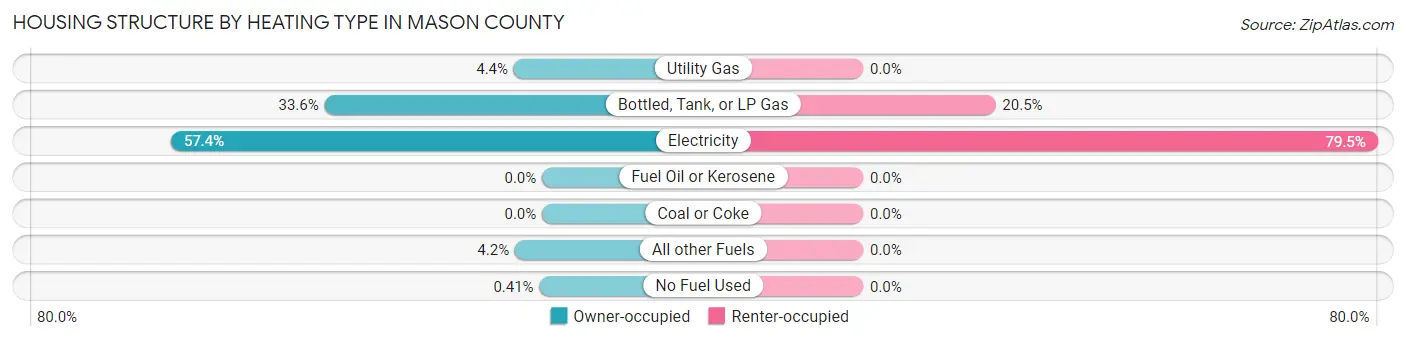
| Heating Type | Owner-occupied | Renter-occupied |
| Utility Gas | 53 (4.4%) | 0 (0.0%) |
| Bottled, Tank, or LP Gas | 409 (33.6%) | 62 (20.5%) |
| Electricity | 698 (57.4%) | 241 (79.5%) |
| Fuel Oil or Kerosene | 0 (0.0%) | 0 (0.0%) |
| Coal or Coke | 0 (0.0%) | 0 (0.0%) |
| All other Fuels | 51 (4.2%) | 0 (0.0%) |
| No Fuel Used | 5 (0.4%) | 0 (0.0%) |
| Total | 1,216 (100.0%) | 303 (100.0%) |
Household Vehicle Usage in Mason County
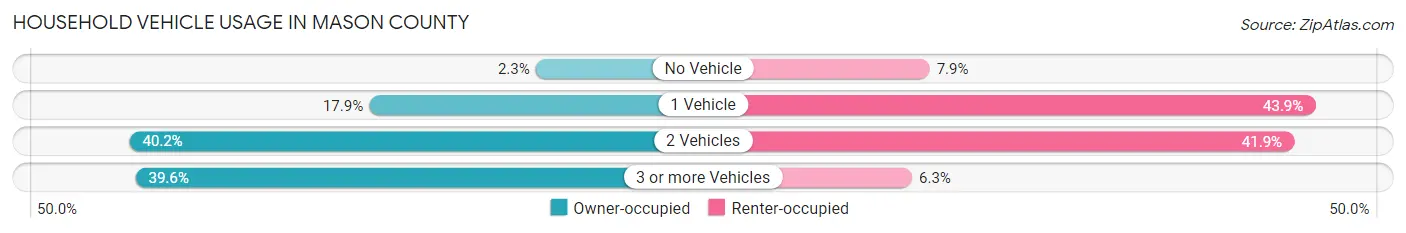
| Vehicles per Household | Owner-occupied | Renter-occupied |
| No Vehicle | 28 (2.3%) | 24 (7.9%) |
| 1 Vehicle | 217 (17.8%) | 133 (43.9%) |
| 2 Vehicles | 489 (40.2%) | 127 (41.9%) |
| 3 or more Vehicles | 482 (39.6%) | 19 (6.3%) |
| Total | 1,216 (100.0%) | 303 (100.0%) |
Real Estate & Mortgages in Mason County
Real Estate and Mortgage Overview in Mason County
| Characteristic | Without Mortgage | With Mortgage |
| Housing Units | 818 | 398 |
| Median Property Value | $240,300 | $268,400 |
| Median Household Income | $76,061 | $138 |
| Monthly Housing Costs | $599 | $65 |
| Real Estate Taxes | $1,823 | $0 |
Property Value by Mortgage Status in Mason County
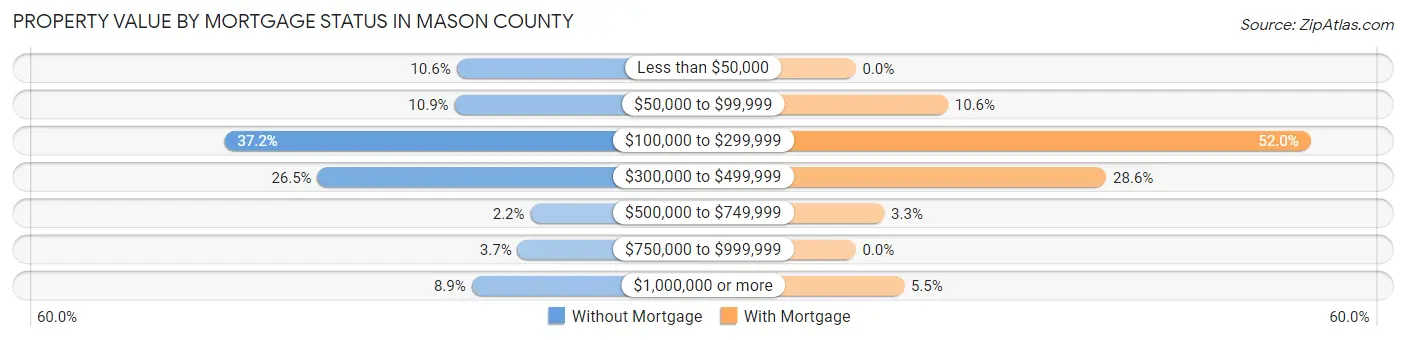
| Property Value | Without Mortgage | With Mortgage |
| Less than $50,000 | 87 (10.6%) | 0 (0.0%) |
| $50,000 to $99,999 | 89 (10.9%) | 42 (10.5%) |
| $100,000 to $299,999 | 304 (37.2%) | 207 (52.0%) |
| $300,000 to $499,999 | 217 (26.5%) | 114 (28.6%) |
| $500,000 to $749,999 | 18 (2.2%) | 13 (3.3%) |
| $750,000 to $999,999 | 30 (3.7%) | 0 (0.0%) |
| $1,000,000 or more | 73 (8.9%) | 22 (5.5%) |
| Total | 818 (100.0%) | 398 (100.0%) |
Household Income by Mortgage Status in Mason County
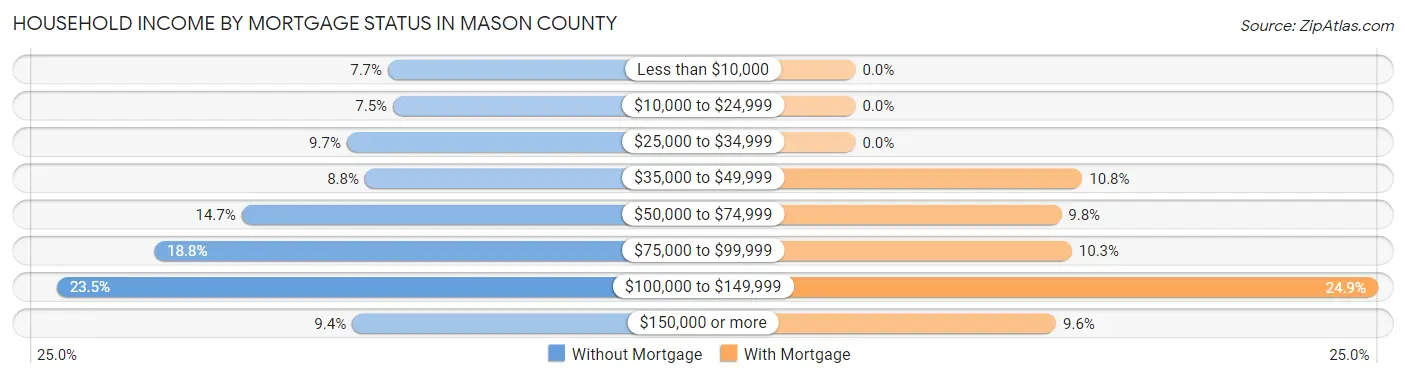
| Household Income | Without Mortgage | With Mortgage |
| Less than $10,000 | 63 (7.7%) | 0 (0.0%) |
| $10,000 to $24,999 | 61 (7.5%) | 0 (0.0%) |
| $25,000 to $34,999 | 79 (9.7%) | 0 (0.0%) |
| $35,000 to $49,999 | 72 (8.8%) | 43 (10.8%) |
| $50,000 to $74,999 | 120 (14.7%) | 39 (9.8%) |
| $75,000 to $99,999 | 154 (18.8%) | 41 (10.3%) |
| $100,000 to $149,999 | 192 (23.5%) | 99 (24.9%) |
| $150,000 or more | 77 (9.4%) | 38 (9.6%) |
| Total | 818 (100.0%) | 398 (100.0%) |
Property Value to Household Income Ratio in Mason County
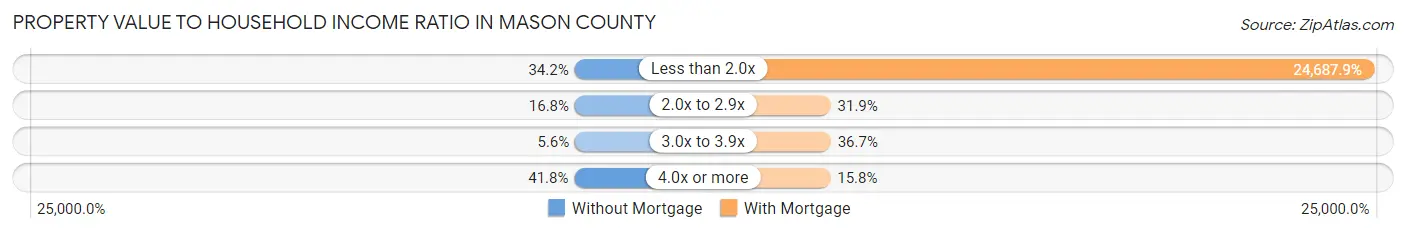
| Value-to-Income Ratio | Without Mortgage | With Mortgage |
| Less than 2.0x | 280 (34.2%) | 98,258 (24,687.9%) |
| 2.0x to 2.9x | 137 (16.8%) | 127 (31.9%) |
| 3.0x to 3.9x | 46 (5.6%) | 146 (36.7%) |
| 4.0x or more | 342 (41.8%) | 63 (15.8%) |
| Total | 818 (100.0%) | 398 (100.0%) |
Real Estate Taxes by Mortgage Status in Mason County
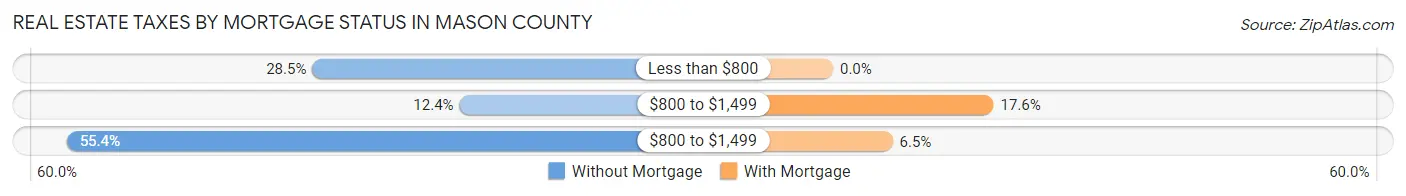
| Property Taxes | Without Mortgage | With Mortgage |
| Less than $800 | 233 (28.5%) | 0 (0.0%) |
| $800 to $1,499 | 101 (12.3%) | 70 (17.6%) |
| $800 to $1,499 | 453 (55.4%) | 26 (6.5%) |
| Total | 818 (100.0%) | 398 (100.0%) |
Health & Disability in Mason County
Health Insurance Coverage by Age in Mason County
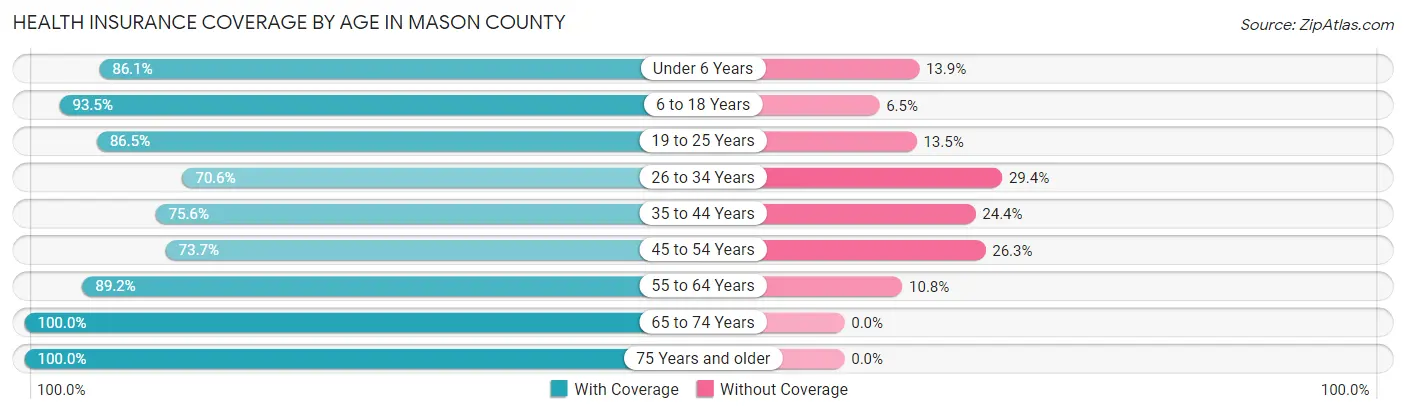
| Age Bracket | With Coverage | Without Coverage |
| Under 6 Years | 315 (86.1%) | 51 (13.9%) |
| 6 to 18 Years | 574 (93.5%) | 40 (6.5%) |
| 19 to 25 Years | 180 (86.5%) | 28 (13.5%) |
| 26 to 34 Years | 228 (70.6%) | 95 (29.4%) |
| 35 to 44 Years | 306 (75.6%) | 99 (24.4%) |
| 45 to 54 Years | 199 (73.7%) | 71 (26.3%) |
| 55 to 64 Years | 472 (89.2%) | 57 (10.8%) |
| 65 to 74 Years | 745 (100.0%) | 0 (0.0%) |
| 75 Years and older | 490 (100.0%) | 0 (0.0%) |
| Total | 3,509 (88.8%) | 441 (11.2%) |
Health Insurance Coverage by Citizenship Status in Mason County
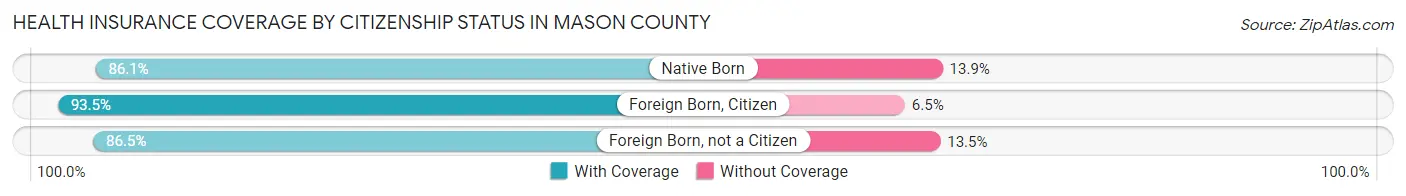
| Citizenship Status | With Coverage | Without Coverage |
| Native Born | 315 (86.1%) | 51 (13.9%) |
| Foreign Born, Citizen | 574 (93.5%) | 40 (6.5%) |
| Foreign Born, not a Citizen | 180 (86.5%) | 28 (13.5%) |
Health Insurance Coverage by Household Income in Mason County
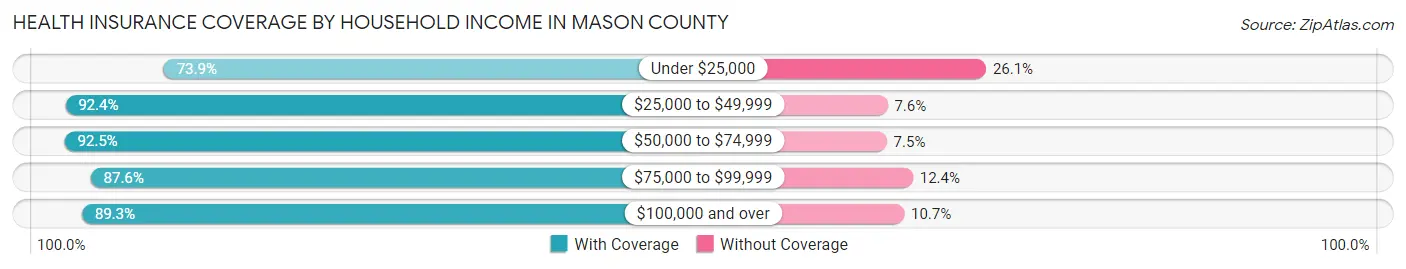
| Household Income | With Coverage | Without Coverage |
| Under $25,000 | 207 (73.9%) | 73 (26.1%) |
| $25,000 to $49,999 | 764 (92.4%) | 63 (7.6%) |
| $50,000 to $74,999 | 359 (92.5%) | 29 (7.5%) |
| $75,000 to $99,999 | 680 (87.6%) | 96 (12.4%) |
| $100,000 and over | 1,499 (89.3%) | 180 (10.7%) |
Public vs Private Health Insurance Coverage by Age in Mason County
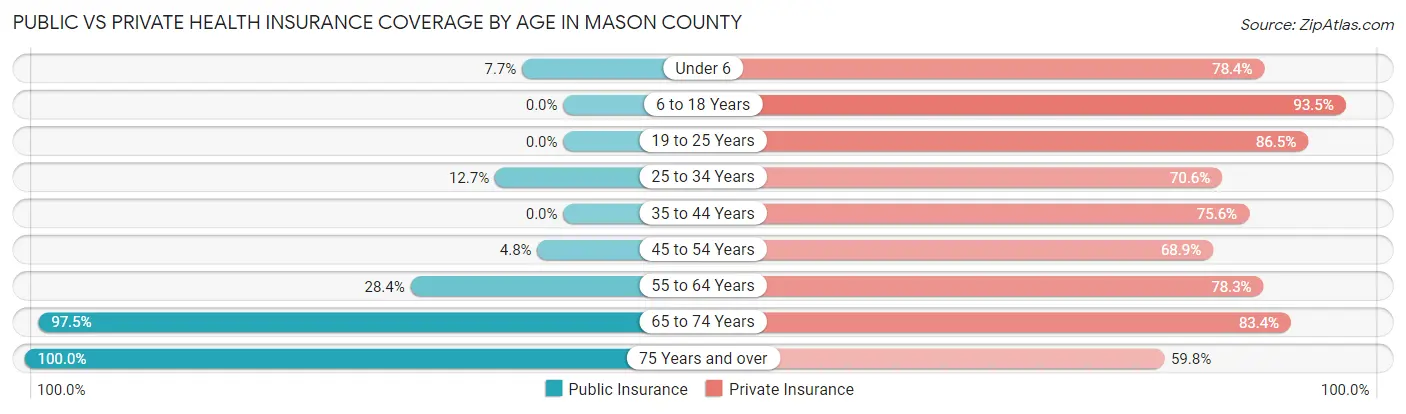
| Age Bracket | Public Insurance | Private Insurance |
| Under 6 | 28 (7.6%) | 287 (78.4%) |
| 6 to 18 Years | 0 (0.0%) | 574 (93.5%) |
| 19 to 25 Years | 0 (0.0%) | 180 (86.5%) |
| 25 to 34 Years | 41 (12.7%) | 228 (70.6%) |
| 35 to 44 Years | 0 (0.0%) | 306 (75.6%) |
| 45 to 54 Years | 13 (4.8%) | 186 (68.9%) |
| 55 to 64 Years | 150 (28.4%) | 414 (78.3%) |
| 65 to 74 Years | 726 (97.5%) | 621 (83.4%) |
| 75 Years and over | 490 (100.0%) | 293 (59.8%) |
| Total | 1,448 (36.7%) | 3,089 (78.2%) |
Disability Status by Sex by Age in Mason County
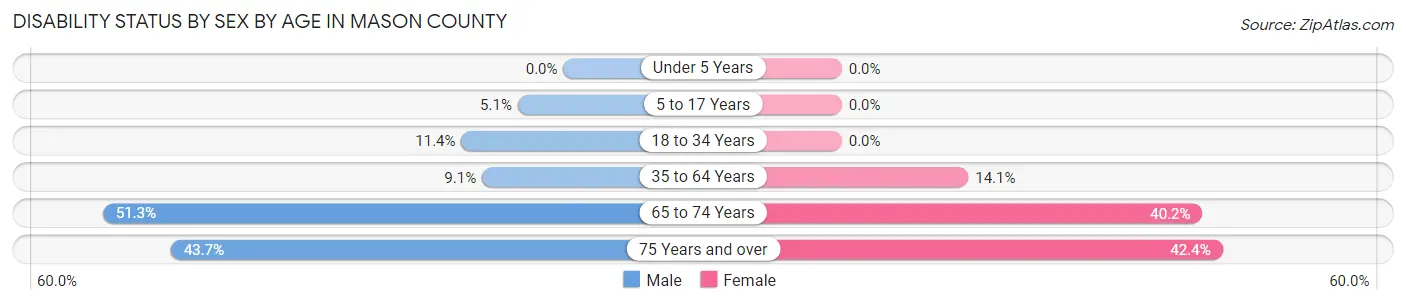
| Age Bracket | Male | Female |
| Under 5 Years | 0 (0.0%) | 0 (0.0%) |
| 5 to 17 Years | 13 (5.1%) | 0 (0.0%) |
| 18 to 34 Years | 41 (11.4%) | 0 (0.0%) |
| 35 to 64 Years | 48 (9.1%) | 95 (14.1%) |
| 65 to 74 Years | 179 (51.3%) | 159 (40.2%) |
| 75 Years and over | 108 (43.7%) | 103 (42.4%) |
Disability Class by Sex by Age in Mason County
Disability Class: Hearing Difficulty
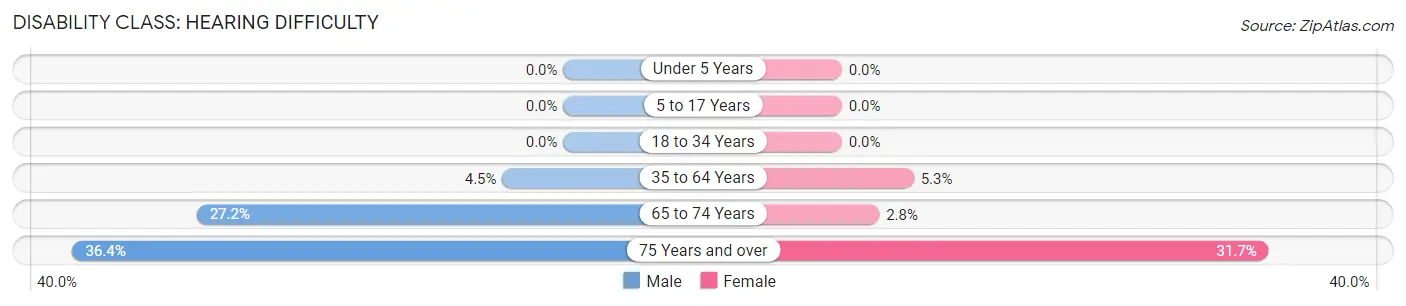
| Age Bracket | Male | Female |
| Under 5 Years | 0 (0.0%) | 0 (0.0%) |
| 5 to 17 Years | 0 (0.0%) | 0 (0.0%) |
| 18 to 34 Years | 0 (0.0%) | 0 (0.0%) |
| 35 to 64 Years | 24 (4.5%) | 36 (5.3%) |
| 65 to 74 Years | 95 (27.2%) | 11 (2.8%) |
| 75 Years and over | 90 (36.4%) | 77 (31.7%) |
Disability Class: Vision Difficulty
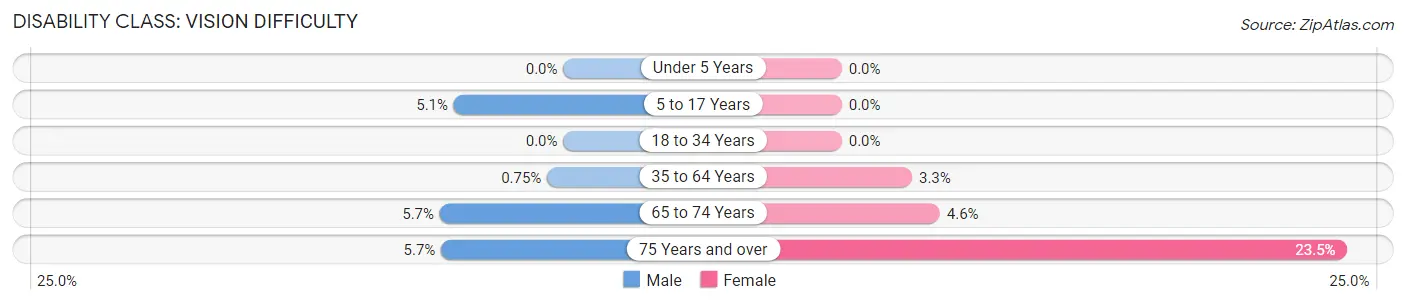
| Age Bracket | Male | Female |
| Under 5 Years | 0 (0.0%) | 0 (0.0%) |
| 5 to 17 Years | 13 (5.1%) | 0 (0.0%) |
| 18 to 34 Years | 0 (0.0%) | 0 (0.0%) |
| 35 to 64 Years | 4 (0.7%) | 22 (3.3%) |
| 65 to 74 Years | 20 (5.7%) | 18 (4.5%) |
| 75 Years and over | 14 (5.7%) | 57 (23.5%) |
Disability Class: Cognitive Difficulty
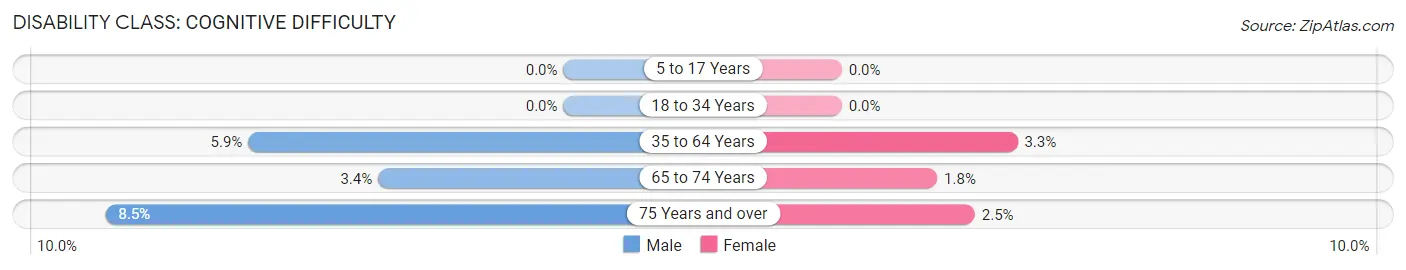
| Age Bracket | Male | Female |
| 5 to 17 Years | 0 (0.0%) | 0 (0.0%) |
| 18 to 34 Years | 0 (0.0%) | 0 (0.0%) |
| 35 to 64 Years | 31 (5.9%) | 22 (3.3%) |
| 65 to 74 Years | 12 (3.4%) | 7 (1.8%) |
| 75 Years and over | 21 (8.5%) | 6 (2.5%) |
Disability Class: Ambulatory Difficulty
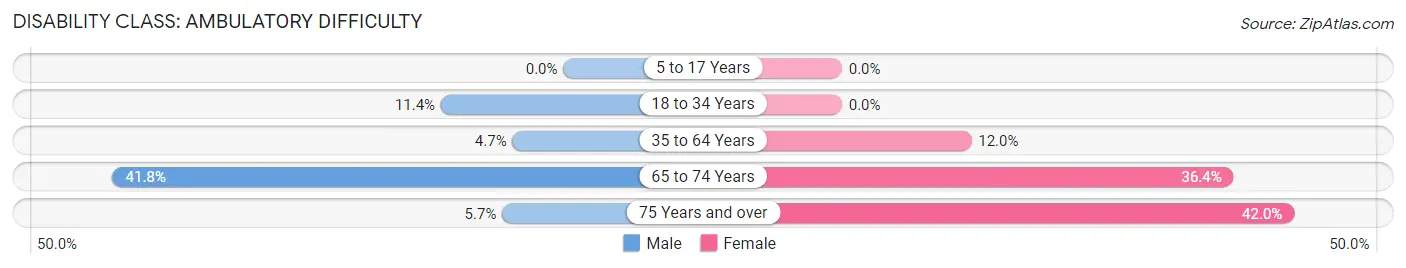
| Age Bracket | Male | Female |
| 5 to 17 Years | 0 (0.0%) | 0 (0.0%) |
| 18 to 34 Years | 41 (11.4%) | 0 (0.0%) |
| 35 to 64 Years | 25 (4.7%) | 81 (12.0%) |
| 65 to 74 Years | 146 (41.8%) | 144 (36.4%) |
| 75 Years and over | 14 (5.7%) | 102 (42.0%) |
Disability Class: Self-Care Difficulty
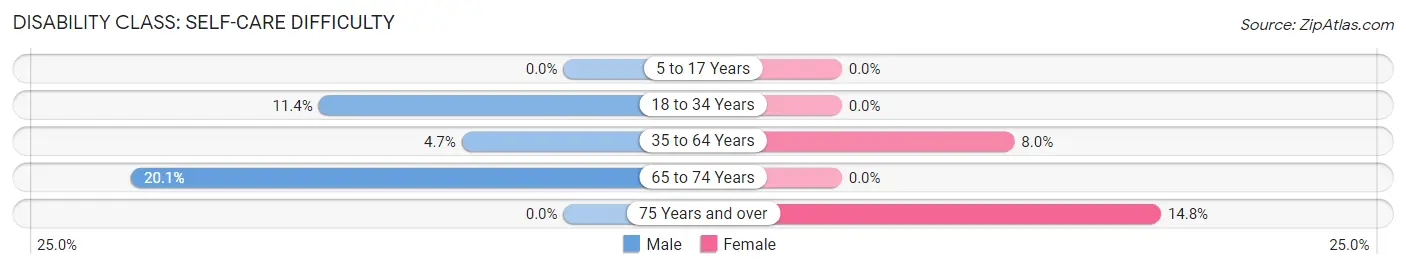
| Age Bracket | Male | Female |
| 5 to 17 Years | 0 (0.0%) | 0 (0.0%) |
| 18 to 34 Years | 41 (11.4%) | 0 (0.0%) |
| 35 to 64 Years | 25 (4.7%) | 54 (8.0%) |
| 65 to 74 Years | 70 (20.1%) | 0 (0.0%) |
| 75 Years and over | 0 (0.0%) | 36 (14.8%) |
Technology Access in Mason County
Computing Device Access in Mason County
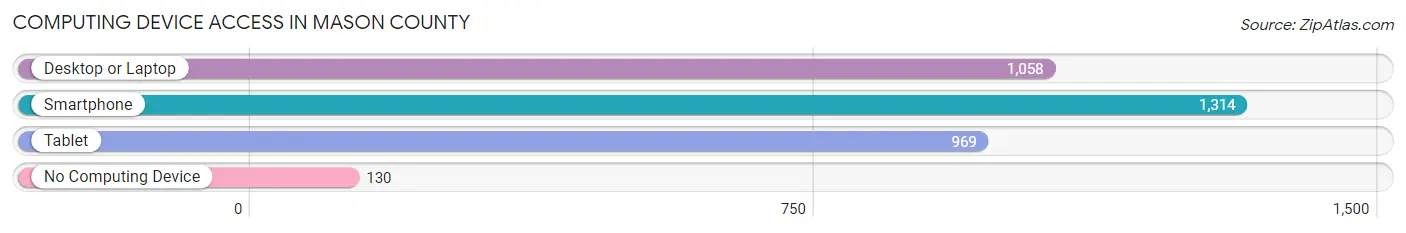
| Device Type | # Households | % Households |
| Desktop or Laptop | 1,058 | 69.7% |
| Smartphone | 1,314 | 86.5% |
| Tablet | 969 | 63.8% |
| No Computing Device | 130 | 8.6% |
| Total | 1,519 | 100.0% |
Internet Access in Mason County
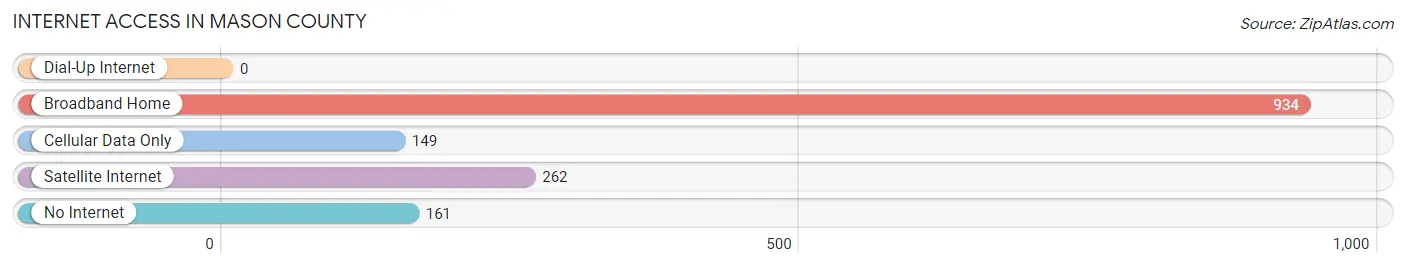
| Internet Type | # Households | % Households |
| Dial-Up Internet | 0 | 0.0% |
| Broadband Home | 934 | 61.5% |
| Cellular Data Only | 149 | 9.8% |
| Satellite Internet | 262 | 17.2% |
| No Internet | 161 | 10.6% |
| Total | 1,519 | 100.0% |
Mason County Summary
Mason County is located in the western part of the state of Texas, in the Hill Country region. It is bordered by San Saba County to the north, McCulloch County to the east, Llano County to the south, and Kimble County to the west. The county seat is Mason, and the largest city is Fredericksburg. The county has a total area of 902 square miles, of which 899 square miles is land and 3 square miles is water.
Mason County was established in 1858 and named for Fort Mason, which was named for Major George T. Mason, a hero of the Mexican-American War. The county was originally part of Bexar County, but was later divided into its own county.
The geography of Mason County is mostly hilly, with some flat areas in the north and south. The county is home to several rivers, including the Llano, San Saba, and Colorado. The county is also home to several state parks, including Enchanted Rock State Natural Area, Pedernales Falls State Park, and Inks Lake State Park.
The economy of Mason County is largely based on agriculture, with the main crops being cotton, corn, wheat, and hay. The county is also home to several wineries, and is a popular destination for tourists.
The population of Mason County was 4,836 in 2000, with a population density of 5.4 people per square mile. The median household income was $30,945, and the median family income was $37,813. The per capita income was $17,845. The racial makeup of the county was 88.3% White, 0.3% African American, 0.7% Native American, 0.2% Asian, 0.1% Pacific Islander, 8.9% from other races, and 1.6% from two or more races. Hispanic or Latino of any race were 18.3% of the population.
Mason County is served by the Mason County Independent School District, which includes four elementary schools, one middle school, and one high school. The county is also home to several private schools, including the Fredericksburg Christian Academy and the Mason County Christian Academy.
Mason County is a rural county with a rich history and a strong agricultural economy. It is home to several state parks, wineries, and other attractions, making it a popular destination for tourists. The county is served by a strong school district, and has a diverse population with a median household income that is slightly above the state average.
Common Questions
What is Per Capita Income in Mason County?
Per Capita income in Mason County is $36,235.
What is the Median Family Income in Mason County?
Median Family Income in Mason County is $96,193.
What is the Median Household income in Mason County?
Median Household Income in Mason County is $77,583.
What is Income or Wage Gap in Mason County?
Income or Wage Gap in Mason County is 12.7%.
Women in Mason County earn 87.3 cents for every dollar earned by a man.
What is Inequality or Gini Index in Mason County?
Inequality or Gini Index in Mason County is 0.46.
What is the Total Population of Mason County?
Total Population of Mason County is 3,959.
What is the Total Male Population of Mason County?
Total Male Population of Mason County is 1,977.
What is the Total Female Population of Mason County?
Total Female Population of Mason County is 1,982.
What is the Ratio of Males per 100 Females in Mason County?
There are 99.75 Males per 100 Females in Mason County.
What is the Ratio of Females per 100 Males in Mason County?
There are 100.25 Females per 100 Males in Mason County.
What is the Median Population Age in Mason County?
Median Population Age in Mason County is 48.2 Years.
What is the Average Family Size in Mason County
Average Family Size in Mason County is 3.2 People.
What is the Average Household Size in Mason County
Average Household Size in Mason County is 2.6 People.
How Large is the Labor Force in Mason County?
There are 1,677 People in the Labor Forcein in Mason County.
What is the Percentage of People in the Labor Force in Mason County?
52.7% of People are in the Labor Force in Mason County.
What is the Unemployment Rate in Mason County?
Unemployment Rate in Mason County is 2.8%.