Marion County, TX Map & Demographics
Marion County Map
Marion County Overview
$27,263
PER CAPITA INCOME
$61,726
AVG FAMILY INCOME
$48,040
AVG HOUSEHOLD INCOME
20.8%
WAGE / INCOME GAP [ % ]
79.2¢/ $1
WAGE / INCOME GAP [ $ ]
$13,811
FAMILY INCOME DEFICIT
0.45
INEQUALITY / GINI INDEX
9,668
TOTAL POPULATION
4,724
MALE POPULATION
4,944
FEMALE POPULATION
95.55
MALES / 100 FEMALES
104.66
FEMALES / 100 MALES
52.1
MEDIAN AGE
3.2
AVG FAMILY SIZE
2.4
AVG HOUSEHOLD SIZE
3,864
LABOR FORCE [ PEOPLE ]
47.3%
PERCENT IN LABOR FORCE
10.7%
UNEMPLOYMENT RATE
Income in Marion County
Income Overview in Marion County
Per Capita Income in Marion County is $27,263, while median incomes of families and households are $61,726 and $48,040 respectively.
| Characteristic | Number | Measure |
| Per Capita Income | 9,668 | $27,263 |
| Median Family Income | 2,350 | $61,726 |
| Mean Family Income | 2,350 | $81,337 |
| Median Household Income | 4,014 | $48,040 |
| Mean Household Income | 4,014 | $63,070 |
| Income Deficit | 2,350 | $13,811 |
| Wage / Income Gap (%) | 9,668 | 20.79% |
| Wage / Income Gap ($) | 9,668 | 79.21¢ per $1 |
| Gini / Inequality Index | 9,668 | 0.45 |
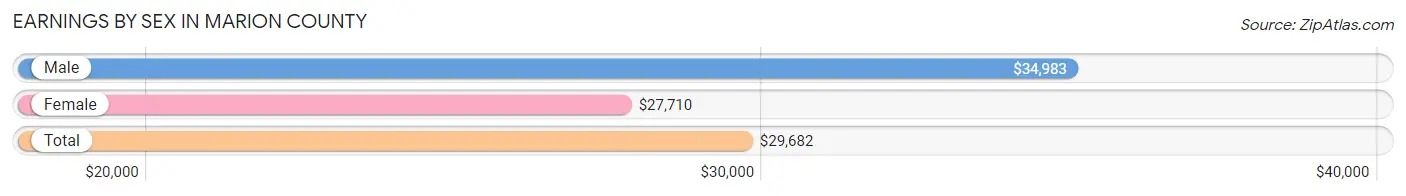
Earnings by Sex in Marion County
Average Earnings in Marion County are $29,682, $34,983 for men and $27,710 for women, a difference of 20.8%.
| Sex | Number | Average Earnings |
| Male | 1,943 (50.5%) | $34,983 |
| Female | 1,903 (49.5%) | $27,710 |
| Total | 3,846 (100.0%) | $29,682 |
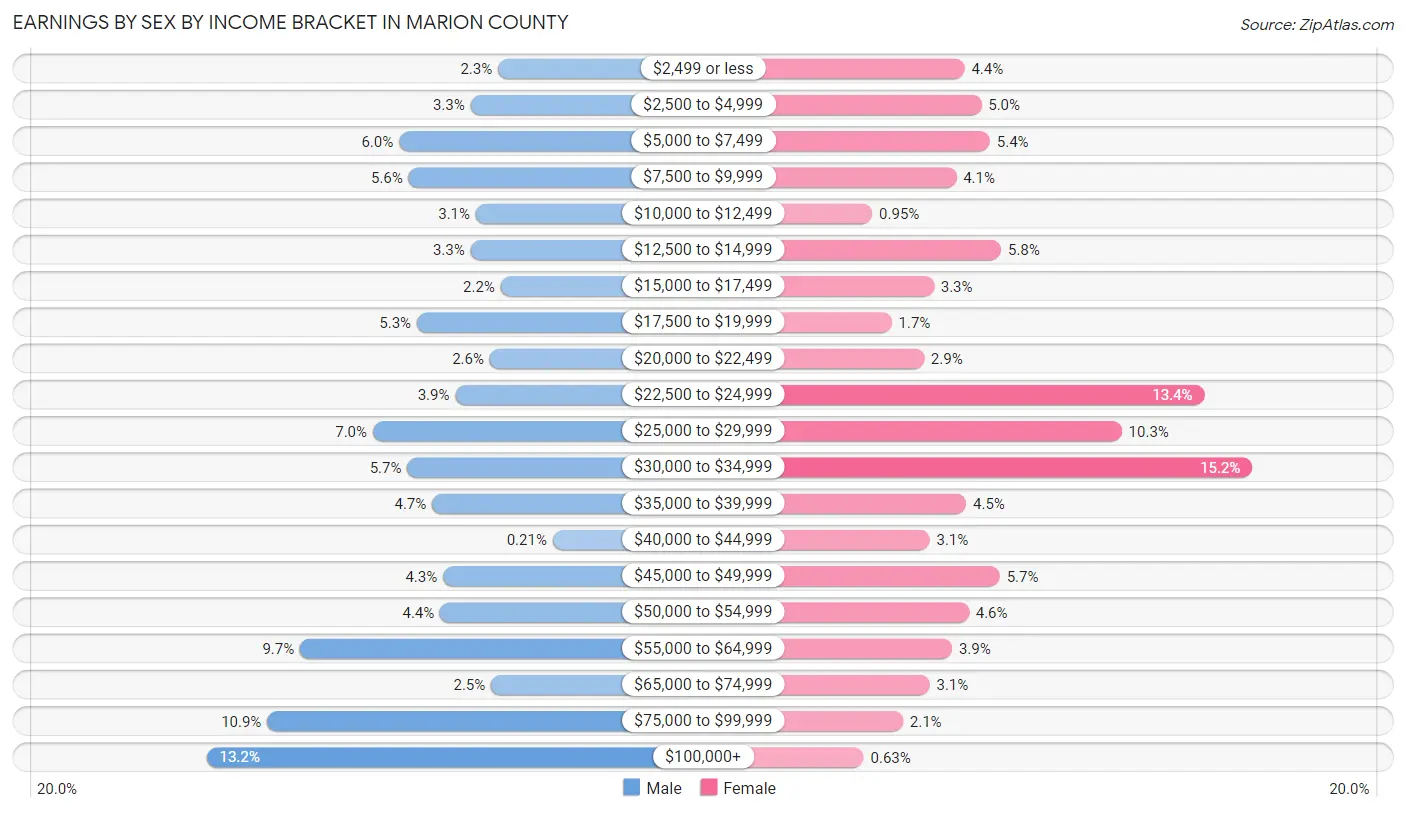
Earnings by Sex by Income Bracket in Marion County
The most common earnings brackets in Marion County are $100,000+ for men (256 | 13.2%) and $30,000 to $34,999 for women (289 | 15.2%).
| Income | Male | Female |
| $2,499 or less | 44 (2.3%) | 84 (4.4%) |
| $2,500 to $4,999 | 64 (3.3%) | 96 (5.0%) |
| $5,000 to $7,499 | 116 (6.0%) | 102 (5.4%) |
| $7,500 to $9,999 | 109 (5.6%) | 78 (4.1%) |
| $10,000 to $12,499 | 60 (3.1%) | 18 (0.9%) |
| $12,500 to $14,999 | 64 (3.3%) | 110 (5.8%) |
| $15,000 to $17,499 | 42 (2.2%) | 62 (3.3%) |
| $17,500 to $19,999 | 103 (5.3%) | 32 (1.7%) |
| $20,000 to $22,499 | 50 (2.6%) | 55 (2.9%) |
| $22,500 to $24,999 | 75 (3.9%) | 255 (13.4%) |
| $25,000 to $29,999 | 135 (7.0%) | 196 (10.3%) |
| $30,000 to $34,999 | 110 (5.7%) | 289 (15.2%) |
| $35,000 to $39,999 | 92 (4.7%) | 85 (4.5%) |
| $40,000 to $44,999 | 4 (0.2%) | 59 (3.1%) |
| $45,000 to $49,999 | 84 (4.3%) | 109 (5.7%) |
| $50,000 to $54,999 | 86 (4.4%) | 87 (4.6%) |
| $55,000 to $64,999 | 188 (9.7%) | 75 (3.9%) |
| $65,000 to $74,999 | 49 (2.5%) | 59 (3.1%) |
| $75,000 to $99,999 | 212 (10.9%) | 40 (2.1%) |
| $100,000+ | 256 (13.2%) | 12 (0.6%) |
| Total | 1,943 (100.0%) | 1,903 (100.0%) |
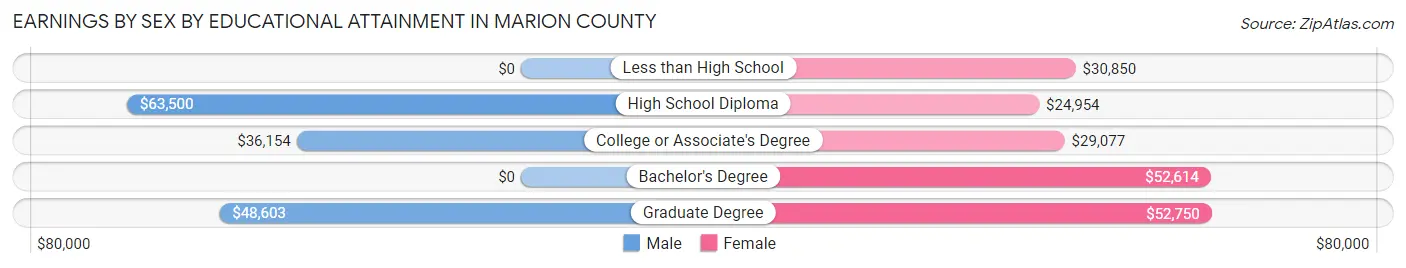
Earnings by Sex by Educational Attainment in Marion County
Average earnings in Marion County are $47,096 for men and $29,279 for women, a difference of 37.8%. Men with an educational attainment of high school diploma enjoy the highest average annual earnings of $63,500, while those with college or associate's degree education earn the least with $36,154. Women with an educational attainment of graduate degree earn the most with the average annual earnings of $52,750, while those with high school diploma education have the smallest earnings of $24,954.
| Educational Attainment | Male Income | Female Income |
| Less than High School | - | - |
| High School Diploma | $63,500 | $24,954 |
| College or Associate's Degree | $36,154 | $29,077 |
| Bachelor's Degree | - | - |
| Graduate Degree | $48,603 | $52,750 |
| Total | $47,096 | $29,279 |
Family Income in Marion County
Family Income Brackets in Marion County
According to the Marion County family income data, there are 498 families falling into the $35,000 to $49,999 income range, which is the most common income bracket and makes up 21.2% of all families. Conversely, the $10,000 to $14,999 income bracket is the least frequent group with only 42 families (1.8%) belonging to this category.
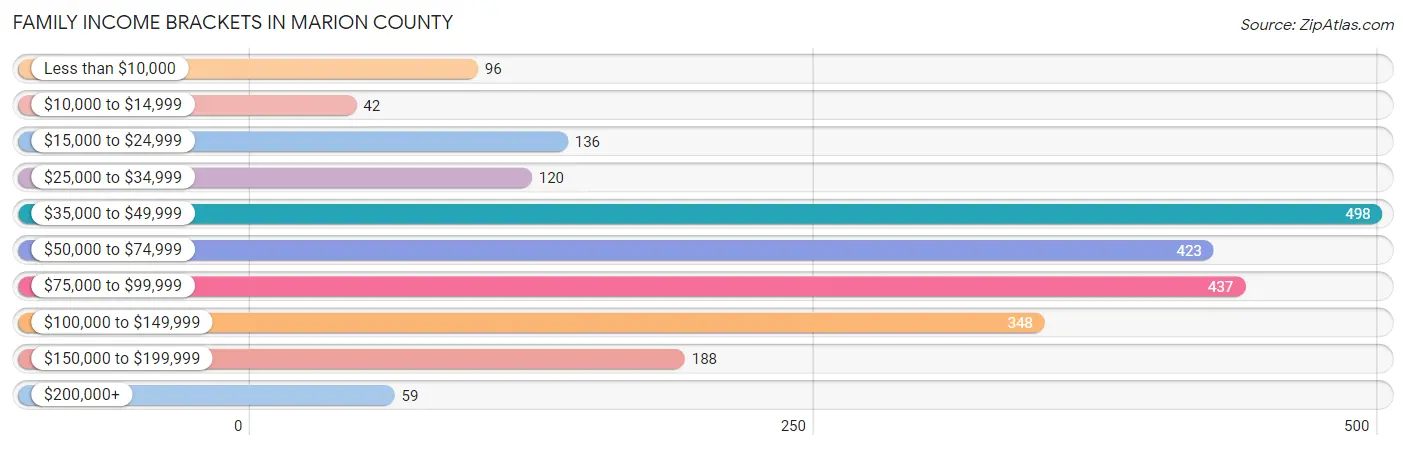
| Income Bracket | # Families | % Families |
| Less than $10,000 | 96 | 4.1% |
| $10,000 to $14,999 | 42 | 1.8% |
| $15,000 to $24,999 | 136 | 5.8% |
| $25,000 to $34,999 | 120 | 5.1% |
| $35,000 to $49,999 | 498 | 21.2% |
| $50,000 to $74,999 | 423 | 18.0% |
| $75,000 to $99,999 | 437 | 18.6% |
| $100,000 to $149,999 | 348 | 14.8% |
| $150,000 to $199,999 | 188 | 8.0% |
| $200,000+ | 59 | 2.5% |
Family Income by Famaliy Size in Marion County
6-person families (56 | 2.4%) account for the highest median family income in Marion County with $111,667 per family, while 2-person families (1,412 | 60.1%) have the highest median income of $27,946 per family member.
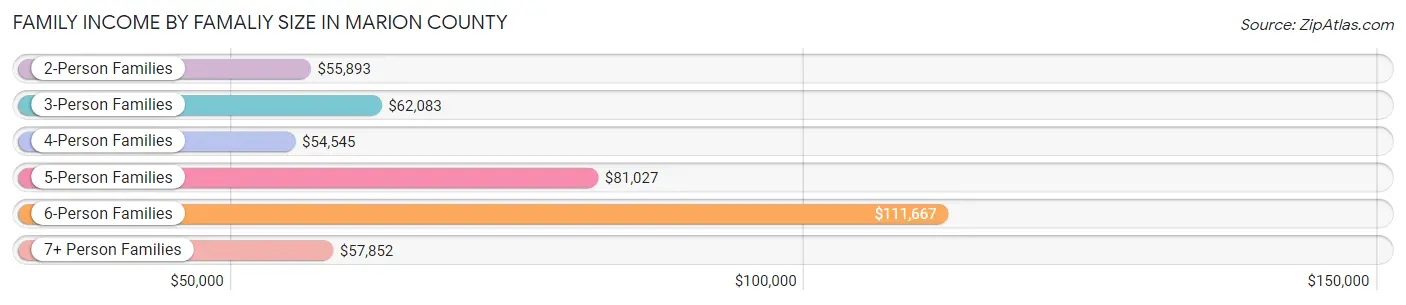
| Income Bracket | # Families | Median Income |
| 2-Person Families | 1,412 (60.1%) | $55,893 |
| 3-Person Families | 343 (14.6%) | $62,083 |
| 4-Person Families | 320 (13.6%) | $54,545 |
| 5-Person Families | 156 (6.6%) | $81,027 |
| 6-Person Families | 56 (2.4%) | $111,667 |
| 7+ Person Families | 63 (2.7%) | $57,852 |
| Total | 2,350 (100.0%) | $61,726 |
Family Income by Number of Earners in Marion County
The median family income in Marion County is $61,726, with families comprising 2 earners (717) having the highest median family income of $106,250, while families with no earners (627) have the lowest median family income of $41,850, accounting for 30.5% and 26.7% of families, respectively.
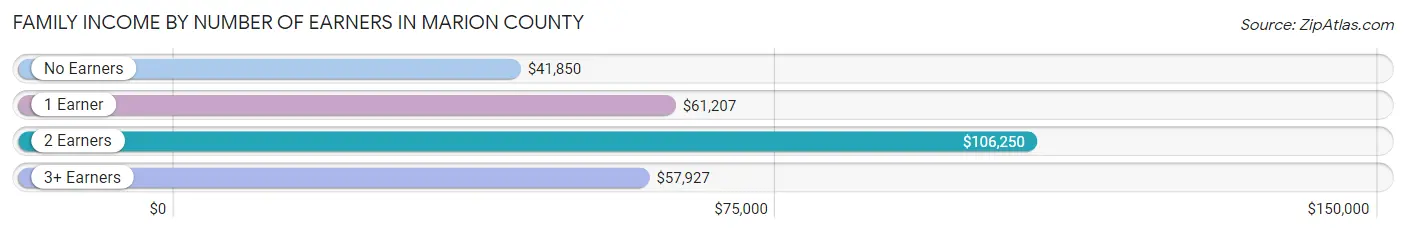
| Number of Earners | # Families | Median Income |
| No Earners | 627 (26.7%) | $41,850 |
| 1 Earner | 820 (34.9%) | $61,207 |
| 2 Earners | 717 (30.5%) | $106,250 |
| 3+ Earners | 186 (7.9%) | $57,927 |
| Total | 2,350 (100.0%) | $61,726 |
Household Income in Marion County
Household Income Brackets in Marion County
With 727 households falling in the category, the $35,000 to $49,999 income range is the most frequent in Marion County, accounting for 18.1% of all households. In contrast, only 76 households (1.9%) fall into the $200,000+ income bracket, making it the least populous group.
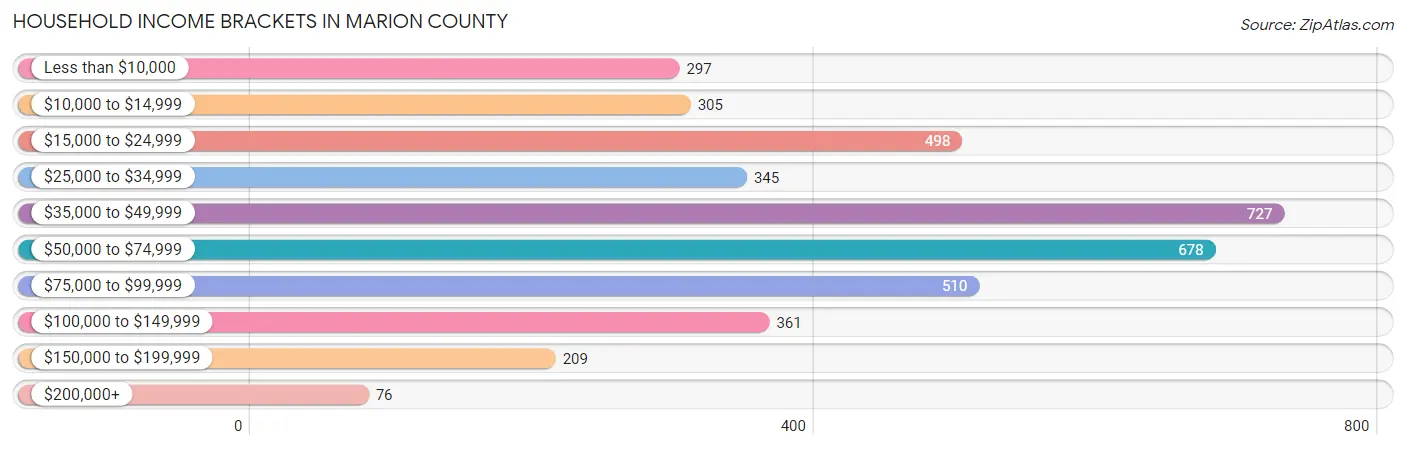
| Income Bracket | # Households | % Households |
| Less than $10,000 | 297 | 7.4% |
| $10,000 to $14,999 | 305 | 7.6% |
| $15,000 to $24,999 | 498 | 12.4% |
| $25,000 to $34,999 | 345 | 8.6% |
| $35,000 to $49,999 | 727 | 18.1% |
| $50,000 to $74,999 | 678 | 16.9% |
| $75,000 to $99,999 | 510 | 12.7% |
| $100,000 to $149,999 | 361 | 9.0% |
| $150,000 to $199,999 | 209 | 5.2% |
| $200,000+ | 76 | 1.9% |
Household Income by Householder Age in Marion County
The median household income in Marion County is $48,040, with the highest median household income of $53,438 found in the 25 to 44 years age bracket for the primary householder. A total of 682 households (17.0%) fall into this category. Meanwhile, the 15 to 24 years age bracket for the primary householder has the lowest median household income of $0, with 23 households (0.6%) in this group.
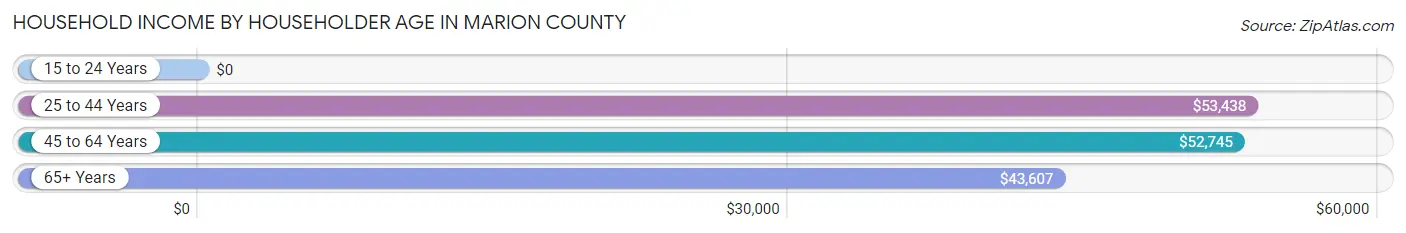
| Income Bracket | # Households | Median Income |
| 15 to 24 Years | 23 (0.6%) | $0 |
| 25 to 44 Years | 682 (17.0%) | $53,438 |
| 45 to 64 Years | 1,516 (37.8%) | $52,745 |
| 65+ Years | 1,793 (44.7%) | $43,607 |
| Total | 4,014 (100.0%) | $48,040 |
Poverty in Marion County
Income Below Poverty by Sex and Age in Marion County
With 13.9% poverty level for males and 17.4% for females among the residents of Marion County, 15 year old males and under 5 year old females are the most vulnerable to poverty, with 25 males (61.0%) and 100 females (41.8%) in their respective age groups living below the poverty level.
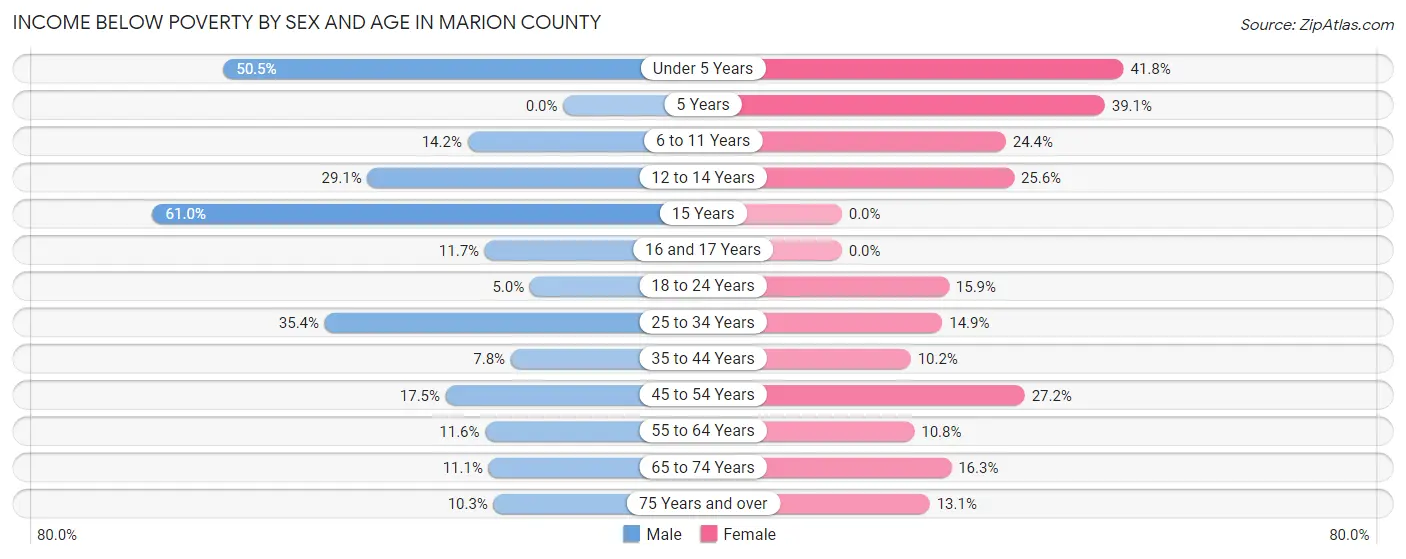
| Age Bracket | Male | Female |
| Under 5 Years | 52 (50.5%) | 100 (41.8%) |
| 5 Years | 0 (0.0%) | 25 (39.1%) |
| 6 to 11 Years | 48 (14.2%) | 84 (24.3%) |
| 12 to 14 Years | 41 (29.1%) | 34 (25.6%) |
| 15 Years | 25 (61.0%) | 0 (0.0%) |
| 16 and 17 Years | 12 (11.7%) | 0 (0.0%) |
| 18 to 24 Years | 24 (5.0%) | 45 (15.9%) |
| 25 to 34 Years | 91 (35.4%) | 66 (14.9%) |
| 35 to 44 Years | 49 (7.8%) | 48 (10.2%) |
| 45 to 54 Years | 74 (17.4%) | 151 (27.2%) |
| 55 to 64 Years | 99 (11.6%) | 99 (10.8%) |
| 65 to 74 Years | 87 (11.1%) | 130 (16.3%) |
| 75 Years and over | 48 (10.3%) | 70 (13.1%) |
| Total | 650 (13.9%) | 852 (17.4%) |
Income Above Poverty by Sex and Age in Marion County
According to the poverty statistics in Marion County, males aged 5 years and females aged 15 years are the age groups that are most secure financially, with 100.0% of males and 100.0% of females in these age groups living above the poverty line.
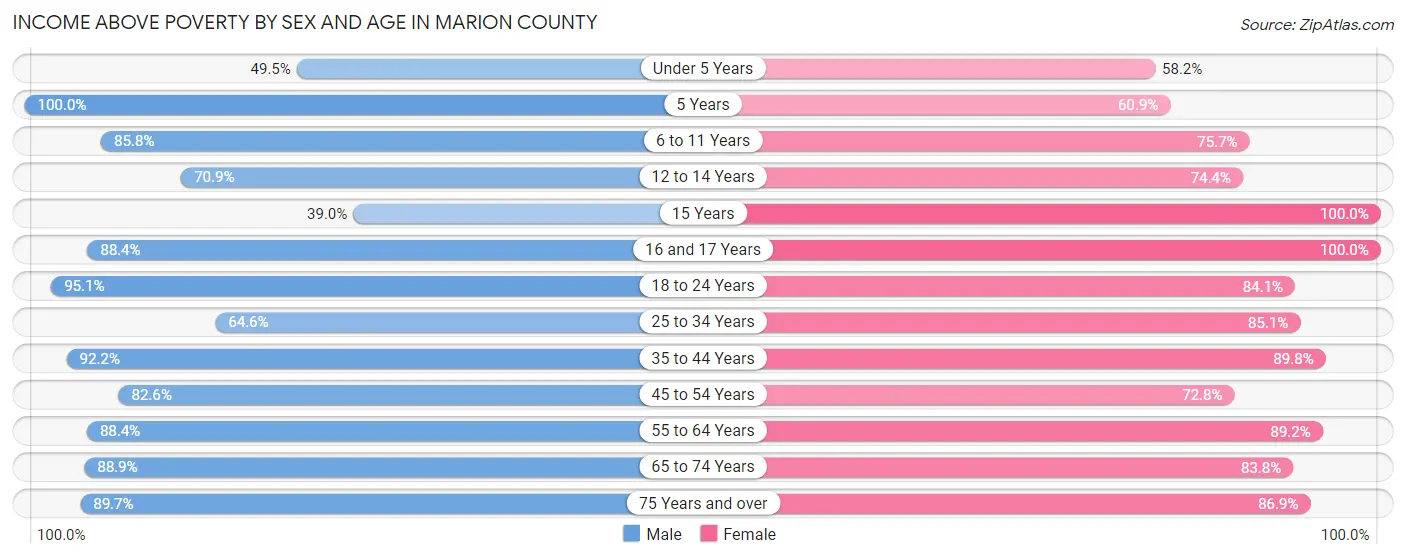
| Age Bracket | Male | Female |
| Under 5 Years | 51 (49.5%) | 139 (58.2%) |
| 5 Years | 52 (100.0%) | 39 (60.9%) |
| 6 to 11 Years | 290 (85.8%) | 261 (75.6%) |
| 12 to 14 Years | 100 (70.9%) | 99 (74.4%) |
| 15 Years | 16 (39.0%) | 43 (100.0%) |
| 16 and 17 Years | 91 (88.3%) | 59 (100.0%) |
| 18 to 24 Years | 461 (95.1%) | 238 (84.1%) |
| 25 to 34 Years | 166 (64.6%) | 376 (85.1%) |
| 35 to 44 Years | 580 (92.2%) | 421 (89.8%) |
| 45 to 54 Years | 350 (82.6%) | 405 (72.8%) |
| 55 to 64 Years | 756 (88.4%) | 820 (89.2%) |
| 65 to 74 Years | 698 (88.9%) | 670 (83.8%) |
| 75 Years and over | 416 (89.7%) | 466 (86.9%) |
| Total | 4,027 (86.1%) | 4,036 (82.6%) |
Income Below Poverty Among Married-Couple Families in Marion County
The poverty statistics for married-couple families in Marion County show that 4.5% or 76 of the total 1,686 families live below the poverty line. Families with 5 or more children have the highest poverty rate of 100.0%, comprising of 27 families. On the other hand, families with 3 or 4 children have the lowest poverty rate of 0.0%, which includes 0 families.
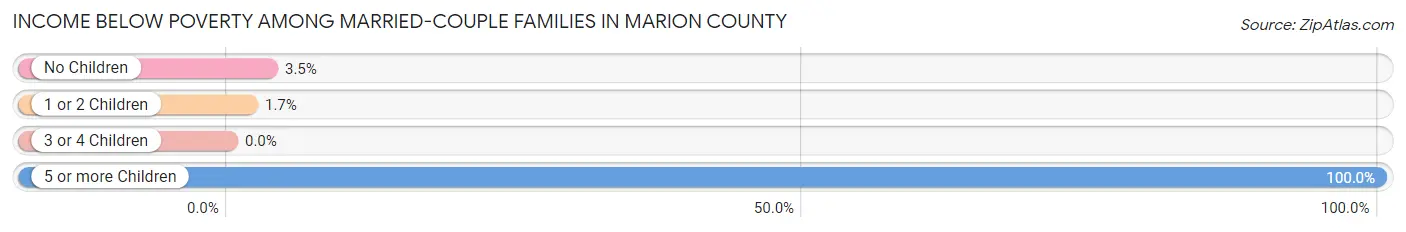
| Children | Above Poverty | Below Poverty |
| No Children | 1,222 (96.5%) | 44 (3.5%) |
| 1 or 2 Children | 283 (98.3%) | 5 (1.7%) |
| 3 or 4 Children | 105 (100.0%) | 0 (0.0%) |
| 5 or more Children | 0 (0.0%) | 27 (100.0%) |
| Total | 1,610 (95.5%) | 76 (4.5%) |
Income Below Poverty Among Single-Parent Households in Marion County
According to the poverty data in Marion County, 37.0% or 54 single-father households and 12.4% or 64 single-mother households are living below the poverty line. Among single-father households, those with 1 or 2 children have the highest poverty rate, with 47 households (65.3%) experiencing poverty. Likewise, among single-mother households, those with 3 or 4 children have the highest poverty rate, with 18 households (25.4%) falling below the poverty line.
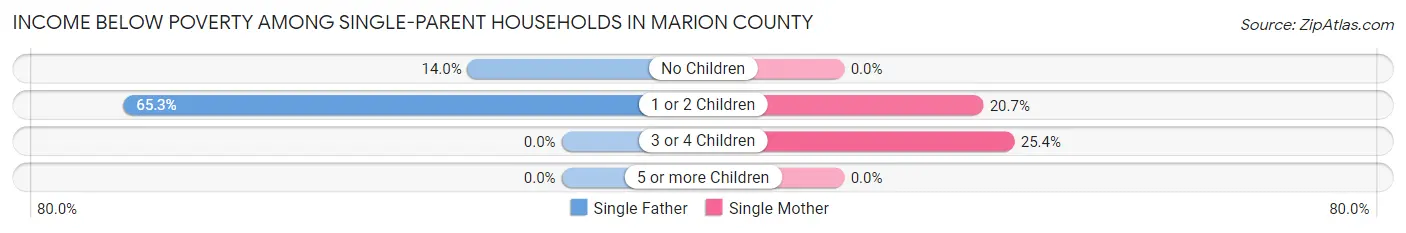
| Children | Single Father | Single Mother |
| No Children | 7 (14.0%) | 0 (0.0%) |
| 1 or 2 Children | 47 (65.3%) | 46 (20.7%) |
| 3 or 4 Children | 0 (0.0%) | 18 (25.4%) |
| 5 or more Children | 0 (0.0%) | 0 (0.0%) |
| Total | 54 (37.0%) | 64 (12.4%) |
Income Below Poverty Among Married-Couple vs Single-Parent Households in Marion County
The poverty data for Marion County shows that 76 of the married-couple family households (4.5%) and 118 of the single-parent households (17.8%) are living below the poverty level. Within the married-couple family households, those with 5 or more children have the highest poverty rate, with 27 households (100.0%) falling below the poverty line. Among the single-parent households, those with 1 or 2 children have the highest poverty rate, with 93 household (31.6%) living below poverty.
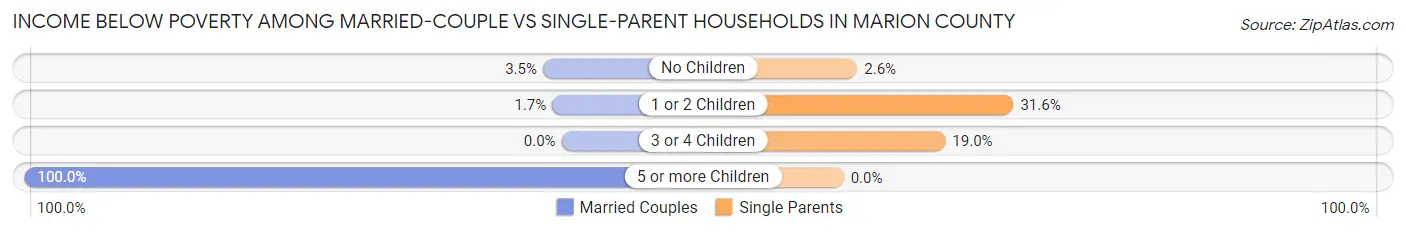
| Children | Married-Couple Families | Single-Parent Households |
| No Children | 44 (3.5%) | 7 (2.5%) |
| 1 or 2 Children | 5 (1.7%) | 93 (31.6%) |
| 3 or 4 Children | 0 (0.0%) | 18 (19.0%) |
| 5 or more Children | 27 (100.0%) | 0 (0.0%) |
| Total | 76 (4.5%) | 118 (17.8%) |
Race in Marion County
The most populous races in Marion County are White / Caucasian (6,901 | 71.4%), Black / African American (2,117 | 21.9%), and Hispanic or Latino (447 | 4.6%).
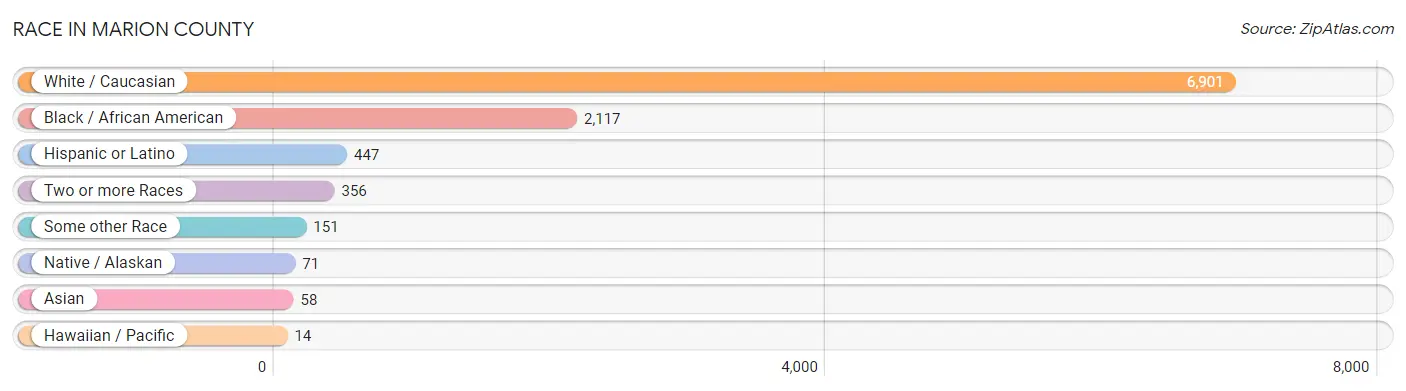
| Race | # Population | % Population |
| Asian | 58 | 0.6% |
| Black / African American | 2,117 | 21.9% |
| Hawaiian / Pacific | 14 | 0.1% |
| Hispanic or Latino | 447 | 4.6% |
| Native / Alaskan | 71 | 0.7% |
| White / Caucasian | 6,901 | 71.4% |
| Two or more Races | 356 | 3.7% |
| Some other Race | 151 | 1.6% |
| Total | 9,668 | 100.0% |
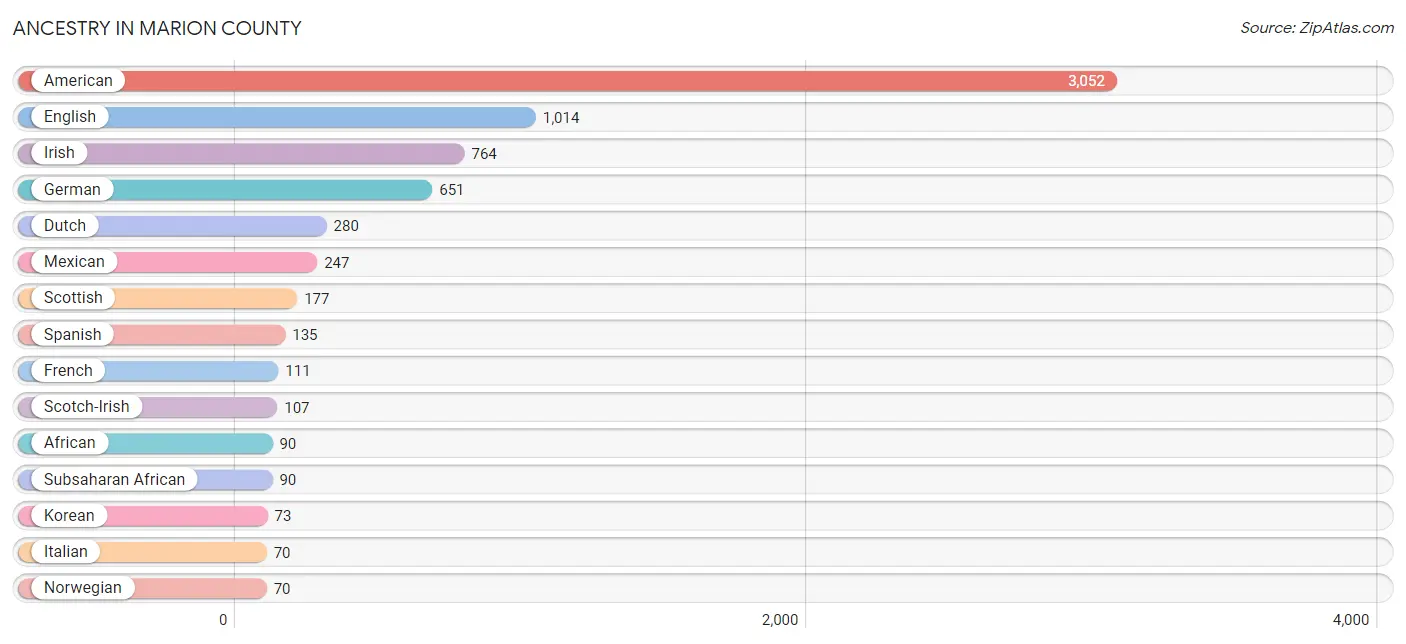
Ancestry in Marion County
The most populous ancestries reported in Marion County are American (3,052 | 31.6%), English (1,014 | 10.5%), Irish (764 | 7.9%), German (651 | 6.7%), and Dutch (280 | 2.9%), together accounting for 59.6% of all Marion County residents.
| Ancestry | # Population | % Population |
| African | 90 | 0.9% |
| American | 3,052 | 31.6% |
| Apache | 11 | 0.1% |
| Arab | 15 | 0.2% |
| Bhutanese | 23 | 0.2% |
| British | 23 | 0.2% |
| Cajun | 9 | 0.1% |
| Cherokee | 32 | 0.3% |
| Chickasaw | 12 | 0.1% |
| Choctaw | 5 | 0.1% |
| Creek | 48 | 0.5% |
| Czech | 38 | 0.4% |
| Danish | 13 | 0.1% |
| Dutch | 280 | 2.9% |
| Dutch West Indian | 14 | 0.1% |
| English | 1,014 | 10.5% |
| European | 30 | 0.3% |
| French | 111 | 1.1% |
| French American Indian | 3 | 0.0% |
| German | 651 | 6.7% |
| Guamanian / Chamorro | 14 | 0.1% |
| Irish | 764 | 7.9% |
| Italian | 70 | 0.7% |
| Korean | 73 | 0.8% |
| Lebanese | 15 | 0.2% |
| Mexican | 247 | 2.5% |
| Northern European | 14 | 0.1% |
| Norwegian | 70 | 0.7% |
| Polish | 49 | 0.5% |
| Portuguese | 11 | 0.1% |
| Puerto Rican | 14 | 0.1% |
| Russian | 11 | 0.1% |
| Scandinavian | 49 | 0.5% |
| Scotch-Irish | 107 | 1.1% |
| Scottish | 177 | 1.8% |
| Sioux | 5 | 0.1% |
| South American | 28 | 0.3% |
| Spaniard | 17 | 0.2% |
| Spanish | 135 | 1.4% |
| Subsaharan African | 90 | 0.9% |
| Swedish | 30 | 0.3% |
| Swiss | 5 | 0.1% |
| Thai | 16 | 0.2% |
| Ukrainian | 12 | 0.1% |
| Venezuelan | 28 | 0.3% |
| Welsh | 60 | 0.6% | View All 46 Rows |
Immigrants in Marion County
The most numerous immigrant groups reported in Marion County came from Latin America (168 | 1.7%), Central America (140 | 1.5%), Mexico (140 | 1.5%), Europe (65 | 0.7%), and Germany (50 | 0.5%), together accounting for 5.8% of all Marion County residents.
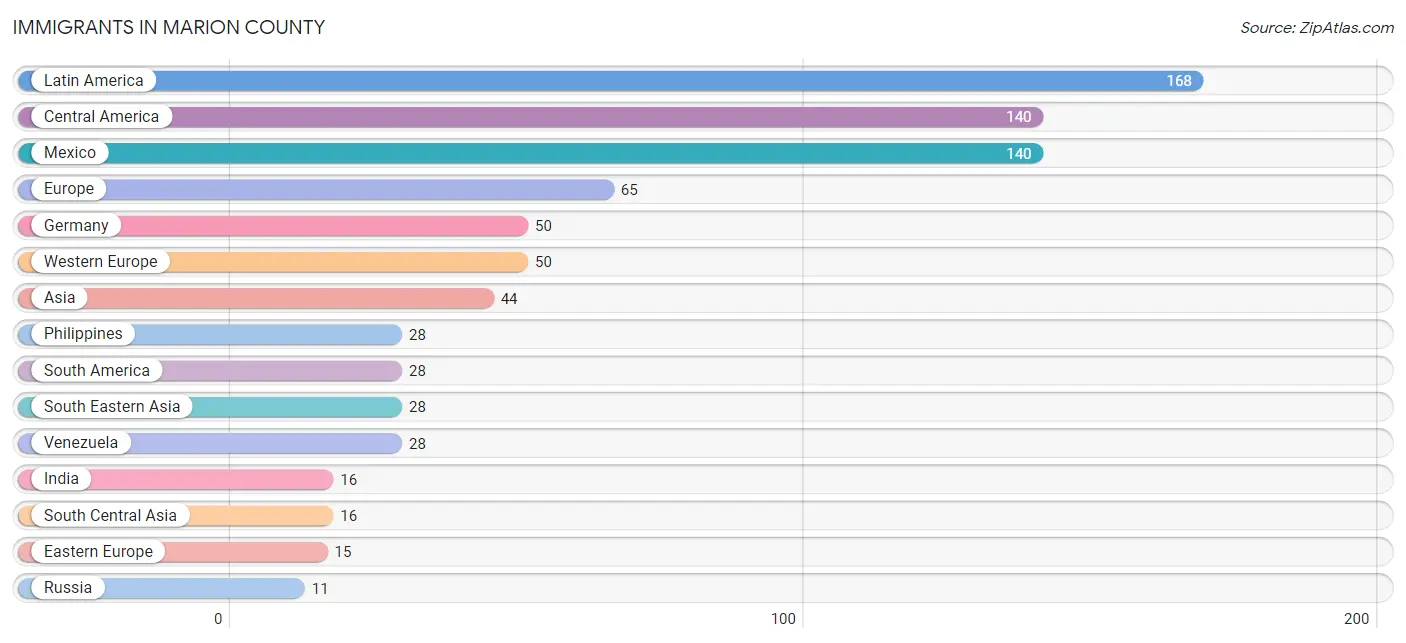
| Immigration Origin | # Population | % Population |
| Asia | 44 | 0.5% |
| Canada | 4 | 0.0% |
| Central America | 140 | 1.5% |
| Eastern Europe | 15 | 0.2% |
| Europe | 65 | 0.7% |
| Germany | 50 | 0.5% |
| India | 16 | 0.2% |
| Latin America | 168 | 1.7% |
| Mexico | 140 | 1.5% |
| Philippines | 28 | 0.3% |
| Russia | 11 | 0.1% |
| South America | 28 | 0.3% |
| South Central Asia | 16 | 0.2% |
| South Eastern Asia | 28 | 0.3% |
| Ukraine | 4 | 0.0% |
| Venezuela | 28 | 0.3% |
| Western Europe | 50 | 0.5% | View All 17 Rows |
Sex and Age in Marion County
Sex and Age in Marion County
The most populous age groups in Marion County are 65 to 69 Years (512 | 10.8%) for men and 60 to 64 Years (566 | 11.5%) for women.
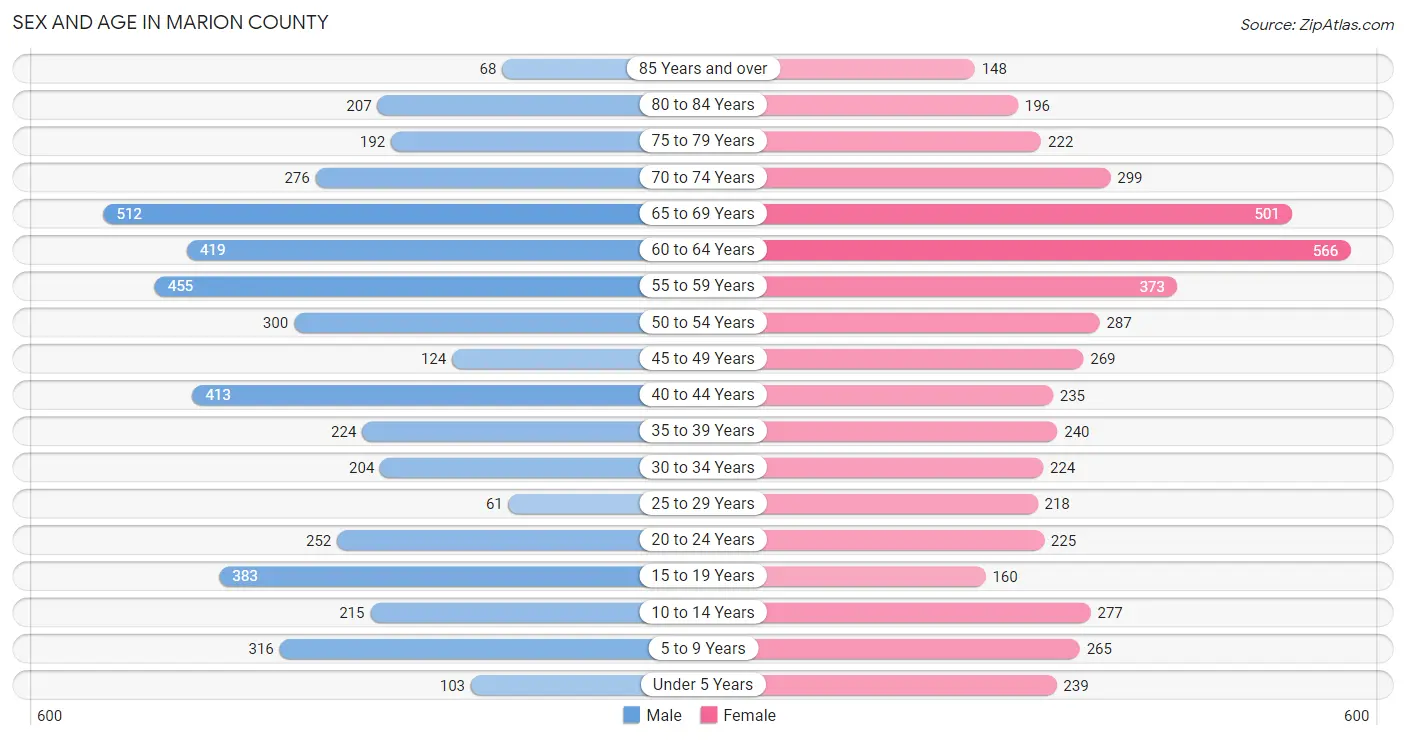
| Age Bracket | Male | Female |
| Under 5 Years | 103 (2.2%) | 239 (4.8%) |
| 5 to 9 Years | 316 (6.7%) | 265 (5.4%) |
| 10 to 14 Years | 215 (4.5%) | 277 (5.6%) |
| 15 to 19 Years | 383 (8.1%) | 160 (3.2%) |
| 20 to 24 Years | 252 (5.3%) | 225 (4.5%) |
| 25 to 29 Years | 61 (1.3%) | 218 (4.4%) |
| 30 to 34 Years | 204 (4.3%) | 224 (4.5%) |
| 35 to 39 Years | 224 (4.7%) | 240 (4.9%) |
| 40 to 44 Years | 413 (8.7%) | 235 (4.8%) |
| 45 to 49 Years | 124 (2.6%) | 269 (5.4%) |
| 50 to 54 Years | 300 (6.4%) | 287 (5.8%) |
| 55 to 59 Years | 455 (9.6%) | 373 (7.5%) |
| 60 to 64 Years | 419 (8.9%) | 566 (11.5%) |
| 65 to 69 Years | 512 (10.8%) | 501 (10.1%) |
| 70 to 74 Years | 276 (5.8%) | 299 (6.0%) |
| 75 to 79 Years | 192 (4.1%) | 222 (4.5%) |
| 80 to 84 Years | 207 (4.4%) | 196 (4.0%) |
| 85 Years and over | 68 (1.4%) | 148 (3.0%) |
| Total | 4,724 (100.0%) | 4,944 (100.0%) |
Families and Households in Marion County
Median Family Size in Marion County
The median family size in Marion County is 3.21 persons per family, with single male/father families (146 | 6.2%) accounting for the largest median family size of 3.92 persons per family. On the other hand, married-couple families (1,686 | 71.7%) represent the smallest median family size with 2.97 persons per family.
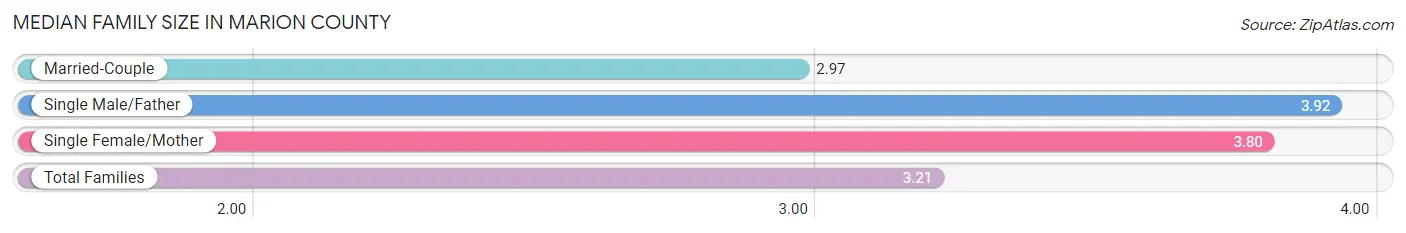
| Family Type | # Families | Family Size |
| Married-Couple | 1,686 (71.7%) | 2.97 |
| Single Male/Father | 146 (6.2%) | 3.92 |
| Single Female/Mother | 518 (22.0%) | 3.80 |
| Total Families | 2,350 (100.0%) | 3.21 |
Median Household Size in Marion County
The median household size in Marion County is 2.38 persons per household, with single male/father households (146 | 3.6%) accounting for the largest median household size of 4.51 persons per household. non-family households (1,664 | 41.4%) represent the smallest median household size with 1.12 persons per household.
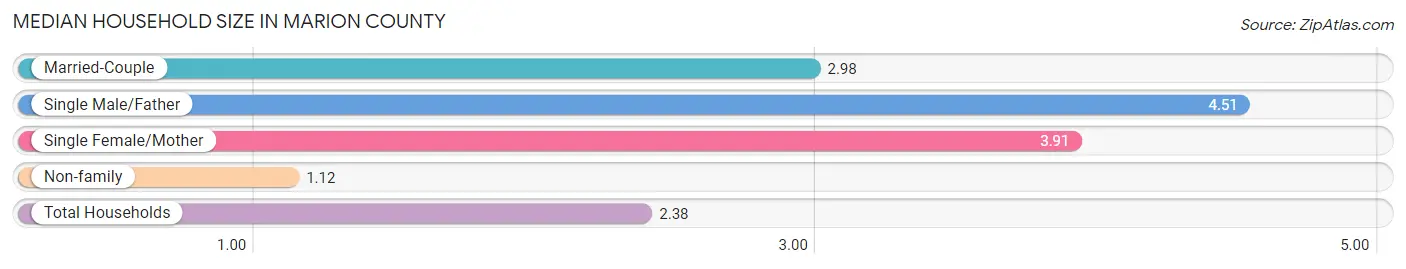
| Household Type | # Households | Household Size |
| Married-Couple | 1,686 (42.0%) | 2.98 |
| Single Male/Father | 146 (3.6%) | 4.51 |
| Single Female/Mother | 518 (12.9%) | 3.91 |
| Non-family | 1,664 (41.4%) | 1.12 |
| Total Households | 4,014 (100.0%) | 2.38 |
Household Size by Marriage Status in Marion County
Out of a total of 4,014 households in Marion County, 2,350 (58.6%) are family households, while 1,664 (41.4%) are nonfamily households. The most numerous type of family households are 2-person households, comprising 1,359, and the most common type of nonfamily households are 1-person households, comprising 1,530.
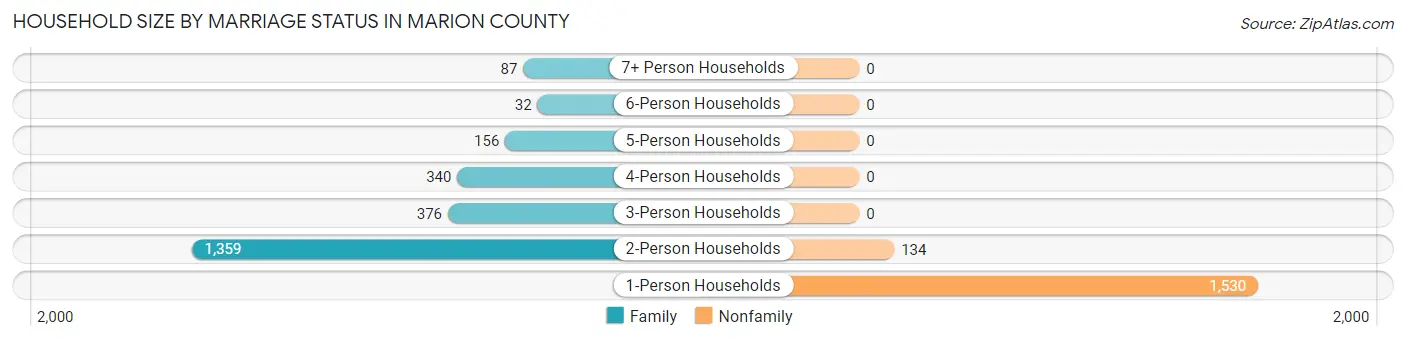
| Household Size | Family Households | Nonfamily Households |
| 1-Person Households | - | 1,530 (38.1%) |
| 2-Person Households | 1,359 (33.9%) | 134 (3.3%) |
| 3-Person Households | 376 (9.4%) | 0 (0.0%) |
| 4-Person Households | 340 (8.5%) | 0 (0.0%) |
| 5-Person Households | 156 (3.9%) | 0 (0.0%) |
| 6-Person Households | 32 (0.8%) | 0 (0.0%) |
| 7+ Person Households | 87 (2.2%) | 0 (0.0%) |
| Total | 2,350 (58.6%) | 1,664 (41.4%) |
Female Fertility in Marion County
Fertility by Age in Marion County
Average fertility rate in Marion County is 44.0 births per 1,000 women. Women in the age bracket of 20 to 34 years have the highest fertility rate with 97.0 births per 1,000 women. Women in the age bracket of 20 to 34 years acount for 90.3% of all women with births.
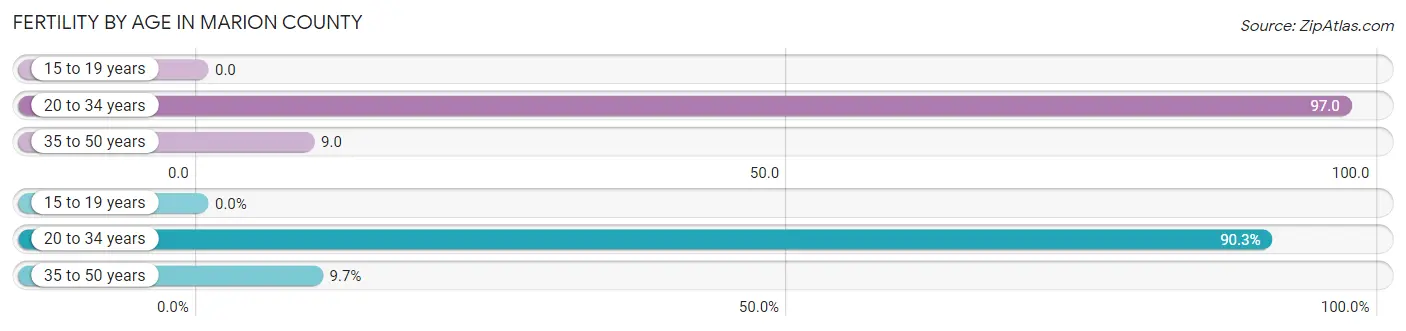
| Age Bracket | Women with Births | Births / 1,000 Women |
| 15 to 19 years | 0 (0.0%) | 0.0 |
| 20 to 34 years | 65 (90.3%) | 97.0 |
| 35 to 50 years | 7 (9.7%) | 9.0 |
| Total | 72 (100.0%) | 44.0 |
Fertility by Age by Marriage Status in Marion County
72.2% of women with births (72) in Marion County are married. The highest percentage of unmarried women with births falls into 20 to 34 years age bracket with 30.8% of them unmarried at the time of birth, while the lowest percentage of unmarried women with births belong to 35 to 50 years age bracket with 0.0% of them unmarried.
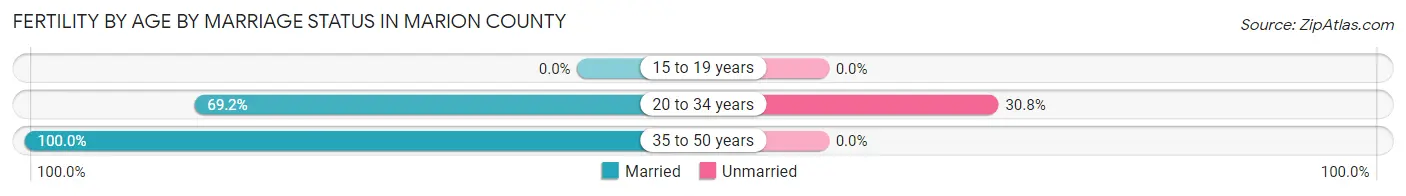
| Age Bracket | Married | Unmarried |
| 15 to 19 years | 0 (0.0%) | 0 (0.0%) |
| 20 to 34 years | 45 (69.2%) | 20 (30.8%) |
| 35 to 50 years | 7 (100.0%) | 0 (0.0%) |
| Total | 52 (72.2%) | 20 (27.8%) |
Fertility by Education in Marion County
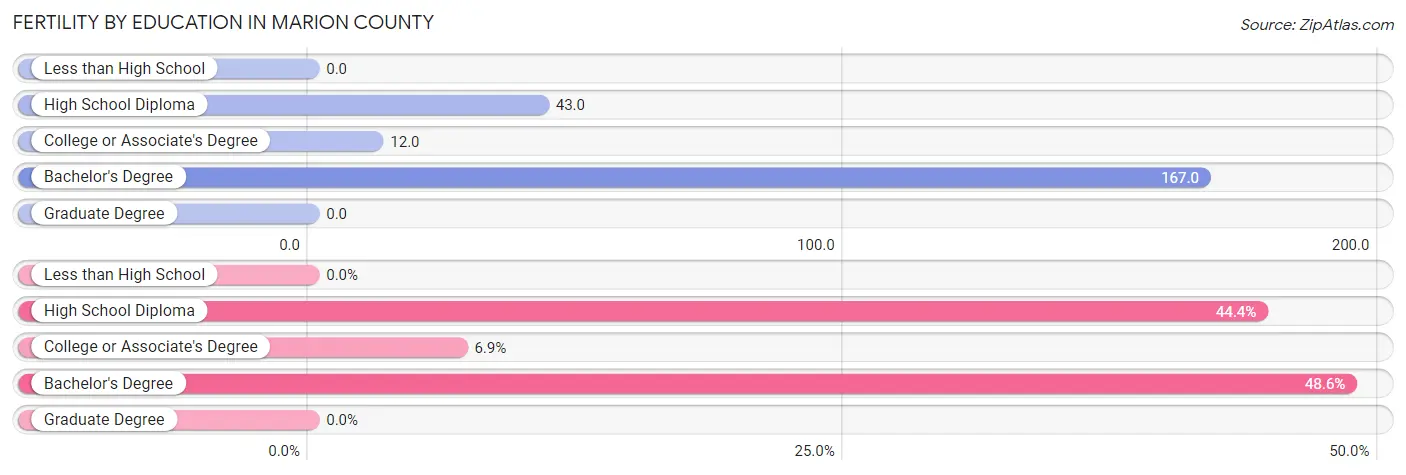
| Educational Attainment | Women with Births | Births / 1,000 Women |
| Less than High School | 0 (0.0%) | 0.0 |
| High School Diploma | 32 (44.4%) | 43.0 |
| College or Associate's Degree | 5 (6.9%) | 12.0 |
| Bachelor's Degree | 35 (48.6%) | 167.0 |
| Graduate Degree | 0 (0.0%) | 0.0 |
| Total | 72 (100.0%) | 44.0 |
Fertility by Education by Marriage Status in Marion County
27.8% of women with births in Marion County are unmarried. Women with the educational attainment of college or associate's degree are most likely to be married with 100.0% of them married at childbirth, while women with the educational attainment of high school diploma are least likely to be married with 62.5% of them unmarried at childbirth.
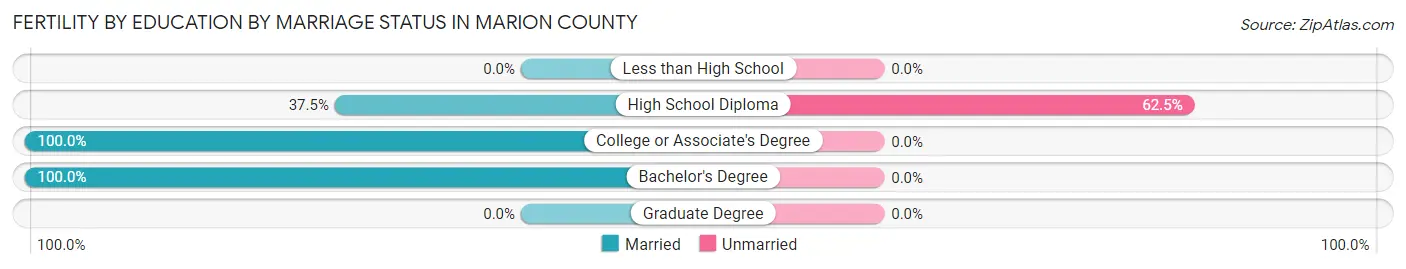
| Educational Attainment | Married | Unmarried |
| Less than High School | 0 (0.0%) | 0 (0.0%) |
| High School Diploma | 12 (37.5%) | 20 (62.5%) |
| College or Associate's Degree | 5 (100.0%) | 0 (0.0%) |
| Bachelor's Degree | 35 (100.0%) | 0 (0.0%) |
| Graduate Degree | 0 (0.0%) | 0 (0.0%) |
| Total | 52 (72.2%) | 20 (27.8%) |
Employment Characteristics in Marion County
Employment by Class of Employer in Marion County
Among the 3,364 employed individuals in Marion County, private company employees (2,360 | 70.2%), not-for-profit organizations (289 | 8.6%), and local government employees (258 | 7.7%) make up the most common classes of employment.
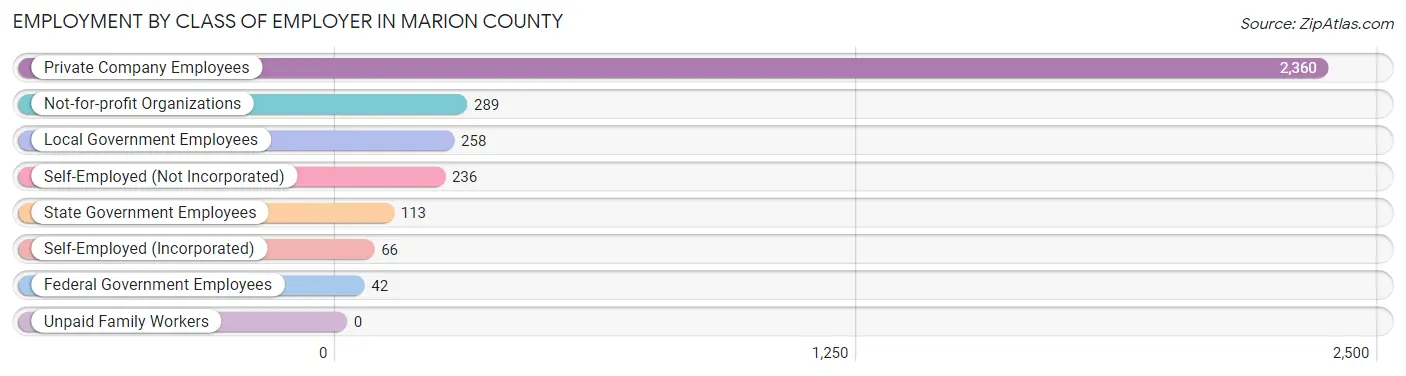
| Employer Class | # Employees | % Employees |
| Private Company Employees | 2,360 | 70.2% |
| Self-Employed (Incorporated) | 66 | 2.0% |
| Self-Employed (Not Incorporated) | 236 | 7.0% |
| Not-for-profit Organizations | 289 | 8.6% |
| Local Government Employees | 258 | 7.7% |
| State Government Employees | 113 | 3.4% |
| Federal Government Employees | 42 | 1.3% |
| Unpaid Family Workers | 0 | 0.0% |
| Total | 3,364 | 100.0% |
Employment Status by Age in Marion County
According to the labor force statistics for Marion County, out of the total population over 16 years of age (8,169), 47.3% or 3,864 individuals are in the labor force, with 10.7% or 413 of them unemployed. The age group with the highest labor force participation rate is 55 to 59 years, with 73.7% or 610 individuals in the labor force. Within the labor force, the 16 to 19 years age range has the highest percentage of unemployed individuals, with 58.1% or 137 of them being unemployed.
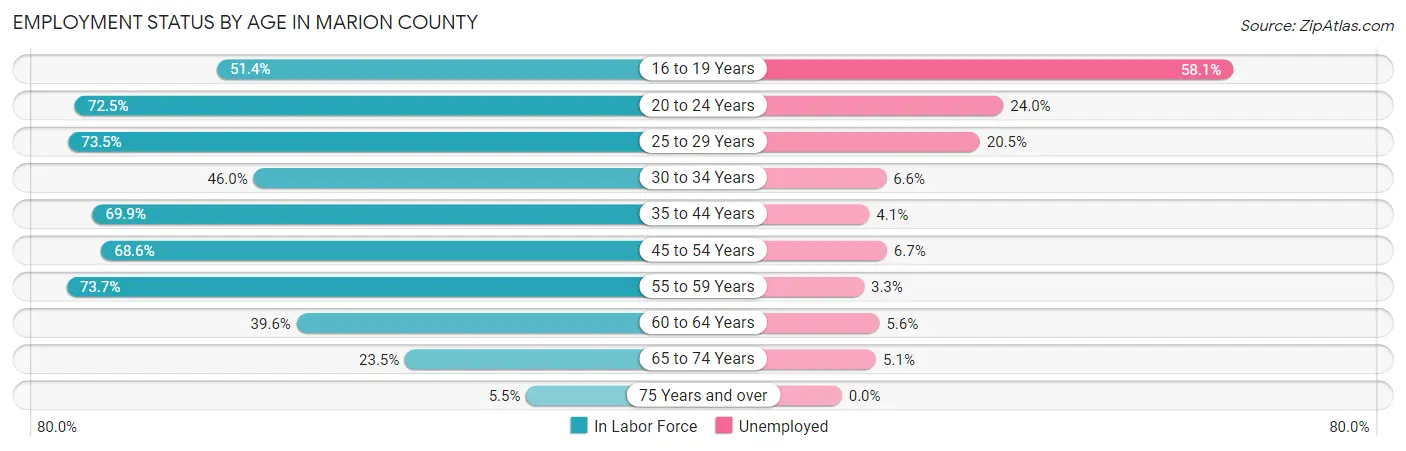
| Age Bracket | In Labor Force | Unemployed |
| 16 to 19 Years | 236 (51.4%) | 137 (58.1%) |
| 20 to 24 Years | 346 (72.5%) | 83 (24.0%) |
| 25 to 29 Years | 205 (73.5%) | 42 (20.5%) |
| 30 to 34 Years | 197 (46.0%) | 13 (6.6%) |
| 35 to 44 Years | 777 (69.9%) | 32 (4.1%) |
| 45 to 54 Years | 672 (68.6%) | 45 (6.7%) |
| 55 to 59 Years | 610 (73.7%) | 20 (3.3%) |
| 60 to 64 Years | 390 (39.6%) | 22 (5.6%) |
| 65 to 74 Years | 373 (23.5%) | 19 (5.1%) |
| 75 Years and over | 57 (5.5%) | 0 (0.0%) |
| Total | 3,864 (47.3%) | 413 (10.7%) |
Employment Status by Educational Attainment in Marion County
According to labor force statistics for Marion County, 61.8% of individuals (2,850) out of the total population between 25 and 64 years of age (4,612) are in the labor force, with 6.1% or 174 of them being unemployed. The group with the highest labor force participation rate are those with the educational attainment of bachelor's degree or higher, with 76.4% or 551 individuals in the labor force. Within the labor force, individuals with college / associate degree education have the highest percentage of unemployment, with 7.5% or 66 of them being unemployed.
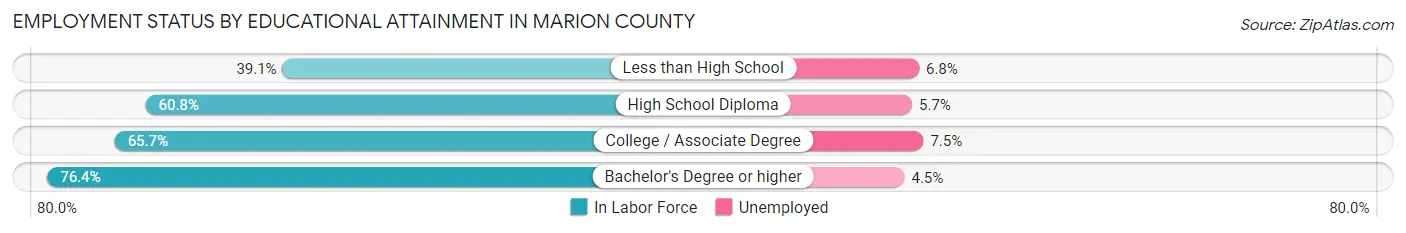
| Educational Attainment | In Labor Force | Unemployed |
| Less than High School | 236 (39.1%) | 41 (6.8%) |
| High School Diploma | 1,185 (60.8%) | 111 (5.7%) |
| College / Associate Degree | 879 (65.7%) | 100 (7.5%) |
| Bachelor's Degree or higher | 551 (76.4%) | 32 (4.5%) |
| Total | 2,850 (61.8%) | 281 (6.1%) |
Employment Occupations by Sex in Marion County
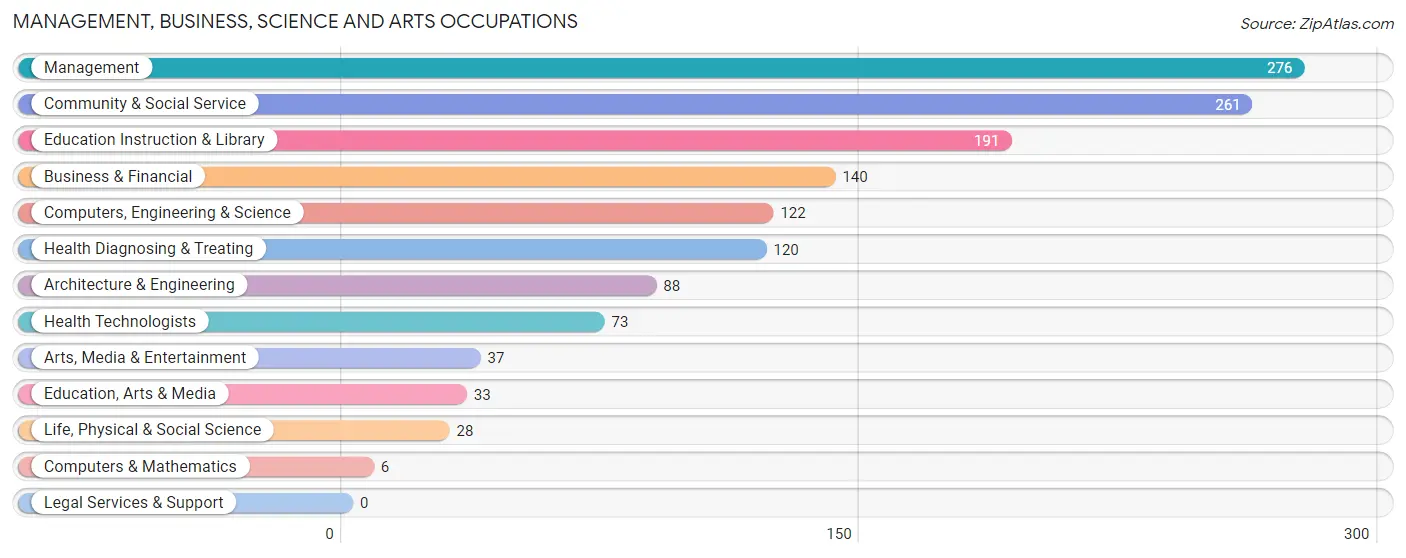
Management, Business, Science and Arts Occupations
The most common Management, Business, Science and Arts occupations in Marion County are Management (276 | 8.0%), Community & Social Service (261 | 7.6%), Education Instruction & Library (191 | 5.5%), Business & Financial (140 | 4.1%), and Computers, Engineering & Science (122 | 3.5%).
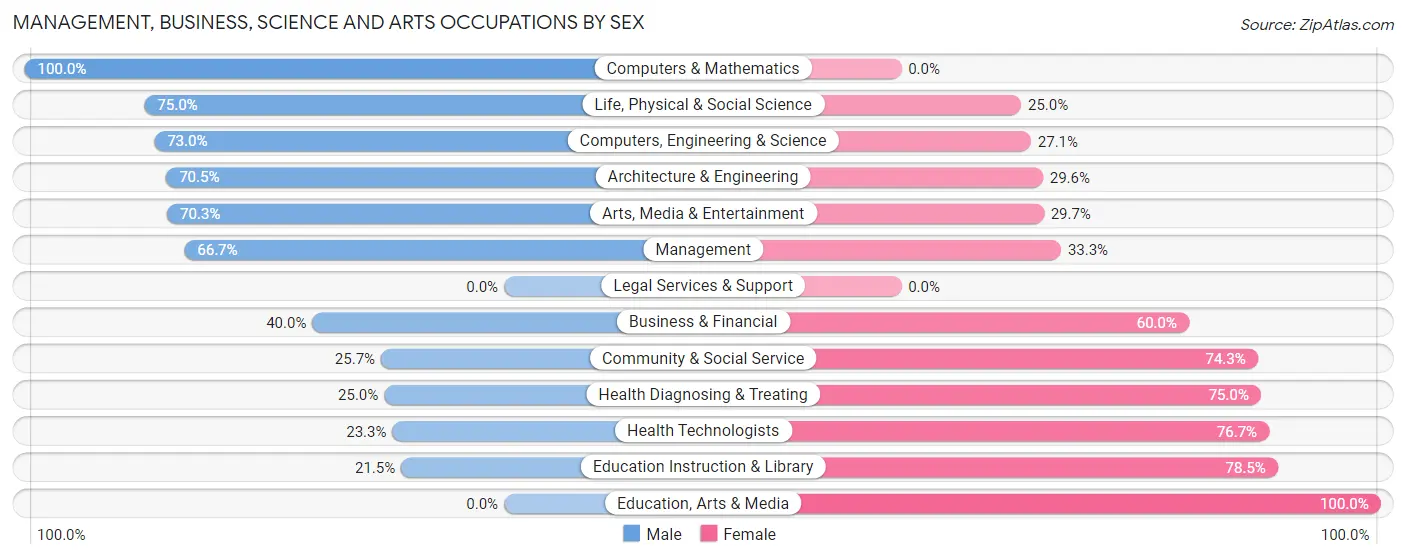
Management, Business, Science and Arts Occupations by Sex
Within the Management, Business, Science and Arts occupations in Marion County, the most male-oriented occupations are Computers & Mathematics (100.0%), Life, Physical & Social Science (75.0%), and Computers, Engineering & Science (73.0%), while the most female-oriented occupations are Education, Arts & Media (100.0%), Education Instruction & Library (78.5%), and Health Technologists (76.7%).
| Occupation | Male | Female |
| Management | 184 (66.7%) | 92 (33.3%) |
| Business & Financial | 56 (40.0%) | 84 (60.0%) |
| Computers, Engineering & Science | 89 (73.0%) | 33 (27.1%) |
| Computers & Mathematics | 6 (100.0%) | 0 (0.0%) |
| Architecture & Engineering | 62 (70.5%) | 26 (29.5%) |
| Life, Physical & Social Science | 21 (75.0%) | 7 (25.0%) |
| Community & Social Service | 67 (25.7%) | 194 (74.3%) |
| Education, Arts & Media | 0 (0.0%) | 33 (100.0%) |
| Legal Services & Support | 0 (0.0%) | 0 (0.0%) |
| Education Instruction & Library | 41 (21.5%) | 150 (78.5%) |
| Arts, Media & Entertainment | 26 (70.3%) | 11 (29.7%) |
| Health Diagnosing & Treating | 30 (25.0%) | 90 (75.0%) |
| Health Technologists | 17 (23.3%) | 56 (76.7%) |
| Total (Category) | 426 (46.4%) | 493 (53.6%) |
| Total (Overall) | 1,683 (48.8%) | 1,767 (51.2%) |
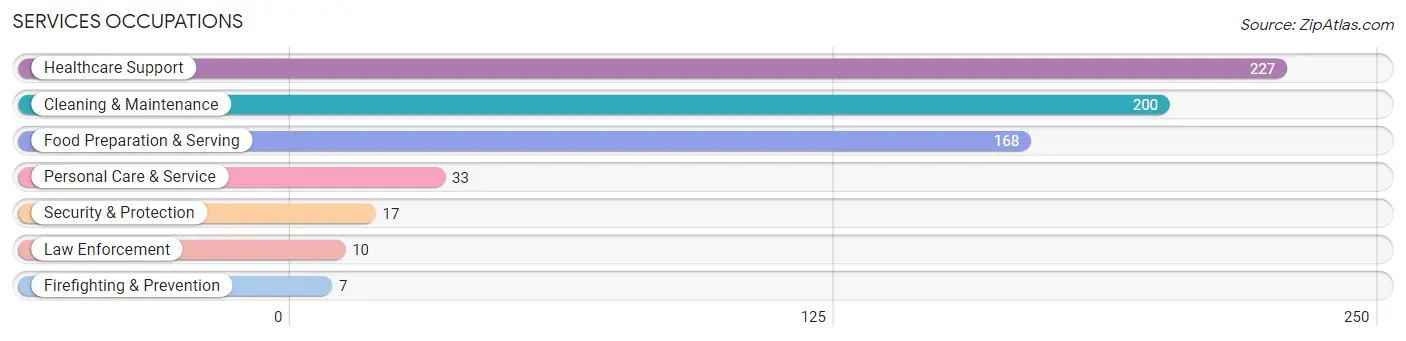
Services Occupations
The most common Services occupations in Marion County are Healthcare Support (227 | 6.6%), Cleaning & Maintenance (200 | 5.8%), Food Preparation & Serving (168 | 4.9%), Personal Care & Service (33 | 1.0%), and Security & Protection (17 | 0.5%).
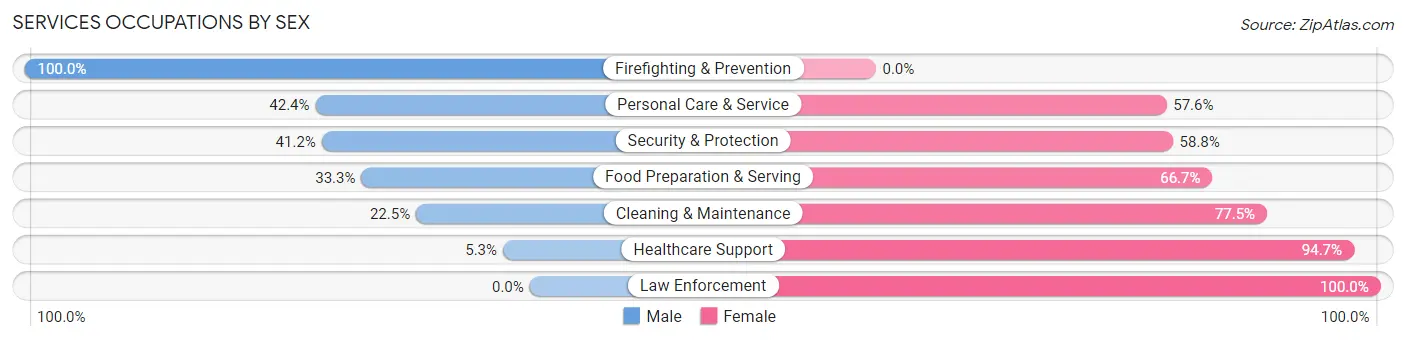
Services Occupations by Sex
Within the Services occupations in Marion County, the most male-oriented occupations are Firefighting & Prevention (100.0%), Personal Care & Service (42.4%), and Security & Protection (41.2%), while the most female-oriented occupations are Law Enforcement (100.0%), Healthcare Support (94.7%), and Cleaning & Maintenance (77.5%).
| Occupation | Male | Female |
| Healthcare Support | 12 (5.3%) | 215 (94.7%) |
| Security & Protection | 7 (41.2%) | 10 (58.8%) |
| Firefighting & Prevention | 7 (100.0%) | 0 (0.0%) |
| Law Enforcement | 0 (0.0%) | 10 (100.0%) |
| Food Preparation & Serving | 56 (33.3%) | 112 (66.7%) |
| Cleaning & Maintenance | 45 (22.5%) | 155 (77.5%) |
| Personal Care & Service | 14 (42.4%) | 19 (57.6%) |
| Total (Category) | 134 (20.8%) | 511 (79.2%) |
| Total (Overall) | 1,683 (48.8%) | 1,767 (51.2%) |
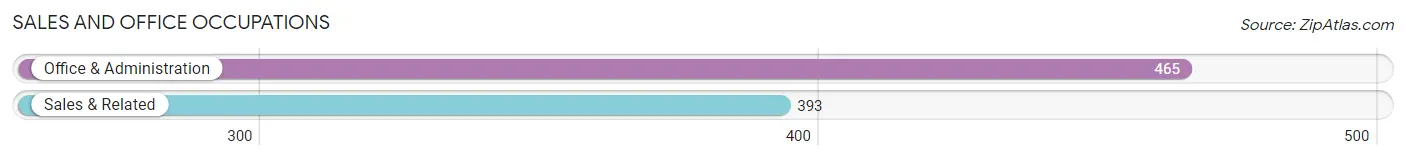
Sales and Office Occupations
The most common Sales and Office occupations in Marion County are Office & Administration (465 | 13.5%), and Sales & Related (393 | 11.4%).
Sales and Office Occupations by Sex
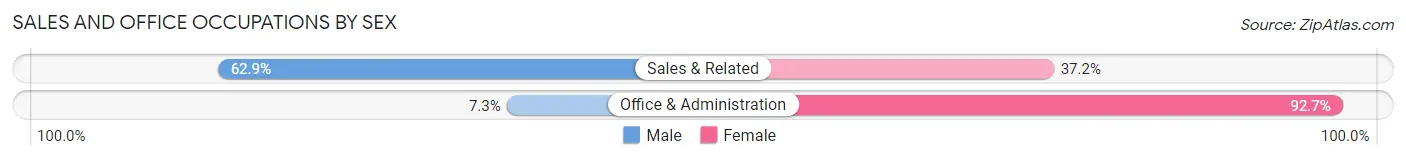
| Occupation | Male | Female |
| Sales & Related | 247 (62.8%) | 146 (37.1%) |
| Office & Administration | 34 (7.3%) | 431 (92.7%) |
| Total (Category) | 281 (32.8%) | 577 (67.2%) |
| Total (Overall) | 1,683 (48.8%) | 1,767 (51.2%) |
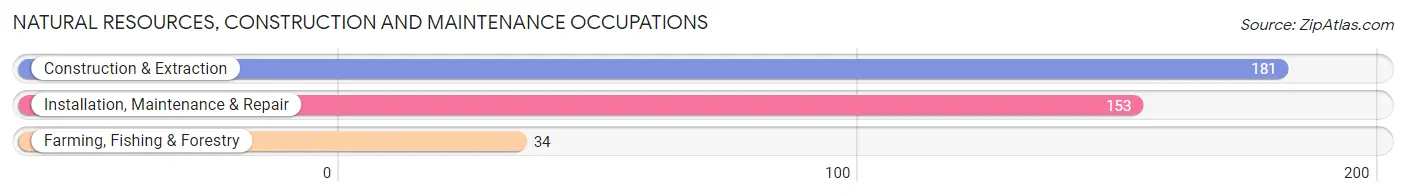
Natural Resources, Construction and Maintenance Occupations
The most common Natural Resources, Construction and Maintenance occupations in Marion County are Construction & Extraction (181 | 5.2%), Installation, Maintenance & Repair (153 | 4.4%), and Farming, Fishing & Forestry (34 | 1.0%).
Natural Resources, Construction and Maintenance Occupations by Sex
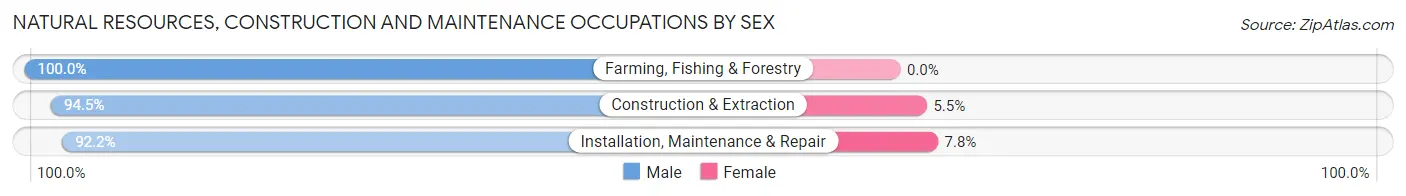
| Occupation | Male | Female |
| Farming, Fishing & Forestry | 34 (100.0%) | 0 (0.0%) |
| Construction & Extraction | 171 (94.5%) | 10 (5.5%) |
| Installation, Maintenance & Repair | 141 (92.2%) | 12 (7.8%) |
| Total (Category) | 346 (94.0%) | 22 (6.0%) |
| Total (Overall) | 1,683 (48.8%) | 1,767 (51.2%) |
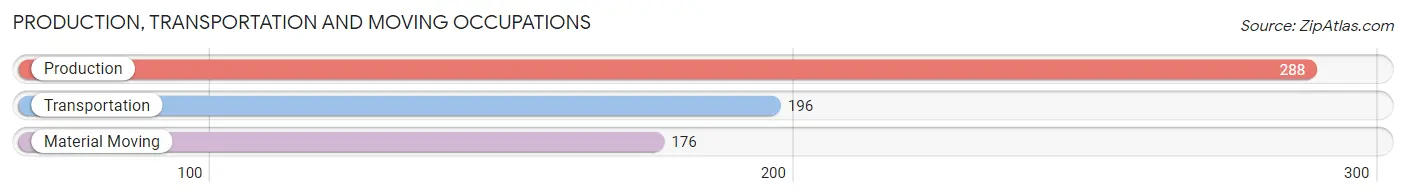
Production, Transportation and Moving Occupations
The most common Production, Transportation and Moving occupations in Marion County are Production (288 | 8.4%), Transportation (196 | 5.7%), and Material Moving (176 | 5.1%).
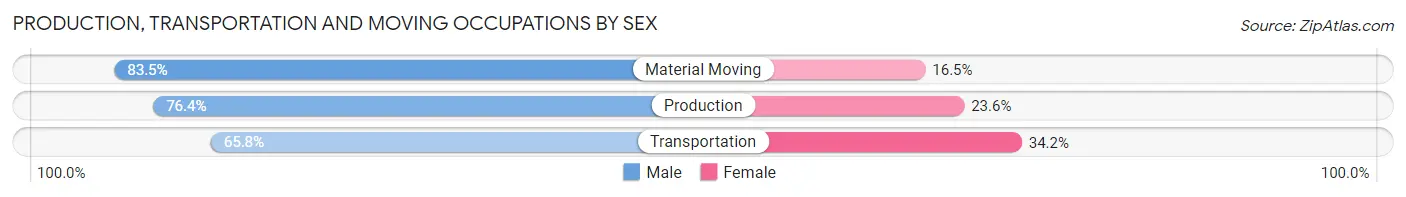
Production, Transportation and Moving Occupations by Sex
| Occupation | Male | Female |
| Production | 220 (76.4%) | 68 (23.6%) |
| Transportation | 129 (65.8%) | 67 (34.2%) |
| Material Moving | 147 (83.5%) | 29 (16.5%) |
| Total (Category) | 496 (75.1%) | 164 (24.8%) |
| Total (Overall) | 1,683 (48.8%) | 1,767 (51.2%) |
Employment Industries by Sex in Marion County
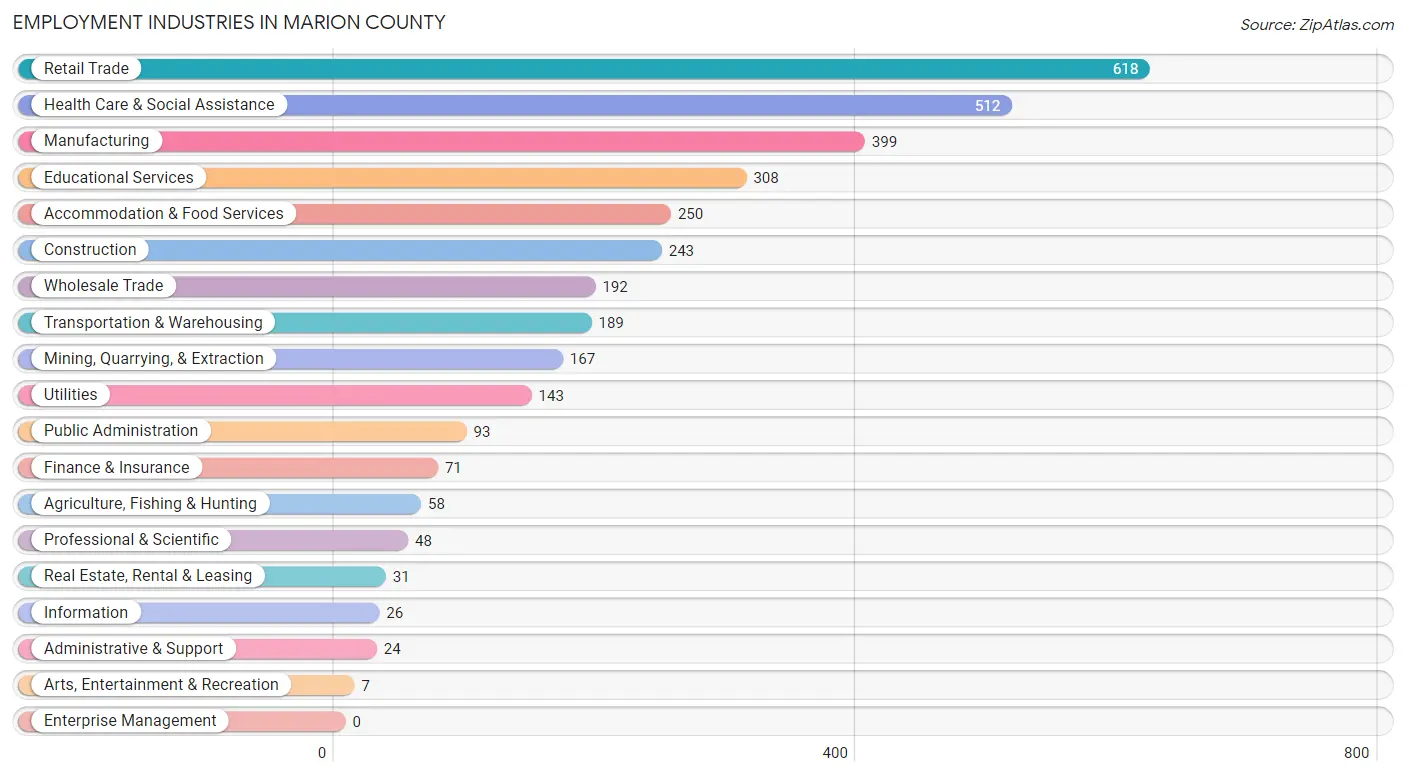
Employment Industries in Marion County
The major employment industries in Marion County include Retail Trade (618 | 17.9%), Health Care & Social Assistance (512 | 14.8%), Manufacturing (399 | 11.6%), Educational Services (308 | 8.9%), and Accommodation & Food Services (250 | 7.2%).
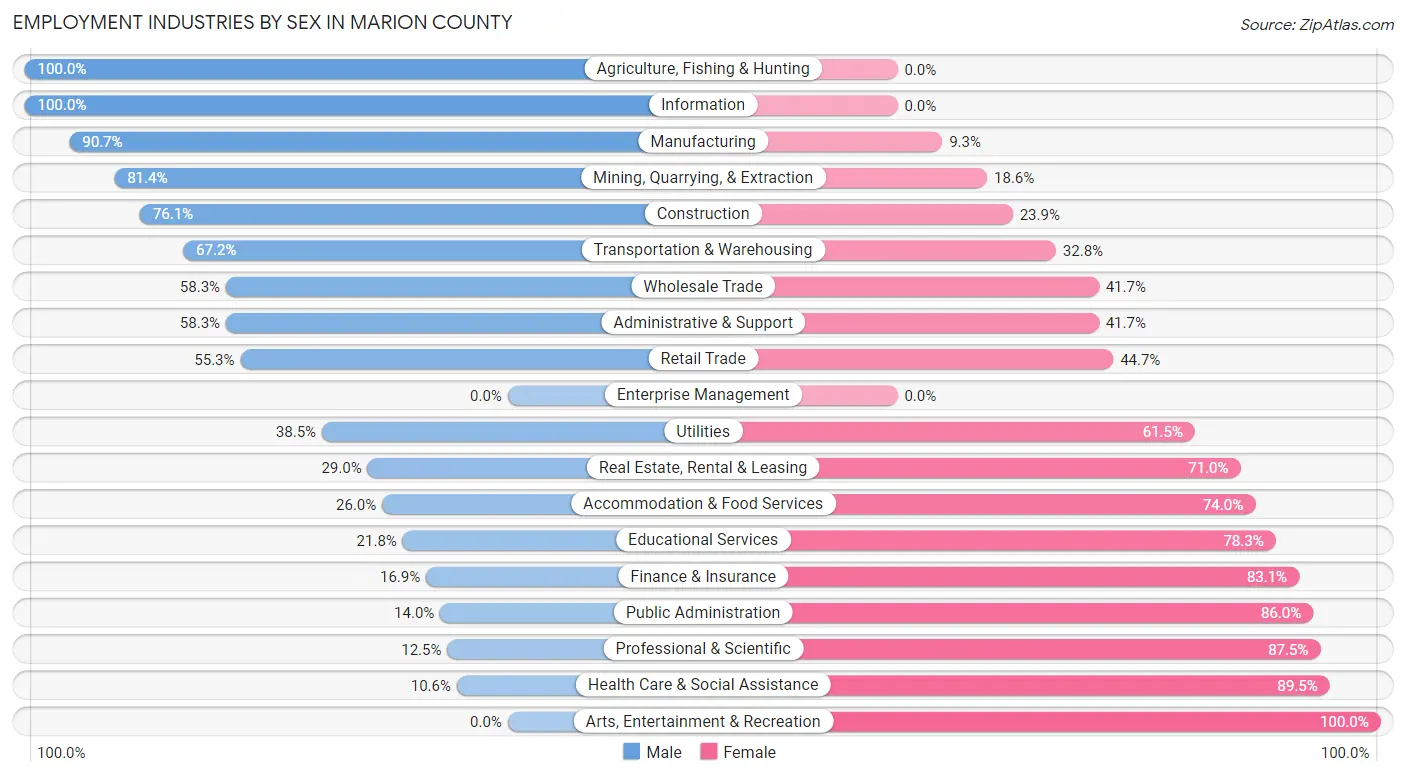
Employment Industries by Sex in Marion County
The Marion County industries that see more men than women are Agriculture, Fishing & Hunting (100.0%), Information (100.0%), and Manufacturing (90.7%), whereas the industries that tend to have a higher number of women are Arts, Entertainment & Recreation (100.0%), Health Care & Social Assistance (89.4%), and Professional & Scientific (87.5%).
| Industry | Male | Female |
| Agriculture, Fishing & Hunting | 58 (100.0%) | 0 (0.0%) |
| Mining, Quarrying, & Extraction | 136 (81.4%) | 31 (18.6%) |
| Construction | 185 (76.1%) | 58 (23.9%) |
| Manufacturing | 362 (90.7%) | 37 (9.3%) |
| Wholesale Trade | 112 (58.3%) | 80 (41.7%) |
| Retail Trade | 342 (55.3%) | 276 (44.7%) |
| Transportation & Warehousing | 127 (67.2%) | 62 (32.8%) |
| Utilities | 55 (38.5%) | 88 (61.5%) |
| Information | 26 (100.0%) | 0 (0.0%) |
| Finance & Insurance | 12 (16.9%) | 59 (83.1%) |
| Real Estate, Rental & Leasing | 9 (29.0%) | 22 (71.0%) |
| Professional & Scientific | 6 (12.5%) | 42 (87.5%) |
| Enterprise Management | 0 (0.0%) | 0 (0.0%) |
| Administrative & Support | 14 (58.3%) | 10 (41.7%) |
| Educational Services | 67 (21.7%) | 241 (78.2%) |
| Health Care & Social Assistance | 54 (10.5%) | 458 (89.4%) |
| Arts, Entertainment & Recreation | 0 (0.0%) | 7 (100.0%) |
| Accommodation & Food Services | 65 (26.0%) | 185 (74.0%) |
| Public Administration | 13 (14.0%) | 80 (86.0%) |
| Total | 1,683 (48.8%) | 1,767 (51.2%) |
Education in Marion County
School Enrollment in Marion County
The most common levels of schooling among the 1,515 students in Marion County are elementary school (425 | 28.1%), middle school (423 | 27.9%), and high school (344 | 22.7%).
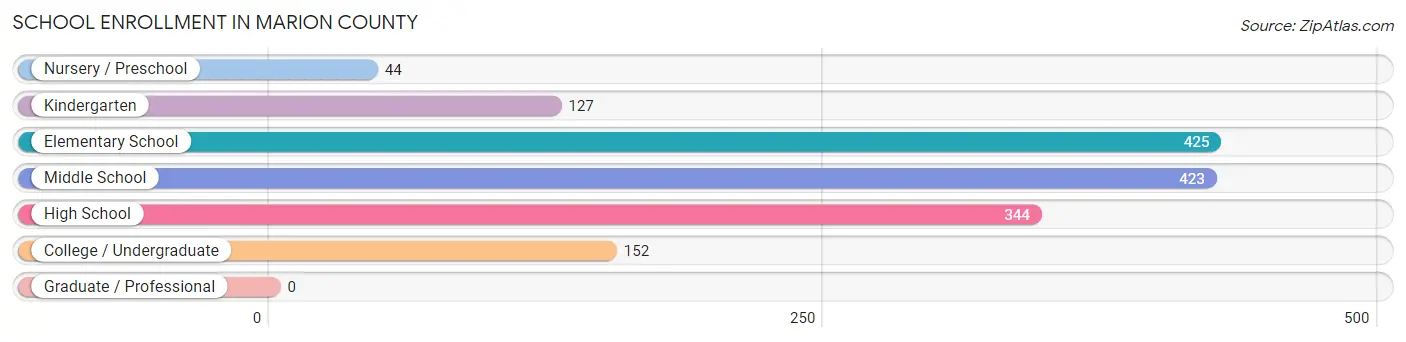
| School Level | # Students | % Students |
| Nursery / Preschool | 44 | 2.9% |
| Kindergarten | 127 | 8.4% |
| Elementary School | 425 | 28.1% |
| Middle School | 423 | 27.9% |
| High School | 344 | 22.7% |
| College / Undergraduate | 152 | 10.0% |
| Graduate / Professional | 0 | 0.0% |
| Total | 1,515 | 100.0% |
School Enrollment by Age by Funding Source in Marion County
Out of a total of 1,515 students who are enrolled in schools in Marion County, 161 (10.6%) attend a private institution, while the remaining 1,354 (89.4%) are enrolled in public schools. The age group of 35 years and over has the highest likelihood of being enrolled in private schools, with 53 (57.6% in the age bracket) enrolled. Conversely, the age group of 3 to 4 year olds has the lowest likelihood of being enrolled in a private school, with 26 (100.0% in the age bracket) attending a public institution.
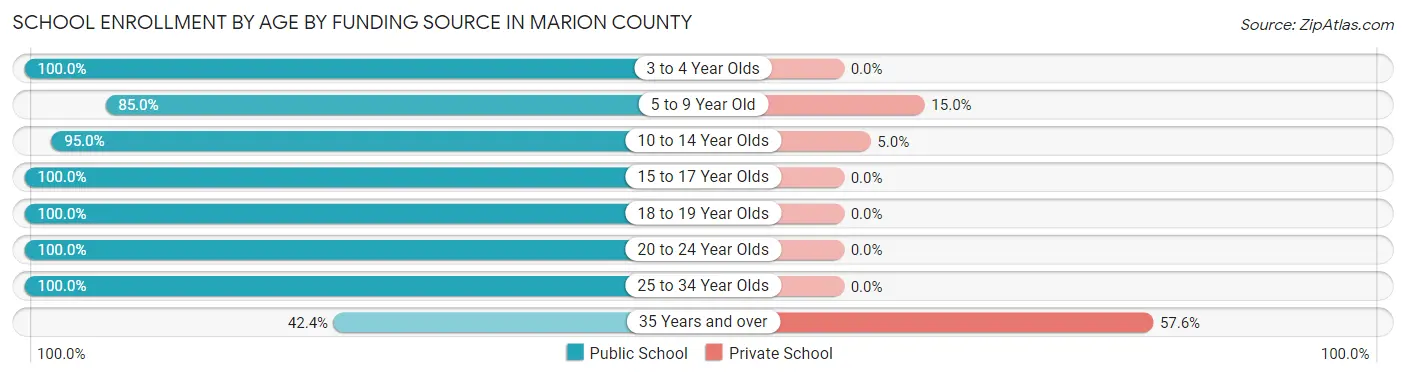
| Age Bracket | Public School | Private School |
| 3 to 4 Year Olds | 26 (100.0%) | 0 (0.0%) |
| 5 to 9 Year Old | 480 (85.0%) | 85 (15.0%) |
| 10 to 14 Year Olds | 439 (95.0%) | 23 (5.0%) |
| 15 to 17 Year Olds | 246 (100.0%) | 0 (0.0%) |
| 18 to 19 Year Olds | 81 (100.0%) | 0 (0.0%) |
| 20 to 24 Year Olds | 27 (100.0%) | 0 (0.0%) |
| 25 to 34 Year Olds | 16 (100.0%) | 0 (0.0%) |
| 35 Years and over | 39 (42.4%) | 53 (57.6%) |
| Total | 1,354 (89.4%) | 161 (10.6%) |
Educational Attainment by Field of Study in Marion County
Business (307 | 24.3%), education (251 | 19.9%), liberal arts & history (105 | 8.3%), computers & mathematics (99 | 7.8%), and bio, nature & agricultural (92 | 7.3%) are the most common fields of study among 1,264 individuals in Marion County who have obtained a bachelor's degree or higher.
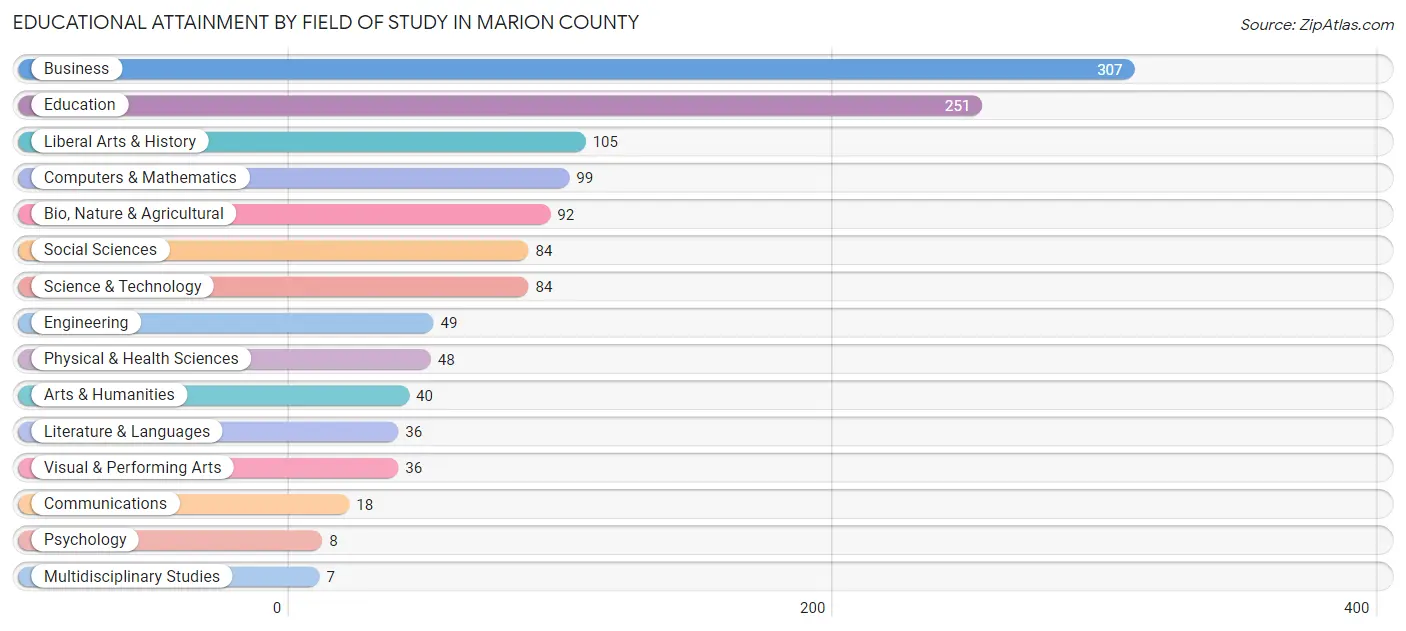
| Field of Study | # Graduates | % Graduates |
| Computers & Mathematics | 99 | 7.8% |
| Bio, Nature & Agricultural | 92 | 7.3% |
| Physical & Health Sciences | 48 | 3.8% |
| Psychology | 8 | 0.6% |
| Social Sciences | 84 | 6.7% |
| Engineering | 49 | 3.9% |
| Multidisciplinary Studies | 7 | 0.5% |
| Science & Technology | 84 | 6.7% |
| Business | 307 | 24.3% |
| Education | 251 | 19.9% |
| Literature & Languages | 36 | 2.9% |
| Liberal Arts & History | 105 | 8.3% |
| Visual & Performing Arts | 36 | 2.9% |
| Communications | 18 | 1.4% |
| Arts & Humanities | 40 | 3.2% |
| Total | 1,264 | 100.0% |
Transportation & Commute in Marion County
Vehicle Availability by Sex in Marion County
The most prevalent vehicle ownership categories in Marion County are males with 2 vehicles (632, accounting for 38.6%) and females with 2 vehicles (665, making up 36.6%).
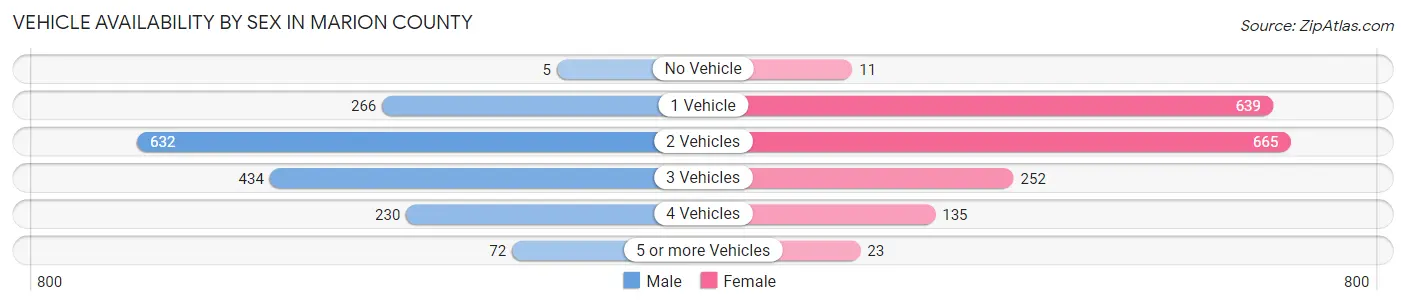
| Vehicles Available | Male | Female |
| No Vehicle | 5 (0.3%) | 11 (0.6%) |
| 1 Vehicle | 266 (16.2%) | 639 (37.0%) |
| 2 Vehicles | 632 (38.6%) | 665 (38.6%) |
| 3 Vehicles | 434 (26.5%) | 252 (14.6%) |
| 4 Vehicles | 230 (14.0%) | 135 (7.8%) |
| 5 or more Vehicles | 72 (4.4%) | 23 (1.3%) |
| Total | 1,639 (100.0%) | 1,725 (100.0%) |
Commute Time in Marion County
The most frequently occuring commute durations in Marion County are 30 to 34 minutes (593 commuters, 17.9%), 45 to 59 minutes (491 commuters, 14.8%), and 20 to 24 minutes (422 commuters, 12.7%).
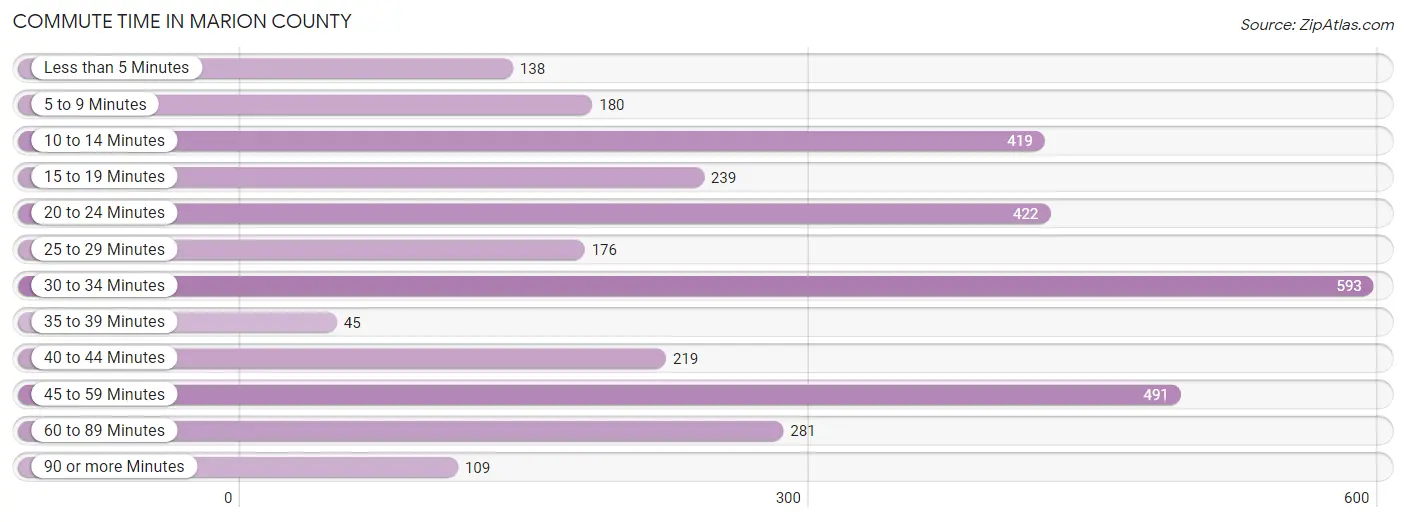
| Commute Time | # Commuters | % Commuters |
| Less than 5 Minutes | 138 | 4.2% |
| 5 to 9 Minutes | 180 | 5.4% |
| 10 to 14 Minutes | 419 | 12.7% |
| 15 to 19 Minutes | 239 | 7.2% |
| 20 to 24 Minutes | 422 | 12.7% |
| 25 to 29 Minutes | 176 | 5.3% |
| 30 to 34 Minutes | 593 | 17.9% |
| 35 to 39 Minutes | 45 | 1.4% |
| 40 to 44 Minutes | 219 | 6.6% |
| 45 to 59 Minutes | 491 | 14.8% |
| 60 to 89 Minutes | 281 | 8.5% |
| 90 or more Minutes | 109 | 3.3% |
Commute Time by Sex in Marion County
The most common commute times in Marion County are 45 to 59 minutes (284 commuters, 17.6%) for males and 30 to 34 minutes (402 commuters, 23.7%) for females.
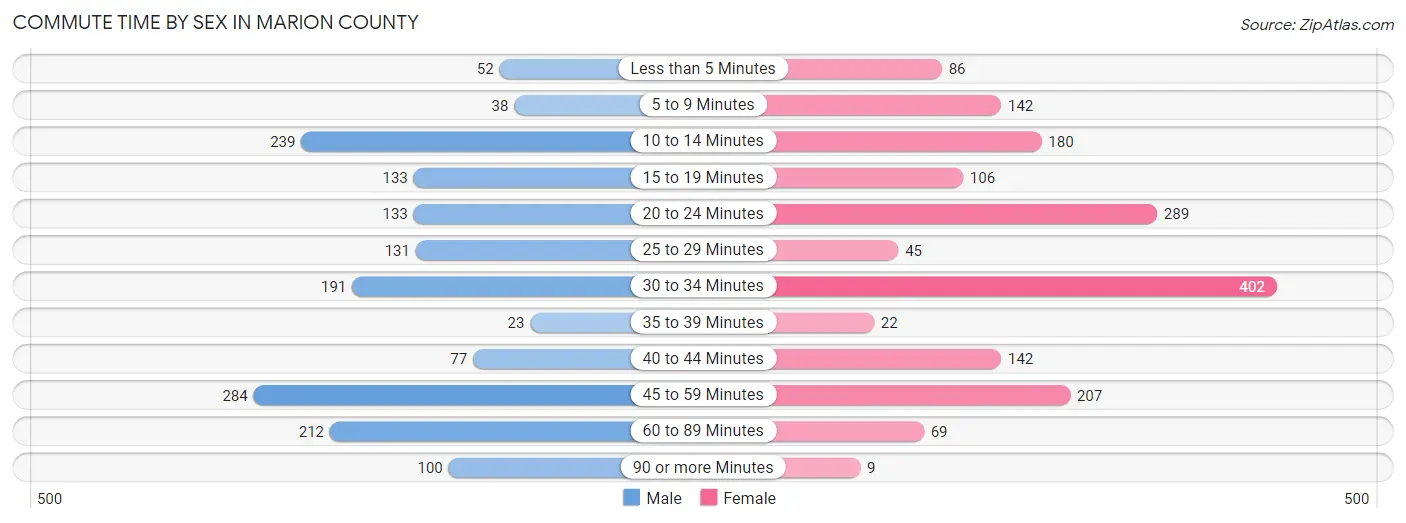
| Commute Time | Male | Female |
| Less than 5 Minutes | 52 (3.2%) | 86 (5.1%) |
| 5 to 9 Minutes | 38 (2.4%) | 142 (8.4%) |
| 10 to 14 Minutes | 239 (14.8%) | 180 (10.6%) |
| 15 to 19 Minutes | 133 (8.3%) | 106 (6.2%) |
| 20 to 24 Minutes | 133 (8.3%) | 289 (17.0%) |
| 25 to 29 Minutes | 131 (8.1%) | 45 (2.6%) |
| 30 to 34 Minutes | 191 (11.8%) | 402 (23.7%) |
| 35 to 39 Minutes | 23 (1.4%) | 22 (1.3%) |
| 40 to 44 Minutes | 77 (4.8%) | 142 (8.4%) |
| 45 to 59 Minutes | 284 (17.6%) | 207 (12.2%) |
| 60 to 89 Minutes | 212 (13.1%) | 69 (4.1%) |
| 90 or more Minutes | 100 (6.2%) | 9 (0.5%) |
Time of Departure to Work by Sex in Marion County
The most frequent times of departure to work in Marion County are 6:00 AM to 6:29 AM (286, 17.7%) for males and 7:00 AM to 7:29 AM (523, 30.8%) for females.
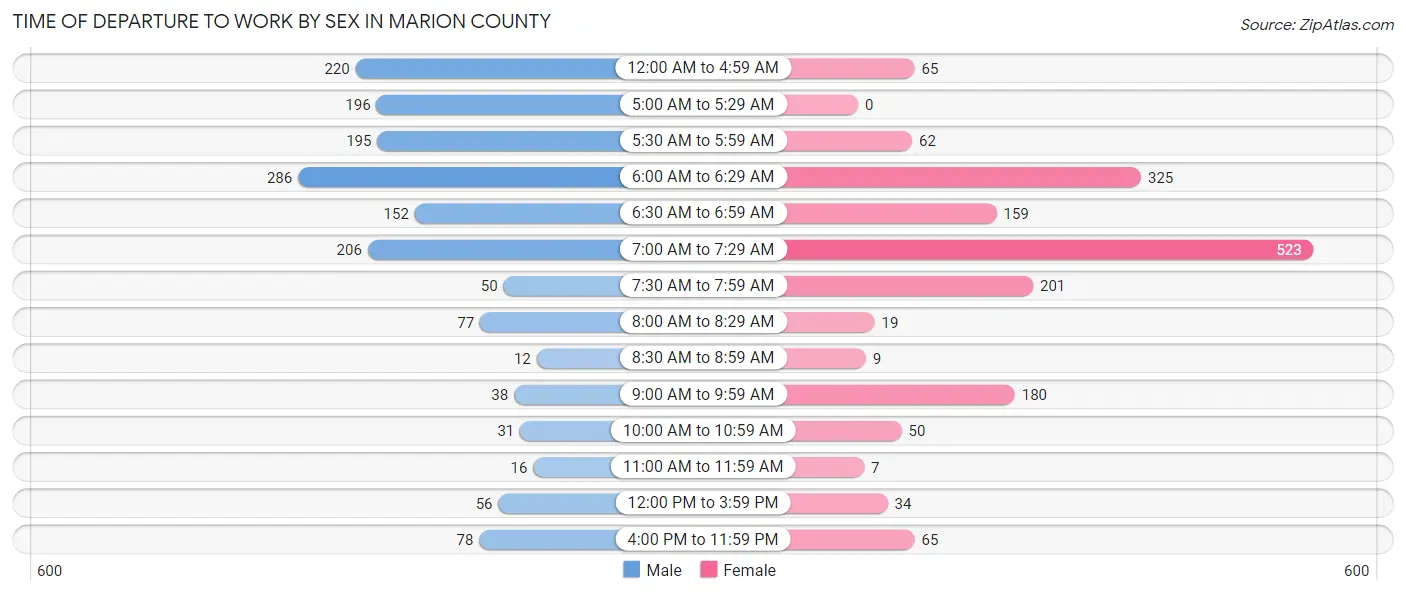
| Time of Departure | Male | Female |
| 12:00 AM to 4:59 AM | 220 (13.6%) | 65 (3.8%) |
| 5:00 AM to 5:29 AM | 196 (12.1%) | 0 (0.0%) |
| 5:30 AM to 5:59 AM | 195 (12.1%) | 62 (3.6%) |
| 6:00 AM to 6:29 AM | 286 (17.7%) | 325 (19.1%) |
| 6:30 AM to 6:59 AM | 152 (9.4%) | 159 (9.4%) |
| 7:00 AM to 7:29 AM | 206 (12.8%) | 523 (30.8%) |
| 7:30 AM to 7:59 AM | 50 (3.1%) | 201 (11.8%) |
| 8:00 AM to 8:29 AM | 77 (4.8%) | 19 (1.1%) |
| 8:30 AM to 8:59 AM | 12 (0.7%) | 9 (0.5%) |
| 9:00 AM to 9:59 AM | 38 (2.4%) | 180 (10.6%) |
| 10:00 AM to 10:59 AM | 31 (1.9%) | 50 (2.9%) |
| 11:00 AM to 11:59 AM | 16 (1.0%) | 7 (0.4%) |
| 12:00 PM to 3:59 PM | 56 (3.5%) | 34 (2.0%) |
| 4:00 PM to 11:59 PM | 78 (4.8%) | 65 (3.8%) |
| Total | 1,613 (100.0%) | 1,699 (100.0%) |
Housing Occupancy in Marion County
Occupancy by Ownership in Marion County
Of the total 4,014 dwellings in Marion County, owner-occupied units account for 3,115 (77.6%), while renter-occupied units make up 899 (22.4%).
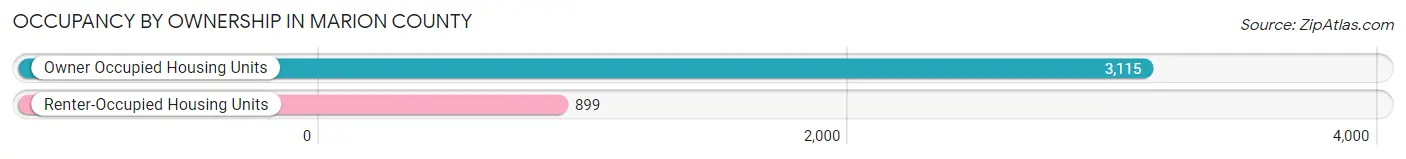
| Occupancy | # Housing Units | % Housing Units |
| Owner Occupied Housing Units | 3,115 | 77.6% |
| Renter-Occupied Housing Units | 899 | 22.4% |
| Total Occupied Housing Units | 4,014 | 100.0% |
Occupancy by Household Size in Marion County
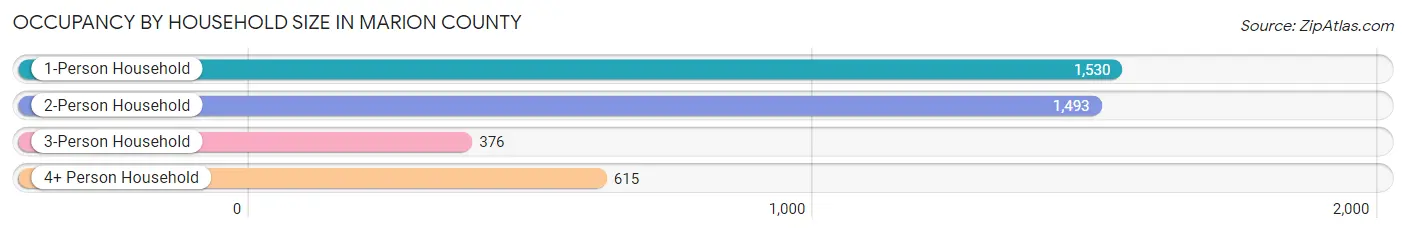
| Household Size | # Housing Units | % Housing Units |
| 1-Person Household | 1,530 | 38.1% |
| 2-Person Household | 1,493 | 37.2% |
| 3-Person Household | 376 | 9.4% |
| 4+ Person Household | 615 | 15.3% |
| Total Housing Units | 4,014 | 100.0% |
Occupancy by Ownership by Household Size in Marion County
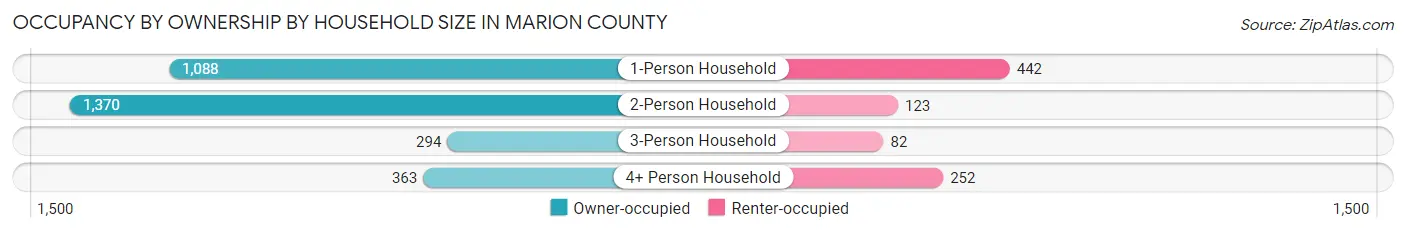
| Household Size | Owner-occupied | Renter-occupied |
| 1-Person Household | 1,088 (71.1%) | 442 (28.9%) |
| 2-Person Household | 1,370 (91.8%) | 123 (8.2%) |
| 3-Person Household | 294 (78.2%) | 82 (21.8%) |
| 4+ Person Household | 363 (59.0%) | 252 (41.0%) |
| Total Housing Units | 3,115 (77.6%) | 899 (22.4%) |
Occupancy by Educational Attainment in Marion County
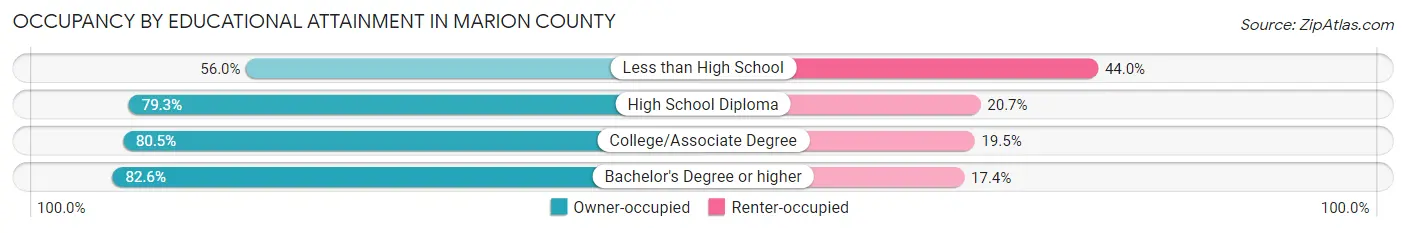
| Household Size | Owner-occupied | Renter-occupied |
| Less than High School | 260 (56.0%) | 204 (44.0%) |
| High School Diploma | 1,221 (79.3%) | 318 (20.7%) |
| College/Associate Degree | 1,037 (80.5%) | 251 (19.5%) |
| Bachelor's Degree or higher | 597 (82.6%) | 126 (17.4%) |
Occupancy by Age of Householder in Marion County
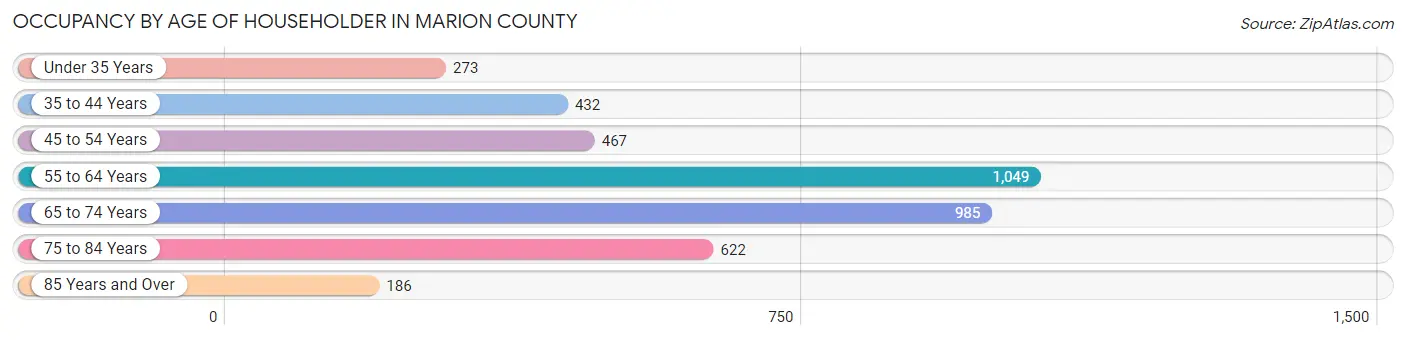
| Age Bracket | # Households | % Households |
| Under 35 Years | 273 | 6.8% |
| 35 to 44 Years | 432 | 10.8% |
| 45 to 54 Years | 467 | 11.6% |
| 55 to 64 Years | 1,049 | 26.1% |
| 65 to 74 Years | 985 | 24.5% |
| 75 to 84 Years | 622 | 15.5% |
| 85 Years and Over | 186 | 4.6% |
| Total | 4,014 | 100.0% |
Housing Finances in Marion County
Median Income by Occupancy in Marion County
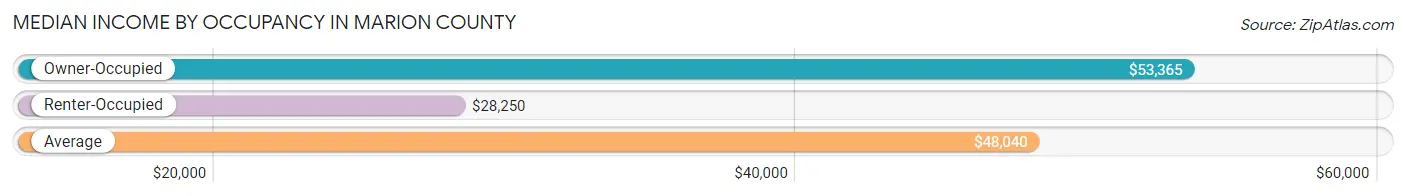
| Occupancy Type | # Households | Median Income |
| Owner-Occupied | 3,115 (77.6%) | $53,365 |
| Renter-Occupied | 899 (22.4%) | $28,250 |
| Average | 4,014 (100.0%) | $48,040 |
Occupancy by Householder Income Bracket in Marion County
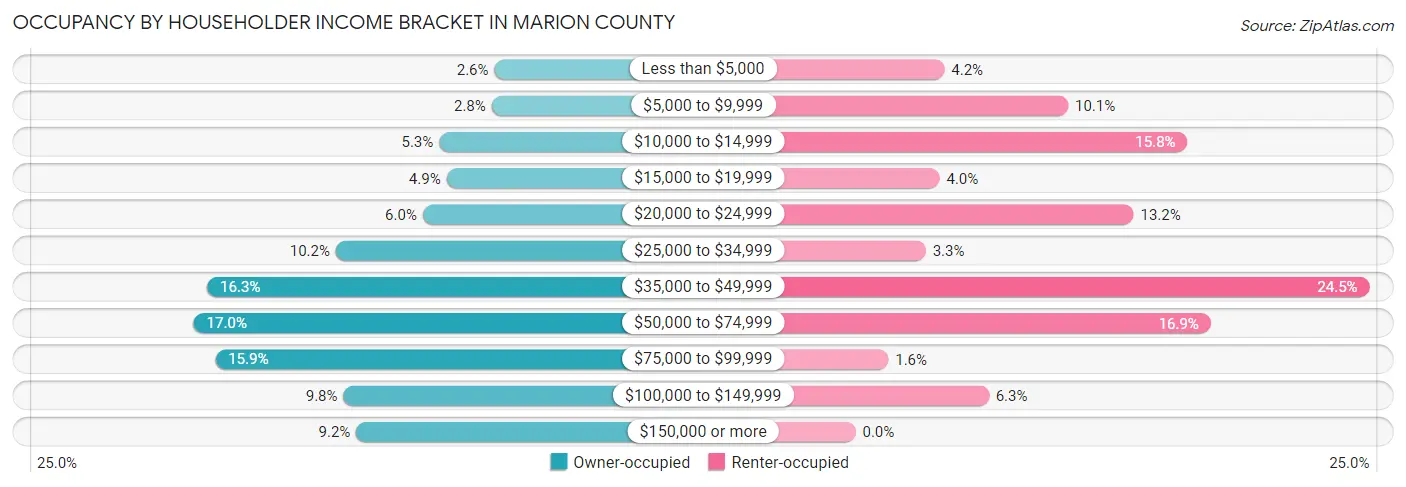
| Income Bracket | Owner-occupied | Renter-occupied |
| Less than $5,000 | 82 (2.6%) | 38 (4.2%) |
| $5,000 to $9,999 | 86 (2.8%) | 91 (10.1%) |
| $10,000 to $14,999 | 164 (5.3%) | 142 (15.8%) |
| $15,000 to $19,999 | 153 (4.9%) | 36 (4.0%) |
| $20,000 to $24,999 | 188 (6.0%) | 119 (13.2%) |
| $25,000 to $34,999 | 317 (10.2%) | 30 (3.3%) |
| $35,000 to $49,999 | 508 (16.3%) | 220 (24.5%) |
| $50,000 to $74,999 | 528 (17.0%) | 152 (16.9%) |
| $75,000 to $99,999 | 496 (15.9%) | 14 (1.6%) |
| $100,000 to $149,999 | 306 (9.8%) | 57 (6.3%) |
| $150,000 or more | 287 (9.2%) | 0 (0.0%) |
| Total | 3,115 (100.0%) | 899 (100.0%) |
Monthly Housing Cost Tiers in Marion County
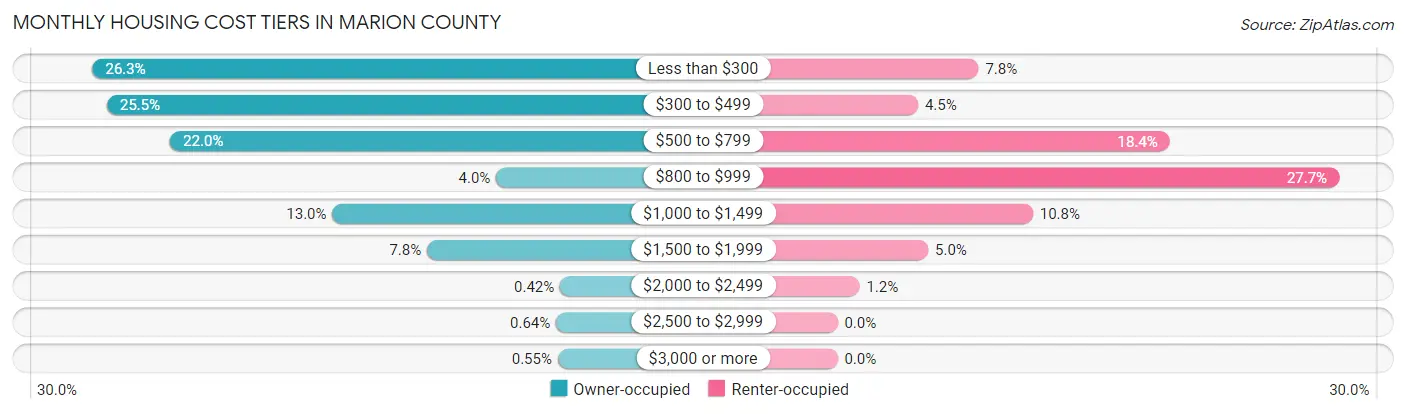
| Monthly Cost | Owner-occupied | Renter-occupied |
| Less than $300 | 818 (26.3%) | 70 (7.8%) |
| $300 to $499 | 793 (25.5%) | 40 (4.4%) |
| $500 to $799 | 684 (22.0%) | 165 (18.3%) |
| $800 to $999 | 123 (4.0%) | 249 (27.7%) |
| $1,000 to $1,499 | 405 (13.0%) | 97 (10.8%) |
| $1,500 to $1,999 | 242 (7.8%) | 45 (5.0%) |
| $2,000 to $2,499 | 13 (0.4%) | 11 (1.2%) |
| $2,500 to $2,999 | 20 (0.6%) | 0 (0.0%) |
| $3,000 or more | 17 (0.5%) | 0 (0.0%) |
| Total | 3,115 (100.0%) | 899 (100.0%) |
Physical Housing Characteristics in Marion County
Housing Structures in Marion County
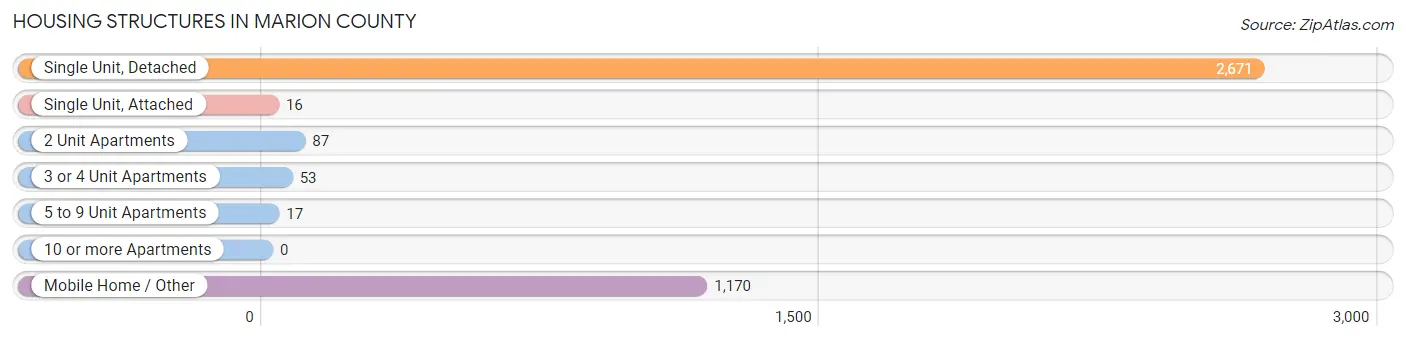
| Structure Type | # Housing Units | % Housing Units |
| Single Unit, Detached | 2,671 | 66.5% |
| Single Unit, Attached | 16 | 0.4% |
| 2 Unit Apartments | 87 | 2.2% |
| 3 or 4 Unit Apartments | 53 | 1.3% |
| 5 to 9 Unit Apartments | 17 | 0.4% |
| 10 or more Apartments | 0 | 0.0% |
| Mobile Home / Other | 1,170 | 29.1% |
| Total | 4,014 | 100.0% |
Housing Structures by Occupancy in Marion County
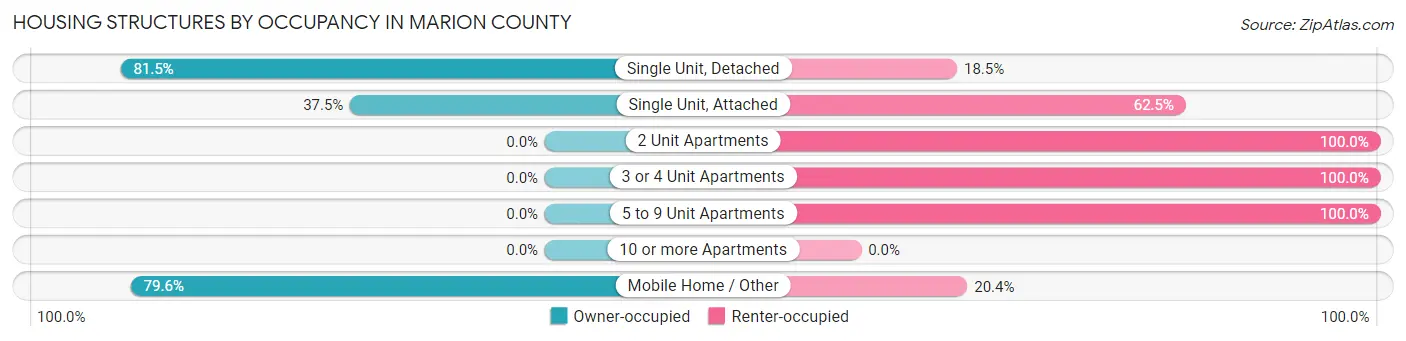
| Structure Type | Owner-occupied | Renter-occupied |
| Single Unit, Detached | 2,178 (81.5%) | 493 (18.5%) |
| Single Unit, Attached | 6 (37.5%) | 10 (62.5%) |
| 2 Unit Apartments | 0 (0.0%) | 87 (100.0%) |
| 3 or 4 Unit Apartments | 0 (0.0%) | 53 (100.0%) |
| 5 to 9 Unit Apartments | 0 (0.0%) | 17 (100.0%) |
| 10 or more Apartments | 0 (0.0%) | 0 (0.0%) |
| Mobile Home / Other | 931 (79.6%) | 239 (20.4%) |
| Total | 3,115 (77.6%) | 899 (22.4%) |
Housing Structures by Number of Rooms in Marion County
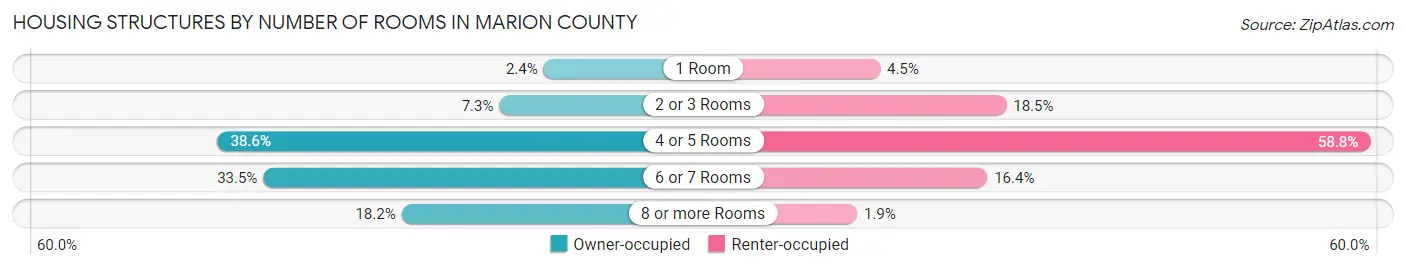
| Number of Rooms | Owner-occupied | Renter-occupied |
| 1 Room | 75 (2.4%) | 40 (4.4%) |
| 2 or 3 Rooms | 228 (7.3%) | 166 (18.5%) |
| 4 or 5 Rooms | 1,202 (38.6%) | 529 (58.8%) |
| 6 or 7 Rooms | 1,044 (33.5%) | 147 (16.4%) |
| 8 or more Rooms | 566 (18.2%) | 17 (1.9%) |
| Total | 3,115 (100.0%) | 899 (100.0%) |
Housing Structure by Heating Type in Marion County
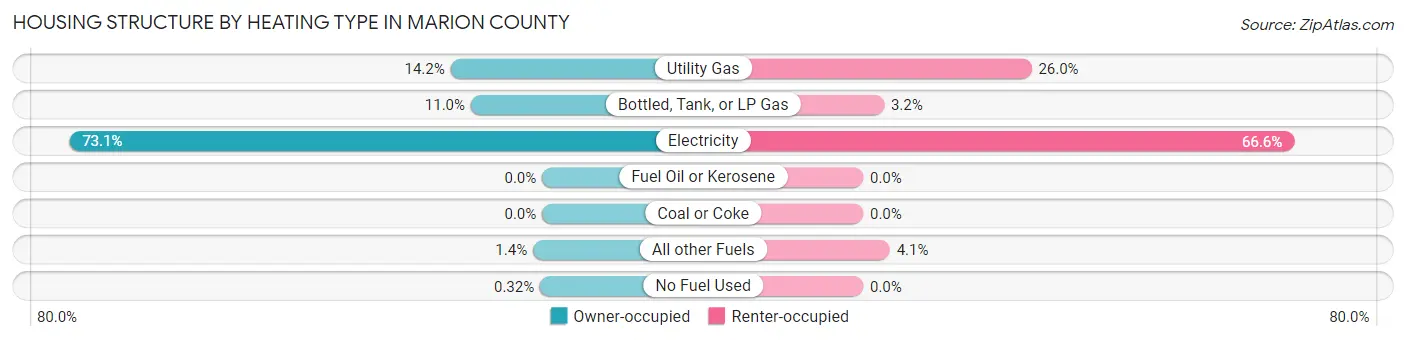
| Heating Type | Owner-occupied | Renter-occupied |
| Utility Gas | 441 (14.2%) | 234 (26.0%) |
| Bottled, Tank, or LP Gas | 343 (11.0%) | 29 (3.2%) |
| Electricity | 2,277 (73.1%) | 599 (66.6%) |
| Fuel Oil or Kerosene | 0 (0.0%) | 0 (0.0%) |
| Coal or Coke | 0 (0.0%) | 0 (0.0%) |
| All other Fuels | 44 (1.4%) | 37 (4.1%) |
| No Fuel Used | 10 (0.3%) | 0 (0.0%) |
| Total | 3,115 (100.0%) | 899 (100.0%) |
Household Vehicle Usage in Marion County
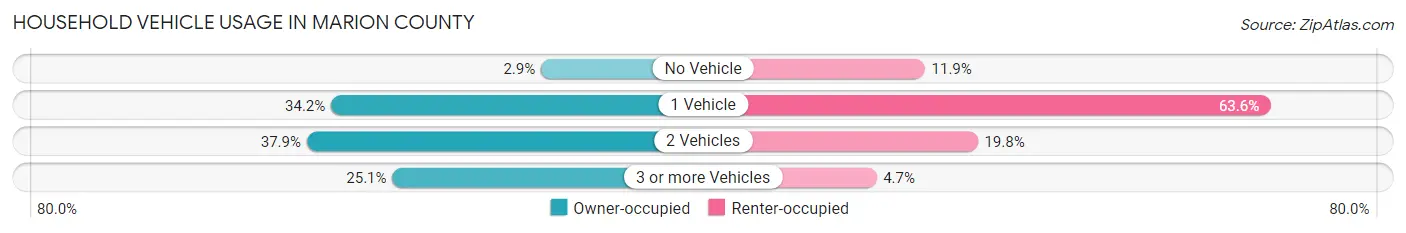
| Vehicles per Household | Owner-occupied | Renter-occupied |
| No Vehicle | 89 (2.9%) | 107 (11.9%) |
| 1 Vehicle | 1,066 (34.2%) | 572 (63.6%) |
| 2 Vehicles | 1,179 (37.9%) | 178 (19.8%) |
| 3 or more Vehicles | 781 (25.1%) | 42 (4.7%) |
| Total | 3,115 (100.0%) | 899 (100.0%) |
Real Estate & Mortgages in Marion County
Real Estate and Mortgage Overview in Marion County
| Characteristic | Without Mortgage | With Mortgage |
| Housing Units | 2,332 | 783 |
| Median Property Value | $89,800 | $138,100 |
| Median Household Income | $48,107 | $208 |
| Monthly Housing Costs | $395 | $13 |
| Real Estate Taxes | $642 | $0 |
Property Value by Mortgage Status in Marion County
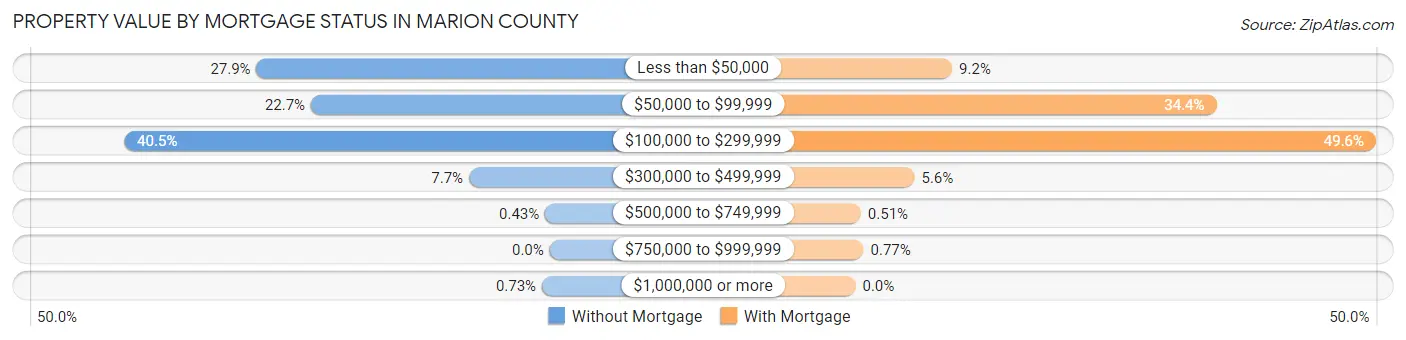
| Property Value | Without Mortgage | With Mortgage |
| Less than $50,000 | 651 (27.9%) | 72 (9.2%) |
| $50,000 to $99,999 | 530 (22.7%) | 269 (34.4%) |
| $100,000 to $299,999 | 945 (40.5%) | 388 (49.5%) |
| $300,000 to $499,999 | 179 (7.7%) | 44 (5.6%) |
| $500,000 to $749,999 | 10 (0.4%) | 4 (0.5%) |
| $750,000 to $999,999 | 0 (0.0%) | 6 (0.8%) |
| $1,000,000 or more | 17 (0.7%) | 0 (0.0%) |
| Total | 2,332 (100.0%) | 783 (100.0%) |
Household Income by Mortgage Status in Marion County
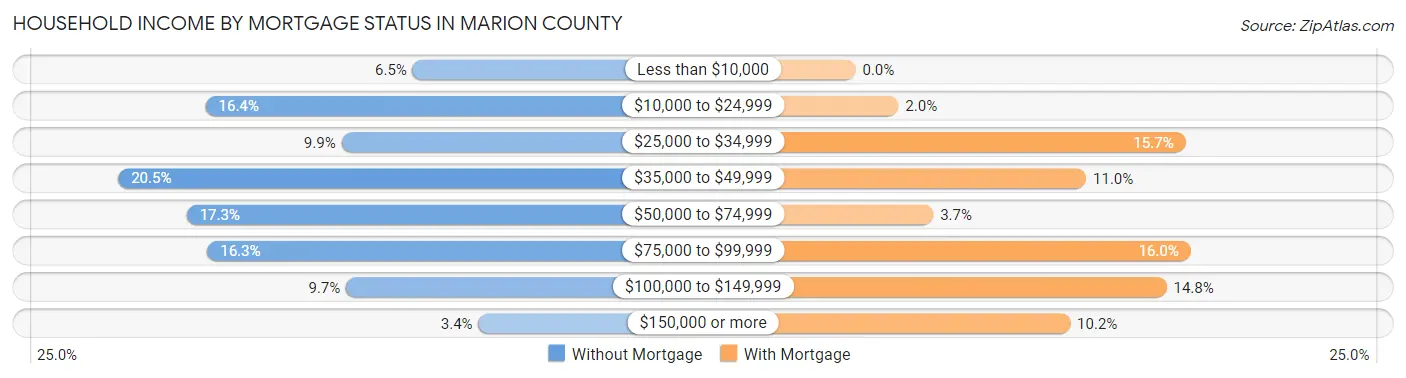
| Household Income | Without Mortgage | With Mortgage |
| Less than $10,000 | 152 (6.5%) | 0 (0.0%) |
| $10,000 to $24,999 | 382 (16.4%) | 16 (2.0%) |
| $25,000 to $34,999 | 231 (9.9%) | 123 (15.7%) |
| $35,000 to $49,999 | 479 (20.5%) | 86 (11.0%) |
| $50,000 to $74,999 | 403 (17.3%) | 29 (3.7%) |
| $75,000 to $99,999 | 380 (16.3%) | 125 (16.0%) |
| $100,000 to $149,999 | 226 (9.7%) | 116 (14.8%) |
| $150,000 or more | 79 (3.4%) | 80 (10.2%) |
| Total | 2,332 (100.0%) | 783 (100.0%) |
Property Value to Household Income Ratio in Marion County
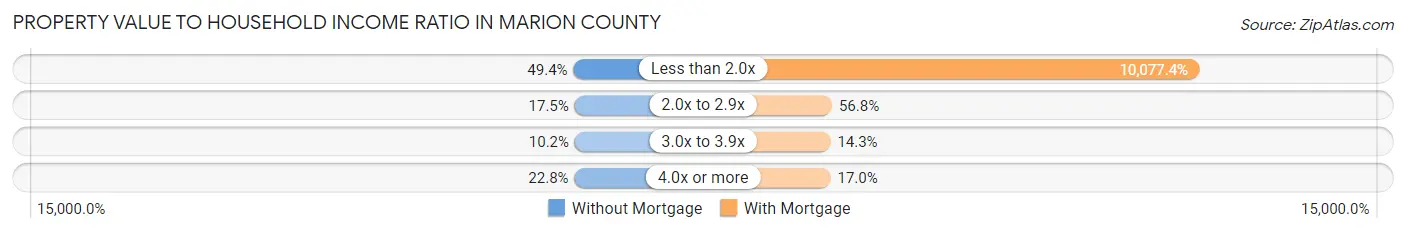
| Value-to-Income Ratio | Without Mortgage | With Mortgage |
| Less than 2.0x | 1,151 (49.4%) | 78,906 (10,077.4%) |
| 2.0x to 2.9x | 407 (17.4%) | 445 (56.8%) |
| 3.0x to 3.9x | 238 (10.2%) | 112 (14.3%) |
| 4.0x or more | 531 (22.8%) | 133 (17.0%) |
| Total | 2,332 (100.0%) | 783 (100.0%) |
Real Estate Taxes by Mortgage Status in Marion County
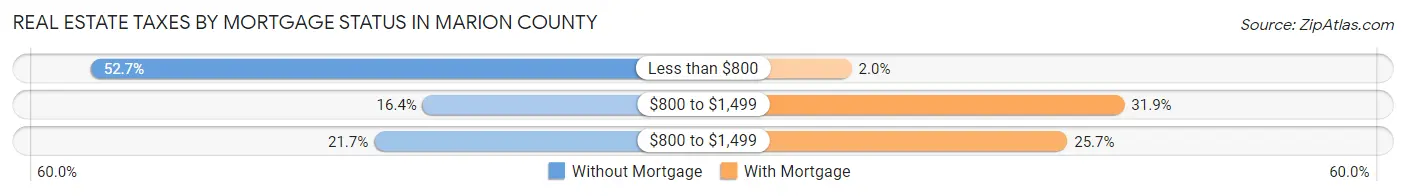
| Property Taxes | Without Mortgage | With Mortgage |
| Less than $800 | 1,230 (52.7%) | 16 (2.0%) |
| $800 to $1,499 | 382 (16.4%) | 250 (31.9%) |
| $800 to $1,499 | 506 (21.7%) | 201 (25.7%) |
| Total | 2,332 (100.0%) | 783 (100.0%) |
Health & Disability in Marion County
Health Insurance Coverage by Age in Marion County
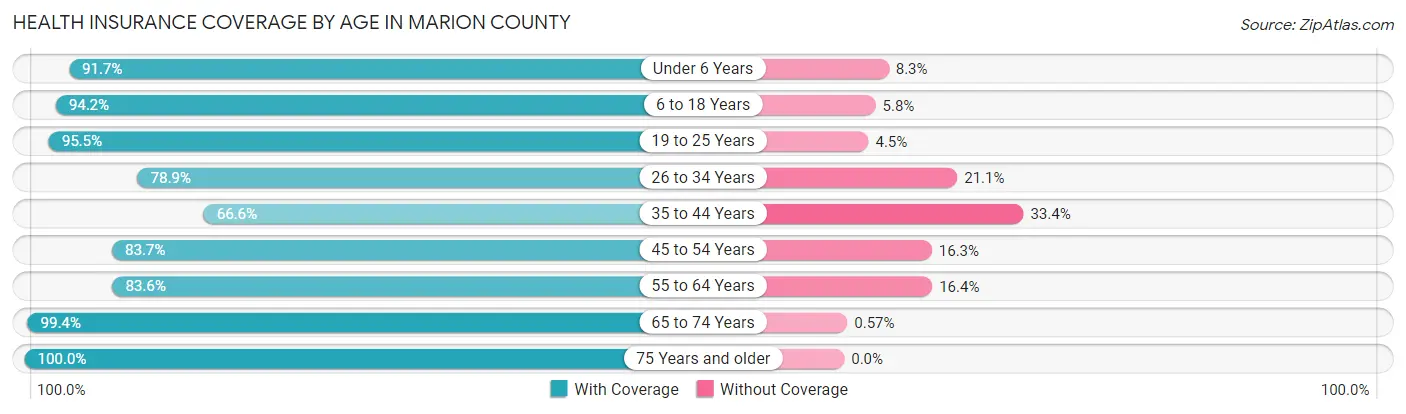
| Age Bracket | With Coverage | Without Coverage |
| Under 6 Years | 420 (91.7%) | 38 (8.3%) |
| 6 to 18 Years | 1,193 (94.2%) | 74 (5.8%) |
| 19 to 25 Years | 719 (95.5%) | 34 (4.5%) |
| 26 to 34 Years | 513 (78.9%) | 137 (21.1%) |
| 35 to 44 Years | 731 (66.6%) | 367 (33.4%) |
| 45 to 54 Years | 820 (83.7%) | 160 (16.3%) |
| 55 to 64 Years | 1,483 (83.6%) | 291 (16.4%) |
| 65 to 74 Years | 1,576 (99.4%) | 9 (0.6%) |
| 75 Years and older | 1,000 (100.0%) | 0 (0.0%) |
| Total | 8,455 (88.4%) | 1,110 (11.6%) |
Health Insurance Coverage by Citizenship Status in Marion County
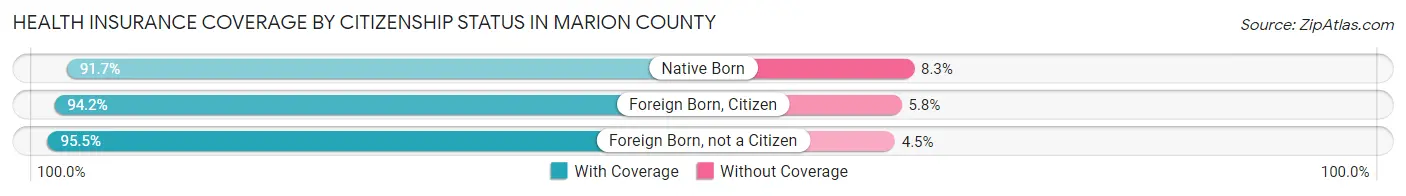
| Citizenship Status | With Coverage | Without Coverage |
| Native Born | 420 (91.7%) | 38 (8.3%) |
| Foreign Born, Citizen | 1,193 (94.2%) | 74 (5.8%) |
| Foreign Born, not a Citizen | 719 (95.5%) | 34 (4.5%) |
Health Insurance Coverage by Household Income in Marion County
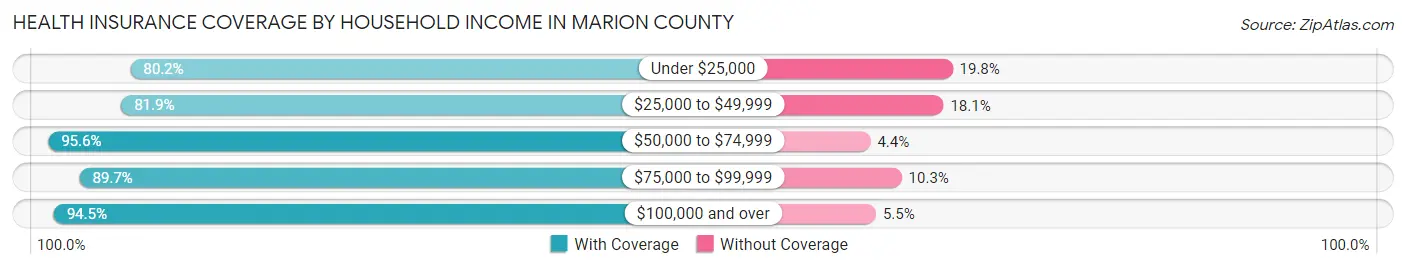
| Household Income | With Coverage | Without Coverage |
| Under $25,000 | 1,396 (80.2%) | 345 (19.8%) |
| $25,000 to $49,999 | 1,904 (81.9%) | 421 (18.1%) |
| $50,000 to $74,999 | 1,941 (95.6%) | 90 (4.4%) |
| $75,000 to $99,999 | 1,204 (89.7%) | 138 (10.3%) |
| $100,000 and over | 2,010 (94.5%) | 116 (5.5%) |
Public vs Private Health Insurance Coverage by Age in Marion County
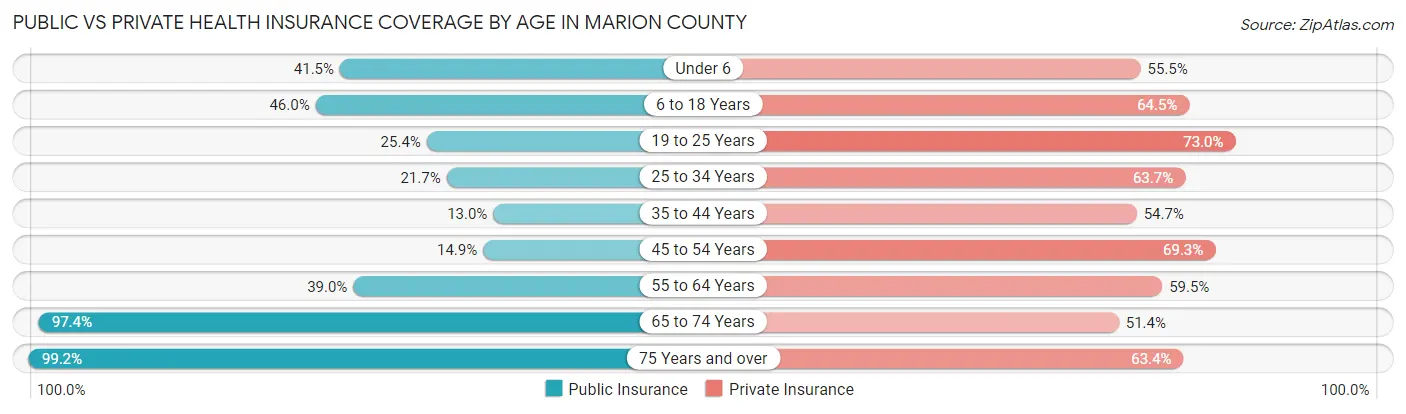
| Age Bracket | Public Insurance | Private Insurance |
| Under 6 | 190 (41.5%) | 254 (55.5%) |
| 6 to 18 Years | 583 (46.0%) | 817 (64.5%) |
| 19 to 25 Years | 191 (25.4%) | 550 (73.0%) |
| 25 to 34 Years | 141 (21.7%) | 414 (63.7%) |
| 35 to 44 Years | 143 (13.0%) | 601 (54.7%) |
| 45 to 54 Years | 146 (14.9%) | 679 (69.3%) |
| 55 to 64 Years | 692 (39.0%) | 1,055 (59.5%) |
| 65 to 74 Years | 1,543 (97.4%) | 815 (51.4%) |
| 75 Years and over | 992 (99.2%) | 634 (63.4%) |
| Total | 4,621 (48.3%) | 5,819 (60.8%) |
Disability Status by Sex by Age in Marion County
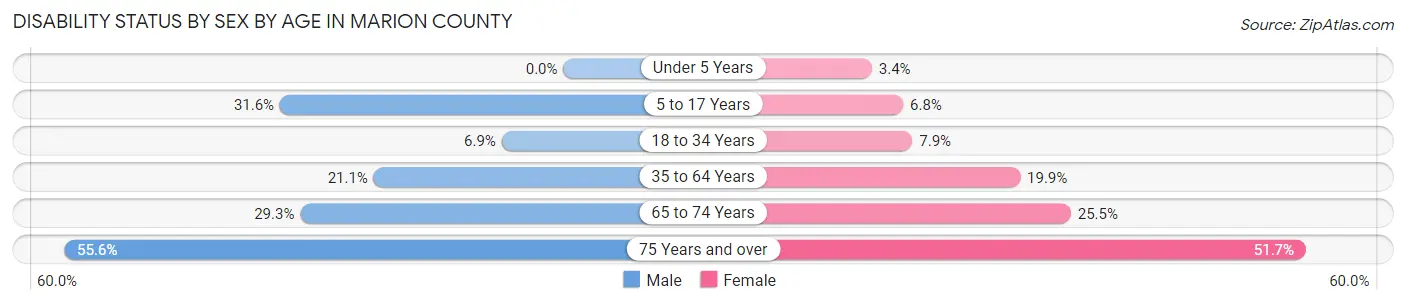
| Age Bracket | Male | Female |
| Under 5 Years | 0 (0.0%) | 8 (3.4%) |
| 5 to 17 Years | 213 (31.6%) | 44 (6.8%) |
| 18 to 34 Years | 51 (6.9%) | 57 (7.9%) |
| 35 to 64 Years | 403 (21.1%) | 386 (19.9%) |
| 65 to 74 Years | 230 (29.3%) | 204 (25.5%) |
| 75 Years and over | 258 (55.6%) | 277 (51.7%) |
Disability Class by Sex by Age in Marion County
Disability Class: Hearing Difficulty
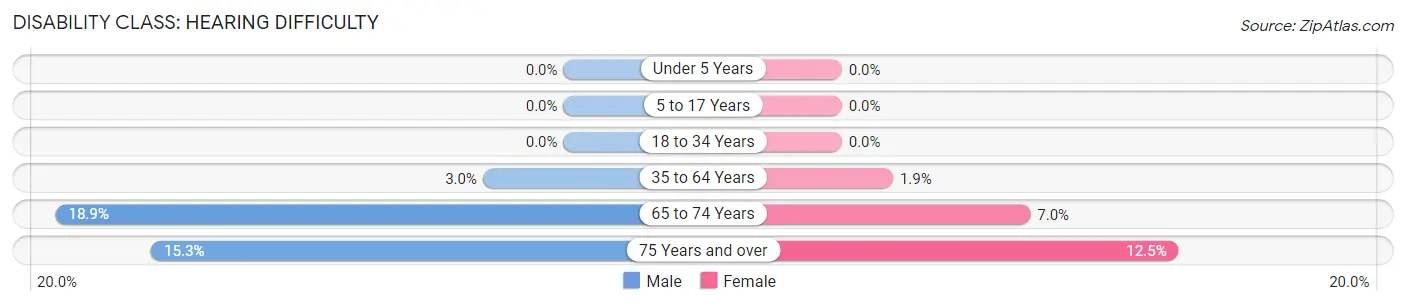
| Age Bracket | Male | Female |
| Under 5 Years | 0 (0.0%) | 0 (0.0%) |
| 5 to 17 Years | 0 (0.0%) | 0 (0.0%) |
| 18 to 34 Years | 0 (0.0%) | 0 (0.0%) |
| 35 to 64 Years | 57 (3.0%) | 37 (1.9%) |
| 65 to 74 Years | 148 (18.9%) | 56 (7.0%) |
| 75 Years and over | 71 (15.3%) | 67 (12.5%) |
Disability Class: Vision Difficulty
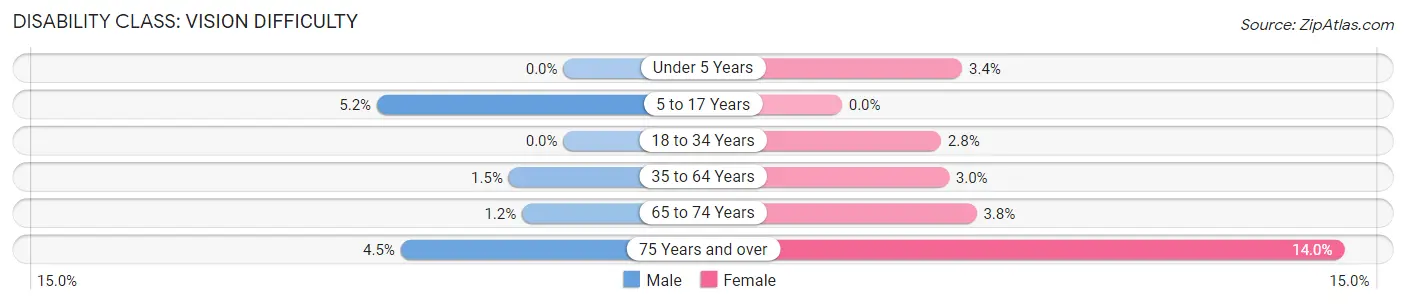
| Age Bracket | Male | Female |
| Under 5 Years | 0 (0.0%) | 8 (3.4%) |
| 5 to 17 Years | 35 (5.2%) | 0 (0.0%) |
| 18 to 34 Years | 0 (0.0%) | 20 (2.8%) |
| 35 to 64 Years | 29 (1.5%) | 58 (3.0%) |
| 65 to 74 Years | 9 (1.1%) | 30 (3.7%) |
| 75 Years and over | 21 (4.5%) | 75 (14.0%) |
Disability Class: Cognitive Difficulty
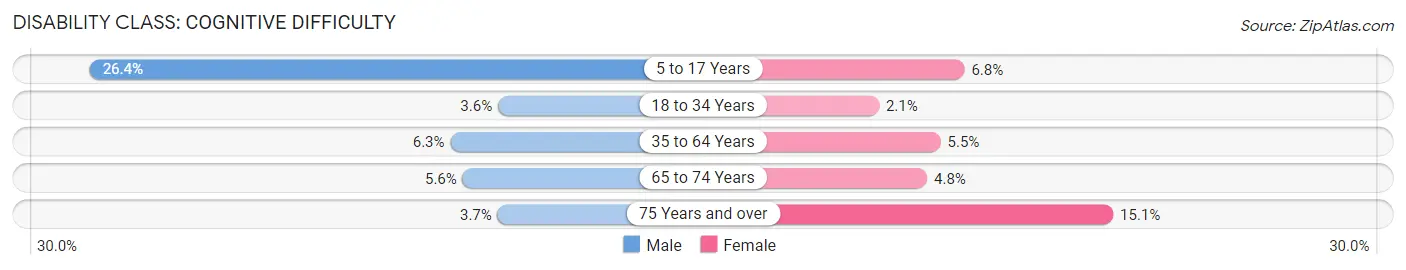
| Age Bracket | Male | Female |
| 5 to 17 Years | 178 (26.4%) | 44 (6.8%) |
| 18 to 34 Years | 27 (3.6%) | 15 (2.1%) |
| 35 to 64 Years | 120 (6.3%) | 107 (5.5%) |
| 65 to 74 Years | 44 (5.6%) | 38 (4.8%) |
| 75 Years and over | 17 (3.7%) | 81 (15.1%) |
Disability Class: Ambulatory Difficulty
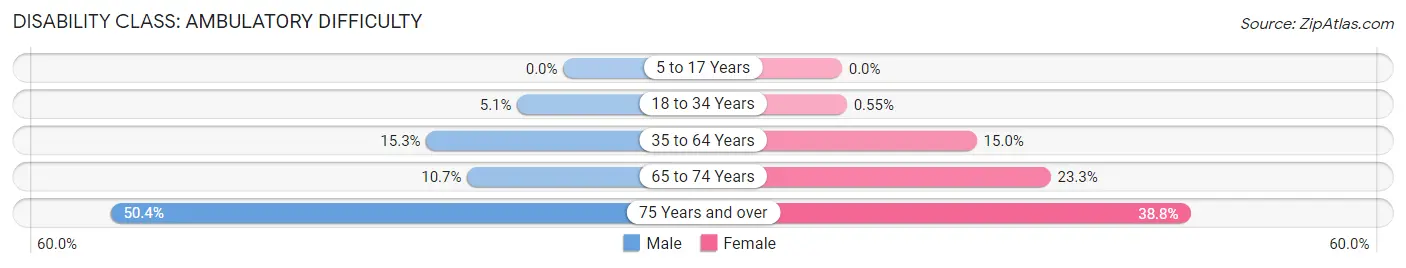
| Age Bracket | Male | Female |
| 5 to 17 Years | 0 (0.0%) | 0 (0.0%) |
| 18 to 34 Years | 38 (5.1%) | 4 (0.5%) |
| 35 to 64 Years | 291 (15.2%) | 292 (15.0%) |
| 65 to 74 Years | 84 (10.7%) | 186 (23.3%) |
| 75 Years and over | 234 (50.4%) | 208 (38.8%) |
Disability Class: Self-Care Difficulty
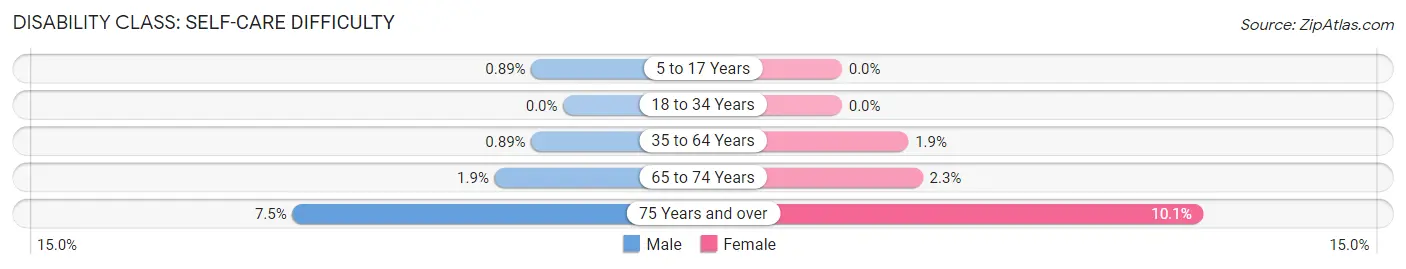
| Age Bracket | Male | Female |
| 5 to 17 Years | 6 (0.9%) | 0 (0.0%) |
| 18 to 34 Years | 0 (0.0%) | 0 (0.0%) |
| 35 to 64 Years | 17 (0.9%) | 36 (1.8%) |
| 65 to 74 Years | 15 (1.9%) | 18 (2.2%) |
| 75 Years and over | 35 (7.5%) | 54 (10.1%) |
Technology Access in Marion County
Computing Device Access in Marion County
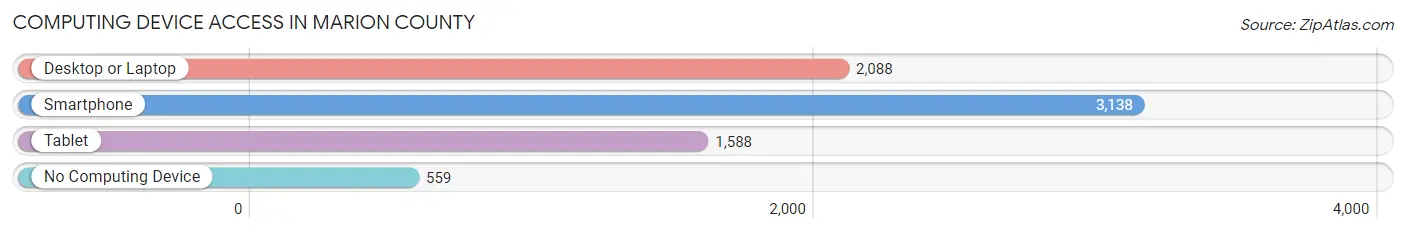
| Device Type | # Households | % Households |
| Desktop or Laptop | 2,088 | 52.0% |
| Smartphone | 3,138 | 78.2% |
| Tablet | 1,588 | 39.6% |
| No Computing Device | 559 | 13.9% |
| Total | 4,014 | 100.0% |
Internet Access in Marion County
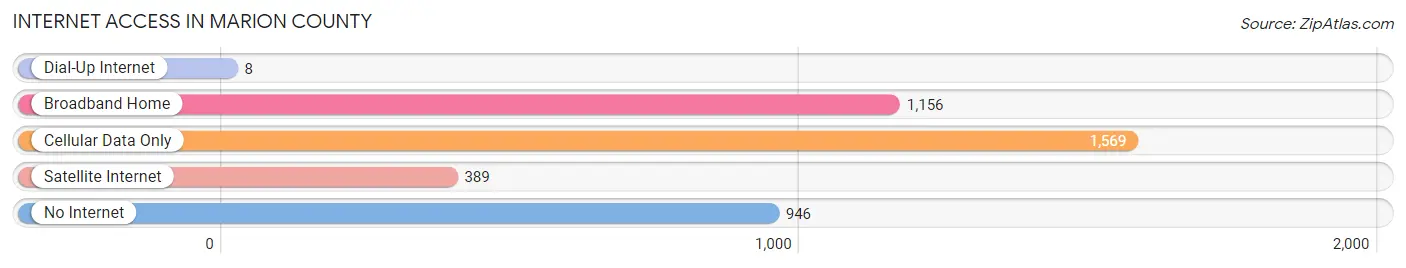
| Internet Type | # Households | % Households |
| Dial-Up Internet | 8 | 0.2% |
| Broadband Home | 1,156 | 28.8% |
| Cellular Data Only | 1,569 | 39.1% |
| Satellite Internet | 389 | 9.7% |
| No Internet | 946 | 23.6% |
| Total | 4,014 | 100.0% |
Marion County Summary
Marion County, Texas is located in the northeastern part of the state, and is bordered by Cass County to the north, Harrison County to the east, Upshur County to the south, and Morris County to the west. The county seat is Jefferson, and the county was named for Francis Marion, a Revolutionary War hero. The county has a total area of 590 square miles, and a population of 10,814 as of the 2010 census.
Geography
Marion County is located in the Piney Woods region of East Texas, and is mostly covered in forests of pine and hardwood trees. The county is drained by the Big Cypress Bayou, which flows through the county from north to south. The terrain is mostly flat, with some rolling hills in the northern part of the county. The highest point in the county is located in the northwest corner, at an elevation of 545 feet.
The climate of Marion County is humid subtropical, with hot summers and mild winters. The average annual temperature is 68 degrees Fahrenheit, and the average annual precipitation is 44 inches.
Economy
The economy of Marion County is largely based on agriculture and timber production. The county is home to several large timber companies, and the timber industry is the largest employer in the county. Other major industries include oil and gas production, manufacturing, and tourism.
The county is home to several large employers, including the Jefferson Regional Medical Center, the Jefferson Independent School District, and the Marion County Sheriff's Office. The county also has a large number of small businesses, including restaurants, retail stores, and service providers.
Demographics
As of the 2010 census, the population of Marion County was 10,814, with a population density of 18.4 people per square mile. The racial makeup of the county was 79.3% White, 16.2% African American, 0.5% Native American, 0.3% Asian, 0.1% Pacific Islander, 2.2% from other races, and 1.5% from two or more races. Hispanic or Latino of any race were 4.7% of the population.
The median income for a household in the county was $35,945, and the median income for a family was $41,945. The per capita income for the county was $17,845. About 17.2% of the population was below the poverty line.
Education
Marion County is served by the Jefferson Independent School District, which consists of five elementary schools, two middle schools, and one high school. The county is also home to several private schools, including the Jefferson Christian Academy and the Jefferson Preparatory Academy.
The county is home to two higher education institutions, the University of Texas at Tyler-Marion County Campus and the East Texas Baptist University-Marion County Campus. Both campuses offer a variety of degree programs, including business, education, and nursing.
Conclusion
Marion County, Texas is a rural county located in the northeastern part of the state. The county is mostly covered in forests of pine and hardwood trees, and is drained by the Big Cypress Bayou. The economy of the county is largely based on agriculture and timber production, and the county is home to several large employers. The population of the county is 10,814, and the median income for a household is $35,945. The county is served by the Jefferson Independent School District, and is home to two higher education institutions.
Common Questions
What is Per Capita Income in Marion County?
Per Capita income in Marion County is $27,263.
What is the Median Family Income in Marion County?
Median Family Income in Marion County is $61,726.
What is the Median Household income in Marion County?
Median Household Income in Marion County is $48,040.
What is Income or Wage Gap in Marion County?
Income or Wage Gap in Marion County is 20.8%.
Women in Marion County earn 79.2 cents for every dollar earned by a man.
What is Family Income Deficit in Marion County?
Family Income Deficit in Marion County is $13,811.
Families that are below poverty line in Marion County earn $13,811 less on average than the poverty threshold level.
What is Inequality or Gini Index in Marion County?
Inequality or Gini Index in Marion County is 0.45.
What is the Total Population of Marion County?
Total Population of Marion County is 9,668.
What is the Total Male Population of Marion County?
Total Male Population of Marion County is 4,724.
What is the Total Female Population of Marion County?
Total Female Population of Marion County is 4,944.
What is the Ratio of Males per 100 Females in Marion County?
There are 95.55 Males per 100 Females in Marion County.
What is the Ratio of Females per 100 Males in Marion County?
There are 104.66 Females per 100 Males in Marion County.
What is the Median Population Age in Marion County?
Median Population Age in Marion County is 52.1 Years.
What is the Average Family Size in Marion County
Average Family Size in Marion County is 3.2 People.
What is the Average Household Size in Marion County
Average Household Size in Marion County is 2.4 People.
How Large is the Labor Force in Marion County?
There are 3,864 People in the Labor Forcein in Marion County.
What is the Percentage of People in the Labor Force in Marion County?
47.3% of People are in the Labor Force in Marion County.
What is the Unemployment Rate in Marion County?
Unemployment Rate in Marion County is 10.7%.