Madison County, TX Map & Demographics
Madison County Map
Madison County Overview
$24,340
PER CAPITA INCOME
$74,757
AVG FAMILY INCOME
$65,768
AVG HOUSEHOLD INCOME
33.0%
WAGE / INCOME GAP [ % ]
67.0¢/ $1
WAGE / INCOME GAP [ $ ]
$7,175
FAMILY INCOME DEFICIT
0.41
INEQUALITY / GINI INDEX
13,556
TOTAL POPULATION
7,679
MALE POPULATION
5,877
FEMALE POPULATION
130.66
MALES / 100 FEMALES
76.53
FEMALES / 100 MALES
36.2
MEDIAN AGE
3.5
AVG FAMILY SIZE
2.8
AVG HOUSEHOLD SIZE
5,116
LABOR FORCE [ PEOPLE ]
46.7%
PERCENT IN LABOR FORCE
6.3%
UNEMPLOYMENT RATE
Madison County Area Codes
Income in Madison County
Income Overview in Madison County
Per Capita Income in Madison County is $24,340, while median incomes of families and households are $74,757 and $65,768 respectively.
| Characteristic | Number | Measure |
| Per Capita Income | 13,556 | $24,340 |
| Median Family Income | 2,753 | $74,757 |
| Mean Family Income | 2,753 | $90,105 |
| Median Household Income | 4,081 | $65,768 |
| Mean Household Income | 4,081 | $76,169 |
| Income Deficit | 2,753 | $7,175 |
| Wage / Income Gap (%) | 13,556 | 33.00% |
| Wage / Income Gap ($) | 13,556 | 67.00¢ per $1 |
| Gini / Inequality Index | 13,556 | 0.41 |
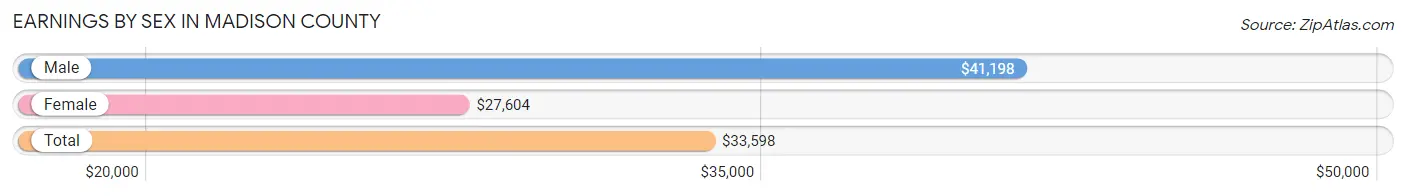
Earnings by Sex in Madison County
Average Earnings in Madison County are $33,598, $41,198 for men and $27,604 for women, a difference of 33.0%.
| Sex | Number | Average Earnings |
| Male | 2,935 (54.0%) | $41,198 |
| Female | 2,501 (46.0%) | $27,604 |
| Total | 5,436 (100.0%) | $33,598 |
Earnings by Sex by Income Bracket in Madison County
The most common earnings brackets in Madison County are $100,000+ for men (421 | 14.3%) and $25,000 to $29,999 for women (305 | 12.2%).
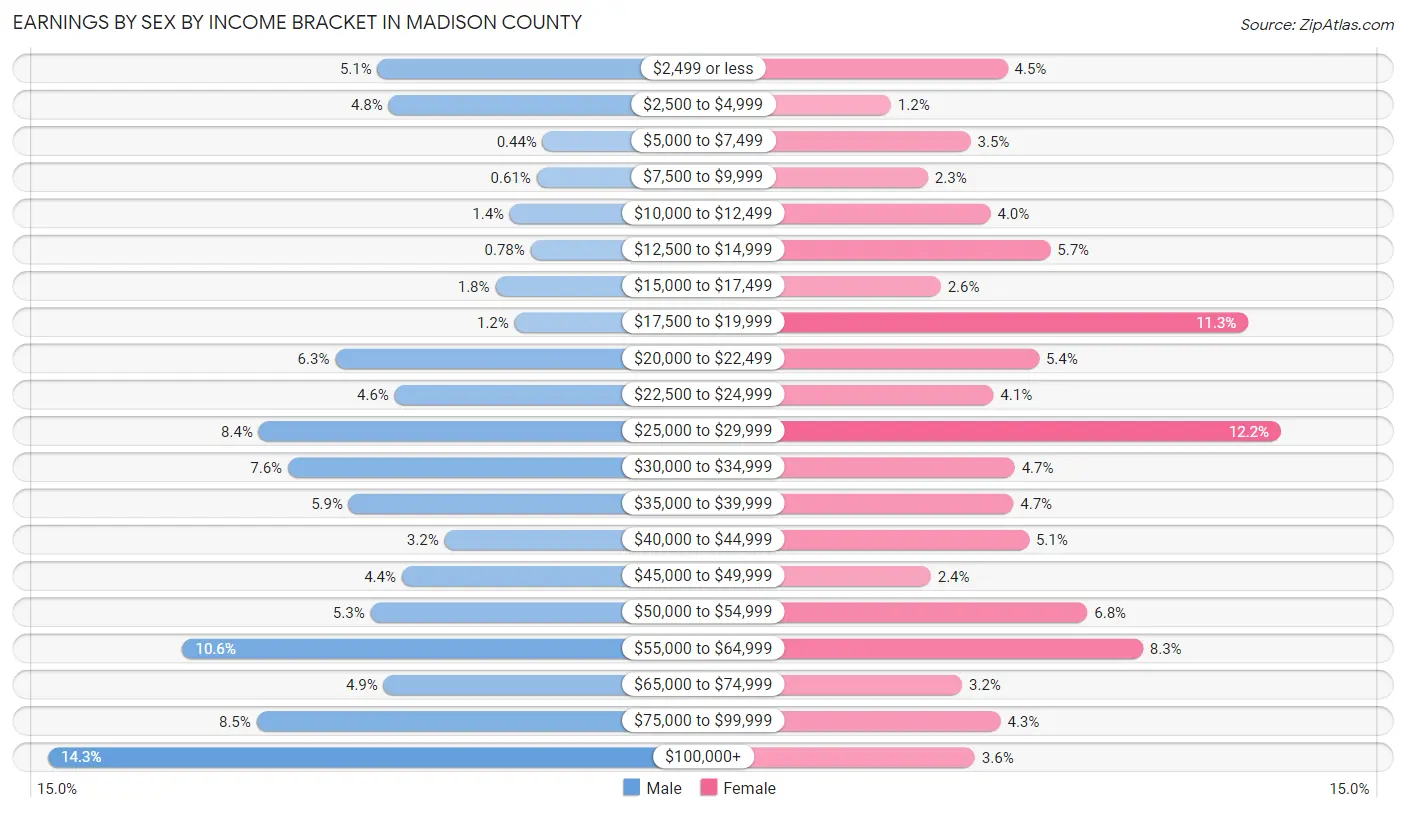
| Income | Male | Female |
| $2,499 or less | 149 (5.1%) | 113 (4.5%) |
| $2,500 to $4,999 | 140 (4.8%) | 31 (1.2%) |
| $5,000 to $7,499 | 13 (0.4%) | 87 (3.5%) |
| $7,500 to $9,999 | 18 (0.6%) | 57 (2.3%) |
| $10,000 to $12,499 | 40 (1.4%) | 101 (4.0%) |
| $12,500 to $14,999 | 23 (0.8%) | 143 (5.7%) |
| $15,000 to $17,499 | 52 (1.8%) | 66 (2.6%) |
| $17,500 to $19,999 | 36 (1.2%) | 282 (11.3%) |
| $20,000 to $22,499 | 184 (6.3%) | 135 (5.4%) |
| $22,500 to $24,999 | 135 (4.6%) | 103 (4.1%) |
| $25,000 to $29,999 | 247 (8.4%) | 305 (12.2%) |
| $30,000 to $34,999 | 223 (7.6%) | 118 (4.7%) |
| $35,000 to $39,999 | 173 (5.9%) | 117 (4.7%) |
| $40,000 to $44,999 | 94 (3.2%) | 128 (5.1%) |
| $45,000 to $49,999 | 129 (4.4%) | 59 (2.4%) |
| $50,000 to $54,999 | 155 (5.3%) | 169 (6.8%) |
| $55,000 to $64,999 | 310 (10.6%) | 208 (8.3%) |
| $65,000 to $74,999 | 144 (4.9%) | 81 (3.2%) |
| $75,000 to $99,999 | 249 (8.5%) | 108 (4.3%) |
| $100,000+ | 421 (14.3%) | 90 (3.6%) |
| Total | 2,935 (100.0%) | 2,501 (100.0%) |
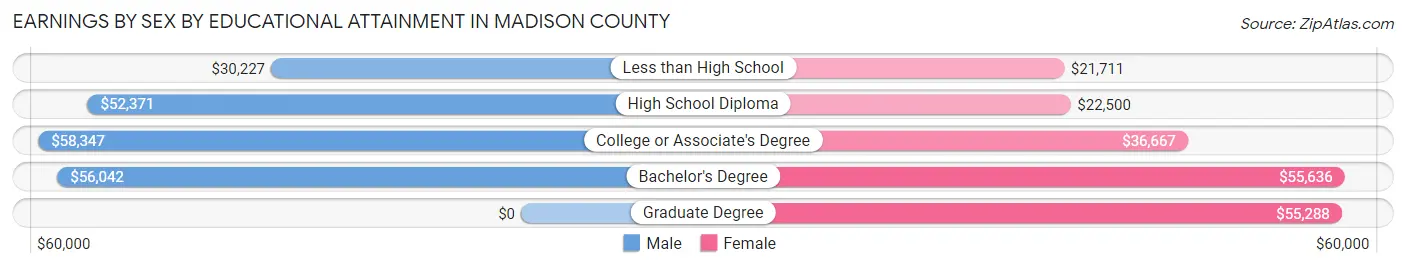
Earnings by Sex by Educational Attainment in Madison County
Average earnings in Madison County are $49,804 for men and $30,294 for women, a difference of 39.2%. Men with an educational attainment of college or associate's degree enjoy the highest average annual earnings of $58,347, while those with less than high school education earn the least with $30,227. Women with an educational attainment of bachelor's degree earn the most with the average annual earnings of $55,636, while those with less than high school education have the smallest earnings of $21,711.
| Educational Attainment | Male Income | Female Income |
| Less than High School | $30,227 | $21,711 |
| High School Diploma | $52,371 | $22,500 |
| College or Associate's Degree | $58,347 | $36,667 |
| Bachelor's Degree | $56,042 | $55,636 |
| Graduate Degree | - | - |
| Total | $49,804 | $30,294 |
Family Income in Madison County
Family Income Brackets in Madison County
According to the Madison County family income data, there are 617 families falling into the $50,000 to $74,999 income range, which is the most common income bracket and makes up 22.4% of all families. Conversely, the $10,000 to $14,999 income bracket is the least frequent group with only 14 families (0.5%) belonging to this category.
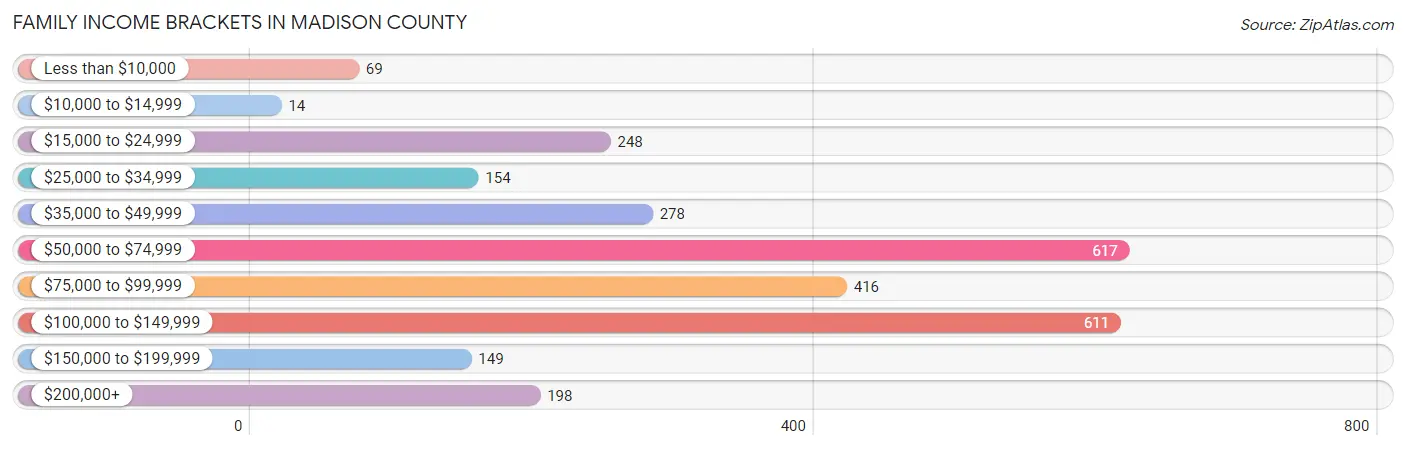
| Income Bracket | # Families | % Families |
| Less than $10,000 | 69 | 2.5% |
| $10,000 to $14,999 | 14 | 0.5% |
| $15,000 to $24,999 | 248 | 9.0% |
| $25,000 to $34,999 | 154 | 5.6% |
| $35,000 to $49,999 | 278 | 10.1% |
| $50,000 to $74,999 | 617 | 22.4% |
| $75,000 to $99,999 | 416 | 15.1% |
| $100,000 to $149,999 | 611 | 22.2% |
| $150,000 to $199,999 | 149 | 5.4% |
| $200,000+ | 198 | 7.2% |
Family Income by Famaliy Size in Madison County
6-person families (62 | 2.2%) account for the highest median family income in Madison County with $107,273 per family, while 2-person families (1,209 | 43.9%) have the highest median income of $30,276 per family member.
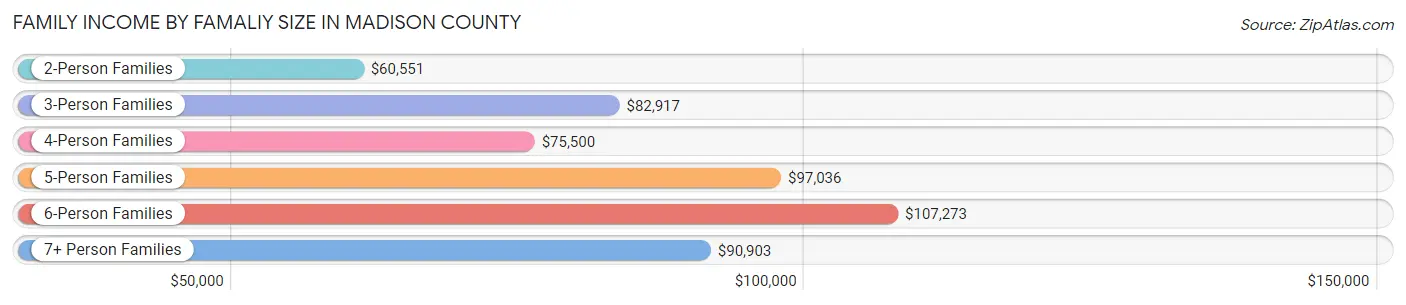
| Income Bracket | # Families | Median Income |
| 2-Person Families | 1,209 (43.9%) | $60,551 |
| 3-Person Families | 692 (25.1%) | $82,917 |
| 4-Person Families | 410 (14.9%) | $75,500 |
| 5-Person Families | 311 (11.3%) | $97,036 |
| 6-Person Families | 62 (2.2%) | $107,273 |
| 7+ Person Families | 69 (2.5%) | $90,903 |
| Total | 2,753 (100.0%) | $74,757 |
Family Income by Number of Earners in Madison County
The median family income in Madison County is $74,757, with families comprising 3+ earners (297) having the highest median family income of $138,260, while families with no earners (457) have the lowest median family income of $40,347, accounting for 10.8% and 16.6% of families, respectively.
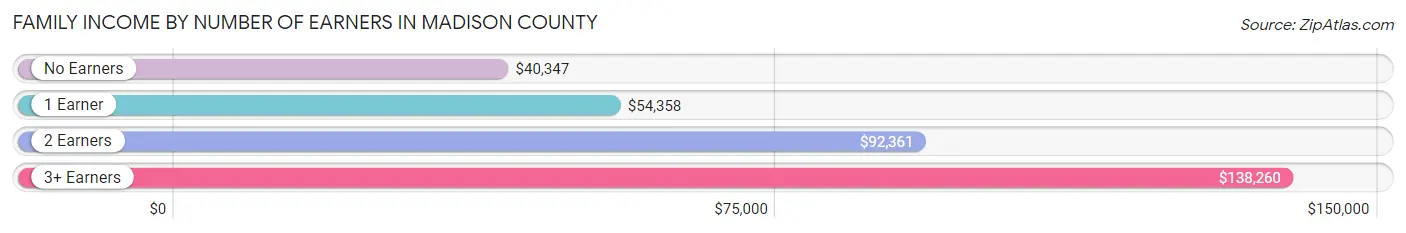
| Number of Earners | # Families | Median Income |
| No Earners | 457 (16.6%) | $40,347 |
| 1 Earner | 873 (31.7%) | $54,358 |
| 2 Earners | 1,126 (40.9%) | $92,361 |
| 3+ Earners | 297 (10.8%) | $138,260 |
| Total | 2,753 (100.0%) | $74,757 |
Household Income in Madison County
Household Income Brackets in Madison County
With 898 households falling in the category, the $50,000 to $74,999 income range is the most frequent in Madison County, accounting for 22.0% of all households. In contrast, only 200 households (4.9%) fall into the $10,000 to $14,999 income bracket, making it the least populous group.
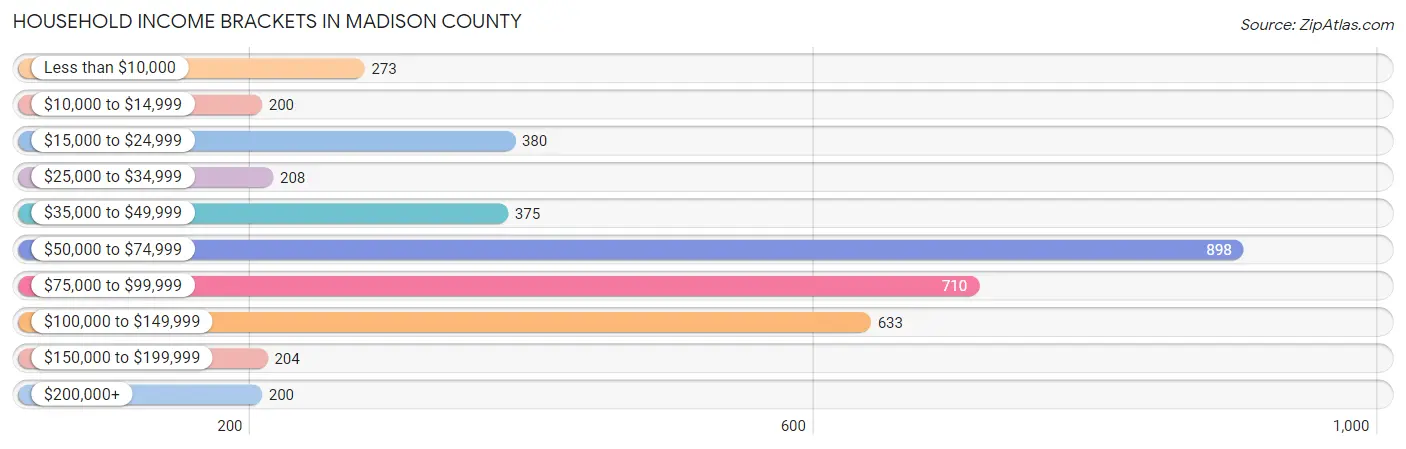
| Income Bracket | # Households | % Households |
| Less than $10,000 | 273 | 6.7% |
| $10,000 to $14,999 | 200 | 4.9% |
| $15,000 to $24,999 | 380 | 9.3% |
| $25,000 to $34,999 | 208 | 5.1% |
| $35,000 to $49,999 | 375 | 9.2% |
| $50,000 to $74,999 | 898 | 22.0% |
| $75,000 to $99,999 | 710 | 17.4% |
| $100,000 to $149,999 | 633 | 15.5% |
| $150,000 to $199,999 | 204 | 5.0% |
| $200,000+ | 200 | 4.9% |
Household Income by Householder Age in Madison County
The median household income in Madison County is $65,768, with the highest median household income of $75,997 found in the 25 to 44 years age bracket for the primary householder. A total of 1,329 households (32.6%) fall into this category. Meanwhile, the 15 to 24 years age bracket for the primary householder has the lowest median household income of $45,769, with 126 households (3.1%) in this group.
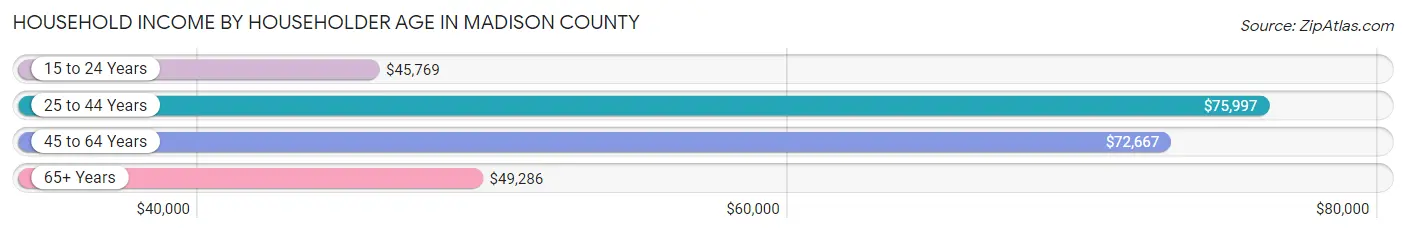
| Income Bracket | # Households | Median Income |
| 15 to 24 Years | 126 (3.1%) | $45,769 |
| 25 to 44 Years | 1,329 (32.6%) | $75,997 |
| 45 to 64 Years | 1,392 (34.1%) | $72,667 |
| 65+ Years | 1,234 (30.2%) | $49,286 |
| Total | 4,081 (100.0%) | $65,768 |
Poverty in Madison County
Income Below Poverty by Sex and Age in Madison County
With 11.7% poverty level for males and 13.3% for females among the residents of Madison County, 5 year old males and 12 to 14 year old females are the most vulnerable to poverty, with 27 males (28.7%) and 72 females (22.3%) in their respective age groups living below the poverty level.
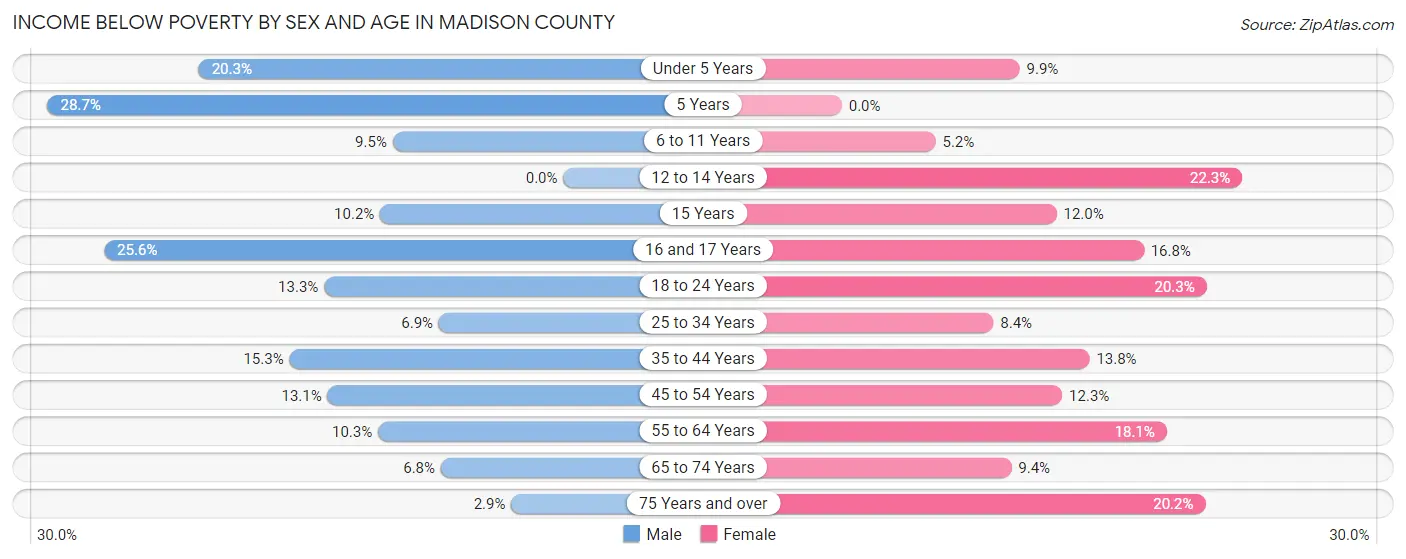
| Age Bracket | Male | Female |
| Under 5 Years | 80 (20.3%) | 40 (9.9%) |
| 5 Years | 27 (28.7%) | 0 (0.0%) |
| 6 to 11 Years | 40 (9.5%) | 24 (5.2%) |
| 12 to 14 Years | 0 (0.0%) | 72 (22.3%) |
| 15 Years | 5 (10.2%) | 11 (12.0%) |
| 16 and 17 Years | 56 (25.6%) | 20 (16.8%) |
| 18 to 24 Years | 81 (13.3%) | 79 (20.3%) |
| 25 to 34 Years | 46 (6.9%) | 68 (8.4%) |
| 35 to 44 Years | 126 (15.2%) | 84 (13.8%) |
| 45 to 54 Years | 75 (13.1%) | 88 (12.3%) |
| 55 to 64 Years | 61 (10.3%) | 129 (18.1%) |
| 65 to 74 Years | 36 (6.8%) | 61 (9.4%) |
| 75 Years and over | 10 (2.9%) | 84 (20.2%) |
| Total | 643 (11.7%) | 760 (13.3%) |
Income Above Poverty by Sex and Age in Madison County
According to the poverty statistics in Madison County, males aged 12 to 14 years and females aged 5 years are the age groups that are most secure financially, with 100.0% of males and 100.0% of females in these age groups living above the poverty line.
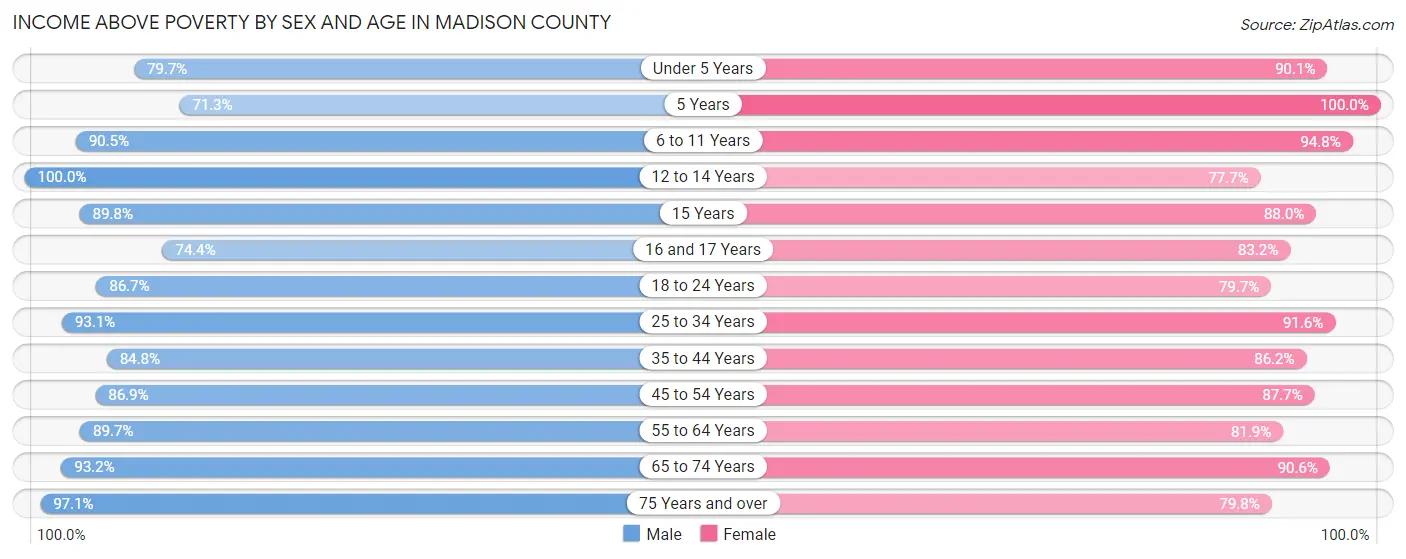
| Age Bracket | Male | Female |
| Under 5 Years | 314 (79.7%) | 364 (90.1%) |
| 5 Years | 67 (71.3%) | 39 (100.0%) |
| 6 to 11 Years | 381 (90.5%) | 436 (94.8%) |
| 12 to 14 Years | 206 (100.0%) | 251 (77.7%) |
| 15 Years | 44 (89.8%) | 81 (88.0%) |
| 16 and 17 Years | 163 (74.4%) | 99 (83.2%) |
| 18 to 24 Years | 527 (86.7%) | 310 (79.7%) |
| 25 to 34 Years | 618 (93.1%) | 738 (91.6%) |
| 35 to 44 Years | 700 (84.8%) | 525 (86.2%) |
| 45 to 54 Years | 496 (86.9%) | 629 (87.7%) |
| 55 to 64 Years | 530 (89.7%) | 584 (81.9%) |
| 65 to 74 Years | 492 (93.2%) | 585 (90.6%) |
| 75 Years and over | 335 (97.1%) | 331 (79.8%) |
| Total | 4,873 (88.3%) | 4,972 (86.7%) |
Income Below Poverty Among Married-Couple Families in Madison County
The poverty statistics for married-couple families in Madison County show that 5.3% or 105 of the total 1,984 families live below the poverty line. Families with 1 or 2 children have the highest poverty rate of 10.4%, comprising of 60 families. On the other hand, families with 5 or more children have the lowest poverty rate of 0.0%, which includes 0 families.
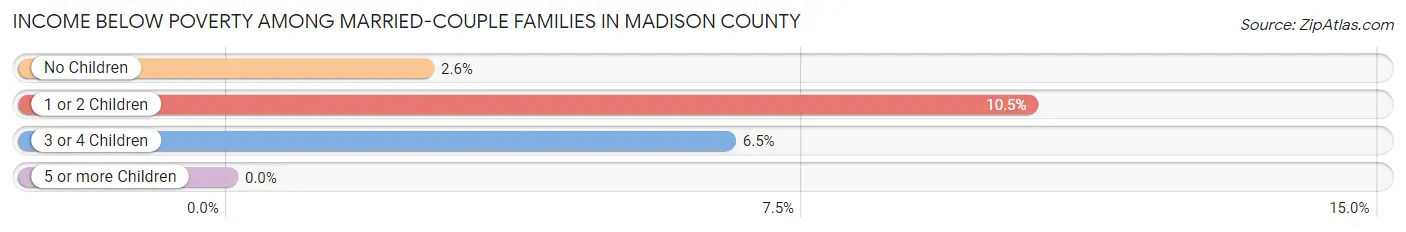
| Children | Above Poverty | Below Poverty |
| No Children | 1,105 (97.4%) | 29 (2.6%) |
| 1 or 2 Children | 514 (89.5%) | 60 (10.4%) |
| 3 or 4 Children | 230 (93.5%) | 16 (6.5%) |
| 5 or more Children | 30 (100.0%) | 0 (0.0%) |
| Total | 1,879 (94.7%) | 105 (5.3%) |
Income Below Poverty Among Single-Parent Households in Madison County
According to the poverty data in Madison County, 15.7% or 21 single-father households and 26.8% or 170 single-mother households are living below the poverty line. Among single-father households, those with 1 or 2 children have the highest poverty rate, with 14 households (24.1%) experiencing poverty. Likewise, among single-mother households, those with 3 or 4 children have the highest poverty rate, with 37 households (50.7%) falling below the poverty line.
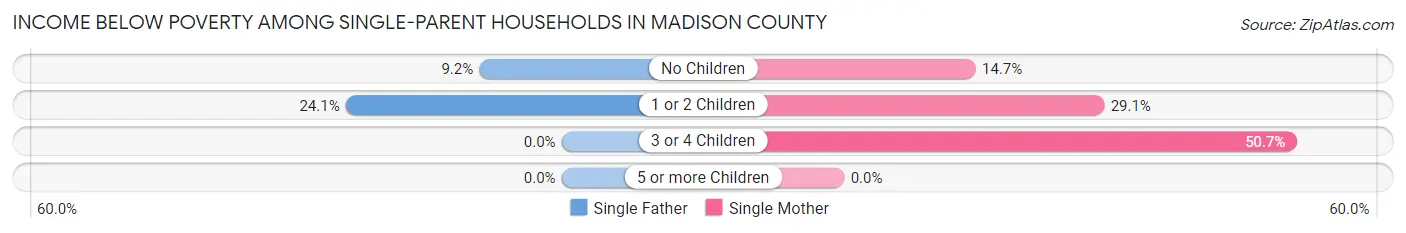
| Children | Single Father | Single Mother |
| No Children | 7 (9.2%) | 31 (14.7%) |
| 1 or 2 Children | 14 (24.1%) | 102 (29.1%) |
| 3 or 4 Children | 0 (0.0%) | 37 (50.7%) |
| 5 or more Children | 0 (0.0%) | 0 (0.0%) |
| Total | 21 (15.7%) | 170 (26.8%) |
Income Below Poverty Among Married-Couple vs Single-Parent Households in Madison County
The poverty data for Madison County shows that 105 of the married-couple family households (5.3%) and 191 of the single-parent households (24.8%) are living below the poverty level. Within the married-couple family households, those with 1 or 2 children have the highest poverty rate, with 60 households (10.4%) falling below the poverty line. Among the single-parent households, those with 3 or 4 children have the highest poverty rate, with 37 household (50.7%) living below poverty.
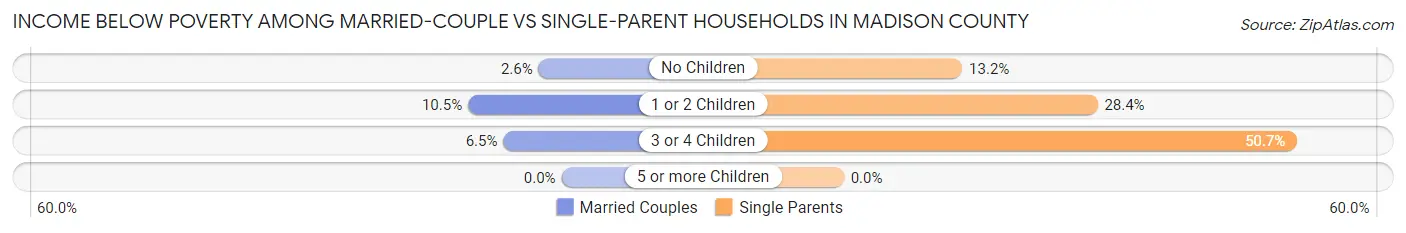
| Children | Married-Couple Families | Single-Parent Households |
| No Children | 29 (2.6%) | 38 (13.2%) |
| 1 or 2 Children | 60 (10.4%) | 116 (28.4%) |
| 3 or 4 Children | 16 (6.5%) | 37 (50.7%) |
| 5 or more Children | 0 (0.0%) | 0 (0.0%) |
| Total | 105 (5.3%) | 191 (24.8%) |
Race in Madison County
The most populous races in Madison County are White / Caucasian (9,008 | 66.4%), Hispanic or Latino (3,353 | 24.7%), and Black / African American (2,173 | 16.0%).
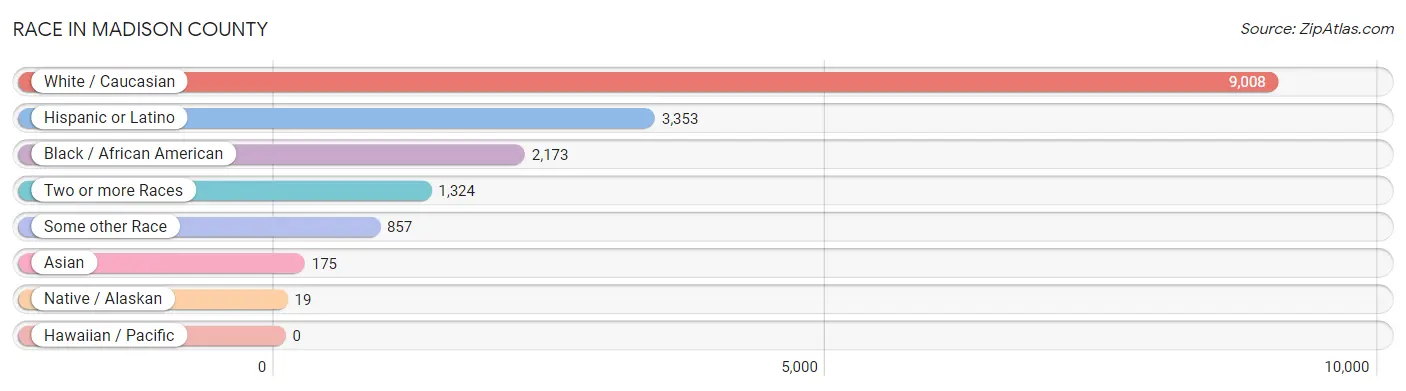
| Race | # Population | % Population |
| Asian | 175 | 1.3% |
| Black / African American | 2,173 | 16.0% |
| Hawaiian / Pacific | 0 | 0.0% |
| Hispanic or Latino | 3,353 | 24.7% |
| Native / Alaskan | 19 | 0.1% |
| White / Caucasian | 9,008 | 66.4% |
| Two or more Races | 1,324 | 9.8% |
| Some other Race | 857 | 6.3% |
| Total | 13,556 | 100.0% |
Ancestry in Madison County
The most populous ancestries reported in Madison County are Mexican (2,868 | 21.2%), German (1,676 | 12.4%), Irish (1,240 | 9.1%), English (1,233 | 9.1%), and American (733 | 5.4%), together accounting for 57.2% of all Madison County residents.
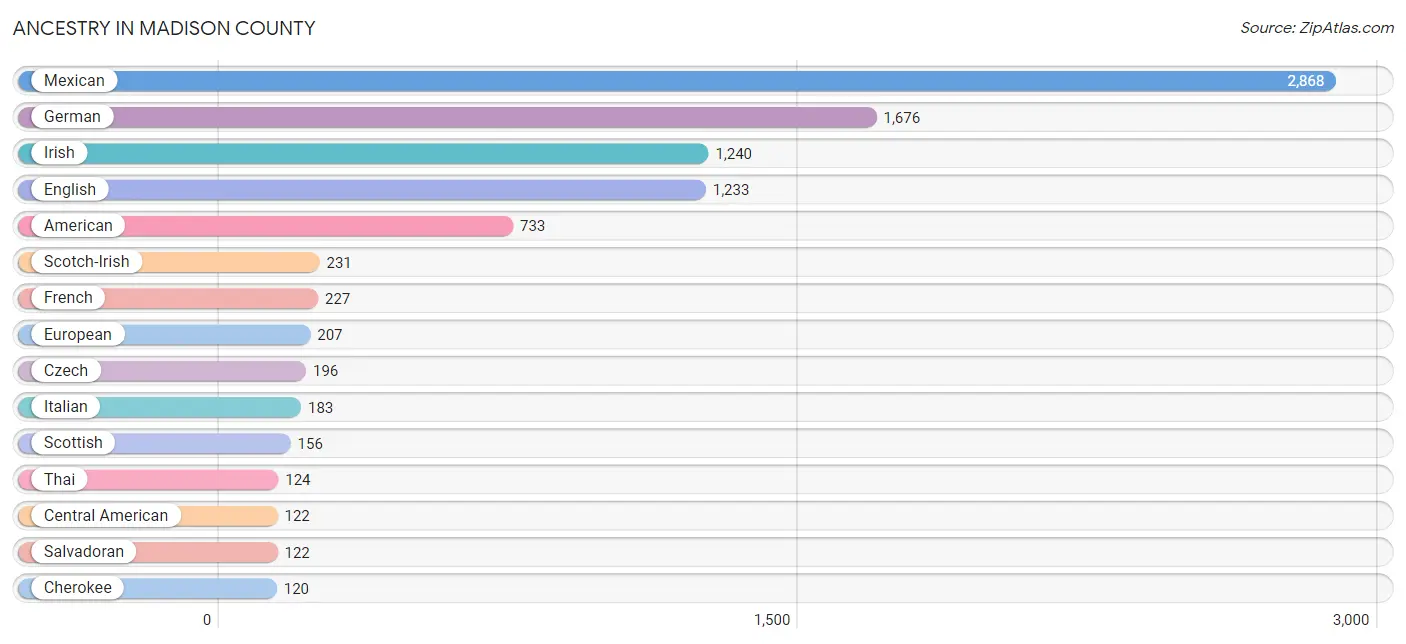
| Ancestry | # Population | % Population |
| African | 33 | 0.2% |
| American | 733 | 5.4% |
| Bhutanese | 16 | 0.1% |
| Blackfeet | 30 | 0.2% |
| British | 32 | 0.2% |
| Burmese | 15 | 0.1% |
| Cajun | 56 | 0.4% |
| Canadian | 9 | 0.1% |
| Central American | 122 | 0.9% |
| Cherokee | 120 | 0.9% |
| Chickasaw | 1 | 0.0% |
| Colombian | 22 | 0.2% |
| Comanche | 18 | 0.1% |
| Creek | 6 | 0.0% |
| Cuban | 57 | 0.4% |
| Czech | 196 | 1.5% |
| Czechoslovakian | 12 | 0.1% |
| Danish | 20 | 0.2% |
| Dominican | 6 | 0.0% |
| Dutch | 60 | 0.4% |
| Dutch West Indian | 5 | 0.0% |
| English | 1,233 | 9.1% |
| European | 207 | 1.5% |
| French | 227 | 1.7% |
| French American Indian | 10 | 0.1% |
| French Canadian | 2 | 0.0% |
| German | 1,676 | 12.4% |
| Greek | 34 | 0.3% |
| Haitian | 5 | 0.0% |
| Hungarian | 79 | 0.6% |
| Indian (Asian) | 18 | 0.1% |
| Irish | 1,240 | 9.1% |
| Italian | 183 | 1.3% |
| Malaysian | 6 | 0.0% |
| Mexican | 2,868 | 21.2% |
| Norwegian | 8 | 0.1% |
| Pennsylvania German | 5 | 0.0% |
| Polish | 69 | 0.5% |
| Puerto Rican | 25 | 0.2% |
| Russian | 17 | 0.1% |
| Salvadoran | 122 | 0.9% |
| Scandinavian | 3 | 0.0% |
| Scotch-Irish | 231 | 1.7% |
| Scottish | 156 | 1.1% |
| Seminole | 6 | 0.0% |
| Sioux | 6 | 0.0% |
| South American | 22 | 0.2% |
| Spaniard | 10 | 0.1% |
| Spanish | 3 | 0.0% |
| Sri Lankan | 15 | 0.1% |
| Subsaharan African | 33 | 0.2% |
| Swedish | 31 | 0.2% |
| Thai | 124 | 0.9% |
| Welsh | 19 | 0.1% | View All 54 Rows |
Immigrants in Madison County
The most numerous immigrant groups reported in Madison County came from Latin America (1,164 | 8.6%), Central America (1,114 | 8.2%), Mexico (1,008 | 7.4%), Asia (104 | 0.8%), and El Salvador (85 | 0.6%), together accounting for 25.6% of all Madison County residents.
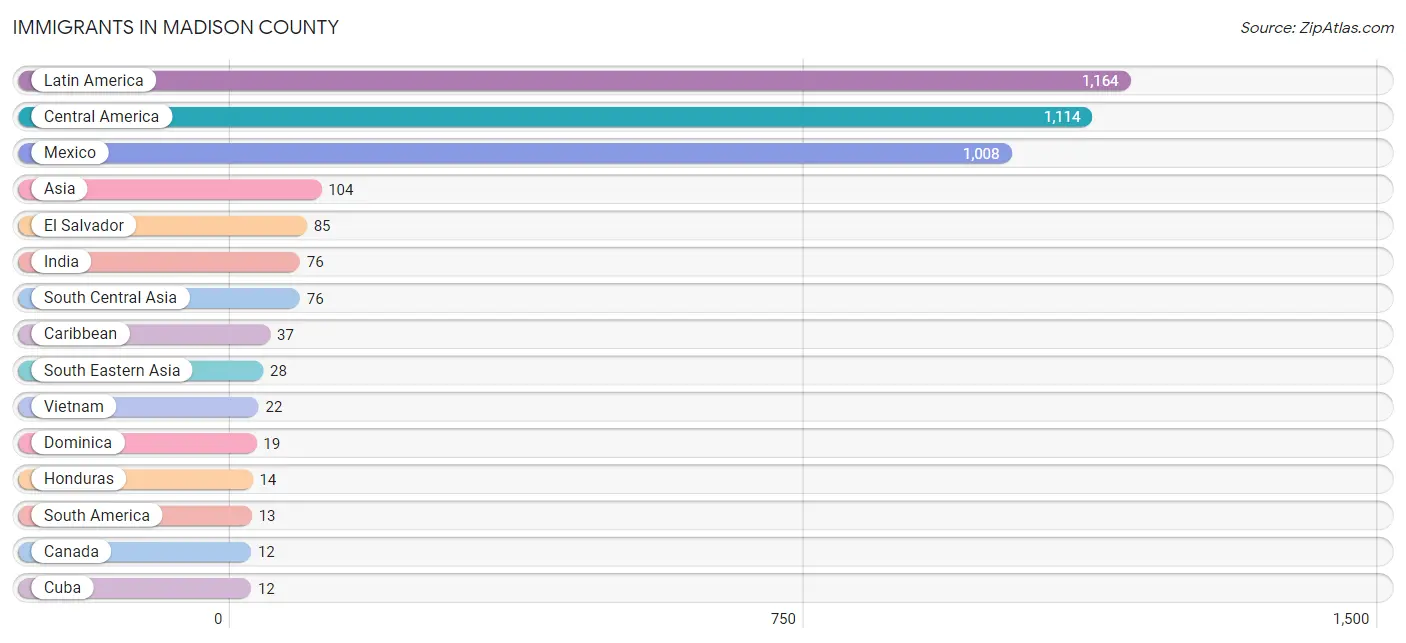
| Immigration Origin | # Population | % Population |
| Asia | 104 | 0.8% |
| Canada | 12 | 0.1% |
| Caribbean | 37 | 0.3% |
| Central America | 1,114 | 8.2% |
| Colombia | 10 | 0.1% |
| Cuba | 12 | 0.1% |
| Dominica | 19 | 0.1% |
| Dominican Republic | 6 | 0.0% |
| El Salvador | 85 | 0.6% |
| Honduras | 14 | 0.1% |
| India | 76 | 0.6% |
| Laos | 6 | 0.0% |
| Latin America | 1,164 | 8.6% |
| Mexico | 1,008 | 7.4% |
| Nicaragua | 7 | 0.1% |
| South America | 13 | 0.1% |
| South Central Asia | 76 | 0.6% |
| South Eastern Asia | 28 | 0.2% |
| Venezuela | 3 | 0.0% |
| Vietnam | 22 | 0.2% | View All 20 Rows |
Sex and Age in Madison County
Sex and Age in Madison County
The most populous age groups in Madison County are 35 to 39 Years (836 | 10.9%) for men and 25 to 29 Years (507 | 8.6%) for women.
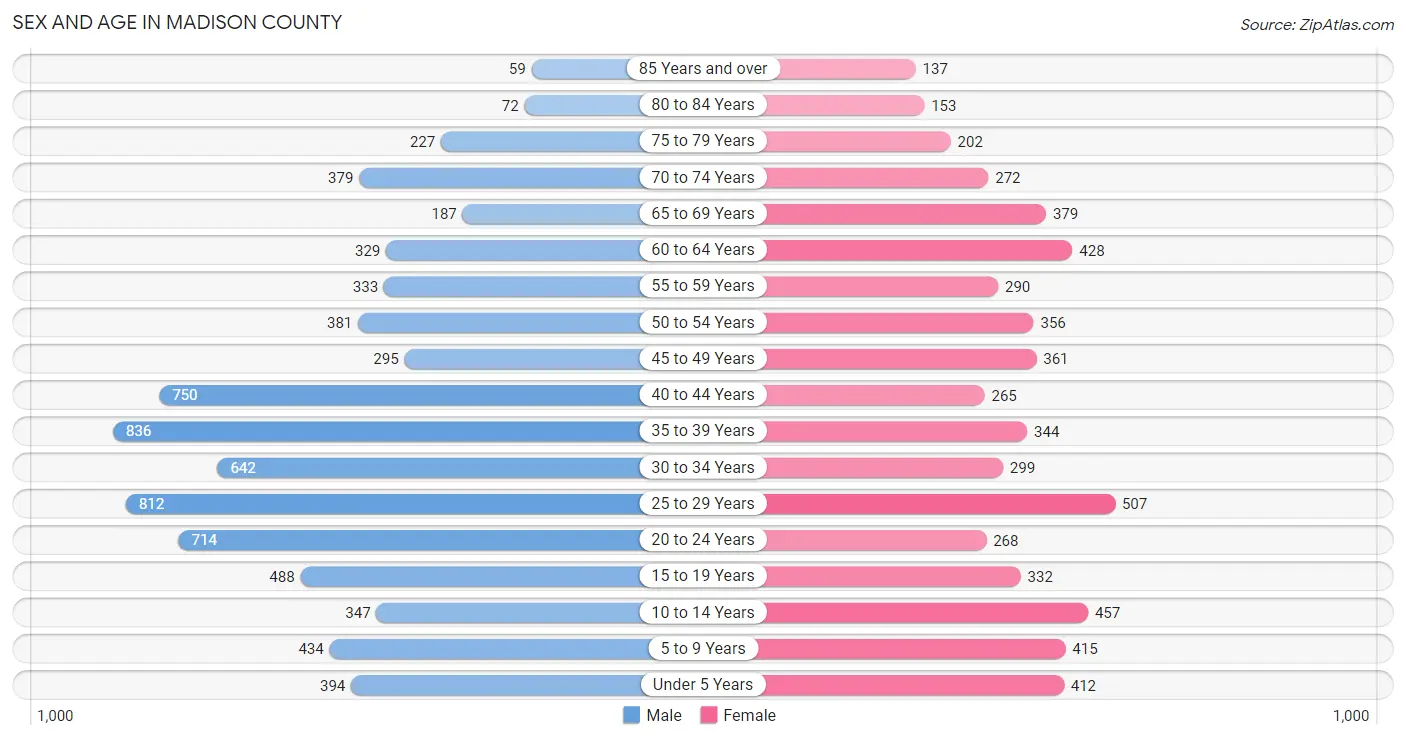
| Age Bracket | Male | Female |
| Under 5 Years | 394 (5.1%) | 412 (7.0%) |
| 5 to 9 Years | 434 (5.7%) | 415 (7.1%) |
| 10 to 14 Years | 347 (4.5%) | 457 (7.8%) |
| 15 to 19 Years | 488 (6.4%) | 332 (5.7%) |
| 20 to 24 Years | 714 (9.3%) | 268 (4.6%) |
| 25 to 29 Years | 812 (10.6%) | 507 (8.6%) |
| 30 to 34 Years | 642 (8.4%) | 299 (5.1%) |
| 35 to 39 Years | 836 (10.9%) | 344 (5.9%) |
| 40 to 44 Years | 750 (9.8%) | 265 (4.5%) |
| 45 to 49 Years | 295 (3.8%) | 361 (6.1%) |
| 50 to 54 Years | 381 (5.0%) | 356 (6.1%) |
| 55 to 59 Years | 333 (4.3%) | 290 (4.9%) |
| 60 to 64 Years | 329 (4.3%) | 428 (7.3%) |
| 65 to 69 Years | 187 (2.4%) | 379 (6.5%) |
| 70 to 74 Years | 379 (4.9%) | 272 (4.6%) |
| 75 to 79 Years | 227 (3.0%) | 202 (3.4%) |
| 80 to 84 Years | 72 (0.9%) | 153 (2.6%) |
| 85 Years and over | 59 (0.8%) | 137 (2.3%) |
| Total | 7,679 (100.0%) | 5,877 (100.0%) |
Families and Households in Madison County
Median Family Size in Madison County
The median family size in Madison County is 3.46 persons per family, with single male/father families (134 | 4.9%) accounting for the largest median family size of 3.68 persons per family. On the other hand, single female/mother families (635 | 23.1%) represent the smallest median family size with 3.10 persons per family.
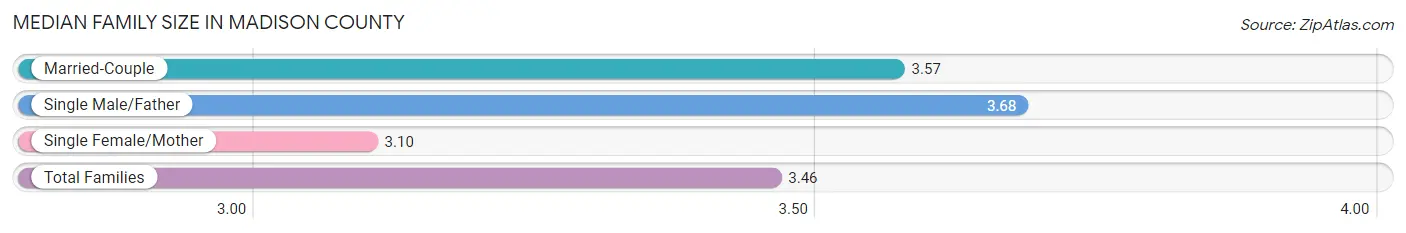
| Family Type | # Families | Family Size |
| Married-Couple | 1,984 (72.1%) | 3.57 |
| Single Male/Father | 134 (4.9%) | 3.68 |
| Single Female/Mother | 635 (23.1%) | 3.10 |
| Total Families | 2,753 (100.0%) | 3.46 |
Median Household Size in Madison County
The median household size in Madison County is 2.78 persons per household, with single male/father households (134 | 3.3%) accounting for the largest median household size of 4.1 persons per household. non-family households (1,328 | 32.5%) represent the smallest median household size with 1.10 persons per household.
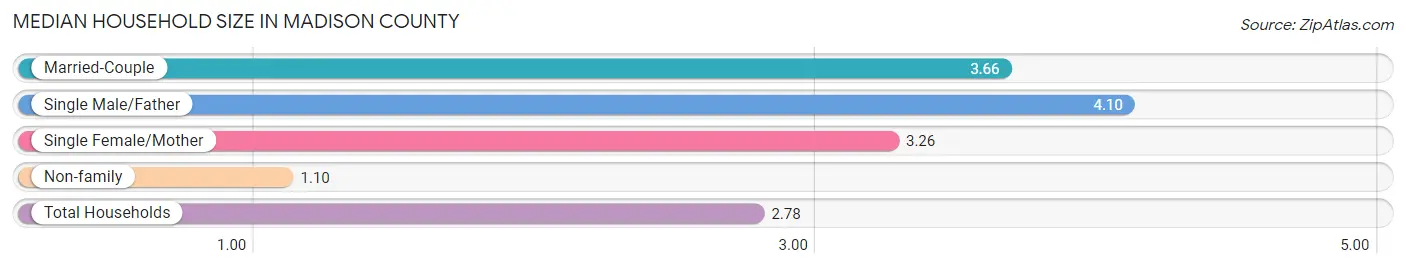
| Household Type | # Households | Household Size |
| Married-Couple | 1,984 (48.6%) | 3.66 |
| Single Male/Father | 134 (3.3%) | 4.10 |
| Single Female/Mother | 635 (15.6%) | 3.26 |
| Non-family | 1,328 (32.5%) | 1.10 |
| Total Households | 4,081 (100.0%) | 2.78 |
Household Size by Marriage Status in Madison County
Out of a total of 4,081 households in Madison County, 2,753 (67.5%) are family households, while 1,328 (32.5%) are nonfamily households. The most numerous type of family households are 2-person households, comprising 1,131, and the most common type of nonfamily households are 1-person households, comprising 1,254.
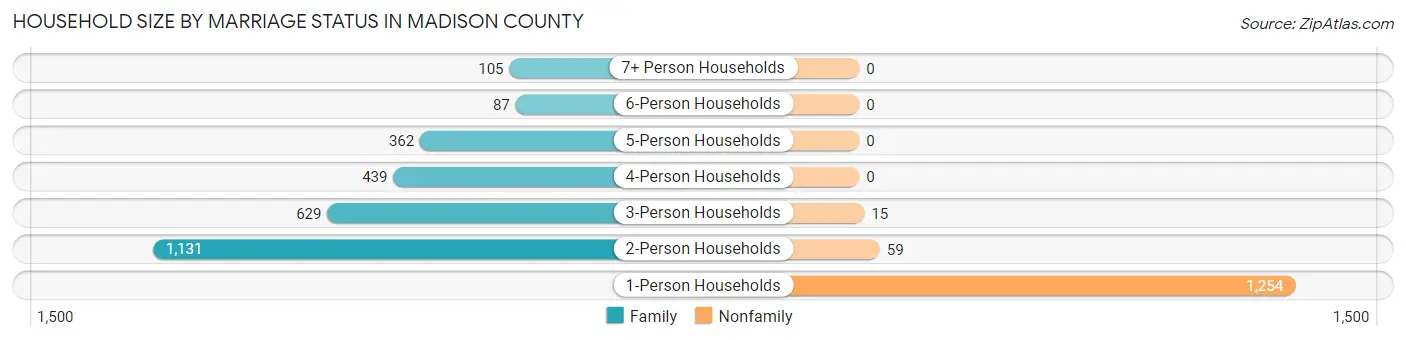
| Household Size | Family Households | Nonfamily Households |
| 1-Person Households | - | 1,254 (30.7%) |
| 2-Person Households | 1,131 (27.7%) | 59 (1.5%) |
| 3-Person Households | 629 (15.4%) | 15 (0.4%) |
| 4-Person Households | 439 (10.8%) | 0 (0.0%) |
| 5-Person Households | 362 (8.9%) | 0 (0.0%) |
| 6-Person Households | 87 (2.1%) | 0 (0.0%) |
| 7+ Person Households | 105 (2.6%) | 0 (0.0%) |
| Total | 2,753 (67.5%) | 1,328 (32.5%) |
Female Fertility in Madison County
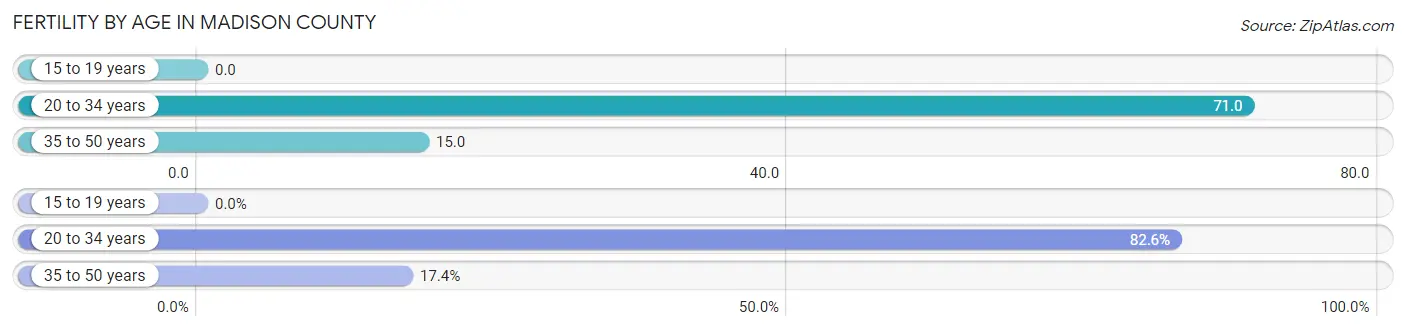
Fertility by Age in Madison County
Average fertility rate in Madison County is 37.0 births per 1,000 women. Women in the age bracket of 20 to 34 years have the highest fertility rate with 71.0 births per 1,000 women. Women in the age bracket of 20 to 34 years acount for 82.6% of all women with births.
| Age Bracket | Women with Births | Births / 1,000 Women |
| 15 to 19 years | 0 (0.0%) | 0.0 |
| 20 to 34 years | 76 (82.6%) | 71.0 |
| 35 to 50 years | 16 (17.4%) | 15.0 |
| Total | 92 (100.0%) | 37.0 |
Fertility by Age by Marriage Status in Madison County
59.8% of women with births (92) in Madison County are married. The highest percentage of unmarried women with births falls into 35 to 50 years age bracket with 56.2% of them unmarried at the time of birth, while the lowest percentage of unmarried women with births belong to 20 to 34 years age bracket with 36.8% of them unmarried.
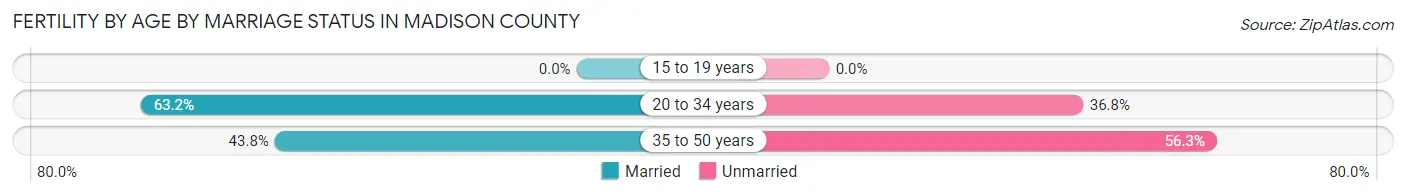
| Age Bracket | Married | Unmarried |
| 15 to 19 years | 0 (0.0%) | 0 (0.0%) |
| 20 to 34 years | 48 (63.2%) | 28 (36.8%) |
| 35 to 50 years | 7 (43.8%) | 9 (56.2%) |
| Total | 55 (59.8%) | 37 (40.2%) |
Fertility by Education in Madison County
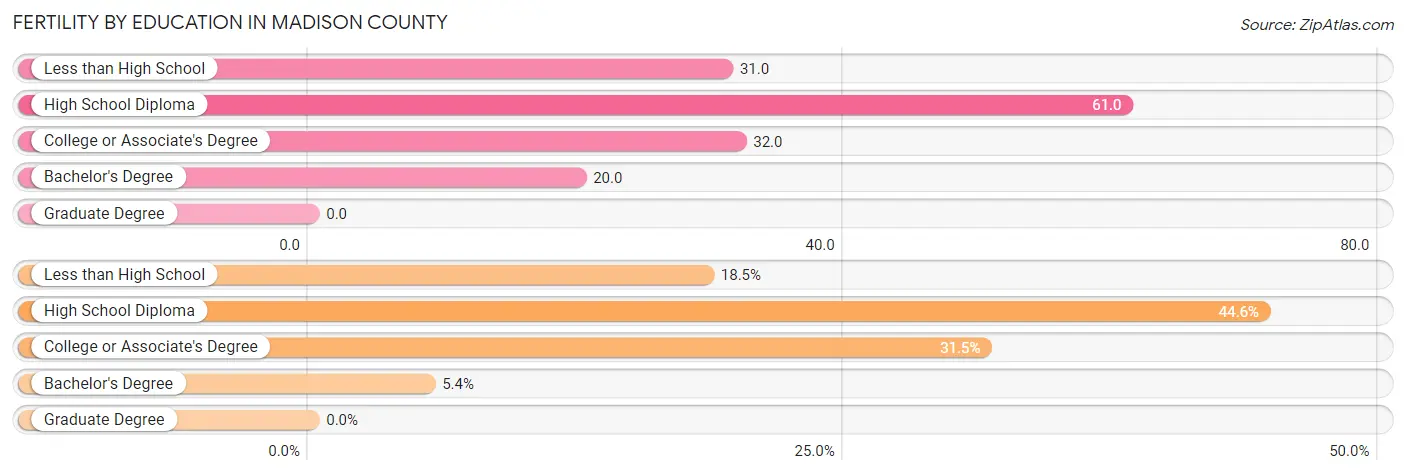
| Educational Attainment | Women with Births | Births / 1,000 Women |
| Less than High School | 17 (18.5%) | 31.0 |
| High School Diploma | 41 (44.6%) | 61.0 |
| College or Associate's Degree | 29 (31.5%) | 32.0 |
| Bachelor's Degree | 5 (5.4%) | 20.0 |
| Graduate Degree | 0 (0.0%) | 0.0 |
| Total | 92 (100.0%) | 37.0 |
Fertility by Education by Marriage Status in Madison County
40.2% of women with births in Madison County are unmarried. Women with the educational attainment of college or associate's degree are most likely to be married with 100.0% of them married at childbirth, while women with the educational attainment of high school diploma are least likely to be married with 68.3% of them unmarried at childbirth.
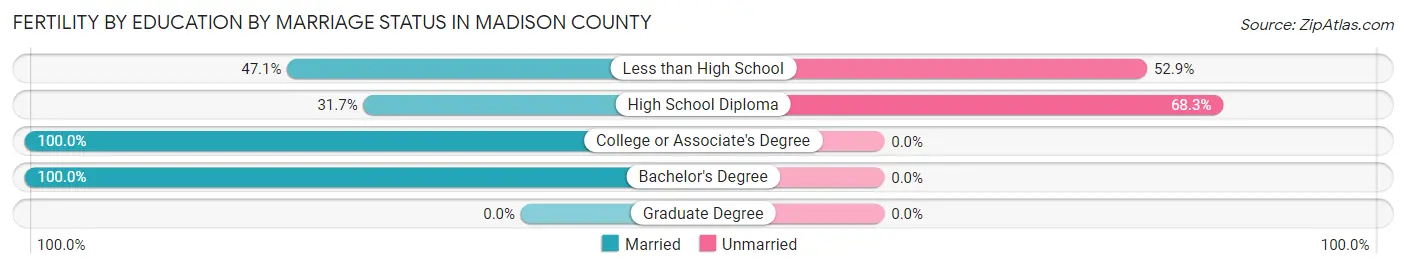
| Educational Attainment | Married | Unmarried |
| Less than High School | 8 (47.1%) | 9 (52.9%) |
| High School Diploma | 13 (31.7%) | 28 (68.3%) |
| College or Associate's Degree | 29 (100.0%) | 0 (0.0%) |
| Bachelor's Degree | 5 (100.0%) | 0 (0.0%) |
| Graduate Degree | 0 (0.0%) | 0 (0.0%) |
| Total | 55 (59.8%) | 37 (40.2%) |
Employment Characteristics in Madison County
Employment by Class of Employer in Madison County
Among the 4,698 employed individuals in Madison County, private company employees (3,180 | 67.7%), state government employees (368 | 7.8%), and self-employed (not incorporated) (349 | 7.4%) make up the most common classes of employment.
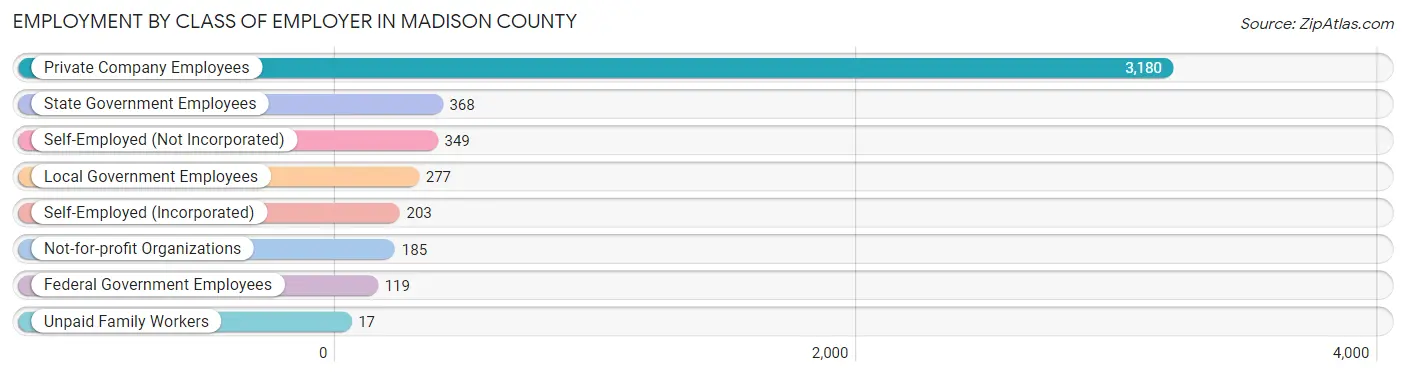
| Employer Class | # Employees | % Employees |
| Private Company Employees | 3,180 | 67.7% |
| Self-Employed (Incorporated) | 203 | 4.3% |
| Self-Employed (Not Incorporated) | 349 | 7.4% |
| Not-for-profit Organizations | 185 | 3.9% |
| Local Government Employees | 277 | 5.9% |
| State Government Employees | 368 | 7.8% |
| Federal Government Employees | 119 | 2.5% |
| Unpaid Family Workers | 17 | 0.4% |
| Total | 4,698 | 100.0% |
Employment Status by Age in Madison County
According to the labor force statistics for Madison County, out of the total population over 16 years of age (10,956), 46.7% or 5,116 individuals are in the labor force, with 6.3% or 322 of them unemployed. The age group with the highest labor force participation rate is 45 to 54 years, with 75.2% or 1,048 individuals in the labor force. Within the labor force, the 75 years and over age range has the highest percentage of unemployed individuals, with 67.8% or 99 of them being unemployed.
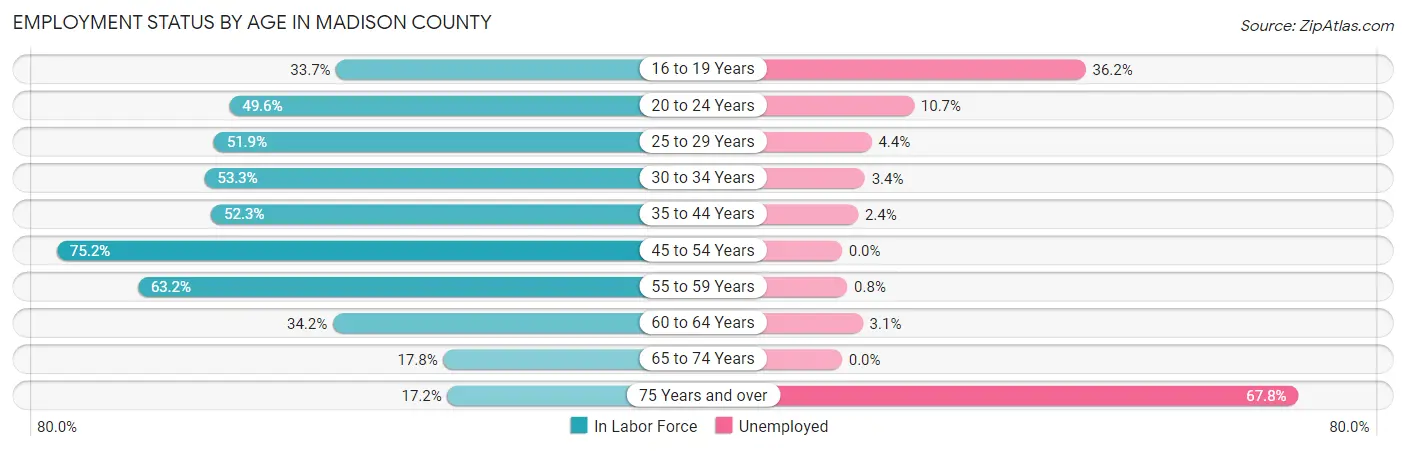
| Age Bracket | In Labor Force | Unemployed |
| 16 to 19 Years | 229 (33.7%) | 83 (36.2%) |
| 20 to 24 Years | 487 (49.6%) | 52 (10.7%) |
| 25 to 29 Years | 685 (51.9%) | 30 (4.4%) |
| 30 to 34 Years | 502 (53.3%) | 17 (3.4%) |
| 35 to 44 Years | 1,148 (52.3%) | 28 (2.4%) |
| 45 to 54 Years | 1,048 (75.2%) | 0 (0.0%) |
| 55 to 59 Years | 394 (63.2%) | 3 (0.8%) |
| 60 to 64 Years | 259 (34.2%) | 8 (3.1%) |
| 65 to 74 Years | 217 (17.8%) | 0 (0.0%) |
| 75 Years and over | 146 (17.2%) | 99 (67.8%) |
| Total | 5,116 (46.7%) | 322 (6.3%) |
Employment Status by Educational Attainment in Madison County
According to labor force statistics for Madison County, 55.8% of individuals (4,033) out of the total population between 25 and 64 years of age (7,228) are in the labor force, with 2.1% or 85 of them being unemployed. The group with the highest labor force participation rate are those with the educational attainment of bachelor's degree or higher, with 74.3% or 733 individuals in the labor force. Within the labor force, individuals with high school diploma education have the highest percentage of unemployment, with 3.6% or 54 of them being unemployed.
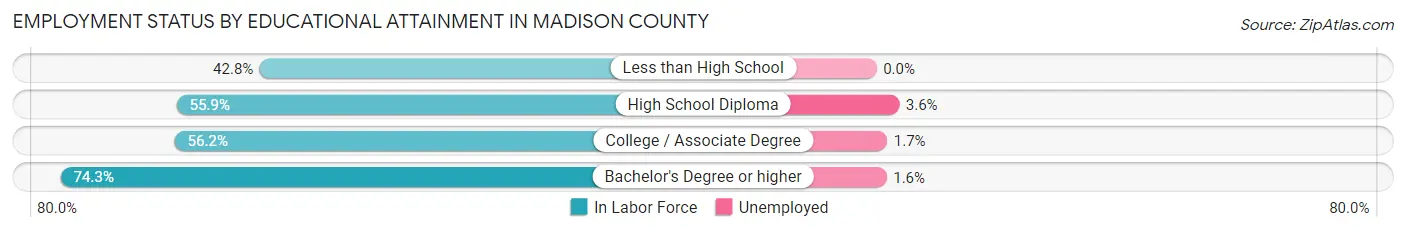
| Educational Attainment | In Labor Force | Unemployed |
| Less than High School | 634 (42.8%) | 0 (0.0%) |
| High School Diploma | 1,512 (55.9%) | 97 (3.6%) |
| College / Associate Degree | 1,155 (56.2%) | 35 (1.7%) |
| Bachelor's Degree or higher | 733 (74.3%) | 16 (1.6%) |
| Total | 4,033 (55.8%) | 152 (2.1%) |
Employment Occupations by Sex in Madison County
Management, Business, Science and Arts Occupations
The most common Management, Business, Science and Arts occupations in Madison County are Management (432 | 9.0%), Community & Social Service (413 | 8.6%), Education Instruction & Library (278 | 5.8%), Health Diagnosing & Treating (144 | 3.0%), and Computers, Engineering & Science (102 | 2.1%).
Management, Business, Science and Arts Occupations by Sex
Within the Management, Business, Science and Arts occupations in Madison County, the most male-oriented occupations are Computers & Mathematics (100.0%), Computers, Engineering & Science (95.1%), and Architecture & Engineering (86.5%), while the most female-oriented occupations are Education, Arts & Media (100.0%), Health Technologists (100.0%), and Health Diagnosing & Treating (88.2%).
| Occupation | Male | Female |
| Management | 147 (34.0%) | 285 (66.0%) |
| Business & Financial | 32 (37.2%) | 54 (62.8%) |
| Computers, Engineering & Science | 97 (95.1%) | 5 (4.9%) |
| Computers & Mathematics | 65 (100.0%) | 0 (0.0%) |
| Architecture & Engineering | 32 (86.5%) | 5 (13.5%) |
| Life, Physical & Social Science | 0 (0.0%) | 0 (0.0%) |
| Community & Social Service | 65 (15.7%) | 348 (84.3%) |
| Education, Arts & Media | 0 (0.0%) | 64 (100.0%) |
| Legal Services & Support | 18 (34.6%) | 34 (65.4%) |
| Education Instruction & Library | 37 (13.3%) | 241 (86.7%) |
| Arts, Media & Entertainment | 10 (52.6%) | 9 (47.4%) |
| Health Diagnosing & Treating | 17 (11.8%) | 127 (88.2%) |
| Health Technologists | 0 (0.0%) | 91 (100.0%) |
| Total (Category) | 358 (30.4%) | 819 (69.6%) |
| Total (Overall) | 2,490 (51.9%) | 2,303 (48.0%) |
Services Occupations
The most common Services occupations in Madison County are Cleaning & Maintenance (247 | 5.1%), Food Preparation & Serving (217 | 4.5%), Personal Care & Service (121 | 2.5%), Security & Protection (112 | 2.3%), and Healthcare Support (83 | 1.7%).
Services Occupations by Sex
Within the Services occupations in Madison County, the most male-oriented occupations are Firefighting & Prevention (100.0%), Security & Protection (92.9%), and Law Enforcement (90.1%), while the most female-oriented occupations are Healthcare Support (100.0%), Personal Care & Service (100.0%), and Food Preparation & Serving (51.6%).
| Occupation | Male | Female |
| Healthcare Support | 0 (0.0%) | 83 (100.0%) |
| Security & Protection | 104 (92.9%) | 8 (7.1%) |
| Firefighting & Prevention | 31 (100.0%) | 0 (0.0%) |
| Law Enforcement | 73 (90.1%) | 8 (9.9%) |
| Food Preparation & Serving | 105 (48.4%) | 112 (51.6%) |
| Cleaning & Maintenance | 147 (59.5%) | 100 (40.5%) |
| Personal Care & Service | 0 (0.0%) | 121 (100.0%) |
| Total (Category) | 356 (45.6%) | 424 (54.4%) |
| Total (Overall) | 2,490 (51.9%) | 2,303 (48.0%) |
Sales and Office Occupations
The most common Sales and Office occupations in Madison County are Sales & Related (625 | 13.0%), and Office & Administration (510 | 10.6%).

Sales and Office Occupations by Sex

| Occupation | Male | Female |
| Sales & Related | 242 (38.7%) | 383 (61.3%) |
| Office & Administration | 94 (18.4%) | 416 (81.6%) |
| Total (Category) | 336 (29.6%) | 799 (70.4%) |
| Total (Overall) | 2,490 (51.9%) | 2,303 (48.0%) |
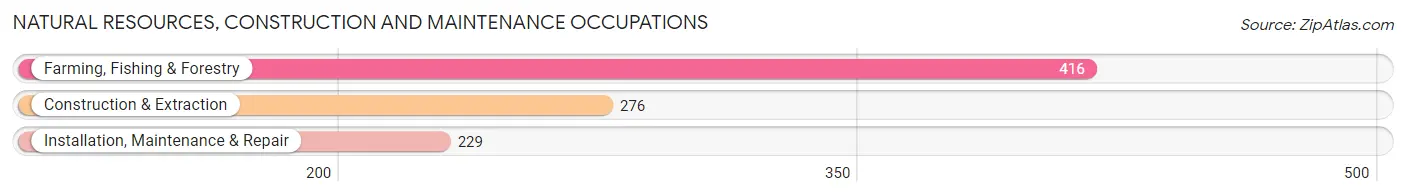
Natural Resources, Construction and Maintenance Occupations
The most common Natural Resources, Construction and Maintenance occupations in Madison County are Farming, Fishing & Forestry (416 | 8.7%), Construction & Extraction (276 | 5.8%), and Installation, Maintenance & Repair (229 | 4.8%).
Natural Resources, Construction and Maintenance Occupations by Sex
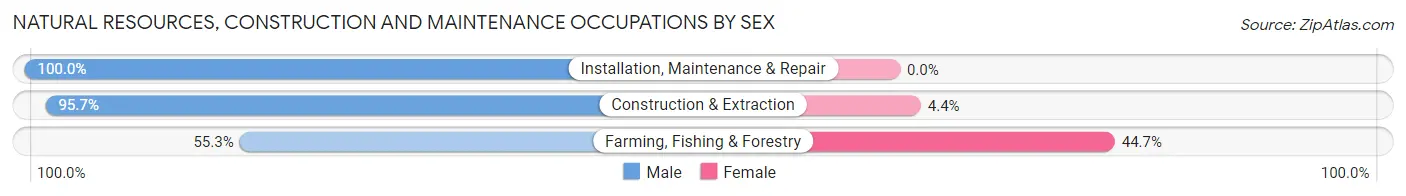
| Occupation | Male | Female |
| Farming, Fishing & Forestry | 230 (55.3%) | 186 (44.7%) |
| Construction & Extraction | 264 (95.7%) | 12 (4.3%) |
| Installation, Maintenance & Repair | 229 (100.0%) | 0 (0.0%) |
| Total (Category) | 723 (78.5%) | 198 (21.5%) |
| Total (Overall) | 2,490 (51.9%) | 2,303 (48.0%) |
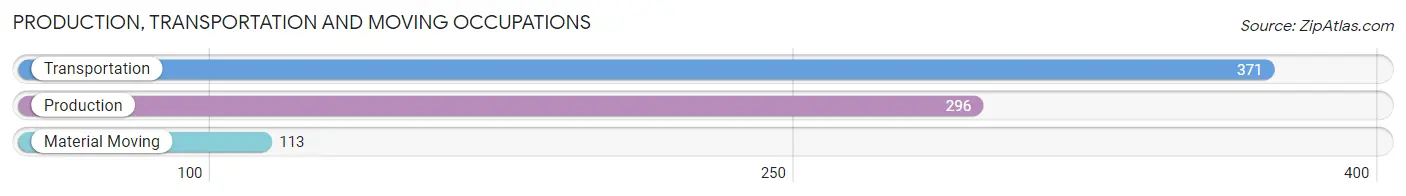
Production, Transportation and Moving Occupations
The most common Production, Transportation and Moving occupations in Madison County are Transportation (371 | 7.7%), Production (296 | 6.2%), and Material Moving (113 | 2.4%).
Production, Transportation and Moving Occupations by Sex
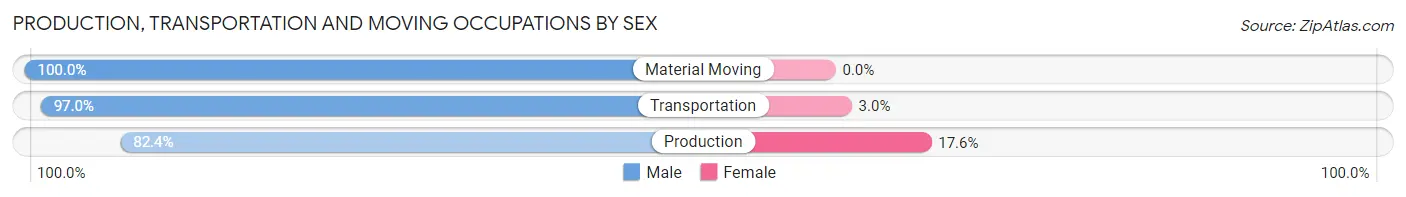
| Occupation | Male | Female |
| Production | 244 (82.4%) | 52 (17.6%) |
| Transportation | 360 (97.0%) | 11 (3.0%) |
| Material Moving | 113 (100.0%) | 0 (0.0%) |
| Total (Category) | 717 (91.9%) | 63 (8.1%) |
| Total (Overall) | 2,490 (51.9%) | 2,303 (48.0%) |
Employment Industries by Sex in Madison County
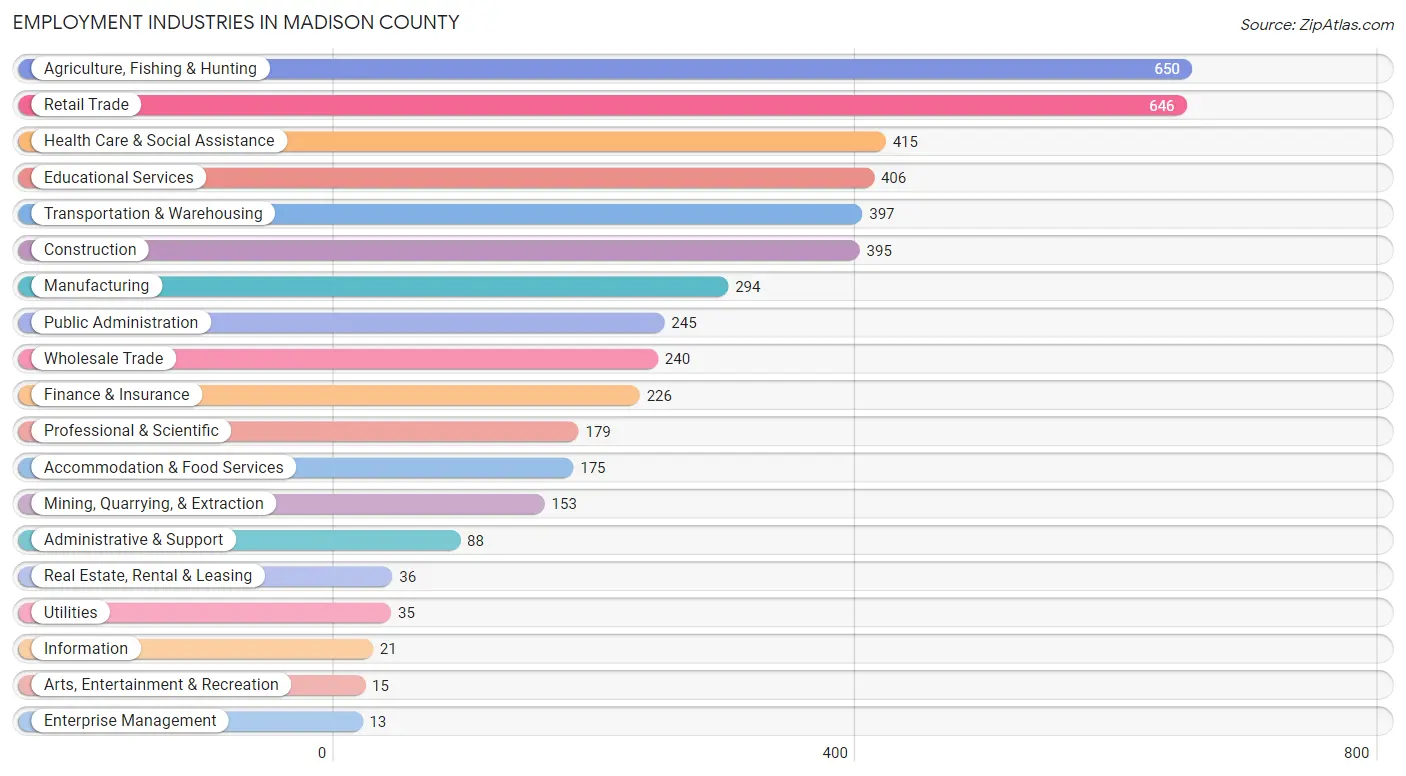
Employment Industries in Madison County
The major employment industries in Madison County include Agriculture, Fishing & Hunting (650 | 13.6%), Retail Trade (646 | 13.5%), Health Care & Social Assistance (415 | 8.7%), Educational Services (406 | 8.5%), and Transportation & Warehousing (397 | 8.3%).
Employment Industries by Sex in Madison County
The Madison County industries that see more men than women are Administrative & Support (100.0%), Mining, Quarrying, & Extraction (93.5%), and Construction (90.6%), whereas the industries that tend to have a higher number of women are Enterprise Management (100.0%), Health Care & Social Assistance (95.9%), and Accommodation & Food Services (92.6%).
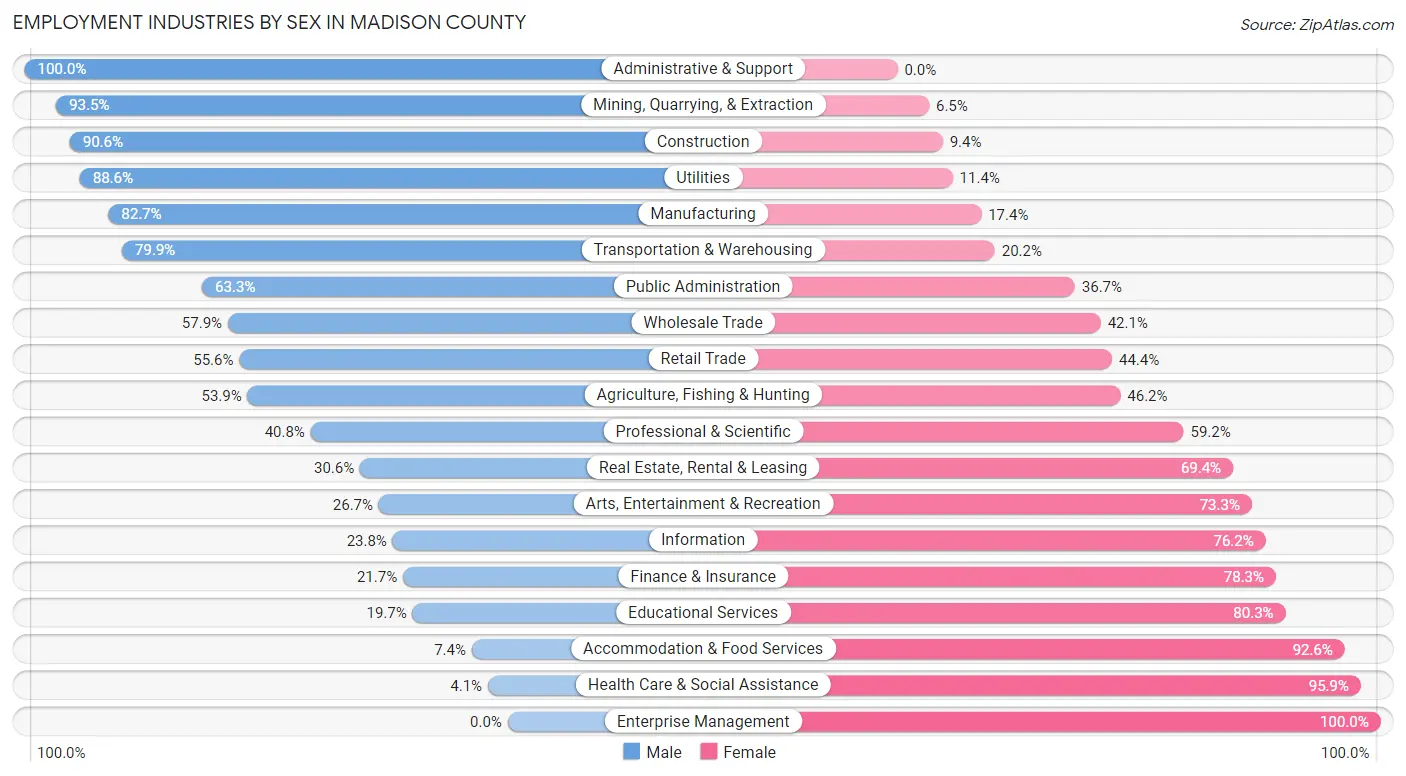
| Industry | Male | Female |
| Agriculture, Fishing & Hunting | 350 (53.8%) | 300 (46.2%) |
| Mining, Quarrying, & Extraction | 143 (93.5%) | 10 (6.5%) |
| Construction | 358 (90.6%) | 37 (9.4%) |
| Manufacturing | 243 (82.7%) | 51 (17.3%) |
| Wholesale Trade | 139 (57.9%) | 101 (42.1%) |
| Retail Trade | 359 (55.6%) | 287 (44.4%) |
| Transportation & Warehousing | 317 (79.8%) | 80 (20.2%) |
| Utilities | 31 (88.6%) | 4 (11.4%) |
| Information | 5 (23.8%) | 16 (76.2%) |
| Finance & Insurance | 49 (21.7%) | 177 (78.3%) |
| Real Estate, Rental & Leasing | 11 (30.6%) | 25 (69.4%) |
| Professional & Scientific | 73 (40.8%) | 106 (59.2%) |
| Enterprise Management | 0 (0.0%) | 13 (100.0%) |
| Administrative & Support | 88 (100.0%) | 0 (0.0%) |
| Educational Services | 80 (19.7%) | 326 (80.3%) |
| Health Care & Social Assistance | 17 (4.1%) | 398 (95.9%) |
| Arts, Entertainment & Recreation | 4 (26.7%) | 11 (73.3%) |
| Accommodation & Food Services | 13 (7.4%) | 162 (92.6%) |
| Public Administration | 155 (63.3%) | 90 (36.7%) |
| Total | 2,490 (51.9%) | 2,303 (48.0%) |
Education in Madison County
School Enrollment in Madison County
The most common levels of schooling among the 3,025 students in Madison County are high school (789 | 26.1%), middle school (692 | 22.9%), and college / undergraduate (593 | 19.6%).
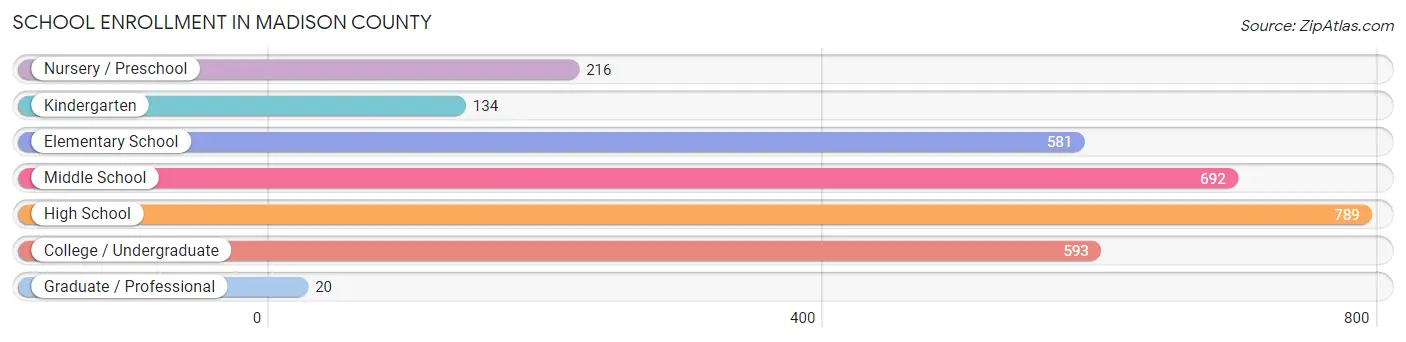
| School Level | # Students | % Students |
| Nursery / Preschool | 216 | 7.1% |
| Kindergarten | 134 | 4.4% |
| Elementary School | 581 | 19.2% |
| Middle School | 692 | 22.9% |
| High School | 789 | 26.1% |
| College / Undergraduate | 593 | 19.6% |
| Graduate / Professional | 20 | 0.7% |
| Total | 3,025 | 100.0% |
School Enrollment by Age by Funding Source in Madison County
Out of a total of 3,025 students who are enrolled in schools in Madison County, 248 (8.2%) attend a private institution, while the remaining 2,777 (91.8%) are enrolled in public schools. The age group of 15 to 17 year olds has the highest likelihood of being enrolled in private schools, with 78 (16.7% in the age bracket) enrolled. Conversely, the age group of 20 to 24 year olds has the lowest likelihood of being enrolled in a private school, with 247 (100.0% in the age bracket) attending a public institution.
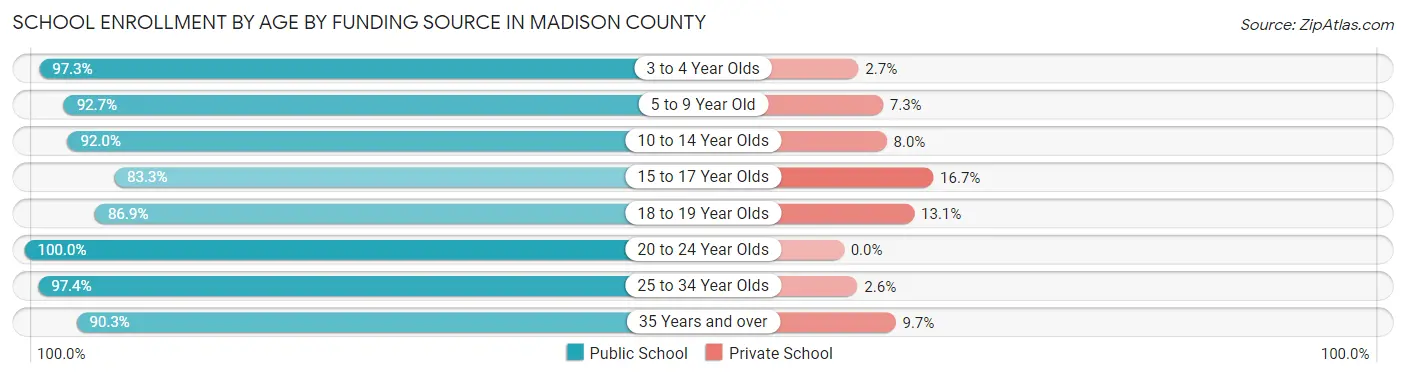
| Age Bracket | Public School | Private School |
| 3 to 4 Year Olds | 142 (97.3%) | 4 (2.7%) |
| 5 to 9 Year Old | 724 (92.7%) | 57 (7.3%) |
| 10 to 14 Year Olds | 691 (92.0%) | 60 (8.0%) |
| 15 to 17 Year Olds | 390 (83.3%) | 78 (16.7%) |
| 18 to 19 Year Olds | 139 (86.9%) | 21 (13.1%) |
| 20 to 24 Year Olds | 247 (100.0%) | 0 (0.0%) |
| 25 to 34 Year Olds | 228 (97.4%) | 6 (2.6%) |
| 35 Years and over | 215 (90.3%) | 23 (9.7%) |
| Total | 2,777 (91.8%) | 248 (8.2%) |
Educational Attainment by Field of Study in Madison County
Business (247 | 17.2%), education (236 | 16.5%), science & technology (153 | 10.7%), arts & humanities (150 | 10.5%), and social sciences (125 | 8.7%) are the most common fields of study among 1,433 individuals in Madison County who have obtained a bachelor's degree or higher.
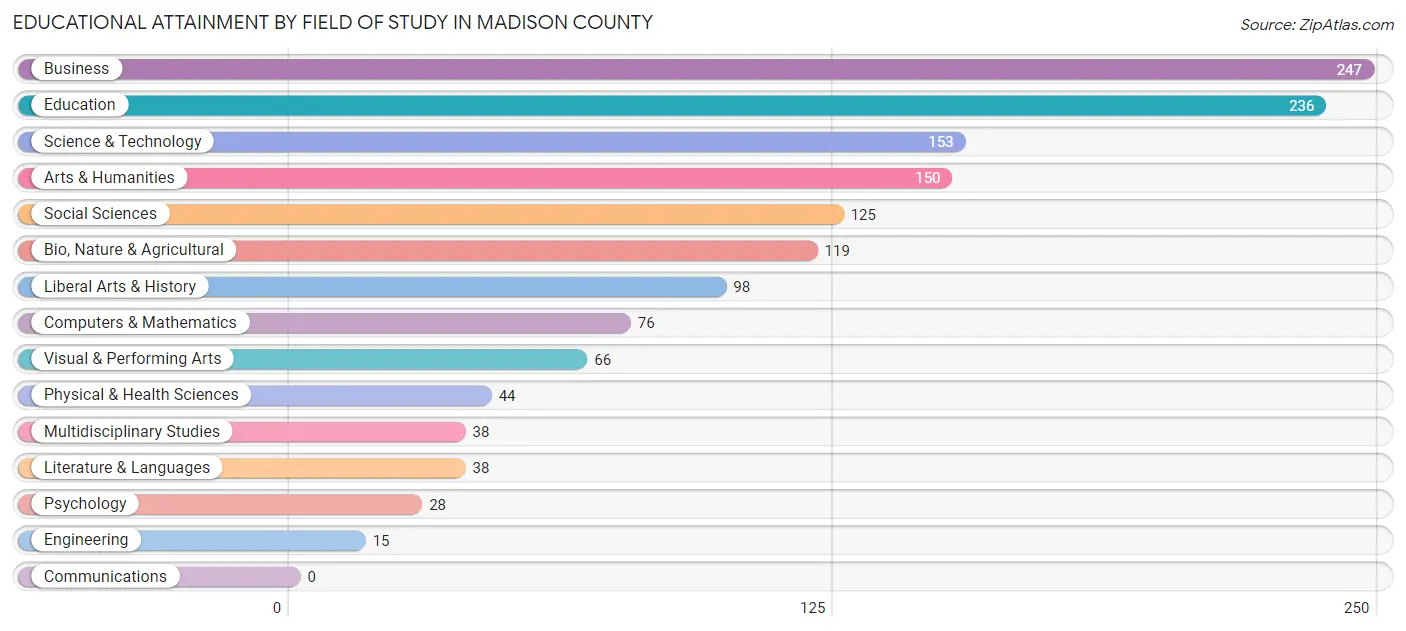
| Field of Study | # Graduates | % Graduates |
| Computers & Mathematics | 76 | 5.3% |
| Bio, Nature & Agricultural | 119 | 8.3% |
| Physical & Health Sciences | 44 | 3.1% |
| Psychology | 28 | 1.9% |
| Social Sciences | 125 | 8.7% |
| Engineering | 15 | 1.1% |
| Multidisciplinary Studies | 38 | 2.6% |
| Science & Technology | 153 | 10.7% |
| Business | 247 | 17.2% |
| Education | 236 | 16.5% |
| Literature & Languages | 38 | 2.6% |
| Liberal Arts & History | 98 | 6.8% |
| Visual & Performing Arts | 66 | 4.6% |
| Communications | 0 | 0.0% |
| Arts & Humanities | 150 | 10.5% |
| Total | 1,433 | 100.0% |
Transportation & Commute in Madison County
Vehicle Availability by Sex in Madison County
The most prevalent vehicle ownership categories in Madison County are males with 2 vehicles (875, accounting for 36.6%) and females with 2 vehicles (671, making up 38.1%).
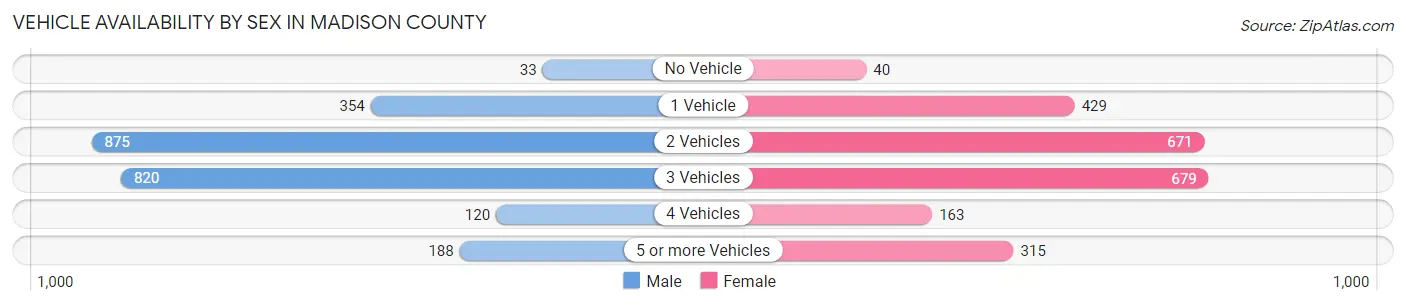
| Vehicles Available | Male | Female |
| No Vehicle | 33 (1.4%) | 40 (1.7%) |
| 1 Vehicle | 354 (14.8%) | 429 (18.7%) |
| 2 Vehicles | 875 (36.6%) | 671 (29.2%) |
| 3 Vehicles | 820 (34.3%) | 679 (29.6%) |
| 4 Vehicles | 120 (5.0%) | 163 (7.1%) |
| 5 or more Vehicles | 188 (7.9%) | 315 (13.7%) |
| Total | 2,390 (100.0%) | 2,297 (100.0%) |
Commute Time in Madison County
The most frequently occuring commute durations in Madison County are 5 to 9 minutes (842 commuters, 18.8%), 10 to 14 minutes (758 commuters, 16.9%), and 15 to 19 minutes (522 commuters, 11.6%).
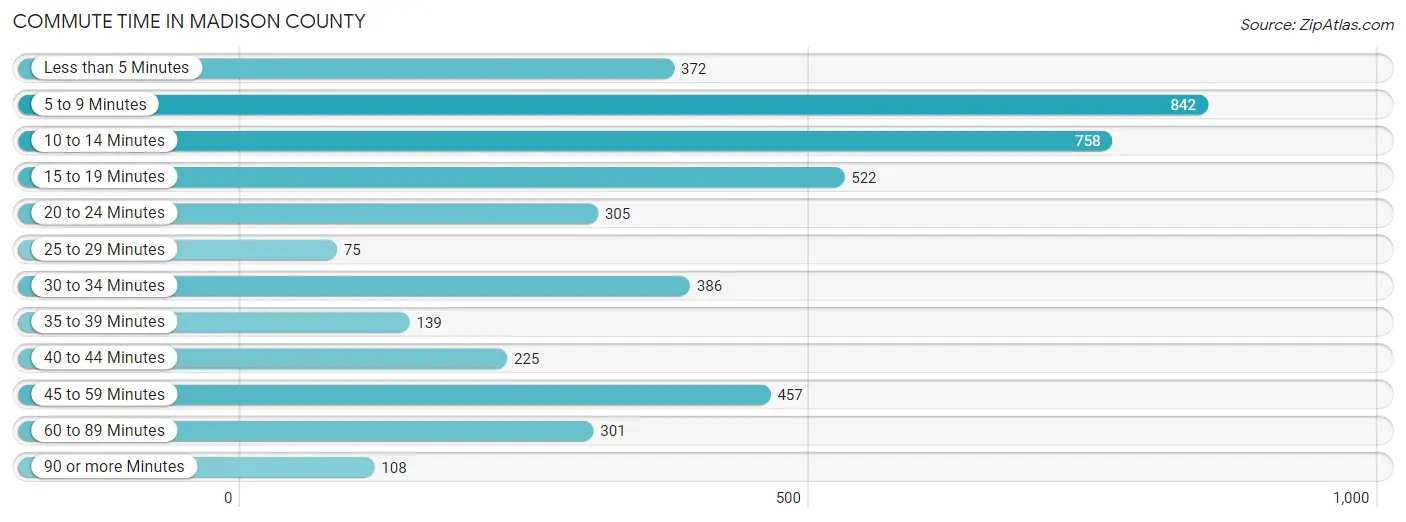
| Commute Time | # Commuters | % Commuters |
| Less than 5 Minutes | 372 | 8.3% |
| 5 to 9 Minutes | 842 | 18.8% |
| 10 to 14 Minutes | 758 | 16.9% |
| 15 to 19 Minutes | 522 | 11.6% |
| 20 to 24 Minutes | 305 | 6.8% |
| 25 to 29 Minutes | 75 | 1.7% |
| 30 to 34 Minutes | 386 | 8.6% |
| 35 to 39 Minutes | 139 | 3.1% |
| 40 to 44 Minutes | 225 | 5.0% |
| 45 to 59 Minutes | 457 | 10.2% |
| 60 to 89 Minutes | 301 | 6.7% |
| 90 or more Minutes | 108 | 2.4% |
Commute Time by Sex in Madison County
The most common commute times in Madison County are 10 to 14 minutes (450 commuters, 19.5%) for males and 5 to 9 minutes (520 commuters, 23.9%) for females.
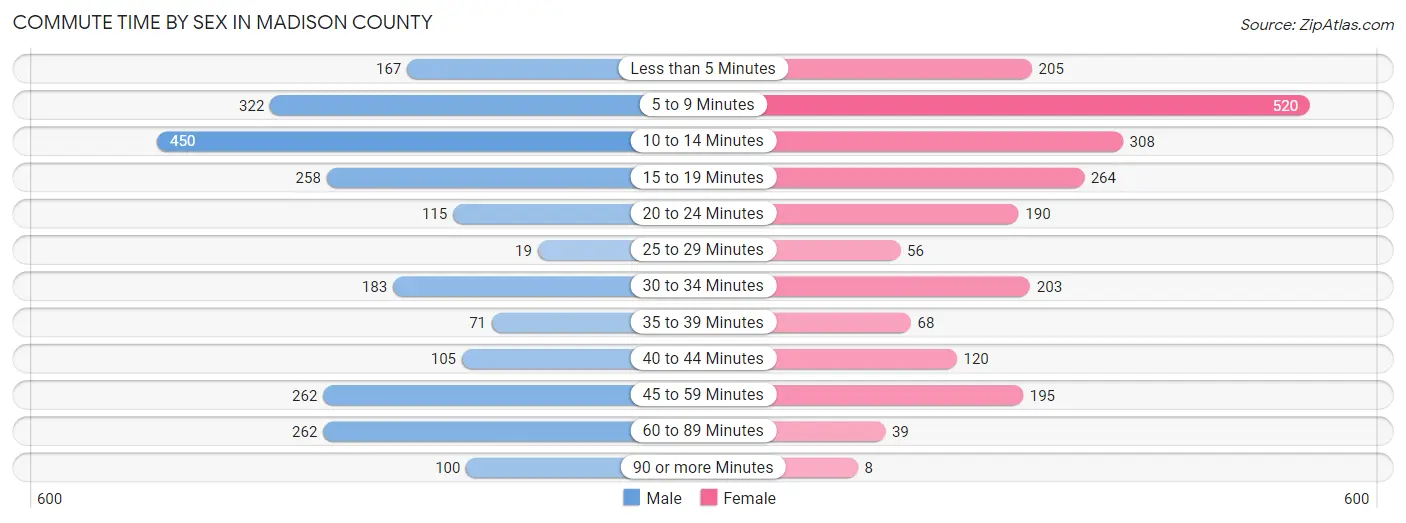
| Commute Time | Male | Female |
| Less than 5 Minutes | 167 (7.2%) | 205 (9.4%) |
| 5 to 9 Minutes | 322 (13.9%) | 520 (23.9%) |
| 10 to 14 Minutes | 450 (19.5%) | 308 (14.1%) |
| 15 to 19 Minutes | 258 (11.2%) | 264 (12.1%) |
| 20 to 24 Minutes | 115 (5.0%) | 190 (8.7%) |
| 25 to 29 Minutes | 19 (0.8%) | 56 (2.6%) |
| 30 to 34 Minutes | 183 (7.9%) | 203 (9.3%) |
| 35 to 39 Minutes | 71 (3.1%) | 68 (3.1%) |
| 40 to 44 Minutes | 105 (4.5%) | 120 (5.5%) |
| 45 to 59 Minutes | 262 (11.3%) | 195 (9.0%) |
| 60 to 89 Minutes | 262 (11.3%) | 39 (1.8%) |
| 90 or more Minutes | 100 (4.3%) | 8 (0.4%) |
Time of Departure to Work by Sex in Madison County
The most frequent times of departure to work in Madison County are 7:00 AM to 7:29 AM (494, 21.3%) for males and 7:00 AM to 7:29 AM (482, 22.2%) for females.
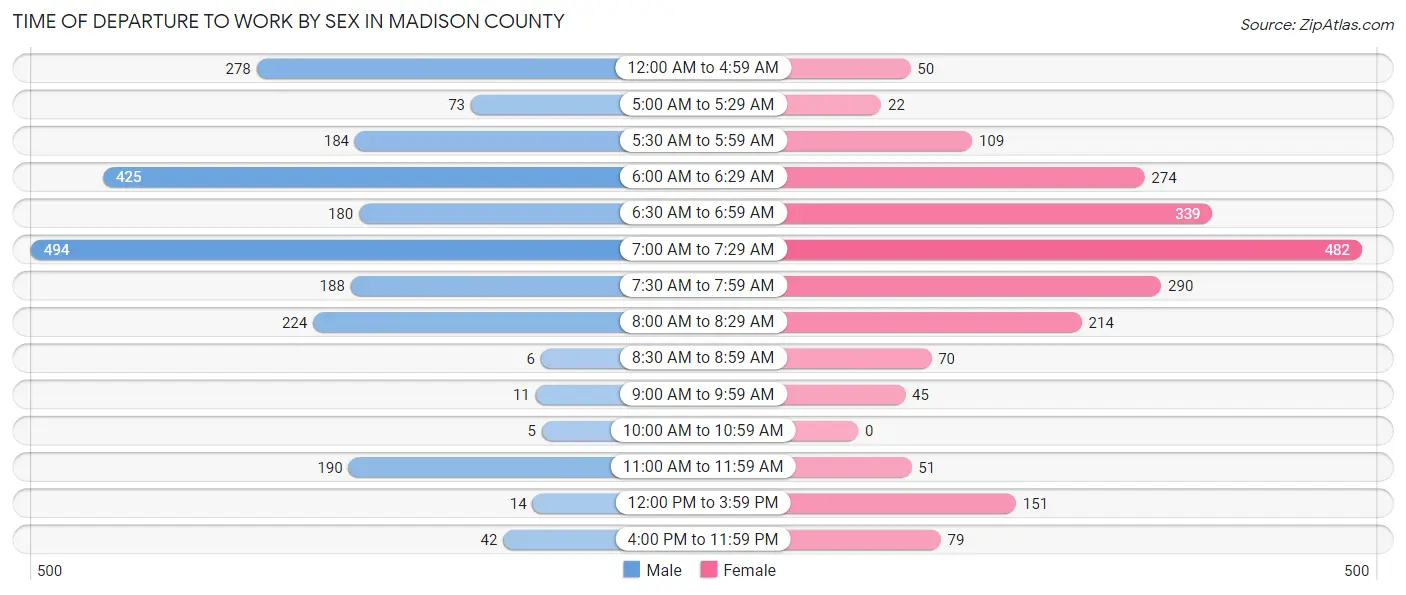
| Time of Departure | Male | Female |
| 12:00 AM to 4:59 AM | 278 (12.0%) | 50 (2.3%) |
| 5:00 AM to 5:29 AM | 73 (3.2%) | 22 (1.0%) |
| 5:30 AM to 5:59 AM | 184 (8.0%) | 109 (5.0%) |
| 6:00 AM to 6:29 AM | 425 (18.4%) | 274 (12.6%) |
| 6:30 AM to 6:59 AM | 180 (7.8%) | 339 (15.6%) |
| 7:00 AM to 7:29 AM | 494 (21.3%) | 482 (22.2%) |
| 7:30 AM to 7:59 AM | 188 (8.1%) | 290 (13.3%) |
| 8:00 AM to 8:29 AM | 224 (9.7%) | 214 (9.8%) |
| 8:30 AM to 8:59 AM | 6 (0.3%) | 70 (3.2%) |
| 9:00 AM to 9:59 AM | 11 (0.5%) | 45 (2.1%) |
| 10:00 AM to 10:59 AM | 5 (0.2%) | 0 (0.0%) |
| 11:00 AM to 11:59 AM | 190 (8.2%) | 51 (2.3%) |
| 12:00 PM to 3:59 PM | 14 (0.6%) | 151 (6.9%) |
| 4:00 PM to 11:59 PM | 42 (1.8%) | 79 (3.6%) |
| Total | 2,314 (100.0%) | 2,176 (100.0%) |
Housing Occupancy in Madison County
Occupancy by Ownership in Madison County
Of the total 4,081 dwellings in Madison County, owner-occupied units account for 2,911 (71.3%), while renter-occupied units make up 1,170 (28.7%).
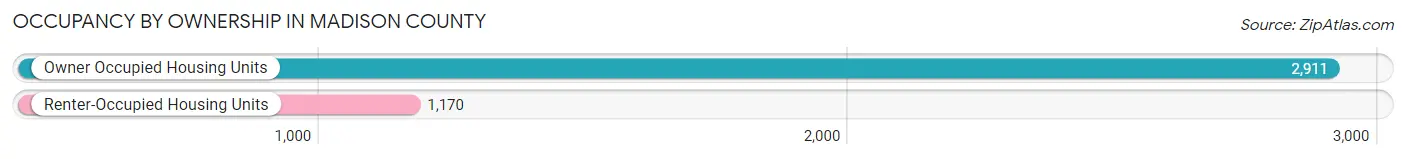
| Occupancy | # Housing Units | % Housing Units |
| Owner Occupied Housing Units | 2,911 | 71.3% |
| Renter-Occupied Housing Units | 1,170 | 28.7% |
| Total Occupied Housing Units | 4,081 | 100.0% |
Occupancy by Household Size in Madison County
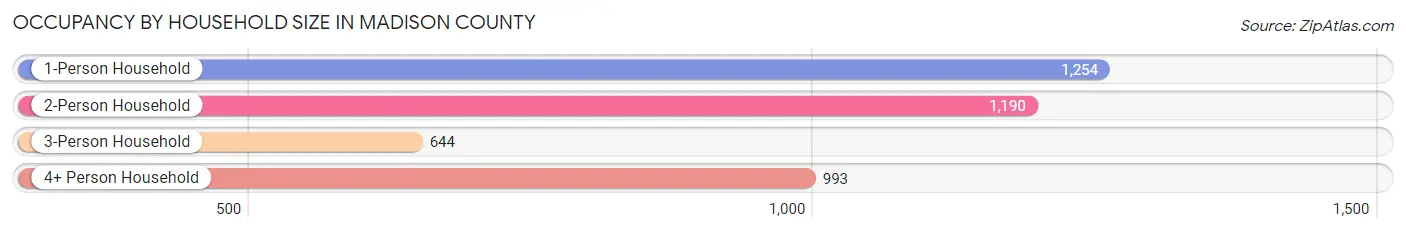
| Household Size | # Housing Units | % Housing Units |
| 1-Person Household | 1,254 | 30.7% |
| 2-Person Household | 1,190 | 29.2% |
| 3-Person Household | 644 | 15.8% |
| 4+ Person Household | 993 | 24.3% |
| Total Housing Units | 4,081 | 100.0% |
Occupancy by Ownership by Household Size in Madison County
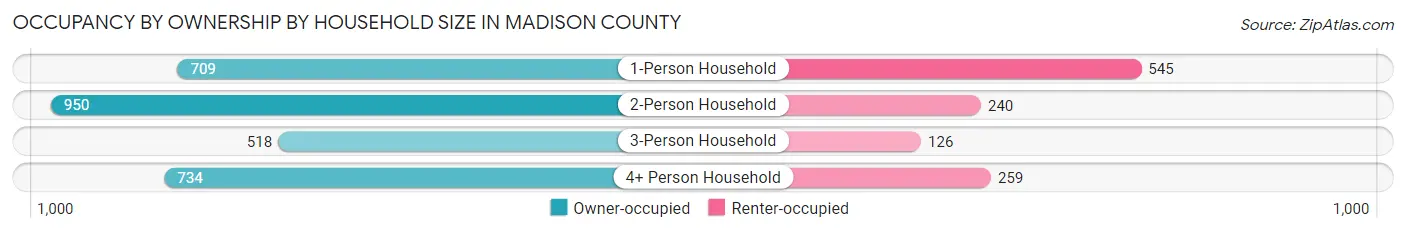
| Household Size | Owner-occupied | Renter-occupied |
| 1-Person Household | 709 (56.5%) | 545 (43.5%) |
| 2-Person Household | 950 (79.8%) | 240 (20.2%) |
| 3-Person Household | 518 (80.4%) | 126 (19.6%) |
| 4+ Person Household | 734 (73.9%) | 259 (26.1%) |
| Total Housing Units | 2,911 (71.3%) | 1,170 (28.7%) |
Occupancy by Educational Attainment in Madison County
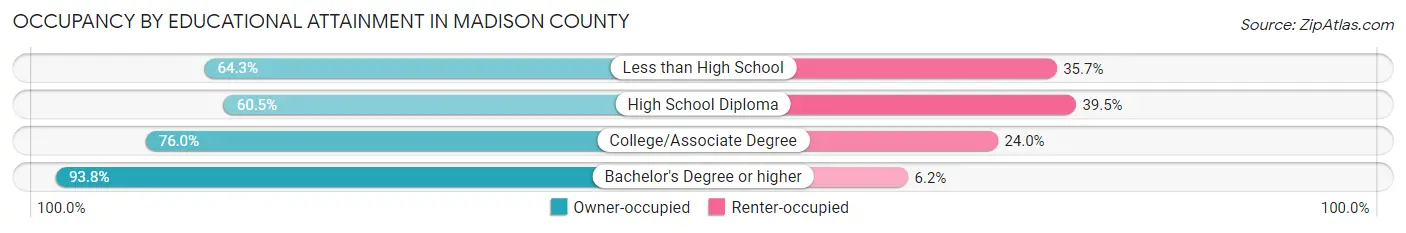
| Household Size | Owner-occupied | Renter-occupied |
| Less than High School | 398 (64.3%) | 221 (35.7%) |
| High School Diploma | 937 (60.5%) | 612 (39.5%) |
| College/Associate Degree | 929 (76.0%) | 294 (24.0%) |
| Bachelor's Degree or higher | 647 (93.8%) | 43 (6.2%) |
Occupancy by Age of Householder in Madison County
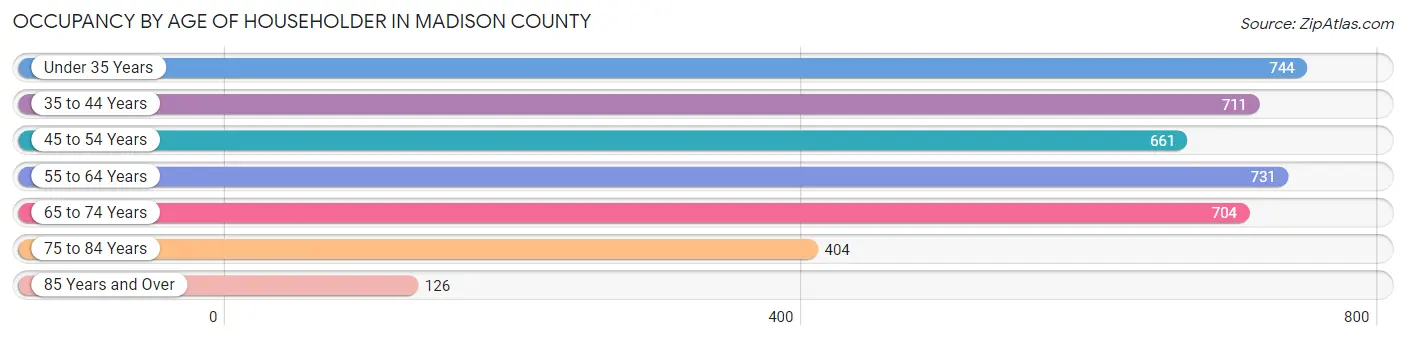
| Age Bracket | # Households | % Households |
| Under 35 Years | 744 | 18.2% |
| 35 to 44 Years | 711 | 17.4% |
| 45 to 54 Years | 661 | 16.2% |
| 55 to 64 Years | 731 | 17.9% |
| 65 to 74 Years | 704 | 17.2% |
| 75 to 84 Years | 404 | 9.9% |
| 85 Years and Over | 126 | 3.1% |
| Total | 4,081 | 100.0% |
Housing Finances in Madison County
Median Income by Occupancy in Madison County
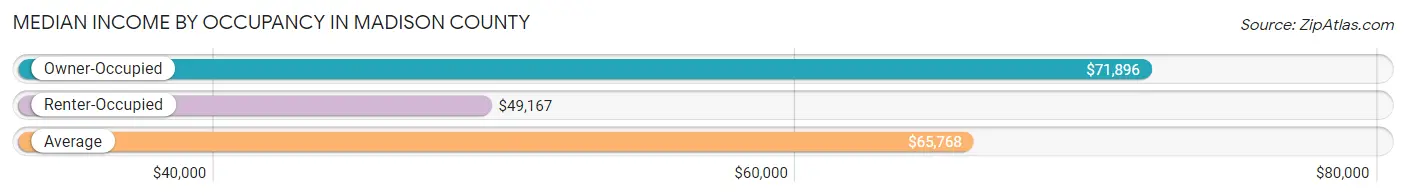
| Occupancy Type | # Households | Median Income |
| Owner-Occupied | 2,911 (71.3%) | $71,896 |
| Renter-Occupied | 1,170 (28.7%) | $49,167 |
| Average | 4,081 (100.0%) | $65,768 |
Occupancy by Householder Income Bracket in Madison County
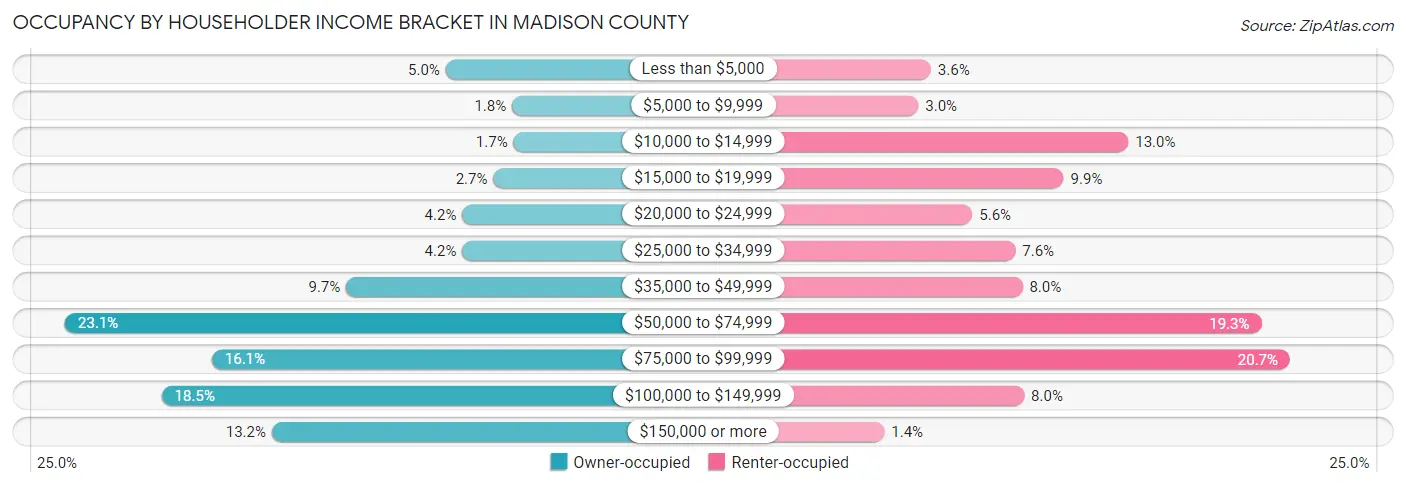
| Income Bracket | Owner-occupied | Renter-occupied |
| Less than $5,000 | 144 (5.0%) | 42 (3.6%) |
| $5,000 to $9,999 | 52 (1.8%) | 35 (3.0%) |
| $10,000 to $14,999 | 50 (1.7%) | 152 (13.0%) |
| $15,000 to $19,999 | 78 (2.7%) | 116 (9.9%) |
| $20,000 to $24,999 | 121 (4.2%) | 65 (5.6%) |
| $25,000 to $34,999 | 121 (4.2%) | 89 (7.6%) |
| $35,000 to $49,999 | 282 (9.7%) | 93 (8.0%) |
| $50,000 to $74,999 | 672 (23.1%) | 226 (19.3%) |
| $75,000 to $99,999 | 468 (16.1%) | 242 (20.7%) |
| $100,000 to $149,999 | 538 (18.5%) | 94 (8.0%) |
| $150,000 or more | 385 (13.2%) | 16 (1.4%) |
| Total | 2,911 (100.0%) | 1,170 (100.0%) |
Monthly Housing Cost Tiers in Madison County
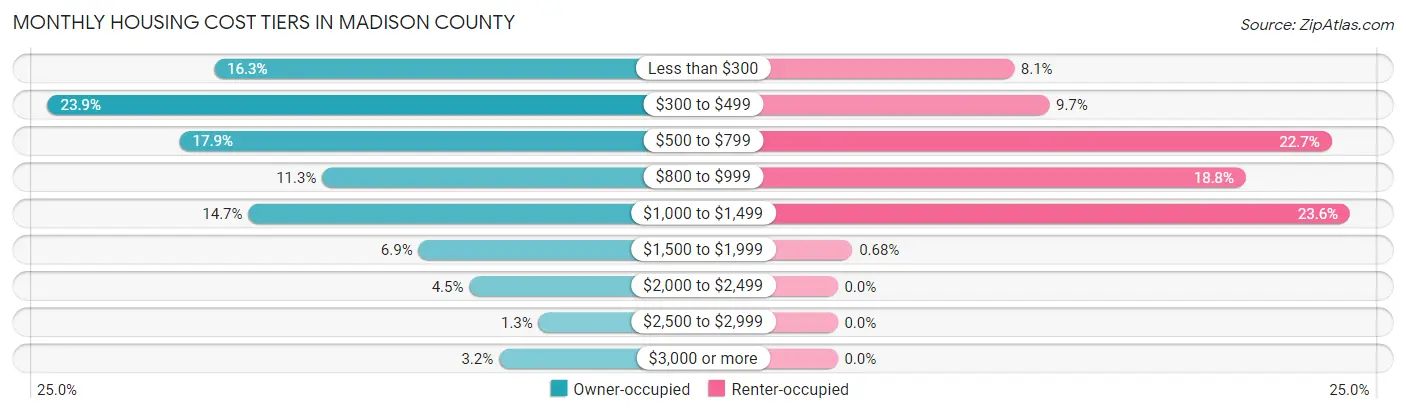
| Monthly Cost | Owner-occupied | Renter-occupied |
| Less than $300 | 474 (16.3%) | 95 (8.1%) |
| $300 to $499 | 697 (23.9%) | 114 (9.7%) |
| $500 to $799 | 520 (17.9%) | 266 (22.7%) |
| $800 to $999 | 329 (11.3%) | 220 (18.8%) |
| $1,000 to $1,499 | 428 (14.7%) | 276 (23.6%) |
| $1,500 to $1,999 | 200 (6.9%) | 8 (0.7%) |
| $2,000 to $2,499 | 132 (4.5%) | 0 (0.0%) |
| $2,500 to $2,999 | 39 (1.3%) | 0 (0.0%) |
| $3,000 or more | 92 (3.2%) | 0 (0.0%) |
| Total | 2,911 (100.0%) | 1,170 (100.0%) |
Physical Housing Characteristics in Madison County
Housing Structures in Madison County
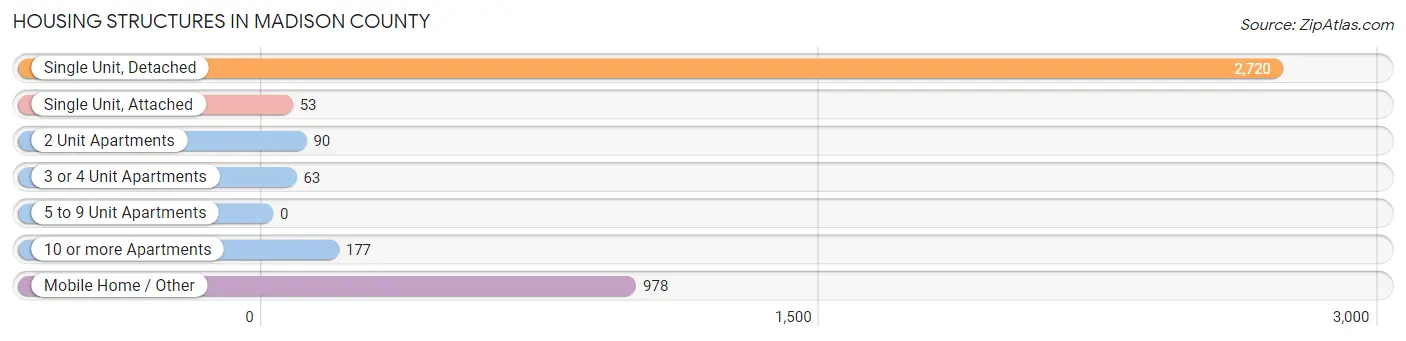
| Structure Type | # Housing Units | % Housing Units |
| Single Unit, Detached | 2,720 | 66.6% |
| Single Unit, Attached | 53 | 1.3% |
| 2 Unit Apartments | 90 | 2.2% |
| 3 or 4 Unit Apartments | 63 | 1.5% |
| 5 to 9 Unit Apartments | 0 | 0.0% |
| 10 or more Apartments | 177 | 4.3% |
| Mobile Home / Other | 978 | 24.0% |
| Total | 4,081 | 100.0% |
Housing Structures by Occupancy in Madison County
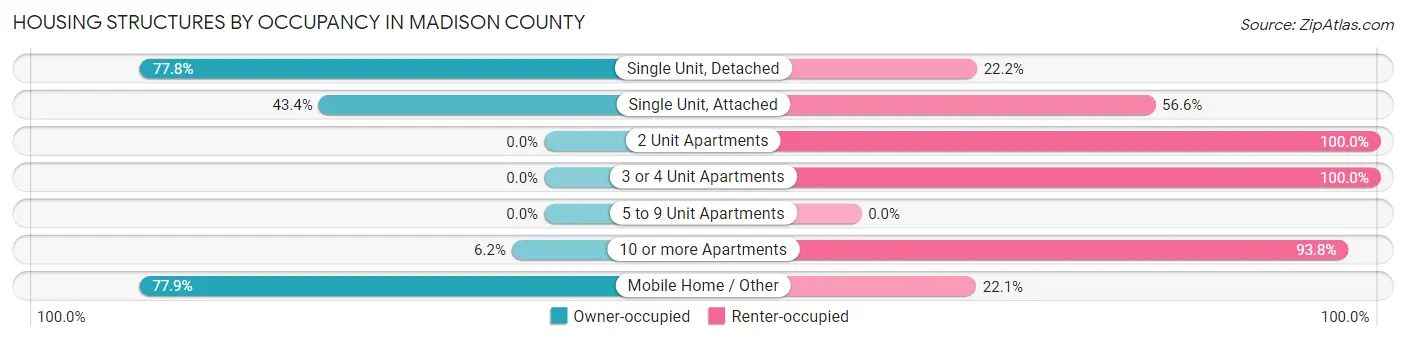
| Structure Type | Owner-occupied | Renter-occupied |
| Single Unit, Detached | 2,115 (77.8%) | 605 (22.2%) |
| Single Unit, Attached | 23 (43.4%) | 30 (56.6%) |
| 2 Unit Apartments | 0 (0.0%) | 90 (100.0%) |
| 3 or 4 Unit Apartments | 0 (0.0%) | 63 (100.0%) |
| 5 to 9 Unit Apartments | 0 (0.0%) | 0 (0.0%) |
| 10 or more Apartments | 11 (6.2%) | 166 (93.8%) |
| Mobile Home / Other | 762 (77.9%) | 216 (22.1%) |
| Total | 2,911 (71.3%) | 1,170 (28.7%) |
Housing Structures by Number of Rooms in Madison County
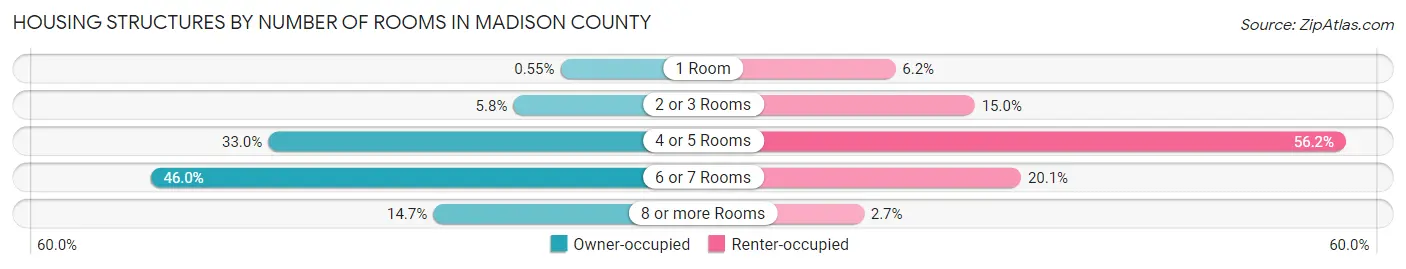
| Number of Rooms | Owner-occupied | Renter-occupied |
| 1 Room | 16 (0.5%) | 72 (6.1%) |
| 2 or 3 Rooms | 168 (5.8%) | 175 (15.0%) |
| 4 or 5 Rooms | 960 (33.0%) | 657 (56.1%) |
| 6 or 7 Rooms | 1,340 (46.0%) | 235 (20.1%) |
| 8 or more Rooms | 427 (14.7%) | 31 (2.6%) |
| Total | 2,911 (100.0%) | 1,170 (100.0%) |
Housing Structure by Heating Type in Madison County
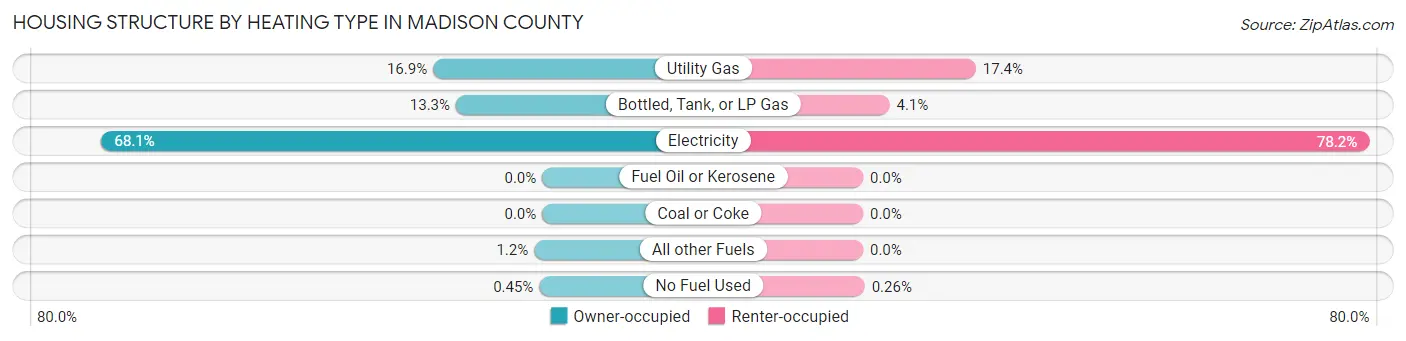
| Heating Type | Owner-occupied | Renter-occupied |
| Utility Gas | 491 (16.9%) | 204 (17.4%) |
| Bottled, Tank, or LP Gas | 388 (13.3%) | 48 (4.1%) |
| Electricity | 1,983 (68.1%) | 915 (78.2%) |
| Fuel Oil or Kerosene | 0 (0.0%) | 0 (0.0%) |
| Coal or Coke | 0 (0.0%) | 0 (0.0%) |
| All other Fuels | 36 (1.2%) | 0 (0.0%) |
| No Fuel Used | 13 (0.4%) | 3 (0.3%) |
| Total | 2,911 (100.0%) | 1,170 (100.0%) |
Household Vehicle Usage in Madison County
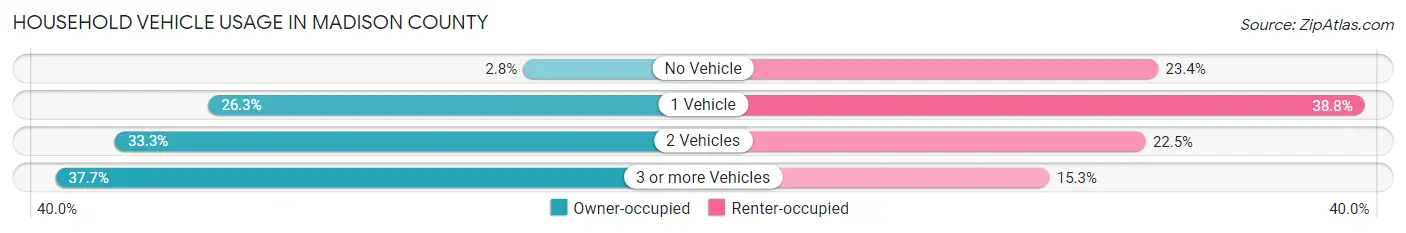
| Vehicles per Household | Owner-occupied | Renter-occupied |
| No Vehicle | 81 (2.8%) | 274 (23.4%) |
| 1 Vehicle | 765 (26.3%) | 454 (38.8%) |
| 2 Vehicles | 968 (33.3%) | 263 (22.5%) |
| 3 or more Vehicles | 1,097 (37.7%) | 179 (15.3%) |
| Total | 2,911 (100.0%) | 1,170 (100.0%) |
Real Estate & Mortgages in Madison County
Real Estate and Mortgage Overview in Madison County
| Characteristic | Without Mortgage | With Mortgage |
| Housing Units | 1,894 | 1,017 |
| Median Property Value | $104,800 | $174,100 |
| Median Household Income | $66,250 | $147 |
| Monthly Housing Costs | $461 | $87 |
| Real Estate Taxes | $1,340 | $61 |
Property Value by Mortgage Status in Madison County
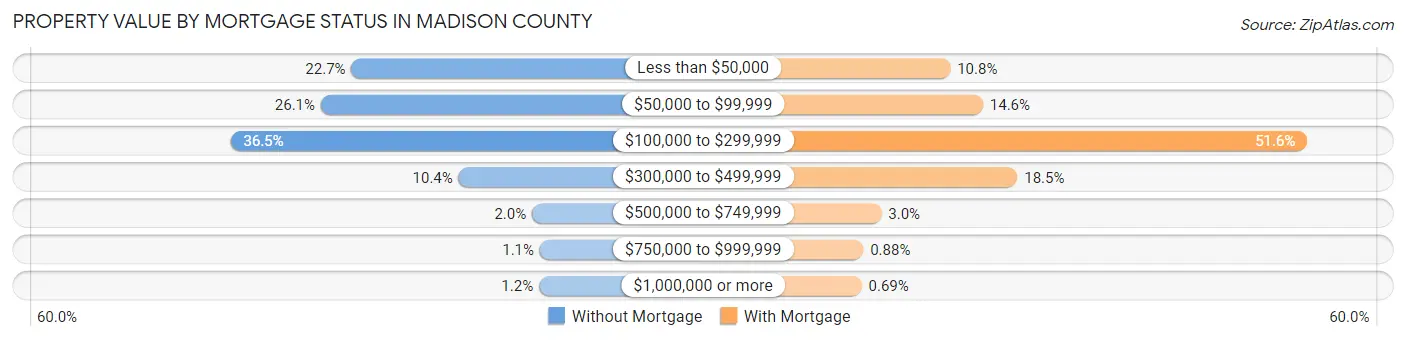
| Property Value | Without Mortgage | With Mortgage |
| Less than $50,000 | 429 (22.7%) | 110 (10.8%) |
| $50,000 to $99,999 | 495 (26.1%) | 148 (14.5%) |
| $100,000 to $299,999 | 691 (36.5%) | 525 (51.6%) |
| $300,000 to $499,999 | 197 (10.4%) | 188 (18.5%) |
| $500,000 to $749,999 | 38 (2.0%) | 30 (2.9%) |
| $750,000 to $999,999 | 21 (1.1%) | 9 (0.9%) |
| $1,000,000 or more | 23 (1.2%) | 7 (0.7%) |
| Total | 1,894 (100.0%) | 1,017 (100.0%) |
Household Income by Mortgage Status in Madison County
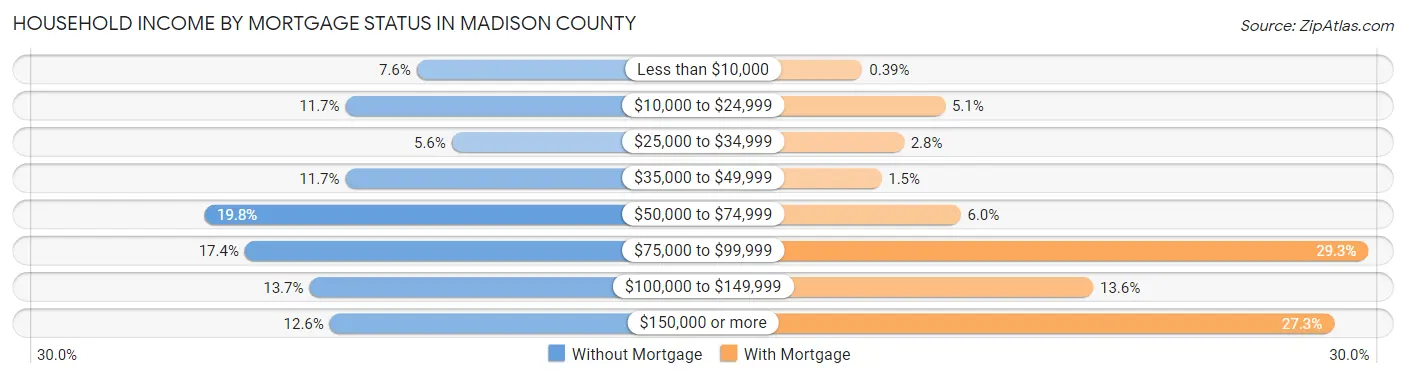
| Household Income | Without Mortgage | With Mortgage |
| Less than $10,000 | 144 (7.6%) | 4 (0.4%) |
| $10,000 to $24,999 | 221 (11.7%) | 52 (5.1%) |
| $25,000 to $34,999 | 106 (5.6%) | 28 (2.8%) |
| $35,000 to $49,999 | 221 (11.7%) | 15 (1.5%) |
| $50,000 to $74,999 | 374 (19.8%) | 61 (6.0%) |
| $75,000 to $99,999 | 330 (17.4%) | 298 (29.3%) |
| $100,000 to $149,999 | 260 (13.7%) | 138 (13.6%) |
| $150,000 or more | 238 (12.6%) | 278 (27.3%) |
| Total | 1,894 (100.0%) | 1,017 (100.0%) |
Property Value to Household Income Ratio in Madison County
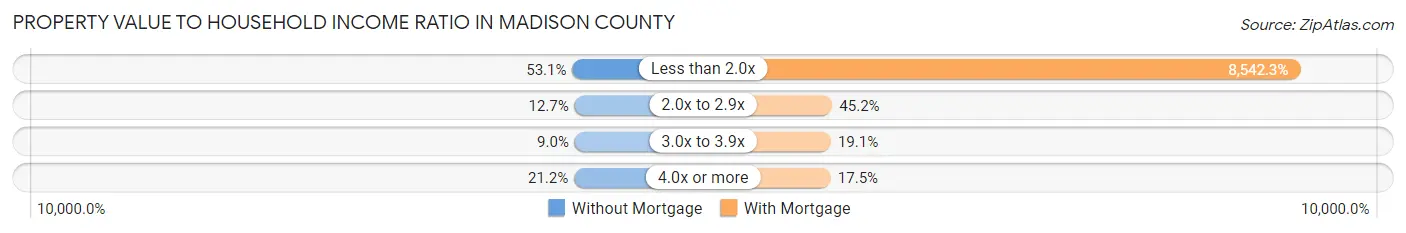
| Value-to-Income Ratio | Without Mortgage | With Mortgage |
| Less than 2.0x | 1,005 (53.1%) | 86,875 (8,542.3%) |
| 2.0x to 2.9x | 241 (12.7%) | 460 (45.2%) |
| 3.0x to 3.9x | 171 (9.0%) | 194 (19.1%) |
| 4.0x or more | 402 (21.2%) | 178 (17.5%) |
| Total | 1,894 (100.0%) | 1,017 (100.0%) |
Real Estate Taxes by Mortgage Status in Madison County
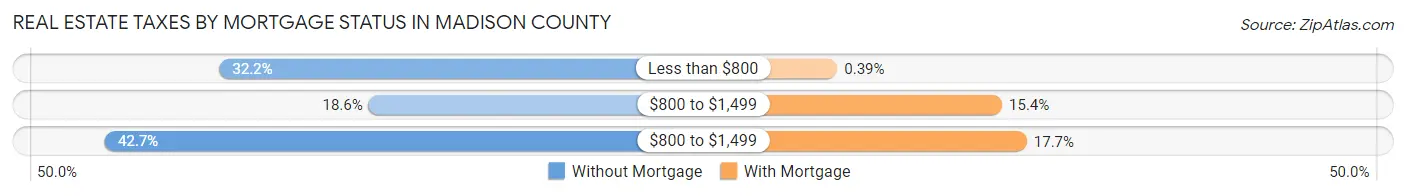
| Property Taxes | Without Mortgage | With Mortgage |
| Less than $800 | 610 (32.2%) | 4 (0.4%) |
| $800 to $1,499 | 352 (18.6%) | 157 (15.4%) |
| $800 to $1,499 | 808 (42.7%) | 180 (17.7%) |
| Total | 1,894 (100.0%) | 1,017 (100.0%) |
Health & Disability in Madison County
Health Insurance Coverage by Age in Madison County
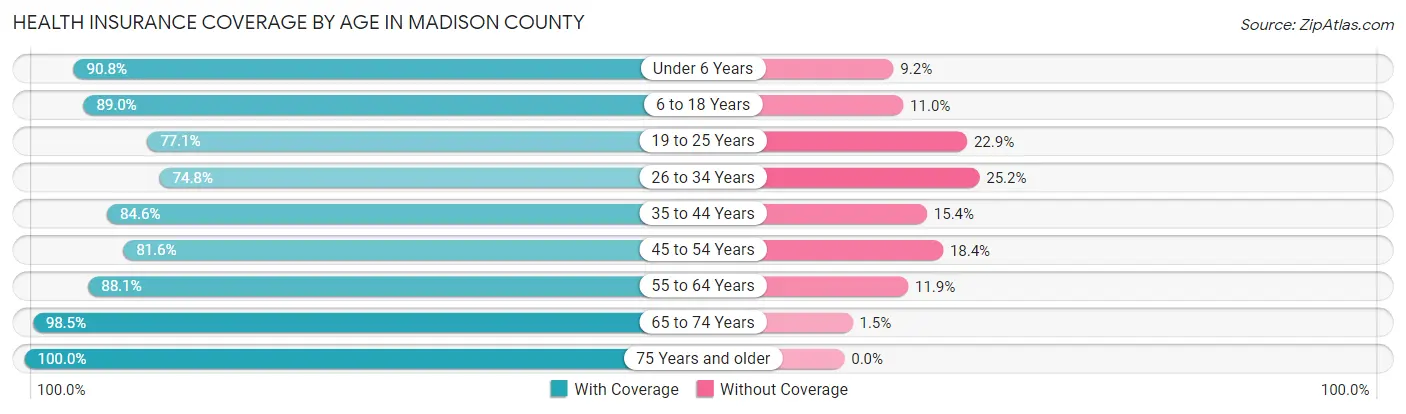
| Age Bracket | With Coverage | Without Coverage |
| Under 6 Years | 853 (90.8%) | 86 (9.2%) |
| 6 to 18 Years | 1,881 (89.0%) | 232 (11.0%) |
| 19 to 25 Years | 853 (77.1%) | 253 (22.9%) |
| 26 to 34 Years | 933 (74.8%) | 314 (25.2%) |
| 35 to 44 Years | 1,214 (84.6%) | 221 (15.4%) |
| 45 to 54 Years | 1,051 (81.6%) | 237 (18.4%) |
| 55 to 64 Years | 1,149 (88.1%) | 155 (11.9%) |
| 65 to 74 Years | 1,156 (98.5%) | 18 (1.5%) |
| 75 Years and older | 760 (100.0%) | 0 (0.0%) |
| Total | 9,850 (86.7%) | 1,516 (13.3%) |
Health Insurance Coverage by Citizenship Status in Madison County
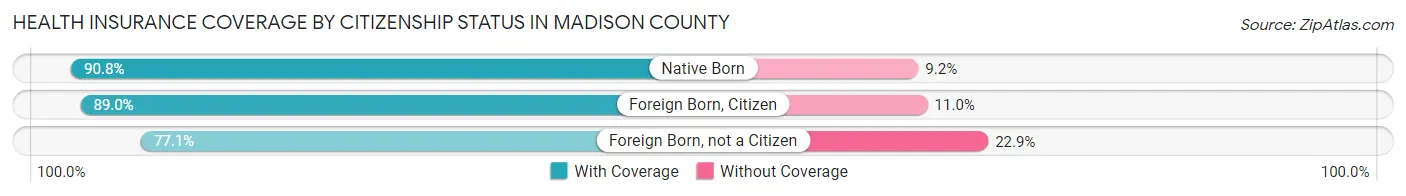
| Citizenship Status | With Coverage | Without Coverage |
| Native Born | 853 (90.8%) | 86 (9.2%) |
| Foreign Born, Citizen | 1,881 (89.0%) | 232 (11.0%) |
| Foreign Born, not a Citizen | 853 (77.1%) | 253 (22.9%) |
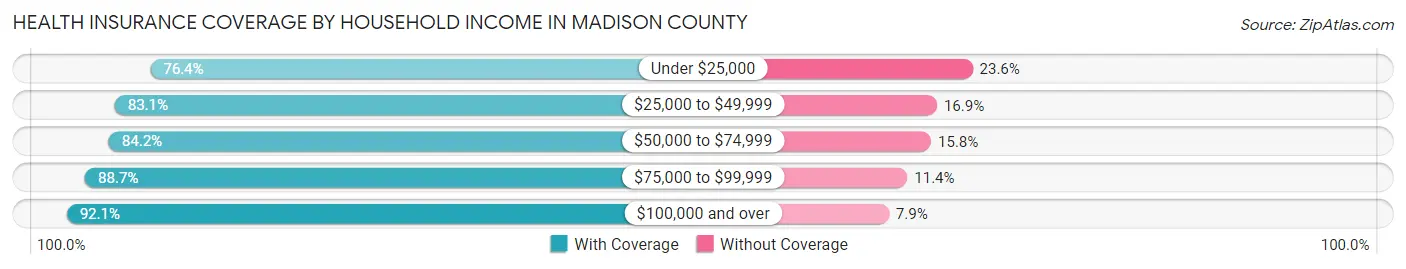
Health Insurance Coverage by Household Income in Madison County
| Household Income | With Coverage | Without Coverage |
| Under $25,000 | 1,044 (76.4%) | 322 (23.6%) |
| $25,000 to $49,999 | 1,229 (83.1%) | 250 (16.9%) |
| $50,000 to $74,999 | 2,047 (84.2%) | 384 (15.8%) |
| $75,000 to $99,999 | 1,983 (88.6%) | 254 (11.4%) |
| $100,000 and over | 3,525 (92.1%) | 302 (7.9%) |
Public vs Private Health Insurance Coverage by Age in Madison County
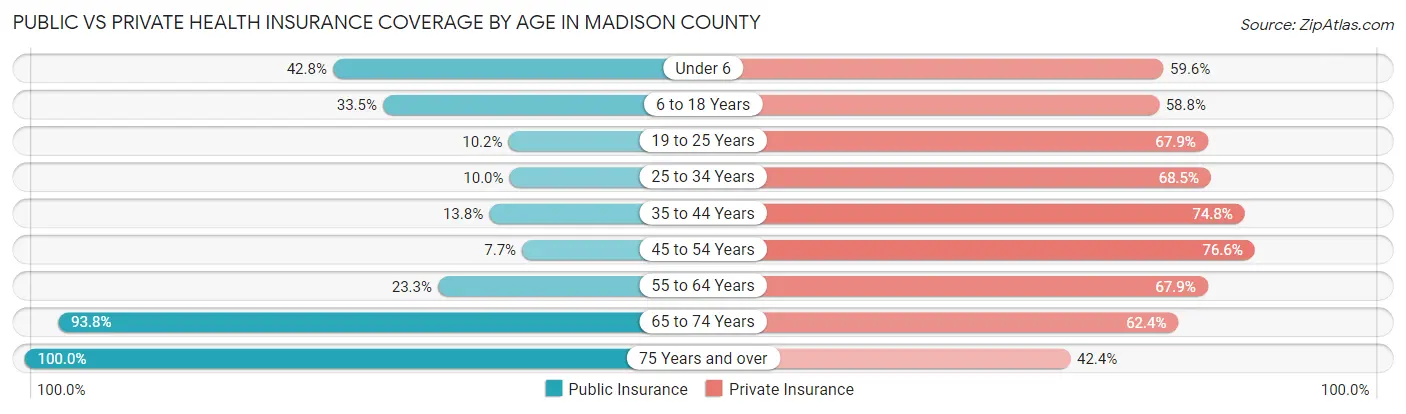
| Age Bracket | Public Insurance | Private Insurance |
| Under 6 | 402 (42.8%) | 560 (59.6%) |
| 6 to 18 Years | 708 (33.5%) | 1,243 (58.8%) |
| 19 to 25 Years | 113 (10.2%) | 751 (67.9%) |
| 25 to 34 Years | 125 (10.0%) | 854 (68.5%) |
| 35 to 44 Years | 198 (13.8%) | 1,073 (74.8%) |
| 45 to 54 Years | 99 (7.7%) | 987 (76.6%) |
| 55 to 64 Years | 304 (23.3%) | 885 (67.9%) |
| 65 to 74 Years | 1,101 (93.8%) | 733 (62.4%) |
| 75 Years and over | 760 (100.0%) | 322 (42.4%) |
| Total | 3,810 (33.5%) | 7,408 (65.2%) |
Disability Status by Sex by Age in Madison County
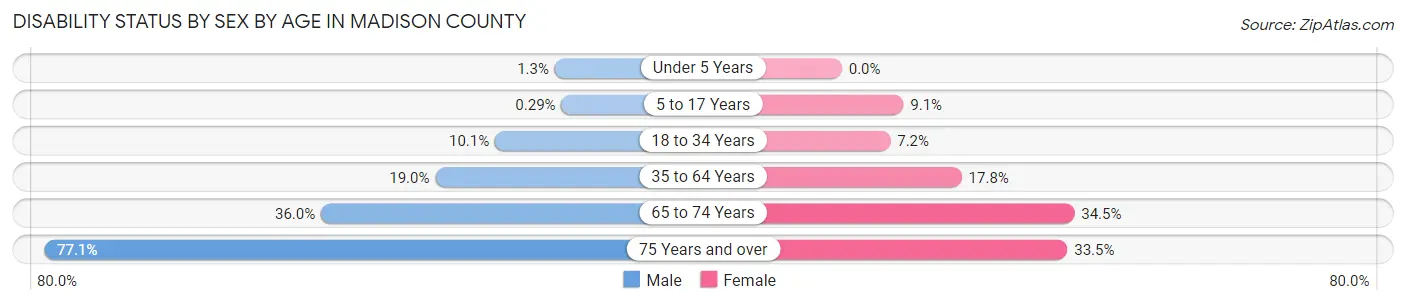
| Age Bracket | Male | Female |
| Under 5 Years | 5 (1.3%) | 0 (0.0%) |
| 5 to 17 Years | 3 (0.3%) | 99 (9.1%) |
| 18 to 34 Years | 129 (10.1%) | 86 (7.2%) |
| 35 to 64 Years | 378 (19.0%) | 363 (17.8%) |
| 65 to 74 Years | 190 (36.0%) | 223 (34.5%) |
| 75 Years and over | 266 (77.1%) | 139 (33.5%) |
Disability Class by Sex by Age in Madison County
Disability Class: Hearing Difficulty
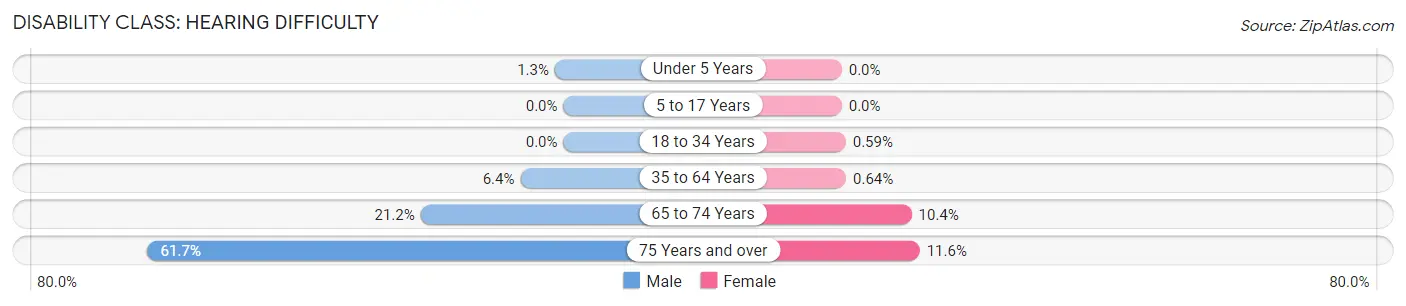
| Age Bracket | Male | Female |
| Under 5 Years | 5 (1.3%) | 0 (0.0%) |
| 5 to 17 Years | 0 (0.0%) | 0 (0.0%) |
| 18 to 34 Years | 0 (0.0%) | 7 (0.6%) |
| 35 to 64 Years | 127 (6.4%) | 13 (0.6%) |
| 65 to 74 Years | 112 (21.2%) | 67 (10.4%) |
| 75 Years and over | 213 (61.7%) | 48 (11.6%) |
Disability Class: Vision Difficulty
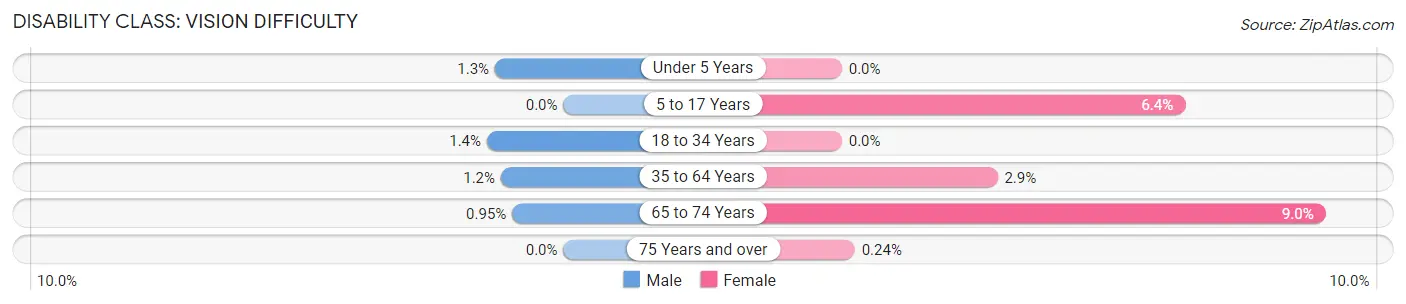
| Age Bracket | Male | Female |
| Under 5 Years | 5 (1.3%) | 0 (0.0%) |
| 5 to 17 Years | 0 (0.0%) | 69 (6.4%) |
| 18 to 34 Years | 18 (1.4%) | 0 (0.0%) |
| 35 to 64 Years | 23 (1.2%) | 59 (2.9%) |
| 65 to 74 Years | 5 (0.9%) | 58 (9.0%) |
| 75 Years and over | 0 (0.0%) | 1 (0.2%) |
Disability Class: Cognitive Difficulty
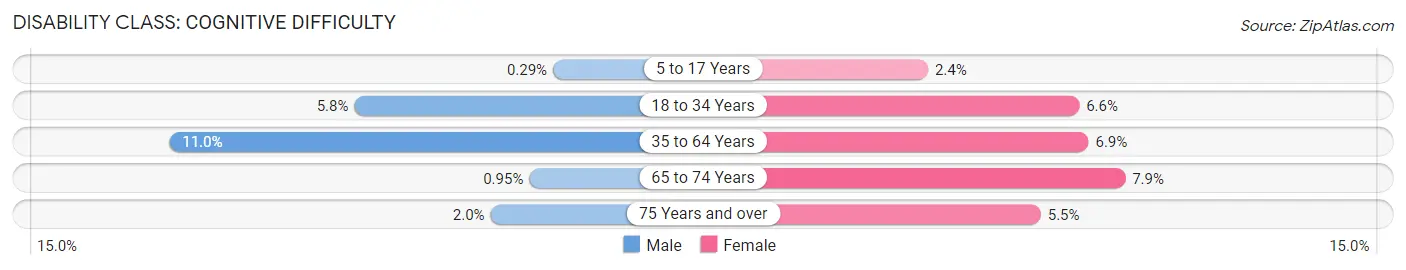
| Age Bracket | Male | Female |
| 5 to 17 Years | 3 (0.3%) | 26 (2.4%) |
| 18 to 34 Years | 74 (5.8%) | 79 (6.6%) |
| 35 to 64 Years | 218 (11.0%) | 140 (6.9%) |
| 65 to 74 Years | 5 (0.9%) | 51 (7.9%) |
| 75 Years and over | 7 (2.0%) | 23 (5.5%) |
Disability Class: Ambulatory Difficulty
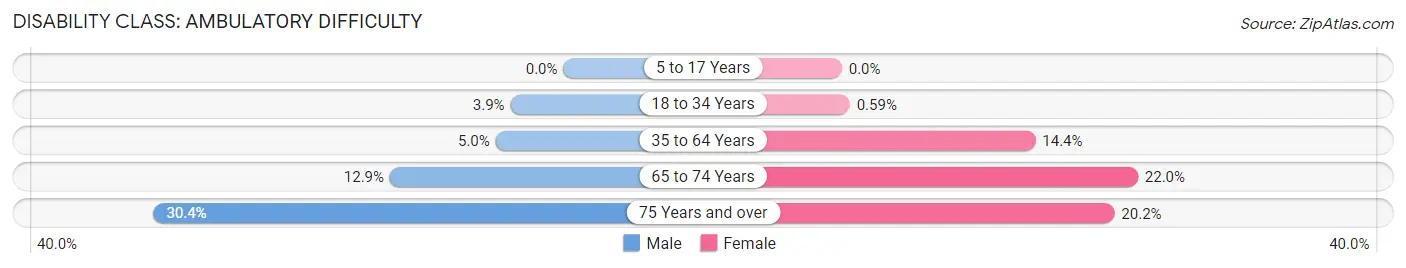
| Age Bracket | Male | Female |
| 5 to 17 Years | 0 (0.0%) | 0 (0.0%) |
| 18 to 34 Years | 50 (3.9%) | 7 (0.6%) |
| 35 to 64 Years | 100 (5.0%) | 293 (14.4%) |
| 65 to 74 Years | 68 (12.9%) | 142 (22.0%) |
| 75 Years and over | 105 (30.4%) | 84 (20.2%) |
Disability Class: Self-Care Difficulty
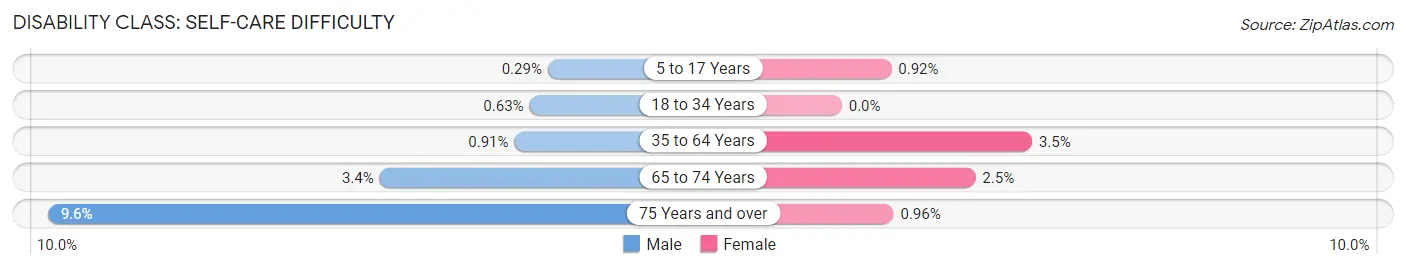
| Age Bracket | Male | Female |
| 5 to 17 Years | 3 (0.3%) | 10 (0.9%) |
| 18 to 34 Years | 8 (0.6%) | 0 (0.0%) |
| 35 to 64 Years | 18 (0.9%) | 72 (3.5%) |
| 65 to 74 Years | 18 (3.4%) | 16 (2.5%) |
| 75 Years and over | 33 (9.6%) | 4 (1.0%) |
Technology Access in Madison County
Computing Device Access in Madison County
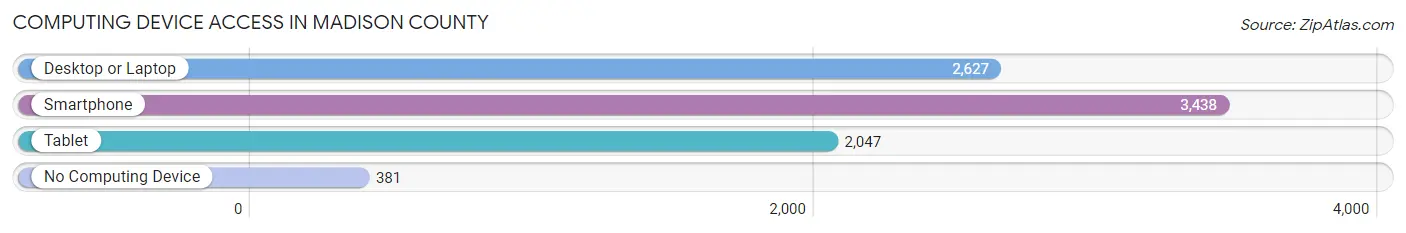
| Device Type | # Households | % Households |
| Desktop or Laptop | 2,627 | 64.4% |
| Smartphone | 3,438 | 84.2% |
| Tablet | 2,047 | 50.2% |
| No Computing Device | 381 | 9.3% |
| Total | 4,081 | 100.0% |
Internet Access in Madison County
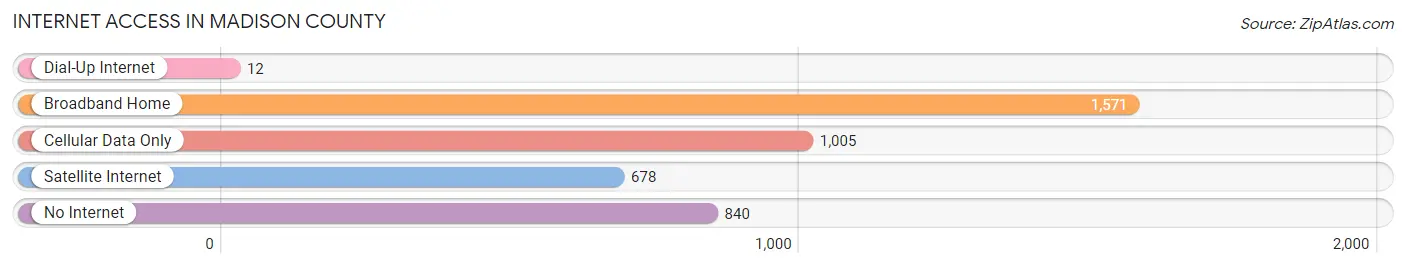
| Internet Type | # Households | % Households |
| Dial-Up Internet | 12 | 0.3% |
| Broadband Home | 1,571 | 38.5% |
| Cellular Data Only | 1,005 | 24.6% |
| Satellite Internet | 678 | 16.6% |
| No Internet | 840 | 20.6% |
| Total | 4,081 | 100.0% |
Madison County Summary
Madison County is located in the state of Texas, in the United States of America. It is part of the Central Texas region and is bordered by Brazos, Grimes, Walker, and Leon counties. The county seat is Madisonville, and the county has a population of approximately 13,000 people.
Geography
Madison County is located in the eastern part of Texas, and is part of the Central Texas region. It is bordered by Brazos, Grimes, Walker, and Leon counties. The county is mostly rural, with a few small towns and cities. The terrain is mostly flat, with some rolling hills in the northern part of the county. The county is home to several rivers, including the Trinity, Navasota, and San Jacinto. The climate is generally mild, with hot summers and mild winters.
History
Madison County was established in 1853, and was named after President James Madison. The county was originally part of Brazos County, and was later divided into Madison and Grimes counties. The county seat was originally located in the town of Madisonville, which was established in 1854. The county has a long history of ranching and farming, and is still home to many ranches and farms today.
Economy
The economy of Madison County is largely based on agriculture and ranching. The county is home to several large ranches, and is also home to several small farms. The county is also home to several small businesses, including restaurants, retail stores, and other services. The county is also home to several oil and gas companies, which provide jobs and economic activity to the area.
Demographics
As of the 2010 census, Madison County had a population of 13,068 people. The population is mostly white (83.3%), with a small percentage of African Americans (7.2%), Hispanics (7.1%), and other races (2.4%). The median household income is $45,845, and the median age is 38.7 years.
Conclusion
Madison County is a rural county located in the Central Texas region of the United States. It has a long history of ranching and farming, and is still home to many ranches and farms today. The economy is largely based on agriculture and ranching, and the county is also home to several small businesses. The population is mostly white, with a small percentage of African Americans, Hispanics, and other races. Madison County is a great place to live and work, and offers a unique and diverse culture.
Common Questions
What is Per Capita Income in Madison County?
Per Capita income in Madison County is $24,340.
What is the Median Family Income in Madison County?
Median Family Income in Madison County is $74,757.
What is the Median Household income in Madison County?
Median Household Income in Madison County is $65,768.
What is Income or Wage Gap in Madison County?
Income or Wage Gap in Madison County is 33.0%.
Women in Madison County earn 67.0 cents for every dollar earned by a man.
What is Family Income Deficit in Madison County?
Family Income Deficit in Madison County is $7,175.
Families that are below poverty line in Madison County earn $7,175 less on average than the poverty threshold level.
What is Inequality or Gini Index in Madison County?
Inequality or Gini Index in Madison County is 0.41.
What is the Total Population of Madison County?
Total Population of Madison County is 13,556.
What is the Total Male Population of Madison County?
Total Male Population of Madison County is 7,679.
What is the Total Female Population of Madison County?
Total Female Population of Madison County is 5,877.
What is the Ratio of Males per 100 Females in Madison County?
There are 130.66 Males per 100 Females in Madison County.
What is the Ratio of Females per 100 Males in Madison County?
There are 76.53 Females per 100 Males in Madison County.
What is the Median Population Age in Madison County?
Median Population Age in Madison County is 36.2 Years.
What is the Average Family Size in Madison County
Average Family Size in Madison County is 3.5 People.
What is the Average Household Size in Madison County
Average Household Size in Madison County is 2.8 People.
How Large is the Labor Force in Madison County?
There are 5,116 People in the Labor Forcein in Madison County.
What is the Percentage of People in the Labor Force in Madison County?
46.7% of People are in the Labor Force in Madison County.
What is the Unemployment Rate in Madison County?
Unemployment Rate in Madison County is 6.3%.